Abstract
Impacts of air pollution are not limited to human health and ecosystems, but are also important for building materials. The main objective of this study is the quantification and mapping of air pollution effects on the materials, namely the soiling effect of modern glass. An integrated modelling approach was implemented to quantify and analyze the spatial distribution of glass soiling due to exposure to air pollution. The methodology is based on an integrated modelling approach (transportation-emissions-dispersion modelling) applied with high spatial resolution for Coimbra (Portugal) urban area and compared with national scale modelling, showing the important contribution of local pollution sources affecting spatial variability in the soiling effect. Air quality data from CAMS (Copernicus Atmosphere Monitoring Service) were used to quantify the soiling effect at national scale. The results are presented and analyzed in terms of haze. The results obtained at national scale suggest that the average time to reach a 1% haze is 320 days, and this time is reduced to 180 days in the most affected areas. However, urban scale modelling applied with a detailed characterization of local pollution sources in Coimbra provides significantly different results and reveals that in the most affected areas, near road traffic, 1% haze could be reached in approximately 80 days. The methodology proposed and implemented in this study provides relevant information for the maintenance and preservation of building materials and highlights the importance of integrated modelling with high spatial resolution for the assessment of the soiling effect in the built environment.
1. Introduction
The impacts of air pollution are usually associated with human health and ecosystem degradation. However, it is also one of the deterioration factors that affect construction materials, including historic buildings and monuments [1,2,3,4]. While buildings naturally deteriorate due to environmental factors like sunlight, wind, humidity, and rain, air pollution accelerates the natural deterioration processes of materials, reducing their esthetic value and lifespan [3,5,6]. Additionally, air pollution leads to corrosion (caused by acidifying compounds), biodegradation, wear, and colour fading (mainly caused by O3), as well as soiling effects, resulting in the change in optical properties and darkening of surfaces exposed to atmospheric pollution.
The built environment, and particularly urban areas, face significant challenges from air pollution, driven by contributions from local sources, such as road traffic, biomass burning, and emissions from the construction sector, but also due to long-range transport of air pollution from distant sources [1,3,7]. The pollutants can interact with surfaces in the built environment, resulting in undesirable alterations and leaving traces of these interactions [8], while some alterations, such as soiling, are largely reversible as the accumulated particles can typically be removed through cleaning. Deterioration, on the other hand, is an irreversible process where air pollutants chemically or physically alter the material itself, leading to structural damage, corrosion, or surface wear [9].
Particulate matter (PM), sulphur dioxide (SO2), and nitrogen dioxide (NO2) are recognized as the main air pollutants responsible for the most visible and detectable degradation of building materials [10,11]. Given that urban areas host the bulk of the built environment, including heritage structures, the potential for damage due to soiling is significantly heightened compared to rural areas [6].
The soiling of man-made surfaces is probably the most visible damage evidence linked to air pollution impacts [6]. The extent of soiling is influenced by multiple factors, encompassing the material’s properties (such as porosity, colour, and surface texture), atmospheric aerosol characteristics (including size distribution, concentration, and aerosol type), the surface’s exposure conditions (wall inclinations, architectural ledges or saliences, sheltering from rainfall, etc.), and the prevailing climate conditions [6,11]. Not only buildings are affected by soiling, but all exposed surfaces are, including vehicles and photovoltaic modules [6,7]. Thus, the efficiency of solar panels is significantly compromised by soiling. As dust settles on solar panels, reducing irradiance and restricting solar flux, power loss becomes inevitable [12].
Understanding the interplay and relative impact of various degradation processes on the overall surface condition is challenging since soiling is often associated with other processes such as surface wear and corrosion [7]. For example, soiling rates can increase when associated with other degradation processes that occur in glass, such as weathering due to attack by airborne particles, mainly by K and Ca compounds, as well as chlorides (NaCl and KCl), causing depths and cracks in the glass surfaces so that more particle matter is encouraged to deposit on these surfaces, increasing soiling ratios [13]. Despite this complexity, soiling frequently emerges as a primary rationale for cleaning, particularly for windows [7].
The repercussions of soiling are not uniformly distributed, being more pronounced in areas adjacent to heavy traffic routes. Exhaust emissions from road traffic due to incomplete combustion of fossil fuels and dark particles from tyre and brake wear abrasion are identified as substantial contributors to PM pollution [14,15] and soiling on the facades along the main urban roads [16].
To quantify soiling effects, several metrics could be used. Thus, for opaque surfaces (stone, concrete, plastic, wood), changes in surface gloss, lightness, and any other factors directly tied to surface reflectance serve as useful indicators for evaluating visual degradation caused by soiling. However, for transparent materials, transmittance measurements are favoured over reflectance [17], with soiling typically expressed as haze (Equation (1)), a measure of the ratio between diffused light transmission (Td) and direct transmission (TL) in the initial light direction [6,18].
A haze exceeding 1% is perceptible to the naked human eye [6,17], indicating a significant decline in esthetic appeal and necessitating increased cleaning and maintenance efforts [7]. In urban areas, where the problem is typically more severe, the frequency and therefore the cost of cleaning operations required to restore the original visual appearance of buildings can be high [17,18].
Understanding the relationship between air pollution and material degradation is essential to figuring out the magnitude of the problem, identifying the most affected areas, and establishing strategies for the sustainable maintenance and preservation of external materials [1]. Traditionally, the quantification and assessment of material degradation primarily involve two approaches: (i) conducting measurement campaigns [16,17,18,19,20], which require great effort and are based on test sites, providing data at selected locations, or (ii) employing computational modelling that takes into account dose–response functions and enables the spatial distribution of data [6,7,21,22,23].
Dose–response functions (DRF) provide information on the soiling rates of materials in response to different levels or loads of pollutants, together with meteorological and air pollution parameters [21,24], and are important features in studying the corrosion and soiling of construction materials, especially in the context of exposure to environmental pollutants in urban areas. Computational modelling based on dose–response functions allows for a better understanding of soiling problems at different scales and facilitates the replicability of the methodology [7,25].
This paper focuses on the study of soiling of transparent materials, and the main objective is the implementation of a modelling approach for quantification and mapping of the soiling effects in modern glass due to exposure to air pollution, emphasizing both national (Portugal) and urban scales (Coimbra). This research provides information for establishing conservation strategies and proactive measures to mitigate the effects air pollution in the built environment by mapping soiling patterns and evaluating factors contributing to its magnitude.
2. Methodology
2.1. Atmospheric Soiling Quantification
The methodology adopted for assessing atmospheric soiling is based on modelling and mapping the pollutants concentrations and soiling at multi-scale following the main recommendations of the International Co-operative Programme on Effects on Materials (ICP Materials) [24]. The methodological framework implemented in this study includes four steps: (i) estimation of pollutant concentrations; (ii) quantification of atmospheric soiling; (iii) spatial distribution at national and urban scales; and (iv) a comparison between the results (Figure 1).
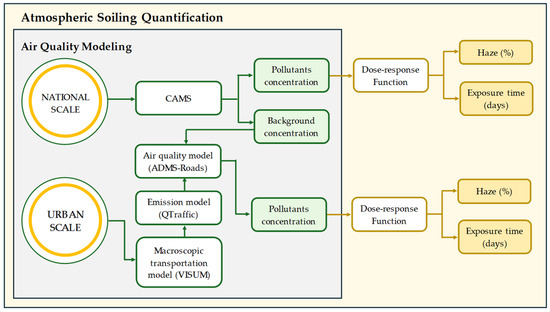
Figure 1.
Methodological framework implemented in this study.
To implement the methodology, atmospheric pollution data for mainland Portugal were obtained from the European Copernicus Atmosphere Monitoring Service (CAMS). For the analysis at urban scale, an integrated modelling approach (transportation–emissions–air pollution dispersion) was implemented for Coimbra, allowing for the assessment of local sources of pollution with high spatial resolution. The methodology applied on the national scale will be detailed in Section 2.2 and for the urban scale in Section 2.3.
The soiling effect for transparent materials was estimated according to a multi-pollutant dose–response function derived from a multilinear regression equation (Equation (2)), employed based on the work of Lombardo et al. [17], for a chemically inert, modern silica–soda–lime glass. The results are expressed as haze H (%) which is influenced by concentrations of SO2, NO2, and PM10 (µg m−3) and the exposure time t (days):
This dose–response function was derived from field research programmes conducted under the UNECE ICP Materials and based on data gathered from various field campaigns in different environments for sheltered conditions [24].
2.2. National Scale Air Quality Modelling
Mainland Portugal, considered in this study, is located at the southwestern tip of the Iberian Peninsula, bordered north and east by Spain and to the west and south by the Atlantic Ocean (Figure 2). It has a temperate climate with rainy winters and dry summers [26]. Demographically, it has two large metropolitan areas: the Lisbon Metropolitan Area, with approximately 2.8 million inhabitants [27], divided into two sub-regions, Greater Lisbon and the Setubal Peninsula, and the Porto Metropolitan Area, with approximately 1.7 million inhabitants [27].
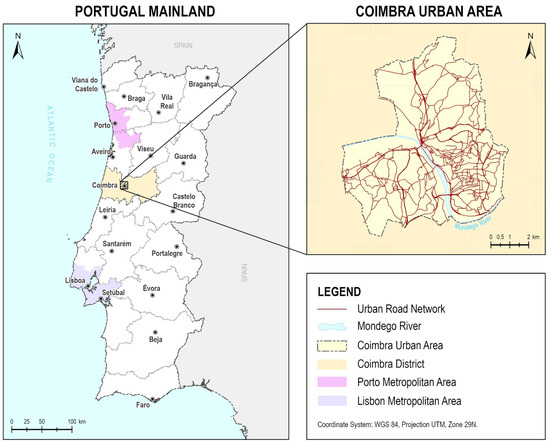
Figure 2.
Portugal mainland and Coimbra urban area.
As mentioned previously, air pollution data at the national scale were obtained from CAMS, and were processed to obtain annual average concentrations considering reanalysis data from the multi-model ENSEMBLE approach [28,29]. CAMS reanalysis data combine model simulations with observations from multiple sources to account for uncertainties and improve data reliability, creating a more accurate representation of atmospheric conditions [29,30].
The ENSEMBLE products have a spatial grid resolution of 0.1° × 0.1° (~10 km × 10 km) and are calculated for different vertical layers, ranging from the surface (at the monitoring station level) to 5000 m in altitude. Meteorological data from the European Centre for Medium-Range Weather Forecasts (ECMWF) drive the chemical transport models, maintaining the same spatial and temporal resolution used by CAMS [28,29].
The analysis and soiling quantification involved extracting CAMS-validated reanalysis data for surface-level concentrations of PM10, NO2, and SO2 in NetCDF format. As the files originally extracted from CAMS provide hourly concentrations, the data were processed in Geographic Information System (GIS) to obtain annual average concentrations for each pollutant.
2.3. Urban Scale Air Quality Modelling
Coimbra urban area (Figure 2) is a part of Municipality and Region with the same name, located in the centre of mainland Portugal. The Municipality of Coimbra had a resident population around 141,000 inhabitants in 2021 and average population density of around about 440 inhab/km2 [27]. Coimbra is distinguished by its historical and architectural heritage; its central area is classified as a UNESCO World Heritage site. It is also home to one of the oldest universities in Europe, the University of Coimbra, known as a university city, although about 25% of the resident population is elderly. Local air pollution in Coimbra is mainly related with road traffic emissions, commercial activities, and residential biomass burning [14,15,31,32,33,34,35,36].
An integrated modelling chain was established to assess air quality at the urban scale for Coimbra. This approach involved three interconnected models: (i) macroscopic transportation model, (ii) emission model, and (iii) air pollution dispersion model. This integrated approach has previously been applied in other studies to assess atmospheric pollution on an urban scale, with different research objectives, and for different pollutants [14,31,32].
- (i)
- Macroscopic transportation model
The VISUM 13 software [37], a versatile traffic modelling tool, was employed for multimodal analysis. This model integrates various transportation modes into a reliable network model [31] and is one of the most used to provide traffic volume estimation [33]. The VISUM transportation model implemented in this study is based on the four-step approach and includes trip generation, trip distribution, modal split, and traffic assignment. Detailed characterization of the road network and data on origin-destination (O-D), trip duration, route taken, and average speed are available for the city-scale simulations. The outputs from the transportation model on traffic volume and average speed for each road segment are used as inputs to the emission model to quantify road traffic emissions with high temporal and spatial resolution.
- (ii)
- Emission model
The Traffic Emission and Energy Consumption Model (QTraffic) [33] was applied at urban scale to estimate emissions induced by vehicles considering exhaust and non-exhaust processes based on the updated European guidelines for emission factors [34,38]. The QTraffic model is designed for line sources, being able to estimate emissions by considering emission factors as a function of average speed and vehicle class (based on engine age, type, capacity, vehicle weight, fuel type, and emission reduction technology) [14]. Consequently, the required input data for the emissions model have been compiled according to statistical information on fleet composition, spatial data on road network, traffic volume, and vehicle speed provided by VISUM. Traffic emission data calculated at this step were important inputs to simulate air pollution dispersion at urban scale [14].
- (iii)
- Air quality model
The advanced Gaussian dispersion model adapted for line sources, known as ADMS-Roads [39], was employed to obtain the spatial distribution of hourly pollutant concentrations in Coimbra’s urban area, utilizing a 30 m spatial grid resolution in combination with the street canyon module [40] to consider the influence of buildings along the street on airflow movement and its effects on the dispersion of pollutants. In addition to the local emission sources explicitly considered in the model, background pollution levels were characterized based on regional modelling provided by CAMS. The hourly outputs provided by ADMS were processed to obtain annual average concentrations for PM10, NO2, and SO2, considering a selected year (2018).
To effectively communicate results, maps were created that highlight the spatial distribution of pollutant concentrations. This comprehensive methodology allowed for a detailed assessment of urban air quality.
3. Results and Discussions
The results of air quality modelling, conducted at national and urban scales, along with the presentation of the atmospheric soiling maps for mainland Portugal and Coimbra urban area are presented and discussed in this section.
3.1. Air Quality
Spatial variations in the annual mean concentrations for PM10, NO2, and SO2 in 2018 for Portugal are presented in Figure 3. These maps are obtained by processing CAMS data with 0.1° × 0.1° grid resolution. The maps reveal distinct patterns for each analyzed pollutant.
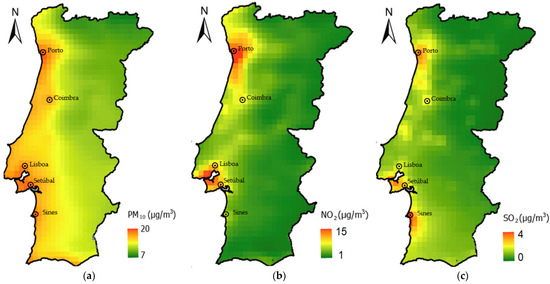
Figure 3.
Spatial distribution of annual mean concentrations for PM10 (a), NO2 (b), and SO2 (c) in 2018 for Portugal mainland.
NO2 concentrations (Figure 3b) exhibit a strong correlation with road traffic emissions, showcasing higher pollution levels in urban areas, with greater prevalence in the most populous municipalities in Portugal, namely Lisbon, Porto/Vila Nova de Gaia, and Setubal Peninsula. Conversely, SO2 concentration (Figure 3c) peaks are in industrial zones, reflecting their association with industrial activities. With emphasis on the location where the Sines refinery is installed in the south of the Setubal district, where the highest values are observed. The spatial variation of annual mean PM10 concentrations (Figure 3a) presents a smoother pattern influenced by diverse pollution sources and the long-range transport of mineral dust. Overall, densely populated coastal zones emerge as the most significantly affected areas for all pollutants.
While the CAMS data presented in Figure 3 offer valuable insights on air pollution at national scale, their applicability on the urban scale is limited due to the size of grid cells (0.1° × 0.1°) when compared with the results obtained at higher spatial resolution, with grid cells of 30 m × 30 m presented in Figure 4 for Coimbra urban area, where emissions arising from road transport are very important.
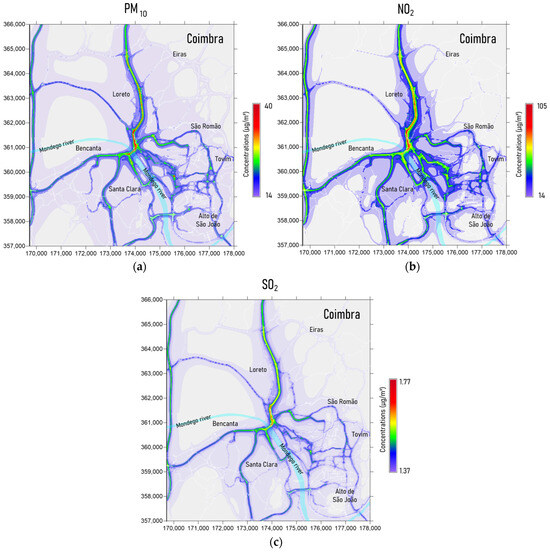
Figure 4.
Spatial distribution of annual mean concentrations for PM10 (a), NO2 (b), and SO2 (c) in 2018 for Coimbra city.
It is observed that the annual mean PM10 concentrations for Coimbra derived from urban-scale modelling and mapping reach values of 40 µg/m3, in contrast to the 17 µg/m3 provided from the national-scale approach (Figure 3a). A similar spatial pattern is observed for NO2 (Figure 4b), reaching concentrations of 105 µg/m3, significantly above the background levels. This emphasizes the importance of employing high-resolution modelling approaches when assessing air quality at the city level, as they reveal a pattern with high spatial gradients in pollutant concentrations associated with local sources. The spatial distribution of air pollution close to main roads supports the substantial contribution of road traffic emissions. Moreover, meteorological conditions and urban morphology are also important factors that contribute to the spatial heterogeneity of pollution levels in the urban environment [31].
Although there are no specific reference values for the exposure of construction material to atmospheric pollution, the Ambient Air Quality Directive (2008/50/EC) has established air quality standards for the key air pollutants in the European Union (EU) [41]. The upcoming revision of the Ambient Air Quality Directive aims to align these standards more closely with the World Health Organization guidelines [42] by setting interim EU air quality targets for 2030 and proposing 20 µg/m3 as a new limit value for annual average concentrations of PM10, NO2, and SO2 [43]. This revision is part of the EU’s broader strategy to achieve zero air pollution at the latest by 2050 [44].
The analysis of the modelling results reveals no exceedance of the limit values at national scale (Figure 3). However, the urban scale modelling with higher spatial resolution emphasizes the concentrations of PM10 and NO2 above the established limits in several locations. While such analyses allow for the primary identification of critical areas and conjecture regarding the main sources of pollution, modelling on a national scale can lead to the smoothing of results, hiding important local variations in the distribution of air pollutants.
3.2. Glass Soiling
The spatial variability of glass soiling for mainland Portugal is analyzed in terms of the number of days required to reach a 1% haze, utilizing a multipollutant dose–response function for the soiling of transparent material, as previously described (Equation (2)). The resulting soiling map (Figure 5) unveils significant variations in the exposure time needed to attain a 1% haze and illustrates its spatial distribution across Portugal.
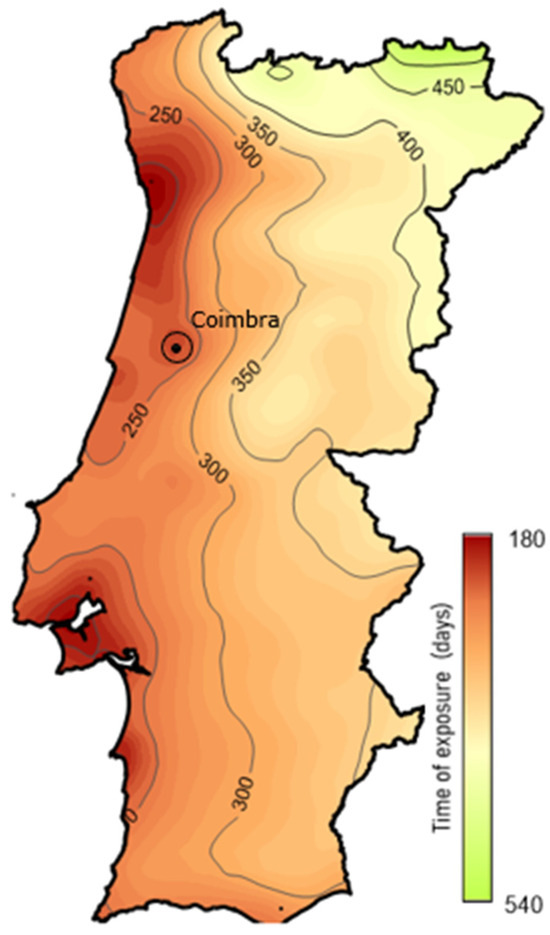
Figure 5.
Soiling effect for modern glass in mainland Portugal—days to reach a haze of 1%.
Modelling results based on air pollution data for 2018 indicate that, on a national scale, the average number of days to reach a 1% haze (H = 1%) on glass surfaces is 320 days, while in the most affected areas, H = 1% is reached in just 180 days (Table 1). The average loss of transparency at the national domain over a one-year exposure to air pollution is H = 1.2%, with the most affected areas exhibiting a maximum haze of 2.4% during the same period.

Table 1.
Soiling results for mainland Portugal.
Coastal areas exhibit the highest soiling potentials, with a 1% haze achieved in approximately six months. This indicates a heightened necessity for more frequent cleaning operations in these regions, thereby incurring increased maintenance costs.
The soiling map for Coimbra city, produced by applying the same dose–response function but using high spatial resolution of air quality data, can be seen in Figure 6a. The results indicate an average of 185 days to reach a 1% haze (H = 1%) on glass surfaces, with the most affected areas reaching H = 1% in just 84 days (see Table 2).
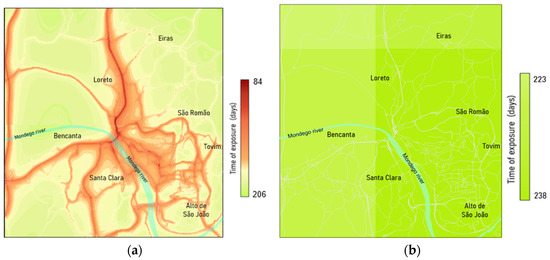
Figure 6.
Soiling effect for modern glass in Coimbra—days to reach a haze of 1%. Results from urban scale modelling (a) and results from national scale modelling (b).

Table 2.
Soiling results for Coimbra urban area.
For one-year of exposure to air pollution, the mean loss of transparency for the urban domain is H = 2.4%, with the most affected areas experiencing a maximum haze of 8.5% during the same period. These results are significantly different from the haze estimations based on air quality data, with gross spatial resolution provided by CAMS for Coimbra urban area (223–238 days for reach H = 1% and the maximum haze was 1.8%), as presented in Table 2 (due to the limited number of grid cells overlapping the urban area, STD and P95% from national scale modelling are not presented).
The comparative analysis of the results (Table 2) was obtained for the Coimbra region through modelling at different scales, a national scale and an urban scale, highlighting the differences in values and the importance of carrying out atmospheric soiling analyses with a higher spatial resolution to account for the local sources of pollution and assess potential impacts on glass surfaces.
4. Conclusions
This study investigated the soiling of modern glass due to exposure to air pollution based on a modelling approach. This methodology involved the estimation of pollutant concentrations, the quantification of atmospheric soiling, and the analysis of spatial distribution of soiling at national (Portugal) and urban (Coimbra) scales.
The results show significant spatial variability in soiling effects across different scales, highlighting the importance of spatial resolution in environmental modelling. Thus, national scale modelling allows for the identification of general trends and spatial patterns, providing valuable insights for national-level pollution control policies. However, when the spatial resolution is refined to an urban scale, as in the Coimbra case study, the results underscore the limitations of coarse-scale models in capturing the spatial variability in local pollution. In terms of soiling, on a national scale, the average time to reach a 1% haze on glass surfaces is approximately 320 days, but this decreases to 180 days in the most polluted areas in coastal zone. However, the urban-scale modelling provides a more detailed view, showing that near the road traffic sources, 1% haze can occur in just 80 days. This suggests that urban areas with high traffic emissions are more susceptible to soiling, emphasizing the need for more frequent maintenance of glass surfaces in such environments. These findings reveal the importance of using high-resolution models to accurately assess air quality and its effects in urban environments, where local pollution sources and urban morphology play an important role.
The obtained results emphasize the relevance of employing a modelling approach to quantify the impacts of air pollution on building materials and highlight the need to implement air pollution mitigation strategies. The urban-scale analysis might be a valuable tool for estimating average maintenance intervals and assessing damage costs attributable to air pollution. The findings enhance our understanding of the current issues arising from atmospheric pollution and help to identify sites requiring special attention, typically located in areas with significant anthropogenic activity. This study serves as a foundation for further research and site-specific analyses, highlighting the need for additional measures and policies to reduce atmospheric pollution in cities to prevent future damage to outdoor materials.
This study is a pilot effort, and some limitations could be highlighted. Thus, in addition to road transport emissions, other local sources of air pollution, such as biomass burning and emissions from the construction sector, could be important when assessing glass soiling and should be considered. Expanding the analysis to include other materials beyond modern glass is also relevant; however, this would require supplementary data, such as information on precipitation acidity. While this was beyond the scope of the current study, it will be addressed in future research.
As a next step, microscale modelling could be explored to investigate the link between air pollution, the built environment, and mitigation strategies. Thus, green infrastructure and nature-based solutions hold significant promise as a strategic recourse for addressing air pollution issues and consequently protecting outdoor materials. However, the non-homogeneous distribution of pollution sources and receptors in cities, along with the spatial and temporal variability in dispersion conditions and the challenge of obtaining air quality data with sufficient spatial resolution make it difficult to quantify the contribution of green solutions in improving urban air quality. In this context, modelling approaches can provide a valuable framework for the quantitative evaluation and comparison of different mitigation strategies.
Author Contributions
Conceptualization, N.P., N.B., and O.T.; methodology, N.P. and N.B.; software, N.P. and N.B.; formal analysis, N.P. and N.B.; writing—original draft preparation, N.B.; writing—review and editing, N.P. and O.T.; visualization, N.B. and N.P.; supervision, O.T. All authors have read and agreed to the published version of the manuscript.
Funding
This research was supported by PhD grant of N.B (2022.14252.BD) from the Portuguese Foundation for Science and Technology (FCT).
Data Availability Statement
Air quality data for the Portuguese domain could be downloaded from publicly available dataset at: https://ads.atmosphere.copernicus.eu (accessed on 13 June 2023). The raw data supporting the conclusions of this article for urban scale will be made available by the authors on request.
Acknowledgments
The authors acknowledge the free use of data from the Copernicus Atmosphere Monitoring Service (CAMS).
Conflicts of Interest
The authors declare no conflicts of interest.
References
- Irwin, J.; Tidblad, J.; Kucera, V. Air Quality Policy. In the Effects of Air Pollution on Cultural Heritage; Watt, J., Hamilton, R., Kucera, V., Tidblad, J., Eds.; Springer: Boston, MA, USA, 2009; pp. 269–293. [Google Scholar] [CrossRef]
- Ivaskova, M.; Kotes, P.; Brodnan, M. Air pollution as an important factor in construction materials deterioration in Slovak Republic. Procedia Eng. 2015, 108, 131–138. [Google Scholar] [CrossRef]
- Ruffolo, S.A.; La Russa, M.F.; Rovella, N.; Ricca, M. The Impact of Air Pollution on Stone Materials. Environments 2023, 10, 119. [Google Scholar] [CrossRef]
- Tidblad, J.; Kreislová, K.; Faller, M.; De la Fuente, D.; Yates, T.; Verney-Carron, A.; Grøntoft, T.; Gordon, A.; Hans, U. ICP materials trends in corrosion, soiling and air pollution (1987–2014). Materials 2007, 10, 969. [Google Scholar] [CrossRef]
- Brimblecombe, P. Air Pollution Reviews—Vol. 2. In The Effects of Air Pollution on the Built Environment; Imperial College Press: London, UK, 2003; ISBN 978-1-84816-128-3. [Google Scholar]
- Spezzano, P. Estimates of the economic damage due to the soiling of residential buildings induced by air pollution in Italy. Environ. Sci. Pollut. Res. 2022, 29, 52336–52354. [Google Scholar] [CrossRef] [PubMed]
- Grøntoft, T.; Verney-Carron, A.; Tidblad, J. Cleaning costs for European sheltered white painted steel and modern glass surfaces due to air pollution since the year 2000. Atmosphere 2019, 10, 167. [Google Scholar] [CrossRef]
- Alves, C.; Sanjurjo-Sánchez, J. Geoscience of the built environment: Pollutants and Materials Surfaces. Geosciences 2011, 1, 26–43. [Google Scholar] [CrossRef]
- Chervenkov, H. Assessment of material deterioration in Bulgaria owing to air pollution. Int. J. Environ. Pollut. 2008, 31, 385–393. [Google Scholar] [CrossRef]
- Bogdan, A.; Chambre, D.; Copolovici, D.M.; Bungau, T.; Bungau, C.C.; Copolovici, L. Heritage Building Preservation in the Process of Sustainable Urban Development: The Case of Brasov Medieval City, Romania. Sustainability 2022, 14, 6959. [Google Scholar] [CrossRef]
- Hamilton, R.; Crabbe, H. Environment, Pollution and Effects. In The Effects of Air Pollution on Cultural Heritage; Watt, J., Hamilton, R., Kucera, V., Tidblad, J., Eds.; Springer: Boston, MA, USA, 2009; pp. 1–28. [Google Scholar] [CrossRef]
- Adekanbi, M.L.; Alaba, E.S.; John, T.J.; Tundealao, T.D.; Banji, T.I. Soiling loss in solar systems: A review of its effect on solar energy efficiency and mitigation techniques. Clean. Energy Syst. 2024, 7, 100094. [Google Scholar] [CrossRef]
- Al-Thani, H.; Koç, M.; Isaifan, R.J. A review on the direct effect of particulate atmospheric pollution on materials and its mitigation for sustainable cities and societies. Environ. Sci. Pollut. Res. 2018, 25, 27839–27857. [Google Scholar] [CrossRef]
- Dias, D.; Pina, N.; Tchepel, O. Characterization of traffic-related particulate matter at urban scale. Int. J. Transp. Dev. Integr. 2019, 3, 144–151. [Google Scholar] [CrossRef][Green Version]
- Pio, C.; Rienda, I.C.; Nunes, T.; Gonçalves, C.; Tchepel, O.; Pina, K.N.; Rodrigues, J.; Lucarelli, F.; Alves, C.A. Impact of biomass burning and non-exhaust vehicle emissions on PM10 levels in a mid-size non-industrial western Iberian city. Atmos. Environ. 2022, 289, 119293. [Google Scholar] [CrossRef]
- Auras, M.; Bundschuh, P.; Eichhorn, J.; Kirchner, D.; Mach, M.; Seewald, B.; Scheuvens, D.; Snethlage, R. Salt deposition and soiling of stone facades by traffic-induced immissions. Environ. Earth Sci. 2018, 77, 323. [Google Scholar] [CrossRef]
- Lombardo, T.; Ionescu, A.; Chabas, A.; Lefèvre, R.A.; Ausset, P.; Candau, Y. Dose-response function for the soiling of silica-soda-lime glass due to dry deposition. Sci. Total Environ. 2010, 408, 976–984. [Google Scholar] [CrossRef] [PubMed]
- Alfaro, S.C.; Chabas, A.; Lombardo, T.; Verney-Carron, A.; Ausset, P. Predicting the soiling of modern glass in urban environments: A new physically-based model. Atmos. Environ. 2021, 60, 348–357. [Google Scholar] [CrossRef]
- Lombardo, T.; Ionescu, A.; Lefèvre, R.A.; Chabas, A.; Ausset, P.; Cachier, H. Soiling of silica-soda-lime float glass in urban environment: Measurements and modelling. Atmos. Environ. 2005, 39, 989–997. [Google Scholar] [CrossRef]
- Chabas, A.; Lombardo, T.; Cachier, H.; Pertuisot, M.H.; Oikonomou, K.; Falcone, R.; Veritá, M.; Geotti-Bianchini, F. Behaviour of self-cleaning glass in urban atmosphere. Build. Environ. 2008, 43, 2124–2131. [Google Scholar] [CrossRef]
- Spezzano, P. Mapping the susceptibility of UNESCO World Cultural Heritage sites in Europe to ambient (outdoor) air pollution. Sci. Total Environ. 2021, 754, 142345. [Google Scholar] [CrossRef]
- Vidal, F.; Vicente, R.; Silva, J.M. Review of environmental and air pollution impacts on built heritage: 10 questions on corrosion and soiling effects for urban intervention. J. Cult. Herit. 2019, 37, 273–295. [Google Scholar] [CrossRef]
- De la Fuente, D.; Vega, J.M.; Viejo, F.; Díaz, I.; Morcillo, M. Mapping air pollution effects on atmospheric degradation of cultural heritage. J. Cult. Herit. 2013, 14, 138–145. [Google Scholar] [CrossRef]
- CLRTAP. Mapping of Effects on Materials. In Manual on Methodologies and Criteria for Modelling and Mapping Critical Loads and Levels and Air Pollution Effects, Risks and Trends; UNECE Convention on Long-range Transboundary Air Pollution; German Environment Agency: Berlin, Germany, 2022; pp. 137–149. [Google Scholar]
- El-Harbawi, M. Air quality modelling, simulation, and computational methods: A review. Environ. Rev. 2013, 21, 149–179. [Google Scholar] [CrossRef]
- Instituto Português do Mar e da Atmosfera (IPMA). Clima de Portugal Continental. Available online: https://www.ipma.pt/pt/educativa/tempo.clima/ (accessed on 3 June 2024).
- PORDATA. Statistics about Portugal and Europa. Resident Population, According to Census. 2021. Available online: https://www.pordata.pt/en/municipalities/resident+population++according+to+census+total+and+by+major+age+groups-22 (accessed on 24 January 2024).
- Copernicus Atmosphere Monitoring Service (CAMS). European Air Quality. Available online: https://atmosphere.copernicus.eu/?category=data_access&subENSEMBLE=reanalysis_products (accessed on 22 March 2023).
- ECMWF. CAMS Regional: European Air Quality Reanalyses Data Documentation. Available online: https://confluence.ecmwf.int/display/CKB/CAMS+Regional%3A+European+air+quality+reanalyses+data+documentation (accessed on 13 February 2024).
- Copernicus Climate Data Store. Available online: https://ads.atmosphere.copernicus.eu/cdsapp#!/dataset/cams-europe-air-quality-reanalyses?tab=overview (accessed on 7 February 2024).
- Tchepel, O.; Monteiro, A.; Dias, D.; Gama, C.; Pina, N.; Rodrigues, J.P.; Ferreira, M.; Miranda, A.I. Urban aerosol assessment and forecast: Coimbra case study. Atmos. Pollut. Res. 2020, 11, 1155–1164. [Google Scholar] [CrossRef]
- Dias, D.; Tchepel, O.; Antunes, A.P. Integrated modelling approach for the evaluation of low emission zones. J. Environ. Manag. 2016, 177, 253–263. [Google Scholar] [CrossRef] [PubMed]
- Dias, D.; Antunes, A.P.; Tchepel, O. Modelling of emissions and energy use from biofuel fuelled vehicles at urban scale. Sustainability 2019, 11, 2902. [Google Scholar] [CrossRef]
- Pina, N.; Tchepel, O. A bottom-up modelling approach to quantify cold start emissions from urban road traffic. Int. J. Sustain. Transp. 2022, 17, 942–955. [Google Scholar] [CrossRef]
- Alves, C.; Rienda, I.C.; Vicente, A.; Vicente, E.; Gonçalves, C.; Candeias, C.; Rocha, F.; Lucarelli, F.; Pazzi, G.; Kováts, N.; et al. Morphological properties, chemical composition, cancer risks and toxicological potential of airborne particles from traffic and urban background sites. Atmos. Res. 2010, 264, 105837. [Google Scholar] [CrossRef]
- Pina, N.; Almeida, S.M.; Alves, C.; Tchepel, O. Local contribution of road traffic and residential biomass burning to black carbon aerosols–modelling and validation. Atmos. Environ. 2024, 337, 120764. [Google Scholar] [CrossRef]
- PTV. VISUM 13 User Guide; PTV-AG: Karlsruhe, Germany, 2013. [Google Scholar]
- EMEP/EEA. Exhaust emissions from road transport. Passenger cars, light-duty trucks, heavy-duty vehicles including buses and motor cycles. In Air Pollutant Emission Inventory Guidebook 2019 (EEA Report No. 13/2019); European Monitoring and Evaluation Programme (EMEP): Dublin, Ireland; European Environment Agency (EEA): Copenhagen, Denmark, 2019. [Google Scholar]
- CERC. ADMS-Roads User Guide 2017. Version 4.1. Available online: https://www.cerc.co.uk/environmental-software/user-guides.html (accessed on 1 March 2023).
- Hertel, O.; Berkowicz, R. Operational Street Pollution Model (OSPM). Evaluation of the Model on Data from St. Olavs Street in Oslo; National Environmental Research Institute: Nagpur, India, 1989. [CrossRef]
- Directive 2008/50/EC of the European Parliament and of the Council of 21 May 2008 on ambient air quality and cleaner air for Europe. Off. J. Eur. Union 2008, L 152, 1–44. Available online: https://eur-lex.europa.eu/legal-content/EN/TXT/PDF/?uri=CELEX:32008L0050&from=en (accessed on 4 April 2024).
- Particulate matter (PM2.5 and PM10), ozone, nitrogen dioxide, sulfur dioxide and carbon monoxide. In WHO Global Air Quality Guidelines; World Health Organization: Geneva, Switzerland, 2021; Available online: https://www.who.int/publications/i/item/9789240034228 (accessed on 4 April 2024).
- COM/2022/542 Final—Proposal for a Directive of the European Parliament and of the Council on Ambient Air Quality and Cleaner Air for Europe. Available online: https://eur-lex.europa.eu/legal-content/EN/TXT/?uri=COM%3A2022%3A542%3AFIN (accessed on 27 July 2024).
- European Green Deal: Commission Proposes Rules for Cleaner Air and Water. Available online: https://ec.europa.eu/commission/presscorner/detail/en/ip_22_6278 (accessed on 27 July 2024).
Disclaimer/Publisher’s Note: The statements, opinions and data contained in all publications are solely those of the individual author(s) and contributor(s) and not of MDPI and/or the editor(s). MDPI and/or the editor(s) disclaim responsibility for any injury to people or property resulting from any ideas, methods, instructions or products referred to in the content. |
© 2024 by the authors. Licensee MDPI, Basel, Switzerland. This article is an open access article distributed under the terms and conditions of the Creative Commons Attribution (CC BY) license (https://creativecommons.org/licenses/by/4.0/).