Article

Disentangling the Effects of Multiple Impacts of Natural Flooding on a Riverine Floodplain Lake by Applying the Phytoplankton Functional Approach

by
Melita Mihaljević
1,† and
Katarina Kajan
2,*,†
1
Department of Biology, Josip Juraj Strossmayer University of Osijek, Ulica cara Hadrijana 8/A, HR-31000 Osijek, Croatia
2
Independent Researcher, Ivana Bakića 26, HR-31206 Erdut, Croatia
*
Author to whom correspondence should be addressed.
These authors contributed equally to this work.
Environments 2024, 11(10), 216; https://doi.org/10.3390/environments11100216
Submission received: 6 August 2024 / Revised: 18 September 2024 / Accepted: 29 September 2024 / Published: 1 October 2024

Abstract

:
Riverine floodplains are ecologically remarkable systems that have historically faced strong anthropogenic pressures. The aim of this study was to examine whether the phytoplankton functional approach by Reynolds is a useful tool for disentangling anthropogenic pressure from the impact of natural flooding on a riverine floodplain lake. Lake Sakadaš, part of the large conserved river–floodplain system along the Danube River (Kopački Rit, Croatia), was used as a case study. Historical data on phytoplankton dynamics from the 1970s, when the lake was exposed to direct inflows of agricultural wastewater, were compared with current data from a time when the lake was a strongly protected area. Analysis of the phytoplankton community, based on functional groups and their beta diversities, revealed clear variation between the observed periods. The heavy bloom of species from only one functional group with extremely high biomass indicated a highly impacted environment in the past. Recent data suggest that, with the cessation of direct pollution, near-natural hydrological conditions with flooding as a fundamental environmental driving factor, support algal assemblages characteristic of a naturally eutrophic lake. Assessing multiple pressures on floodplain lakes and disentangling their specific impacts on ecological statuses are crucial for defining the protection and sustainable management of these particularly sensitive and endangered freshwater systems.

1. Introduction

Human activities have increased the discharge of pollutants, altered water flow regimes, and modified the morphology of rivers, which has resulted in multiple pressures on freshwater ecosystems [1]. To understand the distribution and composition of biological communities and their interaction with physicochemical and biological factors, it is crucial to disentangle the influence of both natural factors and human disturbances on freshwater systems [2]. At the European level, the classification systems for assessing the ecological statuses of surface waters, as outlined by the Water Framework Directive (WFD) [3], aim to evaluate how the structure of biological communities and ecosystem functioning are altered in response to anthropogenic pressures such as nutrient loading, exposure to toxic and hazardous substances, physical habitat alterations, etc. [4]. Consequently, there has been an increasing demand in recent decades for methods to assess the ecological status of freshwater ecosystems [5]. Most of the methods primarily address the impacts of eutrophication, with only a few accounting for multiple pressures (mainly eutrophication and hydromorphological alterations). However, not all the necessary pressure–response relationships have been established, or they have been established only for eutrophication parameters [6]. This highlights the need for further research, particularly regarding the impact of combined pressures, such as eutrophication and hydrological pressures, like alterations in natural water levels or flushing rates [6]. Additionally, the WFD assesses the ecological quality status of surface water bodies by comparing the biological quality elements of a water body with their reference values derived from type-specific reference conditions [3]. The definition of reference conditions is, therefore, a crucial element in ecological assessments of freshwater ecosystems [7]. However, this process can be challenging, particularly in ecosystems with significant temporal fluctuations or spatial variations (i.e., lowland rivers) or in ecosystems with limited data on their structure and function prior to human settlement or disturbance (i.e., riverine floodplains) [8].
Riverine floodplains build an important link between rivers and their catchments, mainly through their water retention capacities and the lateral connectivity controlled by flood events and groundwater exchange, along with the presence of structural features such as side channels and wetlands [9]. The biodiversity and productivity of floodplains result from natural flooding events, where water overflows the riverbanks and spreads across the alluvial plain, depositing sediments and replenishing nutrients in the process [10]. Over the past centuries, riverine floodplains have faced significant anthropogenic pressures, making them some of the most vulnerable and endangered ecosystems today [11]. In particular, floodplains along large European rivers have been threatened by numerous anthropogenic factors. These include catchment-level impacts, such as land use changes and urbanization, which affect runoff and sediment yield, as well as river channel modifications, like river regulation, that directly alter both the channel and surrounding floodplains [12]. Consequently, 70–90% of Europe’s floodplains are now ecologically degraded [13] and no longer provide the same ecosystem services as natural floodplains, including supporting habitats for the distinctive flora and fauna native to these ecosystems [14].
The impact of specific human activities on lowland floodplain river ecosystems is often poorly understood, and establishing a ‘reference’ condition for these systems is frequently challenging due to the lack of pristine or pre-disturbed sites, as well as the absence of process-based models that can accurately predict the effects of natural and human-induced disturbances [8]. Since determining the actual ecological status relies on knowledge of undisturbed reference states of a particular water body, the main disadvantage is the lack of historical data on various organism groups, i.e., the taxa expected in the absence of human pressures, in a “pristine condition” [15]. Therefore, when sites with minor anthropogenic impact are unavailable, historical monitoring data or paleoecological methods should be used to reconstruct reference conditions prior to the commencement of significant human influence [16]. Expert judgment may be required to assess when human impact began to intensify and to determine the period that reflects conditions with a minor impact [4]. In addition to the aforementioned, structural elements in a complex river–floodplain system, such as small-scale permanent and temporary water bodies, are usually not included in regular hydrobiological monitoring. Only recently has the European ecological floodplain typology begun to develop [9], with a proposal to classify floodplains based on abiotic factors known to govern floodplain habitats and biota, but not influenced by human alterations.
Among biological qualitative elements, phytoplankton has been used mandatorily in the assessment of rivers and lakes and has played an important role in the development of WFD-compliant assessment methods [6]. Traditional phytoplankton monitoring based on the taxonomic level of community structure has proven only partially useful for determining water quality, as numerous phytoplankton species are grouped into broader taxonomic categories despite their very different ecological properties [17]. Consequently, studies over the past few decades have focused on developing phytoplankton trait-based approaches that group species with similar morphological and functional properties, leading to the creation of several phytoplankton classification concepts. According to one such concept, the functional phytoplankton classification sensu Reynolds et al. [17], species groups are defined by specific habitats, tolerances, and sensitivities based on various combinations of physical, chemical, and biological properties of the water body environment, such as the depth of the mixing layer, light, temperature, nutrients, and grazing pressure. Functional classifications, altogether with more than 40 groups (coda) described, simplify the comparison of seasonal changes in various water body types and evaluate the responses to environmental changes [18]. The applicability of a phytoplankton functional approach to assessing riverine floodplains in tropical regions, which remain relatively conserved and ecologically functional [10], has shown that the flood pulse, influenced by local factors, is the main driver of the phytoplankton functional groups in floodplain lakes in the Pantanal [19], Tocantins [20], and Amazonia [21]. Additionally, functional classification enables the representation of hydrological phases that characterize phytoplankton succession in highly disturbed river–floodplain systems, as observed in research on a floodplain lake in the Middle Danube [22]. The findings of Yan et al. [23] further demonstrate that land use types reflecting anthropogenic pressures could act as critical drivers explaining the dynamics of phytoplankton functional groups in river-connected lakes [23].
Following the functional classification, Padisák et al. [24] developed the phytoplankton assemblage index (Q index) to assess the ecological status of different lake types. The Q index is calculated by taking the proportion of functional groups (FGs) in the total biomass and multiplying it by a numerical factor (F) specific to each functional group. This factor reflects the type of phytoplankton assemblage that would be expected in a pristine lake of the corresponding type.
Recent research has demonstrated that the Q index can be applied without geographic limitations to both lakes and rivers. For instance, it has been used effectively for various types of Bulgarian lakes [25], small lakes in Poland [26], a shallow alluvial lake in Turkey [27], Mediterranean shallow lakes [28] and reservoirs [29], tropical semi-arid eutrophic reservoirs [30,31], and subtropical reservoir [32]. Hajnal and Padisák [33] successfully utilized the phytoplankton assemblage structure indicated by the Q index to reconstruct the history of water quality in Lake Balaton and to quantify changes in water quality during the eutrophication and restoration phases. Wang et al. [34] found that the Q index is effective in revealing spatial and temporal patterns of ecological status during bloom in a tributary bay of the Three Gorges Reservoir (China). Frau et al. [35] determined that the Q index is the most accurate metric for monitoring Neo-tropical shallow lakes, responding well to variations in phosphorus. Abony et al. [36] examined the Q composition metric for rivers to demonstrate the effects of human activity on the natural distribution of phytoplankton along the River Loire. Their study revealed that the longitudinal distribution of FGs could reflect changes in functional diversity due to human impacts, whereas species diversity alone might not.
The aim of this study was to evaluate whether the phytoplankton assemblage approach is a useful tool for effectively characterizing the impact of multiple pressures on the ecological status of a riverine floodplain lake. Lake Sakadaš, a shallow lake in one of the largest preserved floodplains along the Danube River (Kopački Rit Nature Park, Croatia), was used as a case study. Due to the lack of data from relatively pristine conditions, this assessment was based on comparing the dynamics of phytoplankton assemblages using historical data from the first phytoplankton research conducted half a century ago (1972–1973) by Dr. Gucunski [37], when the lake was exposed to direct wastewater inflows from nearby agricultural areas with the current data (2011–2012). We hypothesize that applying a phytoplankton functional approach could help distinguish between the effects of natural flooding and those resulting from anthropogenic influences on the floodplain lake.

2. Materials and Methods

2.1. Study Area

The floodplain along the Middle Danube, section 1410–1383 river km, known as a part of the Kopački Rit Nature Park (Croatia) (Figure 1), is one of the largest preserved natural floodplains of the Danube, covering approximately 180 km2. The hydrologic, hydraulic, and morphological variability through space and time determine the different habitats found in this area. The diversity of aquatic and wet biotopes, mostly channels, oxbows, marshes, and shallow lakes, continuously changes the area covered by water depending on the inflow of riverine waters. The flooding primarily depends on the hydrological regime of the Danube, and it may occur in any season of the year. Water flow, along with sediment transport and deposition across the floodplain, is highly complex due to the presence of diverse geomorphological features and vegetation types.
One of the significant water bodies in the Kopački Rit floodplain is Lake Sakadaš, the deepest water depression located in the western part of the floodplain, near the embankment that delineates the inundation area (Figure 1). The average depth of the lake is about 5 m, with a maximum depth of ca. 12 m and a surface water area of about 0.15 km2. The lake is in direct hydrological connection with the main river channel through two channels with a total length of ca. 10 km.
The flooding dynamics of the river–floodplain system of Kopački Rit can be approximated based on fluctuations in the Danube water level (DWL) [38,39,40]. According to Tadić et al. [38], the floodplain system begins to fill with Danubian waters when the DWL at 1401.4 r. km (hydrological station Apatin) exceeds 81.50 m a.s.l., causing overflow of the Hulovo Channel. Shallow channels and lakes begin filling once the water level reaches 82.00 m a.s.l. At this same level, water also starts flowing into Kopački Rit from the northern side through Vemeljski Dunavac. When the water level exceeds 83.00 m a.s.l., the entire floodplain area of Kopački Rit becomes inundated. According to Schwarz [40], minor floods (DWL 3–3.5 m) inundate less than 20% of the floodplain area, while extremely high floods (DWL higher than 5 m) inundate almost the entire floodplain area.
The results of hydrological analyses conducted by Tadić et al. [41] showed that in the period 1960–2019, there were no significant changes in the annual discharges of the Danube River stretch along the Kopački Rit. However, the distribution of river discharge on a monthly and seasonal basis has changed. High flows and high water pulses showed homogeneity, while low-flow episodes have become considerably frequent.
Some hydro-technical structures built in the past, such as canals, pumping stations, and levees, were often operated without proper control, allowing water drained from agricultural fields to enter the floodplain area [38]. During the 1970s, the lake was under strong impact due to the direct inflow of wastewater from the surrounding agricultural areas [37]. Conservation efforts resulted in the area being granted protection with the status of Nature Park. Additionally, revitalization measures were applied in 1984 and included complete isolation of the lake from wastewater and sediment removal. Afterward, during the last few decades, the lake was in a eutrophic/hypertrophic state according to OECD criteria [42], with yearly average phosphorous concentrations higher than 1000 µg L−1, transparency less than 1.5 m, and maximum chlorophyll–a concentrations exceeding 50 µg L−1 [43,44,45]. However, fluctuations in phytoplankton biomass are strongly related to flooding intensity, causing the lake to frequently shift between phytoplankton-clear and phytoplankton-turbid conditions with recurring cyanobacterial blooms [46].

2.2. Sampling and Physicochemical Analyses

In the period from July 2011 to September 2012, sampling was conducted monthly in the central region of Lake Sakadaš, (except in February 2012, when the lake was frozen). Selected water quality parameters, including water temperature, pH, conductivity, and dissolved oxygen (DO), were measured in situ at the subsurface (ca. 0.2 m) using a portable Multi 340i WTW instrument (Wissenschaftlich-Technische Werkstätten, Weilheim, Germany). Lake water depth (WD) was measured with a weighted rope and the transparency was estimated with a Secchi disc. Samples for chemical analyses of ammonium (NH4+), nitrates (NO3), nitrites (NO2), organic nitrogen (orgN), total nitrogen (TN), and total phosphorus (TP) were taken at a depth of ca. 0.2 m below the water surface. Chemical variables were analyzed in the laboratory according to standard methods [47]. Depth-integrated samples for assessing the quantitative composition of phytoplankton were collected from the entire water column and fixed in situ with Lugol’s acidified solution. For qualitative analysis, samples were obtained using a 22.5 µm mesh phytoplankton net and preserved in 4% formaldehyde.
The historical data cover the period from July 1972 to September 1973 (excluding August 1973). This dataset includes monthly qualitative and quantitative phytoplankton composition data, as well as data on a few physical and chemical parameters, including water temperature, water depth, transparency, pH, and DO, while other chemical variables, mainly nutrients, were recorded as either present or absent [37].

2.3. Phytoplankton Analysis

In samples collected during 2011–2012, phytoplankton taxa were identified by light microscopic observations using standard literature for species determination [48,49,50,51,52,53]. The taxonomic classification was updated with recent findings, and nomenclature was revised according to Algaebase [54]. Quantitative assessment of phytoplankton was conducted following Utermöhl [55], using an inverted microscope (Axiovert 25, Carl Zeiss, Inc., Göttingen, Germany) at multiple magnifications (100×, 400×) and counting 400 individuals. The counting unit was the individual (unicell, coenobium, filament, or colony), and each species’ abundance was expressed as the number of individuals per liter (ind. L−1). Biovolumes were calculated following Rott (1981), where individuals were measured and their volumes determined by relating cell shape to the corresponding geometric body. For colonial organisms with mucilage, calculations included the entire colony together with the mucilage. Biomass was estimated by multiplying each phytoplankton species’ abundance by its mean biovolume [56,57] and expressed as milligrams per liter (mg L−1) of fresh mass.
Qualitative and quantitative phytoplankton composition data for the period 1972–1973 were obtained from Gucunski [37]. The taxonomic classification was updated according to Algaebase [54]. Phytoplankton abundance data (cell L−1) were converted to biomass (mg L−1) using cell biovolume data from the phytoplankton species database published by Gucunski and Popović [58], following the methods described above.
Phytoplankton taxa were classified into functional groups based on the framework proposed by Reynolds et al. [17] and revised by Padisák et al. [18]. The assemblage index (Q index), as outlined by Padisák et al. [24], was used to assess the ecological status of the lake. This index was calculated based on the relative share of each functional group in the total biomass (1), the biomass of each functional group (FG), the total biomass, and the factor number (F) assigned to each FG. The factor number was determined based on the previous knowledge and experience of experts, along with data from the literature. The ecological status was classified into five grades: 0–1 (bad), 1–2 (tolerable), 2–3 (medium), 3–4 (good), and 4–5 (excellent).
Q = i = 1 n p i F

2.4. Statistical Analysis

The data were visualized and statistically analyzed in R studio v 2024.04.1 [59] and R v 4.4.0 [60] with the packages vegan [61], dplyr [62], and ggplot2 [63]. For subsequent analyses, data from the August 2012 sampling were excluded, while no data were available from August 1973. Correlations between parameters across two periods were evaluated using Pearson’s correlation. Differences in environmental parameters within the samples from July 2011 to September 2012 were examined using principal component analysis (PCA). From the total dataset, the main environmental factors were selected for PCA after excluding co-correlating parameters identified through Pearson’s correlation. Principal coordinate analysis (PCoA) was performed on the Bray–Curtis distance matrix at the level of FG’s biomass.

3. Results

3.1. Flooding Pattern

During the periods from July 1972–September 1973 and from July 2011–September 2012, the Danube water level (DWL) exhibited distinct variability patterns (Figure 2). The daily courses of the DWL for these periods showed a statistically significant positive correlation (Pearson’s r = 0.27, p < 0.001). The floodplain was characterized by alternating phases of limnophase (dry periods) and potamophase (flood periods). Flooding patterns were defined by timing (season), duration of flooding, and the total surface of the flooded area (Table 1).
The period 1972–1973 was characterized by frequent floods, including two extremely high flood events when the DWL exceeded 5 m and flooded more than 90% of the area in July 1972 and May 1973. This period featured a maximal DWL of 5.84 m and extensive flooding, with more than 75% of the floodplain inundated over 27 days. The most extended flood occurred during the spring–summer of 1973, lasting 80 days in continuum. Additionally, there was a long-lasting dry phase from mid-July to the end of October in 1972, with another dry phase occurring in the summer of 1973.
The inundation pattern during the period 2011–2012 was characterized by frequent short-term floods of minor to moderate intensities, except during late summer and early autumn, when long-lasting dry conditions occurred in both years. Extremely low DWL influenced the outflow of water from the floodplain to the main channel, with a minimal water level of −0.30 m recorded in December 2011. The longest dry phase was marked by an absence of flooding for 97 days in winter, which characterized the longest dry phase of the 2011–2012 study period. After this dry phase, short-term flood pulses were frequent during late winter and spring, including two major flood pulses with a maximum level of 4.91 m. In the summer of 2012, the floodplain went through a second dry phase lasting until the end of the studies.

3.2. Physical and Chemical Water Parameters

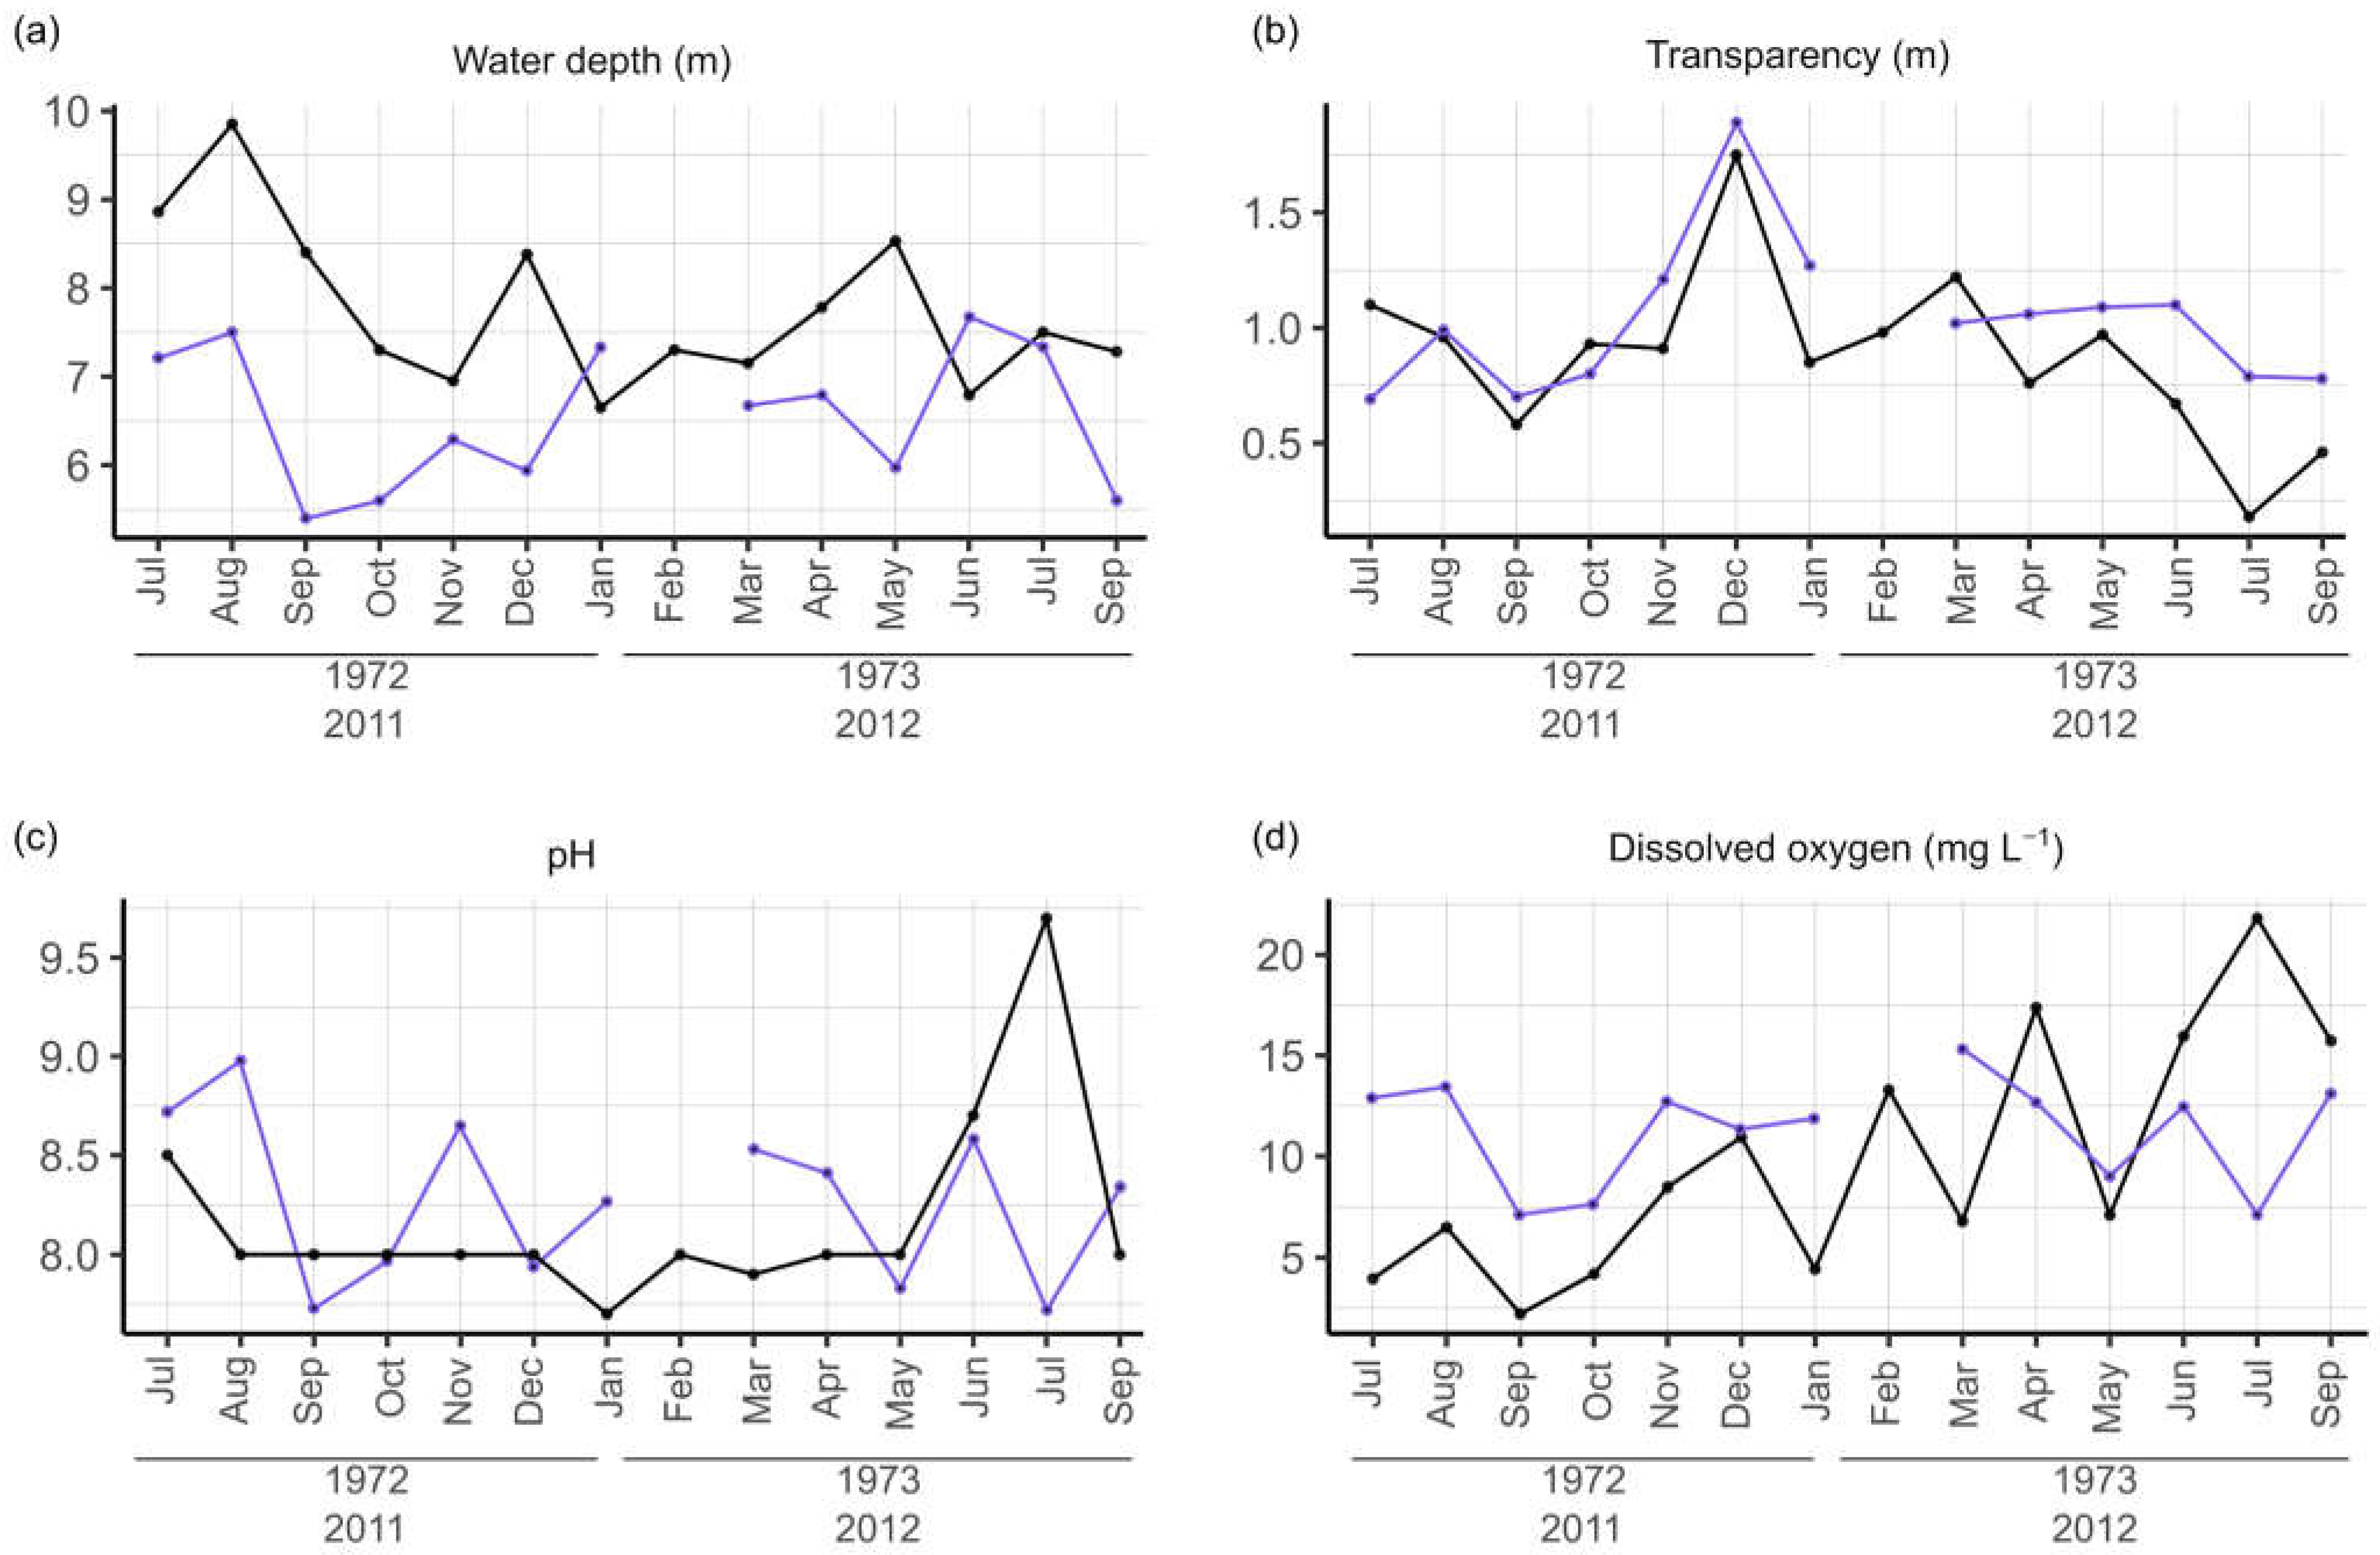
Unfortunately, only data for lake water depth (WD), water temperature, and three water quality parameters (transparency, DO, and pH) are available for the period 1972–1973 (Figure 3). During this period, WD oscillations ranged from 6.65 to 9.85 m, with a mean value of 7.77 m showing a statistically significant correlation with the DWL (Pearson’s r = 0.85 p = 0.00012; Figure 3a). Water transparency (Secchi depth, SD) was consistently low throughout the study period, with a mean value of 0.88 m and oscillations from 1.75 m in December 1972 to only 0.18 m in July 1973 (Figure 3b). The lake water was always alkaline, with a mean pH of 8.1 and an exceptionally high value of 9.7 recorded in July 1973 (Figure 3c). DO concentrations showed a significant correlation with pH (Pearson’s r = 0.6, p = 0.024). Hypoxic conditions appeared in September 1972, with a concentration of only 2.2 mg L−1, while higher concentrations were recorded in the summer of 1973 (Figure 3d).
During the period 2011–2012, the WD of the lake varied from 5.4 to 7.7 m (Figure 3a), showing a statistically significant correlation with the DWL (Pearson’s r = 0.69, p = 0.0085). Compared with historical data, the lower mean WD in 2011–2012 (7.77 m vs. 6.56 m) is attributed to the rapid silting process across the entire floodplain [38]. Water transparency remained very low, with a mean value of 1.0 m and oscillations between 0.7 and 1.9 m, similar to historical observations (Figure 3b). The pH values ranged between 7.7 and 9.0, indicating alkaline conditions similar to historical data (Figure 3c). DO concentrations varied from 7.1 to 15.3 mg L−1, with no anoxic conditions observed (Figure 3d). A statistically significant correlation was found between pH and DO (Pearson’s r = 0.85, p = 0.00026).
A positive statistically significant correlation between the two studied periods was found for transparency (Pearson’s r = 0.69, p = 0.0095) and water temperature (Pearson’s r = 0.97, p ≤ 0.001), but no significant correlations were identified for the other parameters.
Significant nutrient oscillations were measured during 2011–2012 in Lake Sakadaš (Table 2). The highest values of ammonium (454 µg L−1) and nitrates (3950 µg L−1) were recorded in December 2011, coinciding with the highest water transparency. Nitrate concentrations were positively correlated with transparency (Pearson’s r = 0.81, p ≤ 0.001), while ammonium concentrations showed a negative correlation with DWL (Pearson’s r = −0.59, p = 0.034). Total nitrogen concentrations were higher in 2012, with a maximum of 5682 µg L−1, and positively correlated with transparency (Pearson’s r = 0.63, p = 0.02). Total phosphorus levels varied significantly throughout the sampling period, ranging from 61 to 422 µg L−1 (Table 2).
Principal component analysis (PCA) performed on nine physical and chemical parameters from the 2011–2012 period explained 71.50% of the total variance along the first two principal component axes (Figure 4). The analysis revealed that higher DWL, WD, and pH were linked to the separation of samples from the summer period, whereas samples from September, October, and December 2011 were characterized by lower DWL and WD. However, the interactions of multiple parameters did not result in distinct groupings of samples, suggesting that no single factor was dominant enough to produce a clear separation between samples in the studied period.

3.3. Phytoplankton Functional Assemblages and Q Index

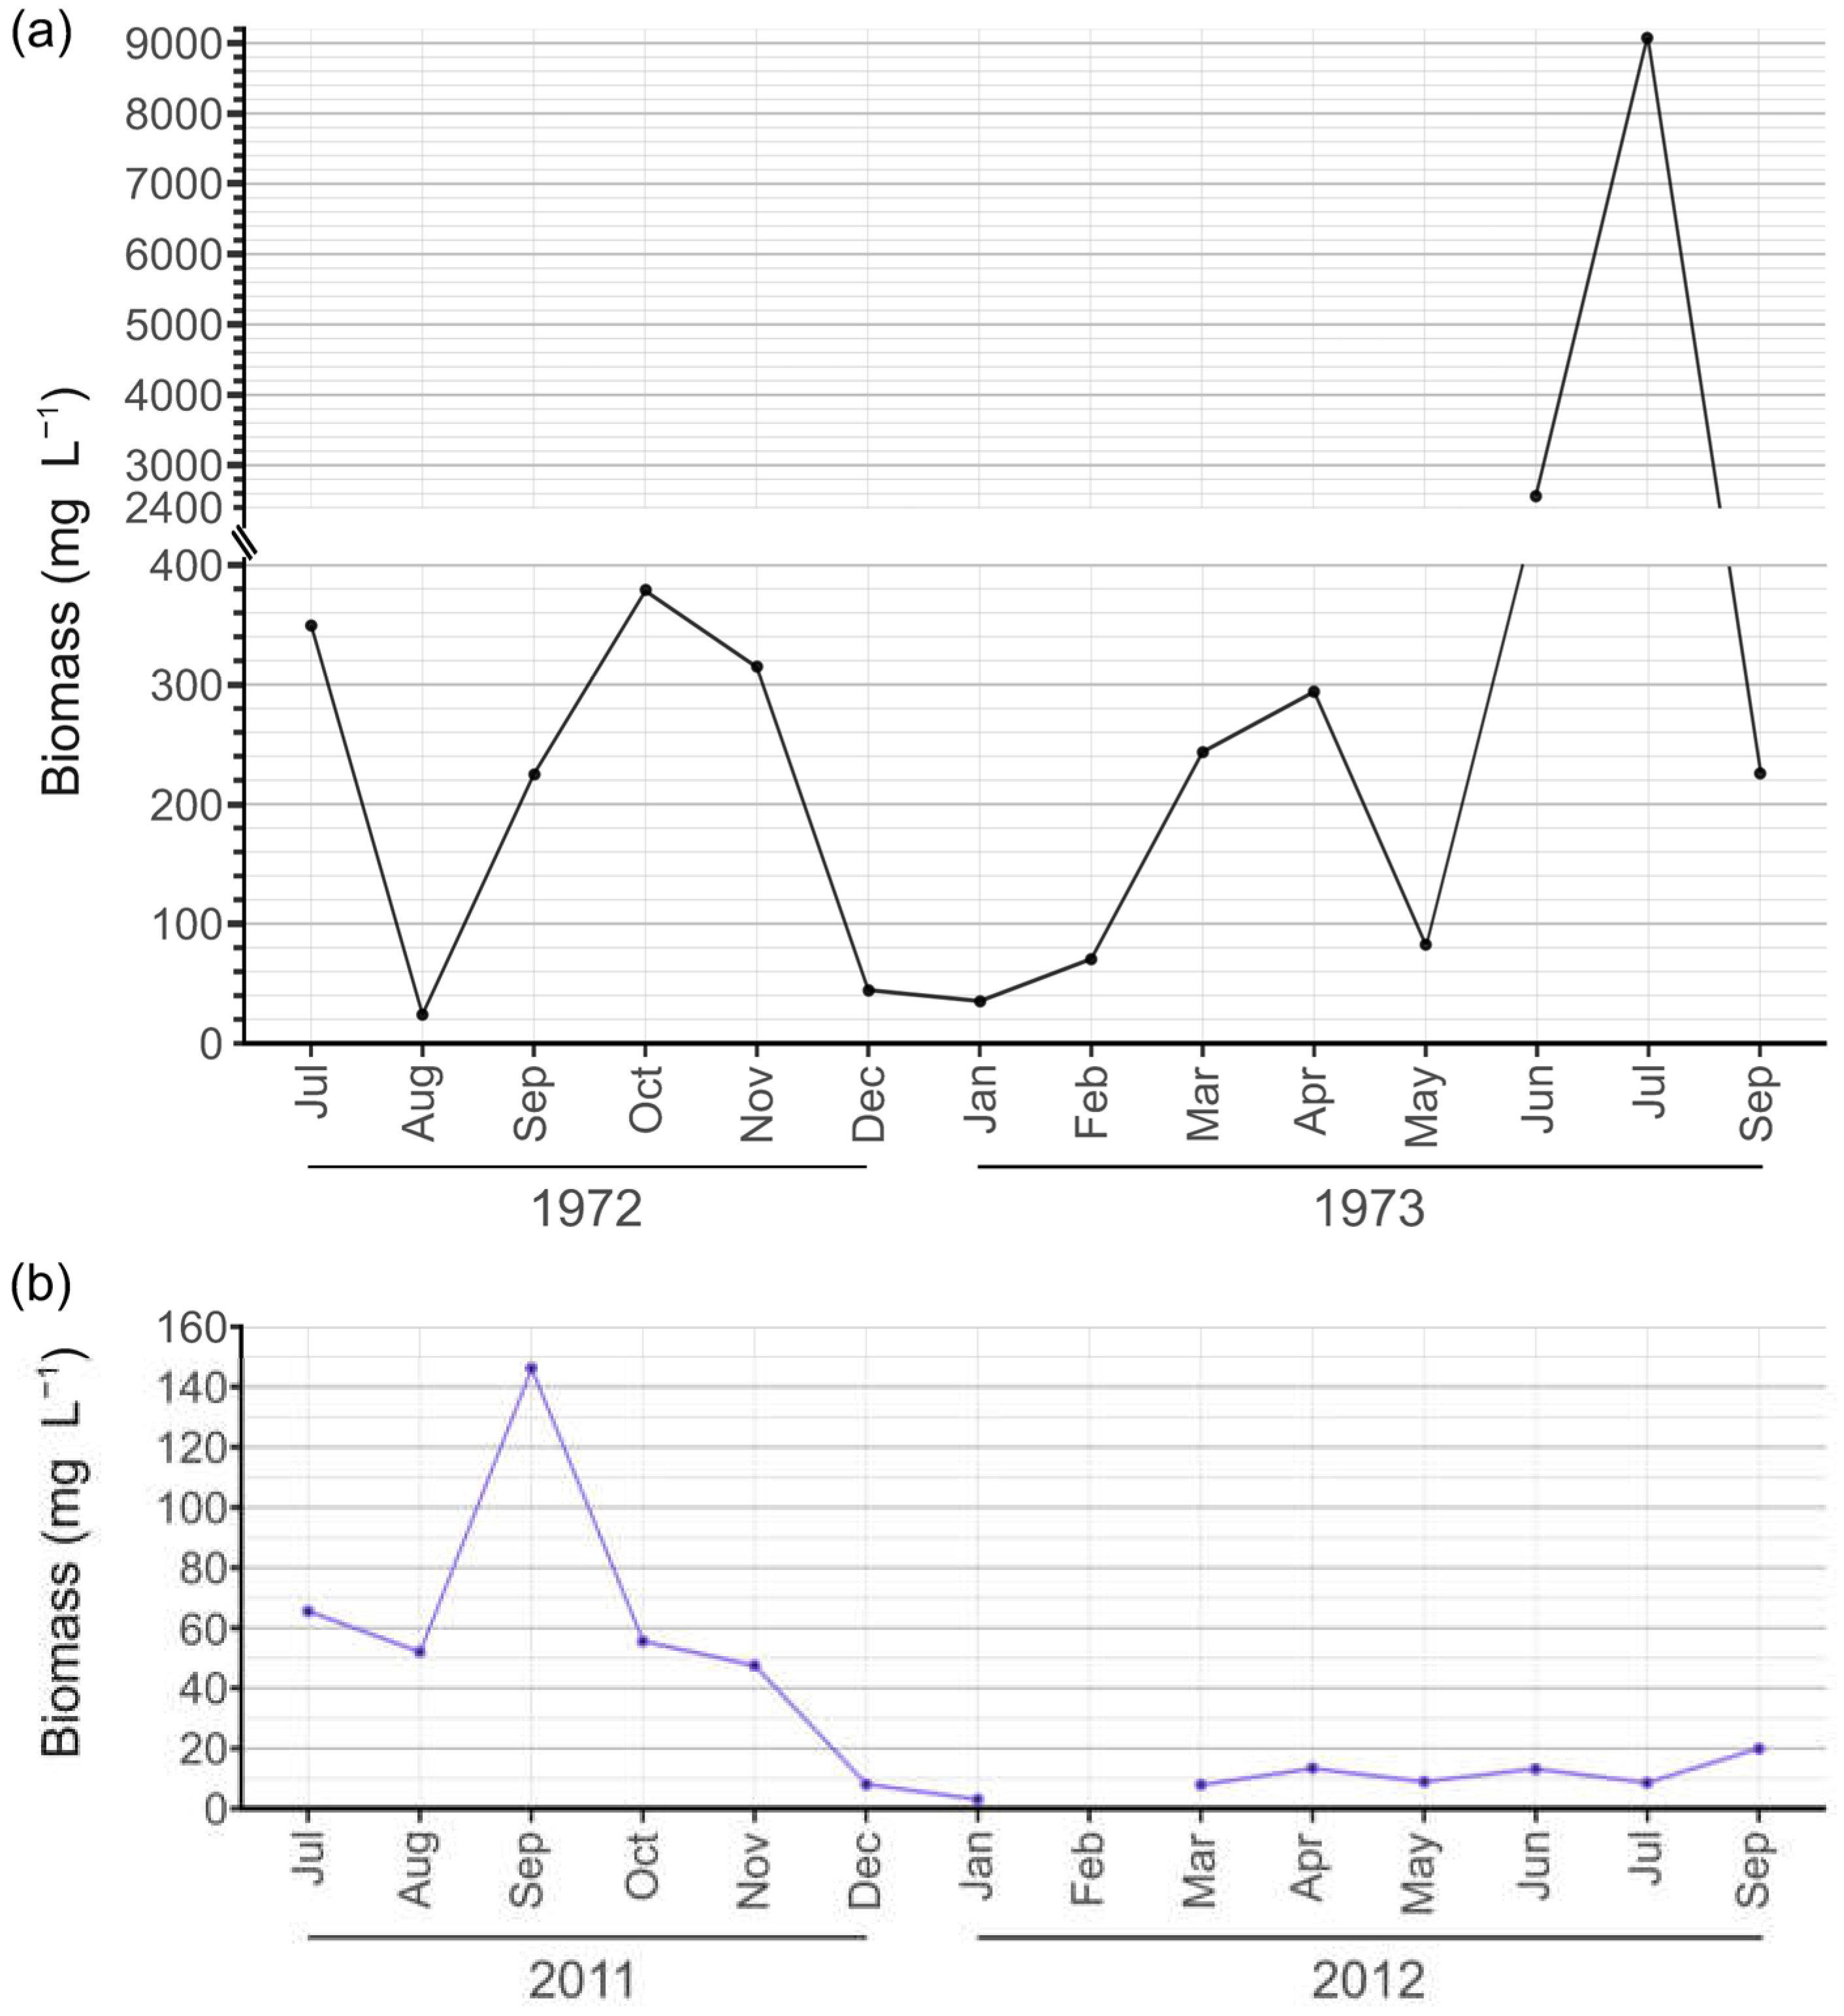
During the period 1972–1973, total phytoplankton biomass was enormously high, with a mean value of 995.0 ± 2413.3 mg L−1 (Figure 5a). Biomass peaked at 2564 mg L−1 in June 1973, with an enormously high value of 9075 mg L−1 recorded in July 1973. Lower values (less than 50 mg L−1) were observed during the winter months (December to February), as expected. However, a significant decrease in biomass was noted in August 1972 (Figure 5a). Total biomass during this period correlated negatively with transparency (Pearson’s r = −0.59, p = 0.026) and positively with DO (Pearson’s r = 0.64, p = 0.015) and pH (Pearson’s r = 0.94, p ≤ 0.001).
In contrast, total phytoplankton biomass during 2011–2012 was much lower, with a mean value of 34.7 ± 40.0 mg L−1 (Figure 5b). Two periods were distinguished in relation to higher values of the total biomass: turbid conditions in 2011 with biomass oscillation up to 145 mg L−1, and clear conditions in 2012 with biomass oscillation up to 45 mg L−1 (Figure 5b). Total biomass during this period showed a positive correlation with nitrite concentrations (Pearson’s r = 0.71, p = 0.0064) and a negative correlation with total nitrogen (Pearson’s r = −0.72, p = 0.0053).
A total of 317 phytoplankton taxa were registered during the studied periods in Lake Sakadaš and sorted into 28 functional groups (FGs; Table 3) among which 22 FGs had relative biomasses higher than 5% and were considered dominant: B, C, D, E, F, G, H1, J, L0, M, MP, P, S1, S2, SN, T, W1, W2, WS, X2, X3, and Y.
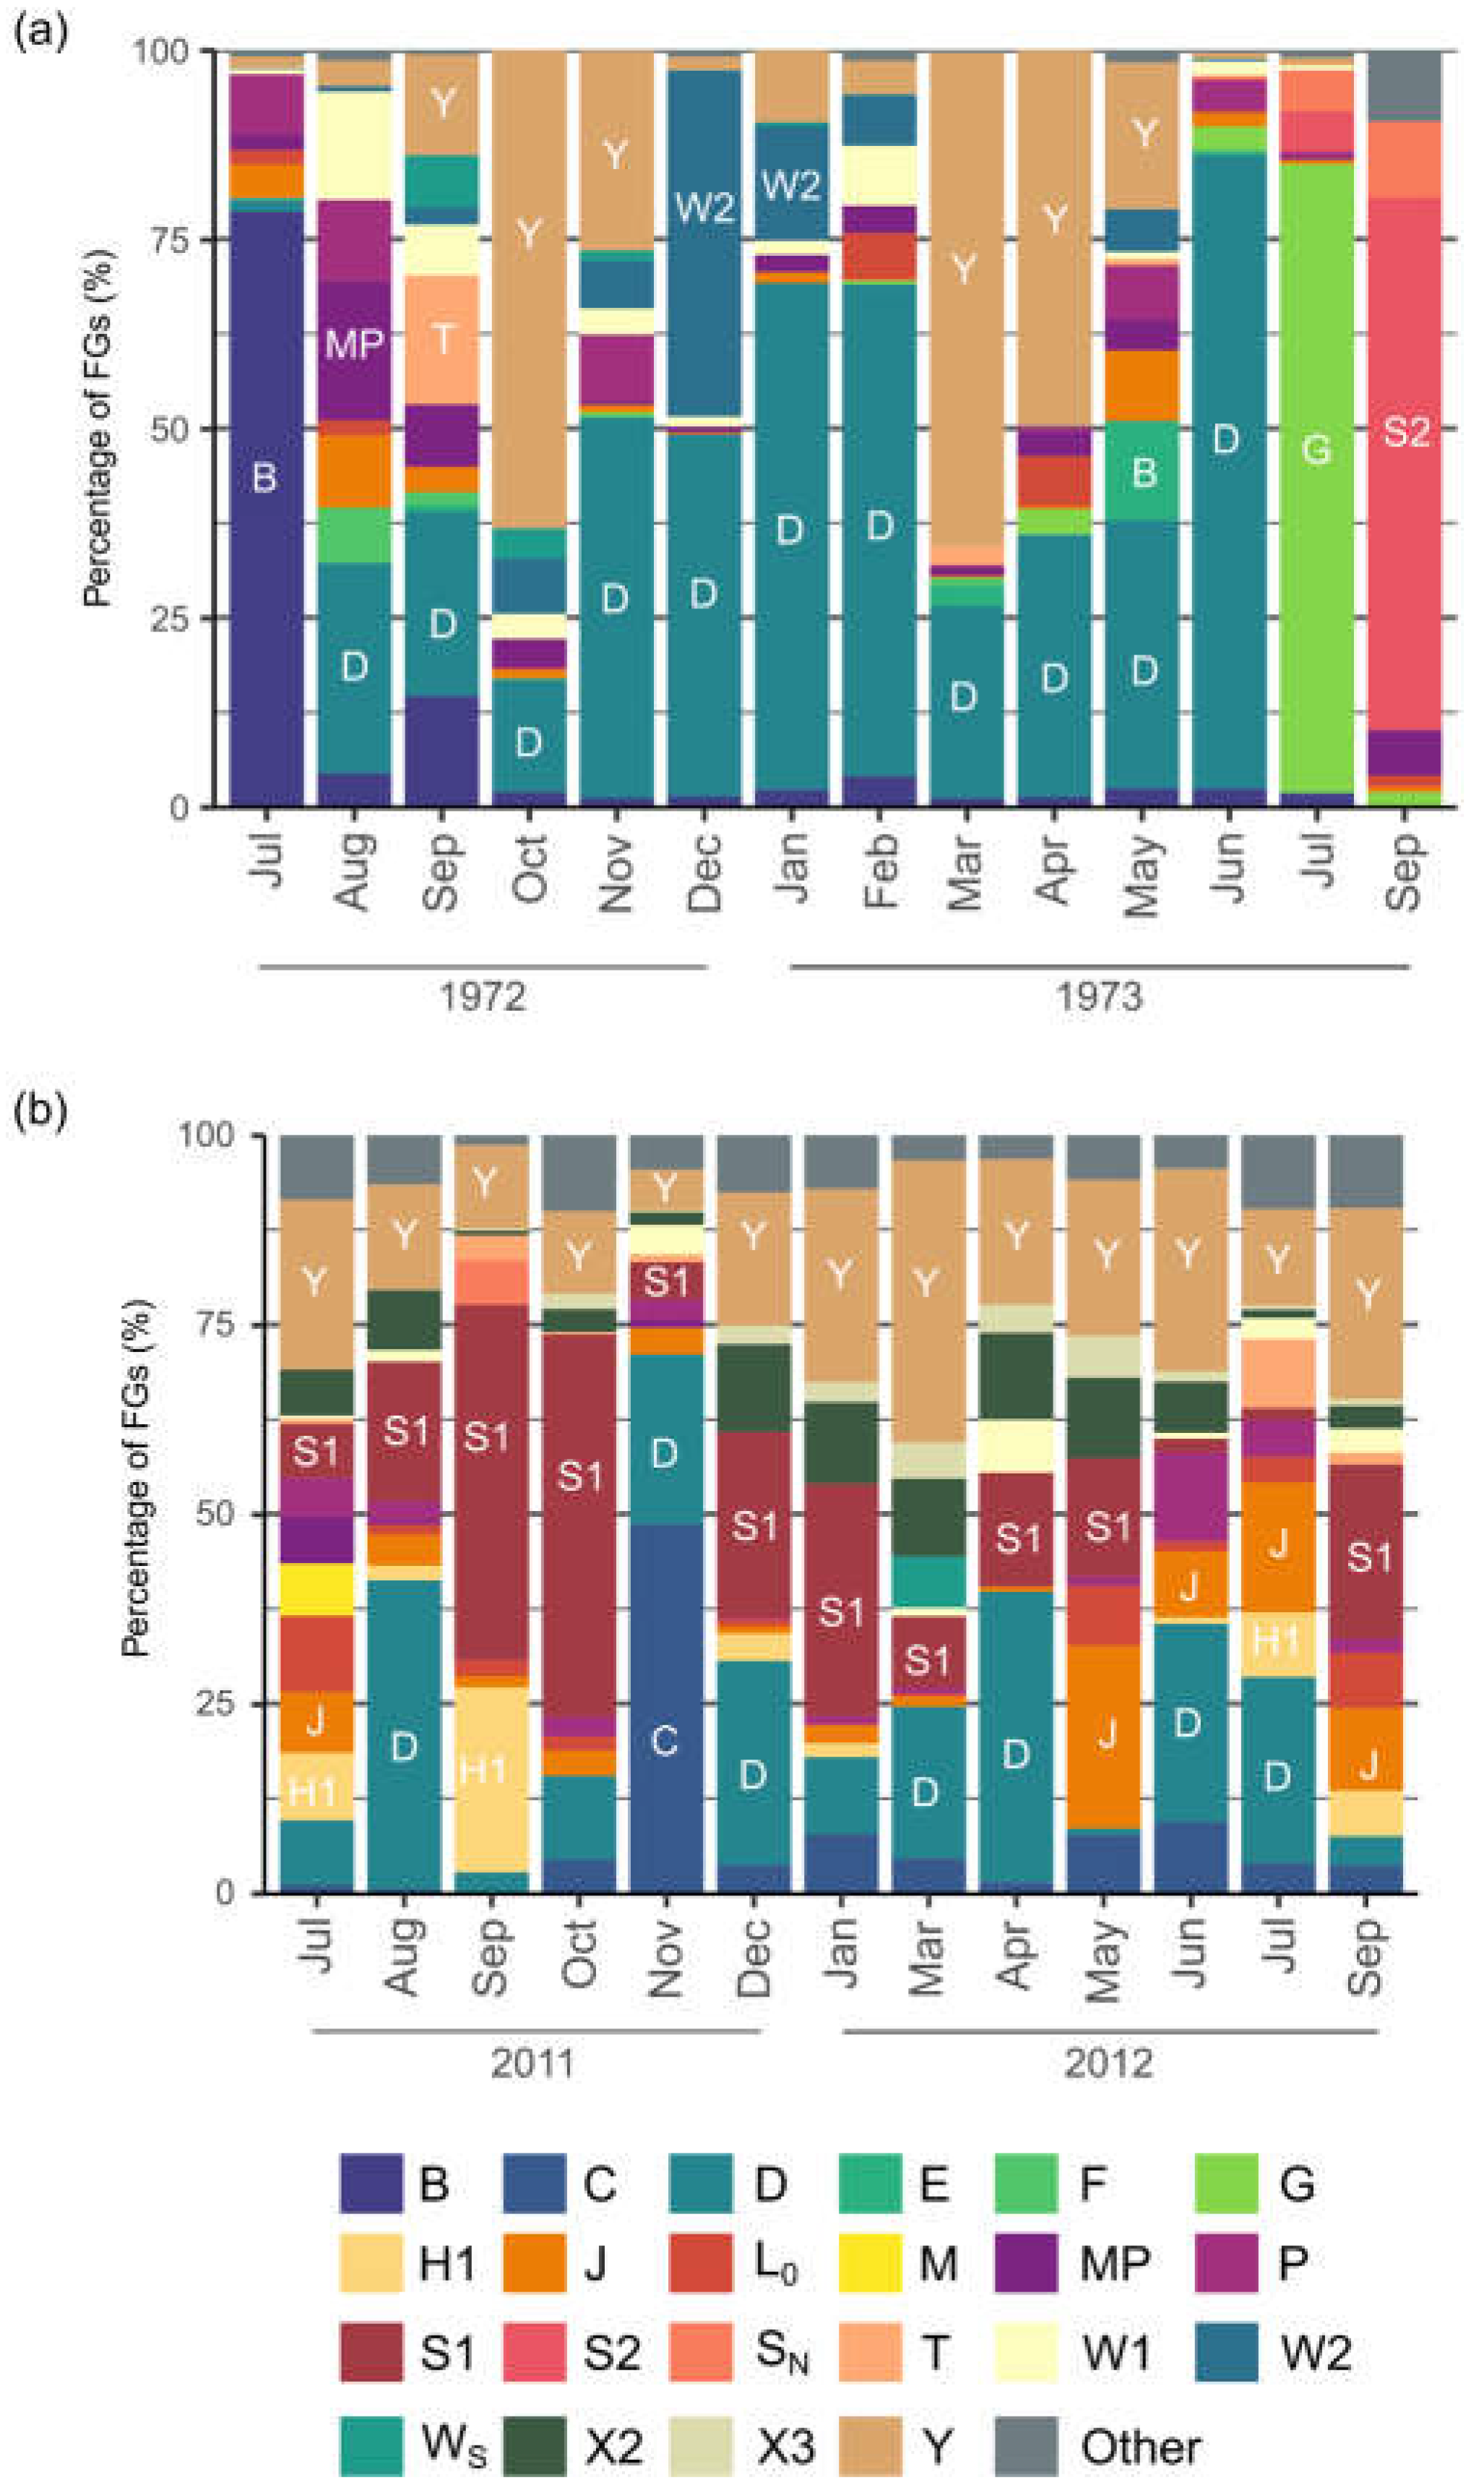
In the period 1972–1973, species belonging to groups D, G, B, and S2 exhibited extremely high blooming, reaching relative biomass values higher than 70% of the total biomass (Figure 6a; Table 3). In June 1972, group D accounted for 83.8% of the total biomass dominated by the centric diatoms Stephanodisucus hantzschii and Cyclostephanos dubius. Group G reached up to 83% of the total biomass in July 1973, with the dominance by Eudorina elegans, Pleodorina illinoisensis, and Pandorina morum. The dominant species from group B was Aulacoseira italica which massively developed in June 1973 and constituted 77.9% of the total biomass. Group S2, with monodominant species Spirulina sp., reached up to 70.4% in September 1972.
During the period 2011–2012, filamentous Cyanobacterial functional groups were present throughout the study period, with group S1 generally contributing to the total biomass (Figure 6b; Table 3). The highest contribution to total biomass was recorded in September 2011, during a massive bloom of filamentous Cyanobacteria belonging to groups S1, H1, and SN. Group S1 contributed up to 50.4% of the total biomass, mainly driven by the dominance of Planktothrix agardhii (48.1%), while group H1 achieved its highest biomass contribution during the study period, dominated by Dolichospermum sigmoideum (24%). This pattern persisted, except in June and July 2012 during the summer flood, when group D dominated the phytoplankton community with the highest contributions of Ulnaria ulna and Stephanodiscus hantzschii. Additionally, during the winter, group C, represented by Cyclotella meneghiniana, reached 48.7% of the total biomass in November 2011.
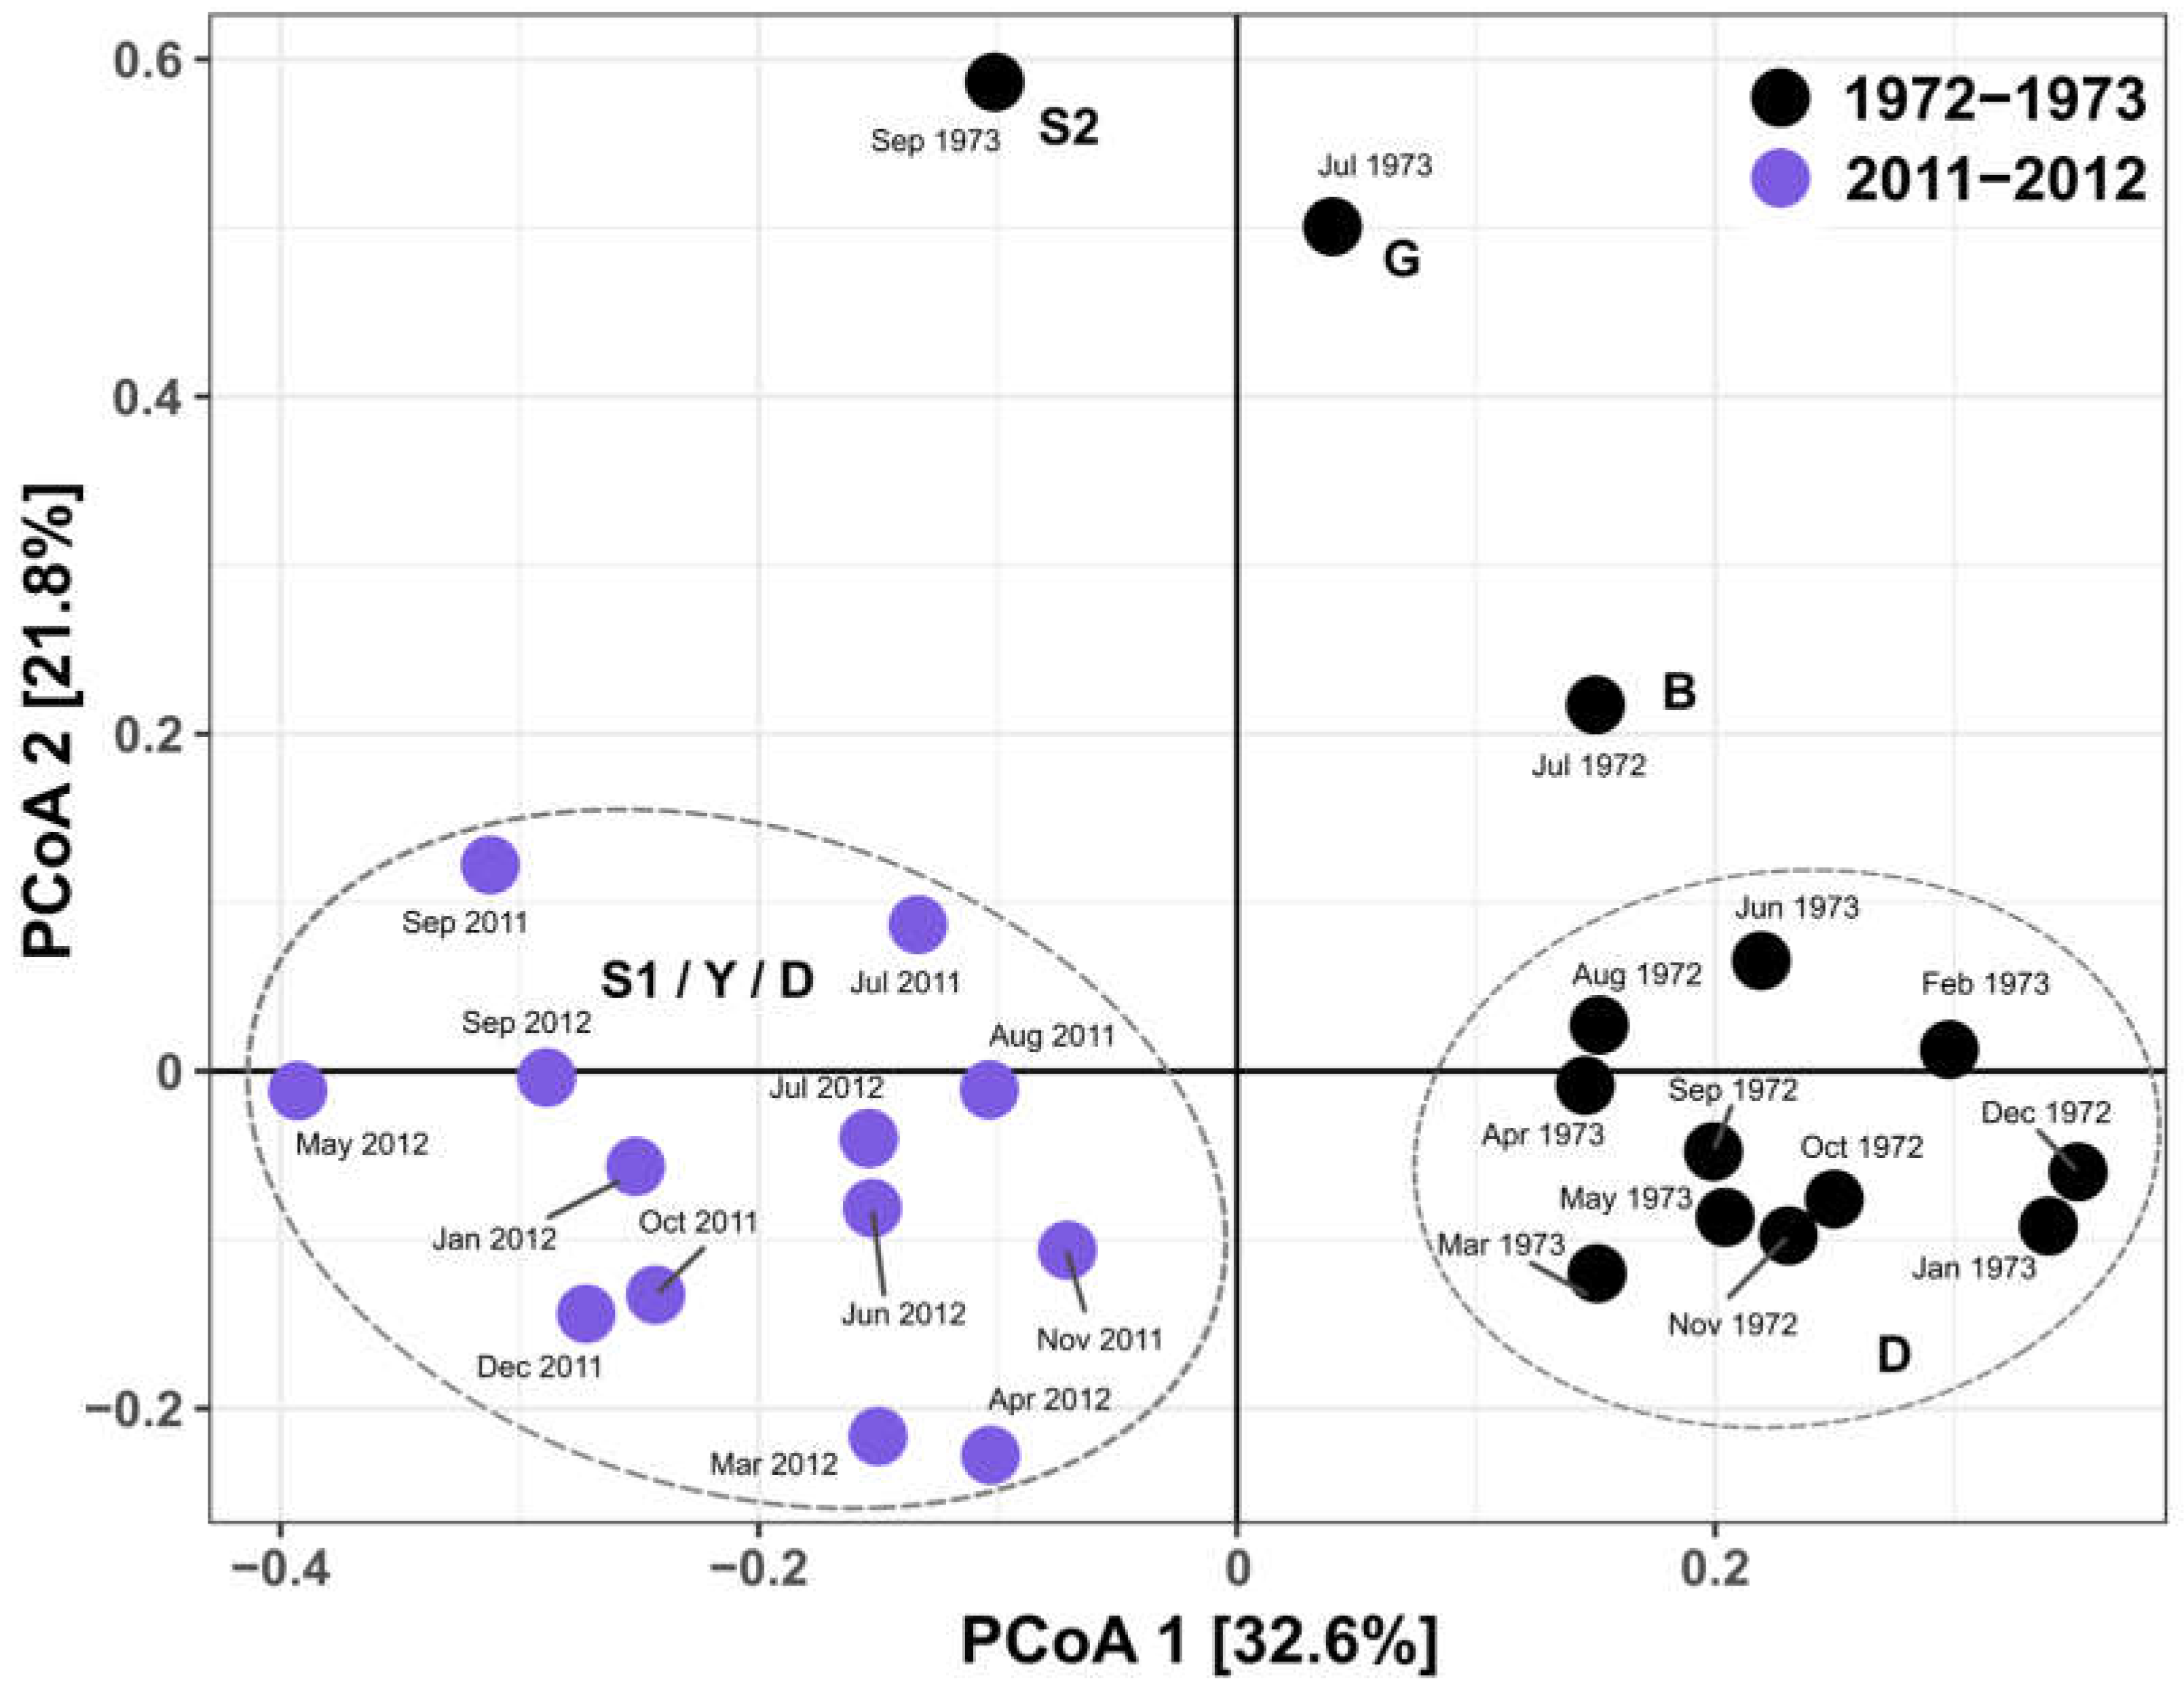
The results of PCoA displayed a separation of samples into two distinct groups based on the biomass of phytoplankton FGs in the lake (Figure 7). Samples whose species were massively developed and contributed to the total biomass of FG with more than 70% separated (groups S2, G, and B) from the remained two groups. Group 2011–2012 encompassed samples from the period 2011–2012, with the highest dominance of S1, Y, and D FGs, while group 1972–1973 had high dominance of D and Y functional groups.
The Q index values during the period 1972–1973 ranged from 0.17 to 3.10, indicating fluctuations in the ecological status of the lake (Figure 7). It was frequently in a medium condition, while in July and September 1973, the lake was in a bad condition. In December 1972 and January 1973, it was in tolerable condition, and only in May 1973 did the lake reach a good condition. The Q index showed a negative correlation with DO (Pearson’s r = −0.65, p = 0.012) and total biomass (Pearson’s r = −0.6, p = 0.023).
In the period 2011–2012, the Q index values varied seasonally, shifting the ecological status of the lake from tolerable to good (Figure 8). The highest value of 3.68 was recorded in November 2011, while the lowest of 1.05 was recorded in September 2011 during a cyanobacterial bloom. The Q index was negatively correlated with nitrites (Pearson’s r = −0.72, p = 0.0058) and total biomass (Pearson’s r = −0.57, p = 0.041).

4. Discussion

The investigated floodplain of Kopački Rit has been under various natural and anthropogenic impacts during the past half a century and, as in other complex river–floodplain systems, it is difficult to distinguish between their individual influences on lake ecology [12]. Our results, obtained by applying the functional approach and comparing historical records (from the 1970s) with current phytoplankton dynamics allowed for a rough assessment of the impact of particular factors on the ecological status of the lake. Given the dataset of phytoplankton functional groups and the main group arrangements in the principal coordinate analysis (PCoA) of the phytoplankton community, clear variations related to past and recent conditions were shown at the level of the FG biomass. Therefore, the influence of agricultural wastewater as the main anthropogenic impact in the past can be elucidated from the effects of the natural impact of flooding and eutrophication.

4.1. Anthropogenic Influence—Inflow of Agricultural Wastewater

Our results highlighted that heavy algal bloom, with extremely high biomass, composed of species just from one FG or the bloom of only one species from particular FGs were the most distinctive feature of the environmental conditions in the past. This indicates that only a small number of species were favored by the environmental conditions at that time, i.e., a highly anthropogenic impacted environment. Although there is no data on nutrient concentrations, it is reasonable to assume that wastewaters contributed to the intensive nitrate (N) enrichment of lake water, which was a widespread occurrence at that time in industrialized countries in Europe due to the agricultural intensification and extensive application of N fertilizers [64]. It is known that extreme N pollution in shallow eutrophic environments uniquely degrades water quality beyond levels attributable to P alone [65], and only a small number of species can find optimal conditions for development in such an environment; however, little is still known of how the in situ response to N fertilization differs among phytoplankton [66].
The most specific phytoplankton composition, visible in the arrangement of FGs in the principal coordinate analysis (PCoA), was in July and September of 1973. The Q index values (less than 1) indicate bad ecological conditions at that time. Firstly, the total phytoplankton biomass grew to enormously high values as a result of the massive development of species from group G (Eudorina sp., Pandorina sp., and Pleodorina sp.). Generally, the heavy blooming of this species has been widely recognized in eutrophic lakes under strong human impact with large amounts of sewage [67] or with excessive nutrient loading [68]. It is also indicative that in the summer of 1973, Kiss [69] recorded intensive algal bloom of Eudorina elegans in the dead arm of the Tisza River (a tributary of the Danube in Hungary) in strongly polluted salt and alkaline waters, containing large amounts of decomposing organic matters and qualified those conditions as “eutrophication to a dangerous extent”. Keeping in mind that this happened in a region with intense agricultural activity, similar to the surrounding area of our investigated lake, nitrate pollution of surface waters as associated with the use of fertilizer N can be considered as a source of such explosive bloom of species from group G.
Conditions of an “extreme environment for phytoplankton” [70] are also visible from another heavy algal bloom—that of the filamentous cyanobacteria Limnospira sp. (group S2), which occurred in September 1973, immediately after the bloom of species from group G. Extremely high biomass and monodominance of Limnospira fusiformis (syn. Arthrospira fusiformis in early publications Spirulina, or S. platensis) is typical for saline–alkaline lakes (soda lakes) characterized by high pH (over 9) and water rich in carbonate, chloride, and sulfate forms [70]. The pH in Lake Sakadaš was higher than 8 at that time, but only a month earlier, the pH had reached an extremely high value of nearly 10, which could have triggered the bloom. Although Limnospira is one of the most productive phytoplankton species throughout tropical and sub-tropical Africa [71], its blooming in European freshwater was found to occur sporadically, but without exception under certain specific conditions [72]. For example, unispecies bloom with an extremely high abundance of L. fusiformis was found in salty puddles in Serbia (Danube Basin) under conditions of high nutrient concentrations (particularly nitrates), higher salinity, and high pH due to the incoming wastewaters from the surrounding agricultural fields [73]. The importance of highly alkaline habitats for the development of group S2 species was emphasized by Reynolds et al. [17] who defined highly alkaline waters as a habitat template for group S2 species.

4.2. Influence of Flooding

In floodplain ecology, the postulate is that the flood pulse is a basic ecological factor that affects both the environment and biota [74], whereas the intensity of impact depends on the timing, duration, and magnitude of flooding [10,75]. According to the given results, the impact of flooding on the phytoplankton can be followed through changes in the total phytoplankton biomass, as well as through changes in dominant functional groups.
With the incoming floodwaters, significant changes in lake environmental characteristics occurred—water depth increased, as did water mixing, which supported the resuspension of organic matter and a decrease in transparency. These are unfavorable conditions for the survival and development of many phytoplankton species, therefore a decrease in the total phytoplankton biomass was registered under flood conditions, for example, a major flood in August 1972 caused a decrease in the total phytoplankton biomass from 350 mg L−1 to less than 50 mg L−1. Particularly significant was the occurrence of extreme flooding in spring 2012, which was a stressor high enough for the transition of the investigated lake from a turbid state characterized by high phytoplankton biomass and cyanobacterial bloom, in which it found itself the previous summer, to a clear state with very low phytoplankton biomass. The alternate regime shift is a cyclic phenomenon in this lake [22], and it is known that such an episode can have a significant impact on the structure and function of the entire river–floodplain ecosystem [76].
Flooding and mixed waters were favorable for the development of diatoms and diatom-dominated FGs, particularly groups B, C, D, and P. Their dominance and abundance are influenced by the in-lake factors as well as by the intensity and duration of flooding and, to a certain extent, by their direct input in floodwaters. Thus, group P was best represented in August 1972, during the intense flooding of the lake. The dependence of species from group P on physical mixing is strongly apparent, requiring a continuous or semi-continuous mixed layer 2–3 m in thickness [17], which is ensured under conditions when a large amount of floodwater flows into the lake. In addition to that, the eutrophic-hypertrophic condition was favorable for Aulacoseira granulata, the dominant species in group P, recognized as a common diatom in eutrophic lakes [77] and as one of the few diatom species that produce blooms in hypereutrophic freshwater environments [78].
The flood pulse can act synergistically with other drivers of change to promote a profound ecological state change [10], as evidenced by the appearance of the monotypic bloom of Aulacoseira italica from group B and the extremely heavy bloom of species from group D (Stephanodiscus hantzschi and S. dubius) that occurred in July 1972 and June 1973, respectively. This can be largely associated with the direct input of these assemblages from Danubian waters since at that time, the phytoplankton in the middle Danube was dominated by large and medium-sized centrics, Stephanodiscus spp. in the first place, well abundant as a consequence of high nutrient loading [67,78]. It is known that in frequently flooded floodplains, diatom assemblages are influenced by the river floodwaters that bring them to the floodplain habitats [79]. In addition to that, the rapid formation of bloom can be promoted by the physiological characteristics of some species from groups B and D that can form resting cells [69], like many species of Stephanodiscus and Aulacoseira. These meroplanktonic species form a vegetative resting cell in superficial lake sediments and spend a part of their life in hypolimnion or the littoral zone and can be found in the plankton during periods when the water column undergoes turbulent mixing [70]. Finally, it is widely accepted that a high abundance of S. hantzschii can be considered indicative of high nutrient levels and eutrophic conditions in both rivers and lakes [80]. Therefore, it can be assumed that the enrichment of the lake water with nutrients from the inflow of wastewater certainly supported the mass development of centric diatoms from groups B and D [17].
A lower amount of nutrients and increased pH values in the lake water, as noted in November 2011, were favorable conditions for the development of group C species. Stephanocyclus meneghinianum, as the dominant species in group C, is known as an alkalophilic species, clearly favored by high (between 9 and 12) pH values [81], and an indicator species in highly productive alkaline saline lakes [82]. Furthermore, S. meneghinianum is a typical co-dominant species in the Danube phytoplankton under conditions of high water discharge [83] and its input with floodwaters into the lake can be assumed. The dominance of species from group C can indicate an improvement in the ecological condition and lake revitalization.
Flooding dynamics are a disturbing factor affecting the appearance and persistence of cyanobacterial blooms, which frequently occur in this lake and characterize the turbid conditions [22], as seen in 2011. Due to the frequent and long-lasting floods in late spring and early summer, the short-lasting cyanobacterial bloom developed and peaked no earlier than September 2011, with a dominance of group S1 and co-dominance of group H1. Species belonging to these groups are frequently in competition [84], where the low nitrogen H1 group was particularly sensitive to stress caused by flooding, while non-N2-fixing species (S1) showed tolerance to short-term flooding [22]. Thus, in highly turbulent environments as was the case in the summer of 2011, species in the H1 group were less successful in forming long-lasting blooms. With the inflow of floodwaters into the lake in October, the cyanobacterial biomass decreased to a third of its previous value, indicating flood disturbance.

5. Conclusions

A comparison of historical and current phytoplankton dynamics using functional assemblages demonstrated that different pressures on the lake environment can be tracked, depending on their expression strength. The frequent occurrence of heavy blooms of a single species or assemblage, which is characteristic of hypertrophic and polluted lakes, reflects the most significant aspects of phytoplankton dynamics in the past when the lake was under strong anthropogenic pressure due to agricultural wastewater inflow. Recent data suggest that, with the cessation of direct pollution, near-natural hydrological conditions with flooding as a fundamental environmental driving factor support algal assemblages characteristic of naturally eutrophic floodplain lakes.
Altogether, reconstructing the past conditions of a floodplain lake can provide important information needed to identify the drivers and rates of its change, which is especially important when there is no data available for determining the pristine condition. Assessing multiple pressures on floodplain lakes and disentangling their specific impacts on ecological status are crucial for defining protection and sustainable management measures for these particularly sensitive and endangered freshwater systems.

Author Contributions

Conceptualization, M.M.; Methodology, M.M. and K.K.; Validation, M.M. and K.K.; Formal Analysis, K.K.; Investigation, M.M. and K.K.; Data Curation, M.M.; Writing—Original Draft Preparation, M.M.; Writing—Review and Editing, M.M. and K.K.; Visualization, K.K.; Funding Acquisition, M.M. All authors have read and agreed to the published version of the manuscript.

Funding

This research was funded by the Josip Juraj Strossmayer University of Osijek, Department of Biology (Institutional project No. 3105-1).

Data Availability Statement

Raw data that support the outcomes of this study are available from the corresponding authors upon reasonable request.

Acknowledgments

We would like to express our sincerest appreciation to the family of Dragica Gucunski for encouraging us to process the historical data. KK wishes to extend her gratitude to Judit Padisák for her expert guidance and to Géza Szelmeczy for his support during KK’s Erasmus student training. Special thanks are extended to Dubravka Špoljarić Maronić and Tanja Žuna Pfeiffer for their assistance with phytoplankton determination, and to Filip Stević for his help with the sampling process. We thank the two anonymous reviewers for their constructive feedback on the original submission.

Conflicts of Interest

The authors declare no conflicts of interest.

References

  1. Grizzetti, B.; Pistocchi, A.; Liquete, C.; Udias, A.; Bouraoui, F.; van de Bund, W. Human Pressures and Ecological Status of European Rivers. Sci. Rep. 2017, 7, 205. [Google Scholar] [CrossRef]
  2. Wang, L.; Cao, Y.; Infante, D.M. Disentangling Effects of Natural Factors and Human Disturbances on Aquatic Systems—Needs and Approaches. Water 2023, 15, 1387. [Google Scholar] [CrossRef]
  3. European Commission (European Commission, Brussels, Belgium). Directive 2000/60/EC of the European Parliament and of the Council establishing a framework for Community action in the field of water policy (Water Framework Directive). Off. J. Eur. Union 2000, L327/1. [Google Scholar]
  4. Heiskanen, A.; Gromisz, S.; Jaanus, P.; Kauppila, P.; Purina, I.; Sagert, S.; Wasmund, N. Developing Reference Conditions for Phytoplankton in the Baltic Coastal Waters. In Part I: Applicability of Historical and Long-Term Datasets for Reconstruction of Past Phytoplankton Conditions; Technical Report, EUR 21582/EN/1; Joint Research Centre (JRC): Brussels, Belgium, 2005. [Google Scholar]
  5. Frau, D.; Medrano, J.; Calvi, C.; Giorgi, A. Water Quality Assessment of a Neotropical Pampean Lowland Stream Using a Phytoplankton Functional Trait Approach. Environ. Monit. Assess. 2019, 191, 681. [Google Scholar] [CrossRef]
  6. Poikane, S.; Birk, S.; Böhmer, J.; Carvalho, L.; de Hoyos, C.; Gassner, H.; Hellsten, S.; Kelly, M.; Lyche Solheim, A.; Olin, M.; et al. A Hitchhiker’s Guide to European Lake Ecological Assessment and Intercalibration. Ecol. Indic. 2015, 52, 533–544. [Google Scholar] [CrossRef]
  7. Järvinen, M.; Drakare, S.; Free, G.; Lyche-Solheim, A.; Phillips, G.; Skjelbred, B.; Mischke, U.; Ott, I.; Poikane, S.; Søndergaard, M.; et al. Phytoplankton Indicator Taxa for Reference Conditions in Northern and Central European Lowland Lakes. Hydrobiologia 2013, 704, 97–113. [Google Scholar] [CrossRef]
  8. Thoms, M.C.; Ogden, R.W.; Reid, M.A. Establishing the Condition of Lowland Floodplain Rivers: A Palaeo-Ecological Approach. Freshw. Biol. 1999, 41, 407–423. [Google Scholar] [CrossRef]
  9. Globevnik, L.; Januschke, K.; Kail, J.; Snoj, L.; Manfrin, A.; Azlak, M.; Christiansen, T.; Birk, S. Preliminary Assessment of River Floodplain Condition in Europe; ETC/ICM Technical Report 5/2020; European Topic Centre on Inland, Coastal and Marine Waters: Magdeburg, Germany, 2020; pp. 1–121. [Google Scholar]
  10. Correa, S.B.; van der Sleen, P.; Siddiqui, S.F.; Bogotá-Gregory, J.D.; Arantes, C.C.; Barnett, A.A.; Couto, T.B.A.; Goulding, M.; Anderson, E.P. Biotic Indicators for Ecological State Change in Amazonian Floodplains. Bioscience 2022, 72, 753–768. [Google Scholar] [CrossRef]
  11. Amoros, C.; Bornette, G. Connectivity and Biocomplexity in Waterbodies of Riverine Floodplains. Freshw. Biol. 2002, 47, 761–776. [Google Scholar] [CrossRef]
  12. Maaß, A.-L.; Schüttrumpf, H.; Lehmkuhl, F. Human Impact on Fluvial Systems in Europe with Special Regard to Today’s River Restorations. Environ. Sci. Eur. 2021, 33, 119. [Google Scholar] [CrossRef]
  13. European Environment Agency. Floodplains: A Natural System to Preserve and Restore; European Environment Agency: Copenhagen, Denmark, 2020; ISBN 9789294802118.
  14. Fischer, C.; Damm, C.; Foeckler, F.; Gelhaus, M.; Gerstner, L.; Harris, R.M.B.; Hoffmann, T.G.; Iwanowski, J.; Kasperidus, H.; Mehl, D.; et al. The “Habitat Provision” Index for Assessing Floodplain Biodiversity and Restoration Potential as an Ecosystem Service—Method and Application. Front. Ecol. Evol. 2019, 7, 483. [Google Scholar] [CrossRef]
  15. Birk, S.; Bonne, W.; Borja, A.; Brucet, S.; Courrat, A.; Poikane, S.; Solimini, A.; Van De Bund, W.; Zampoukas, N.; Hering, D. Three Hundred Ways to Assess Europe’s Surface Waters: An Almost Complete Overview of Biological Methods to Implement the Water Framework Directive. Ecol. Indic. 2012, 18, 31–41. [Google Scholar] [CrossRef]
  16. Bund, W.V.D.; Solimini, A.G. Ecological Quality Ratios for Ecological Quality Assessment in Inland and Marine Waters; European Commission Joint Research Centre: Ispra, Italy, 2006; pp. 1–22. [Google Scholar]
  17. Reynolds, C.S.; Huszar, V.; Kruk, C.; Naselli-Flores, L.; Melo, S. Towards a Functional Classification of the Freshwater Phytoplankton. J. Plankton Res. 2002, 24, 417–428. [Google Scholar] [CrossRef]
  18. Padisák, J.; Crossetti, L.O.; Naselli-Flores, L. Use and Misuse in the Application of the Phytoplankton Functional Classification: A Critical Review with Updates. Hydrobiologia 2009, 621, 1–19. [Google Scholar] [CrossRef]
  19. Loverde-Oliveira, S.M.; Huszar, V.L.M. Phytoplankton Functional Groups Driven by Alternative States in a Tropical Floodplain Lake (Pantanal, Brazil). Oecologia Aust. 2019, 23, 926–939. [Google Scholar] [CrossRef]
  20. Machado, K.B.; Teresa, F.B.; Vieira, L.C.G.; Huszar, V.L.d.M.; Nabout, J.C. Comparing the Effects of Landscape and Local Environmental Variables on Taxonomic and Functional Composition of Phytoplankton Communities. J. Plankton Res. 2016, 38, 1334–1346. [Google Scholar] [CrossRef]
  21. Kraus, C.N.; Bonnet, M.-P.; Miranda, C.A.; de Souza Nogueira, I.; Garnier, J.; Vieira, L.C.G. Interannual Hydrological Variations and Ecological Phytoplankton Patterns in Amazonian Floodplain Lakes. Hydrobiologia 2019, 830, 135–149. [Google Scholar] [CrossRef]
  22. Stević, F.; Mihaljević, M.; Špoljarić, D. Changes of Phytoplankton Functional Groups in a Floodplain Lake Associated with Hydrological Perturbations. Hydrobiologia 2013, 709, 143–158. [Google Scholar] [CrossRef]
  23. Yan, G.; Yin, X.; Huang, M.; Wang, X.; Huang, D.; Li, D. Dynamics of Phytoplankton Functional Groups in River-Connected Lakes and the Major Influencing Factors: A Case Study of Dongting Lake, China. Ecol. Indic. 2023, 149, 110177. [Google Scholar] [CrossRef]
  24. Padisák, J.; Borics, G.; Grigorszky, I.; Soróczki-Pintér, É. Use of Phytoplankton Assemblages for Monitoring Ecological Status of Lakes within the Water Framework Directive: The Assemblage Index. Hydrobiologia 2006, 553, 1–14. [Google Scholar] [CrossRef]
  25. Belkinova, D.; PadisáK, J.; Gecheva, G.; Cheshmedjiev, S. Phytoplankton Based Assessment of Ecological Status of Bulgarian Lakes and Comparison of Metrics within the Water Framework Directive. Appl. Ecol. Environ. Res. 2014, 12, 83–103. [Google Scholar] [CrossRef]
  26. Poniewozik, M.; Lenard, T. Phytoplankton Composition and Ecological Status of Lakes with Cyanobacteria Dominance. Int. J. Environ. Res. Public Health 2022, 19, 3832. [Google Scholar] [CrossRef] [PubMed]
  27. Demir, A.N.; Fakioǧlu, Ö.; Dural, B. Phytoplankton Functional Groups Provide a Quality Assessment Method by the Q Assemblage Index in Lake Mogan (Turkey). Turk. J. Bot. 2014, 38, 169–179. [Google Scholar] [CrossRef]
  28. Ongun Sevindik, T.; Tunca, H.; Gönülol, A.; Yildirim Gürsoy, N.; Küçükkaya, Ş.N.; Durgut Kinali, Z. Phytoplankton Dynamics and Structure, and Ecological Status Estimation by the q Assemblage Index: A Comparative Analysis in Two Shallow Mediterranean Lakes. Turk. J. Bot. 2017, 41, 25–36. [Google Scholar] [CrossRef]
  29. Çelekli, A.; Öztürk, B. Determination of Ecological Status and Ecological Preferences of Phytoplankton Using Multivariate Approach in a Mediterranean Reservoir. Hydrobiologia 2014, 740, 115–135. [Google Scholar] [CrossRef]
  30. Vieira, P.C.S.; Cardoso, M.M.L.; da Costa, I.A.S. Vertical and Temporal Dynamics of Phytoplanktonic Associations and the Application of Index Assembly in Tropical Semi-Arid Eutrophic Reservoir, Northeastern Brazil. Acta Limnol. Bras. 2015, 27, 130–144. [Google Scholar] [CrossRef]
  31. Silva, A.P.C.; da Costa, I.A.S. Biomonitoramento Do Estado Ecológico de Dois Reservatórios Do Semiárido Brasileiro Utilizando Assembleias Fitoplanctônicas (Índice Q). Acta Limnol. Bras. 2015, 27, 1–14. [Google Scholar] [CrossRef]
  32. Becker, V.; Huszar, V.L.M.; Crossetti, L.O. Responses of Phytoplankton Functional Groups to the Mixing Regime in a Deep Subtropical Reservoir. Hydrobiologia 2009, 628, 137–151. [Google Scholar] [CrossRef]
  33. Hajnal, É.; Padisák, J. Analysis of Long-Term Ecological Status of Lake Balaton Based on the ALMOBAL Phytoplankton Database. Hydrobiologia 2008, 599, 227–237. [Google Scholar] [CrossRef]
  34. Wang, L.; Cai, Q.; Tan, L.; Kong, L. Phytoplankton Development and Ecological Status during a Cyanobacterial Bloom in a Tributary Bay of the Three Gorges Reservoir, China. Sci. Total Environ. 2011, 409, 3820–3828. [Google Scholar] [CrossRef]
  35. Frau, D.; Mayora, G.; Devercelli, M. Phytoplankton-Based Water Quality Metrics: Feasibility of Their Use in a Neotropical Shallow Lake. Mar. Freshw. Res. 2018, 69, 1746–1754. [Google Scholar] [CrossRef]
  36. Abonyi, A.; Leitão, M.; Lançon, A.M.; Padisák, J. Phytoplankton Functional Groups as Indicators of Human Impacts along the River Loire (France). Hydrobiologia 2012, 698, 233–249. [Google Scholar] [CrossRef]
  37. Gucunski, D. Kvantitativna Istraživanja Fitoplanktona u Upravljanom Prirodnom Rezervatu Kopački Rit. Ph.D. Thesis, University of Zagreb, Zagreb, Croatia, 1975. [Google Scholar]
  38. Tadić, L.; Bonacci, O.; Dadić, T. Dynamics of the Kopački Rit (Croatia) Wetland Floodplain Water Regime. Environ. Earth Sci. 2014, 71, 3559–3570. [Google Scholar] [CrossRef]
  39. Mihaljević, M.; Getz, D.; Tadić, Z.; Živanović, B.; Gucunski, D.; Topić, J.; Kalinović, I.; Mikuska, J. Kopački Rit—Pregled Istraživanja i Bibliografija; Hrvatska Akademija Znanosti i Umjetnosti (HAZU): Zagreb, Croatia, 1999. [Google Scholar]
  40. Schwarz, U. Landschaftsökologische Charakterisierung des Kopački Rit unter Besonderer Berücksichtigung von Flusslandschaftsformen Sowie Deren Genese und Typologie. Ph.D. Thesis, University of Wien, Wien, Austria, 2005. [Google Scholar]
  41. Tadić, L.; Tamás, E.A.; Mihaljević, M.; Janjić, J. Potential Climate Impacts of Hydrological Alterations and Discharge Variabilities of the Mura, Drava, and Danube Rivers on the Natural Resources of the MDD UNESCO Biosphere Reserve. Climate 2022, 10, 139. [Google Scholar] [CrossRef]
  42. OECD. Eutrophication of Waters. Monitoring, Assessment and Control; Organisation for Economic Cooperation and Development: Paris, France, 1982; p. 154. [Google Scholar]
  43. Mihaljević, M.; Špoljarić, D.; Stević, F.; Cvijanović, V.; Hackenberger Kutuzović, B. The Influence of Extreme Floods from the River Danube in 2006 on Phytoplankton Communities in a Floodplain Lake: Shift to a Clear State. Limnologica 2010, 40, 260–268. [Google Scholar] [CrossRef]
  44. Horvatić, J.; Mihaljević, M.; Stević, F. Algal Growth Potential of Chlorella Kessleri FOTT et NOV. in Comparison with in Situ Microphytoplankton Dynamics in the Water of Lake Sakadaš Marshes. Period. Biol. 2003, 105, 307–312. [Google Scholar]
  45. Stević, F.; Mihaljević, M.; Horvatić, J. Interactions between Microphytoplankton of the Danube, Its Sidearms and Wetlands (1426–1388 r. Km, Croatia). Period. Biol. 2005, 107, 299–304. [Google Scholar]
  46. Mihaljević, M.; Stević, F. Cyanobacterial Blooms in a Temperate River-Floodplain Ecosystem: The Importance of Hydrological Extremes. Aquat. Ecol. 2011, 45, 335–349. [Google Scholar] [CrossRef]
  47. APHA (American Public Health Association). Standard Methods for the Examination of Water and Wastewater; American Public Health Association: Washington, DC, USA, 1992. [Google Scholar]
  48. Hustedt, F. Bacillariophyta; Otto Koeltz Science Publishers: Koenigstein, Germany, 1976. [Google Scholar]
  49. Hindák, F.; Cyrus, Z.; Marvan, P.; Javornicky, P.; Komarek, J.; Etll, H.; Rosa, K.; Sladečkova, A.; Popovsky, J.; Punčocharova, M.; et al. Slatkovodne Riasy. Hindák, F., Ed.; Slovenske Pedagogicke Nakladelstvo: Bratislava, Slovakia, 1978. [Google Scholar]
  50. Meffert, M.E.; Oberhäuser, R.; Overbeck, J. Morphology and Taxonomy of Oscillatoria redekei (Cyanophyta). Br. Phycol. J. 1981, 16, 107–114. [Google Scholar] [CrossRef]
  51. Anagnostidis, K.; Komárek, J. Modern approach to the classification system of cyanophytes. 1. Introduction. Arch. Für Hydrobiol. Suppl. 1985, 71, 291–302. [Google Scholar]
  52. Anagnostidis, K.; Komárek, J. Modern approach to the classification system of cyanophytes. 3. Oscillatoriales. Arch. Für Hydrobiol. Suppl. 1988, 80, 327–472. [Google Scholar]
  53. Komárek, J.; Anagnostidis, K. Modern approach to the classification system of cyanophytes. 4. Nostocales. Algol. Stud. 1989, 56, 247–345. [Google Scholar]
  54. Guiry, M.D.; Guiry, G.M. AlgaeBase; World-Wide Electronic Publication; National University of Ireland: Galway, Ireland, 2024; Available online: http://www.algaebase.org (accessed on 1 June 2024).
  55. Utermöhl, H. Zur Vervollkommnung der quantitativen Phytoplankton-Methodik. Int. Ver. Theor. Angew. Limnol. 1958, 9, 1–38. [Google Scholar] [CrossRef]
  56. Javornický, P.; Komárková, J. The changes in several parameters of plankton primary productivity in Slapy Reservoir 1960–1967, their mutual correlations and correlations with the main ecological factors. Hydrobiol. Stud. 1973, 2, 155–211. [Google Scholar]
  57. Sournia, A. Phytoplankton Manual; UNESCO: Paris, Italy, 1978; pp. 1–337. [Google Scholar]
  58. Gucunski, D.; Popović, Ž. Podaci Za Kvantitativnu Analizu Fitoplanktona Rezervata “Kopački Rit”. Anal. Zavoda Jugoslav. Akad. 1984, 2, 277–298. [Google Scholar]
  59. RStudio Team. RStudio: Integrated Development for R; RStudio PBC: Boston, MA, USA, 2020; Available online: http://www.rstudio.com/ (accessed on 1 July 2023).
  60. R Core Team R: A Language and Environment for Statistical Computing; R Foundation for Statistical Computing: Vienna, Austria, 2020; Available online: https://www.r-project.org/ (accessed on 1 June 2024).
  61. Oksanen, J.; Blanchet, F.G.; Friendly, M.; Kindt, R.; Legendre, P.; Mcglinn, D.; Minchin, P.R.; Hara, R.B.O.; Simpson, G.L.; Solymos, P.; et al. Vegan: Community Ecology Package; R Package Version 2.5-7; 2020; Available online: https://cran.r-project.org/web/packages/vegan/index.html (accessed on 1 June 2024).
  62. Wickham, H.; François, R.; Henry, L.; Müller, K.; Vaughan, D. Dplyr: A Grammar of Data Manipulation. Available online: https://dplyr.tidyverse.org/authors.html (accessed on 1 June 2024).
  63. Wickham, H. Ggplot2: Elegant Graphics for Data Analysis; Springer: New York, USA, 2016; Volume 35, ISBN 9780387981406. [Google Scholar]
  64. Bijay-Singh; Craswell, E. Fertilizers and Nitrate Pollution of Surface and Ground Water: An Increasingly Pervasive Global Problem. SN Appl. Sci. 2021, 3, 518. [Google Scholar] [CrossRef]
  65. Bogard, M.J.; Vogt, R.J.; Hayes, N.M.; Leavitt, P.R. Unabated Nitrogen Pollution Favors Growth of Toxic Cyanobacteria over Chlorophytes in Most Hypereutrophic Lakes. Environ. Sci. Technol. 2020, 54, 3219–3227. [Google Scholar] [CrossRef]
  66. Donald, D.B.; Bogard, M.J.; Finlay, K.; Bunting, L.; Leavitt, P.R. Phytoplankton-Specific Response to Enrichment of Phosphorus-Rich Surface Waters with Ammonium, Nitrate, and Urea. PLoS ONE 2013, 8, e53277. [Google Scholar] [CrossRef]
  67. Munawar, M.; Zafar, A.R. A Preliminary Study of Vertical Movement of Eudorina Elegans and Trinema Lineare during a Bloom Caused by Them. Hydrobiologia 1967, 29, 140–148. [Google Scholar] [CrossRef]
  68. Millie, D.F.; Fahnenstiel, G.L.; Bressie, J.D.; Pigg, R.J.; Rediske, R.R.; Klarer, D.M.; Tester, P.A.; Litaker, W.R. Late-Summer Phytoplankton in Western Lake Erie (Laurentian Great Lakes): Bloom Distributions, Toxicity, and Environmental Influences. Aquat. Ecol. 2009, 43, 915–934. [Google Scholar] [CrossRef]
  69. Kiss, I. Investigation of the Water Blooms of Eudorina Elegans in the Dead-Arm of the River Tisza at the Community Mártély. Tiscia 1977, 12, 37–47. [Google Scholar]
  70. Padisák, J.; Naselli-Flores, L. Phytoplankton in Extreme Environments: Importance and Consequences of Habitat Permanency. Hydrobiologia 2021, 848, 157–176. [Google Scholar] [CrossRef]
  71. El-Bestawy, E.; Bellinger, E.G.; Sigee, D.C. Elemental Composition of Phytoplankton in a Subtropical Lake: X-ray Microanalytical Studies on the Dominant Algae Spirulina Platensis (Cyanophyta) and Cyclotella Meneghiniana (Bacillariophyceae). Eur. J. Phycol. 1996, 31, 157–166. [Google Scholar] [CrossRef]
  72. Sili, C.; Torzillo, G.; Vonshak, A. Arthrospira (Spirulina). In Ecology of Cyanobacteria II: Their Diversity in Space and Time; Whitton, B.A., Ed.; Springer: Dordrecht, The Netherlands, 2012; Volume 9789400738, pp. 677–705. [Google Scholar]
  73. Fužinato, S.; Fodora, A.; Subakov-Simić, G. Arthrospira Fusiformis (Voronichin) Komarek et Lund (Cyanoprokaryota) A New Species for Europe. Arch. Hydrobiol. Suppl. Algol. Stud. 2010, 134, 17–24. [Google Scholar] [CrossRef]
  74. Tockner, K.; Malard, F.; Ward, J.V. An Extension of the Flood Pulse Concept. Hydrol. Process. 2000, 14, 2861–2883. [Google Scholar] [CrossRef]
  75. Mihaljević, M.; Stević, F.; Horvatić, J.; Hackenberger Kutuzović, B. Dual Impact of the Flood Pulses on the Phytoplankton Assemblages in a Danubian Floodplain Lake (Kopački Rit Nature Park, Croatia). Hydrobiologia 2009, 618, 77–88. [Google Scholar] [CrossRef]
  76. Bouska, K.L.; Houser, J.N.; De Jager, N.R.; Drake, D.C.; Collins, S.F.; Gibson-Reinemer, D.K.; Thomsen, M.A. Conceptualizing Alternate Regimes in a Large Floodplain-River Ecosystem: Water Clarity, Invasive Fish, and Floodplain Vegetation. J. Environ. Manag. 2020, 264, 110516. [Google Scholar] [CrossRef]
  77. Yang, Y.; Stenger-Kovács, C.; Padisák, J.; Pettersson, K. Effects of Winter Severity on Spring Phytoplankton Development in a Temperate Lake (Lake Erken, Sweden). Hydrobiologia 2016, 780, 47–57. [Google Scholar] [CrossRef]
  78. Vieira, A.A.H.; Ortolano, P.I.C.; Giroldo, D.; Oliveira, M.J.D.; Bittar, T.B.; Lombardi, A.T.; Sartori, A.L.; Paulsen, B.S. Role of Hydrophobic Extracellular Polysaccharide of Aulacoseira Granulata (Bacillariophyceae) on Aggregate Formation in a Turbulent and Hypereutrophic Reservoir. Limnol. Oceanogr. 2008, 53, 1887–1899. [Google Scholar] [CrossRef]
  79. Weilhoefer, C.L.; Pan, Y.; Eppard, S. The Effects of River Floodwaters on Floodplain Wetland Water Quality and Diatom Assemblages. Wetlands 2008, 28, 473–486. [Google Scholar] [CrossRef]
  80. Tolotti, M.; Boscaini, A.; Salmaso, N. Comparative Analysis of Phytoplankton Patterns in Two Modified Lakes with Contrasting Hydrological Features. Aquat. Sci. 2010, 72, 213–226. [Google Scholar] [CrossRef]
  81. Ma, C.; Chula Mwagona, P.; Yu, H.; Sun, X.; Liang, L.; Al-Ghanim, K.A.; Mahboob, S. Spatial and Temporal Variation of Phytoplankton Functional Groups in Extremely Alkaline Dali Nur Lake, North China. J. Freshw. Ecol. 2019, 34, 91–105. [Google Scholar] [CrossRef]
  82. Stenger-Kovács, C.; Lengyel, E.; Buczkó, K.; Tóth, F.M.; Crossetti, L.O.; Pellinger, A.; Doma, Z.Z.; Padisák, J. Vanishing World: Alkaline, Saline Lakes in Central Europe and Their Diatom Assemblages. Inland Waters 2014, 4, 383–396. [Google Scholar] [CrossRef]
  83. Mihaljević, M.; Stević, F.; Špoljarić-Maronić, D.; Žuna Pfeiffer, T. Application of Morpho-Functional Classifications in the Evaluation of Phytoplankton Changes in the Danube River. Acta Zool. Bulg. Suppl. 2014, 7, 153–158. [Google Scholar]
  84. Padisák, J.; Borics, G.; Fehér, G.; Grigorszky, I.; Oldal, I.; Schmidt, A.; Zámbóné-Doma, Z. Dominant Species, Functional Assemblages and Frequency of Equilibrium Phases in Late Summer Phytoplankton Assemblages in Hungarian Small Shallow Lakes. Hydrobiologia 2003, 502, 157–168. [Google Scholar] [CrossRef]
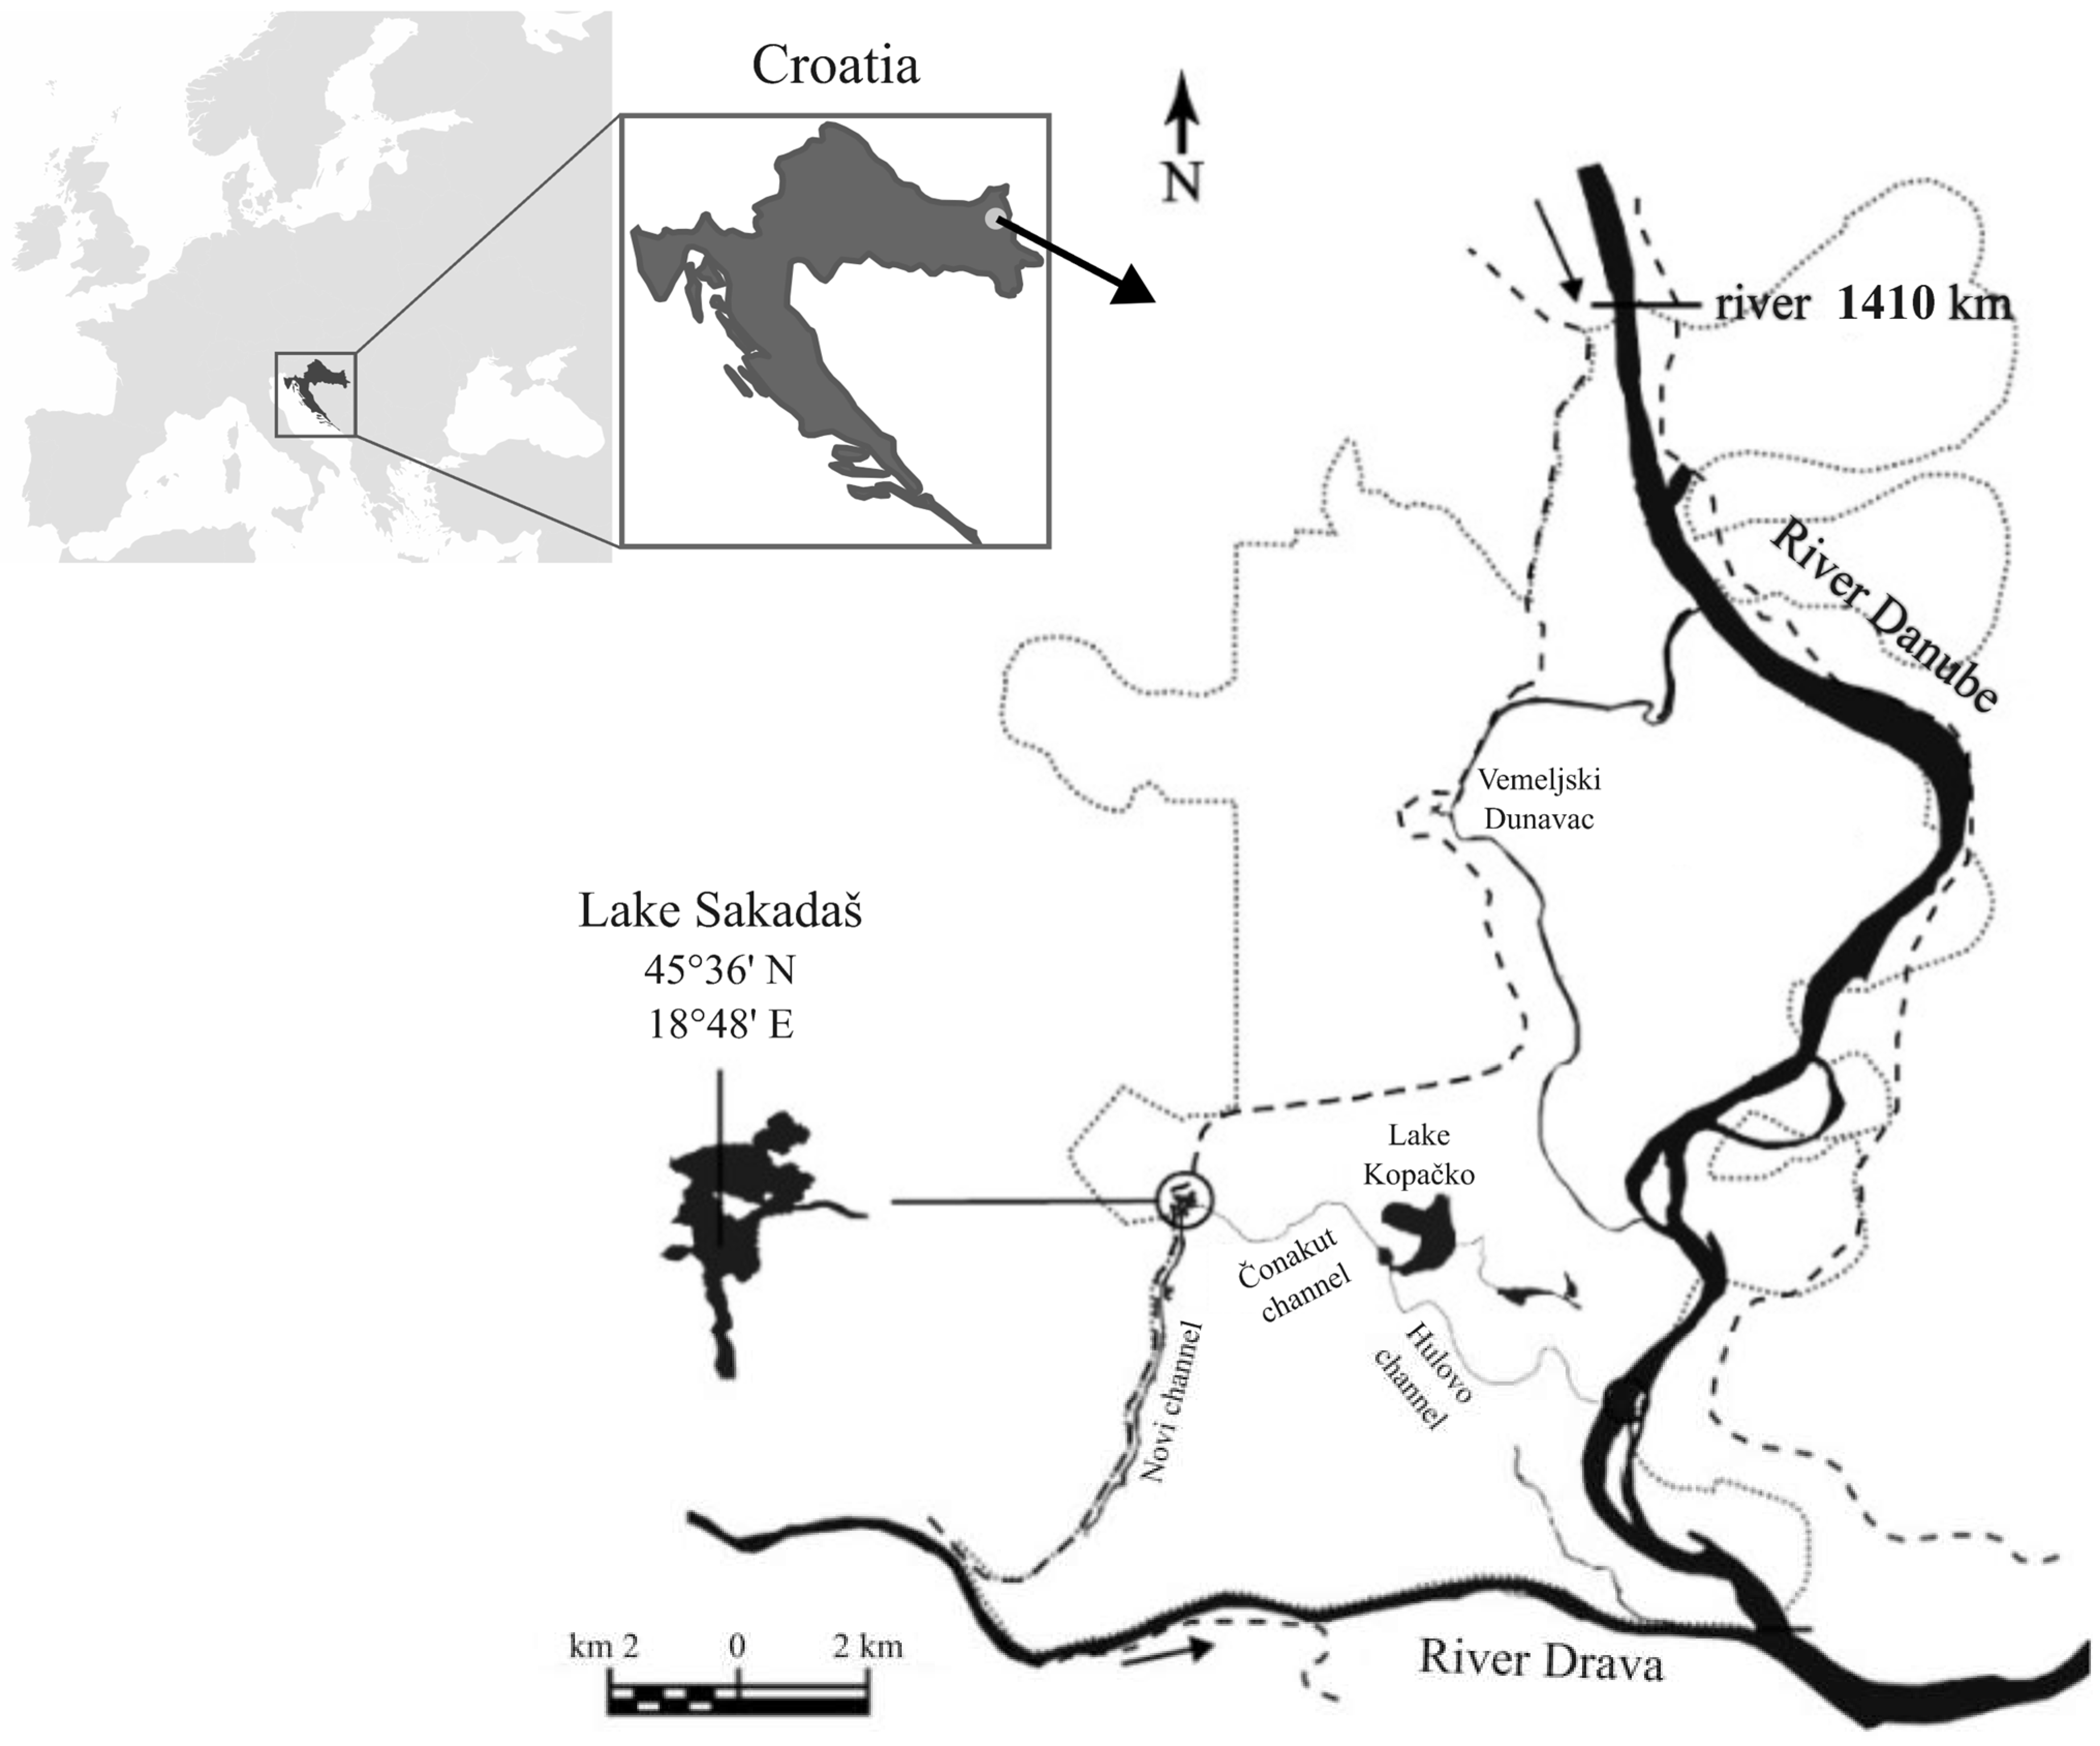
Figure 1. Study area: Danubian floodplain—Kopački Rit Nature Park (Croatia)—Lake Sakadaš. Modified from Mihaljević et al. [22].
Environments 11 00216 g001
Figure 2. Daily oscillations of the Danube water level at the gauge station at 1401.4 r. km. The black line represents the period from 1972–1973, while the violet dashed line represents the period from 2011–2012. Flooding of Lake Sakadaš begins when the Danube water level rises above 3 m (dashed line).
Environments 11 00216 g002
Figure 3. Temporal variations in physical and chemical parameters in the floodplain lake measured in both compared periods: water depth (a), water transparency (b), values of pH (c), and dissolved oxygen (d), during the periods July 1972–September 1973 (black line; data source Gucunski [37]) and July 2011–September 2012 (violet line).
Environments 11 00216 g003
Figure 4. Principal component analysis (PCA) of physical and chemical water parameters in the floodplain lake during the period 2011–2012.
Environments 11 00216 g004
Figure 5. Temporal variations in the total phytoplankton biomass during the periods July 1972–September 1973 (a), and July 2011–September 2012 (b).
Environments 11 00216 g005
Figure 6. Relative biomass of dominant FGs with contributions higher than 5% of the total biomass during the periods July 1972–September 1973 (a) and July 2011–September 2012 (b). FGs with a relative abundance of less than 5% were combined into the category labeled “Other”.
Environments 11 00216 g006
Figure 7. Principal coordinate analysis (PCoA) of phytoplankton community at the level of FGs biomass of the floodplain lake during the periods July 1972–September 1973 and July 2011–September 2012. The dots are color-coded based on the period. Dashed lines indicate the boundaries between groups.
Environments 11 00216 g007
Figure 8. Dynamics of the phytoplankton assemblage index (Q index) and ecological status of the floodplain lake during the periods July 1972–September 1973 (black line) and July 2011–September 2012 (violet line).
Environments 11 00216 g008
Table 1. Danube water level (maximum, minimum, and mean) and flooding dynamics of the river–floodplain system (categorization and duration) during the periods of July 1972–September 1973 and July 2011–September 2012. (*) The approximation of the flooded area according to Schwarz [40].
Danube Water Level 1972–19732011–2012
Maximum 5.844.91
Minimum 0.55−0.30
Mean 2.482.14
Flooded area (%) *Flooding duration (days/period)
3.0–3.5204642
3.5–4.0404334
4.0–5.0753817
>5.0>90270
Total >3 m 155100
>3 in continuum 8028
Table 2. Chemical parameters in the floodplain lake during the period July 2011–September 2012.
Parameter (µg L−1)MinMaxMean
Ammonium (NH4+)<5454127
Nitrates (NO3)203950710
Nitrites (NO2)583.625
Organic nitrogen (orgN)32353001701
Total nitrogen (TN)58856822524
Total phosphorus (TP)61422209
Table 3. List of phytoplankton functional groups and species in the floodplain lake. Species present only during one period are marked as follows 1972–1973 (*) and 2011–2012 (#).
Functional GroupsSpecies
AAcanthoceras zachariasii (Brun) Sim. (*), Cyclotella sp. (#)
BAulacoseira italica (Ehrenb.) Sim. (*), Lindavia comta (Kütz.) Nakov, Gullory, Julius, Theriot & Alverson (#)
CAsterionella formosa Hass. (*), Stephanocyclus meneghinianus (Kütz.) Kulikovskiy, Genkal & Kociolek (#)
DCyclostephanos dubius (Hust.) Round (*), Stephanodiscus hantzschii Grun., Ulnaria acus (Kütz.) Aboal (#), Ulnaria ulna (Nitz.) Comp.
EDinobryon divergens var. angulatum (Seligo) Brunnth. (*), Dinobryon divergens Imh. (#)
FOocystis marssonii Lemm. (*), Micractinium bornhemiense (W.Conrad) Korshikov (#)
GEudorina elegans Ehrenb. (*), Pleodorina illinoisensis Kofoid (*), Pandorina morum (O.F.Müller) Bory (*)
H1Dolichospermum planctonicum (Brunnth.) Wacklin, L.Hoff. & Kom. (*), Cuspidothrix issatschenkoi (Usachev) P.Rajaniemi, Kom., R.Willame, P.Hrouzek, K.Kastovská, L.Hoffm. & K.Sivonen (#), Dolichospermum sigmoideum (Nygaard) Wacklin, L.Hoffm. & Kom. (#), Aphanizomenon flos-aquae Ralfs ex Born. & Flah. (#), Dolichospermum solitarium (Kleb.) Wacklin, L.Hoffm. & Kom. (#)
H2Gloeotrichia sp. (*)
JPediastrum boryanum var. boryanum (Turp.) Menegh. (*), Tetradesmus lagerheimii M.J.Wynne & Guiry (#), Coelastrum microporum Nägeli (#)
KAphanothece elabens (Bréb. ex Menegh.) Elenkin
L0Peridinium cinctum (O.F.Müller) Ehrenb., Apocalathium aciculiferum (Lemm.) Craveiro, Daugbjerg, Moestrup & Calado (#)
MMicrocystis aeruginosa (Kütz.) Kütz., Microcystis wesenbergii (Kom.) Kom. ex Kom. (*)
MPBrachysira exilis (Kütz.) Round & D.G.Mann (*), Gyrosigma macrum (W.Smith) J.W.Griffith & Henfrey (*), Oscillatoria tenuis C.Agardh ex Gomont (*), Amphora ovalis (Kütz.) Kütz. (#)
NCosmarium sp. (*), Cosmarium phaseolus Bréb. ex Ralfs (#)
PAulacoseira granulata (Ehrenb.) Sim., Staurastrum sp. (*), Closterium macilentum Bréb. (*)
S1Limnothrix redekei (Goor) Meffert, Planktothrix agardhii (Gom.) Anag. & Kom. (#), Pseudanabaena limnetica (Lemm.) Kom. (#)
S2Limnospira sp. (*)
SNRaphidiopsis mediterranea Skuja (*), Raphidiopsis raciborskii (Wołoszyńska) Aguilera & al. (#)
TMougeotia spp. (*), Binuclearia lauterbornii (Schmidle) Proschkina-Lavrenko (#)
TBNavicula rhynchocephala Kütz. (*), Navicula sp. (#)
W1Lepocinclis ovum (Ehrenb.) Lemm., Euglena texta (Duj.) Hübner (#)
W2Strombomonas annulata (Daday) Deflandre (*), Trachelomonas volvocina (Ehrenb.) Ehrenb., Trachelomonas crenulatocollis Maskell (*)
WSSynura uvella Ehrenb.
X1Pseudodidymocystis planctonica (Korshikov) E.Hegewald & Deason
X2Chlamydomonas globosa J.W.Snow (*), Chlamydomonas sp. (#), Carteria sp. (#), Rhodomonas sp. (#), Rhodomonas lacustris Pasch. & Rutt. (#)
X3Chrysococcus rufescens Klebs (#)
YCryptomonas erosa Ehrenb., Cryptomonas ovate Ehrenb. (#), Cryptomonas sp. (#), Naiadinium polonicum (Wolosz.) S.Carty (*)
Disclaimer/Publisher’s Note: The statements, opinions and data contained in all publications are solely those of the individual author(s) and contributor(s) and not of MDPI and/or the editor(s). MDPI and/or the editor(s) disclaim responsibility for any injury to people or property resulting from any ideas, methods, instructions or products referred to in the content.