Article

Use of Geogrids and Recycled Rubber in Railroad Infrastructure for Enhanced Performance

1
Centre for Geomechanics and Railway Engineering (CGRE) and ARC Training Centre for Advanced Technologies in Rail Track Infrastructure (ITTC-Rail), University of Wollongong, Wollongong, NSW 2522, Australia
2
Australian Rail Track Corporation Ltd., Broadmeadow, NSW 2292, Australia
3
Global Synthetics Pty Ltd., Brisbane, QLD 4014, Australia
*
Author to whom correspondence should be addressed.
Geosciences 2019, 9(1), 30; https://doi.org/10.3390/geosciences9010030
Submission received: 21 November 2018 / Revised: 17 December 2018 / Accepted: 28 December 2018 / Published: 8 January 2019
(This article belongs to the Special Issue Advances in Computational Geomechanics)

Abstract

:
Railway tracks are conventionally built on compacted ballast and structural fill layers placed above the natural (subgrade) foundation. However, during train operations, track deteriorations occur progressively due to ballast degradation. The associated track deformation is usually accompanied by a reduction in both load bearing capacity and drainage, apart from imposing frequent track maintenance. Suitable ground improvement techniques involving plastic inclusions (e.g., geogrids) and energy absorbing materials (e.g., rubber products) to enhance the stability and longevity of tracks have become increasingly popular. This paper presents the outcomes from innovative research and development measures into the use of plastic and rubber elements in rail tracks undertaken at the University of Wollongong, Australia, over the past twenty years. The results obtained from laboratory tests, mathematical modelling and numerical modelling reveal that track performance can be improved significantly by using geogrid and energy absorbing rubber products (e.g., rubber crumbs, waste tire-cell and rubber mats). Test results show that the addition of rubber materials can efficiently improve the energy absorption of the structural layer and also reduce ballast breakage. Furthermore, by incorporating the work input parameters, the energy absorbing property of the newly developed synthetic capping layer is captured by correct modelling of dilatancy. In addition, the laboratory behavior of tire cells and geogrids has been validated by numerical modelling (i.e., Finite Element Modelling-FEM, Discrete Element—DEM), and a coupled DEM-FEM modelling approach is also introduced to simulate ballast deformation.

1. Introduction

Railways are one of the most popular and important modes for transporting freight and passengers worldwide, of which Australia is one of the countries who has the longest heavy haul trains from 3–5 km long with axle loads up to 40 tons [1]. These heavy haul ballasted tracks need upgrade because they are expected to withstand heavier track-induced stresses and higher speeds for enhanced productivity in agriculture and mining sectors. The ballast layer is performed as a load bearing platform installed beneath the sleepers and above the sub-ballast (capping) and subgrade layer. It usually consists of medium to coarse gravel sized aggregates and a limited percentage of cobble-size particles with free drainage properties [2,3].
During train operations the track progressively deteriorates due to: (i) the lateral spreading and settlement of ballast or sub-ballast layers because of inadequate confinement [2,4]; (ii) ballast deteriorations caused by breakage of sharp edges and angular corners, the intrusion of fine particles, and mud-pumping from the layers of soft soil lying below, all of which seriously compromise its particle angularity, shear strength and hydraulic conductivity [2,5,6,7]. Such track deterioration leads to costly and frequent maintenance, especially when the heavy haul tracks undergo heavier axle loads and higher speeds [8,9]; for example, in New South Wales, Australia alone the cost of track maintenance for ballast-related work is estimated to be around 14–15 million dollars per year [10]. In addition to the repeated loads exerted by moving wheels, rail structures are commonly subject to dynamic impact forces of high magnitude produced by rail irregularities (e.g., corrugations, imperfect welds, rail dips) as well as imperfections such as wheel flats. These impact forces can likewise be generated at transition zones involving abrupt variations of vertical track stiffness, such as at the approaches to tunnels, bridge or viaduct and level crossings, or where there is a sudden change from conventional ballast to slab track intensifying ballast breakage and adversely affecting track stability [11,12,13,14,15]. One potential method of enhancing the substructure capacity to withstand the large cyclic and impact loads induced by fast-moving heavy-haul trains is to improve the performance of the ballast layer using plastic (e.g., geogrids) and rubber inclusions (e.g., rubber mat, tire cell, and rubber crumbs) [2,11,12,13,14,15,16,17,18,19,20,21,22,23,24,25,26,27,28,29,30].
The high damping properties of rubber materials have made them a promising inclusion for rail track as to enhance the energy absorbing characteristics of rail tracks, as well as reduce noise, vibration, ballast degradation and impact damage to track components [11,12,13,14,15,16,17,18,19,20,21,22,23,24,25,26,27,28,29,30]. Since these rubber materials can be made from end-of-life tires, they are environmentally friendly and economically attractive, promoting optimism and exploration into the potential use of rubber materials in rail foundations. Several types of rubber inclusions are used in rail foundations: (i) rail pads (i.e., placed between the rail and sleeper interfaces), (ii) under sleeper pads (USP) installed at the interfaces of the sleeper and ballast, (iii) under ballast mats (UBM) placed beneath the ballast, (iv) rubber crumbs or shreds mixed with ballast, (v) tire cells installed in the capping layer, and (vi) a synthetic-energy-absorbing-layer (SEAL), i.e., a mixture of rubber crumbs and other waste materials [4,19,20,21,22,23,24,25,26]. It was found that the under ballast mats can reduce overall ballast degradation by around 25–45%, and reduce the vertical plastic strain by around 10–20% and the lateral strain of ballast by around 5–10% [20]. Indraratna et al. [4] indicate that tire cells installed in the capping layer that are infilled with crushed basalt can provide considerable lateral confinement and reduce vertical settlement by approximately 10–12 mm in comparison to an unconfined capping layer. Sol-Sanchez et al. [26] state that mixing 10% rubber crumbs (by volume) with ballast can reduce ballast degradation efficiently and help the ballast layer to dissipate more energy. Indraratna et al. [19] developed a synthetic energy absorbing capping layer by optimizing the mixtures of mining waste (i.e., steel furnace slag and coal wash) and rubber crumbs; the resulting optimal waste matrix has a higher energy absorbing capacity and permeability than traditional sub-ballast materials, as well as acceptable shear strength and deformation.
Geogrids have long been regarded as an effective method of stabilizing ballast because they provide reinforcement and additional confining pressure. The reinforcement effect of geogrids is generally due to the tensile strains generated in the geogrids as the geogrid and ballast particles interlock [31,32,33,34]; this is how geogrids provide vertical and lateral confinement to the ballast grains and thus reduce its deformation [32,35].
Although comprehensive laboratory investigations of plastic and rubber inclusions in rail tracks have been carried out, there are still a lot of challenges remaining of these studies, e.g., mathematic insight to rubber-blended mixtures. Laboratory investigations on geogrid-ballast interaction under impact loading conditions are also required to better understand the effectiveness of geogrids in rail tracks and to improve existing design guidelines. Moreover, numerical modelling of capping layers confined by tire cells, deformation and degradation behavior of ballast reinforced with geogrid, and cyclic densification of ballast and subsequent deformation upon loading is limited. Even fewer studies are found on the coupled DEM-FEM analysis. In this paper, the influence of adding rubber crumbs (RC) on the stress-strain behavior and energy absorption property of the waste matrix is described. A dilatancy model for these waste mixtures to capture the effect of RC and their energy absorbing properties is also developed. A large-scale drop-weight impact test device is used to investigate ballast behavior under impact loading and to analyze the role of geogrids and rubber mats in mitigating ballast damage under successive impacts. Moreover, FEM analysis of a capping layer confined by tire cells and a DEM simulation of ballast reinforced by geogrid are also described. At the end, a coupled DEM-FEM modelling approach is also introduced to examine the load and deformation behavior of ballast.

2. A Dilatancy Model for a Synthetic Energy Absorbing Layer (SEAL) for Sub-Ballast

2.1. Laboratory Study of the Waste Matrix

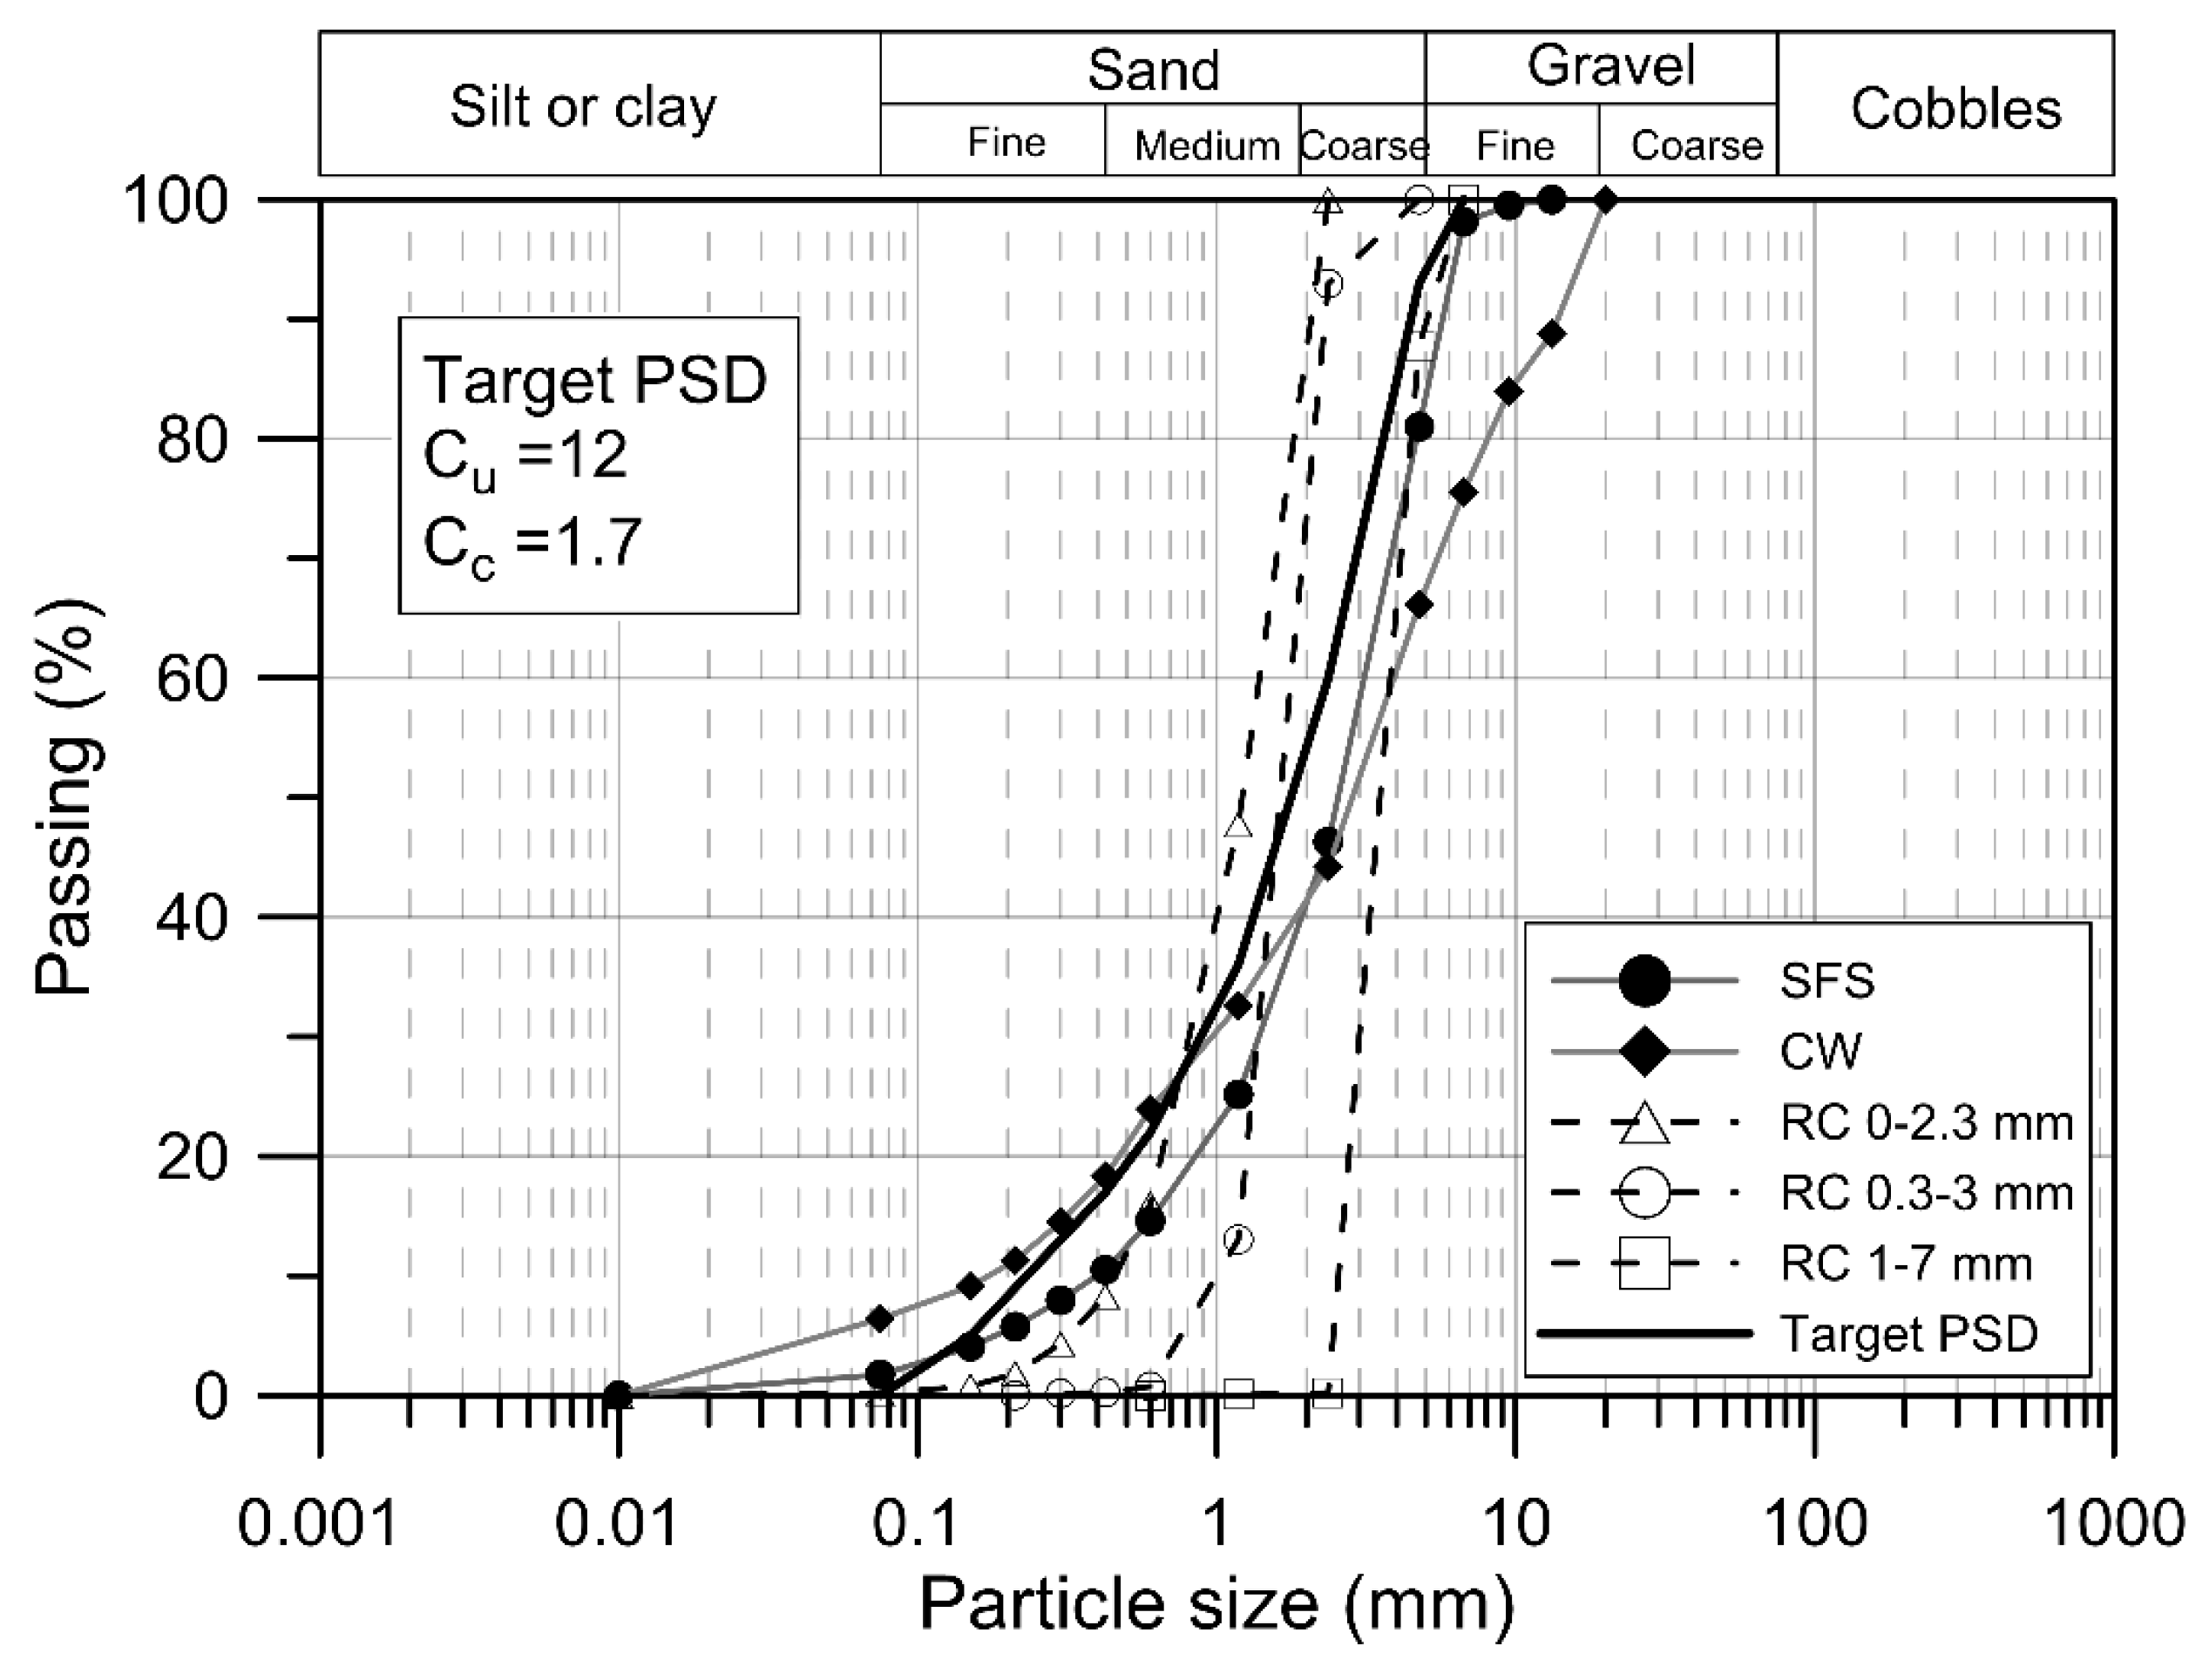
2.1.1. Materials and Test Program
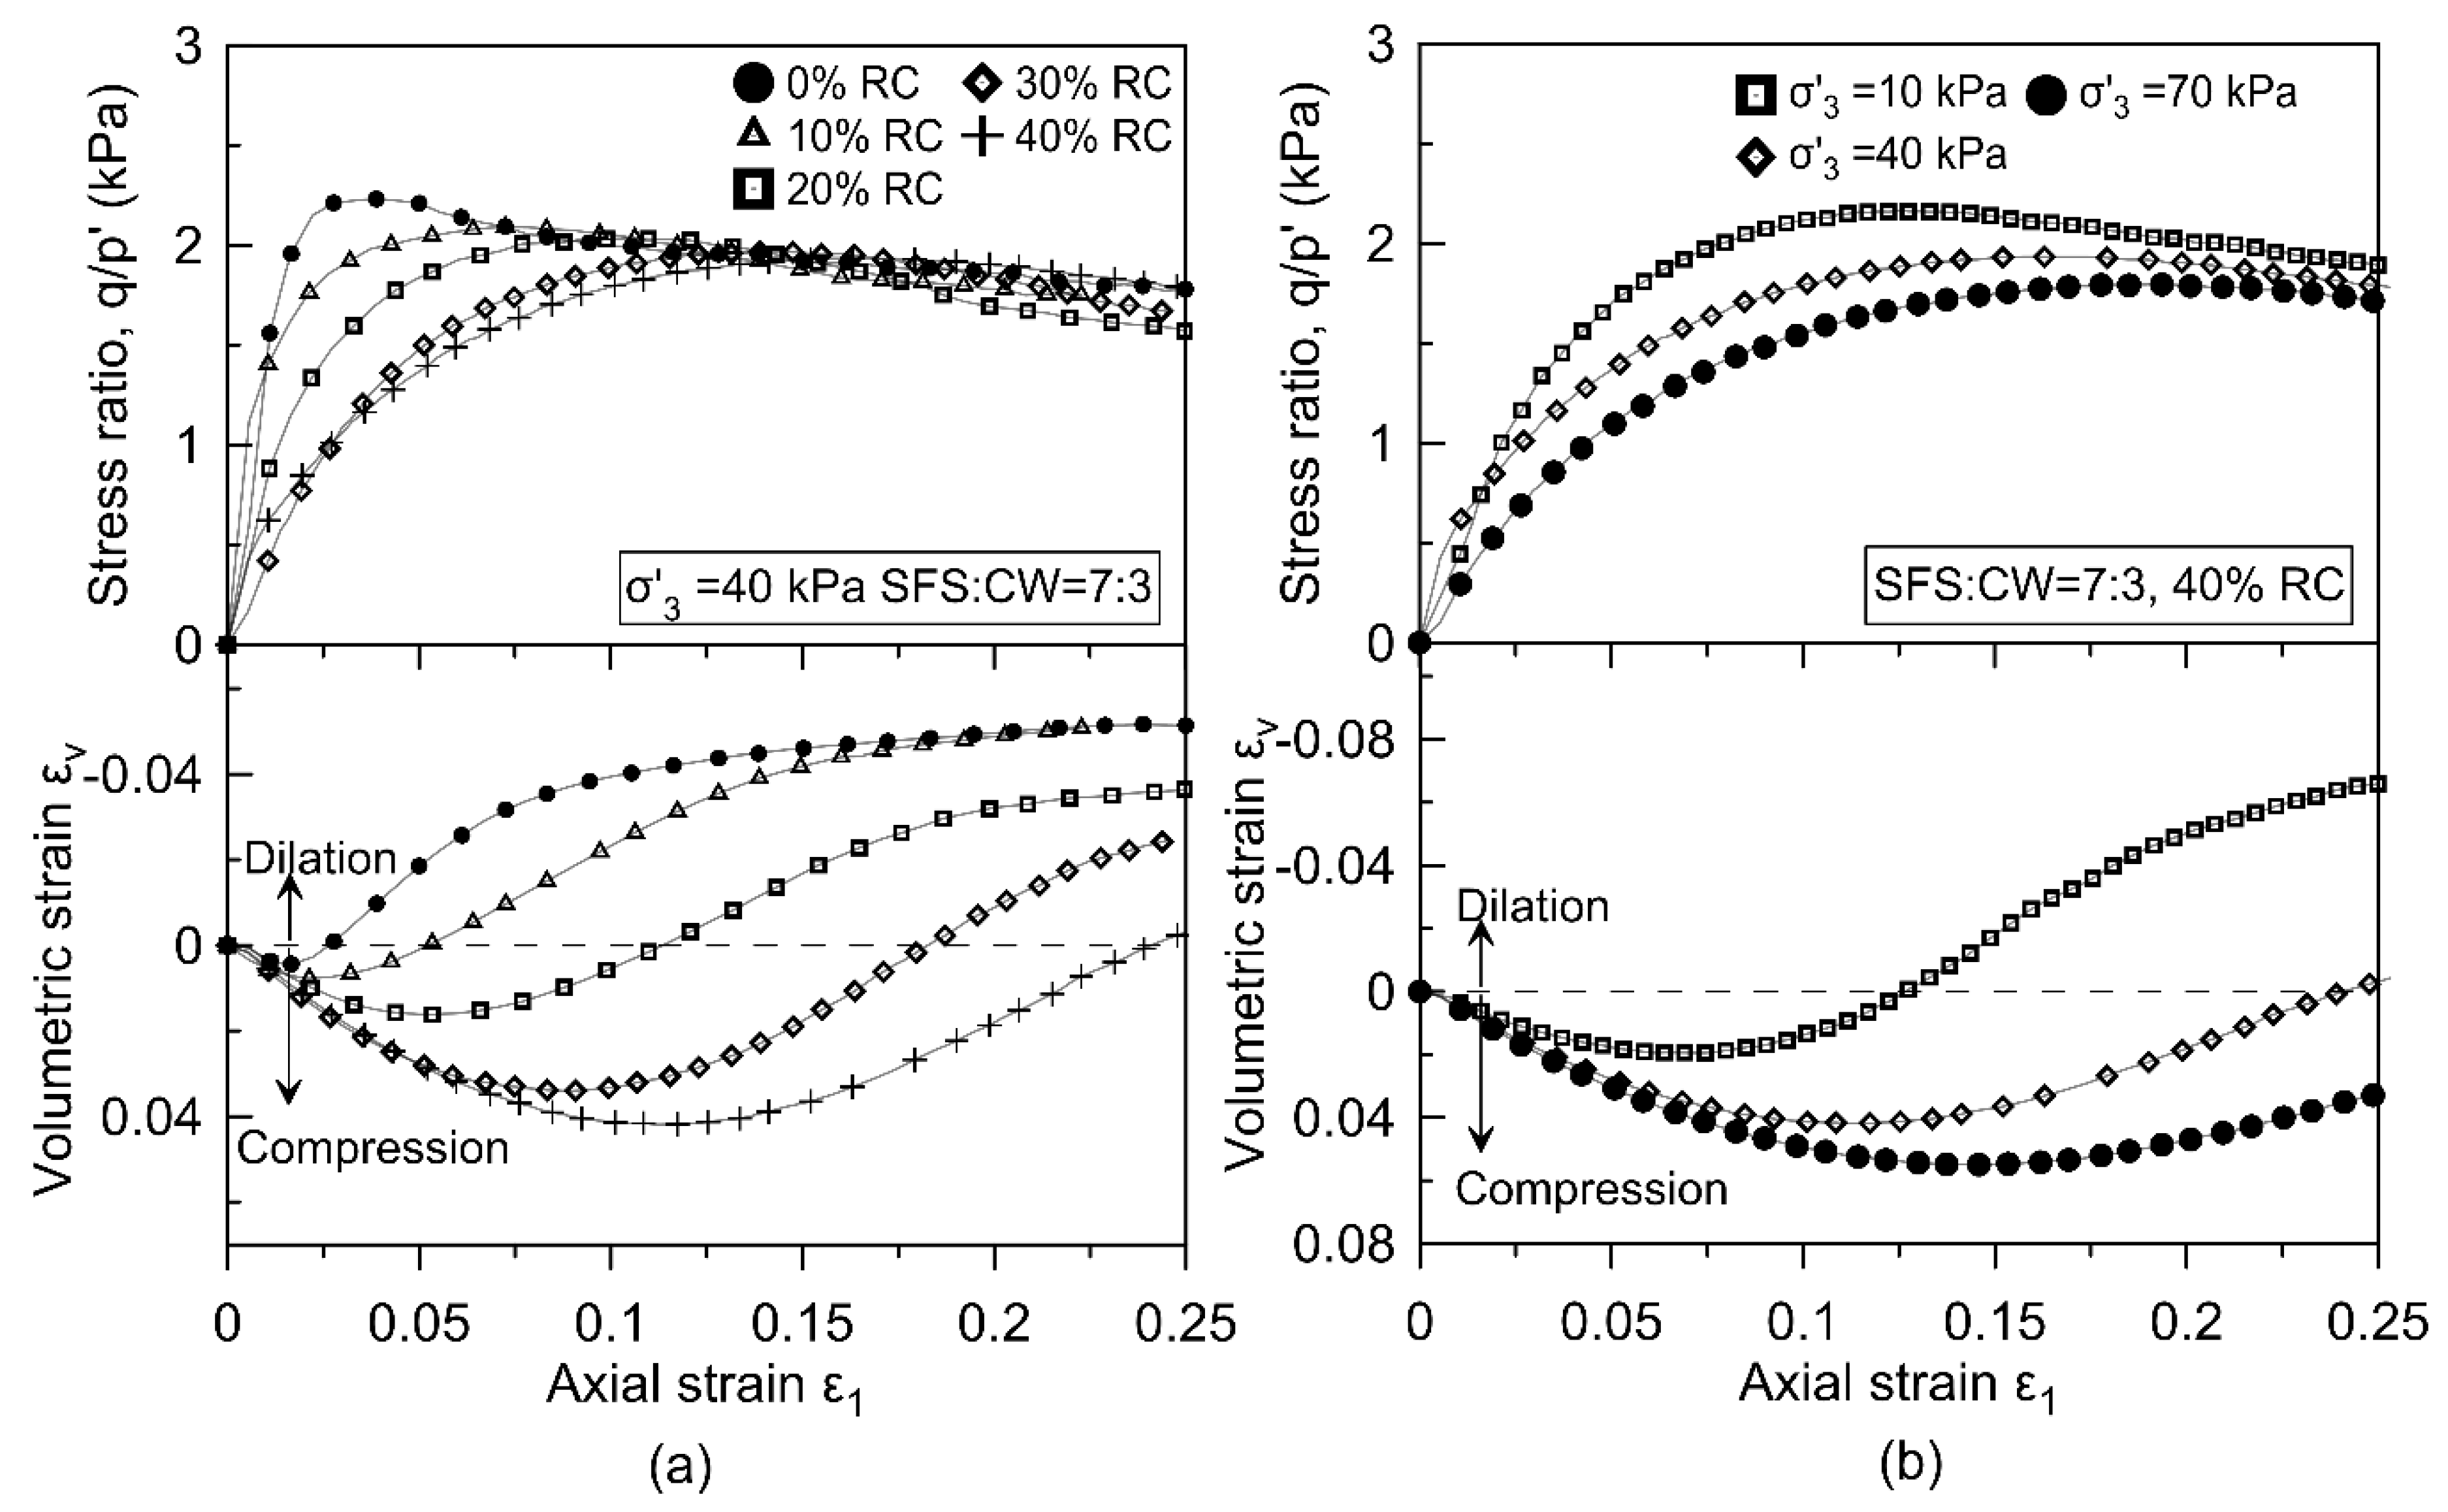
Three types of waste granular materials, i.e., steel furnace slag (SFS), coal wash (CW) and rubber crumbs (RC) were mixed to develop a SEAL layer for railway sub-ballast. The granular SFS (specific gravity, G s = 3.3 ) came from Australia Steel Milling Services and consists mainly of prismoidal/cuboidal particles with strong interlocking properties. The softer CW ( G s = 2.11 ) from Illawarra Coal is usually a random blend of both angular and relatively flaky grains with dual porosity, and the RC ( G s = 1.15 ) is derived from waste tires. To achieve the target particle size distribution (PSD) curves of the waste matrix for this study, the RC consisting of three different sizes (0–2.3 mm, 0.3–3 mm, and 1–7 mm) were used. PSD of SFS, CW, RC and the target PSD for the waste matrix are shown in Figure 1.
All the waste materials were mixed with SFS:CW = 7:3 (by weight), because this blending ratio can secure sufficient shear strength, an acceptable particle breakage and swelling potential for the waste mixtures [19,25]. The RC contents ( R b ,   % ) used were 0, 10, 20, 30, or 40% RC (by weight). The stress-strain and energy absorbing behavior of the SFS+CW+RC matrix were examined via a series of static triaxial tests. All the specimens (100 mm high by 50 mm in diameter) were compacted into five layers with the optimum water content and the target initial dry unit weight was 95% of their maximum dry density. The optimum moisture content (OMC) and the maximum dry density ( γ d m a x ) were obtained using the standard Proctor Compaction test procedure and their values are given in Table 1. The maximum dry density of the waste matrix decreases as the rubber content increases due to the relatively low unit weight of rubber.
A series of consolidated drained triaxial tests were carried out according to ASTM D7181 [36] consisting of three main stages, i.e., saturation, consolidation, and shearing. Details of these test procedure have been explained elsewhere by Indraratna et al. [19]. Note that three different effective confining pressures at a low level (i.e., σ 3 = 10 ,   40 ,   and   70   kPa ) were used during consolidation and shearing to simulate typical field conditions of railway sub-ballast in the towns of Bulli and Singleton [1,11]. Once the tests were complete, sieving was carried out to examine the particle breakage caused by shearing. The test results were corrected according to membrane correction obtained under a confining pressure of σ 3 = 10   kPa , but it was ignored for higher confining pressures where the error becomes less than 3% [19,37].

2.1.2. Test Results

The typical stress-strain curves of SFS+CW+RC mixtures obtained from the static triaxial tests are presented in Figure 2. Figure 2a shows that the inclusion of RC reduces the peak stress ratio of the waste matrix under the same effective confining pressure (i.e., σ 3 = 40   kPa ); this is due to the lower shear strength of rubber materials in comparison to SFS and CW. Moreover, as R b (%) increases, the strain softening phenomenon after the peak stress ratio is weakened, and the axial strain ε 1 corresponding to the peak stress ratio increases. This indicates that the waste matrix changes from brittle to ductile, which indicates a definite advantage for using rubber in the waste matrix as sub-ballast. Its higher ductility can prevent abrupt failure and allow the waste matrix to undergo larger plastic deformation before failure. As expected, the specimen becomes more contractive when more RC is involved, there is around 4% compression of volumetric strain for the SFS+CW+RC matrix containing 40% RC.
Figure 2b shows the stress-strain behavior of the waste matrix having R b = 40 % under different effective confining pressures. Note that with a certain amount of RC (i.e., R b = 40 % ), the waste matrix tends to contract more and the peak stress ratio decreases when the effective confining pressure increases.
The energy absorption characteristics of the waste matrix can be evaluated by the strain energy density, the area under the shear stress-strain curve up to failure (Figure 3a) as defined by:
E = 0 γ f τ d γ
where E represents the strain energy density (kPa), γ f refers to the shear strain (dimensionless) corresponding to the failure point, and τ is the shear strength (kPa). Failure here refers to the point when the specimen reaches the peak deviator stress under the monotonic triaxial conditions suggested by Kim and Santamarina [38] for soil-rubber mixtures.
In Figure 3a the shaded area under the shear stress-strain curves represents the strain energy density of the waste matrix having: R b = 0 ,   10   and   20 % . There is a sharp increase in the shaded area when 10% of RC is added to the waste matrix, and this reflects the high energy absorbed by rubber materials. However, when more RC is included, only a marginal increase in the strain energy density is observed (Figure 3b). This is because the increase in ductility is compromised by the decrease in the peak deviator stress (Figure 3a). Moreover, as the effective confining pressure increases, the strain energy density of the waste matrix increases, which suggests that more work input is absorbed by the sample under higher loading conditions. The strain energy density of traditional sub-ballast (well graded crushed rock) tested by Indraratna et al. [19] is also presented in Figure 3b. Noteworthy that the strain energy density of traditional sub-ballast is similar to the waste matrix without RC, and there is a big difference with the optimum mixture (SFS:CW = 7:3 with R b = 10 % ) selected by Indraratna et al. [19]. The test result shown in Figure 3b indicates that the waste matrix with 10% of RC can improve the strain energy density by 2–3 times when compared to traditional sub-ballast.
The ballast breakage index (BI) first proposed by Indraratna et al. [39] is another method for evaluating the influence that R b (%) has on the energy absorbing characteristics of the waste matrix. Moreover, particle breakage of subballast will generate more fine particles and change the particle size distribution of the materials, and then adversely affect the filtration and drainage functions of the subballast layer. As coal wash (CW) has a very high particle breakage potential, the breakage index is also a pertinent parameter of the synthetic energy absorbing layer (SEAL). Figure 4 shows the BI index of SFS+CW+RC mixtures with different amounts of RC after shearing under different effective confining pressures, and it decreases significantly with the addition of RC. When R b 10 % , BI is similar or less than traditional subballast tested by Indraratna et al. [19]. When RC contents increase to 30–40%, the particle breakage of the waste mixtures is ignorable. This is attributed to the high energy absorbing capacity of rubber materials that can buffer the loads as the rubber crumbs deform, and in this way help reduce the breakage of CW. This further indicates that installing a synthetic energy absorbing layer in a rail track will certainly assist in reducing particle degradation and increase track longevity.

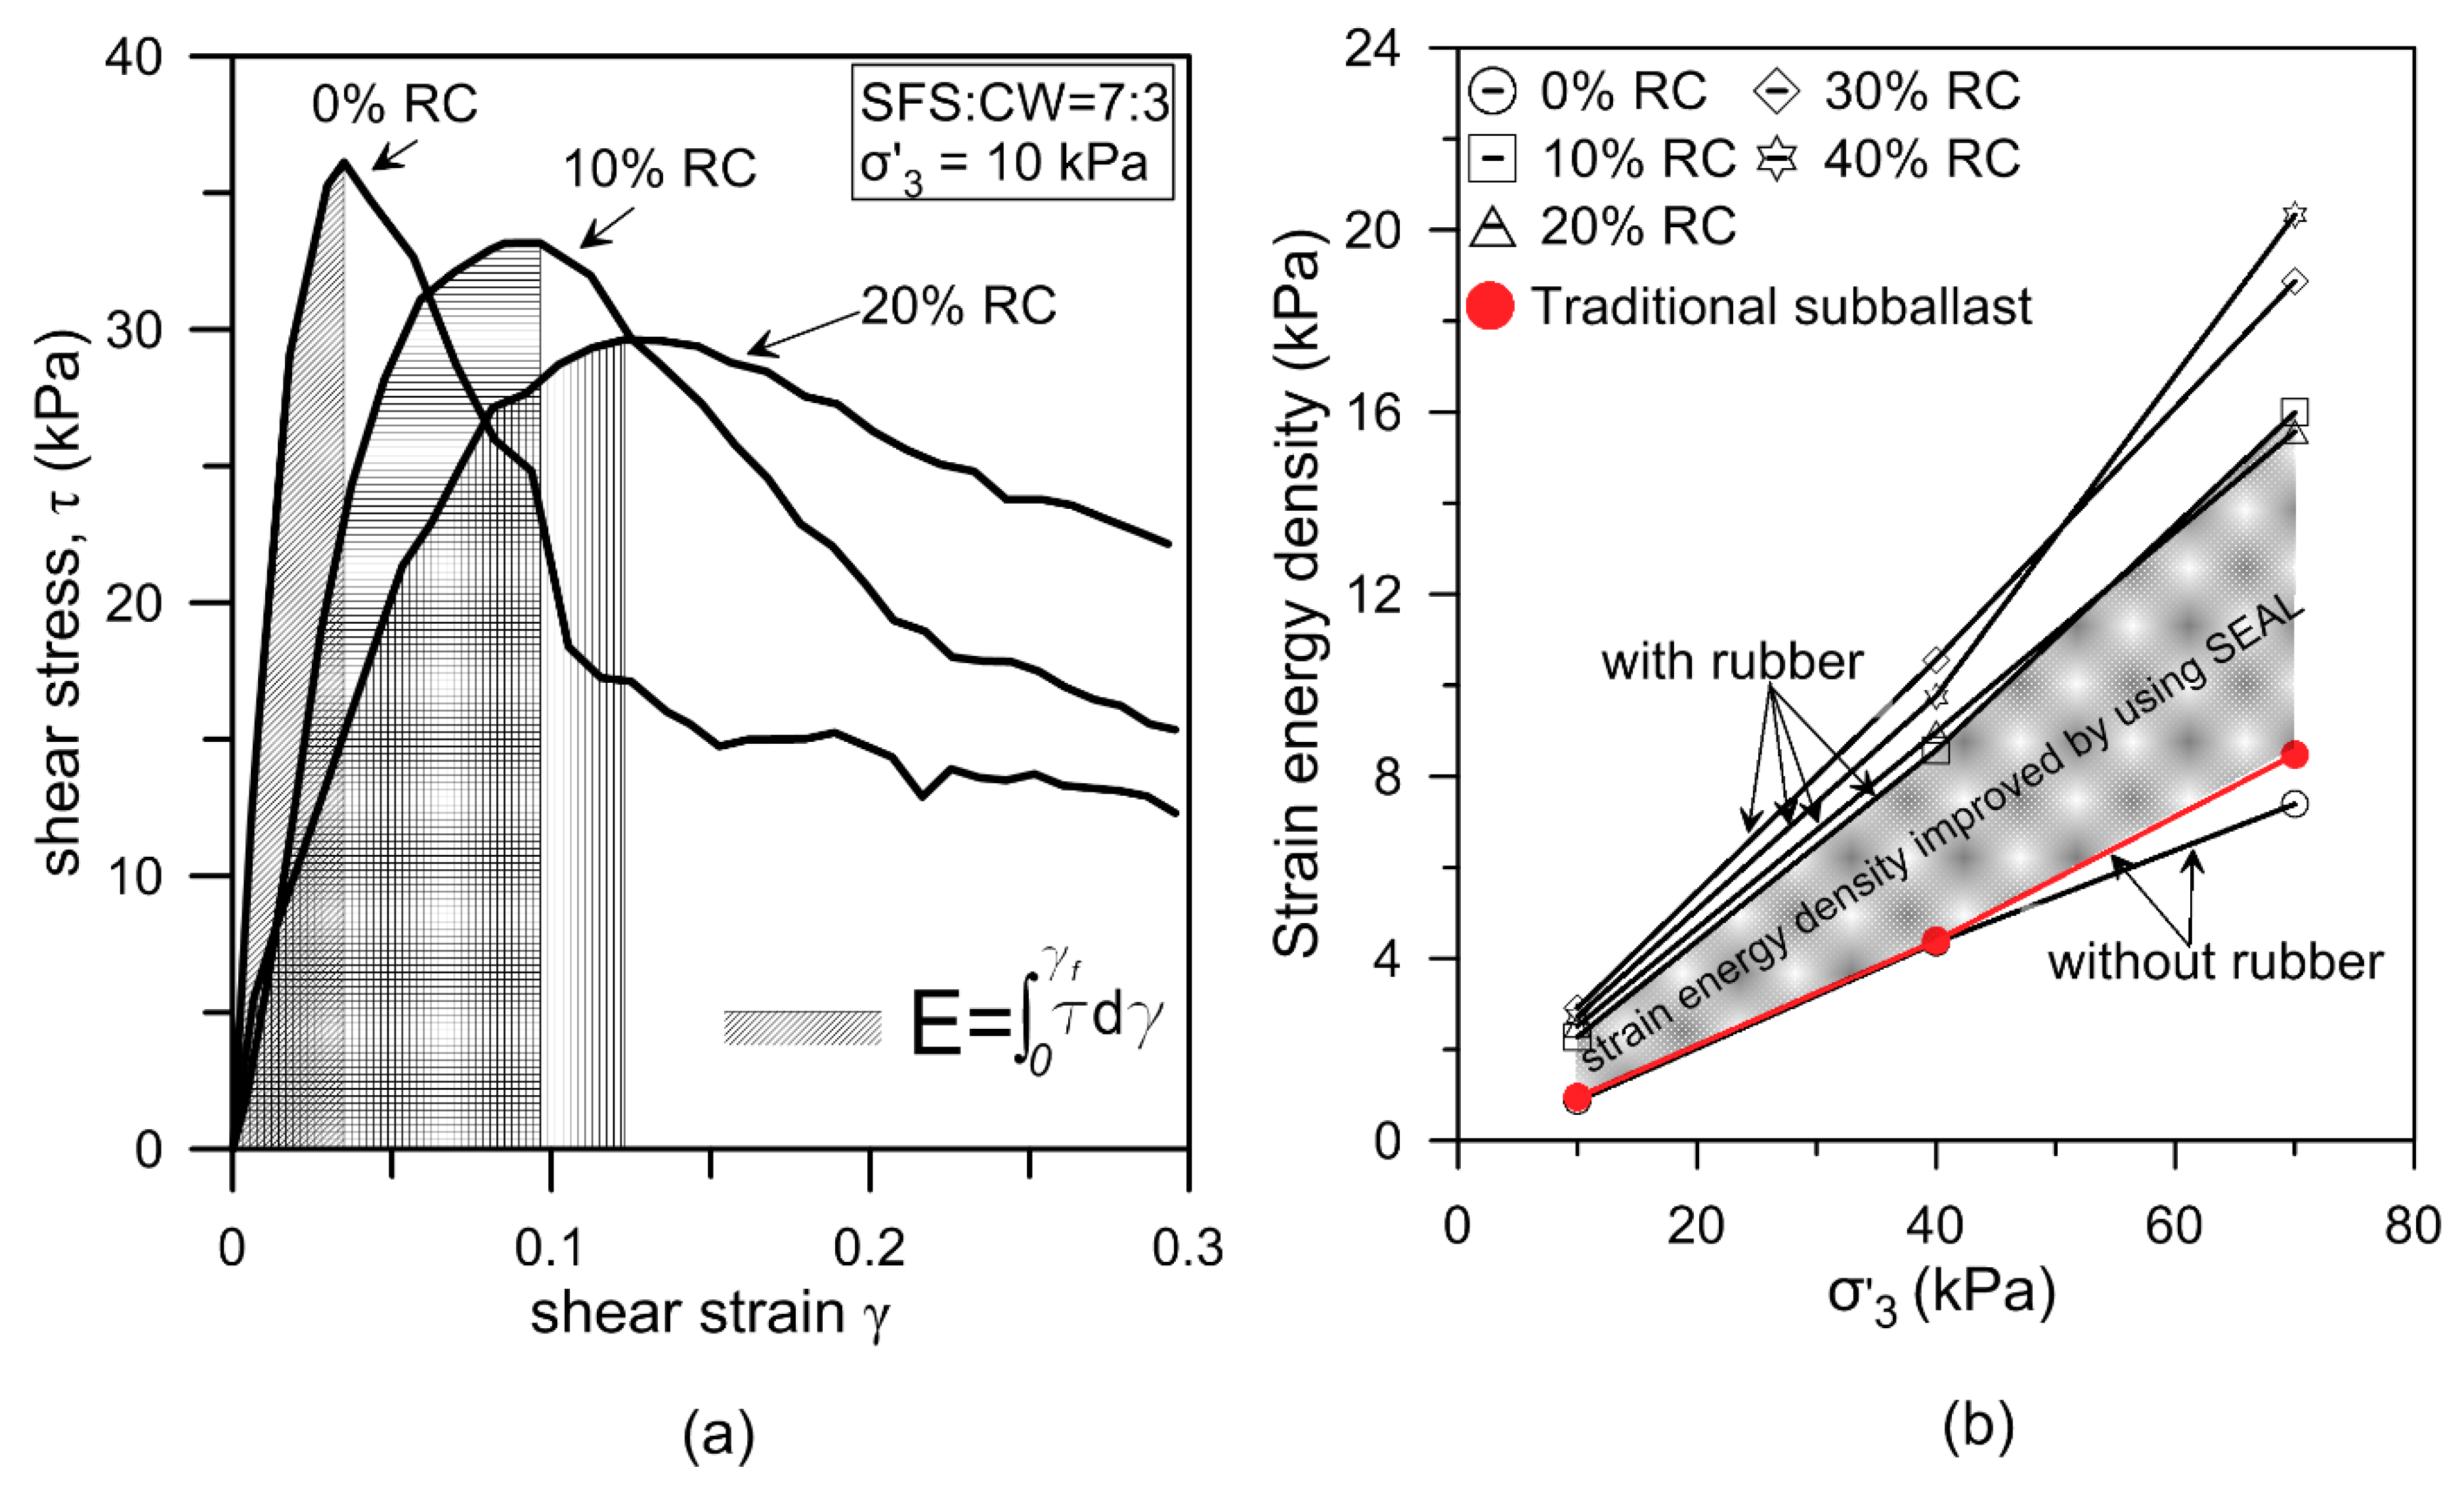
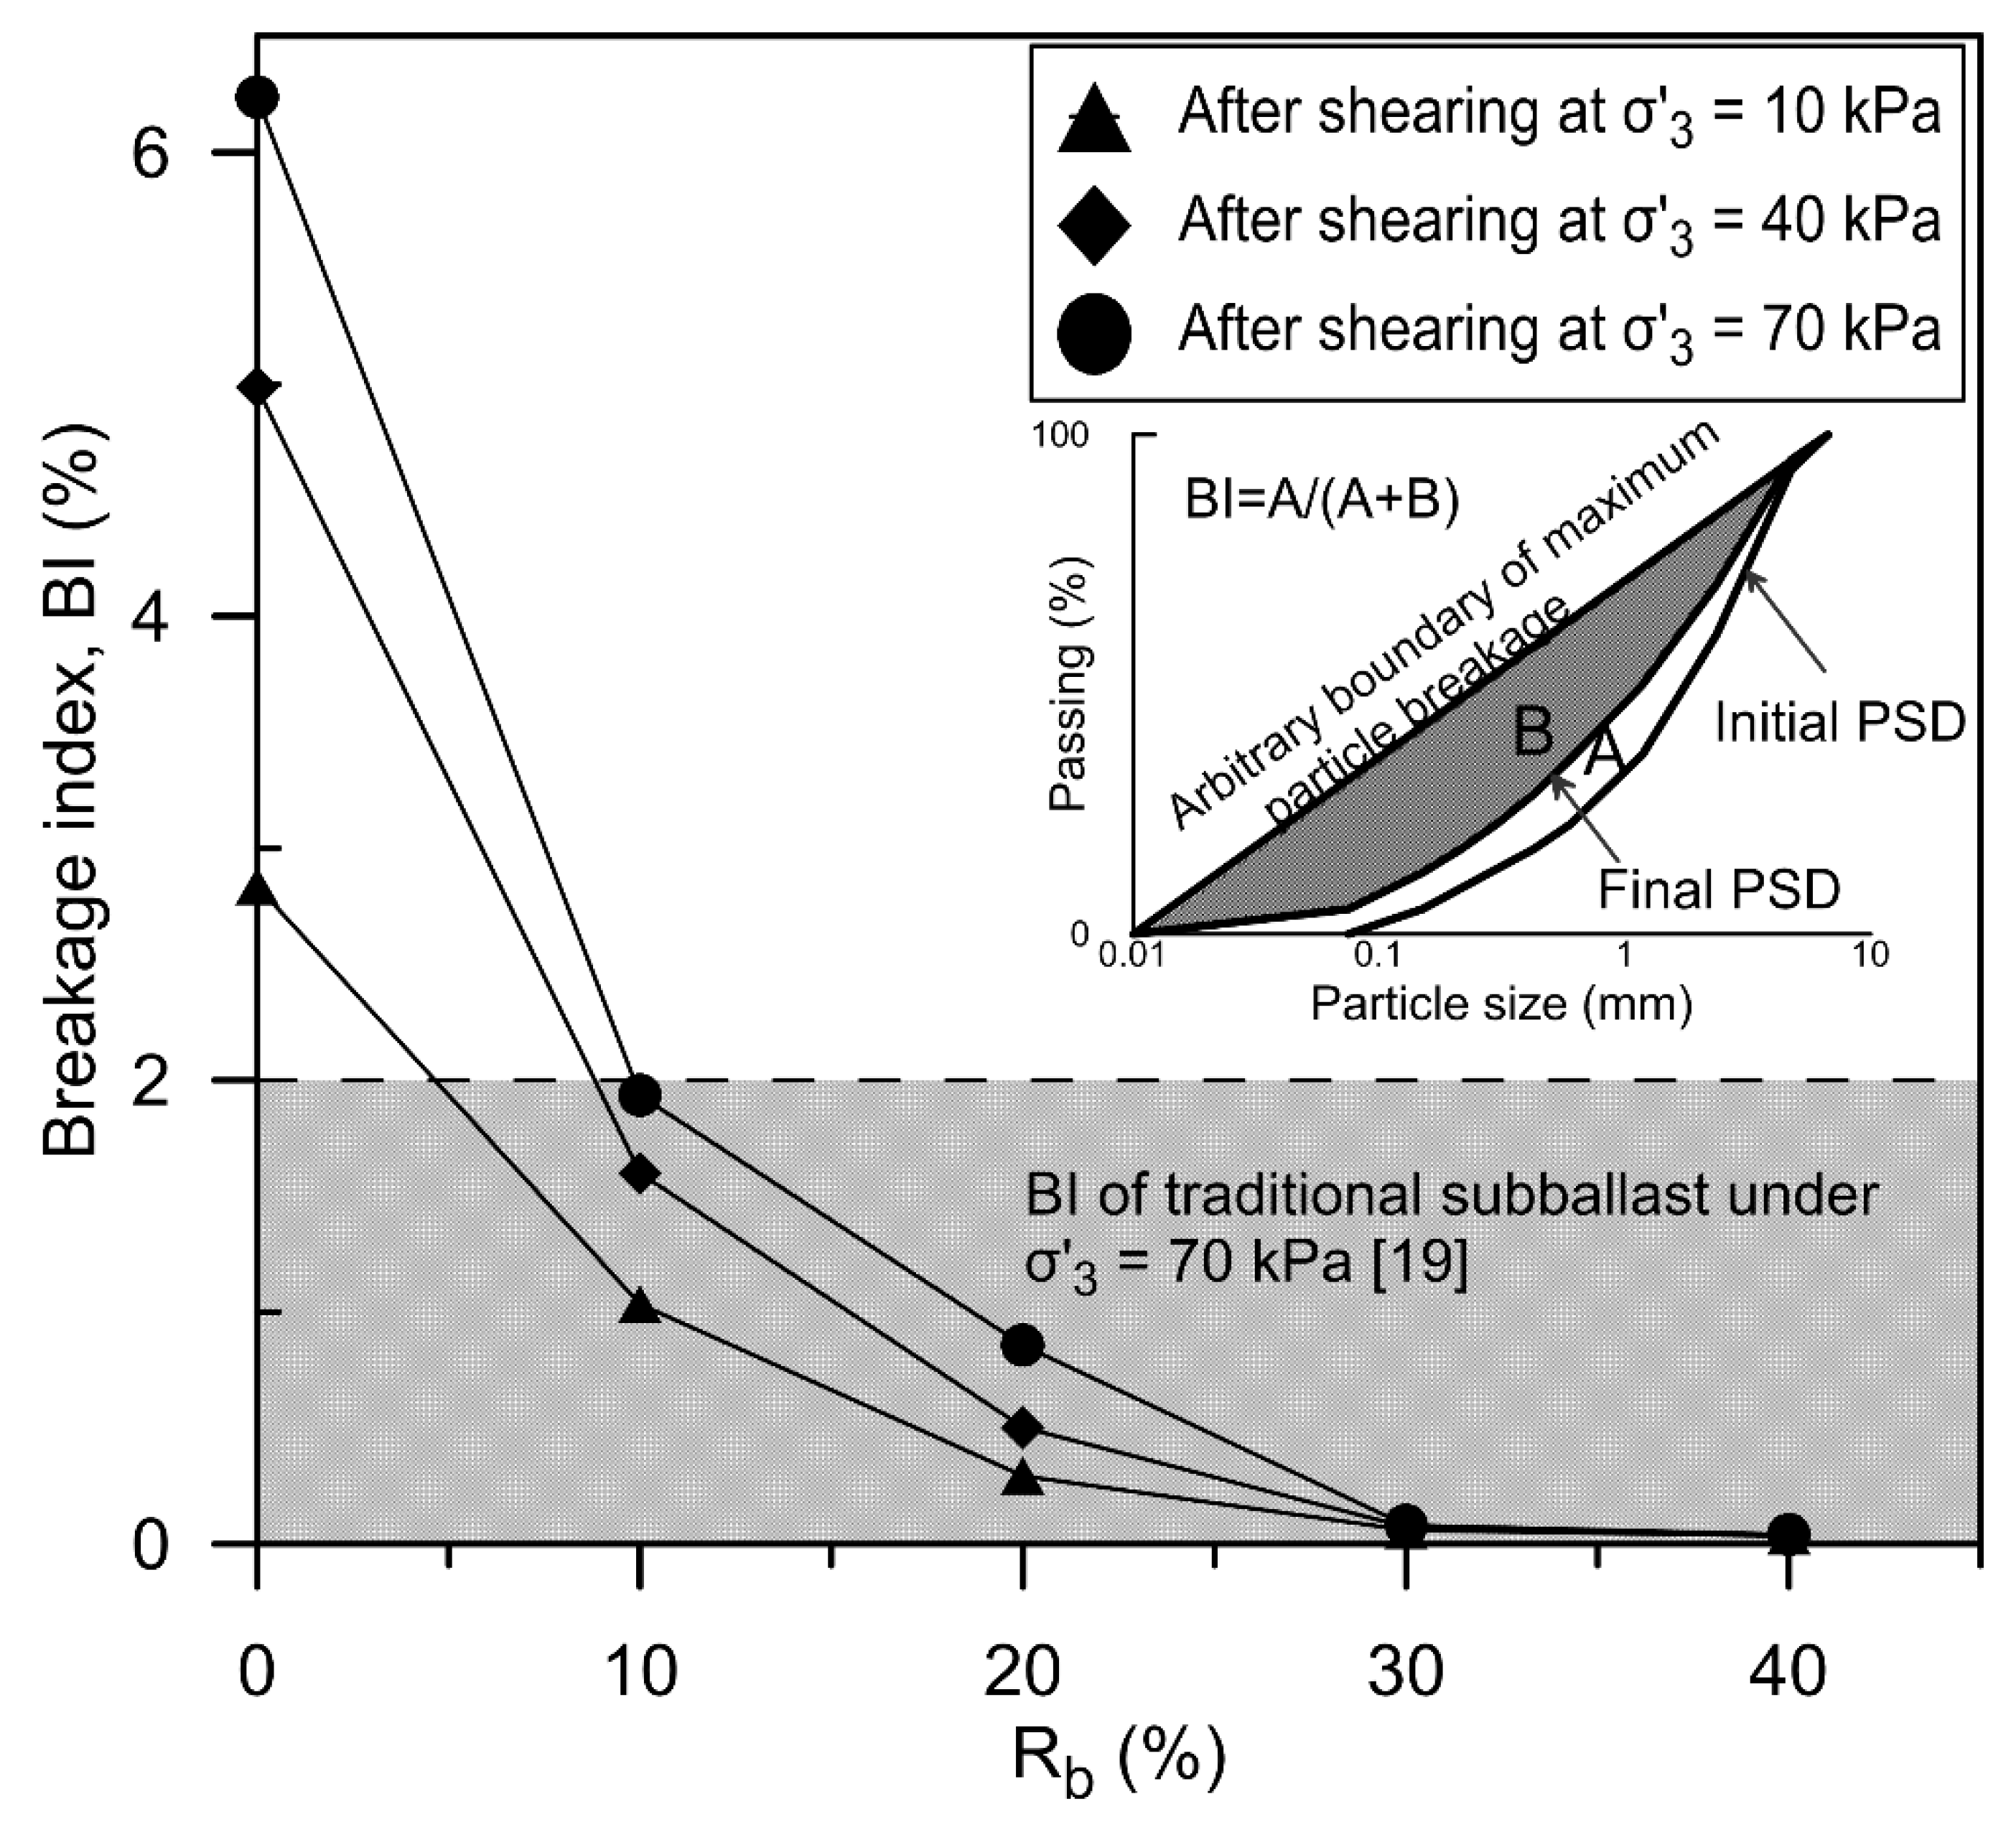
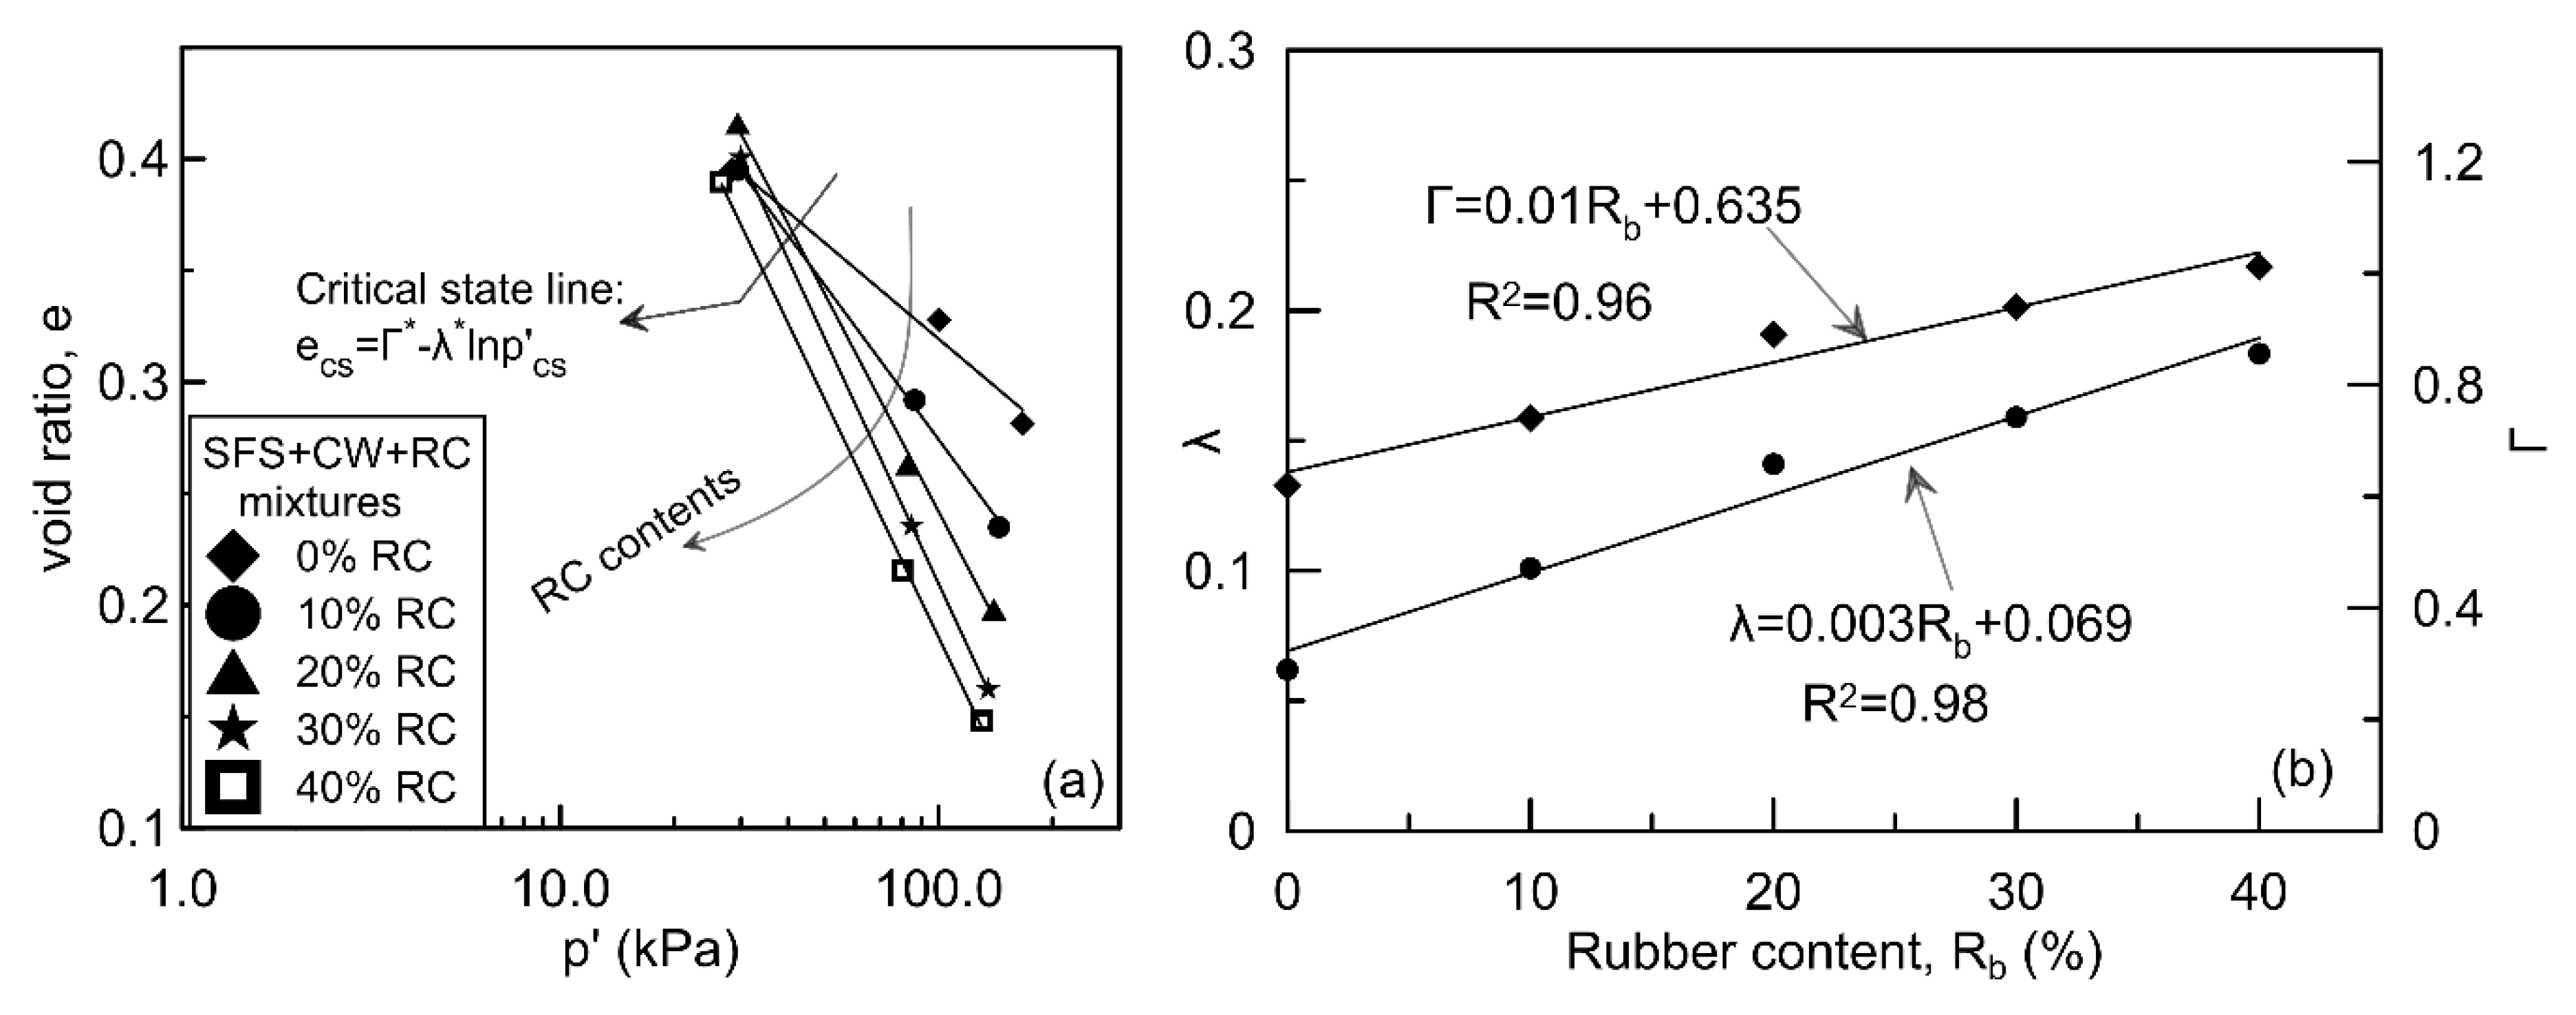
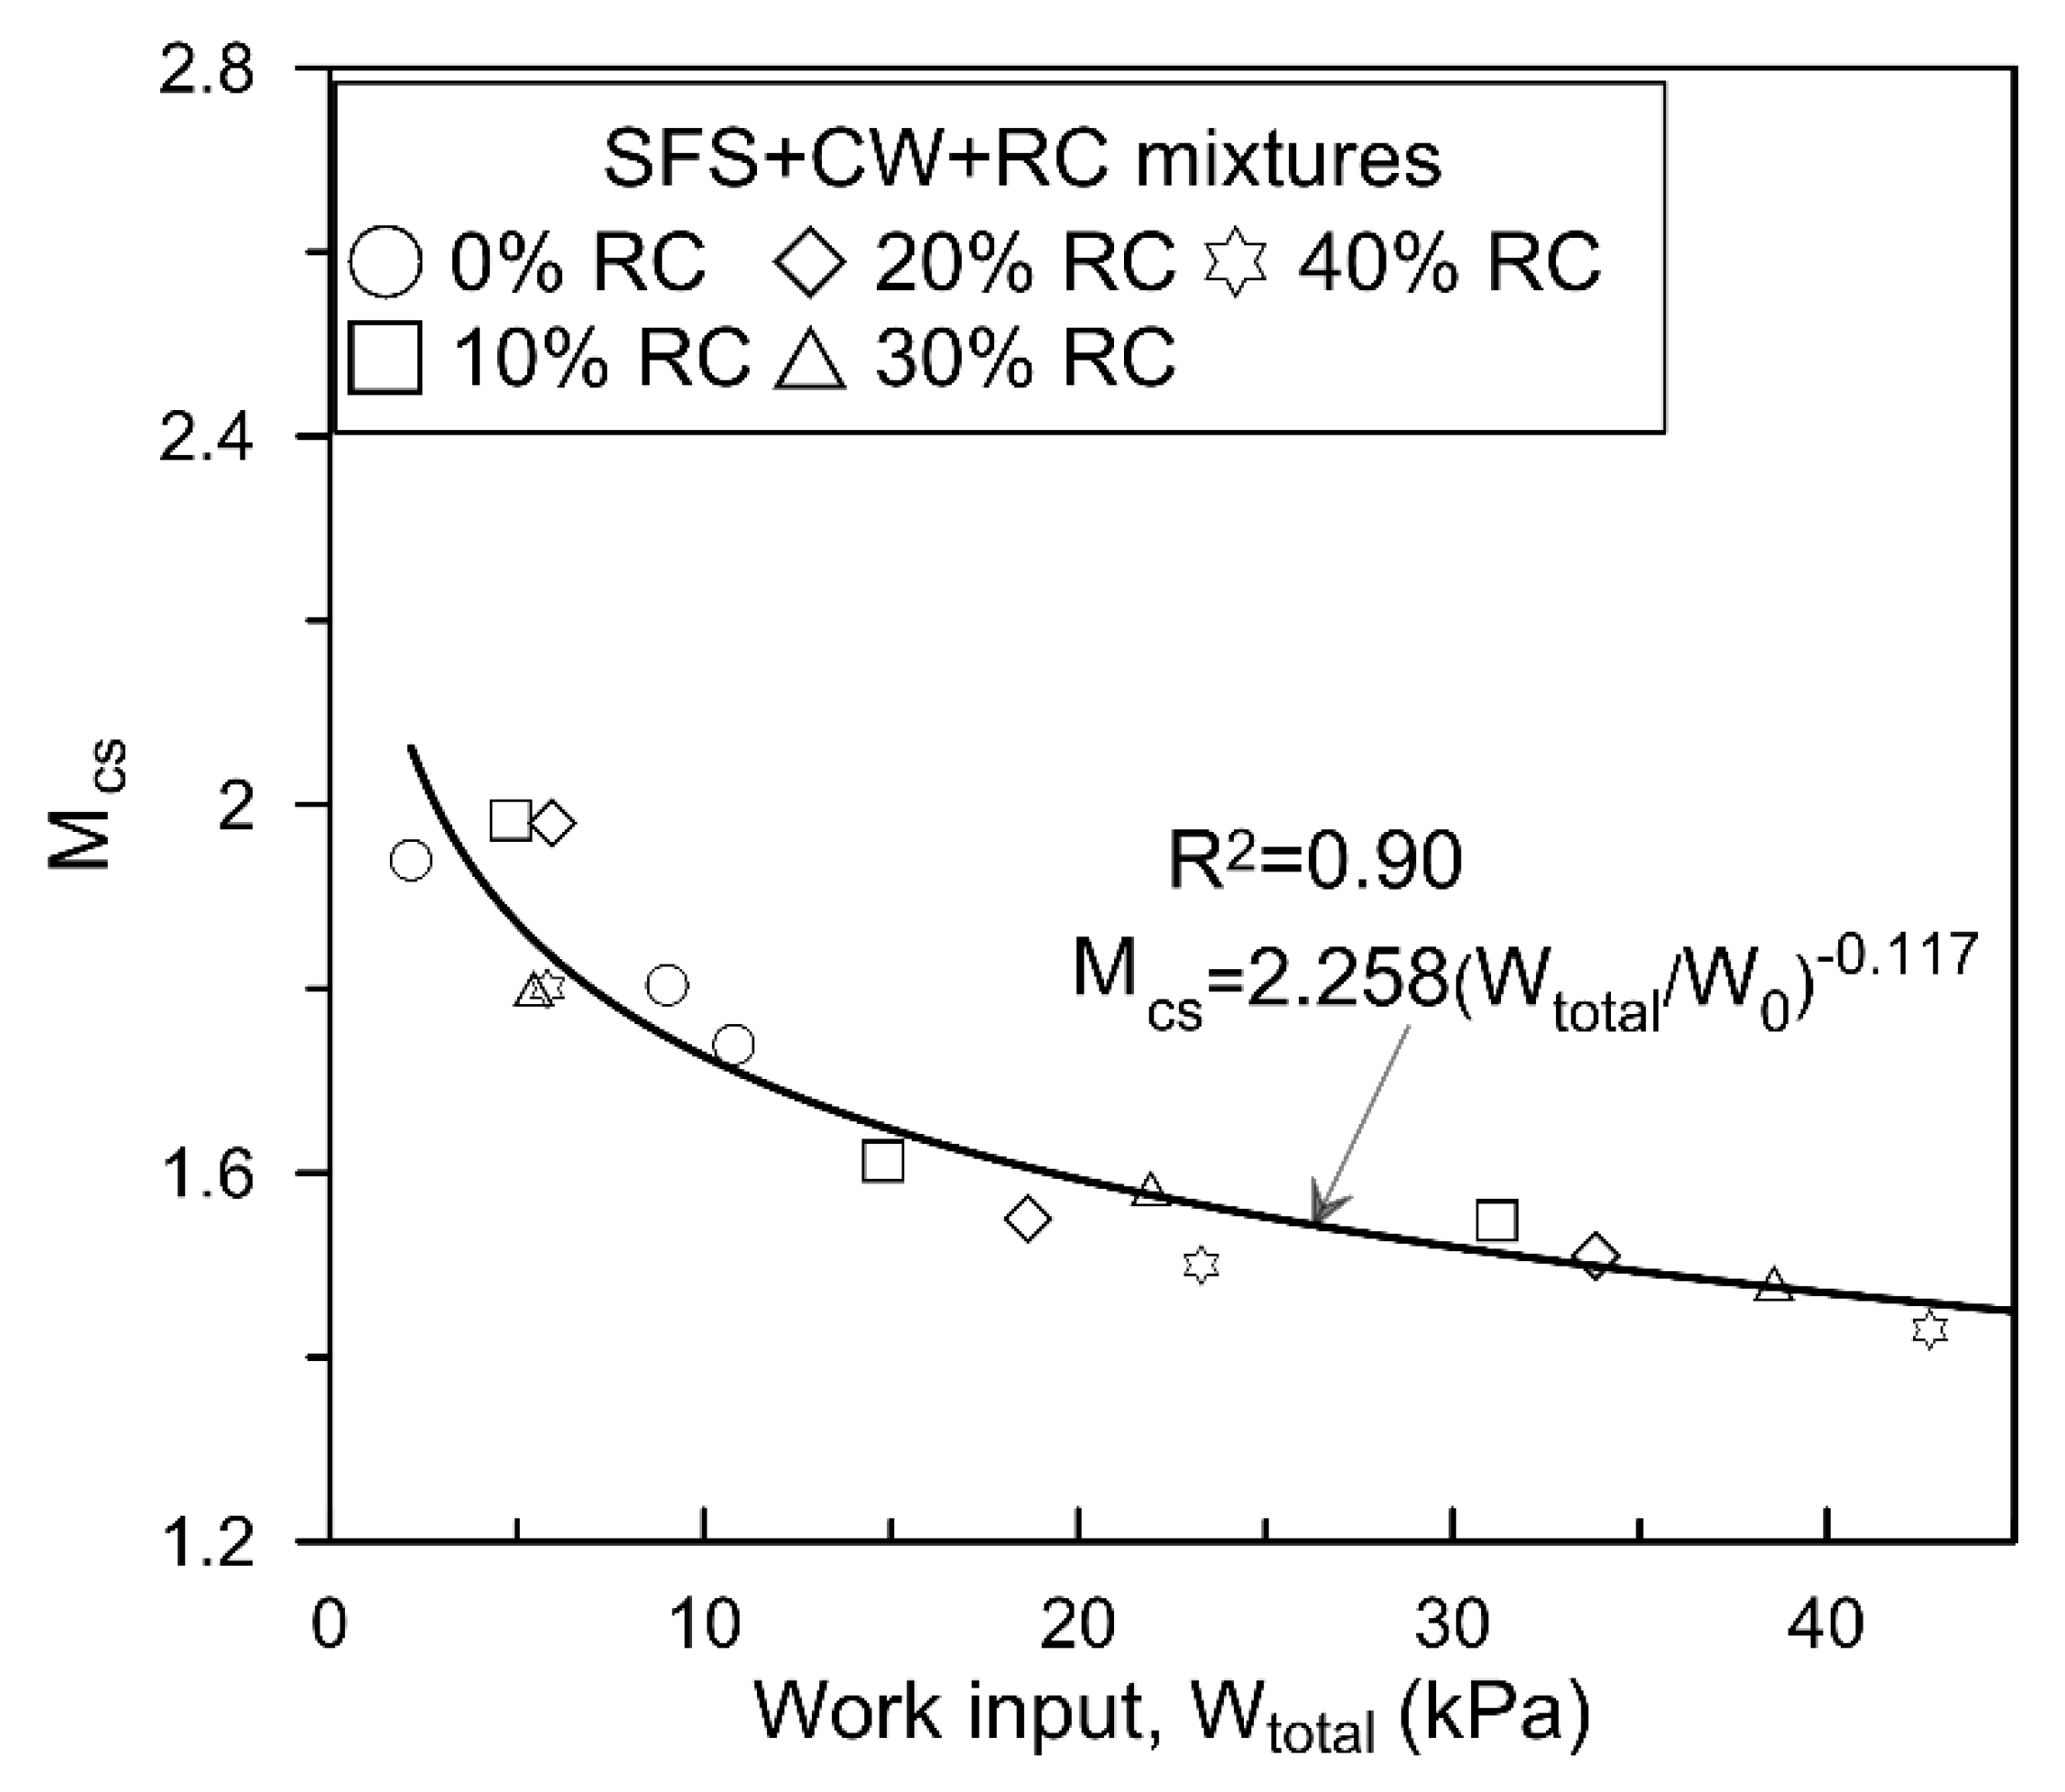
2.2. Critical State Related to Energy Absorbing Property

The critical state can be defined as when a soil reaches a condition whereby the deviator stress and the mean effective stress approach a constant value as the axial strain increases, and the corresponding soil dilatancy ( d ε v p / d ε q p ) also reaches zero, i.e.,
d q d ε q = d p d ε q = d ε v p d ε q p = 0
where ε q is the deviator strain, ε v p is the plastic volumetric stain, and ε q p is the plastic deviator strain.
Difficulties have been found for mixtures of the soil-tire chips/fiber to achieve a critical state [40,41], whereas the critical state of soil-RC mixtures can be partially obtained under laboratory conditions [42,43]. This is because rubber materials that are larger with longer and narrower shape continue to deform until the test ends, whereas smaller particles of RC can be hindered from deforming by the surrounding rigid materials. Qi et al. [43] indicate that there is still a trend whereby SFS+CW+RC mixtures having R b 20 % may reach a critical state beyond ε 1 = 25 % , which is in the proximity of the maximum axial strain that can be reached in most laboratory conditions, hence, extrapolation is often required to obtain the critical state parameters. In this study, the critical state parameters, i.e., the critical state ratio ( M c s ) and the critical void ratio ( e c s ) are determined by two methods: (1) for a waste matrix having R b < 20 % , the critical state parameters are directly obtained through the test results; (2) for a waste matrix having R b 20 % , the critical state parameters are obtained by extrapolating the stress ratio-strain curves and stress ratio-dilatancy curves. All the critical state parameters are shown in Table 2.
As with other granular materials, the critical line in e p space is a linear relationship for each SFS+CW+RC mixture (Figure 5a):
e c s = Γ λ ln p c s
where Γ is the void ratio corresponding to p c s = 1   k P a , and λ represents the gradient of the critical state line in e p space. It is interesting to find that the critical state lines for the waste matrix in e p plane rotate clockwise as R b increases indicating the calibration parameters Γ and λ have a special relationship with R b . This special relationship is found to be linear (Figure 5b), as shown below:
Γ = Γ 1 + Γ 2 R b
λ = λ 1 + λ 2 R b
where Γ and λ are the modified critical state parameters that capture the influence of R b , while Γ 1 , Γ 2 , λ 1 , and λ 2 are calibration parameters. The linear relationship in Figure 5b shows an excellent correlation with the test data having the coefficient of determination R 2 > 0.95 .
The critical stress ratio M c s for each SFS+CW+RC mixture under different effective confining pressures is not unique, and it changes with R b and σ 3 . Considering that the strain energy density is also influenced by R b and σ 3 , these two parameters may somehow be related to each other. However, the critical state reflects the state of soil where there are no increments in the deviator stress q and mean effective stress p upon further straining; this specific point only occurs after all the energy input or absorbed by the soil has worked on the sample. Therefore, the total work input W t o t a l is a more comprehensive indicator for M c s than the strain energy density that only reflects the energy input by the shear stress. Previous studies such as Chavez & Alonso [44] also use the work input to capture the influence of suction and confining pressure on the critical state ratio of rockfill. Here, the increment of energy input equates to the incremental work done by the applied stresses q and p :
d W t o t a l = p d ε v + q d ε q
where d W t o t a l is the incremental work input, and d ε v and d ε q are the incremental volumetric strain and incremental deviator strain.
The value of W t o t a l of SFS+CW+RC mixtures is shown in Table 2. By combining W t o t a l with M c s (Figure 6), an empirical relationship can be developed whereby:
M c s = M 0 ( W t o t a l W 0 ) α
where M 0 is the critical stress ratio when W t o t a l = 1   k P a , α is a regression coefficient, and W 0 = 1   k P a is used to keep the units of both sides of the equation the same. The value of M 0 and α are shown in Figure 6. With R 2 = 0.90 , the exponential relationship between the critical stress ratio and the work input shows convincing acceptance in relation to the test data. It is noteworthy that some deviations are always expected for regression-based fitting curves in relation to the laboratory test data. With this empirical relationship, the energy input or absorbing level is incorporated by the critical state parameter.

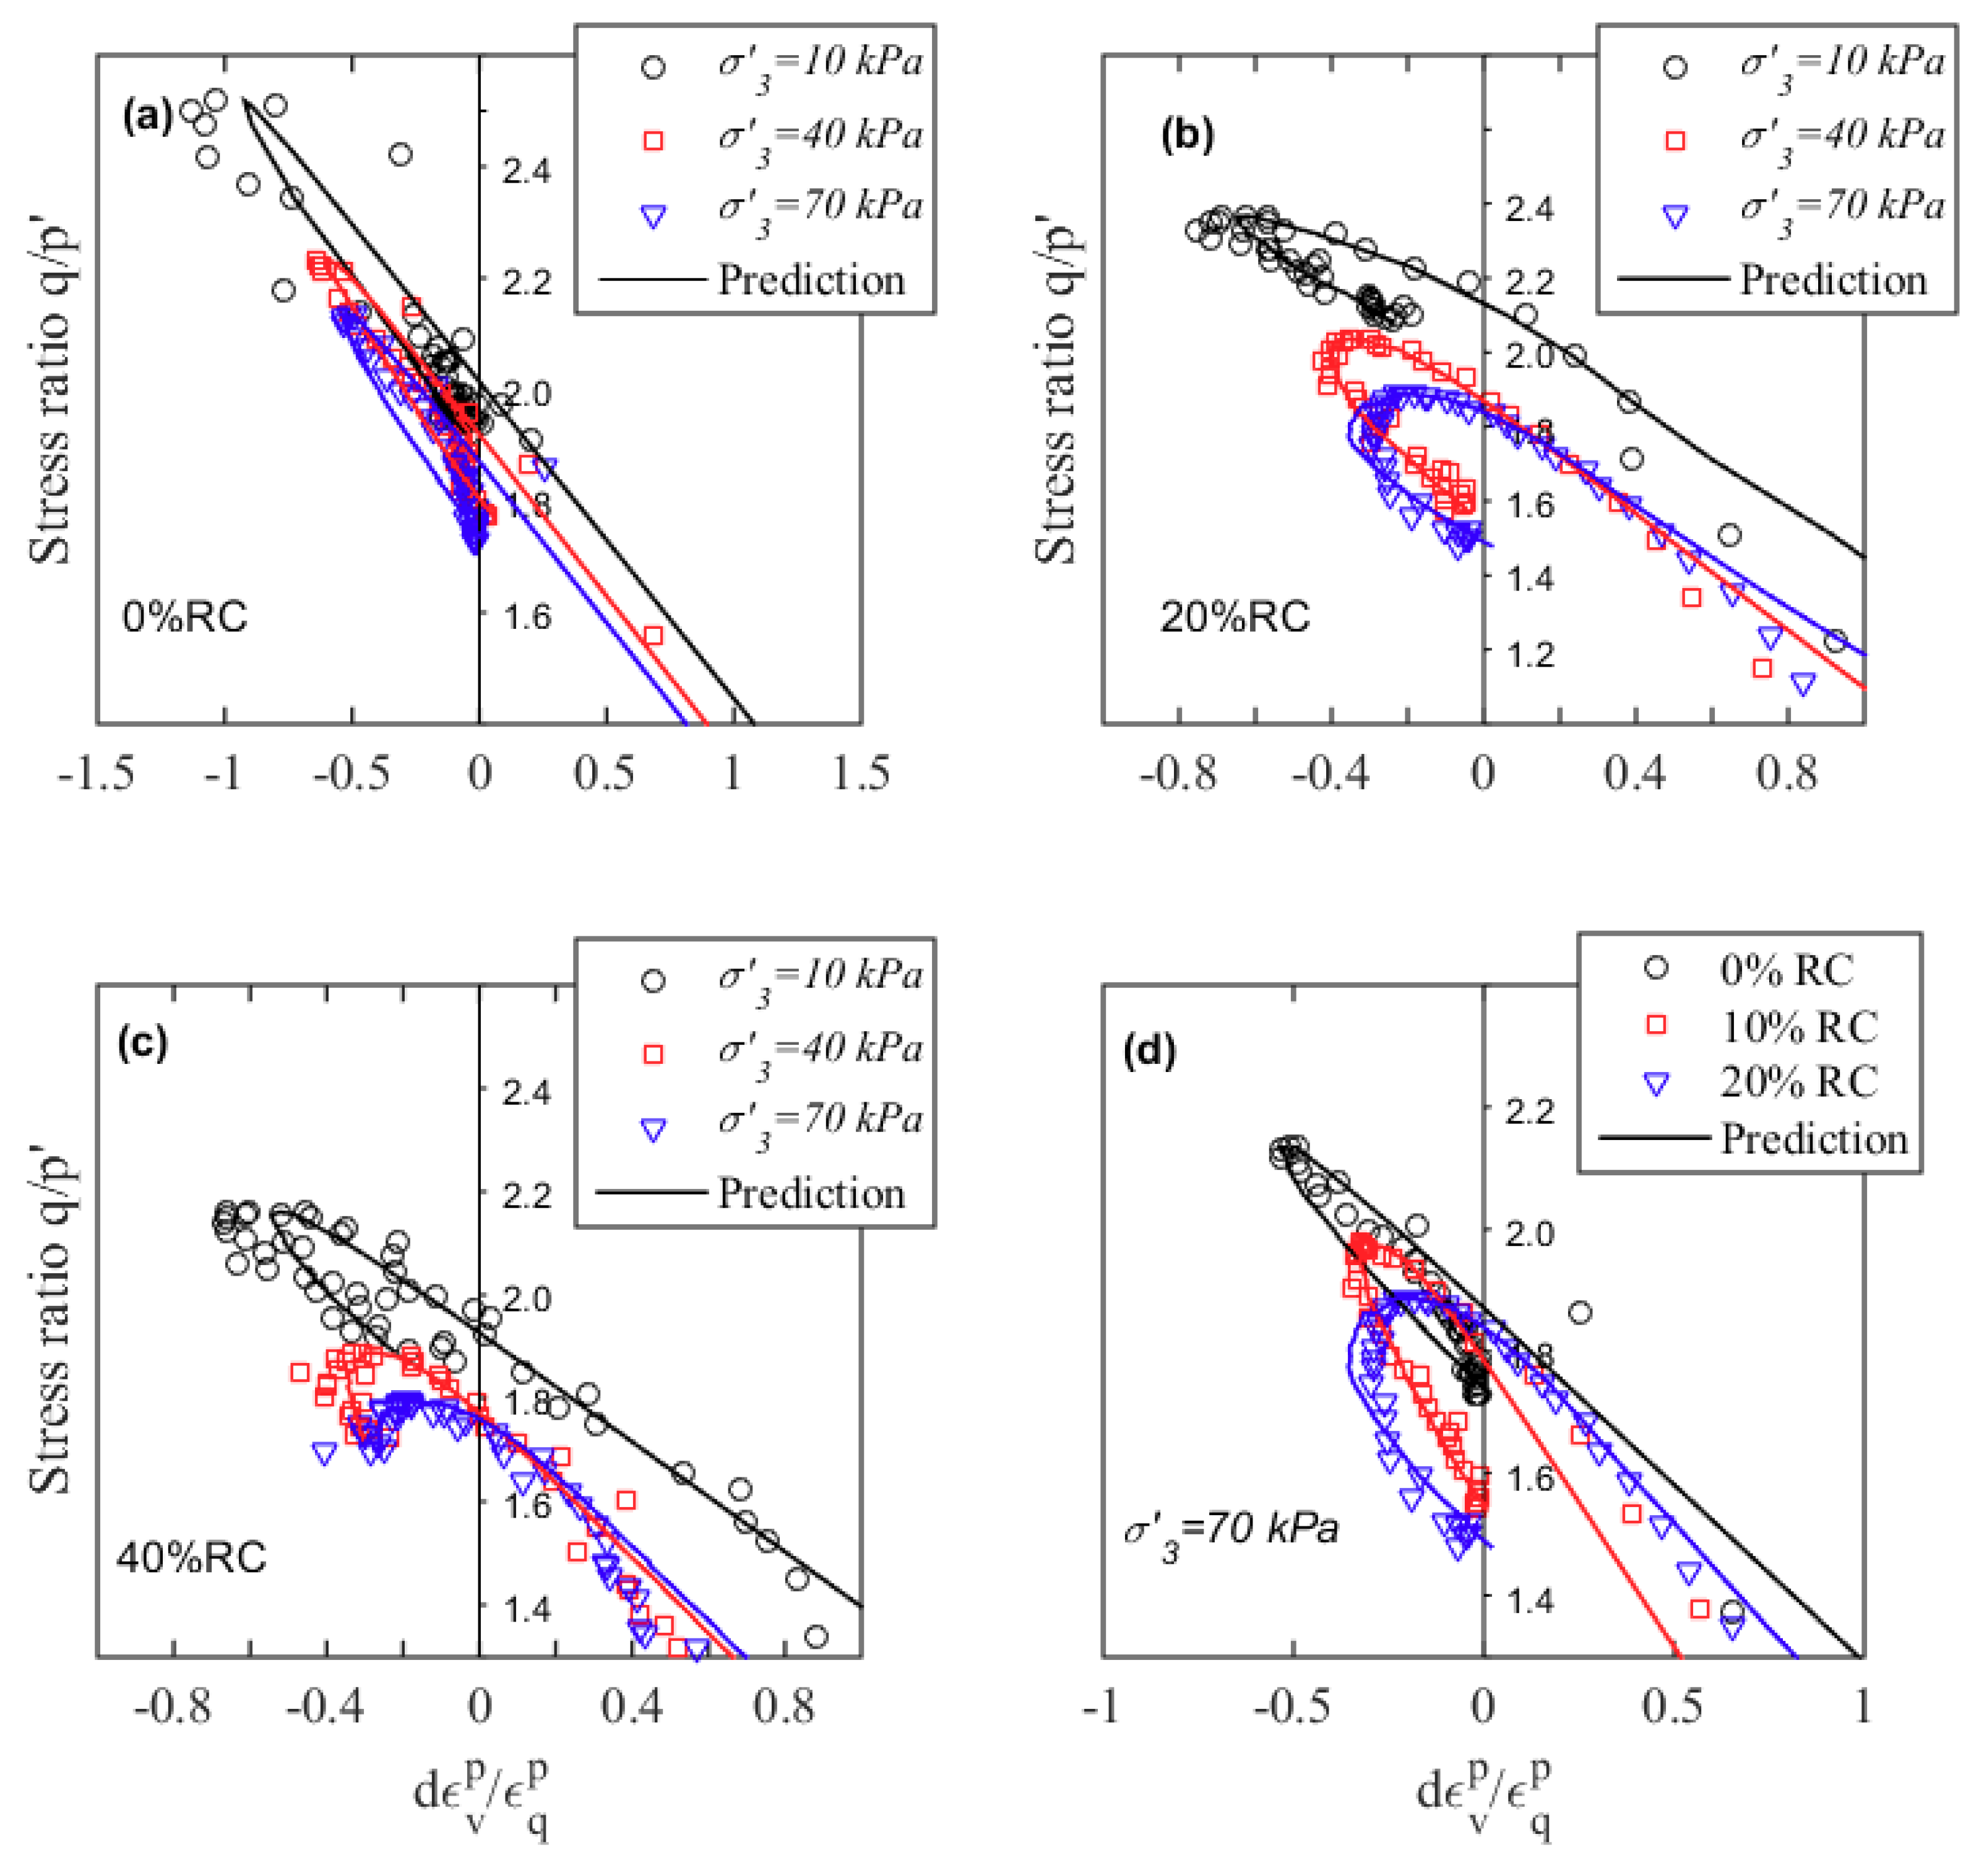
2.3. Dilatancy Modelling

The stress-dilatancy relationship is one of the fundamental conceptual ideas in soil geomechanics. It aims to model the stress behavior of soils when dilation occurs in response to shear deformation [45]. In other words, the dilatancy of soil represents the state corresponding to soil density and stress conditions. To incorporate the effect of soil density and stress conditions on the deformation of soils, Been and Jefferies [46] introduce a state parameter ψ which refers to the difference between the current void ratio and the critical void ratio at the same pressure:
ψ = e e c s
By considering the relationship between the critical void ratio and amount of RC, the state parameter ψ can be modified by substituting Equations (3)–(5) into Equation (8), thus:
ψ = e ( Γ λ ln p C S )
By following Li and Dafalias [47], the dilatancy of soil d is associated with the state parameter, and is expressed by:
d = d ε v p d ε q p = d 0 ( e m ψ η M c s )
where d 0 and m are two material parameters, M c s is the critical stress ratio modified with W t o t a l , and ψ is the state parameter modified with R b (%).
Parameter m can be obtained based on the phase transformation state (PTS) where the samples change from contractive to dilative, i.e., d = 0 , ψ = ψ P T S , and the stress ratio η = η P T S . Hence,
m = 1 ψ P T S ln ( η P T S M c s )
The dilatancy parameter d 0 can be computed according to the peak deviator stress point, i.e., d = d p e a k , ψ = ψ p e a k , and the stress ratio η = η p e a k . Thus,
d 0 = d p e a k ( e m ψ p e a k η p e a k M c s )
The values of the dilatancy parameters are shown in Table 2. Figure 7a–d shows the comparison between the dilatancy model predictions and the test results for SFS+CW+RC mixtures. It can be observed that the model captures the overall stress-dilatancy relationship of the waste matrix very well. It is noteworthy that the dilatancy decreases when R b or σ 3 increases, and all the specimens experience a hook after the peak stress ratio. By incorporating the modified critical state parameters with R b and W t o t a l this dilatancy can incorporate the influence of adding RC and the energy absorbing property of the waste matrix.

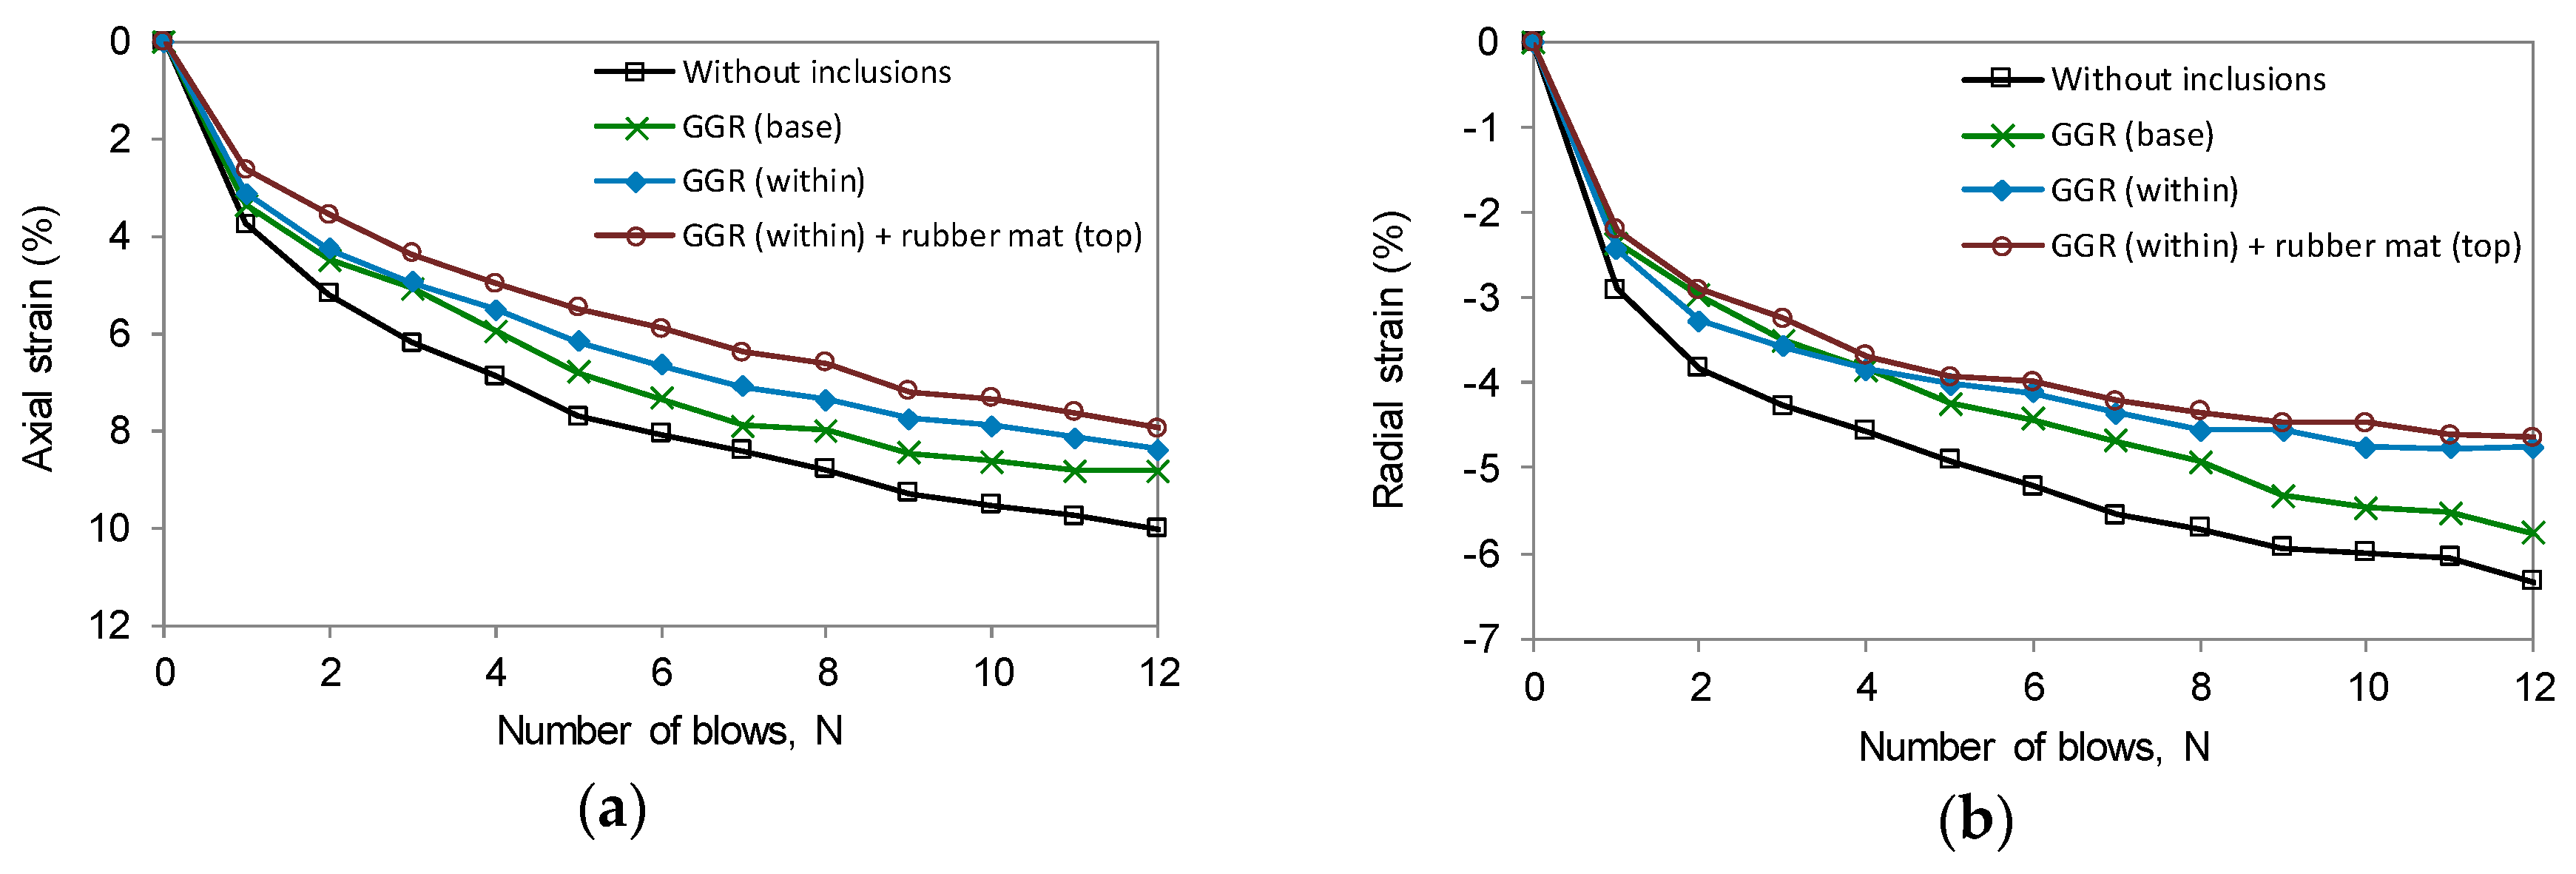
3. Laboratory Investigation for Geogrid-Reinforced Ballast

3.1. Materials and Methods

The role of geogrids in improving ballast degradation and deformation behavior under impact loading conditions was assessed using a large drop-weight impact test facility designed and built at UOW [48]. The apparatus consists of a free-fall hammer (590 kg in mass) which can be released from any height up to 6 m. A 150 mm drop height was adopted in this study to generate dynamic stresses simulating typical wheel defects [11]. The impact force versus time during each blow was monitored by a dynamic load cell, whereas the specimen axial and radial strains were estimated through manual measurements. Each test consisted of a total of 12 blows, after which the incremental deformations of ballast were almost negligible. The resulting breakage was then characterized using the Ballast Breakage Index (BBI) originally introduced by Indraratna et al. [39].
Test specimens were prepared inside a 300 mm diameter cylindrical rubber membrane with relatively high thickness (7 mm) to avoid piercing by sharp aggregates under the applied loads. First, a sub-ballast layer consisting of a mixture of sand and gravel was poured and compacted in dry conditions to a target unit weight, γ = 19 kN/m3 in two layers 75 mm thick. The ballast aggregates were then placed on top of the sub-ballast mass and compacted in three 100 mm thick layers (γ = 15.3 kN/m3) using a vibratory hammer. To enable the analysis of aggregate breakage throughout the depth, each of the three individual layers were color-coded.
The geogrid used in the current study consists of a laid and welded biaxial geogrid manufactured from polypropylene with 31 mm × 31 mm apertures, with a peak tensile strength of 40 kN/m and corresponding elongation of 8%. The test program (Table 3) involved ballast specimens with and without geogrid reinforcement. The position of placement of the geogrid was varied (i.e., either at the bottom of the ballast layer or at a distance of 100 mm from the bottom) to analyze its potential effect on ballast response. To investigate the effectiveness of a coupled geogrid-rubber mat solution, an additional test was performed in which three rubber mat layers with individual thickness of 10 mm were placed on top of the ballast layer, and simultaneously a geogrid sheet was installed at a height of 100 mm.

3.2. Test Results

Figure 8a presents the impact force variation with time in the first and last blows of test T1, where two different types of force peaks can be observed, namely, multiple high-frequency peaks acting for a very short duration (generally termed as P1 force), followed by a lower magnitude peak that remains for a longer duration (known as the P2 force) [49]. P1 forces occur immediately after impact as a quasi-instantaneous reaction of the specimen to the shock, whereby the various peaks are attributed to the hammer rebound. The effects of P1 forces are mostly filtered out by the load assembly, and thus they are unlike to cause ballast degradation [50]. In turn, P2 forces are related to the mechanical resistance of the ballast layer against the shock, leading to its significant deformation. Hence, the forces P2 are of greater relevance concerning track substructure deterioration (e.g., [51]) and should be controlled in order to ensure the safety of the track system.
Figure 8b compares the values of P2 measured in tests T1 to T4 throughout the repeated impact blows. It can be concluded that P2 forces exhibited a consistent increasing trend along the tests. Indeed, with successive blows, the ballast mass becomes denser as a result of the reorientation and breakage of particles. A denser ballast assembly provides greater inertial resistance producing larger P2 forces. This finding suggests that the impact forces generated in a newly laid track may be of lower magnitude than those in a frequently used track, where the ballast bed is in a denser state. Figure 8b also shows that the values of P2 were not significantly influenced by the presence of geogrid reinforcement. However, a considerable reduction of the impact forces was achieved by installing rubber mats above the ballast, which can be attributed to the damping properties or energy absorption capacity of these rubber elements.
The permanent axial and radial strains of ballast measured during testing are plotted in Figure 9. As expected, ballast deformations increase throughout the successive blows. A relatively rapid strain increment rate is recorded in the first impacts because of the reorientation and degradation of aggregates, which gradually reduces after a certain stage. It can clearly be seen that the provision of laid and welded biaxial geogrid attenuates the lateral and vertical strains of the ballast layer, when compared to the unreinforced condition, although the impact forces were the same for both conditions. The interlocking of ballast particles with geogrid apertures which leads to the reduction of lateral movement of particles (lateral confinement) can provide a more stable granular assembly to maintain a greater contact area, hence distributing the internal loads more uniformly. Figure 9 also shows that a higher efficiency (i.e., lower deformations) can be attained if the reinforcement is installed within the aggregate assembly (i.e., at a distance of 100 mm from the base), which is associated with greater interaction between the ballast aggregates and the geogrid, since the aggregates on both sides of the reinforcement can interlock with its apertures, as opposed to the case when the geogrid is placed over a stiff soil layer (i.e., sub-ballast layer). Furthermore, installing rubber mats at the top of the load-bearing ballast and a geogrid within the ballast assembly further enhances the ballast deformation response. Indeed, when both artificial inclusions were used (test T4), the ballast axial and radial deformations decreased by 21% and 27%, respectively, in comparison with those in the absence of any reinforcement (test T1).
The estimated values of ballast breakage (BBI) for each layer are listed in Table 4, along with the values corresponding to the whole (300 mm thick) ballast sample (BBI global). The BBI values ranged from 0.072 to 0.190 and were generally consistent with those obtained in a field trial carried out in the town of Singleton [52] for samples collected prior to track maintenance. Except for the test T4, in which three rubber mats layers were placed at the top of the ballast aggregates, the aggregate breakage was more severe in the uppermost ballast layer and tended to reduce with depth. In general, when all three layers are considered, geogrid-reinforced ballast (tests T2 and T3) experienced less breakage than unreinforced ballast (test T1). Similar to what was concluded regarding the ballast strains, installing the geogrid within the ballast layer resulted in a superior overall performance (i.e., lower BBI global value) when compared with the geogrid placed at the sub-ballast-ballast interface, which ensures more effective geogrid-ballast interlocking on both sides of the reinforcement. Comparing the results from tests T3 and T4, it is evident that the overall BBI value decreased significantly (28%) by the inclusion of rubber mats at the top of the ballast layer, which is associated with the reduction of the impact forces P2. Therefore, the simultaneous use of geogrids and rubber mats (i.e., under sleeper pads) as examined in this study can be an effective way of minimizing ballast deterioration under repeated impact loads, with significant benefits for enhanced track stability and extended maintenance cycles.

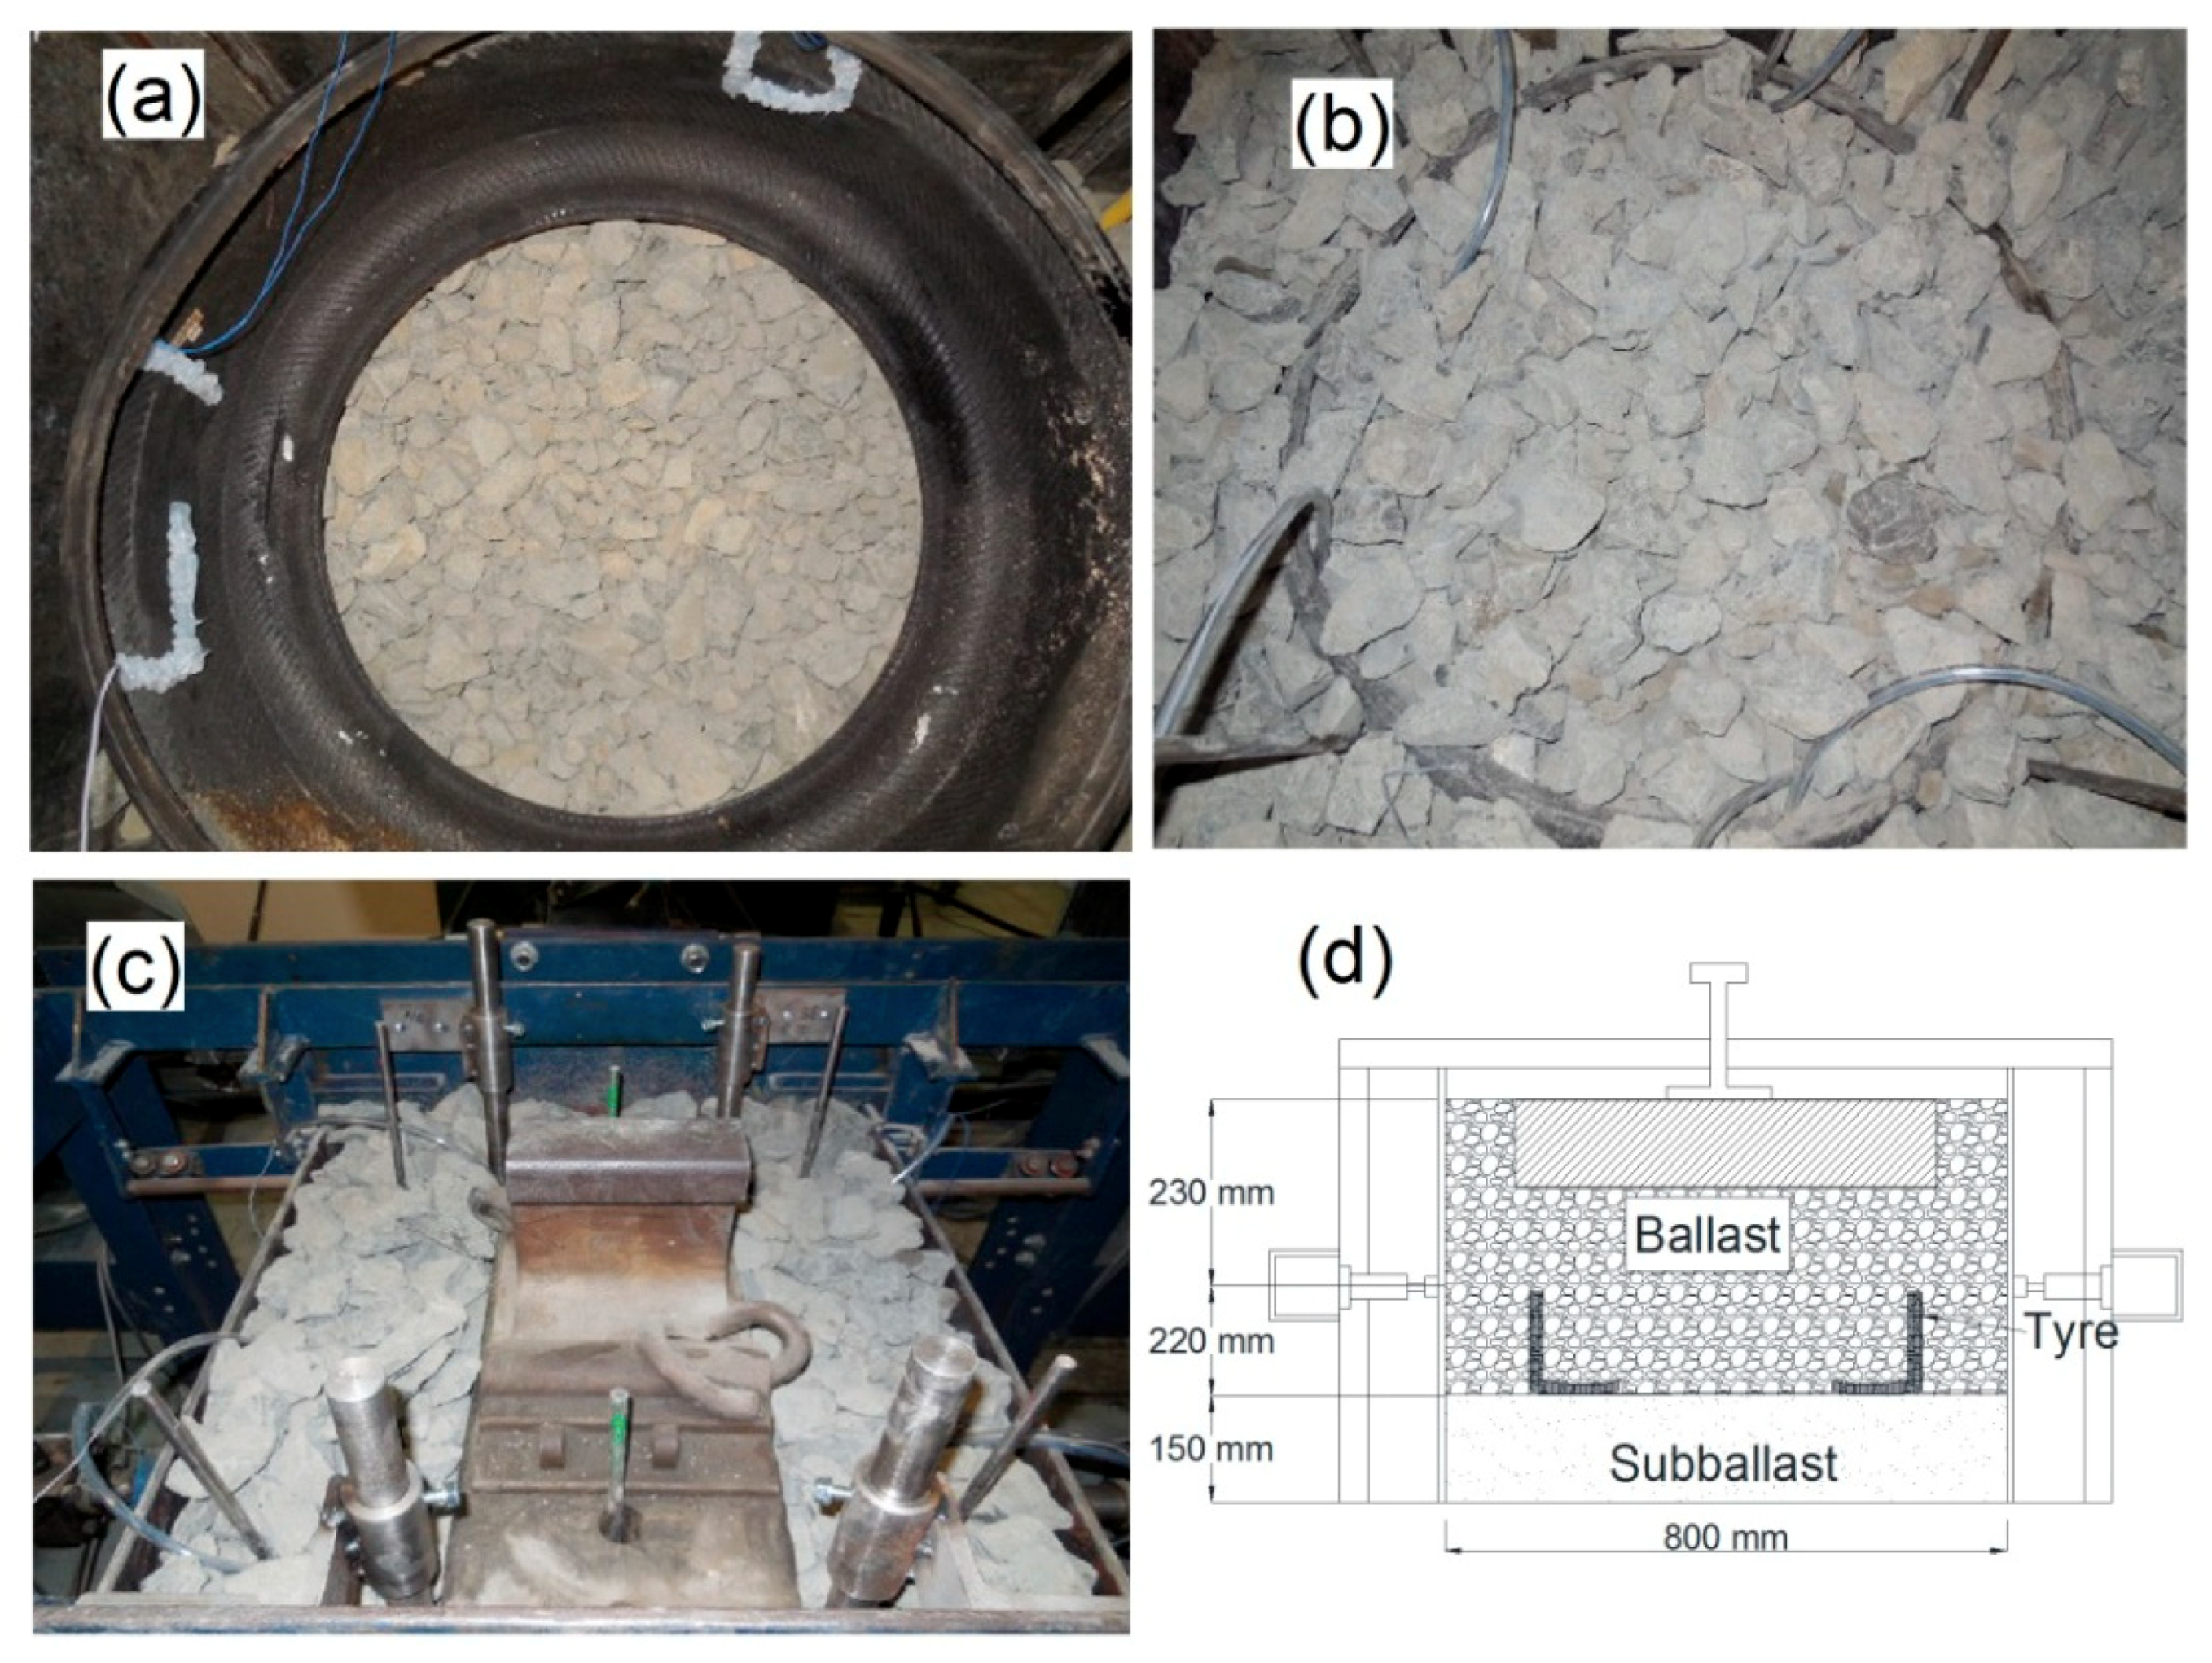
4. Finite Modelling on Tire Cell

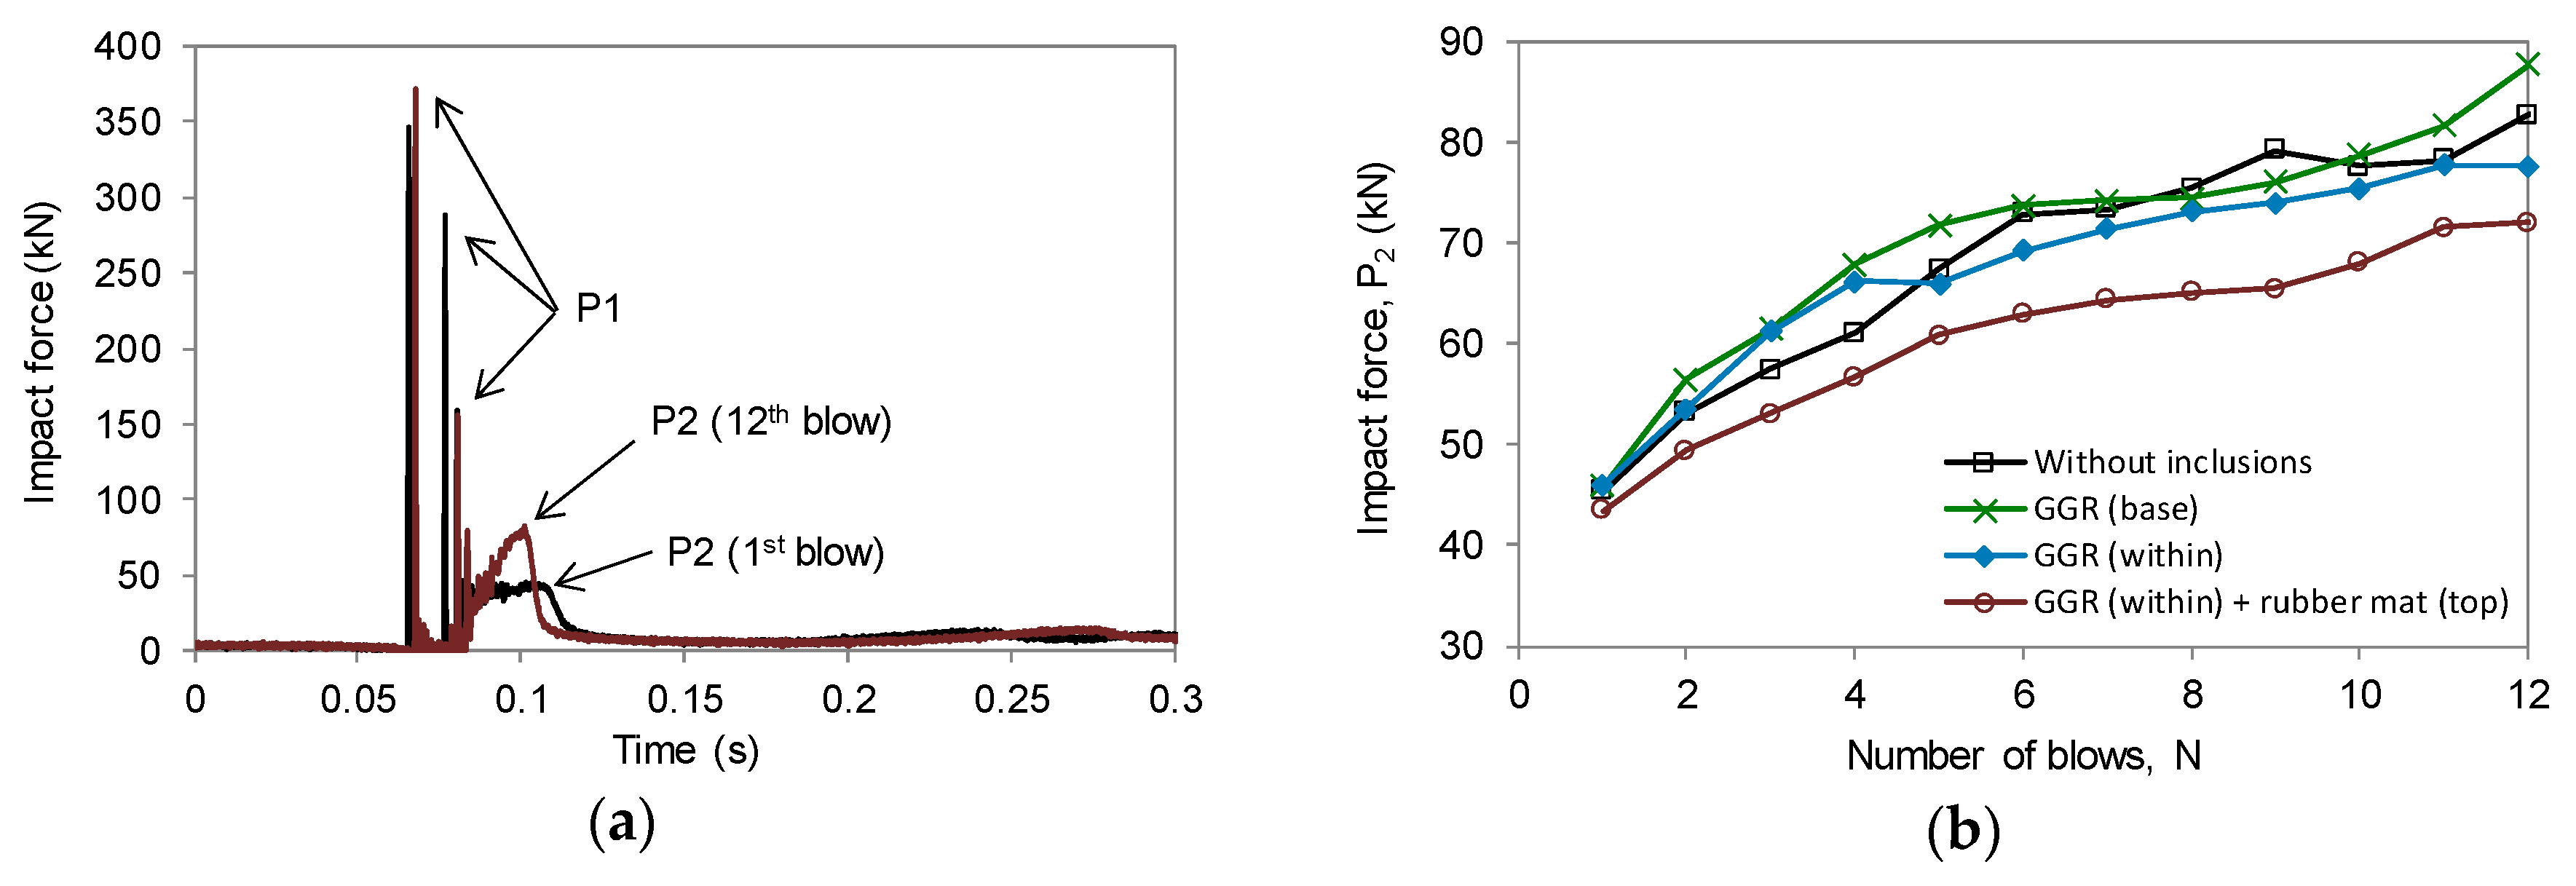
4.1. Laboratory Investigation

Waste tires have a 3D cylindrical form, so they can be used to reinforce track foundations by enhancing the bearing capacity and reducing the deformation of ballasted track embankments. Recent research at the University of Wollongong on the use of the infilled scrap tires tested them as a ‘unit cell’ in the track process simulation testing apparatus (TPSTA) designed and built in-house to simulate actual field track conditions (Figure 10). The materials tested in the laboratory consist of ballast (i.e., coarse, angular grains, size = 10–60 mm), capping (crushed basalt, size = 0.3–20mm), structural fill and a scrap tire cell. The used car tire cell (with one side wall removed) had an outside diameter of 580 mm, a rim diameter of 330 mm, and a width of 150 mm. A predetermined amount of ballast (by weight) was compacted inside the tires to a thickness of 150 mm to obtain a representative unit weight of about 15.5 kN/m3. Compaction was carried out using a hand-held vibratory hammer.
Laboratory tests were carried out at the University of Wollongong up to 500,000 load cycles to simulate heavy haul freight trains of 30-ton axle load under a frequency of f = 10 Hz. Details of these laboratory tests were presented previously by Indraratna et al. [4]. They highlight that tire reinforcement significantly reduces the deformation of ballast and also reduces lateral displacement. These experiments prove that rubber tires increase the stiffness of the sub-ballast (capping) layer by more than 50%, and moreover, the inclusion of rubber tires in the capping layer helps to reduce the stress transmitted to the subgrade. The particle size distributions of ballast samples before and after testing show there was less ballast breakage for samples with a rubber tire cell at the sub-ballast (capping) layer; this proves that the inclusion of tires could reduce the breakage of ballast aggregates given the higher energy and dissipation capacity of a composite system, it also improves overall track stability and longevity.

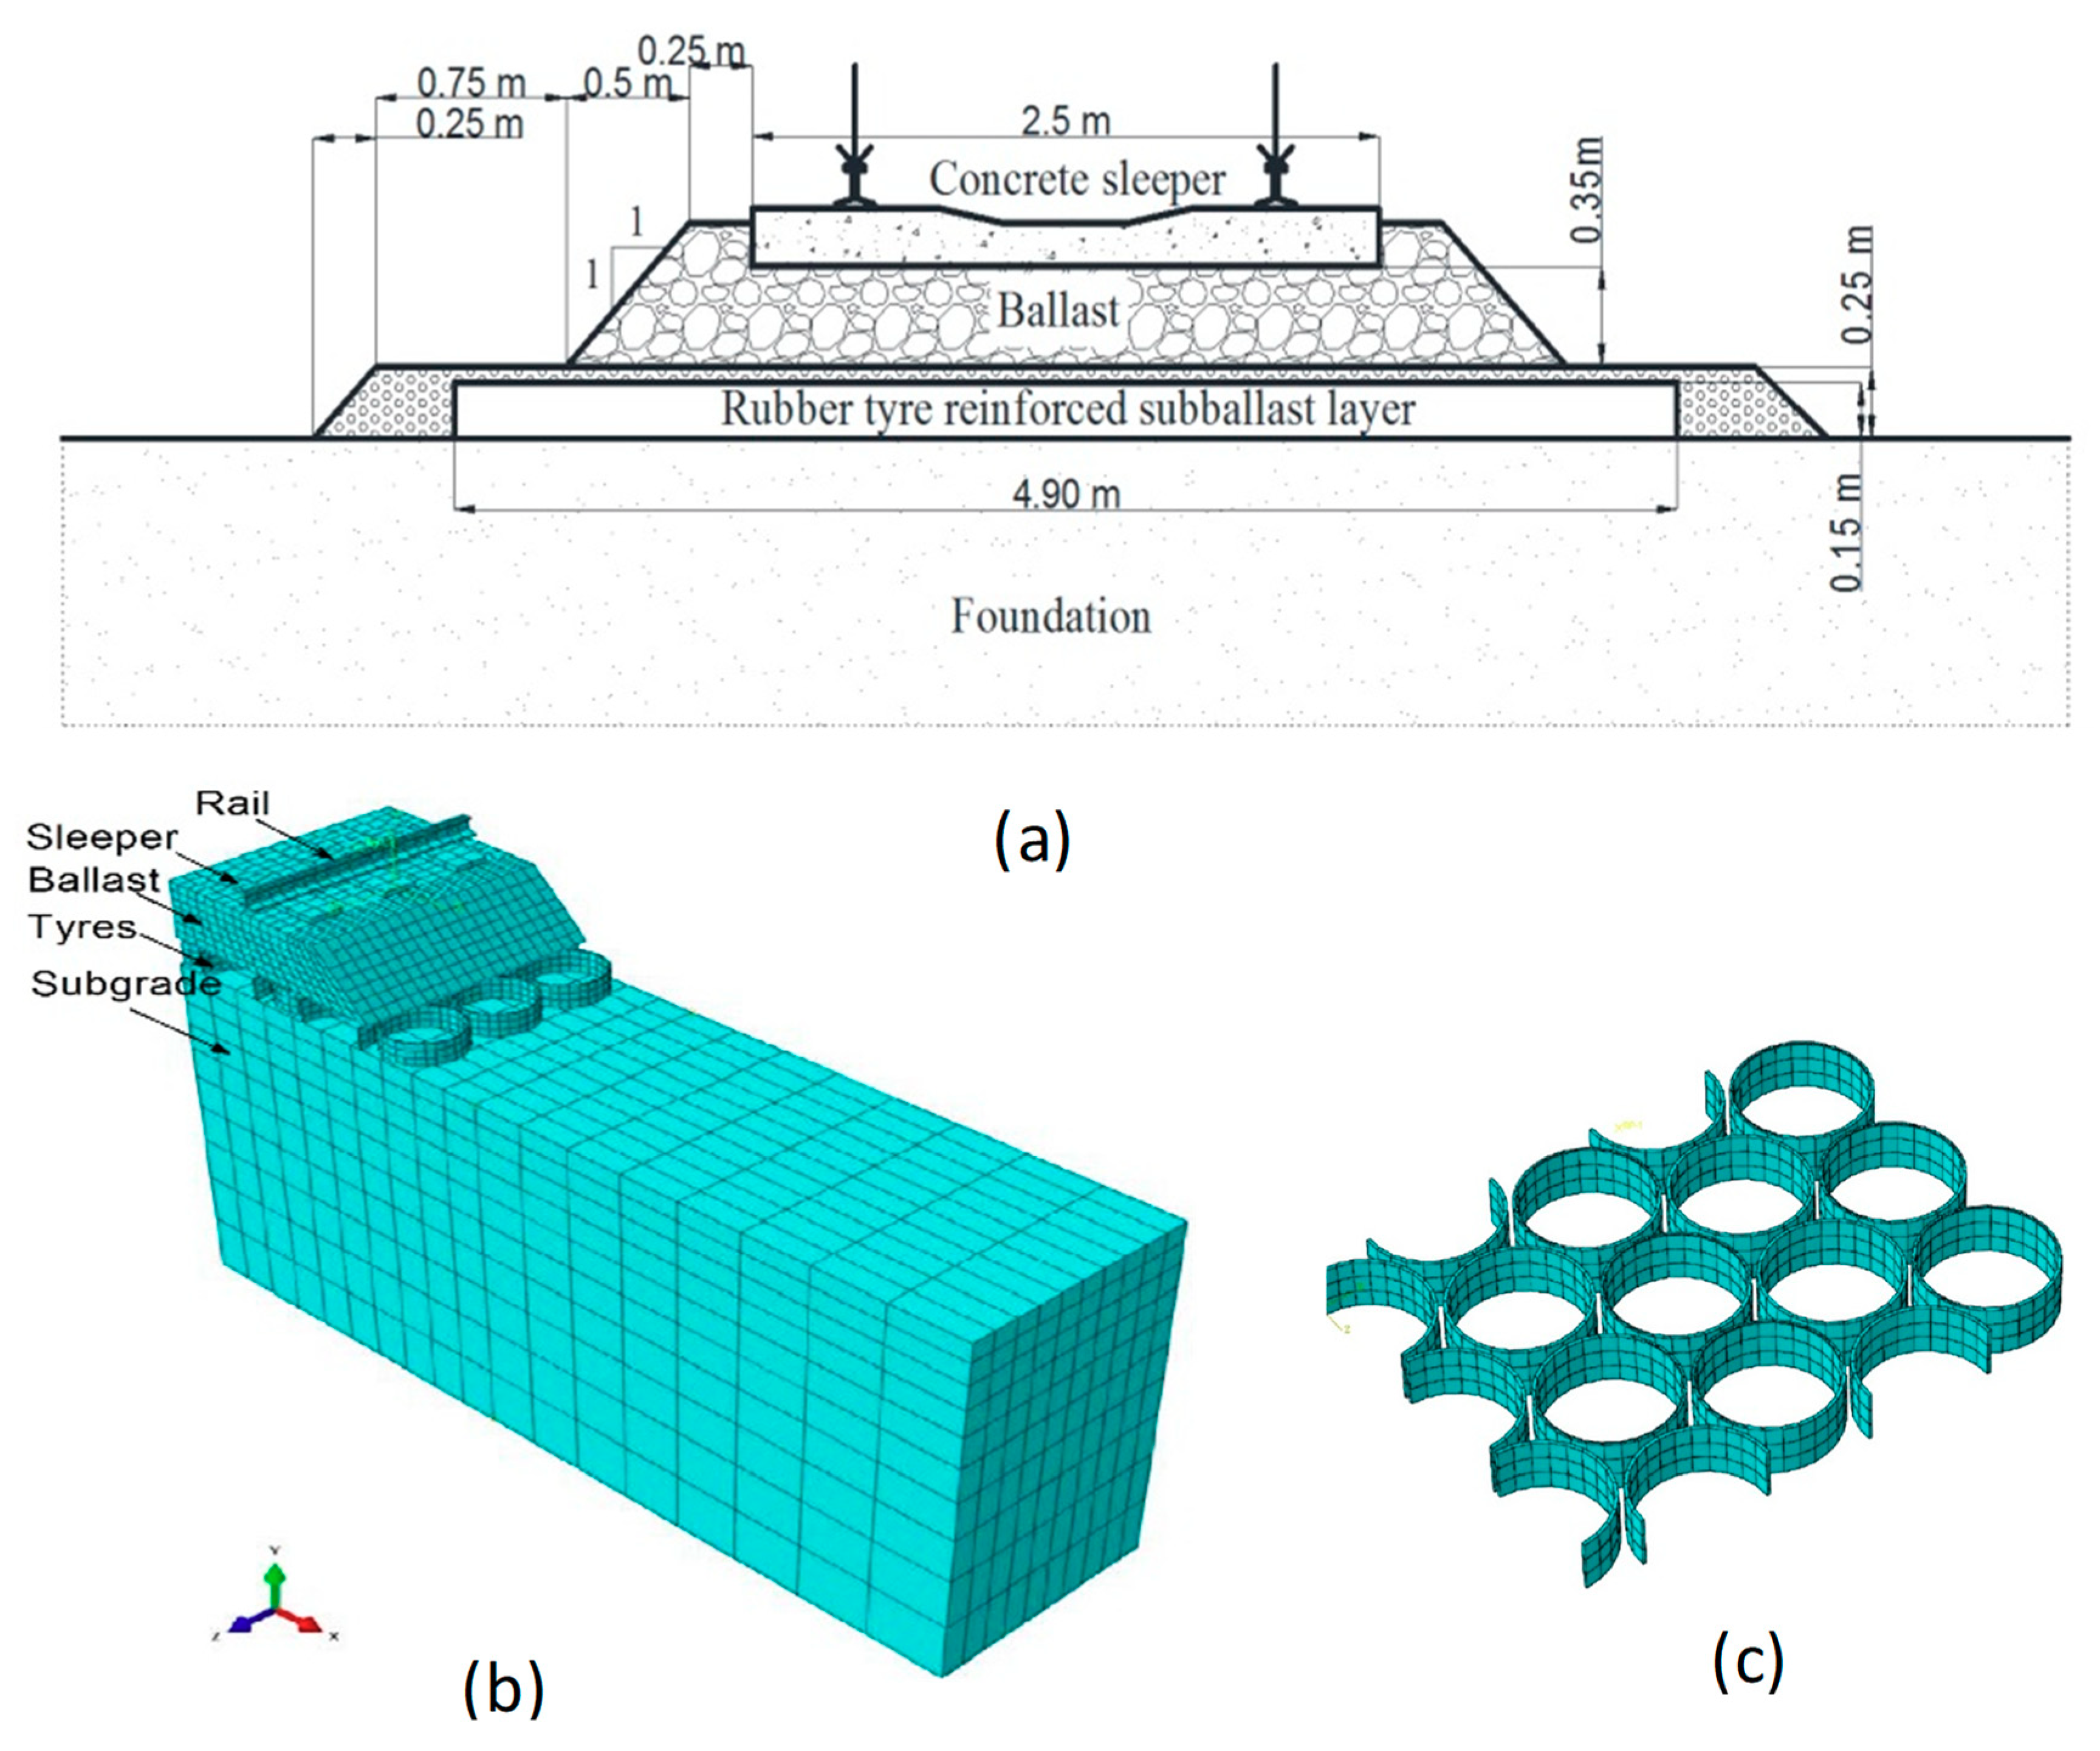
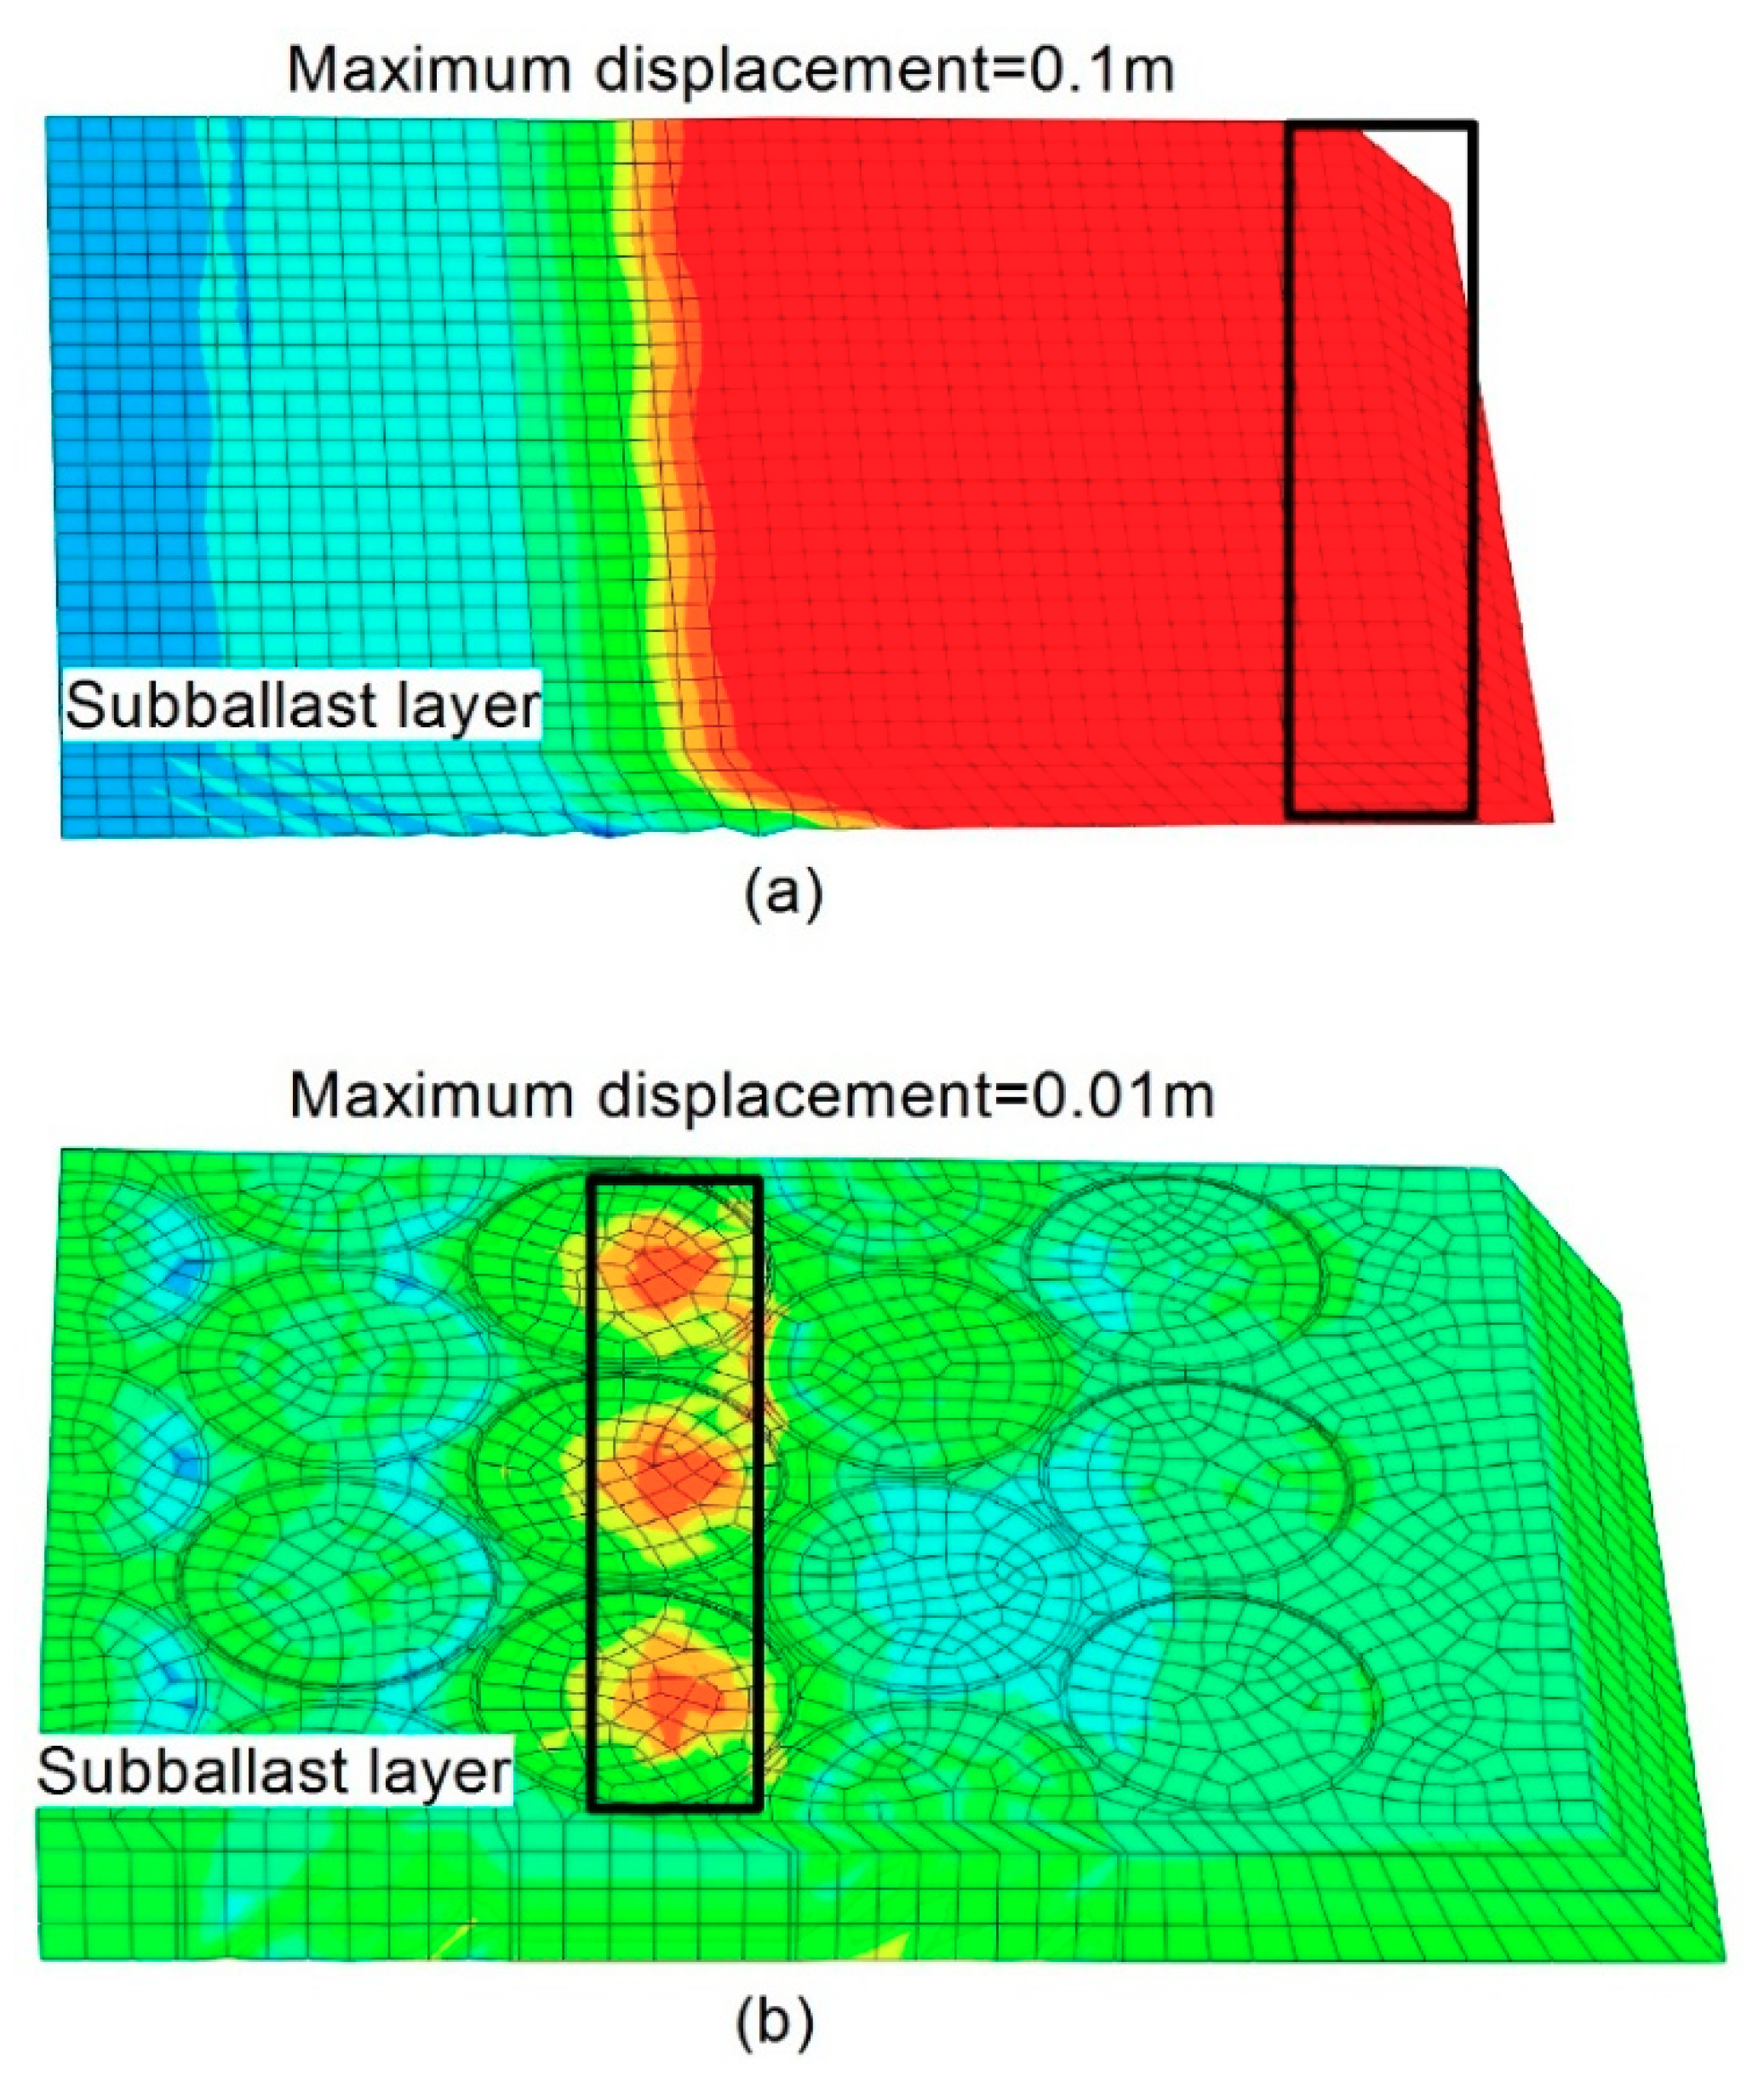
4.2. Finite Element Modelling for Recycled Tire-Reinforced Capping Layer

Finite element modelling (FEM) is used to simulate the role that recycled tires have on load and deformation of a capping layer containing infilled tires. A schematic cross-section of a typical ballasted track embankment is shown in Figure 11a. A 3D FEM mesh to simulate a track embankment with recycled tires in the capping layer is shown in Figure 11b, where simulated waste tires are shown in Figure 11c. Steel rails are supported by reinforced concrete sleepers spaced at 600 mm centers, and these sleepers are placed directly onto the ballast layer. A typical car tire of 560 mm in diameter by 10 mm thick is simulated, as is the geometry of the sub-structure layers of track shown in Figure 11b. The ballast, capping and subgrade are considered to be linearly elastic-perfectly plastic materials by adopting the Mohr-Coulomb failure criteria. The rubber tires are simulated as cylinders having the same thickness as those tested in the laboratory. The rails and sleepers are modelled as linear elastic materials that are much stiffer than the ballast, subgrade and rubber tires. The ballasted track and foundation are discretized by a mesh that consists of 8-noded hexahedral elements with reduced integration points (C3D8R). The input parameters adopted for the FEM model are presented in Table 5 [4].
Figure 12 shows the contours of lateral displacement that occur in a sub-ballast (capping) layer with and without recycled tires. A comparison of these contours shows that the maximum lateral displacement of unreinforced sub-ballast (100 mm) is greater than reinforced sub-ballast (10 mm) under similar loadings. It is believed that this additional confinement stiffens the infill-tires composite system and makes it a more flexible mattress that enables a smaller and more uniform stress to be transmitted to the underlying subgrade; as a result there is less lateral deformation. Track design is based mainly on controlling the traffic and load-induced stresses on the subgrade to levels that will prevent the subgrade from progressive shear failure and excessive plastic (irrecoverable) deformation [3]. To maintain track profiles, the lateral displacement of ballast must be kept within certain limits. Previous studies at UOW [37] indicated that there was an optimum range of confining pressures which minimized ballast breakage. This range was between 15 and 65 kPa for deviator stresses of 230 kPa, but it could increase to 50–140 kPa when the deviatoric stress had increased to 750 kPa. The minimum confining pressure needed to reduce dilation and particle breakage was around 40–50 kPa; current Australian tracks have confining pressures of less than about 25 kPa, and this may lead to excessive dilation to initiate track instability.

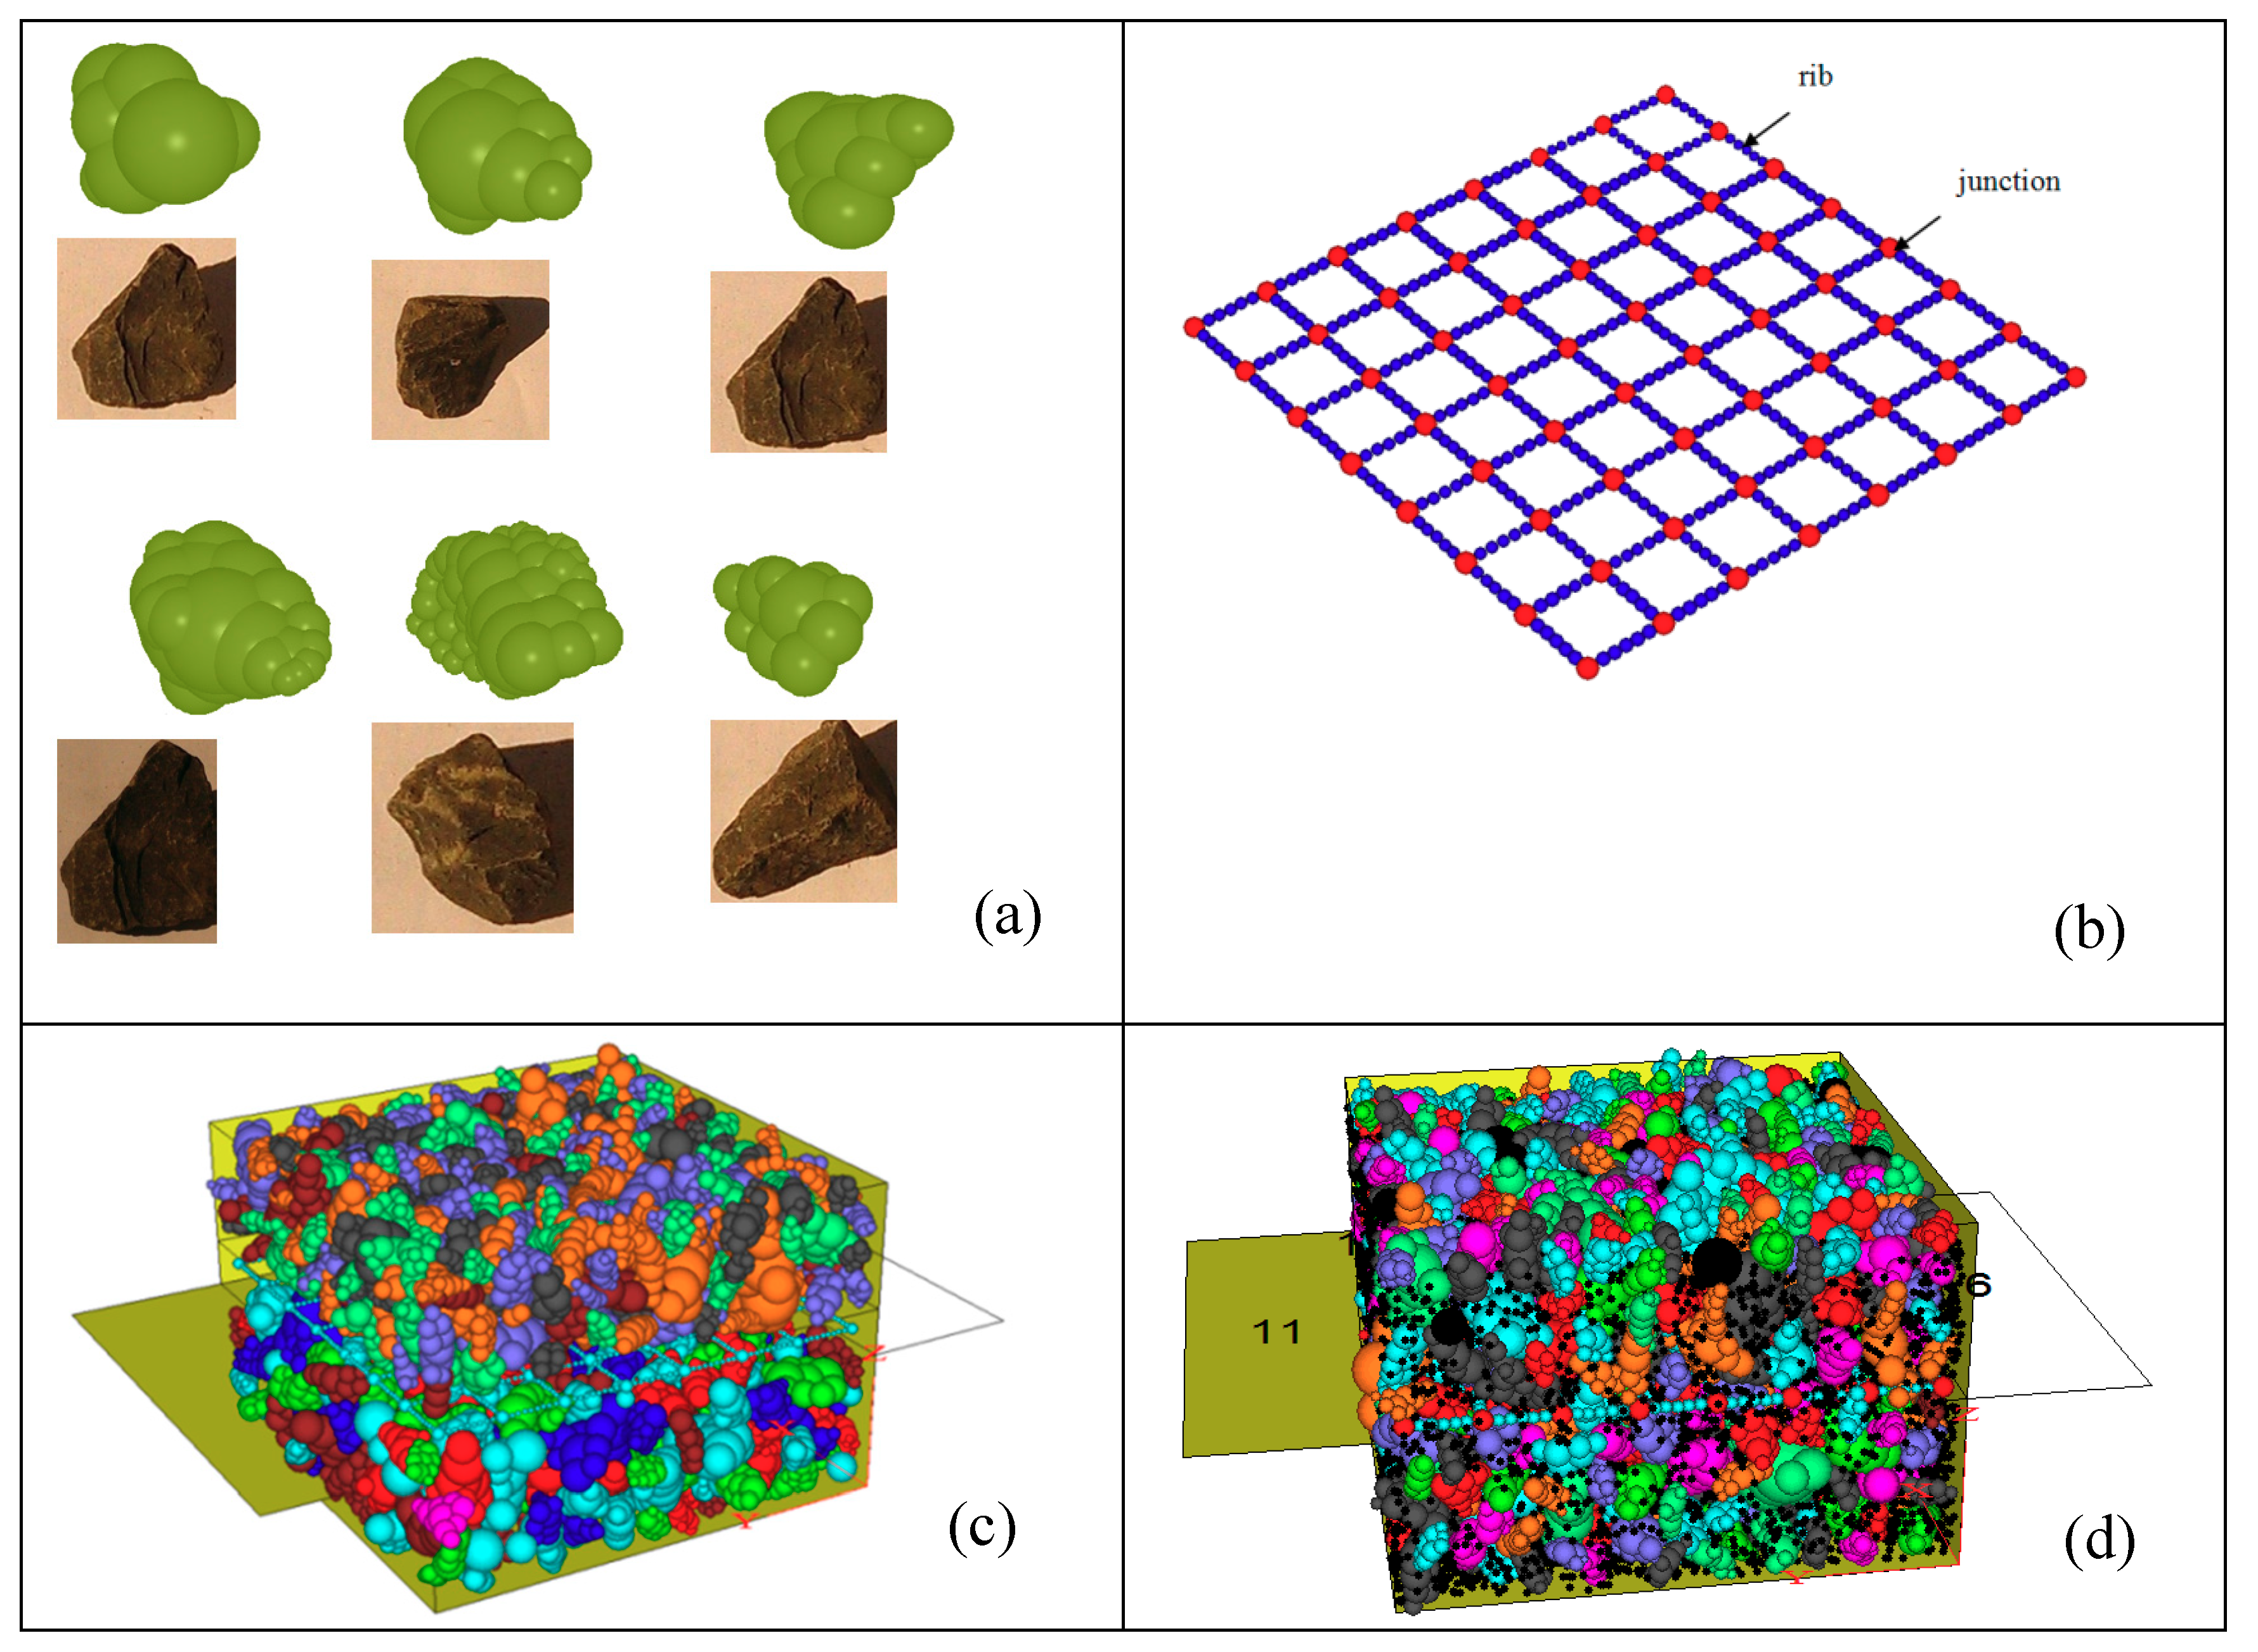
5. DEM Modelling for Geogrid-Reinforced Ballast

The discrete element method (DEM) first introduced by Cundall and Strack [53] is commonly used to study the micro-mechanical behavior of granular assemblies. Unlike the continuum approach (e.g., finite element method—FEM), DEM can simulate discrete particles having irregular shapes, and different sizes and varied angularity, and it can capture particle breakages that are unlikely to be modelled by the FEM approach [54,55,56,57]. DEM treats the interactions of discrete grains as dynamic processes by considering the balance of internal forces. The calculations executed in DEM adopt Newton’s second law for particles to particles and the force-displacement law at the contacts [33,58]. The force-displacement law derives the contact force acting on two particles in contact to the relative displacement between them [59]. If grain B with a radius R [ B ] is in contact with grain A with radius R [ A ] (Figure 13), or in contact with walls, the particle penetration depth (overlapping) ( U n ) can be calculated from:
U n = { R [ A ] + R [ B ] d , ( particles   to   particles ) R [ B ] d , ( particles   to   walls )
where, d : distance between the particle to particle centres, determined as:
d = | x i [ B ] x i [ A ] | = ( x i [ B ] x i [ A ] ) ( x i [ B ] x i [ A ] )
The location of the contact point is defined by:
x i [ C ] = { x i [ A ] + ( R [ A ] 1 2 U n ) n i ( particles   to   particles ) x i [ B ] + ( R [ B ] 1 2 U n ) n i ( particles   to   walls )
where, n i : unit vector and can be determined by:
n i = x i [ B ] x i [ A ] d
At a given time, the force vector F that represents the interaction between the two particles is resolved into normal ( F N ) and shear component ( F T ) with respect to the contact plane:
F N = K N U n
δ F T = K T · δ U s
where, K N and K T are the normal and shear stiffness at the contact, δ U s is the incremental shear displacement, and δ F T is the incremental shear force. The new shear contact force is determined by summing the old shear force existing at the start of the time-step with the shear elastic force increment:
F T F T + δ F T μ   F N
where μ is the coefficient of friction.

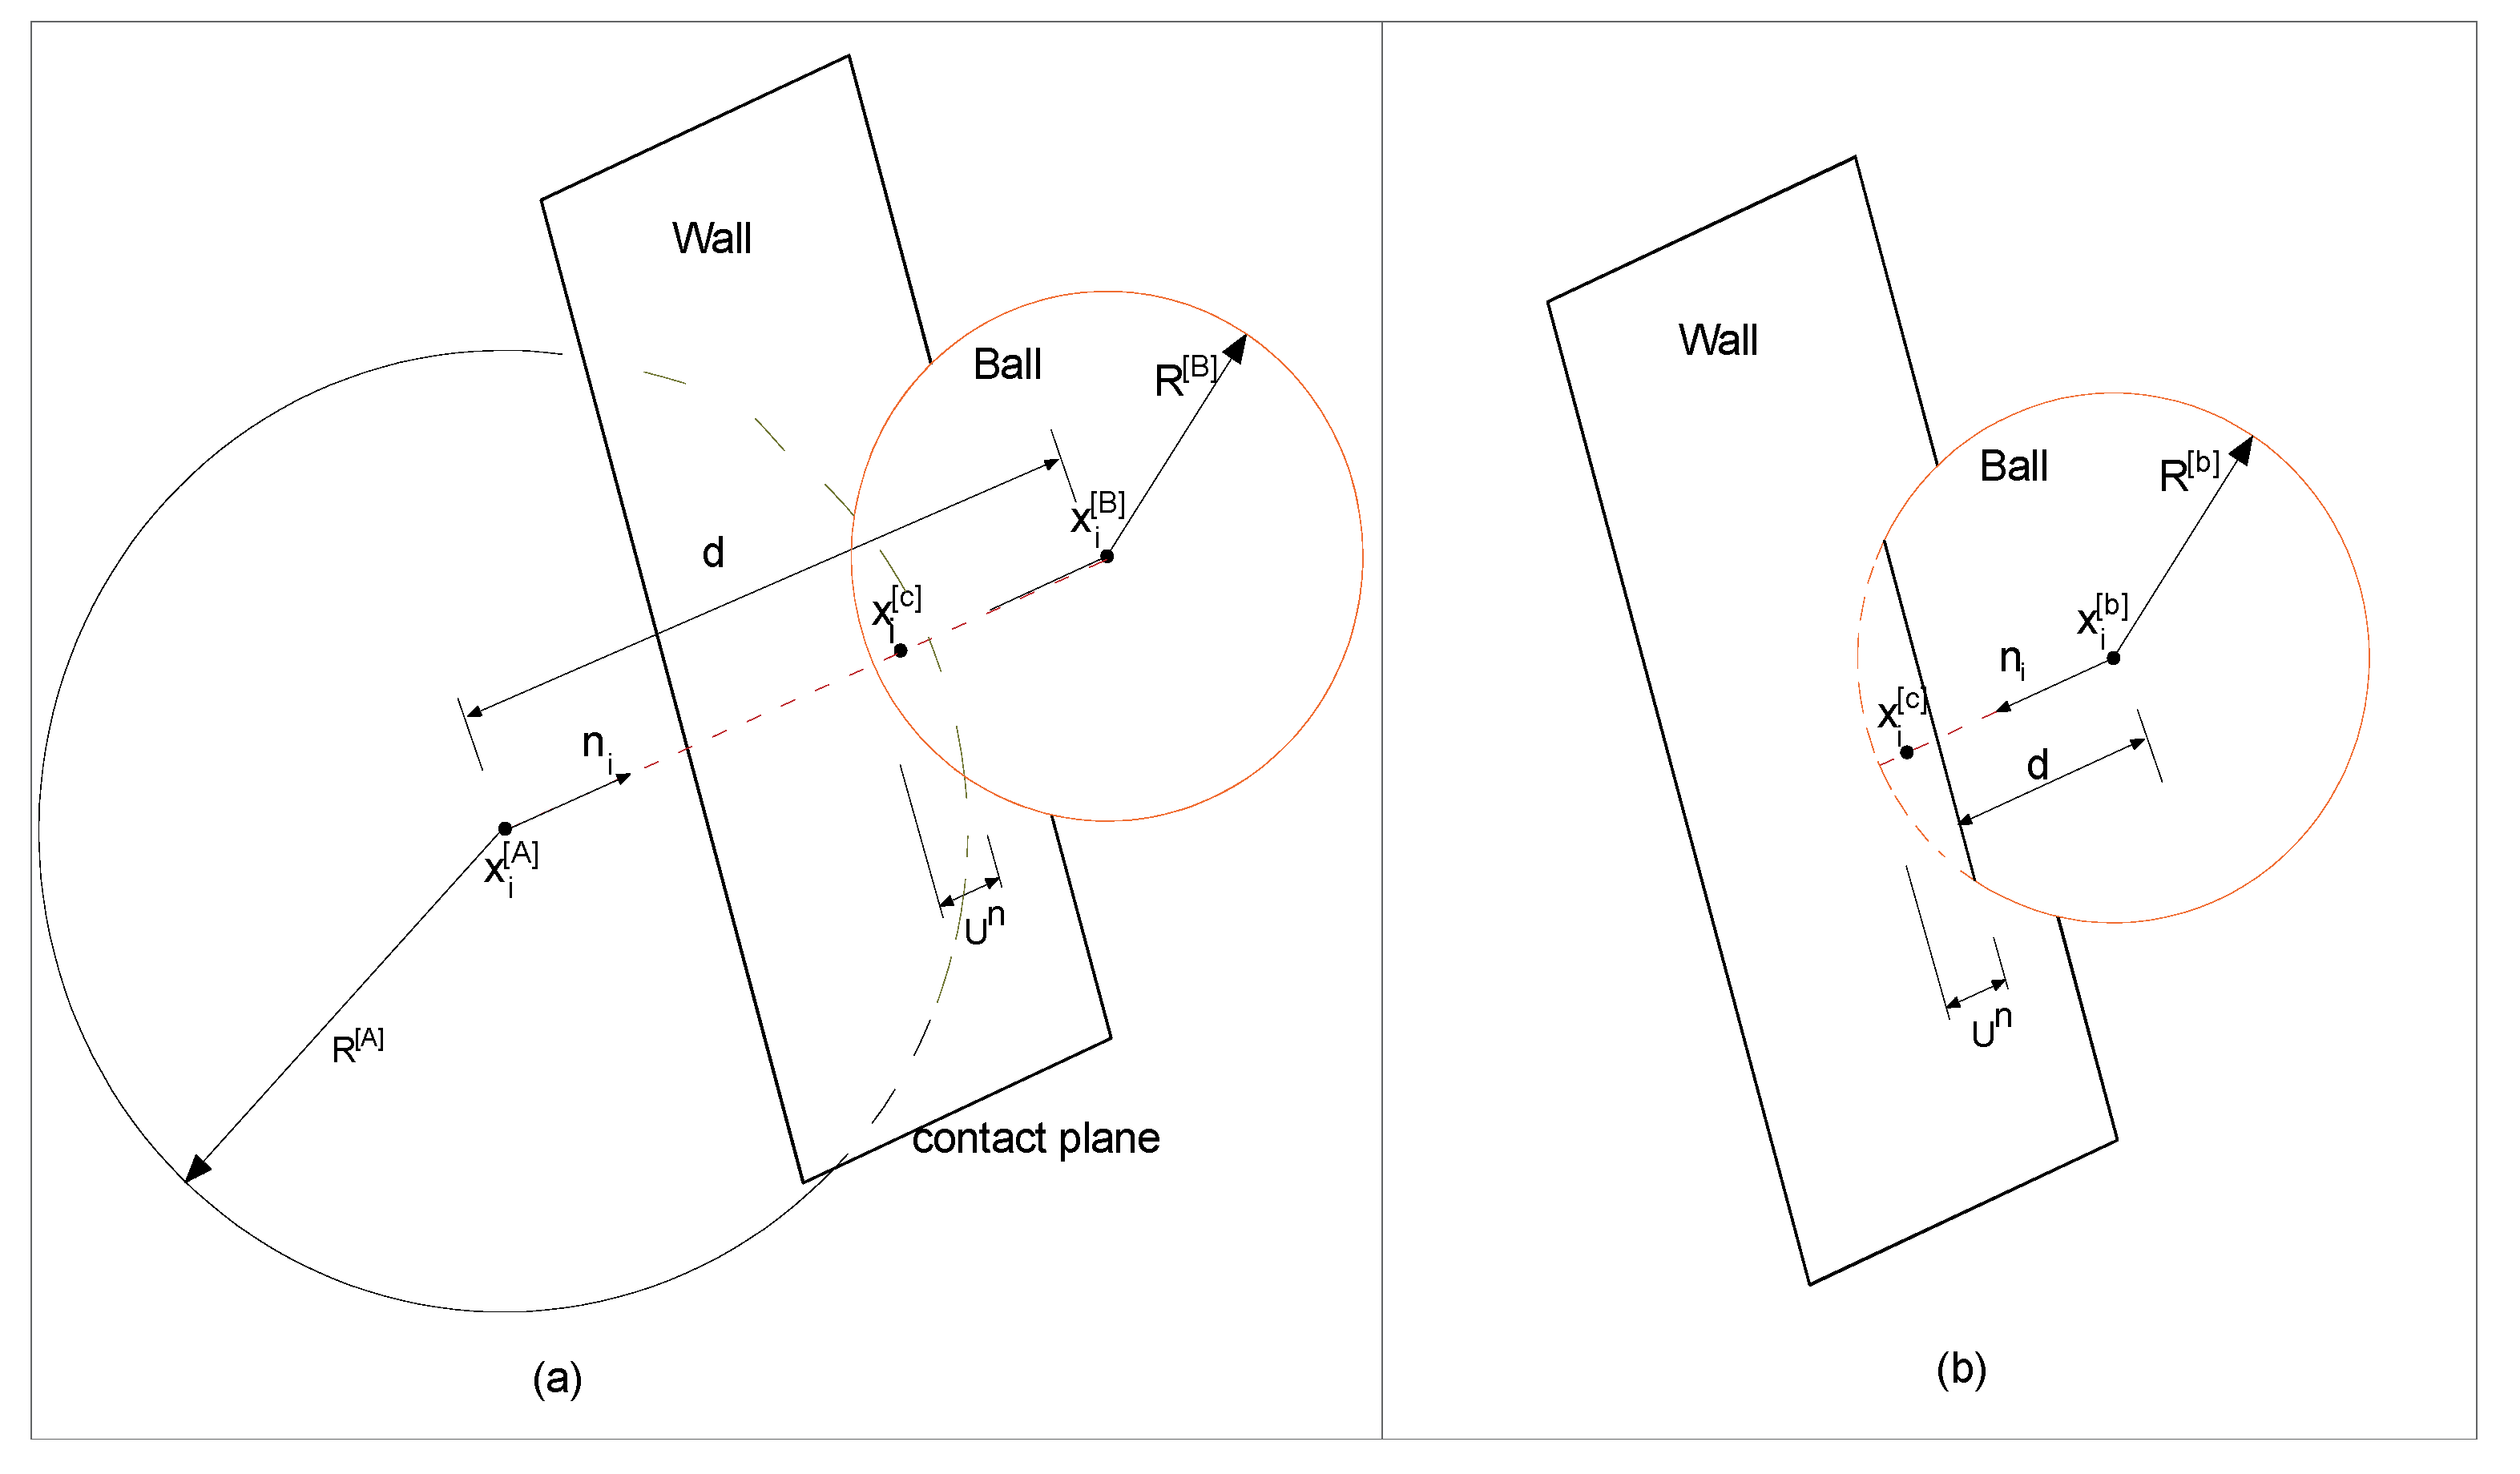
5.1. DEM Modelling of Geogrid-Reinforced Ballast

Figure 14 illustrates how the discrete element method is used to model geogrid-stabilized ballast aggregates in direct shear tests. The dimensions in this simulated model are the same as the laboratory test (300 mm long × 300 mm wide × 200 mm high). Ballast grains of various shapes and sizes are simulated by bonding many spherical balls together at suitable sizes and locations to represent actual ballast angularity and shape (Figure 14a). A biaxial geogrid (40 mm × 40 mm) is simulated by connecting small balls together (2 mm diameter at the ribs and 4 mm diameter at the junctions) to replicate the geogrid tested in the laboratory (Figure 14b). Simulated large-scale direct shear tests for fresh and fouled ballast (VCI = 40%) are presented in Figure 14c,d, respectively. The micro-mechanical input parameters selected to model the ballast, geogrid, and fouling agents are listed in Table 6 [56]. To quantify the level of fouling, the void contaminant index (VCI) introduced earlier by Tennakoon et al. [6], which considers the specific gravity of the fouling material used:
V C I = 1 + e f e b × G s b G s f × M f M b × 100  
where e f : void ratio of coal fines, e b : void ratio of fresh ballast,   M f : dry weight of fouling agent, M b : weight of fresh ballast; G s b : specific gravity of ballast, G s f : specific gravity of fouling agent.
DEM simulations of direct shear tests are carried out under normal stresses of σn = 27, 51, and 75 kPa. Figure 15 compares the shear stress-strain response of geogrid-stabilized ballast predicted by the DEM model with those measured in the laboratory, noting that the predicted data matches the experimental results of fresh and fouled ballast. The strain softening behavior and volumetric expansion under shearing are captured and indicate that the higher the normal stress (σn), the greater the shear strength and the smaller the dilation [60]. The ability of geogrid to increase the shear strength of ballast can be quantified by comparing the shear strengths of reinforced and unreinforced ballast; this is mainly due to the interlocking effects between the ballast grains and the geogrid.

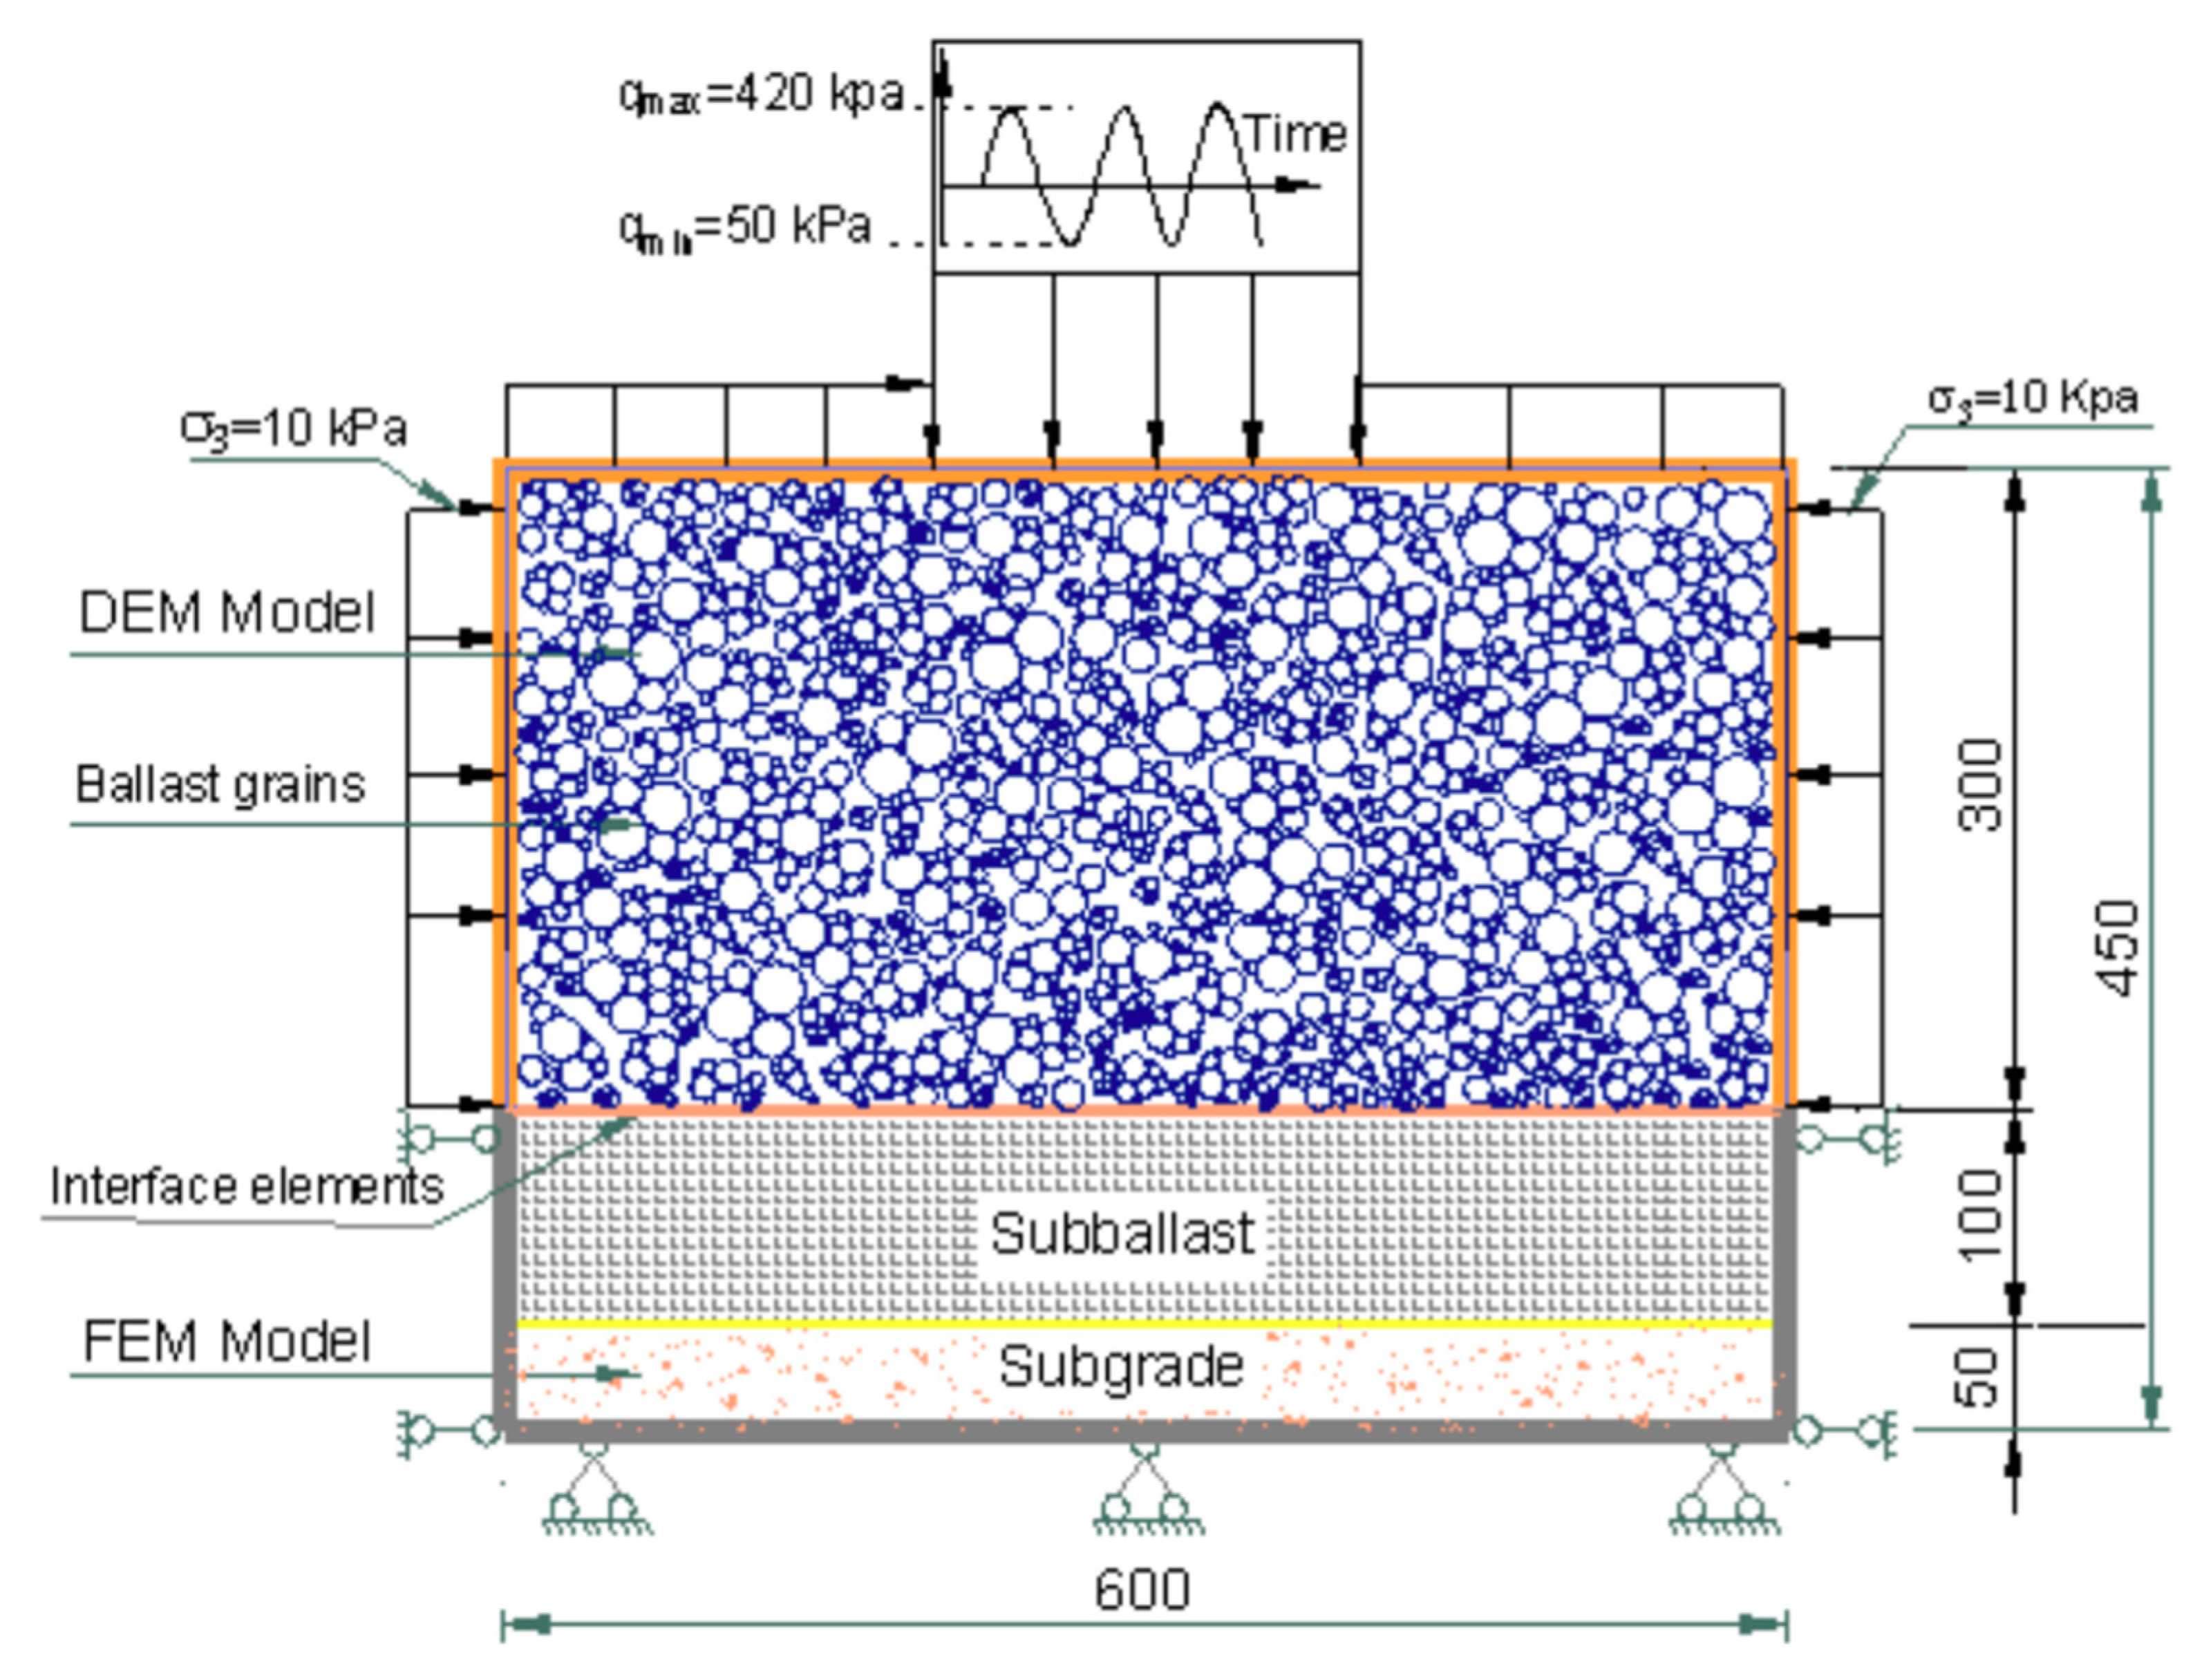
5.2. Coupled Discrete-Continuum Modelling

The excessive computational costs associated with simulating an assembly involving a large number of particles may limit the application of DEM to practical problems. For example, Ngo et al. [31] simulated a typical laboratory test on fouled ballast and it took almost 500 h (using a high performance computer) to complete the simulations for large-scale direct shear tests. Given the exceedingly high computational time required to solve a practical geotechnical problem in DEM, it is better to develop a combined discrete-continuum approach to fully utilize the advantages of the discrete and continuum modelling approaches and to mitigate their respective drawbacks.
A coupled DEM-FEM model is introduced in this study to take advantage of each modelling scheme and provide a viable approach to model ballasted track embankments. It is noted that the coupled DEM-FEM was carried out in plane strain condition to simulate a long straight section of track where longitudinal strains (parallel to rails) is minimal. Also, 2D plane strain analysis reduces the computational time considerable. DEM is used to simulate ballast aggregates where the shape and size of realistic ballast grains and procedures to simulate them in DEM are adopted from Indraratna et al. [61], and where groups of bonded circular grains are used to simulate irregularly shaped ballast grains. The amount of broken bonds (dis-connected) within a group represents ballast breakage. The continuum method (FEM) is used to model the subgrade and a 150 mm thick capping layer to mimic a capping formation in the field (Figure 16). Principally, a combination of DEM and FEM can be applied at the ballast-capping interface by: (i) treating the finite element nodal displacements as boundary conditions (i.e., applied wall velocities) for the discrete elements, and (ii) applying the forces acting on the discrete elements as the force boundary conditions of the finite element grids. A mathematical framework to combine DEM and FEM to numerically model ballast-subgrade interaction by considering various subgrade stiffness and cyclic loading conditions has already been presented by Ngo et al. [62]. The results of the load-deformation responses of ballast measured in the laboratory are used to calibrate the combined DEM-FEM model.

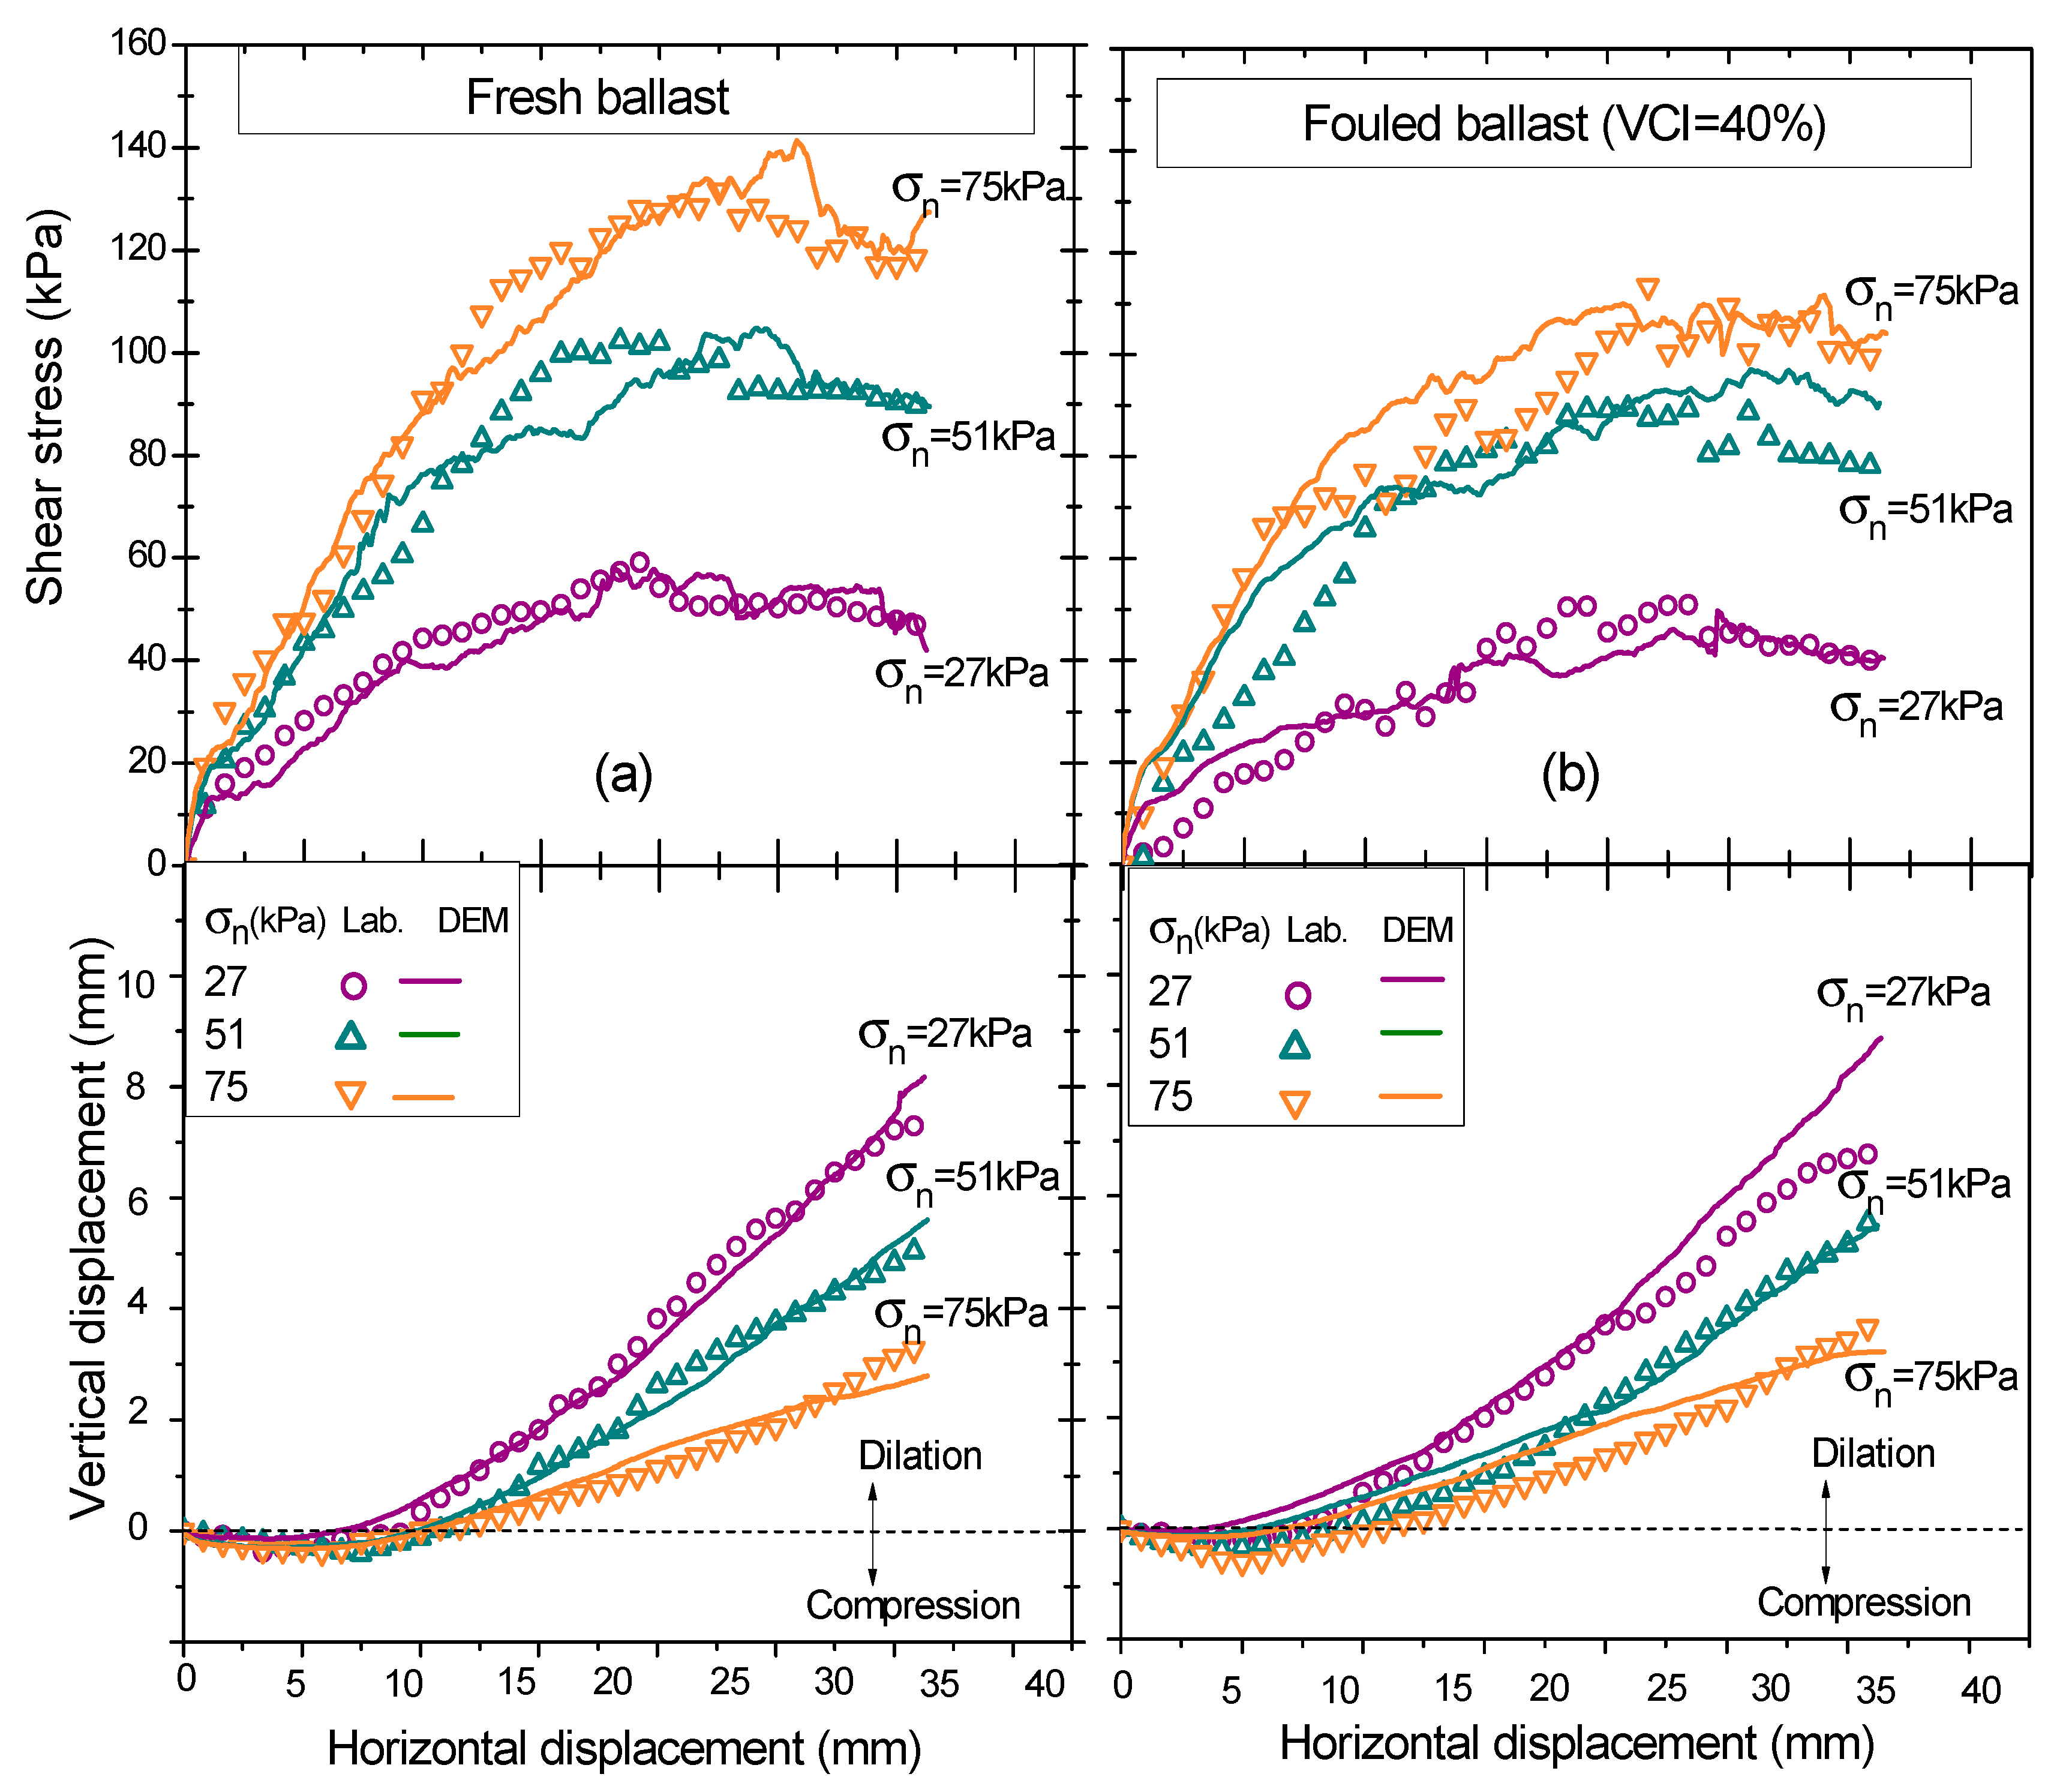
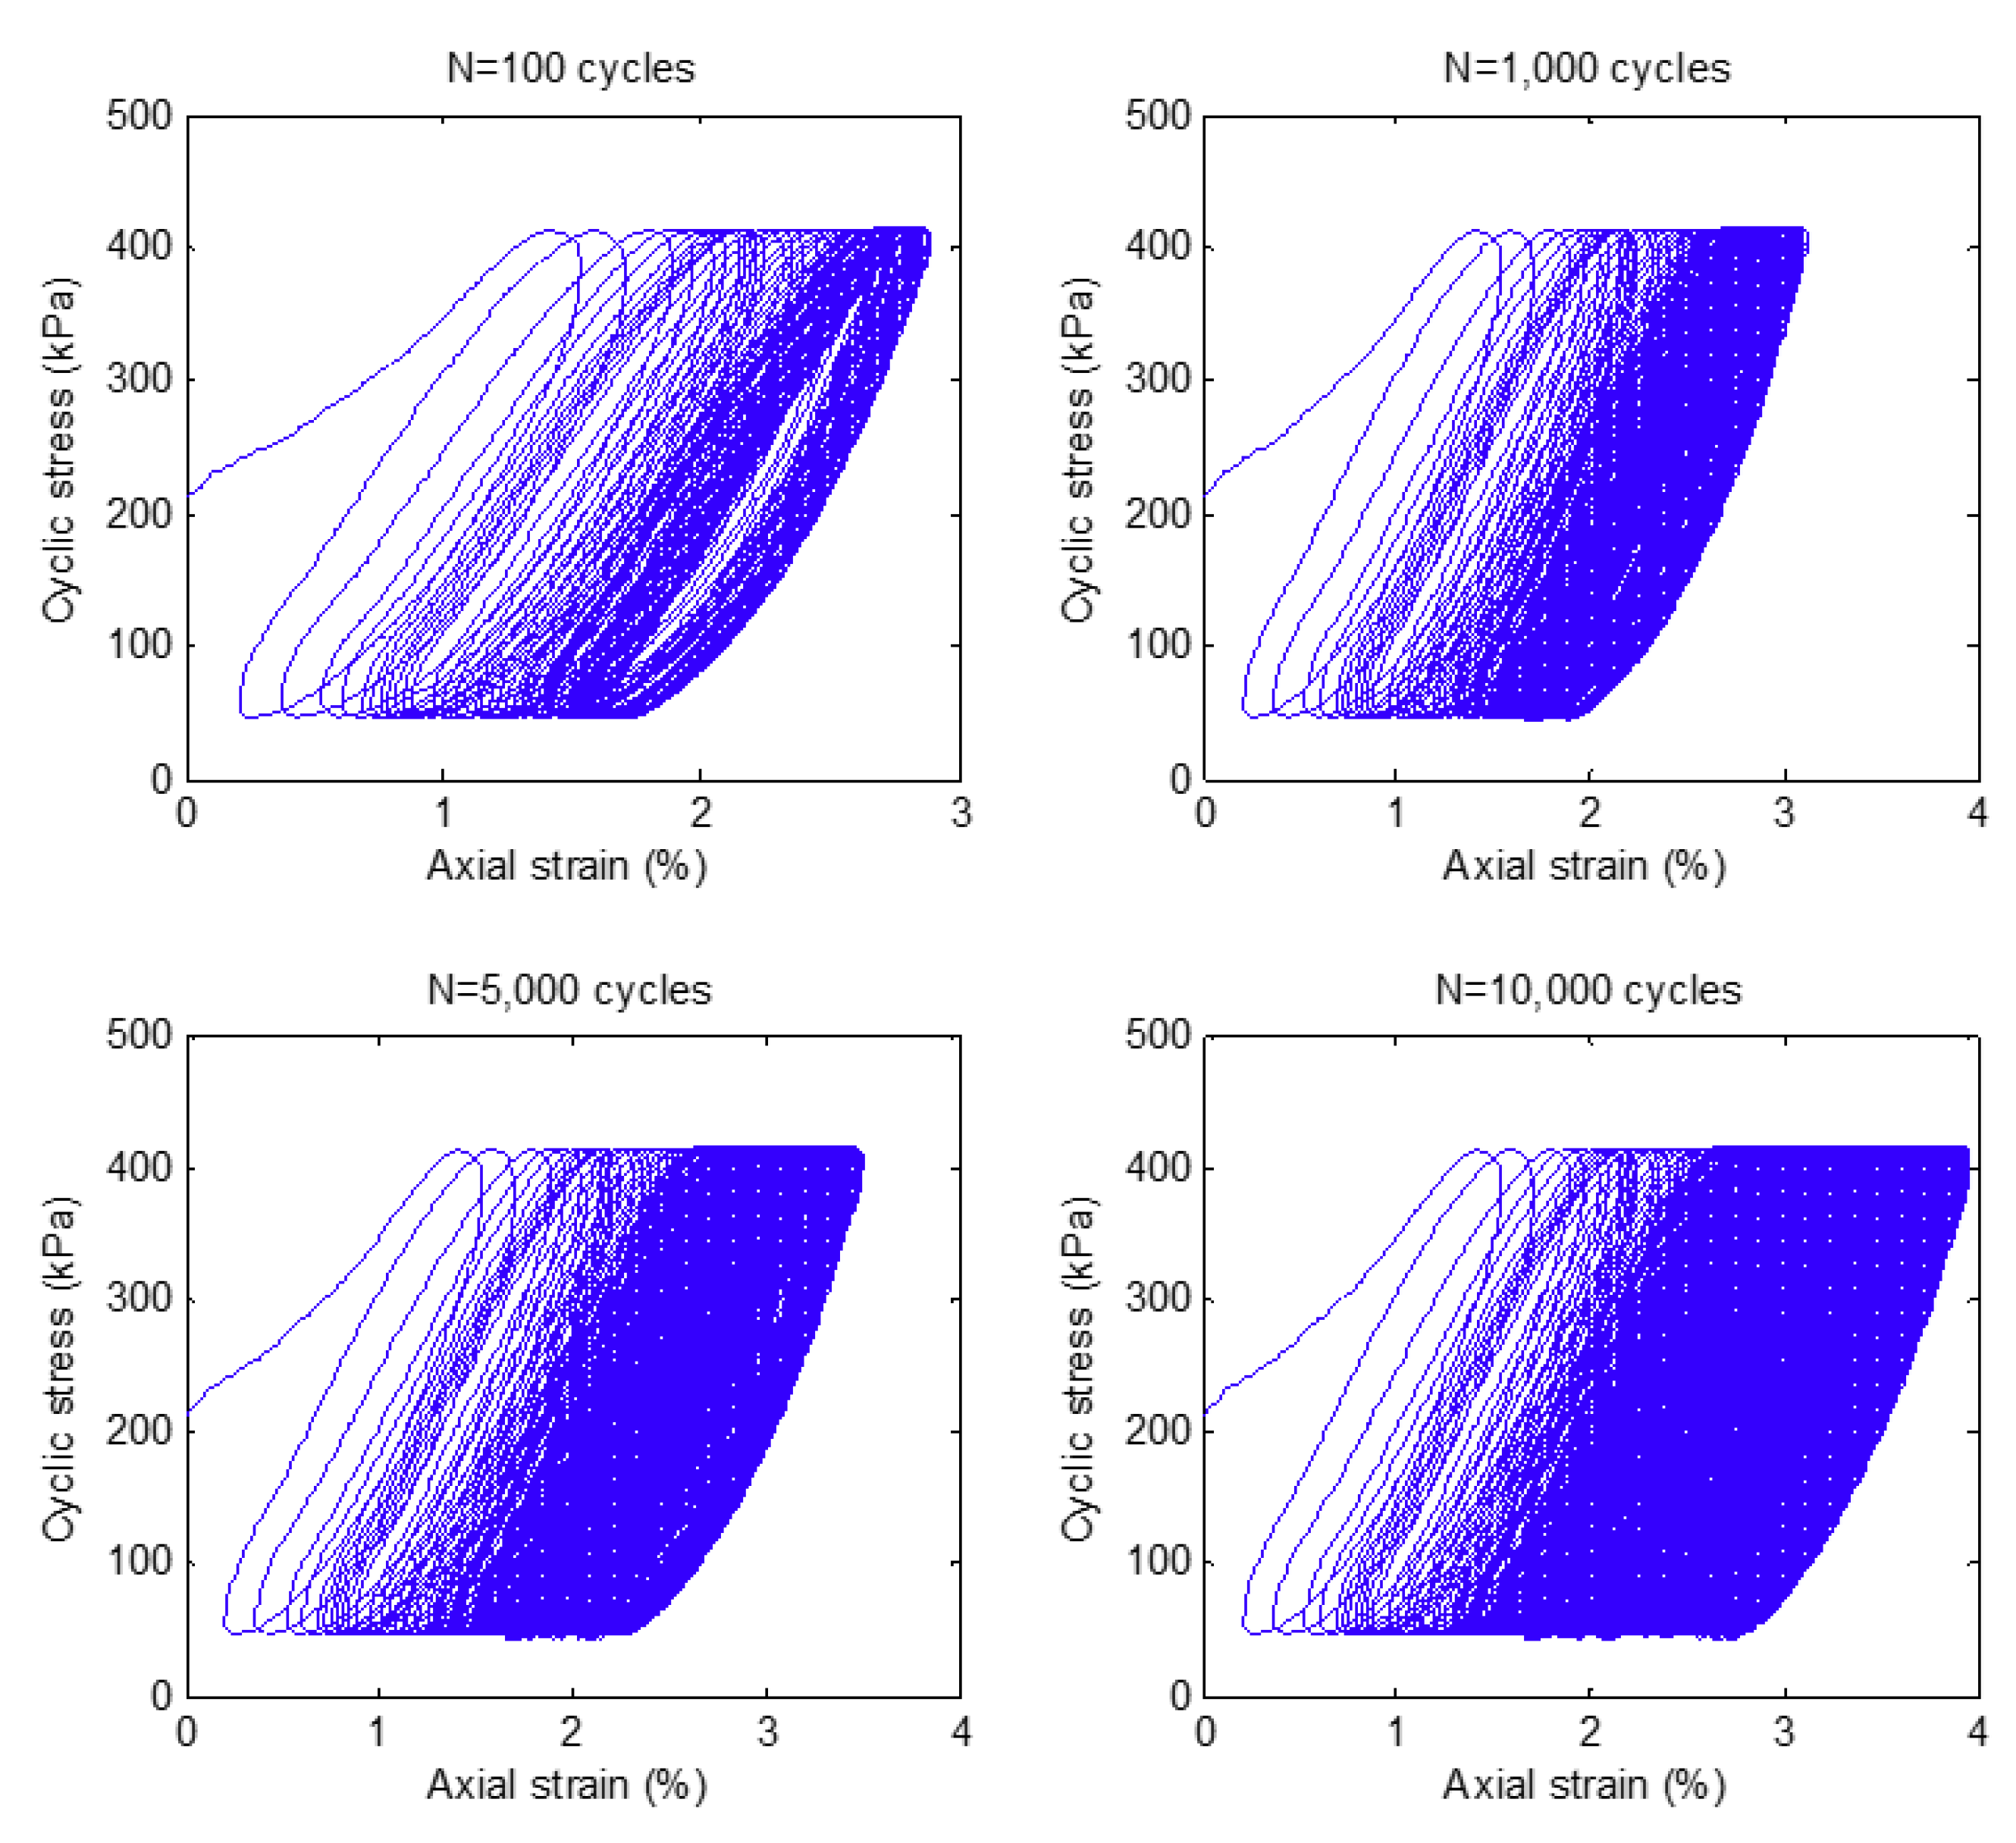
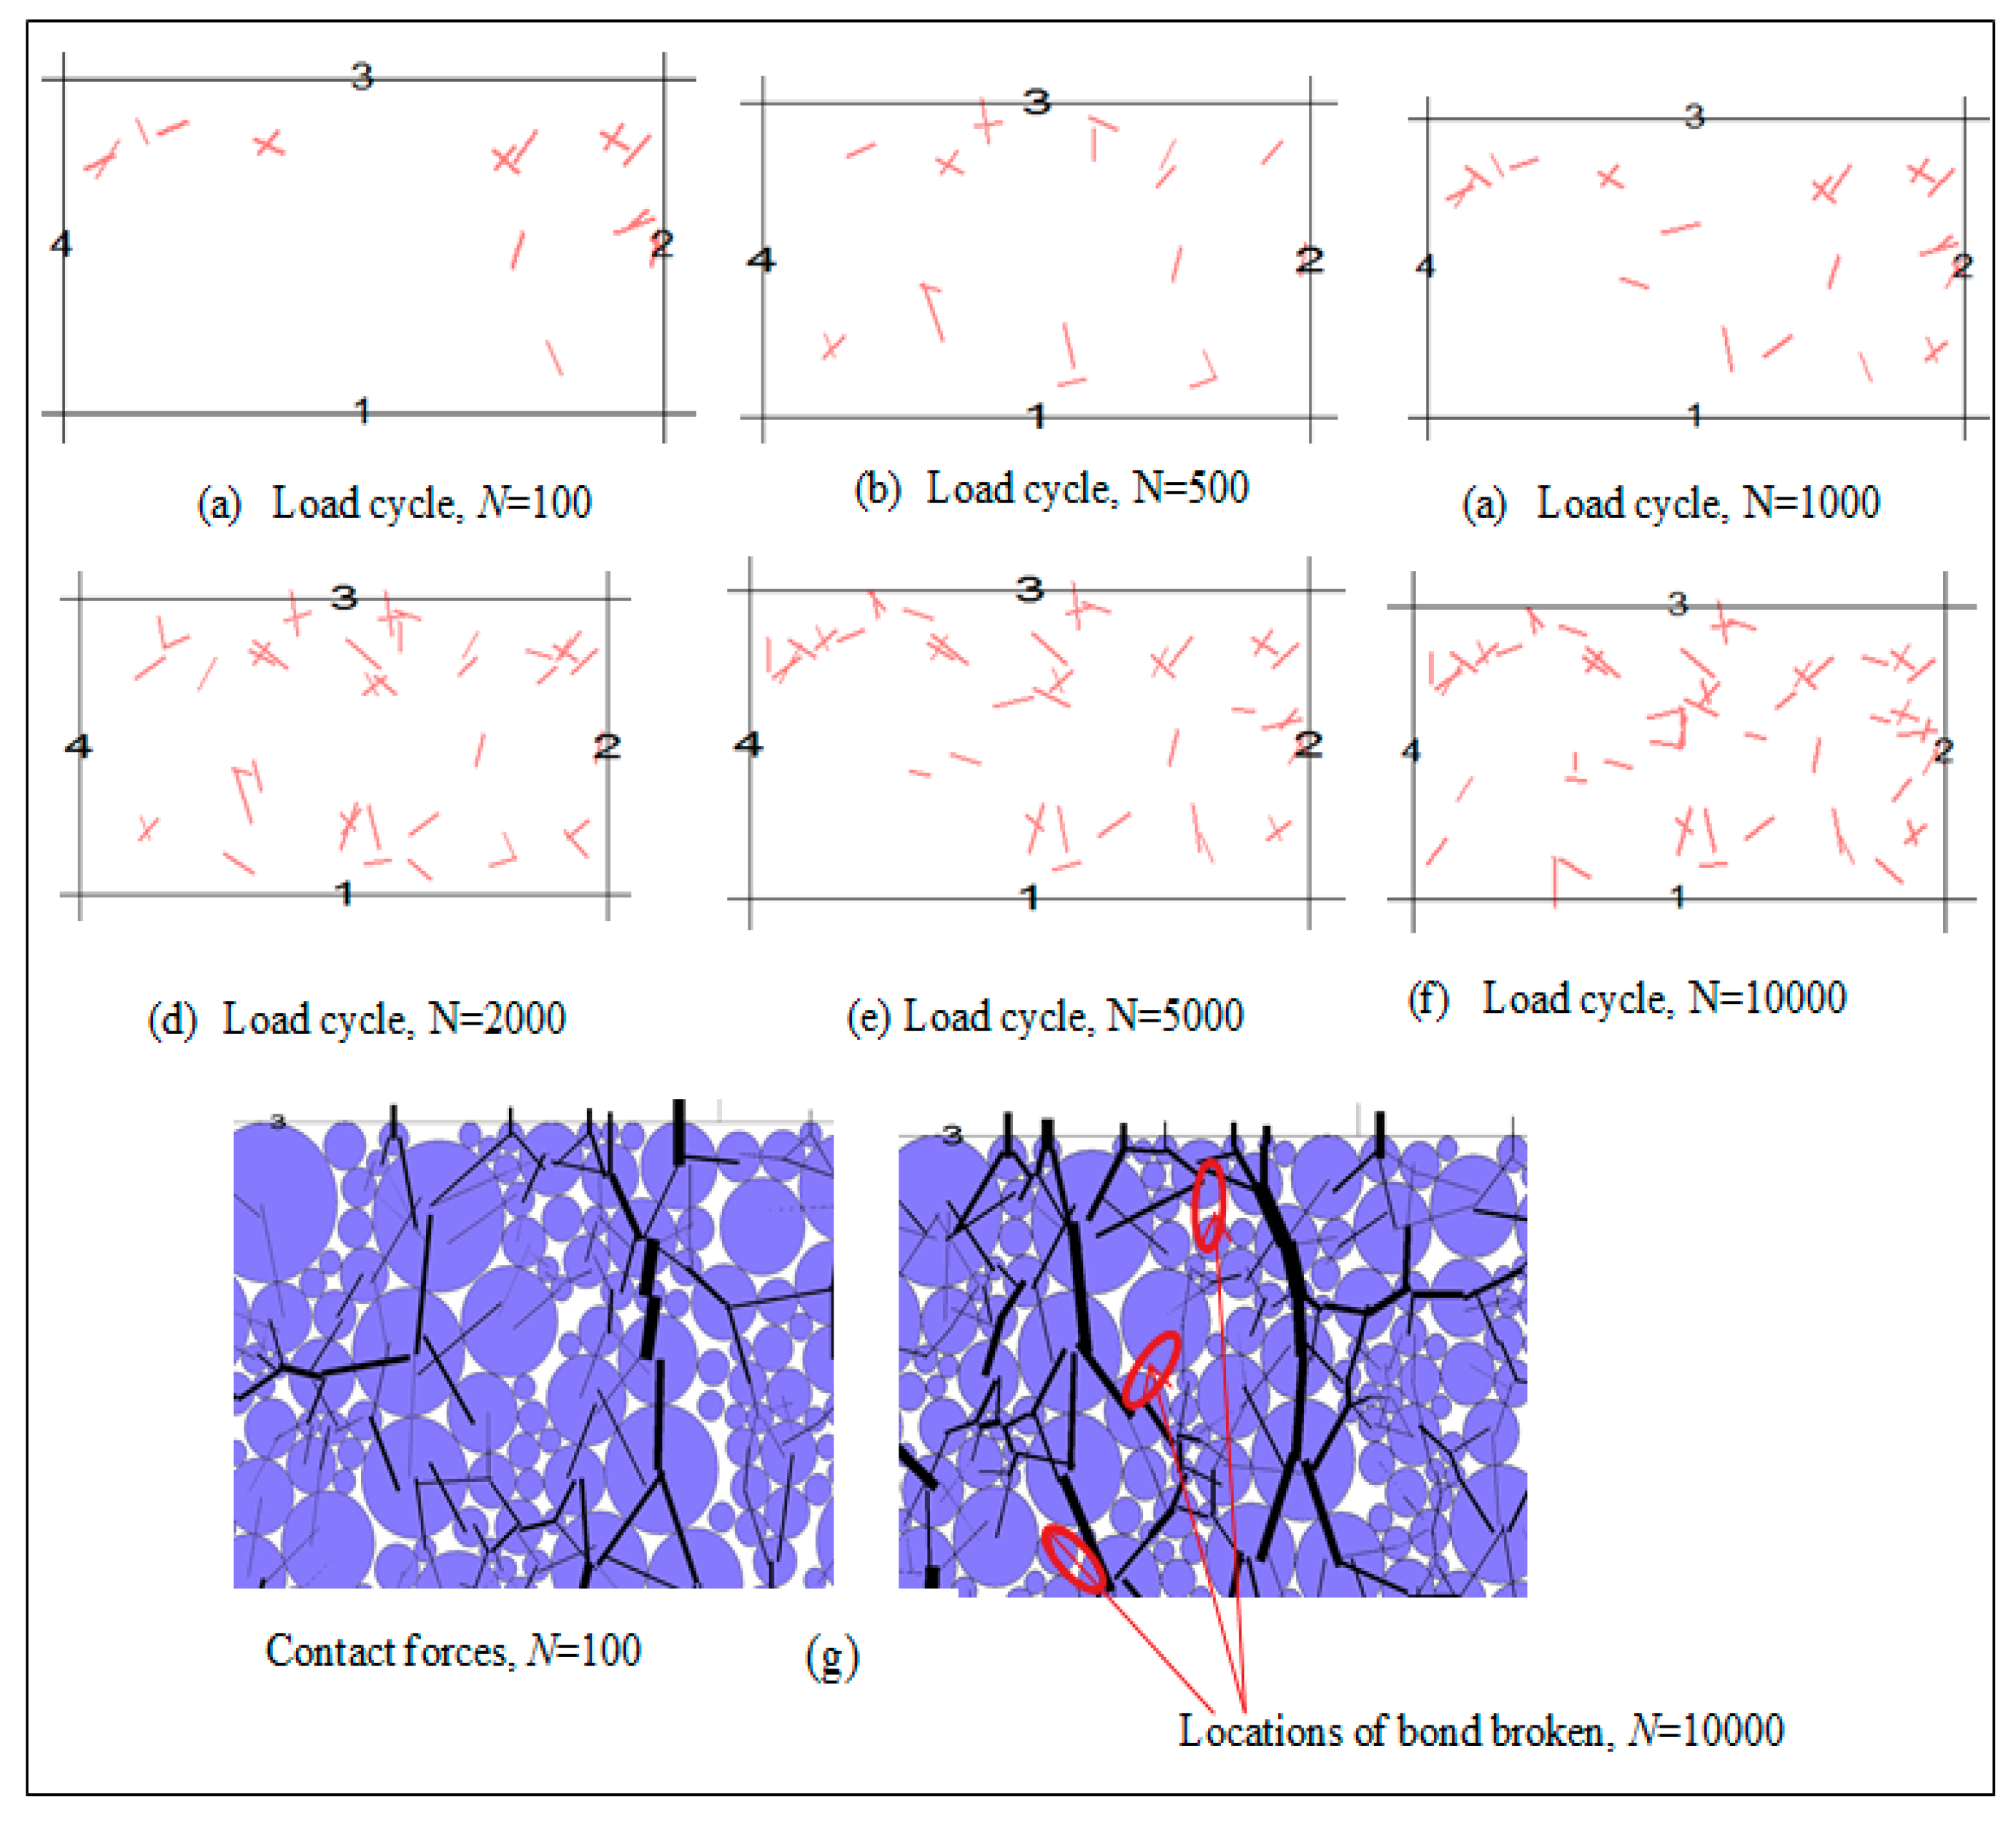
5.3. Cyclic Stress-Strain and Particle Breakage Responses

Figure 17 shows the predicted cyclic stresses with accumulated axial strains obtained from the coupled DEM-FEM model at varying load cycles. The predicted axial strain increases by almost 3% within the first 1000 load cycles, followed by a slight increase in the axial strains up to N = 5000 cycles, and then it remained relatively stable to the end (N = 10,000 cycles). In fact, the cyclic hysteresis loops decreased as the number of cycles increased, thus implying that the ballast specimen began to respond more elastically through cyclic densification as time increased.
The bonds within a cluster of particles that are disconnected are an approximate representation of ballast breakage in the combined DEM-FEM analysis. Figure 18 shows images of the evolving bond breakage (the numbers and places where they break) at cyclic loads that vary from N = 100–10,000 cycles under a loading frequency of f = 15 Hz. Within the first 100 cycles, a large number of bonds directly under the loading plate due to the large contact forces induced (Figure 18a), but as the number of cyclic loading cycles increase, the intensity of broken bonds also increases (Figure 18b–f). Meanwhile the particles become compacted and stop breaking, which results in a solid and more uniform distribution of contact force in the vertical direction (i.e., the principal direction of stress). Moreover, the evolution of broken bonds is to the same as the increasing amount of ballast breakage measured by the laboratory testing data; this explains why the evolution contact forces in the ballast specimen is a dynamic process governed by ballast breakage. Figure 18g shows the typical places and movements of broken grains under cyclic loads where the bonds are separated and the corresponding aggregates are moving away each other, thus representing particle breakage.

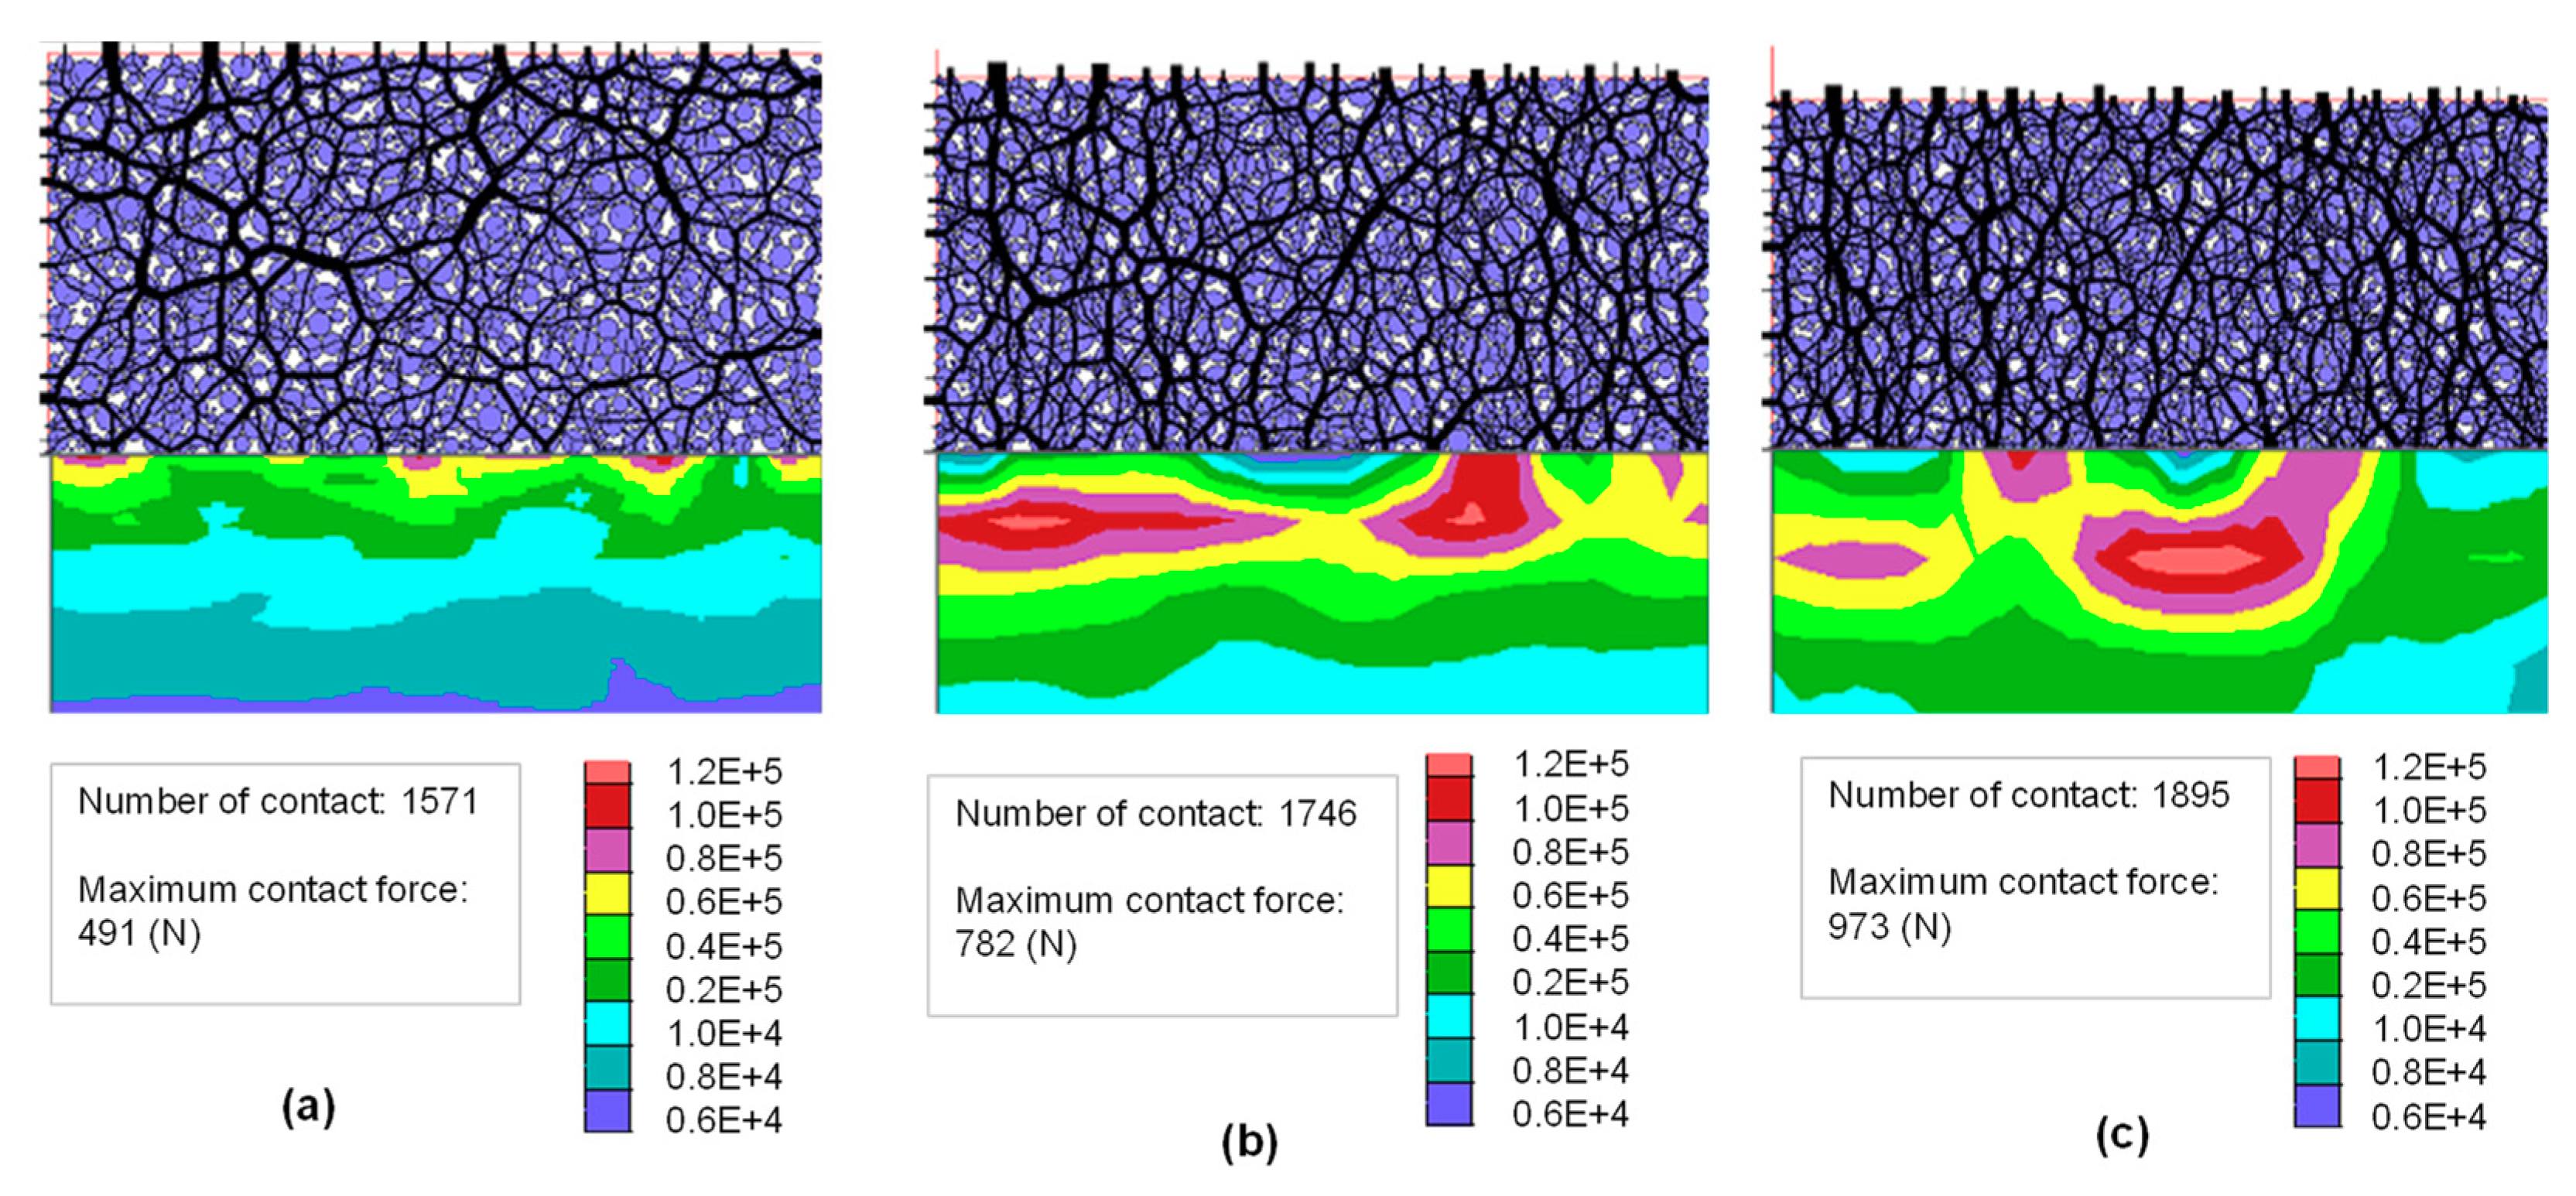
5.4. Contact Forces and Stress Analysis

The cyclic load is transmitted to the discrete ballast grains to form contact force networks where the fabric of contact forces varies with the packing structure and also controls the deformation and strength of the ballast assembly [63,64,65], among others. Figure 19 shows the inter-particle contact forces of a ballast assembly combined with vertical stress contours measured at various load cycles of N = 10, N = 1000 and N = 5000. Here, the contact forces are distributed in a vertical direction (i.e., the direction of principal stress) while the cyclic loads are transmitted downwards through the ballast assembly. Repeated loading leads to high concentrations of contact forces directly underneath the sleeper (i.e., loading surface), and the nearby wall edges, while the load is transmitted vertically to the subgrade below (Figure 19b,c). The force distributions in the DEM zone are heterogeneous because the maximum contact forces change considerably with loading cycles; these forces deform the assembly (i.e., the vertical and lateral displacements) and break the contact between bonds (i.e., particle breakage). The compressive stress (σyy) in the subgrade is initially higher at the interfaces that are in direct contact with the ballast particles, but this stress will largely decrease with depth.

6. Conclusions

The stress-strain behavior of the SFS+CW+RC matrix was examined using a number of static triaxial tests. The test results indicated that the addition of RC increased the energy absorption characteristics and ductility of the waste matrix, which was an advantage by adding RC albeit the slight reduction of the peak stress ratio. Moreover, it was found that the critical state parameters for each waste matrix were not unique as they varied with the amount of RC and the effective confining pressures. To capture the energy absorbing property by adding RC, the energy input W t o t a l was introduced, and an experimental relationship between W t o t a l and M c s could be established. Based on this empirical relationship, a dilatancy model for the waste matrix was developed and the model predictions could corroborate well with the test results.
In this paper, a novel approach to reinforce the upper sub-ballast (capping) with recycled rubber tires to enhance track stability and longevity was also presented. Large-scale laboratory testing and FEM modelling of a capping layer reinforced with rubber tires revealed that they helped to reduce the stress transmitted to the subgrade; in fact the recycled tires increased the stiffness of the capping layer by approximately 50%, and also reduced the breakage of ballast aggregates, despite the fact that this composite system had a higher energy dissipation capacity.
The effect of geogrids and rubber mats on the mechanical response of railway ballast subject to large impact loads was investigated through a series of impact tests involving both unreinforced and geogrid-reinforced ballast samples. While the geogrid reinforcement plays a key role in curtailing the lateral strains of ballast, it also provides a more stable granular assembly to maintain a greater contact area, hence distributing the internal loads more uniformly. The resilient rubber mats are effective in reducing the impact-induced forces and associated ballast breakage. This study therefore suggests that the use of geogrids and rubber mats in tandem (i.e., in the form of under sleeper pads) offers a sound solution to optimize track stability and longevity under severe impact loading.
DEM modelling of ballast stabilized with geogrid indicated a system of improved shear strength. A coupled discrete-continuum approach was used to examine the load and deformation of ballast where the grains were simulated by DEM, and the subgrade/capping was simulated by FEM. Irregular shaped grains were simulated in DEM by bonding a predetermined amount of balls together to mimic the appropriate angularity, size and shape of particles. Data on the load and deformation responses from the coupled DEM-FEM model were comparable with experimental data, indicating that the proposed model could simulate the load and displacement of ballast subjected to cyclic loading. The evolution of contact forces and stress contours that developed in the ballast assemblies captured at various stages of cyclic loading showed that the contact force was distributed non-uniformly across the specimens when the maximum force occurs directly under the sleepers; this leads to an increased number of broken bonds.

Author Contributions

Conceptualization, B.I.; Formal analysis, B.I., Y.Q., T.N.N. and F.B.F.; Funding acquisition, B.I.; Investigation, Y.Q., T.N.N. and F.B.F.; Methodology, B.I., Y.Q., T.N.N., C.R. and F.B.F.; Project administration, B.I., T.N. and A.S.; Supervision, B.I. and C.R.; Writing—original draft, Y.Q., T.N.N. and F.B.F.; Writing—review & editing, B.I., C.R., T.N. and A.S.

Funding

This research was funded by [Australian Research Council Industrial Transformation Training Centre for Advanced Technologies in Rail Track Infrastructure and the Australian Research Council Discovery Project] grant number [IC170100006 and ARC-DP180101916].

Acknowledgements

This research was conducted by the Australian Research Council Industrial Transformation Training Centre for Advanced Technologies in Rail Track Infrastructure (IC170100006) and funded by the Australian Government and the Australian Research Council Discovery Project (ARC-DP180101916). The authors also wish to thank the financial support from the Rail Manufacturing Cooperative Research Centre (funded jointly by participating rail organisations and the Australian Federal Government’s Business Cooperative Research Centre Program), Global Synthetics Pty Ltd., Naue GmbH & Co. KG and Foundation Specialists Group through Project R2.5.2—Application of geogrids for minimising track deformation and degradation under high frequency cyclic and heavy haul loading. Some results reported in this paper have been the result of numerous successful projects partially funded by the ARC and three consecutive Cooperative Research Centers (CRC) in the area of railway infrastructure. A significant portion of the content has already been discussed in past issues of the ASCE International Journal of Geomechanics, Journal of Geotechnical and Geoenvironmental Engineering, Computers and Geotechnics, ASCE Journal of Materials in Civil Engineering, Transportation Geotechnics, Proceedings of the ICE—Ground Improvement, among others; salient contents from these previous publications are reproduced here with kind permission from the respective sources. The authors are thankful to contributions from our colleague Vinod S. Jayan, Ana Heitor, Qideng Sun, and Jim Grant. Collaboration with Tim Neville (ARTC) for encouraging the use of energy absorbing rubber mats in real-life tracks is also appreciated, with subsequent support from organizations including the Australasian Centre for Rail Innovation (ACRI) and RM CRC (Project R2.5.1), among others. The assistance provided by industry (ASMS, South 32, and Tire Crumb Australia) in relation to the procurement of material used in this study is gratefully acknowledged. The authors are also grateful to Alan Grant, Cameron Neilson, Duncan Best, and Richard Berndt for their assistance during the laboratory work.

Conflicts of Interest

The authors declare no conflicts of interest.

References

  1. Indraratna, B.; Salim, W.; Rujikiatkamjorn, C. Advanced Rail Geotechnology—Ballasted Track; CRC Press, Taylor & Francis Group: London, UK, 2011. [Google Scholar]
  2. Indraratna, B.; Ngo, N.T.; Rujikiatkamjorn, C. Behavior of geogrid-reinforced ballast under various levels of fouling. Geotext. Geomembr. 2011, 29, 313–322. [Google Scholar] [CrossRef]
  3. Selig, E.T.; Waters, J.M. Track Geotechnology and Substructure Management; Thomas Telford: London, UK, 1994. [Google Scholar]
  4. Indraratna, B.; Sun, Q.; Heitor, A.; Grant, J. Performance of Rubber Tire-Confined Capping Layer under Cyclic Loading for Railroad Conditions. J. Mater. Civ. Eng. 2018, 30, 06017021. [Google Scholar] [CrossRef]
  5. Tutumluer, E.; Dombrow, W.; Huang, H. Laboratory characterization of coal dust fouled ballast behavior. In Proceedings of the AREMA 2008 Annual Conference & Exposition, Salt Lake City, UT, USA, 21–24 September 2008. [Google Scholar]
  6. Tennakoon, N.; Indraratna, B.; Rujikiatkamjorn, C.; Nimbalkar, S.; Neville, T. The role of ballast-fouling characteristics on the drainage capacity of rail substructure. Geotech. Test. J. 2012, 35, 1–11. [Google Scholar] [CrossRef]
  7. Sussmann, T.R.; Ruel, M.; Chrismer, S.M. Source of ballast fouling and influence considerations for condition assessment criteria. Transp. Res. Rec. J. Transp. Res. Board 2012, 2289, 87–94. [Google Scholar] [CrossRef]
  8. Indraratna, B.; Sun, Q.; Ngo, N.T.; Rujikiatkamjorn, C. Current research into ballasted rail tracks: Model tests and their practical implications. Aust. J. Struct. Eng. 2017, 18, 204–220. [Google Scholar] [CrossRef]
  9. Aursudkij, B.; McDowell, G.R.; Collop, A.C. Cyclic loading of railway ballast under triaxial conditions and in a railway test facility. Granul. Matter 2009, 11, 391–401. [Google Scholar] [CrossRef]
  10. Hussaini, S.K.K.; Indraratna, B.; Vinod, J. Performance of geosynthetically-reinforced rail ballast in direct shear conditions. In Proceedings of the 11th Australia–New Zealand Conference on Geomechanics: Ground Engineering in a Changing World, Melbourne, Australia, 15–18 July 2012; pp. 1268–1273. [Google Scholar]
  11. Indraratna, B.; Nimbalkar, S.; Christie, D.; Rujikiatkamjorn, C.; Vinod, J.S. Field assessment of the performance of a ballasted rail track with and without geosynthetics. J. Geotech. Geoenviron. Eng. 2010, 136, 907–917. [Google Scholar] [CrossRef]
  12. Ferreira, F.B.; Indraratna, B. Deformation and degradation response of railway ballast under impact loading—Effect of artificial inclusions. In Proceedings of the 1st International Conference on Rail Transportation—ICRT 2017: Railway Development, Operations, and Maintenance, Chengdu, China, 10–12 July 2017; pp. 1090–1101. [Google Scholar]
  13. Nimbalkar, S.; Indraratna, B.; Dash, S.; Christie, D. Improved performance of railway ballast under impact loads using shock mats. J. Geotech. Geoenviron. Eng. 2012, 138, 281–294. [Google Scholar] [CrossRef]
  14. Ngo, N.T.; Indraratna, B.; Ferreira, F.B.; Rujikiatkamjorn, C. Improved performance of geosynthetics enhanced ballast: Laboratory and numerical studies. Proc. Inst. Civ. Eng.-Ground Improv. 2018, 171, 202–222. [Google Scholar] [CrossRef]
  15. Indraratna, B.; Ferreira, F.B.; Qi, Y.; Ngo, T. Application of geoinclusions for sustainable rail infrastructure under increased axle loads and higher speeds. Innov. Infrastruct. Solut. 2018, 3, 69. [Google Scholar] [CrossRef]
  16. Ngo, N.T.; Indraratna, B.; Rujikiatkamjorn, C. Micromechanics-based investigation of fouled ballast using large-scale triaxial tests and discrete element modeling. J. Geotech. Geoenviron. Eng. 2017, 134, 04016089. [Google Scholar] [CrossRef]
  17. Ngo, N.T.; Indraratna, B.; Rujikiatkamjorn, C. Stabilisation of track substructure with geo-inclusions—Experimental evidence and DEM simulation. Int. J. Rail Transp. 2017, 5, 63–86. [Google Scholar] [CrossRef]
  18. Ngo, N.T.; Indraratna, B.; Rujikiatkamjorn, C. A study of the geogrid–sub-ballast interface via experimental evaluation and discrete element modelling. Granul. Matter 2017, 19, 1–16. [Google Scholar] [CrossRef]
  19. Indraratna, B.; Qi, Y.J.; Heitor, A. Evaluating the properties of mixtures of steel furnace slag, coal wash, and rubber crumbs used as sub-ballast. J. Mater. Civ. Eng. 2018, 30, 04017251. [Google Scholar] [CrossRef]
  20. Navaratnarajah, S.K.; Indraratna, B. Use of rubber mats to improve the deformation and degradation behavior of rail ballast under cyclic loading. J. Geotech. Geoenviron. Eng. 2017, 143, 04017015. [Google Scholar] [CrossRef]
  21. Navaratnarajah, S.K.; Indraratna, B.; Ngo, N.T. Influence of under sleeper pads on ballast behavior under cyclic loading—Experimental and numerical Studies. J. Geotech. Geoenviron. Eng. 2018, 144, 04018068. [Google Scholar] [CrossRef]
  22. Qi, Y.; Indraratna, B.; Heitor, A.; Vinod, J.S. Effect of rubber crumbs on the cyclic behavior of steel furnace slag and coal wash mixtures. J. Geotech. Geoenviron. Eng. 2018, 144, 04017107. [Google Scholar] [CrossRef]
  23. Qi, Y.; Indraratna, B.; Heitor, A.; Vinod, J.S. The Influence of Rubber Crumbs on the Energy Absorbing Property of Waste Mixtures. In Proceedings of the International Symposium on Geotechnics of Transportation Infrastructure (ISGTI 2018), New Delhi, India, 7–8 April 2018; pp. 455–460. [Google Scholar]
  24. Qi, Y.; Indraratna, B.; Vinod, J.S. Dynamic Properties of Mixtures of Waste Materials. In Proceedings of the GeoShanghai 2018 International Conference: Advances in Soil Dynamics and Foundation Engineering. GSIC 2018; Qiu, T., Tiwari, B., Zhang, Z., Eds.; Springer: Singapore, 2018; pp. 308–317. [Google Scholar]
  25. Qi, Y.; Indraratna, B.; Heitor, A.; Vinod, J.S. Closure to ‘Effect of Rubber Crumbs on the Cyclic Behavior of Steel Furnace Slag and Coal Wash Mixtures’. J. Geotech. Geoenviron. Eng. 2018, 145, 07018035. [Google Scholar] [CrossRef]
  26. Sol-Sanchez, M.; Thom, N.H.; Moreno-Navarro, F.; Rubio-Gamez, M.C.; Airey, G.D. A study into the use of crumb rubber in railway ballast. Constr. Build. Mater. 2015, 75, 19–24. [Google Scholar] [CrossRef]
  27. Soltani, A.; Deng, A.; Taheri, A.; Sridharan, A. Swell–Shrink–Consolidation Behavior of Rubber–Reinforced Expansive Soils. Geotech. Test. J. 2018, 42. [Google Scholar] [CrossRef]
  28. Soltani, A.; Deng, A.; Taheri, A.; Mirzababaei, M. Rubber Powder–Polymer Combined Stabilization of South Australian Expansive Soils. Geosynth. Int. 2018, 25, 304–321. [Google Scholar] [CrossRef]
  29. Soltani, A.; Deng, A.; Taheri, A.; Sridharan, A. Consistency Limits and Compaction Characteristics of Clay Soils Containing Rubber Waste. Proc. Inst. Civ. Eng. Geotech. Eng. 2018, 1–34. [Google Scholar] [CrossRef]
  30. Mashiri, M.S.; Vinod, J.S.; Sheikh, M.N.; Carraro, J.A.H. Shear Modulus of Sand–Tire Chip Mixtures. Environ. Geotech. 2017. [Google Scholar] [CrossRef]
  31. Ngo, N.T.; Indraratna, B.; Rujikiatkamjorn, C. DEM simulation of the behavior of geogrid stabilised ballast fouled with coal. Comput. Geotech. 2014, 55, 224–231. [Google Scholar] [CrossRef]
  32. Bathurst, R.J.; Raymond, G.P. Geogrid reinforcement of ballasted track. Transp. Res. Rec. 1987, 1153, 8–14. [Google Scholar]
  33. McDowell, G.R.; Harireche, O.; Konietzky, H.; Brown, S.F.; Thom, N.H. Discrete element modelling of geogrid-reinforced aggregates. Proce. ICE Geotech. Eng. 2006, 159, 35–48. [Google Scholar] [CrossRef]
  34. Indraratna, B.; Nimbalkar, S.S.; Ngo, N.T.; Neville, T. Performance improvement of rail track substructure using artificial inclusions—Experimental and numerical studies. Transp. Geotech. 2016, 8, 69–85. [Google Scholar] [CrossRef]
  35. Brown, S.F.; Kwan, J.; Thom, N.H. Identifying the key parameters that influencegeogrid reinforcement of railway ballast. Geotext. Geomembr. 2007, 25, 326–335. [Google Scholar] [CrossRef]
  36. ASTM D7181, American Society for Tests and Materials. Standard Method for Consolidated Drained Triaxial Compression Test for Soils; ASTM International: West Conshohocken, PA, USA, 2011. [Google Scholar]
  37. Lackenby, J.; Indraratna, B.; McDowell, G.; Christie, D. Effect of confining pressure on ballast degradation and deformation under cyclic triaxial loading. Géotechnique 2007, 57, 527–536. [Google Scholar] [CrossRef] [Green Version]
  38. Kim, H.K.; Santamarina, J.C. Sand-rubber mixtures (large rubber chips). Can. Geotech. J. 2008, 45, 1457–1466. [Google Scholar] [CrossRef]
  39. Indraratna, B.; Lackenby, J.; Christie, D. Effect of confining pressure on the degradation of ballast under cyclic loading. Géotechnique 2005, 55, 325–328. [Google Scholar] [CrossRef] [Green Version]
  40. Mashiri, M.; Vinod, J.S.; Sheikh, M.N.; Tsang, H.H. Shear strength and dilatancy behavior of sand–tire chip mixtures. Soil Found. 2015, 55, 517–528. [Google Scholar] [CrossRef]
  41. Fu, R.; Coop, M.R.; Li, X.Q. The mechanics of a compressive sand mixed with tire rubber. Géotech. Lett. 2014, 4, 238–243. [Google Scholar] [CrossRef]
  42. Youwai, S.; Bergado, D.T. Strength and deformation characteristics of shredded rubber tire-sand mixtures. Can. Geotech. J. 2003, 40, 254–264. [Google Scholar] [CrossRef]
  43. Qi, Y.; Indraratna, B.; Vinod, J.S. Behavior of Steel Furnace Slag, Coal Wash, and Rubber Crumb Mixtures, with Special Relevance to Stress-dilatancy Relation. J. Mater. Civ. Eng. 2018, 30, 04018276. [Google Scholar] [CrossRef]
  44. Chavez, C.; Alonso, E.E. A constitutive model for crushed granular aggregates which includes suction effects. Soil Found. 2003, 43, 215–227. [Google Scholar] [CrossRef]
  45. Collins, I.F.; Muhunthan, B. On the relationship between stress-dilatancy, anisotropy, and plastic dissipation for granular materials. Géotechnique 2003, 53, 611–618. [Google Scholar] [CrossRef]
  46. Been, K.; Jefferies, M.J.; Hachey, J. The critical states of sands. Géotechnique 1991, 41, 365–381. [Google Scholar] [CrossRef]
  47. Li, X.S.; Dafalias, Y.F. Dilatancy for cohesionless soils. Géotechnique 2000, 50, 449–460. [Google Scholar] [CrossRef]
  48. Jenkins, H.M.; Stephenson, J.E.; Clayton, G.A.; Moorland, J.W.; Lyon, D. The effect of track and vehicle parameters on wheel/rail vertical dynamic forces. Railw. Eng. J. 1974, 3, 2–16. [Google Scholar]
  49. Kaewunruen, S.; Remennikov, A.M. Dynamic crack propagations in prestressed concrete sleepers in railway track systems subjected to severe impact loads. J. Struct. Eng. ASCE 2010, 136, 749–754. [Google Scholar] [CrossRef]
  50. Frederick, C.O.; Round, D.J. Vertical Track Loading. In Track Technology; Thomas Telford: London, UK, 1985; pp. 135–149. [Google Scholar]
  51. Rochard, B.P.; Schmidt, F. Benefits of lower-mass trains for high speed rail operations. Proc. Inst. Civ. Eng. Transp. 2004, 157, 51–64. [Google Scholar] [CrossRef]
  52. Indraratna, B.; Nimbalkar, S.; Neville, T. Performance assessment of reinforced ballasted rail track. Proc. ICE Ground Improv. 2014, 167, 24–34. [Google Scholar] [CrossRef] [Green Version]
  53. Cundall, P.A.; Strack, O.D.L. A discrete numerical model for granular assemblies. Géotechnique 1979, 29, 47–65. [Google Scholar] [CrossRef]
  54. Jiang, M.; Yu, H.-S.; Harris, D. Kinematic variables bridging discrete and continuum granular mechanics. Mech. Res. Commun. 2006, 33, 651–666. [Google Scholar] [CrossRef]
  55. Lu, M.; McDowell, G.R. Discrete element modelling of ballast abrasion. Géotechnique 2006, 56, 651–655. [Google Scholar] [CrossRef]
  56. Indraratna, B.; Ngo, N.T.; Rujikiatkamjorn, C.; Vinod, J. Behavior of fresh and fouled railway ballast subjected to direct shear testing - a discrete element simulation. Int. J. Geomech. 2014, 14, 34–44. [Google Scholar] [CrossRef]
  57. Karrech, A.; Duhamel, D.; Bonnet, G.; Chevoir, F.; Roux, J.-N.; Canou, J.; Dupla, J.-C. A discrete element study of settlement in vibrated granular layers: Role of contact loss and acceleration. Granul. Matter 2008, 10, 369–375. [Google Scholar] [CrossRef]
  58. Lobo-Guerrero, S.; Vallejo, L.E. Discrete element method analysis of railtrack ballast degradation during cyclic loading. Granul. Matter 2006, 8, 195–204. [Google Scholar] [CrossRef]
  59. Itasca. Particle Flow Code in Three Dimensions (PFC3D); Itasca Consulting Group, Inc.: Minneapolis, MN, USA, 2016. [Google Scholar]
  60. Indraratna, B.; Ngo, T. Ballast Railroad Design: Smart-Uow Approach; CRC Press, Taylor & Francis Group: London, UK, 2018. [Google Scholar]
  61. Indraratna, B.; Ngo, N.T.; Rujikiatkamjorn, C. Deformation of coal fouled ballast stabilized with geogrid under cyclic load. J. Geotech. Geoenviron. Eng. 2013, 139, 1275–1289. [Google Scholar] [CrossRef]
  62. Ngo, N.T.; Indraratna, B.; Rujikiatkamjorn, C. Simulation Ballasted Track Behavior: Numerical Treatment and Field Application. Int. J. Geomech. 2017, 17, 04016130. [Google Scholar] [CrossRef]
  63. O’Sullivan, C.; Cui, L.; O’Neill, C. Discrete element analysis of the response of granular materials during cyclic loading. Soils Found. 2008, 48, 511–530. [Google Scholar] [CrossRef]
  64. Azéma, E.; Linero, S.; Estrada, N.; Lizcano, A. Shear strength and microstructure of polydisperse packings: The effect of size span and shape of particle size distribution. Phys. Rev. E 2017, 96, 022902. [Google Scholar] [CrossRef] [PubMed]
  65. He, Y.; Evans, T.J.; Shen, Y.S.; Yu, A.B.; Yang, R.Y. Discrete modelling of the compaction of non-spherical particles using a multi-sphere approach. Miner. Eng. 2018, 117, 108–116. [Google Scholar] [CrossRef]
Figure 1. Particle size distribution curves of SFS, CW, RC and the target PSD of the waste matrix (modified after Qi et al. [22]).
Geosciences 09 00030 g001
Figure 2. Stress-strain curves of SFS+CW+RC mixtures: (a) having different RC contents under σ 3 = 40   k P a ; (b) having 40% RC under different σ 3 .
Geosciences 09 00030 g002
Figure 3. (a) Definition of Strain energy density; (b) Stain energy density of SFS+CW+RC mixtures (modified after Qi et al. [23]).
Geosciences 09 00030 g003
Figure 4. Breakage index of SFS+CW+RC mixtures.
Geosciences 09 00030 g004
Figure 5. (a) e p curves of SFS+CW+RC mixtures at critical state; (b) relationship of Γ and λ in terms of R b (modified after Qi et al. [43]).
Geosciences 09 00030 g005
Figure 6. The relationship between W t o t a l and M c s (modified after Qi et al. [43]).
Geosciences 09 00030 g006
Figure 7. Dilatancy model predictions and the test results for SFS+CW+RC mixtures (a) having 0% RC under different effective confining pressures, (b) having 20% RC under different effective confining pressures, (c) having 40% RC under different effective confining pressures, and (d) having different RC contents under σ 3 = 70   kPa .
Geosciences 09 00030 g007
Figure 8. (a) Impact force-time histories recorded in the first and last blows of test T1 (unreinforced sample); (b) Variation of impact force P2 with number of blows.
Geosciences 09 00030 g008
Figure 9. Evolution of ballast permanent deformations over number of blows: (a) Axial deformations; (b) Radial deformations.
Geosciences 09 00030 g009
Figure 10. (a) Tire before experiment; (b) tire filled with ballast; (c) testing set up; (d) schematic illustration (adopted from Indraratna et al. [4]—with permission from ASCE).
Geosciences 09 00030 g010
Figure 11. FEM modelling for rubber tire-reinforced capping layer: (a) Track geometry with rubber tires reinforced capping layer; (b) FEM mesh of ballasted railway track; (c) FEM mesh of rubber tires (modified after Indraratna et al. [8]).
Geosciences 09 00030 g011
Figure 12. Lateral displacements in the sub-ballast: (a) without rubber tires and (b) with rubber tires (modified after Indraratna et al. [8]).
Geosciences 09 00030 g012
Figure 13. Notation used to describe contacts in DEM: (a) ball-ball contact; (b) ball-wall contact
Geosciences 09 00030 g013
Figure 14. DEM model of geogrid-reinforced ballast: (a) simulated ballast aggregates; (b) geogrid; (c) fresh ballast; (d) fouled ballast (VCI = 40%) (modified after Ngo et al. [31]).
Geosciences 09 00030 g014
Figure 15. Shear stress-strain responses and volumetric changes of geogrid-reinforced ballast: (a) fresh ballast; (b) fouled ballast (data source: Ngo et al. [31]).
Geosciences 09 00030 g015
Figure 16. Coupled DEM-FEM to simulate the RPSTA tests for ballast (Ngo et al. [60]-with permission from ASCE).
Geosciences 09 00030 g016
Figure 17. Predicted cyclic stress versus axial strain at varying number of load cycles (Ngo et al. [60]—with permission from ASCE).
Geosciences 09 00030 g017
Figure 18. Predicted bond breakage at varied load cycles: (a) N = 100; (b) N = 500; (c) N = 1000; (d) N = 2000; (e) N = 5000; (f) N = 10000 (data source: Ngo et al. [62]—with permission from ASCE); (g) contact forces, N = 100
Geosciences 09 00030 g018
Figure 19. Distribution of contact forces and vertical stress contour developed in discrete and continuum media at varying load cycles; (a) N = 10 cycles; (b) N = 1000 cycles; and (c) N = 5000 (modified after Ngo et al. [62]—with permission from ASCE).
Geosciences 09 00030 g019
Table 1. Optimum moisture content and maximum dry density of the waste mixtures.
Waste Matrix γ d m a x ( kN / m 3 ) OMC (%)
SFS:CW = 7:3, 0% RC18.6012.5
SFS:CW = 7:3, 10% RC16.4513
SFS:CW = 7:3, 20% RC14.7015
SFS:CW = 7:3, 30% RC13.2813.5
SFS:CW = 7:3, 40% RC12.115
Table 2. Dilatancy model parameters for SFS+CW+RC mixtures [43].
Mixtures σ 3   ( kPa ) M c s e c s W t o t a l   ( kPa ) m d 0 Γ λ
SFS:CW = 7:3,
0% RC
101.940.3952.18−0.6593.3070.610.062
401.800.3289.02−0.8763.119
701.740.28110.79−1.303.03
SFS:CW = 7:3,
10% RC
102.010.3954.84−0.462.950.740.101
401.610.29214.80−2.152.17
701.550.23531.18−2.861.83
SFS:CW = 7:3,
20% RC
101.980.4165.95−0.535.120.890.141
401.550.26318.66−2.982.18
701.510.19833.82−5.293.19
SFS:CW = 7:3,
30% RC
102.00.4015.46−0.933.800.940.159
401.610.23621.93−2.363.29
701.480.16238.58−4.162.49
SFS:CW = 7:3,
40% RC
101.80.3905.81−0.5566.0141.010.183
401.50.21623.28−2.8192.325
701.430.14842.74−4.3072.890
Table 3. Impact test program.
TestGeogridRubber Mat
T1N/AN/A
T2Base of ballastN/A
T3Within ballastN/A
T4Within ballastTop of ballast
Table 4. Quantification of ballast breakage using the BBI.
TestBBI (Global)BBI (Top)BBI (Middle)BBI (Bottom)
T10.1500.1870.1090.155
T20.1410.1900.1220.111
T30.1300.1550.1430.091
T40.0930.0720.1070.100
Table 5. Track variable values used in the FEM analysis (adopted from Indraratna et al. [8]).
Track VariableValue
Rail Properties
Density (kg/m3)
Young’s modulus E (MPa)
Poisson’s ratio, ν
8000
500,000
0.27
Sleeper Properties
Density (kg/m3)
Young’s modulus E (MPa)
Poisson’s ratio, ν
2000
30,000
0.25
Ballast Layer
Density (kg/m3)
Young’s modulus E (MPa)
Poisson’s ratio, ν
Internal angle of friction, ϕ (degrees)
Angle of dilation, ψ (degrees)
Cohesion, c (kPa)
Thickness (m)
1530
200
0.3
45
15
1
0.35
Capping Layer
Density (kg/m3)
Young’s modulus E (MPa)
Poisson’s ratio, ν
Internal angle of friction, (degrees)
Angle of dilation, ψ (degrees)
Cohesion, c (kPa)
2100
140
0.3
39
15
1
Subgrade Layer
Density (kg/m3)
Young’s modulus E (MPa)
Poisson’s ratio, ν
1700
20
0.35
Tire Properties
Density (kg/m3)
Young’s modulus E (MPa)
Poisson’s ratio, ν
1500
750
0.35
Wheel Load
Static wheel load (kN)
Train Speed (km/h)
Dynamic amplification factor (DAF)
Dynamic wheel load (kN)
122.5
100
1.54
188.2
Table 6. Micro-mechanical input parameters used in the DEM analysis (Ngo et al. [31]).
Input ParametersBallastFouling MaterialsGeogrid
Particle density (kg/m3)
Coefficient of friction
Contact normal stiffness, kn (N/m)
Contact shear stiffness, ks (N/m)
Contact normal stiffness of wall-particle (N/m)
Shear stiffness of wall-particle (N/m)
Parallel bond radius multiplier, rp
Parallel bond normal stiffness, knp (kPa/m)
Parallel bond shear stiffness, ksp (kPa/m)
Parallel bond normal strength, σnp (MPa)
Parallel bond shear strength, σsp (MPa)
2700
0.8
0.52 × 10⁸
0.52 × 10⁸
1 × 10⁸
1 × 10⁸
1250
0.2
1.27 × 10⁴
1.27 × 10⁴
1 × 10⁸
1 × 10⁸
800
0.5
1.77 × 10⁷
0.88 × 10⁷
1 × 10⁸
1 × 10⁸
0.5
5.68 × 10⁸
5.68 × 10⁸
456
456

