Article

Effect of Orientation and Vegetation over the Embankment Crest for Energy Reduction at Downstream

by
Kannangara D. C. R. Dissanayaka
1,
Norio Tanaka
2,* and
Md. Kamrul Hasan
1
1
Graduate School of Science and Engineering, Saitama University, 255 Shimo-okubo, Sakura-ku, Saitama-shi 338-8570, Japan
2
International Institute for Resilient Society, Saitama University, 255 Shimo-okubo, Sakura-ku, Saitama-shi 338-8570, Japan
*
Author to whom correspondence should be addressed.
Geosciences 2022, 12(10), 354; https://doi.org/10.3390/geosciences12100354
Submission received: 6 July 2022 / Revised: 15 September 2022 / Accepted: 16 September 2022 / Published: 22 September 2022
(This article belongs to the Special Issue Interdisciplinary Geosciences Perspectives of Tsunami Volume 4)

Abstract

:
Coastal embankments often collapse due to the tremendous destructive energy of an overtopping tsunami flow due to a deep scour by nappe flow. Hence, to clarify the nappe flow formation condition due to the overtopping, a series of tests were carried out within a laboratory flume with immobile settings by lowering the downstream surface angle of an embankment model while keeping the upstream surface slope constant (1:1) with five non-dimensional overtopping depths and six different crest conditions. The conditions imposed on the embankment crest in the flow direction were without vegetation; horizontal crest, (−)4% descending crest slope, (+)4% ascending crest slope, and adding vegetation model with three different densities across the horizontal crest to improve resistance to the flow. The increased resistance provided by the vegetation models were categorized based on the spacing ratio between cylinders to diameter: sparse, intermediate, and dense. Increased vegetation density above the crest results in a significant reduction of flow energy by approximately 30–50% at the downstream brink edge and 40–60% at the downstream plunge basin. In contrast, the maximum energy reduction was found to be by the dense vegetation model. Additionally, owing to the steep slope of the water surface profile and the increasing vegetation density, the impinging jet’s impact point moved closer to the toe of an embankment. This implies that vegetation covers a smaller area while increasing density to mitigate the destructive intensity of flood/tsunami movement. Meanwhile, the descending crest scenario results in a faster nappe flow formation. In contrast, the ascending crest scenario delays the nappe formation while reducing the downstream slope angle. It maintains the sub-critical flow at the crest, except near the downstream brink edge.

1. Introduction

A dike or embankment in a coastal region may be overtopped and breached when a river flood or tsunami run-up exceeds the design water level. This overflowing flow can cause substantial damage in the downstream region. In recent years, significant damage has occurred throughout coastal zones due to tsunamis overtopping their banks and storm surge-related coastal flooding, which has increased in severity and frequency over several decades. It is critical to give a complete description of how a breach occurs and a hydrograph showing the outflow during overtopping. Based on these data, effective early warning systems and emergency plans may be developed to minimize loss of life or property. Tsunamis arise from probable coastal structural collapse, wreaking havoc on people and property [1,2,3,4,5,6,7]. Certain structures may collapse for various reasons, including that they can only withstand established safety margins and are prone to degradation [8,9].
The inundated currents by the 2011 Great East Japan Tsunami (GEJT) generated a large, scoured area at the coastal dike’s downstream toe, and the dike’s downstream slope was destroyed entirely. For example, according to the field investigations conducted by Kato et al. [10] and Tokida and Tanimoto [11], numerous locations along the Tohoku region’s Pacific Coast experienced downstream slope collapses, with scours spanning more than 20 m in width. On the other hand, the coastal forest damaged by the GEJT was severe due to no obstruction in its path, and it came into direct contact with the tsunami’s intensity [12]. Tsunami energy reduction might be enhanced by creating and maintaining a hydraulic jump or a secondary embankment constructed behind the sea embankment [13]. Furthermore, the trees behind the dikes minimized the damage [14]. Additionally, a hydraulic jump might be generated with the increasing resistance provided by a forest behind the embankment [13]. However, there is still limited data on the energy reduction associated with a hydraulic jump in conjunction with an embankment and downstream forest data. Land use restrictions in the coastal zone significantly hinder establishing a dense forest for tsunami mitigation [15]. Establishing a denser emergent forest in an actual plantation is challenging since tall trees need enough space to develop efficiently [16]. Tanaka et al. [15] revealed that in the 2004 IOT, a vertically two-layer forest in Sri Lanka was shown to absorb tsunami energy behind the forest. This type of hybrid alternative needs more extensive land availability. Usually, near urbanized coastal zones, land value is significantly higher, and land acquisition for such kind of ecosystem-based hybrid approach would be much costlier. Therefore, considering these significant effects on the initial cost of the construction, planting a forest on the embankment crest or introducing a geometrical change to the embankments crest would be the best solution [17,18,19]. At the same time, strengthening and managing the downstream usage (coastal environmental/urban planning) would be an added advantage for planning a resilience society against the tsunami risk. After the 2011 GEJT, Non-profitable Organization (NPO) tested an environmentally friendly forested embankment system with a variety of tree species (including a mix of short and tall tree species) in the Tohoku region of Japan [20].
Following the GEJT, a new system of dikes was proposed for the future tsunami mitigation along the coasts of Iwate, Fukushima, and Miyagi Prefectures in Japan, which involves rebuilding of coastal dikes or their elevation [20]. Additionally, after the IOT, the Coast Conservation Department (CCD) of Sri Lanka offered various actions to mitigate the future tsunami risks, including constructing coastal embankments and forests in the coastal zones. Meanwhile, an embankment overflow creates an impinging jet downstream, which is responsible for the embankment structure’s erosion when the head-cut migration starts. This impinging jet flow creates and accelerates the scour hole formation near the toe of the embankment structure, and it further increases the head cut migration towards the upstream [21]. Hence, avoiding the formation of the nappe flow impinging jet due to the overtopping would be an added advantage to prevent the complete structure failure or controlling of the breach growth mechanism. Additionally, the fluid force created over the downstream surface can mitigate by providing an erosion protection mechanism or creating a plunge pool to absorb the fluid pressure, which barely reduces the erosion concerning the water depth by the provided water cushion [3]. Before finalizing the geometric conditions over the embankment crest, previous research done by Daneshfaraz et al. [22], Emiroglu and Bayler [23], and Imanin et al. [24] was referred to. These studies identified the flow properties downstream of the broad crested weir with different slopes and shapes over the crest. They did not check the influence of the downstream surface slope contribution over the change of nappe impinging jet properties and energy reduction downstream.
Thus, this research aimed to develop a hybrid defense system consisting of a sea embankment with the different geometric conditions imposed over the crest, including a single-layer vegetation model (VM) established with various porosities to absorb the energy of an overtopping tsunami surge. Pandanus odoratissimus forest was suggested to be planted as single layer vegetation over the crest in real embankment, as shown in Figure 1, to reduce the tsunami energy, with tsunami height ranging from 5 m to 7 m. Figure 1 also includes the actual growth situation of P. odoratissimus behind the seaside slope of the coastal embankment. It will act as a secondary defensive structure on the top of the embankment’s crest to regulate the breach mechanism and mitigate the destructive effects in the downstream region. Most of the coastal embankments are usually paved with concrete blocks. Anchoring the block system to the embankment body can enhance the strength in the upstream surface of the EM against the first exposure to the wave action during a disaster situation. Meanwhile, the paving on the downstream surface of the EM delays or prevents scouring due to the overtopping flow. Additionally, the properties of the nappe flow impinging jet were identified concerning the geometric condition. Due to the model size used and the experimental flume’s fixed bed elevation, this research focuses primarily on the flow structures and the energy reduction due to the changing geometry of the crest of an EM and nappe flow formation.

2. Materials and Methods

2.1. Experimental Conditions

2.1.1. Scaling of the Model

To scale the model, the existing coastal structures and tsunami water depths recorded in Sri Lanka at the 2004 Indian Ocean Tsunami (IOT) and water depths at the 2011 Great East Japan Tsunami (GEJT) were referred to, and priority was given to the overtopping flow depth [11,25]. Based on the ICHARM [25] report regarding 2004 IOT, water depths were recorded as 2–6.4 m at the Galle Port area in Sri Lanka, and the average tsunami flow depth was around 4.70 m. Then, the height and crest width of the prototype were selected as 4.0 m. Additionally, consider the accuracy of observation and flume capacity before selecting the experimental scale, like when the scale is large enough that it can accurately visualize the flow variations through image processing. Finally, the model scale has been set and chosen to satisfy the bio-shield and structural solution requirement to mitigate destruction in coastal environments by the tsunami flow. Hence, the ratio of length Ls = Lp/Lm was used, where Lp is the length of the prototype and Lm is the length of the model. Finally, Ls was defined as 10 in this study. Then, the overtopping depths were set at 2–6 cm, corresponding to the experimental flume’s discharge characteristics. The experimental setup was constructed using smoothly coated plywood sheets with Manning’s roughness coefficient (n) of around 0.012. For low water depths, surface tension is dominant with low Reynolds numbers ( R e < 200), but it is negligible in low water depths with high velocities. In this experiment, the minimum water depth at the EM crest was 2.0 cm (EM-NHC), and in the actual field over the embankment crest (0.2 m depth of water is overflowing from 4.2 m high tsunami), which is equal to 20.0 cm according to the selected scale over the crest. Additionally, in the present experimental investigation, the Reynolds number ( R e ) varied between the range of 7.13 × 10³ to 4.45 × 10⁴ at the crest of EM for every experimental condition considered (Table 1). Meanwhile, Weber’s number ( W e ) exists between the range of 12.78–94.45. Table 1 summarizes the Weber number and Reynolds number range concerning the normalized overtopping depth for each experimental case.
According to the summarized data in Table 1, the flow over the EM crest follows turbulent flow characteristics concerning the Reynolds number ( R e ). Similarly concerning the Weber number W e values, it ranges greater than W e 11 , which implies that surface tension was not exist over the experiment flow conditions [26].

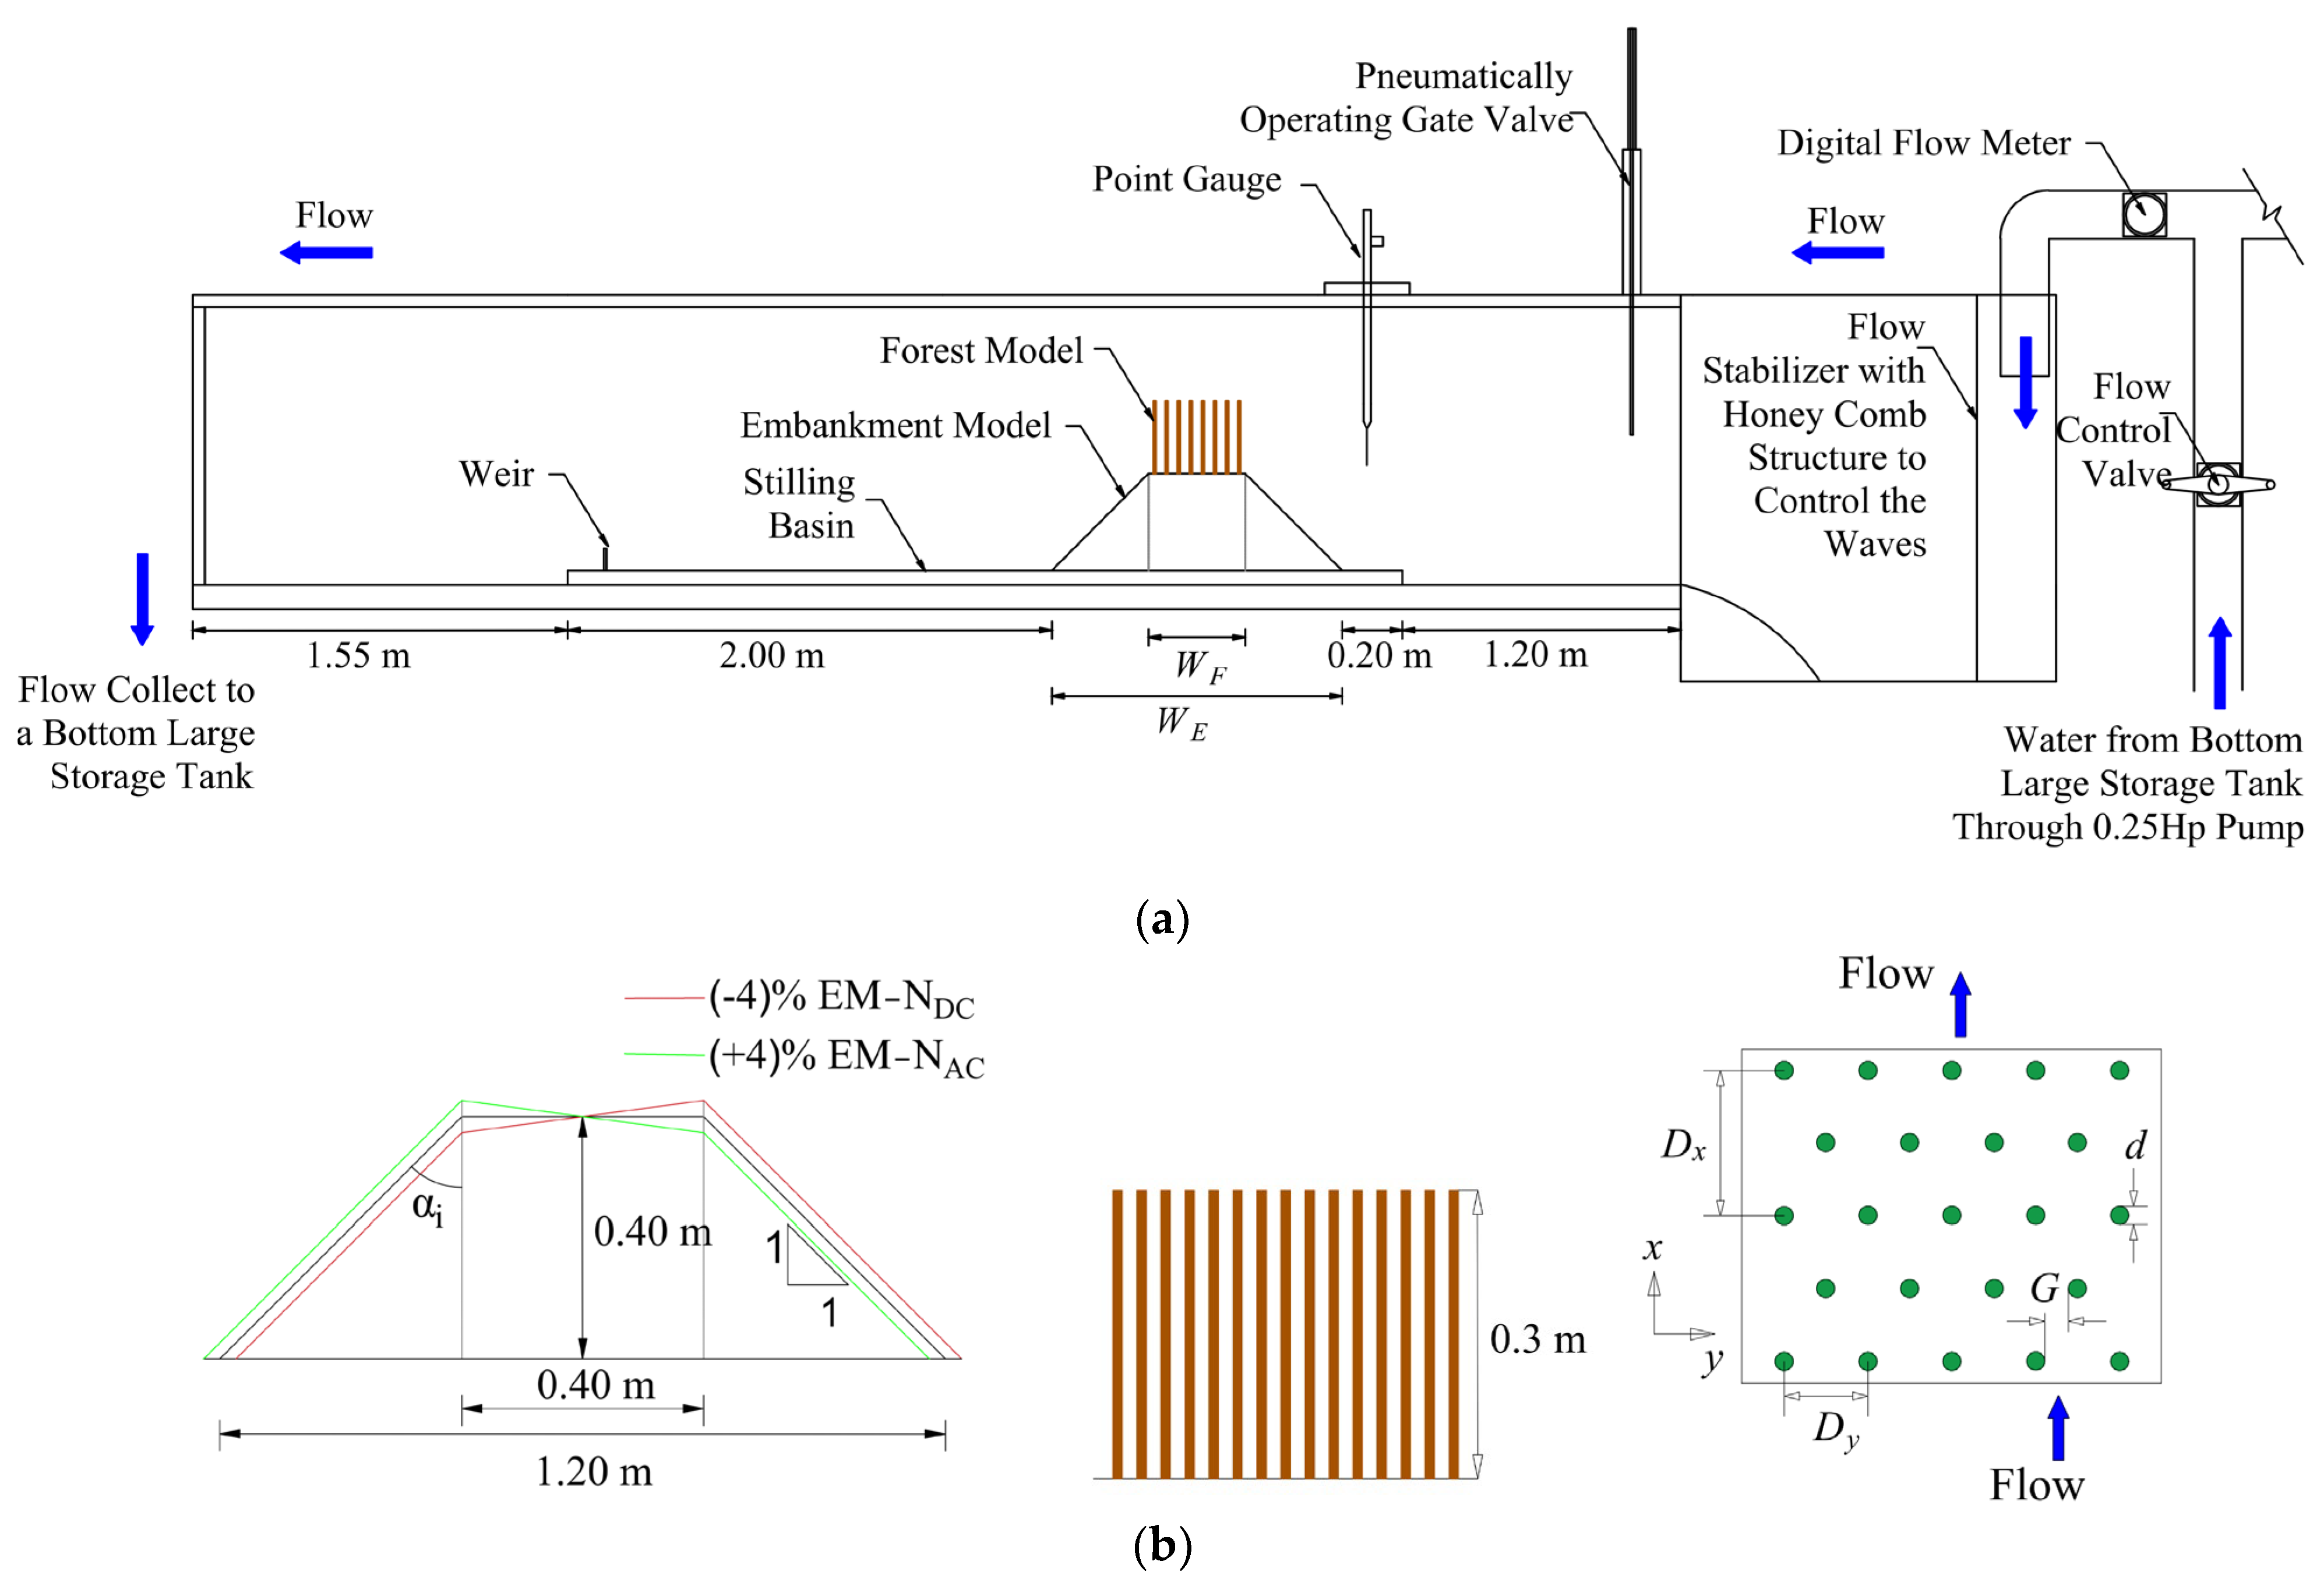
2.1.2. Flume Characteristics and Flow Conditions

A laboratory experiment with a hybrid defense structure consisting of an embankment model (EM) with a vegetation model (VM) over the crest of the EM was conducted in a glass-sided experimental flume. The flume was 6.25 m long, 0.5 m wide, and 1.2 m high, with a zero-bed slope in Saitama University, Japan. One flow depth measurement system is attached to the channel with electronic gauge reading to observe the inflow discharge. The schematic of the experimental flume setup is shown in Figure 2a. Figure 2b defined the embankment dimensions, vegetation model dimensions, and the vegetation model arrangement. The properties of the specified embankment height, vegetation model, and tsunami flows were generally regarded as an average case, not specific to any location. Spiske et al. [27] stated that the flow was subcritical and had a Froude number [Fr = V/(gh)0.5, where V = depth-averaged velocity (m/s), g = gravitational acceleration (m/s2), and h = flow depth (m)] between 0.7 and 1 at several places inundated by a tsunami. Hence, this subcritical flow condition explained by Spiske et al. [27] was utilized in this experiment. The present study aimed to clarify the formation condition of the nappe flow and energy reduction downstream by changing the downstream surface slope angle of the EM with and without vegetation over the EM crest. In addition, the effect of orientation of the embankment crest was investigated, which included a slope (δ) concerning the EM crest width of (+)4% ascending (EM-NAC) and (−)4% descending (EM-NDC) towards the downstream. In Figure 2b, the EM model setup for (+)4% ascending (EM-NAC) and (−)4% descending (EM-NDC) is indicated by the dashed lines. All the experiments were conducted on a non-erodible wooden bed to replicate the existing coastal embankment as coastal embankments are usually protected, i.e., made of concrete. In Series 1 (EM-NHC), a laboratory experiment was conducted without vegetation on the crest (crest horizontal), only reducing the downstream surface slope angle ( α i ) from 45° to 0° in 5° decrements, with five overtopping depths ( h m ), as mentioned in Table 2, to check the behavior of the nappe flow formation, energy downstream (at downstream brink edge of EM crest and downstream of the EM), and hydraulic jump formation.
In Series 2 (EM-VMS, EM-VMI, and EM-VMD), following the same flow conditions, three VMs in different vegetation densities were fixed on the EM crest to check the nappe flow properties, energy reduction downstream, and hydraulic jump formation. In Series 3 (EM-NAC and EM-NDC), following the same flow conditions and evaluation characteristics as the above two, we introduced a crest angle as (+)4% ascending and (−)4% descending towards the flow, which is illustrated in Figure 2b. Discharge of the channel was maintained to remain at a constant flow to maintain the steady flow conditions, especially to finalize the initial overtopping flow depths. Then, we followed the same flow discharges for every case to represent the Froude similarity.

2.1.3. Setup of the Physical Model

The physical model of the EM with VM on the embankment’s crest was set inside the flume by considering the existing IOT data and land availability. A wooden EM made from smoothly coated plywood with a height of 40.0 cm and a slope of 1:1 was chosen and put up on the flume bed based on the predicted embankment height of 4.0 m for the proposed beach replenishment projects in Sri Lanka [28]. As with earlier research [16,25,29], VM was built entirely of rigid wooden cylinders. Even when the coastal forest was damaged (tree breakage, washout, overturning, and partial destruction), trees with 0.4 m or more diameters were not observed to be broken in the GEJT in the specific sites [30]. The post-tsunami survey of the IOT also identified that plenty of trees were unbroken, with diameters ranging from 0.1 m to 0.3 m along the seashore of different locations in Sri Lanka [31]. The post-tsunami survey of IOT done in the affected region and identification of coastal vegetation belts against disaster risk reduction of the tsunami [25] suggested that P. odoratissimus has excellent resistance against the tsunami run-up (Figure 1). The breast height diameter of P. odoratissimus trees varies between 12–20 cm [25]. Thus, considering the actual scale, land availability, aesthetic appearance near the suburban corridor, environmental impact, and nonbreaking conditions of coastal forest trees, circular wooden cylinders with a diameter of 1.2 cm were used to simulate the emergent tree model and represent the prototype.
Meanwhile, the tsunami heights at the tree breaking refer to the highest possible tsunami inundation levels in catastrophe areas when trees were discovered toppled or broken in the aftermath of tsunami events [25]. These statistics were gathered in the tsunami’s aftermath in Sri Lanka and Thailand. P. odoratissimus is a tropical coastal tree that grows densely and can withstand drought, severe winds, and salt spray. This tree was identified in Sri Lanka’s natural coastal vegetation zone [31]. Additionally, P. odoratissimus tree belt was proven to reduce the tsunami energy in a tsunami less than 5 m high on an actual scale [31,32]. Therefore, VM, considered comparable to the P. odoratissimus, was evaluated as a secondary defensive structure at the top of the embankment’s crest to regulate the breach mechanism and mitigate the effect of the downstream side in this research. According to Figure 2b, in the vegetation layout, d, D, and G denote the diameter of the cylinder, the center-to-center distance of the cylinder, and spacing between the cylinder in the cross-stream direction, respectively. The symbol Dy represents the center-to-center distances between cylinders in the cross-stream direction. D x ( = 3 D y ) denotes the center-to-center distances between the cylinders along the flow direction [3,16,33]. The vegetation models covered almost the whole width of the flume while leaving a narrow space between the outside stem and the flume wall. The ratio of the flume width to the cylinder diameter should be more than five to reduce the impact of sidewalls on the flow structure [2,33,34]. This ratio was maintained in this experiment to minimize the sidewall impact [33]. The flow structure in the vicinity of a vegetation model is determined by the non-dimensional spacing G/d [33,35]. Wooden cylinders of 0.3 m height set with G/d = 1.33 were used to develop the sparse vegetation model (VMS), G/d = 0.592 was used to construct the intermediate vegetation model (VMI), and G/d = 0.29 was used to produce the dense vegetation model (VMD) [16]. The vegetation width ( W F ) and the center-to-center distance between the trees D were chosen based on the vegetation thickness, dn [=( 2 W F / 3 D 2 )10−2] of 180 No.cm for VMS, 380 No.cm for VMI, and 580 No.cm for VMD, respectively [16]. This vegetation thickness d n (No.cm) was defined as a function of the summed tree diameter. Further, it is defined as a product of the diameter of a tree ( d ) at breast height, the number of trees ( n ) in a rectangle with of frontage of unit length along the shoreline and depth equal to the width of the forest ( W F ) [4,5,16,32].
In this experiment (Figure 2a), EM was placed on the flume bed 1.2 m down from the inlet tank. With the experimental conditions, vegetation models (VMs) with different G/d ratios were placed on the crest of the EM. The primary objective of this case study is to identify the energy reduction and nappe flow formation concerning the EM crest’s geometrical conditions while lowering the EM’s downstream surface slope (Figure 2a,b). Then, we repeated the above with an (+)4% ascending (EM-NAC) and (−)4% descending (EM-NDC) crest angle towards the flow to justify the behavior of the nappe flow formation and position of the hydraulic jump. Meanwhile, vegetation models with different densities were put on the horizontal crest of the EM. Then, we repeated the same process of the experiment. As described in Figure 2, the weir height of 0.1 m was installed at 2.0 m from the EM toe towards the downstream side at the initial case and kept until the entire experiment series was finished to make a plunge pool. The plunge pool, created due to the installed weir, helped to identify the effect of the water cushion when the nappe flow impinging jet (free nappe condition) hit the downstream surface and hydraulic jump formation.

2.2. Experimental Procedure and Data Analysis

2.2.1. Initial Condition

The initial condition of this experiment was the overtopping depth considered at the middle section of the embankment with a horizontal crest and no vegetation condition (EMNHC), while keeping the upstream and downstream surface slopes equal to 1:1.
The finalized overtopping depths were 2.0 cm, 3.0 cm, 4.0 cm, 5.0 cm, and 6.0 cm, respectively. The corresponding Froude numbers for the initial overtopping depths at the mid-section over the embankment crest were 0.928, 1.040, 1.084, 1.095, and 1.086, respectively. Additionally, summary of the hydraulic parameters observed at each experimental run were tabulated in Table 3 (i.e., discharge, flow velocity V d , h m , h u , h c , h d , Δ H / H m a x ).

2.2.2. Measurement of the Water Depth and Velocity

A point gauge was used to measure the water depth at a short interval across the flume’s center, depending on the flume’s water surface variation only over the embankment crest. Due to the flume’s depth of around 1.2 m, measuring the complete flow profile with a point gauge provided was difficult due to a lack of available facilities. Consequently, additionally to the point gauge, another two measuring devices were used to estimate the water surface height across the various segments chosen (direct measurement by the gauge reading at the flume side wall and the high-resolution image analysis). The maximum and lowest depths at a fixed location with surface variability were measured repeatedly and then averaged over the crest of the embankment at each experiment trail. The depth-averaged velocity ( V ) was determined at a given position using the continuity equation V = Q i / ( h b ) , where Q i is the flow rate (m3/s), b is the flume width (m), and h is the water depth (m).

2.2.3. Normalized Parameters Used for the Analysis

To analyze the data, based on the physical scale of the experimental models and the associated hydraulic conditions (Table 2), the following normalized parameters were defined to represent the real scale. The overtopping depth measured at the mid-section of the EM model at the initial condition was described as a normalized overtopping depth, H m ( = h m / h E ) , where h m is the overtopping water depth measured at the mid-section of the EM crest in the initial case, and h E is the height of the embankment at the center (Figure 3a,b).
The normalized water depths of the downstream brink edge of the embankment were defined as H d ( = h d / h E ) , and h d is the water depths of the downstream brink edge of the embankment crest. Critical depth over the embankment crest was defined as the normalized critical depth H c ( = h d / h c ) , where h c is the critical depth over the embankment crest. The normalized jump location (i.e., the toe of the jump) of the formed hydraulic jump at the downstream plunge pool was defined as P J ( = p j / L c ) , where p j is the position of the jump measured from the downstream brink edge, and L c is the crest width of the embankment. Specific energy loss over the downstream brink edge of the embankment crest is defined as Δ E d [ = ( E u E d ) / E u ] , where E u is the specific energy at the upstream brink edge, and E d is the specific energy at the downstream brink edge. The normalized total head loss at the plunge pool was defined as H L ( = Δ H / H m a x ) , and the parameters in this are described under Equation (2) in Section 2.2.6.

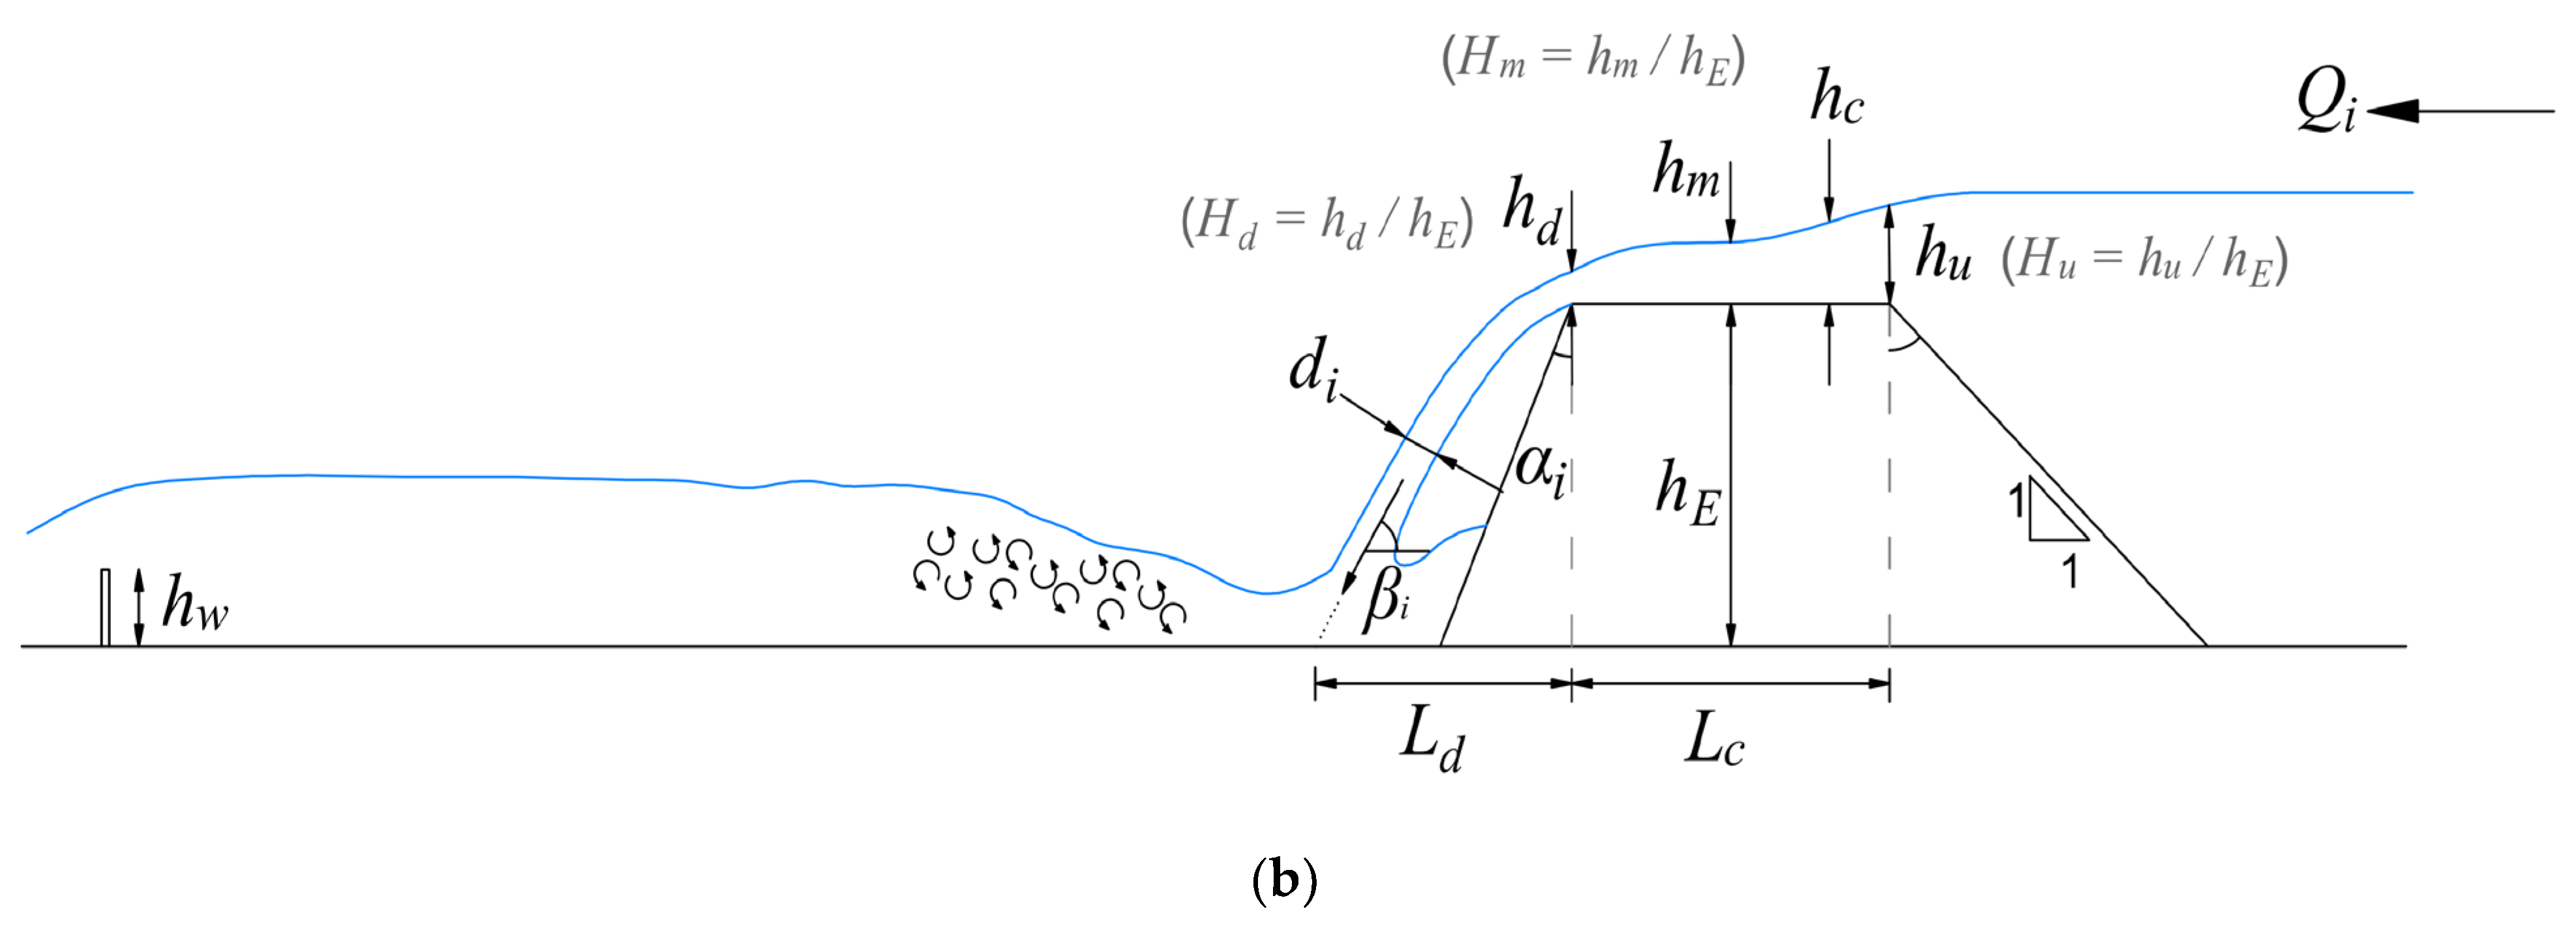
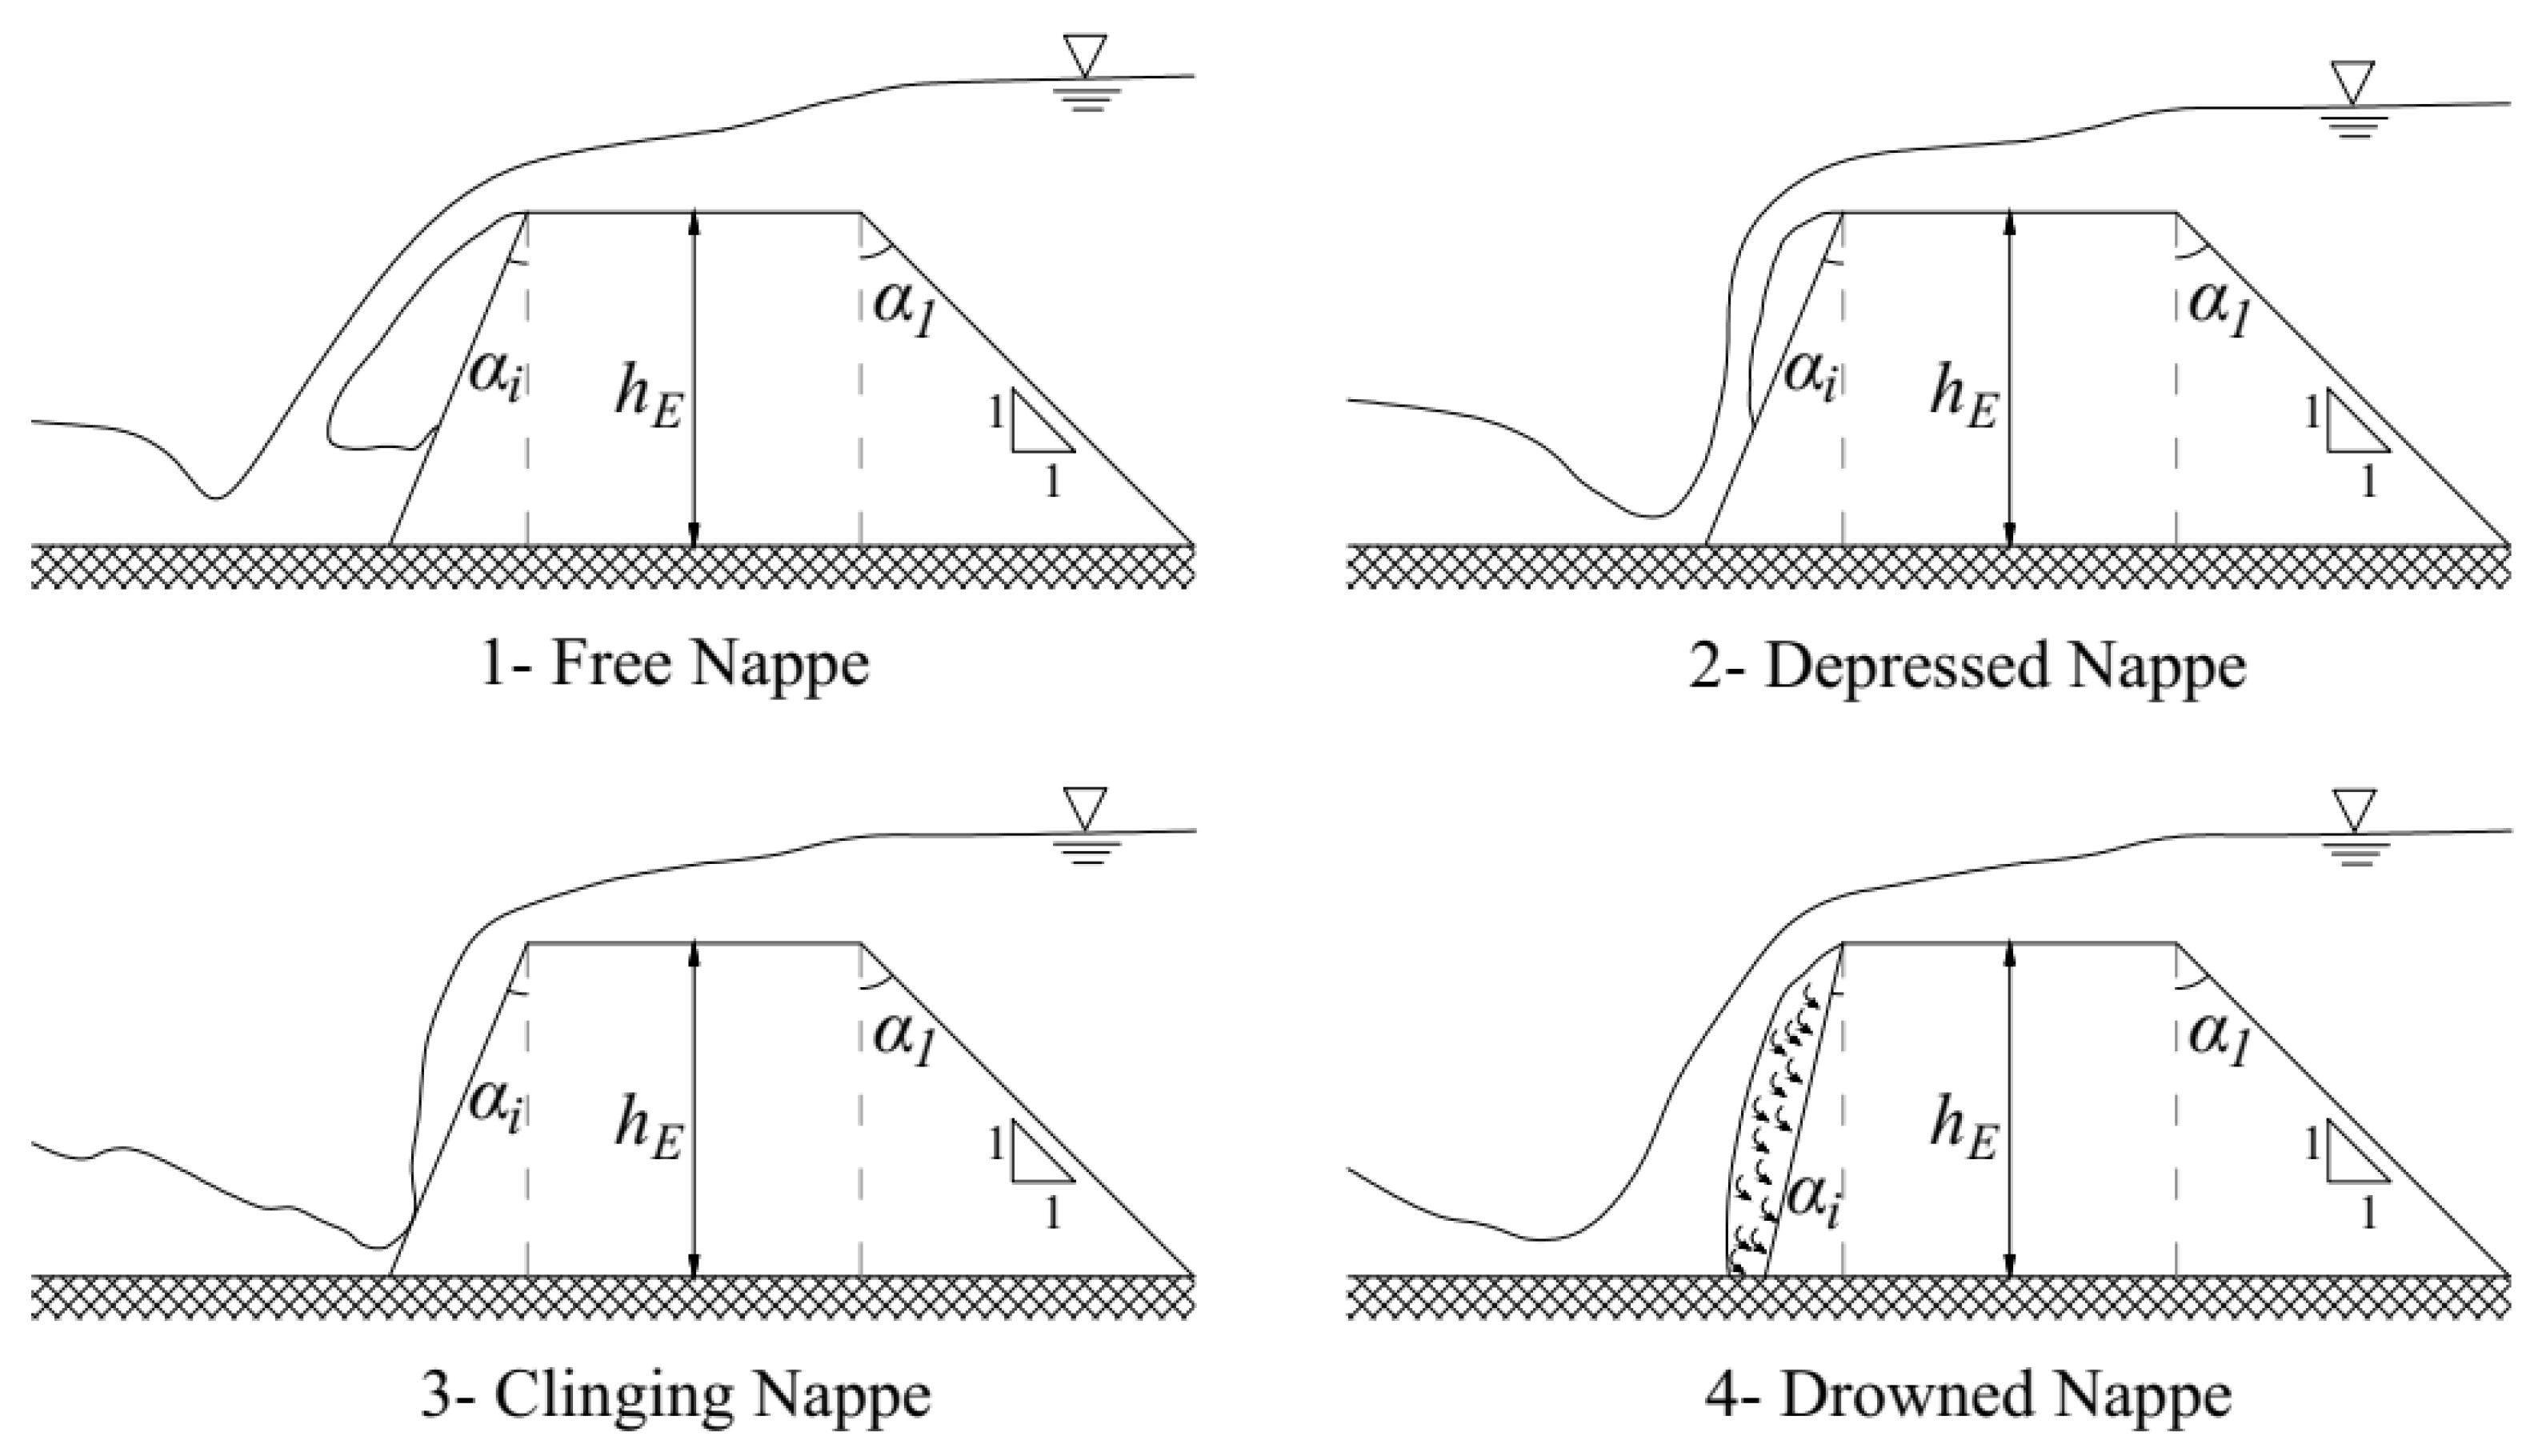
2.2.4. Nappe Flow and Its Properties

Nappe flow impinging jet is created by the relatively high velocity at the downstream brink edge when overtopping flow occurs over a broad crested weir with considerable drop height towards the downstream [17,18,19]. Nappe flow properties would be highly dependable based on the aeration beneath the nappe flow impinging jet’s lower profile and the kinetic energy induced by the drop height. To form a nappe flow, there should be a division of flow with the bounded section with straight channel bottom (crest of the EM) and unbounded downstream jet zone, which were created by lowering the downstream surface slope angle ( α i ) [19,22,23,24,36].
During the experiment, two flow jets have been observed: a fully air-entrained developed jet and a non-aerated undeveloped flow jet. This fully developed jet is highly dependable on the atmospheric pressure conditions on the free-falling water jet upper and lower boundaries [19,37]. This atmospheric pressure below the lower boundary of the jet directly contributed to the drop length ( L d ) of the nappe flow, impinging jets measured from the downstream brink edge of the EM crest. Following the experiment, we observed the first three types of nappe flow formation [36], similar to the schematic diagram in Figure 4.

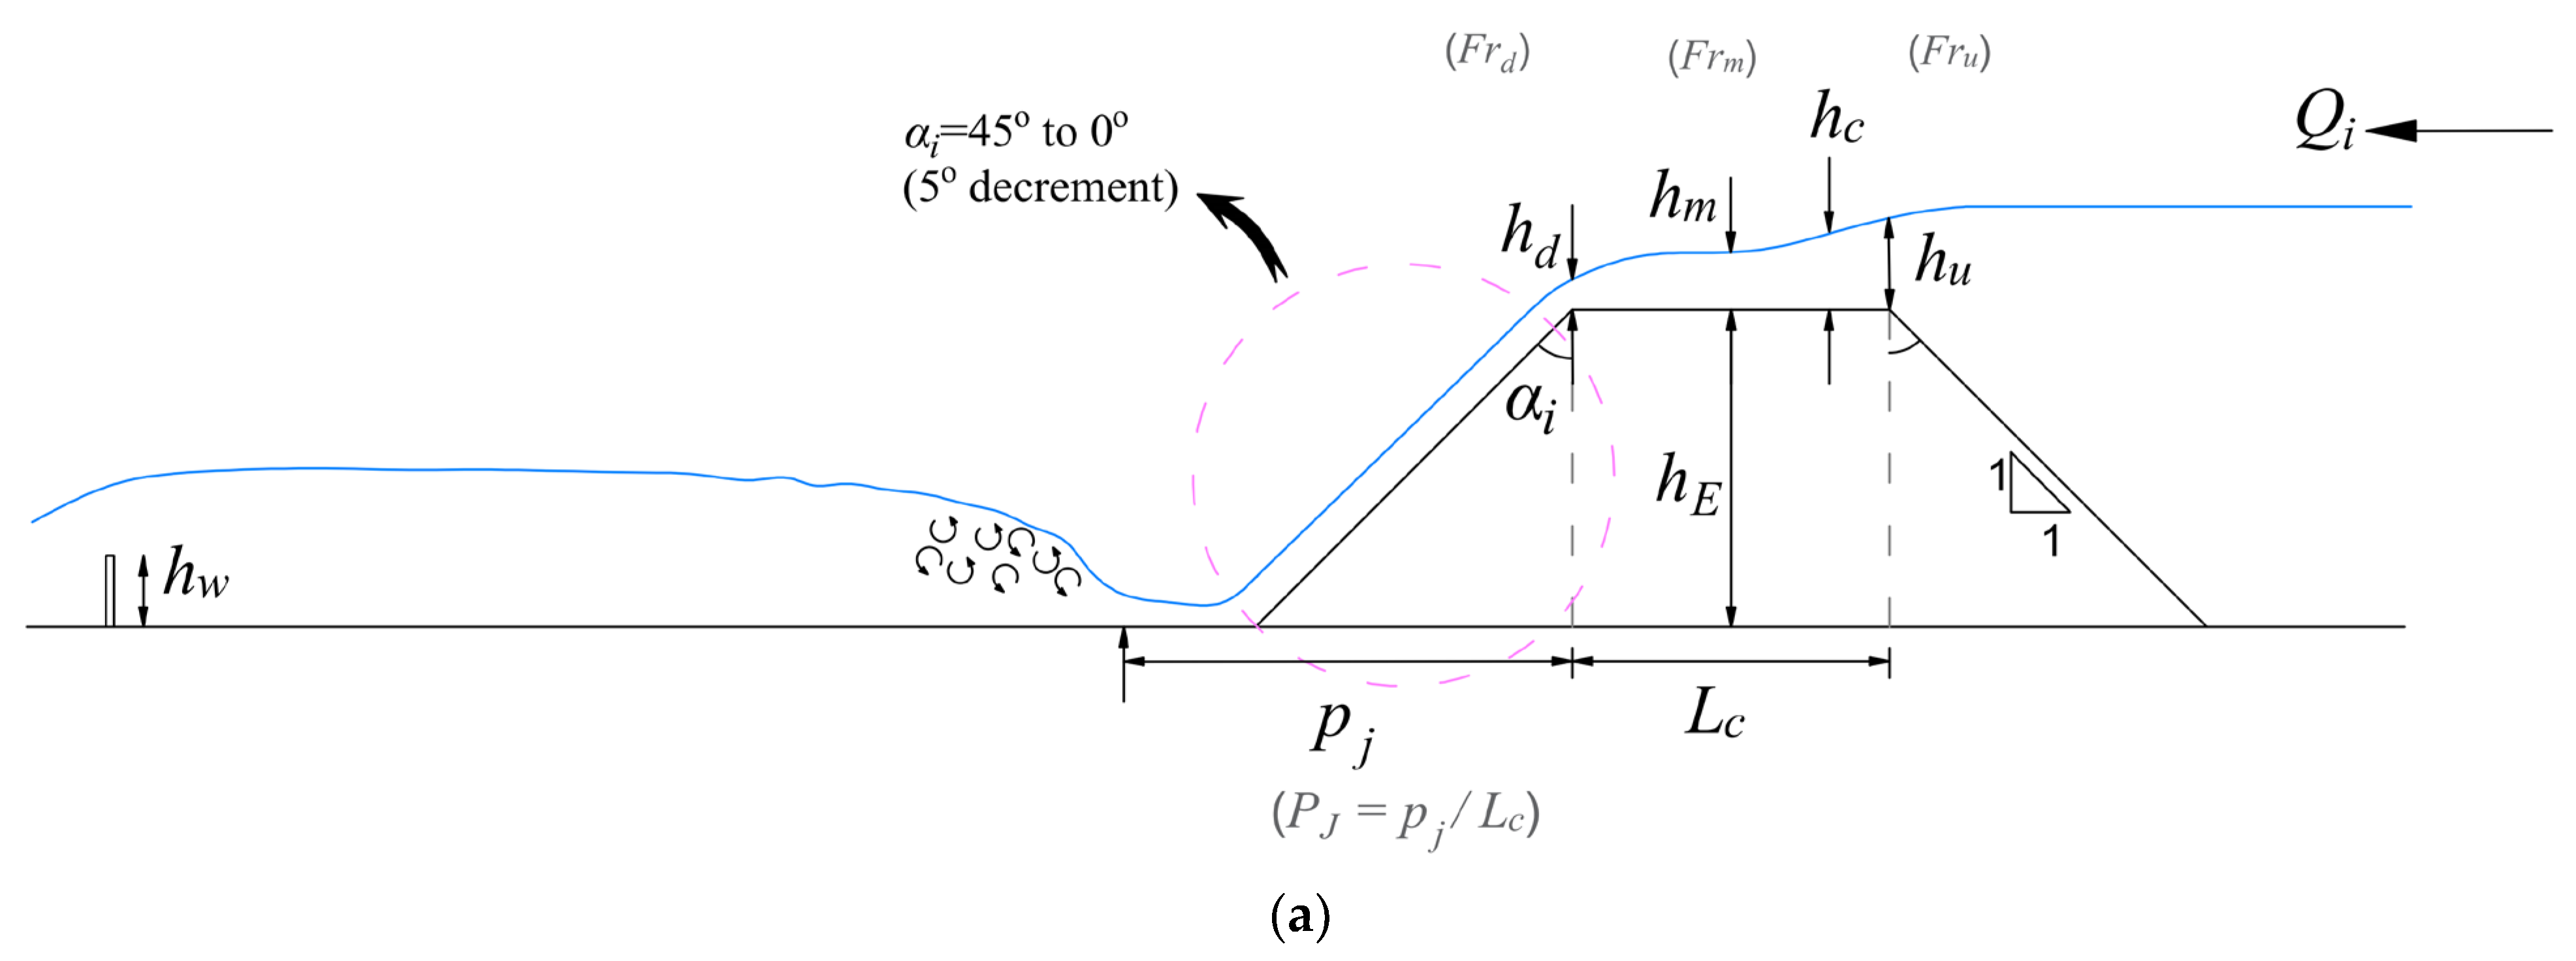
2.2.5. Position of the Hydraulic Jump

A hydraulic jump occurs when the flow in the open channel transitions from supercritical to subcritical. According to the Froude number, the hydraulic jump types for a rectangular prismatic channel with zero upstream and almost horizontal downstream slopes are categorized [38]. This experiment had a hydraulic jump in the plunge pool due to the weir fixed downstream when overtopping occurs (Figure 3a). As the jump is characterized by the development of large-scale turbulence, including roller vortex and turbulent eddies, the toe position of the hydraulic jump, i.e., the place where the jump started to develop, was measured from the downstream brink edge. In that case, when the clinging or depressed nappe conditions followed the overtopping flow, the hydraulic jump started near the downstream toe. Additionally, when the flow was observed in the free nappe conditions, the hydraulic jump started from the point where the impinging jet hit the plunge pool.

2.2.6. Energy Loss and Head Loss

Determining the defensive system’s efficacy as a function of mitigation from overtopping flow and energy reduction at any channel cross-section concerning the channel bottom can be measured using the following equation [38].
E = z + h + α V 2 2 g
where E is the specific energy, z is the elevation of the bottom, h is the depth of water, V is the depth-averaged velocity, and α is the co-efficient used to calculate velocity fluctuations. In this study, the value of α is considered 1.1, because all the vegetation models are single-layer models [39]. The experimental work by Chanson [40] was referenced to determine the energy loss caused by a nappe flow development over a downstream plunge pool as a total head loss through the system. This study introduced a method to calculate the downstream head loss (total energy loss) in a gated and untagged spillway when overtopping flow follows a nappe flow formation. Hence, the head loss due to the overtopping flow over the plunge pool downstream of the embankment can be calculated using the following equation [40].
Δ H H m a x = 1 [ 0.54   ( h c h s ) 0.275 + 3.43 2   ( h c h s ) 0.55 3 2 + H d a m h d ]
where Δ H is head loss (m), H m a x is the maximum head at the upstream, h c   ( = q w 3 / g 3 ) is the critical flow depth for a rectangular channel (m), h is the step height (m), H d a m is the dam height (m). According to the experiment we have done, the h and H d a m heights are similar in value of 0.4 m.

3. Results

3.1. Flow Properties at EM Crest

3.1.1. Changes in the Flow Structure by Overtopping and Nappe Flow Formation

Flow structure over the horizontal crest of no vegetation case (EM-NHC) was similar to the flow over a broad crested weir [41,42]. While reducing the downstream slope angle from 45° to 0° in 5° decrements, the overtopping flow was converted to an impinging jet (nappe flow). The most extended nappe length occurred for the EM-NDC at 0° slope case when the H m equals 0.05. This inclination of the crest further increased the nappe impinging jet drop length from downstream brink edge towards the plunge pool. In the EM-NDC case, quicker nappe flow was generated even for 45° of the downstream slope, similar to the depressed nappe (Figure 4). In the vegetation cases, while increasing the density of the vegetation model placed over the EM crest, the nappe flow impinging jet angle was increased, length to the jet impact location from the downstream brink edge (drop length) reduced, and the jet thickness changed due to the followed gradient by the water surface inside the vegetation model and downstream brink depth ( h d ).
The position of the hydraulic jump downstream has changed concerning the downstream brink depth, overtopping flow, EM crest geometry, and orientation. Considering the absence of vegetation cases, the higher L d value of the nappe flow was generated when the crest has (−)4% EM-NDC case. In the EM-NAC crest case, all the nappe, except when H m equals 0.15, in the 25° downstream slope case, the impinging jet has followed the properties of the depressed nappe condition while reducing the downstream slope angle ( α i ) 35° to 25°, except 45° to 35°. In (+)4% EM-NAC, EM-NHC, and all the vegetation cases (EM-VMS, EM-VMI, and EM-VMD), there was no nappe flow generation that occurred when the downstream slope reduced from 45° to 35°, except (−)4% EM-NDC case. After the 25° downstream slope angle ( α i ) up to the near-vertical position ( α i = 0 o ), in every case, including EM-NHC, EM-NDC, EM-NAC, EM-VMS, EM-VMI, and EM-VMD, the overtopping flow followed free nappe or fully developed nappe (Figure 4) condition just after the downstream brink edge. Flow throughout the model setup maintained a sub-critical flow condition for all the cases at the upstream brink edge of the EM, in which the Froude number ( F r u ) has a range of 0.2 to 0.7. Additionally, for all the cases, at the downstream brink edge, flow followed a supercritical flow condition over the EM crest, with Froude number ( F r d ) ranging from 1.0 to 2.6. In the downstream plunge pool area, flow followed a sub-critical flow condition for every case, and its Froude number ( F r ) ranging between 0.6 to 0.75 due to the water cushion effect.
Considering the nappe flow formation, Abdalla and Shamaa [19] have described the impinging jet types. This experimental study occurred the clinging nappe, depressed nappe, and free nappe flow conditions (Figure 4) with different geometrical properties over the EM crest [36]. Keeping free nappe is the safest flow structure out of these three nappe flow conditions. After exiting from the crest, free nappe converted the massive fluid force of the incoming tsunami wave overtopping flow into a thinner jet flow when compared to the flow depth upstream of the EM. This jet hit the downstream plunge pool within a specific limited area concerning the overtopping depth and the crest geometry. EMNDC crest slope can make a quicker free nappe due to the provided slope concerning the overtopping depth. Meanwhile, when increasing the density of the vegetation, the nappe flows impact location (value of L d such as the drop length) became closer to the toe of the EM. This demonstrates that the vegetation requires a shorter distance to dissipate the energy of the overtopping flow at the downstream plunge pool. Table 4 below summarizes the first free nappe formation conditions concerning the crest geometry and overtopping depth (similar value in given flow discharge through the experimental setup at the initial condition). In Table 4, critical brink depth ( d b , c r ) is identical to the downstream brink edge water depth ( h d ), and critical angle ( θ c r ) is the downstream slope angle ( α i ) where the first free nappe has occurred.

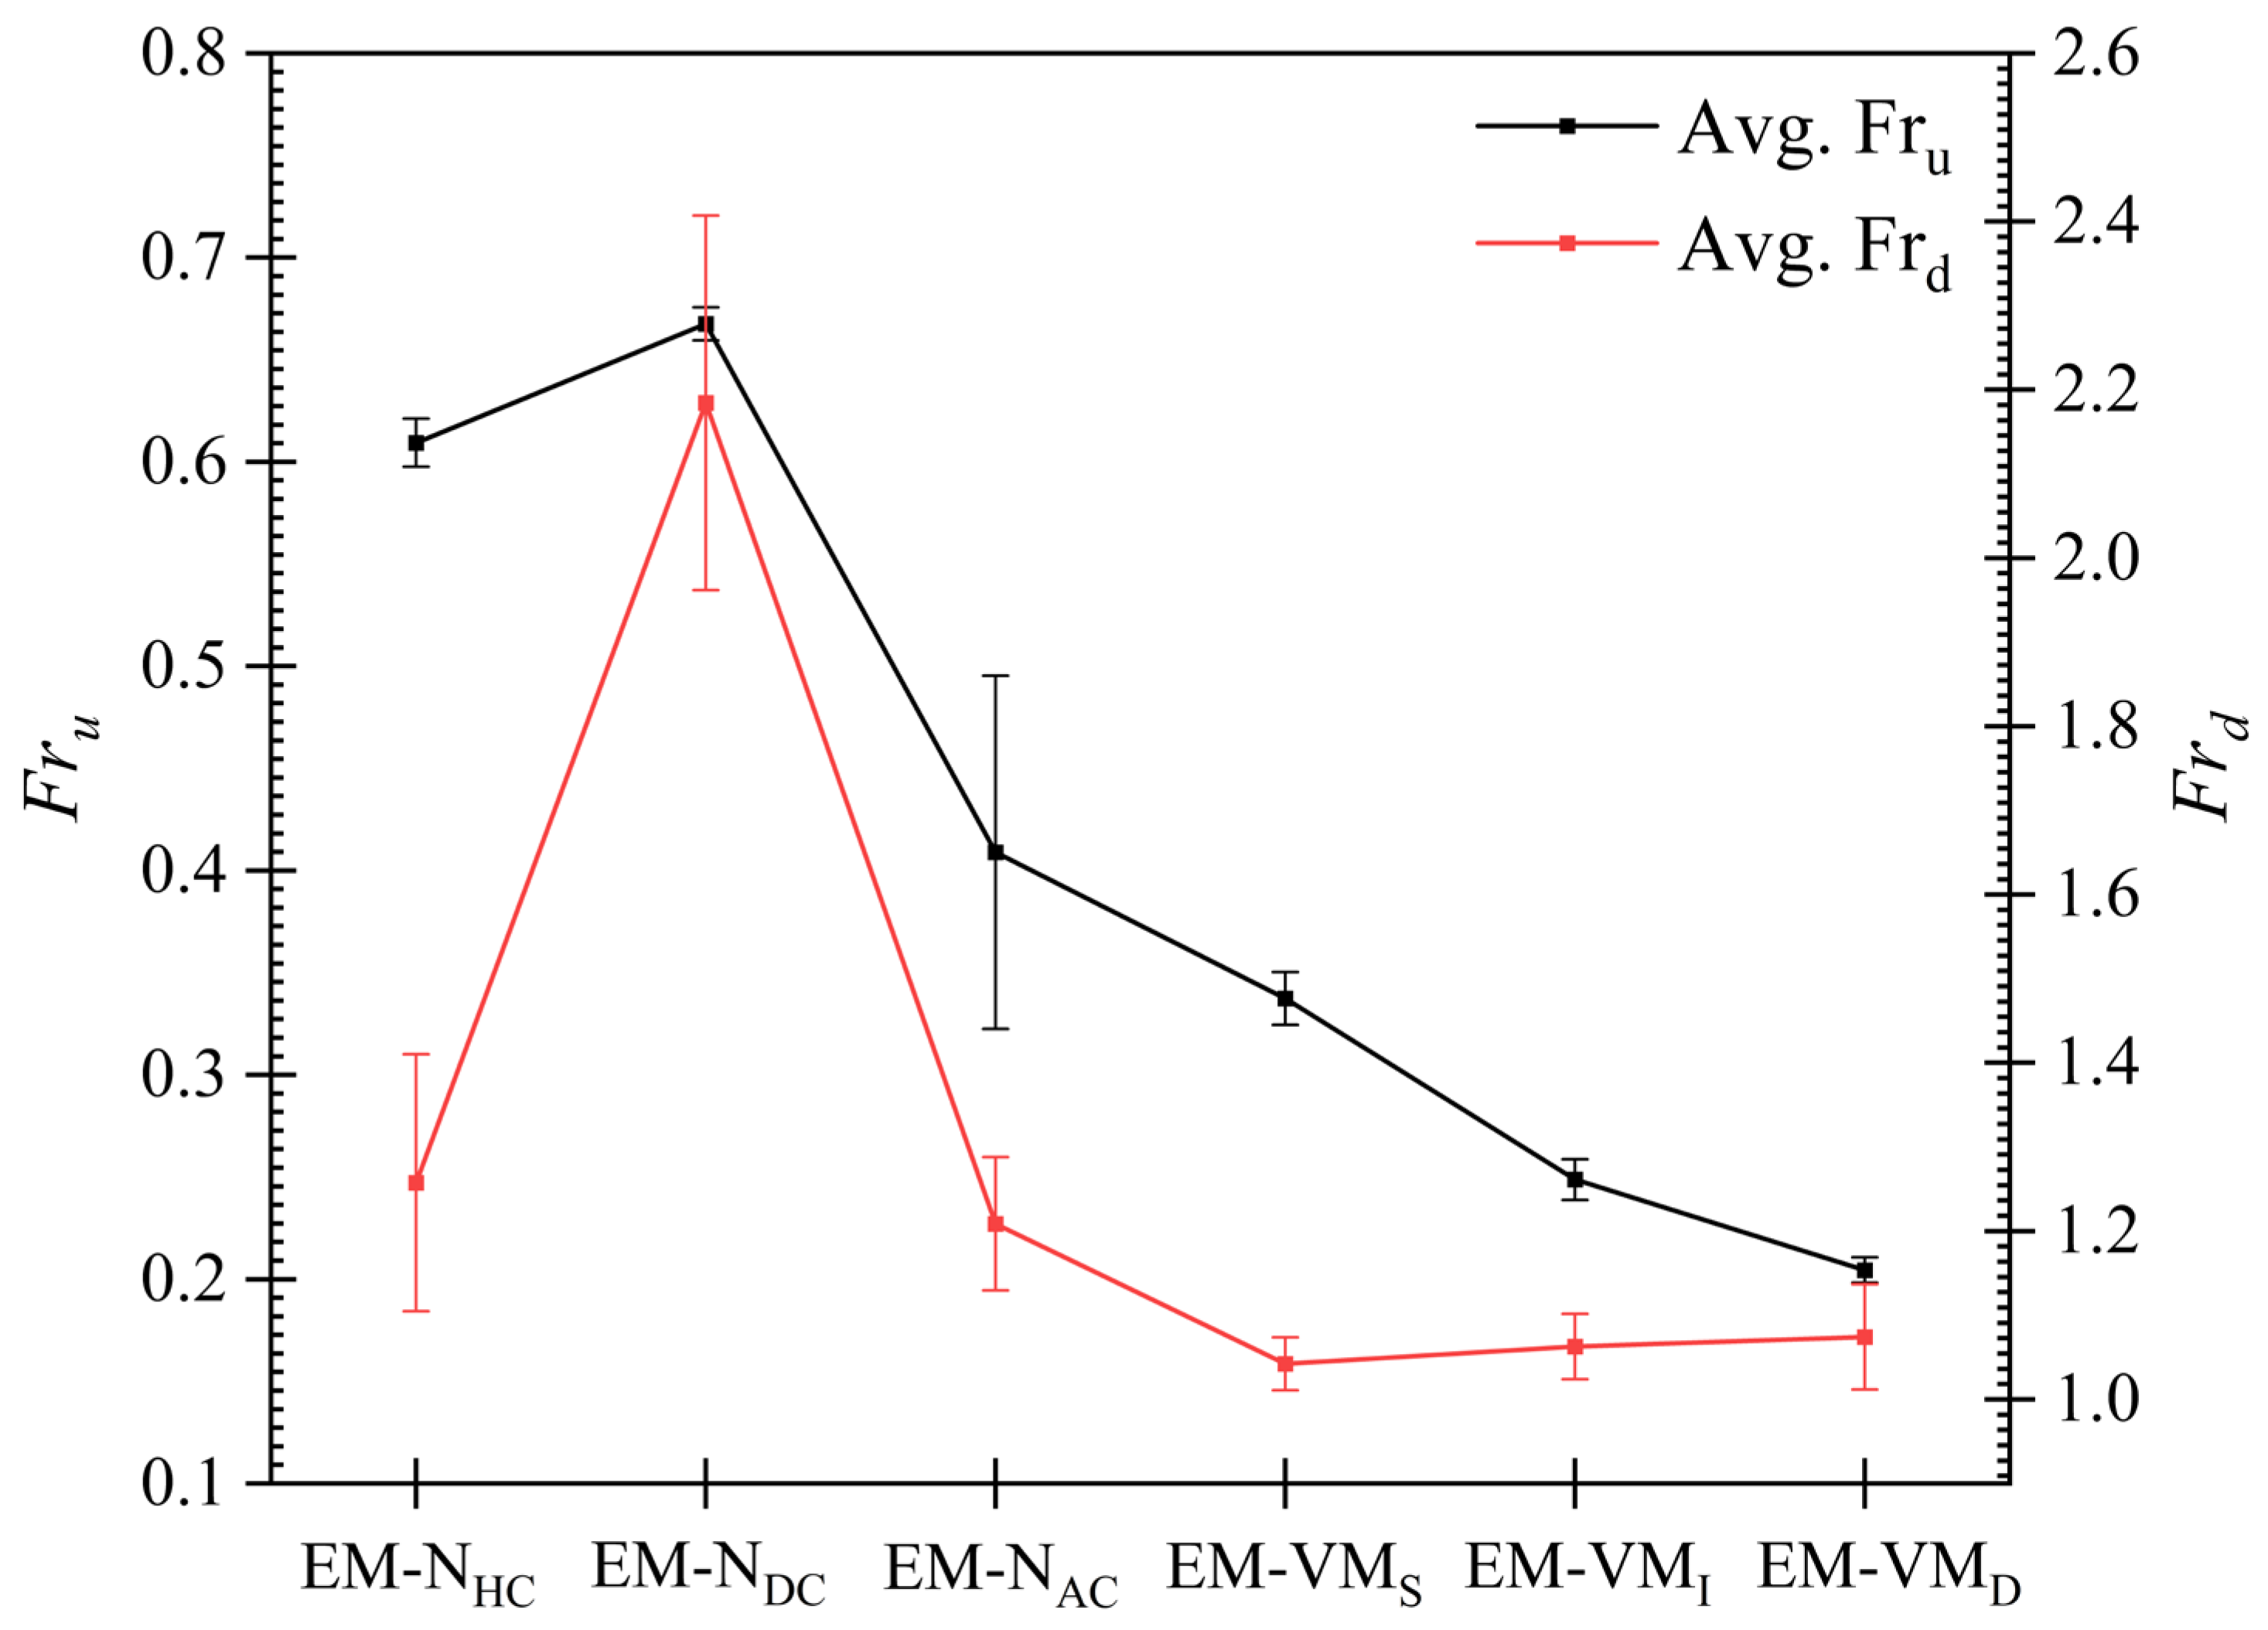
3.1.2. Froude Number and Critical Depth

According to Figure 5, this section explains the behavior of the Froude number across the EM crest at the downstream and upstream brink edges. Additionally, referring to Figure 6 compares the Froude number to identify the location of the critical Froude number ( F r c ) at the crest of the embankment for each case, including EM-NHC, EM-NDC, EM-NAC, EM-VMS, EM-VMI, and EM-VMD concerning the downstream brink edge water depth ( h d ). The initial case of this experimental study was a horizontal crest with no vegetation, with a 1:1 slope of both the upstream and downstream surfaces of the EM (Figure 2a). The average Froude numbers at the upstream brink edge ( F r u ) and downstream brink edge ( F r d ) concerning the cases (shown in Table 2 and Table 3) are plotted in Figure 5 according to the schematic Figure 2.
Referring to Figure 5, as described in the Section 3.1.1, for all the cases, the Froude number at the upstream brink edge maintained a sub-critical flow condition, and the downstream brink edge maintained a supercritical flow condition. Concerning the values in Figure 5, the highest Froude number for upstream and downstream occurred for the (−)4% slope EM-NDC case. Due to the induced crest slope (Figure 2b), it further accelerated the flow velocity and reduced the flow depth. Next, for the (+)4% slope, the EM-NAC case maintained a Froude value in supercritical conditions but was less than the EM-NHC and EM-NDC due to the increased flow depth by the inclined slope and the provided resistance by the geometrical change against the free surface flow. For all the vegetation cases, the F r u value ranges between 0.20 to 0.34, and the F r d value ranges from 1.04 to 1.07, which indicates that the critical Froude number ( F r c ) for the vegetation cases was located near the downstream brink edge but inside the VM.
Figure 6 defined the average behavior of the critical depth ( H C ) over the crest of the embankment concerning the normalized overtopping depth H m ( = h m / h E ) , which was based on the geometrical constraints considered in the experimental setup (Figure 1 and Figure 3). For the EM-NHC and (+)4% slope EM-NAC cases, critical flow depth was shifted towards the location between the upstream brink edge and mid-section of the EM crest according to the plotted results. For the (−)4% slope EM-NDC case, the H C value was further moved towards the upstream brink edge with increasing H m compared to the other two no-vegetation crest cases (Figure 5, F r d   a n d   F r u values of EM-NHC and EM-NAC). When considering the vegetation cases, with the increasing density, the H c value significantly changes within the first three over topping depths for all the vegetation cases (EM-VMS, EM-VMI and EM-VMD). Because of the increased density, the downstream brink edge is lower in EM-VMI and EM-VMD than in EM-VMS for the first three overtopping depths. Hence, critical depth recorded lower values and increased for EM-VMI up to the third H m value of 0.10. Next, EM-VMI followed the same pattern as EM-VMS, which refers to H c value of EM-VMS and EM-VMI that were lying significantly closer to the downstream brink edge, but inside the vegetation model, the H c value was closer to the h d value. However, in the EM-VMD case, when the H m value was between 0.125 and 0.15, critical depth h c is almost near to the downstream brink edge water depth h d , referring to Figure 6.

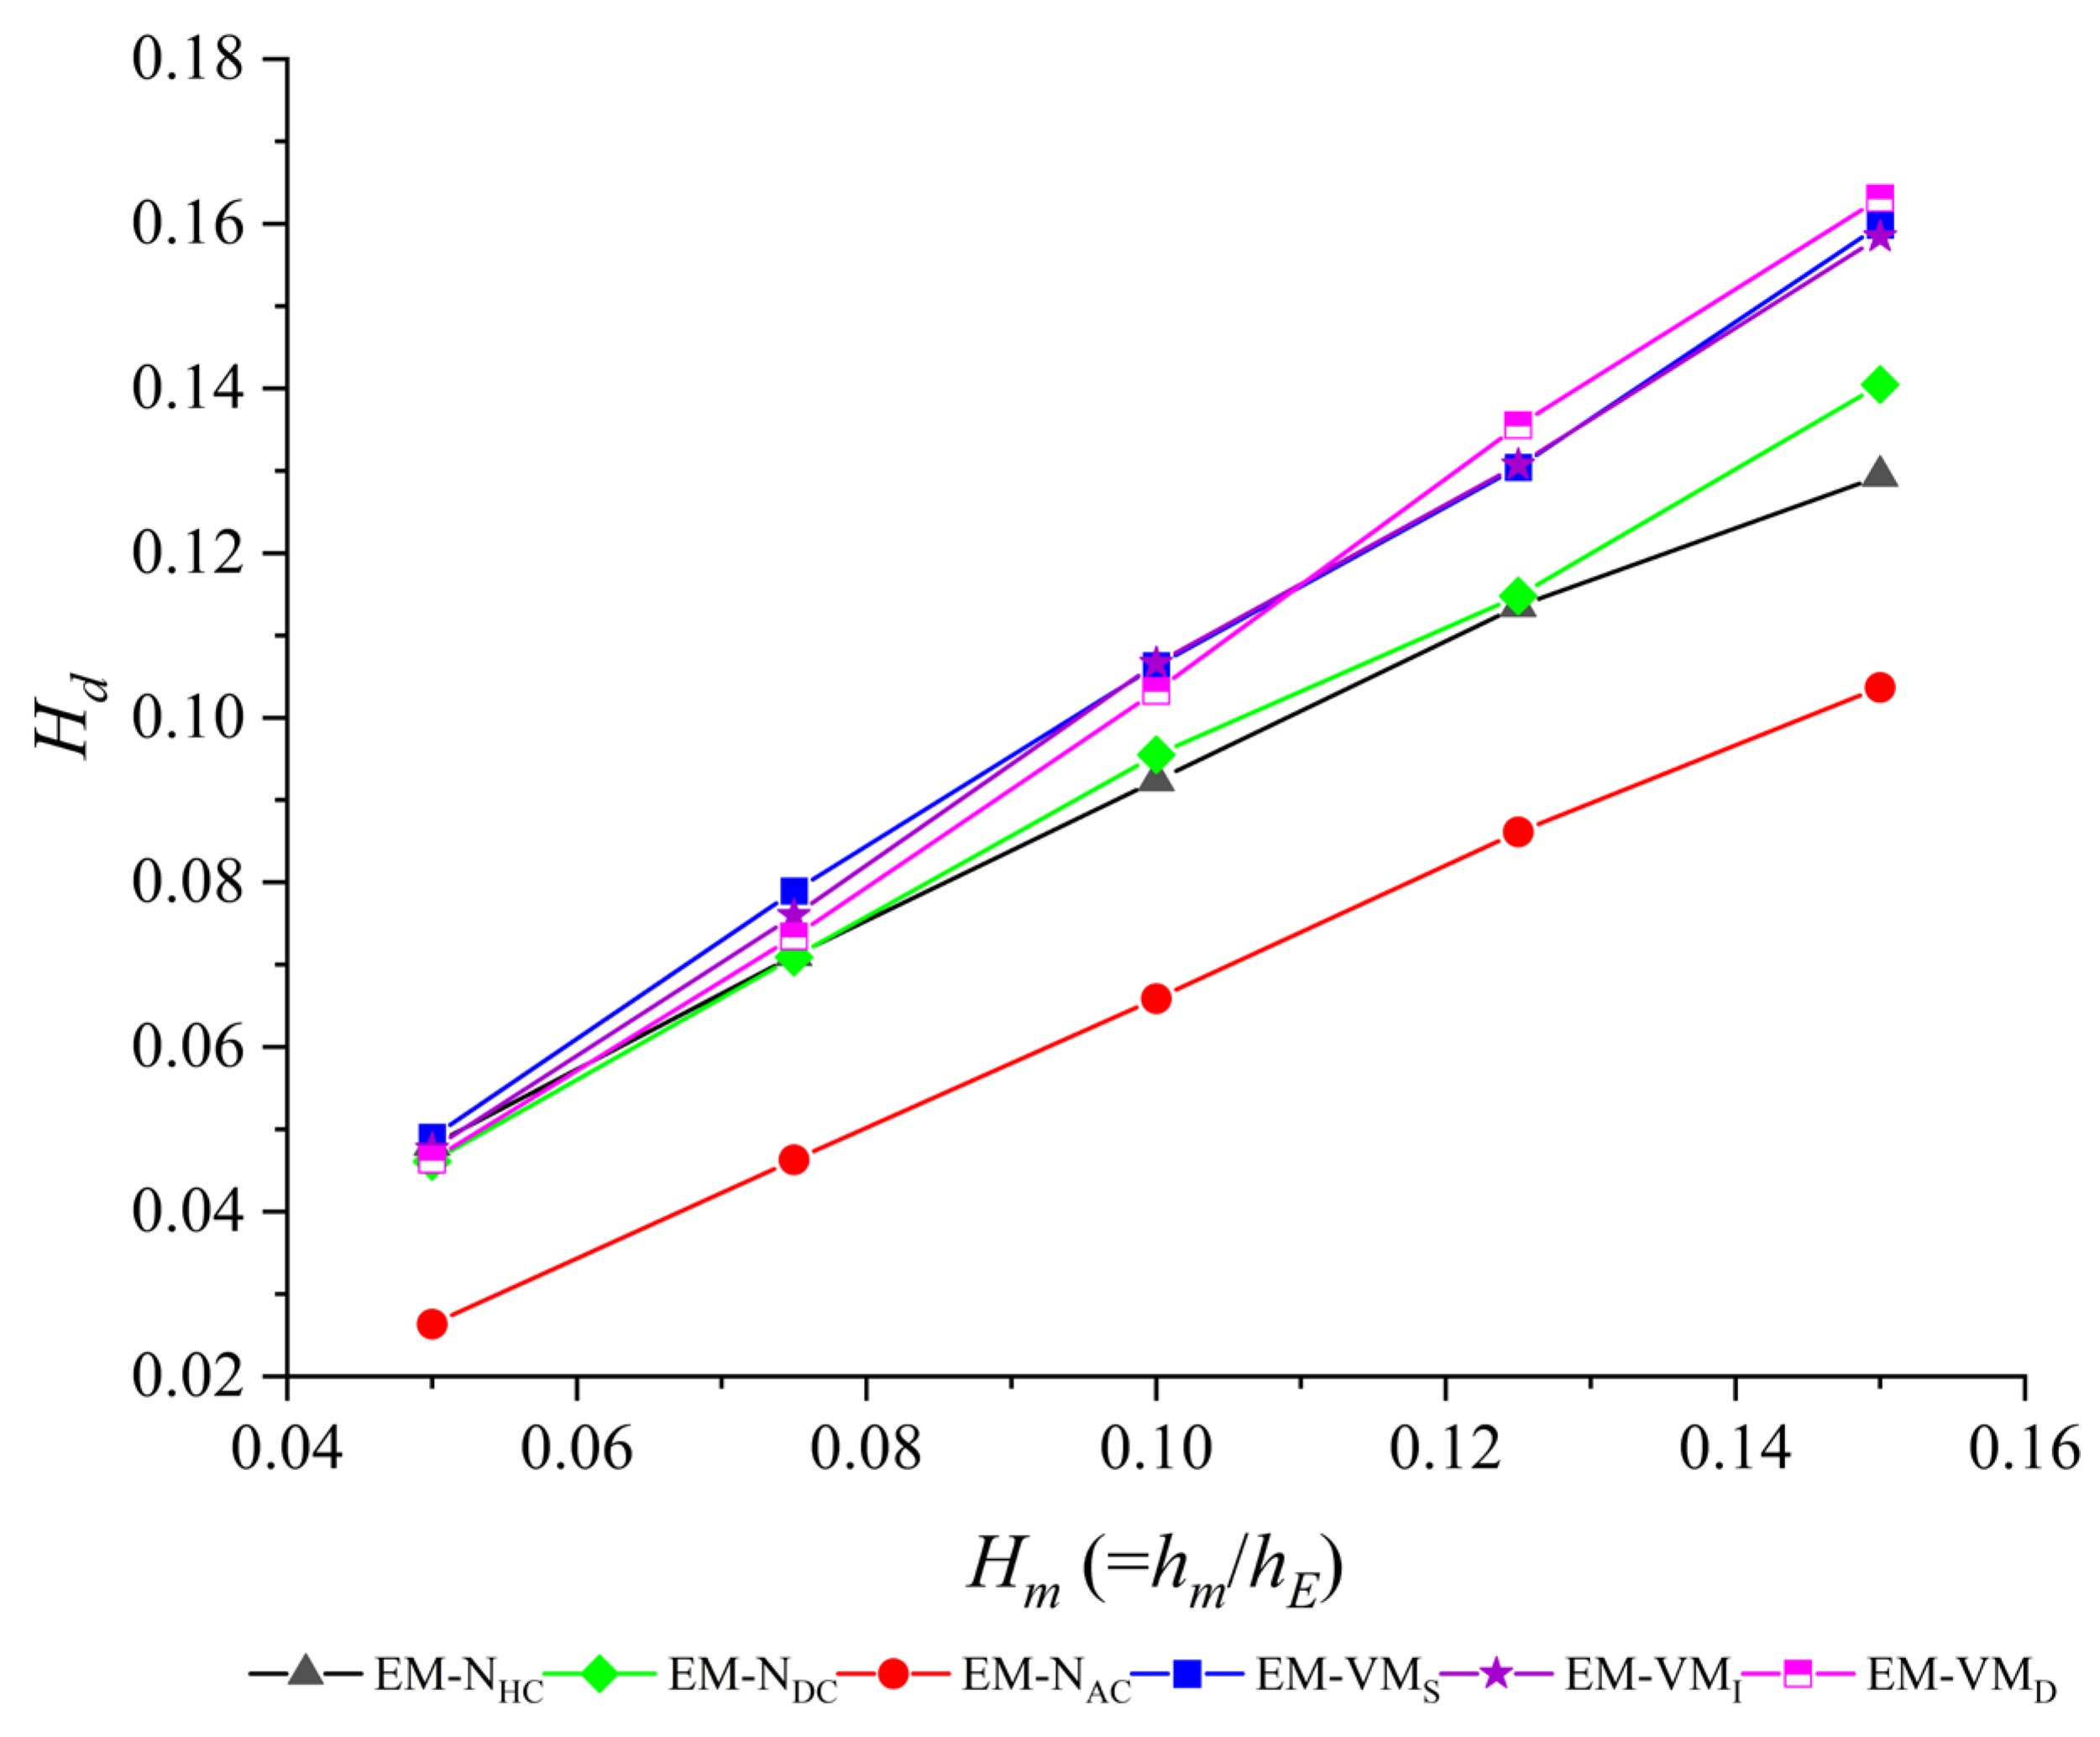
3.1.3. Effect of the Crest Orientation and Geometry on the Water Depth at Downstream

Figure 7 illustrates the normalized water depths at the downstream H d   ( = h d / h E ) brink edge of the embankment against the normalized overtopping depth H m (= h m / h E ). As mentioned earlier, flow structures for the no vegetation cases (EM-NHC, EM-NDC, and EM-NAC) were similar in flow over the broad crested weir [22,23,42]. In such a case, the critical Froude number ( F r c ) moved towards the upstream brink edge, and flow over the downstream brink edge is supercritical (Figure 3 and Figure 6) with increasing discharge.
According to Figure 7, the lowest H d was generated for the (−)4% EM-NDC crest case due to its induced slope over the crest (Figure 6). The normalized downstream brink edge water depths ( H d ) were nearly similar in value in each vegetation case of EM-VMS, EM-VMI, and EM-VMD, respectively, according to Figure 7. The reason there are equal values for the downstream brink edge water depths is the selected densities of the vegetation models, which have a unique interval of its dn number value as 180 (EM-VMS), 380 (EM-VMI), and 580 (EM-VMD) No.cm, respectively. However, the total resistance provided by each vegetation model has dramatically changed against the overtopping flow within a shorter distance (0.4 m width of EM crest) due to the staggered arrangement of the vegetation (Figure 2b). The vegetation, by its staggered arrangement, drastically increased the upstream brink edge water depth ( h u ) while increasing the corresponding discharge of selected overtopping depth ( h m ), which follows a steep gradient with respect to the density concerned (Table 3) [22,23,36]. This followed steep gradient with vegetation over the crest further reduces the volume of water passing over the embankment towards the downstream. This reduces the energy downstream further, with increased density and flow discharge. According to Figure 6, the normalized critical depth ( H c ) behavior concerning the H d for all the vegetation cases is near 1.0. That means critical depths were located near the downstream brink edge in all the vegetation cases. As a result, the H d value for all the vegetation cases of EM-VMS, EM-VMI, and EM-VMD was nearly similar.

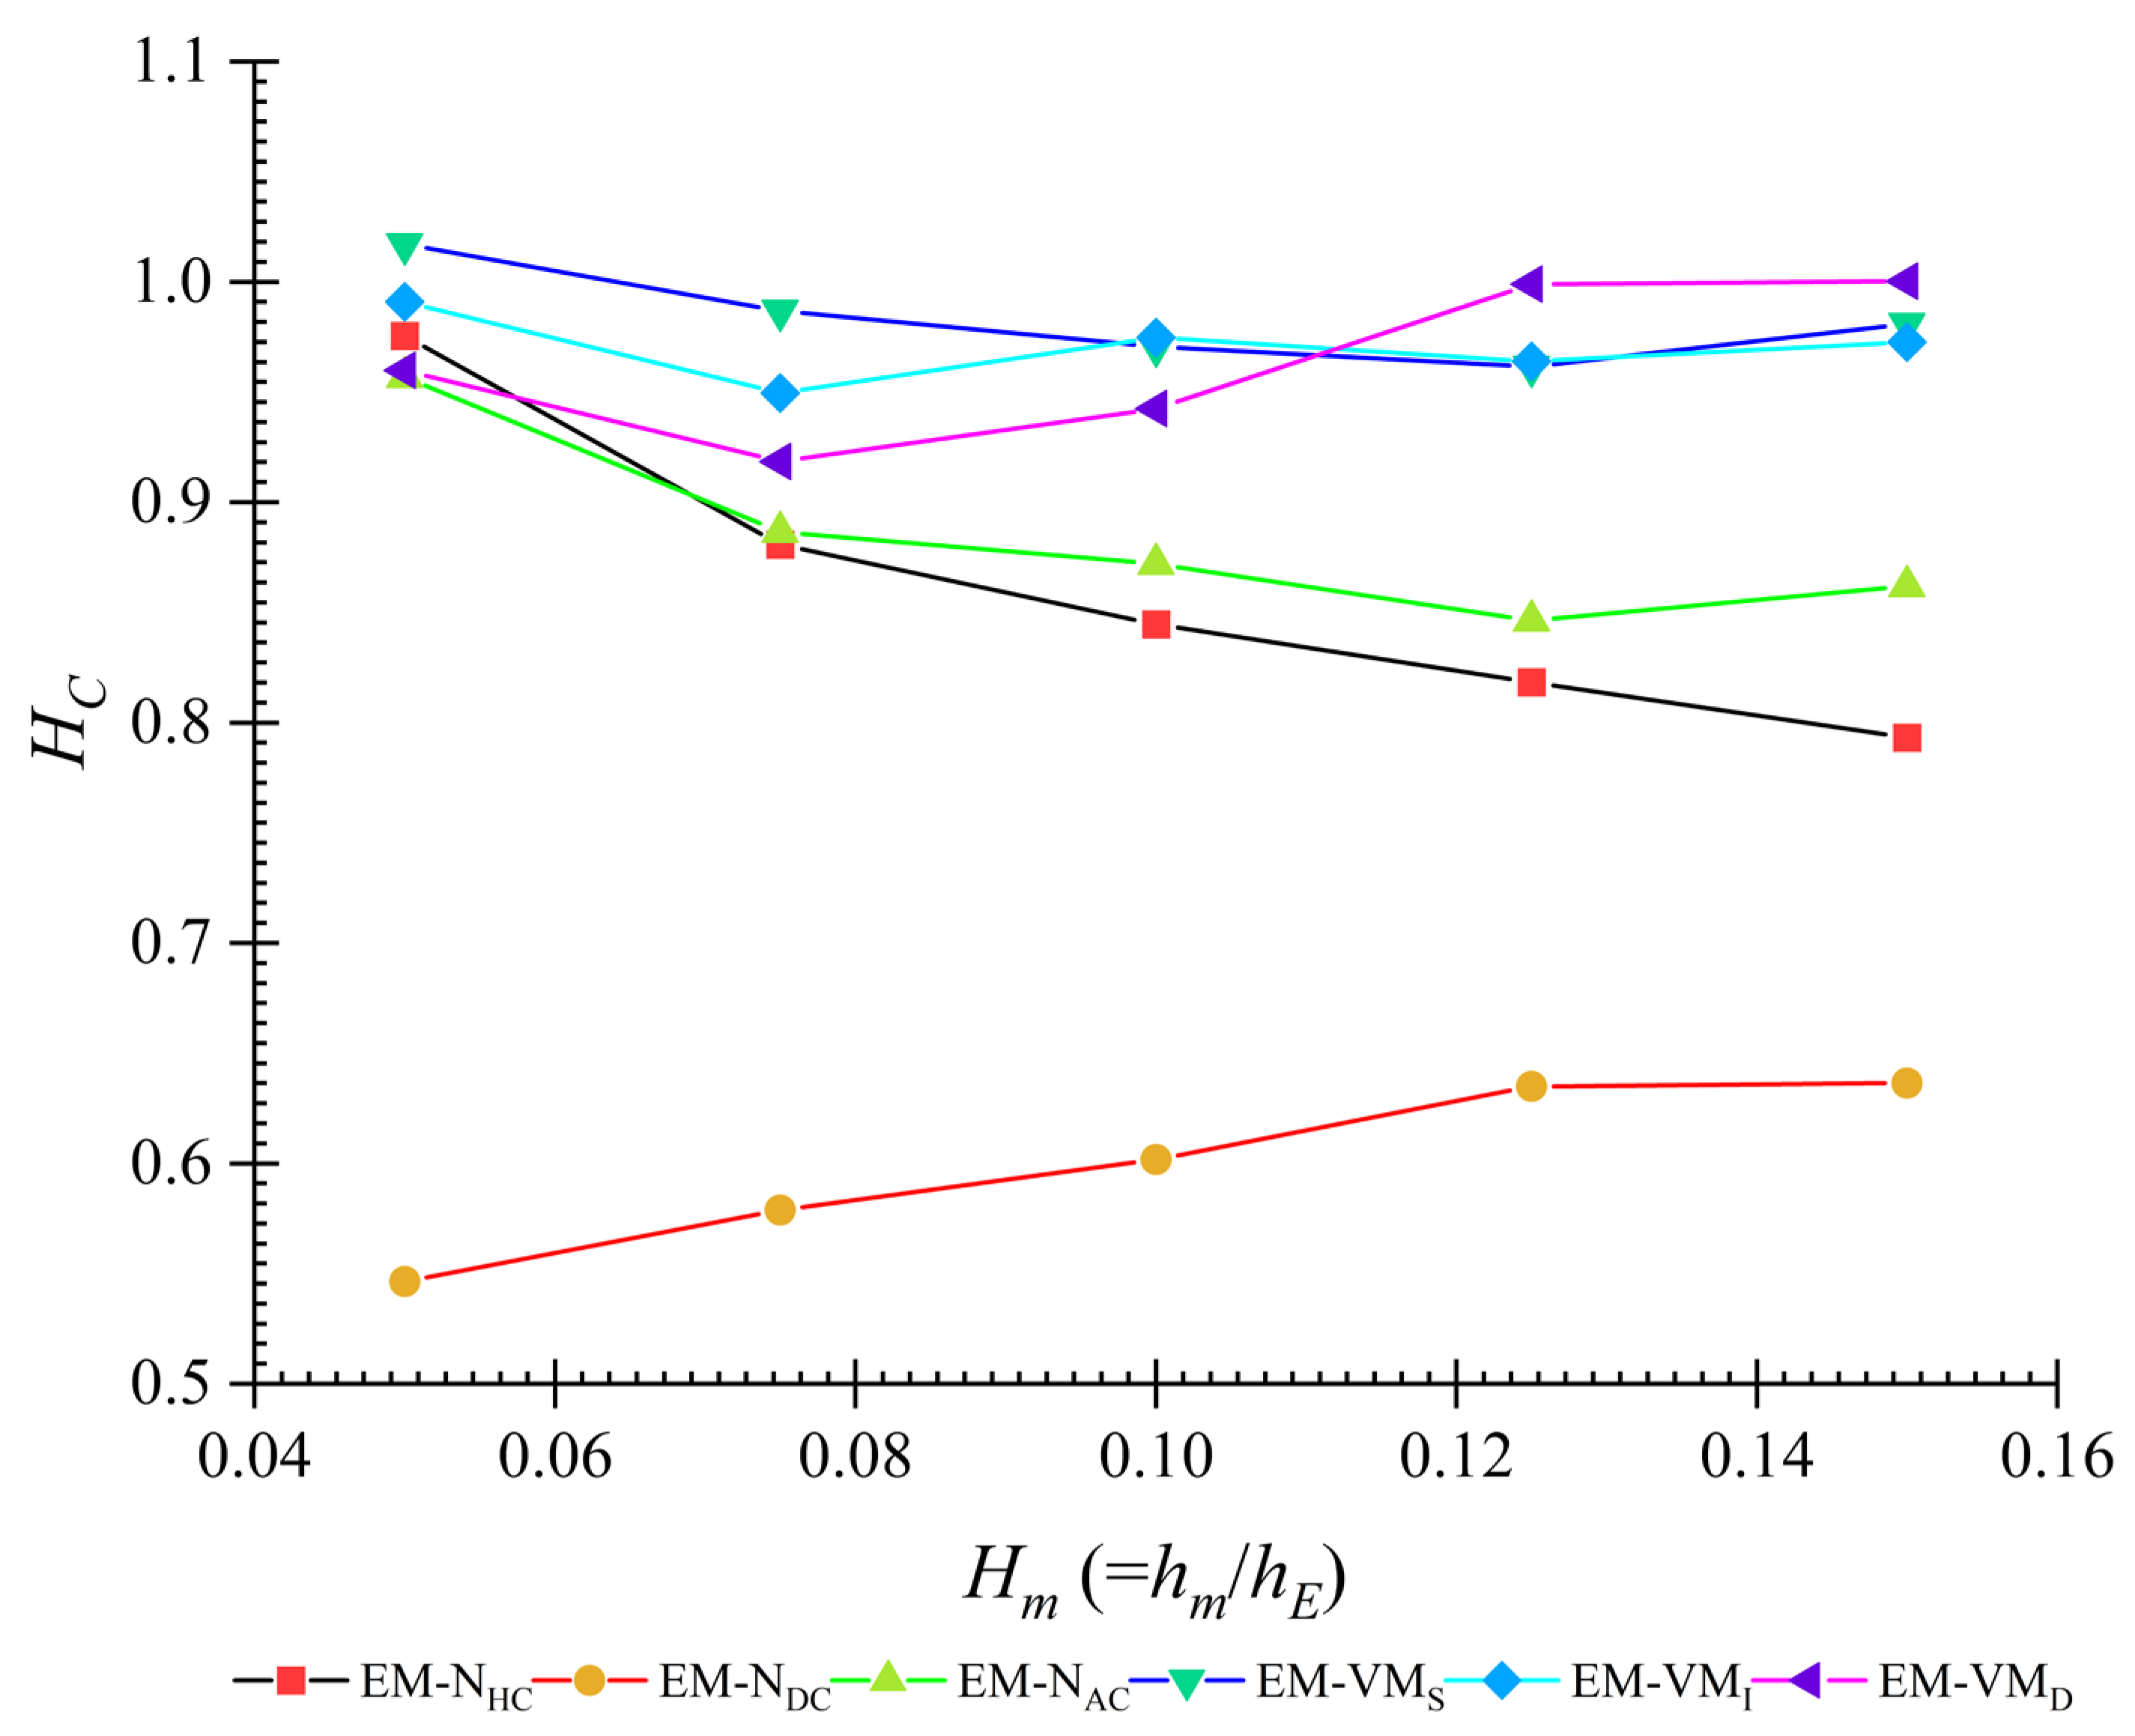
3.1.4. Energy Reduction over the Embankment Crest by Overtopping and at the Downstream Plunge Pool

Figure 8a describes the normalized specific energy reduction at the downstream brink edge   Δ E d / E u   against the normalized overtopping depth H m for all the cases while reducing the downstream slope from 45° to 0°. E d is the downstream brink edge specific energy and E u is the upstream brink edge specific energy. The highest specific energy reduction was found when the dense vegetation (VMD) model was at the embankment’s crest. Due to its porosity (Pr = 95.65%), the dense vegetation model provided additional resistance to the flow, and upstream water depth has the maximum value with respect to the water surface gradient inside the VM (Figure 5 and Table 3). Hence, in the VMD model, normalized energy reduction ( Δ E d / E u ) is more significant than 0.5 in the other cases (Figure 8a). The normalized energy reduction at the downstream brink edge by the VMI and VMS models was higher than 0.4 to 0.3, respectively. Meanwhile, the worst case was that the crest had (−)4% descending slope (EM-NDC) towards the downstream and flow was accelerated further due to the downward slope introduced at the crest. Due to this extra acceleration, velocity was increased at the downstream brink edge compared the other two no vegetation cases (EM-NHC and EM-NAC) while varying the overtopping flow depth. This increased velocity increases the flow energy contribution over the specific energy at downstream brink edge in comparison to the upstream brink edge specific energy value concerning the Equation (1). Hence, the normalized energy reduction in (−)4% slope EM-NDC case was given a negative result from positive while increasing the value of H m . On the other hand, the provided geometrical change over the crest surface was insufficient to control the flow over the crest in EMNDC cases compared to EM-NHC and EM-NAC cases (Figure 8a).
Figure 8b shows the mean value of the head loss H L   ( = Δ H / H m a x ) in the downstream plunge pool of the embankment when the fully developed nappe flow regime occurred concerning the normalized downstream brink edge water depth H d   ( = h d / h E ). This was calculated concerning the mean of the downstream brink depth according to Chanson’s Equation (2) [40]. The average head loss can be defined as the difference between the maximum head (head upstream of the embankment) and the head at the downstream plunge pool of the embankment. For a given embankment height, the energy dissipation rate due to the head loss decreases as the overtopping depth increases [40]. Additionally, the head loss influences the crest geometry. According to Figure 6, head loss increases mean high energy reduction, and head loss decreases mean low energy reduction while increasing the value of H m . This relationship agrees well with the Chanson [40,43] experiment results. The vegetation models gave the highest head loss. Out of these three vegetation models, the dense vegetation model (VMD), which has a porosity of 95.65%, was recorded as the highest head loss reduction method. Comparing the cases of no vegetation at the crest, the lowest head loss reduction was given by the (−)4% crest slope case (EM-NDC), and the highest head loss reduction was provided by the (+)4% crest (EM-NAC) case due to the geometric properties of the crest.

3.1.5. Position of the Hydraulic Jump at Downstream

Figure 9a,b represent the formation of the hydraulic jump at the downstream plunge pool for the (−)4% EM-NDC and (+)4% EM-NAC crest, where the downstream surface slope ( α i ) equals 10° at the highest overtopping depth ( H m = 0.15 ). According to the crest orientation and geometry, the hydraulic jump-starting position has changed downstream. It was indicated by the red color arrow and a dotted line in Figure 9a,b. According to Figure 9, the jump’s position is directly influenced by the crest geometry and orientation concerning the downstream surface angle. Figure 10a,b show the results of the variation of the normalized position of the hydraulic jump ( P J ) concerning the normalized overtopping depth ( H m = h m / h E ) for 25° and 10° downstream surfaces slopes cases. The lowest H m value ( H m = 0.05 ) for both cases of 25° and 10° position of the hydraulic jump recorded the highest value. The normalized position of the hydraulic jump P J ( = p j / L c ) relates to the type of the nappe flow and the angle of the downstream surface slope. If the nappe flow follows the depressed or clinging nappe property (Figure 4), the hydraulic jump started on the downstream surface near the downstream toe of the embankment. At the free nappe condition, as shown in Figure 9a,b, the hydraulic jump started after the position where the nappe flow hit the downstream plunge pool.
Therefore, the non-dimensional position of the hydraulic jump values has minor deviations to the nappe flow impinging jet impact distance (drop length, L d ) measured from the downstream brink edge for free nappe conditions. In contrast, for clinging or depressed nappe conditions, the hydraulic jump position equals the distance of the toe from the downstream brink edge. The starting position of the hydraulic jump is always within the 0.4 m distance from the downstream brink edge of the embankment towards the flow. The hydraulic jump formation throughout the experiment series was similar to the submerged hydraulic jump conditions due to the installed weir downstream. The primary purpose of the installed weir downstream (Figure 2) was to create a plunge pool to identify the hydraulic jump characteristics during the nappe flow formation. This is similar to the effect of the water depth behind the free nappe (between the bottom surface of the impinging jet and the downstream embankment surface) flow. This was not covered in the paper because this parameter significantly impacts movable bed condition experiments but not fixed bed studies. To evaluate the damage to the structure relevant to the jump position, the pressure gradient should be measured at the jump-starting location (pressure changes at the impinging jet impact position) in the plunge pool concerning the geometrical changes considered in the experimental setup. However, due to the lack of facility, we could not catch the pressure gradient changes at the plunge pool near the jump-starting position in the experimental flume.

3.2. Nappe Flow Properties

There was a significant change in the physical properties of the nappe flow with the changes in the crest geometry and arrangement. Similar to nappe flow impinging jet thickness ( d j e t ), the impinging jet angle ( β i ) and drop length ( L d ) were changed while varying the EM crest conditions and flow. Nappe flow impinging jet follows a projectile motion in this fixed bed experiment, even changing the crest conditions. In addition, nappe flow impinging jet properties depend on the depth of water at the downstream brink edge of the crest, fallen height, and volume of air under the impinging jet lower profile while reducing the downstream slope [19,24,35,40,44]. Out of these, embankment height ( h E ) plays a significant role in the nappe flow properties, mainly on L d and d j e t . The physical properties of nappe flows were calculated using the second measurement methodology, as described in Section 2.2.2. The first one was direct measurement from gauge reading on flume glass-sided wall and the second one used high-resolution captured images for analysis using the ‘’ImageJPro’’ (software developed by the National Institutes of Health and the Laboratory for Optical and Computational Instrumentation, LOCI, University of Wisconsin, Madison, WI, USA). Due to the flume characteristics and lack of facility, we unable to capture the pressure development under the lower profile of the nappe impinging jet concerning the overtopping water depth and crest geometry considered. Therefore, it was difficult to compute the sensitivity of the nappe form with respect to the experimental measurements except defining the physical properties, as mentioned in above.

Variation of the Nappe Flow Drop Length, Thickness, and Impinging Jet Angle

Table 5 tabulated the change of L d with normalized overtopping depth H m (= h m / h E ), including different geometries for 25° and 10°. To compare and reveal the distinctive features of the physical properties of the flow structures, 25° and 10° downstream slope cases were selected. The reason to choose the 25° downstream surface slope angle case for the comparison is that formation of visible nappe flow, either depressed or free nappe, has formed most of the crest conditions of the embankment model. With the different geometries and crest conditions of the embankment, when overtopping and downstream slope changing occurs, a massive volume of water converted into a jet flow, i.e., nappe flow. This nappe flow property of Ld depends on the discharge, downstream brink depth, height of the EM, and crest geometric conditions. For the 25° downstream surface slope, the horizontal distance to the jet impact location from the embankment brink edge for the initial setup (EM-NHC) and all the three vegetation cases (EM-VMS, EM-VMI, and EM-VMD) varied between 66 to 272 mm. For (+)4% crest slope and (−)4% crest slope, the horizontal distance to the toe from the downstream brink edge of the EM varied between 141 to 249 mm and 106 to 289 mm, respectively.
Additionally, for the 10° downstream slope, horizontal distances for the jet impact location L d from the downstream brink edge in the crest horizontal cases (EM-NHC, EM-VMS, EM-VMI, EM-VMD), (+)4% crest slope (EM-NAC), and (−)4% crest slope (EM-NDC) varied between 114 to 289 mm, 146 to 263 mm, and 240 to 294 mm, respectively. From Table 3, for 25° downward slope angles, we can see up to the third H m value that flow is followed by depressed nappe conditions, except for the EM-NHC, (−)4% crest slope EM-NDC, and EM-VMS cases. Moreover, according to Table 5, for (−)4% crest slope case, except for the first discharge in 25° and 10°, the flow has followed free nappe flow condition.
Due to the reduction of flow thickness with the induced angle and increased velocity, in (−)4% crest case, at 10° downward slopes, L d occurred as 289 mm when H m equals 0.05. Compared with the 25° case, this value has a higher deviation for the same discharge. We can assume that this is because the volume of air below the nappe impinging jet lower profile was mainly influenced by concerning the downstream surface slope of EM, as stated by Abdalla and Shamaa [19], Deneshfaraz et al. [22] and Chanson [43]. This can be concluded that the volume of air below the lower profile of the impinging jet with the downstream surface slope of the EM was increasing while the downstream surface slope angle ( α i ) was reducing (Figure 3) [19,22,23,24]. While increasing the overtopping depth, the weight of the water jet increased. At the second H m   value, where discharge equals 8.97 × 10⁻³ m3/s, the drop length of the impinging jet of (−)4% crest case reduced to a specific value around 240 mm for a 10° downward slope.
Table 5 tabulated the nappe flow impinging jet thickness d j e t while changing normalized overtopping depth H m value for 25° and 10° downstream surface slope cases. In this experimental study, the experimental scale used was about 1:10. In this large-scale experiment, measuring water depth behind the vegetation (at downstream brink depth) was critical due to the higher fluctuations. Therefore, a few readings were taken from the measuring point selected, and then the average value was taken as the final reading. When considering Table 5, the lowest impinging jet thickness was given by the (−)4% EM-NDC slope case. Due to this slope, downstream brink depth has been reduced more than in other cases. The highest impinging jet thickness was recorded for the vegetation case of EVDVM. In vegetation cases, downstream brink depth is higher than the EM-NHC, (+)4% EM-NAC, and (−)4% EM-NDC cases. When water flows through the vegetation model, the impinging jet thickness was similar in value and had minimal fluctuations. The primary concern monitored was that while increasing the density of the vegetation, the water depth fluctuations at the downstream brink edge were also increased, but brink depth was maintained by the vegetation patch near a similar value, meanwhile increasing the depth of water in front of the vegetation patch (upstream brink edge) due to the followed gradient [3,17,18,45,46,47]. Table 5, represented below, revealed the behavioral change of the impinging jet angle ( β i ) when it was hitting at the downstream plunge pool with changing the normalized overtopping depth H m . Changes to the nappe flow impinging jet angle have occurred with the change of crest geometry and orientation. Table 5 compares the impinging jet angle for the downstream surface slope of 25° and 10° cases.
The impinging jet angle was measured when the water jet was hit on the plunge pool [1,17,18,21,42]. While increasing the discharge respective to the finalized overtopping depth ( h m ), impinging jet decreases its angle from a near-vertical position for all the cases except the EM-NDC with 10° surface slope case. In contrast, it can be concluded that the vegetation cases impinging jet impact position concerning to the jet angle came towards the structure, according to Table 5’s results.

4. Discussion

4.1. Flow Structures and Their Characteristics

This study examined the flow characteristics and flow structures when the overtopping occurred over an embankment. As an initial condition, we considered an embankment with a 1:1 slope on both the upstream and downstream sides with 4 m in height and 4 m in crest within a 1:10 scale (Figure 2). This experiment was done inside a rectangular flume with a zero-slope condition. Five water depths at the embankment’s center were considered as initial overtopping depths when the crest was horizontal with no vegetation (EMNHC). The discharge conditions and the experimental observations recorded in each cases considered were tabulated in Table 3. Experiments were carried out with the six different cases. The first three cases were included without any geometrical restrictions (vegetation models over the crest) as the horizontal crest EM-NHC, (−)4% descending slope of the crest (EM-NDC), and (+)4% ascending slope crest case (EM-NAC). Additionally, three types of vegetation models, VMS, VMI, and VMD, were set up over the horizontal crest of the embankment. Further details about these vegetation models’ density and porosity are tabulated in Table 1.
In a system with a single embankment (i.e., no mitigation), a backwater rise was noted upstream due to the embankment’s resistance. Then, the flow approached and overtopped the landside with a higher velocity, where the embankment acted as a weir. We installed a small weir downstream of the embankment as a secondary structure, creating a plunge pool between the embankment and itself. This plunge pool absorbs the potential energy of the overtopped flow by the provided water cushion [3,14,45,46,47]. When the crest orientation of the embankment changed and vegetation with different configurations was placed, significant variation in the flow structures occurred, and the water cushion effect developed by the plunge pool downstream also changed. The lowest downstream brink edge water depth was recorded for the (−)4% EM-NDC case. This is because the induced slope of the crest further accelerates the free surface flow towards the downstream and free fall due to the elevation difference. According to Figure 5, values of the water depths are greater in the (+)4% EM-NAC case than in the EM-NHC case with no vegetation. The (+)4% EMNAC case gives additional resistance for the free surface flow by its geometrical shape of the crest. Additionally, when comparing the upstream water depths of all no vegetation cases on the crest, according to Figure 6, the (+)4% EM-NAC case has the highest water depth due to the resistance provided by the inclined crest towards the downstream. The lowest values of the upstream water depths were recorded (Figure 6) for the (−4%) EM-NDC case. This means the volume of water surpasses the overtopped flow towards the downstream side very quickly in this case. Hence, this (−4)% EM-NDC case orientation is an unsuitable mitigation measure. Still, it is helpful to disappear the overtopping towards the drainage system at the downstream side during a disaster before any damage occur to the structure very quickly [22,23]. A secondary countermeasure should exist, such as a vegetation patch or any other structural alternative [3,16,47].
Numerous studies [1,4,5,11,20,30,33] have documented the destruction of numerous coastal embankments and seawalls in 2011 due to the GEJT’s local scouring of the ground. Local scouring occurred primarily due to the overtopping flow directly striking the toe and/or supporting structure, resulting in substantial erosion, or scouring, which ultimately resulted in the structure failing [6]. However, when a secondary structure is implemented, a hydraulic jump forms due to the resistance offered by the secondary structure [47,48]. Further, when a hydraulic jump is formed, its position must be controlled because the high turbulence induced by a hydraulic jump results in scouring at the jump, which might be dangerous for both structures [38,49]. This structure type is proposed to minimize land use. As Rahman et al. [3,45] and Rashedunnabi and Tanaka [47] explained in their experimental studies, they need more land to initiate the hybrid defense mechanism. As an alternative, we introduced vegetation over the broad crested weir and installed a small weir (1/4 of embankment height) as a secondary structure to mitigate the effect of the hydraulic jump by creating a water cushion due to the plunge pool [17,18,49].

4.2. Vegetation over the Crest of the Embankment, Energy Reduction, and Head Loss

Coastal forests significantly mitigate the impact of a tsunami or coastal flood disasters by trapping floating debris, dissipating flowing water energy, reducing wind speed, maintaining an ecologically friendly environment, and by providing a larger buffer zone. Vegetation planting over an embankment crest is not similar to vegetation planting on average ground level. In this case, engineers cannot select multiple kinds of vegetation to plant over the embankment crest because some vegetations utilize a larger space. Considering this space utilization, thinner forests with small-diameter trees that have grown taller can be planted as a single-layer vegetation, and a double-layer vegetation patch over the crest of the coastal embankment is possible. Therefore, to represent the requirement mentioned above, we used 12 mm diameter 300 mm height wooden cylinders in a staggered arrangement to describe the vegetation patch with three different densities as a Single-layer VM (Table 1) [16,33]. When water passes through the vegetation patch, the water surface gradient rises concerning the provided resistance against the flow by the vegetation.
Ali and Uijttewaal [17,18] described the flow resistance and energy reduction downstream by using vegetated weirlike obstacles placed over the crest of the weir (dike or groyne). In the case of vegetated dikes or embankments, additional losses are expected due to vegetation. Vegetation is considered in this study as a single layer emergent vertical cylinders placed on top of the embankment crest in staggered arrangement and geometric variations to the EM crest (EM-NHC, EM-NDC, and EM-NAC). Predominantly for the gradually varying flow conditions, the effect of vegetation is modelled as a drag force. Kothyari et al. [50] described the flow–vegetation interactions. In the case of rapidly varying flow over the vegetated embankments in the present study, the effect of vegetation on the depth-averaged velocity is calculated, accounting for a reduced cross-sectional area resulting from the horizontal contraction [17,18]. This horizontal contraction of flow provided additional energy reduction over the downstream due to the increase of total head upstream due to the increase of upstream water depth ( h u ).
According to Figure 8, the dense vegetation model (VMD) occupies the highest energy reduction, with a porosity (Pr) of 96.65%. The VMD’s average energy reduction at the downstream brink edge while varying the discharge was between 49% to 51%. The intermediate vegetation model (VMI) was the second-largest energy reduction, with a porosity of 92.20%. The average energy reduction of VMI’s varied between 42% to 46%. Additionally, VMS with a porosity of 82.62% reduced the energy between 30% to 35%. The influence of the additional drag provided by the vegetation density increased the water depth in front of the vegetation patch (upstream brink edge). Additionally, with the increase in the density of the vegetation patch, the Froude number of the upstream (in front of vegetation) decreased while increasing the corresponding flow discharge. According to Figure 5, the water depth in front of the vegetation increased concerning the density of the vegetation. Thus, it can be concluded that vegetation over the embankment crest significantly reduced the energy of incoming tsunami waves by reducing flow velocity, increasing the depth of water, and by creating a time delay by reducing the flow thickness at the downstream side. This will minimize the loss of lives and property on the downstream side while increasing evacuations’ safety at low discharges. Referring to the flow structures, overtopping flow over the embankment with free crest condition (EM-NHC, (+)4% EM-NAC case, and (−)4% EM-NDC case), water flow behaves similar to the broad crested weir. After replacing the embankment crest with different vegetation models, the free-surface flow of the overtopping follows a slope inside the vegetation patch concerning the G/d ratio of the vegetation model. Additionally, the vegetation model raises the total head loss more than no vegetation cases (EM-NHC, EM-NAC, EM-NDC). This head loss increment is due to the blockage ratio and additional drag provided against the flow by the vegetation model by its staggered arrangement [47]. Additionally, the increased head loss provided low water depths at the downstream plunge pool [40,43]. This would be an advantage in avoiding the larger inundation extents and heights on the downstream side. The major drawback is tree destruction by trunk breakage, where root parts remained contracted with the ground, and the upper part was damaged. When the fluid force is high, the trunk diameter is small, and root material characteristics like stiffness, strength, and morphology (diameter, length, surface area) are better, this phenomenon occurs [12,15,28,34,51,52]. Washout, which happens when local scouring surpasses the effective root depths of the trees inside the vegetation patch above the embankment crest and head cutting due to nappe impingement downstream, is another mode of destruction [14,21,39,53]. To avoid the local scouring around the embankment, Rahman et al. [3,45] implemented a downstream short frontal and tall forest as a secondary structure, while we installed a weir at downstream to provide a water cushion for the nappe impingement due to the overtopping.
This water cushion effect is determined by the downstream flow depth of overtopping embankment conditions in 2011 GEJT. At the 2011 GEJT disastrous event, the building structures downstream provided an additional blockage for the overtopped flow concerning the building arrangements and orientation opposing to the flow direction. In that case a water cushion effect was provided, as described by Rahmen et al. [45], between the embankment and building structures downstream. Then, the major drawback was due to the water depth elevation a water cushion effect imposed in front by the blockage ratio of the buildings. Further, this water cushion effect elevated the fluid force over the building frontlines. Finally, unstable structures (houses constructed on wooden frames) were totally washed out, and some of them were partly damaged at the 2011 GEJT.

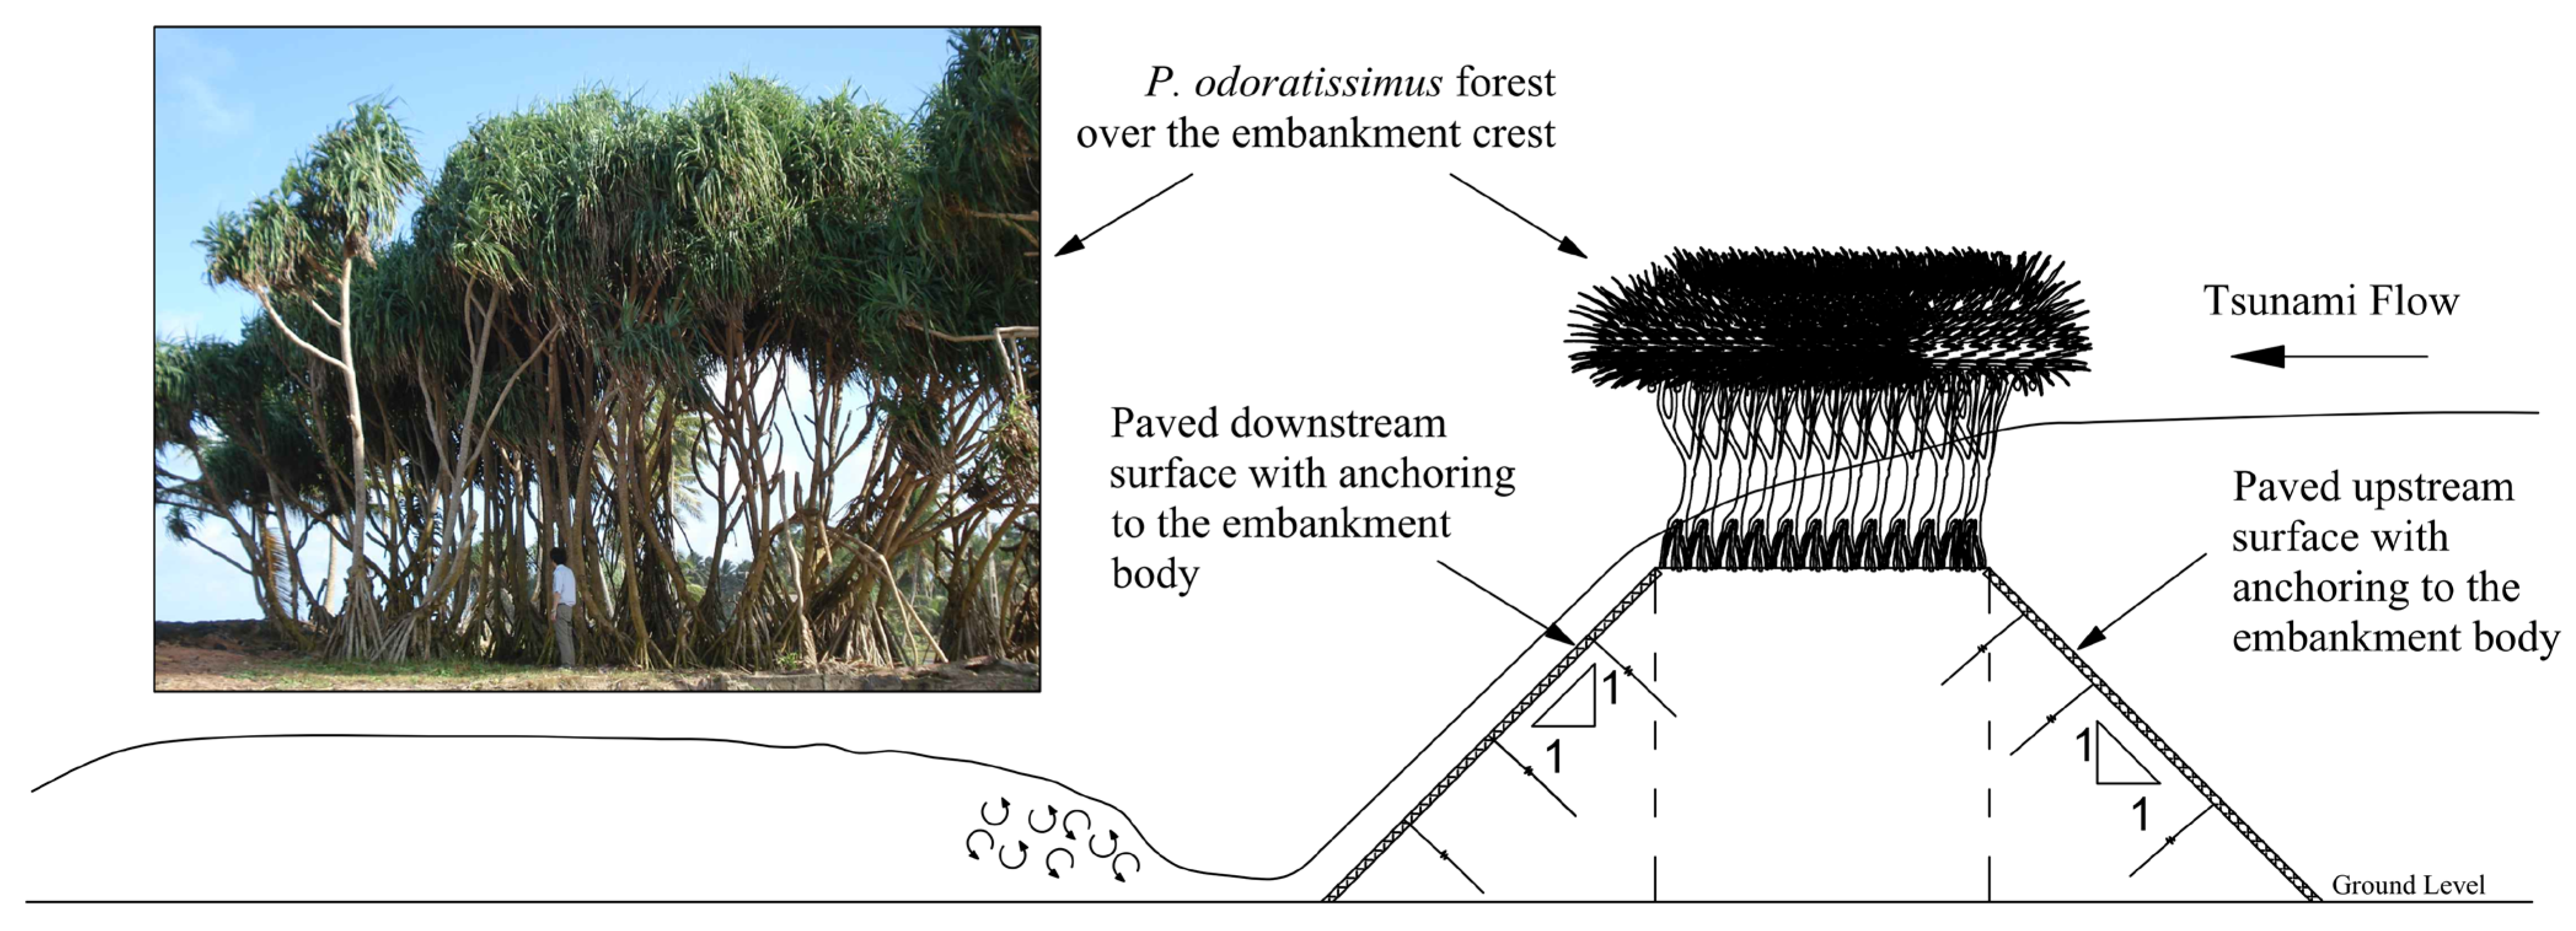
Use of Vegetation as a Countermeasure to Reduce the Destructive Energy of Tsunami

At present, scientists have identified that the hybrid solution for disaster risk reduction is much more efficient than moving with an application of unique solutions. Dissanayaka et al. [1] reviewed the use of Hybrid Eco-DRR for impact mitigation and proposed a solution to satisfy the SDGs in future cities vulnerable to disasters. Additionally, ICHARM [25] provided a guideline on the planning and design of coastal vegetation belts for tsunami disaster mitigation according to the presently available knowledge. Meanwhile, ICHARM [25] identified that coastal forests with P. odoratissimus trees are highly effective in the energy reduction of tsunami waves, and those trees have an excellent strength in withstanding against to the coastal storms, slat water sprays, and salty coastal environmental effects. Therefore, in this study, we considered P. odoratissimus trees as a vegetation model to replicate the vegetation model’s effect over the EM crest.
Hence, after the 2011 GEJT, many projects were initiated, and out of those, two projects remain functioning—planting selected native trees in the Tohoku region of Japan. These two projects are named PUR Project and Morino Project. Under these two projects, evergreen broadleaf trees have been planted to create a lifeguarding forest over 5-m-high embankments constructed using soil and debris created by the earthquake in 2011 since 2016 to enhance the coastal environment and as a preparedness measure for future tsunami risks. Based on this approach, the present study evaluated the flow structures and energy reduction under fixed bed conditions with different tree densities over EM crest and geometric conditions of EM crest, investigating to what extent this method can be applicable when nappe flow is forming while reducing the downstream surface slope. Figure 1 represents a brief idea about the applicability of this new finding as a hybrid alternative to mitigate future tsunami risks in highly developed areas where there is no space to grow thicker coastal vegetation belts.

5. Summary

The present study conducted model scale flume experiments to investigate the nappe flow formation due to overtopping flow from an embankment by changing the crest geometry and downward surface slope of the embankment model (EM). The conclusions derived from the current study are as follows:
  • The overtopping flow from an embankment creates a nappe flow, impinging the jet and steepening the downward slope downstream. Changes in the crest geometry can significantly affect the nappe formation condition. With the ascending slope, the flow structure and geometry over the crest have further controlled nappe flow formation. In descending slope, the nappe flow formation was quicker while increasing overtopping flow. In the EM-NDC case, when the downstream surface slope varied from 45° to 30°, depressed and clinging nappe occurred. This phenomenon was not observed in other cases. In no vegetation cases (EM-NHC, EM-NAC, EM-NDC), the energy reduction and the head losses are comparatively low concerning the cases with vegetation patches (EM-VMS, EM-VMI, EM-VMD) at the crest. The created plunge pool by the secondary structure, the downstream (weir), absorbs the potential energy of the impact of jet impingement using the provided water cushion. The energy absorption by the water cushion of the plunge pool can be further evaluated with mobile bed condition experiments concerning the scouring depth.
  • Vegetation at the crest further delays the overtopping flow by increasing the water depth in front of the vegetation while increasing the discharge corresponding to the selected overtopping depth. This tailwater depth increases majorly depending on the vegetation model’s density (G/d ratio). The G/d ratios of vegetation models were 1.33, 0.59, and 0.29 for EM-VMS, EM-VMI, and EM-VMD, respectively. When density increased, energy reduction at the downstream brink edge was raised, where maximum energy reduction at the downstream brink edge occurred by the EM-VMD greater than 0.5 (Figure 5). Additionally, the head loss downstream was increased concerning the density of the vegetation.
Due to difficulties of construction of an immobile bed experiment, this experiment used a 5° decrementing interval while reducing the downstream surface slope from 45° to 0°. Due to this reason, the sensitivity of the nappe impinging jet to the downstream surface slope angle needs to be further evaluated with small decrementing intervals (such as 1°, 2°, 3°). Hence, further study is needed to identify the variation of the nappe flow with such minor changes in the downstream slope angle experimentally or numerically. Additionally, this study classified the basic flow structures of nappe flow formation while changing the discharge, the crest’s geometrical conditions, and the embankment’s downstream slope angle in immobile bed conditions. Furthermore, contribution of the pressure variation below the nappe lower profile with respect to the volume of air and downstream surface slope needs to be evaluated to justify the sensitivity of the nappe physical properties with respect to the geometry of the EM crest and overtopping discharge. To identify the erosion mechanisms due to the nappe formation, more study is needed on the immobile condition of the EM with the mobile condition of the bed in the plunge pool area.

Author Contributions

Conceptualization, K.D.C.R.D., N.T.; methodology, K.D.C.R.D.; model preparation, K.D.C.R.D. and M.K.H.; investigation K.D.C.R.D. and M.K.H.; data processing and analysis, K.D.C.R.D.; writing—original draft, K.D.C.R.D.; visualization, K.D.C.R.D. and M.K.H.; resources, N.T.; writing—review & editing, N.T.; supervision, N.T.; project administration, N.T.; funding acquisition, N.T. All authors have read and agreed to the published version of the manuscript.

Funding

This research received no external funding.

Institutional Review Board Statement

Not applicable.

Informed Consent Statement

Not applicable.

Data Availability Statement

Not applicable.

Acknowledgments

The authors would like to appreciate the support of the Japanese Ministry of Education, Culture, Sports, Science and Technology (Monbukagakusho–MEXT Scholarship). The authors also acknowledge the anonymous reviewers for their valuable comments to improve this manuscript.

Conflicts of Interest

The authors declare no conflict of interest.

Abbreviations

EMembankment model
EM-NACembankment model with +4.0% ascending crest (no vegetation over the crest)
EM-NDCembankment model with −4.0% descending crest (no vegetation over the crest)
EM-NHCembankment model with horizontal crest (no vegetation over the crest)
EM-VMDembankment model with horizontal crest (dense vegetation model over the crest, G/d = 0.29)
EM-VMIembankment model with horizontal crest (intermediate vegetation model over the crest, G/d = 0.59)
EM-VMSembankment model with horizontal crest (sparse vegetation model over the crest, G/d = 1.33)
GEJTGreat East Japan Tsunami
IOTIndian Ocean Tsunami
VMvegetation model
The following symbols are used in this paper:
α co-efficient used to calculate the velocity fluctuations
α i angle of the downstream surface slope of the EM measured from downstream brink edge
β i angle of the nappe flow impinging jet
θ c r critical angle of the downstream surface slope of the EM measured from downstream brink edge
Δ E d specific energy loss over the downstream brink edge of the EM crest
Δ H head loss (m)
Dcenter to center distance of stems in the vegetation model (m)
Dxcenter to center distance of stems in the vegetation model into x-direction (m)
Dycenter to center distance of stems in the vegetation model into y-direction (m)
E specific energy
E d specific energy at the downstream brink edge over the EM crest
E u specific energy at the upstream brink edge over the EM crest
Gdistance between the stems in the cross-stream direction in the vegetation model (m)
F r Froude number
H c normalized critical water depth over the embankment crest
H d normalized water depth of the downstream brink edge of the embankment crest
H d a m dam height (m), and this is equal to the h E
H L normalized total head loss at the plunge pool
H m normalized overtopping depth measured at the mid-section of the EM
H m a x maximum head at the upstream of the EM
H u normalized water depth of the upstream brink edge of the embankment crest
P J normalized position of the hydraulic jump at the downstream plunge pool of the EM
L c crest length of the EM (m)
L d nappe flow impinging jet drop length measured from downstream brink edge (m)
L m length of the model (m)
L p length of the prototype (m)
L s length scale
Q flow rate through the model (m3/s)
R e Reynolds numbers
V depth-averaged velocity of the flow (m/s)
W e Weber number
W f width of the vegetation model over the crest of the embankment model (m)
b width of the channel (m)/width of the embankment model (m)
d diameter of the stem in vegetation model (m)
d j e t thickness of the nappe flow impinging jet (mm)
d n number of wooden stems in a square meter of the vegetation model (No.cm)
g gravitational acceleration (m/s−2)
h depth of water flow (m)
h c critical water depth over the embankment crest (m)
h d water depth of the downstream brink edge of the embankment crest (m)
h d , c r critical brink depth at downstream brink edge of the EM (m)
h E height of the embankment model at the center (m)
h m overtopping depth measured at the mid-section of the crest of the EM in the initial case (m)
n Manning’s roughness coefficient
p j position of the hydraulic jump in plunge pool measured from the downstream brink edge (m)
z elevation of the bottom of the model from reference line (m)

References

  1. Dissanayaka, K.D.C.R.; Tanaka, N.; Vinodh, T.L.C. Integration of Eco-DRR and hybrid defense system on mitigation of natural disasters (Tsunami and Coastal Flooding): A review. Nat. Hazards 2021, 110, 1–28. [Google Scholar] [CrossRef]
  2. Igarashi, Y.; Tanaka, N.; Zaha, T. Changes in flow structures and energy reduction through compound tsunami mitigation system with embankment and lined piles. Ocean Eng. 2018, 164, 722–732. [Google Scholar] [CrossRef]
  3. Rahman, M.A.; Tanaka, N.; Rashedunnabi, A.H.M. Flume experiments on flow analysis and energy reduction through a compound tsunami mitigation system with a seaward embankment and landward vegetation over a mound. Geosciences 2021, 11, 90. [Google Scholar] [CrossRef]
  4. Shuto, N.; Fujima, K. A short history of tsunami research and countermeasures in Japan. Proc. Jpn. Acad. Ser B Phys. Biol. Sci. 2009, 85, 267–275. [Google Scholar] [CrossRef]
  5. Shuto, N.; Imamura, F.; Koshimura, S.; Satake, K.; Matsutomi, H. Encyclopedia of Tsunamis (Tsunami no Jiten); Asakura Publishing: Tokyo, Japan, 2007; p. 350. [Google Scholar]
  6. Tsujimoto, G.; Kakinoki, T.; Mineura, R.; Uno, K.; Yamada, F. Scouring mechanism behind seawall from tsunami overflow and optimum conditions to reduce tsunami energy with an artificial trench. Coast. Eng. Proc. 2015, 1, 38. [Google Scholar] [CrossRef]
  7. Zaha, T.; Tanaka, N.; Kimiwada, Y. Flume experiments on optimal arrangement of hybrid defense system comprising an embankment, moat, and emergent vegetation to mitigate inundating tsunami current. Ocean Eng. 2019, 173, 45–57. [Google Scholar] [CrossRef]
  8. Allsop, N.W.H.A.; Kortenhaus, A.; Morris, M.W. Failure Mechanisms for Flood Defense Structures. FLOODsite Rep. T04-06-01, FLOODsite Consortium 2007. Available online: www.floodsite.net (accessed on 12 May 2022).
  9. Japan Forest Agency. Annual Report on Forest and Forestry in Japan; Fiscal Year 2011 (Summary). 2012. Available online: https://www.data.go.jp/data/en/dataset/maff_20140918_0070 (accessed on 4 April 2022).
  10. Kato, F.; Suwa, Y.; Watanabe, K.; Hatogai, S. Mechanism of coastal dike failure induced by the Great East Japan Earthquake Tsunami. In Proceedings of the 33rd ICCE, Santander, Spain, 1–6 July 2012. 9p. [Google Scholar]
  11. Tokida, K.; Tanimoto, R. Lessons for countermeasures using earth structures against tsunami obtained in the 2011 Off the Pacific Coast of Tohoku Earthquake. Soils Found. 2014, 54, 523–543. [Google Scholar] [CrossRef]
  12. Tanaka, N.; Yagisawa, J.; Yasuda, S. Breaking pattern and critical breaking condition of Japanese pine trees on coastal sand dunes in huge tsunami caused by Great East Japan Earthquake. Nat. Hazards 2013, 65, 423–442. [Google Scholar] [CrossRef]
  13. Iimura, K.; Tanaka, N. Numerical simulation estimating effects of tree density distribution in coastal forest on tsunami mitigation. Ocean Eng. 2012, 54, 223–232. [Google Scholar] [CrossRef]
  14. Matsuba, S.; Mikami, T.; Jayaratne, R.; Shibayama, T.; Esteban, M. Analysis of tsunami behavior and the effect of coastal forest in reducing tsunami force around the coastal dikes. Coast. Eng. Proc. 2014, 1, 37. [Google Scholar] [CrossRef] [Green Version]
  15. Tanaka, N.; Jinadasa, K.B.S.N.; Mowjood, M.I.M.; Fasly, M.S.M. Coastal vegetation planting projects for tsunami disaster mitigation: Effectiveness evaluation of new establishments. Landsc. Ecol. Eng. 2011, 7, 127–135. [Google Scholar] [CrossRef]
  16. Pasha, G.A.; Tanaka, N. Undular hydraulic jump formation and energy loss in a flow through emergent vegetation of varying thickness and density. Ocean Eng. 2017, 141, 308–325. [Google Scholar] [CrossRef]
  17. Ali, S.; Uijttewaal, W.S.J. Form drag due to vegetated weirlike obstacles interpreted as expansion loss. In Proceedings of the 33rd International Association for Hydro-Environment Engineering and Research (IAHR) World Congress, Vancouver, Canada, 9–14 August 2009; pp. 139–146. [Google Scholar]
  18. Ali, S.; Uijttewaal, W.S.J. Flow resistance of vegetated weir-like obstacles during high water stages. In Proceedings of the River Flow, Bundesanstalt für Wasserbau, Braunschweig, Germany, 8–10 September 2010; pp. 293–299. [Google Scholar]
  19. Abdalla, M.G.; Shamaa, M.T. Experimental Investigation of Nappe Profile and Pool Depth for Broad-Crested Weirs. Int. J. Eng. Res. Gen. Sci. 2016, 4, 1–18, ISSN 2091-2730. [Google Scholar]
  20. Strusińska-Correia, A. Tsunami mitigation in Japan after the 2011 Tōhoku Tsunami. Int. J. Disaster Risk Reduct. 2017, 22, 397–411. [Google Scholar] [CrossRef]
  21. Zhu, T. Breach Growth in Clay Dikes. Ph.D. Thesis, University of Technology, Delft, The Netherlands, 2006. ISBN 10: 90-9020964-6. [Google Scholar]
  22. Daneshfaraz, R.; Dasineh, M.; Ghaderi, A.; Sadeghfam, S. Numerical modelling of hydraulic properties of slopped broad crested weir. AUT J. Civ. Eng. 2020, 4, 229–240. [Google Scholar] [CrossRef]
  23. Emiroglu, M.E.; Baylar, A. The effect of broad-crested weir shape on air entrainment. J. Hydraul. Res. 2003, 41, 649–655. [Google Scholar] [CrossRef]
  24. Imanin, H.; Mohammadian, A.; Hoshyar, P. Experimental and numerical study of flow over a broad-crested weir under different hydraulic head ratios. Flow Meas. Instrum. 2021, 80, 102004. [Google Scholar] [CrossRef]
  25. Tanaka, S.; Istiyanto, D.C.; Kuribayashi, D. (Eds.) ICHARM Planning and Design of Tsunami-Mitigative Coastal Vegetation Belts; Technical Note of PWRI No. 4177; International Centre for Water Hazard and Risk Management under the Auspices of UNESCO (ICHARM) and Public Works Research Institute (PWRI): Ibaraki-ken, Japan, 2010. [Google Scholar]
  26. Peakall, J.; Warburton, J. Surface tension in small hydraulic river models–the significance of the Weber number. J. Hydrol. 1996, 35, 199–212. [Google Scholar]
  27. Spiske, M.; Weiss, R.; Bahlburg, H.; Roskosch, J.; Amijaya, H. The TsuSedMod inversion model applied to the deposits of the 2004 Sumatra and 2006 Java tsunami and implications for estimating flow parameters of palaeo-tsunami. Sediment Geol. 2010, 224, 29–37. [Google Scholar] [CrossRef]
  28. Detailed Design Report for Infrastructure for Coastal Line, Colombo Suburban Railway Project (CSRP). Available online: https://csrp.lk/backend/documents/1-%2020-CL-DD-F-RE-%20Detailed%20Design%20Report%20-%202020-09-web.pdf (accessed on 22 January 2022).
  29. De Costa, R.; Tanaka, N. Inland forest as a trapping function against tsunami borne large broken or washed-out trees. Landsc. Ecol. Eng. 2020, 16, 97–112. [Google Scholar] [CrossRef]
  30. Tanaka, N.; Yasuda, S.; Iimura, K.; Yagisawa, J. Combined effects of coastal forest and sea embankment on reducing the washout region of houses in the Great East Japan tsunami. J. Hydro-Environ. Res. 2014, 8, 270–280. [Google Scholar] [CrossRef]
  31. Tanaka, N.; Sasaki, Y.; Mowjood, M.I.M.; Jinadasa, K.B.S.N.; Homchuen, S. Coastal vegetation structures and their functions in tsunami protection: Experience of the recent Indian Ocean tsunami. Landsc. Ecol. Eng. 2007, 3, 33–45. [Google Scholar] [CrossRef]
  32. Thuy, N.B.; Nandasena, N.A.K.; Hai Dang, V.; Tanaka, N.; Quoc Viet, H.; Giay, C. Simplified formulae for designing coastal forest against tsunami run-up: One-dimensional approach. Mar. Geophys. Geol. 2018, 92, 327–346. [Google Scholar] [CrossRef]
  33. Shuto, N. The effectiveness and limit of tsunami control forests. Coast. Eng. Jpn. 1987, 30, 143–153. [Google Scholar] [CrossRef]
  34. Tanaka, N.; Yagisawa, J. Flow structures and sedimentation characteristics around clump-type vegetation. J. Hydro-Environ. Res. 2010, 4, 15–25. [Google Scholar] [CrossRef]
  35. Takemura, T.; Tanaka, N. Flow structures and drag characteristics of a colony-type emergent roughness model mounted on a flat plate in uniform flow. Fluid Dyn. Res. 2007, 39, 694–710. [Google Scholar] [CrossRef]
  36. Arora, K.R. Fluid Mechanics, Hydraulics, and Hydraulic Machines; Standard Publishers Distribution: Delhi, India, 1973. [Google Scholar]
  37. Dey, S.; Kumar, B.R. Hydraulics of free overfall in-shape channels. Sadhana 2002, 27 Pt 3, 353–363. [Google Scholar] [CrossRef]
  38. Chow, V.T. Open-Channel Hydraulics; McGraw-Hill: New York, NY, USA, 1959; p. 728. [Google Scholar]
  39. Anjum, N.; Tanaka, N. Experimental study on flow analysis and energy loss around discontinued vertically layered vegetation. Environ. Fluid Mech. 2020, 20, 791–817. [Google Scholar] [CrossRef]
  40. Chanson, H. Hydraulics of Nappe Flow Regime above Stepped Chutes and Spillways. Trans.-Inst. Eng. Aust. Civ. Eng. Ce 1994, 36, 69. [Google Scholar]
  41. Foster, M.; Fell, R.; Spannagle, M. The statistics of embankment dam failures and accidents. Can. Geotech. J. 2000, 37, 1000–1024. [Google Scholar] [CrossRef]
  42. Tracy, H.J. Discharge Characteristics of Broad-Crested Weirs; Geological Survey Circular 397; United States Department of the Interior: Reston, VA, USA, 1957. [Google Scholar]
  43. Chanson, H. The Hydraulics of Open Channel Flow: An Introduction: Basic Principles, Sediment Motion, Hydraulic Modelling, Design of Hydraulic Structures, 2nd ed.; Elsevier Ltd.: Amsterdam, The Netherlands, 2004; ISBN 9780080472973. [Google Scholar]
  44. Hamadan, L.; Nahi, T.N. Comparison of Flow over Broad Crested Weir in Laboratory and by a Numerical Method. Wasit J. Eng. Sci. 2018, 6, 82–90. [Google Scholar] [CrossRef]
  45. Rahman, M.A.; Tanaka, N.; Reheman, N. Experimental study on reduction of scouring and tsunami energy through a defense system consisting of a seaward embankment followed by vertically double layered vegetation. Ocean. Eng. 2021, 234, 108816. [Google Scholar] [CrossRef]
  46. Rahman, M.A.; Tanaka, N. Countermeasure against local scouring and tsunami damage by downstream forest behind a coastal embankment. Appl. Ocean. Res. 2022, 120, 103070. [Google Scholar] [CrossRef]
  47. Rashedunnabi, A.H.M.; Tanaka, N. Energy reduction of a tsunami current through a hybrid defense system comprising a sea embankment followed by a coastal forest. Geosciences 2019, 9, 247. [Google Scholar]
  48. Song, J.; De Risi, R.; Goda, K. Influence of Flow Velocity on Tsunami Loss Estimation. Geosciences 2017, 7, 114. [Google Scholar] [CrossRef]
  49. Adam, A.M.; Ruff, J.F.; AlQaser, G.; Abt, S.R. Characteristics of B-jump with different toe locations. J. Hydraul. Eng. 1993, 119, 938–948. [Google Scholar] [CrossRef]
  50. Kothyari, U.C.; Hayashi, K.; Hashimoto, H. Drag coefficient for unsubmerged rigid vegetation stems in open channel flows. J. Hydraul. Res. 2009, 47, 691–699. [Google Scholar] [CrossRef]
  51. Samarakoon, M.B.; Tanaka, N.; Yagisawa, J. Effects of local scouring and saturation of soil due to flooding on maximum resistive bending moment for overturning Robinia pseudoacacia. Landsc. Ecol. Eng. 2013, 9, 11–25. [Google Scholar] [CrossRef]
  52. Tanaka, N.; Sasaki, Y.; Mowjood, M.I.M. Effects of sand dune and vegetation in the coastal area of Sri Lanka at the Indian Ocean tsunami. In Advances in Geosciences: Volume 6: Hydrological Science (HS); World Scientific Co.: Singapore, 2006; pp. 149–159. ISBN 9789812708915. [Google Scholar]
  53. Antonellini, M.; Mollema, P.N. Impact of groundwater salinity on vegetation species richness in the coastal pine forests and wetlands of Ravenna, Italy. Ecol. Eng. 2010, 36, 1201–1211. [Google Scholar] [CrossRef]
Figure 1. Schematic diagram of proposed hybrid mitigation measure of embankment with vegetation over the crest.
Geosciences 12 00354 g001
Figure 2. Schematic detail of the experimental setup inside the channel: (a) a side view of the experiment flume with embankment (EM) and vegetation model (VM), (b) an embankment model (EM), a side view of the vegetation model (VM), and a plan view of the vegetation model arrangement.
Geosciences 12 00354 g002
Figure 3. Sketch of the experimental setup with nappe flow formation: (a) model setup inside the flume without the vegetation over the crest of EM, (b) schematic of formation of nappe flow without vegetation model over the crest of EM.
Geosciences 12 00354 g003aGeosciences 12 00354 g003b
Figure 4. Schematic diagram of types of nappe flow.
Geosciences 12 00354 g004
Figure 5. Variation of average Froude number at upstream and downstream concerning the case.
Geosciences 12 00354 g005
Figure 6. Variation of normalized critical depth ( H c ) with normalized overtopping depth ( H m ).
Geosciences 12 00354 g006
Figure 7. Normalized water downstream brink edge water depth ( H d ) against varying normalized overtopping depth ( H m ).
Geosciences 12 00354 g007
Figure 8. (a) Specific energy loss at the downstream brink edge of the EM with crest condition and varying the normalized overtopping depth ( H m ); (b) head loss at the downstream plunge pool concerning the normalized downstream brink edge water depth ( H d ).
Geosciences 12 00354 g008
Figure 9. Change of the position of the hydraulic jump concerning the type of the nappe flow and downstream slope: (a) −4% descending crest slope (EM-NDC) for 10° downstream slope, (b) +4% ascending crest slope (EM-NAC) for 10° downstream slope.
Geosciences 12 00354 g009
Figure 10. Normalized position of the hydraulic jump ( P J ) with varying normalized overtopping depth ( H 0 ): (a) 25° downstream slope; (b) 10° downstream slope.
Geosciences 12 00354 g010
Table 1. Range of the Reynolds number ( R e ) and Weber number ( W e ) over the entire experiment.
Exp. CaseNormalized Overtopping Depth (Hm)ReWe
EM-NHC0.05, 0.075, 0.10, 0.125, 0.157.52 × 103–4.30 × 10418.6–84.6
EM-NAC0.05, 0.075, 0.10, 0.125, 0.157.76 ×103–4.24 × 10414.5–81.2
EM-NDC0.05, 0.075, 0.10, 0.125, 0.158.01 × 103–4.45 × 10419.3–94.5
EM-VMS0.05, 0.075, 0.10, 0.125, 0.157.13 × 103–4.13 × 10415.9–76.1
EM-VMI0.05, 0.075, 0.10, 0.125, 0.156.91 × 103–4.14 × 10413.5–76.4
EM-VMD0.05, 0.075, 0.10, 0.125, 0.156.76 × 103–4.11 × 10412.8–75.3
Table 2. Summary of the experimental conditions and vegetation configurations.
Exp. CaseNormalized Overtopping Depth (Hm)Dx (mm)Dy (mm)G
(mm)
d (mm)WF (mm)Slope
δ   %
Porosity (Pr) %
EM-NHC0.05, 0.075, 0.10, 0.125, 0.15-------
EM-NAC0.05, 0.075, 0.10, 0.125, 0.15-----+4.0-
EM-NDC0.05, 0.075, 0.10, 0.125, 0.15-----−4.0-
EM-VMS0.05, 0.075, 0.10, 0.125, 0.1596.155.549.512.0400-86.8
EM-VMI0.05, 0.075, 0.10, 0.125, 0.1566.238.236.212.0400-92.2
EM-VMD0.05, 0.075, 0.10, 0.125, 0.1553.530.924.912.0400-95.7
Table 3. Summary of the experimental conditions used in each experimental run.
Exp. CaseDischarge
( m 3 / s ,   × 10 3 )
V d
( m / s , × 10 2 )
h m
( m , × 10 2 )
h u
( m , × 10 2 )
h c
( m , × 10 2 )
h e
( m , × 10 2 )
Δ H / H m a x
EM-NHC4.190.452.012.771.931.880.58
8.970.643.114.443.202.820.49
14.360.784.166.114.383.700.43
19.790.895.117.575.434.440.38
26.061.016.179.046.525.170.35
EM-NAC4.190.453.654.541.931.860.58
8.970.635.096.173.202.840.49
14.360.756.227.644.383.820.43
19.790.867.799.095.434.590.38
26.060.938.2010.376.525.620.35
EM-NDC4.190.801.322.561.931.050.58
8.970.972.334.163.201.850.49
14.361.093.395.714.382.640.43
19.791.154.447.075.433.450.38
26.061.265.508.616.524.150.35
EM-VMS4.190.430.064.261.931.960.58
8.970.570.096.623.203.160.49
14.360.680.129.004.384.250.43
19.790.760.1511.105.435.220.38
26.060.820.1713.296.526.390.35
EM-VMI4.190.440.085.221.931.910.58
8.970.590.138.153.203.040.49
14.360.670.1710.984.384.270.43
19.790.760.2113.625.435.230.38
26.060.820.2516.236.526.340.35
EM-VMD4.190.450.105.861.931.850.58
8.970.610.169.263.202.940.49
14.360.700.2112.624.384.130.43
19.790.730.2515.525.435.420.38
26.060.800.3018.566.526.520.35
N.B. In case of vegetation, at middle of embankment crest water depth cannot be taken due vegetation. Therefore, water surface slope inside the vegetations is provided in that column. h e = h d = downstream brink edge water depth.
Table 4. Summary of the first free nappe observation of the experimental study.
Crest Exposer ConditionCritical
Angle θ c r (Degrees)
Normalized Overtopping Depth (Hm)Critical Brink Depth, h d , c r (cm)
Horizontal Crest without Vegetation (EM-NHC)300.155.17
Ascending Crest (+4%) (EMN-NAC)250.103.82
Descending Crest (−4%) (EM-NDC)300.102.64
Sparse Vegetation (EM-VMS) (G/d = 1.33, dn = 180)300.1255.22
Intermediate Vegetation (EM-VMI) (G/d = 0.59, dn = 380)300.1255.23
Dense Vegetation (EM-VMD) (G/d = 0.29, dn = 580)350.156.52
Table 5. Variation of drop length L d , nappe flow impinging jet thickness d j e t and impinging jet angle β i   concerning the normalized overtopping depth H m   ( = h m / h E ) ; for 25° landward slope and for 10° landward slopes.
Hm
(=hm/hE)
Nappe Flow Drop Length (Ld) (mm)
EM-NHCEM-NACEM-NDCEM-VMSEM-VMIEM-VMD
25°10°25°10°25°10°25°10°25°10°25°10°
0.0597174141146106289661208311589114
0.075115187157156225240143172137169128159
0.10223221178176246253210228204227190218
0.125263245211197279278236246223242228228
0.15272289249263289294252249246246240242
Hm
(=hm/hE)
Nappe Flow Thickness (djet) (mm)
EM-NHCEM-NACEM-NDCEM-VMSEM-VMIEM-VMD
25°10°25°10°25°10°25°10°25°10°25°10°
0.05101091088.111213111413
0.075141617161413171616171717
0.10262625242223232426282727
0.125333433333232343535363336
0.15404241423839504445444645
Hm
(=hm/hE)
Impinging Jet Angle (βi)
EM-NHCEM-NACEM-NDCEM-VMSEM-VMIEM-VMD
25°10°25°10°25°10°25°10°25°10°25°10°
0.05828073737658828182828382
0.075787476777166807681777976
0.10727375756964757575747575
0.125706973736463727172717174
0.15656669696362717170707069
Publisher’s Note: MDPI stays neutral with regard to jurisdictional claims in published maps and institutional affiliations.

