Abstract
There is growing evidence that many large coastal boulder deposits found on the exposed rocky ocean shores were deposited by extreme storm waves rather than by catastrophic tsunamis, as previously thought. In addition, before the first discovery in the northern Adriatic a few years ago, such deposits were not expected in relatively shallow semi-enclosed inland basins. Here we report on a large coastal coarse-clast deposit on the central Adriatic island of Mana, which also contains numerous large storm boulders that weigh up to several tons. Large solitary boulders are also located outside of the deposit, closer to the partly submerged sea cliff and the wave impact. The erosion of the cliff top and displacement of the carbonate bedrock fragments began when the extreme waves inundated the lowermost part of the cliff edge, probably during the late Holocene sea-level rise. The UAS photogrammetry-based fragmentation analysis of the storm deposit and the calculated fractal dimension value indicate that the material was fragmented by multiple high-energy events. A comparison of the available photographs indicates that displacements of the most exposed solitary boulders probably occurred during Vaia, the last extreme storm that hit the Adriatic on the 29th of October 2018. However, the modeled maximum wave height south of Mana during the peak of the storm would be insufficient to move these boulders. Yet local geomorphology probably further influenced the increase in wave height that, in combination with specific geological features, caused displacements of the boulders. There is a shorter fetch affecting Mana Island with respect to the northern Adriatic boulder field in southern Istria. Thus, such an active local erosion of the generally stable eastern Adriatic karstic coast depends on the extreme storms that have a weaker impact in the central than in the northern Adriatic.
1. Introduction
In addition to very large tsunamis, extreme storm waves can cause the detachment, displacement, and imbrication of coastal boulders tens of meters above and away from the shoreline of the open oceans [1,2,3,4,5,6,7]. However, storm boulders are not expected in the semi-enclosed inland seas that do not generally experience extreme storm and massive tsunami waves, e.g., [8]. Furthermore, recent multidisciplinary research on storm boulders along open ocean coasts has indicated that it is difficult to distinguish the mechanism of formation of these coarse-clast deposits—from storms or tsunamis [9,10,11,12]. Nevertheless, storm waves were recently found to be responsible for large carbonate bedrock fragment detachments and displacement of the boulders along the rocky coast of the semi-enclosed, inland, northern Adriatic Sea [13].
Prerequisites for the formation of a coarse-clast coastal storm deposit or accumulation of boulders along rocky shores are as follows: the specific geographical position of a site, specific geological structure of the parent bedrock, relevant fetch, and the existence of extreme waves [13,14,15,16,17]. Tsunami waves might reach several meters in the southern Adriatic where seismicity is larger, but they have much lower wave height in the northern shallow regions [18,19]. In contrast, southern and southeastern winds in the Adriatic are capable of producing the highest waves on the northeastern Adriatic, only because of the large fetch, with significant wave heights surpassing 10 m over the open sea [20,21]. Therefore, most locations facing the open sea receive the impact of the extreme wind-driven waves [22]. Discontinuities in the coastal bedrock represent the second main prerequisite for the detachment of the fragments by the waves [13]. Since the eastern Adriatic coast is built predominantly of deformed successions of stratified carbonates [23,24,25], the more thinly the succession is bedded and the denser the open fracture system, the more prone the rocky coast is to the erosion by extreme waves. Moreover, bedding surfaces that are slightly inclined toward the impact of the waves act as natural ramps for the movement of the boulders away from the shorelines, e.g., [13,26].
Deposits produced by large waves along rocky coasts are described by the frequency-size distribution. Various statistical descriptions have been used to describe the frequency-size distribution of naturally and artificially fragmented material. One of the traditional and still widely used fragmentation assessment models is the Rosin–Rammler equation [27], which is widely used in many fragment size analyses [28,29,30,31,32].
Following the accumulation of coastal boulders in southern Istria (Figure 1A; [13,26]), researchers have continued to look for specific localities exposed to the impact of the southern waves along the rocky eastern Adriatic coast further to the south, aiming to find new coastal boulders or even the coarse-clast storm deposits. During systematic geological mapping and research for the new basic geological map of the Kornati National Park in scale 1:50,000 [33], the largest spatial coarse-clast storm deposit in the Adriatic region, which also included solitary boulders, was discovered on the small uninhabited island of Mana (Figure 1A–C). Subsequent focused investigations of the deposit included geological field observations and measurements, aerial photogrammetry, fragment size and distribution analyses, as well as wave modeling. We inspected the locality on 8 June 2018, while the focused field research was performed on 20 October 2020. The wave modeling for the site was based on the latest extreme storm in the Adriatic region—the 29 October 2018 Vaia storm [34,35] (Figure 1D), which was believed to be the latest cause of the significant boulder dynamics in southern Istria [26].
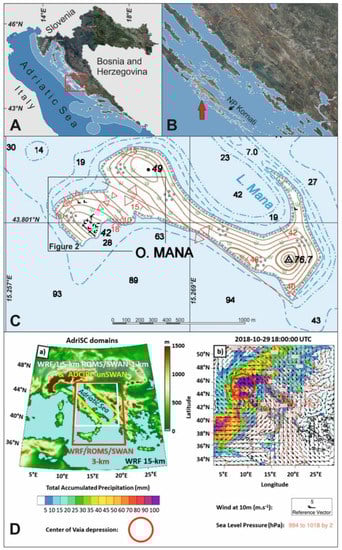
Figure 1.
(A) Location map of Croatia and the NP Kornati in Northern Dalmatia. (B) Location map of the island of Mana in Northern Dalmatia. (C) Topographic map of the island of Mana showing morphology and general bathymetry (in meters, https://geoportal.dgu.hr/ accessed on 8 January 2022), and geological structures of the bedrock carbonates (in red: anticlines, synclines, bed strike, dip, and dip angle). (D) (a) Orography used in the AdriSC WRF 15-km model and geographical location of the nested WRF, ROMS, SWAN, ADCIRC, and unSWAN models. (b) Accumulated rain, sea-level pressure, and the winds during the peak of the Vaia storm using the numerical results obtained with the WRF-15km model from the AdriSC modeling suite. The abbreviations are described in Section 3.4.
In this paper we describe for the first time a coastal coarse-clast deposit that includes many boulders, including solitary boulders found outside the deposit on a rocky shore platform of a small outer island (islet) situated in the central part of the Adriatic Sea. The location of the deposit is important since there is a shorter fetch of the strongest southeastern waves with respect to the previously discovered northern Adriatic site in southern Istria. According to the presented results, we interpret the origin and the general age of the deposit and narrow the period of the last significant boulder displacement. The data presented here also represent the first phase of the deposit monitoring and research that is supposed to continue. Although this is a local study, it is a relevant contribution to studies of other similar coastal settings around the world.
2. Geographical and Geological Setting
The Adriatic Sea is a semi-enclosed inland sea, a northern tip of the central Mediterranean (Figure 1).
The uninhabited island of Mana (0.409 km2) is situated in the central-eastern part of the Adriatic, within the Kornati archipelago (NP Kornati, Northern Dalmatia, Croatia, http://www.np-kornati.hr/index.php?lang=en (accessed 7 January 2022); https://whc.unesco.org/en/tentativelists/5106/ accessed 7 January 2022), and its southern part faces the open sea (Figure 1A,B). The highest altitude on the island is 76.7 m (Figure 1C). The southern cliff is the longest of all the islands in the archipelago and represents a special attraction for the visitors. The cliff has a concave shape; the highest point is 60 m above the sea on the eastern part, while to the south it steeply plunges into the sea to a depth of more than 50 m. The depth of the flat bottom south of the island is >90 m (Figure 1C). Thus, the steep southern coast points to a recent erosion and collapses along the tectonically predisposed, potentially unstable cliff (Figure 2).
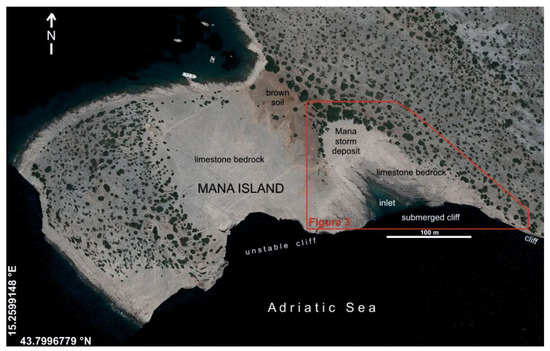
Figure 2.
Low-resolution orthophoto image of the SW part of the island of Mana from 2016 (https://geoportal.dgu.hr/ accessed on 8 January 2022), and the notations showing the Mana storm deposit that unconformably overlays Upper Cretaceous limestone bedrock and Quaternary brown soil (NP Kornati, Central Adriatic, Croatia).
The Kornati archipelago is built predominantly of deformed Upper Cretaceous to Paleogene stratified neritic carbonates [33,36] deposited on the Adriatic Carbonate Platform [23]. The carbonates were strongly deformed and fractured during Alpine orogenic compression and later tectonic phases when the External Dinarides were formed [24]. The exhumed carbonate rocks have been exposed to deep karstification during glacial low sea levels [37,38].
3. Materials and Methods
3.1. Basic Field Observations
The island of Mana coarse-clast coastal deposit, along with a few solitary boulders SE of the deposit and the limestone bedrock in the surroundings, were the main material for the investigations (Figure 2). The bedrock of the entire island is composed of shallow-water carbonates referred to as the Late Cretaceous Gornji Humac formation [33]. Compact micritic limestone characterized by intercalations of rudist bivalve lithosomes prevails within a few hundred meters of a thick pile of well-bedded carbonates that is tectonically deformed into a major anticline, and several minor anticlines and synclines in its SW limb, all characterized by a typical Dinaridic strike (NW-SE, Figure 1C).
The tectonic structure and lithology of the bedrock were investigated by classical geological field methodology. The general bedding and fracture system were measured by a geological compass. The largest and the most interesting boulders from the deposit as well as the solitary ones were selected and measured. The lithological composition of the bedrock and the boulders were compared with hand lens analyses. The orientations of the boulders were measured, and possible traces of marine biological encrustations and boring bivalves were investigated. Panoramic and focused photographs were taken for later analyses.
3.2. UAS Photogrammetry and 3D Modeling
Unmanned aircraft system (UAS) photogrammetry has become a very popular topic and is applied as a relatively low-cost spatial data collection method in geological studies and interdisciplinary research [39,40,41]. The products derived from UAS photogrammetry usually consider datasets such as point clouds, high-resolution digital surface models and digital orthophotos, photorealistic 3D models and visualizations. Rotary wing UAS was used for the purpose of the study, i.e., a custom-made hexa-copter multirotor with the possible installation of different cameras [42]. As with any geodetic method, field measurements were an indispensable part of the process. The field survey included collecting images during predefined planned missions using the UAS equipped with GNSS/INS for Direct Sensor Orientation (DiSO), with Ground Control Points (GCPs) set at the field for monitoring purposes. Integrated Sensor Orientation (ISO) was performed during post-processing based on determined coordinates of GCPs along with the initial position and attitude of the camera sensor. Initial data processing consisted of the assignment of coordinates of image centers, manual assignment of GCPs for the images, and initial setup of coordinate systems. The dataset was generated by photogrammetric software with an implemented SfM algorithm (Pix4D version 4.0.18). The first step was an automatic identification and feature matching in multiple overlapping images using the SIFT (Scale Invariant Feature Transform) object recognition system. Then matching feature points along with accurate or approximate image position and orientation were used in a bundle-block adjustment procedure. Based on 3D object reconstruction, a dense point cloud was generated as well as a high-resolution digital surface model and orthophoto map (Supplement S1).
3.3. Fragment Size Distribution Analysis from UAS Photogrammetry
The shape of the frequency-size distribution curve can be described by a continuous function such as the Rosin–Rammler (R-R, cf. [27]), whose equation is as follows:
Y = cumulative fraction of material by weight less than size x; N = constant, describing the material uniformity and hence called the “uniformity constant” spread or shape parameter; and x0 = the “characteristic fragment size” or location parameter of the distribution, defined as the size at which 63.2% () of the fragments (by weight) are smaller.
Taking the natural logarithm of Equation (1) two times; we obtain
There is a linear relationship between and so the shape parameter N can be obtained as the slope of the fitted line.
Fragmentation analysis of 3D models of rock piles generated from drone imagery (UAS photogrammetry) was performed by the Fragmenter software module in the ShapeMetrix UAV system (3GSM GmbH, Austria). It features the delineation of single fragments on a 3D model by a combined 3D surface and image analysis, the sizing of fragments based on the delineated surface patches, and the determination of the fragment size distribution. The analysis fits an ellipsoid in 3D and takes the medium axis. This kind of analysis emulates sieving.
The Fragmenter software also calculates best-fit distribution functions such as the R-R from the fragment size distribution plot. The R-R best-fit cumulative fragment size distribution is defined by two parameters, the median or 50% passing size ×50 and the uniformity constant N [43].
3.4. Atmosphere-Ocean-Wave Modeling during the 29 October 2018 Vaia Storm
The Adriatic Sea and Coast (AdriSC) modeling suite used in this study was developed to represent atmospheric and oceanic processes at various temporal and spatial scales in the Adriatic region [22,44] with two different modules. The AdriSC basic module provides the kilometer-scale coupled atmosphere and general ocean circulation for processes spanning hours to decades [45,46]. It couples the Weather Research and Forecasting (WRF, [47]) model at 15 and 3 km resolution of the atmosphere with the Regional Ocean Modeling System (ROMS, [48,49]) of the ocean and the Simulating Waves Nearshore (SWAN, [50]) model at 3 and 1 km resolution. The AdriSC nearshore module is exclusively used to assess the high-resolution coastal dynamics during extreme events. It couples the WRF model at 1.5 km resolution and the fully coupled ADvanced CIRCulation (ADCIRC) and SWAN unstructured models [51] at up to 10 m resolution. In recent years, the nearshore module has been widely used to reproduce, for example, wind waves in the northern Adriatic during the Vaia storm [26], air pressure instabilities and meteotsunami waves [52], and bora wind-induced dynamics and the associated surface cooling [53,54].
Evaluation of the AdriSC model was performed in previous studies for both the Vaia storm specifically [26] and an ensemble of extreme sirocco events in the Adriatic Sea, including the Vaia storm [22,53]. These studies demonstrated that the AdriSC modeling suite can reproduce with a good accuracy the atmospheric conditions as well as the extreme sea levels and wave heights during these events.
In this study, in order to accurately reproduce the Vaia storm, which took place in the Adriatic Sea on 29 October 2018, the basic module was set up to run for three days between 27 October and 30 October 2018. Initial conditions and boundary forcing were provided by: (1) the 6 hourly ERA-Interim reanalysis fields [55], (2) the daily analysis MEDSEA-Ocean fields [56], and (3) the hourly MEDSEA-Wave fields [57]. The nearshore module, forced by the results of the basic module, was set up to run between 28 October at midday and 30 October 2018. The synoptic conditions reproduced by the AdriSC WRF 15-km model at the peak of the Vaia storm in the Adriatic basin (at around 18:00 UTC on 29 October 2018) are presented in Figure 1D. They indicated that a strong southeasterly sirocco windstorm was blowing along the Adriatic basin. Furthermore, these strong sirocco winds persisting for many hours along the Adriatic coasts were also associated with measured extreme wave heights and storm surges. Given the good evaluation results obtained in previous studies, only the 1-min wave results from the unstructured (unSWAN) model in the vicinity of Mana Island were analyzed thereafter.
Owing to the lack of precise bathymetry data and resolution in the nearshore area where the waves break (i.e., surf zone), as well as the known limitations of the physics used in the SWAN model (e.g., the parameterization of the wave breaking), the wave heights modeled by the AdriSC unSWAN module during the event were extracted off the surf zone (ideally in deep water). The equation from [58] was applied to evaluate the wave height at the breaking point, Equation (3):
where Hb is the breaking wave height; H0 and L0 are the wave height and the wave length off the surf zone (ideally in deep water), respectively; and β is the slope of the seabed near the coast (i.e., in the area where the waves are expected to break).
4. Results
4.1. Limestone Bedrock and Fracture System
In the western part of the island, there is an elongated valley (small plain) striking NW-SE, which is covered by the shallow sea in the NW and terminates at the edge of a steep cliff in the SE (Figure 2). Limestone bedrock along the valley is unconformably covered by at least a meter of thick loose Quaternary brown soil, characterized in places by the reddish-brown calcrete at the contact with the bedrock carbonates. In the SE part of the valley there is a distinct coarse-clast deposit that unconformably overlays both the carbonate bedrock and the brown soil. The deposit is located 20–30 m NW of the tip of a shallow triangular inlet up to a few meters deep and represents the lowest top of the cliff that is partly submerged at this central part.
The limestone bedrock SE of the Mana coarse-clast deposit surrounding the shallow triangular inlet is heavily fractured and eroded (Figure 3, Figure 4 and Figure 5A) and built of alternating thin- to thick-bedded (5–90 cm, on average 50 cm) mostly micritic and well-cemented (compact) shallow-water limestones (mudstone, wackestones to floatstones). The limestone beds are gently inclined to the SW, and the average bed dip direction/dip angle is 218/12 (Figure 1C). Thus, the upper bedding planes form natural ramps, partly covered by the sea in the shallow inlet and dissected by the cliff from the south (Figure 5B). The primary bedding discontinuities are open a few centimeters, while within the beds there are up to a few millimeters of open secondary discontinuities reflecting lithological inhomogeneities parallel to the bedding (Figure 5C).

Figure 3.
High-resolution UAS orthophoto image (20 October 2020, see Supplement S1) of the investigated area on the island of Mana showing a shallow triangular inlet, highly eroded limestone bedrock in the surroundings, and the coarse-clast deposit on the NW margin (bordered by a long yellow line). The selected boulders are highlight by short yellow lines and marked by numbers (1–10). Observed displacement of the three boulders (6, 9, 10) between June 2018 and October 2020 are marked by red arrows (see also Figure 5F and Figure 6). Inset: Schematic drawing of the fracture system (each set is marked by another color) of the strongly eroded bedrock limestone in front of Mana coarse-clast deposit. The cumulative rose diagram shows all the fracture orientations weighted according to the observed total lengths (circular statistic of the delineated fracture sets according to Oriana software, Kovach Computing Services).

Figure 4.
Panorama image (westward view) based on a photogrammetric UAS 3D model of the Mana coarse-clast deposit (see Supplement S1). Color scale (legend) for the modeled thickness of the deposit (thin marginal parts not shown). Elevations above the mean sea level are marked in white numbers.
On the orthophoto high-resolution image (Figure 3), there is a clearly visible complex fracture network within the strongly eroded limestone bedrock surrounding the inlet. With respect to the NW-SE bed strike, longitudinal, transversal, and diagonal subvertical fractures form a rather chaotic network. Major longitudinal fractures are parallel to the Dinaridic fold axial plane (NW-SE), and the beds mostly have erosional terminations along the fractures that are spaced meters apart. Major transversal fractures (NE-SW) are also spaced meters apart, while diagonal fractures are spaced mostly centimeters to decimeters apart. The most prominent fractures are oriented generally W-E.
The fracture network is especially dense in the central part of the strongly eroded bedrock that is characterized by thin beds (5–15 cm), resulting in three-dimensional bedrock fragmentation, with the fragments centimeters to decimeters in size. The underlying beds are more compact than the central part of the bedrock limestone succession and as thick-bedded (40–90 cm), and the fractures are not as open as in the thin beds. Thus, the bedrock fragments on the marginal parts of the strongly eroded bedrock surrounding the inlet are decimeters to meters in size. The fracture net is not as clearly visible on the bottom of the inlet and in the peri-tidal zone since a centimeters-thick marine biogenic cover exists on the bedrock (red algae, barnacles, etc.).

Figure 5.
Field photographs of the Mana coarse-clast deposit, solitary boulders, and the bedrock limestones. The selected boulders are marked by numbers. (A) 2020 panoramic view from the SE to the tip of the shallow inlet, with eroded limestone bedrock, recognizable boulders (1, 6, 7, 8, 9), the deposit, and the brown soil in the background. Black arrow indicates a person for scale at the recently moved boulder 6. (B) 2018 panoramic view to the east on the proximal (SE) part of the deposit and a few solitary boulders in the front of the deposit (MB 6, 9, and 10) that were displaced between 2018 and 2020 (southern cliff in the background). (C) 2020 view of bedding discontinuities within the central part of the limestone bedrock in front of the deposit. White scale bar is a meter long. (D) 2020 view of the frontal part of the deposit and the boulders imbricated to the SE. (E) 2020 view of one of the largest boulders (3, hammer) that is strongly corroded and characterized by remnants of Lithophaga borings. (F) 2018 photo of a group of boulders in the frontal part of the deposit characterized by remnants of reddish-brown calcrete that is found also at the contact of the bedrock with the brown soil. Note three boulders in front of the deposit (6, 9, and 10) that were displaced between June 2018 and October 2020, and one (7) that was not displaced. (G) 2020 photo of the overturned platy boulder (1, hammer) in the frontal part of the deposit. (H) Corroded biogenic carbonate encrustations and the barnacle shells from the present-day (overturned) bottom side of boulder 1, originally on the upper bedding surface of the bedrock limestone (scale bar is 1 cm).
4.2. Mana Coarse-Clast Deposit
The coarse-clast deposit has an irregular semi-circular shape (75 m × 60 m), which covers an area of ~3892 m2 (Figure 3). The high-resolution digital surface model was built based on the UAS photogrammetry (Figure 4). In the proximal (frontal) part of the deposit facing the storm waves from the SE, the deposit is situated on top of highly eroded limestone bedrock, and the lowest part is at an altitude of 1.3 m above sea level (a.s.l). On the distal NW part, the deposit covers the brown soil at the altitude of 5 m a.s.l. The highest peak of the deposit is 7 m a.s.l. Estimated thickness in the thickest part is >2 m. Modeled volume is 3123 m3.
The coarse-clast deposit is composed of unsorted and sub-rounded limestone pebbles and cobbles, as well as angular limestone boulders. SE of the deposit there are a few solitary boulders that are not included in the deposit. With the aim of more precise description and possible future monitoring, we selected and measured ten Mana boulders (MB): five boulders situated within the deposit (MB 1–5) and five solitary boulders situated SE of the deposit (MB 6-10; Figure 3; Table 1).

Table 1.
Selected boulder data according to the field observations and photogrammetric measurements (20 October 2020) and estimation of the Mana storm deposit in general. Marks: * solitary boulders out of the unified deposit. # average bulk density is evaluated according to the professional data on mechanical properties of the most popular types of Cretaceous dimension limestone from regions that are similar to Mana limestones [59].
The larger boulders lay mostly in the frontal SE part of the deposit, facing the shallow inlet. Larger boulders are meters in size and mostly platy in shape, reflecting their origin in the well-bedded bedrock limestone. The platy boulders are imbricated to the SE in the frontal part of the deposit (Table 1, Figure 5D).
The largest boulder from the deposit (MB-3) is highly corroded and elongated, oriented SW-NE. It is 3.6 m long and 0.9 m thick, has a volume of 3.24 m3, and weighs approximately 8 t (Figure 5E). The boulder is overlapped from the SE by a platy boulder. Strongly corroded remnants of Lithophaga lithophaga borings were observed on MB-3.
4.3. Recent Displacements of the Solitary Boulders
Comparison of photographs of the frontal part of the deposit taken in June 2018 (Figure 5B,F) with photograph (Figure 5A) and the high-resolution UAS orthophoto image (Figure 3; Supplement S1) taken in October 2020 revealed the displacement of a few meters of two small solitary boulders (MB-9 and MB-10). The small boulders are located on the large upper bedding plane that is a gently inclined natural ramp facing the wave impact. In addition, an almost 20 m displacement of a large solitary boulder 6 (Figure 5B) along another upper bedding plane also occurred between 2018 and 2020 (Figure 5A,B), as visible on low-resolution orthophoto images (Figure 6). It is noteworthy that MB-6 was not moved between 2011 and 2018 (set of images accessible on https://geoportal.dgu.hr/ (accessed on 10 July 2022)). It should be mentioned that the Vaia storm happened on 29 October 2018 [26], and its role will be discussed later.

Figure 6.
Low-resolution orthophoto images (https://geoportal.dgu.hr/ accessed on 8 January 2022) of the Mana coarse-clast deposit and the boulder in the front (MB-6) that were displaced (red arrow) between 2018 and 2020.
4.4. Surface Fragment Size and Distribution within the Mana Deposit
The Rosin–Rammler distribution is a useful tool for representing particle size distributions generated by grinding, milling, and crushing operations in artificial or natural processes. From the continuous fragment size distribution function, it can be inferred which process of comminution (grinding, milling, and crushing) was dominant, based on the shape parameter (N) or fractal dimension (D). Thus, the frequency-size distribution of any fragmented natural process could be fitted to the Rosin–Rammler (R-R) equation, which is equivalent to the Weibull distribution.
The presented results obtained by UAS imagery fragment delineation refer only to the surface part of the Mana storm deposit where fragment size distribution was analyzed for 101,780 delineated fragments (Figure 7). The fragments were delineated with Fragmenter software within the selected part of the Mana coarse-clast deposit, excluding the marginal parts that were very thin or covered by bushes (Figure 7A). The focus was on the boulder-sized fragments (>256 mm) that prevailed among the detectable fragments (Figure 7B).
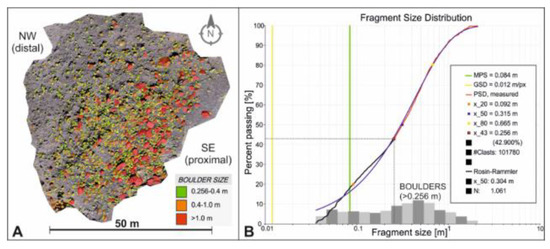
Figure 7.
(A) Boulder-size fragment distribution map within the Mana coarse-clast deposits. (B) Fragment size distribution diagram for all detectable fragments and fitted R-R distribution (Fragmenter; 3GSM GmbH). The minimum size of a fragment depends on the 3D point spacing and the image resolution. MPS—median point spacing, GSD—ground sample distance.
Two more fragment size distribution analyses were conducted separately for the proximal (SE) and distal (NW) regions, since the larger boulders were clearly concentrated in the proximal area (Figure 7A). Moreover, a boulder with a maximum size of 1910 m (length of the ellipsoid’s middle axis) was found in the proximal region, based on which a volume of 3.65 m3 and a weight of 9.122 t were calculated (limestone density of 2.5 t/m3 was used to compute the weight). In the distal region, a boulder with a maximum size of 1.118 m was found, based on which a volume of 0.73 m3 and a weight of 1.828 t were calculated. The results were similar to the measurements in the field (Table 1).
According to the linear relationship between and , the uniformity constant shape parameter N was estimated (Figure 8a). Linear regression was applied to the fragment size distribution data obtained from the Fragmenter software. According to the fitting results, the slope of the line (shape parameter N) is summarized in Table 2 for the entire storm deposit area, proximal and distal parts.
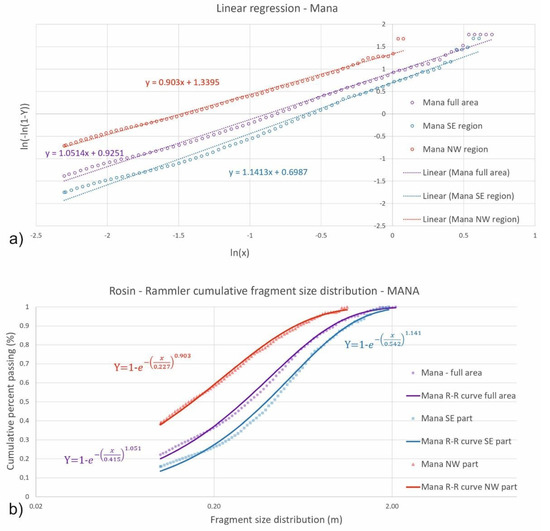
Figure 8.
(a) Linear regression for empirical fragment size data; shape parameter for entire area N = 1.051, for proximal (SE) part N = 1.141 and for distal (NW) part N = 0.903 (b) The R-R cumulative fragment size distribution for the entire area, as well as for the proximal (SE) and distal (NW) parts.
Table 2.
Shape parameter and fractal dimension for the entire analyzed Mana deposit area, as well as for the proximal (SE) and distal (NW) parts.
The R-R cumulative fragment size distribution for the entire area as well as the proximal and distal parts are shown in Figure 8b. Table 2 displays the fractal dimensions D according to [28], D = 3-N, and compares the values of the shape parameters obtained in the Fragmenter software and according to Formula (2). The differences in the shape parameter values found in Table 2 were minimal, most likely owing to the computation procedure. The shape parameter N in the Fragmenter software was most likely calculated using all empirical data, but in the second case, binned data were used.
4.5. Wave Modeling during the 29 October 2018 Vaia Storm
Near Mana Island (Figure 9a), the AdriSC unSWAN model had a resolution ranging from 10 m at the coastline to 1 km further offshore and a bathymetry that captured the main geomorphological features of the seabed (Figure 9b).
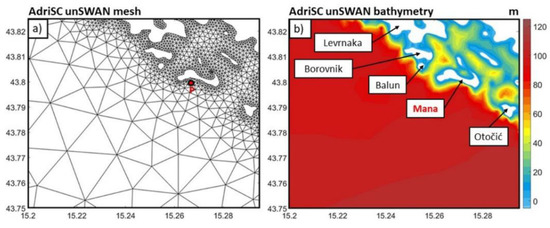
Figure 9.
AdriSC ADCIRC and unSWAN mesh structure with Point P where the wave parameters are extracted (a) and bathymetry (b), in the surroundings of Mana Island. Coordinates are in degrees.
The obtained numerical results (Figure 10) extracted at a point off Mana Island located at a depth of about 42 m (Point P, in Figure 9a) highlighted that the peak of the storm, defined by the peak values of the significant wave height (surpassing 4.5 m), was reached in the evening hours of 29 October 2018, and lasted for about 5 h.
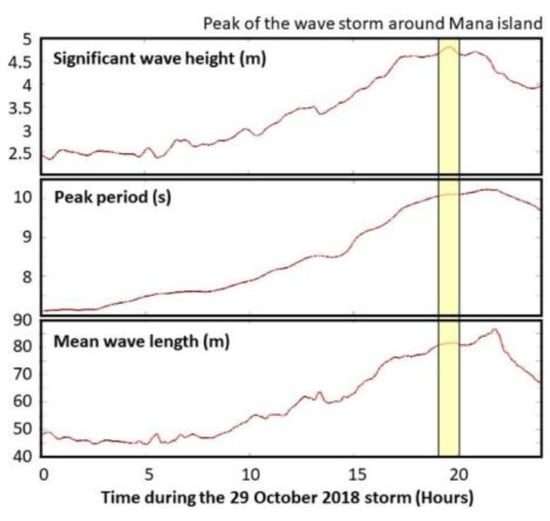
Figure 10.
Time evolution of the AdriSC unSWAN 1-min results of significant wave height, peak period and mean wave length on 29 October 2018 in the vicinity of Mana Island at 42 m depth.
Additionally, the spatial variability of the ocean circulation and the wave fields at the peak of the storm (Figure 11) indicated that the storm generated sea-surface heights up to 0.5 m along Mana Island’s southern coast that were associated with strong current speeds of up to 2 m/s. All islands acted as barriers by breaking the strong waves—i.e., more than 6 m significant wave height, 110 m mean wavelength, and about 9–10 s period offshore—along their offshore coasts and protecting the northeastern part of the domain from any wave influence.
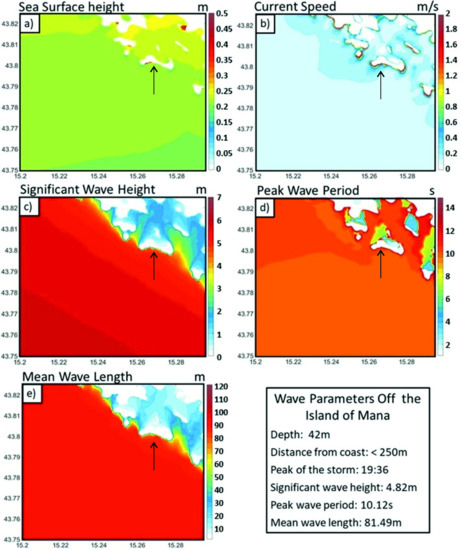
Figure 11.
Spatial variability of (1) ADCIRC maximum sea-surface height (a) and maximum current speed (b) and (2) unSWAN maximum significant wave height (c), maximum peak period (d), and maximum mean wave length (e) obtained in the vicinity of Mana Island during the peak of the 29 October 2018 Vaia storm. Black arrows point to the island of Mana. Coordinates are in degrees.
The nearshore bathymetry of the model may not be accurate owing to a lack of both resolution and precise bathymetric data. Thus, to investigate the boulder motions across the inlet area of the island of Mana, the wave parameters extracted at point P (Figure 10) were used for the wave height estimates at the breaking point using the equation of [58]. On 29 October 2018 at 19:36, the maximum significant wave height reached 4.82 m, with an associated maximum wave height of 8.39 m, a peak period of 10.12 s, and a mean wave length of 81.49 m. Assuming a bottom slope of 12° (i.e., the bedding surface of the bedrock), the significant wave height in the inlet at the breaking point for the storm was 7.81 m. Knowing that the maximum wave height in a sequence of 1000 waves (lasting about 2.8 h for wave period of about 10 s) was 1.86 times higher than the significant wave height, the maximum wave height that impacted the inlet area during the Vaia storm was estimated as about 14.5 m at its breaking point.
5. Discussion
5.1. Bedrock Conditions and the Origin of the Clasts
Well-bedded limestone bedrock surrounding the inlet is characterized by relatively closely spaced (5–90 cm) bedding discontinuities. In addition, a distinct net of tectonic discontinuities characterized by at least three systems of sub-vertical fractures is present (Figure 3). The fractures, in combination with the bedding discontinuities, define fragments of bedrock limestone centimeters to meters in size.
Remnants of the brown soil, i.e., the reddish-brown calcrete found at the contact of the bedrock and the soil, as well as on some boulders (Figure 5E), testify to the subaerial origin of the boulders. This finding followed the expectations, since the top of the soil at the NW margin of the deposit is 5 m above the present-day sea level (Figure 4) and >1 m thick soil probably extended further SE to the edge of the cliff before the soil was eroded by the extreme waves, i.e., recurring storm inundation.
On the other hand, eroded borings of Lithophaga sp. observed on one large boulder (MB-3, Figure 5F) as well as the remnants of marine biogenic encrustations and barnacle shells that are still attached to the other one (Figure 5G,H), testify to the once sublittoral or intertidal position of the parent limestone beds, respectively. Thus, this implies that the boulders originated from both: (a) the limestone beds underlying the overlying soil that originally formed the exposed edge of the cliff at the place of the present-day inlet and its surrounding, and (b) submerged bedrock in the inlet formed after the erosion of the upper part of the bedrock with the soil. The latter is evidently younger and that is why the boulders with the traces of marine life were found in the frontal (proximal) SE part of the deposit (e.g., MB-1 and MB-3; Figure 3).
5.2. Fragment Size Distribution
It is important to note that different controlling factors act at different locations within the storm deposit area: the lithology, its strength, and initial fracturing; the initial storm deposit volume, controlling the stress level, and stress release in the rock mass; the local topography and chemical weathering. All these factors, together with storm or tsunami waves releasing energy and the frequency of that occurrence (multiple or single event), have an impact on the fragmentation process.
Although originally applied to a different depositional setting, the obtained data supported the hypothesis that clastic deposits have a lower shape parameter or a higher fractal dimension as the run-out distance increases, e.g., [32]. In storm deposits, a similar mechanism applies, with an increased amount of grinding. Thus, finer-grained fragments (pebbles and cobbles) are found in the distal area of the Mana storm deposits owing to reworking of the fines by the waves in the first phase of the formation of the deposit, which also includes possible sublittoral reworking within the inlet. However, because of the obvious energy increase during the sea-level rise, the recent sublittoral fragments that have not been observed since were probably redeposited further from the inlet and incorporated into the Mana storm deposit. The authors of [29] concluded that significant shearing and continued comminution led to a lower value of the shape parameter (N), and this was supported by the obtained values of the shape parameter for the distal area of the Mana storm deposit (Table 2).
Consequently, an increase in fractal dimension (D) is expected with increasing distance from the source. The distal area of the Mana deposits had a higher value of D, which was evident in the more graded particle size distribution and the larger number of fine particles. The entire Mana deposit area fractal dimension value D = 1.94 was close to the bottom limit of the value range 2.1–2.7 [30], indicating that the material was fragmented by multiple and/or high-energy events. The obtained results indicated relatively higher D values for storm deposits because they were exposed to several high-energy events in the past and longer grinding durations that produced more fines.
In addition, according to previously mentioned authors, particle size distribution analysis was used to determine which type of distribution, or which fragmentation process, was more dominant for the proximal or distal part of the deposit, or whether the material was fragmented by multiple or single high-energy events. In general, the R-R distribution can be used to describe particle size distributions produced by diverse physical processes, and it can be used to compare particle size distributions produced by artificial and natural processes.
Additional research on storm deposits (cf. [12,60,61]) will be needed to understand how the rock type, total energy input, strain rate, confining pressure, and strain history, as well as cataclastic processes, affect the shape parameter in the R-R cumulative fragment size distribution or the fractal dimension D.
5.3. Wave Modeling and Boulders Movements
Previous studies on the eastern Adriatic rocky shore [13,26] demonstrated that extreme southern storm waves were exclusively responsible for the boulder accumulation along the coastline. The rocky shore in southern Istria is, according to the AdriSC model, exposed to the largest and the most extreme waves in the Adriatic that develop during extreme weather events driven by SE winds. In addition, the southern tip of Istria (Cape Kamenjak) is characterized by a gently inclined coastal-to-seabed ramp that has the potential to generate an extreme wave-breaking effect.
Similarly, according to the AdriSC model (Figure 11), the Mana storm deposit is also under the direct impact of extreme southern waves. While the tsunami hazard is low [18,19], the central Adriatic Sea is exposed to extreme southern to southeastern waves formed by strong southern winds [13,22]. The modeled maximum significant wave height of 4.82 m, with a peak period of 10.12 s and mean wavelength of 81.49 m, implies that the breaking wave at the inlet could be much higher, and the maximum wave height along the inlet at the breaking point for the 29 October 2018 storm was estimated as 14.5 m. This is higher than the theoretical wave heights presented in Table 1 that are needed to move the exposed solitary boulders (cf. [13,62]). However, our current hydrodynamic understanding does not permit the reliable computation of wave height from boulder measurements, and a combination of field, numerical, and experimental approaches is required to quantify relationships between wave power and mass transport onshore [12].
Nevertheless, the Vaia storm waves displaced the exposed solitary 4 t boulder (MB-6) by 20 m, while neither the smaller 2.8 t boulder (MB-7) nor the largest 14 t boulder (MB-8), which are also well exposed, moved at all. Thus, the possible movement of the boulders depended significantly on local geology and geomorphology, i.e., the configuration of the natural ramps (orientation of the bedding surfaces), local niches (e.g., truncations of the beds and potholes), and the shape of a boulder, which can lock the boulder and protect it from the extreme waves, etc.
Furthermore, this approach does not consider the channeling effect of the nearly vertical submerged concave cliff SE of the shallow inlet (Figure 1C) and the configuration of the inlet itself, which can potentially increase the energy of the waves [63]. Indeed, the proper representation of the nearshore wave dynamics in the inlet would require nesting a nearshore wave model (e.g., X-Beach model [64,65]) within the basin-scale SWAN model.
5.4. Transport Mechanism
The storm waves capable of detaching and displacing boulders of 5.9 t (MB-1) or 8.1 t (MB-3) to distance of 32 or 48 m and 3.0 or 4.8 m above sea level, respectively (Table 1, Figure 3), must be approximately 13 m high (cf. [13,62]). However, the previous commonly accepted calculations were highly criticized by [12] as mentioned above. Nevertheless, gently inclined bedding planes in the inlet above the Mana cliff serve as a ramp for easier displacement of the detached limestone fragments. Most of the boulders are platy-shaped and thus prone to sliding and possibly surfing (cf. [3]). In addition to sliding, there was an obvious rotation of the boulders, since the largest observed boulder (MB-8) was rotated at least 90°, according to the orientation of the fracture pattern on the solitary boulder perpendicular to the fracture pattern on the parent limestone bed (Figure 3).
Thinner boulders (most of the largest boulders are 0.5 m thick) have a platy tabular shape, implying displacement by sliding along the limestone ramp during propagation of the extreme waves over the inlet area. In the frontal (proximal) SE part of the storm deposit, the platy boulders can finally become imbricated when broken extreme waves completely inundate the inlet area and hit the frontal part of the deposit. Some of the platy boulders are overturned (MB-1), which implies a surfing mechanism. The elongated and oval shape of the largest boulder (MB-3) oriented perpendicular to the wave direction implies a rolling mechanism of the boulder along the natural ramp.
The crests of the extreme waves could have reached the edge of the cliff in the first phase of the formation of the deposit when the sea level was a few meters lower than today [37,38]. The distal (NW) and the lower parts of the deposit were built of the smaller fragments (pebbles, cobbles, and smaller boulders) that could be reworked during the initial erosion of the future inlet area during marine inundation over the lowest top of the cliff. There was probably no erosion in the first phase since the cliff top was a few meters higher than today (note that the preserved soil cover in the flat NW part of the valley is at 5 m a.s.l) and covered by then attached brown soil. Thus, there was a critical moment when the soil was eroded by the extreme waves that probably coincided with the first erosion of the bedrock fragments in the future inlet area and the reworking of the smaller fragments in the first littoral or paleo-beach.
The largest boulders, which require much higher-energy extreme waves, sit at the top of the deposit and in the frontal (proximal) SE part (Figure 3 and Figure 7). Such a distribution implies the earlier detachment of the thinner and more fractured beds from the eroded limestone succession. Thus, the extreme waves probably first eroded highly fragmented carbonate bedrock in the lowermost central part of the Mana southern cliff, i.e., the present-day shallow inlet, and deposited the relatively smaller fragment in the distal part of the deposit. The open space was created below the thicker beds (Figure 5C) that enabled the later extreme waves (produced during the modern sea level) to detach the larger fragments from the bedrock succession. The larger boulders could be moved along the natural ramps (gently inclined beds of the eroded bedrock), and thus be displaced tens of meters inland. Neither the detachment nor the transportation process likely occurred during a single storm; the boulders were transported by several subsequent extreme storms that produced the “perfect” waves. Most likely, the storms occurred episodically (see [26]), as implied by the scenario of the recently moved boulders on the island of Mana (MB-6, -9, and -10; Figure 3).
5.5. Boulder Dynamics and the Age of the Deposit
Recent movement of at least three boulders (MB-6, -9, and -10) was observed according to the analysis of the orthophoto images (Figure 3 and Figure 6) and the field photographs (Figure 5A,F). The detachment event of the three boulders was not observed, since all of them were already detached on the oldest analyzed images. The displacement of all three boulders happened between June 2018 and October 2020. The largest boulder from the group (MB-6) is also visible on older low-resolution orthophoto images from the analyzed set, and it did not move between 2011 and 2018 (Figure 6).
The 29 October 2018 Vaia storm’s extreme waves were proven capable of displacing some already beached storm boulders in southern Istria up to a few meters along the coast [26,66]. Consequently, the Vaia storm, the most extreme storm in the past decade, is also presumed responsible for the last significant boulder movements observed on the island of Mana. Since the recently displaced largest boulder did not move between 2011 and 2018 (Figure 6), we assumed that significant movements of the largest boulders on Mana occur on a decadal or longer scale. However, the northern Adriatic is characterized by longer fetch, and this is probably why an 8 t boulder was beached in 2014 at the boulder site in southern Istria [13].
Because some might wonder if this deposit could have formed during the last high sea level in the previous interglacial (MIS 5.5), let us consider this option as well. The present-day corrosion rate of the predominantly compact micritic limestone along the coast in the area (without freshwater springs) is approximately 0.04 mm/year [67]. At higher altitudes on the adjacent island of Kornat it is approximately 0.02 mm/year [68]. Nevertheless, according to these rates, most limestone boulders from that age would be completely corroded and have disappeared from the surface during the last >100,000 years [69]. In addition, the loose brown soil in the valley would have been completely eroded if the valley had been inundated by the sea during the MIS 5.5 highstand. Consequently, the possible origin of the deposit during the last interglacial (MIS 5.5)—when the sea level was a few meters higher than the modern period [38,70]—can be excluded. Thus, given the rate of corrosion of the carbonate bedrock and the present-day local depositional setting, the preservation potential of the Mana coarse-clast deposit in the future geological record is generally low.
The eastern Adriatic karstic coast is generally relatively stable because the relatively slow chemical dissolution (corrosion) predominates [25]. The faster mechanical erosion is active only locally and represented mostly by collapses of the carbonate rocks along tectonically predisposed steep cliffs. The central Dalmatian area has been tectonically rather stable in recent times [71,72], and a possible tectonic subsidence or uplift would be at least two orders of magnitude lower than regional sea-level rise [37,38]. Thus, a tectonic contribution can be excluded from the calculations and interpretations of the young deposits on this part of the Adriatic coast.
Thus, the inlet has obviously been formed by local erosion of the previously fractured carbonate bedrock at the edge of the sea cliff. Considering the insignificant local tectonic movements and corrosion rates of carbonate bedrock, the hypsometrically lowest part of the edge has been subjected to the strong impact of the extreme waves since the late Holocene, when the sea level was a few meters lower than today [37,38]. The position of the storm deposit, close to the partly eroded and submerged sea cliff edge in the backyard of the shallow inlet, implies that the Mana storm deposit was formed during the same time period and is still forming.
5.6. Future Research
The future systematic C14 dating of the remnants of sub-recent marine biological encrustations and barnacle shells found on some boulders could allow determination of the first episodes of extreme waves that detached the fragments from the partly submerged bedrock and displaced the boulders onshore. The overturned carbonate boulders and the original upper bedding planes of the eroded bedrock can be dated by the cosmogenic nuclides. Although there are obstacles in dating because of possible diagenetic effects [73], a comparison of the cosmogenic nuclides and C14 dating could better constrain the periods of extreme storms along the Adriatic shores. In turn, this would allow correlating the extreme storm periods and the recorded climate change during the late Holocene in this part of the Mediterranean and perhaps allow the prediction of future extreme weather events.
Comparison of the presented high-resolution orthophoto image with a future one is crucial for a more precise evaluation of the boulders’ dynamics. The ultimate methodology for assessing the spatial and temporal boulder movements would be real-time monitoring of the selected boulders and the storm waves (see [74]). A detail bathymetry of the submerged cliff and the sea bottom south of Mana, together with nearshore wave models such as X-Beach, can finally improve the detailed modeling of the maximum wave height in a similar setting.
6. Conclusions
Despite the previous assumption that shallow and semi-enclosed seas such as the Adriatic Sea lack extreme waves, several studies have confirmed such waves. As a result, the bedrock carbonates at outer positions of the northeastern Adriatic rocky coast that face the open sea are prone to erosion under the strong impact of extreme southern waves formed during extreme storms.
At specific locations along the predominantly karstic eastern Adriatic coast, the fragments detached by the extreme waves can be meters in size and can accumulate along the coast up to a hundred meters from the shoreline.
In situ bedrock fragmentation depends on the combination of the depositional (bedding) and tectonic discontinuities (fractures). Generally, thinner beds and closely spaced fractures enable smaller fragments that can be detached easily and displaced by the waves. Apart from the older tectonic in situ fragmentation, the storm waves can further fragment the material by hydrodynamic forces during the formation of a coarse-clast deposit.
The fractal dimension value D = 1.94 calculated from shape parameter N (D = 3-N) indicated that the material from the coarse-clast deposit on the island of Mana was fragmented by multiple high-energy events.
Since neither meteorological nor significant classical tsunamis have been recorded in the central and northern Adriatic Sea, the Mana coarse-clast deposit was formed during the past extreme storms.
The most recent cause of significant boulder movement in the northeastern Adriatic—including the solitary boulders on Mana Island—was the 29 October 2018 Vaia storm. The wave modeling predicted a peak significant wave height of 4.82 m off the island and 7.81 m during the wave breaking. The wave heights at their maximum are estimated to reach 14.5 m, which is enough to detach and displace some of the exposed solitary boulders.
Local topography highly influences the increase in wave height that, in combination with specific geological features, causes the local erosion, i.e., the detachments and displacements of the limestone fragments up to a boulder size.
Considering the shorter fetch affecting the central Adriatic island of Mana with respect to the northern Adriatic boulder field in southern Istria, there are probably fewer waves that can move large boulders. This is also supported by the oldest available images of the boulder area on Mana because, prior to the 2018 Vaia storm, powerful enough waves hit Mana only before 2011. Thus, the detachment and movement of the large boulders on Mana Island took place over longer periods with respect to the Istrian site.
Supplementary Materials
The following are available online at https://www.mdpi.com/article/10.3390/geosciences12100355/s1.
Author Contributions
Conceptualization, T.K.; methodology, T.K., D.N., C.D., B.K., S.B., I.V., and S.F.; software, D.N., C.D., and B.K.; validation, T.K., S.F., and I.V.; formal analysis, T.K., D.N., C.D., and B.K.; investigation, T.K, D.N., B.K., and I.V.; resources, T.K.; data curation, T.K., D.N., C.D., and B.K.; writing—original draft preparation, T.K., D.N., C.D. and B.K.; writing—review and editing, T.K., D.N., C.D., B.K., S.B., I.V., and S.F.; visualization, T.K., D.N., C.D., and B.K.; supervision, T.K., I.V. and S.F.; project administration, T.K.; funding acquisition, T.K. All authors have read and agreed to the published version of the manuscript.
Funding
This research received no external funding.
Data Availability Statement
The data have been posted to a trusted repository, and a DOI for the data repository allowing journal and reviewer access to the posted data (uploaded 27 April 2022) is located at https://data.mendeley.com/datasets/f3ptzmjcwv/1: Korbar, Tvrtko (2022), “2022_Korbar-et-al_Mana”, Mendeley Data, V1, https://doi.org/10.17632/f3ptzmjcwv.1.
Acknowledgments
We would like to thank Kornati National Park for boat transport during the fieldwork. This research did not receive any specific grant from funding agencies in the public, commercial, or not-for-profit sectors. Two anonymous reviewers’ suggestions were very useful for the improvement of an early version of the manuscript. Special thanks to the Assistent Editor Sorin Hadrian Petrescu as well as to the Managing and the Academic editors.
Conflicts of Interest
The authors declare no conflict of interest.
References
- Suanez, S.; Fichaut, B.; Magne, R. Cliff-top storm deposits on Banneg Island, Brittany, France: Effects of giant waves in the Eastern Atlantic Ocean. Sediment. Geol. 2009, 220, 12–28. [Google Scholar] [CrossRef]
- Etienne, S.; Paris, R. Boulder accumulations related to storms on the south coast of the Reykjanes Peninsula (Iceland). Geomorphology 2020, 114, 55–70. [Google Scholar] [CrossRef]
- Fichaut, B.; Suanez, S. Quarrying, transport and deposition of cliff-top storm deposits during extreme events: Banneg Island, Brittany. Mar. Geol. 2011, 283, 36–55. [Google Scholar] [CrossRef]
- Goto, K.; Miyagi, K.; Kawana, T.; Takahashi, J.; Imamura, F. Emplacement and movement of boulders by known storm waves—Field evidence from the Okinawa Islands, Japan. Mar. Geol. 2011, 283, 66–78. [Google Scholar] [CrossRef]
- Cox, R.; Zentner, D.B.; Kirchner, B.J.; Cook, M.S. Boulder ridges on the Aran Islands (Ireland): Recent movements caused by storm waves, not tsunamis. J. Geol. 2012, 120, 249–272. [Google Scholar] [CrossRef]
- Cox, R.; Jahn, K.L.; Watkins, O.G.; Cox, P. Extraordinary boulder transport by storm waves, and criteria for analysing coastal boulder deposits. Earth-Sci. Rev. 2018, 177, 623–636. [Google Scholar] [CrossRef]
- Cox, R. Very large boulders were moved by storm waves on the west coast of Ireland in winter 2013–2014. Mar. Geol. 2019, 412, 217–219. [Google Scholar] [CrossRef]
- Mastronuzzi, G.; Pignatelli, C.; Sansò, P.; Selleri, G. Boulder accumulations produced by the 20th February, 1743 tsunami along the coast of Southeastern Salento (Apulia region, Italy). Mar. Geol. 2007, 242, 191–205. [Google Scholar] [CrossRef]
- Williams, D.M.; Hall, A.M. Cliff-top megaclast deposits of Ireland, a record of extreme waves in the North Atlantic—storms or tsunamis? Mar. Geol. 2004, 206, 101–117. [Google Scholar] [CrossRef]
- Richmond, B.M.; Watt, S.; Buckley, M.; Jaffe, B.E.; Gelfenbaum, G.; Morton, R.A. Recent storm and tsunami coarse-clast deposit characteristics, southeast Hawai’i. Mar. Geol. 2011, 283, 79–89. [Google Scholar] [CrossRef]
- Prizomwala, S.P.; Gandhi, D.; Ukey, V.M.; Bhatt, N.; Rastogi, B.K. Coastal boulders as evidences of high-energy marine events from Diu Island, west coast of India: Storm or palaeotsunami? Nat. Hazards 2015, 75, 1187–1203. [Google Scholar] [CrossRef]
- Cox, R.; Ardhuin, F.; Dias, F.; Autret, R.; Beisiegel, N.; Earlie, C.S.; Herterich, J.G.; Kennedy, A.; Paris, R.; Raby, A.; et al. Systematic Review Shows That Work Done by Storm Waves Can Be Misinterpreted as Tsunami-Related Because Commonly Used Hydrodynamic Equations Are Flawed. Front. Mar. Sci. 2020, 7, 4. [Google Scholar] [CrossRef]
- Biolchi, S.; Furlani, S.; Devoto, S.; Scicchitano, G.; Korbar, T.; Vilibić, I.; Šepić, J. The origin and dynamics of coastal boulders in a semi-enclosed shallow basin: A northern Adriatic case study. Mar. Geol. 2019, 411, 62–77. [Google Scholar] [CrossRef]
- Hall, A.M.; Hansom, J.D.; Williams, D.M.; Jarvis, J. Distribution, geomorphology and lithofacies of cliff-top storm deposits: Examples from the high-energy coasts of Scotland and Ireland. Mar. Geol. 2006, 232, 131–155. [Google Scholar] [CrossRef]
- Naylor, L.A.; Stephenson, W.J.; Smith, H.C.M.; Way, O.; Mendelssohn, J.; Cowley, A. Geomorphological control on boulder transport and coastal erosion before, during and after an extreme extra-tropical cyclone. Earth Surf. Processes Landf. 2016, 41, 685–700. [Google Scholar] [CrossRef]
- Oliveira, M.A.; Scotto, M.G.; Barbosa, S.; de Andrade, C.F.; da Conceição Freitas, M. Morphological controls and statistical modelling of boulder transport by extreme storms. Mar. Geol. 2020, 426, 106216. [Google Scholar] [CrossRef]
- Biolchi, S.; Furlani, S.; Antonioli, F.; Baldassini, N.; Deguara, J.C.; Devoto, S.; Stefano, A.D.; Evans, J.; Gambin, T.; Gauci, R.; et al. Boulder accumulations related to extreme wave events on the eastern coast of Malta. Nat. Hazards Earth Syst. Sci. 2016, 16, 719–756. [Google Scholar] [CrossRef]
- Paulatto, M.; Pinat, T.; Romanelli, F. Tsunami hazard scenarios in the Adriatic Sea domain. Nat. Hazards Earth Syst. Sci. 2007, 7, 309–325. [Google Scholar] [CrossRef]
- Pasarić, M.; Brizuela, B.; Graziani, L.; Maramai, A.; Orlić, M. Historical tsunamis in the Adriatic Sea. Nat. Hazards 2012, 61, 281–316. [Google Scholar] [CrossRef]
- Leder, N.; Smirčić, A.; Vilibić, I. Extreme values of surface wave heights in the northern Adriatic. Geofizika 1999, 15, 1–13. [Google Scholar]
- Pomaro, A.; Cavaleri, L.; Lionello, P. Climatology and trends of the Adriatic Sea wind waves: Analysis of a 37-year long instrumental data set. Int. J. Clim. 2017, 37, 4237–4250. [Google Scholar] [CrossRef]
- Denamiel, C.; Pranić, P.; Quentin, F.; Mihanović, H.; Vilibić, I. Pseudo-global warming projections of extreme wave storms in complex coastal regions: The case of the Adriatic Sea. Clim. Dyn. 2020, 55, 2483–2509. [Google Scholar] [CrossRef]
- Vlahović, I.; Tišljar, J.; Velić, I.; Matičec, D. Evolution of the Adriatic Carbonate Platform: Palaeogeography, main events and depositional dynamics. Palaeogeogr. Palaeoclimatol. Palaeoecol. 2005, 220, 333–360. [Google Scholar] [CrossRef]
- Korbar, T. Orogenic evolution of the External Dinarides in the NE Adriatic region: A model constrained by tectonostratigraphy of Upper Cretaceous to Palaeogene carbonates. Earth-Sci. Rev. 2009, 96, 296–312. [Google Scholar] [CrossRef]
- Pikelj, K.; Juračić, M. Eastern Adriatic coast (EAC): Geomorphology and coastal vulnerability of a karstic coast. J. Coast. Res. 2013, 29, 944–957. [Google Scholar] [CrossRef]
- Biolchi, S.; Denamiel, C.; Devoto, S.; Korbar, T.; Macovaz, V.; Scicchitano, G.; Vilibić, I.; Furlani, S. Impact of the October 2018 Storm Vaia on Coastal Boulders in the Northern Adriatic Sea. Water 2019, 11, 2229. [Google Scholar] [CrossRef]
- Rosin, P.; Rammler, E. Laws governing the fineness of powdered coal. J. Inst. Fuel 1933, 7, 89–105. [Google Scholar]
- Turcotte, D.L. Fractals and fragmentation. J. Geophys. Res. 1986, 91, 1921–1926. [Google Scholar] [CrossRef]
- Grady, D.E.; Kipp, M.E. Dynamic rock fragmentation. In Fracture Mechanics of Rocks, Atkinson, B.K., Ed.; Elsevier: New York, NY, USA, 1987; pp. 429–475. [Google Scholar]
- Hartmann, W.K. Terrestrial, lunar, and interplanetary rock fragmentation. Icarus 1969, 10, 201–213. [Google Scholar] [CrossRef]
- Lu, P.; Jefferson, I.F.; Rosenbaum, M.S.; Smalley, I.J. Fractal characteristics of loess formation: Evidence from laboratory experiments. Eng. Geol. 2003, 69, 287–293. [Google Scholar] [CrossRef]
- Crosta, G.B.; Frattini, P.; Fusi, N. Fragmentation in the Val Pola rock avalanche, Italian Alps. J. Geophys. Res.-Earth 2007, 112, F01006. [Google Scholar] [CrossRef]
- Brčić, V.; Korbar, T.; Fuček, L.; Palenik, D.; Belić, N.; Mišur, I.; Wacha, L. Osnovna Geološka Karta Republike Hrvatske (Basic Geological Map of the Republic of Croatia) Mjerila (Scale) 1:50,000—NP KORNATI; Zavod za Geologiju (Department of Geology), Hrvatski Geološki Institute (Croatian Geological Survey): Zagreb, Croatia, 2019; ISBN 978-953-6907-72-4.
- Cavaleri, L.; Bajo, M.; Barbariol, F.; Bastianini, M.; Benetazzo, A.; Bertotti, L.; Chiggiato, J.; Davolio, S.; Ferrarin, C.; Magnusson, L.; et al. The 29 October 2018 storm in Northern Italy—An exceptional event and its modeling. Prog. Oceanogr. 2019, 178, 102178. [Google Scholar] [CrossRef]
- Davolio, S.; Della Fera, S.; Laviola, S.; Miglietta, M.M.; Levizzani, V. Heavy precipitation over Italy from the Mediterranean storm “Vaia” in October 2018: Assessing the role of an atmospheric river. Mon. Weather Rev. 2020, 148, 3571–3588. [Google Scholar] [CrossRef]
- Korbar, T.; Surić, M.; Fuček, L.; Mihelčić, V.; Veseli, V.; Drobne, K. Geologija kornatskog otočja (Geology of Kornati archipelago). In Vodič Ekskurzija (Excursion Guidebook), 4. Hrvatski Geološki Kongres (4th Croatian Geological Congress); Horvat, M., Ed.; Hrvatski Geološki Institut (Croatian Geological Survey): Zagreb, Croatia, 2010; Excursion B1; pp. 130–142. [Google Scholar]
- Surić, M.; Juračić, M.; Horvatinčić, N.; Krajcar Bronić, I. Late Pleistocene—Holocene sea-level rise and the pattern of coastal karst inundation: Records from submerged speleothems along the Eastern Adriatic Coast (Croatia). Mar. Geol. 2005, 214, 163–175. [Google Scholar] [CrossRef]
- Benjamin, J.; Rovere, A.; Fontana, A.; Furlani, S.; Vacchi, M.; Inglis, R.H.; Galili, E.; Antonioli, F.; Sivan, D.; Miko, S.; et al. late Quaternary Sea-Level Changes and Early Human Societies in the Central and Eastern Mediterranean Basin: An Interdisciplinary Review. Quat. Int. 2017, 449, 29–57. [Google Scholar] [CrossRef]
- Kordić, B.; Lužar-Oberiter, B.; Pikelj, K.; Matoš, B.; Vlastelica, G. Integration of terrestrial laser ccanning and UAS photogrammetry in geological studies: Examples from Croatia. Period. Polytech. Civ. Eng. 2019, 63, 989–1003. [Google Scholar]
- Aleshin, I.M.; Ivanov, S.D.; Koryagin, V.N.; Matveev, M.A.; Morozov, Y.A.; Perederin, F.V.; Kholodkov, K.I. Review on the use of light unmanned aerial vehicles in geological and geophysical research. Seism. Instrum. 2020, 56, 509–515. [Google Scholar] [CrossRef]
- Martelet, G.; Gloaguen, E.; Døssing, A.; Lima Simoes da Silva, E.; Linde, J.; Rasmussen, T.M. Airborne/UAV Multisensor surveys enhance the geological mapping and 3D model of a pseudo-skarn deposit in Ploumanac’h, French Brittany. Minerals 2021, 11, 1259. [Google Scholar] [CrossRef]
- Kordić, B.; Gašparović, M.; Oberiter, B.L.; Đapo, A.; Vlastelica, G. Spatial data performance test of mid-cost UAS with direct georeferencing. Period. Polytech. Civ. Eng. 2020, 64, 859–868. [Google Scholar] [CrossRef]
- Ochterlony, F. The Swebrec © function: Linking fragmentation by blasting and crushing. Trans. Inst. Min. Metall. Sect. A Min. Technol. 2005, 114, A29–A44. [Google Scholar] [CrossRef]
- Denamiel, C.; Šepić, J.; Ivanković, D.; Vilibić, I. The Adriatic Sea and Coast modeling suite: Evaluation of the meteotsunami forecast component. Ocean Model. 2019, 135, 71–93. [Google Scholar] [CrossRef]
- Denamiel, C.; Pranić, P.; Ivanković, D.; Tojčić, I.; Vilibić, I. Performance of the Adriatic Sea and Coast (AdriSC) climate component—A COAWST V3.3-based coupled atmosphere–ocean modeling suite: Atmospheric dataset. Geosci. Model Dev. 2021, 14, 3995–4017. [Google Scholar] [CrossRef]
- Pranić, P.; Denamiel, C.; Vilibić, I. Performance of the Adriatic Sea and Coast (AdriSC) climate component—A COAWST V3.3-based coupled atmosphere-ocean modeling suite: Ocean part. Geosci. Model Dev. 2021, 14, 5927–5955. [Google Scholar] [CrossRef]
- Skamarock, W.C.; Klemp, J.B.; Dudhia, J.; Gill, D.O.; Barker, D.M.; Wang, W.; Powers, J.G. A description of the advanced research WRF version 2. In NCAR Technical Note NCAR/TN; University Corporation for Atmospheric Research: Boulder, CO, USA, 2005; p. 468. [Google Scholar]
- Shchepetkin, A.F.; McWilliams, J.C. The regional oceanic modeling system: A split-explicit, free-surface, topography-following-coordinate ocean model. Ocean Model. 2005, 9, 347–404. [Google Scholar] [CrossRef]
- Shchepetkin, A.F.; McWilliams, J.C. Correction and commentary for “Ocean forecasting in terrain-following coordinates: Formulation and skill assessment of the regional ocean modeling system”. J. Comput. Phys. 2009, 228, 8985–9000. [Google Scholar] [CrossRef]
- Booij, N.; Ris, R.C.; Holthuijsen, L. A third-generation wave model for coastal regions: Model description and validation. J. Geophys. Res. Atmos. 1997, 104, 7649–7656. [Google Scholar] [CrossRef]
- Dietrich, J.C.; Tanaka, S.; Westerink, J.J.; Dawson, C.N.; Luettich, R.A.; Zijlema, M.; Holthuijsen, L.H.; Smith, J.M.; Westerink, L.G.; Westerink, H.J. Performance of the Unstructured-Mesh, SWAN+ADCIRC Model in Computing Hurricane Waves and Surge. J. Sci. Comput. 2012, 52, 468–497. [Google Scholar] [CrossRef]
- Tojčić, I.; Denamiel, C.; Vilibić, I. Performance of the Adriatic early warning system during the multi-meteotsunami event of 11–19 May 2020: An assessment using energy banners. Nat. Hazards Earth Syst. Sci. 2021, 21, 2427–2446. [Google Scholar] [CrossRef]
- Denamiel, C.; Tojčić, I.; Vilibić, I. Far future climate (2060–2100) of the northern Adriatic air–sea heat transfers associated with extreme bora events. Clim. Dyn. 2020, 55, 3043–3066. [Google Scholar] [CrossRef]
- Denamiel, C.; Tojčić, I.; Vilibić, I. Balancing accuracy and efficiency of atmospheric models in the northern Adriatic during severe bora events. J. Geophys. Res. Atmos. 2021, 126, e2020JD033516. [Google Scholar] [CrossRef]
- Balsamo, G.; Albergel, C.; Beljaars, A.; Boussetta, S.; Brun, E.; Cloke, H.; Dee, D.; Dutra, E.; Muñoz-Sabater, J.; Pappenberger, F.; et al. ERA-Interim/Land: A global land surface reanalysis data set. Hydrol. Earth Syst. Sci. 2015, 19, 389–407. [Google Scholar] [CrossRef]
- Pinardi, N.; Allen, I.; Demirov, E.; De Mey, P.; Korres, G.; Lascaratos, A.; Le Traon, P.Y.; Maillard, C.; Manzella, G.; Tziavos, C. Mediterranean Ocean Forecasting System: First phase of implementation (1998–2001). Ann. Geophys. 2003, 21, 3–20. [Google Scholar] [CrossRef]
- Ravdas, M.; Zacharioudaki, A.; Korres, G. Implementation and validation of a new operational wave forecasting system of the Mediterranean Monitoring and Forecasting Centre in the framework of the Copernicus Marine Environment Monitoring Service. Nat. Hazards Earth Syst. Sci. 2018, 18, 2675–2695. [Google Scholar] [CrossRef]
- Sunamura, T.; Horikawa, K. Two-Dimensional Beach Transformation due to Waves. Coast. Eng. Proc. 1974, 1, 920–938. [Google Scholar]
- Crnković, B.; Jovičić, D. Dimension stone deposit in Croatia. Rud.-Geološko-Naft. Zb. 1993, 5, 139–163. [Google Scholar]
- Noormets, R.; Crook, K.A.W.; Felton, E.A. Sedimentology of rocky shorelines: 3. Hydrodynamics of megaclast emplacement and transport on a shore platform, Oahu, Hawaii. Sediment. Geol. 2004, 172, 41–65. [Google Scholar] [CrossRef]
- Bujan, N.; Cox, R. Maximal Heights of Nearshore Storm Waves and Resultant Onshore Flow Velocities. Front. Mar. Sci. 2020, 7, 309. [Google Scholar] [CrossRef]
- Nandasena, N.A.K.; Paris, R.; Tanaka, N. Reassessment of hydrodynamic equations: Minimum flow velocity to initiate boulder transport by high energy events (storms, tsunamis). Mar. Geol. 2011, 281, 70–84. [Google Scholar] [CrossRef]
- Pudjaprasetya, S.R.; Risriani, V.M. Iryanto. Numerical Simulation of Propagation and Run-Up of Long Waves in U-Shaped Bays. Fluids 2021, 6, 146. [Google Scholar] [CrossRef]
- Roelvink, J.; Reniers, A.; van Dongeren, A.; van Thiel de Vries, J.S.M.; McCall, R.; Lescinski, J. Modelling storm impacts on beaches, dunes and barrier islands. Coast. Eng. 2009, 56, 1133–1152. [Google Scholar] [CrossRef]
- Roelvink, J.; Reniers, A.; van Dongeren, A.; van Thiel de Vries, J.S.M.; Lescinski, J.; McCall, R. XBeach Model Description and Manual. Technical Report, Unescio-IHE. Deltares and Delft University of Technology: Delft, The Netherlands, 2010. [Google Scholar]
- Farkas, A.; Degiuli, N.; Martić, I. Assessment of offshore wave energy potential in the Croatian part of the Adriatic Sea and comparison with wind energy potential. Energies 2019, 2, 2357. [Google Scholar] [CrossRef]
- Furlani, S.; Cucchi, F.; Forti, F.; Rossi, A. Comparison between coastal and inland Karst limestone lowering rates in the northeastern Adriatic Region (Italy and Croatia). Geomorphology 2009, 104, 73–81. [Google Scholar] [CrossRef]
- Krklec, K.; Domínguez-Villar, D.; Braucher, R.; Perica, D.; Mrak, I. Morphometric comparison of weathering features on side by side carbonate rock surfaces with different exposure ages—A case from the Croatian coast. Quat. Int. 2018, 494, 275–285. [Google Scholar] [CrossRef]
- Furlani, S.; Vaccher, V.; Antonioli, F.; Agate, M.; Biolchi, S.; Boccali, C.; Busetti, A.; Caldareri, F.; Canziani, F.; Chemello, R.; et al. Preservation of MIS 5.5 erosional landforms and biological structures to be used as sea level change markers: A matter of luck. Water 2021, 13, 2127. [Google Scholar] [CrossRef]
- Lambeck, K.; Purcell, A. Sea-level change in Mediterranean Sea since the LGM: Model predictions for tectonically stable areas. Quat. Sci Rev. 2005, 24, 1969–1988. [Google Scholar] [CrossRef]
- Faivre, S.; Bakran-Petricioli, T.; Horvatinčić, N.; Sironić, A. Distinct phases of relative sea level changes in the central Adriatic during the last 1500 years—Influence of climatic variations? Palaeogeogr. Palaeoclim. Palaeocl. 2013, 369, 163–174. [Google Scholar] [CrossRef]
- Surić, M.; Korbar, T.; Juračić, M. Tectonic constraints on the late Pleistocene-Holocene relative sea-level change along the north-eastern Adriatic coast (Croatia). Geomorphology 2014, 220, 93–103. [Google Scholar] [CrossRef]
- Rixhon, G.; May, S.M.; Engel, M.; Mechernich, S.; Schroeder-Ritzrau, A.; Frank, N.; Fohlmeister, J.; Boulvain, F.; Dunai, T.; Brückner, H. Multiple dating approach (14C, 230Th/U and 36Cl) of tsunami-transported reef-top boulders on Bonaire (Leeward Antilles)—Current achievements and challenges. Mar. Geol. 2018, 396, 100–113. [Google Scholar] [CrossRef]
- Scardino, G.; Scicchitano, G.; Chirivì, M.; Costa, P.J.M.; Luparelli, A.; Mastronuzzi, G. Convolutional Neural network and Optical Flow for the Assessment of Wave and Tide Parameters from Video Analysis (LEUCOTEA): An Innovative Tool for Coastal Monitoring. Remote Sens. 2022, 14, 2994. [Google Scholar] [CrossRef]
Publisher’s Note: MDPI stays neutral with regard to jurisdictional claims in published maps and institutional affiliations. |
© 2022 by the authors. Licensee MDPI, Basel, Switzerland. This article is an open access article distributed under the terms and conditions of the Creative Commons Attribution (CC BY) license (https://creativecommons.org/licenses/by/4.0/).