Insights about the Epidemiology of Dog Bites in a Canadian City Using a Dog Aggression Scale and Administrative Data

 , ,
, ,
Simple Summary
Abstract
1. Introduction
2. Materials and Methods
2.1. Data Collection
2.2. Statistical Analyses
3. Results
3.1. Multivariable Generalized Ordered Logistic Regression Model
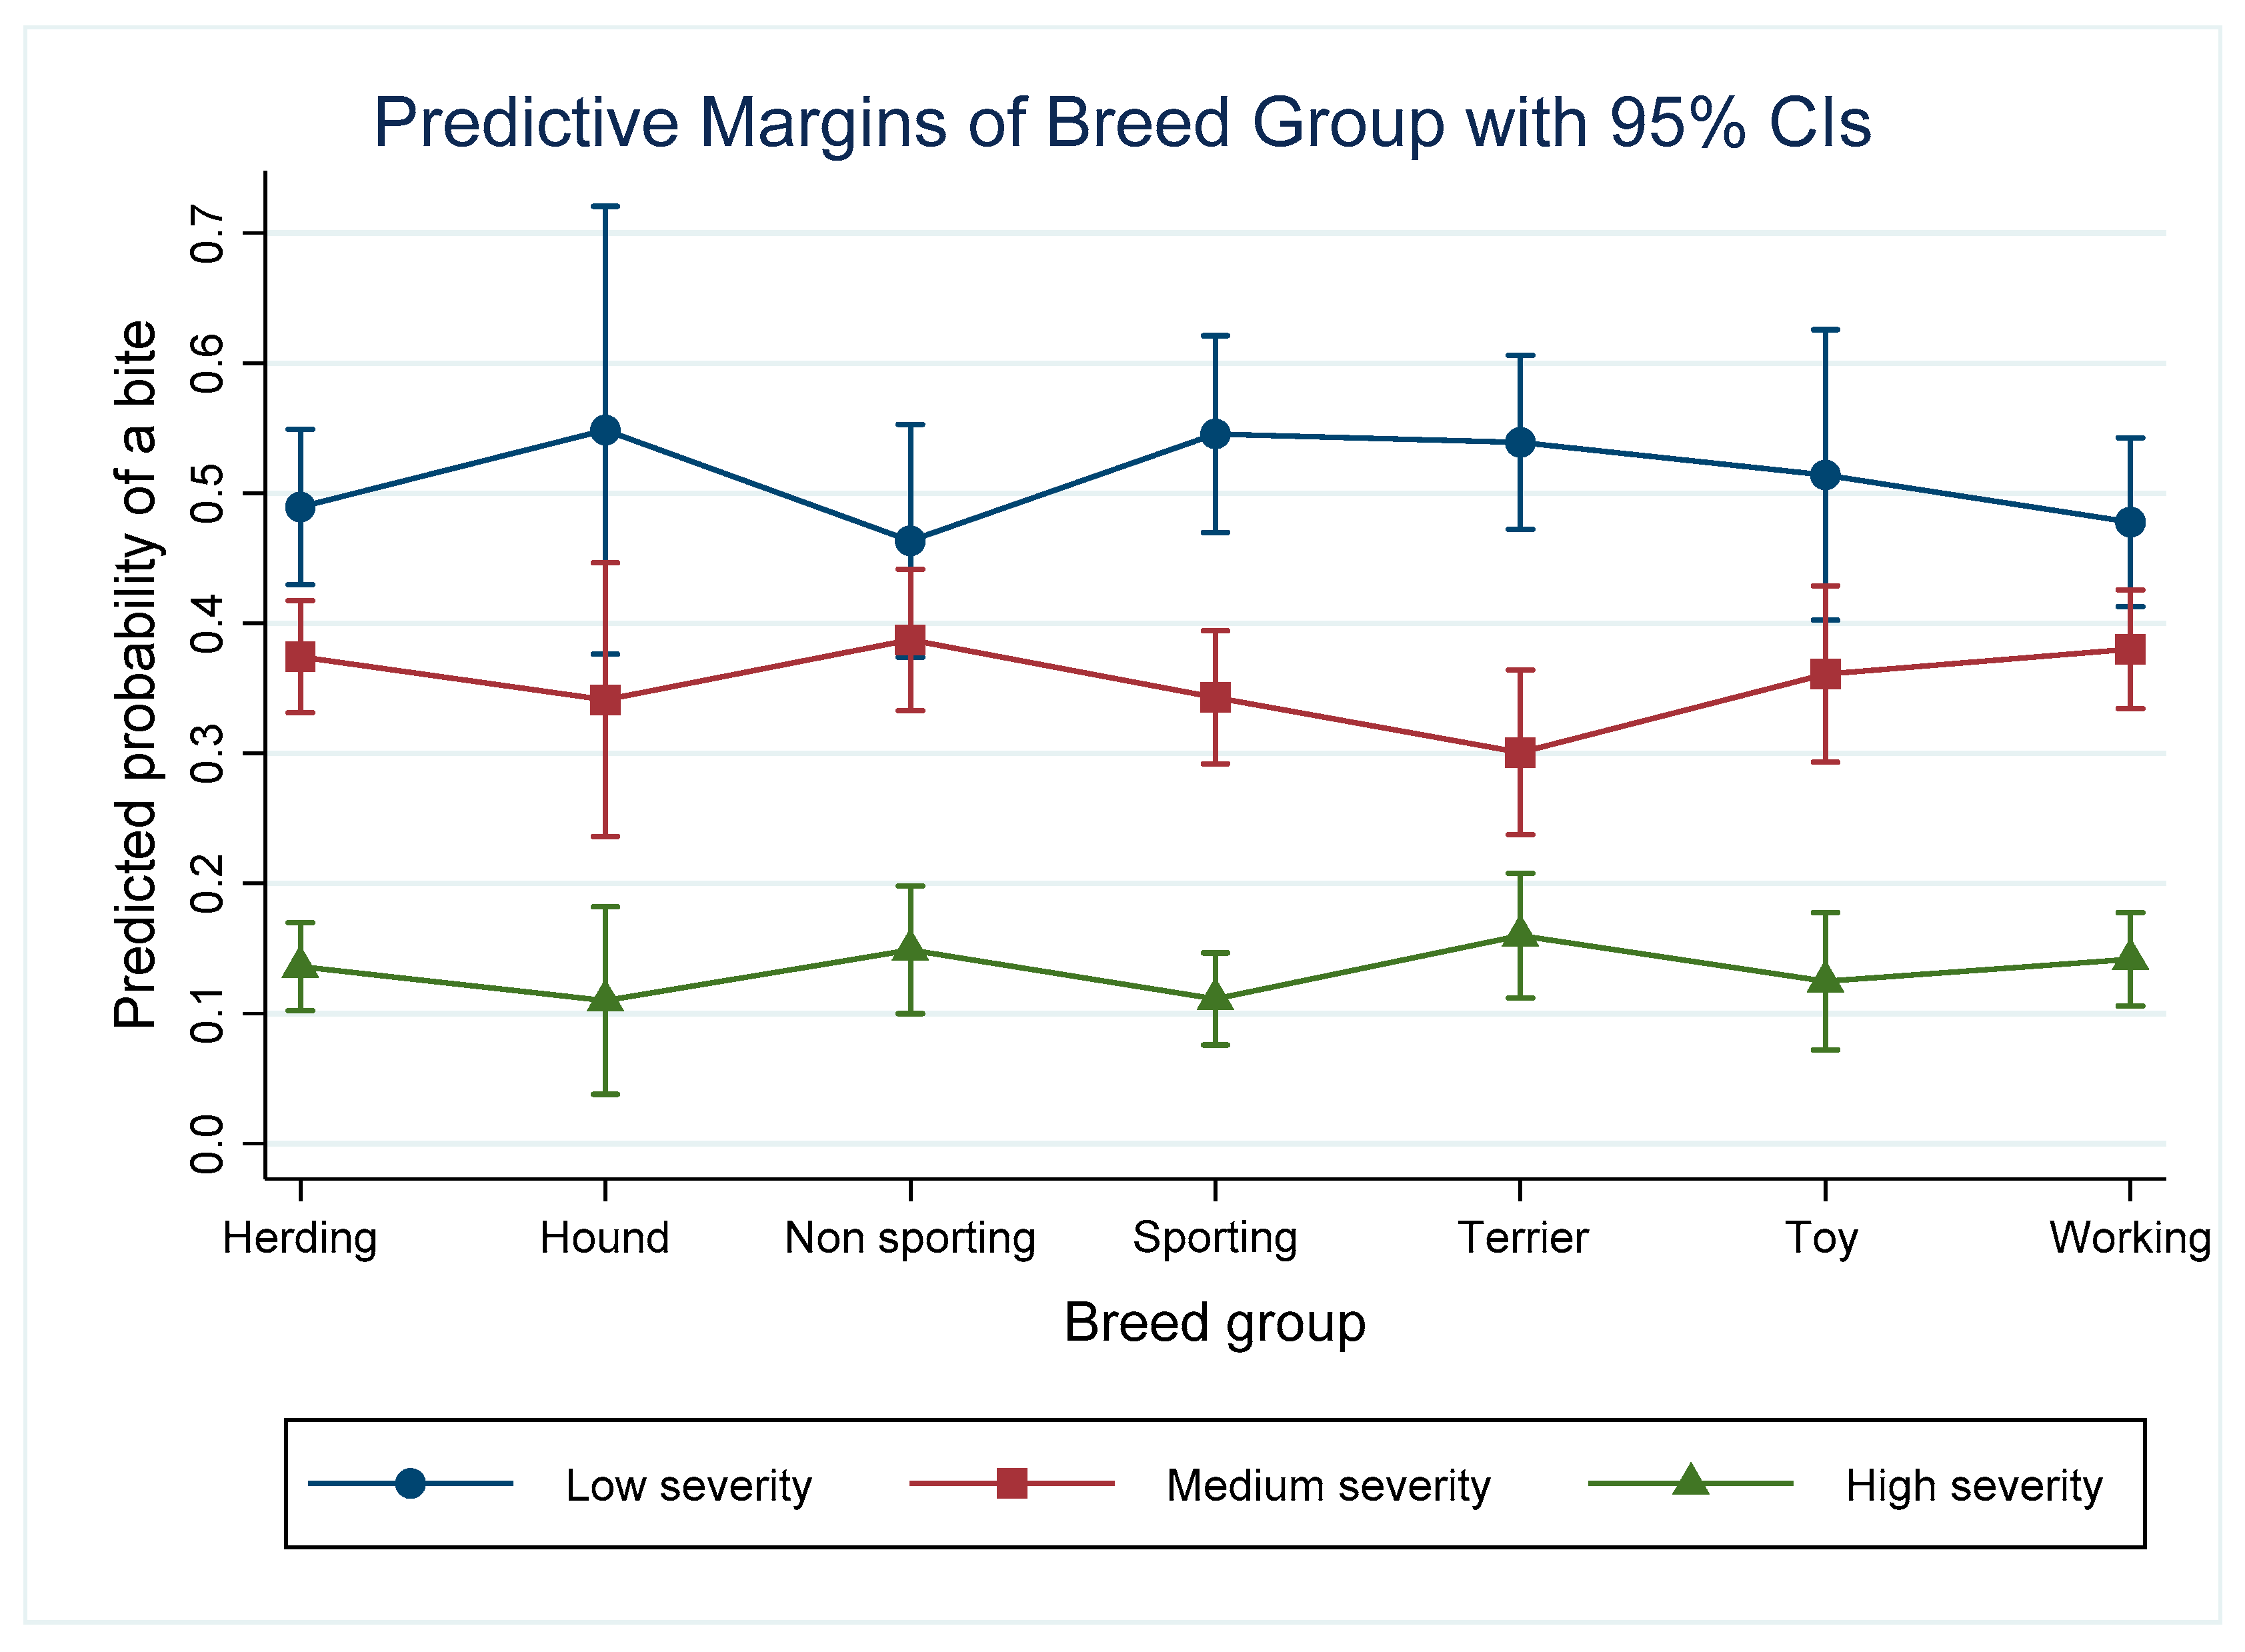
3.2. Breed Group
3.3. Incident Location
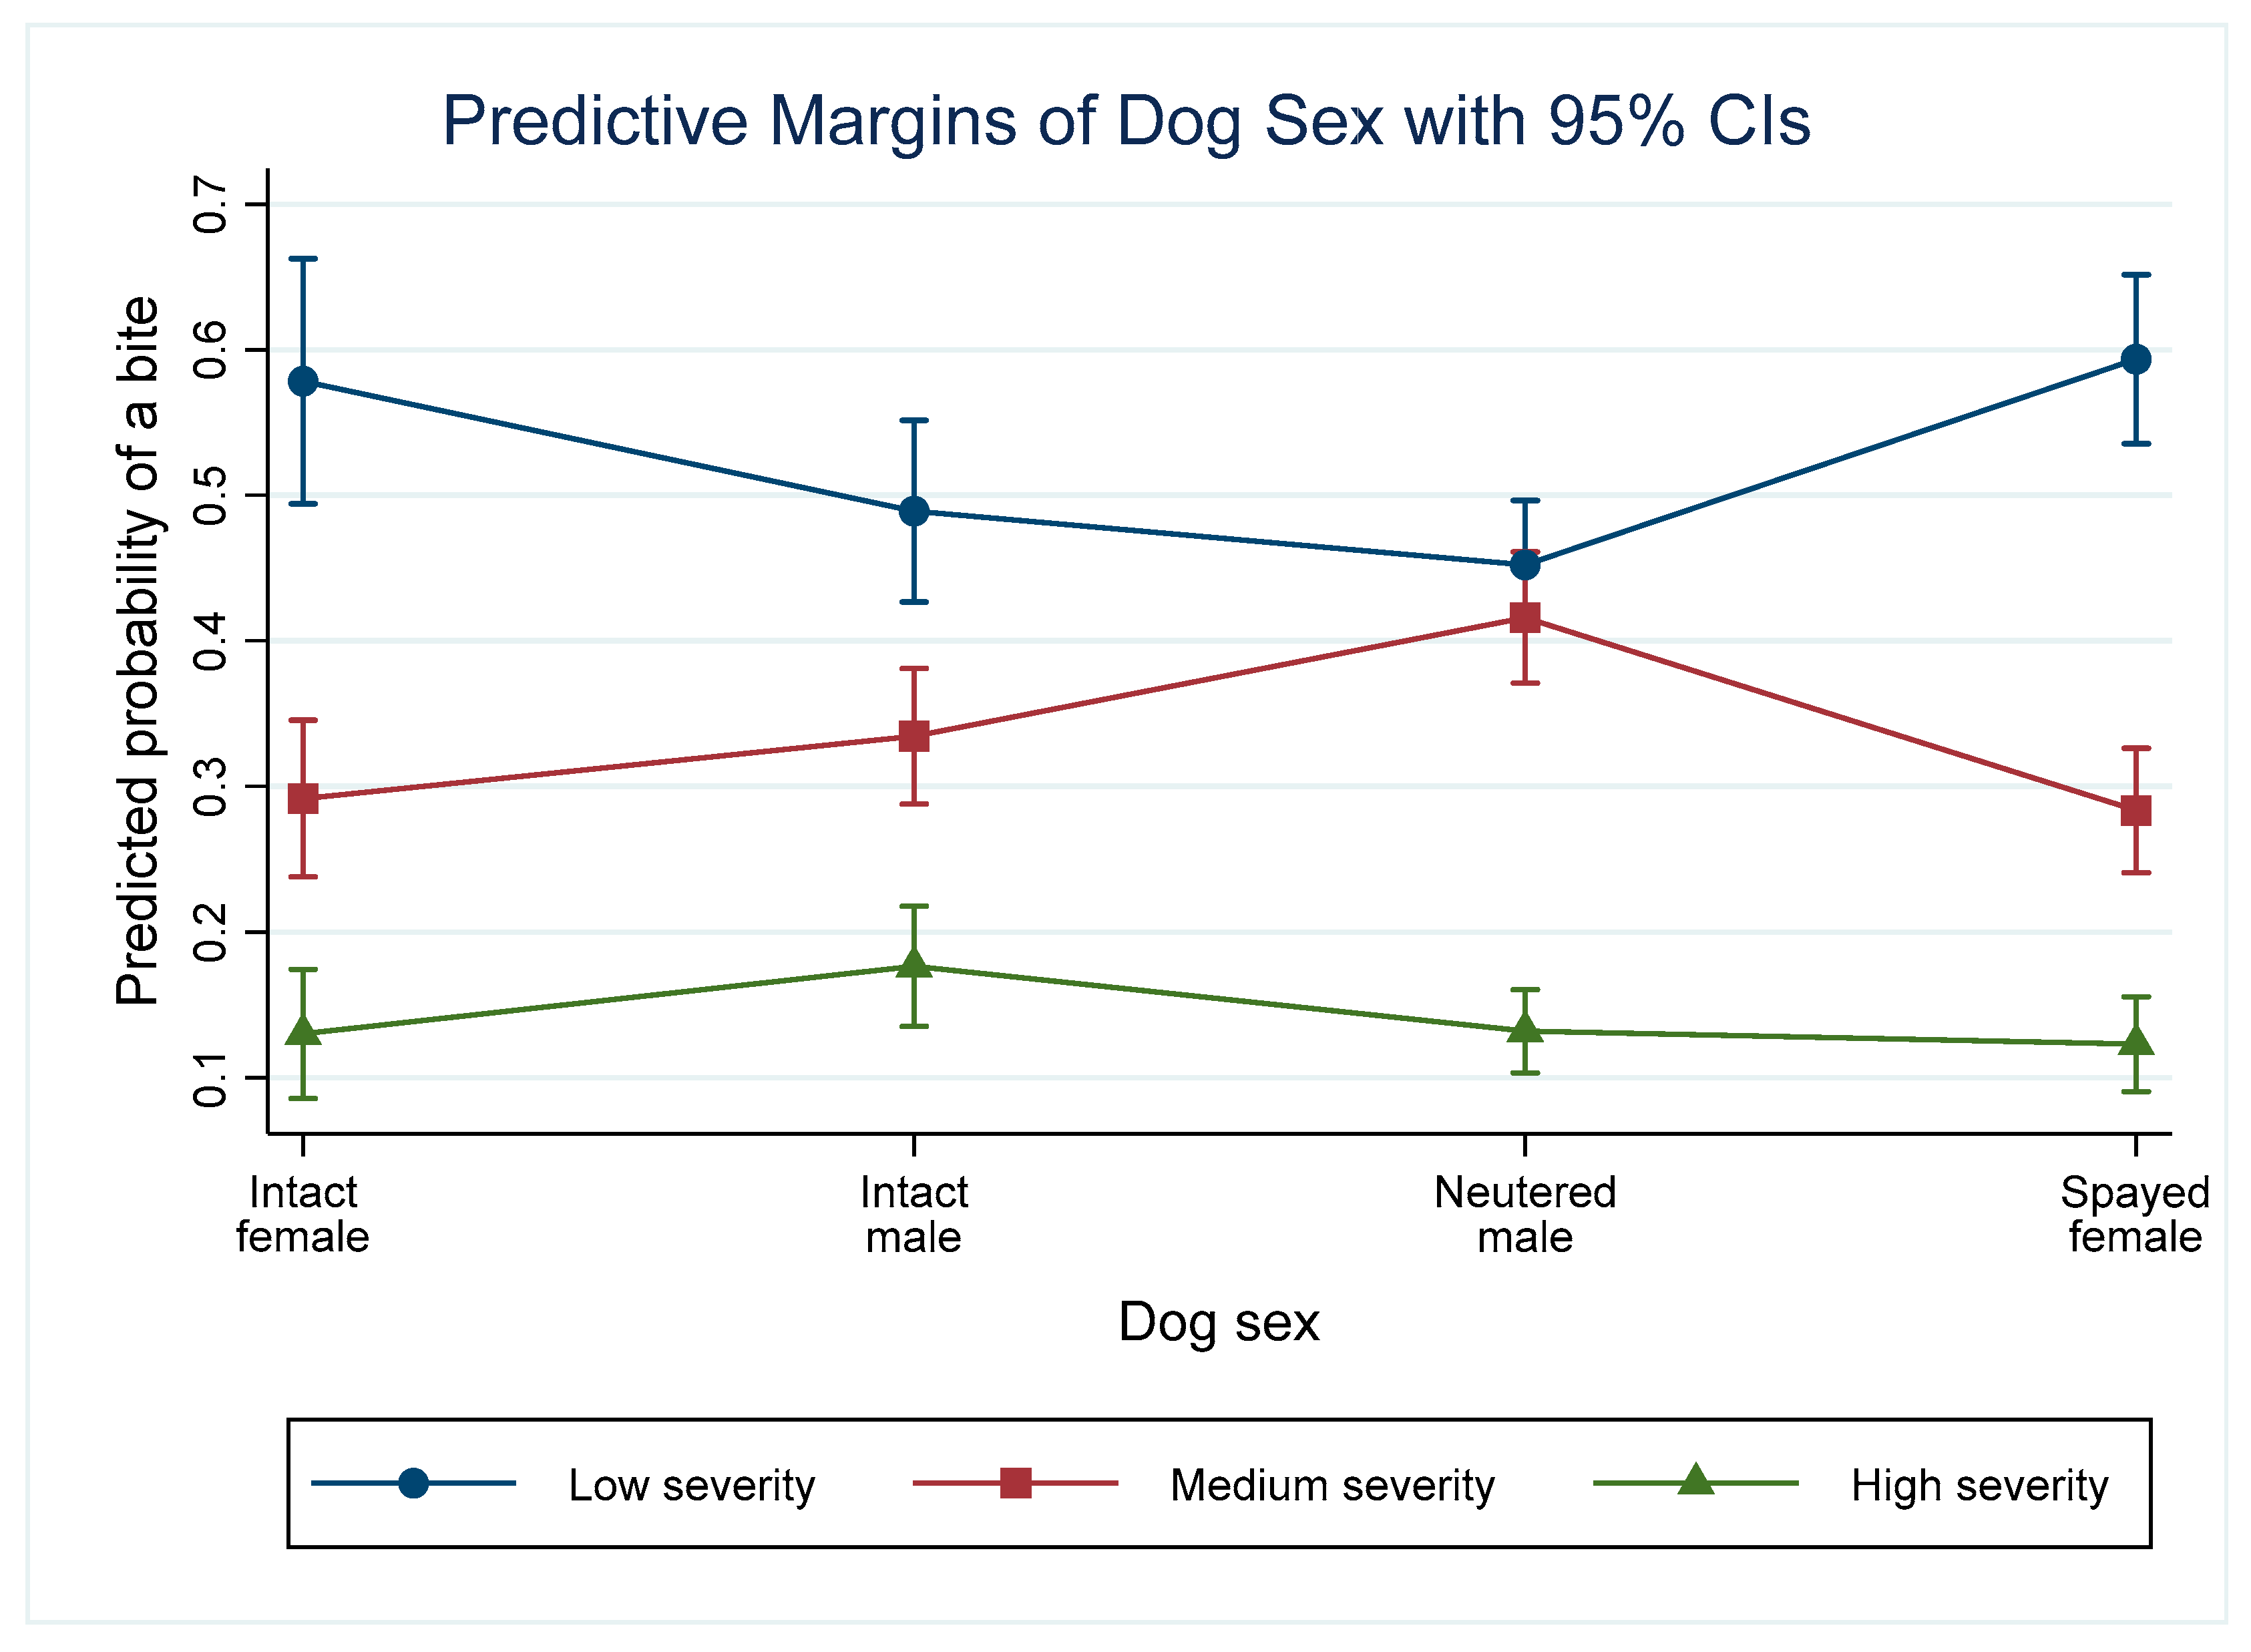
3.4. Dog Sex
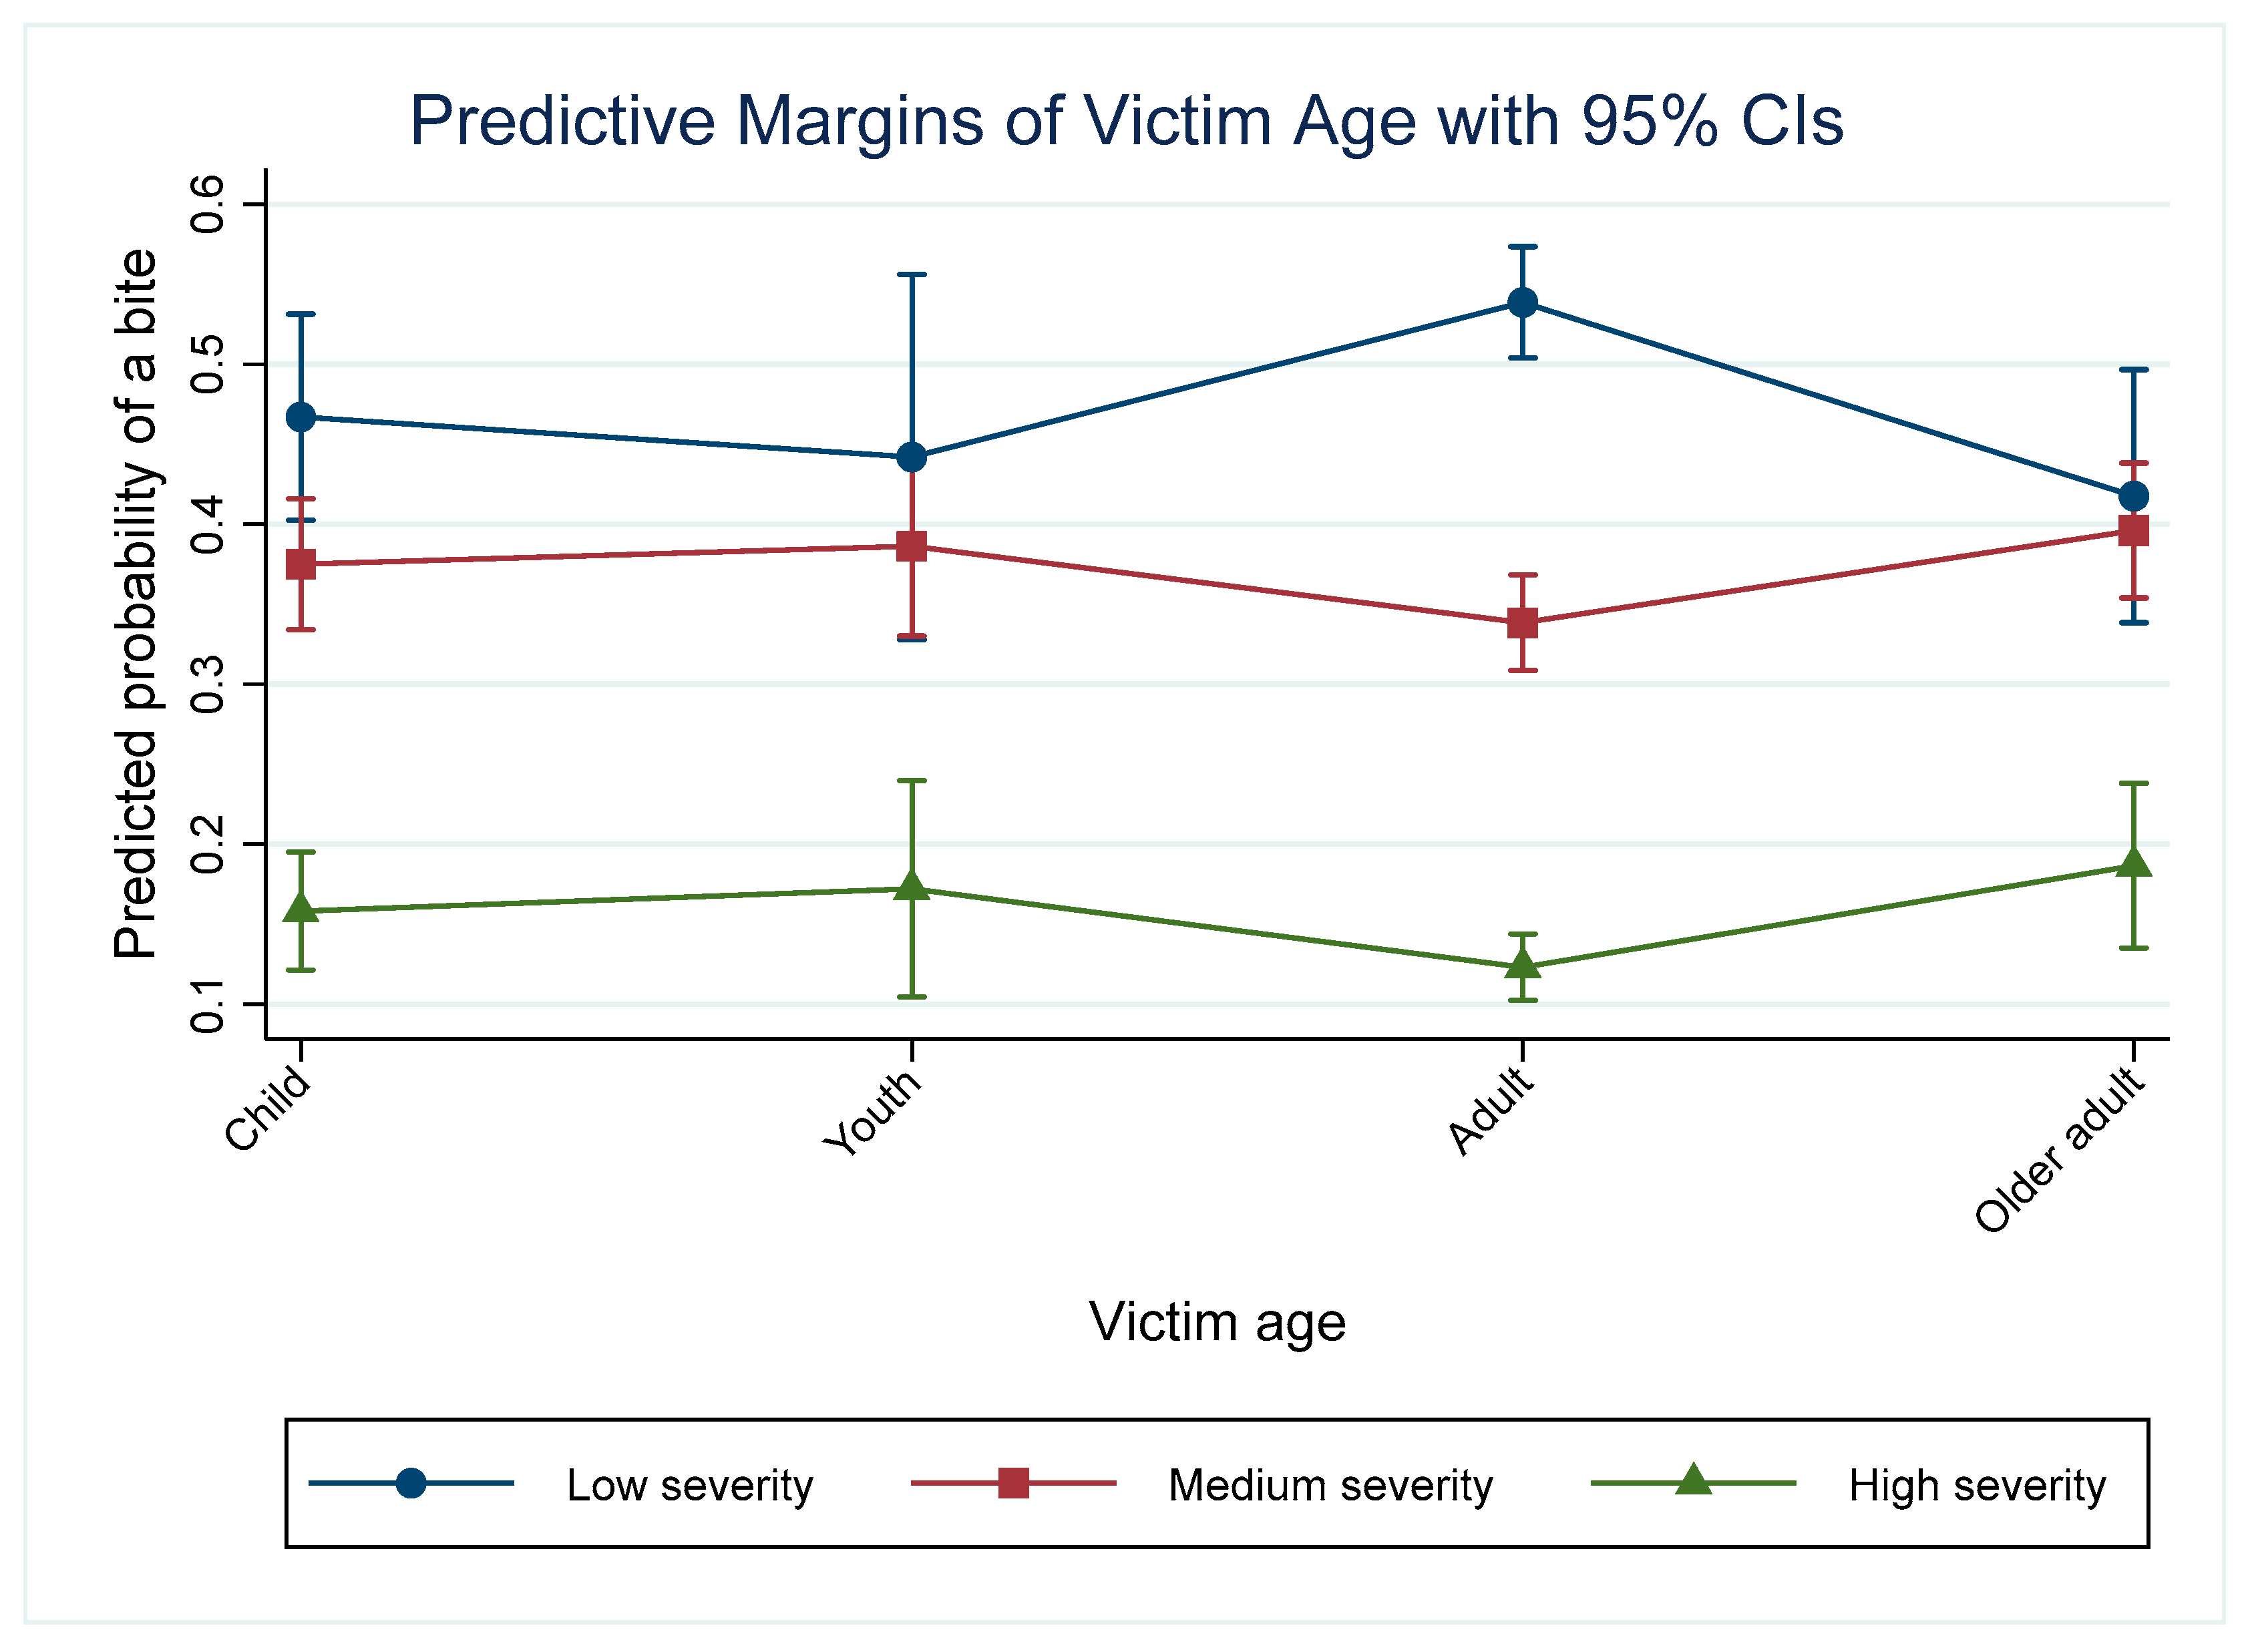
3.5. Victim Age
3.6. Dog Age
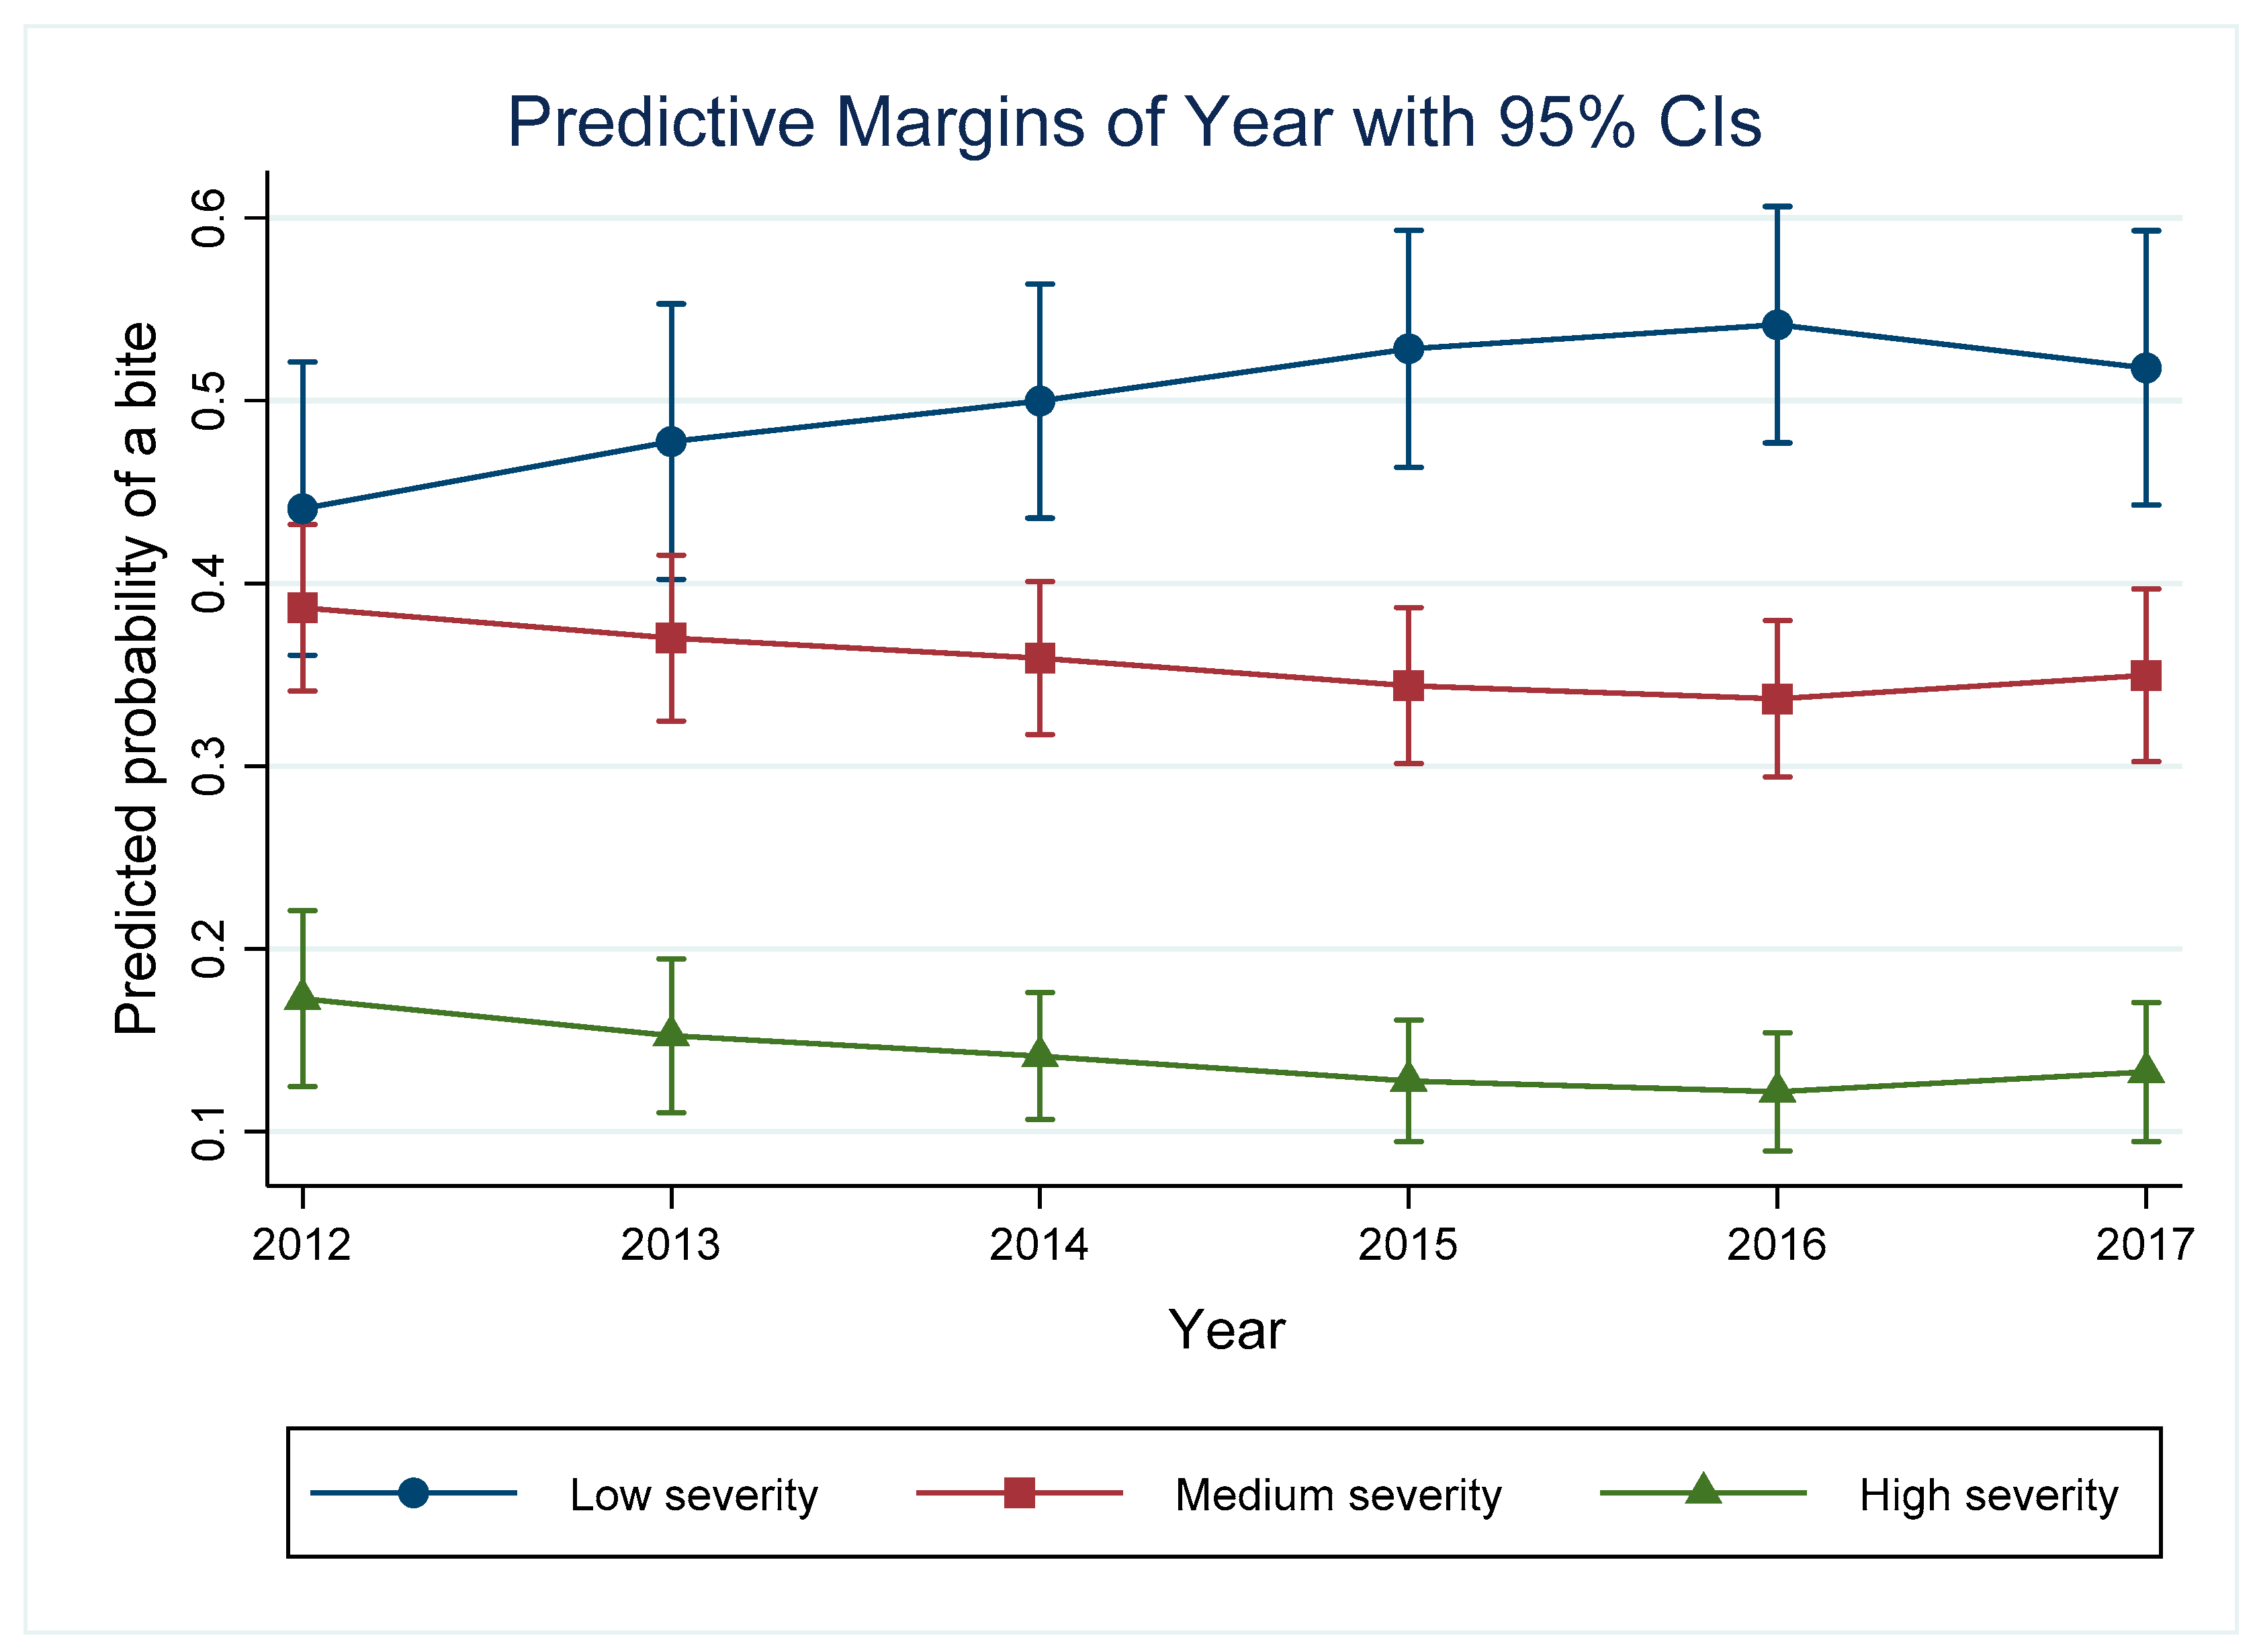
3.7. Year
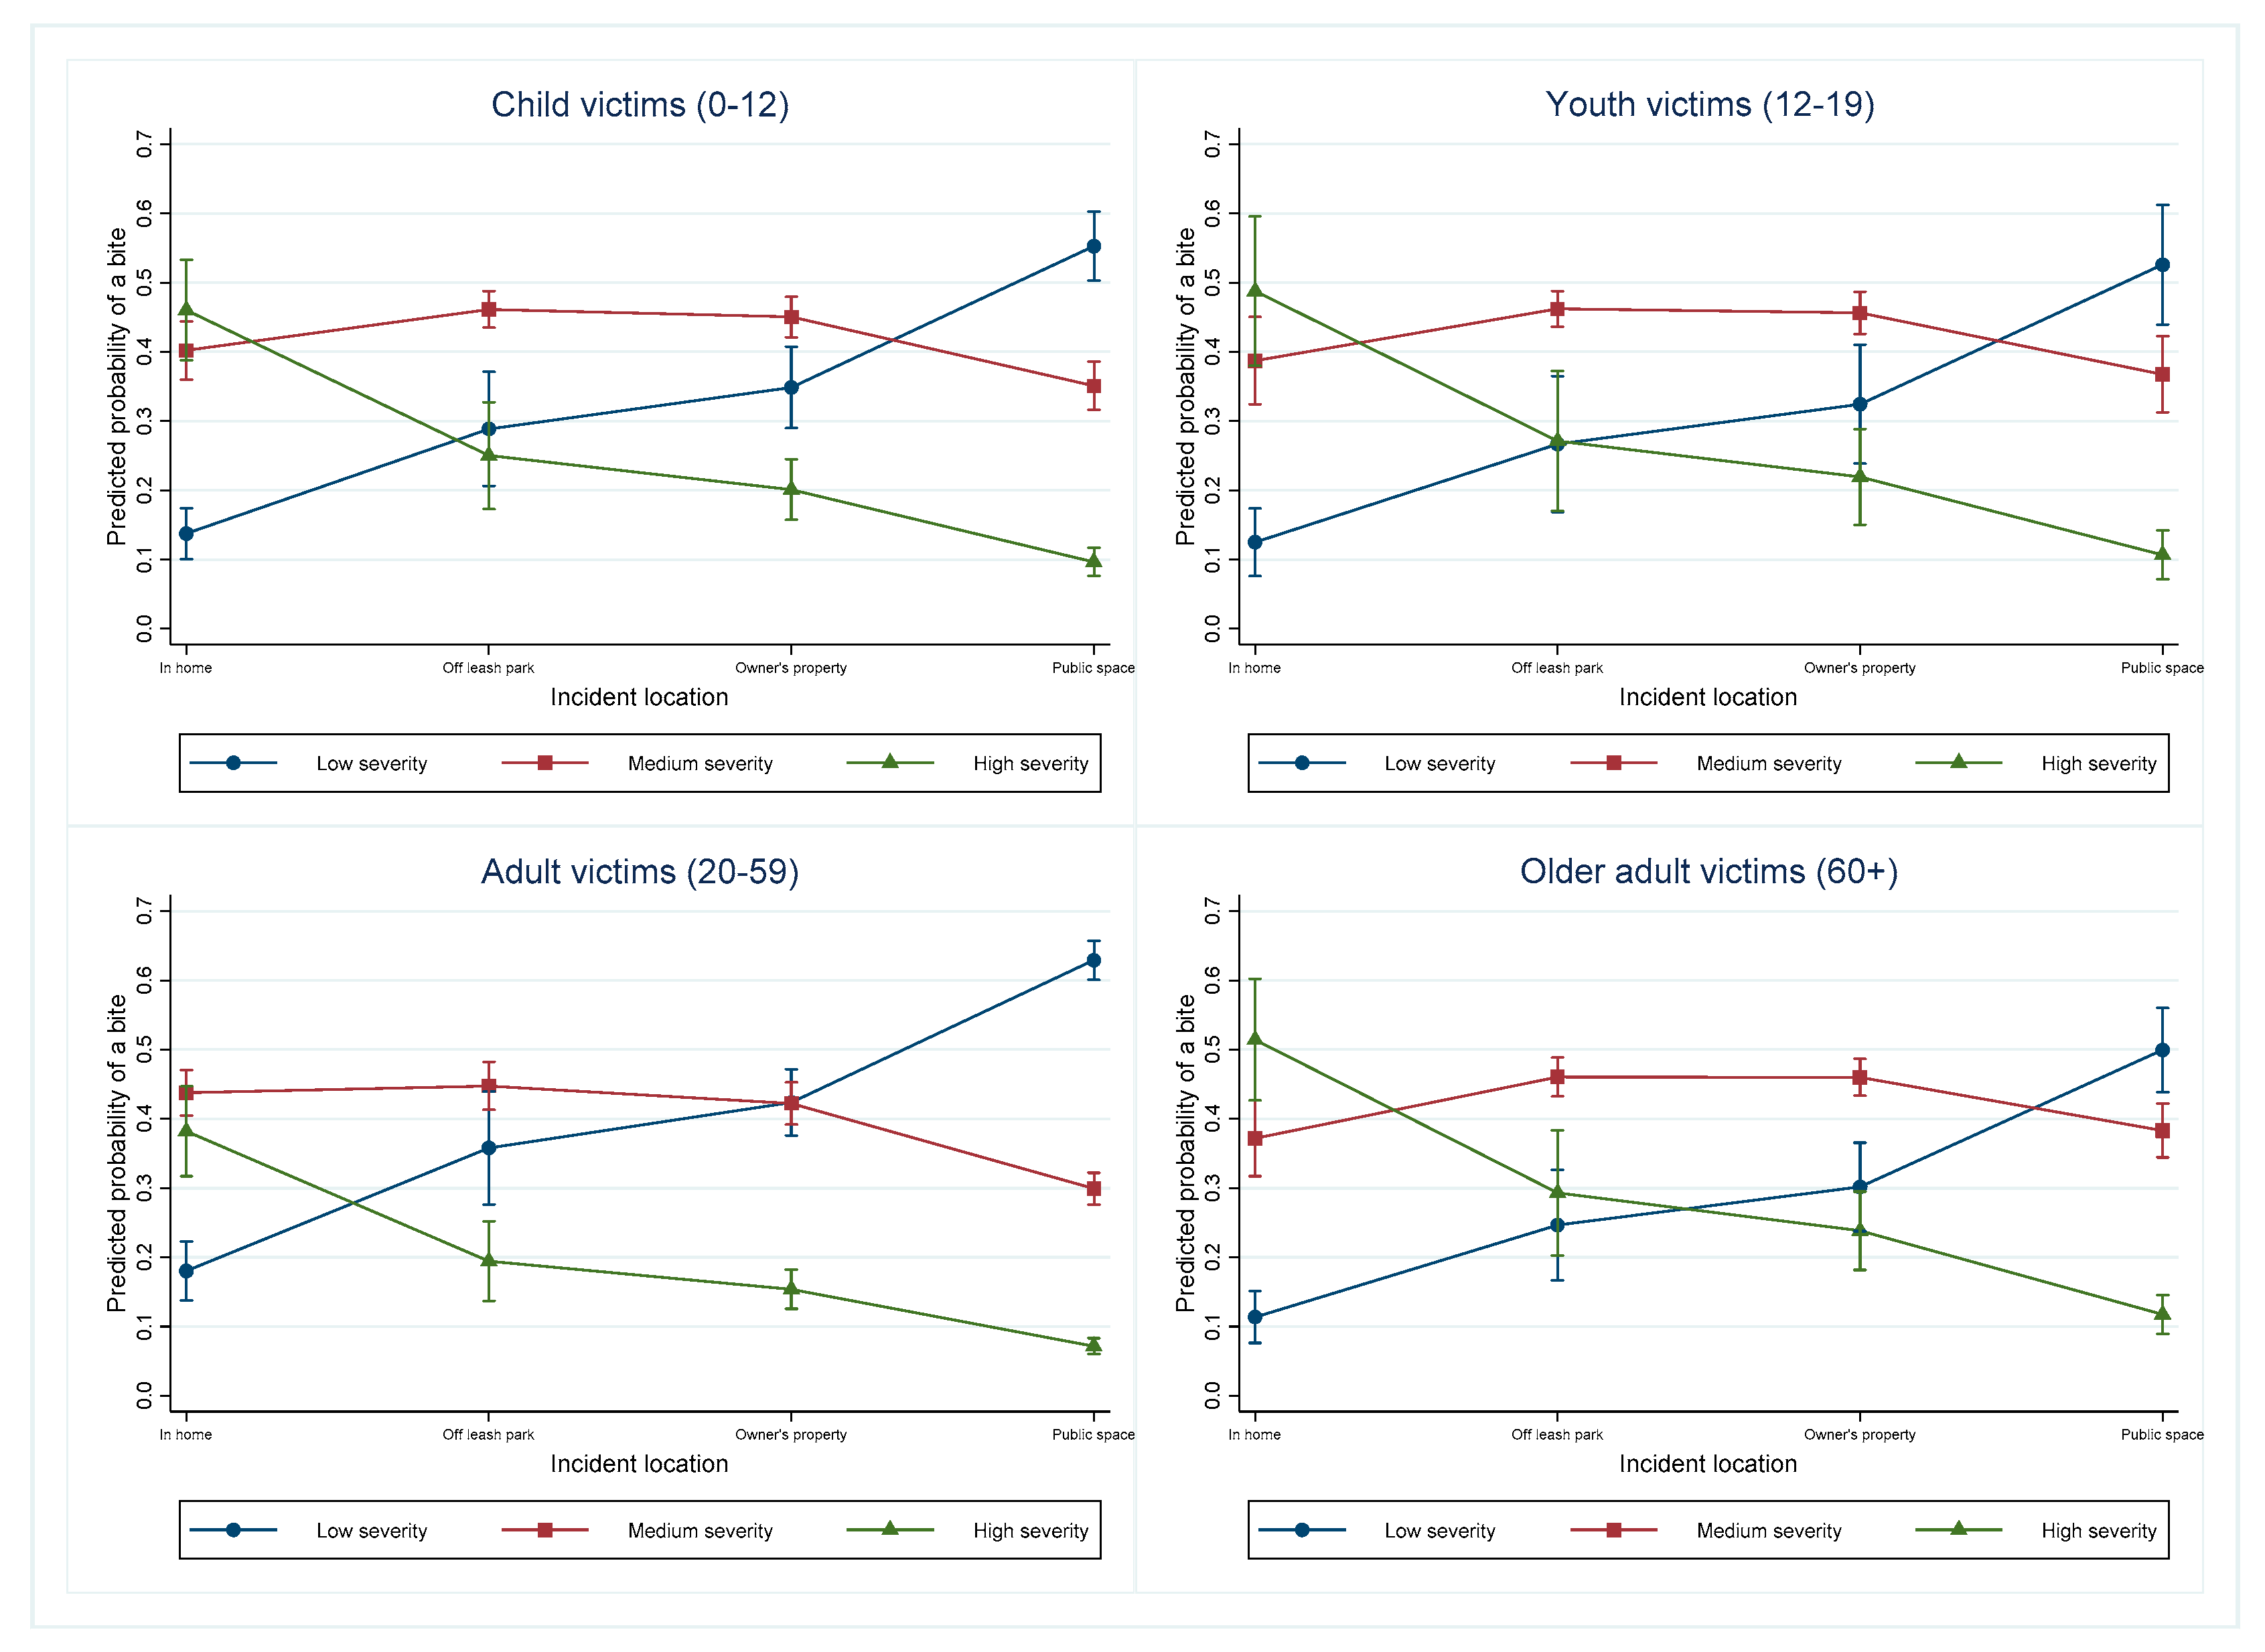
3.8. Victim Age in Different Incident Locations
4. Discussion
4.1. Bite Severity
4.2. Breed Group
4.3. Incident Location
4.4. Dog Sex
4.5. Victim Age
4.6. Age of the Dog
4.7. Year of the Incident
4.8. Study Limitations
5. Conclusions
Author Contributions
Funding
Acknowledgments
Conflicts of Interest
References
- Davies, H.D. When your best friend bites: A note on dog and cat bites. Can. J. Infect. Dis. 2000, 11, 227–229. [Google Scholar] [CrossRef] [PubMed]
- Schurer, J.M.; Phipps, K.; Okemow, C.; Beatch, H.; Jenkins, E. Stabilizing Dog Populations and Improving Animal and Public Health Through a Participatory Approach in Indigenous Communities. Zoonoses Public Health 2015, 62, 445–455. [Google Scholar] [CrossRef] [PubMed]
- Degeling, C.; Rock, M. “It was not just a walking experience”: Reflections on the role of care in dog-walking. Health Promot. Int. 2013, 28, 397–406. [Google Scholar] [CrossRef] [PubMed]
- McCormack, G.R.; Rock, M.; Sandalack, B.; Uribe, F.A. Access to off-leash parks, street pattern and dog walking among adults. Public Health 2011, 125, 540–546. [Google Scholar] [CrossRef] [PubMed]
- Toohey, A.M.; McCormack, G.R.; Doyle-Baker, P.K.; Adams, C.L.; Rock, M.J. Dog-walking and sense of community in neighborhoods: Implications for promoting regular physical activity in adults 50 years and older. Health Place 2013, 22, 75–81. [Google Scholar] [CrossRef] [PubMed]
- Christian, H.E.; Westgarth, C.; Bauman, A.; Richards, E.A.; Rhodes, R.E.; Evenson, K.R.; Mayer, J.A.; Thorpe, R.J. Dog Ownership and Physical Activity: A Review of the Evidence. J. Phys. Act. Health 2013, 10, 750–759. [Google Scholar] [CrossRef] [PubMed]
- Schultz, R.C.; McMaster, W.C. The treatment of dog bite injuries, especially those of the face. Plast. Reconstr. Surg. 1972, 49, 494–500. [Google Scholar] [CrossRef]
- National Canine Research Council. Growling, Snarling, Snapping, and Biting Behavior: Incidence and Correlates; A Literature Review. 2017. Available online: https://www.nationalcanineresearchcouncil.com/research-library/growling-snarling-snapping-and-biting-behavior-incidence-and-correlates-literature (accessed on 4 June 2019).
- Patronek, G.J.; Sacks, J.J.; Delise, K.M.; Cleary, D.V.; Marder, A.R. Co-occurrence of potentially preventable factors in 256 dog bite-related fatalities in the United States (2000–2009). J. Am. Vet. Med. Assoc. 2013, 243, 1726–1736. [Google Scholar] [CrossRef]
- Caffrey, N.; Mounchili, A.; McConkey, S.; Cockram, M.S. Survey of euthanasia practices in animal shelters in Canada. Can. Vet. J. 2011, 52, 55. [Google Scholar]
- Szpakowski, N.M.; Bonnett, B.N.; Martin, S.W. An epidemiological investigation into the reported incidents of dog biting in the City of Guelph. Can. Vet. J. 1989, 30, 937–942. [Google Scholar]
- Gilchrist, J.; Sacks, J.J.; White, D.; Kresnow, M.-J. Dog bites: Still a problem? Inj. Prev. 2008, 14, 296–301. [Google Scholar] [CrossRef] [PubMed]
- World Health Organization Animal Bites. Available online: http://www.who.int/en/news-room/fact-sheets/detail/animal-bites (accessed on 4 December 2018).
- Ozanne-Smith, J.; Ashby, K.; Stathakis, V.Z. Dog bite and injury prevention—Analysis, critical review, and research agenda. Inj. Prev. 2001, 7, 321–326. [Google Scholar] [CrossRef] [PubMed]
- Chang, Y.; McMahon, J.E.; Hennon, D.L.; Laporte, R.E.; Coben, J.H. Dog Bite Incidence in the City of Pittsburgh: A Capture-Recapture Approach. Am. J. Public Health 1997, 87, 1703–1705. [Google Scholar] [CrossRef] [PubMed]
- Rock, M.J.; Rault, D.; Degeling, C. Social Science & Medicine Dog-bites, rabies and One Health: Towards improved coordination in research, policy and practice. Soc. Sci. Med. 2017, 187, 126–133. [Google Scholar] [PubMed]
- Public Health Agency of Canada Canadian Hospitals Injury Reporting and Prevention Program-Canada.ca. Available online: https://www.canada.ca/en/public-health/services/injury-prevention/canadian-hospitals-injury-reporting-prevention-program.html (accessed on 18 December 2018).
- Health Surveillance and Epidemiology Division (Public Health Agency of Canada). Injuries Associated with Non-Fatal Dog Bites: Canadian Hospitals Injury Reporting and Prevention Program (CHIRPP) database, 1990-2003 (cumulative to January 2005), All ages, 13,921 records. Available online: https://www.canada.ca/en/public-health/services/injury-prevention/canadian-hospitals-injury-reporting-prevention-program/injury-reports/injuries-associated-dog-bites-dog-attacks.html (accessed on 6 June 2019).
- Animal Services. Bylaw Preventing Dog Bites and Safety Around Dogs. 2010. Available online: http://www.calgary.ca/CSPS/ABS/Pages/Animal-Services/Dog-bite-prevention.aspx (accessed on 4 June 2019).
- Alberta Veterinary Medical Association. Dog Bite Prevention. 2015. Available online: https://www.albertaanimalhealthsource.ca/content/dog-bite-prevention (accessed on 4 June 2019).
- Canada Safety Council Protecting Children from Dog Bites-Canada Safety Council. 2018. Available online: https://canadasafetycouncil.org/protecting-children-from-dog-bites/ (accessed on 4 June 2019).
- Rock, M.J.; Adams, C.L.; Degeling, C.; Massolo, A.; McCormack, G.R. Policies on pets for healthy cities: A conceptual framework. Health Promot. Int. 2014, 30, 976–986. [Google Scholar] [CrossRef] [PubMed]
- Rock, M. Pet bylaws and posthumanist health promotion: A case study of urban policy. Crit. Public Health 2013, 23, 201–212. [Google Scholar] [CrossRef]
- Parliament of Victoria. Inquiry into the Legislative and Regulatory Framework Relating to Restricted-Breed Dogs; Publisher: Parliament of Victoria Economy and Infrastructure Committee, Victorian Government Printer PP No 152, Session 2014-16; p. 3. ISBN 978 925458 19 0 2016. Available online: https://www.parliament.vic.gov.au/404-eic-lc/inquiry-into-the-legislative-and-regulatory-framework-relating-to-restricted-breed-dogs (accessed on 6 June 2019).
- Mills, D.S. Dog Bites: A Multidisciplinary Perspective; 5M Publishing: Sheffield, UK, 2017. [Google Scholar]
- Clarke, N.M.; Fraser, D. Animal control measures and their relationship to the reported incidence of dog bites in urban Canadian municipalities. Can. Vet. J. 2013, 54, 145–149. [Google Scholar] [PubMed]
- Rock, M.J.; Degeling, C. Social Science & Medicine Public health ethics and more-than-human solidarity. Soc. Sci. Med. 2015, 129, 61–67. [Google Scholar]
- Parrish, H.M.; Clack, F.B.; Brobst, D.; Mock, J.F. Epidemiology of Dog Bites. Public Health Rep. 1959, 74, 891–903. [Google Scholar] [CrossRef]
- Jones, B.A.; Beck, A.M. Unreported Dog Bite and Attitudes towards Dogs; Center for the Interaction of Animals and Society, School of Veterinary Medicine, University of Pennsylvania: Philadelphia, PA, USA, 1980. [Google Scholar]
- Westgarth, C.; Pinchbeck, G.L.; Bradshaw, J.W.S.; Dawson, S.; Gaskell, R.M.; Christley, R.M. Dog-human and dog-dog interactions of 260 dog-owning households in a community in Cheshire. Vet. Rec. 2008, 162, 436–442. [Google Scholar] [CrossRef]
- Golinko, M.S.; Arslanian, B.; Williams, J.K. Characteristics of 1616 Consecutive Dog Bite Injuries at a Single Institution. Clin. Pediatr. 2017, 56, 316–325. [Google Scholar] [CrossRef] [PubMed]
- Fein, J.; Bogumil, D.; Upperman, J.S.; Burke, R.V. Pediatric dog bites: A population-based profile. Inj. Prev. 2018. [Google Scholar] [CrossRef]
- Dunbar, I. Dr. Ian Dunbar’s Dog Bite Scale (Official Authorized Version) An Assessment of the Severity of Biting Problems Based on an Objective Evaluation of Wound Pathology 2017. (T. A. of P. D. Trainers, Ed.). 104 South Calhoun Street, Greenville, SC 29601. Available online: http://apdt.com/wp-content/uploads/2017/01/ian-dunbar-dog-bite-scale.pdf (accessed on 4 June 2019).
- Yin, S. Was It Just a Little Bite or More? Evaluating Bite Levels in Dogs–Dr. Sophia Yin. CattleDog Publishing. The Legacy of Dr Sophia Yin. Available online: https://drsophiayin.com/blog/entry/was-it-just-a-little-bite-or-more-evaluating-bite-levels-in-dogs/ (accessed on 9 November 2019).
- Lu Dunbar, J. The Bite Scale|Dog Star Daily. Dog Star Daily. Available online: https://www.dogstardaily.com/training/bite-scale?utm_content=bufferc1cfa&utm_medium=social&utm_source=facebook.com&utm_campaign=buffer (accessed on 9 November 2018).
- Simpson, R.J.; Simpson, K.J.; VanKavage, L. Rethinking dog breed identification in veterinary practice. J. Am. Vet. Med. Assoc. 2012, 241, 1163–1166. [Google Scholar] [CrossRef] [PubMed]
- Club, C.K. Breed Standards|CKC. 200 Ronson Drive Suite 400 Etobicoke, ON: Canadian Kennel Club. Available online: https://www.ckc.ca/en/Files/Forms/Shows-Trials/Breed-Standards (accessed on 4 June 2019).
- Williams, R.; Williams, R.A. 5@nd E. Gologit2: A Program for Generalized Logistic Regression/Partial Proportional Odds Models for Ordinal Dependent Variables. Available online: https://www.stata.com/meeting/4nasug/gologit2.pdf (accessed on 4 June 2019).
- Long, J.; Freese, J.; Powers, D. Regression models for categorical dependent variables using Stata. Sociol. Methods Res. 2002, 31, 106–110. [Google Scholar]
- Williams, R. Generalized Ordered Logit/Partial Proportional Odds Models for Ordinal Dependent Variables. Stata J. 2006, 6, 58–82. [Google Scholar] [CrossRef]
- Westgarth, C.; Brooke, M.; Christley, R.M. How many people have been bitten by dogs? A cross-sectional survey of prevalence, incidence and factors associated with dog bites in a UK community. J. Epidemiol. Community Health 2018, 72, 331–336. [Google Scholar] [CrossRef] [PubMed]
- Oxley, J.A.; Christley, R.; Westgarth, C. Contexts and consequences of dog bite incidents. J. Vet. Behav. 2018, 23, 33–39. [Google Scholar] [CrossRef]
- Doogan, S.; Thomas, G.V. Origins of fear of dogs in adults and children: The role of conditioning processes and prior familiarity with dogs. Behav. Res. Ther. 1992, 30, 387–394. [Google Scholar] [CrossRef]
- Kirk, J.H.; McCowan, B.; Atwill, E.R.; Glenn, K.S.; Higginbotham, G.E.; Collar, C.A.; Castillo, A.; Reed, B.A.; Peterson, N.G.; Cullor, J.S. Association of Minimum Inhibitory Concentration Cluster Patterns with Dairy Management Practices for Environmental Bacteria Isolated from Bulk Tank Milk. J. Dairy Sci. 2005, 88, 3710–3720. [Google Scholar] [CrossRef]
- MacNeil-Allcock, A.; Clarke, N.M.; Ledger, R.A.; Fraser, D. Aggression, behaviour, and animal care among pit bulls and other dogs adopted from an animal shelter. Anim. Welf. 2011, 20, 463–468. [Google Scholar]
- Collier, S. Breed-specific legislation and the pit bull terrier: Are the laws justified? J. Vet. Behav. 2006, 1, 17–22. [Google Scholar] [CrossRef]
- Canadian Kennel Club Non-Sporting Dogs|CKC. Available online: https://www.ckc.ca/en/Choosing-a-Dog/Choosing-a-Breed/Non-Sporting-Dogs (accessed on 29 April 2019).
- Shewell, P.C.; Nancarrow, J.D. Dogs that bite. Br. Med. J. 1991, 303, 1512–1513. [Google Scholar] [CrossRef] [PubMed]
- Kasbekar, A.V.; Garfit, H.; Duncan, C.; Mehta, B.; Davies, K.; Narasimhan, G.; Donne, A.J. Dog bites to the head and neck in children; an increasing problem in the UK. Clin. Otolaryngol. 2013, 38, 259–262. [Google Scholar]
- Loder, R.T. The demographics of dog bites in the United States. Heliyon 2019, 5, e01360. [Google Scholar] [CrossRef] [PubMed]
- Park, J.W.; Kim, D.K.; Jung, J.Y.; Lee, S.U.; Chang, I.; Kwak, Y.H.; Hwang, S. Dog-bite injuries in Korea and risk factors for significant dog-bite injuries: A 6-year cross-sectional study. PLoS ONE 2019, 14, e0210541. [Google Scholar] [CrossRef] [PubMed]
- Hart, B.L.; Hart, L.A. Selecting, raising, and caring for dogs to avoid problem aggression. J. Am. Vet. Med. Assoc. 1997, 210, 1129–1134. [Google Scholar] [PubMed]
- Pirruccio, K.; Yoon, Y.M.; Ahn, J. Fractures in Elderly Americans Associated with Walking Leashed Dogs Fractures in Elderly Americans Associated with Walking Leashed Dogs Letters. JAMA Surg. 2019, 154, 458–459. [Google Scholar] [CrossRef]
- De Keuster, T.; Lamoureux, J.; Kahn, A. Epidemiology of dog bites: A Belgian experience of canine behaviour and public health concerns. Vet. J. 2006, 172, 482–487. [Google Scholar] [CrossRef]
- Casey, R.A.; Loftus, B.; Bolster, C.; Richards, G.J.; Blackwell, E.J. Human directed aggression in domestic dogs (Canis familiaris): Occurrence in different contexts and risk factors. Appl. Anim. Behav. Sci. 2014, 152, 52–63. [Google Scholar] [CrossRef]
- Lang, M.E.; Klassen, T. Dog bites in Canadian children: A five-year review of severity and emergency department management. CJEM 2005, 7, 309–314. [Google Scholar] [CrossRef]


| Outcome of Interest. | Number of Incidents (2012–2017) | Assessment of the Severity of Biting Problems Based on an Objective Evaluation of Wound Pathology | |
|---|---|---|---|
| Low severity incident | 1023 | Level 1 | Dog growls, lunges, snarls-no teeth touch skin. Mostly intimidation/threatening behaviour |
| 368 | Level 2 | Teeth touch skin but no puncture. May have red mark/minor bruise from dog’s head or snout, may have minor scratches from paws/nails. Minor surface abrasions or lacerations | |
| Medium severity incident | 955 | Level 3 | Punctures one to three holes, single bite. No tearing or slashes. Victim not shaken side to side. Bruising |
| High severity incident | 111 | Level 3.5 | Multiple level 3 bites |
| 191 | Level 4 | Two to four holes from a single bite, typically contact/punctures from more than canines, considerable bruising. Black bruising, tears and/or slashing wounds. Dog clamped down and held and/or shook head from side to side | |
| 65 | Level 5 | Multiple bites at Level 4 or above. A concerted, repeated attack causing severe injury | |
| Not included | Level 6 | Any bite resulting in death of an animal | |
| Variable | Frequency | (%) | Low Severity (Level 1 and 2) | Medium Severity (Level 3) | High Severity (Level 3.5, 4, 5) | Unconditional Generalized Ordered Logistic Regression (OR) | 2p-Value |
|---|---|---|---|---|---|---|---|
| *~ Incident Location: | <0.0001 | ||||||
| In house | 227 | 8 | 22 | 110 | 95 | Baseline | |
| Off-leash park | 161 | 6 | 57 | 87 | 17 | 0.18 | <0.001 |
| Owner’s property | 437 | 16 | 176 | 183 | 78 | NPL | |
| Public | 1888 | 70 | 1136 | 575 | 177 | NPL | |
| * Victim age | 0.0056 | ||||||
| Child (0–12) | 455 | 17 | 202 | 166 | 87 | Baseline | - |
| Youth (13–19) | 157 | 6 | 71 | 66 | 20 | 0.86 | 0.40 |
| Adult (20–59) | 1662 | 61 | 904 | 569 | 189 | 0.63 | <0.001 |
| Older adult (60+) | 304 | 11 | 137 | 114 | 53 | 0.95 | 0.70 |
| Unknown | 135 | 5 | 77 | 40 | 18 | 0.60 | 0.008 |
| *~ Dog sex: | <0.0001 | ||||||
| Female-intact | 263 | 10 | 160 | 71 | 32 | Baseline | - |
| Male-intact | 501 | 18 | 253 | 158 | 90 | 1.54 | 0.004 |
| Male-neutered | 1050 | 39 | 450 | 445 | 155 | NPL | |
| Female-spayed | 525 | 199 | 315 | 154 | 56 | 1.00 | 0.97 |
| Unknown | 374 | 14 | 213 | 127 | 34 | NPL | |
| * Dog age: | 0.0001 | ||||||
| 0–2 | 762 | 28 | 428 | 239 | 95 | Baseline | - |
| 3–6 | 1008 | 37 | 502 | 358 | 148 | 1.28 | 0.008 |
| 7+ | 522 | 19 | 227 | 217 | 78 | 1.55 | <0.001 |
| Unknown | 421 | 16 | 234 | 141 | 46 | 0.99 | 0.96 |
| * City quadrant: | 0.07 | ||||||
| Northeast | 528 | 23 | 287 | 170 | 71 | Baseline | - |
| Northwest | 732 | 31 | 370 | 257 | 105 | 1.15 | 0.21 |
| Southeast | 537 | 23 | 249 | 198 | 90 | 1.37 | 0.008 |
| Southwest | 528 | 23 | 257 | 204 | 67 | 1.18 | 0.16 |
| *~ Year: | <0.0001 | ||||||
| 2012 | 325 | 12 | 134 | 147 | 44 | NPL | |
| 2013 | 360 | 13 | 165 | 142 | 53 | 1.17 | 0.25 |
| 2014 | 511 | 19 | 260 | 182 | 69 | 0.98 | 0.87 |
| 2015 | 523 | 19 | 280 | 186 | 57 | 0.86 | 0.23 |
| 2016 | 548 | 20 | 320 | 158 | 70 | 0.75 | 0.02 |
| 2017 | 446 | 16 | 232 | 140 | 74 | Baseline | - |
| * Month: | 0.16 | ||||||
| January | 160 | 6 | 83 | 60 | 17 | Baseline | - |
| February | 135 | 5 | 67 | 44 | 24 | 1.22 | 0.37 |
| March | 187 | 7 | 87 | 73 | 27 | 1.26 | 0.25 |
| April | 254 | 9 | 147 | 74 | 33 | 0.85 | 0.41 |
| May | 259 | 9 | 124 | 101 | 34 | 1.18 | 0.38 |
| June | 365 | 13 | 201 | 118 | 46 | 0.93 | 0.70 |
| July | 295 | 11 | 142 | 111 | 42 | 1.2 | 0.33 |
| August | 290 | 11 | 142 | 107 | 41 | 1.17 | 0.41 |
| September | 255 | 9 | 147 | 79 | 29 | 0.84 | 0.36 |
| October | 239 | 9 | 117 | 90 | 32 | 1.15 | 0.47 |
| November | 145 | 5 | 71 | 56 | 18 | 1.13 | 0.57 |
| December | 129 | 5 | 63 | 42 | 24 | 1.27 | 0.29 |
| * Prior aggression | 0.07 | ||||||
| No | 1817 | 67 | 932 | 885 | Baseline | - | |
| Yes | 418 | 15 | 197 | 221 | 1.18 | 0.12 | |
| Unknown | 478 | 18 | 262 | 216 | 0.87 | 0.17 | |
| ^ Victim Gender | 0.41 | ||||||
| Male | 1349 | 50 | 675 | 498 | 176 | 1.06 | 041 |
| Female | 1364 | 50 | 716 | 457 | 191 | Baseline | - |
| *~ Breed group: | 0.006 | ||||||
| Herding | 630 | 23 | 315 | 234 | 81 | 0.83 | 0.18 |
| Hound | 66 | 2 | 31 | 32 | 3 | 0.79 | 0.35 |
| Non-sporting | 251 | 9 | 111 | 107 | 33 | Baseline | |
| Sporting | 435 | 16 | 254 | 133 | 48 | 0.60 | 0.001 |
| Terrier | 618 | 23 | 334 | 189 | 95 | NPL | |
| Toy | 155 | 6 | 72 | 72 | 11 | 0.83 | 0.35 |
| Working | 558 | 21 | 274 | 188 | 96 | NPL | |
| ^ Circumstances: | |||||||
| At large | 1525 | 56 | 1011 | 385 | 129 | ||
| Contained | 111 | 4 | 30 | 43 | 38 | ||
| Dog fight | 82 | 3 | 13 | 41 | 28 | ||
| Guard dog | 2 | 0 | 0 | 1 | 1 | ||
| Multi-dog | 153 | 6 | 120 | 25 | 8 | ||
| On leash | 243 | 9 | 78 | 136 | 29 | ||
| Other | 444 | 16 | 115 | 242 | 87 | ||
| Provoked | 81 | 3 | 7 | 48 | 26 | ||
| Tethered | 65 | 2 | 14 | 30 | 21 | ||
| Unknown | 7 | 0 | 3 | 4 | 0 | ||
| 1^ Ward | |||||||
| 1 | 149 | 5.5 | 72 | 59 | 18 | ||
| 2 | 145 | 5 | 71 | 58 | 16 | ||
| 3 | 166 | 6 | 86 | 60 | 20 | ||
| 4 | 179 | 7 | 83 | 67 | 29 | ||
| 5 | 244 | 9 | 118 | 88 | 38 | ||
| 6 | 113 | 4 | 59 | 44 | 10 | ||
| 7 | 117 | 4 | 55 | 42 | 20 | ||
| 8 | 100 | 4 | 46 | 38 | 16 | ||
| 9 | 241 | 9 | 111 | 89 | 41 | ||
| 10 | 259 | 10 | 120 | 90 | 49 | ||
| 11 | 154 | 6 | 86 | 55 | 13 | ||
| 12 | 179 | 7 | 107 | 50 | 22 | ||
| 13 | 130 | 5 | 83 | 27 | 20 | ||
| 14 | 149 | 5.5 | 66 | 62 | 21 | ||
| Out of town/Unknown | 388 | 14 | 228 | 126 | 34 | ||
| ^ Controlled by: | |||||||
| Child | 68 | 2.5 | 23 | 30 | 15 | ||
| Family | 264 | 10 | 109 | 121 | 34 | ||
| Friend | 128 | 5 | 64 | 51 | 13 | ||
| None | 881 | 32 | 598 | 198 | 85 | ||
| Owner | 1318 | 46 | 567 | 539 | 212 | ||
| Professional | 31 | 1 | 11 | 13 | 7 | ||
| Unknown | 23 | 1 | 19 | 3 | 1 | ||
| ^ Relationship with dog: | |||||||
| Family | 122 | 4.5 | 12 | 53 | 57 | ||
| Guest | 88 | 3 | 11 | 37 | 40 | ||
| Neighbour | 722 | 27 | 458 | 194 | 70 | ||
| None | 1504 | 55 | 769 | 564 | 171 | ||
| Service provider | 277 | 10 | 141 | 107 | 29 | ||
| ^1 Where obtained: | |||||||
| Breeder | 289 | 11 | 153 | 103 | 33 | ||
| Other | 474 | 17 | 225 | 164 | 85 | ||
| Rescue/Shelter | 222 | 8 | 104 | 85 | 33 | ||
| Unknown | 1728 | 64 | 909 | 603 | 216 | ||
| ^1 Vaccination status: | |||||||
| Not vaccinated | 469 | 17 | 256 | 149 | 64 | ||
| Vaccinated | 1144 | 42 | 510 | 456 | 178 | ||
| Unknown | 1100 | 41 | 626 | 350 | 125 | ||
| ^1 Licence status | |||||||
| No licence | 611 | 23 | 306 | 215 | 90 | ||
| Licence | 1128 | 42 | 607 | 362 | 159 | ||
| Unknown | 974 | 36 | 478 | 378 | 118 | ||
| ^1 Years owned the dog: | |||||||
| Less than 1 year | 187 | 7 | 100 | 54 | 33 | ||
| 1–3 years | 419 | 15 | 216 | 142 | 61 | ||
| 3–5 years | 207 | 8 | 111 | 74 | 22 | ||
| 5+ years | 212 | 8 | 94 | 86 | 32 | ||
| Unknown | 1688 | 62 | 870 | 599 | 219 |
| Multivariable Generalized Ordered Logistic Regression (n = 2165) | Low versus Medium and High (Equation (1)) | Low and Medium versus High (Equation (2)) | * Gamma (Deviations from Proportionality) | |||||
|---|---|---|---|---|---|---|---|---|
| OR | p-Value | 95% CI | OR | p-Value | 95% CI | OR | p-Value | |
| Breed Group (baseline is non-sporting) | ||||||||
| Herding | 0.89 | 0.456 | 0.65–1.21 | |||||
| Hound | 0.68 | 0.184 | 0.38–1.20 | |||||
| Sporting | 0.69 | 0.032 | 0.49–0.97 | |||||
| Terrier | 0.71 | 0.041 | 0.51–0.99 | 1.10 | 0.630 | 0.75–1.61 | 1.55 | 0.003 |
| Toy | 0.79 | 0.277 | 0.52–1.20 | |||||
| Working | 0.94 | 0.689 | 0.68–1.29 | |||||
| Incident location (baseline is public space) | ||||||||
| In home | 8.17 | <0.001 | 6.08–10.98 | |||||
| Off-leash park | 3.20 | <0.001 | 2.18–4.68 | |||||
| Owner’s property | 2.38 | <0.001 | 1.91–2.97 | |||||
| Dog Sex (baseline is intact female) | ||||||||
| Intact male | 1.50 | 0.01 | 1.09–2.06 | |||||
| Neutered male | 1.77 | <0.001 | 1.31–2.40 | 1.02 | 0.921 | 0.71–1.46 | 0.57 | <0.001 |
| Spayed female | 0.93 | 0.67 | 0.67–1.29 | |||||
| Victim age (baseline is adult) | ||||||||
| Child | 1.39 | 0.004 | 1.11–1.73 | |||||
| Youth | 1.55 | 0.020 | 1.07–2.25 | |||||
| Older adult | 1.74 | <0.001 | 1.33–2.27 | |||||
| Dog age (baseline is 0–2) | ||||||||
| 3–6 | 1.26 | 0.026 | 1.03–1.54 | |||||
| 7+ | 1.46 | 0.002 | 1.16–1.86 | |||||
| Year (baseline is 2017) | ||||||||
| 2012 | 1.42 | 0.034 | 1.03–1.97 | |||||
| 2013 | 1.20 | 0.253 | 0.88–1.65 | |||||
| 2014 | 1.09 | 0.579 | 0.81–1.46 | |||||
| 2015 | 0.95 | 0.750 | 0.71–1.28 | |||||
| 2016 | 0.90 | 0.473 | 0.67–1.21 | |||||
| Constant | 0.40 | <0.001 | 0.25–0.62 | 0.06 | <0.001 | 0.04–0.10 | ||
| Severity and Location of the Incident: | Child Victim | Youth Victim | Adult Victim | Older Adult Victim |
|---|---|---|---|---|
| Low severity—In home | AB | AB | A | AB |
| Low severity—Off-leash park | CDE | ABCDE | BCD | CDE |
| Low severity—Owner’s property | CDEF | CDEF | D | DE H |
| Low severity—Public space | G | G | FG | |
| Medium severity—In home | DEF | CDEFG | D | DE HI |
| Medium severity—Off-leash park | FG | FG | D | G |
| Medium severity—Owner’s property | FG | E | D | I |
| Medium severity—Public space | DE | DEFG | BC | EF H |
| High severity—In home | EFG | E | CD | HI |
| High severity—Off-leash park | BCD | BCD FG | AB | B DEFG |
| High severity—Owner’s property | BC | BC | A | B D |
| High severity—Public space | A | A | A C |
© 2019 by the authors. Licensee MDPI, Basel, Switzerland. This article is an open access article distributed under the terms and conditions of the Creative Commons Attribution (CC BY) license (http://creativecommons.org/licenses/by/4.0/).
Share and Cite
Caffrey, N.; Rock, M.; Schmidtz, O.; Anderson, D.; Parkinson, M.; Checkley, S.L. Insights about the Epidemiology of Dog Bites in a Canadian City Using a Dog Aggression Scale and Administrative Data. Animals 2019, 9, 324. https://doi.org/10.3390/ani9060324
Caffrey N, Rock M, Schmidtz O, Anderson D, Parkinson M, Checkley SL. Insights about the Epidemiology of Dog Bites in a Canadian City Using a Dog Aggression Scale and Administrative Data. Animals. 2019; 9(6):324. https://doi.org/10.3390/ani9060324
Chicago/Turabian StyleCaffrey, Niamh, Melanie Rock, Olivia Schmidtz, Doug Anderson, Melissa Parkinson, and Sylvia L. Checkley. 2019. "Insights about the Epidemiology of Dog Bites in a Canadian City Using a Dog Aggression Scale and Administrative Data" Animals 9, no. 6: 324. https://doi.org/10.3390/ani9060324
APA StyleCaffrey, N., Rock, M., Schmidtz, O., Anderson, D., Parkinson, M., & Checkley, S. L. (2019). Insights about the Epidemiology of Dog Bites in a Canadian City Using a Dog Aggression Scale and Administrative Data. Animals, 9(6), 324. https://doi.org/10.3390/ani9060324