
The Inclusion of Pea in Concentrates Had Minor Effects on the Meat Quality of Light Lambs

 ,
,  , ,
, ,  and
and
Abstract
Simple Summary
Abstract
1. Introduction
2. Materials and Methods
2.1. Animal Management and Experimental Design
2.2. Slaughtering Conditions and Sampling
2.3. Determinations
2.4. Chemical Analyses
2.5. Statistical Analyses
3. Results
3.1. Feedstuffs
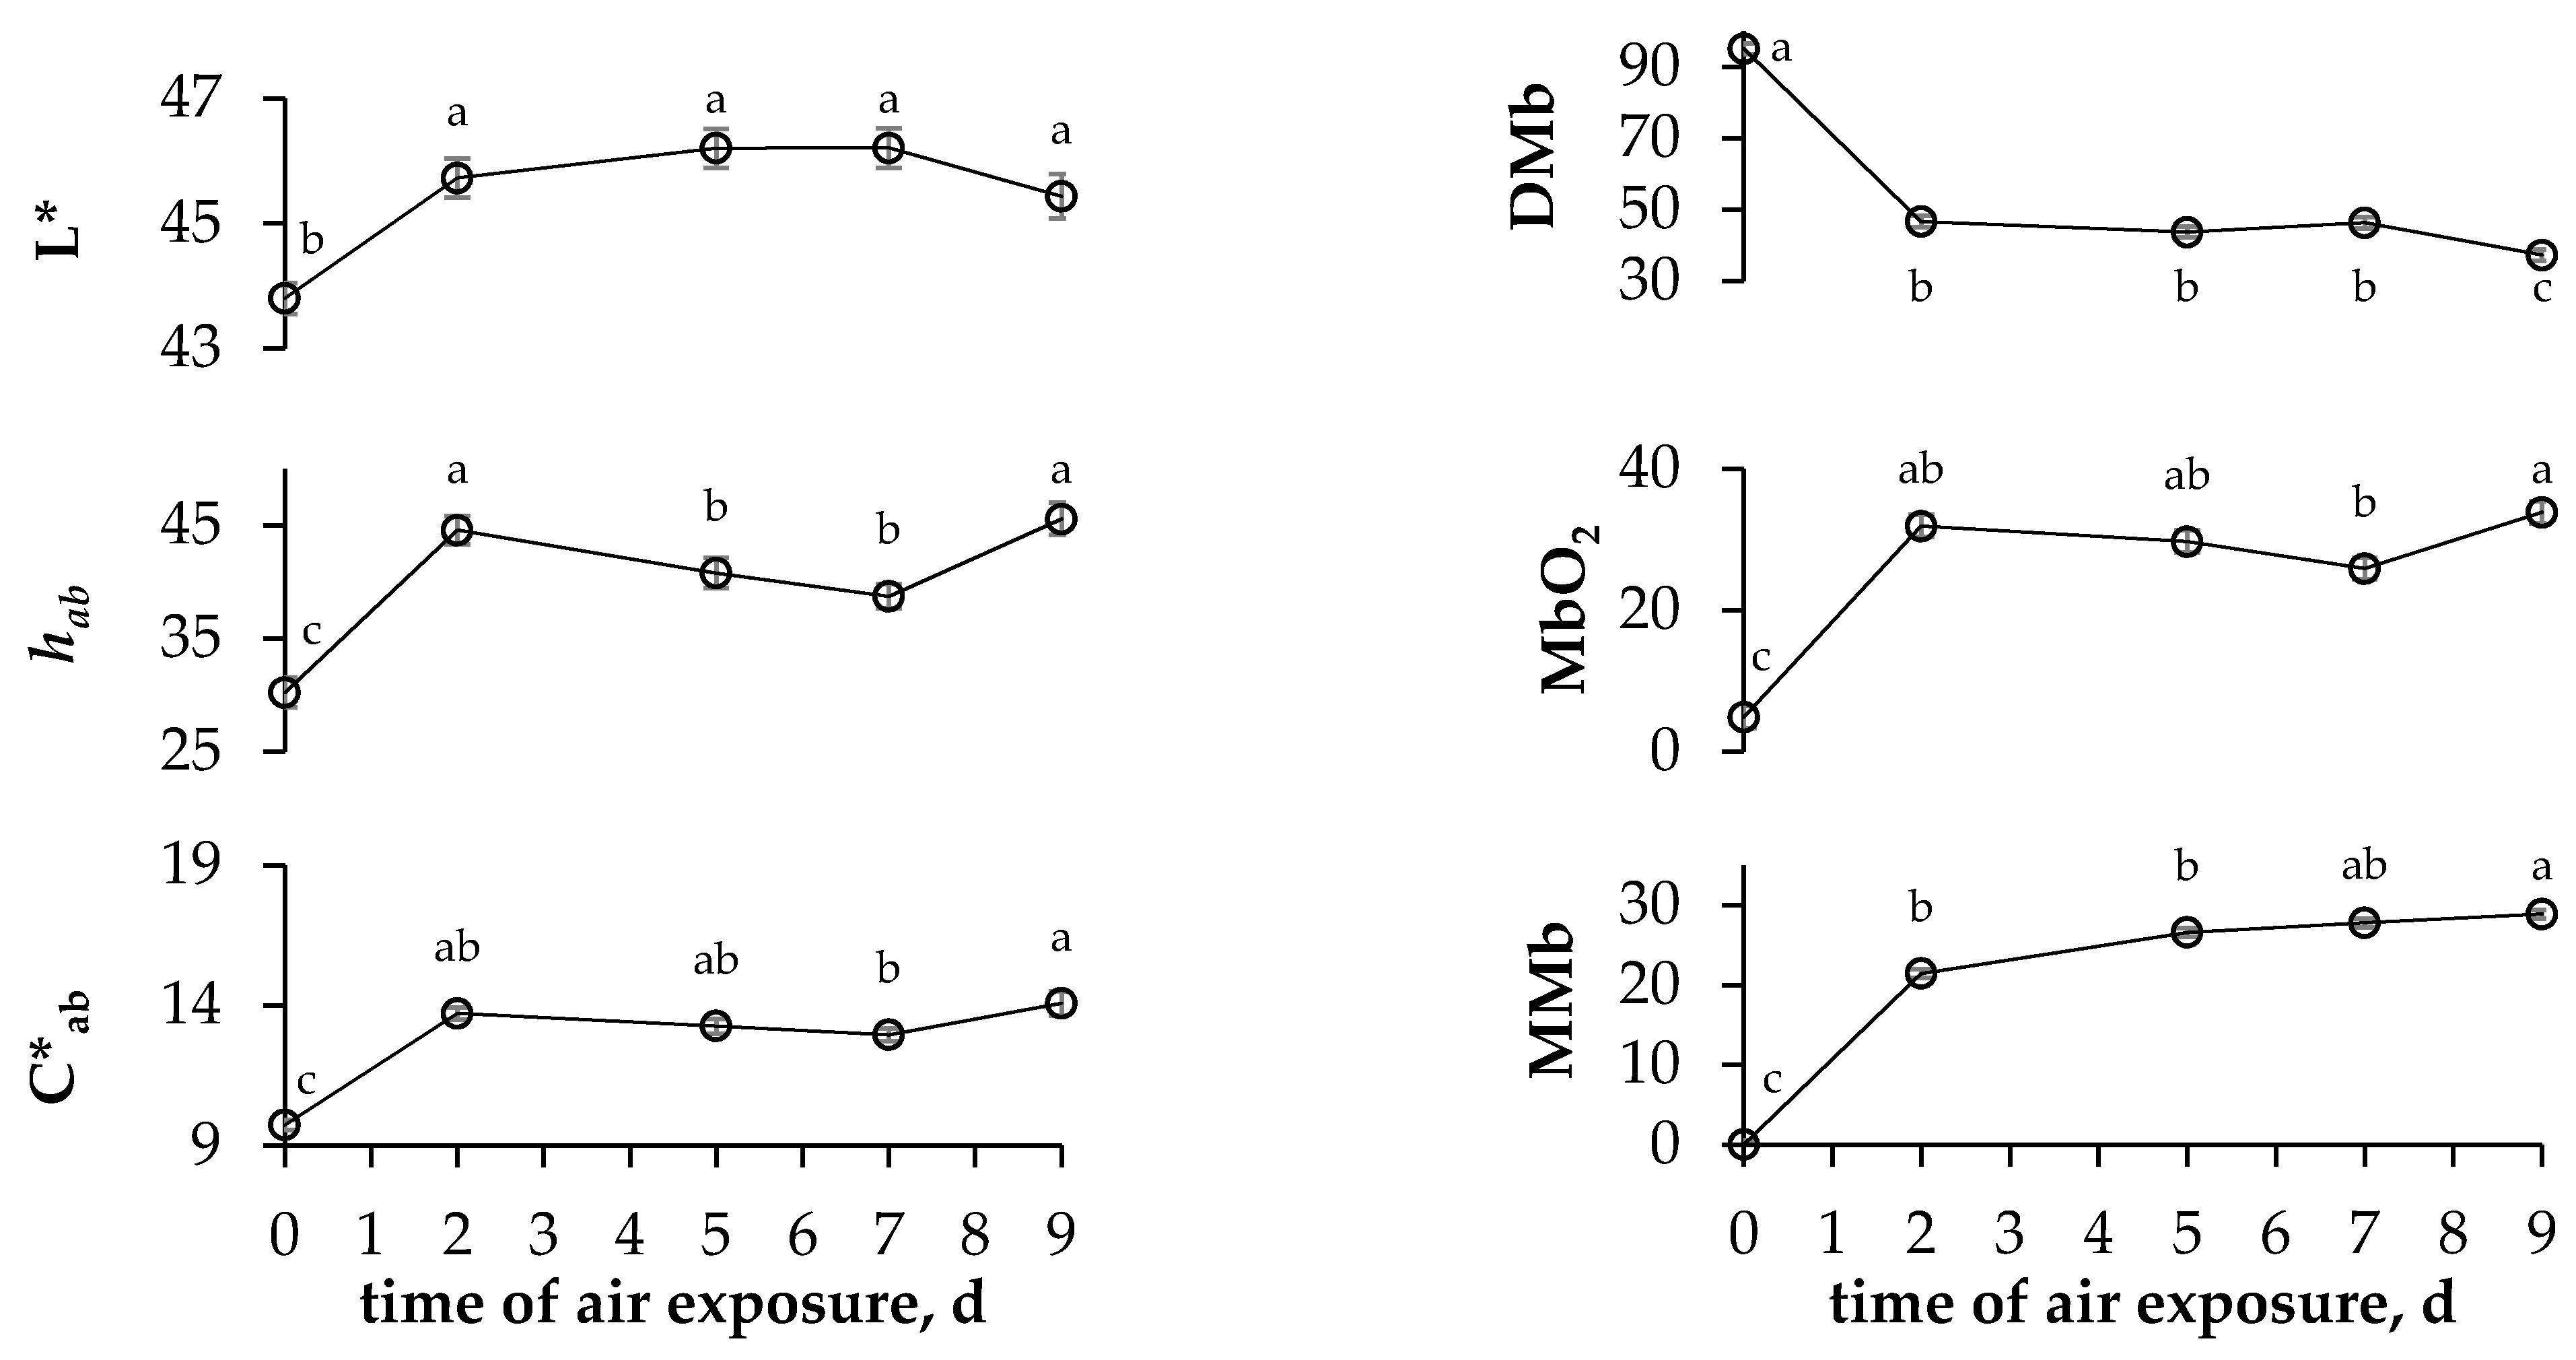
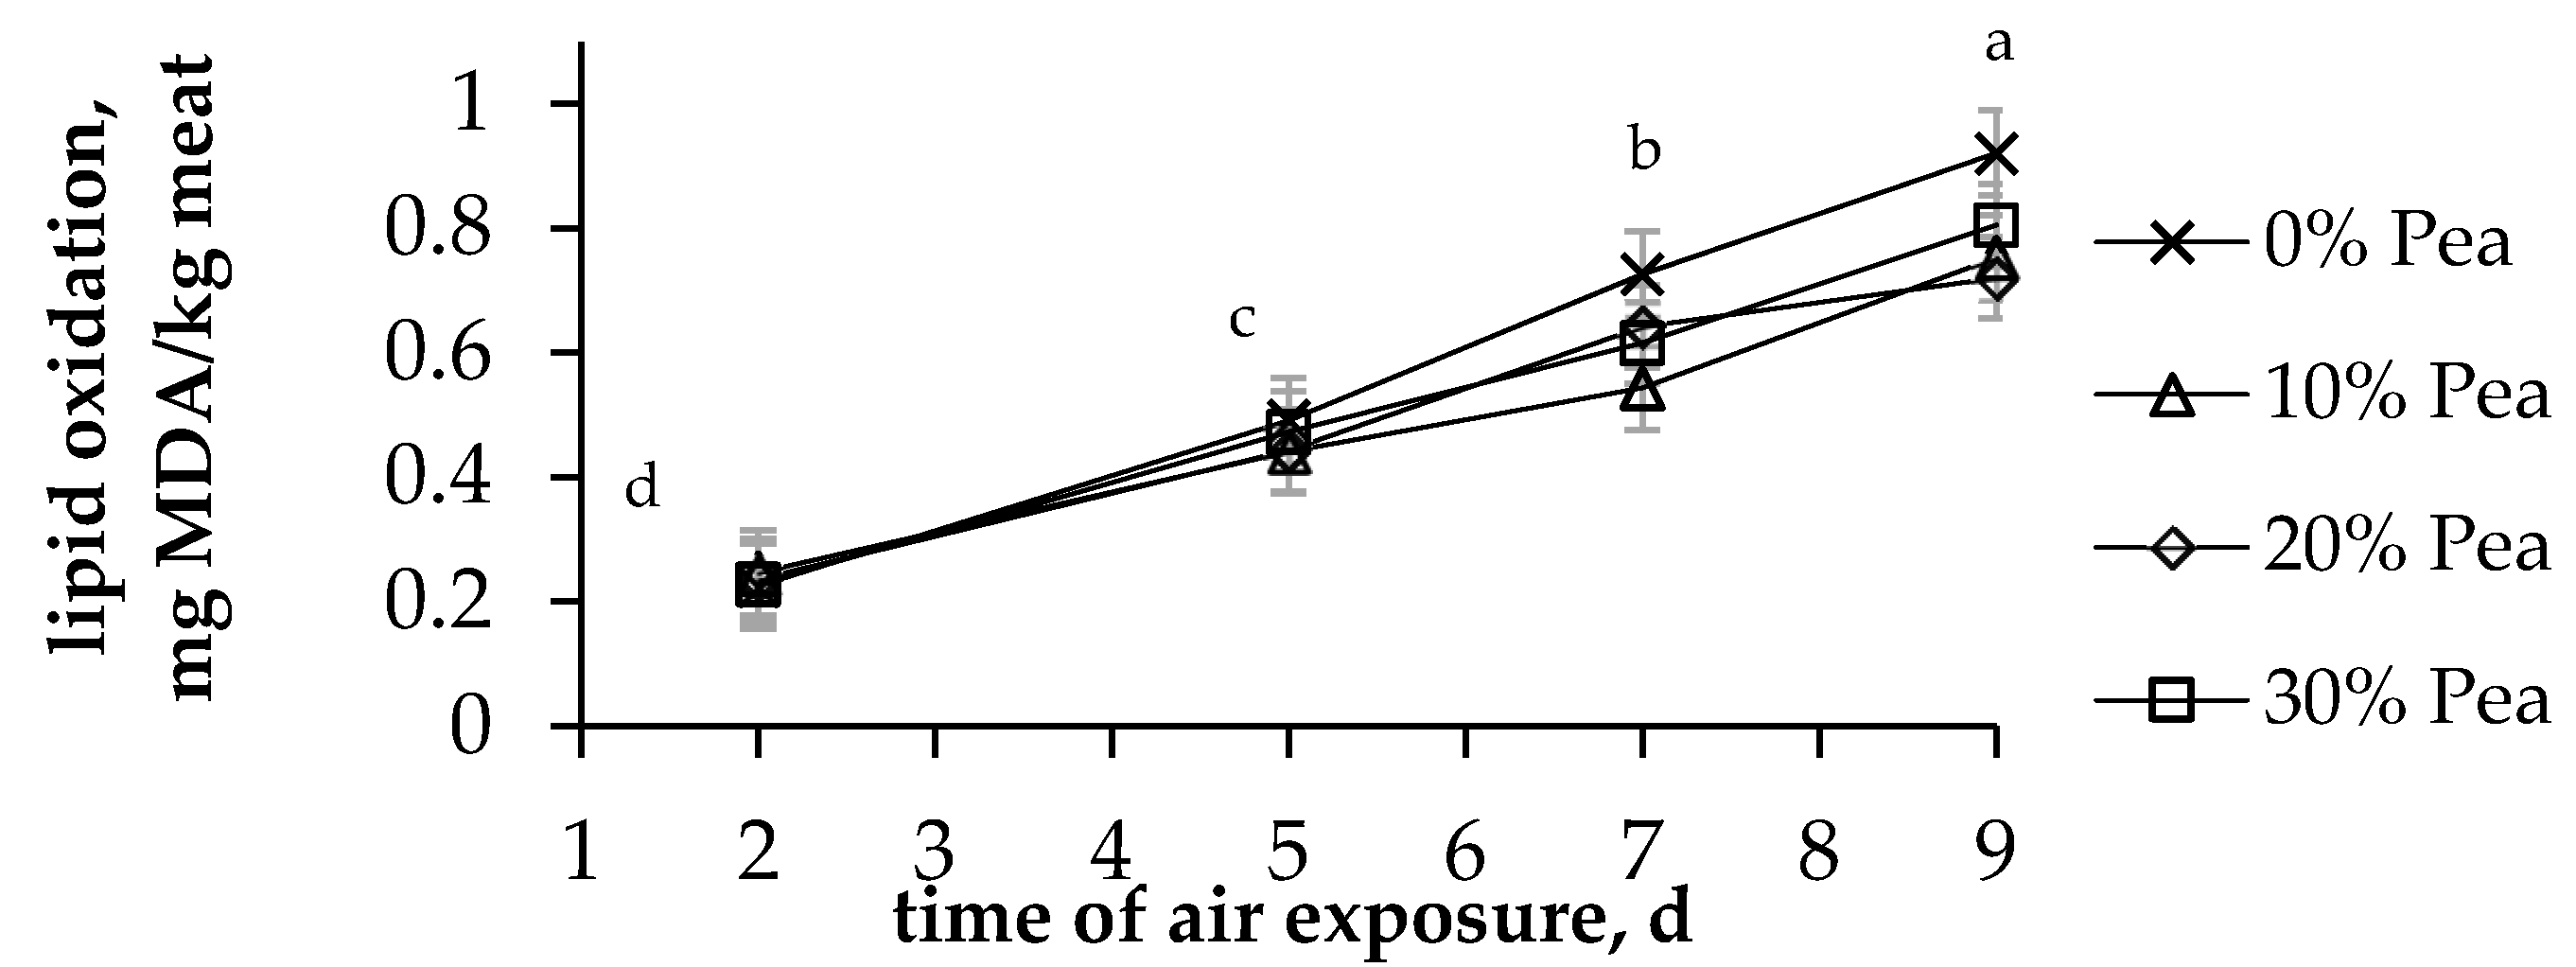
3.2. Carcass Colour
3.3. Meat Quality
4. Discussion
5. Conclusions
Author Contributions
Funding
Institutional Review Board Statement
Data Availability Statement
Acknowledgments
Conflicts of Interest
References
- Karlsson, J.O.; Parodi, A.; van Zanten, H.H.E.; Hansson, P.-A.; Röös, E. Halting European Union soybean feed imports favours ruminants over pigs and poultry. Nat. Food 2021, 2, 38–46. [Google Scholar] [CrossRef]
- Fischer, E.; Cachon, R.; Cayot, N. Pisum sativum vs. Glycine max, a comparative review of nutritional, physicochemical, and sensory properties for food uses. Trends Food Sci. Technol. 2020, 95, 196–204. [Google Scholar] [CrossRef]
- Bonanno, A.; Tornambè, G.; Di Grigoli, A.; Genna, V.; Bellina, V.; Di Miceli, G.; Giambalvo, D. Effect of legume grains as a source of dietary protein on the quality of organic lamb meat. J. Sci. Food Agric. 2012, 92, 2870–2875. [Google Scholar] [CrossRef] [PubMed]
- Schreuder, R.; de Visser, C.L.M. EIP-AGRI Focus Group; Protein CROPS: Final Report; European Commission: Brussels, Belgium, 2014. [Google Scholar]
- Bonanno, A.; Di Grigoli, A.; Vitale, F.; Alabiso, M.; Giosuè, C.; Mazza, F.; Todaro, M. Legume grain-based supplements in dairy sheep diet: Effects on milk yield, composition and fatty acid profile. Anim. Prod. Sci. 2016, 56, 130–140. [Google Scholar] [CrossRef][Green Version]
- Loe, E.R.; Bauer, M.L.; Lardy, G.P.; Caton, J.S.; Berg, P.T. Field pea (Pisum sativum) inclusion in corn-based lamb finishing diets. Small Rumin. Res. 2004, 53, 39–45. [Google Scholar] [CrossRef]
- Bachmann, M.; Kuhnitzsch, C.; Okon, P.; Martens, S.D.; Greef, J.M.; Steinhöfel, O.; Zeyner, A. Ruminal in vitro protein degradation and apparent digestibility of energy and nutrients in sheep fed native or ensiled + toasted pea (Pisum sativum) grains. Animals 2019, 9, 401. [Google Scholar] [CrossRef] [PubMed]
- FEDNA. Tablas FEDNA de Composición y Valor Nutritivo de Alimentos Para la Fabricación de Piensos Compuestos; FEDNA: Madrid, Spain, 2019. [Google Scholar]
- Colonna, M.A.; Giannico, F.; Marsico, G.; Vonghia, G.; Ragni, M.; Jambrenghi, A.C. Effect of pea (Pisum sativum L.) as alternative to soybean meal on the productive performances and meat quality traits of Merino crossbred lamb types. Prog. Nutr. 2014, 16, 39–51. [Google Scholar]
- Karlsson, L.; Martinsson, K. Growth performance of lambs fed different protein supplements in barley-based diets. Livest. Sci. 2011, 138, 125–131. [Google Scholar] [CrossRef]
- Lobón, S.; Joy, M.; Casasús, I.; Rufino-Moya, P.J.; Blanco, M. Field pea can partially replace soybean meal in fattening concentrate without deleterious effects on the digestibility and performance of light lambs. Animals 2020, 10, 243. [Google Scholar] [CrossRef] [PubMed]
- Scerra, M.; Caparra, P.; Foti, F.; Cilione, C.; Zappia, G.; Motta, C.; Scerra, V. Intramuscular fatty acid composition of lambs fed diets containing alternative protein sources. Meat Sci. 2011, 87, 229–233. [Google Scholar] [CrossRef]
- Purroy, A.; Surra, J.; Muñoz, F.; Morago, E. Empleo de leguminosas grano en el pienso para cebo de corderos: Y III. Guisantes. Inf. Tec. Econ. Agrar. 1992, 88A, 63–69. [Google Scholar]
- Turner, T.D.; Karlsson, L.; Mapiye, C.; Rolland, D.C.; Martinsson, K.; Dugan, M.E.R. Dietary influence on the m. longissimus dorsi fatty acid composition of lambs in relation to protein source. Meat Sci. 2012, 91, 472–477. [Google Scholar] [CrossRef] [PubMed]
- Lanza, M.; Fabro, C.; Scerra, M.; Bella, M.; Pagano, R.; Brogna, D.M.R.; Pennisi, P. Lamb meat quality and intramuscular fatty acid composition as affected by concentrates including different legume seeds. Ital. J. Anim. Sci. 2011, 10, 87–94. [Google Scholar] [CrossRef][Green Version]
- Joy, M.; Rufino-Moya, P.; Lobón, S.; Blanco, M. The effect of the inclusion of pea in lamb fattening concentrate on in vitro and in situ rumen fermentation. J. Sci. Food Agric. 2021, 101, 3041–3048. [Google Scholar] [CrossRef]
- Ripoll, G.; González-Calvo, L.; Molino, F.; Calvo, J.H.; Joy, M. Effects of finishing period length with vitamin E supplementation and alfalfa grazing on carcass color and the evolution of meat color and the lipid oxidation of light lambs. Meat Sci. 2013, 93, 906–913. [Google Scholar] [CrossRef]
- Krzywicki, K. Assessment of relative content of myoglobin, oxymyoglobin and metmyoglobin at the surface of beef. Meat Sci. 1979, 3, 1–10. [Google Scholar] [CrossRef]
- Prache, S.; Theriez, M. Traceability of lamb production systems: Carotenoids in plasma and adipose tissue. Anim. Sci. 1999, 69, 29–36. [Google Scholar] [CrossRef]
- Lepetit, J. Deformation of collagenous, elastin and muscle fibres in raw meat in relation to anisotropy and length ratio. Meat Sci. 1989, 26, 47–66. [Google Scholar] [CrossRef]
- AOAC. Official Methods of Analysis, 16th ed.; AOAC International: Gaithersburg, MD, USA, 1999. [Google Scholar]
- AOCS. Rapid Determination of Oil/Fat Utilizing High Temperature Solvent Extraction; AOCS Press: Urbana, IL, USA, 2005. [Google Scholar]
- Blanco, M.; Ripoll, G.; Casasús, I.; Bertolín, J.R.; Joy, M. Carotenoids and tocopherol in plasma and subcutaneous fat colour to trace forage-feeding in growing steers. Livest. Sci. 2019, 219, 104–110. [Google Scholar] [CrossRef]
- Bertolín, J.R.; Joy, M.; Rufino-Moya, P.J.; Lobón, S.; Blanco, M. Simultaneous determination of carotenoids, tocopherols, retinol and cholesterol in ovine lyophilised samples of milk, meat, and liver and in unprocessed/raw samples of fat. Food Chem. 2018, 257, 182–188. [Google Scholar] [CrossRef]
- Sukhija, P.S.; Palmquist, D.L. Rapid method for determination of total fatty-acid content and composition of feedstuffs and feces. J. Agric. Food Chem. 1988, 36, 1202–1206. [Google Scholar] [CrossRef]
- Lee, M.R.F.; Tweed, J.K.S.; Kim, E.J.; Scollan, N.D. Beef, chicken and lamb fatty acid analysis—A simplified direct bimethylation procedure using freeze-dried material. Meat Sci. 2012, 92, 863–866. [Google Scholar] [CrossRef] [PubMed]
- Bravo-Lamas, L.; Barron, L.J.R.; Kramer, J.K.G.; Etaio, I.; Aldai, N. Characterization of the fatty acid composition of lamb commercially available in northern Spain: Emphasis on the trans-18:1 and CLA content and profile. Meat Sci. 2016, 117, 108–116. [Google Scholar] [CrossRef]
- Ulbricht, T.L.V.; Southgate, D.A.T. Coronary heart disease: Seven dietary factors. Lancet 1991, 338, 985–992. [Google Scholar] [CrossRef]
- Lanza, M.; Bella, M.; Priolo, A.; Fasone, V. Peas (Pisum sativum L.) as an alternative protein source in lamb diets: Growth performances, and carcass and meat quality. Small Rumin. Res. 2003, 47, 63–68. [Google Scholar] [CrossRef]
- Facciolongo, A.M.; De Marzo, D.; Ragni, M.; Lestingi, A.; Toteda, F. Use of alternative protein sources for finishing lambs. 2. Effects on chemical and physical characteristics and fatty acid composition of meat. Prog. Nutr. 2015, 17, 165–173. [Google Scholar]
- Lobón, S.; Blanco, M.; Sanz, A.; Ripoll, G.; Joy, M. Effects of feeding strategies during lactation and the inclusion of quebracho in the fattening on performance and carcass traits in light lambs. J. Sci. Food Agric. 2019, 99, 457–463. [Google Scholar] [CrossRef] [PubMed]
- Lobón, S.; Blanco, M.; Sanz, A.; Ripoll, G.; Bertolín, J.R.; Joy, M. Meat quality of light lambs is more affected by the dam’s feeding system during lactation than by the inclusion of quebracho in the fattening concentrate. J. Anim. Sci. 2017, 95, 4998–5011. [Google Scholar] [CrossRef] [PubMed]
- Carrasco, S.; Panea, B.; Ripoll, G.; Sanz, A.; Joy, M. Influence of feeding systems on cortisol levels, fat colour and instrumental meat quality in light lambs. Meat Sci. 2009, 83, 50–56. [Google Scholar] [CrossRef]
- Liu, Q.; Lanari, M.C.; Schaefer, D.M. A Review of Dietary Vitamin-E Supplementation for Improvement of Beef Quality. J. Anim. Sci. 1995, 73, 3131–3140. [Google Scholar] [CrossRef]
- Bernués, A.; Ripoll, G.; Panea, B. Consumer segmentation based on convenience orientation and attitudes towards quality attributes of lamb meat. Food Qual. Prefer. 2012, 26, 211–220. [Google Scholar] [CrossRef]
- Domínguez, R.; Pateiro, M.; Gagaoua, M.; Barba, F.J.; Zhang, W.; Lorenzo, J.M. A comprehensive review on lipid oxidation in meat and meat products. Antioxidants 2019, 8, 429. [Google Scholar] [CrossRef] [PubMed]
- Lestingi, A.; Facciolongo, A.M.; Jambrenghi, A.C.; Ragni, M.; Toteda, F. The use of peas and sweet lupin seeds alone or in association for fattening lambs: Effects on performance, blood parameters and meat quality. Small Rumin. Res. 2016, 143, 15–23. [Google Scholar] [CrossRef]
- Salter, A.M. Dietary fatty acids and cardiovascular disease. Animal 2013, 7, 163–171. [Google Scholar] [CrossRef] [PubMed]
- Woods, V.B.; Fearon, A.M. Dietary sources of unsaturated fatty acids for animals and their transfer into meat, milk and eggs: A review. Livest. Sci. 2009, 126, 1–20. [Google Scholar] [CrossRef]
- Chen, J.; Liu, H. Nutritional indices for assessing fatty acids: A mini-review. Int. J. Mol. Sci. 2020, 21, 5695. [Google Scholar] [CrossRef]


| 0%pea | 10%pea | 20%pea | 30%pea | s.e. | p-Value | |
|---|---|---|---|---|---|---|
| n | 4 | 4 | 4 | 4 | ||
| FA, g/100 g | ||||||
| C12:0 | 0.08 c | 0.13 ab | 0.11 b | 0.15 a | 0.004 | <0.001 |
| C14:0 | 0.52 b | 0.68 ab | 0.74 ab | 0.77 a | 0.029 | 0.04 |
| C16:0 | 34.01 d | 37.18 b | 38.15 a | 35.49 c | 0.118 | <0.001 |
| C17:0 | 0.19 | 0.15 | 0.17 | 0.21 | 0.014 | 0.52 |
| C18:0 | 10.61 a | 8.79 b | 8.54 b | 10.61 a | 0.185 | 0.002 |
| C18:1 c9 | 19.18 b | 23.28 a | 24.86 a | 23.19 a | 0.211 | <0.001 |
| C18:2 n-6 | 32.18 a | 26.95 b | 24.66 b | 26.56 b | 0.294 | <0.001 |
| C20:0 | 0.26 | 0.23 | 0.27 | 0.25 | 0.011 | 0.70 |
| C18:3 n-3 | 2.44 | 2.20 | 2.15 | 2.38 | 0.041 | 0.09 |
| C23:0 | 0.44 | 0.27 | 0.21 | 0.19 | 0.071 | 0.61 |
| Carotenoids, µg/g DM | ||||||
| Lutein | 0.9 b | 1.2 b | 1.3 b | 1.7 a | 0.04 | <0.001 |
| Zeaxanthin | 0.69 a | 0.51 b | 0.32 c | 0.47 bc | 0.02 | <0.001 |
| 13 Z-β-carotene | 0.8 c | 1.7 b | 2.2 a | 1.4 b | 0.04 | <0.001 |
| 9 Z-β-carotene | 0.5 c | 1.0 b | 1.4 a | 0.9 b | 0.04 | <0.001 |
| All E-β-carotene | 1.1 b | 1.8 a | 2.3 a | 1.9 a | 0.06 | <0.001 |
| Tocopherols, µg/g DM | ||||||
| α-tocopherol | 4.4 a | 4.8 a | 4.9 a | 3.3 b | 0.07 | <0.001 |
| γ-tocopherol | 10.0 b | 11.0 b | 11.4 b | 13.6 a | 0.21 | <0.001 |
| δ-tocopherol | 3.4 c | 6.2 b | 7.8 a | 6.3 b | 0.06 | <0.001 |
| 0%pea | 10%pea | 20%pea | 30%pea | s.e.m. | p-Value | |
|---|---|---|---|---|---|---|
| n | 13 | 13 | 14 | 14 | ||
| Rectus abdominis muscle | ||||||
| Lightness (L*) | 47.8 | 48.0 | 47.3 | 48.1 | 0.3 | 0.81 |
| Redness (a*) | 9.1 | 8.5 | 9.0 | 9.0 | 0.2 | 0.71 |
| Yellowness (b*) | 9.8 | 10.1 | 9.5 | 10.3 | 0.2 | 0.53 |
| Chroma (C*ab) | 13.4 | 13.3 | 13.3 | 13.8 | 0.2 | 0.75 |
| Hue angle (hab) | 47.1 | 49.6 | 45.9 | 49.0 | 1.0 | 0.55 |
| Perirenal fat | ||||||
| Lightness (L*) | 71.4 | 72.3 | 71.6 | 72.4 | 0.3 | 0.66 |
| Redness (a*) | 4.8 | 4.2 | 4.6 | 4.3 | 0.2 | 0.56 |
| Yellowness (b*) | 11.6 | 11.0 | 11.8 | 11.4 | 0.2 | 0.57 |
| Chroma (C*ab) | 12.5 | 11.8 | 12.8 | 12.2 | 0.2 | 0.52 |
| Hue angle (hab) | 67.6 | 69.2 | 68.4 | 69.7 | 0.6 | 0.68 |
| SUM | 120 | 110 | 123 | 104 | 5.7 | 0.63 |
| Subcutaneous caudal fat | ||||||
| Lightness (L*) | 69.7 | 69.5 | 70.1 | 70.1 | 0.3 | 0.86 |
| Redness (a*) | 2.8 | 2.9 | 2.7 | 2.7 | 0.2 | 0.98 |
| Yellowness (b*) | 11.3 | 12.1 | 11.5 | 12.3 | 0.3 | 0.59 |
| Chroma (C*ab) | 11.6 | 12.5 | 11.9 | 12.7 | 0.3 | 0.62 |
| Hue angle (hab) | 76.4 | 76.8 | 76.5 | 78.4 | 0.6 | 0.67 |
| SUM | 93 | 102 | 109 | 121 | 5.1 | 0.28 |
| 0%pea | 10%pea | 20%pea | 30%pea | s.e.m. | p-Value | |
|---|---|---|---|---|---|---|
| Raw Semitendinosus muscle | ||||||
| Shear force, N cm−2 | 41.9 | 43.5 | 42.2 | 41.7 | 0.88 | 0.89 |
| Toughness, N cm−2 | 12.6 | 13.0 | 12.1 | 13.0 | 0.31 | 0.68 |
| Cooked Semimembranosus muscle | ||||||
| Stress-compression 20%, N | 14.8 | 17.1 | 15.5 | 16.3 | 0.41 | 0.24 |
| Stress-compression 80%, N | 52.1 | 49.6 | 52.2 | 53.5 | 1.62 | 0.86 |
| LTL muscle | ||||||
| Dry matter, % | 22.00 | 21.79 | 22.23 | 21.53 | 0.112 | 0.13 |
| Crude protein, %FM | 20.30 | 20.27 | 20.41 | 19.86 | 0.097 | 0.25 |
| Intramuscular fat, %FM | 1.65 | 1.67 | 1.93 | 1.72 | 0.051 | 0.26 |
| Cholesterol, mg/g FM | 0.51 ab | 0.51 ab | 0.53 a | 0.49 b | 0.005 | 0.02 |
| Retinol, µg/g FM | 0.023 b | 0.028 a | 0.026 ab | 0.024 ab | 0.001 | 0.02 |
| α-tocopherol, µg/g FM | 0.63 | 0.69 | 0.66 | 0.57 | 0.026 | 0.35 |
| ɣ-tocopherol, µg/g FM | 0.17 | 0.21 | 0.21 | 0.24 | 0.011 | 0.11 |
| 0%pea | 10%pea | 20%pea | 30%pea | s.e.m. | Pr > F | |
|---|---|---|---|---|---|---|
| Saturated FA, g/100 g | ||||||
| C10:0 | 0.12 | 0.13 | 0.13 | 0.11 | 0.01 | 0.78 |
| C12:0 | 0.24 | 0.20 | 0.28 | 0.24 | 0.02 | 0.37 |
| aC13:0 | 0.94 | 1.14 | 0.94 | 1.06 | 0.04 | 0.20 |
| C13:0 | 0.06 ab | 0.09 a | 0.05 b | 0.07 ab | 0.01 | 0.04 |
| iC14:0 | 0.68 | 0.82 | 0.61 | 0.67 | 0.03 | 0.11 |
| C14:0 | 3.38 | 3.12 | 3.46 | 3.05 | 0.09 | 0.32 |
| iC15:0 | 0.11 | 0.11 | 0.11 | 0.09 | 0.01 | 0.50 |
| aC15:0 | 0.66 | 0.68 | 0.63 | 0.67 | 0.02 | 0.83 |
| C15:0 | 0.42 b | 0.41 b | 0.49 a | 0.47 ab | 0.01 | 0.01 |
| DMA C16:0 | 0.87 | 0.84 | 0.82 | 0.86 | 0.03 | 0.94 |
| iC16:0 | 0.13 | 0.11 | 0.12 | 0.12 | 0.00 | 0.36 |
| aC16:0 | 0.48 | 0.52 | 0.48 | 0.50 | 0.02 | 0.86 |
| C16:0 | 22.12 | 22.00 | 22.81 | 21.74 | 0.15 | 0.07 |
| C17:0 | 0.99 b | 0.96 b | 1.20 ab | 1.27 a | 0.04 | 0.01 |
| DMA C18:0 | 0.18 | 0.14 | 0.15 | 0.18 | 0.01 | 0.56 |
| iC18:0 | 0.12 | 0.11 | 0.09 | 0.10 | 0.00 | 0.07 |
| C18:0 | 13.29 | 13.40 | 14.12 | 13.78 | 0.17 | 0.28 |
| C20:0 | 0.10 | 0.09 | 0.10 | 0.10 | 0.00 | 0.70 |
| C22:0 | 0.08 | 0.08 | 0.07 | 0.08 | 0.00 | 0.56 |
| C24:0 | 0.02 | 0.02 | 0.02 | 0.02 | 0.00 | 0.79 |
| Monounsaturated FA g/100 g | ||||||
| C14:1 c9 | 0.15 | 0.15 | 0.14 | 0.13 | 0.00 | 0.39 |
| C16:1 t9 | 0.44 a | 0.41 ab | 0.38 b | 0.42 ab | 0.01 | 0.04 |
| C16:1 c7 | 0.21 | 0.23 | 0.21 | 0.21 | 0.00 | 0.50 |
| C16:1 c9 | 2.28 | 2.20 | 2.15 | 2.11 | 0.03 | 0.14 |
| C17:1 c9 | 0.79 | 0.80 | 0.85 | 0.98 | 0.03 | 0.08 |
| C18:1 t11 | 2.43 | 2.57 | 2.50 | 2.20 | 0.14 | 0.79 |
| C18:1 c9 | 33.48 | 33.29 | 33.45 | 34.01 | 0.31 | 0.85 |
| C18:1 t15 | 0.18 | 0.20 | 0.15 | 0.16 | 0.01 | 0.24 |
| C18:1 c11 | 0.16 | 0.18 | 0.14 | 0.14 | 0.01 | 0.15 |
| C18:1 c12 | 0.17 | 0.16 | 0.18 | 0.18 | 0.00 | 0.72 |
| C18:1 c13 | 0.10 | 0.10 | 0.09 | 0.08 | 0.01 | 0.83 |
| C18:1 t16 | 0.21 | 0.19 | 0.20 | 0.18 | 0.00 | 0.37 |
| C18:1 c15 | 0.08 | 0.09 | 0.09 | 0.08 | 0.00 | 0.97 |
| C24:1 c9 | 0.15 | 0.21 | 0.16 | 0.18 | 0.01 | 0.10 |
| 0%pea | 10%pea | 20%pea | 30%pea | s.e.m. | Pr > F | |
|---|---|---|---|---|---|---|
| PUFA, g/100 g | ||||||
| C18:2 n-6 t9, t12 | 0.17 | 0.15 | 0.15 | 0.13 | 0.00 | 0.06 |
| C18:2 c9, t11 | 0.31 | 0.28 | 0.28 | 0.28 | 0.01 | 0.74 |
| C18:2 t10, c12 | 0.10 | 0.10 | 0.10 | 0.11 | 0.00 | 0.63 |
| C20:3 n-9 | 0.44 | 0.47 | 0.43 | 0.46 | 0.01 | 0.61 |
| C18:2 n-6 | 7.84 | 7.72 | 6.89 | 7.38 | 0.18 | 0.25 |
| C20:2 n-6 | 0.16 | 0.12 | 0.12 | 0.15 | 0.01 | 0.17 |
| C20:3 n-6 | 0.24 | 0.25 | 0.22 | 0.25 | 0.01 | 0.16 |
| C20:4 n-6 | 2.99 | 3.20 | 2.68 | 3.07 | 0.08 | 0.13 |
| C22:4 n-6 | 0.28 | 0.29 | 0.25 | 0.28 | 0.01 | 0.32 |
| C18:3 n-3 | 0.42 | 0.41 | 0.39 | 0.41 | 0.01 | 0.76 |
| C20:5 n-3 | 0.29 | 0.30 | 0.27 | 0.27 | 0.01 | 0.76 |
| C22:5 n-3 | 0.59 | 0.61 | 0.53 | 0.56 | 0.02 | 0.40 |
| C22:6 n-3 | 0.26 | 0.28 | 0.24 | 0.27 | 0.01 | 0.71 |
| 0%pea | 10%pea | 20%pea | 30%pea | s.e.m. | Pr > F | |
|---|---|---|---|---|---|---|
| Total Saturated FA | 44.98 b | 44.97 b | 46.67 a | 45.16 b | 0.20 | 0.01 |
| Total Monounsaturated FA | 40.19 | 40.15 | 40.11 | 40.47 | 0.33 | 0.98 |
| Total Polyunsaturated FA | 14.16 | 14.25 | 12.62 | 13.72 | 0.30 | 0.20 |
| n-3 | 1.57 | 1.60 | 1.44 | 1.53 | 0.04 | 0.61 |
| n-6 | 8.75 | 8.59 | 7.69 | 8.26 | 0.19 | 0.22 |
| n-6:n-3 | 5.62 | 5.43 | 5.41 | 5.58 | 0.11 | 0.86 |
| Atherogenicity index | 0.71 | 0.69 | 0.75 | 0.68 | 0.01 | 0.09 |
| Thrombogenicity index | 1.32 ab | 1.31 b | 1.43 a | 1.33 ab | 0.01 | 0.02 |
Publisher’s Note: MDPI stays neutral with regard to jurisdictional claims in published maps and institutional affiliations. |
© 2021 by the authors. Licensee MDPI, Basel, Switzerland. This article is an open access article distributed under the terms and conditions of the Creative Commons Attribution (CC BY) license (https://creativecommons.org/licenses/by/4.0/).
Share and Cite
Blanco, M.; Ripoll, G.; Lobón, S.; Bertolín, J.R.; Casasús, I.; Joy, M. The Inclusion of Pea in Concentrates Had Minor Effects on the Meat Quality of Light Lambs. Animals 2021, 11, 2385. https://doi.org/10.3390/ani11082385
Blanco M, Ripoll G, Lobón S, Bertolín JR, Casasús I, Joy M. The Inclusion of Pea in Concentrates Had Minor Effects on the Meat Quality of Light Lambs. Animals. 2021; 11(8):2385. https://doi.org/10.3390/ani11082385
Chicago/Turabian StyleBlanco, Mireia, Guillermo Ripoll, Sandra Lobón, Juan Ramón Bertolín, Isabel Casasús, and Margalida Joy. 2021. "The Inclusion of Pea in Concentrates Had Minor Effects on the Meat Quality of Light Lambs" Animals 11, no. 8: 2385. https://doi.org/10.3390/ani11082385
APA StyleBlanco, M., Ripoll, G., Lobón, S., Bertolín, J. R., Casasús, I., & Joy, M. (2021). The Inclusion of Pea in Concentrates Had Minor Effects on the Meat Quality of Light Lambs. Animals, 11(8), 2385. https://doi.org/10.3390/ani11082385