Improvements on Live Feed Enrichments for Pikeperch (Sander lucioperca) Larval Culture

 , ,
, , 
Simple Summary
Abstract
1. Introduction
2. Materials and Methods
2.1. Fatty Acid Analysis
2.2. RNA/DNA Ratio Analysis Method
2.3. Salinity Stress Challenge
2.4. Statistical Analysis
3. Results
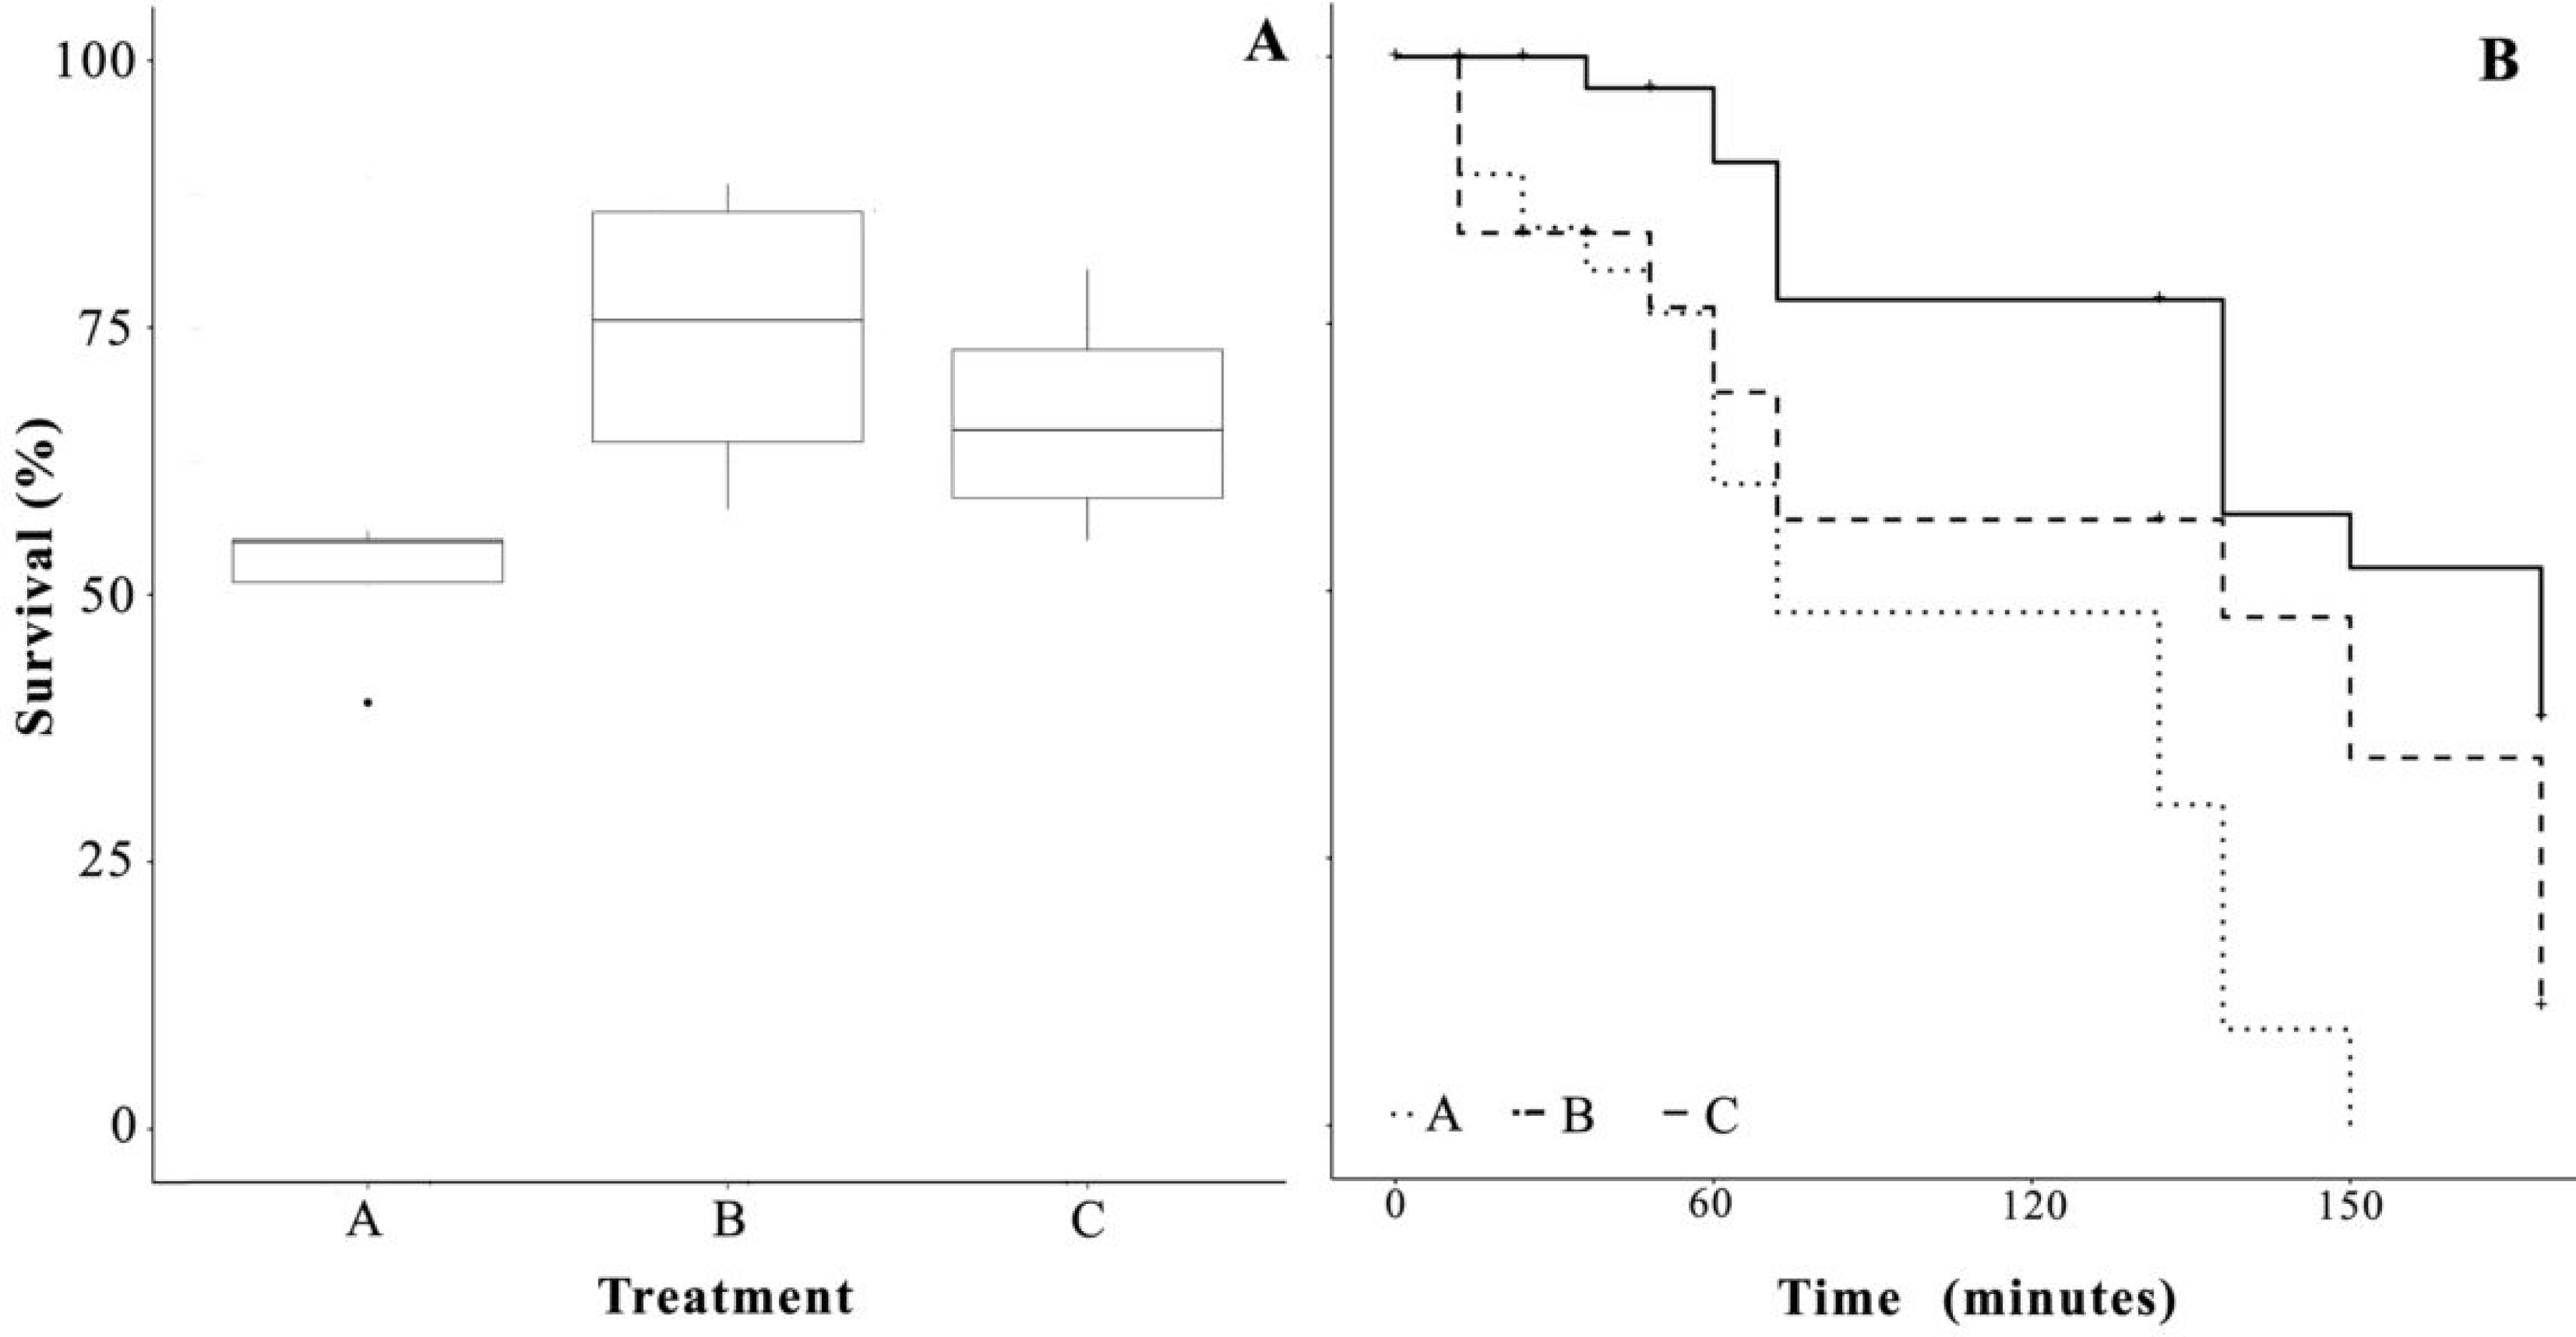
3.1. Survival
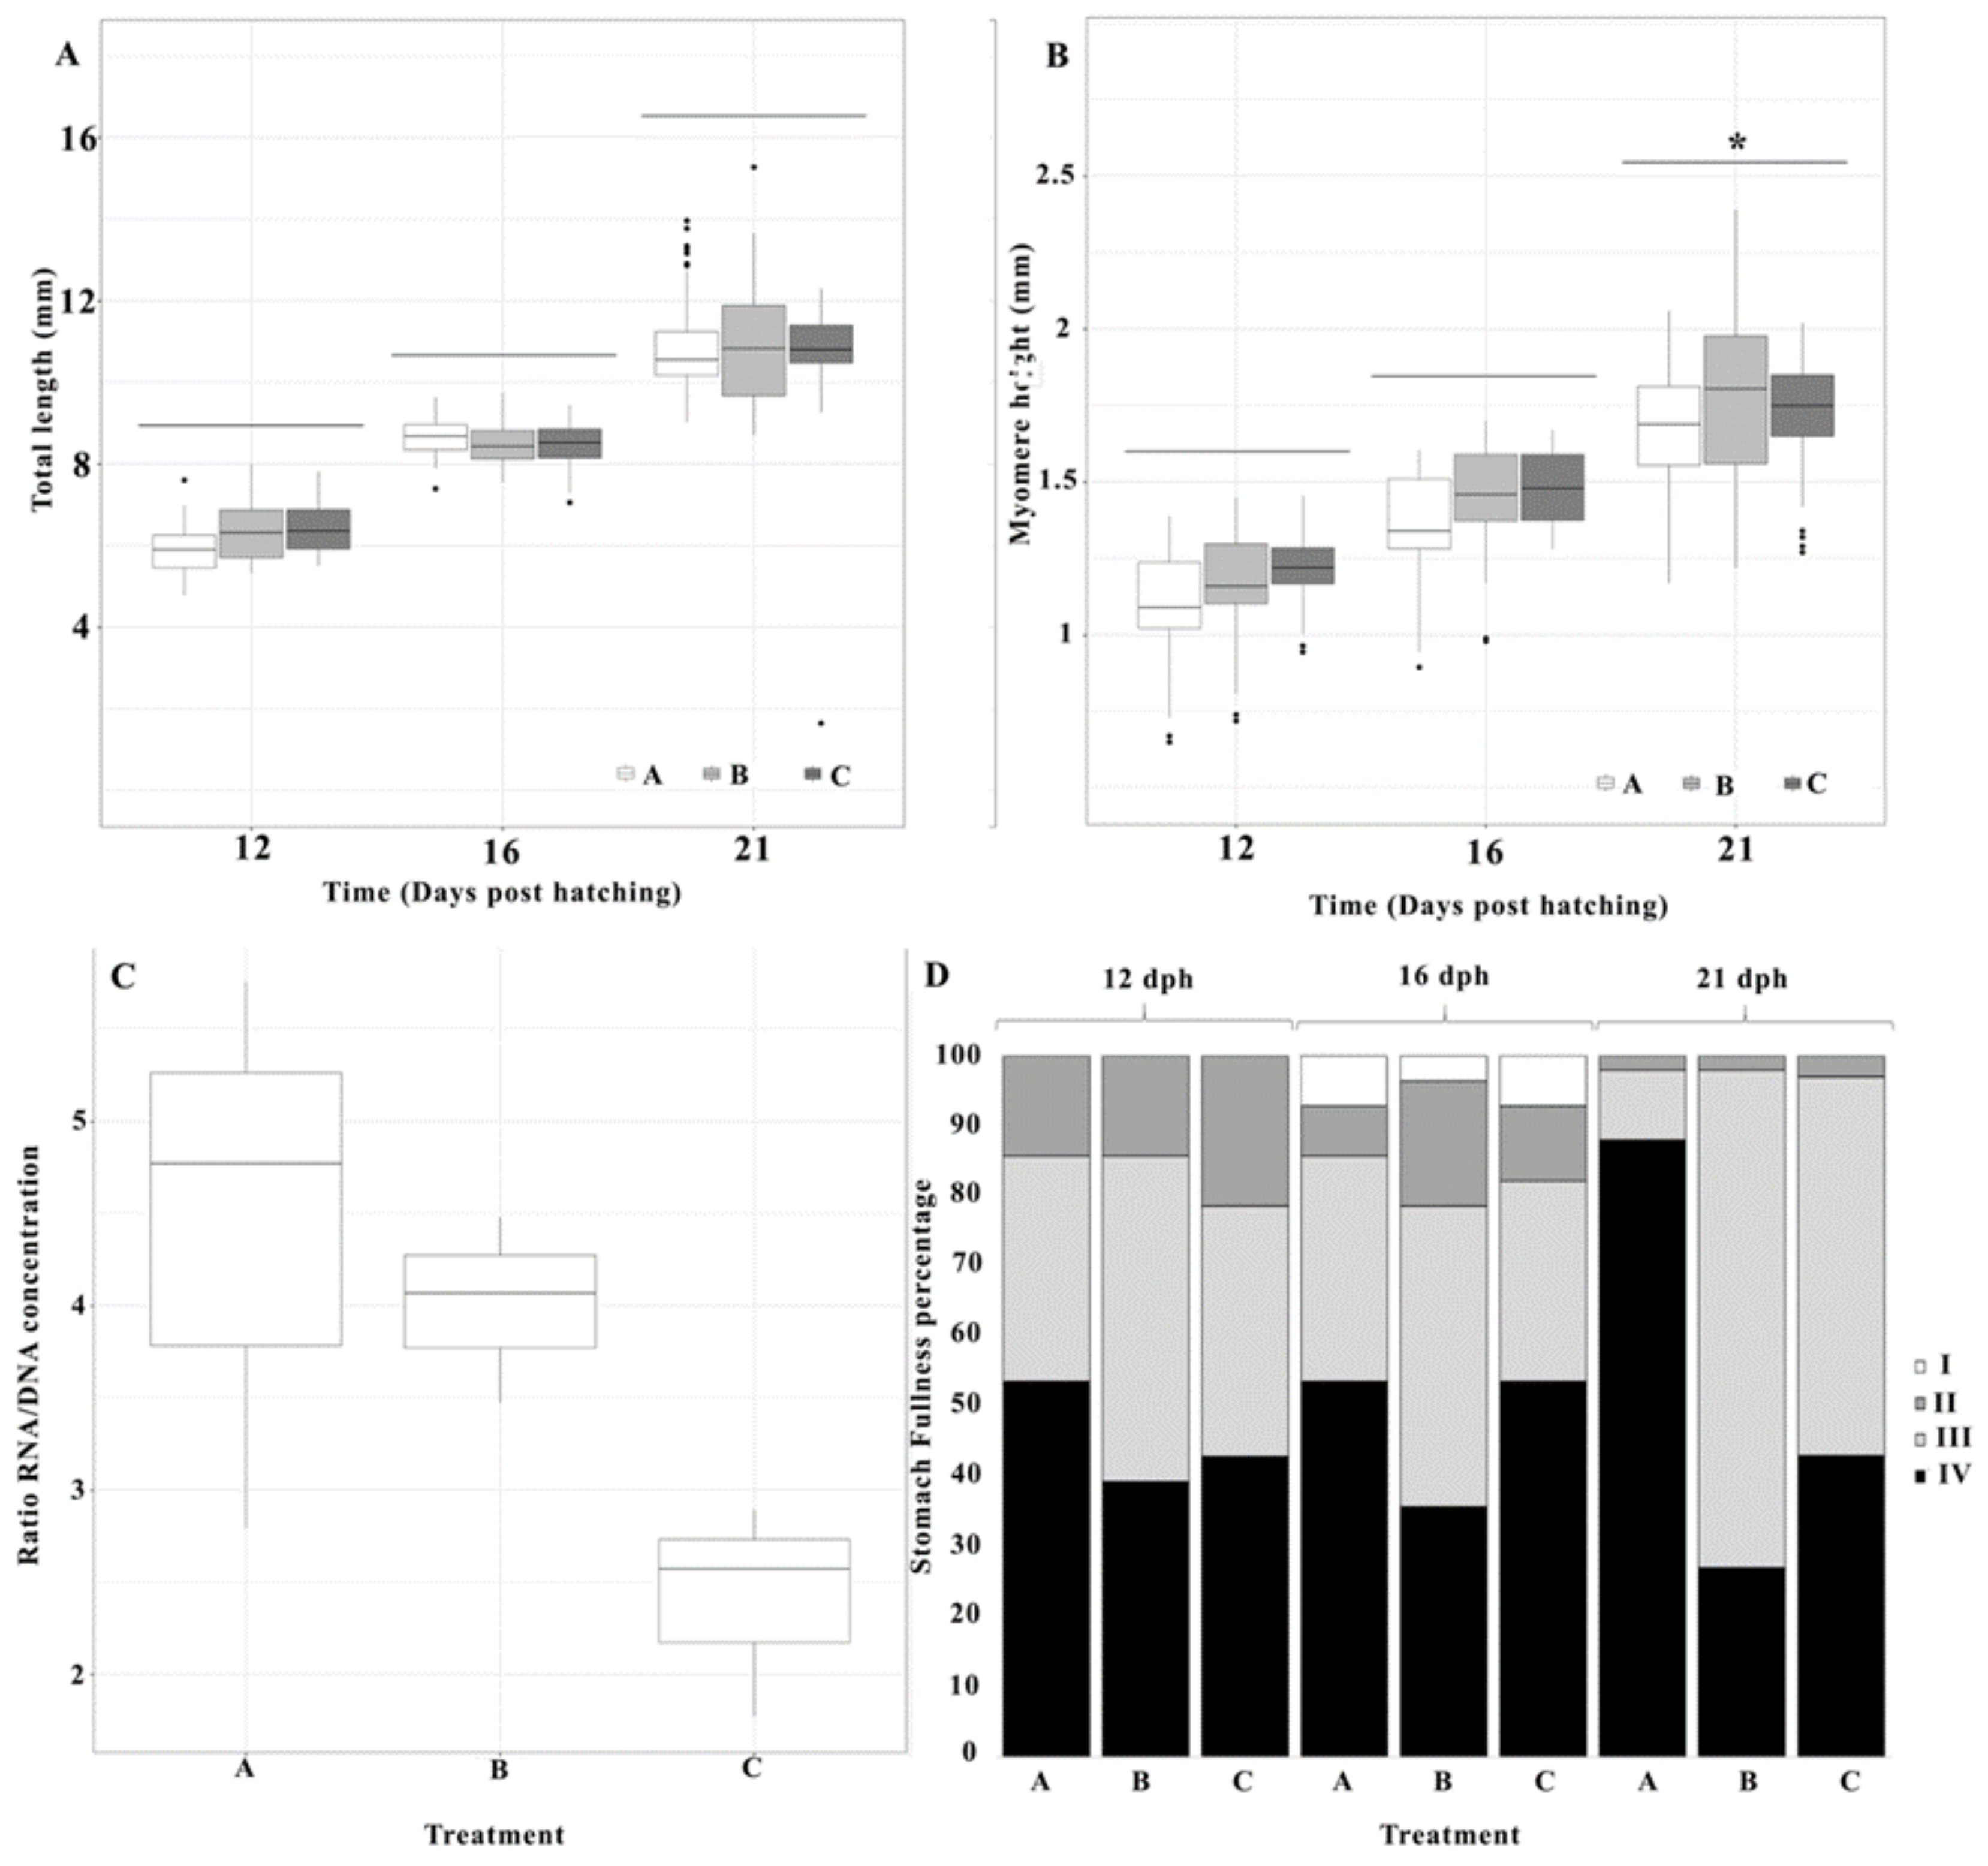
3.2. Larval Growth
3.3. RNA/DNA Ratio
3.4. Salinity Stress Tolerance
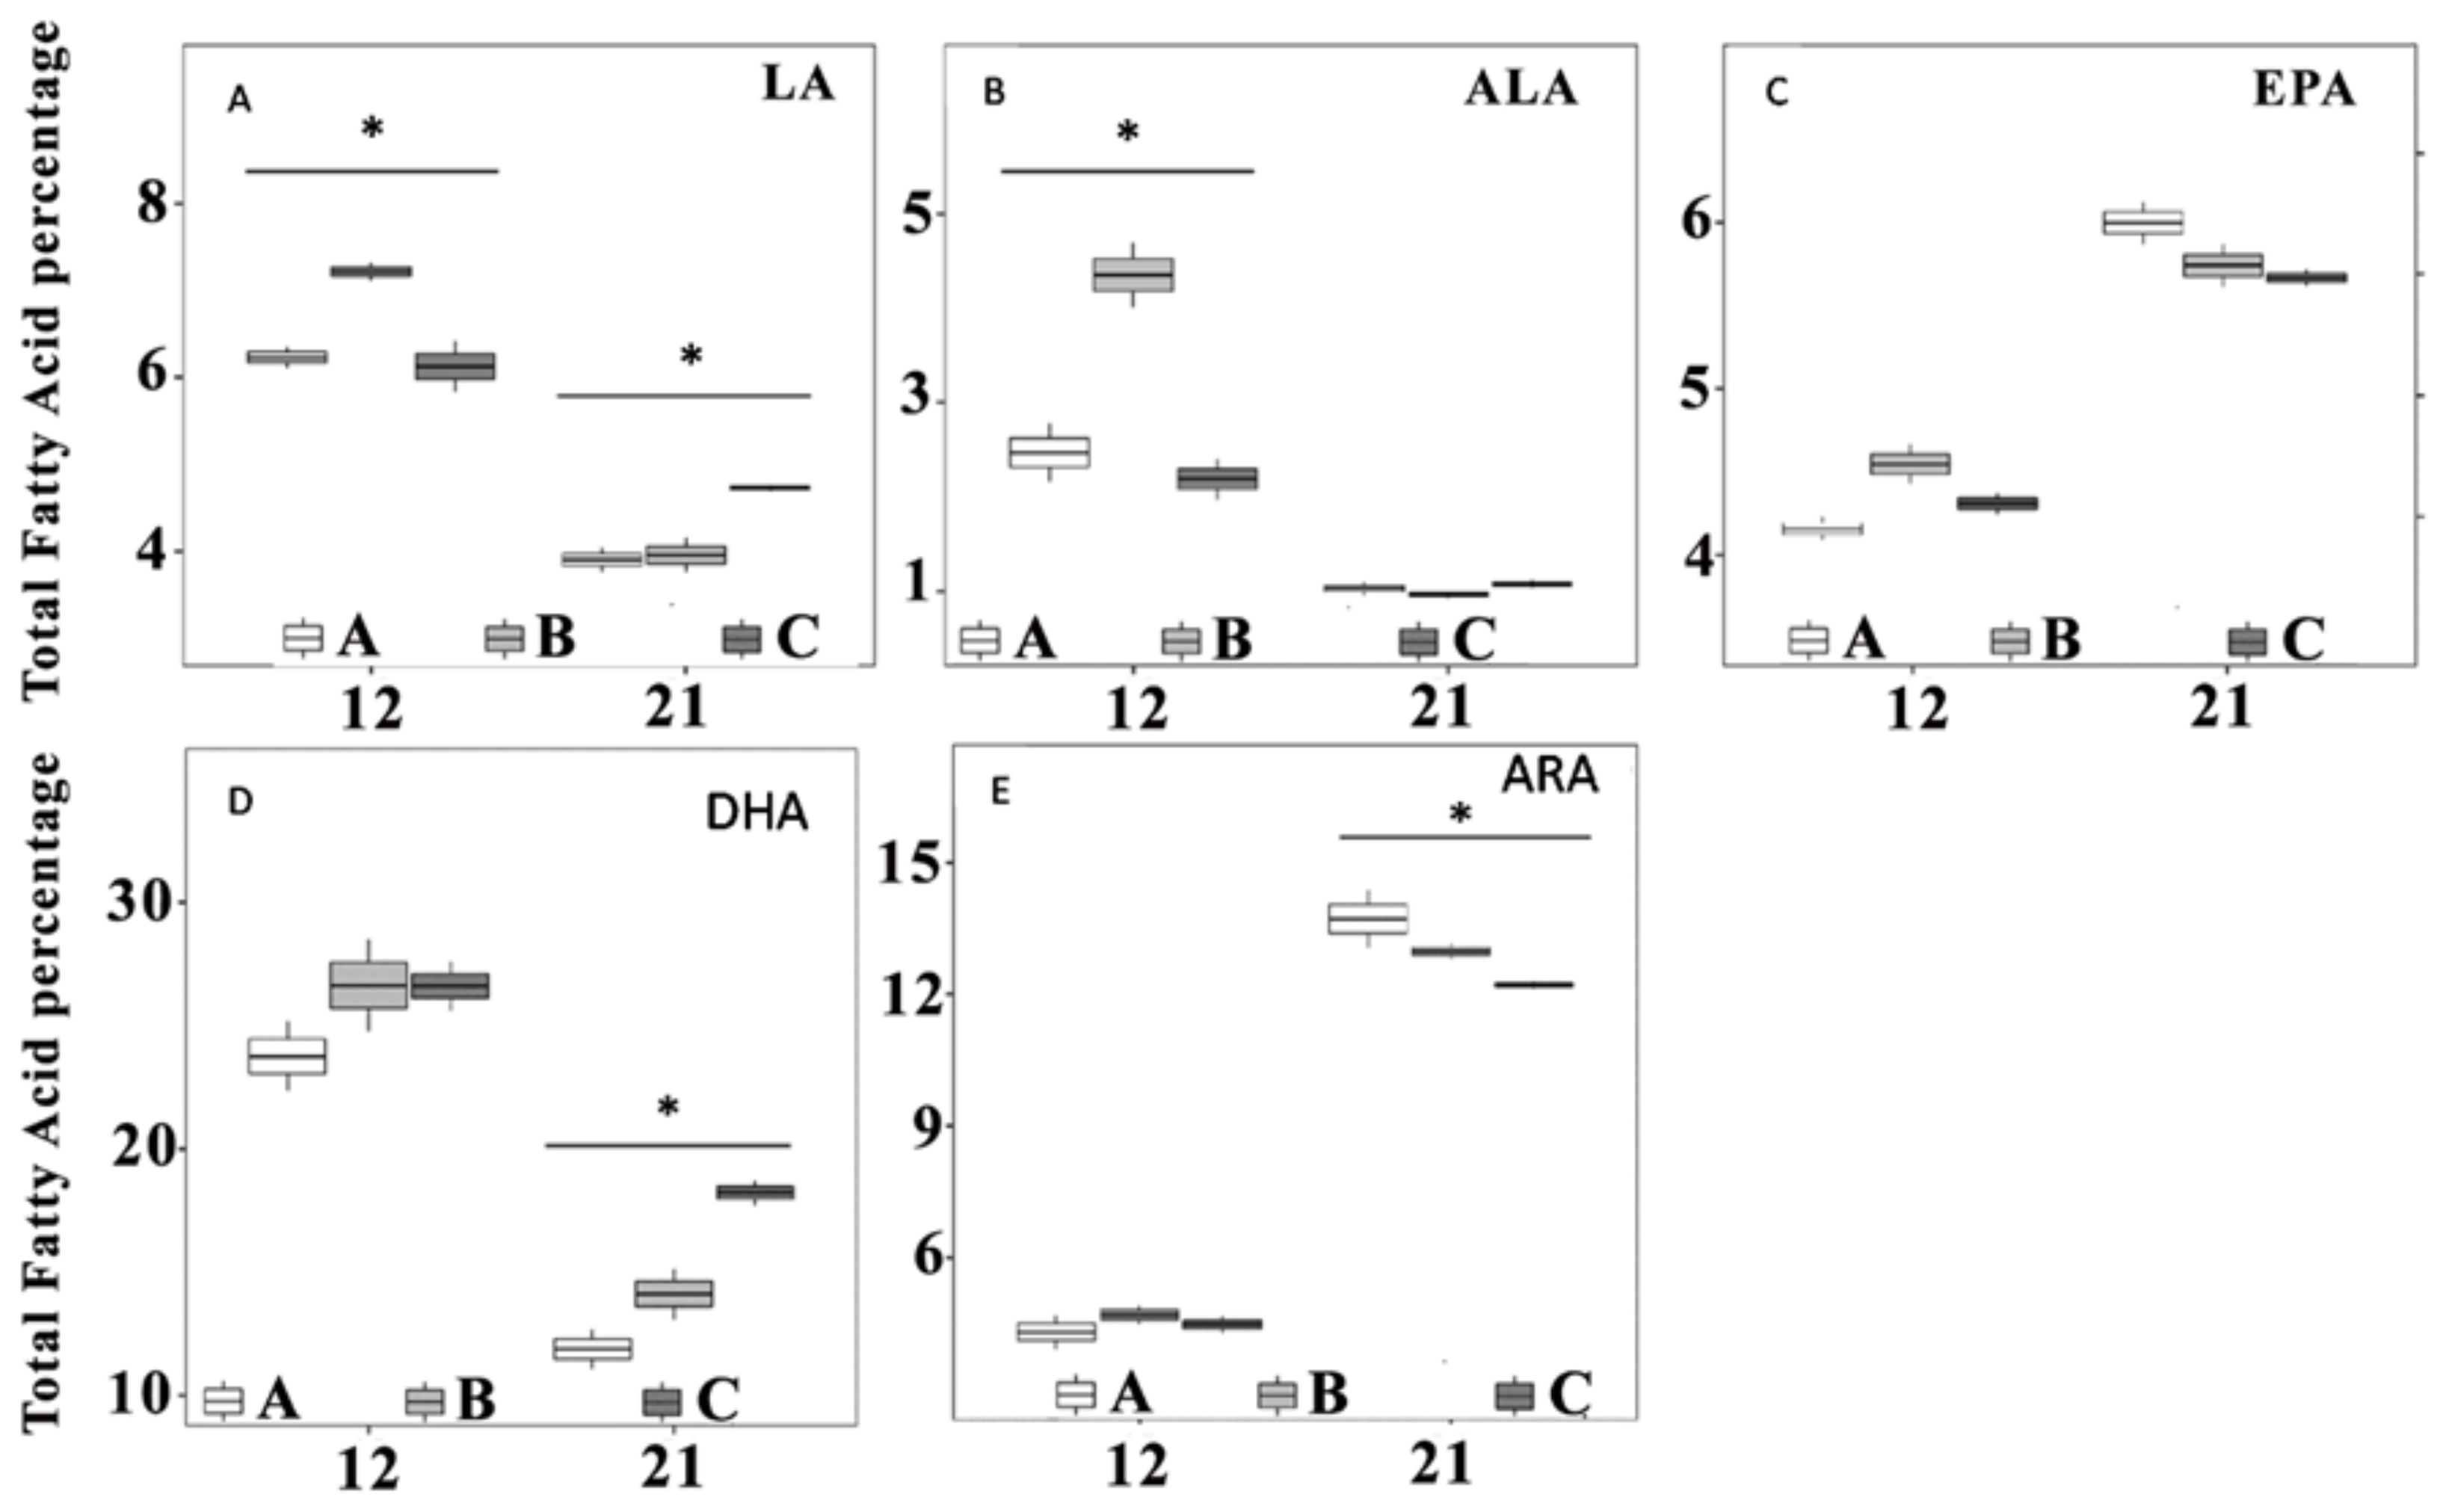
3.5. Fatty Acids
4. Discussion
5. Conclusions
Author Contributions
Funding
Acknowledgments
Conflicts of Interest
References
- Policar, T.; Schaefer, F.J.; Panana, E.; Meyer, S.; Teerlinck, S.; Toner, D.; Żarski, D. Recent progress in European percid fish culture production technology—Tackling bottlenecks. Aquac. Int. 2019, 27, 1151–1174. [Google Scholar] [CrossRef]
- FAO. The State of Food and Agriculture; FAO: Rome, Italy, 2013. [Google Scholar]
- Kestemont, P.; Dabrowski, K.; Summerfelt, R.C. Biology and Culture of Percid Fishes: Principles and Practices, 1st ed.; Springer: Dordrecht, The Netherlands, 2015. [Google Scholar]
- Policar, T.; Stejskal, V.; Kristan, J.; Podhorec, P.; Svinger, V.; Blaha, M. The effect of fish size and stocking density on the weaning success of pond-cultured pikeperch Sander lucioperca L. juveniles. Aquac. Int. 2013, 21, 869–882. [Google Scholar] [CrossRef]
- Dalsgaard, J.; Lund, I.; Thorarinsdottir, R.; Drengstig, A.; Arvonen, K. Farming different species in RAS in Nordic countries: Current status and future perspectives. Aquac. Eng. 2013, 53, 2–13. [Google Scholar] [CrossRef]
- Blecha, M.; Samarin, A.M.; Křišťan, J.; Policar, T. Benefits of hormone treatment of both sexes in semi-artificial reproduction of pikeperch (Sander lucioperca L.). Czech J. Anim. Sci. 2016, 61, 2016–2203. [Google Scholar] [CrossRef]
- Schäfer, F.J. Reproductive Management and Gamete Quality in Pikeperch (Sander lucioperca); Humboldt-Universität zu Berlin: Berlin, Germany, 2016. [Google Scholar]
- Kestemont, P.; Xueliang, X.; Hamza, N.; Maboudou, J.; Toko, I.I. Effect of weaning age and diet on pikeperch larviculture. Aquaculture 2007, 264, 197–204. [Google Scholar] [CrossRef]
- Nyina-wamwiza, L.; Xu, X.L.; Blanchard, G.; Kestemont, P. Effect of dietary protein, lipid and carbohydrate ratio on growth, feed efficiency and body composition of pikeperch Sander lucioperca fingerlings. Aquac. Res. 2005, 36, 486–492. [Google Scholar] [CrossRef]
- Schulz, C.; Böhm, M.; Wirth, M.; Rennert, B. Effect of dietary protein on growth, feed conversion, body composition and survival of pike perch fingerlings (Sander lucioperca). Aquac. Nutr. 2007, 13, 373–380. [Google Scholar] [CrossRef]
- FAO. Fisheries and Aquaculture Statistics; FAO: Rome, Italy, 2016. [Google Scholar]
- Steffens, W.; Geldhauser, F.; Gerstner, P.; Hilge, V. German experiences in the propagation and rearing of fingerling pikeperch (Stizostedion lucioperca). Ann. Zool. Fennici 1996, 33, 627–634. [Google Scholar]
- Nash, C.E.; Kuo, C.-M. Hypotheses for problems impeding the mass propagation of grey mullet and other finfish. Aquaculture 1975, 5, 119–133. [Google Scholar] [CrossRef]
- Howell, B.R. A re-appraisal of the potential of the sole, Solea solea (L.), for commercial cultivation. Aquaculture 1997, 155, 355–365. [Google Scholar] [CrossRef]
- Fuchs, J. Influence de la photoperiode sur la croissance et la survie de la larve et du juvenile de sole (Solea solea) en elevage. Aquaculture 1978, 15, 63–74. [Google Scholar] [CrossRef]
- Person-LêRuyet, J.; Verillaud, P. Techniques d’elevage intensif de la daurade doree (Sparus aurata (L.)) de la naissance a l’age de deux mois. Aquaculture 1980, 20, 351–370. [Google Scholar] [CrossRef]
- Tandler, A.; Helps, S. The effects of photoperiod and water exchange rate on growth and survival of gilthead sea bream (Sparus aurata, Linnaeus; Sparidae) from hatching to metamorphosis in mass rearing systems. Aquaculture 1985, 48, 71–82. [Google Scholar] [CrossRef]
- Girin, M. Marine fish culture in France: Recent developments. Aquaculture 1975, 5, 113. [Google Scholar] [CrossRef]
- Lubzens, E.; Tandler, A.; Minkoff, G. Rotifers as food in aquaculture. Hydrobiologia 1989, 186–187, 387–400. [Google Scholar] [CrossRef]
- Yanes-Roca, C.; Mráz, J.; Born-Torrijos, A.; Holzer, A.S.; Imentai, A.; Policar, T. Introduction of rotifers (Brachionus plicatilis) during pikeperch first feeding. Aquaculture 2018, 497, 260–268. [Google Scholar] [CrossRef]
- Brown, M.R. Nutritional value of microalgae for aquaculture. In Avances en Nutrición Acuícola VI. Memorias del VI Simposium Internacional de Nutrición Acuícola. 3 al 6 de Septiembre del 2002. Cancún, Q. Roo, México; Cruz-Suárez, L.E., Ricque-Marie, D., Tapia-Salazar, M., Gaxiola-Cortés, M.G., Eds.; Universidad Autónoma de Nuevo León: Monterrey, N.L., México, 2002. [Google Scholar]
- Spolaore, P.; Joannis-Cassan, C.; Duran, E.; Isambert, A. Commercial applications of microalgae. J. Biosci. Bioeng. 2006, 101, 87–96. [Google Scholar] [CrossRef]
- Amaro, H.M.; Guedes, A.C.; Malcata, F.X. Advances and perspectives in using microalgae to produce biodiesel. Appl. Energy 2011, 88, 3402–3410. [Google Scholar] [CrossRef]
- Maruyama, A.; Taniguchi, R.; Tanaka, H.; Ishiwata, H.; Higashihara, T. Low-temperature adaptation of deep-sea bacteria isolated from the Japan Trench. Mar. Biol. 1997, 128, 705–711. [Google Scholar] [CrossRef]
- Görs, M.; Schumann, R.; Hepperle, D.; Karsten, U. Quality analysis of commercial Chlorella products used as dietary supplement in human nutrition. J. Appl. Phycol. 2010, 22, 265–276. [Google Scholar] [CrossRef]
- Nematipour, G.R.; Nakagawa, H.; Nanba, K.; Kasahara, S.; Tsujimura, A.; Akira, K. Effect of Chlorella-extract supplement to diet on lipid accumulation of ayu. Nippon Suisan Gakkaishi 1987, 53, 1687–1692. [Google Scholar] [CrossRef]
- Bai, S.C.; Koo, J.; Kim, K.; Kim, S. Effects of Chlorella powder as a feed additive on growth performance in juvenile Korean rockfish, Sebastes schlegeli (Hilgendorf). Aquac. Res. 2001, 32, 92–98. [Google Scholar] [CrossRef]
- Nakagawa, H.; Umino, T.; Tasaka, Y. Usefulness of Ascophyllum meal as a feed additive for red sea bream, Pagrus major. Aquaculture 1997, 151, 275–281. [Google Scholar] [CrossRef]
- Malinovskyi, O.; Veselý, L.; Blecha, M.; Křišťan, J.; Policar, T. The substrate selection and spawning behaviour of pikeperch Sander lucioperca L. broodstock under pond conditions. Aquac. Res. 2018, 49, 3541–3547. [Google Scholar] [CrossRef]
- Malinovskyi, O.; Kolářová, J.; Blecha, M.; Stará, A.; Velíšek, J.; Křišťan, J.; Policar, T. Behavior and physiological status of pond-cultured pikeperch (Sander lucioperca) broodstock effected by sexual interactions throughout semi-artificial reproduction. Aquac. Int. 2019, 27, 1093–1107. [Google Scholar] [CrossRef]
- Blecha, M.; Kristan, J.; Samarin, A.M.; Rodina, M.; Policar, T. Quality and quantity of pikeperch (Sander lucioperca) spermatozoa after varying cold water treatments. J. Appl. Ichthyol. 2015, 31, 75–78. [Google Scholar] [CrossRef]
- Samarin, M.A.; Blecha, M.; Bytyutskyy, D.; Policar, T. Post-ovulatory oocyte ageing in pikeperch (Sander lucioperca L.) and its effect on egg viability rates and the occurrence of larval malformations and ploidy anomalies. Turkish J. Fish. Aquat. Sci. 2015, 15, 429–435. [Google Scholar] [CrossRef]
- Křištan, T.; Alavi, J.; Stejskal, S.M.H.; Policar, V. Hormonal induction of ovulation in pikeperch (Sander lucioperca L.) using human chorionic gonadotropin (hCG) and mammalian GnRH analogue. Aquac. Int. 2013, 21, 811–818. [Google Scholar] [CrossRef]
- Křištan, J.; Stara, J.; Polgesek, A.; Drasovean, M.; Kolarova, A.; Priborsky, J.; Blecha, J.; Svacina, M.; Policar, P.; Velisek, T. Efficacy of different anaesthetics for pikeperch (Sander lucioperca L.) in relation to water temperature. Neuroendocrinol. Lett. 2014, 35, 81–85. [Google Scholar]
- Hara, A.; Radin, N.S. Lipid extraction of tissues with a low-toxicity solvent. Anal. Biochem. 1978, 90, 420–426. [Google Scholar] [CrossRef]
- Appelqvist, L.-A. Lipids in Cruciferae: III. Fatty Acid Composition of Diploid and Tetraploid Seeds of Brassica campestris and Sinapis alba Grown under Two Climatic Extremes. Physiol. Plant. 1968, 21, 615–625. [Google Scholar] [CrossRef]
- Bates, D.; Mächler, M.; Bolker, B.; Walker, S. Fitting Linear Mixed-Effects Models using lme4. J. Stat. Softw. 2014, 67, 1. [Google Scholar]
- Fox, J.; Weisberg, S. An R Companion to Applied Regression, 2nd ed.; Sage: Thousand Oaks, CA, USA, 2011. [Google Scholar]
- Hothorn, T.; Bretz, F.; Westfall, P. Simultaneous inference in general parametric models. Biometrical J. 2008, 50, 346–363. [Google Scholar] [CrossRef] [PubMed]
- Tielmann, M.; Schulz, C.; Meyer, S. The effect of light intensity on performance of larval pike-perch (Sander lucioperca). Aquac. Eng. 2017, 77, 61–71. [Google Scholar] [CrossRef]
- Therneau, T.M.; Grambsch, P.M. Testing Proportional Hazards; Springer: New York, NY, USA, 2000; pp. 127–152. [Google Scholar]
- R Core Team. A Language and Environment for Statistical Computing. 2014. Available online: https://scholar.google.com/citations?user=yvS1QUEAAAAJ&hl=en&oi=sra (accessed on 1 March 2018).
- Dabrowski, K.; Bardega, R. Mouth size and predicted food size preferences of larvae of three cyprinid fish species. Aquaculture 1984, 40, 41–46. [Google Scholar] [CrossRef]
- Ghan, D.; Sprules, W.G. Diet, prey selection, and growth of larval and juvenile burbot Lota lota (L.). J. Fish Biol. 1993, 42, 47–64. [Google Scholar] [CrossRef]
- Fehér, M.; Baranyai, E.; Simon, E.; Bársony, P.; Sz, I.; Posta, J.; Stündl, L. The interactive effect of cobalt enrichment in Artemia on the survival and larval growth of barramundi, Lates calcarifer. Aquaculture 2013, 414–415, 92–99. [Google Scholar] [CrossRef]
- Lund, I.; Steenfeldt, S.J. The effects of dietary long-chain essential fatty acids on growth and stress tolerance in pikeperch larvae (Sander lucioperca L.). Aquac. Nutr. 2011, 17, 191–199. [Google Scholar] [CrossRef]
- Lund, I.; Vilhelm, P.; Winding, B. Comparative Biochemistry and Physiology, Part A Dietary supplementation of essential fatty acids in larval pikeperch (Sander lucioperca); short and long term effects on stress tolerance and metabolic physiology. Comp. Biochem. Physiol. Part A 2012, 162, 340–348. [Google Scholar] [CrossRef]
- Castell, J.D.; Sinnhuber, R.O.; Wales, J.H.; Lee, D.J. Essential fatty acids in the diet of rainbow trout (Salmo gairdneri): Growth, feed conversion and some gross deficiency symptoms. J. Nutr. 1972, 102, 77–85. [Google Scholar] [CrossRef]
- Watanabe, T. Importance of docosahexaenoic acid in marine larval fish. J. World Aquac. Soc. 1993, 24, 152–161. [Google Scholar] [CrossRef]
- Tocher, D.R. Fatty acid requirements in ontogeny of marine and freshwater fish. Aquac. Res. 2010, 41, 717–732. [Google Scholar] [CrossRef]
- Rønnestad, I.; Thorsen, A.; Finn, R.N. Fish larval nutrition: A review of recent advances in the roles of amino acids. Aquaculture 1999, 177, 201–216. [Google Scholar] [CrossRef]
- Finn, R.; Rønnestad, I.; van der Meeren, T.; Fyhn, H. Fuel and metabolic scaling during the early life stages of Atlantic cod Gadus morhua. Mar. Ecol. Prog. Ser. 2002, 243, 217–234. [Google Scholar] [CrossRef]
- Watanabe, T. Lipid nutrition in fish. Comp. Biochem. Physiol. Part B Comp. Biochem. 1982, 73, 3–15. [Google Scholar] [CrossRef]
- Lochmann, R.T.; Gatlin, D.M. Essential fatty acid requirement of juvenile red drum (Sciaenops ocellatus). Fish Physiol. Biochem. 1993, 12, 221–235. [Google Scholar] [CrossRef]
- Williams, K.C.; Barlow, C.G.; Rodgers, L.; Agcopra, C. Dietary composition manipulation to enhance the performance of juvenile barramundi (Lates calcarifer Bloch) reared in cool water. Aquac. Res. 2006, 37, 914–927. [Google Scholar] [CrossRef]
- Dhert, P.; Lavens, P.; Sorgeloos, P. Stress evaluation: A tool for quality control of hatchery-produced shrimp and fish fry. Aquac. Eur. 1992, 17, 6–10. [Google Scholar]
- Sakakura, Y.; Shiotani, S.; Chuda, H.; Hagiwara, A. Flow field control for larviculture of the seven-band grouper Epinephelus septemfasciatus. Aquaculture 2007, 268, 209–215. [Google Scholar] [CrossRef]
- Dhert, P.; Lim, L.C.; Lavens, P.; Chao, T.M.; Chou, R.; Sorgeloos, P. Effect of dietary essential fatty acids on egg quality and larviculture success of the greasy grouper (Epinephelus tauvina F.): Preliminary results. In Larvi’91—Fish & Crustacean Larviculture Symposium, European Aquaculture Society, Special Publication No. 15; Lavens, P., Sorgeloos, P., Jaspers, E., Otlevier, F., Eds.; European Aquaculture Society: Gent, Belgium, 1991; pp. 51–55. [Google Scholar]
- Sinnhuber, R. The role of fats. In Fish in Research; Neuhaus, O.W., Halver, J.E., Eds.; Academic Press: New York, NY, USA, 1969; pp. 245–261. [Google Scholar]
- Lund, I.; El Kertaoui, N.; Izquierdo, M.S.; Dominguez, D.; Hansen, B.W.; Kestemont, P. The importance of phospholipids combined with long-chain PUFA in formulated diets for pikeperch (Sander lucioperca) larvae. Br. J. Nutr. 2018, 120, 628–644. [Google Scholar] [CrossRef]
- Abi-Ayad, S.-M.E.-A.; Boutiba, Z.; Mélard, C.; Kestemont, P. Dynamics of Total Body Fatty Acids During Early Ontogeny of Pikeperch (Sander lucioperca) Larvae. Fish Physiol. Biochem. 2004, 30, 129–136. [Google Scholar] [CrossRef]
- Henderson, R.J.; Park, M.T.; Sargent, J.R. The desaturation and elongation of 14C-labelled polyunsaturated fatty acids by pike (Esox lucius L.) in vivo. Fish Physiol. Biochem. 1995, 14, 223–235. [Google Scholar] [CrossRef] [PubMed]


| Items | Live Feed Total FA % Used for Trial | ||||
|---|---|---|---|---|---|
| FA [%] | ROT (A) | ROT (B) | ROT (C) | ART (A) | ART (C) |
| C14:0 | 2.93 ± 0.62 | 1.87 ± 0.24 | 1.77 ± 0.11 | 2.60 ± 0.13 | 2.35 ± 0.15 |
| C14:1 | 1.24 ± 0.12 | 0.64 ± 0.16 | 0.60 ± 0.03 | 1.09 ± 0.04 | 0.77 ± 0.03 |
| C16:0 | 20.23 ± 0.10 | 18.51 ± 5.41 | 22.95 ± 0.26 | 16.03 ± 0.44 | 17.14 ± 0.50 |
| C16:1 | 10.41 ± 0.23 | 2.04 ± 0.11 | 2.11 ± 0.18 | 16.01 ± 0.46 | 12.54 ± 0.37 |
| C18:0 | 7.08 ± 0.14 | 4.07 ± 0.29 | 4.20 ± 0.02 | 5.22 ± 0.19 | 4.75 ± 0.10 |
| C18:1n-9 | 4.89 ± 1.28 | 0.68 ± 0.07 | 0.86 ± 0.31 | 18.17 ± 0.27 | 17.06 ± 0.39 |
| C18:1n-7 | 2.80 ± 0.11 | 2.38 ± 0.00 | 2.38 ± 0.17 | 13.05 ± 0.81 | 12.31 ± 0.22 |
| C18:2n-6 | 13.97 ± 0.46 | 25.70 ± 2.06 | 24.19 ± 0.08 | 5.24 ± 2.65 | 5.28 ± 0.13 |
| C18:3n-3 | 11.17 ± 0.42 | 36.42 ± 2.79 | 34.10 ± 0.90 | 2.10 ± 0.04 | 2.02 ± 0.25 |
| C20:0 | 0.00 ± 0.00 | 0.00 ± 0.00 | 0.07 ± 0.10 | 0.08 ± 0.01 | 0.00 ± 0.00 |
| C20:1n-9 | 1.12 ± 0.16 | 1.02 ± 0.03 | 0.86 ± 0.08 | 0.38 ± 0.05 | 0.36 ± 0.02 |
| C20:4n-6 | 2.90 ±0.20 | 1.30 ± 0.16 | 1.03 ± 0.14 | 4.00 ± 0.28 | 3.70 ± 0.23 |
| C20:3n-3 | 0.96 ± 0.08 | 1.89 ± 0.01 | 1.72 ± 0.11 | 0.03 ± 0.01 | 0.00 ± 0.00 |
| C20:5n-3 | 10.73 ± 0.38 | 1.87 ± 0.02 | 1.72 ± 0.00 | 15.66 ± 1.12 | 15.20 ± 0.48 |
| C22:0 | 1.08 ± 0.08 | 0.33 ± 0.07 | 0.30 ± 0.01 | 0.08 ± 0.02 | 0.32 ± 0.01 |
| C22:1 | 0.22 ± 0.20 | 0.25 ± 0.11 | 0.07 ± 0.09 | 0.00 ± 0.00 | 0.00 ± 0.00 |
| C22:5n-3 | 4.93 ± 0.16 | 1.05 ± 0.13 | 1.09 ± 0.04 | 0.10 ± 0.01 | 0.00 ± 0.00 |
| C22:6n-3 | 2.09 ± 0.08 | 0.00 ± 0.00 | 6.50 ± 0.24 | 0.07 ± 0.02 | 6.21 ± 0.18 |
| C24:1 | 0.09 ± 0.16 | 0.00 ± 0.00 | 0.00 ± 0.00 | 0.00 ± 0.00 | 0.00 ± 0.00 |
| SFA | 31.33 ± 0.62 | 24.77 ± 4.95 | 29.28 ± 0.30 | 24.09 ± 0.48 | 24.55 ± 0.76 |
| MUFA | 20.77 ± 1.43 | 7.01 ± 0.11 | 6.87 ± 0.67 | 48.71 ± 1.27 | 43.04 ± 0.25 |
| PUFA | 47.90 ± 1.95 | 68.22 ± 4.84 | 63.85 ± 0.97 | 27.21 ± 1.60 | 32.41 ± 0.51 |
| n-3 | 29.88 ± 1.01 | 41.23 ± 2.63 | 38.63 ± 0.75 | 17.89 ± 1.09 | 23.43 ± 0.41 |
| n-6 | 18.03 ± 0.95 | 26.99 ± 2.21 | 25.22 ± 0.22 | 9.31 ± 2.4 | 8.98 ± 0.10 |
| n-3/n-6 | 1.66 ± 0.03 | 1.53 ± 0.03 | 1.53 ± 0.02 | 2.01 ± 0.5 | 2.61 ± 0.02 |
| Items | Larval Total FA % at 12 dph | Larval Total FA % at 21 dph | ||||
|---|---|---|---|---|---|---|
| FA [%] | CON 12 (A) | CHLO 12 (B) | SP 12 (C) | CON 21 (A) | CHLO 21 (B) | SP 21 (C) |
| C14:0 | 0.89 ± 0.03 | 0.72 ± 0.06 | 0.56 ± 0.04 | 0.88 ± 0.20 | 0.74 ± 0.01 | 0.85 ± 0.04 |
| C14:1 | 0.18 ± 0.01 | 0.13 ± 0.18 | 0.00 ± 0.00 | 0.33 ± 0.03 | 0.42 ± 0.06 | 0.36 ± 0.03 |
| C16:0 | 23.44 ± 1.70 | 21.74 ± 1.49 | 22.01 ± 0.39 | 15.98 ± 0.23 | 16.16 ± 0.36 | 15.37 ± 0.24 |
| C16:1 | 4.28 ± 0.07 | 3.53 ± 0.16 | 3.66 ± 0.27 | 5.99 ± 0.07 | 5.80 ± 0.00 | 6.08 ± 0.15 |
| C18:0 | 9.77 ± 0.62 | 9.34 ± 0.63 | 9.84 ± 0.21 | 7.94 ± 0.03 | 7.65 ± 0.41 | 7.11 ± 0.06 |
| C18:1n-9 | 12.75 ± 0.80 | 10.90 ± 0.02 | 11.96 ± 0.52 | 15.42 ± 0.01 | 15.51 ± 0.36 | 14.40 ± 0.17 |
| C18:1n-7 | 3.46 ± 0.13 | 3.43 ± 0.23 | 3.55 ± 0.22 | 11.42 ± 0.31 | 11.10 ± 0.50 | 10.15 ± 0.57 |
| C18:2n-6 | 6.23 ± 0.17 | 7.22 ± 0.14 | 6.12 ± 0.41 | 3.90 ± 0.20 | 3.96 ± 0.28 | 4.73 ± 0.05 |
| C18:3n-3 | 2.47 ± 0.44 | 4.35 ± 0.49 | 2.19 ± 0.30 | 1.03 ± 0.09 | 0.96 ± 0.05 | 1.08 ± 0.06 |
| C20:0 | 0.17 ± 0.08 | 0.00 ± 0.00 | 0.30 ± 0.02 | 0.12 ± 0.17 | 0.00 ± 0.00 | 0.40 ± 0.01 |
| C20:1n-9 | 0.64 ± 0.45 | 0.46 ± 0.16 | 0.57 ± 0.06 | 0.78 ± 0.38 | 0.55 ± 0.11 | 0.25 ± 0.05 |
| C20:4n-6 | 4.97 ± 0.04 | 4.55 ± 0.03 | 5.43 ± 0.24 | 6.00 ± 0.18 | 5.32 ± 0.18 | 5.25 ± 0.07 |
| C20:3n-3 | 0.00 ± 0.00 | 0.00 ± 0.00 | 0.17 ± 0.01 | 0.00 ± 0.00 | 0.00 ± 0.00 | 0.00 ± 0.00 |
| C20:5n-3 | 4.18 ± 0.53 | 4.57 ± 0.29 | 4.34 ± 0.27 | 13.72 ± 0.92 | 12.98 ± 0.24 | 12.22 ± 0.10 |
| C22:0 | 0.47 ± 0.23 | 0.00 ± 0.00 | 0.10 ± 0.14 | 0.58 ± 0.28 | 0.89 ± 0.07 | 0.76 ± 0.05 |
| C22:1 | 0.00 ± 0.00 | 0.00 ± 0.00 | 0.00 ± 0.00 | 0.04 ± 0.06 | 0.00 ± 0.00 | 0.00 ± 0.00 |
| C22:5n-3 | 2.32 ± 0.21 | 2.43 ± 0.22 | 2.56 ± 0.23 | 4.31 ± 0.38 | 4.18 ± 0.45 | 3.12 ± 0.21 |
| C22:6n-3 | 23.76 ± 1.98 | 26.63 ± 2.63 | 26.61 ± 1.42 | 11.54 ± 1.13 | 13.77 ± 1.42 | 17.88 ± 0.71 |
| C24:1 | 0.00 ± 0.00 | 0.00 ± 0.00 | 0.00 ± 0.00 | 0.01 ± 0.01 | 0.00 ± 0.00 | 0.00 ± 0.00 |
| SFA | 34.75 ± 2.05 | 31.80 ± 2.07 | 32.82 ± 0.38 | 25.50 ± 0.11 | 25.44 ± 0.69 | 24.49 ± 0.38 |
| MUFA | 21.32 ± 1.32 | 18.45 ± 0.76 | 19.76 ± 1.08 | 34.00 ± 0.05 | 33.39 ± 0.18 | 31.25 ± 1.08 |
| PUFA | 43.93 ± 3.37 | 49.75 ± 2.83 | 47.43 ± 1.46 | 40.49 ± 0.06 | 41.17 ± 0.87 | 44.26 ± 1.46 |
| n-3 | 32.73 ± 3.16 | 37.98 ± 2.65 | 35.87 ± 1.63 | 30.59 ± 0.08 | 31.89 ± 0.77 | 34.29 ± 1.63 |
| n-6 | 11.20 ± 0.21 | 11.76 ± 0.18 | 11.55 ± 0.17 | 9.90 ± 0.02 | 9.27± 0.10 | 9.98 ± 0.17 |
| n-3/n-6 | 2.92 ± 0.23 | 3.23 ± 0.18 | 3.11 ± 0.19 | 3.09 ± 0.01 | 3.44 ± 0.05 | 3.44 ± 0.19 |
© 2020 by the authors. Licensee MDPI, Basel, Switzerland. This article is an open access article distributed under the terms and conditions of the Creative Commons Attribution (CC BY) license (http://creativecommons.org/licenses/by/4.0/).
Share and Cite
Yanes-Roca, C.; Holzer, A.; Mraz, J.; Veselý, L.; Malinovskyi, O.; Policar, T. Improvements on Live Feed Enrichments for Pikeperch (Sander lucioperca) Larval Culture. Animals 2020, 10, 401. https://doi.org/10.3390/ani10030401
Yanes-Roca C, Holzer A, Mraz J, Veselý L, Malinovskyi O, Policar T. Improvements on Live Feed Enrichments for Pikeperch (Sander lucioperca) Larval Culture. Animals. 2020; 10(3):401. https://doi.org/10.3390/ani10030401
Chicago/Turabian StyleYanes-Roca, Carlos, Astrid Holzer, Jan Mraz, Lukas Veselý, Oleksandr Malinovskyi, and Tomas Policar. 2020. "Improvements on Live Feed Enrichments for Pikeperch (Sander lucioperca) Larval Culture" Animals 10, no. 3: 401. https://doi.org/10.3390/ani10030401
APA StyleYanes-Roca, C., Holzer, A., Mraz, J., Veselý, L., Malinovskyi, O., & Policar, T. (2020). Improvements on Live Feed Enrichments for Pikeperch (Sander lucioperca) Larval Culture. Animals, 10(3), 401. https://doi.org/10.3390/ani10030401