Article

Dietary D-Ribose Supplementation in Sheep: Implications on Rumen, Fecal Microbiota, and Metabolic Function

Jiangxi Province Key Laboratory of Animal Nutrition and Feed, College of Animal Science and Technology, Jiangxi Agricultural University, Nanchang 330045, China
*
Authors to whom correspondence should be addressed.
Microorganisms 2025, 13(11), 2505; https://doi.org/10.3390/microorganisms13112505
Submission received: 9 October 2025 / Revised: 30 October 2025 / Accepted: 30 October 2025 / Published: 31 October 2025
(This article belongs to the Section Gut Microbiota)

Abstract

The objective of this study was to investigate the effects of dietary D-ribose supplementation on the microbial diversity, community composition, and metabolic function of the rumen and fecal microbiota in Hu sheep. Eighteen sheep with similar body weights (20.47 ± 0.58 kg) were selected and randomly divided into two groups, with nine sheep in each group. One group was fed a basal diet (Control), while the other group was supplemented with 300 mg kg−1 of D-ribose in addition to the basal diet (D-Ribose). The results showed that D-ribose supplementation had no significant effect on the richness, diversity, or evenness of the rumen and fecal microbiota (p > 0.05). D-ribose supplementation lowered the relative abundance of Cyanobacteria in the rumen while increasing that of Herbivorax and Faecalibacterium (p < 0.05). In feces, it decreased the relative abundances of Verrucomicrobia, Candidatus Saccharibacteria, Bifidobacterium, and Caproiciproducens, while increasing that of Lawsonibacter and Massilioclostridium (p < 0.05). Non-metric multidimensional scaling (NMDS) analysis of the rumen microbiota revealed a significant overlap between the Control and D-Ribose groups, and analysis of similarities (ANOSIM) showed no significant differences between the two groups (R = 0.079, p = 0.115). In contrast, NMDS analysis of the fecal microbiota showed partial overlap between the two groups, and ANOSIM indicated a significant difference between the Control and D-Ribose groups (R = 0.203, p = 0.017). Dietary D-ribose supplementation had no significant effect on any metabolic function with relative abundance greater than 1% in both the rumen and fecal microbiota (p > 0.05). The results indicated that dietary D-ribose supplementation did not affect the microbial diversity and metabolic function of the rumen and fecal microbiota but altered the relative abundances of certain bacterial genera. This study provides a perspective on rumen and fecal microbiota to more comprehensively evaluate the effects of dietary D-ribose supplementation on ruminants and offers data support for the application of D-ribose in ruminant production.

1. Introduction

In the intricate landscape of ruminant nutrition, optimizing growth performance is a complex challenge that hinges on the delicate balance between feed intake, nutrient absorption, and metabolic efficiency [1]. Feed additives have emerged as essential tools for modulating these processes with precision [2]. A wide array of compounds are employed to enhance rumen fermentation, improve feed digestibility, and bolster overall animal health [3]. Against this backdrop, D-ribose has gathered considerable attention as a potential growth promoter. As a pentose sugar, D-ribose occupies a central role in the pentose phosphate pathway, catalyzing rapid nucleotide synthesis and energy generation [4]. However, its importance transcends these well-documented metabolic roles. Recent microbiological research has unveiled that D-ribose can function as a quorum sensing inhibitor [5]. Quorum sensing (QS) is a sophisticated communication system among rumen microbes that orchestrates their collective behavior, including biofilm formation and fermentation pathways [6]. By interfering with these signaling pathways, D-ribose has the potential to reshape the microbial community structure and function, redirecting fermentation processes toward more host-beneficial outcomes [5]. This dual capacity of D-ribose, serving both as a metabolic precursor and a microbial modulator, makes it a promising candidate for enhancing growth performance in ruminants. A comprehensive elucidation of the synergistic interplay between its biochemical and microbiological effects is imperative for maximizing its potential application in ruminant nutrition.
The rumen microbiome stands as a fundamental pillar of ruminant nutrition, driving the fermentation processes that transform fibrous plant materials into bioavailable nutrients [7]. This intricate microbial ecosystem, encompassing bacteria, protozoa, fungi, archaea, and phages, is indispensable for efficient feed utilization and overall animal health. Its ability to degrade cellulose and hemicellulose into volatile fatty acids (VFA) and microbial protein endows ruminants with a distinct nutritional advantage [8]. Given its central role, a comprehensive understanding of the rumen microbiome is essential for assessing the effectiveness of feed additives. D-ribose has been shown to impact the composition and metabolism of gut microbiota, as demonstrated in studies involving non-ruminant models [9]. These investigations have revealed that D-ribose can modify microbial communities and influence metabolic pathways, particularly those associated with lipid metabolism and gut barrier function [10]. Our prior research has demonstrated that D-ribose holds potential for enhancing growth performance and overall health in ruminants [11]. However, the mechanisms through which D-ribose influences the rumen microbial community remain to be elucidated. Therefore, it is imperative to investigate how D-ribose modulates the rumen microbiome, potentially uncovering its role as a microbial modulator. Elucidating these interactions will provide critical insights into optimizing feed additives, thereby improving ruminant nutrition and performance.
In ruminants, the hindgut microbiota plays a vital role in fermenting fibrous materials that evade rumen digestion and synthesizing essential nutrients, such as vitamins and short-chain fatty acids [12]. Moreover, the fecal microbiota is crucial for maintaining gut health by supporting a balanced immune response and preventing pathogen colonization [13]. As a result, the fecal microbiota serves as a key indicator of overall gastrointestinal health and digestive efficiency. While feed additives are primarily designed to enhance rumen fermentation and improve feed digestibility, their impact on the fecal microbiota can offer further insights into their efficacy [14]. Previous studies have shown that incorporating feed additives, such as rumen-protected glucose and yeast culture, into the diet can notably reshape the fecal microbial profile [15,16]. These changes involve increasing populations of beneficial bacteria, particularly those within the phylum Firmicutes, while reducing potentially detrimental taxa. Additionally, these additives can influence metabolic pathways associated with carbohydrate and amino acid metabolism. Moreover, the rumen microbiota and fecal microbiota exhibit significant overlap and interconnection, suggesting that fecal samples may occasionally be used as surrogates for rumen microbial communities [17]. Dietary D-ribose supplementation has been shown to enhance growth performance and overall health in ruminants [11], but its effects on the rumen and fecal microbiota remain largely unknown. By examining the combined dynamics of rumen and fecal microbial diversity and community structure, we can better understand how D-ribose supplementation affects nutrient utilization and overall health from a microbial perspective. This approach will help elucidate how D-ribose interacts with the gut microbiota and identify its potential role as a microbial modulator.
Therefore, an 80-day feeding trial was conducted to investigate the effects of dietary D-ribose supplementation on the microbial diversity, community composition, and metabolic function of rumen and fecal microbiota in Hu sheep. The hypothesis was that incorporating D-ribose into the diet would alter specific community composition in both the rumen and feces. The findings of this study provide crucial insights into the intestinal microbiota, thereby facilitating a comprehensive evaluation of the potential applications of D-ribose in ruminant production.

2. Materials and Methods

2.1. Animal Ethics

In this study, all experimental procedures involving animals were rigorously conducted in strict accordance with the guidelines and regulations established by the Institutional Animal Care and Use Committee at Jiangxi Agricultural University (protocol number: JXAULL-20240416).

2.2. Experimental Design

A total of 18 female Hu sheep with similar body weights (20.47 ± 0.58 kg) and ages (90.0 ± 0.28 days) were randomly allocated to two groups, each comprising nine animals. One group was fed a standard basal diet (Control), while the other group received the basal diet supplemented with D-ribose at a concentration of 300 mg kg−1 of feed on a dry matter basis (D-Ribose). The D-ribose had a purity level of 99% and was supplied by Jiangxi Chengzhi Bioengineering Co., Ltd. (Yingtan, China). Each sheep was housed individually. To ensure uniform distribution, D-ribose was first blended with finely ground corn (1:20, w/w) to prepare a premix, which was then incorporated into the total mixed ration and mixed for 20 min. The composition and chemical makeup of the basal diet are detailed in Table 1. The trial lasted 80 days, consisting of an initial 20-day adaptation period during which all sheep were fed the basal diet, followed by a 60-day experimental period where the sheep were fed according to their assigned treatments. Throughout the trial, sheep were fed twice daily at 8:00 a.m. and 6:00 p.m., with feed amounts adjusted to ensure 5–10% feed refusal for the subsequent day. Clean drinking water was available to the animals at all times.

2.3. Sample Collection and Feed Analysis

Feed samples were collected on three randomly selected days each week, and they were analyzed for crude protein (CP; method 2001.11), ether extract (EE; method 945.16), calcium (method 935.14), and phosphorus (method 942.23) using AOAC International methods [18]. Additionally, neutral detergent fiber (NDF) and acid detergent fiber (ADF) were determined following the procedures of Van Soest et al. [19], which included the use of thermostable α-amylase. For seven consecutive days prior to the end of the trial, fecal samples were collected from each sheep at 6-h intervals, resulting in a total of 28 samples per sheep. These samples were subsequently pooled in equal proportions to generate a composite fecal sample representative of each individual sheep. On two days preceding the trial’s conclusion, rumen contents were collected using the oral esophageal tubing method described by Paz et al. [20], prior to the morning feeding. The initial 100 mL of the rumen contents was discarded to minimize salivary contamination. The remaining rumen content was then filtered through four layers of cheesecloth to obtain the rumen fluid samples. Both the fecal and rumen fluid samples were stored at −80 °C for subsequent DNA extraction and sequencing analysis.

2.4. DNA Extraction, Sequencing, and Data Analysis

A total of 36 samples, comprising 18 rumen fluid samples and 18 fecal samples, were utilized for total DNA extraction, which was conducted in strict adherence to the manufacturer’s instructions using the specified kits (Omega Bio-tek, Norcross, GA, USA). The V1–V9 regions of the 16S rRNA gene were amplified using primers 27F (5′-AGRGTTYGATYMTGGCTCAG-3′) and 1492R (5′-RGYTACCTTGTTACGACTT-3′). Each sample’s amplification primers incorporated an 8-base tag sequence (Pacific Biosciences, Menlo Park, CA, USA, PN: 102-135-500) for sample differentiation. The PCR reaction mixture consisted of 4 μL of 5x FastPfu Buffer, 2 μL of 2.5 mM dNTPs, 0.8 μL of each primer (5 μM), 0.4 μL of FastPfu Polymerase, 2 μL of template DNA (10 ng), and 10 μL of H2O. The PCR program was set as follows: initial denaturation at 95 °C for 5 min; followed by 30 cycles of denaturation at 95 °C for 30 s, annealing at 55 °C for 30 s, and extension at 72 °C for 45 s; with a final extension at 72 °C for 10 min. The amplified products were purified using the AxyPrep DNA Gel Extraction Kit (Axygen Biosciences, Union City, CA, USA) following 2% agarose gel electrophoresis. SMRTbell libraries were prepared from the purified DNA via blunt-end ligation, following the manufacturer’s protocol (Pacific Biosciences). The amplicons were quantified using a Qubit fluorometer (Qubit 4, Thermo Fisher Scientific, Waltham, MA, USA) and pooled in equimolar amounts. The pooled amplicon mixture was used to construct the sequencing library with the SMRTbell Template Prep Kit 3.0 (Pacific Biosciences, Menlo Park, CA, USA, PN: 102-182-700), following the manufacturer’s protocol. The library was sequenced on the PacBio Sequel II platform. All amplicon sequencing was performed by Shanghai Biozeron Biotechnology Co., Ltd. (Shanghai, China). The raw sequencing data have been deposited in the NCBI SRA database under the accession numbers of PRJNA1300601.
PacBio raw reads were processed using SMRT Link v13.0 (≥3 passes, accuracy ≥0.99) and size-filtered (1000–1800 bp). Barcodes/primers were removed with lima v2.9.0, followed by cutadapt v4.0 (trim-left = 19 nt). ASVs were inferred using the q2-pacbio plugin (DADA2 PacBio-mode) in QIIME 2 2023.7 with maxEE = 12, truncQ = 20, and consensus chimera removal. Full-length ASVs were classified with a Naïve Bayes classifier trained on SILVA 138.2 SSURef NR99 (27F–1492R extract) at 70% confidence. The evaluation of alpha diversity encompassed an array of metrics, including richness as gauged by the Chao1 and ACE indices, diversity as determined by the Shannon and Simpson indices, evenness as assessed with Pielou’s evenness index, and phylogenetic diversity as measured by Faith’s phylogenetic diversity (PD) index. The computations for these indices were conducted using R (version 4.3.3). Non-metric multidimensional scaling (NMDS), utilizing the Bray–Curtis distance as a dissimilarity measure, was selected to characterize beta diversity. This analysis was conducted using the vegan package, a community ecology tool available on R-Forge (https://r-forge.r-project.org/, accessed on 5 August 2025). To further assess the similarity in microbial composition between the control and D-ribose groups, analysis of similarities (ANOSIM) was applied, facilitated by the vegan package in R. Linear discriminant analysis effect size (LEfSe) was employed to identify differentially abundant species between the two groups across various taxonomic levels. The analysis began with a non-parametric factorial Kruskal–Wallis sum-rank test to discern features with significant abundance variations and to identify taxa with substantial differences in abundance. Subsequently, LEfSe utilized linear discriminant analysis (LDA) to quantify the influence of each taxonomic group’s abundance on the observed differentiation, with an LDA score threshold of 5.0 indicating significant discrimination between groups. The Phylogenetic Investigation of Communities by Reconstruction of Unobserved States (PICRUSt2, version 2.5.2) program, which utilizes the Kyoto Encyclopedia of Genes and Genomes (KEGG) database, was employed to predict functional shifts within microbial communities across various samples, revealing the impact of D-ribose supplementation on rumen and fecal metabolic pathways.

2.5. Statistical Analysis

To evaluate the normality and homoscedasticity of the dataset, the Shapiro–Wilk and Levene tests were employed, respectively. Variables that satisfying both assumptions (p > 0.05) were analyzed using an independent-samples t-test analysis to examine differences between the CON and DR groups. In contrast, for variables that failed to meet either assumption (p ≤ 0.05) were analyzed using the non-parametric Mann–Whitney U test. The above statistical analyses were performed using SPSS software (version 20, IBM, Chicago, IL, USA), with a significance threshold of 0.05. Effect size was quantified with Cliff’s delta (δ), computed in R (effsize v0.8.1) using 10,000 bias-corrected and accelerated bootstrap iterations.

3. Results

3.1. Microbial Alpha-Diversity

The effect of dietary D-ribose supplementation on the alpha diversity of both rumen and fecal microbiota is presented in Table 2. Specifically, D-ribose supplementation had no significant influence on key alpha diversity metrics of the rumen microbiota, including Chao1, ACE, Shannon index, Simpson index, Pielou’s evenness, and Faith’s phylogenetic diversity (Faith’s PD) (p > 0.05). Similarly, these indices in the fecal microbiota remained unaffected by D-ribose supplementation (p > 0.05).

3.2. Microbial Community Composition

The effects of dietary D-ribose supplementation on the composition of rumen and fecal microbiota at the phylum level are presented in Table 3 and Table 4, respectively. In the rumen microbiota, the relative abundance of Cyanobacteria was higher in the Control group than in the D-ribose group (p < 0.05). Meanwhile, no significant differences were observed between the two groups in other phyla with a relative abundance greater than 0.01% (p > 0.05). In the fecal microbiota, the relative abundances of Verrucomicrobia and Candidatus Saccharibacteria were significantly lower in the D-ribose group than in the Control group (p < 0.05).
The effects of dietary D-ribose supplementation on the composition of rumen and fecal microbiota at the genus level are presented in Table 5 and Table 6, respectively. Regarding the rumen microbiota, the relative abundances of Herbivorax and Faecalibacterium were significantly higher in the D-ribose group than in the control group (p < 0.05). In the fecal microbiota, the relative abundances of Lawsonibacter and Massilioclostridium were also significantly higher in the D-ribose group than in the control group (p < 0.05). In contrast, the relative abundances of Bifidobacterium and Caproiciproducens were significantly lower in the D-ribose group than in the control group (p < 0.05).

3.3. Microbial Beta-Diversity

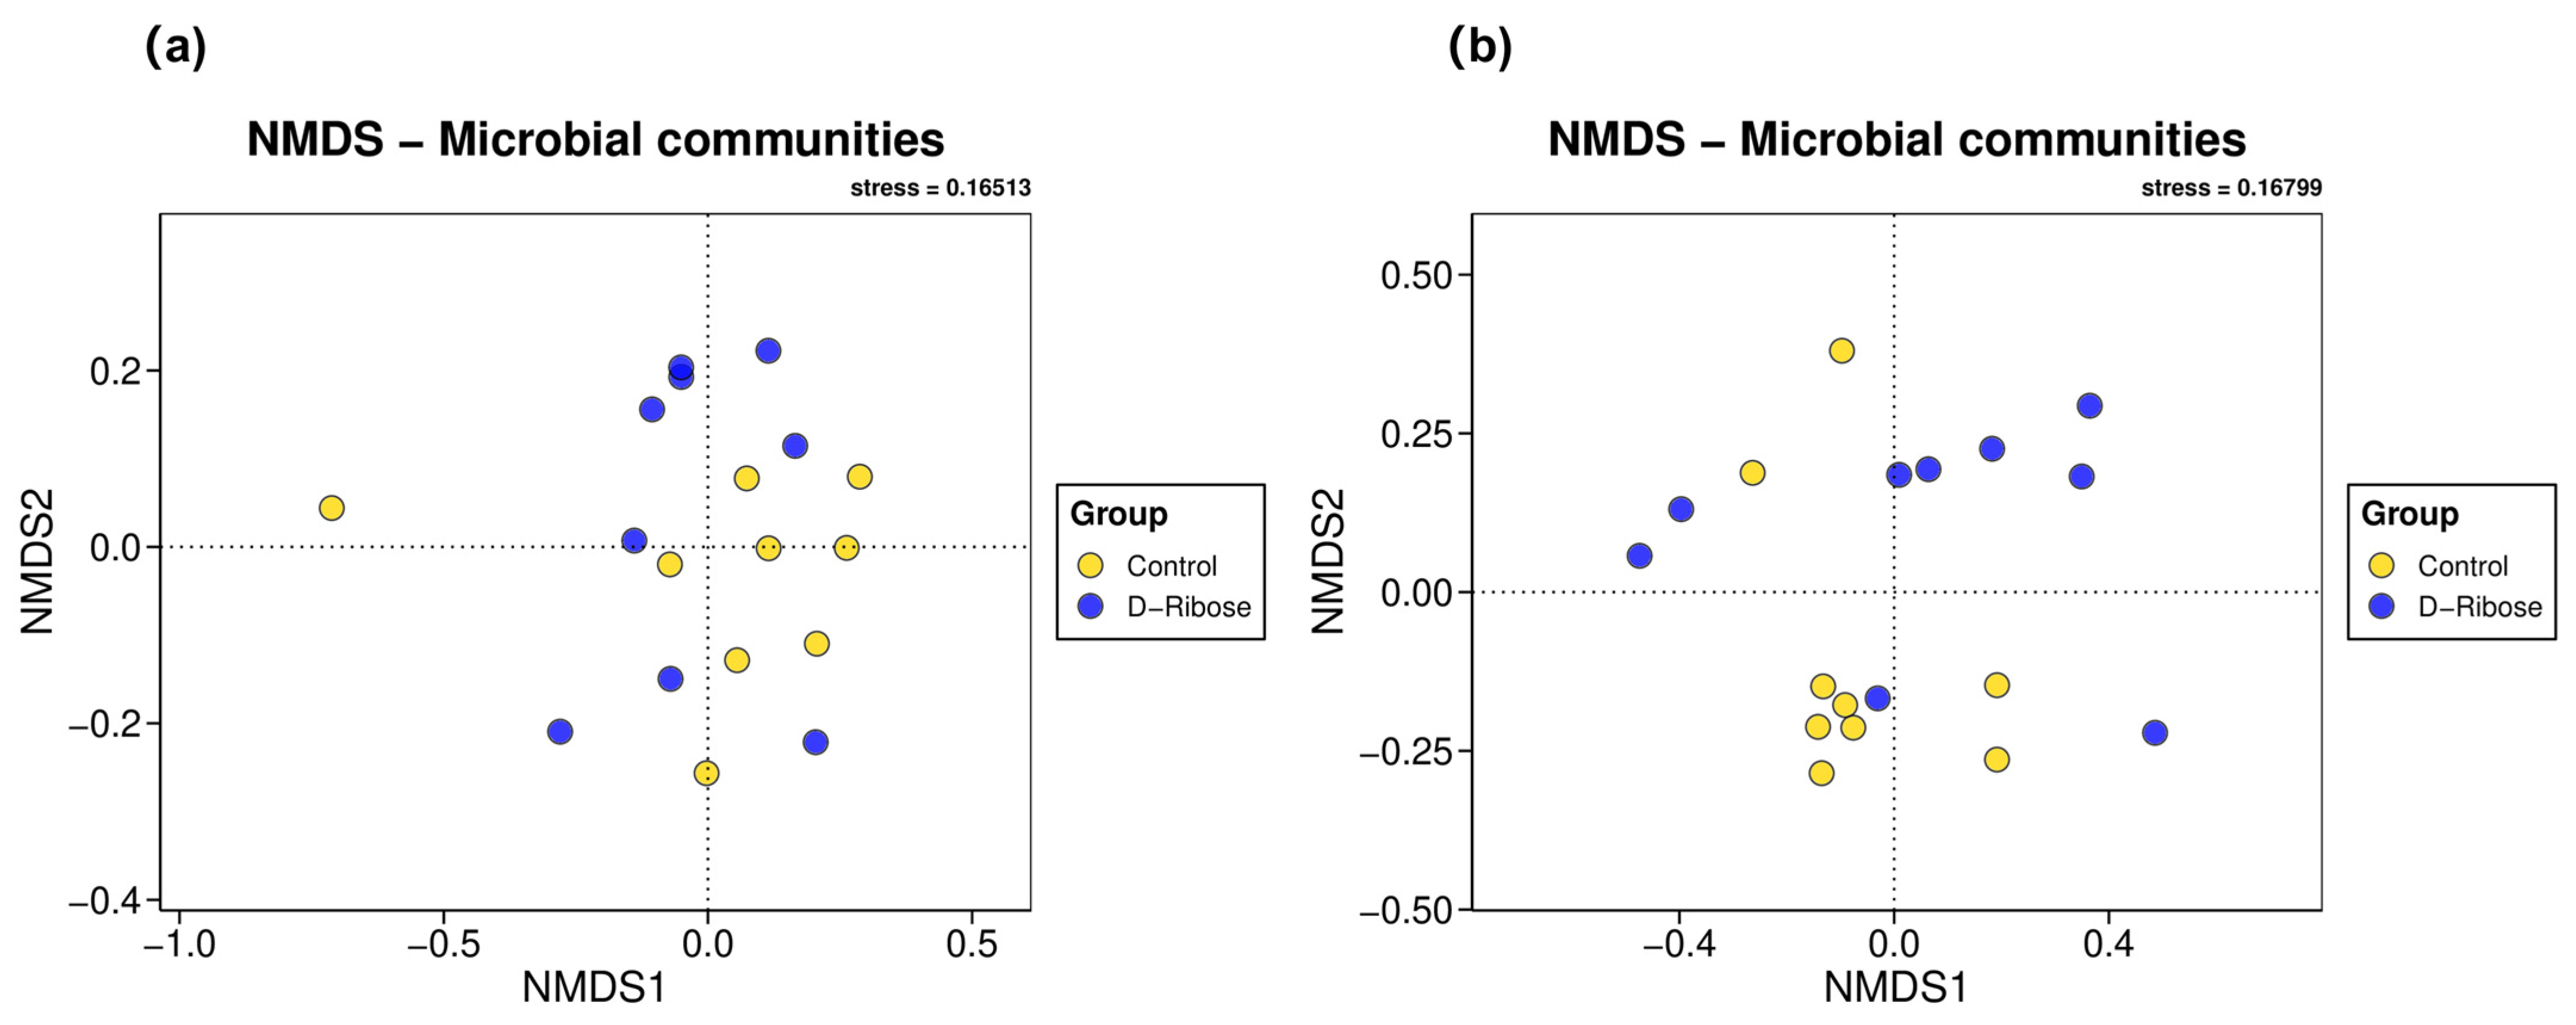
Figure 1a,b display the NMDS of rumen and fecal microbiota, respectively. The Control group and the D-ribose group exhibited substantial and partial overlap in rumen and fecal microbiota, respectively. ANOSIM of the rumen microbiota revealed no significant differences between the two groups (R = 0.079, p = 0.115). In contrast, ANOSIM of the fecal microbiota detected significant differences between the two groups (R = 0.203, p = 0.017).

3.4. Marked Microbiota

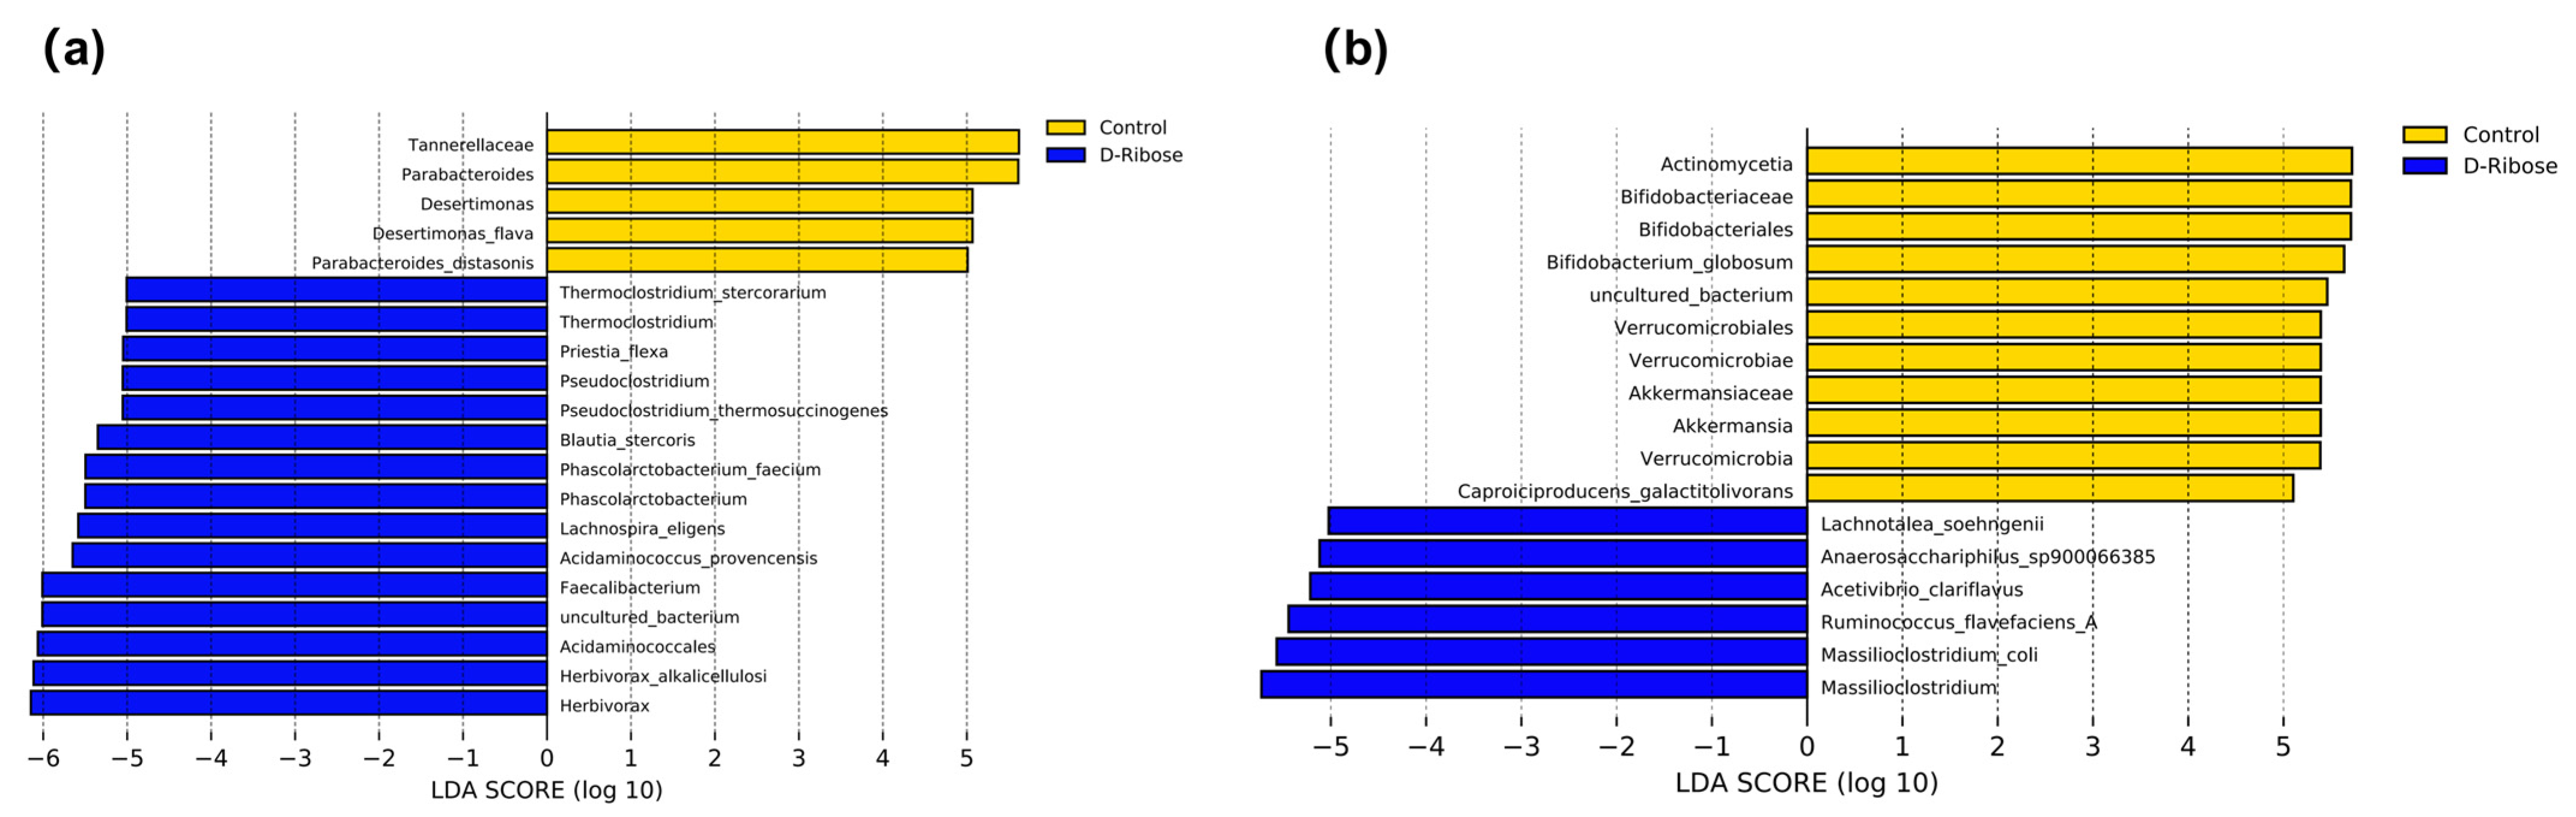
LefSe analysis identified microbes present in low abundance at various taxonomic levels. In total, 20 distinct marker microbes were identified in rumen microbiota (Figure 2a). Specifically, the control group was characterized by five distinct marker microbes: Tannerellaceae, Parabacteroides, Desetimonas, Desertimonas flava, and Parabacteroides distasonis. The D-ribose group displayed 15 unique marker microbes, including Thermoclostridium stercorarium, Thermoclostridium, Priestia flexa, Pseudoclostridium, Pseudoclostridium thermosuccinogenes, Blautia stercoris, Phascolarctobacterium faecium, Phascolarctobacterium, Lachnospira elegants, Acidaminococcus provencensis, Faecalibacterium, uncultured bacterium, Acidaminococcales, Herbivorax alkalicellulosi, and Herbivorax.
Analysis of the fecal microbiota identified 17 distinct marker microbes (Figure 2b). The control group includes several notable microbes such as Actinomycetia, Bifidobacteriaceae, Bifidobacteriales, Bifidobacterium globosum, uncultured bacterium, Verrucomicrobiales, Verrucomicrobiae, Akkermansiaceae, Akkermansia, Verrucomicrobia, and Caproiciproducens galactitolivorans. In contrast, the D-ribose group includes a distinct set of microbes, comprising Lachnotalea soehngenii, Anaerocharis sp900066385, Acetivibrio clariflavus, Ruminococcus flavefaciens A, Massiliclostridium coli, and Massiliclostridium.

3.5. Predicted Metabolic Function

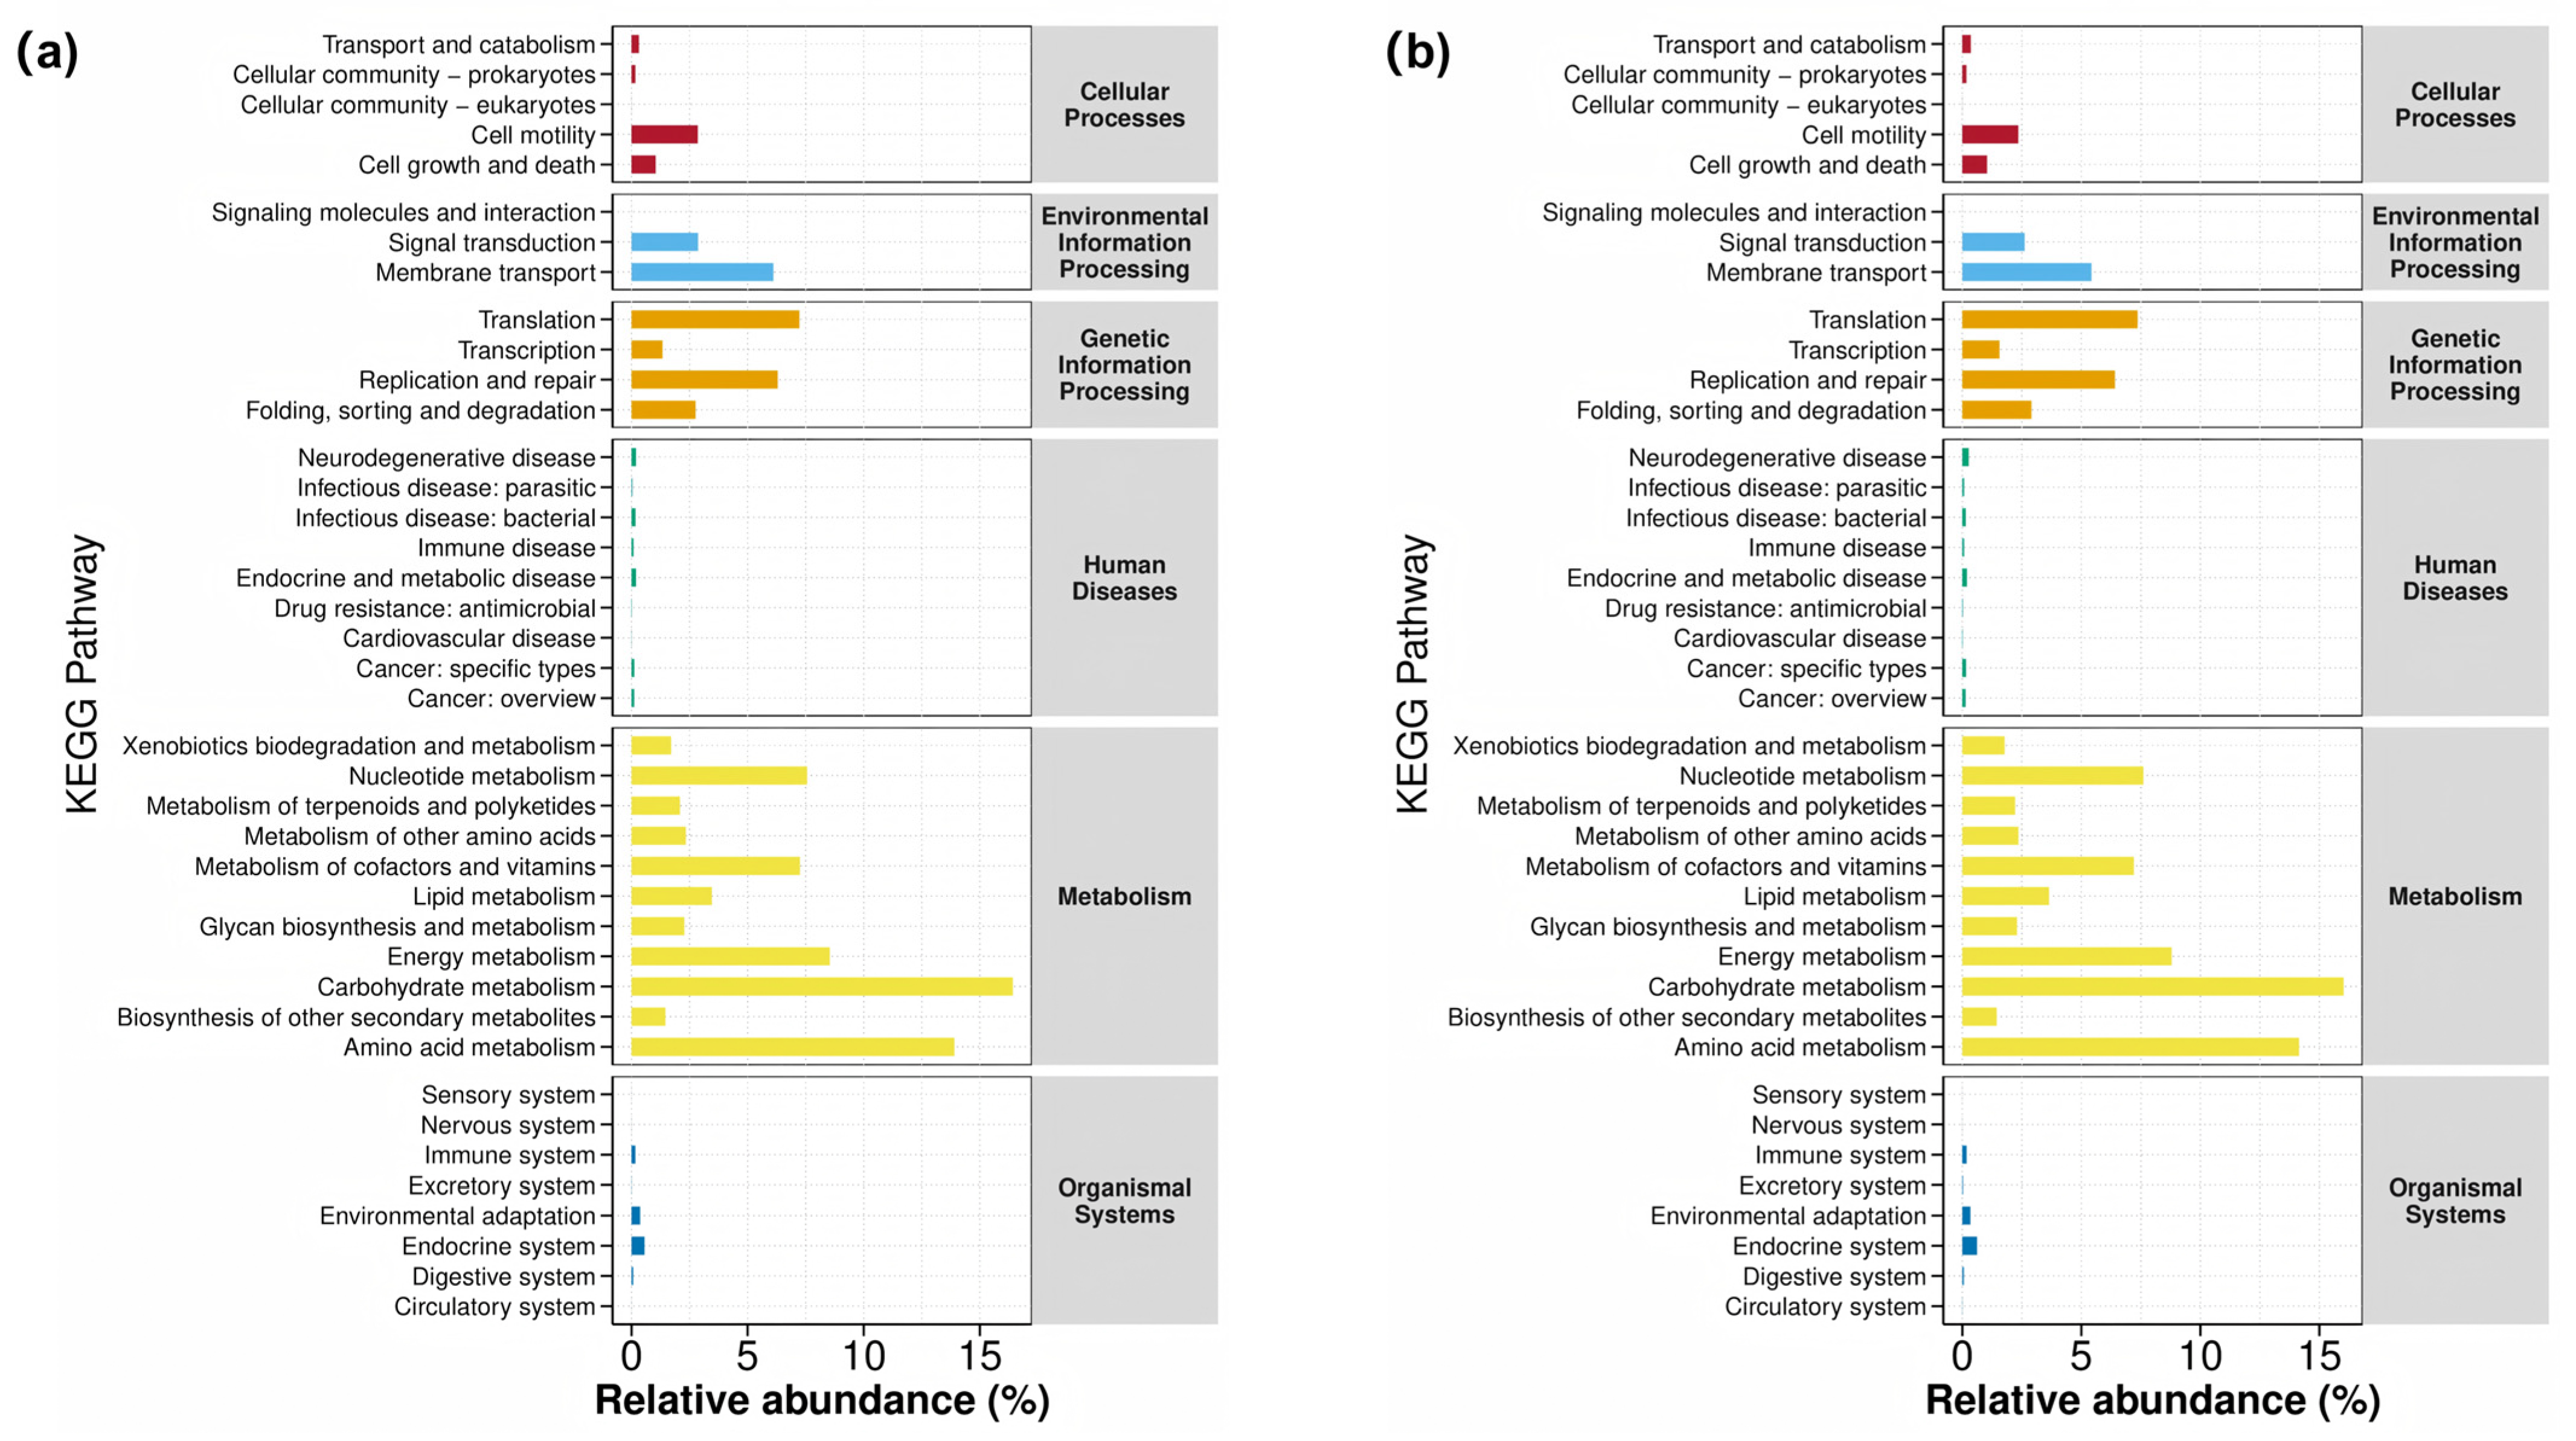
The effects of dietary D-Ribose supplementation on the relative abundances of predicted metabolic pathways are detailed in Table 7 and Table 8 for rumen and fecal microbiota, respectively. The addition of D-Ribose did not significantly alter the relative abundances of metabolic pathways with relative abundance more than 1% (p > 0.05), a finding consistent across both rumen and fecal microbiota. Consistent with this, the top three metabolic pathways in terms of relative abundance in both types of gut microbiota were carbohydrate metabolism, amino acid metabolism, and energy metabolism. Further comparative analysis, as illustrated in Figure 3, revealed that the metabolic functions of the two types of gut microbiota were primarily concentrated in metabolism, genetic information processing, and environmental information processing, with the metabolic pathways within these categories exhibiting similar compositions.

4. Discussion

This study revealed that incorporating D-ribose into sheep feed had no effect on the richness, evenness, or diversity of the rumen microbiota, with comparable outcomes observed in fecal microbiota. This lack of impact on microbial diversity may be attributed to the fact that D-ribose, as an energy supplement, primarily influences the host’s metabolic profile [21]. Previous studies in Angus steers have indicated that feed restriction can disrupt nucleotide metabolism and its associated metabolites, which in turn can affect gut barrier function [22]. Beta-diversity analysis further revealed that supplementing the diet with D-ribose had no significant impact on the community structure of the rumen microbiota. This stability of the rumen microbiota might be attributed to the inherent robustness and adaptability of rumen microbial niches. For instance, quorum sensing (QS), a prevalent interspecies communication mechanism within the rumen microbiota, enables microbial communities to collectively respond to adverse environmental shifts [23]. A prime example is the improved concentration of AI-2 signaling molecule and enhanced biofilm formation within the LuxS/AI-2 QS system, which serves as a defense mechanism against the stress induced by cold drinking water during winter [24]. In contrast, the addition of dietary D-ribose did elicit discernible differences in the beta-diversity of fecal microbiota. This discrepancy could stem from the fact that the rumen microbiota is more complex in terms of diversity, composition, and functionality [25], thereby endowing it with superior adaptability to dietary changes than fecal microbiota. Nevertheless, this hypothesis warrants validation through more comprehensive and in-depth comparative investigations.
Species abundance analysis elucidated the effects of dietary D-ribose supplementation on particular microbial taxa in the rumen. The bacteria Herbivorax, Herbivorax alkalicellulosi, Thermoclostridium, Thermoclostridium stercorarium, Priestia flexa, Pseudoclostridium, and Pseudoclostridium thermosuccinogenes are all anaerobic and thermophilic, with the ability to break down cellulose [26,27]. The relative abundances of these bacteria in the D-ribose group increased significantly. This implies that incorporating D-ribose into the diet could potentially enhance the rumen’s ability to utilize fiber more effectively, which corresponds well to the higher values of the apparent digestibility of NDF and ADF observed after the addition of D-ribose [11]. Faecalibacterium, Blautia stercoris, Phascolarctobacterium, Phascolarctobacterium faecium, and Lachnospira elegans, as well as Lawsonibacter, Lachnotalea soehngenii, Anaerocharis sp900066385, Acetivibrio clariflavus, Ruminococcus flavefaciens A, Massiliclostridium, and Massiliclostridium coli are all strongly associated with gut health. These microorganisms can ferment carbohydrates to generate short-chain fatty acids (SCFA), including acetate, propionate, and butyrate, which are vital for maintaining the integrity of the intestinal barrier and modulating the host’s immune responses [28,29,30]. Meanwhile, Acidaminococcales and Acidaminococcus provencensis possess the capability to degrade amino acids and contribute to protein catabolism and metabolism, thus aiding in the maintenance of gut homeostasis [31]. The elevated relative abundance of these microorganisms in the D-ribose group suggests that incorporating D-ribose into the diet enhances the utilization of energy and protein, as evidenced by higher numerical values of EE and CP digestibility [11], which in turn positively impacts rumen and hindgut health. The family Tannerellaceae, as well as the genera Parabacteroides and Desetimonas, and the species Parabacteroides distasonis and Desertimonas flava, are associated with various intestinal diseases and inflammatory responses [32,33]. For instance, succinate, a metabolite produced by Parabacteroides distasonis, can act as an inflammatory signal. It induces the production of IL-1β via the HIF-1α pathway, thereby triggering an inflammatory response. This, in turn, disrupts the delicate balance of the gut microbiota and negatively impacts nutrient absorption and metabolism [32]. In this study, an increased relative abundance of these microorganisms in the control group indirectly suggests that the addition of D-ribose can enhance the overall health status of the host. These differences observed in the rumen microbial composition further indicate that incorporating D-ribose into the diet can improve the utilization efficiency of energy, protein, and fiber, as well as positively impact the host’s overall health, which is in line with our previous research findings that dietary D-ribose supplementation improves nutrient digestion and reduces stress responses [11].
The analysis of fecal differential microbiota more deeply assessed the impact of dietary D-ribose supplementation on both the composition and the dominant communities of the fecal microbiota. Candidatus Saccharibacteria remains an elusive microorganism, yet to be successfully cultured in laboratory settings. Its elevated abundance has been linked to gut microbiota dysbiosis in individuals suffering from inflammatory bowel diseases, such as Crohn’s disease [34]. Similarly, an increase in the prevalence of Verrucomicrobia, along with its associated classes Verrucomicrobiae and orders Verrucomicrobiales, may serve as a telltale sign of gut microbiota imbalance, potentially foreshadowing the onset of disease [35]. The lower abundances of these fecal microorganisms observed in the D-ribose group suggest that the incorporation of D-ribose into the diet may play a pivotal role in preserving the stability of the gut microbiota, thereby fostering a healthier gastrointestinal environment. Bifidobacteriales, along with Bifidobacteriaceae, Bifidobacterium, and Bifidobacterium globosum, are generally recognized as beneficial bacteria. They modulate the host immune system and boost the activity of regulatory T cells. These bacteria also enhance the barrier function of intestinal epithelial cells, thereby reducing intestinal permeability [36]. The metabolites they produce, such as acetate and butyrate, help maintain the balance of the gut microbiota [36]. Actinomycetia are prevalent in soil, water, and living organisms. They are significant producers of secondary metabolites, including antibiotics and bioactive substances, which play a crucial role in inhibiting pathogenic bacteria and maintaining ecological balance [37]. Surprisingly, in this study, the abundance of these microorganisms in the feces of the control group was significantly higher. One possible explanation is that both the control and D-ribose groups remained healthy throughout the experiment, with no abnormalities in fecal status. The fecal microbiota may exhibit functional redundancy, where other microorganisms can compensate for the reduced abundance of certain species, thereby maintaining overall health [38]. Alternatively, in the D-ribose group, these microorganisms may have been outcompeted by other beneficial microorganisms, leading to a more stable microbial ecological balance. This finding underscores the need for absolute quantification of microbial composition to determine absolute abundance, rather than relying solely on relative abundance data from conventional techniques. Caproiciproducens and Caproiciproducens galactitolivorans are recognized for their ability to ferment substrates such as fructose, lactate, galactose, and xylose, resulting in the production of SCFA [39]. Similarly, Akkermansiaceae and Akkermansia are known for degrading mucin in the gut, which also leads to the generation of SCFA [40]. While these metabolic activities are typically linked to gut health, emerging research indicates that an increased abundance of these microorganisms can be observed in the context of gut dysbiosis, particularly during Salmonella infections [41]. The differential fecal microbial results suggest that dietary D-ribose supplementation specifically boosts the abundance of beneficial microorganisms associated with immune metabolism. This effect contrasts sharply with the impact on the rumen microbiota, where the primary microorganisms drive nutrient digestion and utilization.
D-ribose is a fundamental component in nucleotide metabolism, playing a crucial role in various biological processes, including nucleotide synthesis, energy metabolism, signal transduction, antioxidant defense, DNA repair, and metabolic regulation. However, the predicted metabolic pathways in this study did not reveal any differences in the aforementioned metabolic pathways between the CON and D-ribose groups. Measuring the nucleotide content in blood and rumen fluid could better reveal the relationship between nucleotide metabolism and microbial responses. Moreover, integrating host data with microbial data could provide a more comprehensive explanation for the dynamics of rumen and fecal microbiota due to dietary D-ribose supplementation.
It should be acknowledged that the present investigation exclusively evaluated the impact of dietary D-ribose supplementation at 300 mg kg−1 on ruminal and fecal microbial communities under non-stress conditions. Consequently, whether lower or otherwise alternative doses elicit comparable responses remains to be established. Under environmental challenges such as heat stress, cold stress, or transportation stress, the ruminal microbiota of ruminants undergoes marked compositional and functional shifts; accordingly, the optimal supplemental level of D-ribose and its resultant efficacy under such circumstances awaits systematic clarification in future research. Furthermore, the functional predictions presented here were generated with PICRUSt2, which was trained primarily on human-microbiome data; therefore, the absence of significant differences should be interpreted cautiously and verified in future studies using rumen-specific tools such as CowPI or direct metagenomics.


5. Conclusions

Dietary D-ribose supplementation did not alter the alpha diversity or metabolic functions of the rumen and fecal microbiota. However, it impacted the beta diversity of fecal microbiota and influenced the community composition of specific rumen and the dominants communities of fecal microbiota. Based on the changes in the dynamics of the rumen and fecal microbiota, dietary R-ribose supplementation with 300 mg kg−1 in Hu sheep is an option for a feed additive under the conditions in which the study was carried out.

Author Contributions

Conceptualization, Q.Q. and H.L.; methodology, K.O. and M.Q.; validation, Q.Q., L.L. and K.P.; formal analysis, H.L. and L.L.; investigation, Q.Q., L.L. and K.P.; data curation, Q.Q.; writing—original draft preparation, Q.Q.; writing—review and editing, L.L., H.L. and Q.Q.; visualization, K.P.; supervision, K.O. and M.Q.; project administration, Q.Q. and H.L.; funding acquisition, Q.Q. and H.L. All authors have read and agreed to the published version of the manuscript.

Funding

This research was funded by the Major Discipline Academic and Technical Leaders Training Program of Jiangxi Province, grant number 20243BCE51165 and 20243BCE51114; the National Natural Science Foundation of China, grant number 32260861, 32460849 and 32202708; and the Jiangxi Provincial Natural Science Foundation, grant number 20232BAB215051 and 20232BAB205066.

Institutional Review Board Statement

In this study, all experimental procedures involving animals were rigorously conducted in strict accordance with the guidelines and regulations established by the Institutional Animal Care and Use Committee at Jiangxi Agricultural University (protocol number: JXAULL-20240416, approval date: 6 March 2024).

Informed Consent Statement

Informed consent for participation was obtained from all subjects involved in the study.

Data Availability Statement

The raw sequencing data presented in this study are openly available in the NCBI SRA database under the accession numbers of PRJNA1300601.

Conflicts of Interest

The authors declare no conflicts of interest.

Abbreviations

The following abbreviations are used in this manuscript:
QSQuorum sensing
VFAVolatile fatty acids
PDPhylogenetic diversity
NMDSNon-metric multidimensional scaling
ANOSIMAnalysis of similarities
LEfSeLinear discriminant analysis effect size
LDALinear discriminant analysis
PICRUStPhylogenetic Investigation of Communities by Reconstruction of Unobserved States
KEGGKyoto Encyclopedia of Genes and Genomes
SCFAShort-chain fatty acids

References

  1. Pittroff, W.; Kothmann, M.M. Review: Keystone Issues in Ruminant Science I. Feed Intake Control in Ruminants. Animal 2025, 101553. [Google Scholar] [CrossRef] [Scilit]
  2. Serbester, U. The Role of Feed Additives in Enhancing Ruminant Performance and Sustainability. In Animal Feeds and Additives; Kırkpınar, F., Açıkgöz, Z., Eds.; IntechOpen: London, UK, 2025. [Google Scholar]
  3. Ban, Y.; Guan, L.L. Implication and challenges of direct-fed microbial supplementation to improve ruminant production and health. J. Anim. Sci. Biotechnol. 2021, 12, 109. [Google Scholar] [CrossRef] [Scilit]
  4. Tai, Y.; Zhang, Z.; Liu, Z.; Li, X.; Yang, Z.; Wang, Z.; An, L.; Ma, Q.; Su, Y. D-ribose metabolic disorder and diabetes mellitus. Mol. Biol. Rep. 2024, 51, 220. [Google Scholar] [CrossRef] [Scilit]
  5. Liu, L.; Wu, R.; Zhang, J.; Shang, N.; Li, P. D-Ribose interferes with quorum sensing to inhibit biofilm formation of Lactobacillus paraplantarum L-ZS9. Front. Microbiol. 2017, 8, 1860. [Google Scholar] [CrossRef] [Scilit]
  6. Won, M.-Y.; Oyama, L.B.; Courtney, S.J.; Creevey, C.J.; Huws, S.A. Can rumen bacteria communicate to each other? Microbiome 2020, 8, 23. [Google Scholar] [CrossRef] [Scilit] [PubMed]
  7. Seshadri, R.; Leahy, S.C.; Attwood, G.T.; Teh, K.H.; Lambie, S.C.; Cookson, A.L.; Eloe-Fadrosh, E.A.; Pavlopoulos, G.A.; Hadjithomas, M.; Varghese, N.J.; et al. Cultivation and sequencing of rumen microbiome members from the Hungate1000 Collection. Nat. Biotechnol. 2018, 36, 359–367. [Google Scholar] [CrossRef] [Scilit] [PubMed]
  8. Badhan, A.; Wang, Y.; Terry, S.; Gruninger, R.; Guan, L.L.; McAllister, T.A. Invited review: Interplay of rumen microbiome and the cattle host in modulating feed efficiency and methane emissions. J. Dairy Sci. 2025, 108, 5489–5501. [Google Scholar] [CrossRef] [Scilit]
  9. Liu, H.; Yan, C.; Teng, Y.; Guo, J.; Liang, C.; Xia, X. Gut microbiota and D-ribose mediate the anti-colitic effect of punicalagin in DSS-treated mice. Food Funct. 2024, 15, 7108–7123. [Google Scholar] [CrossRef] [Scilit]
  10. Xu, K.; Ren, Y.; Zhao, S.; Feng, J.; Wu, Q.; Gong, X.; Chen, J.; Xie, P. Oral D-ribose causes depressive-like behavior by altering glycerophospholipid metabolism via the gut-brain axis. Commun. Biol. 2024, 7, 69. [Google Scholar] [CrossRef] [Scilit] [PubMed]
  11. Ge, J.; Li, Y.; Zhao, X.; Ouyang, K.; Qu, M.; Qiu, Q. Dietary Supplementation with D-Ribose Enhances Growth Performance, Improves Serum Antioxidant Capacity, and Inhibits Rumen Microbial LuxS/AI-2 Quorum Sensing of Hu Sheep. Anim. Biosci. 2025, in press. [Google Scholar] [CrossRef] [Scilit]
  12. Lourenco, J.M.; Kieran, T.J.; Seidel, D.S.; Glenn, T.C.; Silveira, M.F.d.; Callaway, T.R.; Stewart, R.L., Jr. Comparison of the ruminal and fecal microbiotas in beef calves supplemented or not with concentrate. PLoS ONE 2020, 15, e0231533. [Google Scholar] [CrossRef] [Scilit]
  13. Brulin, L.; Ducrocq, S.; Estellé, J.; Even, G.; Martel, S.; Merlin, S.; Audebert, C.; Croiseau, P.; Sanchez, M.P. The fecal microbiota of Holstein cows is heritable and genetically correlated to dairy performances. J. Dairy Sci. 2024, 107, 11254–11268. [Google Scholar] [CrossRef] [Scilit]
  14. Lee, S.; Ryu, C.H.; Back, Y.C.; Lee, S.D.; Kim, H. Effect of fermented concentrate on ruminal fermentation, ruminal and fecal microbiome, and growth performance of beef cattle. Animals 2023, 13, 3622. [Google Scholar] [CrossRef] [Scilit]
  15. Zhang, M.; Zhang, A.; Han, R.; Xu, C.; Zhang, N.; Jiang, X.; Wang, S. Changes of fecal microbiota with supplementation of Acremonium terricola culture and yeast culture in ewes during lactation. J. Anim. Sci. 2025, 103, skaf174. [Google Scholar] [CrossRef] [Scilit] [PubMed]
  16. Wang, Y.; Zhao, Y.; Nan, X.; Wang, Y.; Cai, M.; Jiang, L.; Luo, Q.; Xiong, B. Rumen-protected glucose supplementation alters fecal microbiota and its metabolic profiles in early lactation dairy cows. Front. Microbiol. 2022, 13, 1034675. [Google Scholar] [CrossRef] [Scilit] [PubMed]
  17. Andrade, B.G.N.; Bressani, F.A.; Cuadrat, R.R.C.; Tizioto, P.C.; de Oliveira, P.S.N.; Mourão, G.B.; Coutinho, L.L.; Reecy, J.M.; Koltes, J.E.; Walsh, P.; et al. The structure of microbial populations in Nelore GIT reveals inter-dependency of methanogens in feces and rumen. J. Anim. Sci. Biotechnol. 2020, 11, 6. [Google Scholar] [CrossRef] [Scilit]
  18. Association of Official Analytical Chemists (AOAC). Official Method of Analysis of AOAC International, 18th ed.; AOAC International: Rockville, MD, USA, 2005. [Google Scholar]
  19. Van Soest, P.J.; Robertson, J.B.; Lewis, B.A. Methods for dietary fiber, neutral detergent fiber, and nonstarch polysaccharides in relation to animal nutrition. J. Dairy Sci. 1991, 74, 3583–3597. [Google Scholar] [CrossRef] [Scilit] [PubMed]
  20. Paz, H.A.; Anderson, C.L.; Muller, M.J.; Kononoff, P.J.; Fernando, S.C. Rumen bacterial community composition in Holstein and Jersey cows is different under same dietary condition and is not affected by sampling method. Front. Microbiol. 2016, 7, 1206. [Google Scholar] [CrossRef] [Scilit]
  21. Pauly, D.F.; Pepine, C.J. D-Ribose as a supplement for cardiac energy metabolism. J. Cardiovasc. Pharmacol. Ther. 2000, 5, 249–258. [Google Scholar] [CrossRef] [Scilit]
  22. Jiang, Q.; Galvão, M.C.; Alharthi, A.S.; Alhidary, I.A.; Gionbelli, M.P.; McCann, J.C.; Loor, J.J. Feed restriction in Angus steers impacts ruminal bacteria, its metabolites, and causes epithelial inflammation. Ruminants 2024, 4, 387–405. [Google Scholar] [CrossRef] [Scilit]
  23. Fu, C.; Ge, J.; Qu, M.; Ouyang, K.; Qiu, Q. Effects of 4-hydroxy-2,5-dimethyl-3(2H)-furanone supplementation on growth performance, serum antioxidant capacity, rumen fermentation characteristics, rumen bacterial quorum sensing, and microbial community in Hu sheep. Anim. Biosci. 2025, 38, 1422–1434. [Google Scholar] [CrossRef] [Scilit]
  24. Liu, C.; Li, L.; Dai, J.; Qu, M.; Ouyang, K.; Qiu, Q. Heated drinking water in winter improves growth performance of male Hu sheep by modulating rumen quorum sensing and metabolites, and enhancing serum antioxidant capacity. Anim. Biosci. 2025, 38, 2280–2296. [Google Scholar] [CrossRef] [Scilit]
  25. Guo, C.; Liu, J.; Wei, Y.; Du, W.; Li, S. Comparison of the gastrointestinal bacterial microbiota between dairy cows with and without mastitis. Front. Microbiol. 2024, 15, 1332497. [Google Scholar] [CrossRef] [Scilit]
  26. Singh, N.; Mathur, A.S.; Gupta, R.P.; Barrow, C.J.; Tuli, D.K.; Puri, M. Enzyme systems of thermophilic anaerobic bacteria for lignocellulosic biomass conversion. Int. J. Biol. Macromol. 2021, 168, 572–590. [Google Scholar] [CrossRef] [Scilit]
  27. Schwarz, W. The cellulosome and cellulose degradation by anaerobic bacteria. Appl. Microbiol. Biotechnol. 2001, 56, 634–649. [Google Scholar] [CrossRef] [Scilit]
  28. Rauf, A.; Khalil, A.A.; Rahman, U.; Khalid, A.; Naz, S.; Shariati, M.A.; Rebezov, M.; Urtecho, E.Z.; de Albuquerque, R.D.D.G.; Anwar, S.; et al. Recent advances in the therapeutic application of short-chain fatty acids (SCFAs): An updated review. Crit. Rev. Food Sci. Nutr. 2022, 62, 6034–6054. [Google Scholar] [CrossRef] [Scilit]
  29. Brame, J.E.; Liddicoat, C.; Abbott, C.A.; Edwards, R.A.; Robinson, J.M.; Gauthier, N.E.; Breed, M.F. The macroecology of butyrate-producing bacteria via metagenomic assessment of butyrate production capacity. Ecol. Evol. 2024, 14, e11239. [Google Scholar] [CrossRef] [Scilit] [PubMed]
  30. Fu, X.; Liu, Z.; Zhu, C.; Mou, H.; Kong, Q. Nondigestible carbohydrates, butyrate, and butyrate-producing bacteria. Crit. Rev. Food Sci. Nutr. 2019, 59, S130–S152. [Google Scholar] [CrossRef] [Scilit] [PubMed]
  31. Flint, H.J.; Scott, K.P.; Duncan, S.H.; Louis, P.; Forano, E. Microbial degradation of complex carbohydrates in the gut. Gut Microbes 2012, 3, 289–306. [Google Scholar] [CrossRef] [Scilit] [PubMed]
  32. Jiang, T.; Wang, Y.; Fan, W.; Lu, Y.; Zhang, G.; Li, J.; Ma, R.; Liu, M.; Shi, J. Intestinal microbiota distribution and changes in different stages of Parkinson’s disease: A meta-analysis, bioinformatics analysis and in vivo simulation. Biosci. Trends 2025, 19, 87–101. [Google Scholar] [CrossRef] [Scilit]
  33. Kwiatkowska, M.; Gołębiewski, M.; Sikora, M.; Rycharska, E.Ł.; Krogulska, A. The oral cavity and intestinal microbiome in children with functional constipation. Sci. Rep. 2024, 14, 8283. [Google Scholar] [CrossRef] [Scilit]
  34. Yang, Y.; Chen, M.; Yang, B.; Huang, X.; Zhang, X.; He, L.; Zhang, J.; Hua, Z. Use of 16S rRNA gene-targeted group-specific primers for real-time PCR analysis of predominant bacteria in mouse feces. Appl. Environ. Microbiol. 2015, 81, 6749–6756. [Google Scholar] [CrossRef] [Scilit]
  35. Dubourg, G.; Lagier, J.-C.; Armougom, F.; Robert, C.; Audoly, G.; Papazian, L.; Raoult, D. High-level colonisation of the human gut by Verrucomicrobia following broad-spectrum antibiotic treatment. Int. J. Antimicrob. Agents 2013, 41, 149–155. [Google Scholar] [CrossRef] [Scilit]
  36. Derrien, M.; Turroni, F.; Ventura, M.; van Sinderen, D. Insights into endogenous Bifidobacterium species in the human gut microbiota during adulthood. Trends Microbiol. 2022, 30, 940–947. [Google Scholar] [CrossRef] [Scilit]
  37. Yi, R.; Shi, Y.; Cao, X.; Pan, C. Actinomycetes: Treasure trove for discovering novel antibiotic candidates. Eur. J. Med. Chem. 2025, 286, 117317. [Google Scholar] [CrossRef] [Scilit]
  38. Fassarella, M.; Blaak, E.E.; Penders, J.; Nauta, A.; Smidt, H.; Zoetendal, E.G. Gut microbiome stability and resilience: Elucidating the response to perturbations in order to modulate gut health. Gut 2021, 70, 595. [Google Scholar] [CrossRef] [Scilit] [PubMed]
  39. Esquivel-Elizondo, S.; Bağcı, C.; Temovska, M.; Jeon, B.S.; Bessarab, I.; Williams, R.B.H.; Huson, D.H.; Angenent, L.T. The isolate Caproiciproducens sp. 7D4C2 produces n-caproate at mildly acidic conditions from hexoses: Genome and rBOX comparison with related strains and chain-elongating bacteria. Front. Microbiol. 2021, 11, 594524. [Google Scholar] [CrossRef] [Scilit] [PubMed]
  40. Rodrigues, V.F.; Elias-Oliveira, J.; Pereira, Í.S.; Pereira, J.A.; Barbosa, S.C.; Machado, M.S.G.; Carlos, D. Akkermansia muciniphila and gut immune system: A good friendship that attenuates inflammatory bowel disease, obesity, and diabetes. Front. Immunol. 2022, 13, 934695. [Google Scholar] [CrossRef] [Scilit]
  41. Khan, S.; Chousalkar, K.K. Salmonella Typhimurium infection disrupts but continuous feeding of Bacillus based probiotic restores gut microbiota in infected hens. J. Anim. Sci. Biotechnol. 2020, 11, 29. [Google Scholar] [CrossRef] [Scilit] [PubMed]
Figure 1. Non-metric multidimensional scaling analysis of (a) rumen microbiota and (b) fecal microbiota between the group received only the basal diet (Control) and the group received the basal diet supplemented with 300 mg kg−1 of D-ribose (D-Ribose).
Microorganisms 13 02505 g001
Figure 2. Linear discriminant analysis effect size bar chart of (a) rumen microbiota and (b) fecal microbiota between the group received only the basal diet (Control) and the group received the basal diet supplemented with 300 mg kg−1 of D-ribose (D-Ribose).
Microorganisms 13 02505 g002
Figure 3. Kyoto Encyclopedia of Genes and Genomes (KEGG) pathway abundance bar chart for metabolic profiling predicted from (a) rumen microbiota and (b) fecal microbiota.
Microorganisms 13 02505 g003
Table 1. Ingredients and nutrient composition of the basal diet.
IngredientProportion, %
Corn25.00
Soybean meal10.50
Wheat bran12.75
Wheat straw28.75
Peanut straw20.00
Calcium hydrogen phosphate1.00
Limestone0.50
Salt0.50
Premix 11.00
Chemical compositionValue
Metabolizable energy 2, MJ kg−110.06
Crude protein, g kg−1130.6
Neutral detergent fiber, g kg−1402.0
Acid detergent fiber, g kg−1245.6
Ether extract, g kg−126.7
Calcium, g kg−18.7
Phosphorus, g kg−15.0
1 Premix provided the following per kg of DM: 1400 mg of Fe, 1200 mg of Zn, 250 mg of Cu, 900 mg of Mn, 100,000 IU of vitamin A, 27,000 IU of vitamin D3, and 800 IU of vitamin E. 2 The metabolizable energy (ME) value of the feed was estimated by summing the products obtained from multiplying the ME values of each feed ingredient by their respective proportions.
Table 2. Effect of dietary D-ribose supplementation on the alpha-diversity of rumen and fecal microbiota.
ItemControlD-RiboseSEMp-ValueEffect Size
Rumen
Chao14459.114747.221260.126−0.383
ACE4459.114747.281260.126−0.383
Shannon index7.467.800.1600.436−0.235
Simpson index0.98390.99570.0040.436−0.235
Pielou’s evenness0.88780.92100.0170.489−0.210
Faith’s PD280.20292.225.590.149−0.358
Feces
Chao15145.115460.671730.214−0.321
ACE5145.165460.691730.214−0.333
Shannon index8.318.230.0750.546−0.185
Simpson index0.99930.99780.0010.5460.185
Pielou’s evenness0.97280.95680.0070.2580.333
Faith’s PD309.21320.557.050.272−0.358
Control, the group received only the basal diet; D-Ribose, the group received the basal diet supplemented with 300 mg kg−1 of D-ribose; SEM, standard error of the mean.
Table 3. Effects of dietary D-ribose supplementation on the composition of rumen microbiota at the phylum level.
Phylum NameControlD-RiboseSEMp-ValueEffect Size
Firmicutes68.8475.894.940.349−0.185
Bacteroidetes17.7013.904.200.7300.111
Actinobacteria10.347.653.620.863−0.062
Proteobacteria2.332.050.2010.4890.210
Planctomycetes0.520.130.1760.2220.358
Acidobacteria0.090.150.0210.059−0.506
Synergistetes0.020.100.0530.4360.235
Verrucomicrobia0.040.020.0100.3870.259
Candidatus Saccharibacteria0.040.020.0110.7300.111
Tenericutes0.010.030.0130.6650.123
Cyanobacteria0.030.0020.0050.0140.679
Spirochaetes0.0040.020.0070.136−0.432
Gemmatimonadetes0.020.010.0050.2970.296
Control, the group received only the basal diet; D-Ribose, the group received the basal diet supplemented with 300 mg kg−1 of D-ribose; SEM, standard error of the mean.
Table 4. Effects of dietary D-ribose supplementation on the composition of fecal microbiota at the phylum level.
Phylum NameControlD-RiboseSEMp-ValueEffect Size
Firmicutes62.0765.553.260.475−0.309
Bacteroidetes29.2326.513.150.5860.383
Proteobacteria2.633.660.4790.436−0.235
Spirochaetes1.892.370.3810.394−0.259
Actinobacteria2.771.280.4730.0500.556
Verrucomicrobia1.090.200.1580.0140.679
Fibrobacteres0.070.210.0520.489−0.210
Acidobacteria0.090.100.0210.610−0.160
Planctomycetes0.090.040.0180.4360.235
Candidatus Saccharibacteria0.040.010.0070.0400.580
Elusimicrobia0.010.030.0080.136−0.420
Cyanobacteria0.010.010.0060.605−0.160
Control, the group received only the basal diet; D-Ribose, the group received the basal diet supplemented with 300 mg kg−1 of D-ribose; SEM, standard error of the mean.
Table 5. Effects of dietary D-ribose supplementation on the composition of rumen microbiota at the genus level.
Genus NameControlD-RiboseSEMp-ValueEffect Size
Prevotella10.989.343.040.931−0.037
Mitsuokella10.502.133.290.3400.284
Butyrivibrio5.266.231.670.796−0.086
Lachnospira4.775.452.170.436−0.235
Bifidobacterium6.101.271.990.6660.136
Enterocloster2.714.590.7750.161−0.407
Eisenbergiella2.503.610.5460.436−0.235
Herbivorax0.844.691.120.019−0.654
Acetivibrio1.913.591.230.340−0.284
Selenomonas3.161.901.560.0940.481
Pseudoscardovia2.212.771.980.136−0.432
Olsenella1.513.281.170.161−0.407
Caproiciproducens4.500.282.210.6660.136
Blautia1.422.550.5200.190−0.383
Agathobacter2.321.430.6500.7300.111
Succiniclasticum0.952.650.5920.113−0.457
Ruminococcus2.141.430.8020.7960.086
Faecalibacterium0.642.531.030.024−0.630
Parabacteroides2.390.770.5430.0940.481
Sodaliphilus1.641.290.5740.6050.160
Roseburia1.431.400.3250.863−0.062
Christensenella1.081.430.3710.730−0.111
Emergencia0.821.200.2190.340−0.284
Control, the group received only the basal diet; D-Ribose, the group received the basal diet supplemented with 300 mg kg−1 of D-ribose; SEM, standard error of the mean.
Table 6. Effects of dietary D-ribose supplementation on the composition of fecal microbiota at the genus level.
Genus NameControlD-RiboseSEMp-ValueEffect Size
Rikenella6.578.132.270.5460.185
Bacteroides5.314.410.5740.2880.333
Christensenella5.393.910.7100.3870.259
Papillibacter4.294.730.4830.539−0.259
Muribaculum4.654.230.5400.6060.259
Ruminococcus2.864.570.6240.190−0.383
Lawsonibacter3.143.790.2020.038−0.531
Oscillibacter3.552.910.3780.2550.407
Phocaeicola2.982.400.4250.931−0.037
Acetatifactor2.023.300.4330.075−0.383
Duncaniella3.741.300.7000.1130.457
Intestinimonas2.412.600.2330.588−0.185
Massilioclostridium1.513.330.3940.004−0.778
Dysosmobacter2.512.170.3850.5600.407
Acetivibrio2.232.360.3001.000−0.012
Treponema1.542.140.2800.161−0.432
Anaerostipes1.262.360.6770.5460.185
Alistipes1.781.680.1240.6110.136
Prevotella1.591.650.3020.8910.012
Flavonifractor1.471.580.2870.4360.235
Bifidobacterium2.030.680.4350.0310.605
Monoglobus1.181.390.1910.472−0.086
Faecalimonas1.171.390.1480.666−0.136
Caproiciproducens1.620.780.1590.0020.778
Eisenbergiella1.061.210.2480.673−0.160
Kineothrix0.861.340.2060.222−0.358
Blautia1.021.040.2870.7960.086
Control, the group received only the basal diet; D-Ribose, the group received the basal diet supplemented with 300 mg kg−1 of D-ribose; SEM, standard error of the mean.
Table 7. Effect of dietary D-ribose supplementation on the relative abundance of the predicted metabolic pathways in the rumen bacterial microbiome of Hu sheep.
Metabolic PathwayControlD-RiboseSEMp-ValueEffect Size
Carbohydrate metabolism16.4816.360.1460.5760.160
Amino acid metabolism13.9413.860.0860.5740.136
Energy metabolism8.628.450.0930.2220.309
Nucleotide metabolism7.537.590.0480.376−0.185
Metabolism of cofactors and vitamins7.207.290.1330.642−0.062
Translation7.217.240.0680.785−0.210
Replication and repair6.266.330.0440.314−0.235
Membrane transport6.036.190.1930.582−0.160
Lipid metabolism3.443.470.0611.0000.012
Signal transduction2.802.920.1080.458−0.185
Cell motility2.782.920.2330.692−0.062
Folding, sorting and degradation2.742.770.0270.359−0.210
Metabolism of other amino acids2.372.300.0330.1940.383
Glycan biosynthesis and metabolism2.302.240.0800.6270.136
Metabolism of terpenoids and polyketides2.112.050.0340.4360.235
Xenobiotics biodegradation and metabolism1.771.630.0460.0770.506
Biosynthesis of other secondary metabolites1.461.440.0320.6320.136
Transcription1.281.380.0450.125−0.457
Cell growth and death1.041.040.0100.7320.210
Control, the group received only the basal diet; D-Ribose, the group received the basal diet supplemented with 300 mg kg−1 of D-ribose; SEM, standard error of the mean.
Table 8. Effect of dietary D-ribose supplementation on the relative abundance of the predicted metabolic pathways in the fecal bacterial microbiome of Hu sheep.
Metabolic PathwayControlD-RiboseSEMp-ValueEffect Size
Carbohydrate metabolism16.0415.990.0830.6910.037
Amino acid metabolism14.1614.130.0720.2220.358
Energy metabolism8.818.780.0450.6740.284
Nucleotide metabolism7.627.590.0290.536−0.136
Translation7.367.360.0330.988−0.086
Metabolism of cofactors and vitamins7.227.180.0430.6660.235
Replication and repair6.416.410.0220.938−0.062
Membrane transport5.405.460.1490.787−0.333
Lipid metabolism3.653.630.0230.4800.259
Folding, sorting and degradation2.892.920.0140.200−0.383
Signal transduction2.572.660.0850.507−0.407
Metabolism of other amino acids2.362.350.0240.6080.259
Cell motility2.282.420.1030.355−0.333
Glycan biosynthesis and metabolism2.322.270.0340.2810.358
Metabolism of terpenoids and polyketides2.212.220.0220.2970.309
Xenobiotics biodegradation and metabolism1.791.760.0340.3400.284
Transcription1.551.580.0200.260−0.309
Biosynthesis of other secondary metabolites1.461.430.0200.3830.259
Cell growth and death1.041.040.0090.8240.160
Control, the group received only the basal diet; D-Ribose, the group received the basal diet supplemented with 300 mg kg−1 of D-ribose; SEM, standard error of the mean.
Disclaimer/Publisher’s Note: The statements, opinions and data contained in all publications are solely those of the individual author(s) and contributor(s) and not of MDPI and/or the editor(s). MDPI and/or the editor(s) disclaim responsibility for any injury to people or property resulting from any ideas, methods, instructions or products referred to in the content.