1. Introduction
One of the primary types of pollution in the modern day is air pollution caused by solid fine and ultrafine particles, which raises concerns. Air pollution by these particles is caused by the active usage of fossil fuels in transportation, industry, and households [
1,
2]. For example, emissions from automobile exhaust, industrial boiler operations, and local household heating systems based on coal or biofuel are the main sources of sub-micrometre-sized solid particle pollution [
3]. In addition, once particles settle on hard surfaces, such as roads, buildings, or indoor surfaces, secondary pollution can be induced by everyday activity or atmospheric conditions [
4]. Therefore, air pollution by solid fine and ultrafine particles is particularly notable in territories with high urbanization, industrialization, and population, meaning that pollution has a high impact on a large number of individuals [
5,
6]. The presence and inhalation of solid fine and ultrafine particles in the human respiratory system can lead to the accumulation of these hazardous particles. The human organism, in most cases, is not able to remove or recycle these particles in a natural way, so the long-term accumulation of particles leads to numerous chronic or acute diseases and even lethal outcomes [
7,
8]. Therefore, pollution by fine and ultrafine solid particles has a serious impact on public health and should be taken seriously and mitigated by advanced air filtration and purification technologies.
Currently, there exist several particle filtration and purification technologies, such as cyclones, HEPA, carbon, or electrostatic filters. However, these technologies are not capable of capturing fine and ultrafine particles [
9,
10,
11]. So, the air, before these technologies are used, must be pre-conditioned in order to increase the number of particles captured. Several existing pre-conditioning technologies are based on the agglomeration of solid particles into larger agglomerates, i.e., thermal, electrostatic, chemical, and magnetic [
12,
13]. The use of these pre-conditioning technologies increases the efficiency of the entire air filtration and purification system. However, the impact and efficiency of these technologies reduce and then the particle sizes are fine and ultra-fine [
14]. Therefore, in order to mitigate this technological drawback, air pre-conditioning by high-intensity acoustic fields, i.e., acoustic, agglomeration, must be used. Acoustic agglomeration, via ultrasonic high-intensity acoustic fields, is capable of inducting agglomeration of fine and ultrafine solid particles via orthokinetic and acoustic wake effects [
15]. The use of acoustic agglomeration leads to the formation of larger particle agglomerates that can be processed by other pre-conditioning technologies or captured by air filtration systems [
16]. Therefore, it can be seen that successful air filtration and purification, especially in the context of fine and ultrafine particles, is a multi-stage process which must include a composition and combination of several different technologies and processes [
17].
However, acoustic agglomeration technology also exhibits several limitations: the fixed frequency of the acoustic field restricts agglomeration efficiency, since real airflow typically contains a wide spectrum of particle sizes [
18]. In addition, a single acoustic field often demonstrates non-uniformity, both in pressure level and distribution across the airflow. As a result, fine and ultrafine particles are affected by uneven acoustic forces, leading to variable agglomeration levels that depend on the distance from the acoustic pressure source [
19]. To address these limitations, the ultrasonic agglomeration process requires solutions that enable effective interaction with a wider spectrum of fine and ultrafine particle sizes through the use of higher-frequency acoustic fields, as well as improved uniformity of acoustic pressure distribution throughout the airflow [
20,
21]. This may be achieved by employing standing-wave fields or interference fields generated by multiple acoustic sources [
22]. Recent state-of-the-art studies propose several approaches that aim, either fully or partially, at overcoming these challenges.
Ono et al. designed and analyzed a compact agglomeration chamber that is composed of two ultrasonic pressure sources [
23]. The chamber was equipped with ultrasonic transducers operating under harmonic excitation, positioned both in line and opposite to the airflow direction. Along its length, the chamber’s internal volume varied from 8.4 to 76 cm
3, while its other geometric parameters remained constant. This configuration enabled control increase time during which particles remained in the acoustic field and as a result allowed the agglomeration efficiency to be investigated under different time ranges in the acoustic field. The results of simulations and experimental investigations showed that the agglomeration performance of the chamber directly depended on its volume and the acoustic pressure levels generated. It was found that agglomeration efficiency varied from about 15% at an input of 2 W to 60% when the input power reached 6 W. As a result, the authors concluded that higher input power leads to greater agglomeration efficiency, with both the acoustic pressure levels and the exposure time of particles in the acoustic field being critical parameters of the process efficiency.
Chen et al. reported on the results of investigations on the acoustic agglomeration of solid particles in conditions where the frequency of the acoustic field was not constant, but varied over time [
24]. The study combined theoretical modelling with experimental validation, indicating how variations in frequency, acoustic power, and initial mass concentration of fine particles affect the agglomeration process. The experimental investigations were performed under three cases, i.e., a case, with a constant-frequency mode at 6 kHz; a mode where the frequency was decreased from 6 kHz to 1 kHz over 30 s; and a case where the frequency increased from 1 kHz to 6 kHz within the same time range. In all cases, the acoustic pressure source was driven by a harmonic signal. Experimental investigations were performed so that the acoustic pressure was applied to the airflow direction, thereby extending the presence time of the droplets in the acoustic field. The results of the investigations show that the case with continuously decreasing frequency demonstrated around 8% higher agglomeration efficiency compared to the fixed-frequency case. Additionally, the experiments showed that the size of droplets in the airflow increased under acoustic influence, leading to a deviation from the optimal frequency associated with maximum collision and interaction rates.
Hoda et al. designed and investigated an ultrasonic agglomeration chamber based on a cylindrical acoustic radiator that generates pressure waves perpendicular to the airflow [
25]. The chamber’s operation is based on the excitation of the cylinder-shaped radiator in its radial mode with a 27.5 kHz Langevin transducer driven by a harmonic signal. This excitation created a focused acoustic pressure zone on the chamber’s horizontal axis of symmetry. This distribution of the acoustic field ensured that the particles were pushed into a high-pressure zone. Such localization notably increased the possibility of particle collisions and interactions and as a result improved the agglomeration process. Numerical and experimental investigations have shown that this approach can achieve agglomeration efficiencies of up to 86% and highlighted the potential of acoustic pressure concentration in narrow zones as a solution for improving agglomeration efficiency.
This paper represents the results of numerical and experimental investigations related to the development and investigation of a cylindrical acoustic agglomeration chamber based on a high-frequency interference acoustic field generated by three ultrasonic acoustic pressure sources with an angular distribution of 120° around the chamber’s horizontal axis of symmetry. Employment of an interference acoustic field, created from three in-phase acoustic fields, ensures the possibility of obtaining more even acoustic pressure distribution across the agglomeration chamber and inducts a constructive interference effect, which leads to an increase in acoustic pressure levels and ensures an even distribution of high- and low-acoustic-pressure zones across the entire cross section of the acoustic agglomeration chamber.
2. Design and Operation Principle of the Acoustic Agglomeration Chamber
The ultrasonic agglomeration chamber is based on a cylindrical body with external and internal diameters of 150 mm and 149,70 mm, respectively. In addition, the chamber contains three sources of ultrasonic acoustic pressure with an angular distance to the nearby source of 120°. The ultrasonic acoustic pressure sources are composed of a Langevin transducer and disc-shaped acoustic pressure radiators which are connected to the transducers via thread. The ultrasonic acoustic pressure sources are evenly distributed around the horizontal axis of the cylindrical body of the chamber, while the clamping of the sources is based on a fixation made of polylactide plastic (PLA). The fixators are fixed to the body by three M3 bolts while the sources, via clamping discs, are mounted to the fixators.
Figure 1 represents the full structural design of the ultrasonic agglomeration chamber.
As shown in
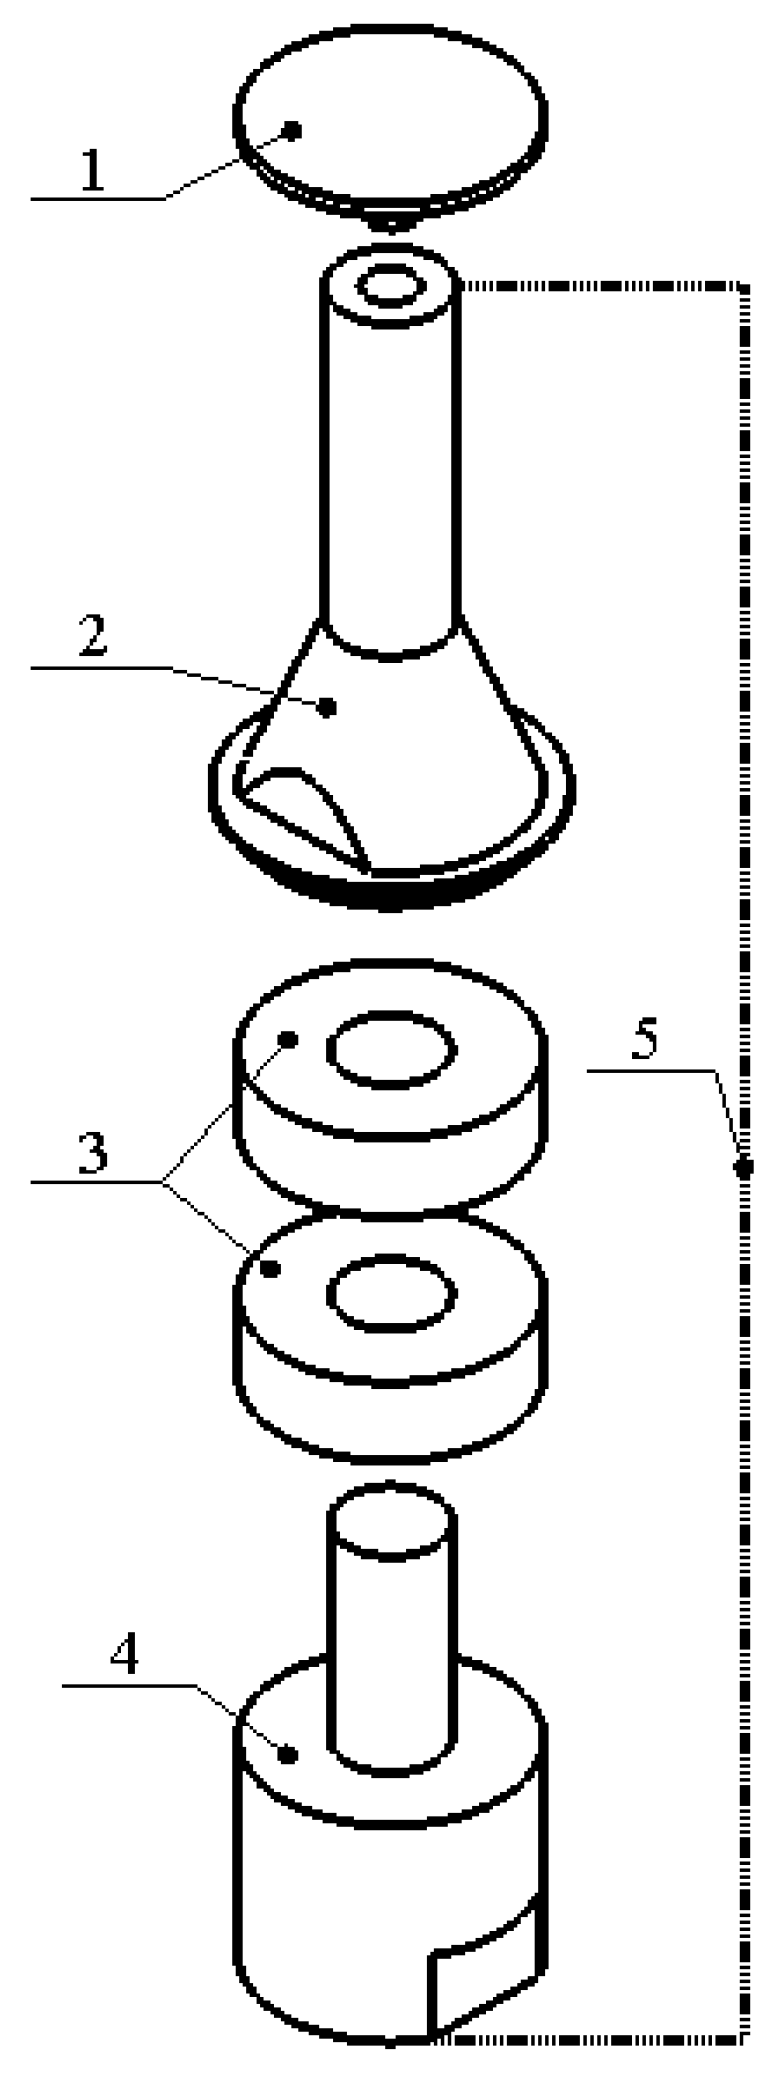
Figure 1, the chamber contains three ultrasonic acoustic pressure sources (UAPSs), each employing a Langevin-type transducer coupled with a disc-shaped acoustic pressure radiator. The transducer design is based on the classical half-wavelength resonance principle, wherein the transducer length—including the piezoceramic rings, horn, and backend mass—is designed to resonate at approximately half the wavelength of the target ultrasonic frequency in the respective materials. This ensures maximum vibrational efficiency and minimizes energy loss due to impedance mismatches [
26]. So, the transducer consists of a stepped horn and an integrated clamping ring, both manufactured from high-grade aluminum alloy for optimal acoustic transmission and mechanical robustness. The two hard piezoceramic rings were selected in order to obtain high electromechanical coupling coefficients [
27]. The entire assembly is pre-stressed using a stud which is made as part of the backend mass to enhance structural integrity and ensure effective coupling of vibrational energy. As shown in
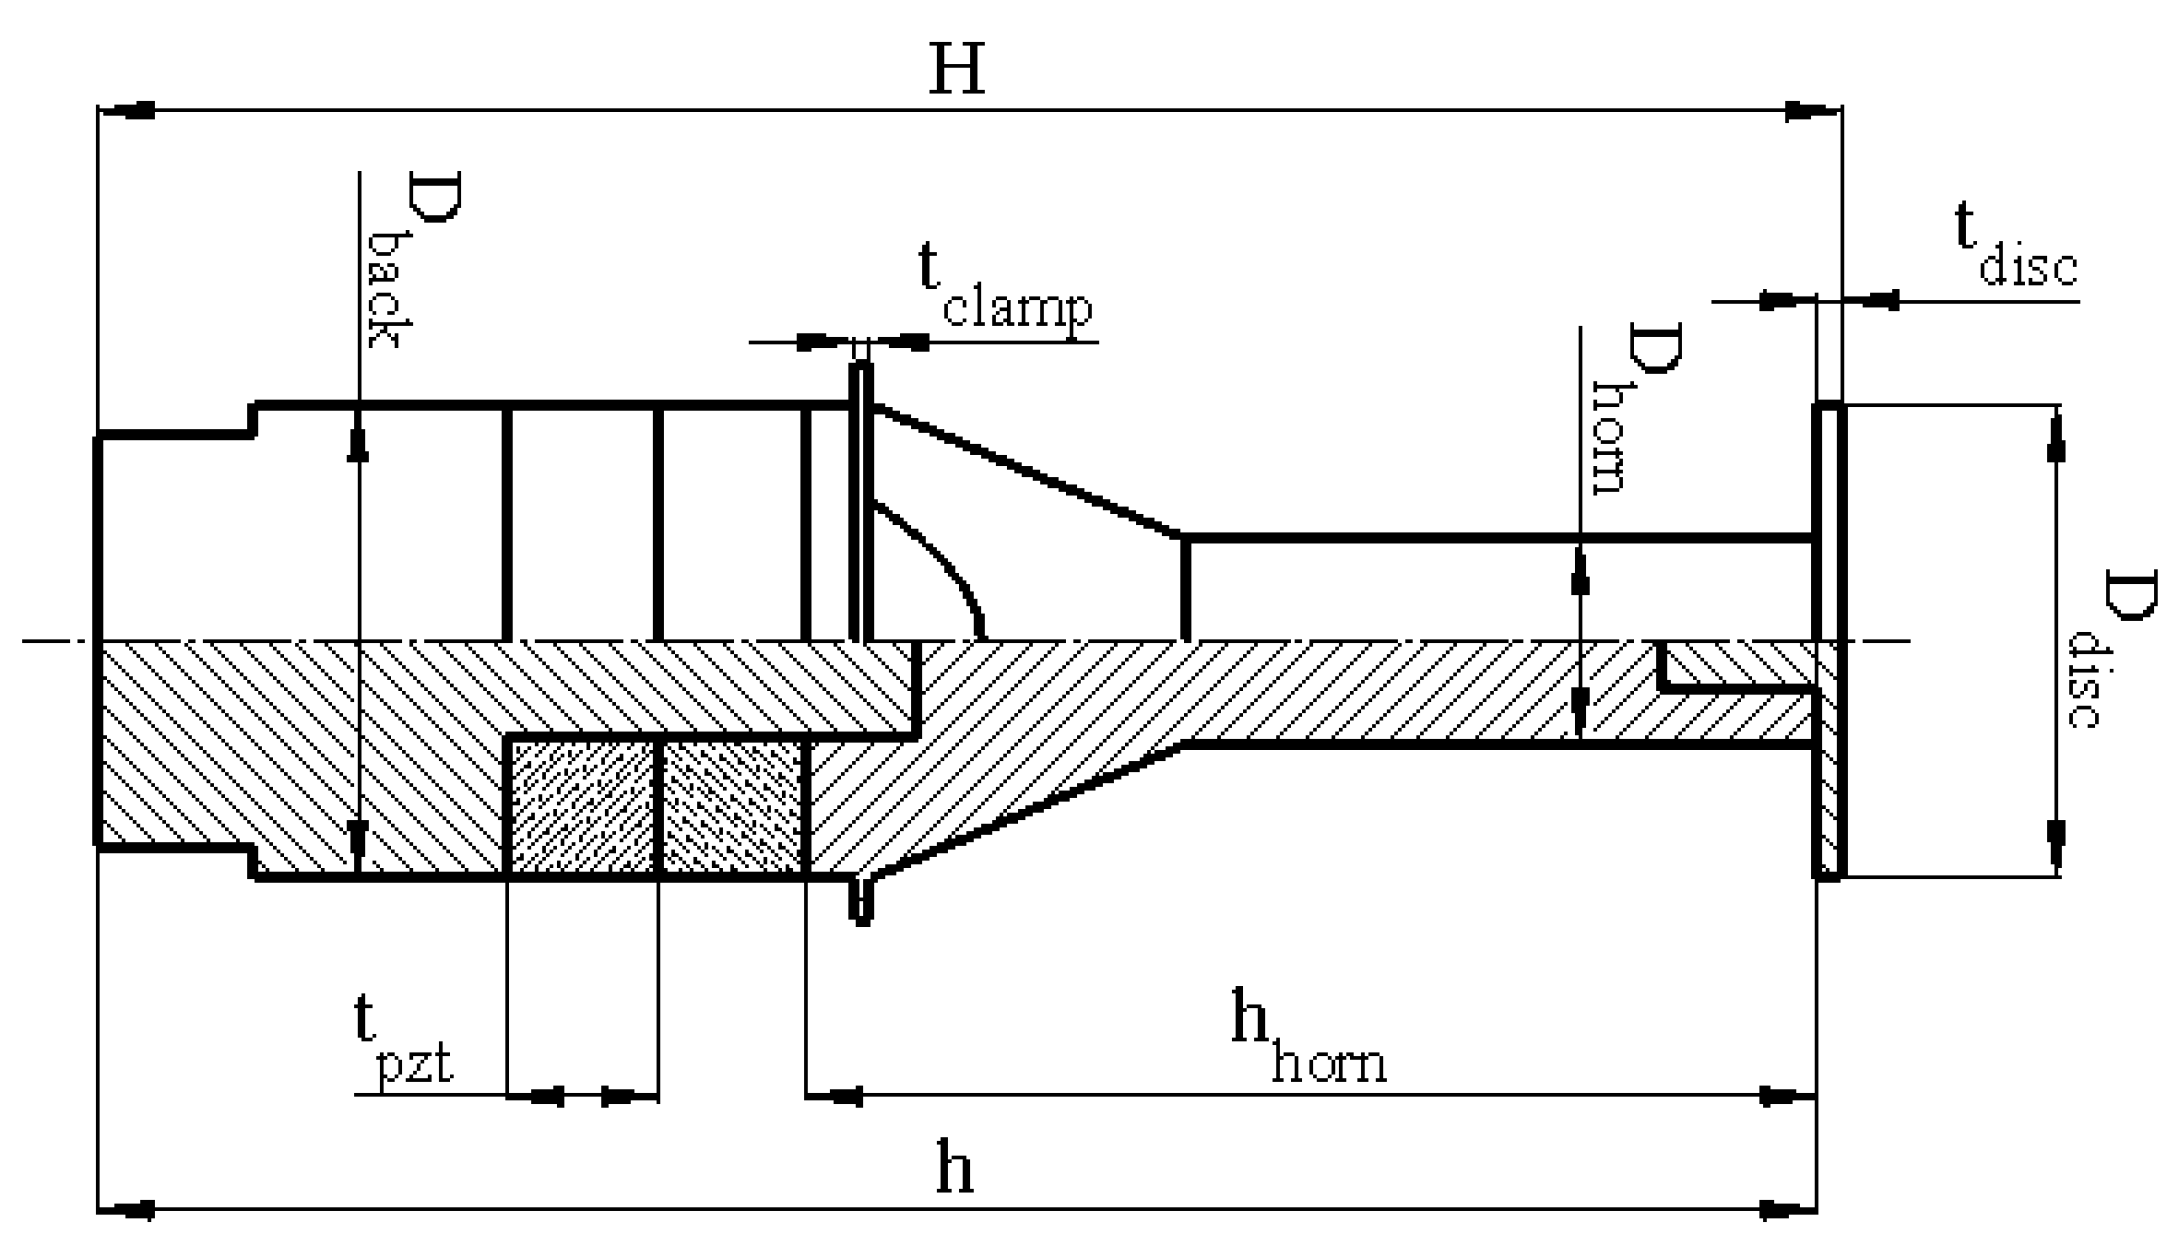
Figure 2, a disc-shaped radiator is mounted to the horn’s tip via threaded connection. The horn itself provides a displacement amplification factor of 2.31, concentrating longitudinal vibrations into the radiator while the clamping ring is positioned at the node of the first longitudinal vibration mode of the transducer, enabling stable mounting while minimizing damping of the structure. To achieve efficient acoustic pressure generation, the disc radiator geometry was carefully designed. Its radius, thickness, and attachment interface were calculated such that its fundamental bending mode frequency coincides with the horn–transducer’s longitudinal resonance frequency. This ensures superposition of the resonances and ensures smooth transfer of vibrational energy from the transducer’s longitudinal vibrations into to bending vibrations of the disc, thereby maximizing the acoustic output of the system. The detailed geometric parameters of the ultrasonic acoustic pressure source are presented in
Figure 3 and
Table 1.
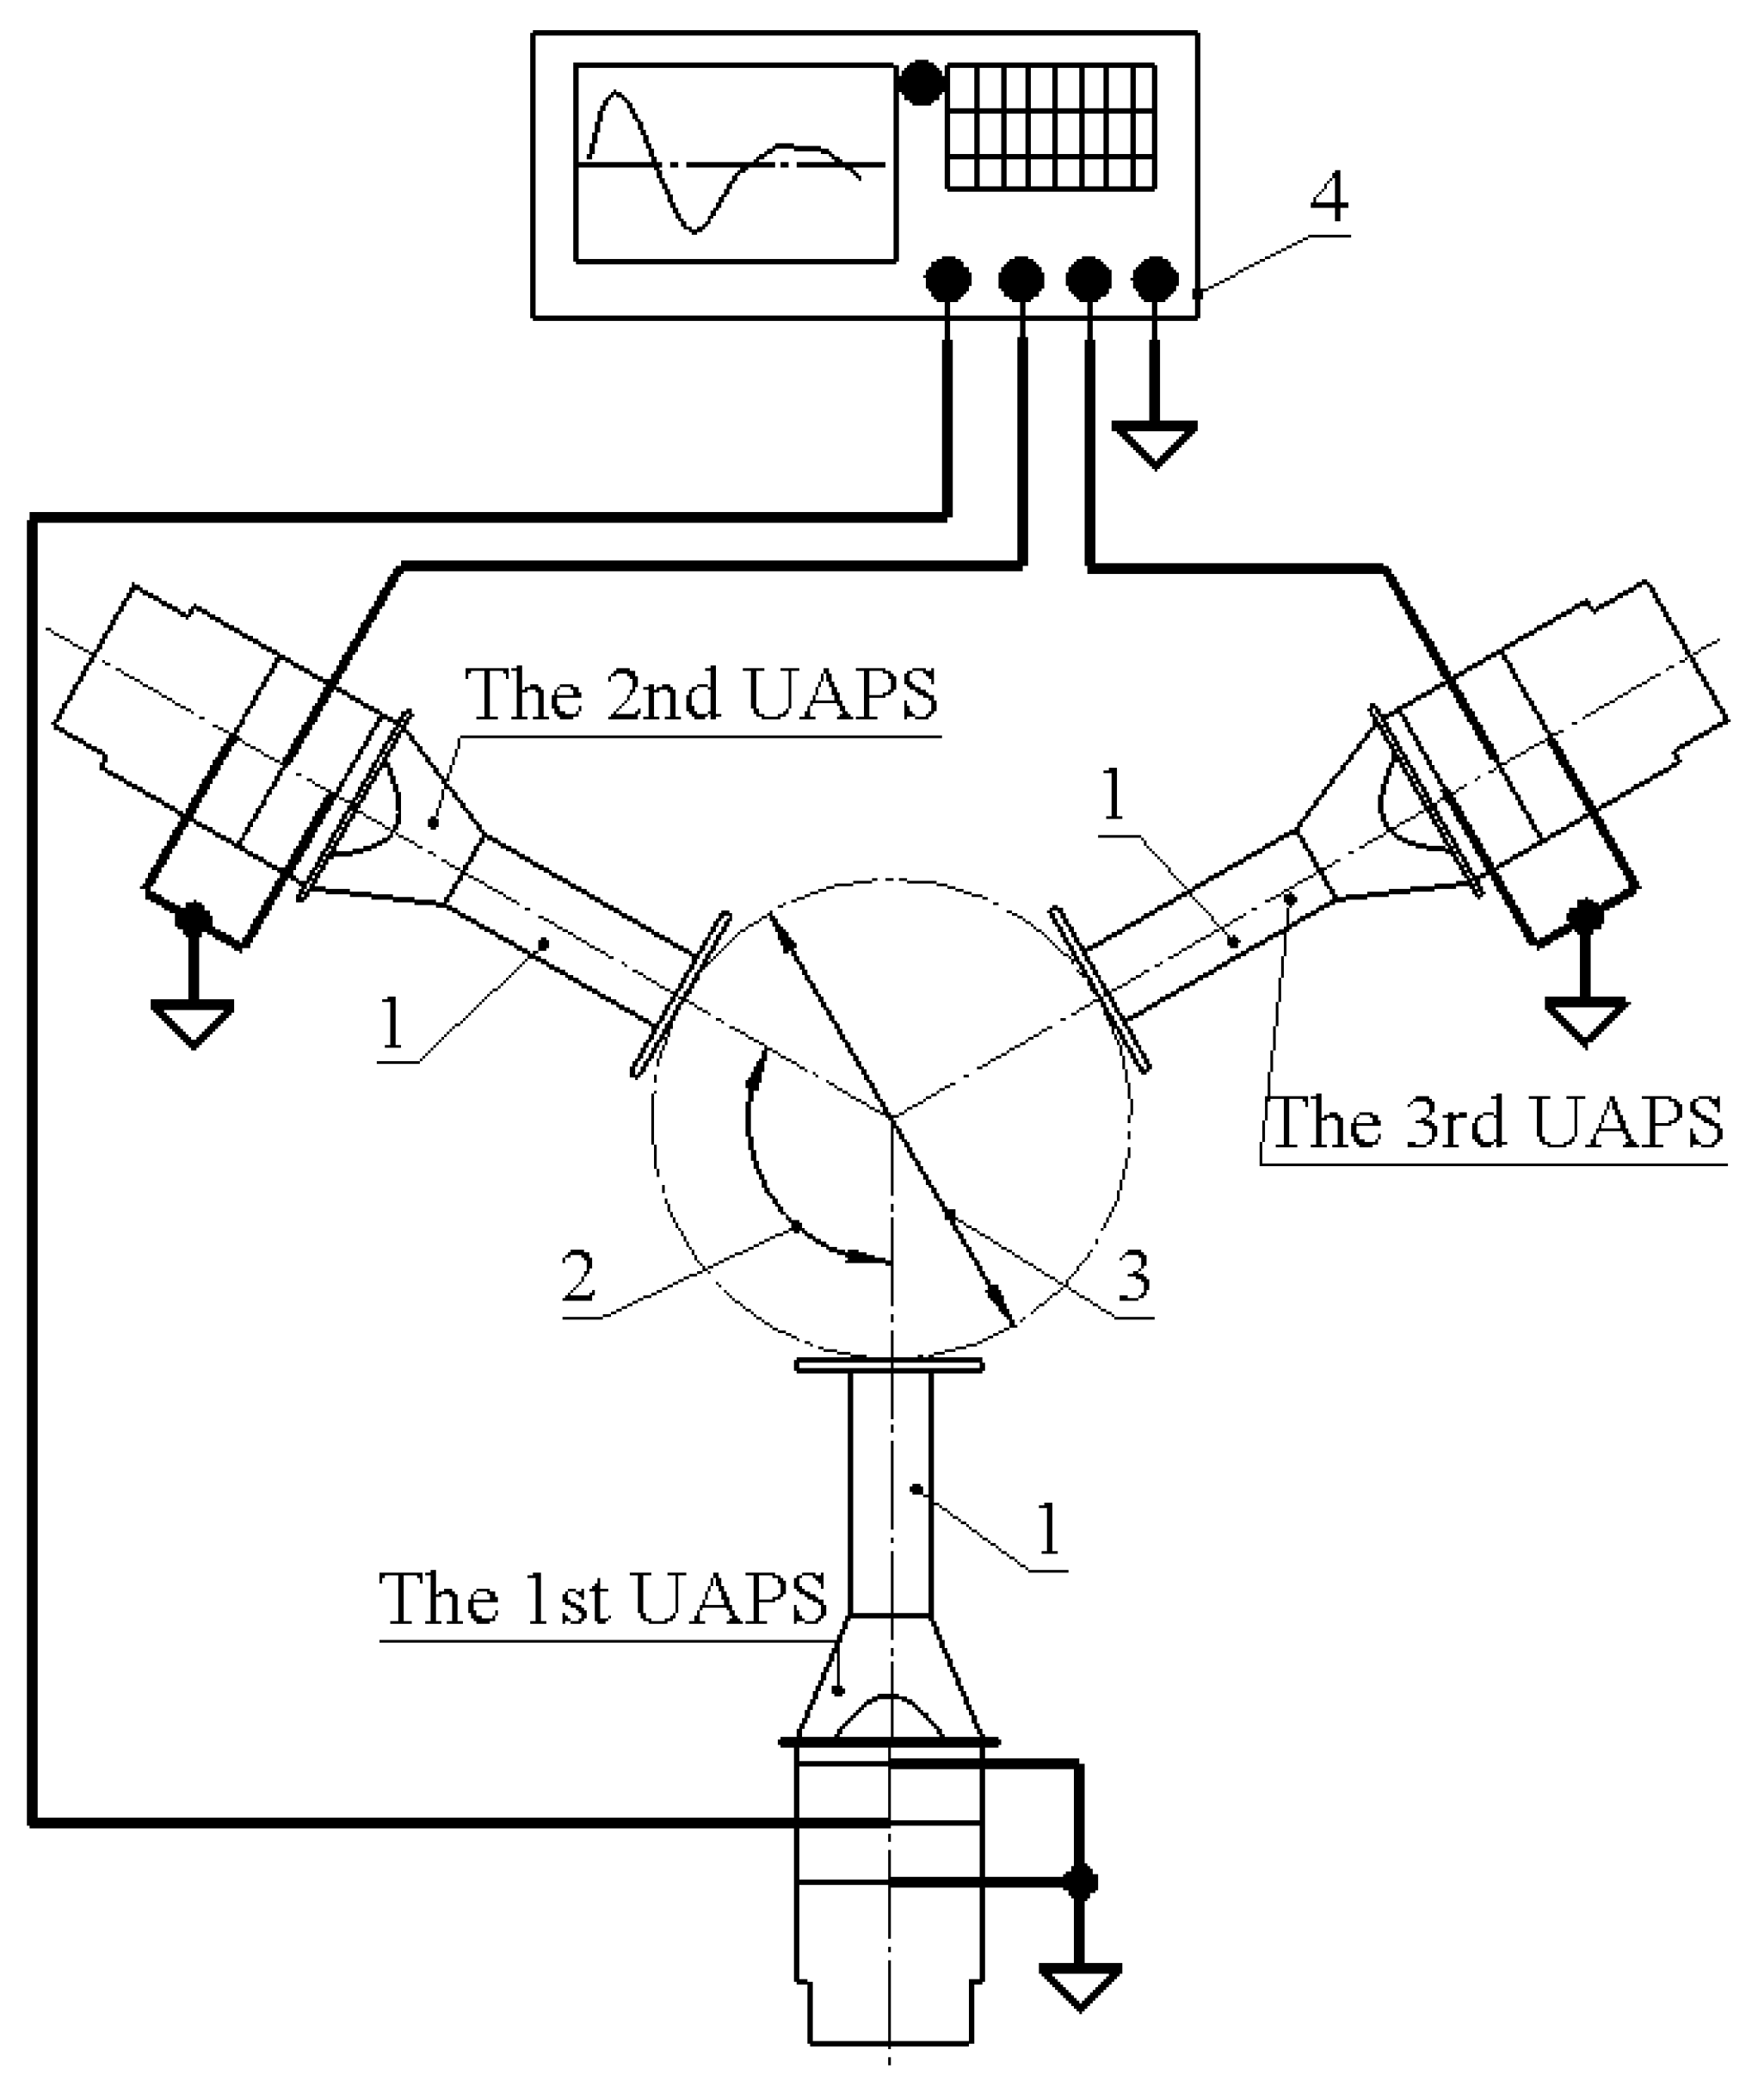
As mentioned above, the operation of the ultrasonic acoustic pressure source is based on the superposition of the first longitudinal vibration mode of the Langevin transducer and the first bending mode of the disc-shaped radiator. The creation of acoustic pressure inside the agglomeration chamber is based on three in-phase harmonic signals with frequencies equal to the resonance frequencies of the acoustic pressure sources. During the conversion of longitudinal vibrations to bending vibrations of the acoustic pressure radiator, the radiator creates an acoustic field with a frequency equal to the frequency of vibrations excited by the signal. Each acoustic pressure source is driven individually, while due to manufacturing or assembly errors and mismatches in geometry, as well as slight differences in clamping forces, each source has slightly different resonance frequency. The excitation schematics of the acoustic agglomeration chamber are shown in
Figure 4.
Therefore, parallel excitation of three acoustic pressure sources creates three acoustic fields that are supplied to the agglomeration chamber under angles of 120°, creating an interference acoustic field with a pattern which exhibits high-density acoustic pressure nodes with high and low pressure levels, and increased sound pressure levels via constructive interference. These two aspects positively influence the acoustic agglomeration process via the increased effect of acoustic pressure on particles across all cross sections of the acoustic agglomeration chamber, as well as increasing acoustic pressure levels.
3. Numerical Investigation of Ultrasonic Acoustic Agglomeration Chamber
Numerical investigations were performed in order to indicate the electromechanical characteristics of the acoustic pressure source, the acoustic pressure, i.e., sound, pressure levels (SPLs), and interference acoustic field patterns, as well as the acoustic characteristics created inside the ultrasonic agglomeration chamber. For this purpose, numerical models of the acoustic pressure source and ultrasonic agglomeration chamber were built using COMSOL Multiphysics 6.1. So, firstly, a numerical model of the ultrasonic acoustic pressure source was built. The concentrator and backend of the Langevin transducer were set as 6061 T6 aluminum, the piezoelectric rings were set as the hard piezoelectric material PIC 181, and the disc-shaped acoustic pressure radiator was set as 6061 T6 aluminum. The material characteristics used in the numerical model are given in
Table 2. The boundary conditions were set as follows: the external surface of the clamping ring of the ultrasonic acoustic pressure source was rigidly fixed, while the excitation signal amplitude of the source was set to 125 V
p-p and applied between two piezoceramic rings. The outer surfaces of the piezoceramic rings, in contact with the body of the ultrasonic acoustic pressure source, were set as neutral.
The first stage of the numerical investigation was dedicated to the modal analysis of the ultrasonic acoustic pressure source with the aim of indicating the natural frequency of the vibration mode suitable for the operation. The results of the calculations are shown in
Figure 5, showing that the modal shape of the source at 49.71 kHz is suitable for acoustic pressure generation, i.e., the, longitudinal vibrations of the Langevin transducer, via the step horn, are transferred to the disc-shaped acoustic pressure radiator which converts longitudinal vibrations to bending vibrations and creates acoustic pressure as a result.
The next stage of the numerical investigation was dedicated to calculations of the impedance and phase frequency characteristics of the ultrasonic acoustic pressure source. The boundary conditions for these calculations were set as in the previous case, while the frequency range under analysis, considering the results of the modal analysis, was set from 49.4 to 50.5 kHz with increment steps of 5 Hz. The results of the calculations are shown in
Figure 6.
As can be seen in
Figure 6, the resonance frequency of the ultrasonic acoustic pressure source is 49.71 kHz with a 152.77 Ω impedance value, while the anti-resonance is 50.23 kHz with a 259 kΩ impedance value. The value of the resonance frequency confirms the results of the modal analysis. In addition, a phase change can be found from −90° to 85° and indicates that the transducer is in resonance. This behaviour demonstrates that the ultrasonic acoustic pressure source exhibits good resonance characteristics and effective energy conversion. Finally, on the basis of the characteristics, the effective coupling coefficient (
keff) was calculated and reached 0.144. Therefore, on the basis of these results, it can be concluded that the ultrasonic acoustic pressure source is suitable for the acoustic agglomeration chamber and is capable of providing acoustic pressure at a frequency of 49.41 kHz.
The next stage of numerical investigations was dedicated to calculating the chamber’s acoustic characteristics and indicating interference field patterns while the ultrasonic acoustic pressure sources were driven by their resonance frequency. For this purpose, a numerical model of the acoustic agglomeration chamber was built. Boundary conditions for ultrasonic acoustic pressure sources were set as in the previous cases, while three sources were placed as in
Figure 4, i.e., the angular, distance between sources was set to 120° while the internal diameter of the chamber was set to 149.75 mm. The volume between acoustic pressure sources was filled with air medium with an initial pressure of 101.32 kPa and a temperature of 23 °C. Therefore, the first stage of numerical investigation was dedicated to the calculation of SPL values and acoustic field patterns then all acoustic pressure source were driven by harmonic signal with frequency equal to resonance frequency. The calculations were performed in the frequency range from 49.25 kHz to 49.75 kHz with frequency increment steps of 5 Hz, while the excitation signal amplitude was set in range from 25 V
p-p to 125 V
p-p with amplitude increment step of 25 V
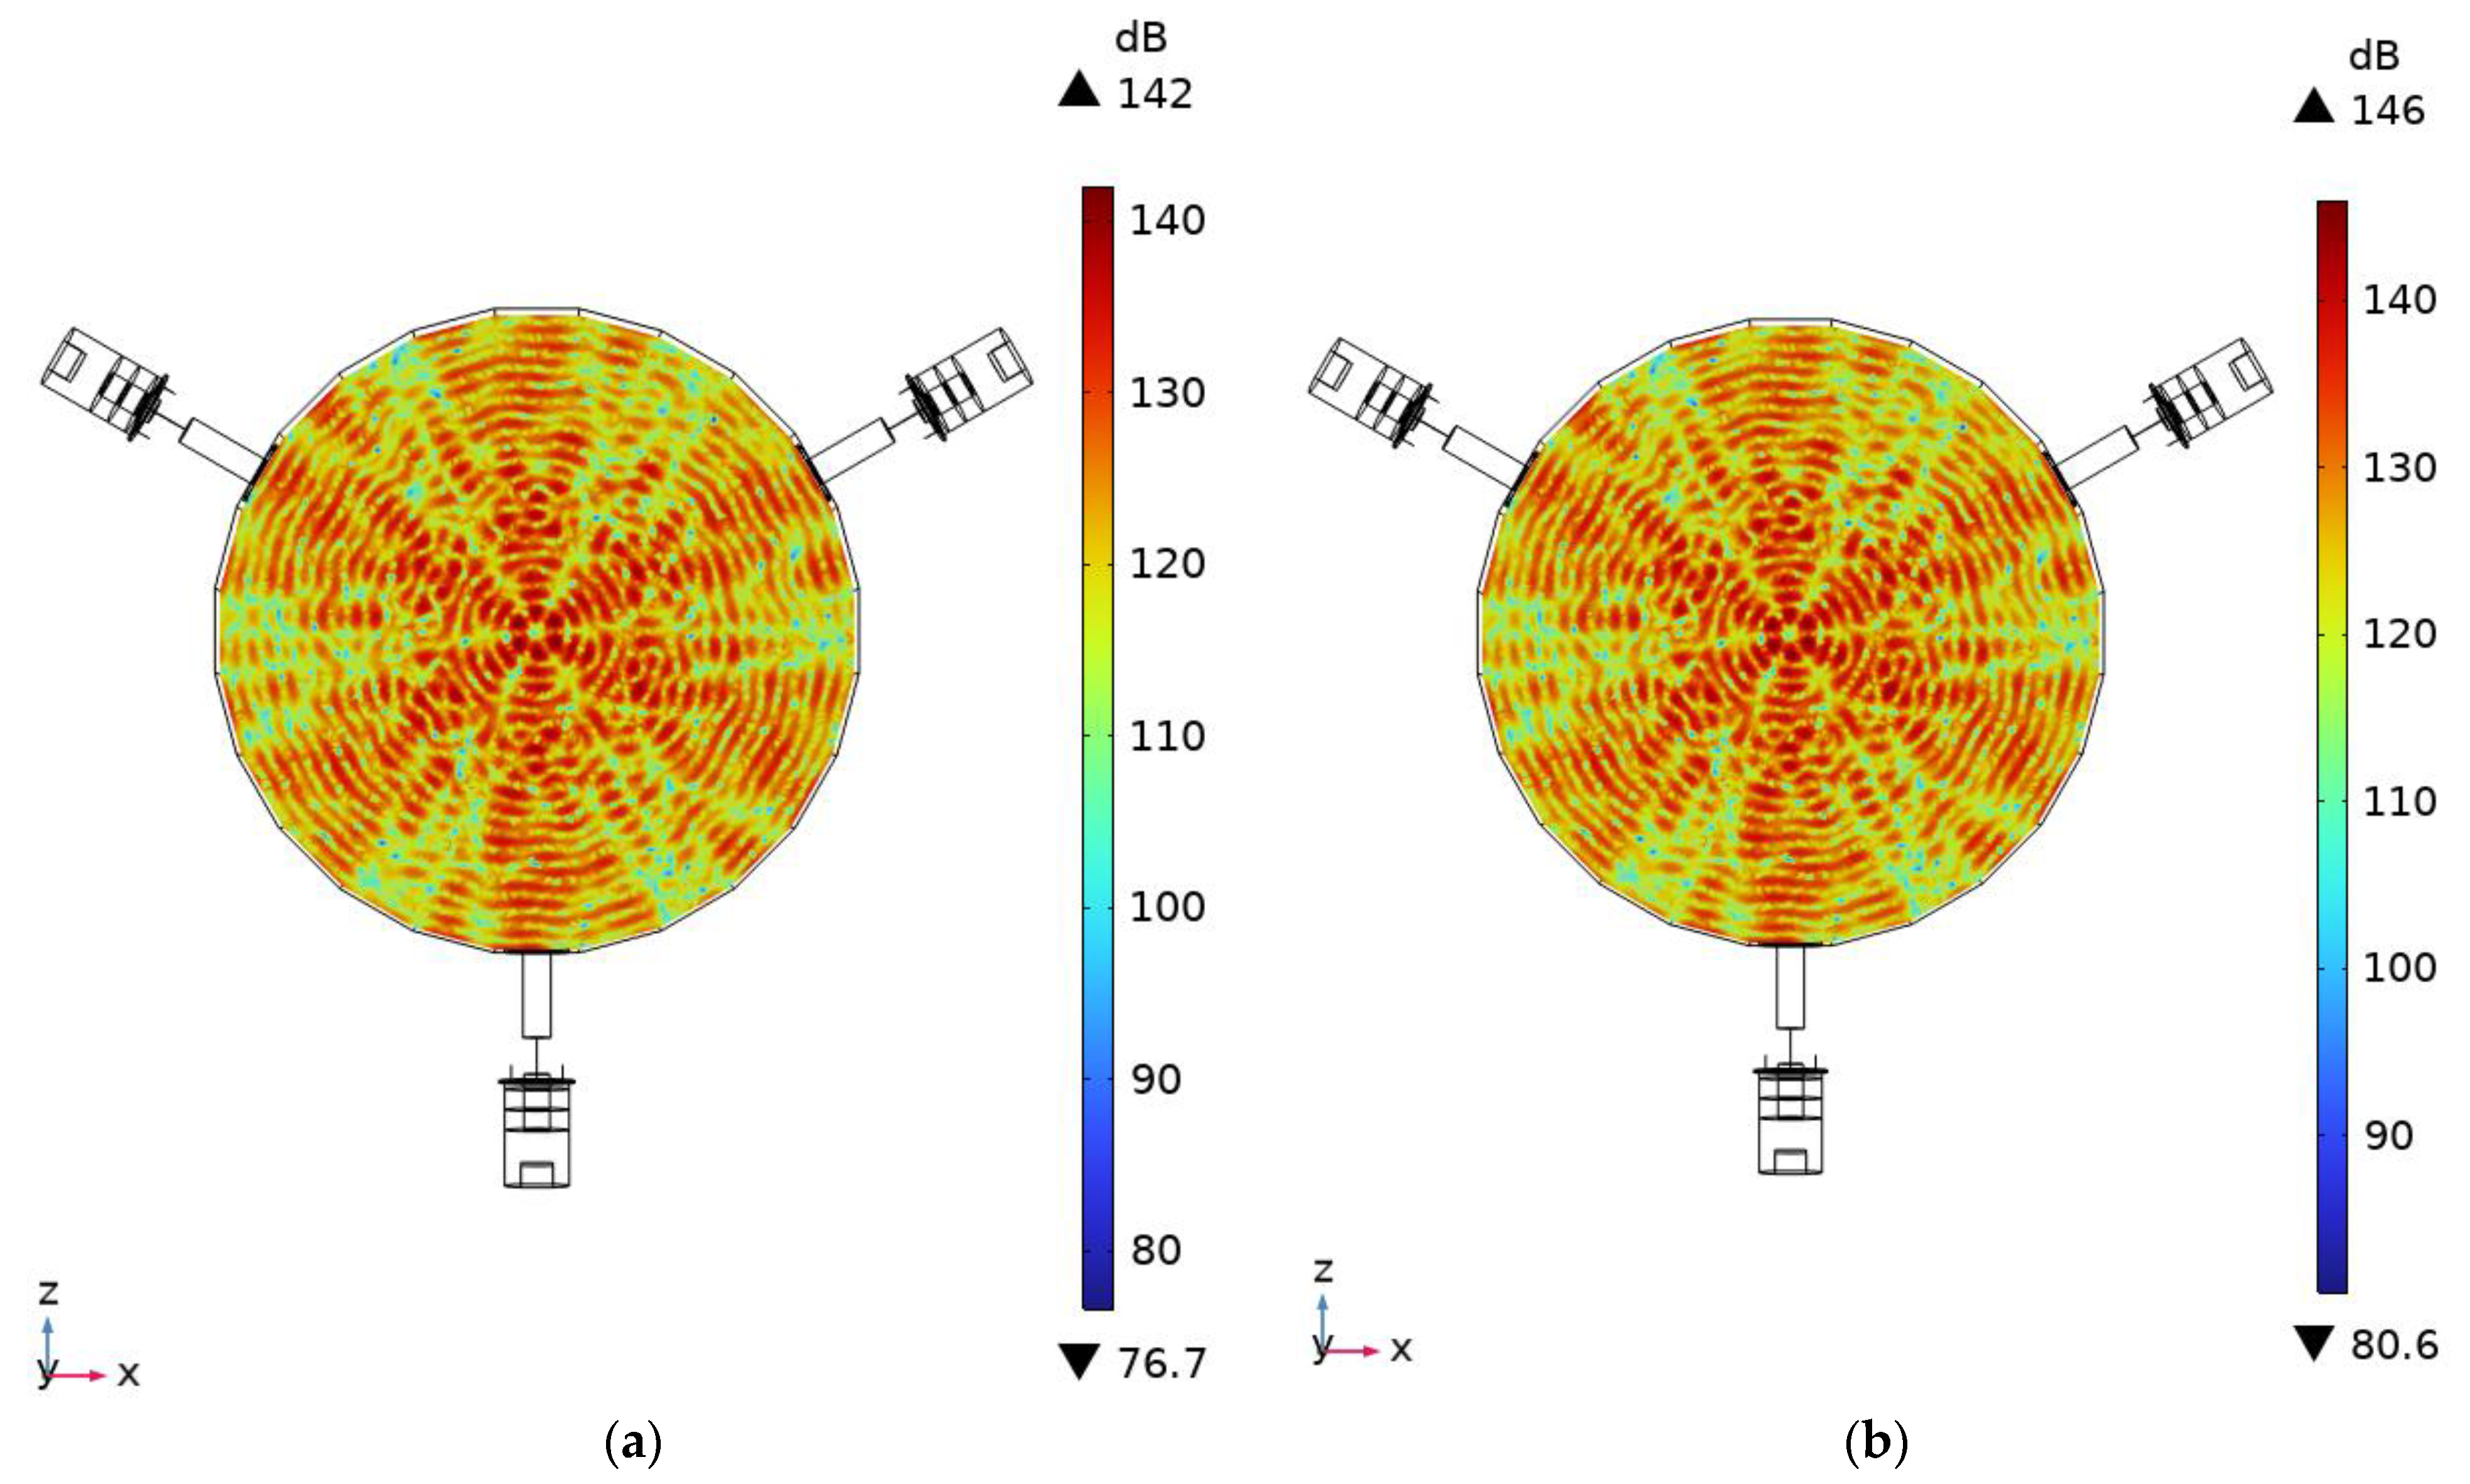
p-p. So, with this calculation setup, the SPL values and their distribution patterns in the agglomeration chamber at different excitation signal amplitudes were calculated. The results of calculations while the excitation signal amplitude was set to 25 V
p-p and to 125 V
p-p are given in
Figure 7.
As can be seen in
Figure 7, the maximum and minimum SPL values when the excitation signal amplitude was set to 25 V
p-p reached 142 dB and 76.7 dB, respectively. On the other hand, the maximum and minimum SPL values at 125 V
p-p reached 146 dB and 80.6 dB, respectively. These values were obtained while the excitation signal frequency was 49.71 kHz. Also, in both cases, it can be found that the pattern of the acoustic field is generated from three acoustic fields and their reflections, which results in an interference acoustic field, ensuring high SPL values via constructive interference. Moreover, the interference acoustic field ensures the even distribution of SPL values across the agglomeration chamber, which ensures the acoustic field has a more even effect on fine and ultrafine particles which are randomly distributed in the airflow. Moreover, an analysis of the interference field pattern shows that the pressure will push the particles from the edge of the chamber to the centre of it, i.e., to, zone with the highest SPLs, which will promote orthokinetic and wake effects of the agglomeration process, which will also positively affect the agglomeration process. So, in order to fully represent the SPL values and their distribution across the agglomeration chamber while different excitation signal amplitudes were used to drive the ultrasonic acoustic pressure sources, the area coverage of different SPL values was calculated. The results of the calculations are shown in
Figure 8.
Firstly, the total area of the cross section of the agglomeration chamber is 176.1 cm
2 or 17,614.2 mm
2. As can be seen in
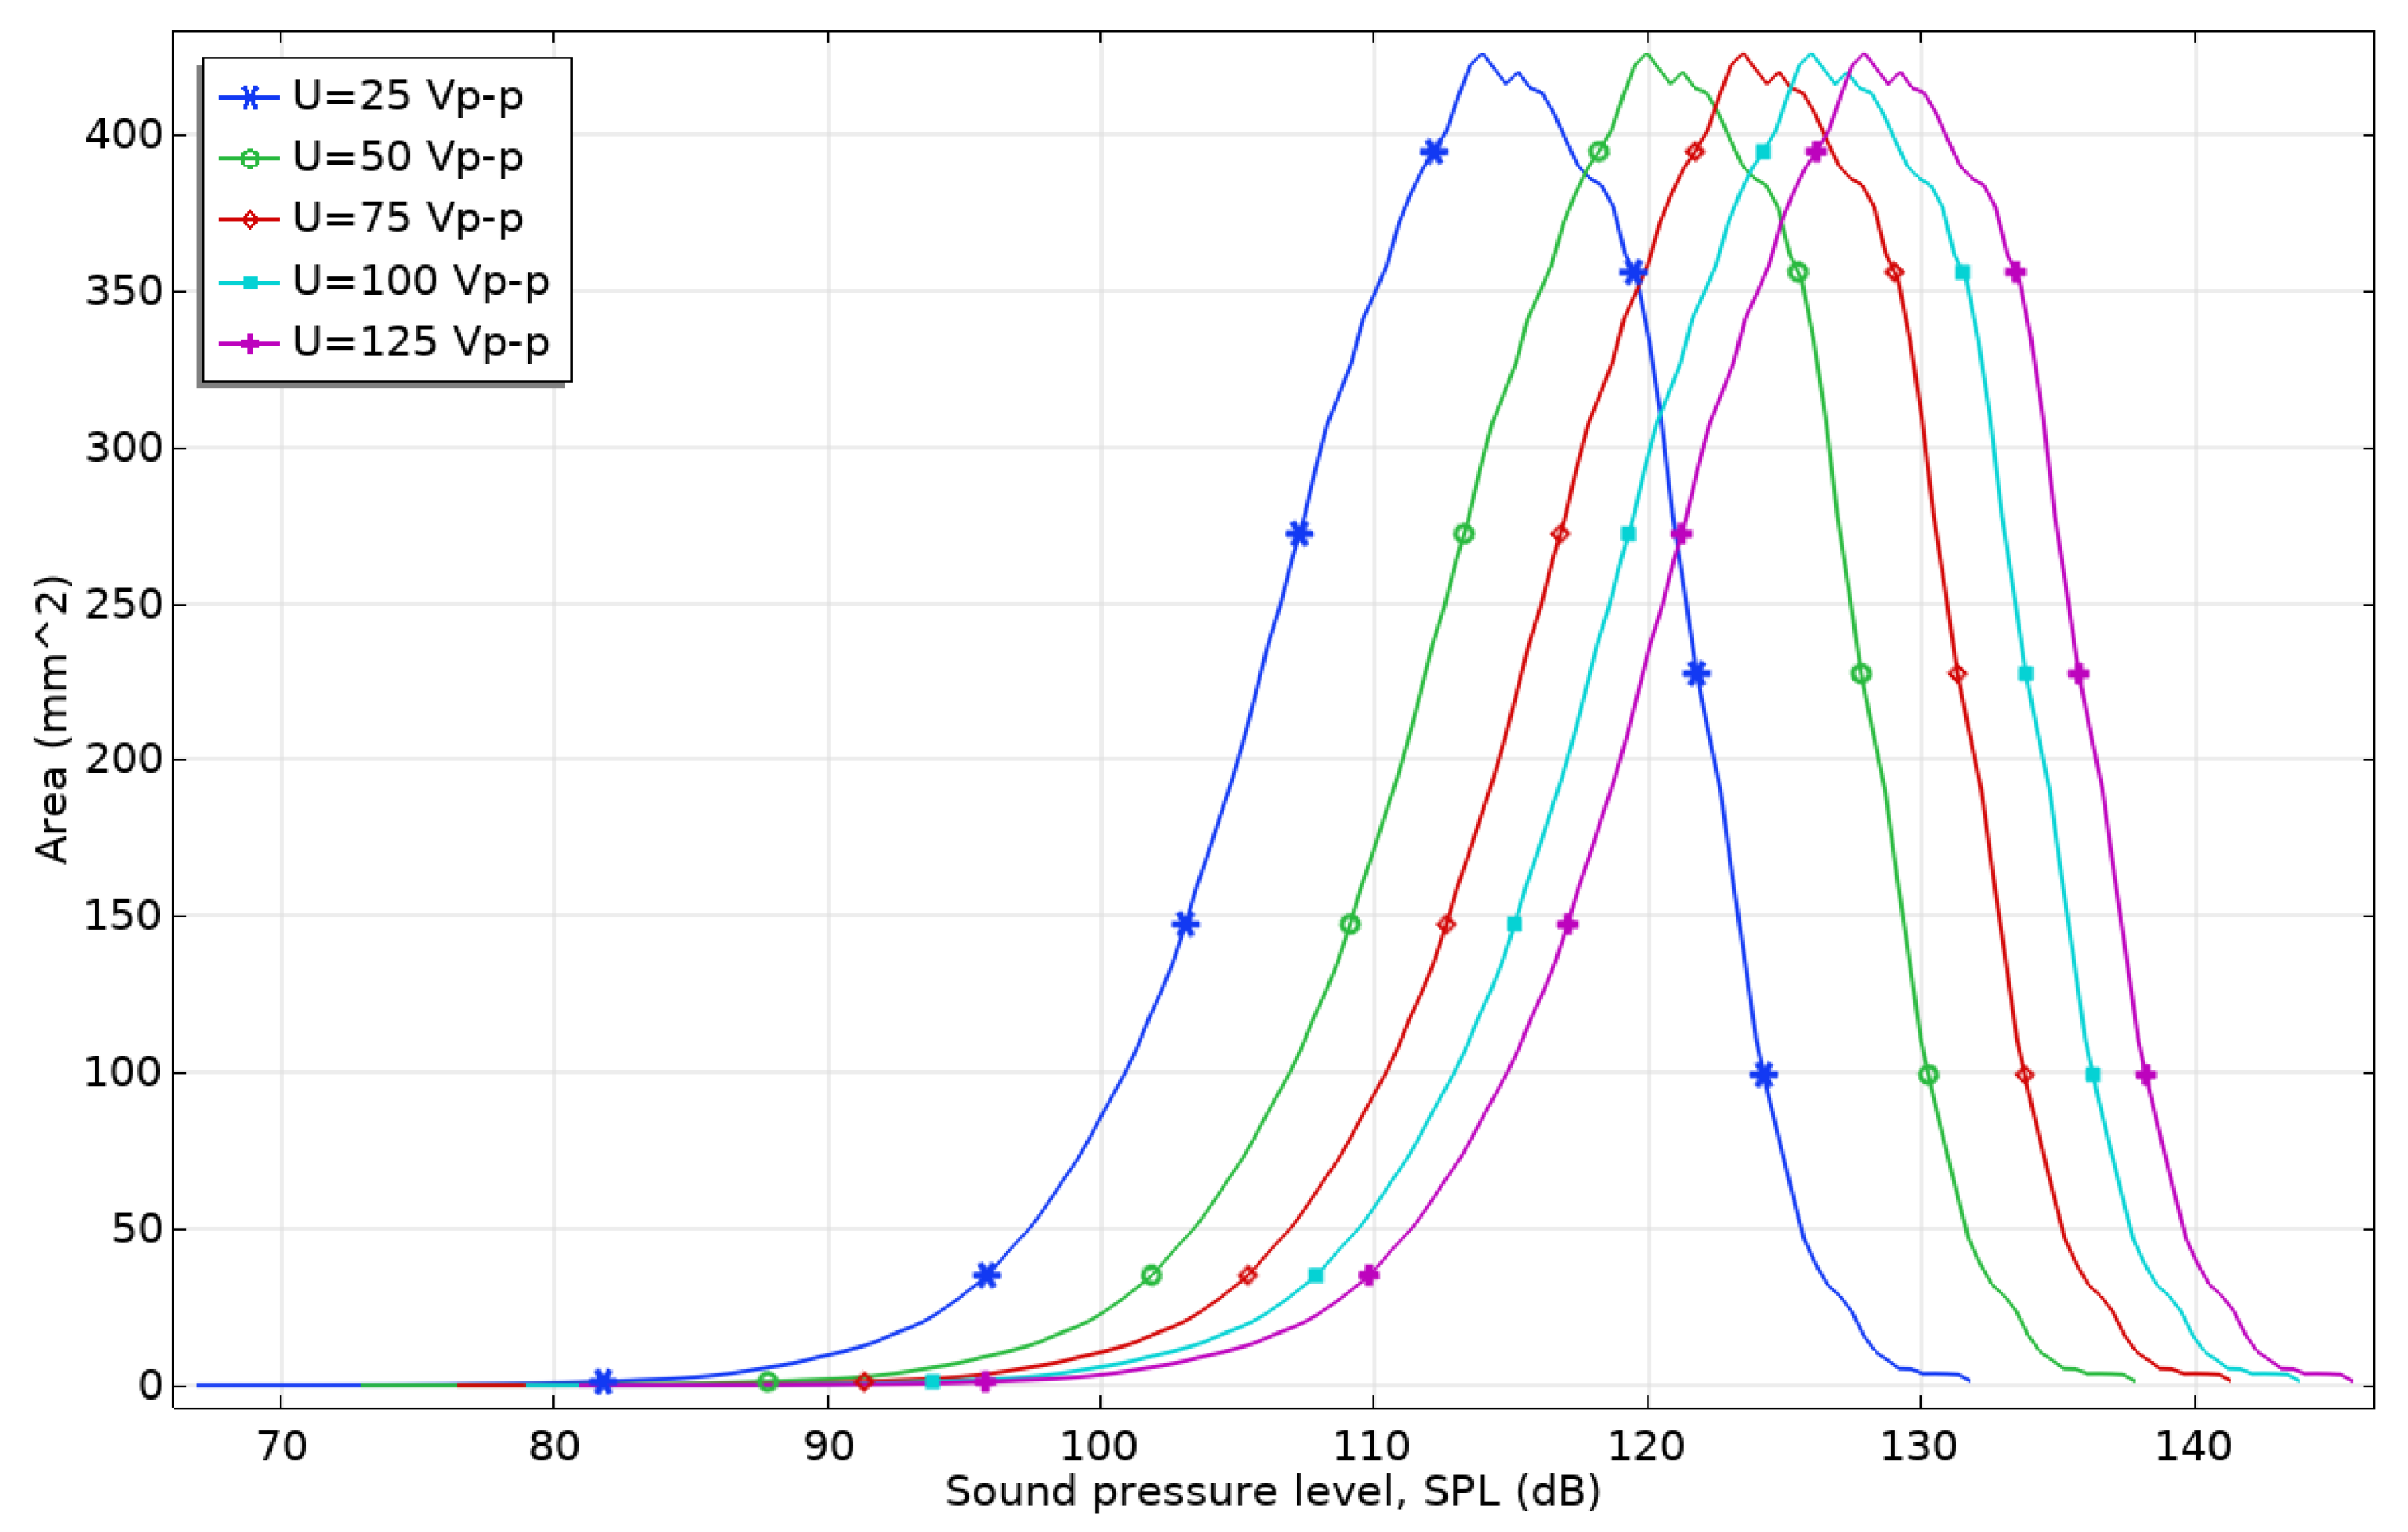
Figure 8, the dominant SPLs at all excitation signal amplitudes were 430 mm
2 or around 2.5% of the agglomeration chamber cross section area. However, the analysis of the entire SPL value distribution show that high SPL values, i.e., from, 100 dB to 146 dB, make up almost the entire cross section of the agglomeration chamber. This shows that high SPL values are properly distributed across the agglomeration chamber and are able to ensure an almost even effect of pressure on particles at different positions in the airflow.
Figure 8 also shows that the dominant SPL values shift from 113 dB at 25 V
p-p to 128 dB at 125 V
p-p, i.e., 15 dB, while the change in excitation voltage is 100 V
p-p or 0.15 dB/V
p-p. Also, on the basis of
Figure 8, it can be found that the coverage level within the chamber is closely tied to the extent of constructive interference generated by the acoustic fields. At lower excitation signal levels, the regions of constructive interference are smaller, leading to lower coverage. However, as the sound pressure level (SPL) increases, the zones of constructive interference expand correspondingly. This enlargement enhances the effective coverage of the acoustic field throughout the chamber. Thus, higher excitation amplitudes contribute to a more uniform and extensive distribution of acoustic pressure and as a result improve the agglomeration process. Such characteristics, as well as
Figure 8, show that the agglomeration chamber shows an almost linear response to excitation signal amplitudes, which ensures a simple driving and control system as well as the possibility of flexibility in adjusting acoustic characteristics to changes in particle concentrations and size spectrum in the airflow.
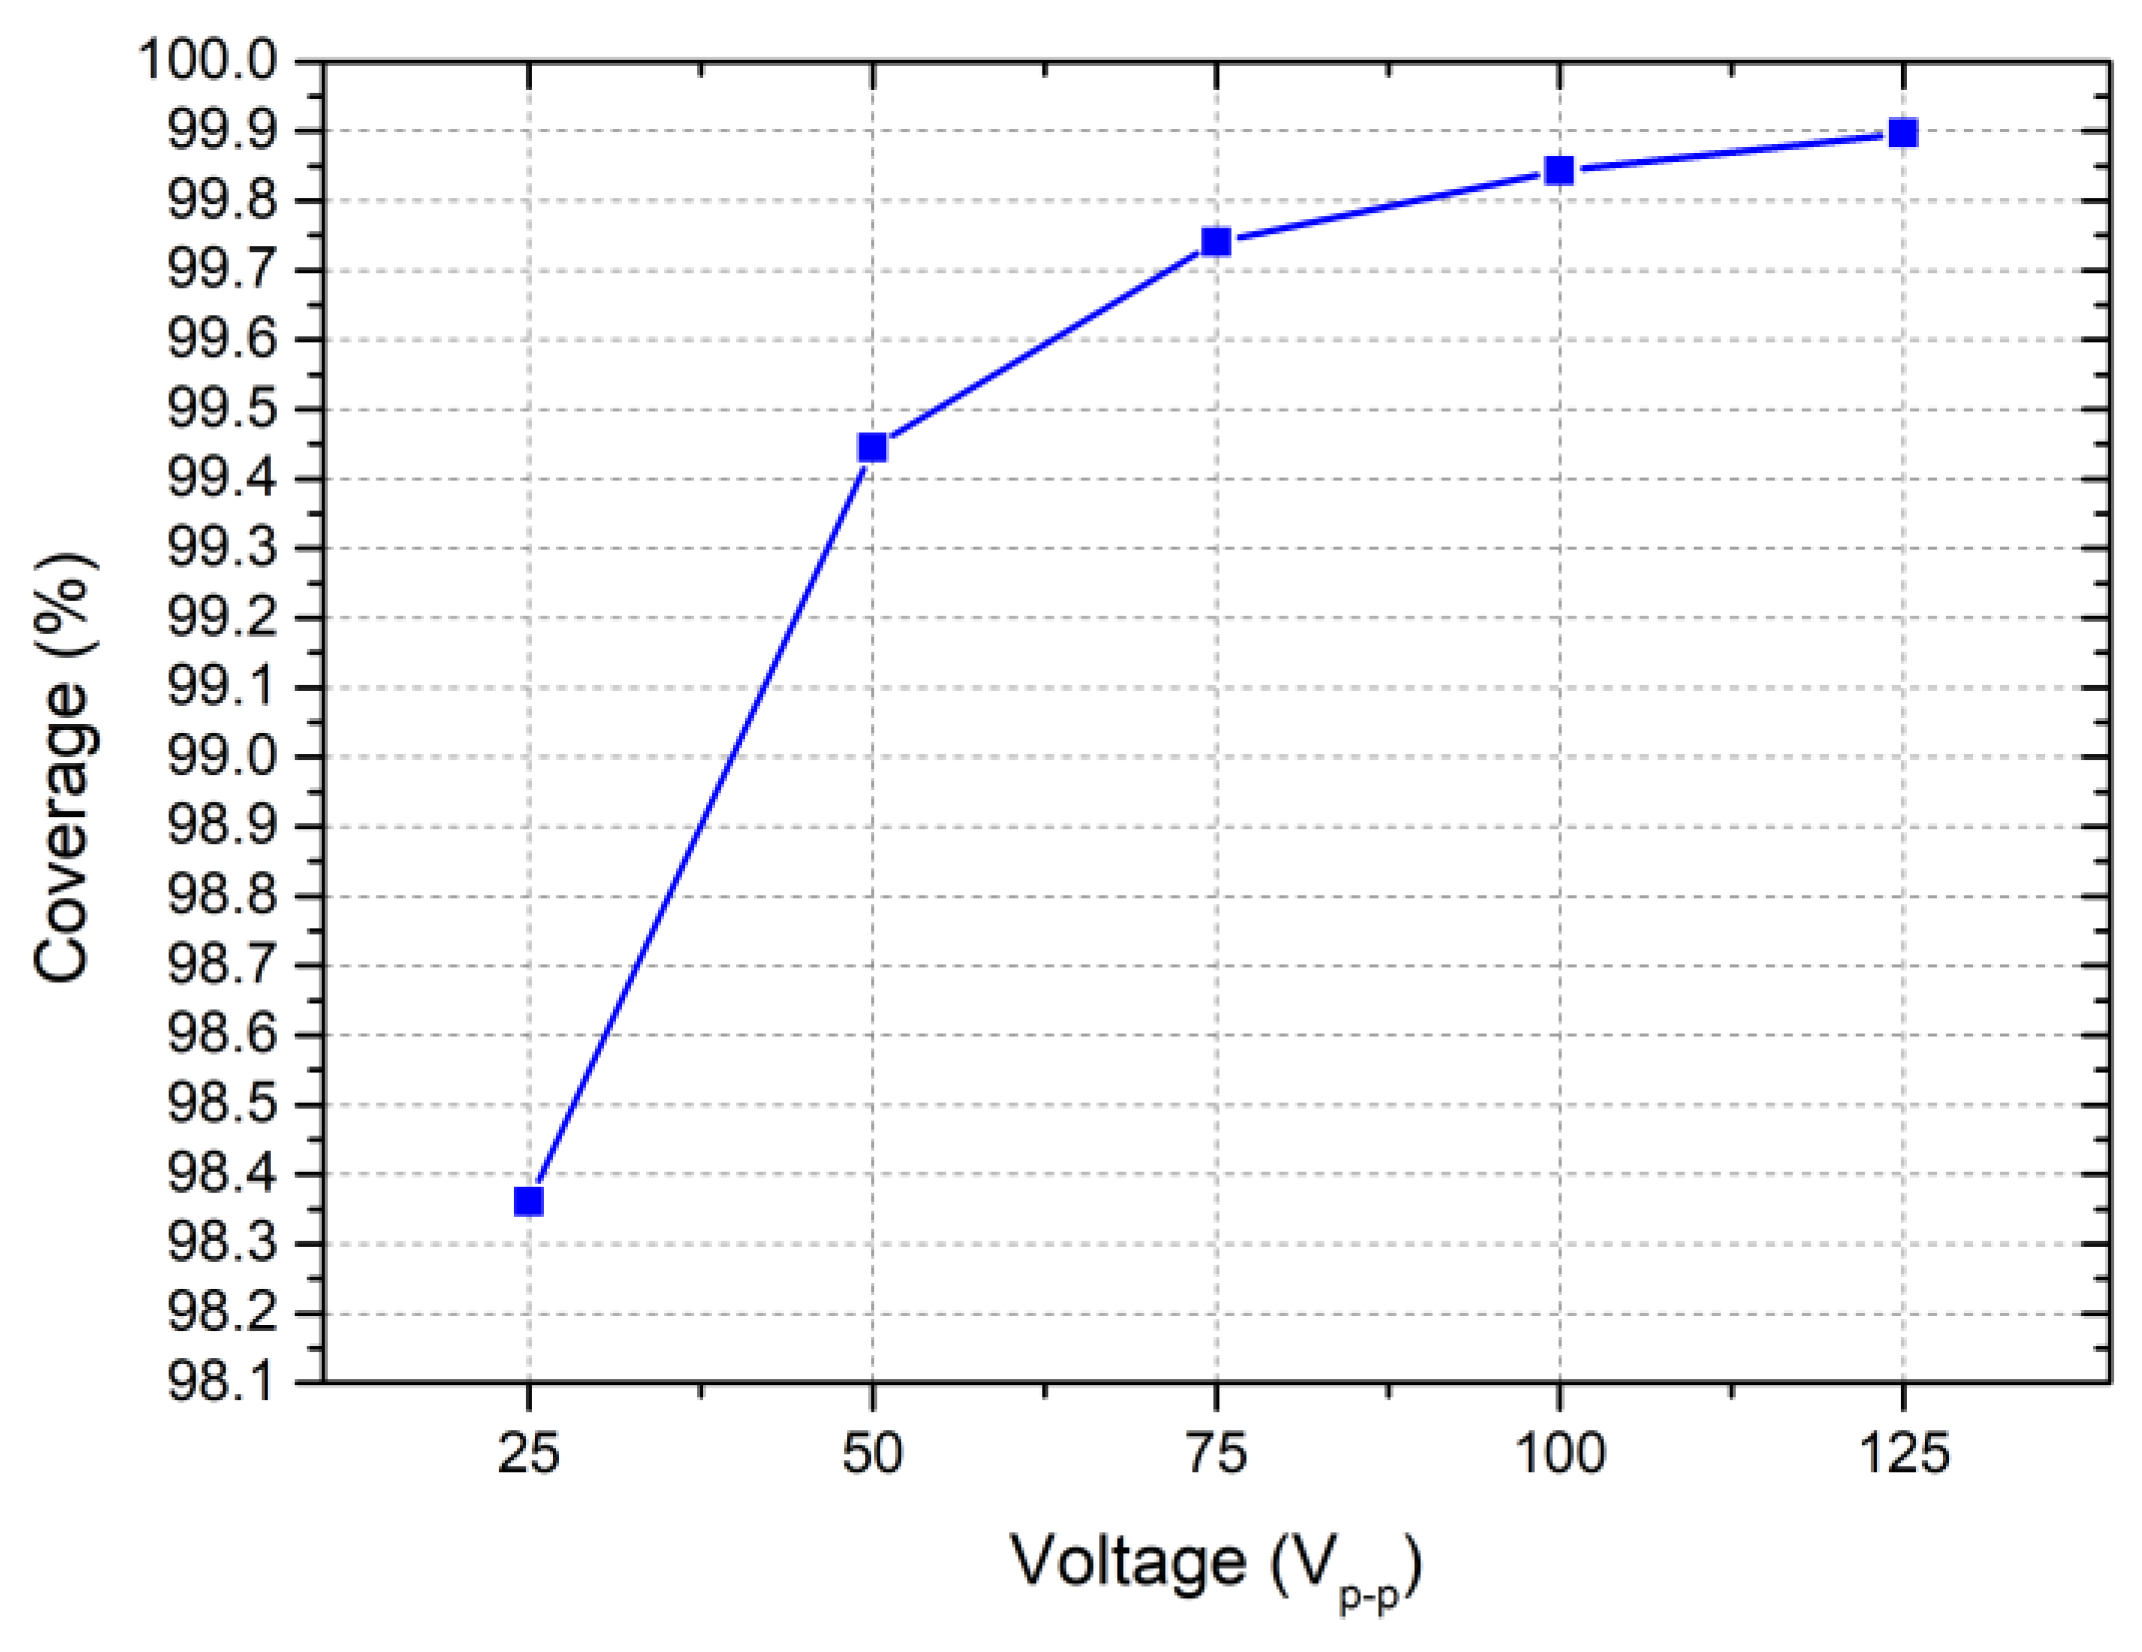
In order to fully represent sound pressure levels and their distribution across the cross section of the chamber, calculations of the area covered by high SPL values were performed. The calculations were performed with a threshold level of 100 dB, i.e., if, the SPL value was lower than the threshold, it was considered a low SPL value. The results of the calculations are shown in
Figure 9.
As can be seen in
Figure 9, high SPL values (more than 100 dB) increased from 98.1% at 25 V
p-p to 99.89% at 125 V
p-p. These results show that the acoustic agglomeration chamber is able to ensure high-density SPL fields at different excitation signal amplitudes and ensure that sound pressure is properly applied to particles throughout the airflow. Finally, in order to indicate the distribution of high and low SPL values across the agglomeration chamber, calculations were performed with a threshold of 100 dB. Binary exceedance maps of the high and low SPL values at 25 V
p-p and at 125 V
p-p are given in
Figure 10.
The binary exceedance maps (
Figure 10) with a 100 dB threshold confirm the results given in
Figure 9 and show that the SPL values at the lower amplitude of 25 V
p-p, in most cases, are located around the nodes of the interference acoustic field (
Figure 10a).
Figure 10b shows that these lower-pressure regions almost vanish compared to the case with 25 V
p-p. These results show that the usage of interference acoustic fields in the agglomeration chamber gives the following benefits: high sound pressure levels are almost evenly distributed across the cross section of the agglomeration chamber; the interference acoustic field ensures a high density of high SPL values; and the induction of constructive interference increases SPL values across the entire cross section of the agglomeration chamber. Therefore, on the basis of these results, it can be concluded that our numerical investigations show great potential for designing ultrasonic agglomeration chambers to improve the agglomeration process of solid fine and ultrafine particles.
4. Experimental Investigation of the Ultrasonic Acoustic Agglomeration Chamber
In order to perform experimental investigations, a prototype of the ultrasonic agglomeration chamber was made. The prototype was made with respect to the geometrical and physical characteristics given in
Figure 1 and
Figure 2 and
Table 1 and
Table 2. The assembled ultrasonic agglomeration chamber is shown in
Figure 11.
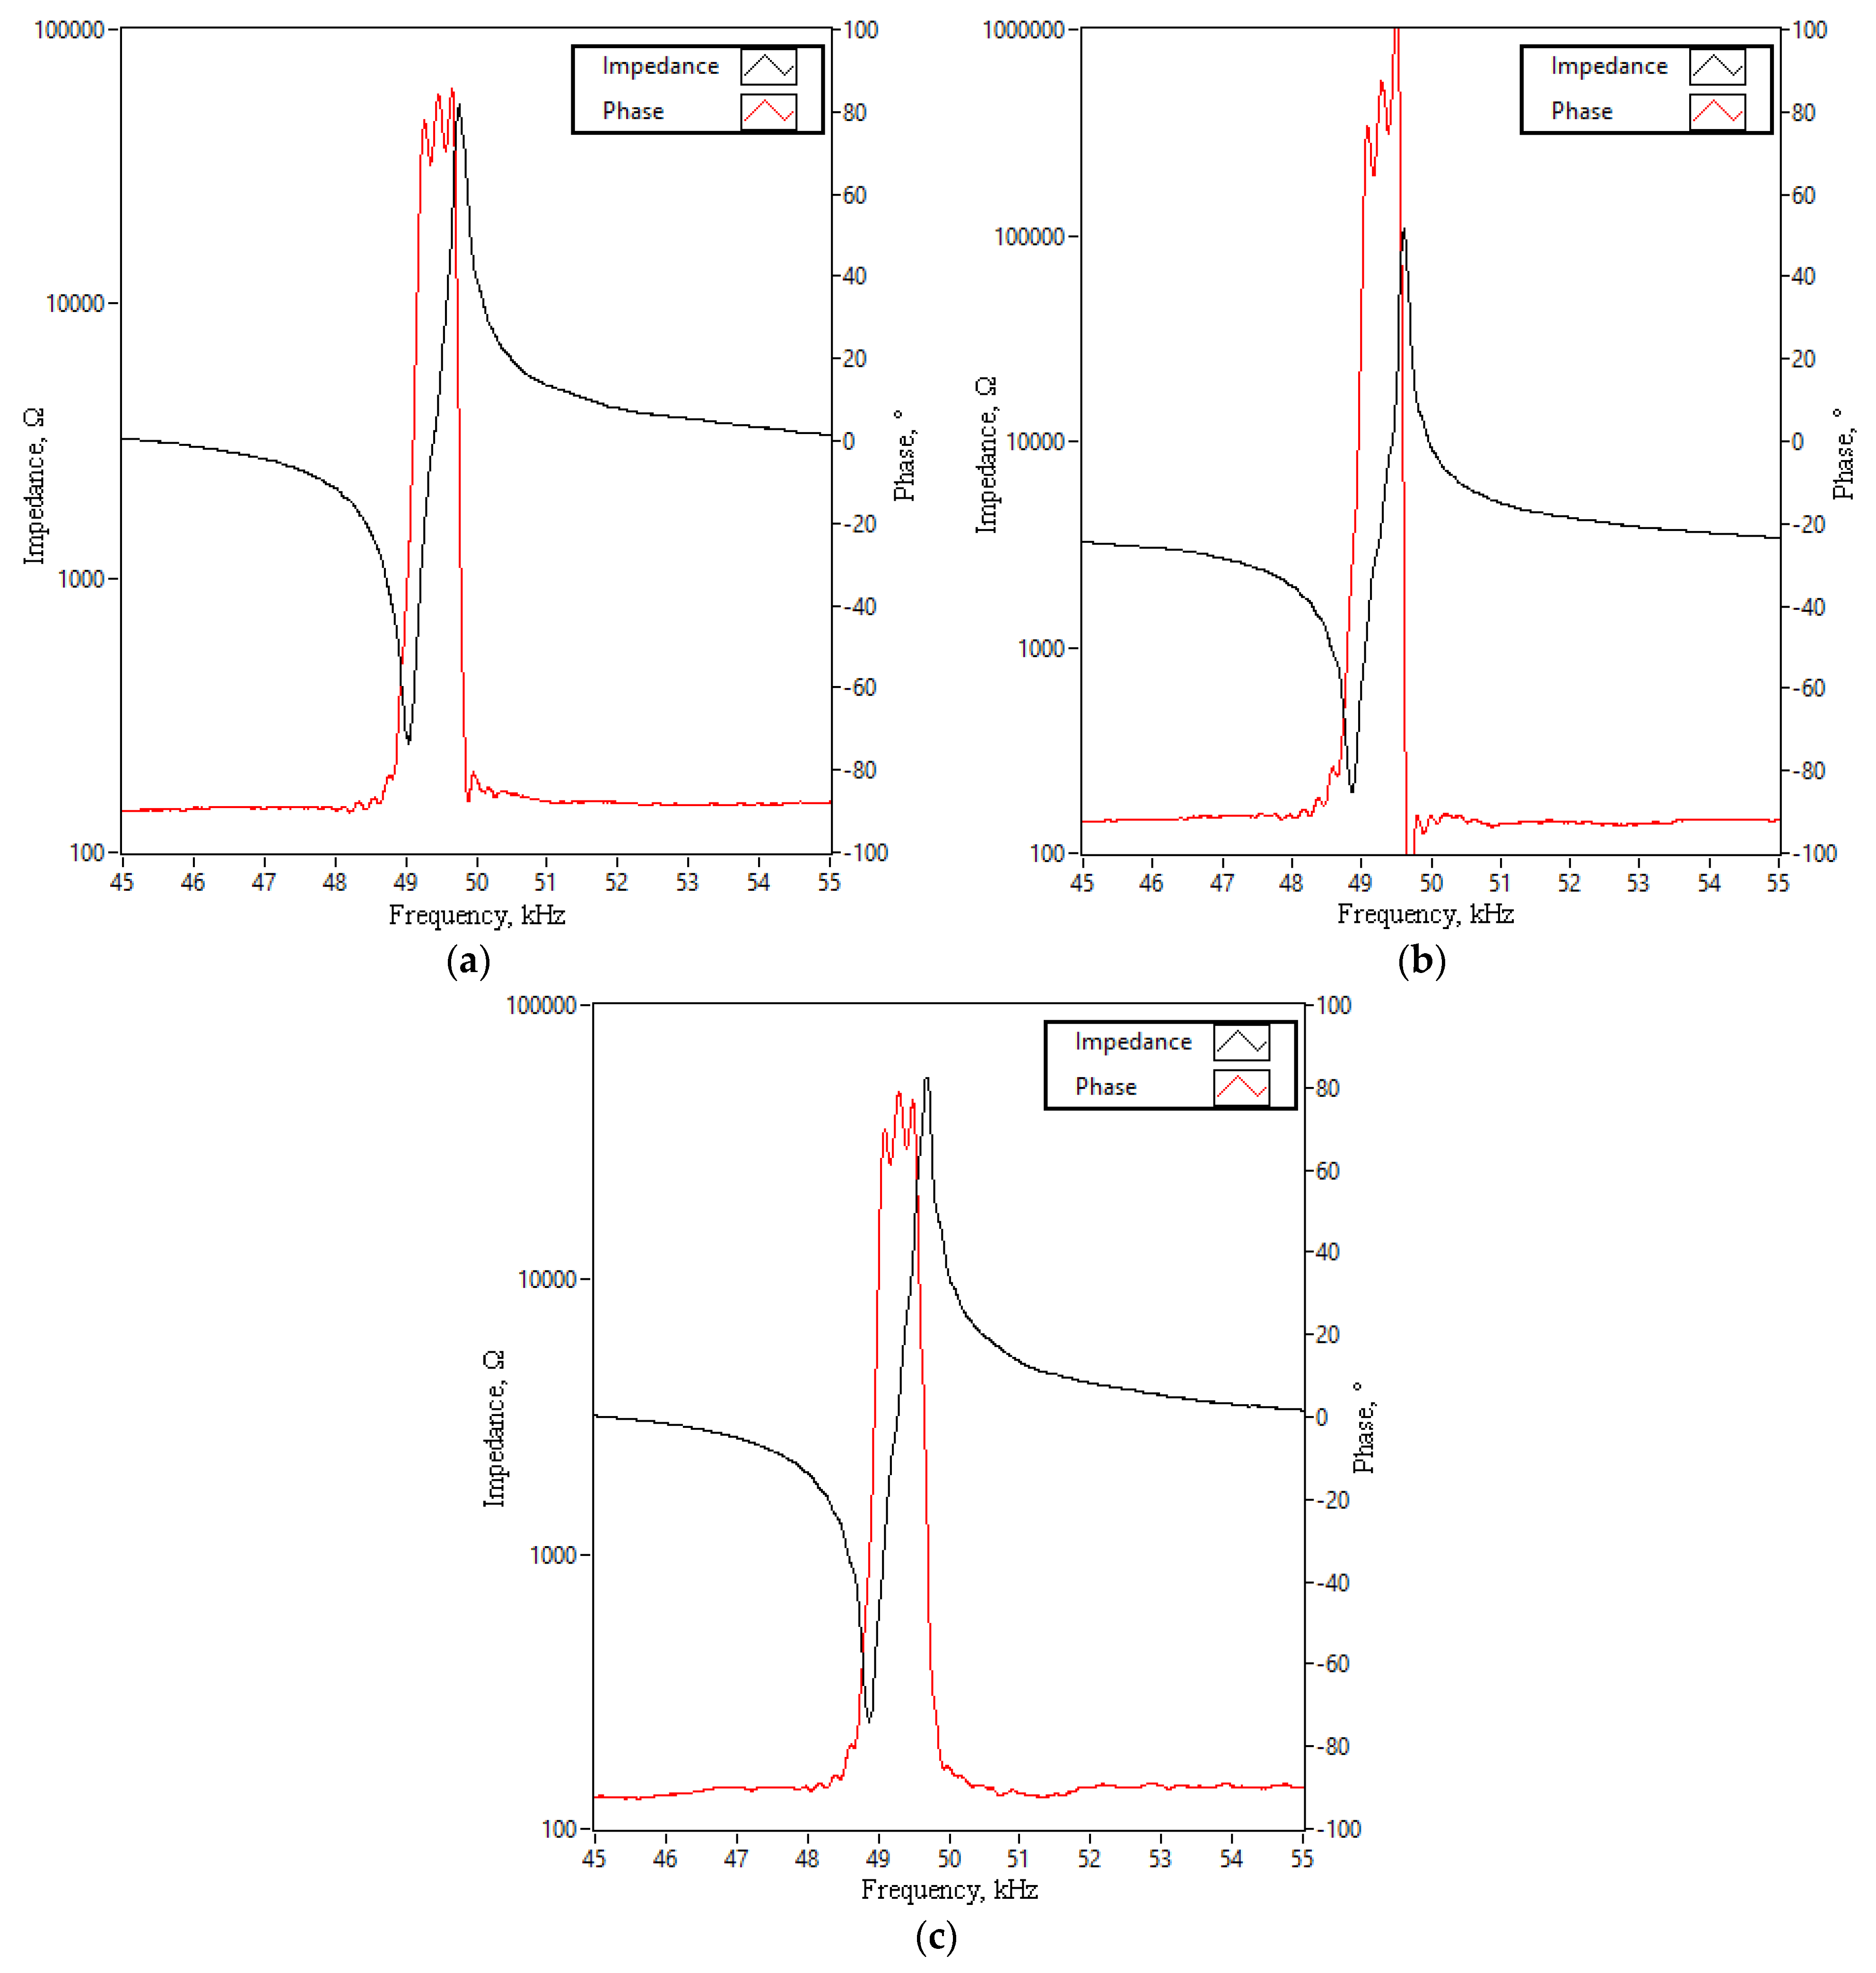
The first stage of experimental investigations was dedicated to measurements of the impedance and phase frequency characteristics of each ultrasonic acoustic pressure source. The aim of the measurements was to indicate the resonance frequencies as well as the effective coupling coefficient of each ultrasonic acoustic pressure source. The measurements were performed in series, i.e., starting from the first UAPS and ending with the third (
Figure 4). The impedance and phase frequency characteristics were measured by a SinPhase 16777k impedance analyzer (Hinterbruehl, Austria), which was set to perform measurements in the range from 45 kHz to 55 kHz with increment steps of 5 Hz. During experimental investigation, the ultrasonic acoustic pressure sources (UAPSs) were fixed to the body of the ultrasonic acoustic agglomeration chamber. The results of the measurements are shown in
Figure 12.
Figure 12 shows that the resonance frequencies of the ultrasonic acoustic pressure sources fluctuate from 48.71 to 48.85 kHz while the impedance values fluctuate from 235.18 Ω to 242.49 Ω. Finally, the phase characteristics for each ultrasonic acoustic pressure source change from −90° to approximately 85°. During comparison of the calculated impedance and phase frequency characteristics, it can be seen that the measured resonance frequencies are approximately 860 Hz higher, while the measured impedance values are 89.73 Ω higher. In general, the differences in resonance and impedance values are mainly caused by the following conditions: mismatches in clamping forces of the sources, i.e., the, numerical model contains ideal clamping while the prototype could exhibit sliding, rotating, etc.; minor mismatches between the characteristics of the materials used in the numerical model and the prototype; mismatches in electrical connection conditions, i.e., the numerical, model was built with ideal electrical connections while the prototype features wires, soldering, and electrodes placed between piezoelectric rings. Therefore, it can be seen that the mismatches between the numerical and experimental investigations are caused by numerous conditions that affect the results. However, the mismatches were at an acceptable level and further experimental investigations can be performed. Finally, a summary of impedance and phase frequency characteristics was made, including resonance and anti-resonance frequencies, impedance values at resonance frequency, and effective coupling coefficients (
keff). A summary is given in
Table 3.
The next stage of experimental investigation was dedicated to measurements of sound pressure levels (SPLs) in the ultrasonic agglomeration chamber when different amplitudes of excitation signal were used. Electrical connections were implemented according to
Figure 4 and the UAPSs were driven simultaneously at their resonance frequencies while the amplitudes of the excitation signal were changed simultaneously from 25 V
p-p to 125 V
p-p with incremental steps of 25 V
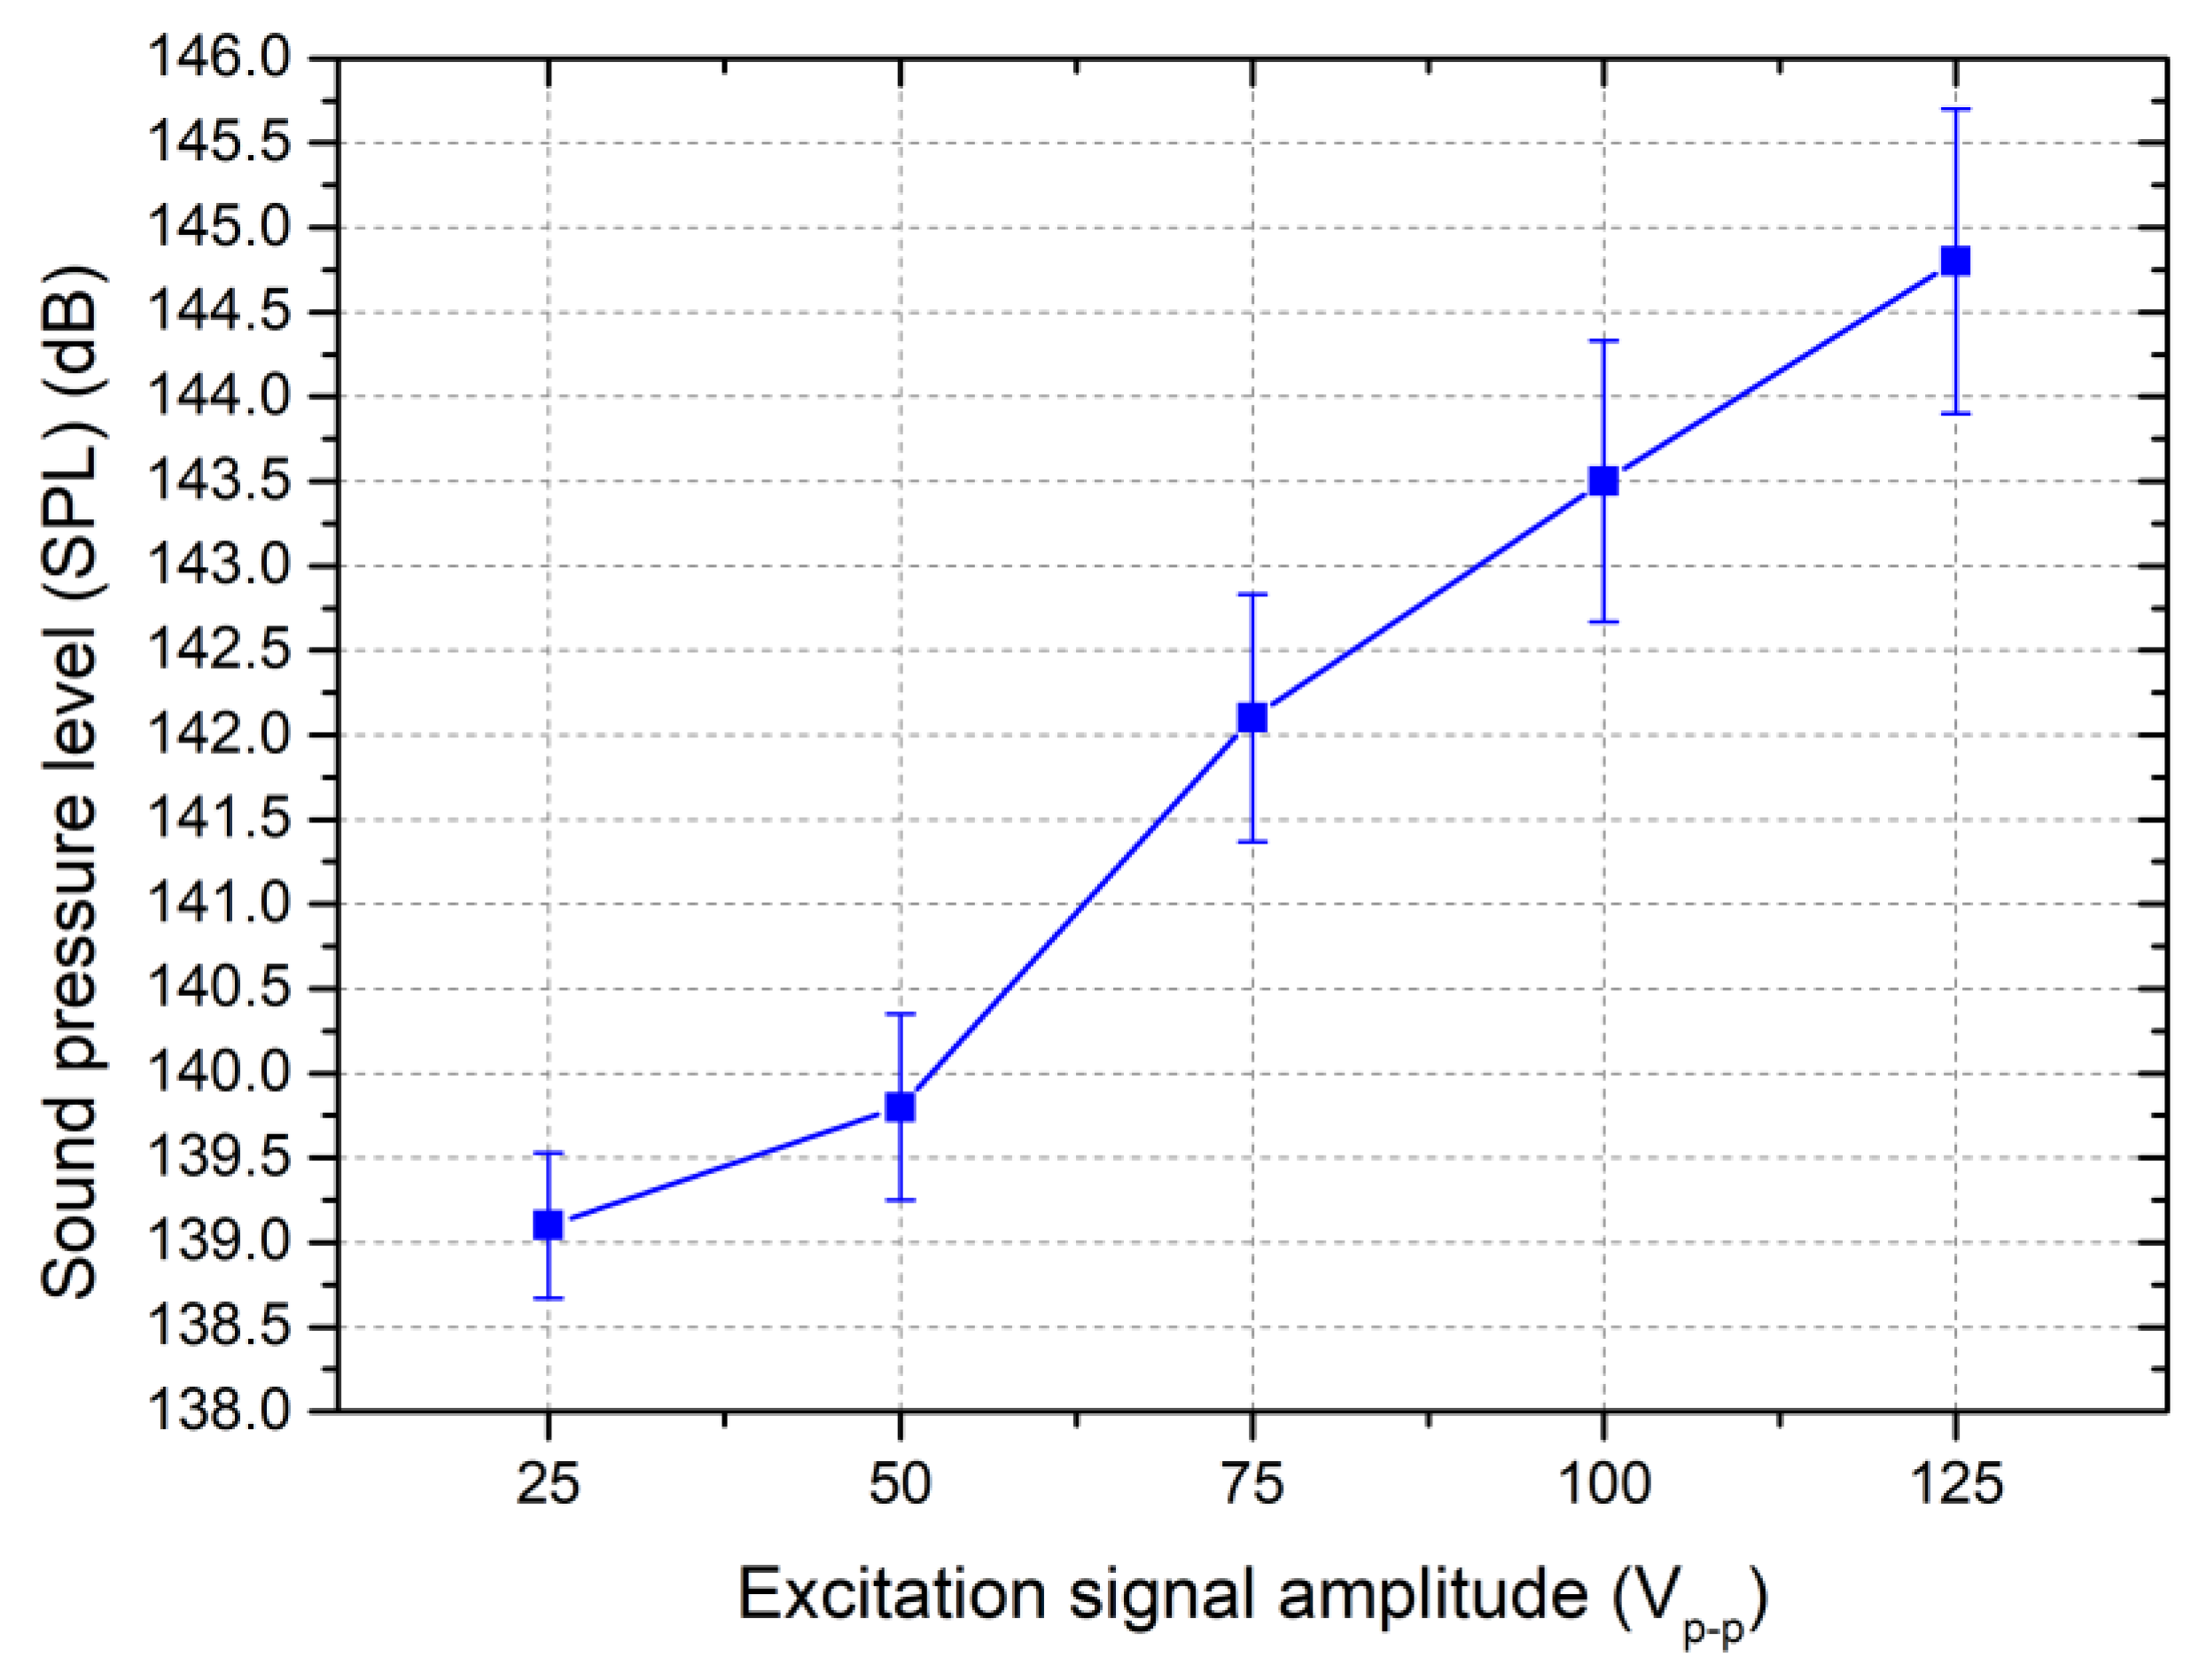
p-p for all UAPSs. Measurements of SPL values were made at the centre of the ultrasonic agglomeration chamber using a Bruel & Kjær Type 8104 hydrophone, which was connected to a Bruel & Kjær Type 9727 data processing system equipped with universal Bruel & Kjær Type 7910 software. For each case of excitation signal amplitude, measurements were performed three times with the goal of indicating a possible deviation of the SPL values. In addition, the hydrophone was placed in the centre of the ultrasonic acoustic agglomeration chamber in front of the ultrasonic acoustic pressure source. The results of the measurements are shown in
Figure 13.
Figure 13 shows that the lowest SPL values were obtained when the UAPSs were driven by an excitation signal of 25 V
p-p, reaching 139.1 dB with a deviation of ±0.43 dB, while the highest SPL value was obtained when the excitation signal amplitude was set to 125 V
p-p, reaching 144.8 dB with a deviation of ±0.91 dB. Also, the analysis of the measurement results show that the SPL values have almost linear dependence on the amplitude of the excitation signal while their deviation are also similar at each excitation signal amplitude. The increase in SPL from 139.1 dB at 25 V
p-p to 144.8 at 125 V
p-p is 5.7 dB or 0.057 dB/Vp-p. These results show that the SPL values in the ultrasonic agglomeration chamber can be easily predicted, controlled, and adjusted by a simple excitation and driving system without feedback demand. On the other hand, in the comparison between the calculated and measured SPL values, notable differences can be observed. In general, these differences are based on the accuracy of the measurement system as well as the positioning of the probe during experimental investigations, i.e., positioning the probe in the exact centre of the zone with the highest sound pressure levels is hardly possible due to the wavelength of the acoustic field and the size of the probe. In addition, these aspects, as well as the reflections of acoustic fields from the probe body, influenced the notable deviation of SPL values, which were indicated experimentally. However, the obtained SPL values are in the appropriate range of agreement between the numerical and experimental results.
Therefore, the next stage of experimental investigations was dedicated to investigating the effect of the interference acoustic field on the ultrasonic agglomeration process when the airflow contained particles with sizes ranging from 191 nm to 1 µm. The field was generated by different excitation signal amplitudes. For this purpose, an experimental setup was built following the schematic shown in
Figure 14.
The experimental setup consisted of a body (
Figure 14—1): a cylindrical air duct 150 mm in diameter with an overall length of 2.7 m. The ambient conditions inside the setup were 22 °C ± 9% and 55% ± 7% relative humidity. Airflow was generated by a fan (
Figure 14—3) controlled by a digital control system (
Figure 14—2). The flow speed was set to 2.3 m/s ± 3% and monitored both by the fan’s control system (
Figure 14—2) and by airflow sensors positioned upstream and downstream of the agglomeration chamber. HEPA filters were installed at the inlet and outlet to ensure particle filtration: the inlet HEPA filter stabilized the particle concentration entering the duct, while the outlet HEPA filter captured particles after the agglomeration chamber (
Figure 14—11). Particles were injected into the stream via a particle injection nozzle (
Figure 14—5) using a PALAS RBG 1000 solid-particle disperser (Karlsruhe, Germany). To ensure uniform particle distribution before and after the agglomeration chamber—and thus at the particle sampling heads (
Figure 14—9)—mixing orifices were employed (
Figure 14—8). Particle sampling on both sides of the chamber was carried out with a PALAS Welas 3000H digital aerosol spectrometer via the sampling heads, with the sampling nozzles’ horizontal axis aligned to the setup’s horizontal symmetry axis (
Figure 14—10). Measurements were taken sequentially: the spectrometer recorded particle counts and size spectra for 60 s upstream and 60 s downstream. Following PALAS’s recommended measurement profile, the sequence was repeated 4–8 times to achieve stabilized spectra with at least 93% confidence and a standard deviation of 7%. The UAPSs (
Figure 14—12) were driven simultaneously by an electrical signal from a signal generator (
Figure 14—14) fed to a power amplifier (
Figure 14—13).
Firstly, measurements of particle quantity and their size spectra was measured while the agglomeration chamber was deactivated. For these measurements, the solid-particle disperser was loaded with Arizona dust with particle sizes ranging from 0.1 µm to 1 µm, while set to the lowest possible injection rate. The results of the measurements are given in
Figure 15.
As can be found in
Figure 15, the dominant size of particles in the airflow was 255 nm, for a total of 156 particles in a cubic centimetre. The 191 nm sized particles totaled 24.7 pieces in cubic centimetre, while those with a size of 1 µm totaled 5.1 pieces in cubic centimetre. In general, this distribution of particle sizes is close to particulate pollution in normal occupied indoor environments. In addition, the graph shows that particle distribution across the experimental setup is stable, i.e., upstream, and downstream characteristics show a mismatch lower than 7%, which shows that the setup reached stable and controllable particle distribution. Therefore, this particle distribution will be used in further experimental investigations.
The next stage of experimental investigation was dedicated to measurements of particle sizes changes over the spectrum while the UAPSs were driven by excitation signal amplitudes from 25 V
p-p to 125 V
p-p with an increment step of 25 V
p-p. The results of the measurements are shown in
Figure 16.
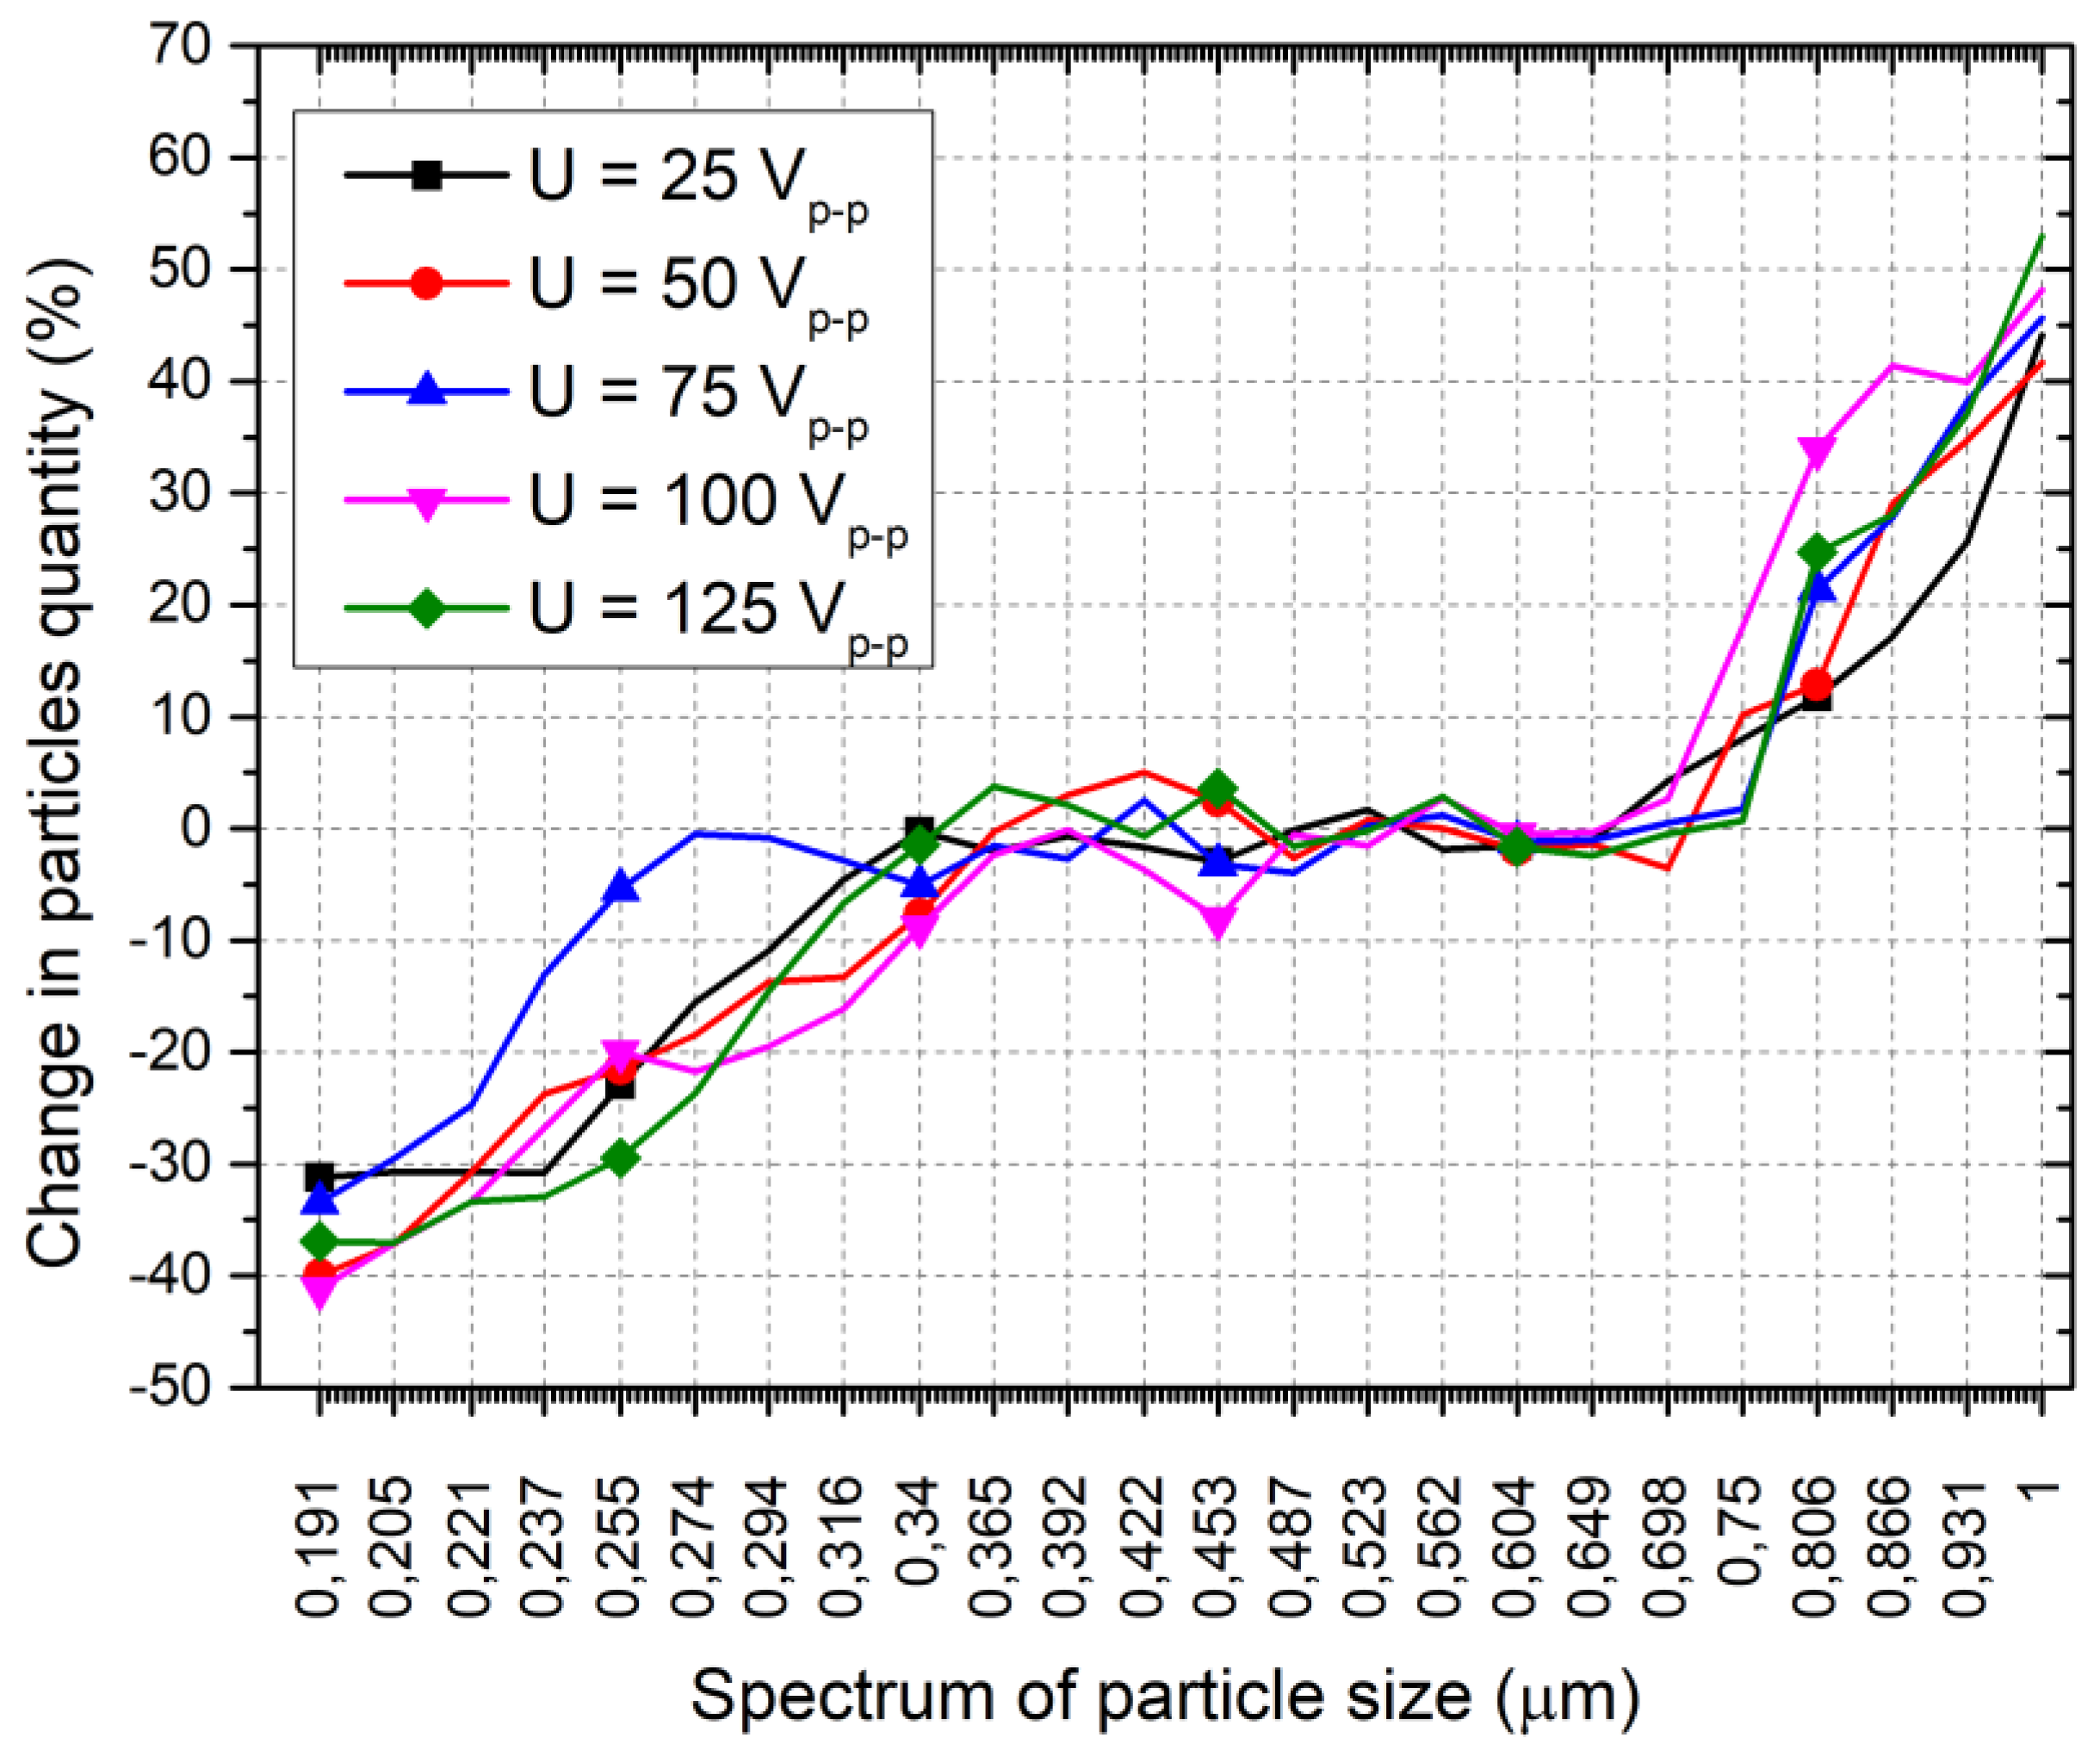
Figure 16 shows that when the excitation signal amplitude was set to 25 V
p-p or an acoustic pressure of 139.1 dB (
Figure 13), the quantity of particles in the spectrum from 191 nm to 294 nm decreased in the range from −31.2% to −10.9%. On the other hand, under the same acoustic conditions, the quantity of particles with sizes ranging from 0.75 µm to 1 µm increased from 11.76% to 44.12%. Similarly, when the excitation signal amplitude was set to 125 V
p-p or an acoustic pressure of 144.8 dB (
Figure 13), the quantity of particles in the spectrum from 191 nm to 294 nm decreased in the range of −36.91% to −14.54%, while particles with a size ranging from 0.75 µm to 1 µm increased from 24.68% to 52.91%.
In addition,
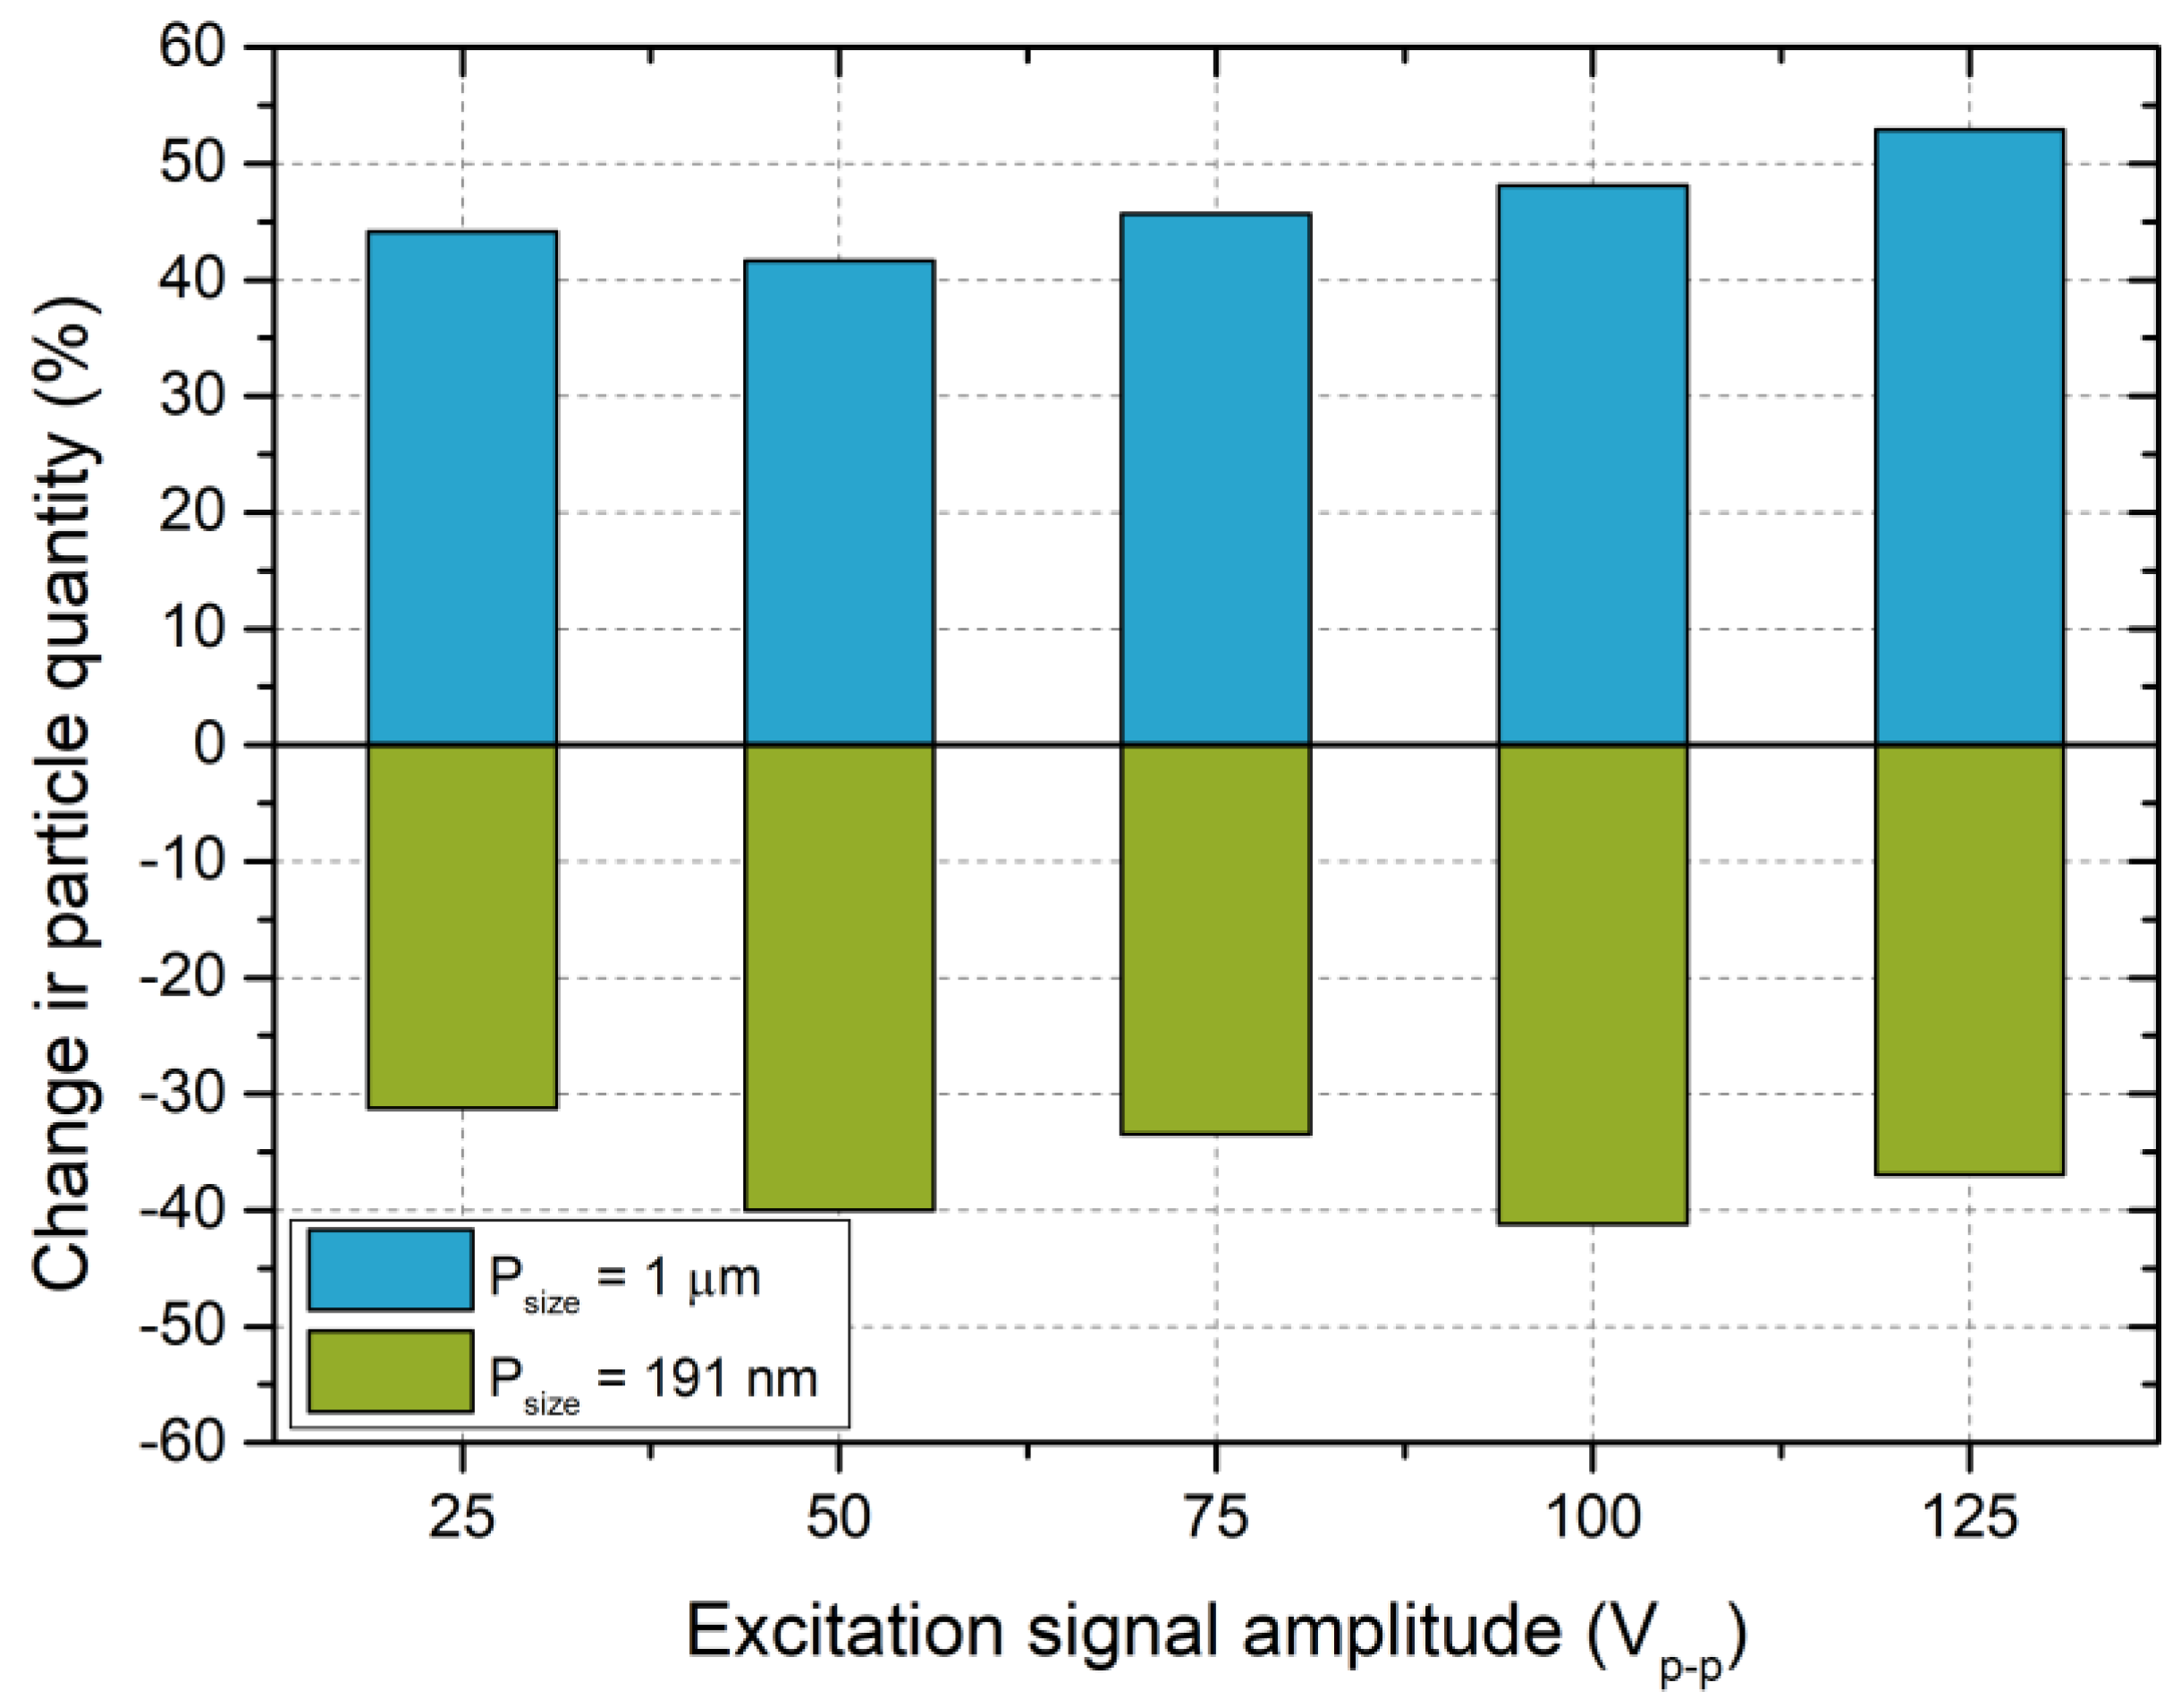
Figure 16 shows that in the particle size spectrum from 316 nm to 0.69 µm, the changes in quantity are minor and fluctuate in the range from −4.5% to 7.98%. This shows that this spectrum of sizes is intermediate, i.e., the, agglomerates formed from smaller particles enter and remain in this spectrum, while the others form bigger agglomerates and enter the spectrum with bigger sizes. This can be explained by the formation of particle agglomerates and their transition from lower to higher sizes while particle quantities in the intermediate spectrum stay relatively stable. Overall, it can be stated that the usage of an interference acoustic field formed from three high-frequency independent acoustic fields ensures a notable impact on particles in the lowest size spectrum, forming agglomerates which are several times larger. In order to fully represent the results, a summary of changes in the quantities of 191 nm and 1 µm sized particles under different excitation signal amplitudes is given in
Figure 17.
Figure 17 shows that the decrease in the quantity of 191 nm particles varies from −31.22% to −41.19% while the acoustic fields inducted by different excitation signal amplitudes vary from 139.1 dB to 144.8 dB. On the other hand, the increment of particles with 1 µm size varies from 41.11% to 52.91% under the same conditions. The summary confirms the results and analysis of the particle change measurements (
Figure 16) and shows that the agglomeration chamber based on an interference acoustic field is able to ensure the efficient agglomeration of fine and ultrafine particles.
5. Conclusions
The results of our numerical and experimental investigations have demonstrated that an acoustic agglomeration chamber equipped with three high-frequency ultrasonic piezoelectric acoustic pressure sources can effectively generate an interference acoustic field that ensures both high sound pressure levels and uniform distribution of acoustic pressure nodes across the chamber. Numerical investigations showed that the acoustic pressure sources have a resonance frequency of 49.71 kHz. At this frequency and excitation signal amplitude of 125 Vp-p, the interference acoustic field reached sound pressure levels of up to 149 dB. Experimental measurements confirmed these results, achieving sound pressure levels of up to 147 dB at 48.85 kHz, with a nearly linear dependence on excitation signal. Experimental investigation of the agglomeration process revealed that the concentration of ultrafine particles in the size range of 191 to 294 nm decreased by 31 to 41%, while the quantity of larger particles, i.e., 1, µm, increased by 41–53%, confirming particle growth under the influence of the interference acoustic field. Intermediate particle sizes remained relatively stable, acting as a transitional zone for agglomerate formation. The results of our experimental investigation have clearly indicated that the interference acoustic field has a positive impact on agglomeration efficiency by increasing sound pressure through constructive interference and distributing acoustic forces evenly throughout the airflow. A clear tendency was observed that higher excitation amplitudes produce greater agglomeration efficiency, accelerating the reduction in the smallest particles and their transformation into larger, more filterable particle agglomerates. From a practical perspective, the chamber shows strong potential for integration into air purification and filtration systems. By shifting ultrafine particles into larger size ranges, it enables more effective removal by conventional filters such as HEPA or electrostatic units, thus improving the overall efficiency of the filtration system. It is also important to note that the experimental investigations were carried out at relatively low particle concentrations, yet a significant agglomeration effect was observed. This suggests that in more polluted airflows, the chamber could perform even more efficiently, underlining its promise for real-world applications in industrial, transportation, and indoor air quality control.

