Abstract
Strains of Eimeria maxima, an enteric parasite of poultry, vary in virulence. Here, we performed microscopy and RNA sequencing on oocysts of strains APU-1 (which exhibits more virulence) and APU-2. Although each underwent parallel development, APU-1 initially approached maturation more slowly. Each strain sporulated by hour 36; their gene expression diverged somewhat thereafter. Candidate biomarkers of viability included 58 genes contributing at least 1000 Transcripts Per Million throughout sporulation, such as cation-transporting ATPases and zinc finger domain-containing proteins. Many genes resemble constitutively expressed genes also important to Eimeria acervulina. Throughout sporulation, the expression of only a few genes differed between strains; these included cyclophilin A, EF-1α, and surface antigens (SAGs). Mature and immature oocysts uniquely differentially express certain genes, such as an X-Pro dipeptidyl-peptidase domain-containing protein in immature oocysts and a profilin in mature oocysts. The immature oocysts of each strain expressed more phosphoserine aminotransferase and the mature oocysts expressed more SAGs and microneme proteins. These data illuminate processes influencing sporulation in Eimeria and related genera, such as Cyclospora, and identify biological processes which may differentiate them. Drivers of development and senescence may provide tools to assess the viability of oocysts, which would greatly benefit the poultry industry and food safety applications.
Keywords:
Eimeria; transcription; differential expression; coccidia; sporulation; development; oocyst; Cyclospora; control; vaccine 1. Introduction
Coccidian parasites of livestock, including those caused by species of Eimeria, Toxoplasma, and Cyclospora, cannot induce infection immediately upon excretion by their prior host; instead, they undergo an extrinsic development (termed sporulation) necessary to become infectious [1,2]. Temperature and humidity regulate the pace of sporulation, which varies among species (and possibly among strains or genotypes of such parasites), thereby influencing the rapidity of the transmission cycle. Better understanding the common regulators of extrinsic development might provide better means to slow or stop extrinsic development, to the benefit of public health and livestock husbandry. If common developmental differences govern both extrinsic and intrinsic parasite reproduction, then differences evident during sporulation may induce, or parallel, phenotypic differences expressed as parasite strains establish and perpetuate infection in the host. This motivated our curiosity to study the sporulation differences among two strains that differ markedly in their virulence as enteric pathogens.
Like the enteric human pathogen Cyclospora cayetanensis, species of Eimeria cause enteric disease. A 2016 study estimated the global cost of poultry coccidiosis to exceed $14 billion (U.S.) globally each year [3]. Seven universally recognized species of Eimeria infect chickens and each parasitizes specific regions of the intestinal tract. The species E. maxima, E. tenella, and E. acervulina present the greatest disease risk and have the greatest economic importance [4]. Therefore, most Eimeria vaccines comprise these species [4,5,6]. Eimeria maxima parasitizes the jejunum of the small intestine [7] but can move to other locations during heavy infection. This parasite causes diarrhea and thickened intestinal walls, and it alters intestinal nutrient uptake [6,7]. Eimeria maxima can have insidious effects such as causing lower weight gain and poorer feed conversion efficiencies, but also can predispose chickens to necrotic enteritis (NE) caused by the colonization of the toxin-producing bacterium Clostridium perfringens [6,8].
Eimeria spp. infecting poultry induce specific host responses generally mediated by T cell responses. Little is known of intraspecific strain differences. E. maxima is highly antigenic; administering only a few oocysts can suffice to induce almost complete immune protection to homologous challenge [9]. Yet, this parasite also exhibits immunological variability [9,10,11,12,13,14,15,16,17,18]. Given the lack of cross-protection among most strains, vaccines must incorporate multiple strains for each species [4,11,19].
Two strains of E. maxima (APU-1 and APU-2) differ in pathogenesis in vivo [18,20]: the APU-1 strain is consistently more pathogenic than the APU-2 strain. Chickens infected with APU-1 gained 20–25% less weight than chickens infected with APU-2, when inoculated with as few as 1000 oocysts. The lesion scores were also 1–2 points higher in chickens infected with APU-1 compared to chickens infected with APU-2. APU-1 also appeared more fecund, producing more oocysts. This phenomenon was more pronounced at lower inoculation doses, as chickens infected with APU-1 produced ~2.5 times more oocysts than chickens infected with a similar dose of APU-2. A recent study [20] also showed that APU-1 invades host cells about twice as efficiently as APU-2.
The biological basis of these differences remains unclear. As in other species of Eimeria, asexual development (schizogony) precedes sexual development (gametogony). Recently, we reported 4–5 generations (multiplicative cycles) of schizogony before formation and the excretion of oocysts 4 days post-oral inoculation with E. maxima oocysts [7].
Here, we sought to understand whether and how these strains of E. maxima may differ in their extrinsic development, the period during which excreted oocysts sporulate to their infectious stage. We built upon omics approaches capable of identifying proteins, transcripts, and gene sequences that demarcate strains and the developmental stages of Eimeria [21,22,23,24,25,26,27,28]. Such genetic determinants may help explain phenotypic differences and describe life cycle development [25,28,29,30,31,32,33,34,35,36]. By delineating markers of viability during E. acervulina oocyst development shared with other species of Eimeria and Cyclospora, we aimed to understand what factors uniquely contribute to development in each species and strain. This will help identify developmental processes that govern coccidian development [37].
To this end, we employed comparative transcriptomics to delineate shared and distinct extrinsic development in two strains of Eimeria exhibiting contrasting virulence in their natural host. Understanding conserved developmental pathways may suggest general means to manage parasite harms (by, for example, retarding or preventing maturation to the infectious state); conserved features of development may also provide practical tools for assessing the viability of parasite stocks employed for vaccination. Understanding features of development unique to strains may illuminate the biological basis of such phenotypic variation, including differences important to animal health and productivity (such as virulence differences between the APU-1 and APU-2 strains of E. maxima). Therefore, we harnessed RNA sequencing (RNA-Seq) to understand their transcriptional differences during sporulation.
2. Materials and Methods
2.1. Ethics Statement
Animal experiments were performed following the protocol (22–06) approved by the BARC Institutional Animal Use and Care Committee, the United States Department of Agriculture. The chickens utilized in this study exhibited no outward signs of severe disease over the course of the study. After the study’s conclusion, all chickens were humanely euthanized; all efforts were made to minimize animal suffering.
2.2. Parasites
To obtain parasites for sporulation studies, we used methods described in [37] with some modifications. Briefly, two groups of eight male broiler chickens (Hubbard/Ross HR708, Longneckers Hatchery, Elizabethtown, PA, USA) were infected via oral gavage with either 3000 sporulated oocysts of strain APU-1 or 12,000 oocysts of strain APU-2. On day six post-inoculation, feces from the birds infected with a given strain were harvested and pooled. Unsporulated oocysts were isolated from chicken feces via flotation on a saturated salt solution and then washed 3–4 times with water. The final oocyst preparation for each strain was resuspended in 2% v/v potassium dichromate in a sterile 1 L flask. The approximate yield of 3 × 10⁸ oocysts was split equally into three flasks (denoted replicates A, B, and C) and incubated in a 29 °C shaking water bath aerated using an aquarium pump to promote sporulation.
An aliquot of 5 × 10⁶ oocysts was removed from each replicate flask at the beginning of the time course (T0) and then every six hours up to 24 h (T6, T12, T18, T24) and then every 12 h thereafter (T36, T48)). At each time point, the oocysts were centrifuged at 2400× g for 5 min at 4 °C and washed with deionized water to remove excess potassium dichromate. The oocysts were then incubated with sodium hypochlorite (6%) for 15 min with rocking agitation at room temperature to remove exogenous microbial contamination. After bleach treatment, samples were washed with deionized water to remove residual bleach. After washing, oocysts were resuspended in TRIzol (Thermo Fisher Scientific, Waltham, MA, USA) and frozen at −80 °C.
2.3. Microscopy
Aliquots of the oocysts at each time point were examined using a hemacytometer at 400× with an AxioScope microscope (ZEISS, Oberkochen, Germany). The percent sporulation was determined by counting the number of sporulated oocysts (those with four completely formed sporocysts) and unsporulated oocysts in multiple fields. We examined the extent of sporulation at additional time points (T30 and T42, but RNA from the oocysts was not isolated). To obtain optimal photomicrographs of developing oocysts, aliquots from each time point were transferred into a microcentrifuge tube and spun at 3400× g for 2 min. The oocyst pellets were washed once with water and final pellets were resuspended in 100–200 µL water before visualization. Images of representative oocysts at each time point were captured using a ZEISS Axioscope camera and the AxioVision imaging software version 4.9.1.0 (400× total magnification). In this study, we define parasite cohorts enriched for unsporulated oocysts as immature (T0) and cohorts enriched for sporulated oocysts as mature (T36).
2.4. Sample Preparation for RNA-Seq
Oocysts frozen in TRIzol were thawed on ice and 2 mL was transferred into a glass homogenizing tube. The suspension was ground using a Teflon pestle for 3–4 cycles of 25 grinds each. The samples were periodically examined using microscopy to monitor the progress of oocyst and sporocyst breakage. Homogenates were transferred into 2 mL RNAse-free microcentrifuge tubes, mixed with chloroform, and incubated at room temperature for 3 min. The tubes were centrifuged at 13,500× g for 15 min at 4 °C. The upper aqueous phase was transferred into new tubes and mixed with an equal volume of 70% ethanol. The total RNA was then isolated using a RNeasy Kit (QIAGEN, Germantown, MD, USA) following the manufacturer’s instructions. The total RNA was quantified using a Qubit 3.0 fluorometer and Qubit RNA High Sensitivity kit (Thermo Fisher Scientific) and the quality was assessed using a Bioanalyzer 2100 and RNA 6000 Nano kit (Agilent Technologies, Santa Clara, CA, USA). The RNA samples were frozen at −80 °C. The total RNA was processed using an Invitrogen Turbo DNA-free kit (Thermo Fisher Scientific). The total RNA of suitable quality for RNA-Seq had an RNA Integrity Number (RIN) ≥ 7 when assessed using a Bioanalyzer 2100.
2.5. cDNA Library Construction and RNA-Seq
The library construction and RNA-Seq utilized methods described by [37] with some exceptions. For each strain, whole coding transcriptome libraries were produced from each of three replicates of oocysts collected at each time point. Approximately 500 ng of total RNA was used as input using the Illumina Stranded mRNA Prep ligation kit (Illumina, San Diego, CA, USA) for cDNA library preparation. The cDNA libraries were quantified using Qubit, and the size distribution of libraries was characterized for each library using a Bioanalyzer 2100 and High Sensitivity DNA kit. The average library size for each sample was determined (ranged from 302 to 388 bp) and normalized for stoichiometric balance. The indexed libraries were then pooled and run on an Illumina NextSeq 2000 using a NextSeq 2000 P3 kit (300 cycles). After the run, reads were automatically converted into .fastq format using Bcl2Fastq (Illumina) and demultiplexed. The sequencing run resulted in four .fastq files per sample, containing two paired reads per lane. Forward and reverse reads were concatenated to produce single forward and reverse read files.
Raw, unpaired Illumina sequencing read files were used for analysis. Reads were imported into Geneious Prime 2023.04 (Biomatters Inc., Boston, MA, USA), https://www.geneious.com (accessed on 10 November 2023), paired, and trimmed using the package BBDuk (version 38.84) to remove Illumina adapter sequences. The adapter sequences were trimmed from the right end using default settings. Additional settings included “Trim Low Quality”, both ends with minimum quality = 20, “Trim adapters based on paired read overhangs”, minimal overlap = 20, and “Discard Short Reads”, minimum length = 30 bp. The trimmed reads were aligned with the most current genome sequence for the E. maxima Weybridge reference strain (annotated NCBI assembly EMW001, [38]) using the Geneious RNA mapper. The expression for each mapped sample was calculated.
We used Transcripts Per Million (TPM) as the main expression metric, calculated by Geneious as (CDS read count × mean read length × 106) ÷ (CDS length × total transcript count). Data tables were exported from Geneious as .csv files and further analyzed in Microsoft Excel (Redmond, WA, USA) to calculate descriptive statistics of the raw reads and TPM for the sample replicates. Data analysis and visualization was aided by Daniel’s XL Toolbox add-in for Excel, version 7.3.4, by Daniel Kraus, Würzburg, Germany (www.xltoolbox.net (accessed on 10 November 2023)). Correlation (Pearson’s) of the normalized RNA-Seq mapped reads (log2 transformed) among strains and replicates was depicted as a heat map constructed in R version 4.3.1using the packages ggplot2 [39] and reshape2 [40]. Transcriptional bias (based on mean TPM from three replicates per time point) as previously described [37] was calculated at each time point for each strain.
2.6. Comparing Differential Gene Expression between Developmental Stages in Samples and Strain
The DESeq2 package [41], as implemented in Geneious Prime 2023.04, calculated the pairwise differential gene expression of time points in grouped replicates. This allowed us to compare the expression of all time points between strains as well as time points during sporulation (within and between strains). We examined differential expression using the log2 ratio of genes and adjusted p-values, which were used for downstream analyses. We used thresholds of >1.5 or <−1.5 log2 fold change (FC) with an adjusted p-value <0.05 to determine significantly differentially expressed genes (DEGs). Volcano plots depicting the log2-FC-vs. −log10-adjusted p-values (Adj. p-value) for DEGs were constructed in the R package Enhanced Volcano [42]. Correlation plots comparing log2 FC of DEGs between strains were constructed in the R package ggplot2.
2.7. Homology Searching and Functional Genomics Analysis
Functional information on genes of interest was derived from the annotations available for the E. maxima Weybridge reference strain in NCBI (assembly EMW001) and ToxoDB v62 ([43]). To elucidate the additional functions of genes, we utilized the functional analysis module in OmicsBox 3.0.27 (BioBam Bioinformatics, Valencia, Spain). Our Blast2GO® workflow (for Phylum Apicomplexa or Eimeria spp.) was previously described in [37]. Other custom Blast2GO settings included an AnnotationE-value-Hit-Filter of 0.001, and all available Interpro Families, Domains, Sites, and Repeats. The rest of the workflow was run with default settings. Additionally, the eggNOG (evolutionary genealogy of genes: Non-supervised Orthologous Groups) [44] mapper (version 2.1.0 with eggNOG 5.0.2) inferred orthology relationships, gene evolutionary histories, and functional annotations to improve the Blast2GO sequence characterization. We used KEGG (Kyoto Encyclopedia of Genes and Genomes) [45] in pathway analysis settings, which enabled biochemical pathway enrichment analysis. KEGG was used with default settings and linked pathways via Enzyme Commission (EC) numbers. The Blast2GO results and lists of GO annotation terms and KEGG pathways were exported from OmicsBox and analyzed further in Microsoft Excel. Additional information for gene homologs and orthologs/paralogs and KEGG pathways (exact EC matches only) was found by searching the data sets in ToxoDB.
2.8. RT-qPCR
RNA-Seq estimates of gene expression were validated on a selection of genes using reverse transcriptase quantitative real-time PCR (RT-qPCR), following procedures described by [37]. Individual RT-qPCR reactions were prepared using SsoAdvanced Universal SYBR Green Supermix (Bio-Rad, Hercules, CA, USA), using 200–500 nM of each primer (Table S1), and 1 µL of diluted cDNA to a total volume of 10 µL. Expression of EMWEY_00042350 (Beta tubulin) was used as a reference to normalize expression levels of target genes. For determining the expression of constitutively expressed genes during sporulation, the abundance of mRNA in each replicate and measured time point was compared to that in the unsporulated oocyst samples (T0). Gene expression was estimated for the reference and target genes after averaging the Cq values for each replicate at each time point. The fold change in expression was calculated using an efficiency-corrected relative expression method [46]. The log2 FC of genes at each time point determined using DESeq2 (using mean of replicates for each RNA-Seq time point relative to T0) was compared to the log2 expression determined using RT-qPCR (mean of three trials, compared to T0). Each experiment was performed three times, and the mean of expression change was calculated for each gene and time point. All primers (Table S1) were designed using NCBI Primer-BLAST [47] and synthesized by Integrated DNA Technologies (Coralville, IA, USA).
3. Results
3.1. Development of E. maxima Oocysts via Microscopy
We determined the percentage of oocyst sporulation of each E. maxima strain every six hours during the entire developmental time course (up to 48 h). From hours 6 and 12, the number of sporulated oocysts in APU-1 increased ~4.5 fold whereas it increased ~3-fold for APU-2 (Figure 1A). By 24 h, most oocysts of APU-2 destined for sporulation (~90%) had sporulated; APU-1 reached this benchmark six hours later. Each strain underwent similar development at each time point, but the proportion of sporulated oocysts (in which four distinct sporocysts were visible) was greater in APU-2 at hours 18 and 24. Each strain achieved maximum sporulation by hour 30. Figure 1B depicts the representative developmental stages during the sporulation course.
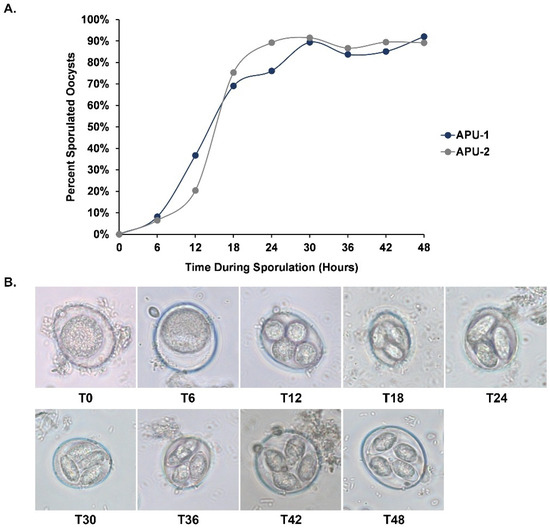
Figure 1.
Differential oocyst development in E. maxima strains APU-1 and APU-2. (A). Percent sporulation of strains during oocyst development. Strain APU-2 reached maximum sporulation sooner. Strains reached maximum sporulation at 30 h. (B). Representative photomicrographs of developing E. maxima oocysts at each time point. Additional time points T30 and T42 are included. Unsporulated oocysts (T0) are diploid and go through meiosis. Four haploid sporoblasts are visible by 12 h (T12) and these become sporocysts (T18–T48). Two sporozoites form in each for the four sporocysts.
3.2. Transcription of E. maxima Oocysts during Sporulation Correlates Highly with Few Exceptions
Overall, a total of ~1.29 billion 100 bp paired-end reads (after trimming) were generated from the 42 samples (derived from three replicates at each time point, Table S2). The number of reads per replicate and time point ranged from 15,969,320 to 44,080,524 (mean 29,402,440 ± 6,837,261) in APU-1 and 21,420,910 to 69,735,510 (mean 31,899,659 ± 12,823,456) in APU-2. The percentage of reads mapping to the E. maxima reference genome averaged ~95% (median = 95.5% for APU-1 and 95.3% for APU-2) in each strain (ranged 93.9–96.2% for APU-1 and 94.1–95.8% for APU-2).
We first analyzed the expression of 6057 annotated genes for each strain and replicate by examining the correlation of log2-transformed mapped reads (Table S3A). The Pearson’s correlation among replicates within each strain was high (r > 0.91, Table S3B). In each strain, the correlation between time points generally eroded with time, progressing from immature (T0) to mature oocysts (T36). For APU-1, gene expression correlated least when comparing T0 to T36 (r = 0.725–0.760). For APU-2, weaker temporal correlations were observed when comparing T0 to T18 through T48 (generally below r = 0.79, ranged r = 0.677–0.783).
The correlation of mean log2-transformed reads (from three replicates per time point, Table S4) ranged from r = 0.749–0.979 in APU-1 and r = 0.730–0.984 in APU-2 (Figure 2). Within a strain, the next strongest correlation in gene expression generally occurred among temporally adjacent pairs (usually spanning 6–12 h). Between strains, the overall mean transcription of genes over time (log2 transformed reads per gene in Table S4) correlated well (r = 0.981). Sometimes, a strain was more similar (or about the same) to itself at another time point than the exact time point of the other strain. For example, APU-1.T48 and APU-1.T36 had r = 0.957 but APU-1.T48 and APU-2.T48 had r = 0.93 (Figure 2). The discordance between strains (as measured by % reduction in correlation for any pair of time points) was greatest when comparing the expression at hour 48 to the expression at hour 0; at this pair of intervals, expression in APU-1 correlated 14.92% more than in APU-2. Comparing strains, the expression differed least when comparing hour 6 to hour 0 (0.02%). Thus, strain-specific differences in gene expression did not arise immediately.
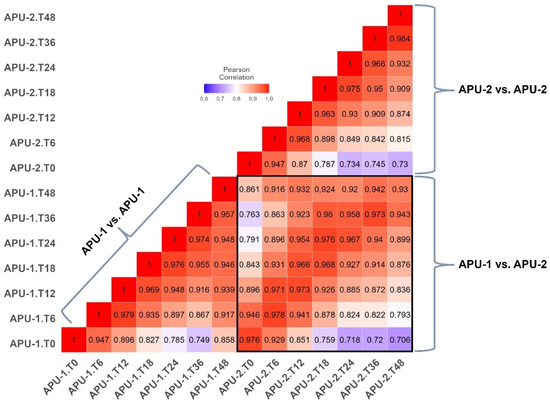
Figure 2.
Pearson’s correlation matrix of transcription between strains APU-1 and APU-2. Mean log2 of mapped reads from three replicates per time point were compared for each strain every 6–12 h during oocyst sporulation. Individual squares represent Pearson’s product correlations between (and within) strains at each time point. Correlations generally decreased with time in each strain. The boxed in area focuses on APU-1 vs. APU-2 correlations, specifically. Note that contemporaneous correlations were generally strongest at the same time point, with exceptions.
Key asynchronous comparisons at hours 18, 24, and 48 (see Figure 2, boxed area) underscored differences in maturation rate, reinforced by the evidence from microscopy (Figure 1). Generally, when strains did not correlate most at the same time point, the best time point was normally ±6–12 h from this time. These exceptional correlations suggested the slower development of APU-1 than APU-2:
- APU-2′s expression at hour 18 best resembled APU-1′s at hour 24 (r = 0.976); by contrast, APU-1 at hour 18 best resembled APU-2 at hour 18.
- Expression in APU-1 at hour 48 correlated best with expression in APU-2 at hour 36 (r = 0.942).
Interestingly, the greatest correlation in expression between the strains when sporulated oocysts predominated (after T18) was at hour 36 (r = 0.973), and it ebbed slightly by hour 48 (r = 0.93). Therefore, evidence from microscopy and transcription established hour 36 as a stable interval for most oocysts to complete sporulation. In general, one strain’s expression of a given gene at a given time point generally predicts that gene’s expression in the other strain, but the quality of this prediction ebbs between 18 and 24 h, when development in APU-2 outpaces development in APU-1.
3.3. RNA-Seq in E. maxima Strains Enabled Analysis of Highly Expressed Genes and Transcriptional Bias
Previous data [37] identified a subset of highly expressed genes throughout E. acervulina sporulation that serve as markers of oocyst viability. Here, we sought evidence for such transcripts in E. maxima strains APU-1 and APU-2. We used Transcripts Per Million (TPM) as a normalization method, to summarize the expression of the 6057 annotated genes. Table S5 contains the mean and standard deviation (SD) of TPM of replicates at each time point.
Initially, we analyzed how uniformly genes contribute to the transcriptome during oocyst development in each strain. We surmised that many of the annotated genes in a strain would contribute relatively few transcripts (indeed, the mean TPM for 6057 genes = 165.10, or <0.017% of total transcripts). The number of genes expressed with >100 TPM at each time point ranged from 723 to 1332 (11.94 to 21.99% of the genes for APU-1) and 718 to 1381 (11.85 to 22.80%) for APU-1 (Table 1); therefore, ~5000/6057 (~83%) annotated genes contributed <100 TPM in each strain. This is in line with our previous report for E. acervulina, where <15% of genes during sporulation contributed >100 TPM [37].

Table 1.
RNA-Seq expression analytics for E. maxima strains APU-1 and APU-2 during sporulation.
To illustrate the range of transcription in strains during sporulation, the lowest expressed gene in APU-1 was at hour 36 (25,751 TPM), whereas the most transcribed gene was at hour 0 (64,395 TPM) (Table 1; this encompassed a range of 2.57–6.44% of total transcripts). For strain APU-2, expression of the most transcribed ranged from 26,560 TPM (at hour 24) to 48,731 (hour 18) (a range of 2.66–4.87%).
As previously established for transcription in E. acervulina [37], we conducted an analysis of transcriptional bias (excess contribution of abundant transcripts). Bias was examined for all genes and then only those with >100 TPM. At each time point (for each strain), transcription was slightly more biased in genes expressed with >100 TPM (Figure 3). The greatest transcriptional bias was observed at 18 h, later than its maximum in E. acervulina (at 4 h). The bias (whether examining all genes or only those with TPM > 100) did not change more than ~3.5-fold from its maximum at T18 to its minimum (at either T0 or T48). The amount of bias observed for all genes at each time point and those with >100 TPM correlated well (r > 0.999, data not shown) within each strain.
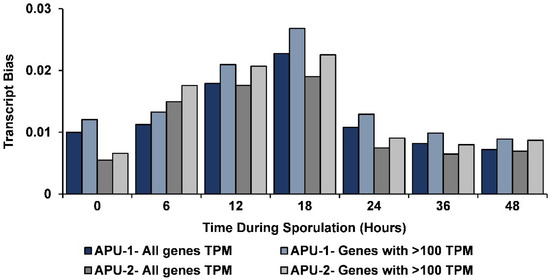
Figure 3.
Transcript bias during oocyst sporulation in E. maxima strains APU-1 and APU-2. The bias in transcription (when a subset of genes most disproportionately contribute to transcripts) is greatest mid-sporulation and peaks at hour 18 (T18). Parallel temporal patterns in transcriptional bias hold whether the analysis is performed on all genes (black, APU-1; dark gray, APU-2) or restricted to those each contributing at least 100 transcripts per million (>100 TPM) (blue, APU-1; gray, APU-2). Transcriptional bias was calculated at each time point (based on mean TPM from three replicates per time point) for each strain.
The degree of bias correlated, temporally, among strains (r = 0.88 comparing all genes; r = 0.874 for genes with >100 TPM). The greatest difference in bias occurred initially, appearing greater in APU-1 than in APU-2; from hours 0 to 6, transcriptional bias remained largely unchanged in APU-1 but increased ~2.5-fold in APU-2. Bias in APU-2 exceeded bias in APU-1 only at hour 6, perhaps due to the genes associated with its accelerated development during that interval.
3.4. Genes Expressed at High Levels throughout Sporulation Are Generally Similar between E. maxima Strains and E. acervulina
A major interest of ours is the identification of markers of viable and infectious coccidian oocysts. Therefore, we examined which transcriptional activities occurred throughout the entire sporulation time course. At any given time, as few as 74 genes contributed >1000 TPM (at hours 12, 18, Table 1). Previously, for E. acervulina, we established an expression threshold of 1000 TPM to identify amplified biomarkers, and here we applied this same criterion to E. maxima strains, identifying genes exhibiting constitutive expression of at least >1000 TPM throughout sporulation.
Of the 6057 annotated genes, 63 (10.4%) were constitutively expressed in APU-1 and 59 (9.74%) were constitutively expressed in APU-2; 58/6057 (9.58%) genes were constitutively expressed in each strain. In this group of 58 genes, 36.2% (21/58) are annotated only as hypothetical proteins in NCBI and ToxoDB. The mean TPM for each gene over time (Table S6) was generally similar among strains; exceptions included genes (e.g., EMWEY_00024920, EMWEY_00025290, EMWEY_00034320, EMWEY_00057080) with >1.4-fold TPM differences between strains.
A general temporal trend held in the expression of these genes: the mean expression of the 58 genes peaked at 12–18 h in each strain and then decreased steadily (Figure 4). Large variation existed for some genes during sporulation due to high expression ranges at certain time points (Table S6). However, over 50% of the genes had an overall mean TPM < 10,000 with relatively little variation (~<4000 SD for mean TPM). The top 10 genes (by mean TPM over time) for each strain were expressed with at least 17,000 TPM. Nine of these genes were common to each strain (e.g., EMWEY_00006260, EMWEY_00042090) and they contributed more to the total number of transcripts and underwent greater change over time.
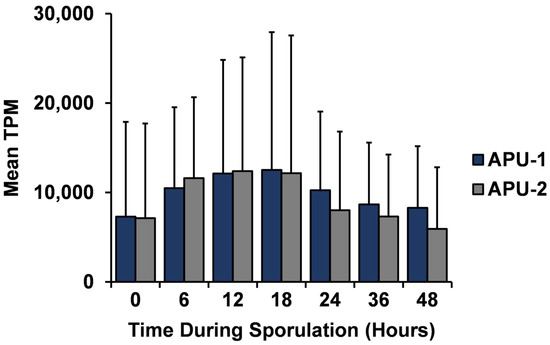
Figure 4.
Temporal trend of constitutively expressed genes in E. maxima strains APU-1 and APU-2. Mean TPM of these 58 genes is displayed over the time course of sporulation. Their mean TPM peaked at 12–18 h. These data support the conclusion that most transcripts important to the continuous development of one strain are also important to the other strain.
To look more broadly, we compared these constitutively expressed genes in E. maxima to our previously reported E. acervulina RNA-Seq data [37]. Of note, most such genes (55 of 58) had a high BLASTP hit in E. acervulina (three exceptions are bolded in Table S6), and of the 55 that could be matched, 41 (~75%) were also constitutively expressed in E. acervulina. Of the 58 genes expressed >1000 TPM in E. maxima, 14 (24.1%) had homologs in E. acervulina that did not meet equivalent expression criteria (bolded, Table S7). Therefore, 17 of the 58 constitutively expressed genes in the E. maxima strains either could not be matched using BLAST or had a match in E. acervulina that was not deemed constitutively expressed in that species. Interestingly, the mean expression of the 41 matched constitutively expressed genes we identified from E. acervulina had maximum mean TPM at four hours (opposed to 12–18 h in E. maxima, Figure 4). These data show that most of the E. maxima-identified genes had homologs previously identified as constitutively expressed in E. acervulina, defining conserved genes important throughout sporulation.
Understanding the Functionality of Constitutively Expressed Viability Markers
To further characterize promising E. maxima candidate biomarkers for viability, we focused on the genes shared between APU-1 and APU-2 that were expressed with at least 20,000 mean TPM over the entire time course (eight genes, italicized in Table S6). Two of these genes encode cation-transporting ATPases (EMWEY_00006260 and EMWEY_00006270). Their homologs in E. acervulina, EAH_00004110 and EMWEY_00004100, were also constitutively expressed genes we previously identified with high expression (>26,000 TPM; Table S7).
In this group of eight genes, other functionally annotated genes encoded a zinc finger DHHC domain-containing protein (EMWEY_00000500). Its homolog in E. acervulina (EAH_00034270) was also a very highly expressed constitutive gene. The remaining highly expressed and shared E. maxima genes (EMWEY_00003320, EMWEY_00033410, EMWEY_00042090, EMWEY_00057080) encode hypothetical proteins. Of note, the homolog of EMWEY_00042090 in E. acervulina (EAH_00037050) had the second highest overall mean TPM (>30,000, Table S7). We could not identify a homolog for EMWEY_00057080 (the highest overall expressed gene in APU-1) in E. acervulina (Table S7). As we found previously for E. acervulina, many constitutively but modestly expressed genes in E. maxima have housekeeping functions.
In the E. maxima NCBI reference strain, 3926/6057 (64.8%) genes are annotated only as hypothetical proteins (as is true for other Eimeria spp.). Compared to our prior analysis of expression in E. acervulina, comparatively few hypothetical proteins occur among the constitutively expressed E. maxima genes (21/58 [36.2%] vs. 26/53 [49.1%] in E. acervulina). To facilitate an improved functional annotation of the hypothetical proteins, we used Blast2GO to search gene homologs Apicomplexa-wide and find related proteins. This search succeeded in identifying a more informative protein hit for 10 of the 21 genes initially identified as encoding hypothetical proteins (bolded in Table S8). This provided more informative annotation (membrane or transmembrane proteins) for three of the eight highly expressed constitutive genes in the E. maxima strains (bolded and italicized, Table S8).
Of the 58 constitutively expressed genes shared by the E. maxima strains, 50 (86.2%) were successfully annotated with at least one Gene Ontology (GO) term (Table S9). With one exception (EMWEY_00029830, encoding a chemotaxis protein), the genes without GO terms encode hypothetical proteins. In total, there were 372 annotated GO terms (Table S9), categorized into the subontologies of Biological Process (BP, 152), Molecular Function (MF, 119), and Cellular Component (CC, 101). Some genes with expression on the lower end of the spectrum (e.g., EMWEY_00024250 [mean TPM > 5000 in each strain], EMWEY_00045300 [mean TPM ~3000 in each strain]) had comparatively more GO terms.
The most frequent BP terms included those related to proteolysis, ubiquitin-dependent catabolic processes, protein modification, translation, transmembrane transport, and many encompassing actin activity. In addition, many terms pertained to regulation and cellular responses. The dominant MF terms pertained to binding (ATP, metal ion, DNA, actin, magnesium, phospholipid, etc.), ligase activity, ATP hydrolysis, endopeptidase activity, cytoskeleton, ribosome functions, and protein-cysteine S-palmitoyltransferase activity. Other terms pertained to a host of cellular functions. The most numerous CC terms included membrane, nucleus, cytosol, cytoplasm, actin, plasma membrane, nucleoplasm, assorted organelle terms, ubiquitinligase complex, and acetylcholine-gated channel complex. In addition, other terms were identified that can be grouped into ribosome structure and cytoskeleton/motility. A few genes encoding hypothetical proteins (that may have matched or not matched to a better annotation in other species) had associated GO terms. In general, many of the enriched terms were like those we identified for the constitutively expressed genes in E. acervulina.
Of the higher expressed genes shared by both strains described above, EMWEY_00006260 and EMWEY_0006270 had GO terms pertaining to membrane and mitochondrion (Table S8). EMWEY_00000500 had eight annotated GO terms including: protein targeting, peptidyl-amino acid modification, protein palmitoylation, protein-cysteine S-palmitoyltransferase activity vacuole, endoplasmic reticulum, Golgi apparatus, and plasma membrane. EMWEY_00033410 (hypothetical protein) had homology to a membrane protein of Besnoitia besnoiti (Table S8) and GO terms of tRNA aminoacylation for protein translation, nucleotide binding, aminoacyl-tRNA ligase activity, and membrane. EMWEY_00042090 also had similar BLAST homology to a membrane protein of other Apicomplexans and the GO term membrane. Two genes encoding hypothetical proteins (EMWEY_00003320 and EMWEY_00057080) did not have more informative hits in Apicomplexa species but EMWEY_00057080 was associated with the GO terms histone methylation and metal ion binding.
Of the 58 constitutively expressed genes, 22 were involved in at least one enzymatic pathway using Blast2GO (Enzyme codes [ECs], Table S8). Many genes below <10,000 overall mean TPM were among the lowest expressed over the time course, but some eclipsed >20,000 mean TPM. We also applied KEGG pathway analysis to identify large metabolic pathways for all genes. Overall, 12 genes had associated KEGG pathways (Table S7); therefore, not all genes with ECs could be linked to a KEGG pathway. We also noted that some of these genes were among those with a larger number of GO annotations than others, as described above. The major pathways defining these genes included thiamine metabolism, purine metabolism, and glycerophospholipid metabolism. EMWEY_00051720 (mean TPM ~6000 in both strains) was linked to an assortment of pathways (found from ToxoDB). Eleven of twelve genes contributing to KEGG pathways matched to homologs in E. acervulina that we previously found were also constitutively expressed by the same criteria (the exception was EMWEY_00024920 = EAH_00006770). These 11 genes essentially were linked to the same KEGG pathways (Table S7).
The highest expressed gene linked to a KEGG pathway differed in each strain. For APU-1, it was EMWEY_00025290 (mean TPM = 25,192, linked to terpenoid backbone biosynthesis). For APU-2, it was EMWEY_00011310 (mean TPM = 17,340, nicotinate and nicotinamide metabolism, alanine, aspartate, and glutamate metabolism; taurine and hypotaurine metabolism). The homolog to EMWEY_00011310 in E. acervulina (EAH_00019500) was also a highly expressed constitutive gene and had the same KEGG pathways (Table S7). Only one of the genes annotated as encoding a hypothetical protein (EMWEY_00024920) had an associated KEGG pathway (PD-L1 expression and PD-1 checkpoint pathway in cancer).
These data reinforce the idea that modestly and constitutively expressed genes encode enzymes in metabolic pathways that underlie basic housekeeping functions. There is a conservation of genes and similarity between species of Eimeria, and possibly among coccidia more generally. While we could identify possible homologs of hypothetical proteins (some highly expressed in both strains) in other Apicomplexan species, little more could be gleaned about their function.
3.5. Few Genes Contributed Many Transcripts throughout Sporulation to a Significantly Different Extent in APU-1 and APU-2
We sought biomarkers that might differentiate the two E. maxima strains by identifying significantly DEGs throughout sporulation. We searched for genes undergoing >1.5 or <−1.5 log2 fold-change (FC) with an adjusted p < 0.05 (Figure 5). Of 204 such genes identified, most contributed minimally (<100 TPM) to the total transcript pool. Ten genes differing in expression among strains contributed, on average, >100 TPM in each strain (Table 2). Genes particular to APU-1 were all upregulated in comparison to APU-2; eight genes were upregulated in APU-2. Two genes (EMWEY_00007700 and EMWEY_00023530, italicized in Table 2 and Table S10) surpassed 100 mean TPM in each strain (and exceeded 1000 TPM at some time points in APU-1) but underwent >1.5 log2 FC in expression when comparing strains. These two genes generally followed the same temporal transcriptional pattern. Other genes particular to each strain were generally expressed with <500 TPM during sporulation, although they were sometimes >6-fold (log2) differentially expressed between strains.
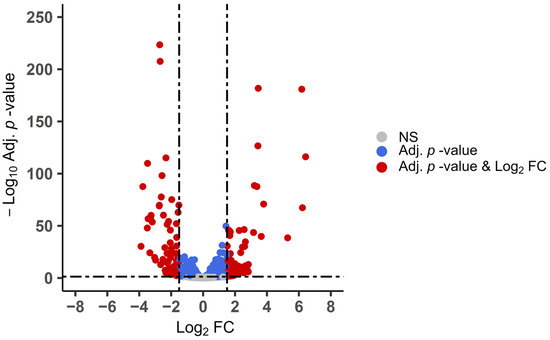
Figure 5.
Differentially expressed genes (DEGs) during sporulation in E. maxima strains APU-1 and APU-2. Expression during sporulation was compared between strains using DESeq2. Threshold criteria of >1.5 or <−1.5 log2 fold change (FC) with adjusted p < 0.05 (Adj. p-value) were utilized. By these criteria, 204 significantly DEGs were identified (in red). This plot depicts expression of E. maxima APU-2 vs. APU-1 (143 upregulated, 61 downregulated genes in APU-2). NS indicates non-significant.
Table 2.
Significantly differentially expressed genes (DEGs) between APU-1 and APU-2 during sporulation.
As a proportion of the total transcripts, certain genes contributed more than 4-fold more (on average) in APU-1 than APU-2 and were upregulated >2-fold (log2) (EMWEY_00023530, EMWEY_00041620, EMWEY_00048910, EMWEY_00056530) (Table 2). Conversely, EMWEY_0005470 (encodes a Surface Antigen [SAG] family member gene) had ~3 times higher log2 FC in APU-2 than in APU-1 (and exceeded a mean TPM of 1000); the strain-to-strain TPM difference was greatest during intervals of active sporulation. Genes EMWEY_00008090 and EMWEY_00058460 were both upregulated >6-fold (log2) in APU-2 with very high differences in the overall mean TPM (expression of these genes was <10 TPM at all time points in APU-1). The genes in APU-2 sometimes achieved >200-fold TPM difference compared to APU-1 at T36. They may be useful in the identification of strains and identifying oocysts at stages during sporulation (see below).
For APU-2, 4/10 of the genes identified encode hypothetical proteins. Blast2GO did not identify a more informative match for these genes (Table S10). In total, nine genes were associated with 61 GO terms and the majority associated with genes EMWEY_00023530 (see above), EMWEY_00036080 (thioredoxin), EMWEY_00039050 (Ovarian Tumor Unit [OTU]-like cysteine protease domain-containing protein), and EMWEY_00058460 (elongation factor 1-alpha, [EF-1α]).
The GO terms for genes unique to APU-2 (Table S10) can be summarized as follows. EMWEY_00036080 has terms pertaining to endoplasmic reticulum and Golgi apparatus structure, protein targeting, transport, and folding. EMWEY_00039050’s GO terms were related to protein deubiquination and peptidase activity. EMWEY_00058460 was associated with the most GO terms and these were of multiple types including tRNA transport, GMP and GTPase binding, ATP activity, actin assembly, and translation processes. Although this gene (and a few others) had EC numbers identified using Blast2GO, only EMWEY_00058460 had linked KEGG pathways in our analysis (Table S10). These pathways were related to drug metabolism, antibiotic synthesis, and metabolism of purines, sulfur, selenocompounds, and thiamine. These pathways were similar in the E. acervulina homolog for this gene (EAH_00032440), which had a very low mean overall expression throughout sporulation. The highest expressed gene (EMWEY_00005470) had a single GO term of “membrane” but no other useful information was identified. All the 10 genes had homologs we could identify in E. acervulina.
Of the 10 DEGs in APU-1, 9 encode hypothetical proteins. After Blast2GO analysis, only one of these genes (EMWEY_00001070) matched to a more informative annotated gene in another Apicomplexan species (SF-assemblin in C. cayetanensis, Table S10). In total, 6 genes were associated with 23 GO terms with the majority (those with other than CC term of “membrane”) associated with genes EMWEY_00001070, EMWEY_00012880, and EMWEY_00023530 (18kDa cyclophilin). GO terms for these genes generally fell into broad categories. EMWEY_00012880 was associated with terms pertaining to cilia assembly and transport/targeting, and EMWEY_00001070 was associated with cytoskeleton and cytoplasm. EMWEY_00023530, the highest overall expressed gene in the group, was associated with terms pertaining to cyclosporin A binding and protein folding and protein isomerization. Only this gene was associated with an EC number, but we did not identify a linked KEGG pathway.
Generally, genes expressed to differing extents in the strains of E. maxima contributed more to the total transcript pool than homologs of these genes in E. acervulina. Eight of the 10 APU-1 genes had homologs that we could identify in E. acervulina. These genes had relatively lower mean overall TPM (most <50 TPM) in E. acervulina. The homolog to EMWEY_00023530 (EAH_00035670) was the highest expressed, eclipsing 160 TPM (Table S10). The homolog to EMWEY_00059740 (EAH_00003690) was the highest expressed in E. acervulina. Interestingly, EMWEY_00005470 (highest TPM in APU-2) had <1.0 mean TPM in E. acervulina. These genes encode SAGs, possibly indicating their increased importance in APU-2.
Overall, during sporulation, certain genes are expressed more in one strain than in the other. However, little additional information exists about the function of these DEGs: few such genes belonged to identifiable metabolic pathways; some were more prominently associated with certain GO terms. Interestingly, those genes identified by GO terms and KEGG pathways tended to be expressed at very low levels throughout sporulation. Therefore, we performed further analysis at specific time points in hopes of identifying more biomarkers important to each strain.
3.6. Differential Expression at Hours 36 and 48 during Oocyst Sporulation
Differences in the expression of genes at certain time points may drive, or reflect, developmental differences between strains. For example, at hour 36, genes EMWEY_00023520 and EMWEY_00056530 in APU-1 and EMWEY_00005470, EMWEY_00008090, and EMWEY_00058460 in APU-2 were expressed much more in one strain than the other (sometimes up to 230-fold higher TPM, Table 2). Accordingly, we sought to identify genes especially responsible for the degree of correlation evident between strains at particular times (Figure 2). Against a general pattern of concurrent changes in expression, comparatively accelerated development in APU-2 was implied by cases where its expression profile correlated best with the expression of APU-1 6–12 h later (Figure 2). The number of significantly DEGs tended to increase as the transcription correlation between time points decreased (Table 3). This decrease in correlation also coincided with increasing DEGs at concurrent time points during sporulation between strains. Yet, the greatest number of DEGs occurred when comparing APU-1 at hour 18 with APU-2 at hour 24.
Table 3.
Summary of differential expression comparing oocyst development (hours) between E. maxima strains.
3.6.1. DEGs at Hour 36 Demarcate Strain-Specific Biomarkers and Help Explain Expression Differences around Periods of Maximum Sporulation
We took special interest in genes whose expression drove a strong correlation between the strains at hour 36, by which time many oocysts completed the formation of visible sporocysts; we also sought to determine the causes of the evident ebbing of correlation by hour 48. Using the previously described criteria, we found 284 DEGs at hour 36 and 850 at hour 48 (Table 3). At hour 36, only three genes contributed >1000 mean TPM in APU-1 (EMWEY_00006520, EMWEY_00007700, EMWEY_00023530) and only one for APU-2 (EMWEY_00005470).
Considering any such genes contributing >100 mean TPM identified 21 genes in each strain, 10 were shared by both strains (italicized in Table 4). For APU-1, most of the DEGs identified (above) based on the average overall expression were also differentially expressed at hour 36 (except for EMWEY_00001070 and EMWEY_00057350). For APU-2, only EMWEY_00036080, EMWEY_00037810, and EMWEY_00042800 were differentially expressed overall but not at hour 36. Therefore, most genes differently expressed throughout sporulation were also differentially expressed at hour 36.
Table 4.
Significantly differentially expressed genes with elevated expression between APU-1 and APU-2 at T36.
As determined for mean expression throughout sporulation, at hour 36, genes such as EMWEY_00023530 and EMWEY_00056530 were upregulated (>2-fold log2) in APU-1. All but six DEGs in APU-1 with >100 TPM encode hypothetical proteins. Generally, the genes with the highest TPM in APU-1 did not have the greatest differential expression vs. APU-2; however, genes such as EMWEY_00005570 and EMWEY_00023520 were upregulated ~3-fold (log2) compared to APU-2 (Table 4).
Except for one gene (EMWEY_00014910, bolded Table S11), our Blast2GO pipeline did not identify any more informative annotations for APU-1 DEGs at hour 36. Also, most GO terms were associated with already annotated genes. Still, some upregulated genes had more than one term. For example, EMWEY_00012880 (~2-fold log2 upregulated in APU-1, encoding a hypothetical protein) and EMWEY_00023530 were associated with at least seven GO terms (see above). EMWEY_00005570 (protein binding) and EMWEY_00023520 (membrane) were each associated with a single GO term. EMWEY_00006520 was associated with nine GO terms, including those relating to development and DNA binding and DNA damage repair. Three genes (EMWEY_00006520, EMWEY_00017660, EMWEY_00052370) had associated KEGG pathways according to our analysis; these were aminobenzoate degradation, amino sugar and nucleotide sugar metabolism, and porphyrin and chlorophyll metabolism, respectively (Table S11).
At hour 36, 19 of 21 genes expressed to a significantly greater extent in APU-1 than in APU-2 had identifiable homologs in E. acervulina. As we found in the analysis of mean expression through time, these genes generally contributed a higher proportion of the total transcripts in E. maxima than their homologs in E. acervulina. However, the homologs of EMWEY_00031340 and EMWEY_00056980 (hypothetical proteins contributing <300 TPM at hour 36, downregulated vs. APU-2) were expressed to a much greater extent in mature oocysts of E. acervulina (italicized and red, Table S11). In E. acervulina, they were DEGs between mature and immature oocysts [37].
As noted in strain APU-1, certain genes overexpressed throughout sporulation in APU-2 were also upregulated at hour 36 (compared to APU-1): for example, EMWEY_00005470 and EMWEY_00058460 (Table 4). Other genes were noticeable for a >2-fold (log2) upregulated expression change, including EMWEY_00000860, EMWEY_00039050, EMWEY_00052050, and EMWEY_00059740 (note that EMWEY_00000860 and EMWEY_00052050 were genes not identified in our overall analysis).
Of the genes expressed more in APU-2 than APU-1 at hour 36, 10 of 21 encode hypothetical proteins. Except for one gene (EMWEY_00007270, bolded Table S11), our Blast2GO pipeline identified no more informative annotated genes. Approximately half of the genes were associated with most of the GO terms. Some genes with related GO terms appeared similar—e.g., EMWEY_00017480 and EMWEY_00056980—yet experienced only modest excess expression in APU-2. A group of genes (EMWEY_00000860, EMWEY_00039050, EMWEY_00052300, EMWEY_00054680, EMWEY_00059760) were associated with amino acid metabolism and protein synthesis/regulation GO terms. EMWEY_00058460 was the highest upregulated DEG vs. APU-1 with 6.7-fold log2 differential expression.
The two SAG protein-encoding genes (EMWEY_00005470, EMWEY_00059740) identified in the overall analysis were also upregulated at T36. These genes have the highest expression during the time course (in each strain) at hour 36. It appears that mature oocysts in APU-2 may be characterized more by protein processes and SAG proteins (upregulated in APU-2, although they contributed >100 TPM in both strains). KEGG pathways were identified for five genes (Table S11: EMWEY_00006520 [see above], EMWEY_00011930, EMWEY_00054680, EMWEY_00058460 [see above], EMWEY_00059760). These pathways concern thiamine/purine metabolism and amino acid and antibiotic synthesis, in addition to other pathways. These genes were all expressed <~500 TPM.
We found that 19 of the APU-2 genes also had homologs in E. acervulina. Two of the genes in common with APU-1 and discussed above had homologs in E. acervulina that were upregulated in mature oocysts, and EMWEY_00011930 (heat shock protein homologous to EAH_00002610) was an additional one (italicized and red, Table S11). The homolog was also expressed with >1000 TPM in E. acervulina and significantly differentially expressed vs. immature oocysts in that species.
3.6.2. DEGs at Hour 48 Characterize the Divergence of Oocysts Compared to Hour 36
As described above, transcriptional profiles agreed best at hour 36 and eroded thereafter. Indeed, concurrent correlation appeared weakest at hour 48. (Figure 2). The number of DEGs, comparing the two strains, triples from hour 36 to hour 48 (from 284 to 850; Table 3). We sought to further understand the changes demarcating this departure (acknowledging that expression in one strain still explains 93% of the variation in expression in the other).
Of the 284 DEGs between strains at hour 36, 184 (64.8%) remained differentially expressed at hour 48. The log2 differential expression ratio for the remaining 100 genes ranged from ±2.7 to ±2.01 (APU-1 vs. APU-2), a tighter range than described in Table 4 (Table S12A). Genes with the largest magnitude in differential expression among strains tended to contribute fewer TPM. Only 12 of these 100 DEGs were upregulated in APU-1. Fourof the 100 genes contributed >100 TPM in APU-1, and only 6 contributed >100 TPM in APU-2 (these were described above and/or in Table 4). These four genes were also DEGs between strains at T36, possibly indicating their greater importance to that time point.
Of these 100 genes, 57 were annotated as hypothetical proteins and Blast2GO found 26/57 (~46%) had a more informative Apicomplexa BLAST hit (Table S12A). Among the 100 genes, some common annotations included DEAD-box domain-containing helicases, subtilases, translation initiation factors, and DNA damage proteins. The groups generally had similar differential expression profiles. Overall, 624 GO terms were found for the 100 genes. Many could be attributed to genes such as EMWEY_00020830 (encoding thioredoxin reductase with 50 terms), EMWEY_00043800 (hypothetical protein with 60 terms mainly pertaining to cellular transport and regulation), EMWEY_00047940 (encoding a helicase protein, 20 terms), EMWEY_00049690 (encoding an anti-silencing protein, 23 terms), and EMWEY_00058910 (encoding a protein transport protein, 22 terms). These genes had a low mean TPM at hour 36 but comprised a higher proportion of total transcripts in APU-2 than in APU-1.
KEGG pathways were identified for 29/100 genes, most of which exhibited relatively low expression. EMWEY_00006520 (one of the highest expressed genes in both strains, but upregulated in APU-1) was described above for the T36 DEGs. Most of the 100 genes had identifiable homologs in E. acervulina, but the expression between species varied (Table S12B). For example, EAH_00017220 (homolog of EMWEY_00038960) was a highly constitutively expressed gene but its E. maxima homolog was expressed to a lesser extent. EAH_00026150 was higher expressed in mature E. acervulina oocysts and its homolog in E. maxima (EMWEY_00056980) was on the higher end of expression at T36 in both strains.
Interestingly, most of the DEGs at hour 48 were not differentially expressed at hour 36 (666/850; 78.4%; Table S12B). Therefore, these genes appear to demarcate strain divergence after hour 36. The log2 FC of the 666 genes ranged from ±3.79 to ±3.71, an increase from the hour 36 DEGs. A greater relative number of genes were expressed >100 TPM in strains at T48 (92 in APU-1, 132 in APU-2) than at T36 and more genes eclipsed 1000 TPM. About 66% (438/666) of the genes were annotated to encode hypothetical proteins. Blast2GO analysis found better matches with more informative annotations for 166 of the 438 (~38%) genes originally encoding hypothetical proteins. As with the T36 genes, T48 had many genes that could be grouped into categories (e.g., ribosomal proteins, kinesins, ATPases, DNA polymerases, invasion proteins, subtilases/subtilisin, zinc finger proteins, etc.). Some were of similar nature to the T36 genes. However, genes encoding adaptin, chromosome segregation proteins, SAGs, myosins, DNA polymerases, mitochondria, and microneme proteins seemed unique to T48 oocysts. Again, the directionality of expression was usually similar for groups. Overall, there were 2904 GO terms identified for the 666 genes.
Although most of the T48 DEGs (not also differentially expressed in T36) were expressed to only a modest extent, 10 DEGs (4 upregulated, 6 downregulated in APU-1) and 23 genes in APU-2 (all upregulated vs. APU-1) had a mean TPM > 1000 at T48 (Table S12B). Genes with higher differential expression in APU-1 generally did not have as high TPM, however. The 10 APU-1 genes were significantly differentially expressed at least 1.6 log2 FC compared to APU-2; eight genes encoded hypothetical proteins. Genes EMWEY_00025300 (hypothetical protein), EMWEY_00036630 (hypothetical protein but had BLAST similarity to a protein kinase domain-containing protein in E. mitis), EMWEY_00056350 (subtilase family serine protease), and EMWEY_00070020 (ATP synthase beta chain) eclipsed 1000 TPM at T48 with at least >1.7-fold log2 higher differential expression than APU-2. GO terms were associated with EMWEY_00036630 (such as protein kinase, ATP binding), EMWEY_00056350 (including proteolysis, serine-type endopeptidase activity), and EMWEY_00070020 (pertaining to translation, ribosomes). The E. acervulina homolog (EAH_00048170) of EMWEY_00056350 was highly expressed throughout sporulation. The highest DEG was EMWEY_00056940 (3.7-fold higher log2 FC in APU-1) with ~120 TPM in APU-1.T48 vs. ~2 TPM in APU-2.T48. This gene, originally annotated to encode a hypothetical protein, had BLAST similarity to a putative adenosine monophosphate deaminase in Neospora caninum. No KEGG pathways were identified for the 10 genes.
For the 23 APU-2 DEGs of interest, 14 exceeded >2000 TPM at T48. These genes were all upregulated vs. APU-1 with at least ~1.6 FC (log2). These included genes such as EMWEY_00005600 (hypothetical protein), EMWEY_00009150 (hypothetical protein, but BLAST similarity to T. gondii family D protein), EMWEY_00016000 (hypothetical protein but BLAST similarity to an uncharacterized serine-rich protein C215.13-like in C. cayetanensis), EMWEY_00016120 (hypothetical protein), EMWEY_00016540 (hypothetical protein), EMWEY_00017740 (hypothetical protein), EMWEY_00028320 (hypothetical protein, but BLAST similarity to a putative autoantigen, coiled-coil vesicle tethering subfamily A protein in T. gondii), and EMWEY_00030150 (hypothetical protein). Genes EMWEY_00009150 and EMWEY_00016000 were very highly expressed (>18,000 TPM) at T48. Several of these genes (and others with >2000 TPM) had multiple GO terms, including EMWEY_00016120 (protein phosphorylation, kinase activity, ATP binding), EMWEY_00017740 (transcription, nucleus, transcription regulation), EMWEY_00023060 (encoding a serine protease inhibitor with terms pertaining to endopeptidases, regulation of endopeptidase activity), and EMWEY_00031210 (encoding Hsp20 with terms pertaining to stress response, protein folding). Genes EMWEY_00005600 and EMWEY_00008410 (encoding an aldo/keto reductase family oxidoreductase) were the only genes with >2000 TPM at T48 with associated KEGG pathways: propanoate, inositol phosphate, amino acid metabolism, and sugar and other molecule catabolism, respectively. Generally, the highest DEGs in APU-2 had low expression but EMWEY_00030150 (hypothetical protein) was ~3-fold log2 more highly expressed vs. APU-1 (and upregulated) with ~3700 TPM (no GO terms or KEGG pathways identified, however). We could identify E. acervulina homologs for almost all the genes with >2000 TPM but they were mostly on the low spectrum of expression. However, EAH_00010650 (Hsp20, homolog of EMWEY_00031210) did reach >1000 TPM at T24 and was significantly differentially expressed vs. immature oocysts. Again, finding a clear association for genes underlying the time point expression between species seems challenging.
3.7. RNA-Seq Revealed Markers That Demarcate Strain-Specific Immature and Mature E. maxima Oocysts
We wished to find markers of immature and mature E. maxima oocysts, as we previously reported in E. acervulina. When comparing the overall differential expression (the log2 ratio between strains without cutoffs) of time points T36 andT0 between strains, there was a high correlation of DEGs (r = 0.90). Most genes underwent parallel expression changes in each strain: 2317 were upregulated and 2522 downregulated in each (upper-right or lower-left quadrants of Figure 6). Far fewer transcripts fall far from the origin in the upper-left (n = 740) or lower-right (n = 403) quadrants in Figure 6 (undergoing contrasting directions in temporal expression). Concurrent changes generally were of similar magnitude, but differences in the extent of temporal variation may be related to developmental differences between strains.
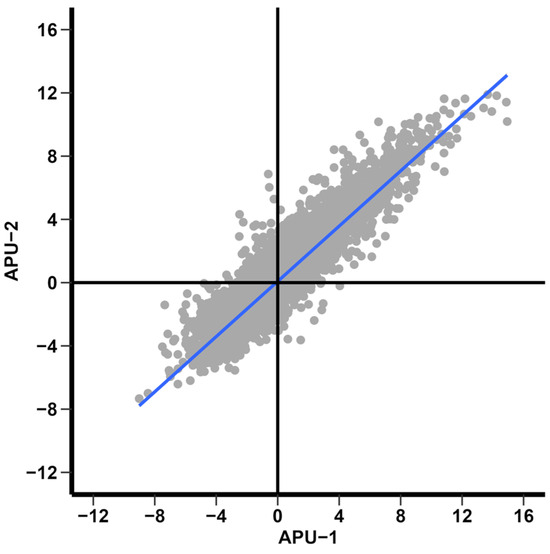
Figure 6.
Log2 FC differential expression between time points T36 and T0 for strains APU-1 and APU-2. Much directional similarity between expressed genes is evident, concordance in top-right and bottom-left quadrants. The blue line indicates the regression line. Note: for 75 of 6057 annotated genes, differential expression could not be determined between time points in strains; therefore, the graph depicts differential expression of 5982 genes.
Generally low baseline expression prevented some genes, exhibiting large fold-changes in expression, from demonstrating statistical significance. Exceptions may signify strain-specific markers of immature or mature oocysts. Table 1 shows 2440 significantly DEGs between T36 and T0 in APU-1 and 2499 DEGs in APU-2 using our thresholds. Of these, 1871 DEGs were shared between strains. The log2 FC of these 1871 DEGs correlated highly (r = 0.96), reinforcing the conclusion that genes in strains undergo similar directional changes in their temporal expression.
We further examined genes undergoing differential expression in each strain at hours 0 and 36, starting with genes not shared by the pair of strains (569 DEGs for APU-1; 628 for APU-2). Of these, strong expression (>1000 TPM) at either hour 0 or 36 characterized 23 genes in APU-1 and four in APU-2 at hour 0 (Table S13). At hour 36, strong expression characterized 19 genes in APU-1 and 2 in APU-2 (Table S14).
Among the 23 high expression DEGs only in APU-1, most (16 = 69.6%) were downregulated at T0 (ranged −2.4–4.1 log2 FC). However, many of these genes contributed to high TPM at both hours 0 and 36 and were constitutively expressed in both strains (Table S6), as well as in E. acervulina. One of the 23 genes (EMWEY_00053520, hypothetical protein) had a homolog in E. acervulina (EAH_00034940) that we previously identified as an upregulated immature oocyst biomarker (~2-fold log2 higher expressed in its immature oocysts). The seven remaining APU-1 DEGs were upregulated and not constitutively expressed. One gene may serve as an especially suitable marker of immature oocysts of APU-1 because its initial expression level was >4 log2 fold higher than its expression at hour 36 (EMWEY_00052020, an X-Pro dipeptidyl-peptidase domain-containing protein). Conversely, three genes specific to APU-2 underwent upregulation from hour 0 to hour 36, whereas one underwent downregulation. Their expression at T36 ranged from 1000 to 3000 TPM (lower than the APU-1 genes) and their log2 FC ranged from −2.3 to 2.13. All the genes were annotated but were not constitutively expressed. None were like the genes previously identified in immature oocysts of E. acervulina. These genes may identify immature oocysts of APU-2.
The same analysis for genes with >1000 TPM at T36 (DEGs vs. T0) in each strain identified 18 genes in APU-1 and 2 in APU-2 (Table S14). For APU-1, almost all were the same as the shared constitutively expressed genes (plus EMWEY_00006520 and EMWEY_00036760, Table S14), owing to their high expression at both T0 and T36. Notably, EMWEY_00006520 was expressed to an even greater extent in APU-1 than in APU-2 (log2 FC = 3.7). It was a DEG we identified between strains at T36 (Table S11) and appeared unique to that time point (not differentially expressed at 48 h, Table S12). Its higher expression vs. APU-2 at T36 (and T0 in APU-1) makes it an especially promising marker for mature APU-1 oocysts. Its homolog (EAH_00010210) was not differentially expressed in mature oocysts of E. acervulina, unlike EMWEY_00036760, which was differentially expressed in mature oocysts, as was its homolog in E. acervulina (EAH_00022470; >3.7 log2 FC in mature vs. immature oocysts but not a mature oocyst biomarker). In strain APU-2, one of the two genes identified (EMWEY_00034320) was also highly expressed at T0 (Table S13). This gene, while >2-fold log2 differentially expressed at T36, was also constitutively expressed in each strain. Its homolog was previously identified as a mature oocyst biomarker in E. acervulina (EAH_00057690; >3-fold log2 upregulated). Therefore, this gene could be used to distinguish E. maxima APU-2 mature oocysts from immature oocysts, but its utility for other purposes may be limited.
3.8. Markers of Immaturity and Maturity Shared by Both Strains of Eimeria maxima
3.8.1. Immature Oocysts
We then identified genes that demarcated markers of immaturity and maturity common to each strain. Given the strong temporal similarities in gene expression in the two strains, we sought to summarize which genes especially characterized either immature or mature oocysts of Eimeria maxima. To this end, we examined the 1871 significantly DEGs which contributed >1000 TPM at either hour 0 or 36 in each.
Only 13 of 1871 genes meeting these criteria were overexpressed (most >~2-fold log2) at hour 0 (Table 5). Four of these 13 were identified as constitutively expressedabove (EMWEY_00025290, EMWEY_00029600, EMWEY_00045300, EMWEY_00057080). Over half of the 13 genes encode hypothetical proteins; the others encode enzymes. For example, EMWEY_00060390 (encoding phosphoserine aminotransferase) was expressed >7-fold log2 higher at T0 than at T36. Another gene, EMWEY_00056350 (encoding subtilase) is homologous to a subtilase (EAH_00048170) we identified as upregulated in T0 oocysts in E. acervulina. Thus, this gene appears to strongly demarcate immature oocysts of both E. acervulina and E. maxima. None of the other genes matched a homolog in E. acervulina that contributed >1000 TPM and was differentially expressed in immature oocysts.
Table 5.
Significantly differentially expressed genes (DEGs) between immature (T0) and mature (T36) oocysts in common to both E. maxima strains.
Except for one of the hypothetical protein-encoding genes (EMWEY_00051470), Blast2GO did not identify any informative hits from other Apicomplexa species (Table S15). A total of 90 GO terms were identified for all genes and many were associated with the downregulated genes EMWEY_00045300 (encoding MAP3K epsilon protein kinase) and EMWEY_00025290 (isoleucyl-tRNA synthetase-related, related to CDS). EMWEY_00060390 (phosphoserine aminotransferase), which exhibited elevated differential expression in both strains, was upregulated with at least ~5.7 log2 FC in E. maxima T0 oocysts. The associated GO terms pertained to serine and lysine biosynthesis.
The gene with the highest TPM at T0 in each strain (>26,000 TPM and at least ~1.9 log2 FC expressed vs. T36 oocysts) was EMWEY_00057080 (a constitutively expressed gene described above). This was associated with the GO terms histone methylation and metal ion binding. EMWEY_00004950 was upregulated >3-fold (log2) and encodes a hypothetical protein. It was associated with one GO term: hydrolase activity. EMWEY_00018810 was ~3-fold log2 differentially expressed and associated with terms regarding mRNA processing and proteolysis.
EMWEY_00051470 encodes a hypothetical protein that was expressed in immature oocysts ~5-fold log2 more than in each strain at hour 0. It resembles a wax ester synthase/acyl coenzyme A (acyl-CoA): diacylglycerol acyltransferase (WS/DGAT) with monoacylglycerol acyltransferase (MGAT) activity in Cystoisospora suis, associated with the GO terms O-acyltransferase activity and membrane. Four genes were associated with KEGG pathways: EMWEY_00024360 (glycosylphosphatidylinositol (GPI)-anchor biosynthesis, purine metabolism), EMWEY_00025290 (terpenoid backbone biosynthesis), EMWEY_00045300 (human immunodeficiency virus 1 infection), and EMWEY_00060390 (multiple amino acid, methane, and vitamin B6 metabolism).
3.8.2. Mature Oocysts
We identified 32 significantly DEGs shared by strains at hour 36 when compared to initial conditions. Some of these achieved >14 log2 FC and contributed >10,000 TPM at hour 36. Interestingly, four genes were expressed strongly at both hours 0 and 36 (italicized in Table 5). The temporal directionality of expression differed. These four genes were highly constitutively expressed throughout sporulation.
Annotation beyond “hypothetical protein” was lacking for most of these 32 genes, including some exhibiting the highest temporal change in expression and contributing the most TPM. Blast2GO did find annotated homologs in some other Apicomplexans for some of these genes: 10/22 genes annotated as encoding hypothetical proteins had a more informative match (bolded in Table S15). These were transmembrane proteins, microneme proteins, as well as some others. EMWEY_00009150 (expressed >15,000 TPM in both strains and >10-fold log2 more at T36 than T0) was the highest expressed hypothetical protein-encoding gene that had a more informative BLAST hit (matched to T. gondii family D protein). This gene was also identified as a DEG differentiating strains at T48 vs. T36 (Table S12A,B). Sometimes, when a better annotation was identified, the best match (by BLAST e-value) was from E. maxima: these were for microneme proteins.
Overall, multiple clusters of genes were found, such as SAGs and micronemes. Along with a myosin protein, these types of protein-encoding genes were also identified in mature E. acervulina oocysts in our previous work. In fact, one-third (11/32 genes) bore strong homology to genes in E. acervulina previously identified as significantly differentially expressed biomarkers in mature oocysts (red in Table S15). Thus, these 11 genes appear to represent especially important markers of maturity in the genus. Six other genes with this expression profile did not identifiably resemble a homolog in E. acervulina, seemingly representing markers of maturity in E. maxima.
For the 32 genes overexpressed at hour 36 in each strain of E. maxima, ~100 total GO terms were identified. Most of the GO terms were assigned to a few genes, such as EMWEY_00025290 and EMWEY_00045300. Some genes undergoing strong upregulation at hour 36 had no associated GO terms or simply “membrane”, but a few such as EMWEY_00014920, EMWEY_00017740, EMWEY_00029270, and EMWEY_00036540 had multiple terms and at least >8 fold log2 higher expression than T0 in both strains. Genes EMWEY_00017740 and EMWEY_00029270 were originally annotated to encode hypothetical proteins; Blast2GO found that the latter resembled a microneme protein in E. maxima. The only genes with associated KEGG pathways were the two in common (EMWEY_00025290, EMWEY_00045300, although upregulated in mature oocysts) with the T0 genes.
3.9. RT-qPCR-Validated RNA-Seq Data
To validate the estimates of gene expression from RNA-Seq, we selected three genes for confirmatory analysis using RT-qPCR. Three time points during sporulation were analyzed that captured expression at immature (T0), intermediate (T18), and mature (T36) stages of oocyst development. Two targeted genes were highly constitutively expressed with >1000 TPM at each time point (EMWEY_0006260, EMWEY_00042090, Table S6) in each strain. Another gene, EMWEY_00005470, was ~3-fold log2 more expressed overall in APU-2 than in APU-1 with a greater expression vs. APU-1 at multiple time points (Table 2 and Table 4). We used these assays to compare the expression at hours 18 and 36 with expression at hour 0, our baseline. For these three genes, we compared log2 expression as estimated using RNA-Seq and RT-qPCR. As shown in Figure 7A, the expression levels of individual genes determined using RT-qPCR were consistent with those obtained using RNA-Seq.
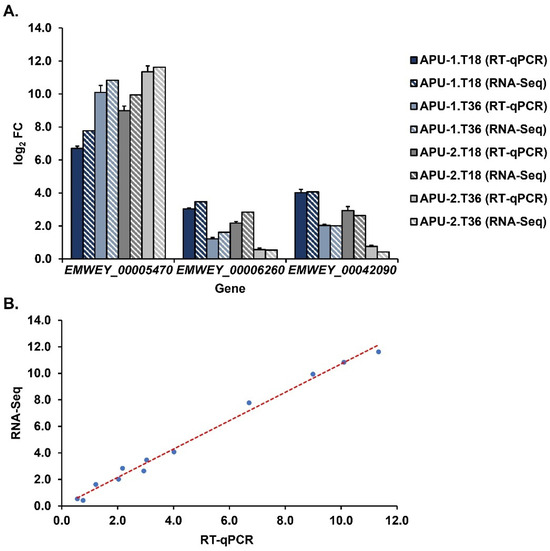
Figure 7.
Relative expression of selected genes correlates highly between RNA-Seq and RT-qPCR assays. (A). Temporal changes in expression of genes selected for validation using RT-qPCR at time points T18 and T36 during oocyst sporulation. The log2 FC using RT-qPCR and RNA-Seq (differential expression by DESeq2) are compared. Gene expression at each time point is depicted relative to initial transcription level (T0). Bars with solid fill represent RT-qPCR and bars with stripe fill represent RNA-Seq. Error bars depict variance among RT-qPCR estimates from three replicate experiments that each employed three replicates per time point. (B). Correlation plot of RT-qPCR vs. RNA-Seq log2 FC data shown in (A). This incorporates data from all three genes and time points T18, T36 (both strains). Red dashes indicate regression line.
As another measure to show qPCR-validated RNA-Seq as a method to investigate dynamic gene expression, data for the two methods (all three genes and time points, both strains) were correlated. These data correlated at a very high level (r = 0.996, Figure 7B) and the results are in line with our previous work studying expression during E. acervulina sporulation [37]. RT-qPCR accurately validates RNA-Seq expression according to various metrics.
4. Discussion
Coccidian infections cause enteric disease in wildlife, livestock, and people. Vaccines that incorporate multiple Eimeria species, and sometimes multiple strains of a single species, remain important to effective coccidiosis control programs, but success varies in part owing to the nuances of immunogenicity, strain variation, and fecundity, which impact treatment specificity and dosing [48,49]. Eimeria maxima can severely disrupt gut nutrient absorption, predisposing birds to microbial colonization and leading to serious complications (such as NE derived from superinfections with Clostridium perfringens) [7]. Diversity among strains of E. maxima complicates vaccination efforts because infection by one strain may provide little or no cross-protection against other strains [9,13,14,16,18,21,24,50].
Data from Eimeria provide important value for understanding concomitant processes in related parasites, such as Cyclospora, which compromises produce safety and causes human enteric disease. Unlike Eimeria, it is challenging to obtain large numbers of Cyclospora oocysts and difficult to achieve, much less study, their sporulation. We are unaware of studies characterizing transcriptomic changes in Cyclospora during sporulation (as we have undertaken here for E. maxima) or senescence, despite the value such studies might provide in risk assessment or risk reduction. Although we are beginning to appreciate the existence of genetic distinctions among Cyclospora isolates infecting humans, no data yet exist concerning differences in their gene expression or progression to the fully sporulated state.
To understand variation in E. maxima, researchers have characterized phenotypically different strains in terms of expressed antigens, omics, sporulation dynamics, pathogenesis/development in vivo, and fecundity [18,21,22,24,25,26,28,51,52]. Our previous work with two strains of E. maxima ([18,20]) showed that the APU-1 strain is more pathogenic than APU-2, exhibiting greater fecundity and host cell invasion. Here, we questioned whether differences in oocyst development might contribute to these differences. To this end, we built upon our previous work [37], which identified highly expressed genes in E. acervulina expressed throughout sporulation or most especially in mature or immature oocysts.
In this study, we found that E. maxima strains are similar in many respects, but some differences may underlie virulence phenotypes. We identified highly expressed genes throughout sporulation shared by both strains that have similarity to E. acervulina and other coccidia. Differential expression analysis between strains throughout sporulation identified potential markers of dissimilarity. Strains correlated highly at hour 36 but diverged at hour 48, and putative genes important to each time point were identified. In addition, we examined genes that may be specific to immature and mature oocysts of each strain, as well as genes that are shared by immature and mature oocysts in strains.
E. maxima oocysts highly express many genes throughout sporulation that are also expressed throughout the sporulation of E. acervulina. These include genes such as ATPases (cation-transporting), a zinc finger DHHC-containing protein, an oocyst wall protein, certain genes annotated to encode hypothetical proteins, and many modestly expressed genes that encode housekeeping functions (e.g., aquaporin, actin). The maximum mean expression of the constitutively expressed E. maxima genes occurred during hours 12 and 18 of sporulation, but their homologs in E. acervulina experienced peak expression at 4 h during sporulation. It is interesting that the latter species may have earlier expression during development, or perhaps sporulation is equivalent as E. maxima has a longer sporulation period. Genes important to sporulation in E. tenella were also reported to be expressed early during oocyst development (0–8 h) [36]. Therefore, critical processes to sporogony are activated early in multiple species of Eimeria. Further studies may be required to dissect what processes regulate the rate of development in each species. Some genes strongly expressed in E. maxima were not strongly expressed in E. acervulina, providing a basis to interrogate the elaboration of species-specific developmental determinants. One such gene (EMWEY_00024920) has GO terms pertaining to RNA and myosin dephosphorylation, metal ion binding, nucleus, and is associated with Programmed Death Ligand (PD-L1) expression and the PD-1 checkpoint pathway in cancer. Interestingly, its homolog in E. acervulina (EAH_00006770) was one we did not find to be constitutively expressed in that species; it was instead highly differentially expressed in immature vs. mature oocysts [37]. Three genes constitutively expressed in E. maxima have no homologs identified in E. acervulina, and the strongest expressed (EMWEY_00057080) encodes a hypothetical protein related to histone methylation and metal ion binding. This could be interesting to follow up further as an E. maxima viability gene.
We identified biomarkers capable of differentiating immature from mature E. maxima, among them many constitutively expressed genes. Relatively few of these demarcated strain APU-1 (and even fewer demarcated APU-2). Genes in immature APU-1 oocysts were largely downregulated, but several cell cycle kinase-encoding genes were upregulated. One upregulated gene (EMWEY_00053520) was homologous to an E. acervulina immature oocyst biomarker we previously identified. Another, EMWEY_00052020 (encodes X-Pro-dipeptidyl-peptidase-domain containing protein), had the highest differential expression vs. APU-2 and may be a marker of APU-1 immature oocysts. Genes unique to mature APU-1 oocysts mostly comprised the constitutively expressed genes discussed above. However, EMWEY_00006520 (encoding a protein similar to DNA-damage-inducible protein P from E. coli) was remarkable as the highest DEG compared to immature oocysts, yet it was not significantly differentially expressed in E. acervulina mature oocysts. EMWEY_00036760 (encodes calmodulin) had a homolog in E. acervulina (EAH_00022470) that was highly differentially expressed in mature vs. immature oocysts of that species, however. For APU-2, the upregulated genes in immature oocysts included a group (ubiquitin, 40S ribosomal protein, ATP synthase beta chain) that may be important for oocyst developmental processes (respiration, protein synthesis). Genes important to mature APU-2 oocysts consisted of EMWEY_00026670 and EMWEY_00034320, which encode an acid phosphatase and profilin protein, respectively. EMWEY_00034320, while also constitutively expressed in each strain, had a homolog in E. acervulina that was significantly differentially expressed in mature vs. immature oocysts. Therefore, it may represent a marker of APU-2 oocysts, but it can be used as a potential viability gene marker as well. Profilins bind actin, along with myosins, formins, and adhesins; they are part of the cellular apicomplexan glideosome essential for host cell invasion [53,54,55]. We previously identified types of glideosomal proteins as important in E. acervulina mature oocysts [37], and they likely serve similar functions in E. maxima.
Additionally, we examined the DEGs that demarcated immature and mature oocysts of both strains. Immature oocysts were associated with some constitutively expressed genes (EMWEY_00025290 and EMWEY_00057080 appeared especially high at time 0) and other enzymes such as phosphoserine aminotransfersase and subtilase. Certain highly expressed subtilases may demarcate immature oocysts, as the one identified in E. maxima (EMWEY_00056350) is homologous to a highly expressed subtilase in E. acervulina (EAH_00048170) that was significantly differentially expressed vs. mature oocysts. In general, GO terms and KEGG pathways identified may define functions particularly important at the inception of sporulation, such as GPI-anchor biosynthesis, histone methylation, and mRNA processing and proteolysis. A larger group of genes was identified in mature E. maxima oocysts. Several of these genes had exceptional fold changes compared to immature oocysts. While some of these genes were constitutively expressed throughout sporulation, we identified groups of genes that previously appeared to be gene markers of maturity in E. acervulina [37]. These included genes encoding SAGs, transmembrane proteins, microneme proteins, and myosin. In addition to our previous work, the work of others has shown the importance of these types of encoding genes to different stages of Eimeria spp. [26,28,35,51,56,57], including characteristic expression in sporulating oocysts or sporozoites.
We also identified genes that may characterize either strain, throughout sporulation and also at specific intervals. We found that the DEGs identified in our overall analysis were also differentially expressed at particular time points, such as hour 36 (when the transcription between two strains correlated highly). Throughout sporulation, a relatively small number of DEGs (~20 of over 6000 annotated genes) distinguished the strains according to our selection criteria. Genes upregulated in APU-1 mostly encoded hypothetical proteins, but one (EMWEY_00023530) encodes the 18kDa cyclophilin A. Cyclophilins catalyze protein isomerization and are involved in proper protein folding; they are critical for pathogen infection [58]. There are multiple cyclophilin families in apicomplexans and these may have roles in RNA processing and act as chaperones [59,60]. Cyclophilin A is a receptor for the immunosuppressive drug cyclosporin A, which inhibits infection or replication of many apicomplexan parasites, including P. falciparum, T. gondii, and Eimeria spp. [60]. The increased differential expression of cyclosporin A in APU-1 vs. APU-2 indicates this critical protein is especially important in the development of the virulent strain, yet we cannot exactly attribute its function for virulence.
Some additional APU-1 DEGs were identified at hour 36 that differed from our overall analysis and may also be important for separating strains. EMWEY_00006520 (aforementioned), EMWEY_00017660 (splicing factor 3B subunit), and EMWEY_00052370 (uroporphyrinogen decarboxylase) were on the borderline of differential expression but notable for their potential roles relating to development and DNA binding/damage repair, spliceosome assembly, and heme biosynthetic process, respectively. Additionally, genes annotated as encoding hypothetical proteins (EMWEY_00002130, EMWEY_00005570, and EMWEY_00056530) were upregulated >2-fold (log2) in APU-1 and associated with GO terms pertaining to DNA-binding/transcription and protein binding.
Genes significantly upregulated in APU-2 in our overall analysis had more functional annotations (although we could not glean much information for the most upregulated transcript, EMWEY_0008090). They were mostly associated with the GO term membrane, but genes EMWEY_00036080 (thioredoxin), EMWEY_00039050 (OTU-like cysteine protease domain-containing protein), and EMWEY_00058460 each bear multiple terms pertaining to protein processes (e.g., -folding, deubiquination, export, binding, assembly). Thioredoxins (with roles in oxidative stress response) and OTU-like cysteine proteases (deubiquinating family enzymes) regulate cellular processes in apicomplexans and have key roles in cellular proliferation and apicoplast import [61,62,63,64]. EMWEY_00058460 (encodes EF-1α) appeared especially interesting since it had >6 log2 FC, encompassed many of the GO terms, and had multiple linked KEGG pathways. EF-1α is a GTPase that transfers aminoacylated tRNAs to ribosomes during protein synthesis. In Apicomplexa, it is a reactive antigen expressed on the apical region of sporozoites, and it is important for invasion. It is currently being studied as a vaccine candidate in multiple Apicomplexan species, associated with robust anti-EF-1α responses [65,66,67,68]. In addition, multiple SAG genes were upregulated in APU-2, and these were different from those we found in common to mature E. maxima oocysts.
As with the APU-1 strain, some additional upregulated DEGs were identified at hour 36 in APU-2. Genes EMWEY_00000860 (20 kDa cyclophilin), EMWEY_00011930 (heat shock protein), EMWEY_00052300 (NAC domain-containing protein), EMWEY_00054680 (aspartate aminotransferase), and EMWEY_00059760 (asparaginase) were notable for their higher differential expression and/or GO term annotations. These terms included protein isomerization/folding, response to misfolded proteins, translation, aspartate amino acid biosynthesis and pyridoxal phosphate binding, and asparaginase activity.
Taken together, two cyclophilin-encoding genes appear to be important during the development of APU-2 (upregulated and downregulated) and a heat shock protein was also upregulated in APU-2. This may reinforce the theme of proper protein folding and chaperone activity as especially important to the less virulent strain, perhaps temporally dependent. It appeared that amino acid metabolism was upregulated in APU-2 as well (more so at 36 h). Hypothetical proteins with expression on the borderline but with GO terms included EMWEY_00017480 and EMWEY_00056980, whose GO terms pertained to regulation of transcription, nucleus, and membrane. These genes therefore appeared to have similar functionality important to multiple forms of transcriptional processes. Genes in both E. maxima strains at T36 generally had higher TPM at this time in E. maxima than their homologs in mature E. acervulina oocysts [37]. However, homologs of the hypothetical protein-encoding genes EMWEY_00031340 and EMWEY_00056980 (upregulated in APU-2) were expressed to a much greater extent in E. acervulina. In fact, the homologs of these two genes in E. acervulina, as well as EMWEY_00011930, were significantly differentially expressed in mature vs. immature oocysts [37], perhaps indicating important similarities in mature oocysts between species (we did not perform a cross-species differential expression analysis).
Based on transcription, the two strains agreed highly at hour 36 and then diverged considerably at 48 h. We therefore examined whether DEGs at the different time points may vary, accounting for some of the transcriptional divergence. We found ~65% DEGs between strains at hour 36 were also differentially expressed at hour 48. Most of these genes were expressed with <100 TPM in each strain. The higher expressed genes in APU-1 were those we identified above as differentially expressed. For example, EMWEY_00006520 was upregulated in APU-1 when comparing strains at hour 36, and it was uniquely differentially expressed compared to immature oocysts. Therefore, it may be a promising marker of mature APU-1 oocysts. Interestingly, its lack of differential expression between strains at hour 48 may indicate it is less important after oocysts have sporulated. A greater number of DEGs at hour 48 were not identified at hour 36. These genes also experienced higher transcription and a greater range in differential expression. Strain APU-2 upregulated several genes highly at T48 compared to APU-1, such as hypothetical proteins with homology to membrane and serine-rich proteins in other species. In the genes particular to hours 36 and 48, some commonalities emerged. We found that at both time points, genes were annotated that encode DNA repair, stress response, helicases, subtilases, translation initiation factors, and ATPase subunits. Therefore, it appeared that common suites of certain proteins are important for mature oocysts in general. At hour 48, oocysts appear to differentially express unique genes such as those encoding adaptin, chromosome segregation proteins, DNA polymerases, microneme proteins, and SAGs, among others.
Notwithstanding their notable virulence differences, we found that the two strains of E. maxima nonetheless undergo decidedly similar transcriptional changes as they sporulate. During the first 12 h, contemporaneous measurements affirm strongly correlated transcriptomes. Then, the less virulent strain (APU-2) transiently outpaces the more virulent strain. During hours 18–24, microscopy indicated more sporulated APU-2 oocysts. These data affirmed that each strain reaches maximal sporulation by about 30 h, at which time their transcriptional profiles match especially closely. This echoes prior reports, from microscopy, tracking the timing of sporulation in E. maxima (Edgar, 1955; Norton and Chard, 1983). Interestingly, the transcriptional profiles thereafter begin to diverge, characterized by weaker correlation at 48 h, and more differentially expressed genes. Such divergence may prefigure or even contribute to what distinguishes each strain once it infects the next host. Thus, the genes identified as diverging in their expression by hour 48 deserve future examination for any functional role they may play in virulence differences among the strains.
Selection for early oocyst maturation can be accomplished via experimental passage through chickens, producing attenuated (less pathogenic) strains of Eimeria that are also faster to develop (precocious). In that light, it is interesting that the less pathogenic, naturally occurring strain studied here (APU-2) progressed though sporulation somewhat faster. Precocious Eimeria strains are less pathogenic and exhibit reduced fecundity but have high immunogenicity [12,69,70,71,72]. They exhibit a different life cycle (often with faster sporozoite invasion) compared to the parent or virulent wild-type strain, which likely accounts for their lower reproductive potential. Our findings indicate that APU-2, although naturally occurring, exhibits life history characteristics akin to those produced via artificial selection during experimental passage. Broader sampling would be needed to discern whether virulence differences broadly entail trade-offs with the pace of sporulation.
It is tempting to speculate on the involvement of the DEGs we have identified in relation to the virulence phenotypes of the E. maxima strains. Unfortunately, some of the more interesting genes often escaped functional characterization efforts, limiting our conclusions, and necessitating further work. Groups of genes in APU-2 may indicate the less virulent strain upregulates more developmental and sporozoite or invasion genes but some genes with similar functions (e.g., SAGs, micronemes, myosin, membrane proteins) were also found to be in common to strains at hour 36 or 48. SAG genes were differentially expressed in APU-2 oocysts with elevated expression at 36 h and different upregulated SAGs were shared by both strains. The relevance of higher expressed SAGs in one strain vs. another is unclear. Whether these contribute to differences in the rate of sporulation, or the degree of virulence expressed in the host, remains unclear. SAGs are principal surface antigens of invasive Apicomplexan stages, involved in pathogenicity, maturation, and other processes [38,73,74]. We found previously, using RNA-Seq, that SAGs were differentially expressed in mature vs. immature oocysts in E. acervulina [37]. Hu et al. (2018) reported that precocious, sporulated E. maxima oocysts upregulate translation initiation factors, transcription initiation factors, and organelle invasion proteins (SAGs, micronemes, calcium-dependent protein kinases, myosins) that could be used in invasion, proliferation, and division processes [28]. It appeared that sporulated oocysts of both the virulent and precocious strains exhibited highly transcribed organelle genes, however, which is consistent with oocyst sporulation (sporozoite differentiation, organelle emergence). Two gene expression studies in E. tenella by Matsubayashi et al. [56,57] found genes relating to glycolysis, TCA, and the pentose phosphate pathway were upregulated in sporulating oocysts of a virulent strain, whereas virulent sporozoites had upregulated carbohydrate metabolism and attachment genes. Also, secreted apical complex proteins, proteases, mitochondrial proteins, and transporters were strongly upregulated in virulent sporozoites, whereas the precocious strain has upregulated genes associated with cell survival, development, and proliferation. The authors theorized that perhaps the parent strains survive long before the invasion and invade actively/successfully into host cells, whereas proliferative processes influence precocity. Our work contrasts with this study in that virulent APU-1 did not exclusively express these types of molecules.
Considering prior studies, it is more difficult to ascribe other genes to certain other phenotypes. Dong et al. [25] reported that a precocious E. maxima strain (sporulated oocysts) upregulates (vs. a parental, virulent strain) a rhomboid family domain-containing protein (possibly for invasion, faster schizogonic development) and downregulates a serpin (serine protease inhibitor), a cation-transporting ATPase, heat-shock protein 70, and a transhydrogenase. In our studies, we found both E. maxima strains expressed a rhomboid family domain-containing protein, two cation-transporting ATPases, and a transhydrogenase consistently throughout sporulation (the E. acervulina homologs were also constitutively expressed in our previous RNA-Seq). While we noted a higher expression in mature vs. immature oocysts for these genes, our differential expression analysis found that one of the cation-transporting ATPases (EMWEY_00006260) and the transhydrogenase (EMWEY_00011310) were only upregulated in mature APU-1 oocysts. The downregulation of other genes may correspond to adaptive changes during acquisition of the precocious phenotype. The upregulation of the cation-transporting ATPase and a calmodulin in mature APU-1 oocysts may indicate the increased importance of calcium regulation in virulent strains. Apicomplexans employ a variety of calcium-modulating proteins for various roles such as motility and differentiation [75].
Hu et al. [28] also reported that some genes we described above (as constitutively expressed and more expressed in APU-1 mature oocysts) were upregulated in precocious vs. parental unsporulated oocysts. These included genes such as aspartyl protease, insulysin, a rhomboid family domain-containing protein, cation-transporting ATPase, a zinc finger DHHC domain-containing proteins, among others. In addition to that described above, we also found a zinc finger DHHC domain-containing protein (EMWEY_00000500), an insulysin (EMWEY_00013380), and aspartyl protease (EMWEY_00013390) were constitutively expressed in E. maxima strains. Again, these genes (except for EMWEY_00013390) were significantly upregulated in mature APU-1 oocysts. Interestingly, the constitutively expressed genes discussed here were not found to be differentially expressed in E. acervulina oocysts in our earlier data.
Addressing the animal health and food safety challenges posed by coccidian oocysts requires a global understanding of how oocysts mature. Despite their phenotypic differences, we found highly parallel development in two strains of E. maxima and that genes expressed through their sporulation largely parallel those expressed throughout sporulation in another species, E. acervulina. Constitutively expressed genes during sporulation have homologs in other types of coccidia, including Cyclospora. These data therefore contribute to broader inter-specific (and inter-generic) comparisons, bringing into focus what uniquely characterizes each species’ development and what processes generally mediate coccidian oocyst development. Thus, such data build a foundation to understand coccidian development writ large, which may find broad application in animal health and food safety. For example, transcripts enabling better assessment of Eimeria oocyst viability may help the produce industry verify that a given vaccine dose remains potent. Likewise, food safety professionals could better assess and manage risks if they could determine, in vitro, the viability of Cyclospora contaminating water or produce. To these ends, our work provides the first cross-species analysis of the degree of conservation among constitutively expressed genes throughout sporulation in any two species of coccidia.
By identifying genes important throughout sporulation of E. maxima and E. acervulina, or important at stages in their maturation, comparative transcriptomics now establishes testable hypotheses in other species, such as Eimeria tenella and Cyclospora cayetanensis. Genes elaborated to an especially great extent in mature oocysts also form a group that may prove important during subsequent developmental stages, particularly in sporozoites as they invade host cells and trophozoites replicating in the host. Such studies would need to discern, for such intracellular parasitic stages, transcriptional processes derived from both the parasite and the host cell. Furthermore, characterizing gene expression in maturing and senescing oocysts holds the promise of further improving the in vitro assessment of oocyst viability.
These data helpfully constrain targets for characterizing Cyclospora maturation. Precisely replicating this study might demand unachievably numerous and synchronized cohorts of Cyclospora (derived, as they are, not from experimental animals but rather from clinical patients). Nonetheless, advances in single-cell transcriptomics might enable the evaluation of sparser RNA templates, enabling empirical evaluation of the predictive value of surrogate data in understanding, and better managing, the risks such organisms pose to human health.
Supplementary Materials
The following supporting information can be downloaded at: https://www.mdpi.com/article/10.3390/pathogens13010002/s1, Table S1. Oligonucleotides used for RT-qPCR in this study. Gene names and annotated protein descriptions (columns A, B), oligonucleotide sequence (column C), and suggested final concentration (nM, nanomolar) for use (column D) are included. All sequences are novel to this work. Table S2. Summary and descriptive statistics of RNA-Seq data in E. maxima strains APU-1 and APU-2. Column A has the time point of collection (hours). RNA-Seq was performed on three replicates (designated A, B, C in column B) initially (T0) and every 6–12 h thereafter (T6–T48). The number of total reads for each strain is in columns C (APU-1) and E (APU-2). The number of mapped reads for each strain is in columns D (APU-1) and F (APU-2). Table S3. Mapped log2 reads and correlations for E. maxima strains APU-1 and APU-2. Table S3. (A). Log2 mapped reads during for replicate samples during sporulation for strains APU-1 and APU-2. Included are the gene name (column A), annotated protein description (column B), nucleotide sequence (column C), amino acid sequence (column D), log2 of mapped raw reads per replicate in the 48 h time course (columns E–Y for APU-1; columns Z-AT for APU-2). (B). Pearson’s correlation of log2 mapped reads for replicates of each strain during the time course. Table S4. Mean log2 mapped reads during sporulation for E. maxima strains APU-1 and APU-2. Included are the E. maxima gene name (column A), and mean log2-tranformed reads per time point (from three replicates per time point) (columns B–H for APU-1; columns I–O for APU-2). Table S5. Mean and standard deviation (SD) for Transcripts Per Million (TPM) during sporulation for E. maxima APU-1 and APU-2 strains. Included are the gene name (column A), annotated protein description (column B), nucleotide sequence (column C), amino acid sequence (column D), mean TPM per time point (from three replicates) for each strain in the 48 h time course (columns E–K for APU-1; columns S-Y for APU-2), and corresponding standard deviation (SD) per sample (columns L–R for APU-1; columns Z-AF for APU-2). Table S6. Shared constitutively expressed genes identified during sporulation for E. maxima strains APU-1 and APU-2. Included are the gene name (column A), annotated protein description (column B), mean Transcripts Per Million (TPM) per time point for each gene in the 48 h time course (columns C–I for APU-1; columns L–R for APU-2), overall mean TPM for each gene (column J for APU-1; column S for APU-2) and corresponding standard deviation (SD) during the time course for each gene per sample (column K for APU-1; column T for APU-2). Bolded genes (n = 3) did not have matching homologs in E. acervulina after BLASTP searching. Italicized genes (n = 8) had overall mean TPM > 20,000 in each strain. Table S7. Highly constitutively expressed genes shared by both E. maxima strains with associated KEGG pathways and E. acervulina homologs. Included are the E. maxima gene name (column A), E. maxima annotated protein description (column B), overall mean Transcripts Per Million (TPM) for each gene per strain (column C for APU-1; column D for APU-2), associated E. maxima KEGG pathways per gene (column E), E. acervulina homolog gene name (column F), E. acervulina annotated protein description (column G), E. acervulina overall mean TPM per gene (column H), and associated E. acervulina KEGG pathways (column I). Bolded genes (n = 14) are those whose homologs in E. acervulina were not expressed >1000 TPM throughout sporulation in prior E. acervulina RNA-Seq [37]. Genes in red (n = 3) did not have an identified BLASTP hit in E. acervulina. Table S8. Blast2GO results for the 58 highly constitutively expressed genes shared by both E. maxima strains. E. maxima gene names and original gene annotations are included in columns A and B, respectively. The overall mean Transcripts Per Million (TPM) for each gene throughout the 48 h time course is included (column C, APU-1; column D, APU-2). BLASTP data include the length of the protein (column E), overall number of BLASTP hits found (column F), hit e-value (column G), the mean percent similarity for hits (column H), BLAST hit description (column I), and best other BLASP hit (column J; not applicable [N/A] if sufficient annotation already existed). Gene Ontology (GO) data include number of GO terms (column K), GO ID numbers (column L; C = Cellular Component, F = Molecular Function, P = Biological Process), and GO term names (column M), Enzyme Commission (EC) number(s) linked to the GO terms of a given sequence (column N), EC enzyme names (column O). InterPro data include ID names (column P), GO ID numbers (column Q), and GO names (column R). Bolded genes (n = 10) are those encoding hypothetical proteins for which Blast2GO identified more informative hits in other Apicomplexa species. Italicized genes (n = 3) had overall mean TPM > 20,000 in each strain and had more informative hits after Blast2GO analysis. Table S9. List of 372 total annotated GO terms for the highly constitutively expressed genes shared by both E. maxima strains. GO terms (column A) are stratified by GO subontologies Biological Process (BP, column B), Molecular Function (MF, column C), and Cellular Component (CC, column D). The total number of GO terms for each subontology is also provided at the bottom of columns B-D. Table S10. Blast2GO results for overall significantly differentially expressed genes between E. maxima strains with associated KEGG pathways and E. acervulina homologs. E. maxima gene names and original gene annotations are included in columns A and B, respectively. The overall mean Transcripts Per Million (TPM) for each gene throughout the 48 h time course is included (column C, APU-1; column D, APU-2). Differential expression data between strains APU-1 vs. APU-2 are given in columns E (log2 fold change) and F (Adjusted p-value). BLASTP data include the length of the protein (column G), overall number of BLASTP hits found (column H), hit e-value (column I), the mean percent similarity for hits (column J), BLAST hit description (column K), and best other BLASP hit (column L; not applicable [N/A] if sufficient annotation already existed). Gene Ontology (GO) data include number of GO terms (column M), GO ID numbers (column N; C = Cellular Component, F = Molecular Function, P = Biological Process), and GO term names (column O), Enzyme Commission (EC) number(s) linked to the GO terms of a given sequence (column P), EC enzyme names (column Q). InterPro data include ID names (column R), GO ID numbers (column S), and GO names (column T). Included also are associated E. maxima KEGG pathways per gene (column U), E. acervulina homolog gene name (column V), E. acervulina annotated protein description (column W), E. acervulina overall mean TPM per gene (column X), and associated E. acervulina KEGG pathways (column Y). Bolded genes (n = 1, APU-1) are those encoding hypothetical proteins for which Blast2GO identified more informative hits in other Apicomplexa species. Italicized genes (n = 2) are shared and significantly differentially expressed between strains with >100 overall mean TPM in each strain. Table S11. Blast2GO results for significantly differentially expressed genes between E. maxima strains at hour 36 during sporulation with associated KEGG pathways and E. acervulina homologs. E. maxima gene names and original gene annotations are included in columns A and B, respectively. The mean Transcripts Per Million TPM for each gene at T36 areincluded (column C, APU-1; column D, APU-2). Differential expression data between APU-1 vs. APU-2 at T36 are given in columns E (log2 fold change) and F (Adjusted p-value). BLASTP data include the length of the protein (column G), overall number of BLASTP hits found (column H), hit e-value (column I), the mean percent similarity for hits (column J), BLAST hit description (column K), and best other BLASP hit (column L; not applicable [N/A] if sufficient annotation already existed). Gene Ontology (GO) data include number of GO terms (column M), GO ID numbers (column N; C = Cellular Component, F = Molecular Function, P = Biological Process), and GO term names (column O), Enzyme Commission (EC) number(s) linked to the GO terms of a given sequence (column P), EC enzyme names (column Q). InterPro data include ID names (column R), GO ID numbers (column S), and GO names (column T). Also included are associated E. maxima KEGG pathways per gene (column U), E. acervulina homolog gene name (column V), E. acervulina annotated protein description (column W), E. acervulina mean overall TPM per gene at (T0, column X; T24, column Y), and associated E. acervulina KEGG pathways (column Z). Bolded genes (n = 1 per strain) are those encoding hypothetical proteins for which Blast2GO identified more informative hits in other Apicomplexa species. Italicized genes (n = 10) are shared and significantly differentially expressed between strains at hour 36 with mean TPM > 100 at hour 36 in each strain. Genes in red (n = 2, APU-1; n = 3, APU-2) are homologous to mature oocyst biomarkers identified in prior E. acervulina RNA-Seq [37]. Table S12. Differentially expressed genes (DEGs) identified between E. maxima strains for oocysts at 36 h and 48 h during sporulation. (A). Data for DEGs between strains at T36, but not at T48; (B). Data for DEGs between strains at T48, but not at T36. Included are the E. maxima gene name (column A), E. maxima annotated protein description (column B), mean Transcripts Per Million (TPM) for each gene at T36 (column C, APU-1, column D, APU-2), and T48 (column G, APU-1; column H, APU-2). Differential expression data between strains at T36 and T48 are given (APU-2 vs. APU-1 log2 fold change, columns E, I; adjusted p-value, columns F, J). BLASTP data include the length of the protein (column K), overall number of BLASTP hits found (column L), hit e-value (column M), the mean percent similarity for hits (column N), BLAST hit description (column O), best other BLASP hit (column P; not applicable [N/A] if sufficient annotation already existed). Gene Ontology (GO) data include number of GO terms (column Q), GO ID numbers (column R; C = Cellular Component, F = Molecular Function, P = Biological Process), and GO term names (column S), Enzyme Commission (EC) number(s) linked to the GO terms of a given sequence (column T), EC enzyme names (column U). InterPro data include ID names (column V), GO ID numbers (column W), and GO names (column X). Also included are associated E. maxima KEGG pathways per gene (column Y), E. acervulina homolog gene name (column Z), E. acervulina annotated protein description (column AA), E. acervulina mean TPM per gene at various time points from prior RNA-Seq [37] (T0–T24, columns AB-AH), and associated E. acervulina KEGG pathways (column AI). Bolded genes (n = 26, Table S12A; n = 166, Table S12B) are those encoding hypothetical proteins for which Blast2GO identified more informative hits in other Apicomplexa species. Table S13. Highly expressed and significantly differentially expressed genes (T0 vs. T36) not shared between E. maxima strains with E. acervulina homologs. E. maxima gene names and original gene annotations are included in columns A and B, respectively. The mean Transcripts Per Million (TPM) for each gene at T0 (column C, APU-1; column G, APU-2) and T36 (column D, APU-1; column H, APU-2) are included. Differential expression data for each strain between time points T0 and T36 are included (log2 FC, columns E and I; adjusted p-value, columns F and J). Columns K and L include E. acervulina homolog gene names and annotated protein descriptions, respectively. E. acervulina mean TPM per gene at T0 and T24 from prior RNA-Seq [37] is included in columns M and N, respectively. Differential expression data between T0 and T24 E. acervulina oocysts are provided in columns O (log2 FC) and P (adjusted p-value). Table S14. Highly expressed and significantly differentially expressed genes (T36 vs. T0) not shared between E. maxima strains with E. acervulina homologs. E. maxima gene names and original gene annotations are included in columns A and B, respectively. The mean Transcripts Per Million (TPM) for each gene at T0 (column C, APU-1; column G, APU-2) and T36 (column D, APU-1; column H, APU-2) included. Differential expression data for each strain between time points T36 and T0 are included (log2 FC, columns E and I; adjusted p-value, columns F and J). Columns K and L include E. acervulina homolog gene names and annotated protein descriptions, respectively. E. acervulina mean TPM per gene at T0 and T24 from prior RNA-Seq [37] is included in columns M and N, respectively. Differential expression data between T24 and T0 E. acervulina oocysts are provided in columns O (log2 FC) and P (Adjusted p-value). Table S15. Blast2GO results for highly expressed and significantly differentially expressed genes (T36 vs. T0) that are shared between E. maxima strains and associated KEGG pathways and E. acervulina homologs. E. maxima gene names and original gene annotations are included in columns A and B, respectively. Mean Transcripts Per Million (TPM) for each at T0 (column C, APU-1; column G, APU-2), and T36 (column D, APU-1; column H, APU-2) is included. Differential expression data for each strain between time points T36 and T0 are included (log2 fold change, columns E and I; Adjusted p-value, columns F and J). BLASTP data include the length of the protein (column K), overall number of BLASTP hits found (column L), hit e-value (column M), the mean percent similarity for hits (column N), blast hit description (column O), best other BLASP hit (column P; not applicable [N/A] if sufficient annotation already existed). Gene Ontology (GO) data include number of GO terms (column Q), GO ID numbers (column R; C = Cellular Component, F = Molecular Function, P = Biological Process), and GO term names (column S), Enzyme Commission (EC) number(s) linked to the GO terms of a given sequence (column T), EC enzyme names (column U). InterPro data include ID names (column V), GO ID numbers (column W), and GO names (column X). Also included are associated E. maxima KEGG pathways per gene (column Y), the E. acervulina homolog gene name (column Z), E. acervulina annotated protein description (column AA), and E. acervulina mean TPM per gene at various time points T0 and T24 from prior RNA-Seq [37] (columns AB, AC). Differential expression data between E. acervulina T0 and T24 oocysts are provided in columns AD (log2 FC) and AE (adjusted p-value). Associated E. acervulina KEGG pathways are in column AF. Bolded genes (n = 1, T0; n = 11, T36) are those (originally annotated as hypothetical protein) where Blast2GO identified more informative hits in other Apicomplexa species. Italicized genes (n = 4) are shared and significantly differentially expressed between strains with mean TPM > 1000 in a strain at T0 or T36. Genes in red (n = 11) are homologous to genes previously reported as differentially expressed biomarkers in mature vs. immature E. acervulina oocysts [37].
Author Contributions
Conceptualization, M.S.T., C.N.O., J.P.D., B.M.R. and M.C.J.; methodology, M.S.T., C.N.O. and M.C.J.; software, M.S.T.; validation, M.S.T., C.N.O., B.M.R. and M.C.J.; formal analysis, M.S.T.; investigation, M.S.T., A.N.J. and C.N.O.; resources, M.C.J. and B.M.R.; data curation, M.S.T.; writing—original draft preparation, M.S.T.; writing—review and editing, M.S.T., C.N.O., J.P.D., B.M.R. and M.C.J.; visualization, M.S.T. and B.M.R.; supervision, B.M.R.; project administration, M.S.T. and B.M.R.; funding acquisition, B.M.R. and M.C.J. All authors have read and agreed to the published version of the manuscript.
Funding
This work was supported by USDA-ARS projects “Foodborne Parasites and Their Impact on Food Safety” 8042–32000-113–000-D and “Developing Improved Control Strategies for Avian Coccidiosis” 8042–32000-114–000-D.
Institutional Review Board Statement
Animal experiments were performed following the protocol (22–06) approved on July 21, 2022 by the Beltsville Agricultural Research Center (BARC) Institutional Animal Use and Care Committee, United States Department of Agriculture (USDA).
Informed Consent Statement
Not applicable.
Data Availability Statement
The data discussed in this publication have been deposited into NCBI’s Gene Expression Omnibus (GEO) [76] and are accessible through GEO Series accession number GSE247034 (https://www.ncbi.nlm.nih.gov/geo/query/acc.cgi?acc=GSE247034 (accessed on 10 November 2023)).
Acknowledgments
We would like to thank Peter Thompson for sequencing assistance.
Conflicts of Interest
The authors declare no conflict of interest.
References
- Stelzer, S.; Basso, W.; Benavides Silvan, J.; Ortega-Mora, L.M.; Maksimov, P.; Gethmann, J.; Conraths, F.J.; Schares, G. Toxoplasma gondii infection and toxoplasmosis in farm animals: Risk factors and economic impact. Food Waterborne Parasitol. 2019, 15, e00037. [Google Scholar] [CrossRef]
- Dubey, J.P.; Khan, A.; Rosenthal, B.M. Life Cycle and Transmission of Cyclospora cayetanensis: Knowns and Unknowns. Microorganisms 2022, 10, 118. [Google Scholar] [CrossRef] [PubMed]
- Blake, D.P.; Knox, J.; Dehaeck, B.; Huntington, B.; Rathinam, T.; Ravipati, V.; Ayoade, S.; Gilbert, W.; Adebambo, A.O.; Jatau, I.D.; et al. Re-calculating the cost of coccidiosis in chickens. Vet. Res. 2020, 51, 115. [Google Scholar] [CrossRef] [PubMed]
- Liu, Q.; Liu, X.; Zhao, X.; Zhu, X.Q.; Suo, X. Live attenuated anticoccidial vaccines for chickens. Trends Parasitol. 2023, 39, 1087–1099. [Google Scholar] [CrossRef]
- Shivaramaiah, C.; Barta, J.R.; Hernandez-Velasco, X.; Tellez, G.; Hargis, B.M. Coccidiosis: Recent advancements in the immunobiology of Eimeria species, preventive measures, and the importance of vaccination as a control tool against these Apicomplexan parasites. Vet. Med. 2014, 5, 23–34. [Google Scholar] [CrossRef]
- Jordan, B.; Albanese, G.; Tensa, L. Coccidiosis in Chickens (Gallus gallus). In Coccidiosis in Livestock, Poultry, Companion Animals, and Humans, 1st ed.; Dubey, J.P., Ed.; CRC Press: Boca Raton, FL, USA, 2019; pp. 169–174. [Google Scholar]
- Dubey, J.P.; Jenkins, M.C. Re-evaluation of the life cycle of Eimeria maxima Tyzzer, 1929 in chickens (Gallus domesticus). Parasitology 2018, 145, 1051–1058. [Google Scholar] [CrossRef] [PubMed]
- Prescott, J.F.; Smyth, J.A.; Shojadoost, B.; Vince, A. Experimental reproduction of necrotic enteritis in chickens: A review. Avian Pathol. 2016, 45, 317–322. [Google Scholar] [CrossRef] [PubMed]
- Smith, A.L.; Hesketh, P.; Archer, A.; Shirley, M.W. Antigenic diversity in Eimeria maxima and the influence of host genetics and immunization schedule on cross-protective immunity. Infect. Immun. 2002, 70, 2472–2479. [Google Scholar] [CrossRef]
- Norton, C.C.; Hein, H.E. Eimeria maxima: A comparison of two laboratory strains with a fresh isolate. Parasitology 1976, 72, 345–354. [Google Scholar] [CrossRef]
- Long, P.L.; Millard, B.J. Immunological differences in Eimeria maxima: Effect of a mixed immunizing inoculum on heterologous challenge. Parasitology 1979, 79, 451–457. [Google Scholar] [CrossRef]
- Shirley, M.W.; Bellatti, M.A. Live attenuated coccidiosis vaccine: Selection of a second precocious line of Eimeria maxima. Res. Vet. Sci. 1988, 44, 25–28. [Google Scholar] [CrossRef] [PubMed]
- Fitz-Coy, S.H. Antigenic variation among strains of Eimeria maxima and E. tenella of the chicken. Avian Dis. 1992, 36, 40–43. [Google Scholar] [CrossRef] [PubMed]
- Martin, A.G.; Danforth, H.D.; Barta, J.R.; Fernando, M.A. Analysis of immunological cross-protection and sensitivities to anticoccidial drugs among five geographical and temporal strains of Eimeria maxima. Int. J. Parasitol. 1997, 27, 527–533. [Google Scholar] [CrossRef] [PubMed]
- Barta, J.R.; Coles, B.A.; Schito, M.L.; Fernando, M.A.; Martin, A.; Danforth, H.D. Analysis of infraspecific variation among five strains of Eimeria maxima from North America. Int. J. Parasitol. 1998, 28, 485–492. [Google Scholar] [CrossRef]
- Blake, D.P.; Hesketh, P.; Archer, A.; Carroll, F.; Shirley, M.W.; Smith, A.L. The influence of immunizing dose size and schedule on immunity to subsequent challenge with antigenically distinct strains of Eimeria maxima. Avian Pathol. 2005, 34, 489–494. [Google Scholar] [CrossRef] [PubMed][Green Version]
- Schwarz, R.S.; Jenkins, M.C.; Klopp, S.; Miska, K.B. Genomic analysis of Eimeria spp. populations in relation to performance levels of broiler chicken farms in Arkansas and North Carolina. J. Parasitol. 2009, 95, 871–880. [Google Scholar] [CrossRef]
- Jenkins, M.C.; Dubey, J.P.; Miska, K.; Fetterer, R. Differences in fecundity of Eimeria maxima strains exhibiting different levels of pathogenicity in its avian host. Vet. Parasitol. 2017, 236, 1–6. [Google Scholar] [CrossRef]
- Zaheer, T.; Abbas, R.Z.; Imran, M.; Abbas, A.; Butt, A.; Aslam, S.; Ahmad, J. Vaccines against chicken coccidiosis with particular reference to previous decade: Progress, challenges, and opportunities. Parasitol. Res. 2022, 121, 2749–2763. [Google Scholar] [CrossRef]
- Jenkins, M.C.; Dubey, J.P. Unpublished Data. 2023. [Google Scholar]
- Blake, D.P.; Hesketh, P.; Archer, A.; Carroll, F.; Smith, A.L.; Shirley, M.W. Parasite genetics and the immune host: Recombination between antigenic types of Eimeria maxima as an entree to the identification of protective antigens. Mol. Biochem. Parasitol. 2004, 138, 143–152. [Google Scholar] [CrossRef]
- Basak, S.C.; Lee, S.; Barta, J.R.; Fernando, M.A. Differential display analysis of gene expression in two immunologically distinct strains of Eimeria maxima. Parasitol. Res. 2006, 99, 28–36. [Google Scholar] [CrossRef]
- Blake, D.P.; Shirley, M.W.; Smith, A.L. Genetic identification of antigens protective against coccidia. Parasite Immunol. 2006, 28, 305–314. [Google Scholar] [CrossRef]
- Blake, D.P.; Billington, K.J.; Copestake, S.L.; Oakes, R.D.; Quail, M.A.; Wan, K.L.; Shirley, M.W.; Smith, A.L. Genetic mapping identifies novel highly protective antigens for an apicomplexan parasite. PLoS Pathog. 2011, 7, e1001279. [Google Scholar] [CrossRef]
- Dong, H.; Lin, J.; Han, H.; Jiang, L.; Zhao, Q.; Zhu, S.; Huang, B. Analysis of differentially expressed genes in the precocious line of Eimeria maxima and its parent strain using suppression subtractive hybridization and cDNA microarrays. Parasitol. Res. 2011, 108, 1033–1040. [Google Scholar] [CrossRef]
- Liu, D.; Li, J.; Cao, L.; Wang, S.; Han, H.; Wu, Y.; Tao, J. Analysis of differentially expressed genes in two immunologically distinct strains of Eimeria maxima using suppression subtractive hybridization and dot-blot hybridization. Parasit. Vectors 2014, 7, 259. [Google Scholar] [CrossRef]
- El-Ashram, S.; Yin, Q.; Liu, H.; Al Nasr, I.; Liu, X.; Suo, X.; Barta, J. From the Macro to the Micro: Gel Mapping to Differentiate between Sporozoites of Two Immunologically Distinct Strains of Eimeria maxima (Strains M6 and Guelph). PLoS ONE 2015, 10, e0143232. [Google Scholar] [CrossRef] [PubMed][Green Version]
- Hu, D.; Wang, C.; Wang, S.; Tang, X.; Duan, C.; Zhang, S.; Suo, J.; Deng, M.; Lv, Y.; Suo, X.; et al. Comparative transcriptome analysis of Eimeria maxima (Apicomplexa: Eimeriidae) suggests DNA replication activities correlating with its fecundity. BMC Genom. 2018, 19, 699. [Google Scholar] [CrossRef] [PubMed]
- Novaes, J.; Rangel, L.T.L.D.; Ferro, M.; Abe, R.Y.; Manha, A.P.S.; de Mello, J.C.M.; Varuzza, L.; Durham, A.M.; Madeira, A.M.B.N.; Gruber, A. A comparative transcriptome analysis reveals expression profiles conserved across three Eimeria spp. of domestic fowl and associated with multiple developmental stages. Int. J. Parasitol. 2012, 42, 39–48. [Google Scholar] [CrossRef]
- Walker, R.A.; Sharman, P.A.; Miller, C.M.; Lippuner, C.; Okoniewski, M.; Eichenberger, R.M.; Ramakrishnan, C.; Brossier, F.; Deplazes, P.; Hehl, A.B.; et al. RNA Seq analysis of the Eimeria tenella gametocyte transcriptome reveals clues about the molecular basis for sexual reproduction and oocyst biogenesis. BMC Genom. 2015, 16, 94. [Google Scholar] [CrossRef] [PubMed]
- Ehret, T.; Spork, S.; Dieterich, C.; Lucius, R.; Heitlinger, E. Dual RNA-seq reveals no plastic transcriptional response of the coccidian parasite Eimeria falciformis to host immune defenses. BMC Genom. 2017, 18, 686. [Google Scholar] [CrossRef] [PubMed]
- Su, S.; Hou, Z.; Liu, D.; Jia, C.; Wang, L.; Xu, J.; Tao, J. Comparative transcriptome analysis of second- and third-generation merozoites of Eimeria necatrix. Parasit. Vectors 2017, 10, 388. [Google Scholar] [CrossRef] [PubMed]
- Xie, Y.; Huang, B.; Xu, L.; Zhao, Q.; Zhu, S.; Zhao, H.; Dong, H.; Han, H. Comparative Transcriptome Analyses of Drug-sensitive and Drug-resistant Strains of Eimeria tenella by RNA-sequencing. J. Eukaryot. Microbiol. 2020, 67, 406–416. [Google Scholar] [CrossRef]
- Sandholt, A.K.S.; Wattrang, E.; Lilja, T.; Ahola, H.; Lunden, A.; Troell, K.; Svard, S.G.; Soderlund, R. Dual RNA-seq transcriptome analysis of caecal tissue during primary Eimeria tenella infection in chickens. BMC Genom. 2021, 22, 660. [Google Scholar] [CrossRef] [PubMed]
- Xie, Y.; Xiao, J.; Zhou, X.; Gu, X.; He, R.; Xu, J.; Jing, B.; Peng, X.; Yang, G. Global transcriptome landscape of the rabbit protozoan parasite Eimeria stiedae. Parasit. Vectors 2021, 14, 308. [Google Scholar] [CrossRef] [PubMed]
- Chen, L.; Tang, X.; Sun, P.; Hu, D.; Zhang, Y.; Wang, C.; Chen, J.; Liu, J.; Gao, Y.; Hao, Z.; et al. Comparative transcriptome profiling of Eimeria tenella in various developmental stages and functional analysis of an ApiAP2 transcription factor exclusively expressed during sporogony. Parasit. Vectors 2023, 16, 241. [Google Scholar] [CrossRef] [PubMed]
- Tucker, M.S.; O’Brien, C.N.; Jenkins, M.C.; Rosenthal, B.M. Dynamically expressed genes provide candidate viability biomarkers in a model coccidian. PLoS ONE 2021, 16, e0258157. [Google Scholar] [CrossRef] [PubMed]
- Reid, A.J.; Blake, D.P.; Ansari, H.R.; Billington, K.; Browne, H.P.; Bryant, J.; Dunn, M.; Hung, S.S.; Kawahara, F.; Miranda-Saavedra, D.; et al. Genomic analysis of the causative agents of coccidiosis in domestic chickens. Genome Res. 2014, 24, 1676–1685. [Google Scholar] [CrossRef]
- Wickham, H. ggplot2. Elegant Graph. Data Anal. 2016, XVI, 260. [Google Scholar] [CrossRef]
- Wickham, H. Reshaping Data with the reshape Package. J. Stat. Softw. 2007, 21, 1–20. [Google Scholar] [CrossRef]
- Love, M.I.; Huber, W.; Anders, S. Moderated estimation of fold change and dispersion for RNA-seq data with DESeq2. Genome Biol. 2014, 15, 550. [Google Scholar] [CrossRef]
- Blighe, K.; Rana, S.; Lewis, M. EnhancedVolcano: Publication-Ready Volcano Plots with Enhanced Colouring and Labeling. Available online: https://github.com/kevinblighe/EnhancedVolcano (accessed on 27 May 2023).
- Amos, B.; Aurrecoechea, C.; Barba, M.; Barreto, A.; Basenko, E.Y.; Bazant, W.; Belnap, R.; Blevins, A.S.; Bohme, U.; Brestelli, J.; et al. VEuPathDB: The eukaryotic pathogen, vector and host bioinformatics resource center. Nucleic Acids Res. 2022, 50, D898–D911. [Google Scholar] [CrossRef] [PubMed]
- Huerta-Cepas, J.; Szklarczyk, D.; Heller, D.; Hernandez-Plaza, A.; Forslund, S.K.; Cook, H.; Mende, D.R.; Letunic, I.; Rattei, T.; Jensen, L.J.; et al. eggNOG 5.0: A hierarchical, functionally and phylogenetically annotated orthology resource based on 5090 organisms and 2502 viruses. Nucleic Acids Res 2019, 47, D309–D314. [Google Scholar] [CrossRef] [PubMed]
- Kanehisa, M.; Sato, Y. KEGG Mapper for inferring cellular functions from protein sequences. Protein Sci. 2020, 29, 28–35. [Google Scholar] [CrossRef] [PubMed]
- Pfaffl, M.W. A new mathematical model for relative quantification in real-time RT-PCR. Nucleic Acids Res. 2001, 29, e45. [Google Scholar] [CrossRef] [PubMed]
- Ye, J.; Coulouris, G.; Zaretskaya, I.; Cutcutache, I.; Rozen, S.; Madden, T.L. Primer-BLAST: A tool to design target-specific primers for polymerase chain reaction. BMC Bioinform. 2012, 13, 134. [Google Scholar] [CrossRef] [PubMed]
- Jenkins, M.; Fetterer, R.; Miska, K. Co-infection of chickens with Eimeria praecox and Eimeria maxima does not prevent development of immunity to Eimeria maxima. Vet. Parasitol. 2009, 161, 320–323. [Google Scholar] [CrossRef]
- Soutter, F.; Werling, D.; Tomley, F.M.; Blake, D.P. Poultry Coccidiosis: Design and Interpretation of Vaccine Studies. Front. Vet. Sci. 2020, 7, 101. [Google Scholar] [CrossRef]
- Allen, P.C.; Jenkins, M.C.; Miska, K.B. Cross protection studies with Eimeria maxima strains. Parasitol. Res. 2005, 97, 179–185. [Google Scholar] [CrossRef]
- Schwarz, R.S.; Fetterer, R.H.; Rosenberg, G.H.; Miska, K.B. Coccidian merozoite transcriptome analysis from Eimeria maxima in comparison to Eimeria tenella and Eimeria acervulina. J. Parasitol. 2010, 96, 49–57. [Google Scholar] [CrossRef]
- Al-Badri, R.; Barta, J.R. The kinetics of oocyst shedding and sporulation in two immunologically distinct strains of Eimeria maxima, GS and M6. Parasitol. Res. 2012, 111, 1947–1952. [Google Scholar] [CrossRef]
- Keeley, A.; Soldati, D. The glideosome: A molecular machine powering motility and host-cell invasion by Apicomplexa. Trends Cell Biol. 2004, 14, 528–532. [Google Scholar] [CrossRef]
- Daher, W.; Soldati-Favre, D. Mechanisms controlling glideosome function in apicomplexans. Curr. Opin. Microbiol. 2009, 12, 408–414. [Google Scholar] [CrossRef]
- Plattner, F.; Yarovinsky, F.; Romero, S.; Didry, D.; Carlier, M.F.; Sher, A.; Soldati-Favre, D. Toxoplasma profilin is essential for host cell invasion and TLR11-dependent induction of an interleukin-12 response. Cell Host Microbe 2008, 3, 77–87. [Google Scholar] [CrossRef]
- Matsubayashi, M.; Hatta, T.; Miyoshi, T.; Anisuzzaman, n.; Sasai, K.; Shimura, K.; Isobe, T.; Kita, K.; Tsuji, N. High-throughput RNA sequencing profiles and transcriptional evidence of aerobic respiratory enzymes in sporulating oocysts and sporozoites of Eimeria tenella. Infect. Genet. Evol. 2013, 18, 269–276. [Google Scholar] [CrossRef] [PubMed]
- Matsubayashi, M.; Kawahara, F.; Hatta, T.; Yamagishi, J.; Miyoshi, T.; Anisuzzaman; Sasai, K.; Isobe, T.; Kita, K.; Tsuji, N. Transcriptional profiles of virulent and precocious strains of Eimeria tenella at sporozoite stage; novel biological insight into attenuated asexual development. Infect. Genet. Evol. 2016, 40, 54–62. [Google Scholar] [CrossRef] [PubMed]
- Liao, Y.; Luo, D.; Peng, K.; Zeng, Y. Cyclophilin A: A key player for etiological agent infection. Appl. Microbiol. Biotechnol. 2021, 105, 1365–1377. [Google Scholar] [CrossRef] [PubMed]
- Hosse, R.J.; Krucken, J.; Bierbaum, S.; Greif, G.; Wunderlich, F. Eimeria tenella: Genomic organization and expression of an 89kDa cyclophilin. Exp. Parasitol. 2008, 118, 275–279. [Google Scholar] [CrossRef] [PubMed]
- Krucken, J.; Greif, G.; von Samson-Himmelstjerna, G. In silico analysis of the cyclophilin repertoire of apicomplexan parasites. Parasit. Vectors 2009, 2, 27. [Google Scholar] [CrossRef] [PubMed]
- Datta, G.; Hossain, M.E.; Asad, M.; Rathore, S.; Mohmmed, A. Plasmodium falciparum OTU-like cysteine protease (PfOTU) is essential for apicoplast homeostasis and associates with noncanonical role of Atg8. Cell Microbiol. 2017, 19, e12748. [Google Scholar] [CrossRef] [PubMed]
- Biddau, M.; Bouchut, A.; Major, J.; Saveria, T.; Tottey, J.; Oka, O.; van-Lith, M.; Jennings, K.E.; Ovciarikova, J.; DeRocher, A.; et al. Two essential Thioredoxins mediate apicoplast biogenesis, protein import, and gene expression in Toxoplasma gondii. PLoS Pathog. 2018, 14, e1006836. [Google Scholar] [CrossRef]
- Wang, P.; Gong, P.; Wang, W.; Li, J.; Ai, Y.; Zhang, X. An Eimeria acervulina OTU protease exhibits linkage-specific deubiquitinase activity. Parasitol. Res. 2019, 118, 47–55. [Google Scholar] [CrossRef]
- Wilde, M.L.; Ruparel, U.; Klemm, T.; Lee, V.V.; Calleja, D.J.; Komander, D.; Tonkin, C.J. Characterisation of the OTU domain deubiquitinase complement of Toxoplasma gondii. Life Sci. Alliance 2023, 6, e202201710. [Google Scholar] [CrossRef]
- Matsubayashi, M.; Teramoto-Kimata, I.; Uni, S.; Lillehoj, H.S.; Matsuda, H.; Furuya, M.; Tani, H.; Sasai, K. Elongation factor-1alpha is a novel protein associated with host cell invasion and a potential protective antigen of Cryptosporidium parvum. J. Biol. Chem. 2013, 288, 34111–34120. [Google Scholar] [CrossRef] [PubMed]
- Lin, R.Q.; Lillehoj, H.S.; Lee, S.K.; Oh, S.; Panebra, A.; Lillehoj, E.P. Vaccination with Eimeria tenella elongation factor-1alpha recombinant protein induces protective immunity against E. tenella and E. maxima infections. Vet. Parasitol. 2017, 243, 79–84. [Google Scholar] [CrossRef] [PubMed]
- Wang, S.; Zhang, Z.; Wang, Y.; Gadahi, J.A.; Xu, L.; Yan, R.; Song, X.; Li, X. Toxoplasma gondii Elongation Factor 1-Alpha (TgEF-1alpha) Is a Novel Vaccine Candidate Antigen against Toxoplasmosis. Front. Microbiol. 2017, 8, 168. [Google Scholar] [CrossRef]
- He, W.; Hao, G.; Xiong, C.; Xiao, J.; Pu, J.; Chen, H.; Xu, L.; Zhu, Y.; Yang, G. Protection against Eimeria intestinalis infection in rabbits immunized with the recombinant elongation factors EF1alpha and EFG. Infect. Immun. 2023, 91, e0020823. [Google Scholar] [CrossRef]
- Jeffers, T.K. Attenuation of Eimeria tenella through selection for precociousness. J. Parasitol. 1975, 61, 1083–1090. [Google Scholar] [CrossRef]
- McDonald, V.; Shirley, M.W. Eimeria mitis: A comparison of the endogenous developmental stages of a line selected for early maturation and the parent strain. Parasitology 1984, 88 Pt. 1, 37–44. [Google Scholar] [CrossRef]
- McDonald, V.; Shirley, M.W.; Bellatti, M.A. Eimeria maxima: Characteristics of attenuated lines obtained by selection for precocious development in the chicken. Exp. Parasitol. 1986, 61, 192–200. [Google Scholar] [CrossRef]
- McDonald, V.; Shirley, M.W. The endogenous development of virulent strains and attenuated precocious lines of Eimeria tenella and E. necatrix. J. Parasitol. 1987, 73, 993–997. [Google Scholar] [CrossRef]
- Tabares, E.; Ferguson, D.; Clark, J.; Soon, P.E.; Wan, K.L.; Tomley, F. Eimeria tenella sporozoites and merozoites differentially express glycosylphosphatidylinositol-anchored variant surface proteins. Mol. Biochem. Parasitol. 2004, 135, 123–132. [Google Scholar] [CrossRef] [PubMed]
- Ramly, N.Z.; Dix, S.R.; Ruzheinikov, S.N.; Sedelnikova, S.E.; Baker, P.J.; Chow, Y.P.; Tomley, F.M.; Blake, D.P.; Wan, K.L.; Nathan, S.; et al. The structure of a major surface antigen SAG19 from Eimeria tenella unifies the Eimeria SAG family. Commun. Biol. 2021, 4, 376. [Google Scholar] [CrossRef] [PubMed]
- Nagamune, K.; Sibley, L.D. Comparative genomic and phylogenetic analyses of calcium ATPases and calcium-regulated proteins in the apicomplexa. Mol. Biol. Evol. 2006, 23, 1613–1627. [Google Scholar] [CrossRef] [PubMed]
- Barrett, T.; Wilhite, S.E.; Ledoux, P.; Evangelista, C.; Kim, I.F.; Tomashevsky, M.; Marshall, K.A.; Phillippy, K.H.; Sherman, P.M.; Holko, M.; et al. NCBI GEO: Archive for functional genomics data sets—Update. Nucleic Acids Res. 2013, 41, D991–D995. [Google Scholar] [CrossRef]
Disclaimer/Publisher’s Note: The statements, opinions and data contained in all publications are solely those of the individual author(s) and contributor(s) and not of MDPI and/or the editor(s). MDPI and/or the editor(s) disclaim responsibility for any injury to people or property resulting from any ideas, methods, instructions or products referred to in the content. |
© 2023 by the authors. Licensee MDPI, Basel, Switzerland. This article is an open access article distributed under the terms and conditions of the Creative Commons Attribution (CC BY) license (https://creativecommons.org/licenses/by/4.0/).