Article

Identifying Opinion Leaders on Twitter during Sporting Events: Lessons from a Case Study

by
José M. Lamirán-Palomares
,
Tomás Baviera
and
Amparo Baviera-Puig
*
Department of Economics and Social Sciences. Building 3B, Universitat Politècnica de València, Camino de Vera s/n, 46022 Valencia, Spain
*
Author to whom correspondence should be addressed.
Soc. Sci. 2019, 8(5), 141; https://doi.org/10.3390/socsci8050141
Submission received: 21 March 2019 / Revised: 27 April 2019 / Accepted: 30 April 2019 / Published: 7 May 2019
(This article belongs to the Section Social Economics)

Abstract

:
Social media platforms have had a significant impact on the public image of sports in recent years. Through the relational dynamics of the communication on these networks, many users have emerged whose opinions can exert a great deal of influence on public conversation online. This research aims to identify the influential Twitter users during the 2016 UCI Track Cycling World Championships using different variables which, in turn, represent different dimensions of influence (popularity, activity and authority). Mathematical variables of the social network analysis and variables provided by Twitter and Google are compared. First, we calculated the Spearman’s rank correlation coefficient among all users (n = 20,175) in pairwise comparisons. Next, we performed a qualitative analysis of the top 25 influential users ranked by each variable. As a result, no single variable assessed is sufficient to identify the different kinds of influential Twitter users. The reason that some variables vary so greatly is that the components of influence are very different. Influence is a contextualised phenomenon. Having a certain type of account is not enough to make a user an influencer if they do not engage (actively or passively) in the conversation. Choosing the influencers will depend on the objectives pursued.

1. Introduction

Social media communication platforms have definitively consolidated their place in various aspects of our society and behaviour (Kaplan and Haenlein 2010; Wilson and Dunn 2011; Towner and Munoz 2016). Without a doubt, the sports industry has been affected such as few others by the consolidation of social media (Hutchins and Rowe 2010; Dart 2014). The use of social media accounts, for example, has transformed the relationship between athletes and their fans and followers, making it more intimate and immediate in terms of response time (Hambrick et al. 2010; Kassing and Sanderson 2010; Cleland 2014). Moreover, the relationship between sporting events, spectators, fans and sponsors has also changed. For example, Delia and Armstrong (2015) studied the 2013 Roland Garros tennis tournament, measuring the sponsors’ impact on social media, and Yu and Wang (2015) analysed fans’ sentiment expression by looking at their tweets during several 2014 World Cup matches.
Filo et al. (2015) and Santomier (2008) examined these changes in their analysis of how the “new media” have changed the production and consumption of sports, and the significant implications of this change in such key areas as sponsorship. Meenaghan et al. (2013) analysed how quantifying the efficacy and impact of social media campaigns on platforms such as Twitter represents a significant opportunity for the increasing number of companies, sporting events and social media platforms by measuring return on investment. It is also a new outlet for advocacy. Hull and Schmittel (2015) explored how advocates for concussion awareness in football used Twitter to help spread their message during the 2013 Super Bowl. Consequently, determining and analysing the companies/organisations or individuals who, through their social media profiles, are most likely to transmit information and exert influence on other users, has become extremely important in social media management.
Despite the efforts made by organizations and brands, the identification of influencers is still the main challenge for both companies and marketers (Lahuerta-Otero and Cordero-Gutiérrez 2016; Khan et al. 2017), also even for sporting events. Thus, this research aims to identify the influential Twitter users during the 2016 UCI (Union Cycliste Internationale) Track Cycling World Championships, using different variables which, in turn, represent different dimensions of influence. We have divided this objective into the following sub-objectives: (i) compare the rankings of influential users in terms of the variables within one dimension; (ii) compare influential user rankings in terms of variables from multiple dimensions; and (iii) identify the most influential users in each dimension.

2. Literature Review and Theoretical Framework

2.1. Twitter and Sport Research

Different studies have been carried out on the Twitter social media platform. Athletes have been the subject of different studies due to their relevance and importance. In many cases, they are considered as celebrities. Sports celebrities are unique from other types of celebrity in that their value is directly related to their own field performance (Turner 2014). Kassing and Sanderson (2010) analysed the tweets launched by the cyclists during the Giro d’Italia. Pegoraro (2010) studied professional athletes using Twitter and found that most athletes used the online social network to communicate with fellow athletes and followers. In other words, they used Twitter more as a means of interaction than as a promotional vehicle. Hambrick et al. (2010) and Hambrick and Mahoney (2011) obtained similar results to Pegoraro (2010). Other users whose activity on Twitter has also been studied are journalists (Hambrick and Sanderson 2013), sponsors (Abeza et al. 2014; Delia and Armstrong 2015) and sport organisations (Hambrick 2012; Wäsche 2015; Naraine and Parent 2016).
Different studies have attempted to identify the influential users on Twitter in different sports and environments with different objectives. Clavio et al. (2012) analysed the interaction network of a Big Ten American football team’s Twitter community. Hambrick (2012) examined how two bicycle-race organisers and influential Twitter users spread information through the online social network to promote their events. Hambrick and Pegoraro (2014) examined social media communities formed during the 2014 Olympic Games. Naraine et al. (2016) compared international and domestic multisport events. Naraine and Parent (2016) analysed national sport organisations and Wäsche (2015) focused on regional sport tourism. More recently, Yan et al. (2018a, 2018b) investigated the Twitter networks of the 2017 UEFA Champions League Final. Although Social Network Analysis (SNA) is commonly used by most of these studies as a methodological approach, the theoretical framework differs. Clavio et al. (2012) used the systems theory, Hambrick and Pegoraro (2014) employed the word-of-mouth (WOM) conceptual framework, and Naraine et al. (2016) based their approach on the stakeholder theory. We propose the two-step flow hypothesis as theoretical framework in order to operationalise influence based on different dimensions.

2.2. Two-Step Flow Hypothesis

Many researchers have studied how information is transmitted between the media and individuals. In their two-step flow theory, Katz and Lazarsfeld (1955) explained the role played by a particular group of people in forming the opinion of the general public. They made a bridge between the media and their contact network, so that they could be considered as prescribers regarding the information published by the media. As such, their contact networks give them more credence than to the media itself, so that they were considered opinion leaders.
In their time, Katz and Lazarsfeld broke from traditional theories of communication, which spoke of the media’s direct influence on the public at large. The two-step theory’s principal hypothesis, on the other hand, modelled the media influence process in two stages: first, communication starts with the media and flows towards opinion leaders. Second, opinion leaders transfer that information to the public at large. The key element of this theory is identifying the correct opinion leaders, as they can vary from topic to topic (Katz 1957).
The arrival of the Internet has altered this communication process itself. In this new scenario, Veglis and Maniou (2018) presented the mediated data model of communication flow, where they incorporated new roles of intermediation. It is the case of data journalists and information seekers, who are distinguished because they know how to organize information and work with large amounts of data (big data). In political communication, Chadwick (2013) featured the new scenario as a hybrid media system consisting of an interrelation of two different logics: the classical media logic and the network logic. This last one is characterized by the interaction of a large amount of actors through the digital media.
As today’s social media platforms are based on user-to-user relationships, this theoretical model might help us to understand the information flow on them (Norris and Curtice 2008). If we identify the influencers of certain groups on these sites, it would be possible to track the desired disseminated messages (Brosius and Weimann 1996; Freberg et al. 2011). According to Morone and Makse (2015), users identified as influential are most capable of disseminating information on Twitter. Nevertheless, measuring a user’s influence in any social media platform is a conceptual problem. There is still no consensus as to the definition of an influential user, and different studies define the term in numerous ways (Gayo-Avello 2013; Bouguessa and Romdhane 2015). It can also be difficult to identify which elements determine influence, the parameters used by the tools to do so, or even the structure of social connections. Indeed, identifying influence can vary greatly depending on the metrics used to measure it (McNeill and Briggs 2014; Yamamoto et al. 2017).
Riquelme and González-Cantergiani (2016) classified the studies of influence on Twitter according to three categories: popularity, activity, and a third group named with the general term influence measures. Dubois and Gaffney (2014) selected a measure focused on the internal importance of a user. Following these authors, we shall examine these three dimensions of the interaction among Twitter users: popularity, activity and authority. A user can be considered popular when many other users follow them. Take, for example, celebrities, who need not be active to be popular. An active user engages in the social network consistently and frequently during a given period, regardless of the attention paid to them by other members of the network. Engagement refers to every measurable activity. On Twitter, it is impossible to know if a user has read a tweet. However, tweets, re-tweets, and mentions, among other things, are measurable (Sousa et al. 2010). Finally, a user has authority when they have connections with other highly connected users. This research relies on these three dimensions—popularity, activity and authority—to analyse influence.

2.3. Social Network Analysis

Identifying influencers has had strong support from SNA, which emerged in the 1940s from Lewin’s Gestalt Theory (Lewin 1939). Lewin formalised and formulated his theory with graph analysis, and in the 1970s, the theory’s mathematical base was further developed and applied by many researchers (Freeman 1979; Freeman et al. 1991; Lozares 1996). Despite subtle differences of opinion among researchers, the central tenet of social network theory is the assumption that what people feel, think, and do comes from the situational relation patterns among actors. SNA helps evaluate the interdependent actions among users overall, despite the fact that not all users are directly linked to one another. This is in stark contrast with the idea that the attributes of individual actors cause behavioural patterns. Thus, the relevance of SNA lies in the evaluation of these social relationships based on the interactions among all the agents involved (Scott 2017).
Although SNA is a common methodological approach in many fields, it has only recently come into the focus of sport researchers. Quatman and Chelladurai (2008a) and Wäsche et al. (2017) provide a general assessment of the utility of the social network theory and analysis and show a wide range of different applications in sport management research. Quatman and Chelladurai (2008b) go one step further and empirically explore the social interaction patterns among scholars in the field of sport management, using a social network perspective. Researchers have used this SNA methodological approach to identify popular users within social networks (Clavio et al. 2012; Hambrick 2012; Hambrick and Sanderson 2013; Hambrick and Pegoraro 2014; Naraine and Parent 2016). SNA can help event organisers understand how social media communities are structured and expand their knowledge of how to manage the conversations held by these communities around their events.
A key concept in social network theory is centrality (Borgatti et al. 2013). This term is associated with an actor’s ability to influence the network’s internal dynamics due to that actor’s location (Borgatti and Everett 2006). Among the various measures of centrality are degree centrality and eigenvector centrality. Each node has a degree of centrality, characterising its relative position within the network by looking at the edges connecting to that particular node. This can be differentiated between indegree (when the interaction is started by the node) and outdegree (when the interaction is addressed to the node) (Newman 2010). Eigenvector centrality (also called eigencentrality) assigns relative scores to all nodes based on the assumption that connections to high-scoring nodes increase a node’s score more than an equal number of connections to low-scoring nodes (Florez 2008). Eigencentrality differs from degree centrality metrics in that the former takes into account the weight of the connected nodes (Bonacich 1972).
These centrality measures can operationalise the selected user influence dimensions when they are applied to the interaction network formed during the Twitter conversation: indegree can measure popularity, outdegree can measure activity, and eigenvector centrality can measure authority. We want to contrast them with two direct variables taken from the user account: number of followers as a proxy for popularity, and number of tweets as a proxy for activity. In the case of authority, we want to compare eigenvector centrality with the measure provided by PageRank algorithm. This variable has previously been used as a general evaluation for influence (Riquelme and González-Cantergiani 2016). PageRank is the algorithm used by Google to evaluate the importance of website pages, and it assesses the probability that a user randomly clicking on links will arrive at a particular page (Page and Brin 1998). Web pages have a higher chance of being reached if they are linked to many times, and if those links come from highly linked pages. All these variables allow us to establish a ranking of Twitter users. To this end, we shall address the following research question (RQ):
RQ1: What are the differences between the user rankings provided by these influence variables taken from SNA (indegree, outdegree, and eigenvector centrality), from Twitter data (number of followers and number of tweets) and from Google (PageRank)?
These variables provide a user classification based only on their overall interaction during the Twitter conversation, regardless of their role in the event. However, we can expect that the event organiser will be more involved (Hambrick 2012), and that journalists will be more relevant in the conversation (Naraine and Parent 2016). Dubois and Gaffney (2014) featured the most relevant users extracted by certain variables of influence, in terms of their role in an electoral campaign. Likewise, in a sporting event there are several roles that might exert their influence by way of their profile. In order to better assess the influential actors, the analysis should take a close look at the top ranked users according to the six previous variables. This will be useful for evaluating whether the three dimensions reveal opinion leaders with no institutional links, as was revealed in the initial studies of personal influence (Katz and Lazarsfeld 1955).
RQ2: Which user profile, in terms of their role in the event, is more present at the head of the rankings provided by the selected influence variables?

3. Data and Methodology

3.1. The Sporting Event

From 2 March to 6 March 2016, the UCI Track Cycling World Championships were held in London’s Olympic velodrome at Lee Valley VeloPark. The event’s signage, event programmes and promotional images included various messages inviting spectators—whether live or on television—to interact with the event. These messages included the official hashtag #TWC2016, the event’s official Twitter account @trackworlds, and the phrase “Tweet from your seat.” This sport event was therefore appropriate to explore our RQ as the organisers encouraged the public to participate in the Twitter conversation.

3.2. Data

For our research, we downloaded the tweets with the hashtag #TWC2016 sent from 15 February to 14 March 2016 (see Supplementary Materials). We used Audiense, specific software for capturing Twitter data. Although we cannot assure that we have all the tweets specified with that condition, at least we have a big sample that we consider enough for our research. The hashtag (#TWC2016) was the same as the one used by The Women’s Conference 2016. This Conference was held in December 2016. Though the dates did not coincide, we checked that there was no tweet of this event in our database. We included the pre-, during and post periods as cited by Abeza et al. (2014), Yan et al. (2018a) and Yan et al. (2018b). We analysed 55,572 tweets (English and non-English) sent initially by 20,303 users, which later fell to 20,175 users after we detected 128 errors or duplicates, among other issues. Once the database was refined, we identified the interactions among the users in the conversation through mentions and re-tweets. To visualise this network, we created a graph using the Gephi software and the Fruchterman–Reingold algorithm (Bastian et al. 2009). We used this algorithm because it emphasizes complementarities in the graphical representation of the network and makes the different clusters emerge. In this graph, the edges are weighted. Table 1 shows the basic information about the graph. The number of nodes (23,339) is greater than the number of users analysed (n = 20,175) because the first one includes those users who were mentioned but did not write any tweet with the hashtag #TWC2016.

3.3. Analysis

We ranked users according to each variable. Then, we performed two different analyses. First, we performed a quantitative analysis. We calculated the Spearman’s rank correlation coefficient among all users (n = 20,175) in pairwise comparisons (Del Campo-Ávila et al. 2013), seeking to determine whether different variables yield similar rankings of users. A positive value indicates a positive correlation, whereas a negative value indicates an inverse correlation (Santesmases 2009). We used Spearman’s coefficient because it is a nonparametric measure of rank correlation since the behaviour and social phenomena associated with web-based social spaces usually follow a power law distribution (Barabási and Albert 1999).
Next, we performed a qualitative analysis of the top 25 influential users ranked by each variable. This sample is enough to provide variety of results, and its size can be managed to bring meaningful insights (Dubois and Gaffney 2014). We carried out a content analysis of each account’s profile (Wilson and Dunn 2011; Clavio et al. 2012). To classify the users, we created the following coding system: 1 = Cyclist participating in the event; 2 = Media (press, radio, TV, etc.); 3 = Fans/Supporters; 4 = Media related to cycling (magazines, websites, etc.); 5 = Journalists, bloggers, ex-cyclists; 6 = Related institutions (federations, cycling teams, organisations); 7 = Others. Once we had selected all users, one of the authors made an initial classification, and another revised it. When there was a discrepancy, the third author was consulted.

4. Results and Discussion

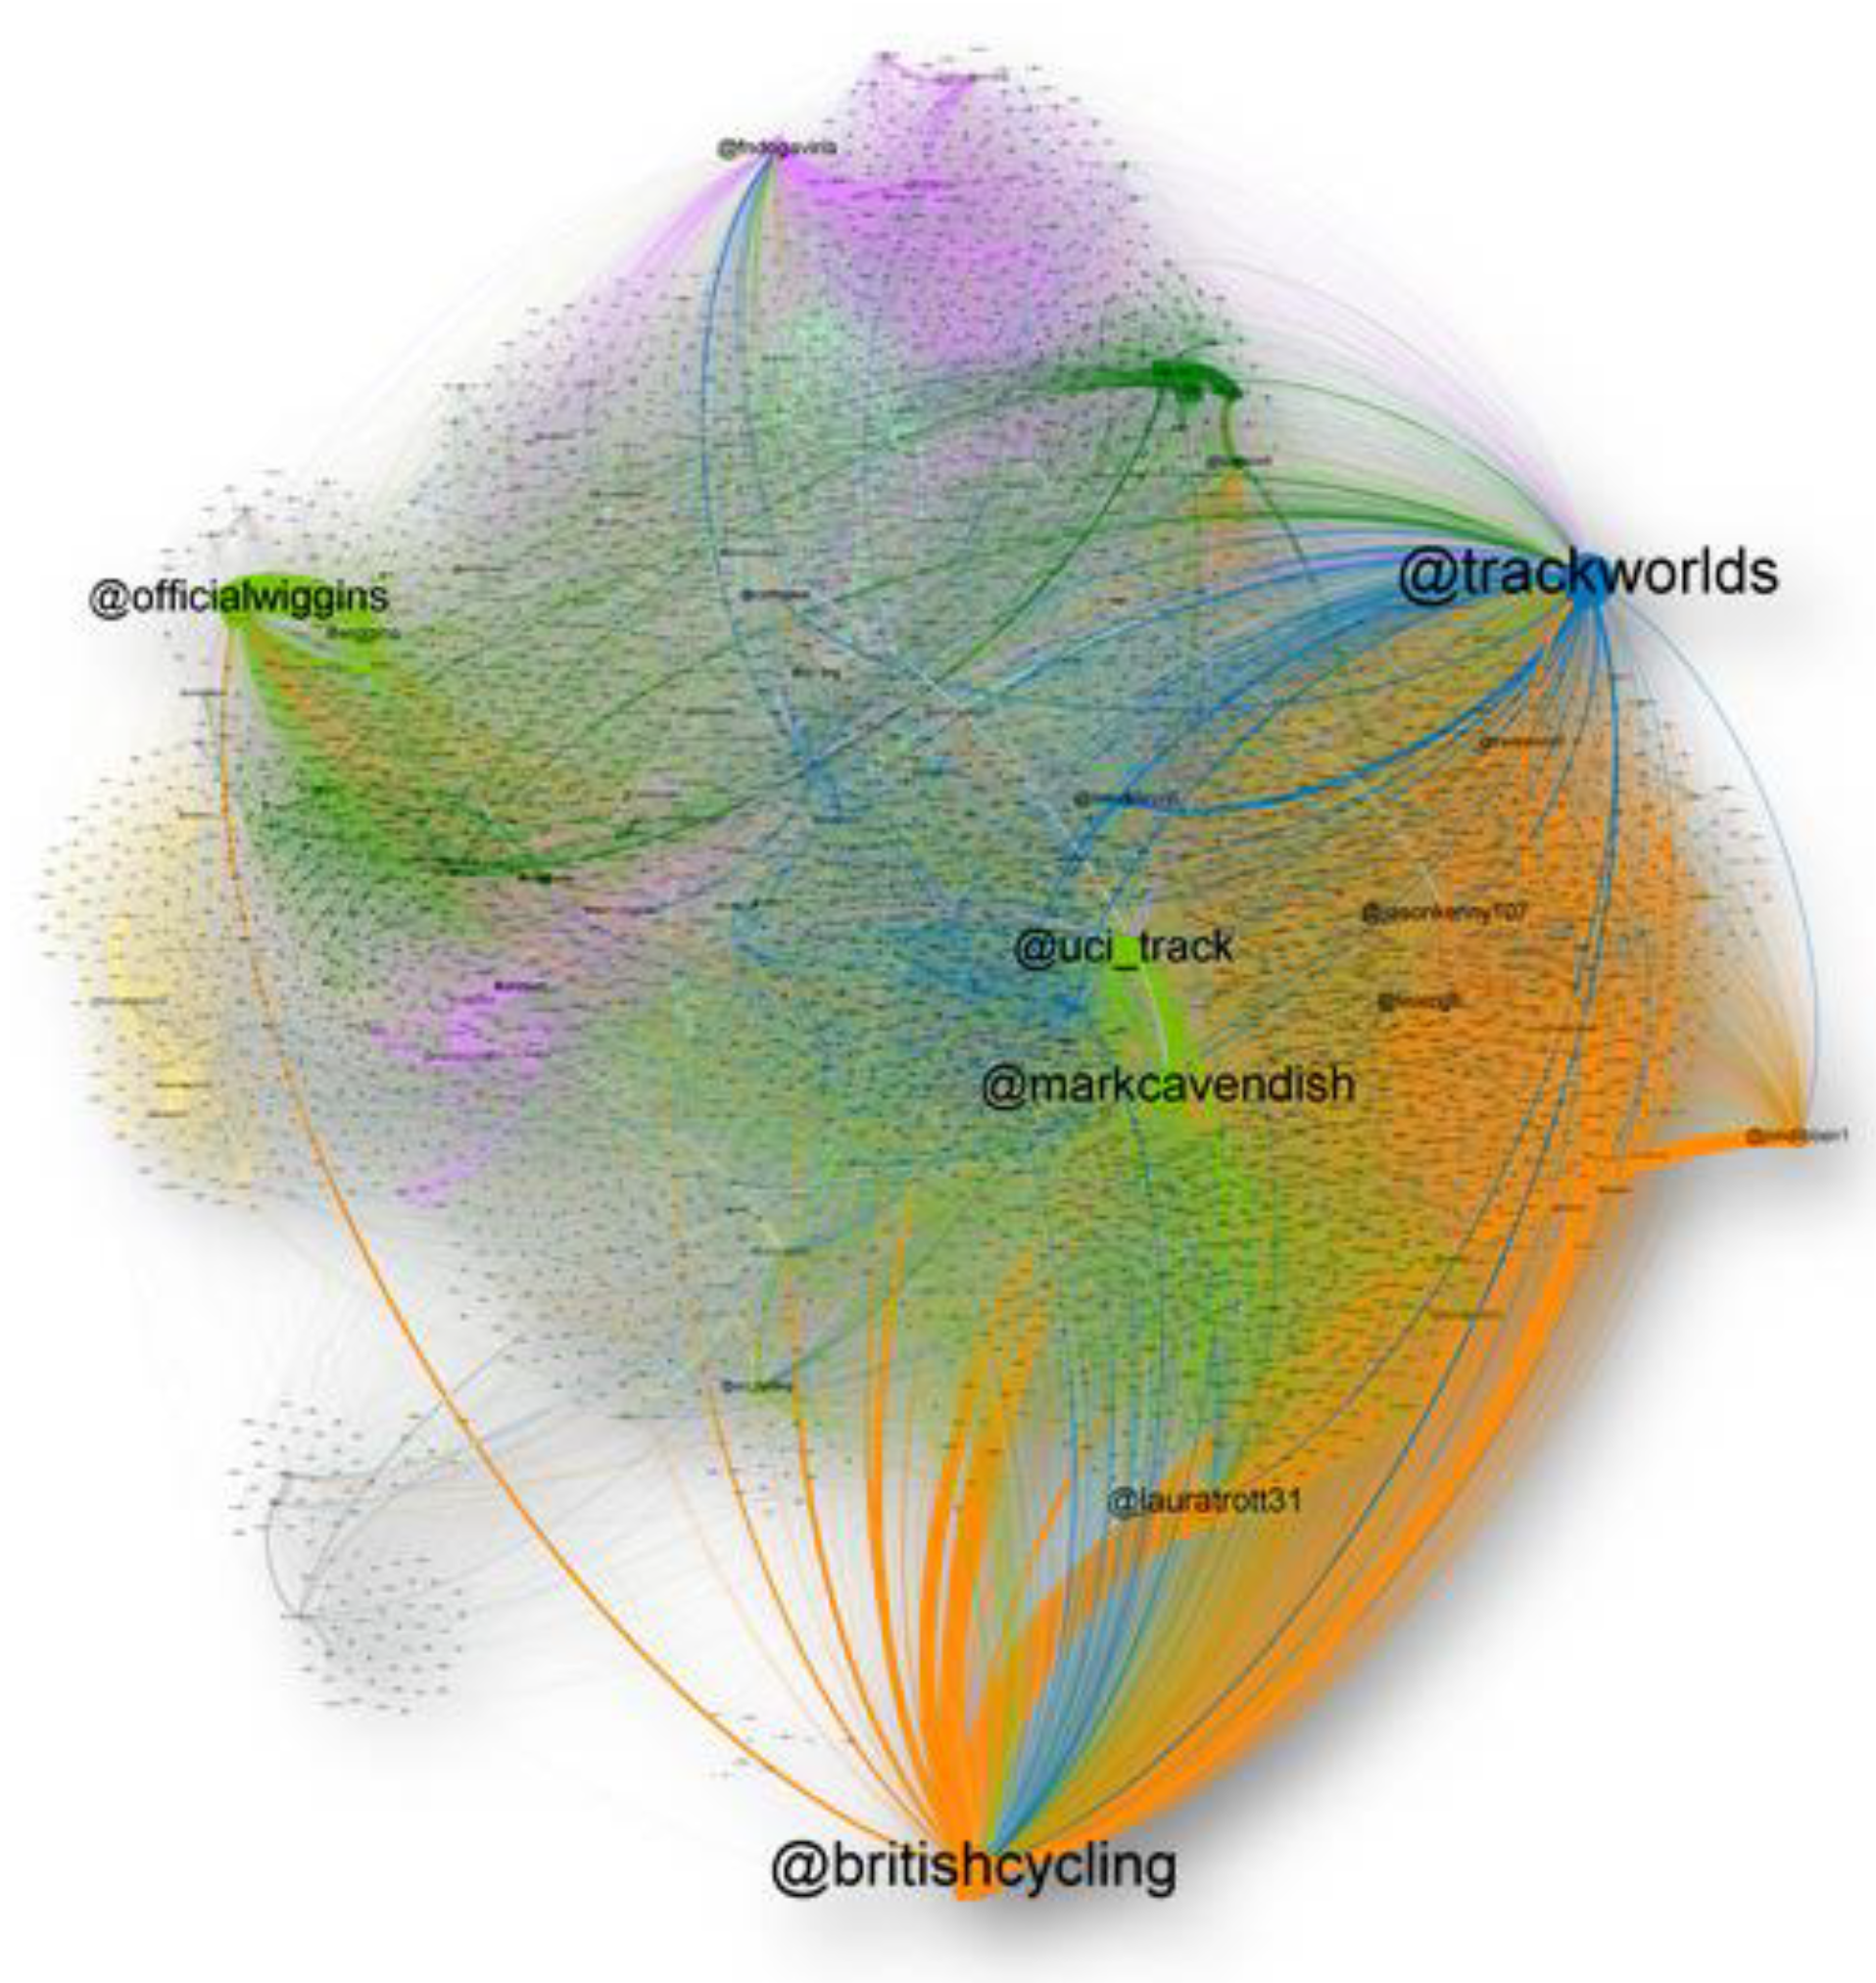
4.1. Interaction Network

Figure 1 shows the interaction graph during the Twitter conversation. Each of the nodes represents a user, and its size corresponds to the indegree variable: a larger size and a bigger font indicate a greater value of this centrality measure. The largest nodes are those that receive the largest number of mentions and retweets. The edges are weighted according to the number of interactions. The colours represent the cluster identified by Gephi.
The clusters reflect the grouping of the users who are talking about the event linked by close interactions. One reason for this clustering has been the language. For example, followers of Colombian cyclists are included in the same cluster and speak in the same language (Spanish). Peripheral positions influence neighbouring clusters while central positions reflect a reach to a greater number of users. Therefore, there may be a node with a high indegree but linked to a few clusters. For example, @trackworlds and @bristishcycling receive edges of few colours compared to @markcavendish or @uci_track, since these are in a central position in the graph. This is exactly the outcome provided by the use of the Fruchterman–Reingold algorithm. We can conclude that we have synthesized the conversation graphically to identify the relative position of the users in the global interaction.

4.2. Correlation between Ranks

Results are shown in Table 2. First, every rank correlation coefficient was significant. Although we take indegree and number of followers to represent the same dimension (popularity), the two measurements are negatively correlated at −0.490. This could be because the most mentioned users do not necessarily have the highest number of followers, and vice versa. Similarly, outdegree and number of tweets are not highly correlated (0.614), despite both metrics representing activity. A possible interpretation is that those who tweet the most do not necessarily mention the greatest number of people. Regarding the authority dimension, Table 2 shows that there is a high positive correlation between PageRank and eigencentrality, yielding two very similar rankings. As opposed to the previous dimension, these two variables are quite similar in conceptual terms and are, therefore, highly aligned. This means that we can characterise the dimension of authority with either of the two variables, as the ranking yielded by one would be quite similar to that of the other.
Of the remaining correlations, we should point out the high positive correlation between indegree and PageRank (0.818), and indegree and eigencentrality (1.000), which could mean that being mentioned often (indegree) has a positive effect on being a reference and becoming an authority (PageRank and eigencentrality) on Twitter. The correlation between PageRank and number of tweets is also very high (0.925). In other words, the authority ranking (PageRank) correlates positively with the productivity ranking (number of tweets). Perhaps the key detail is not that users who tweet more often have a higher PageRank, but rather that users with a high PageRank tweet more often. Number of tweets also correlates positively with indegree and eigencentrality, but to a lesser degree (0.695 and 0.697, respectively). These figures may reaffirm the importance not only of tweeting often but also of interacting with other users.
Nevertheless, number of followers has a very low rank correlation with the other variables: outdegree (0.145), number of tweets (0.180), PageRank (0.059) and eigencentrality (−0.487). This implies that the users with the largest number of followers are neither those who mention the most users, nor those who tweet the most, nor are the references merely due to their authority in the realm of sports (PageRank and eigencentrality). Finally, outdegree negatively correlates with indegree (−0.022), which means that the users most mentioned are not those who most mention other users and vice versa. Outdegree’s correlation with the two authority variables is more problematic. Outdegree has a very small, negative correlation coefficient (−0.017) with eigencentrality, and a significant positive correlation coefficient (0.549) with PageRank. This difference suggests that the PageRank calculation gives much more weight to the user’s propensity to mention others, whereas in the other metric, this measurement is not very important. One potential explanation is that the eigencentrality calculation assumes an asymmetrical network (not distinguishing between the direction of the edges), whereas the edge’s direction is relevant in the PageRank calculation.
These results would reinforce the findings of Barnes and Harary (1983), Knoke and Kuklinski (1982), Wäsche (2015), as well as Naraine and Parent (2016), who discussed the importance of the connectivity and density of relationships in social networks. After analysing the correlation between the dimensions’ variables, we performed a content analysis to compare user rankings among the variables of a single dimension.

4.3. Influential Users by Popularity

The popularity of a Twitter user is determined by the variables indegree and number of followers. In the quantitative analysis, these values are negatively correlated. This fact is confirmed in our qualitative analysis (Table 3), as only three of the 25 profiles with the greatest number of followers rank in the top 25 profiles with the greatest indegree. Of the three users in the top 25 for both variables, @trackworlds ranks first with 5749 followers, far behind @bbcnews, which tops the overall list with 6,232,200.
In our analysis of the 25 users with the highest indegree, the Championship cyclists (Class 1) hold a plurality of the spots. In total, there are 11 cyclists, seven of which are on the British team. There is also a Colombian, an Italian, a Spaniard and a Malay. Of these athletes, only one is a woman (Laura Trott). Nine accounts belong to organisations related to the sporting event (Class 6): cycling federations, velodromes, etc. This would seem logical, as it represents a way for the organisations to interact during the event. Indeed, the top two accounts in the indegree ranking are @trackworlds, the event’s Twitter account, and @britishcycling, the British Cycling Federation’s official account. A Class 7 account also stands out in this ranking. It belongs to the trademark of Mark Cavendish, @cvndsh, one of the cyclists with the greatest media reach during the championships. Lastly, the accounts of the two channels that broadcasted the event appear (@bbcsport and @eurosportuktv) (Class 2), as well as the accounts of two journalists who specialise in cycling (Classes 4 and 5).
In the number of followers variable, the general media accounts (Class 2) are predominant, as these accounts have many followers who want to stay abreast of the day’s news. The top two spots are held by @bbcnews and @bbcsport, with 6,232,200 and 5,352,955 followers, respectively. There are other British general media accounts (@independent and @bbc5live), as the event took place in UK, but there are others from Mexico (@aztecadeportes), Italy (@gazzetta_it), Germany (@bild) and the Netherlands (@nos and @telegraaf). Likewise, Class 7 also dominates this ranking. We can see the accounts of public figures with extensive media reach, such as the President of Colombia (@juanmansantos) and the Malaysian Minister of Sport (@khairykj). The German Football League (@bundelisga_de) and the Getty Images account for sport (@gettysport) can also be found, among others. The accounts of journalists and bloggers (Class 5), and those of event-related institutions (Class 6), are also visible in this ranking. The only cyclist to appear in the top 25 is @markcavendish, with 1,280,000 followers.
Both rankings offer potentially useful information to those companies considering sponsoring an event (Demir and Söderman 2015). Upon choosing an athlete or institution to sponsor, they should consider not only the number of followers, but also to what extent the institution or athlete is mentioned (indegree), a signal of the interest they spark in other users on the network. For instance, the cyclist with the greatest number of followers is the first one in the indegree ranking (@markcavendish), being the exception. The rest of the cyclists who appear in the indegree ranking do not even reach 400,000 followers, in comparison to the 1,280,000 followers attracted by @markcavendish. The cyclist with the lowest number of followers is @sebastianmorav (1497) and occupies a higher position than @eliaviviani in the indegree ranking, with even 30,926 followers more than @sebastianmorav. In a sporting event, it may be that the results obtained by the athlete can greatly influence the number of mentions received. This could be the case of @sebastianmorav who won two medals (one gold and one bronze). These results show a certain democracy in this social media platform, as users great and small have the opportunity to influence the community (Cha et al. 2010; Hambrick and Pegoraro 2014).

4.4. Influential Users by Activity

The variables that make up the activity dimension are outdegree and number of tweets. After comparing user rankings for each variable (Table 4), we see that only 14 accounts appear in both. In the outdegree ranking, 10 of the 25 profiles belong to fans or people unknown to the public at large (Class 3), thereby a priori lacking any significance. Next are the event-related organisations, (Class 6), which appear in this ranking due to their prominent role in promoting the event. Then, there are the cycling-related media outlets (Class 4). Indeed, the top two accounts in this ranking belong to this category (@groupiecam and @fixedgearfever). Lastly, a journalist specialised in cycling (Class 5) and lesser-known general media outlets (Class 2), such as @actussportvideo and @germansportnews, round out the list. Anecdotally speaking, we should mention @velodromomed, a Class 7 account created to call for the construction of a velodrome in the Colombian city of Medellin. This ranking stands out for its large variety of accounts. Every class appears except Class 1 (athletes). One could say that the variable outdegree makes lesser-known accounts more visible.
In the number of tweets variable ranking, the most active account is @robayocolombia, a cycling enthusiast from Colombia. The following three most active accounts belong to Class 4 cycling-related media outlets: @pelotonwatch, @fixedgearfever, and @groupiecam. Related institutions (Class 6) are the predominant account type in this ranking, with @britishcycling and @trackworlds leading the pack. Then, cycling-related media outlets (Class 4) and journalists and bloggers (Class 5) each have two accounts in the top 25, the former represented by @ciclo21 and @cyclismactu and the latter by @_pigeons_ and @twowheeledtank. Fans also appear in this ranking (@robayocolombia, @realdeanporter, @davidverral, and @kerrrrrryyy), but to a lesser extent than in others. The only general media account to appear in the top 25 is @gazettedessport.
The fact that the cyclists fail to appear in these rankings, as opposed to those determined by popularity, makes sense given that they are focused on the championships and do not engage in Twitter. These results contrast with those obtained by Kassing and Sanderson (2010) where cyclists interacted with their fans during the Giro d’Italia. Athletes provided commentary and opinions, fostered interactivity, and cultivated insider perspectives for fans on Twitter. Something similar happens in electoral campaigns, during which candidates remain quite active (Agre 2002; Dahlgren 2005; Small 2011). However, in some top-level competitions, the national committees or federations impose social media limits on their athletes. At times, even the event organisers impose such limits or prevent athletes from mentioning brands that compete with those of the event’s official sponsors.
Consequently, as in the case of the study, Twitter activity falls to the media outlets reporting on the event, as well as the participating federations and organisations. The elevated positions occupied by @trackworlds and @leevalleyvp in the outdegree ranking coincide with the findings of Hambrick (2012), in that the national race organiser used a combination of messages, while focusing more on interactions with others. Fans perform the important task of mentioning other users, above all the cyclists, serving as the championships’ commentators. The identification of these active users can provide organisations with an opportunity to co-create added value to the fan experience (Koenig-Lewis et al. 2018; Kolyperas et al. 2018). Given the importance of lesser-known accounts in this dimension, it could be an example of how sporting events can be used to build community networks thanks to social capital also in the digital environment (Misener and Mason 2006; Hofer and Aubert 2013). Nonetheless, outdegree identifies influential potentials since it would be necessary to analyse the effect of their activity on others. Finally, comparing the number of followers and number of tweets rankings, @teamgb is the only account which appears in both. In addition, also comparing the number of followers of the accounts of the activity dimension, we can see that a higher number of followers is not translated into a higher number of tweets or outdegree. This is consistent with the results of Abeza et al. (2014) and Gibbs et al. (2014). They found that a higher number of followers does not automatically imply that an organisation is more active on Twitter.

4.5. Influential Users by Authority

In the authority dimension, we analysed the variables eigencentrality and PageRank. Table 5 shows 19 accounts appearing in both variables’ rankings, the greatest number of any dimension. One possible explanation is the high correlation between these two variables compared with those of the other dimensions. An analysis of the eigencentrality variable reveals that 16 cyclists (Class 1), as well as seven event-related institutions (Class 6), appear in this ranking. The top four positions are held by @britishcycling, the cyclists @markcavendish and @officialwiggins (the official Twitter page of Sir Bradley Wiggins’s cycling team), and @uci_track (the official account for all UCI Track Cycling events). England, Australia, Italy, Spain, Colombia, Germany and Malaysia all have cyclists representing them in this ranking. The athletes are the nexus between the distinct groups and their cluster, thereby making it possible to transmit information to the latter (Rogers 2010). The accounts of the Track Cycling World Championships’ organisers and participants also serve as a nexus between the groups they influence. The British media outlets (Class 2) that broadcasted the event (@bbcsport @eurosportuktv) round out the top 25 users by authority. For a sporting event, the eigencentrality variable could provide a great deal of information regarding the different clusters within a social network.
In the PageRank variable ranking, the predominant accounts in the Track Cycling World Championships also belong to the cyclists (13 accounts, Class 1) and the event organisers (eight accounts, Class 6). Nonetheless, the top three spots are held by @trackworlds, @britishcycling, and @uci_track, followed by the cyclists @markcavendish and @officialwiggins. The @bbcsport and @eurosportuktv accounts (Class 2) also have a high PageRank, as do the cycling-related journalism accounts @bicigoga and @mundociclistico, Classes 5 and 4, respectively. The user with the top PageRank is @trackworlds. This result is relevant given that @trackworlds has more back links (1924) than any other user. As Naraine et al. (2016) point out, sport organisations emerge as highly connected and as powerful stakeholders.
In terms of authority within the mentions network, Table 5 shows the best-connected users. In calculating PageRank, whether the user is mentioned or not affects the value (directed network), whereas eigencentrality ignores this difference (undirected network). Despite this difference, many users appear in both tables, and their ranking therein is quite similar. Table 5 shows the greater weight of the athletes and institutions in the Twitter conversation. These results are similar to those obtained by Yan et al. (2018b) in the 2017 UEFA (Union of European Football Associations) Champions League Final. Perhaps this alignment highlights the key role played by teams (in this case, the national institution) in cycling, which might otherwise seem to be an individual sport. This emergent feature of the Twitter conversation suggests that users admire the national team as much as the cyclists themselves. Therefore, both (national teams and cyclists) have to pay attention to their Twitter accounts in order to develop stronger relationships and to elicit greater engagement with users and fans on social media. Particularly, cyclists should ensure they tweet content aligned with their desired personal brand (Kunkel et al. 2018).
Finally, we should highlight the role played by different media. The two channels that broadcasted the event (@bbcsport and @eurosportuktv) appear in indegree, eigencentrality and PageRank rankings. However, they do not feature in the activity dimension. In the outdegree variable, the media @actusportvideo (French) and @germansportnews (German) appear. In the number of tweets variable, only the Italian account @gazettedessport becomes visible. In number of followers, @bbcsport occupies the second place. Consequently, broadcasting the sporting event is not translated into being the most active media account on Twitter. This active role is played mainly by Internet-only sports media and bloggers specialised in cycling, in other words, non-traditional media accounts. These results contrast with those achieved by Clavio et al. (2012) who found a high percentage of interactivity, both inbound and outbound, in traditional and non-traditional media accounts. This may be because we are analysing different sports. Clavio et al. (2012) analysed the social network of a Big Ten American football team’s Twitter community, a sport that arouses great interest in the media, while we analysed the UCI Track Cycling World Championships, a niche sport that does not generate much interest in the media.

5. Implications

In this research, we sought to identify the influential Twitter users during the 2016 Track Cycling World Championships (#TWC2016) in terms of the dimensions of popularity, activity, and authority. Each dimension is evaluated by distinct variables. In doing so, this study provides several contributions to scholarship. First, using a rank correlation coefficient to compare variables, we examine the degree to which different variables agree, and consecutively, what different dimensions of influence might exist. Second, using a qualitative analysis of the top 25 influential users for every variable, we obtain the different key actors in the #TWC2016 community on Twitter. In this way, we relate mathematical variables of the SNA and variables offered by Twitter and Google with the dimensions of influence in a global conversation on Twitter during a sporting event. Across the variables indegree (popularity dimension), eigencentrality, and PageRank (authority dimension), the most influential user accounts are largely the same, with the top ranked accounts belonging to cyclists and event-related institutions. National teams are also identified as influential in these dimensions. A possible explanation is the high rank correlation among the three variables. This result could be understood as logical given that these users are the sporting event’s major players. They are the true protagonists of the event. Second, the variables outdegree and number of tweets (activity dimension) are positively correlated, but to a lesser extent than indegree, eigencentrality and PageRank. In the outdegree variable, the top-ranked accounts belong to fans and event-related institutions, whereas in number of tweets, a predominant number of accounts belong to event-related institutions, specialised media outlets, and journalists. Number of followers variable correlates quite low with the other variables. In this ranking, the most important actors are general media and other popular users accounts not related to the sporting event. Actually, this variable has the highest number of users of Class 2 (media) and Class 7 (others).
At this point, we can say that different variables, sensitive to different dimensions of influence, do indeed identify users differently. We could argue that indegree could perhaps be considered as a variable to measure authority with eigencentrality and PageRank in the conversation around a sporting event. However, being mentioned is also a sign of popularity during the realisation of the event. Number of followers points out different actors not related directly to the event. So, it could be considered as a variable to measure the dimension of popularity but in general terms, not exclusively associated with the sporting event. Typically, the most important variables used in sport management for assessing influence are number of followers (Hambrick 2012; Hambrick and Sanderson 2013; Hambrick and Pegoraro 2014), number of tweets (Hambrick and Pegoraro 2014) and different measures of centrality (Wäsche 2015; Naraine and Parent 2016; Naraine et al. 2016; Yan et al. 2018b). We can observe that different variables identify different kinds of Twitter players. The reason that some variables vary so greatly is that the components of influence are very different. This is consistent with Carter (2016), since he explains how influence assessed by network extensive measures is much more complex than influence understood by marketing firms and social media influencers. Influence is a contextualised phenomenon. From the perspective of the Two-Step Flow Hypothesis, if we think only of those who actively engage, we are already limiting ourselves to likely event-related institutions, specialised media outlets and journalists. We rule out the cyclists, the current major players, as they do not tweet during the races. However, they are considered authorities and are mentioned frequently in the Twitter conversation. Therefore, belonging to a certain user account class, such as journalist, athlete, media outlet, or related institution, does not guarantee that account the influencer status during the sporting event if it fails to participate (actively or passively) in the conversation.
This study also provides some managerial implications, as this research is useful to market researchers interested in identifying who influence most in the Twitter conversation. First, the accounts of the most mentioned and most authoritative cyclists and national teams could be particularly relevant for those companies interested in event sponsorship, brand identification and transmitting their corporate values. Both (national teams and cyclists) should pay attention to their Twitter accounts as part of their strategic communication due to their impact in the conversation. Second, promoting the event is not the cyclists’ responsibility, given that they are participating in the races. Rather, this responsibility should fall upon the event-related institutions, the specialised media outlets, and the fans. The information provided by the fans can help organisations better understand the fan experience and to target the most influential fans for relationship building and to stimulate interaction. Third, if we want to spread a particular message, the influencers can be chosen better depending on the type of audience to be reached. For example, if a more general audience is chosen, the variable number of followers provides a series of accounts not directly related to cycling that allows reaching a wider audience. On the contrary, the rest of the variables we have explored in this study provide accounts more related to the world of sports and cycling, thus addressing a more specific audience. Finally, the media that broadcast the sporting event play an important role in the Twitter conversation, although they may not have been the most active.

6. Limitations and Future Research

Although this research has provided insight into determining influential users within a sporting discussion network on Twitter, it has some limitations that should be considered for future research. First, the data used in this study comes exclusively from a cycling event (2016 UCI Track Cycling World Championships), which limits the generalisation of the results to other cycling events and to other kinds of sports. Track cycling is considered a niche sport in comparison with other categories of bicycle racing or other sports. This research is the analysis of a case study and results are specific to this single network. Maybe, results could be extended or compared to other niche sports. Second, this research does not take into account the dynamic nature of social media. Things change from one moment to the next. The sporting discussion network is different at the beginning of races and during the end. Abeza et al. (2014), Yan et al. (2018a) and Yan et al. (2018b) obtained different results depending on the period of time analysed. Related to this point, the current analysis is focused on the entire picture of the whole interaction.
As future lines of research, it would be interesting to extend a similar approach comparing different sporting events to determine if they have the same influence pattern. The comparison could be performed both inside and outside the cycling world. Some research questions to answer in the future could be if the network operates similarly for other cycling events (for example, the mentioned Giro d’Italia) or, comparatively, there are differences in networks across events. Even different social media platforms could be compared. In this case, we analyse Twitter but Facebook or Instagram are also relevant (Anagnostopoulos et al. 2018). The temporary dimension should also be included to compare the network in different periods of time (i.e., pre-, during, and post-). Thus, it could be analysed how the network evolves over the duration of the event (Chew et al. 2017). An important point is whether the sports to be compared are considered niche sports or not. Maybe differences are found based on the very nature of the type of sport (Perić 2018).
Although specific to our network, these results are useful for future studies of influence on Twitter and potentially other social media platforms. There are many opinion leaders, likely far more than we examined in our top 25 qualitative analysis. Nevertheless, it is not only important to know who these opinion leaders are, but also to assess the indicators by which we can carry out this identification. In an exploratory way, we have examined multiple variables to measure the different dimensions of influence. Other variables and dimensions could be included and discussed. For instance, those variables related to the density of the network (homophily and heterophily) (McPherson et al. 2001). The process of identifying the influential users (how and who) presents an interesting avenue for future research. Another possible line of research would be to create a model based on the established dimensions and variables, assigning a weight to each one to find the most influential account during an event. This would be possible with multi-criteria decision methods, such as, Analytic Hierarchy Process (AHP) or Analytic Network Process (ANP) (Saaty 1992). Such a model could effectively replace the tools based on unclear parameters used by companies to identify the most influential user.

7. Conclusions

This study used multiple variables to measure the different dimensions of influence in order to identify the most influential members of the #TWC2016 community on Twitter. In terms of popularity, results are different depending on the variable considered. Indegree highlights cyclists and institutions related to the sporting event as the most influential users. Instead, number of followers points out general media and other popular user accounts not related to the sporting event. When activity is considered, the related institutions are still prominent, but media outlets and journalists specialised in cycling and fans are integrated into the lists of most influential. Finally, considering the authority dimension, cyclists and institutions related to the sporting event stand out again. No single variable assessed is sufficient to identify the different kinds of influentials found within a sporting discussion network on Twitter during an event. The choice of some influencers or others will depend on the objectives pursued.

Supplementary Materials

The following are available online at https://riunet.upv.es/handle/10251/118266, Table S1: Dataset Twitter—2016 UCI Track Cycling World Championships. doi:10.4995/Dataset/10251/118266.

Author Contributions

Conceptualization, J.M.L.-P. and A.B.-P.; methodology, T.B.; software, J.M.L.-P.; validation, T.B.; formal analysis, A.B.-P.; writing—original draft preparation, J.M.L.-P.; writing—review and editing, T.B. and A.B.-P.

Funding

This research received no external funding.

Conflicts of Interest

The authors declare no conflict of interest.

References

  1. Abeza, Gashaw, Ann Pegoraro, Michael L. Naraine, Benoît Séguin, and Norm O’Reilly. 2014. Activating a global sport sponsorship with social media: an analysis of TOP sponsors, Twitter, and the 2014 Olympic Games. International Journal of Sport Management and Marketing 15: 184–213. [Google Scholar] [CrossRef]
  2. Agre, Philip E. 2002. Real-time politics: The internet and the political process. The Information Society 18: 311–31. [Google Scholar] [CrossRef]
  3. Anagnostopoulos, Christos, Petros Parganas, Simon Chadwick, and Alex Fenton. 2018. Branding in pictures: using Instagram as a brand management tool in professional team sport organisations. European Sport Management Quarterly 18: 413–38. [Google Scholar] [CrossRef]
  4. Barabási, Albert-László, and Réka Albert. 1999. Emergence of scaling in random networks. Science 286: 509–12. [Google Scholar] [PubMed]
  5. Barnes, John A., and Frank Harary. 1983. Graph theory in network analysis. Social Networks 5: 235–244. [Google Scholar] [CrossRef]
  6. Bastian, Mathieu, Sebastien Heymann, and Mathieu Jacomy. 2009. Gephi: an open source software for exploring and manipulating networks. Paper presented at the Third International AAAI Conference on Weblogs and Social Media, San José, CA, USA, May 17–20; pp. 17–20. [Google Scholar]
  7. Bonacich, Phillip. 1972. Factoring and weighting approaches to status scores and clique identification. Journal of Mathematical Sociology 2: 113–30. [Google Scholar] [CrossRef]
  8. Borgatti, Stephen P., and Martin G. Everett. 2006. A graph-theoretic perspective on centrality. Social Networks 28: 466–84. [Google Scholar] [CrossRef]
  9. Borgatti, Stephen P., Martin G. Everett, and Jeffrey C. Johnson. 2013. Analyzing Social Networks. Los Angeles: Sage. [Google Scholar]
  10. Bouguessa, Mohamed, and Lofti B. Romdhane. 2015. Identifying authorities in online communities. ACM Transactions on Intelligent Systems and Technology 6: 1–23. [Google Scholar] [CrossRef]
  11. Brosius, Hans-Bernd, and Gabriel Weimann. 1996. Who sets the agenda: Agenda-setting as a two step flow. Communication Research 23: 561–80. [Google Scholar] [CrossRef]
  12. Carter, Daniel. 2016. Hustle and Brand: The Sociotechnical Shaping of Influence. Social Media + Society 2: 1–12. [Google Scholar] [CrossRef]
  13. Cha, Meeyoung, Hamed Haddadi, Fabricio Benevenuto, and Krishna P. Gummadi. 2010. Measuring user influence in Twitter: The million follower fallacy. Paper presented at the 4th International AAAI Conference on Weblogs and Social Media, Washington, DC, USA, May 23–26; pp. 10–17. [Google Scholar]
  14. Chadwick, Andrew. 2013. The Hybrid Media System: Politics and Power. Oxford: Oxford University Press. [Google Scholar]
  15. Chew, Song, Erica Metheney, and Thomas Teague. 2017. Modelling and simulation of the formation of social networks. Social Sciences 6: 79. [Google Scholar] [CrossRef]
  16. Clavio, Galen, Lauren M. Burch, and Evan L. Frederick. 2012. Networked fandom: Applying systems theory to sport Twitter analysis. International Journal of Sport Communication 5: 522–38. [Google Scholar] [CrossRef]
  17. Cleland, Jamie. 2014. Racism, Football Fans, and Online Message Boards: How Social Media Has Added a New Dimension to Racist Discourse in English Football. Journal of Sport & Social Issues 38: 415–31. [Google Scholar]
  18. Dahlgren, Peter. 2005. The internet, public spheres, and political communication: Dispersion and deliberation. Political Communication 22: 147–62. [Google Scholar] [CrossRef]
  19. Dart, Jon. 2014. New media, professional sport and political economy. Journal of Sport & Social Issues 38: 528–47. [Google Scholar]
  20. Del Campo-Ávila, José, Nathalie Moreno-Vergara, and Mónica Trella-López. 2013. Bridging the gap between the least and the most influential Twitter users. Procedia Computer Science 19: 437–44. [Google Scholar]
  21. Delia, Elizabeth B., and Cole G. Armstrong. 2015. #Sponsoring the #FrenchOpen: An examination of social media buzz and sentiment. Journal of Sport Management 29: 184–99. [Google Scholar]
  22. Demir, Robert, and Sten Söderman. 2015. Strategic sponsoring in professional sport: a review and conceptualization. European Sport Management Quarterly 15: 271–300. [Google Scholar] [CrossRef]
  23. Dubois, Elizabeth, and Devin Gaffney. 2014. The multiple facets of influence: Identifying political influentials and opinion leaders on Twitter. American Behavioral Scientist 58: 1260–77. [Google Scholar] [CrossRef]
  24. Filo, Kevin, Daniel Lock, and Adam Karg. 2015. Sport and social media research: A review. Sport Management Review 18: 166–81. [Google Scholar] [CrossRef]
  25. Florez, José L. 2008. Análisis de redes sociales: El poder de la influencia [Social network analysis: The power of influence]. Harvard Deusto Márketing y Ventas 86: 62–71. [Google Scholar]
  26. Freberg, Karen, Kristin Graham, Karen McGaughey, and Laura A. Freberg. 2011. Who are the social media influencers? A study of public perceptions of personality. Public Relations Review 37: 90–92. [Google Scholar] [CrossRef]
  27. Freeman, Linton C. 1979. Centrality in social networks: Conceptual clarification. Social Networks 1: 215–39. [Google Scholar] [CrossRef]
  28. Freeman, Linton C., Stephen P. Borgatti, and Douglas R. White. 1991. Centrality in valued graphs: a measure of betweenness based on network flow. Social Networks 13: 141–54. [Google Scholar] [CrossRef]
  29. Gayo-Avello, Daniel. 2013. Nepotistic relationships in Twitter and their impact on rank prestige algorithms. Information Processing and Management 49: 1250–80. [Google Scholar] [CrossRef]
  30. Gibbs, Chris, Norm O’Reilly, and Michelle Brunette. 2014. Professional team sport and Twitter: Gratifications sought and obtained by followers. International Journal of Sport Communication 7: 188–213. [Google Scholar] [CrossRef]
  31. Hambrick, Marion E. 2012. Six degrees of information: Using social network analysis to explore the spread of information within sport social networks. International Journal of Sport Communication 5: 16–34. [Google Scholar] [CrossRef]
  32. Hambrick, Marion E., and Tara Q. Mahoney. 2011. “It’s incredible—Trust me”: Exploring the role of celebrity athletes as marketers in online social networks. International Journal of Sport Management and Marketing 10: 161–79. [Google Scholar] [CrossRef]
  33. Hambrick, Marion E., and Ann Pegoraro. 2014. Social Sochi: using social network analysis to investigate electronic word-of-mouth transmitted through social media communities. International Journal of Sport Management and Marketing 15: 120–40. [Google Scholar] [CrossRef]
  34. Hambrick, Marion E., and Jimmy Sanderson. 2013. Gaining primacy in the digital network: Using social network analysis to examine sports journalists’ coverage of the Penn State football scandal via Twitter. Journal of Sports Media 8: 1–18. [Google Scholar] [CrossRef]
  35. Hambrick, Marion E., Jason M. Simmons, Greg P. Greenhalgh, and T. Christopher Greenwell. 2010. Understanding professional athletes’ use of Twitter: A content analysis of athlete tweets. International Journal of Sport Communication 3: 454–71. [Google Scholar] [CrossRef]
  36. Hofer, Matthias, and Viviane Aubert. 2013. Perceived bridging and bonding social capital on Twitter: Differentiating between followers and followees. Computers in Human Behavior 29: 2134–42. [Google Scholar] [CrossRef]
  37. Hull, Kevin, and Annelie Schmittel. 2015. A fumbled opportunity? A case study of Twitter’s role in concussion awareness opportunities during the Super Bowl. Journal of Sport & Social Issues 39: 78–94. [Google Scholar]
  38. Hutchins, Brett, and David Rowe. 2010. Reconfiguring Media Sport for the Online World: An Inquiry into “Sports News and Digital Media”. International Journal of Communication 4: 696–718. [Google Scholar]
  39. Kaplan, Andreas M., and Michael Haenlein. 2010. Users of the world, unite! The challenges and opportunities of social media. Business Horizons 53: 59–68. [Google Scholar] [CrossRef]
  40. Kassing, Jeffrey W., and Jimmy Sanderson. 2010. Fan–athlete interaction and Twitter tweeting through the Giro: A case study. International Journal of Sport Communication 3: 113–28. [Google Scholar] [CrossRef]
  41. Katz, Elihu. 1957. The two-step flow of communication: An up-to-date report on an hypothesis. Public Opinion Quarterly 21: 61–78. [Google Scholar] [CrossRef]
  42. Katz, Elihu, and Paul F. Lazarsfeld. 1955. Personal Influence: The Part Played by People in the Flow of Mass Communications. New York: Free Press. [Google Scholar]
  43. Khan, Hikmat U., Ali Daud, Umer Ishfaq, Tehmina Amjad, Naif Aljohani, Rabeeh A. Abbasi, and Jalal S. Alowibdi. 2017. Modelling to identify influential bloggers in the blogosphere: A survey. Computers in Human Behavior 68: 64–82. [Google Scholar] [CrossRef]
  44. Knoke, David, and James H. KuKlinski. 1982. Network Analysis. Sage University Paper series on Quantitative Applications in the Social Sciences, No. 28. Beverly Hills: SAGE Publications. [Google Scholar]
  45. Koenig-Lewis, Nicole, Yousra Asaad, and Adrian Palmer. 2018. Sports events and interaction among spectators: examining antecedents of spectators’ value creation. European Sport Management Quarterly 18: 193–215. [Google Scholar] [CrossRef]
  46. Kolyperas, Dimitrios, Georgios Maglaras, and Leigh Sparks. 2018. Sport fans’ roles in value co-creation. European Sport Management Quarterly. Advance Online Publication. [Google Scholar] [CrossRef]
  47. Kunkel, Thilo, Matthew Walker, and Courtney M. Hodge. 2018. The influence of advertising appeals on consumer perceptions of athlete endorser brand image. European Sport Management Quarterly. Advance Online Publication. [Google Scholar] [CrossRef]
  48. Lahuerta-Otero, Eva, and Rebeca Cordero-Gutiérrez. 2016. Looking for the perfect tweet. The use of data mining techniques to find influencers on Twitter. Computers in Human Behavior 64: 575–83. [Google Scholar] [CrossRef]
  49. Lewin, Kurt. 1939. Field theory and experiment in social psychology: Concepts and methods. American Journal of Sociology 44: 868–96. [Google Scholar] [CrossRef]
  50. Lozares, Carlos. 1996. La teoría de redes sociales [Social network theory]. Revista de Sociología 48: 103–26. [Google Scholar]
  51. McNeill, Andrew R., and Pam Briggs. 2014. Understanding Twitter influence in the health domain. In WWW ’14 Companion, Proceedings of the 23rd International Conference on World Wide Web. New York: ACM, pp. 673–78. [Google Scholar]
  52. McPherson, Miller, Lynn Smith-Lovin, and James M. Cook. 2001. Birds of a feather: Homophily in social networks. Annual Review of Sociology 27: 415–44. [Google Scholar] [CrossRef]
  53. Meenaghan, Tony, Damien McLoughlin, and Alan McCormack. 2013. New challenges in sponsorship evaluation actors, new media, and the context of praxis. Psychology & Marketing 30: 444–60. [Google Scholar]
  54. Misener, Laura, and Daniel S. Mason. 2006. Creating community networks: Can sporting events offer meaningful sources of social capital? Managing Leisure 11: 39–56. [Google Scholar] [CrossRef]
  55. Morone, Flaviano, and Hernán A. Makse. 2015. Influence maximization in complex networks through optimal percolation. Nature 524: 65–68. [Google Scholar] [CrossRef] [PubMed] [Green Version]
  56. Naraine, Michael L., and Milena M. Parent. 2016. Illuminating centralized users in the social media ego network of two national sport organizations. Journal of Sport Management 30: 689–701. [Google Scholar] [CrossRef]
  57. Naraine, Michael L., Jessie Schenk, and Milena M. Parent. 2016. Coordination in international and domestic sports events: Examining stakeholder network governance. Journal of Sport Management 30: 521–37. [Google Scholar] [CrossRef]
  58. Newman, Mark E. J. 2010. Networks: An Introduction. Oxford: Oxford University Press. [Google Scholar]
  59. Norris, Pippa, and John Curtice. 2008. Getting the message out: A two-step model of the role of the internet in campaign communication flows during the 2005 British general election. Journal of Information Technology & Politics 4: 3–13. [Google Scholar]
  60. Page, Lawrence, and Sergey Brin. 1998. The Anatomy of a Large-Scale Hypertextual Web Search Engine. Paper presented at the Seventh International Conference on the World Wide Web, Brisbane, Australia; pp. 107–17. [Google Scholar]
  61. Pegoraro, Ann. 2010. Look who’s talking—Athletes on Twitter: A case study. International Journal of Sport Communication 3: 501–14. [Google Scholar] [CrossRef]
  62. Perić, Marko. 2018. Estimating the perceived socio-economic impacts of hosting large-scale sport tourism events. Social Sciences 7: 176. [Google Scholar] [CrossRef]
  63. Quatman, Catherine, and Packianathan Chelladurai. 2008a. Social network theory and analysis: A complementary lens for inquiry. Journal of Sport Management 22: 338–60. [Google Scholar] [CrossRef]
  64. Quatman, Catherine, and Packianathan Chelladurai. 2008b. The social construction of knowledge in the field of sport management: A social network perspective. Journal of Sport Management 22: 651–76. [Google Scholar] [CrossRef]
  65. Riquelme, Fabián, and Pablo González-Cantergiani. 2016. Measuring user influence on Twitter: A survey. Information Processing and Management 52: 949–75. [Google Scholar] [CrossRef]
  66. Rogers, Everett M. 2010. Diffusion of Innovations, 4th ed. New York: Free Press. [Google Scholar]
  67. Saaty, Thomas L. 1992. Decision Making for Leaders, 2nd ed. Pittsburg: RWS Publications. [Google Scholar]
  68. Santesmases, Miguel. 2009. Dyane versión 4: Diseño y análisis de encuestas en investigación social y de mercados [Dyane Version 4: Design and Analysis of Surveys in Social and Market Research]. Madrid: Pirámide. [Google Scholar]
  69. Santomier, James. 2008. New media, branding and global sports sponsorship. International Journal of Sports Marketing and Sponsorship 10: 9–22. [Google Scholar] [CrossRef]
  70. Scott, John. 2017. Social Network Analysis: A Handbook, 4th ed. Croydon: SAGE Publications. [Google Scholar]
  71. Small, Tamara A. 2011. What the hashtag? A content analysis of Canadian politics on Twitter. Information, Communication & Society 14: 872–95. [Google Scholar]
  72. Sousa, Daniel, Luís Sarmento, and Eduarda Mendes. 2010. Characterization of the Twitter @replies network. In SMUC ’10, Proceedings of the 2nd International Workshop on Search and Mining User-Generated Contents. New York: ACM, pp. 63–70. [Google Scholar]
  73. Towner, Terri, and Caroline L. Munoz. 2016. Boomers versus millennials: Online media influence on media performance and candidate evaluations. Social Sciences 5: 56. [Google Scholar] [CrossRef]
  74. Turner, Graeme. 2014. Understanding Celebrity, 2nd ed. Croydon: SAGE Publications. [Google Scholar]
  75. Veglis, Andreas, and Theodora A. Maniou. 2018. The mediated data model of communication flow. KOME: An International Journal of Pure Communication Inquiry 6: 32–43. [Google Scholar] [CrossRef]
  76. Wäsche, Hagen. 2015. Interorganizational cooperation in sport tourism: A social network analysis. Sport Management Review 18: 542–54. [Google Scholar] [CrossRef]
  77. Wäsche, Hagen, Geoff Dickson, Alexander Woll, and Ulrik Brandes. 2017. Social network analysis in sport research: an emerging paradigm. European Journal for Sport and Society 14: 138–65. [Google Scholar] [CrossRef]
  78. Wilson, Christopher, and Alexandra Dunn. 2011. The Arab Spring|Digital Media in the Egyptian Revolution: Descriptive Analysis from the Tahrir Data Set. International Journal of Communication 5: 1248–72. [Google Scholar]
  79. Yamamoto, Masahiro, Seungahn Nah, and Deborah Chung. 2017. U.S. Newspaper Editors’ Ratings of Social Media as Influential News Sources. International Journal of Communication 11: 684–700. [Google Scholar]
  80. Yan, Grace, Ann Pegoraro, and Nicholas M. Watanabe. 2018a. Student-Athletes’ Organization of Activism at the University of Missouri: Resource Mobilization on Twitter. Journal of Sport Management 32: 24–37. [Google Scholar] [CrossRef]
  81. Yan, Grace, Nicholas M. Watanabe, Stephen L. Shapiro, Michael L. Naraine, and Kevin Hull. 2018b. Unfolding the Twitter scene of the 2017 UEFA Champions League Final: social media networks and power dynamics. European Sport Management Quarterly. [Google Scholar] [CrossRef]
  82. Yu, Yang, and Xiao Wang. 2015. World Cup 2014 in the Twitter World: A big data analysis of sentiments in U.S. sports fans’ tweets. Computers in Human Behavior 48: 392–400. [Google Scholar] [CrossRef]
Figure 1. Interaction graph during the Twitter conversation with the hashtag #TWC2016.
Socsci 08 00141 g001
Table 1. Information about the data.
ItemNumber
Tweets55,572
Users20,175
Retweets35,667
Mentions28,176
Nodes23,339
Edges66,444
Table 2. Spearman’s ranks between variables.
First MetricPaired MetricSpearman’s RankProbability
IndegreeNumber of followers−0.4900.000 **
IndegreeOutdegree−0.0220.001 **
IndegreeNumber of tweets0.6950.000 **
IndegreePageRank0.8180.000 **
IndegreeEigencentrality1.0000.000 **
OutdegreeNumber of followers0.1450.000 **
OutdegreeNumber of tweets0.6140.000 **
OutdegreePageRank0.5490.000 **
OutdegreeEigencentrality−0.0170.017 *
Number of followersNumber of tweets0.1800.000 **
Number of followersPageRank0.0590.000 **
Number of followersEigencentrality−0.4870.000 **
Number of tweetsPageRank0.9250.000 **
Number of tweetsEigencentrality0.6970.000 **
PageRankEigencentrality0.8200.000 **
Note: ** Significant at 1% (p < 0.01); * Significant at 5% (p < 0.05).
Table 3. Top 25 users by popularity.
RankIndegreeNumber of Followers
UserValueNumber of FollowersClassUserValueClass
1trackworlds192457496bbcnews6,232,2002
2britishcycling1842117,3686bbcsport5,352,9552
3markcavendish14531,280,0001juanmansantos4,348,0237
4uci_track131568176independent1,811,1682
5officialwiggins124351,5571aztecadeportes1,692,5412
6lauratrott31940306,0001gazzetta_it1,531,6052
7jasonkenny107613101,0001bundesliga_de1,397,8137
8fndogaviria56513,9321markcavendish1,280,0001
9teamgb531676,0426khairykj1,204,3867
10leevalleyvp46858916bild1,182,9222
11jondibben146643531juanpabloraba1,132,8045
12bbcsport3455,352,9952gettysport978,9407
13cyclingaus30527,5296casaleantonio771,6735
14uci_cycling290168,0026aierta739,4797
15mundociclistico25517,8214adidasuk735,4797
16azizulawang25344,8941chrishoy677,6325
17eurosportuktv24744,9652teamgb676,0426
18bicigoga242112,5675nos618,6432
19owaindoull22156521silvioluiz615,9845
20etixx_quickstep214175,9536clarebalding609,4735
21becksjames21323,5701teamsky580,0436
22sebastianmorav20714971bbc5live577,6982
23cvndsh18321,8517teamcanada545,4647
24skycycling17752,4496infopresidencia530,2767
25eliaviviani15732,4231telegraaf453,9572
Note: Accounts appearing in both rankings are highlighted in grey. Class: 1 = Cyclist participating in the event; 2 = Media (press, radio, TV…); 3 = Fans/Supporters; 4 = Media related to cycling (magazines, websites…); 5 = Journalists, bloggers, ex-cyclists; 6 = Related institutions (federations, cycling teams, organisations); 7 = Others.
Table 4. Top 25 users by activity.
RankOutdegreeNumber of Tweets
UserValueNumber of FollowersClassUserValueNumber of FollowersClass
1groupiecam168554Robayocolombia68226353
2fixedgearfever16712864Pelotonwatch55921,9994
3velodromomed1622557Fixedgearfever42012864
4robayocolombia14426353Groupiecam367554
5trackworlds12057496Britishcycling355117,3686
6leevalleyvp10758916Gazettedessport31744872
7realdeanporter10019693Trackworlds30457496
8_pigeons_8969265_pigeons_26169265
9britishcycling86117,3686Velodromomed2572557
10cyclismactu8115,5254Cyclingaus25627,5296
11ramonap1988793503Twowheeledtank24739645
12iflck687403uci_track23668176
13seigneurlouis672053Leevalleyvp22758916
14swaragency673763cyclogy_168907
15actusportvideo6660982Clubsforkids1522337
16tony_bobfan622803Kevinpersyn1472095
17cyclingaus6027,5296Realdeanporter12619693
18kolkwitzer602945davidverral124973
19davidverrall59973ciclo2112010,8334
20oidoracritica5915693Joanseguidor11841515
21uci_track5968176cyclismactu11615,5254
22aubondossard535425Velouk11520,2416
23germansportnews53492Aussielarry10911,9845
24carolynb66513763Teamgb107676,0426
25cyclogy_51907Kerrrrrryyy1028703
Note: Accounts appearing in both rankings are highlighted in grey. Class: 1 = Cyclist participating in the event; 2 = Media (press, radio, TV…); 3 = Fans/Supporters; 4 = Media related to cycling (magazines, websites…); 5 = Journalists, bloggers, ex-cyclists; 6 = Related institutions (federations, cycling teams, organisations); 7 = Others.
Table 5. Top 25 users by authority.
RankEigencentralityPageRank
UserValueNumber of FollowersClassUserValueNumber of FollowersClass
1britishcycling0.902117,3686trackworlds0.03257496
2markcavendish0.7331,280,0001britishcycling0.025117,3686
3uci_track0.70468176uci_track0.01968176
4officialwiggins0.63651,5571markcavendish0.0191,280,0001
5lauratrott310.555306,0001officialwiggins0.01551,5571
6jasonkenny1070.394101,0001lauratrott310.013306,0001
7leevalleyvp0.37058916fndogaviria0.01013,9321
8fndogaviria0.35513,9321jondibben10.00843531
9jondibben10.34843531edwinavila1890.00882621
10cyclingaus0.28827,5296jasonkenny1070.008101,0001
11teamgb0.279676,0426leevalleyvp0.00858916
12bbcsport0.2335,352,9952cyclingaus0.00827,5296
13uci_cycling0.216168,0026teamgb0.005676,0426
14tennanto0.19783241bbcsport0.0055,352,9552
15becksjames0.18723,5701uci_cycling0.004168,0026
16eurosportuktv0.18544,9652owaindoull0.00356521
17annameares0.15431,3491eurosportuktv0.00344,9652
18kristinavogel0.15044281sebastianmorav0.00314971
19ed_clancy0.14746,6001azizulawang0.00344,8941
20eliaviviani0.14232,4231eliaviviani0.00332,4231
21stevenburke880.13512,6001tennanto0.00383241
22azizulawang0.13544,8941becksjames0.00323,5701
23cyclingnzl0.13144476bicigoga0.003112,5675
24sebastianmorav0.13014971skycycling0.00252,4496
25matthewglaetzer0.12810901mundociclistico0.00217,8214
Note: Accounts appearing in both rankings are highlighted in grey. Class: 1 = Cyclist participating in the event; 2 = Media (press, radio, TV…); 3 = Fans/Supporters; 4 = Media related to cycling (magazines, websites…); 5 = Journalists, bloggers, ex-cyclists; 6 = Related institutions (federations, cycling teams, organisations); 7 = Others.

