1. Introduction
Industry 4.0 is a name given to the recent tendency of automation, as well as data exchange, in various manufacturing technologies. It comprises of cyber physical systems, cognitive computing, cloud computing, and the Internet of things. It is generally referred to as the fourth industrial revolution. The key to every industrial revolution is improvement in productivity (
Herčko et al. 2015;
HuseyniÌ et al. 2017;
Stverkova and Pohludka 2018). Nowadays, a well-performing enterprise can be considered as one capable of using many opportunities, being adaptable to continual changes in the environment, and achieving better performance (
Rajnoha and Lesníková 2016). Organizations have achieved a higher profitability through the use of the steam engine, power, and the move from simple to computerized innovation. Most of the progressive methods of modern enterprise performance management share a strong strategic orientation of management focused on further business development. These progressive methods use highly sophisticated knowledge resulting from modern enterprise information technology, such as business intelligence, or the latest big data analytics (
Rajnoha and Lorincová 2015). The effect of Industry 4.0 is broader, and it influences not only production, but also indirect departments, particularly engineering procedures.
The fourth modern transformation, or Industry 4.0, causes extensive fluctuations in industrial production (
Kagermann et al. 2013). Starting from the German strategic initiative, Industry 4.0 is presently a major frame of a few countries from the U.S., Europe, and Asia (
Kagermann et al. 2013;
Ślusarczyk 2018). It has worked quickly in the creation of advanced ideas (
Strandhagen et al. 2017); for instance, the Internet of things (IoT), big data, smart factory, cyber physical systems, and interoperability rely upon a prompt change in the outlook in mechanical creation. Nowadays, most production and services companies are moving towards higher technology by introducing Industry 4.0 ideas (
Oláh et al. 2018a). Production and services industries are the backbone of every country, having significant a contribution to a nation’s economy (ibid). However, the production and services sector of Pakistan has not achieved significant growth in current years due to low technological improvements (
Khan and Khan 2010).
The textile industry is one of the major production sectors in Pakistan. However, it has been facing various challenges related to technology. Production has been influenced negatively due to a decrease in technological advancement, leading to an effect in overall performance. The Pakistan textile industry contributes approximately more than 60 percent (U.S.
$9.6 billion) to the total exports of the country. Despite this, the industry is facing a extensive decline in its growth rate (
Khan and Khan 2010).
Figure 1 shows the decrease in textile exports for the previous six years.
Pakistan’s textile exports have been on a massive and consistent decline for a long period (
Khan and Khan 2010). This has caused a drop in Pakistan’s exports to a new six-year low, and a gross domestic product (GDP) growth reaching only 4.24% in 2015 (
Pakistan Bureau of Statistics 2016). Pakistan’s GDP growth is significantly lagging behind other frontier markets in Asia, such as Cambodia, Bangladesh, Vietnam, and Laos.
Apart from the production sector, the services sector of Pakistan is also not performing up to standard (
Shamsi and Syed 2015). The logistics industry of Pakistan is facing different issues (
Hameed et al. 2018) due to a lack of technological development, as Pakistan’s electronic commerce market is very volatile and the logistics industry is struggling to cope with various problems (
Shamsi and Syed 2015). Additionally, the logistics industry is lacking as compared to other neighboring countries, namely China, India, and Malaysia (
Hameed et al. 2018).
However, all the issues in the production and services industries of Pakistan can be resolved through introduction of Industry 4.0 technologies. It is expected that Industry 4.0 related technologies, such as big data, smart factory, cyber physical systems (CPS), the Internet of things (IoT), and interoperability, have the ability to resolve various issues through modern technologies.
According to prior studies (see for instance:
Brecher 2015;
Schuh et al. 2014), four enablers of productivity growth under Industry 4.0 include IT-globalization, single source of truth, automation, and cooperation (
Oláh et al. 2018b). These productivity enablers are important in both the production as well as the service industry. Industry 4.0 promotes production and services which automatically increase the overall performance of the production and service industries.
Figure 2 shows the mechanism of Industry 4.0, and the performance of the production and service industries.
Therefore, the objective of this research is to investigate the role of Industry 4.0 in the production and service sectors of Pakistan. However, the sub-objectives are given below:
To examine the role of five Industry 4.0 factors, namely big data, smart factory, cyber physical systems (CPS), the Internet of things (IoT), and interoperability, in production and service operations in the textile and logistics industries.
To examine the role of production and service operations in the enhancement of the textile and logistics industries’ performance.
The current research contributes to the body of knowledge by investigating key Industry 4.0 factors, which contribute significantly in the production and service sector. The scientific contribution of this survey-based exercise is to attain single summary statistics enabling rank discoveries in social sciences. These rank discoveries include having in-depth understanding of the role of Industry 4.0 factors affecting the production and service industry, along with their performance in emerging economies. Hence, through quantitative findings, a diverse range of groups, such as professionals working in the production and services industries, individuals associated with Industry 4.0, and social science scholars and researchers, would benefit from in-depth understanding of the relationship between the five factors and performance of the industries. Moreover, policy makers would be able to use the statistics to address the concerns of declining performance. Managers and professionals working in the production and service industries benefit from the study by having useful insight into the role of the factors of Industry 4.0 in demonstrating quality performance, hence systems and practices can be scientifically developed, reflecting scientific contribution. Therefore, the survey-based exercise provides statistics representing the overall functioning, systems, and practices of the industries, interlinked with the factors of Industry 4.0 shaping scientific development that reflect scientific contribution. This is one of the pioneer studies which examine the impact of Industry 4.0 on the textile and logistics industry, particularly in Pakistan.
2. Review of Literature
Industry 4.0 can be defined as an umbrella term, denoting a variety of recent concepts, as well as numerous linked disciplines within industry (
Lasi et al. 2014). The primary drivers of Industry 4.0 can be separated into two major aspects. In the first case, it is the mixture of quickly progressing technological expansions with the Internet of things (IoT), big data, cyber physical systems (CPS), smart factory, and interoperability. Such types of technologies may cause a paradigm shift within industrial production (
Lasi et al. 2014), and this can be further explained as technology push.
The other aspect is the demand from various manufacturing firms, particularly in different countries having high cost levels, to make oneself autonomous of high labor costs by exploiting new technology with the help of Industry 4.0 (
Strandhagen et al. 2018).
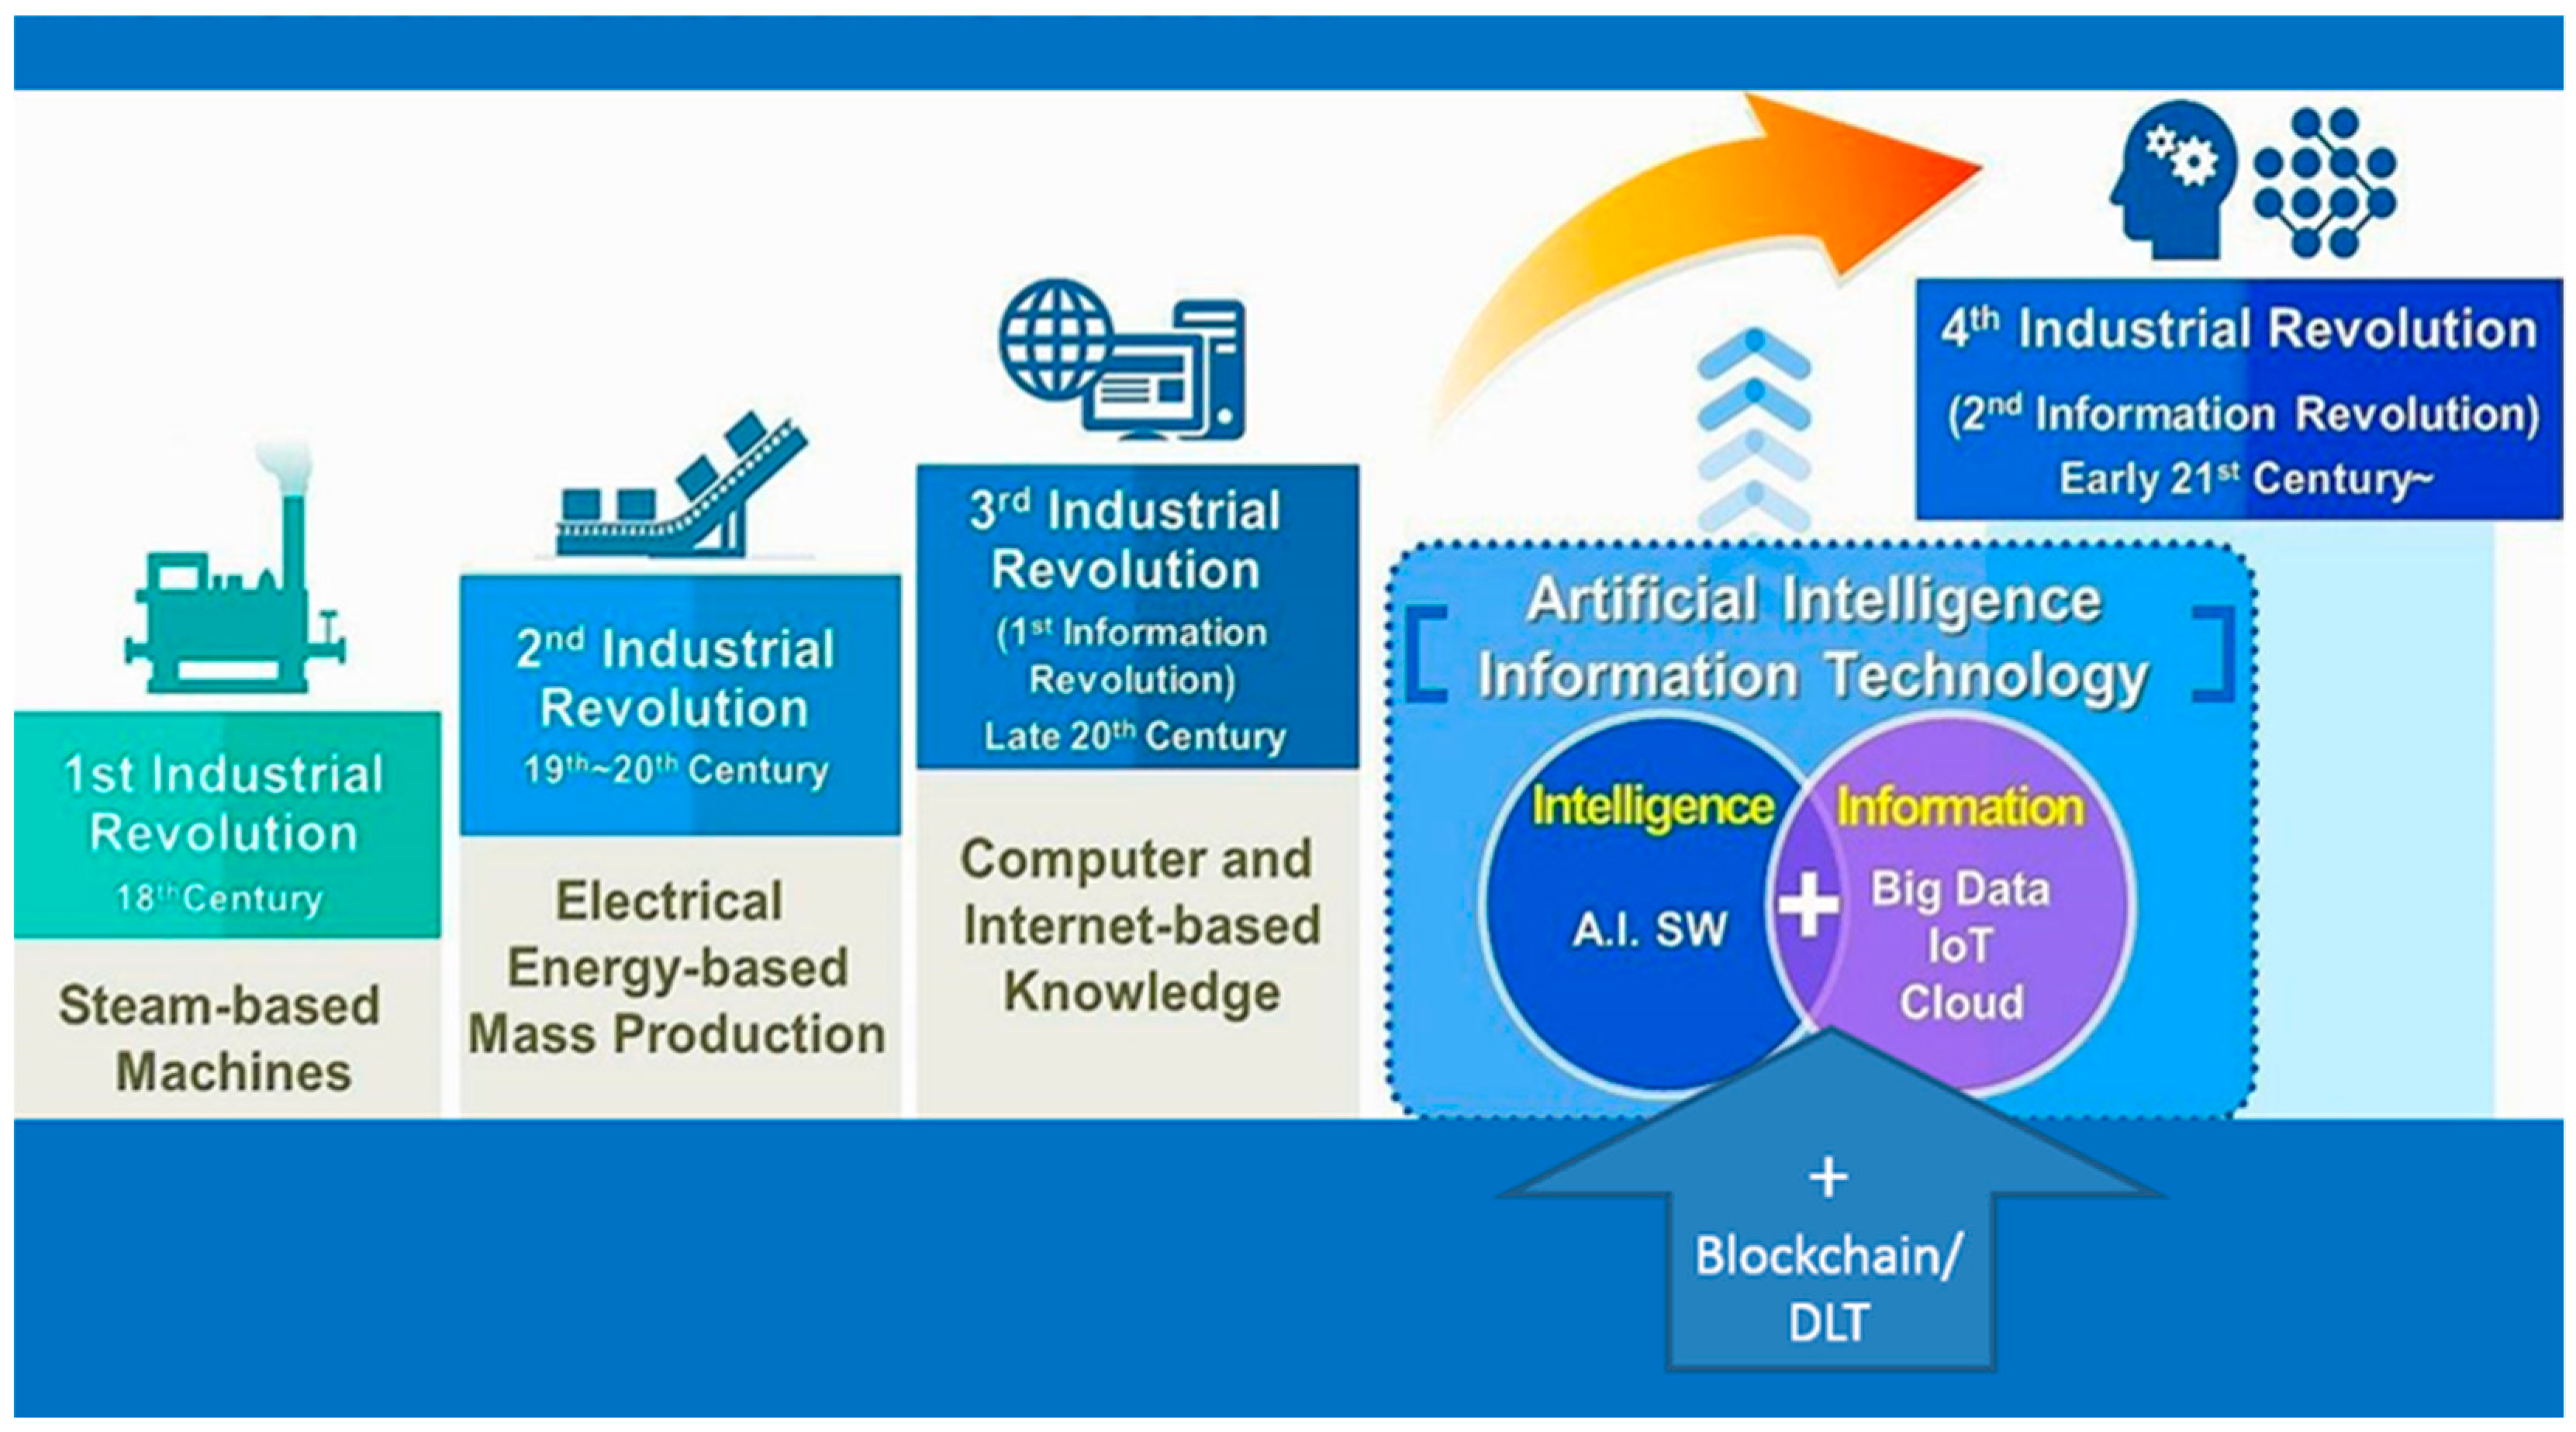
Figure 3 shows how an industrial revolution takes place and how we reached the current level of Industry 4.0 (
Kagermann et al. 2013). The first industrial revolution took place in 18th century, the second took place in 19th and 20th centuries, the third took place in the late 20th century, and finally, the fourth industrial revolution (Industry 4.0) took place in 21th century.
In the context of technological advancement, this study provides vital information on how to boost productivity in production (textile) and service (logistics) industries based on the various principles of Industry 4.0. The current study defines the basic factors, as well as mechanisms of increasing productivity, based on this concept. The major focus of the current study is based on five Industry 4.0 factors: big data, smart factory, cyber physical systems (CPS), the Internet of things (IoT), and interoperability. This research examines how these factors are helpful in the production and service sectors.
Big data is an umbrella term for any technique used to process a huge amount of data or information, comprising capture, security, transfer, storage, analysis, curation, search, privacy, and visualization, and including both structured and unstructured data (
Xu and Duan 2018). Big data is a term used to refer to the rise in the volume of data that is hard to store and process, as well as analyses with the help of traditional database technologies (
Hashem et al. 2015). The nature of big data comprises substantial procedures to recognize, as well as translate, the data into new insights. Numerous researchers have applied big data in prior studies. For instance,
Manyika et al. (
2011) referred to big data as a large volume of scientific data for visualization.
Manyika et al. (
2011) defined big data as “the amount of data just beyond technology’s capability to store, manage, and process efficiently.” Meanwhile,
Zikopoulos et al. (
2013) defined big data as characterized by three Vs: Volume, variety, and velocity. “Big Data is a collection of data from traditional and digital sources inside and outside your company that represents a source for ongoing discovery and analysis.” No doubt big data is supposed to be a new form of capital in today’s marketplace (
Mayer-Schönberger and Cukier 2013;
Satell 2014), however several firms have remained unsuccessful in exploiting it’s advantages (
Mithas et al. 2013). On the other hand, the idea of the smart factory is the unified connection of various steps of individual production, from the initial planning stages to actuators in the field.
Furthermore, “Cyber-Physical Systems (CPS) refers to a new generation of systems with integrated computational and physical capabilities that can interact with humans through many new modalities” (
Baheti and Gill 2011). The capability to interact with and enlarge the abilities of the physical world with the help of computation and communication, as well as control, is a significant enabler for future technological developments. Moreover, the Internet of things (IoT) is a simple term for a magnificent idea. The Internet of things (IoT) is the linkage of all devices to the internet as well as each other. There are three Internet of things (IoT) components, which consist of (a) hardware, (b) middleware, and (c) presentation (
Gubbi et al. 2013). Definite taxonomies of each component can be found elsewhere (
Buyya et al. 2009;
Tilak et al. 2002;
Tory and Moller 2004).
Finally, “Interoperability is in essence what happens when we bring the above elements together. It is the connection of cyber-physical systems, humans and smart factories communicating with each other through the Internet of Things (IoT).” In this direction, manufacturing partners can efficiently share various types of information error-free. Basically, interoperability enables error-free transmission as well as translation. It is one of the basic requirements of a modern technological system (
Sheth 1999).
Industry 4.0 Applications for the Production and Service Industry
The environment of production can be defined as the environment in which a firm related to production continues their operations. Therefore, it links with both external as well as internal factors (
Strandhagen et al. 2017;
Govorukha and Kuchkova 2018). A significant factor for explaining the production environment is the customer order decoupling point (CODP). It is one of the value creation processes in which a product is matched with a real customer order. After production manufacturing, it is delivered to the customer through logistics companies. Thus, both production (textile) as well as services (logistics) industries work together and meet the customer’s needs. However, for smooth operations, both these industries require technological advancement through Industry 4.0.
Table 1 shows Industry 4.0 technologies for logistics.
Advanced technological developments empower researchers to classify patterns in big data (
Lycett 2013). Such scientific investigation needs less reliance on present knowledge and more focus on what is unknown (
Sammut and Sartawi 2012). With the help of big data, it is quite possible to see what is missing, and missing data is easily accessible. It is understood that big data is one of the perfect instruments to attain precise results and increased profit in both the production and service sectors (
Stoicescu 2016).
Big data enables employees to access huge amounts of information about customers and about any production process that has a significant influence on performance. It also has the capability to extract meaning and to sort through big volumes of numbers, as well as find the hidden patterns, unforeseen correlations, and startling connections that can be utilized in various industries, like the production and services fields (
Stoicescu 2016).
The fourth industrial revolution builds upon the applications of cyber physical systems (CPS), which feature end-to-end information communication technology (ICT)-based integration (
Kagermann et al. 2013). Information and communication technology-based integration has significant influence in electronic logistics (
Hameed et al. 2018;
Gwiazda et al. 2015;
Witkowski et al. 2017;
Ślusarczyk et al. 2016) and communication between employees of organizations, communication between partners, and communication between a company and it’s customers. This communication technology increases performance through increases in logistic services and production in textiles.
Lee (
2008) explained that cyber physical systems (CPS) are integrations of computation and physical procedures with embedded computers and networks monitoring physical procedures. It can be considered as the merger between the physical and digital world (
Lasi et al. 2014). This merger is most important for production in the textile industry and services in the logistics industry (
Mahmud et al. 2017).
Moreover, smart factory is interrelated with cyber physical systems (CPS) and the Internet of things (IoT). Smart factories are the important component of Industry 4.0, as according to
Hermann et al. (
2016), it is in a factory where cyber physical systems (CPS) communicate over the Internet of things (IoT), assisting humans and machines in task execution. These tasks include both production and services.
Smart factories, with the help of cyber physical systems (CPS) and the Internet of things (IoT), enable the collection, distribution, and availability of manufacturing related information in real-time (
Lucke et al. 2008).
Radziwon et al. (
2014) described this more comprehensively: “a Smart Factory is a manufacturing solution that provides such flexible and adaptive production processes that will solve problems arising on a production facility with dynamic and rapidly changing boundary conditions in a world of increasing complexity.”
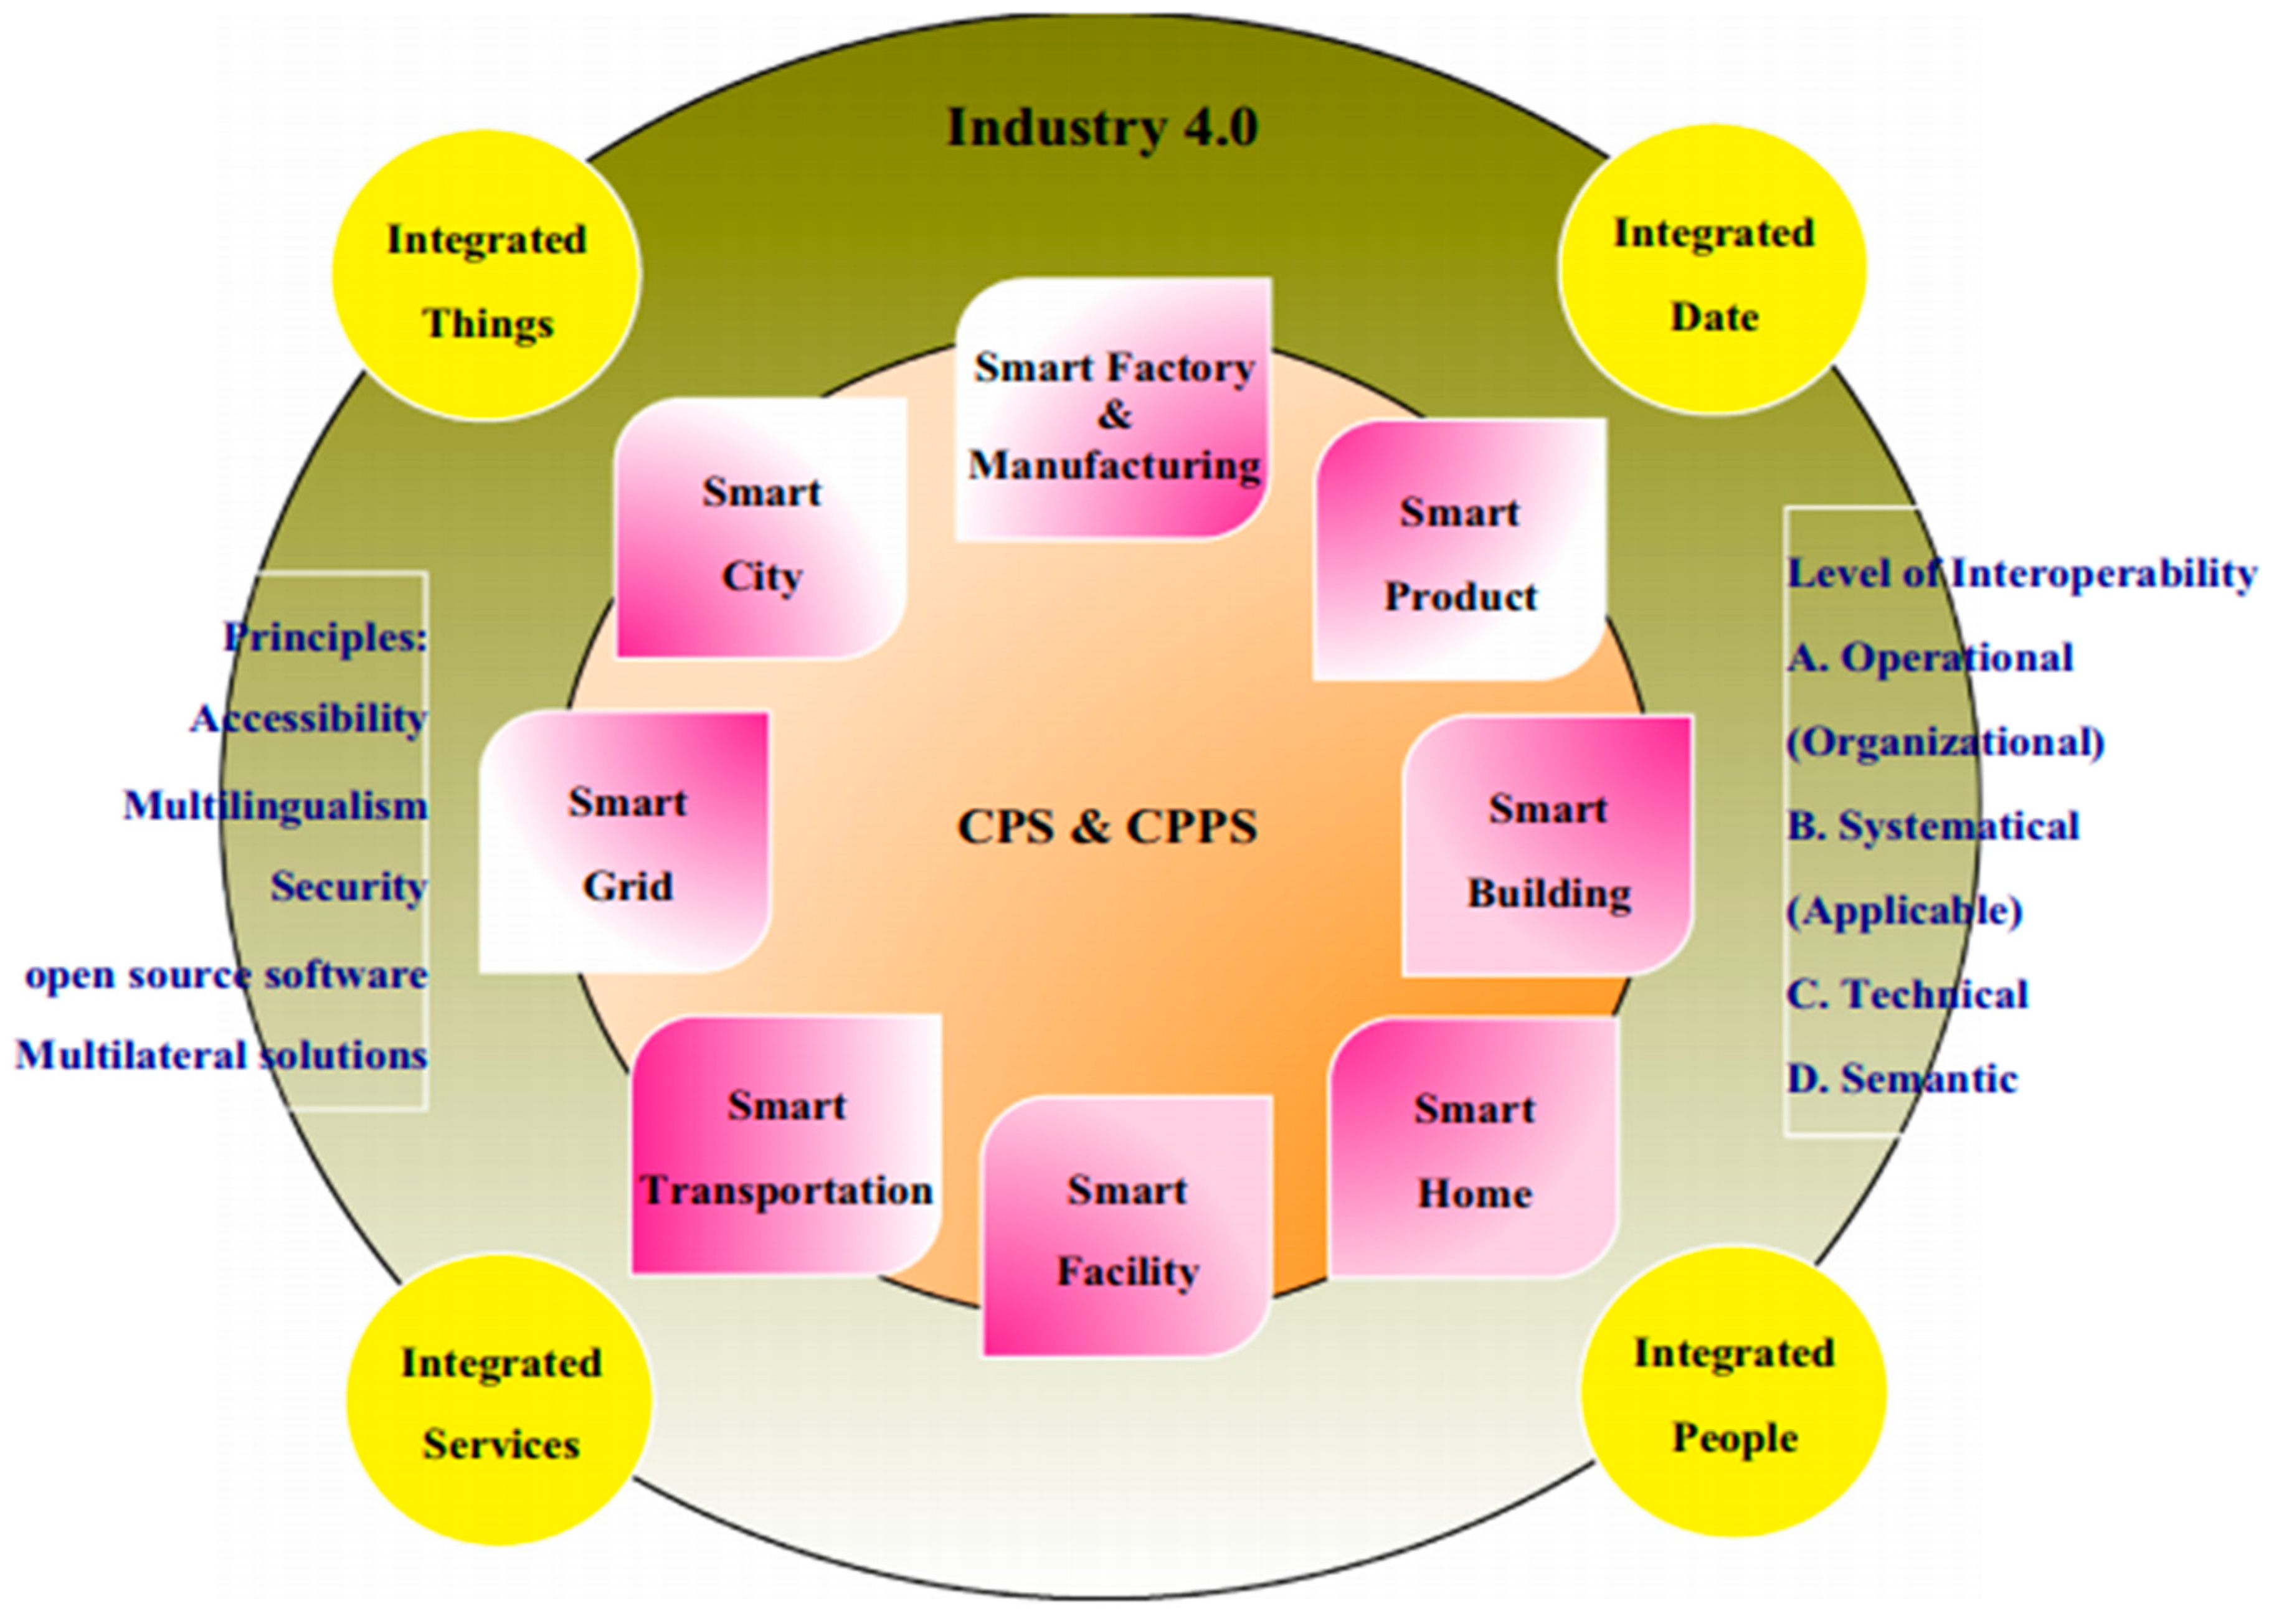
In addition, this study outlines the importance of interoperability in Industry 4.0 for the production and services industry. Industry 4.0 is not only an integration of cyber physical systems (CPS), the Internet of things (IoT), information communication technology (ICT), big data, and smart factories, it is also an interoperability process (
Lu 2017). The framework of interoperability is shown in
Figure 4.
Industry 4.0 has two major factors: Integration and interoperability (
Romero and Vernadat 2016). Integrated with various applications and software arrangements, Industry 4.0 attains seamless operations across production and service organizational boundaries, while also realizing networked organizations (
Ruggaber 2006).
Figure 4 shows the framework of interoperability and how it facilitates the production and services sectors with the integration of other Industry 4.0 factors. Finally, from the literature at hand, the hypotheses for the study are proposed below:
Hypothesis 1. Big data has a significant relationship with production and services.
Hypothesis 2. Smart factories have a significant relationship with production and services.
Hypothesis 3. Cyber physical systems (CPS) have a significant relationship with production and services.
Hypothesis 4. The Internet of things (IoT) has a significant relationship with production and services.
Hypothesis 5. Interoperability has a significant relationship with production and services.
Hypothesis 6. Production and services have a significant relationship with the performance of the production and services industry.
3. Research Methodology
In this cross-sectional research design, the target sectors were mainly textile (production industry) and logistics (service industry), because both face similar challenges, such as these sectors account for over 50% of national exports but share trade worldwide is less than 2% (
Wadho and Chaudhry 2016), selection of the right channel of distribution (
Khan 2010), and low government support in terms of tax incentives for exports and infrastructural development (
Afzal 2017;
Bashar 2017), leading to inadequate technological advancement. Moreover, despite having a distinctive nature, the trends and variations of both sectors are similar to a larger extent. Data was collected from the operational managers of the textile and logistics industry directly involved in Industry 4.0 activities, by using a matrix-based survey questionnaire.
3.1. Sample Size and Sampling Technique
Roscoe (
1975) introduced a rule-of-thumb for considering an appropriate sample size, suggesting that an acceptable sample size should be more than 30 and less than 500 respondents (cited from
Sekaran and Bougie 2012). On the other hand, Comrey and
Lee (
1992) argued that over 200 respondents reflects an adequate sample. The same argument is supported by
Haque et al. (
2017), who suggest that in order to draw a logical conclusion, any sample over 200 is acceptable in social science research. Hence, 300 questionnaires were distributed among the operational level employees (managers) of textile and logistics companies. The total sample size was 224, which is adequate to draw conclusions. Moreover, the researchers used purposive sampling by ensuring an equal split in both considered sectors. According to the strategy of
Haque et al. (
2018), by considering the equal split between groups or sub-sections through employing purposive sampling, researchers can have fair representation. This strategy enables the researchers to target equally by avoiding over-drift towards one set at the expense of the other. We adopted the same strategy by using purposive sampling to have equal and fair representation from both sectors. Thus, 112 respondents from each sector were included. Although purposive sampling is prone to self-selection biases, using the fair representation technique, such as only targeting managers involved in Industry 4.0 and an equal split, enabled the researchers to avoid self-biases.
3.2. Questionnaire Development
Data was collected using the 5-point Likert scale from strongly disagree to strongly agree (1—strongly disagree, 2—disagree, 3—neutral, 4—agree, 5—strongly agree). A Likert scale is most suitable to examine the opinion and views of the respondents (
Sekaran and Bougie 2012). Moreover, a 5-point Likert scale is preferred because it reduces the respondent frustration while increasing the originality of the data (ibid).
We used two types of approach for reliability and validity. One was to ensure the instruments and models, while the other was to ensure the respondents. The reliability and validity of the instruments and models were checked through statistical tests, while for respondent’s we used the demographic-check approach. In the current research, the questionnaires were divided into two major parts. The first part of the questionnaire was based on the profile of respondents, which was comprised of gender, age, marital status, and income (See
Supplementary). The use of socio-demographic questions was used to reach the target audience while ensuring that our respondents were reliable and valid. We used these socio-demographic questions as a way to ensure that the characteristics of a population was authentic by re-checking it with their HR department. As part of the process, we asked the HR departments to confirm with us the number of managers falling into the age brackets, experience, gender, and so on, of our targeted departments. On receiving the response sheet from the HR department, we compared it with the actual respondents’ responses. The idea was to exclude any respondents that had discrepancies in the two (HR and participants’ given details of socio-demographic information) sets. While seeking information from the HR departments, we did not disclose the name of any respondents to them for confidentiality reasons. Thus, the demographic check helped in assessing the reliability and validity of the respondents.
The second part of questionnaire was comprised of the research items based on the key variables of the study, namely big data, smart factories, cyber physical systems (CPS), the Internet of things (IoT), interoperability, production and services, and production and services industry performance. The second part contained attitudinal and behavioral questions such as “
we continuously determine the innovative opportunities for the strategic use of Big Data Analytics”, “
when we make Big Data Analytic investment decisions we consider about how much these options will help end users make quicker decisions”, “
in our organization business analyst and line people meet frequently to discuss important issues”, “
in our organization the responsibility for Big Data Analytic development is clear”, and “
compare to rivals within our industry our organization has the foremost available analytic system” (See
Appendix A,
Supplementary). Thus, the survey questionnaire follows the DAB (Demographic-Attitudinal-Behavior) strategy.
3.3. Data Collection Procedure
Questionnaires were distributed through an e-mail survey using GOOGLEDOC. The questionnaire was emailed from the lead author’s personal email address. Firstly, the e-mail addresses of both industries’ managers were gathered. Secondly, respondents were selected randomly from the list. Proper guidelines to fill the questionnaire and the objective of study were addressed to respondents through e-mail. The respondents not involved in Industry 4.0 were excluded.
We had 53 responses from textile firms and 61 from logistics organizations out of 300 (150 each industry) total distributed survey. After two weeks, we sent our first reminder to prompt more responses. In response to the reminder, we received 34 responses from textile firms and 37 from logistics. After another two weeks gap, we sent a second reminder, and we received 20 more responses from textile firms, whereas only 3 responses from logistics firms. Then we sent our third reminder, and in response we received 11 more responses from textile firms. Thus, we now had 118 responses from textile firms, but only 112 questionnaires were valid in terms of being complete. Therefore, we requested 9 more responses from logistics firms, which we did receive. Hence, we had our total of 224 respondents after 3 reminders.
3.4. Response Rate
From 300 distributed questionnaires, 230 responses were received, out of which 6 were missing significant parts of the questionnaire and thus excluded from the analysis. Therefore, a total of 224 questionnaires were used for the purpose of data analysis through the partial least square (PLS)-structural equation modeling (SEM) technique (See
Supplementary materials).
Table 2 shows the response rate.
4. Data Analysis and Results
The current research followed the recommendations of
Henseler et al. (
2009) to analyze the collected data, which is a prominent method to analyze primary data. It is based on two major parts, which include (1) measurement model assessment and (2) structural model assessment. Measurement model assumptions must be achieved prior to performing structural model assessment. This includes accessing the reliability of data; that is, whether the collected data is reliable to conduct the study or not. It comprises the Cronbach alpha and composite reliability. Cronbach’s alpha is a measure of internal consistency to check close relatedness of items as a group. It is also based on the factor loadings (shown in
Figure 5) of each item (question). All the items should have factor loadings above 0.50 to approach the other assumptions of the measurement model, such as average variance extracted (AVE). AVE shows the external consistency on which the convergent validity is based. Convergent validity, a parameter frequently utilized in social sciences research, refers to the degree to which two measures of constructs that theoretically should be related are in fact related. The second part is the structural model used to test the hypotheses, which was developed from the literature review. The research findings are generally based on structural model assessment.
The results of the current research were obtained through Smart PLS-SEM, which is one of the prominent techniques to analyze data. Most of the prior studies recommended PLS-SEM as one of the suitable techniques to analyze the data (
Hair et al. 2016;
Henseler et al. 2009).
PLS-SEM is based on two major steps. Firstly, the measurement model was examined to check the reliability as well as validity of the model. In the process, factor loading, reliability, and average variance extracted (AVE) were examined. According to previous studies, items having factor loading below 0.40 should be deleted (
Hair et al. 2010). For the present study, Cronbach alpha (0.70), composite reliability (0.70), and average variance extracted (AVE) (0.50) are all acceptable.
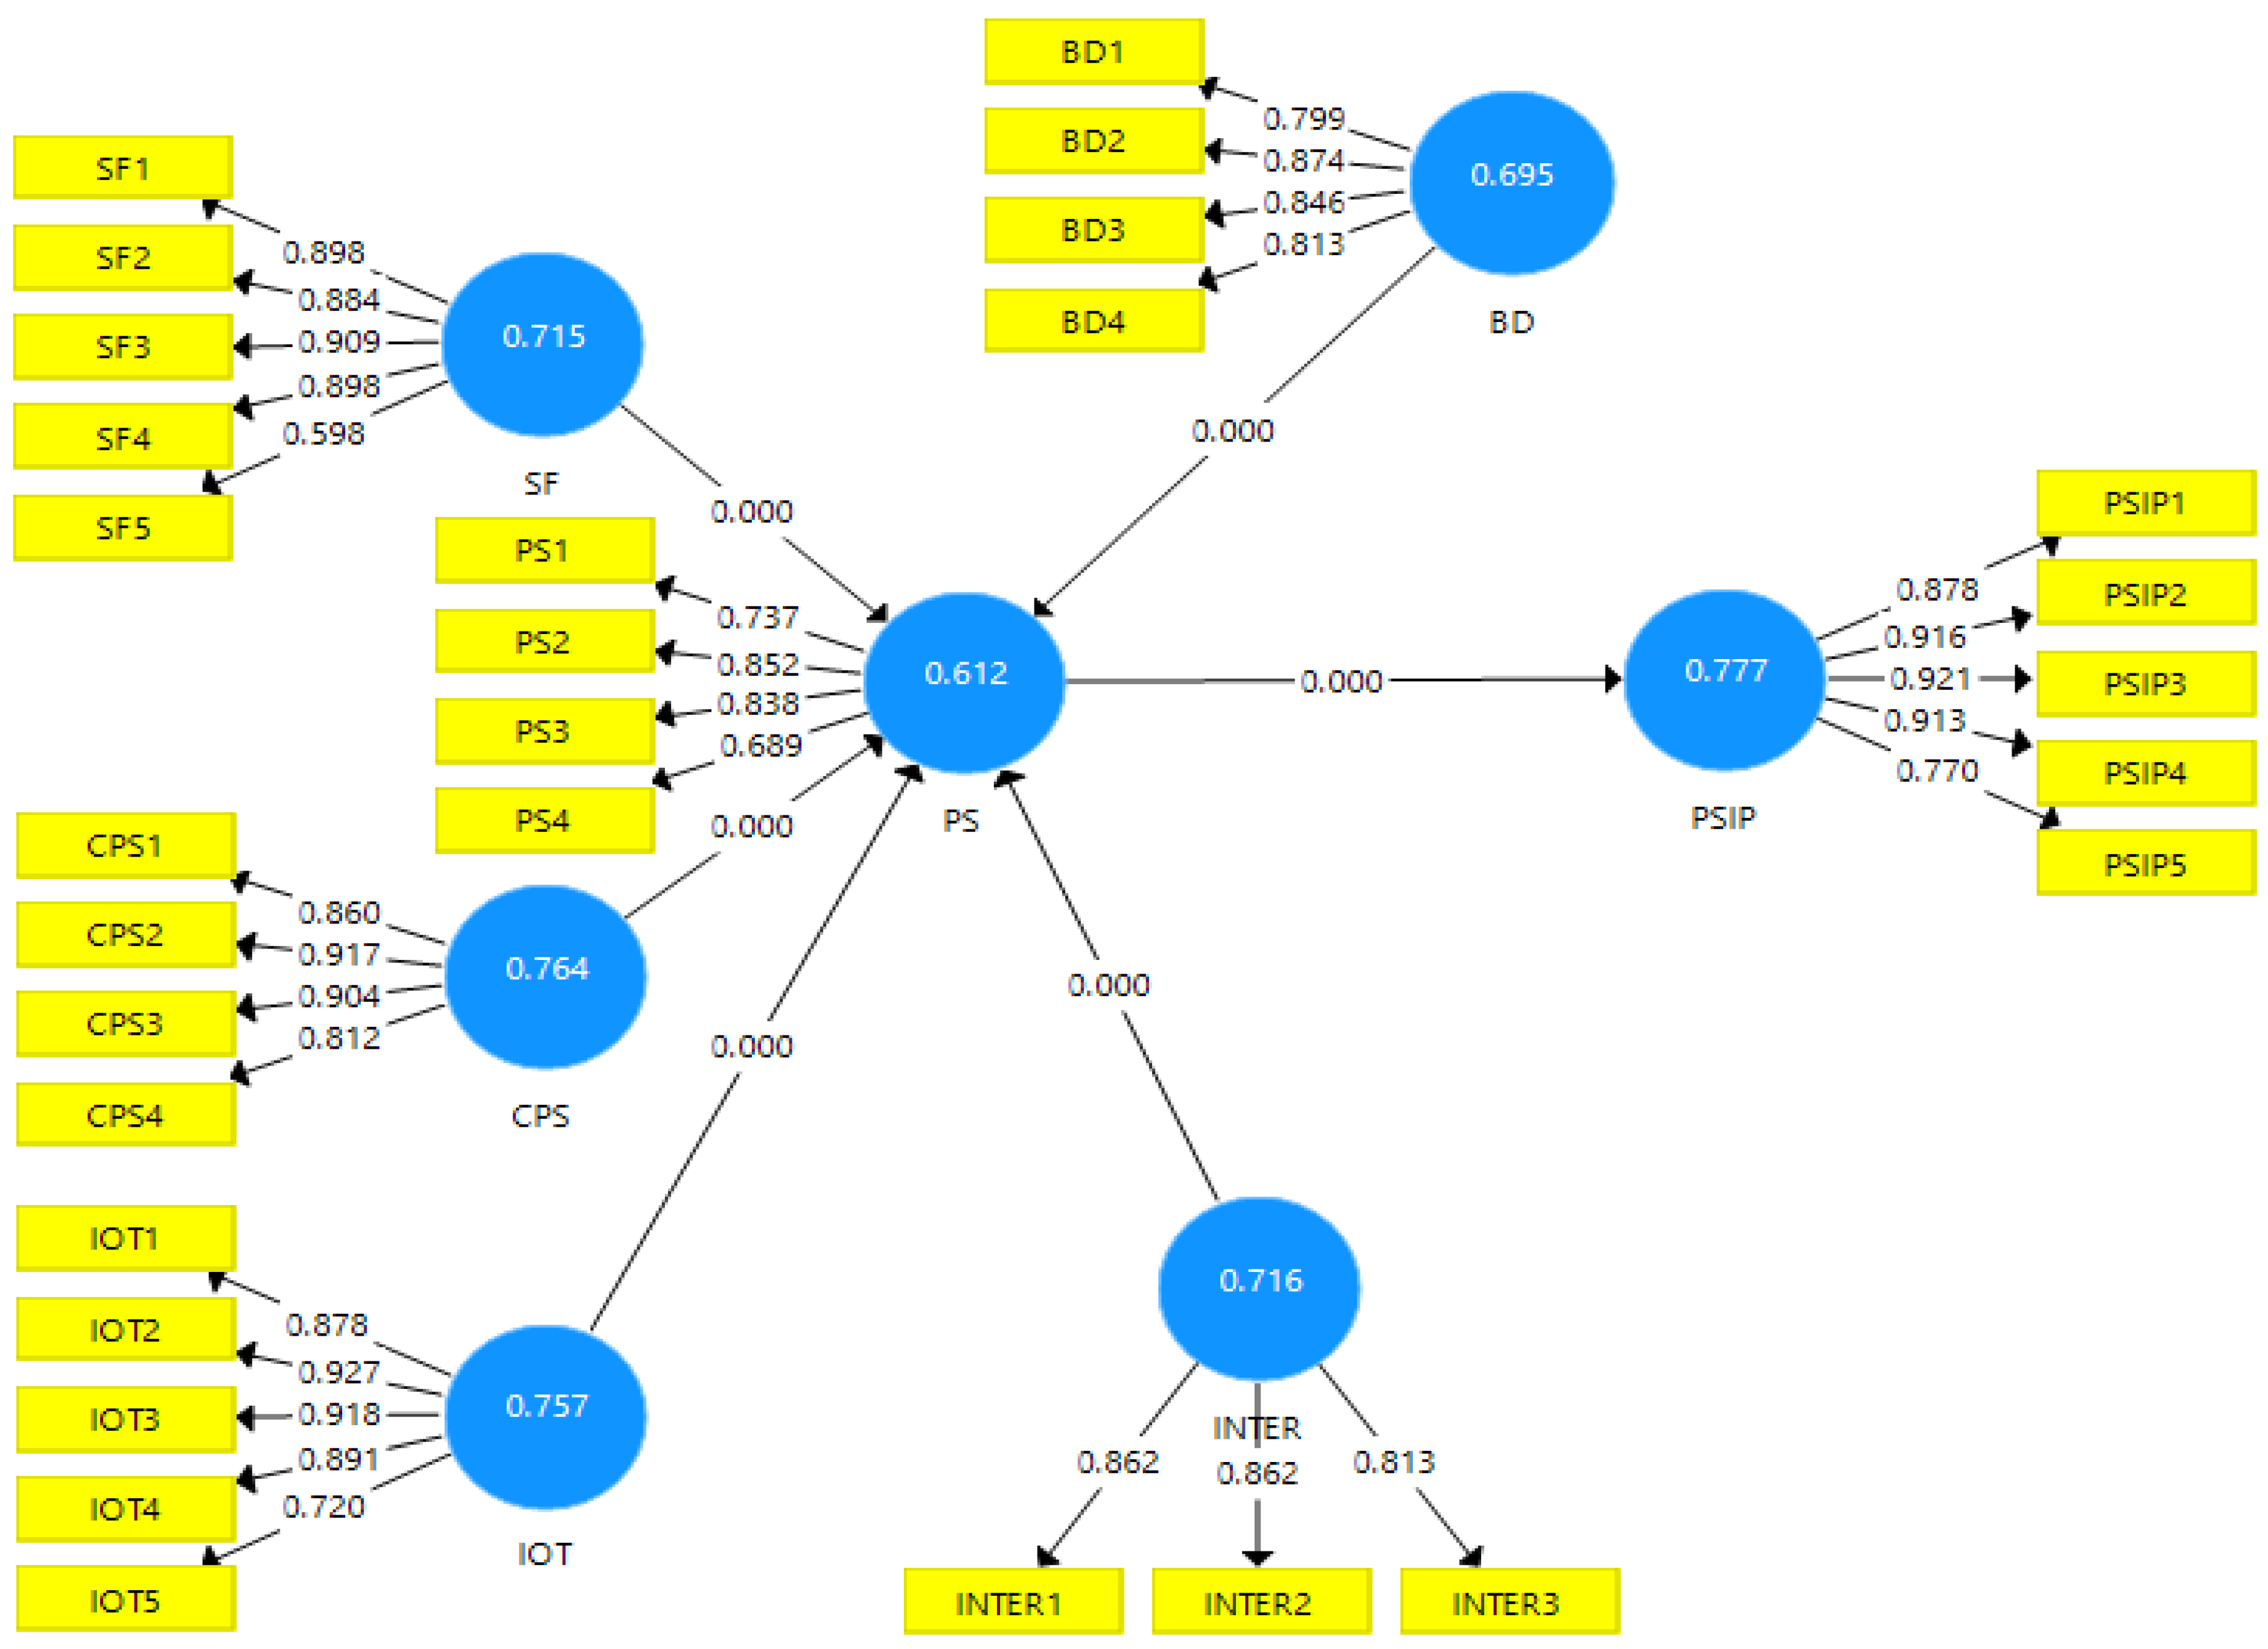
Figure 5 shows the factor loadings and
Table 3 shows Cronbach alpha, composite reliability, and average variance extracted (AVE). All these values are at a more than satisfactory level. Furthermore, discriminant validity is shown in
Table 4 through the heterotrait–monotrait criteria.
There are two things reported in this measurement model, AVE and item loadings. Here, items of latent variables are loaded. As per the rule of thumb, factor loading should be greater than 0.40 (
Hair et al. 2016), and here we can see that all the loaded items of smart factory (SF), big data (BD), production and services (PS), production and services industry performance (PSIP), cyber physical systems (CPS), interoperability (INTER), and the Internet of things (IOT) are acceptable. Moreover, the item loading formed the average variance extracted (AVE), which should be greater than 0.50 (
Hair et al. 2016). In our data, SF (0.715 > 0.50), BD (0.695 > 0.50), PS (0.612 > 0.50), PSIP (0.777 > 0.50), CPS (0.764 > 0.50), IOT (0.757 > 0.50), and INTER (0.716 > 0.50) are acceptable, thus the measurement model is valid.
Secondly, structural model assessment was used to test the relationships between independent and dependent variables. In the current study, the hypotheses were supported with a t-value equal to or more than 1.96. All the hypotheses with a value less than 1.96 were considered as not supported.
In the current study, it is found that all the independent variables for big data have a statistically significant relationship with production and service processes (
t = 2.737 > 1.96). Thus, we fail to reject Hypothesis 1. Smart factory has a highly statistically significant relationship with production and service processes (t = 8.435 > 1.96), hence we do not reject Hypothesis 2. Similarly, we found that cyber physical systems have a statistically significant relationship with production and service processes (t = 2.539 > 1.96). Therefore, we fail to reject Hypothesis 3. Furthermore, the Internet of things (IoT) has a statistically significant relationship with production and service processes (t = 2.467 > 1.96). Hence, we fail to reject Hypothesis 4. We also found that interoperability has a significant relationship with production and service industry processes (t = 7.535 > 1.96). Thus, we fail to reject Hypothesis 5. Lastly, production and services have a highly statistically significant relationship with the performance of the production and services industry (t = 30.467 > 1.96). Hence, we do not reject Hypothesis 6. Moreover, the β-value shows that all the relationships are positive.
Figure 6 shows the relationship between variables and
Table 5 shows the results of the hypotheses.
Additionally,
Table 4 shows the effect size (f
2). In the current research, big data, smart factory, cyber physical systems, the Internet of things (IoT), and interoperability all have small effect size (f
2) according to the recommendations of
Cohen (
1988). However, production and services have a strong effect size (f
2).
According to
Chin (
1998), an 0.33 value of variance (R
2) is moderate and 0.67 is substantial. In the current study, this value is 0.564, which is moderate. This indicates that all the variables are expected to bring 56.4% variance in dependent variables.
Predictive relevance (Q
2) is important to measure how well observed values are reproduced by the model (
Akter et al. 2011). It is critical to measure the predictive validity of a complex research model (
Chin 1998;
Geisser 1975). It refers to “a synthesis of cross validation and function fitting with the perspective that the prediction of observables is of much greater relevance than the estimation of what are often artificial construct – parameters” (
Chin 2010, p. 679;
Geisser 1975, p. 320). In the current study, a blindfolding procedure was used and the Stone–Geisser test was employed for predictive relevance (Q
2) (
Geisser 1974). The predictive relevance (Q
2) is shown in
Table 6. According to the recommendations of
Henseler et al. (
2009), it should be greater than zero. This indicates that the model of the current study has achieved a certain level of quality.
Table 7 shows the goodness of fit (GFI) of the model. It is examined through the standardized root mean square residual (SRMR), normed fit index (NFI), and adjusted goodness-of-fit index (AGFI). According to
Hooper et al. (
2008), SRMR must be below 0.08, NFI must be equal to or above 0.95, and AGFI must also be equal to or above 0.95. In the current study, all the values are satisfactory.
5. Research Findings
The current research examined the effect of five Industry 4.0 factors (big data, smart factory, cyber physical systems (CPS), the Internet of things (IoT), and interoperability) on the production (textile industry) and services (logistics industry) sectors of Pakistan. Moreover, the role of the production and services sector in the performance of the production and service industry was also examined.
The results of the current research found that big data has a significant positive relationship with the production and service sector. The results of the analysis show a t-value of 2.737 and β-value of 0.292. This indicates a direct relationship of big data with production and services. Increases in big data implementation will promote the textile and logistics industry. Furthermore, the current study results are in line with previous studies (
Akter et al. 2016;
Wamba et al. 2017;
Stoicescu 2016).
In the case of smart factories, a significant relationship was found with production and services, with a t-value of 8.435. A β-value of 0.397 also shows a positive relationship of smart factories with production and services. These results are in line with the study carried out by
Lalic et al. (
2017). Therefore, the results demonstrate that better implementation of smart factory technologies will lead to higher production and services. The positive significant results of cyber physical systems (CPS) and the Internet of things (IoT) found with the current findings support the previous studies of
Witkowski et al. (
2017) and
Ślusarczyk et al. (
2016). It is identified that both cyber physical systems (CPS) and the Internet of things (IoT) have a significant relationship with production and services, with t-values of 2.539 and 2.467, and β-values of 0.241 and 0.225, respectively. Thus, both cyber physical systems (CPS) and the Internet of things (IoT) have a significant positive relationship with production and services.
Finally, the effect of production and services on production and services industry performance (textile industry and logistics industry) was examined. It was found that better production and services have a significant positive role in enhancing the overall performance of the textile industry and logistics industry, with a t-value of 30.467 and β-value of 0.751, which is consistent with the previous studies of
Strandhagen et al. (
2017) and
Govorukha and Kuchkova (
2018). Thus, Industry 4.0 has major contributions towards production and services, which ultimately impact positively on the overall performance of the production industry and service industry.
6. Conclusions
The current research focused on the role of Industry 4.0 on the production and services sector of Pakistan. Data was collected from operational level employees (Managers) of the textile and logistics industry through a survey questionnaire.
The findings revealed that Industry 4.0 has major importance in overcoming the various challenges of the textile and logistics industry of Pakistan. Particularly, five Industry 4.0 factors (big data, smart factory, cyber physical systems (CPS), Internet of things (IoT), and interoperability) are the most invaluable to enhance performance. Through these elements, introduction of the latest technology has the potential for enhancing various operations in the considered industries. Additionally, through these five factors, Industry 4.0 is positively associated with the production and services sector, which has positive impact on overall performance. Thus, the textile and logistics industry of Pakistan requires the introduction of Industry 4.0 through a comprehensive plan, which should cover the aforementioned five factors.
Future researchers are invited to compare the performance of various production and services industries after and before Industry 4.0 implementation. This will better show the Industry 4.0 benefits. The researchers should consider a panel study to examine the impact of different time intervals, as it will reflect the variations in different time zones. Additionally, the researchers should consider the split of public and private companies on geographic grounds to further expand the research phenomenon.
Managerial Implication
Within the context of managerial implications, the results of this research provide insights into the focus areas to promote production and service industry operations which automatically increase performance. In general, the outcomes retrieved from this research could be useful to other countries, where the performance of the production and service sector is low, especially in emerging economies. Specifically, the outcomes of this study could be applied by policymakers to address the declining performance of the textile and logistics industry.
Most importantly, this study is beneficial because it revealed various important elements of Industry 4.0 to promote production and service sector performance that managers can consider and implement to ensure that the sector’s performance remains stable. This will allow the managers to not only survive, but to drive the competitive dynamic environment. This study is also beneficial for managers in a sense that they can ensure mandatory Industry 4.0 practices in the textile and service industries in general. Thus, the study is more advantageous for practitioners when making the strategies to improve the performance of the textile and logistics industries.


 Textile (Readymade garments, Bedwear, Towels, Fabric, Yarn, Cotton, Carpets)


