1. Introduction
Bosnia and Herzegovina lie in the heart of South Eastern Europe, which is marked as one of the European regions with rather complex tectonic formations. Many researchers investigated this region, i.e., Northwestern Balkans, Northwest Bosnia and Herzegovina. One of the features which makes South Eastern Europe interesting for researchers, is the fact that all the earthquakes that struck this region until now were earthquakes with a shallow focus. Uniform hazard spectra for this region were produced by several researchers [
1,
2] after the study of the influence of deep and shallow geology. In 2018, the seismic hazard map for Bosnia and Herzegovina, defined in terms of peak ground acceleration (PGA) with a return period of 475 years (
Figure 1), as defined in Eurocode 8, was constructed, and is now part of the National Annex in BAS EN 1998-1: 2018 [
3].
When considering 1944 recorded earthquakes, the focal depth of 64% of them is only 10 km, while earthquakes with a focal depth in the range from 11 to 20 km make up 30% of the sample and around 4.5% of the earthquakes were with a focal depth in the range from 21 to 30 km; which leaves just 1.7% with a focal depth larger than 30 km [
4]. The shallow focus is one of the most destructive features of earthquakes in Bosnia and Herzegovina [
5,
6].
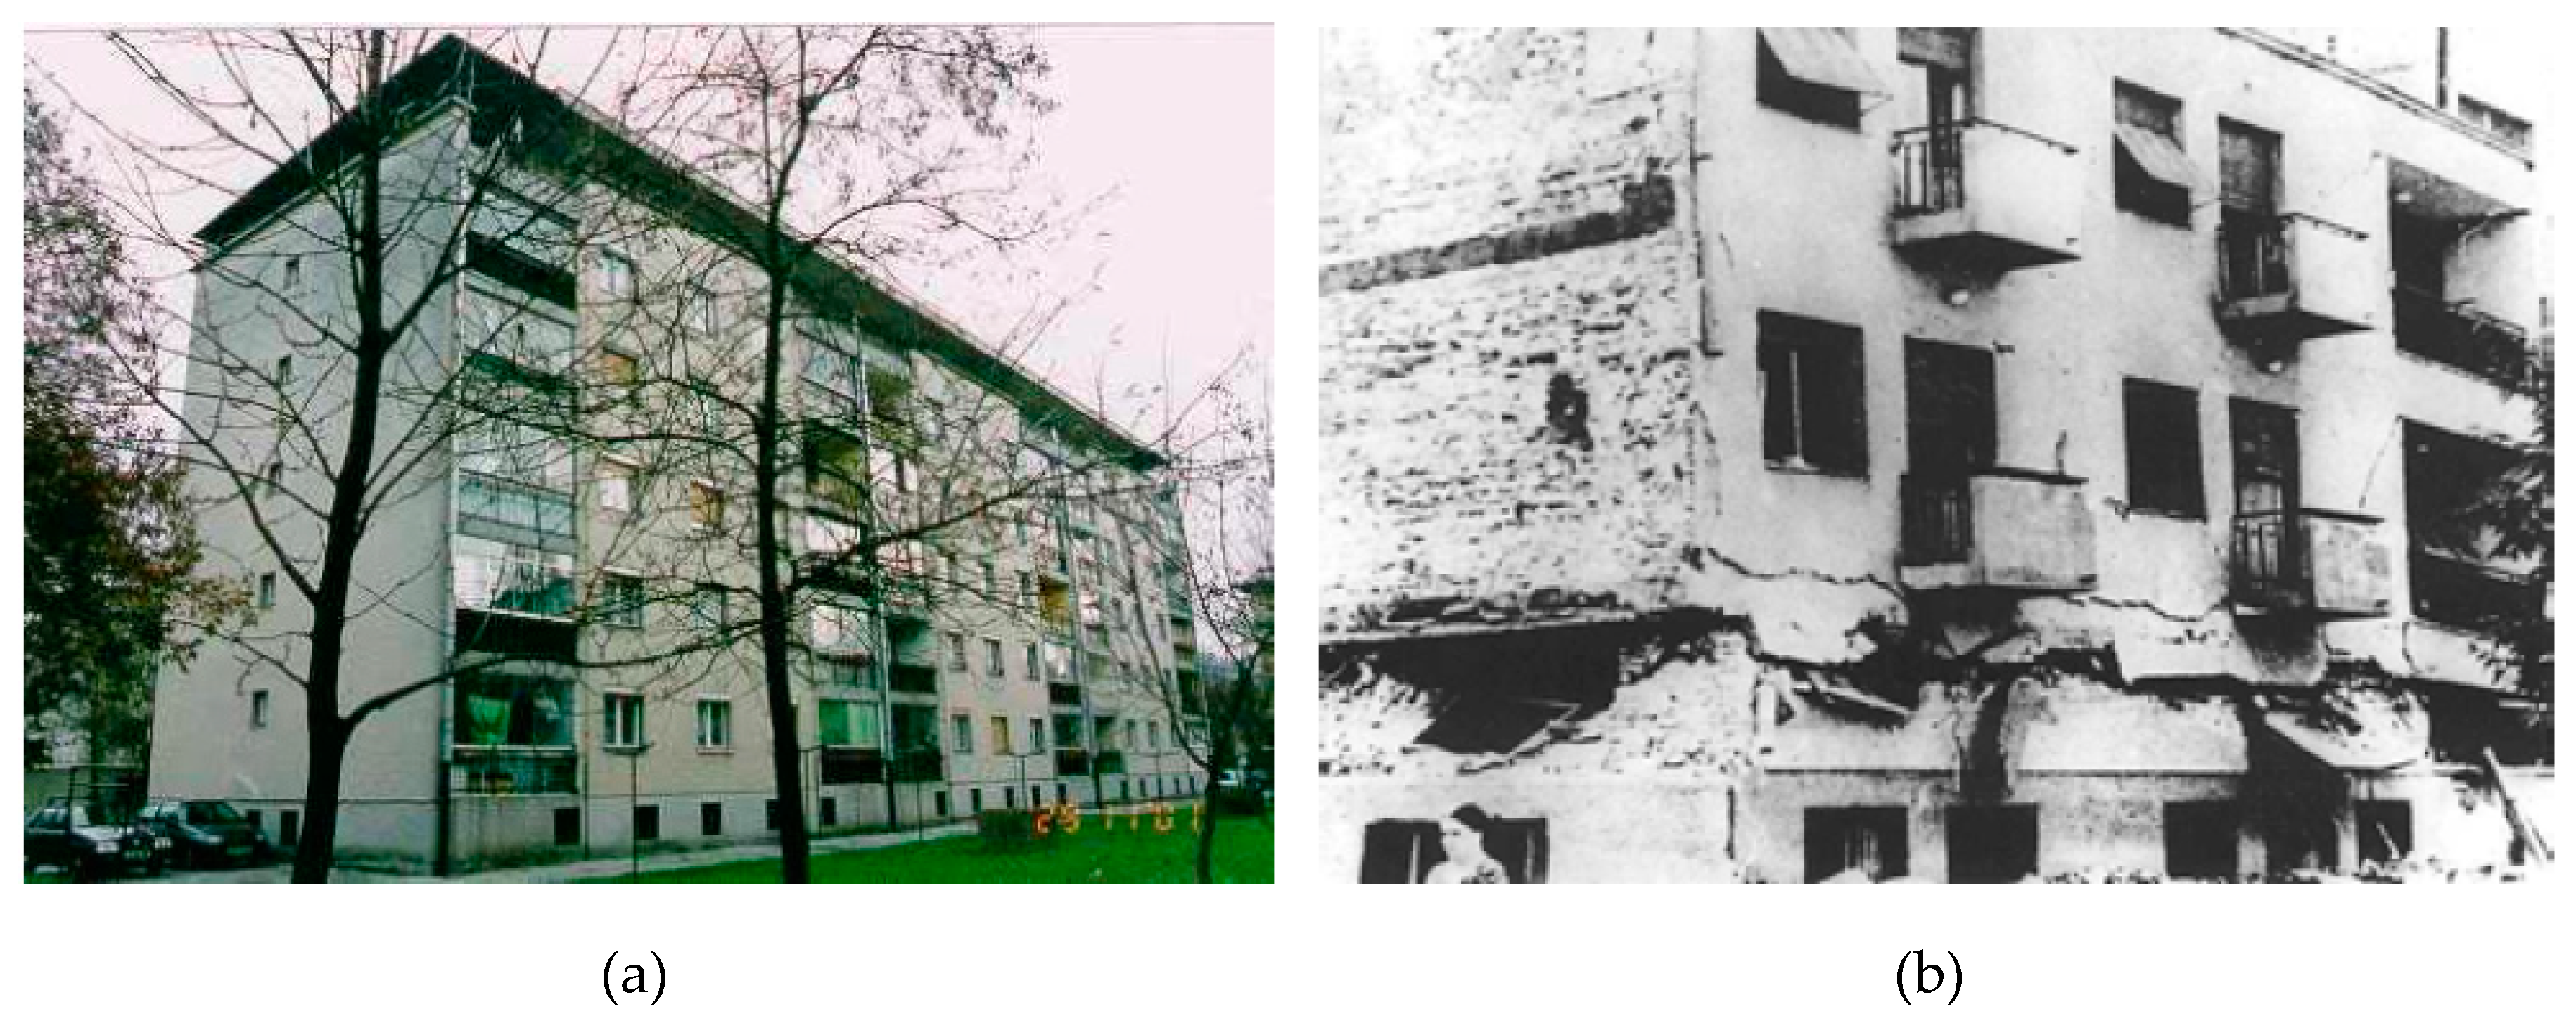
In this paper, a building structure built in 1957 and typical of the Balkans region is elaborated. These type of buildings can be found in all towns in Slovenia (
Figure 2a) and they make up to 30% of the entire housing stock in Slovenia [
7]. According to the national census [
8], the buildings of this type make up 6% of the housing in the urban part of the Sarajevo city center. This construction type was built from 1920 until 1963 in the entire region of ex-Yugoslavia, especially in the Republic of Macedonia, Montenegro, and Bosnia and Herzegovina, mainly in the urban areas. At that time, no seismic codes existed in this region, so these structures were constructed with no seismic regulations. The 1963 Skopje earthquake showed the drawbacks of this type of structures (
Figure 2b), which were severely damaged due to inadequate wall concentration in the predominant earthquake direction, low resistance of the loadbearing system, high height of the unreinforced masonry structure (URM), etc. It is only after this catastrophic event that these type of structures were addressed in the first Temporary Seismic Code produced in 1964 and later upgraded after the 1969 Banja Luka earthquake (which had a focal depth of only 25 km, and a magnitude of 6.4 by Richter’s scale). This was one of the most devastating earthquakes registered in this region. Due to the vast devastation caused by the Banja Luka earthquake, micro-zonation of the urban part of the city was done in 1972. According to that data, the expected average ground acceleration for Banja Luka is 0.18g [
9]. Regardless of this fact, the area of Banja Luka in the seismological map of Bosnia and Herzegovina was defined as an area of maximum registered intensity of 9 by the Mercalli–Cancani–Sieberg intensity scale [
10] for a return period of 500 years. More recently, Lee et al. [
11] conducted the micro-zonation of Banja Luka in the light of performance-based earthquake-resistant design.
According to the new seismic hazard code for Bosnia and Herzegovina, defined in terms of peak ground acceleration (PGA) with a return period of 475 years (
Figure 1), Sarajevo can experience earthquakes with a peak ground acceleration of 0.18g [
3]. Such conditions make this structure rather vulnerable as it was constructed without the application of any seismic measures.
As this structure is typical for the wider region of the Western Balkans, the main purpose of this research is to investigate the seismic safety of the building if exposed to ground motions compatible with Eurocode 8 [
3]. On the basis of obtained numerical results, possible intervention measures for improving the seismic response of the structure are also analyzed and proposed.
2. Description of the Case Study
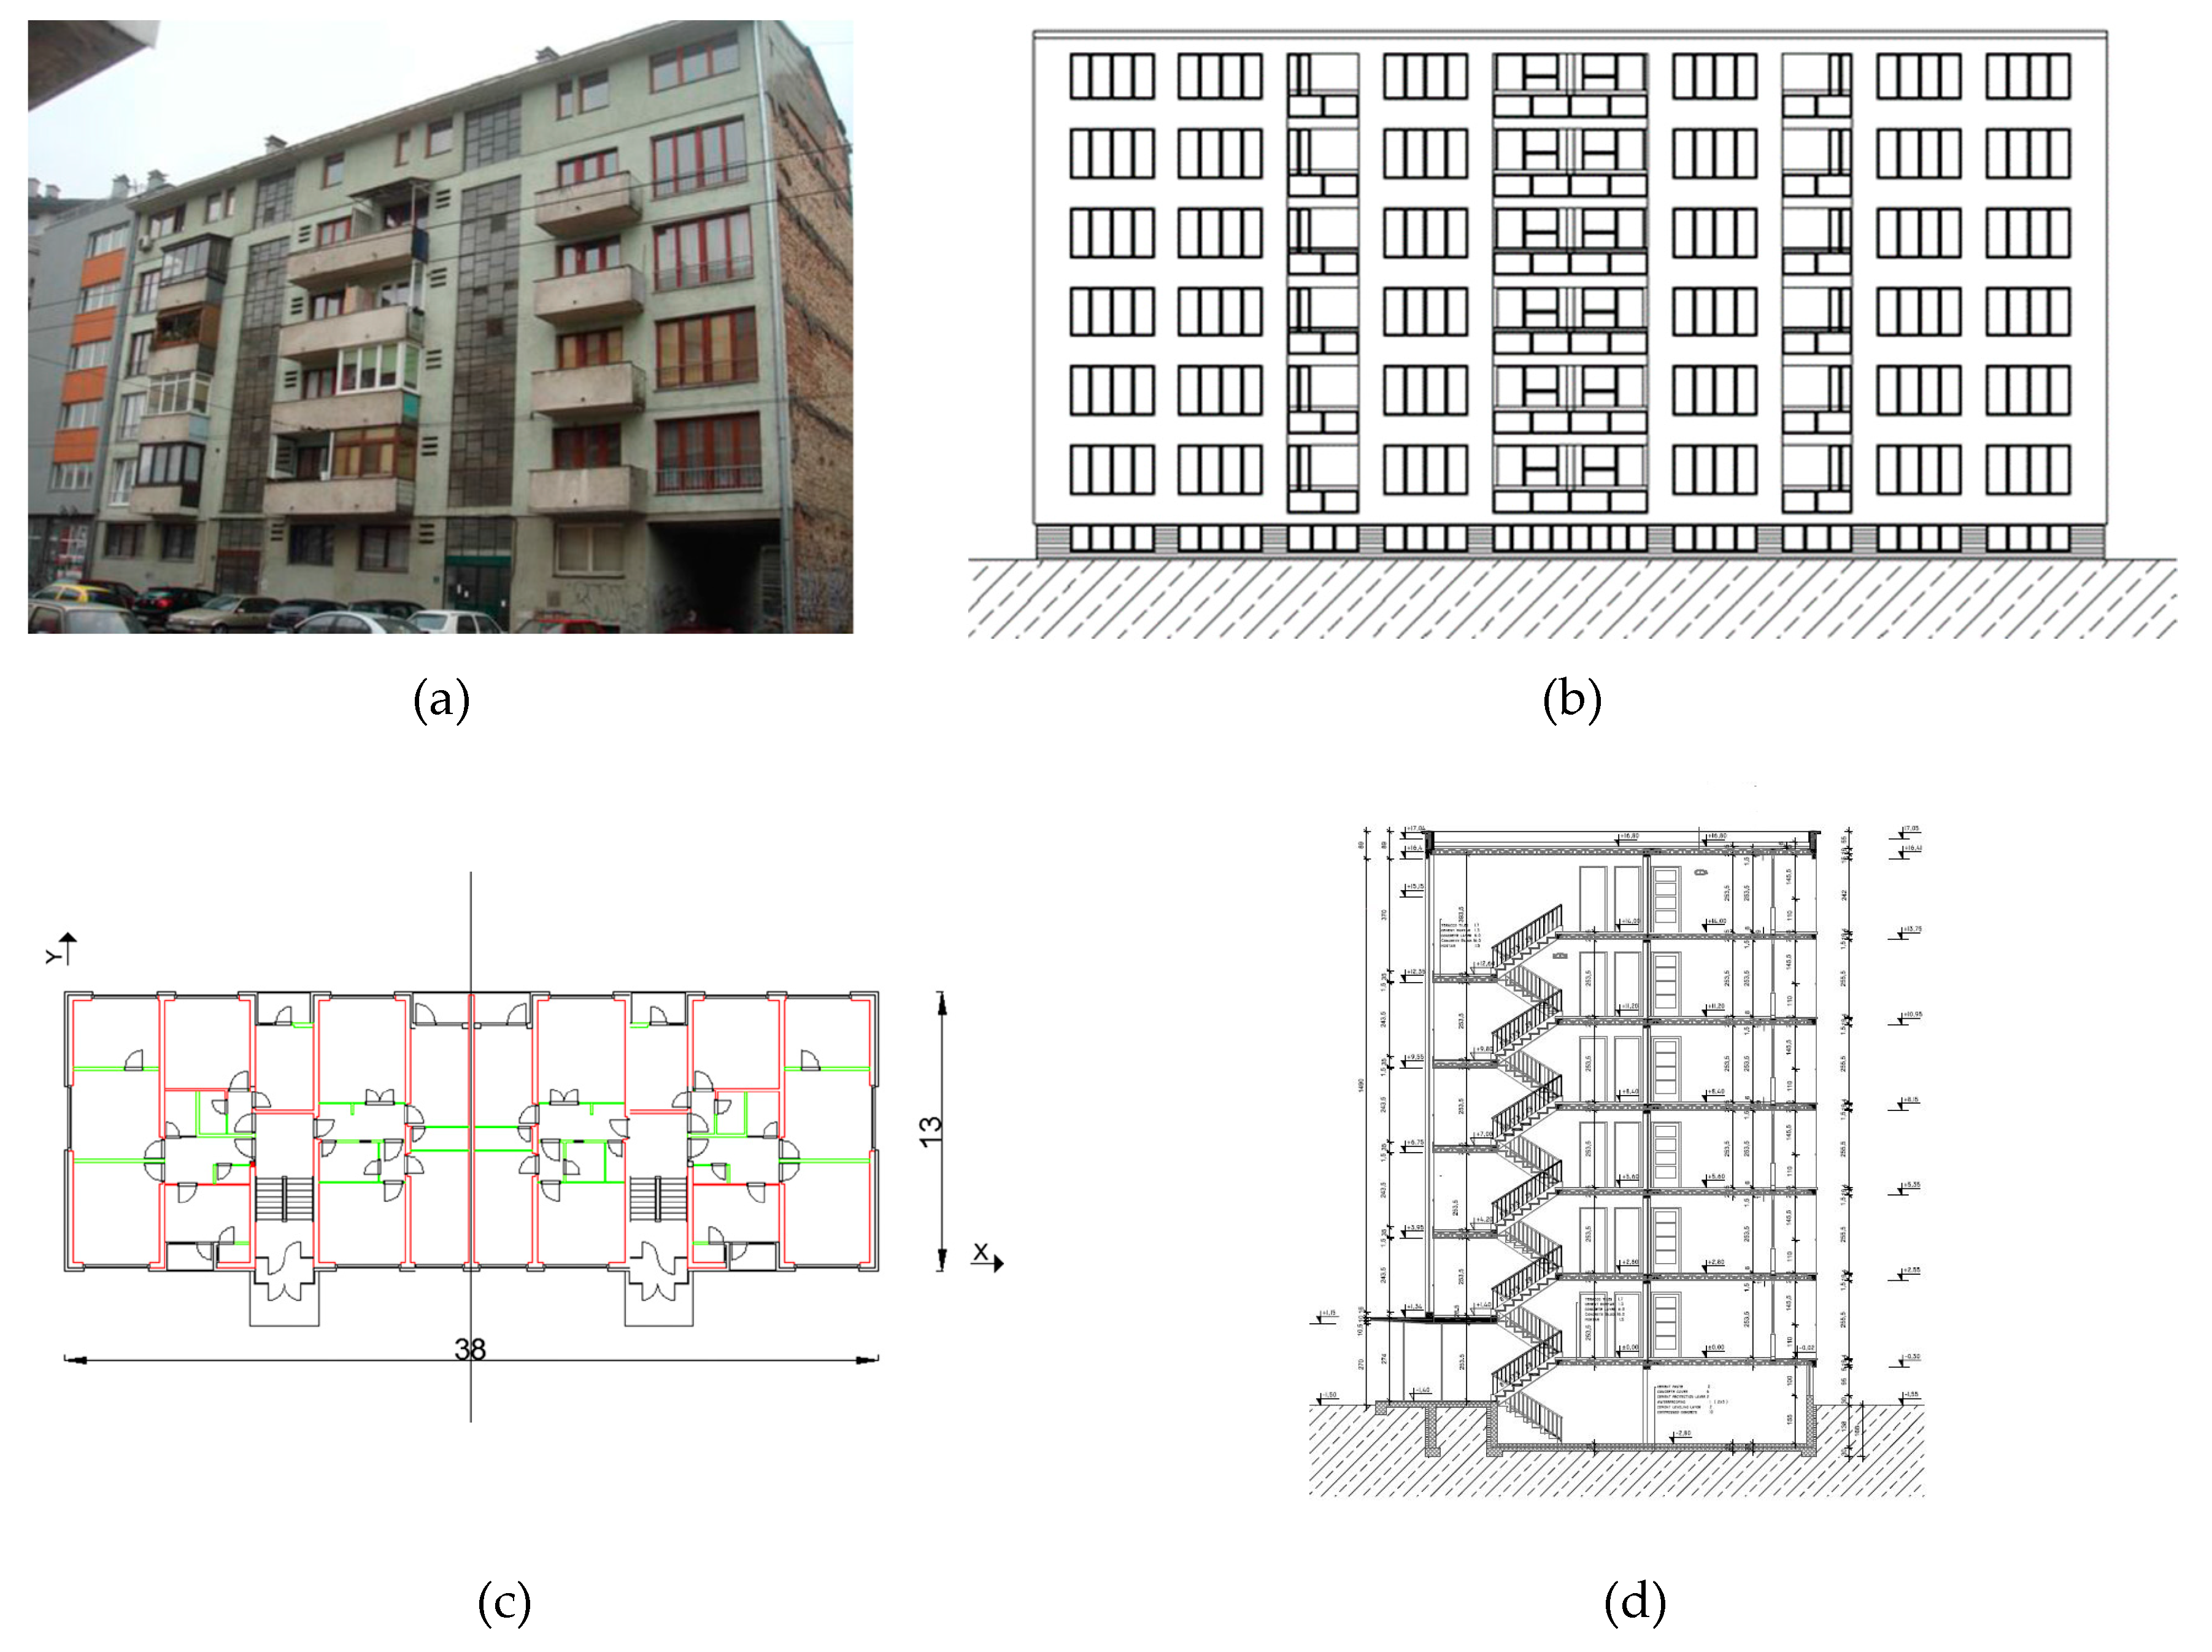
The analyzed building is located in the urban part of Sarajevo (
Figure 3a,b) and it has a rectangular plan, with length L = 38 m and width B = 13 m (
Figure 3c). The total height of the structure with the basement is 21 m (
Figure 3d). The main load bearing walls are located in the Y direction, while the load bearing walls in the X direction are attenuated by many openings. The structure is composed of a basement made of reinforced concrete walls. Dimensions of the walls differ and the inner walls in the Y direction are 38 cm thick, while in the X direction the thickness of the outer walls is 30 cm and of two inner walls is 25 cm. The walls in both directions on all the floors are made of solid brick masonry (dimensions of bricks 250 × 120 × 65 mm) and a façade part (non-load bearing) made of hollow bricks 125 mm thick. The slabs are made of semi-prefabricated “Herbst” concrete hollow elements, joists, and a concrete slab of 6 cm. The total thickness of the slab at the storey’s is 26.5 cm, and the same construction is kept for the roof with thickness increased to 43.5 cm. The structure is an unreinforced masonry building with prefabricated slabs, behaving as rigid diaphragms [
5,
6].
The vulnerability of the building under study is connected to several issues. One of the essential requirements for adequate seismic response is not satisfied, as there is the lack of load-bearing elements in one of the structure’s main directions. The loadbearing walls are mainly placed in the transversal direction (Y), while walls in the longitudinal (X) direction are weakened by a large number of openings (
Figure 2). The structure has a basement, ground floor, and five storeys, and it was constructed as an unreinforced masonry building. The walls are made of solid bricks connected with lime mortar providing a low compressive strength of masonry. By taking into account the EMS 98 [
12], the structure is associated with vulnerability class C. This structure (unconfined masonry, at most 60 years old with reinforced concrete floors) can have different damages grades. For a seismic intensity VII, the damage grade would be 2 (moderate damage), and as the intensity increases the damage grade increases by one level: Seismic intensity VIII provides substantial to heavy damage; seismic intensity IX provides very heavy damage and seismic intensity X provides destruction. Additionally, according to the regulations regarding technical standards for the construction of buildings in seismic areas from 1991 [
10], there is a clear limitation regarding the number of storeys for unreinforced masonry structures in respect to the seismic intensity level, as shown in
Table 1.
This type of structure is characterized by two longitudinal façade walls with a large number of openings, while in the transverse direction the exterior walls have only one opening at the height of each floor. Other transverse (inner) walls have door openings of 2.3 m2–6.9 m2. The total area of the openings in the basement for the longitudinal direction is 19.8%. In the transverse direction, openings in the outer wall occupy only 8.6% of the wall surface. A significant percentage of the aperture is located in the longitudinal walls in the amount of as much as 46% of the wall surface. Thus, the lateral resistance in the longitudinal direction is significantly lower than the lateral resistance in the transverse direction.
Sarajevo is located in the seismic intensity zone VII, thus limiting the number of storeys to G + 2 (see
Table 1), while the analyzed structure is G + 5. It is evident that the limitation according to
Table 1 is not respected, as this regulation was enforced only in the 1980s.
In order to obtain the necessary information regarding the physical and mechanical characteristics, several on-site and laboratory tests were done. Laser distancemeters and total stations were used for verification of the geometric data and as a result, drawings of the building were produced (
Figure 3b–d). Brick units and concrete compressive strengths were determined on samples from the building (
Figure 4a). Five series of two bricks were taken out from representative locations in the structure and their compressive strength was tested in accordance with the ex-Yugoslavian standards [
13] (
Figure 4b). Locations of the extracted brick samples are marked by numbers from 1 to 5 (
Figure 4a). The mean value of brick compressive strength was 19.4 MPa, while the minimum value was 13.4 MPa putting it into a class of M15 (15 MPa), which fulfills the requirements for a load-bearing wall [
13]. Compressive strength of concrete was determined using six cylindrical samples in accordance with the regulations defined in standard [
14]. The mean value of concrete compressive strength was 25.1 MPa, while the minimum value was 22.8 MPa putting it into a class of MB25, which is equivalent to C20/25 in Eurocode 2 [
15], and the reinforcement was ø = 14 mm, type of steel GA240/360 (smooth bars with yield stress 240 MPa, and 360 MPa ultimate strength). Based on results from the experimental campaign, the calculated compressive strength of masonry according to Eurocode 6 [
16] was 4.1 N/mm
2, which was used as the basis for the calculation of other mechanical characteristics. The slabs were made out of concrete class C20/25 and a reinforcement ø = 8 mm and the same type of steel was used as in the basement. All other characteristics were determined from the characteristic compressive strength of the concrete according to Eurocode 2 [
15].
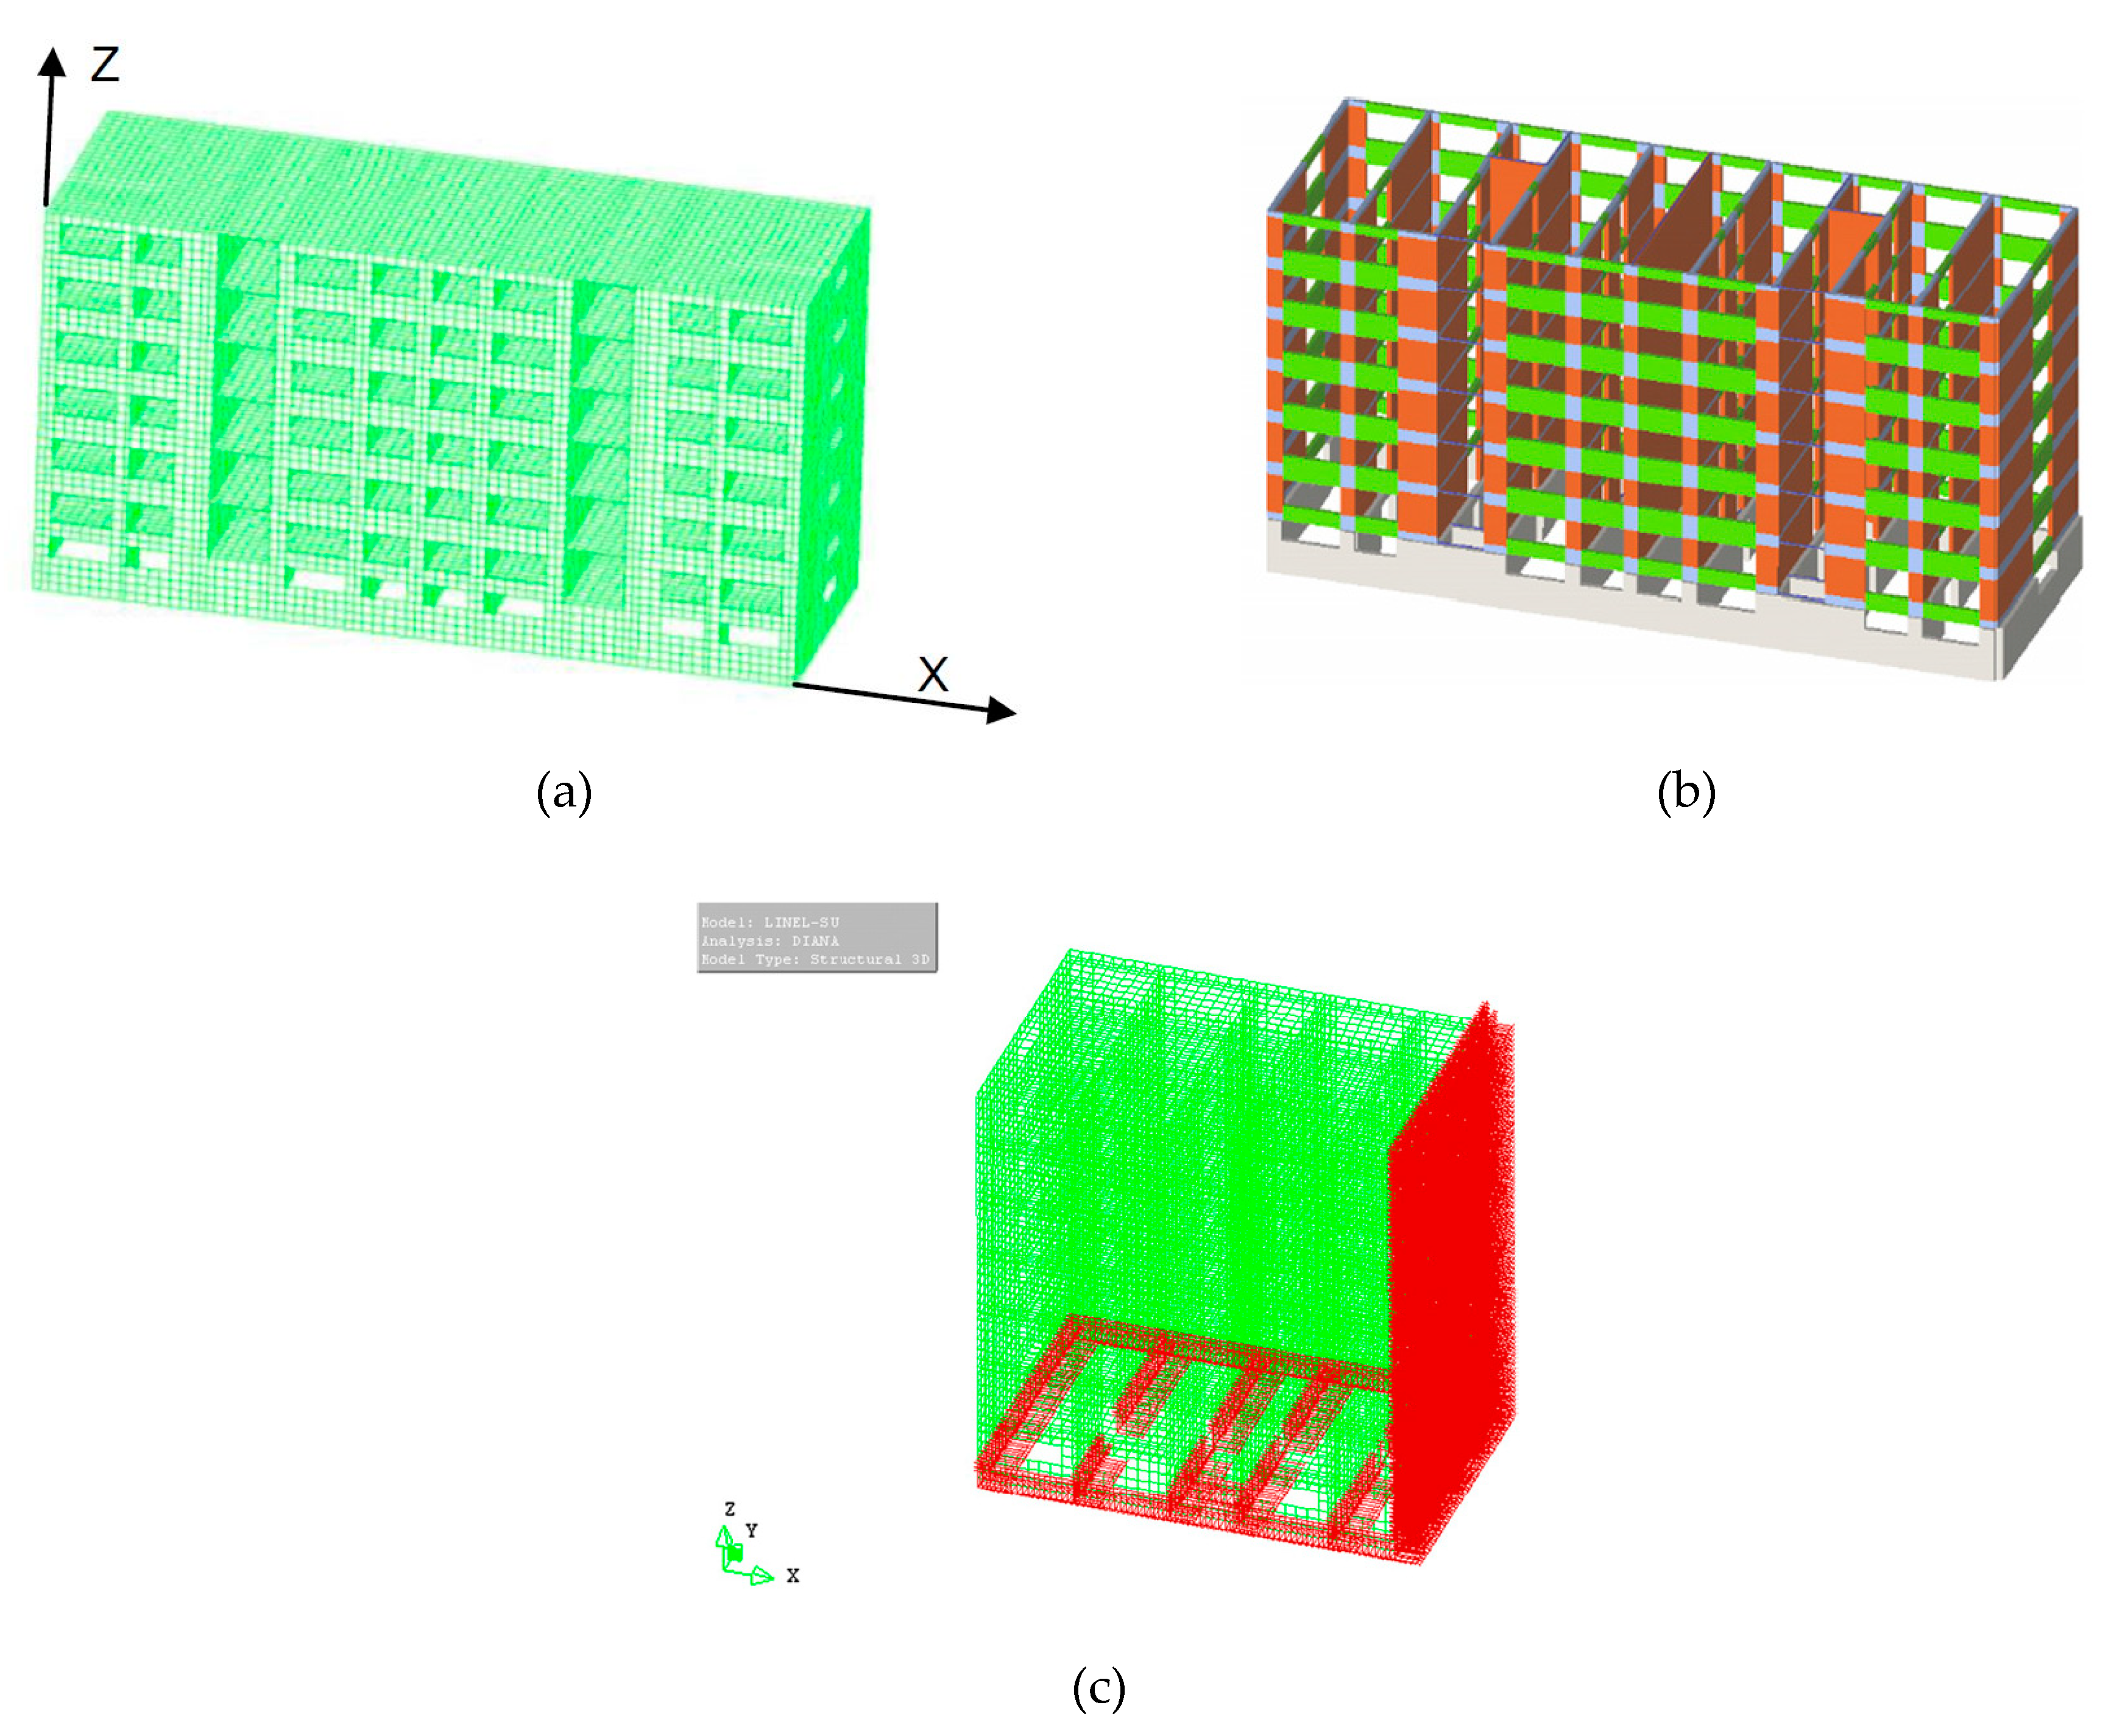
The building, depicted in
Figure 3a, was modelled using a finite element model (FEM) and the equivalent frame model (EFM), with the application of DIANA [
17] (
Figure 5a) and 3MURI [
18] (
Figure 5b), respectively. DIANA software [
19,
20,
21,
22,
23,
24], as well as 3Muri [
24,
25,
26,
27,
28,
29,
30], have been widely applied to model masonry structures. The structure was modeled with a curved shell (quadrilateral element CQ40S type) element. In FEM an element size was 0.25 m having a total of 84,523 nodes and 28,522 elements, while in the EFM, the number of 3D nodes was 218, 34 2D nodes, and 506 elements for the entire structure (
Figure 5a,b). In FEM only half of the structure was modeled and analyzed as the structure is symmetric, employing in total 15,759 CQ40S elements and 45,443 nodes (
Figure 5c). The applied adequate boundary conditions are indicated in
Table 2. Material nonlinearity properties of masonry [
31] were taken into account with the application of the total strain fixed crack model, as defined in DIANA [
17]. The post-cracked shear behavior was introduced by a very low shear retention factor. The physical and material characteristics taken in the analysis are given in
Table 3.
Dynamic characteristics of the structure are important for understanding its dynamic behavior under earthquake actions. The natural frequencies and mode shapes of the entire structure were determined by modal analysis. The first eigen frequency in FEM was 2.19 Hz, while in EFM it amounted to 1.96 Hz and the first mode in both cases was the translation in the X direction [
5,
6,
29]. Furthermore, the values of frequencies are consistent with the data provided by Tomaževič [
32], indicating: “For higher structures even up to 11-storeys the value are close to 2 Hz even though buildings have been built with different materials”. This was used as a verification parameter of the model as no ambient vibration tests were conducted on the structure.
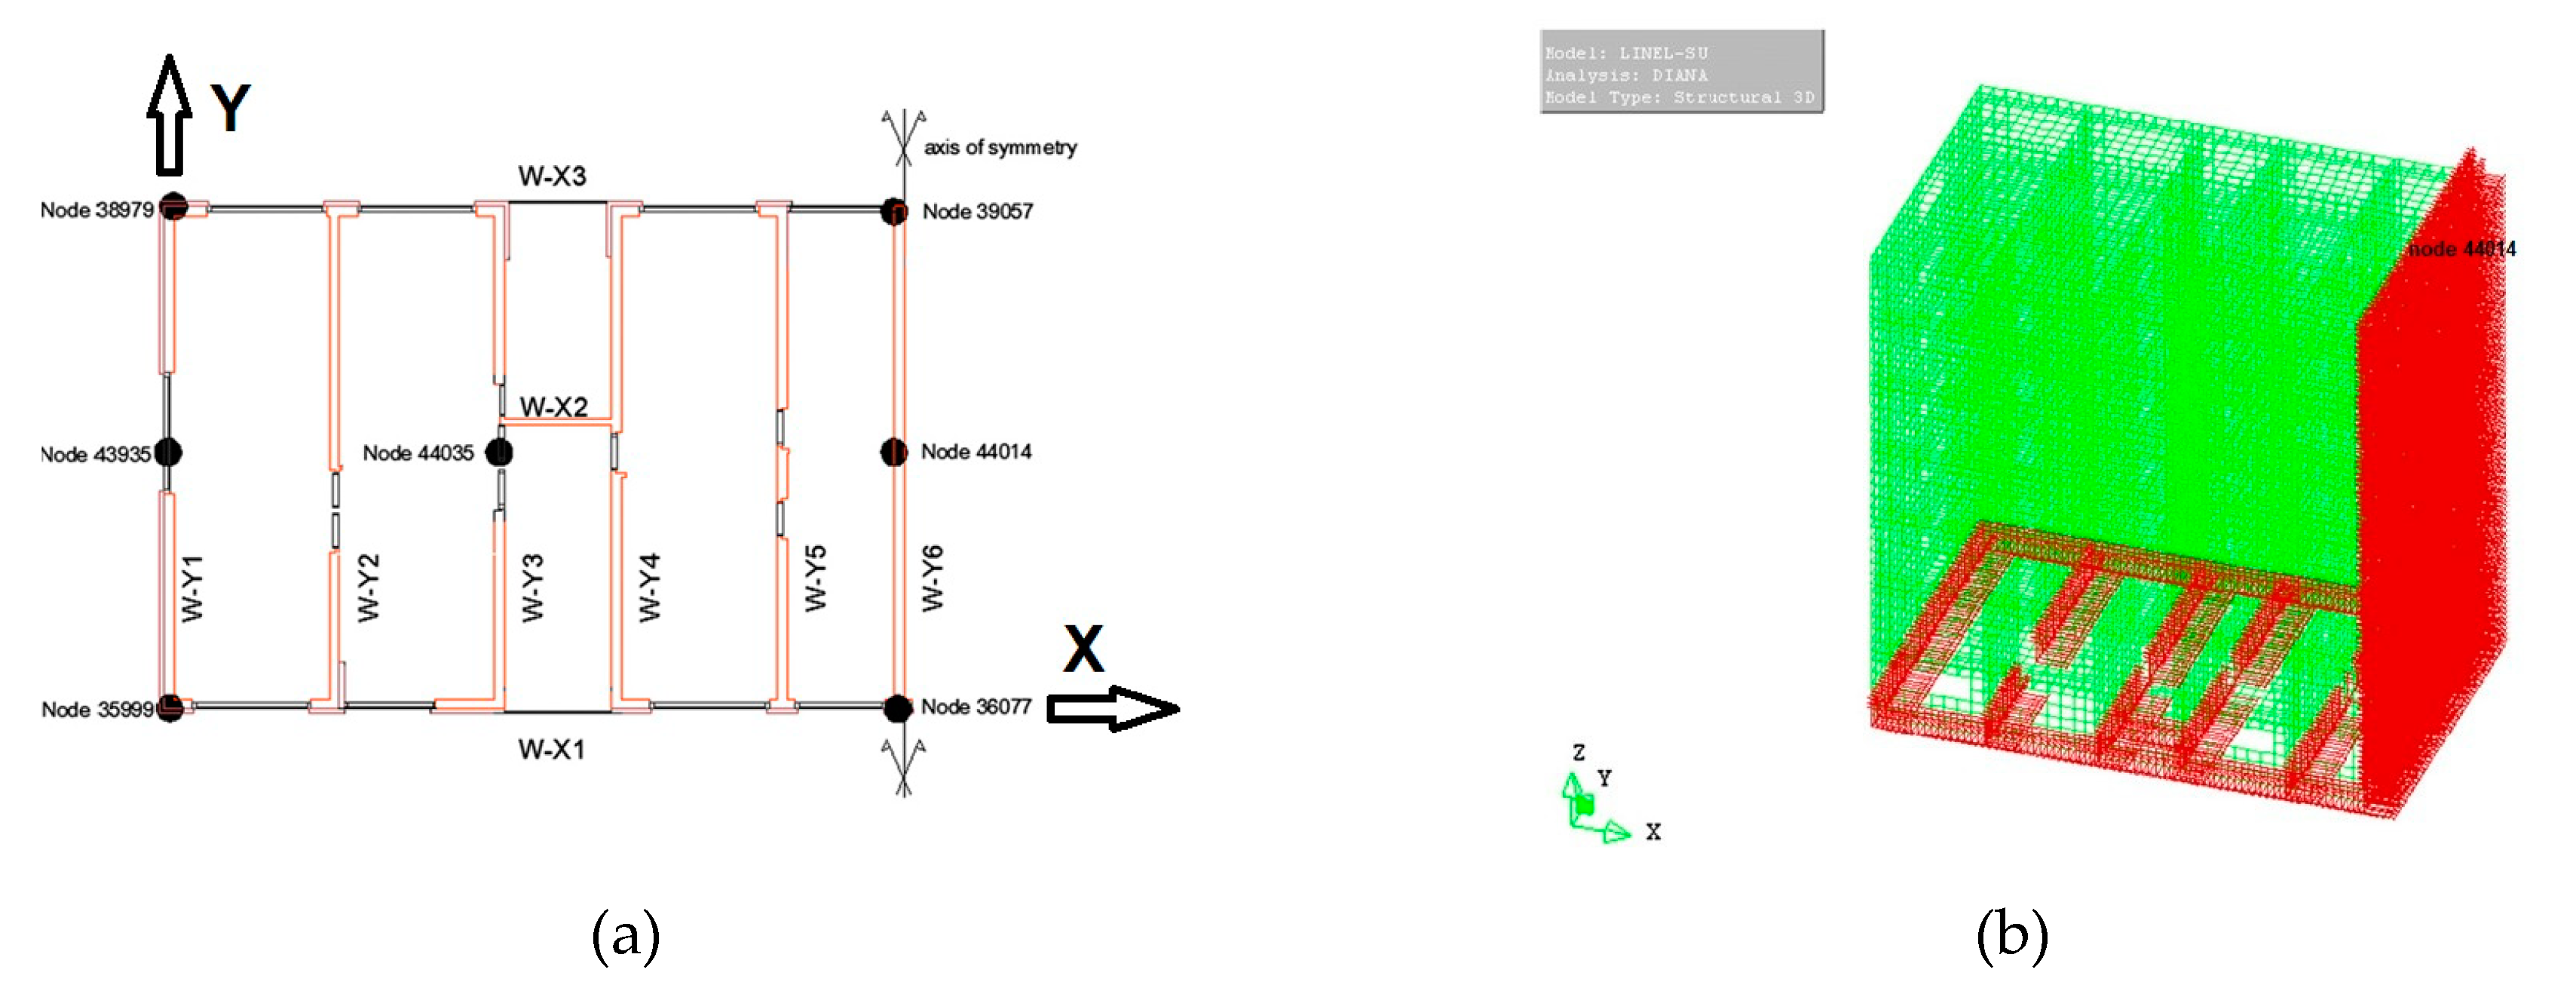
Figure 6a shows the labeling of the walls in the structure in the two directions as well as the numbers of the nodes on the top floor of the structure. The node used to monitor the top displacement is located at the axis of symmetry in the center of the structure (referred to as node 44014) (
Figure 6b). For more details regarding the numerical model of the structure and material characteristics the reader is referred to references [
5,
6].
3. Results of the Unstrengthened Configuration
The FEM model was used to perform pushover and time history analysis, while the EFM model was only used to conduct pushover analysis. Comparing the pushover curves obtained from the two models, the difference in the maximum load coefficient was in the range of 6.4% to 6.9%, which is considered as an acceptable range [
5,
6]. Here, the load coefficient is the ratio between the base shear forces due to pushover (y direction) and the sum of all vertical loads (z direction).
Results show that the EFM model is stiffer in comparison to the FEM model. The difference in the stiffness could be attributed to the rigid connections between the spandrel and the pier elements. Spandrels mainly influence the boundary conditions of piers [
33]. The time history analysis in FEM was compared with pushover analysis in EFM just in the view of distribution of pattern damage and it was evident that it follows the same sequence [
5,
6]. The location of the cracks were around the opening and, as the windows are very close to the corner of the walls (75 to 100 cm), this is weakening the connection between the walls causing additional concentration of stresses and crack development. The major damage is concentrated on the ground floor. The two models gave results that were in excellent correlation, however for the sake of computational efficiency, it was decided to continue the further analysis with the EFM model.
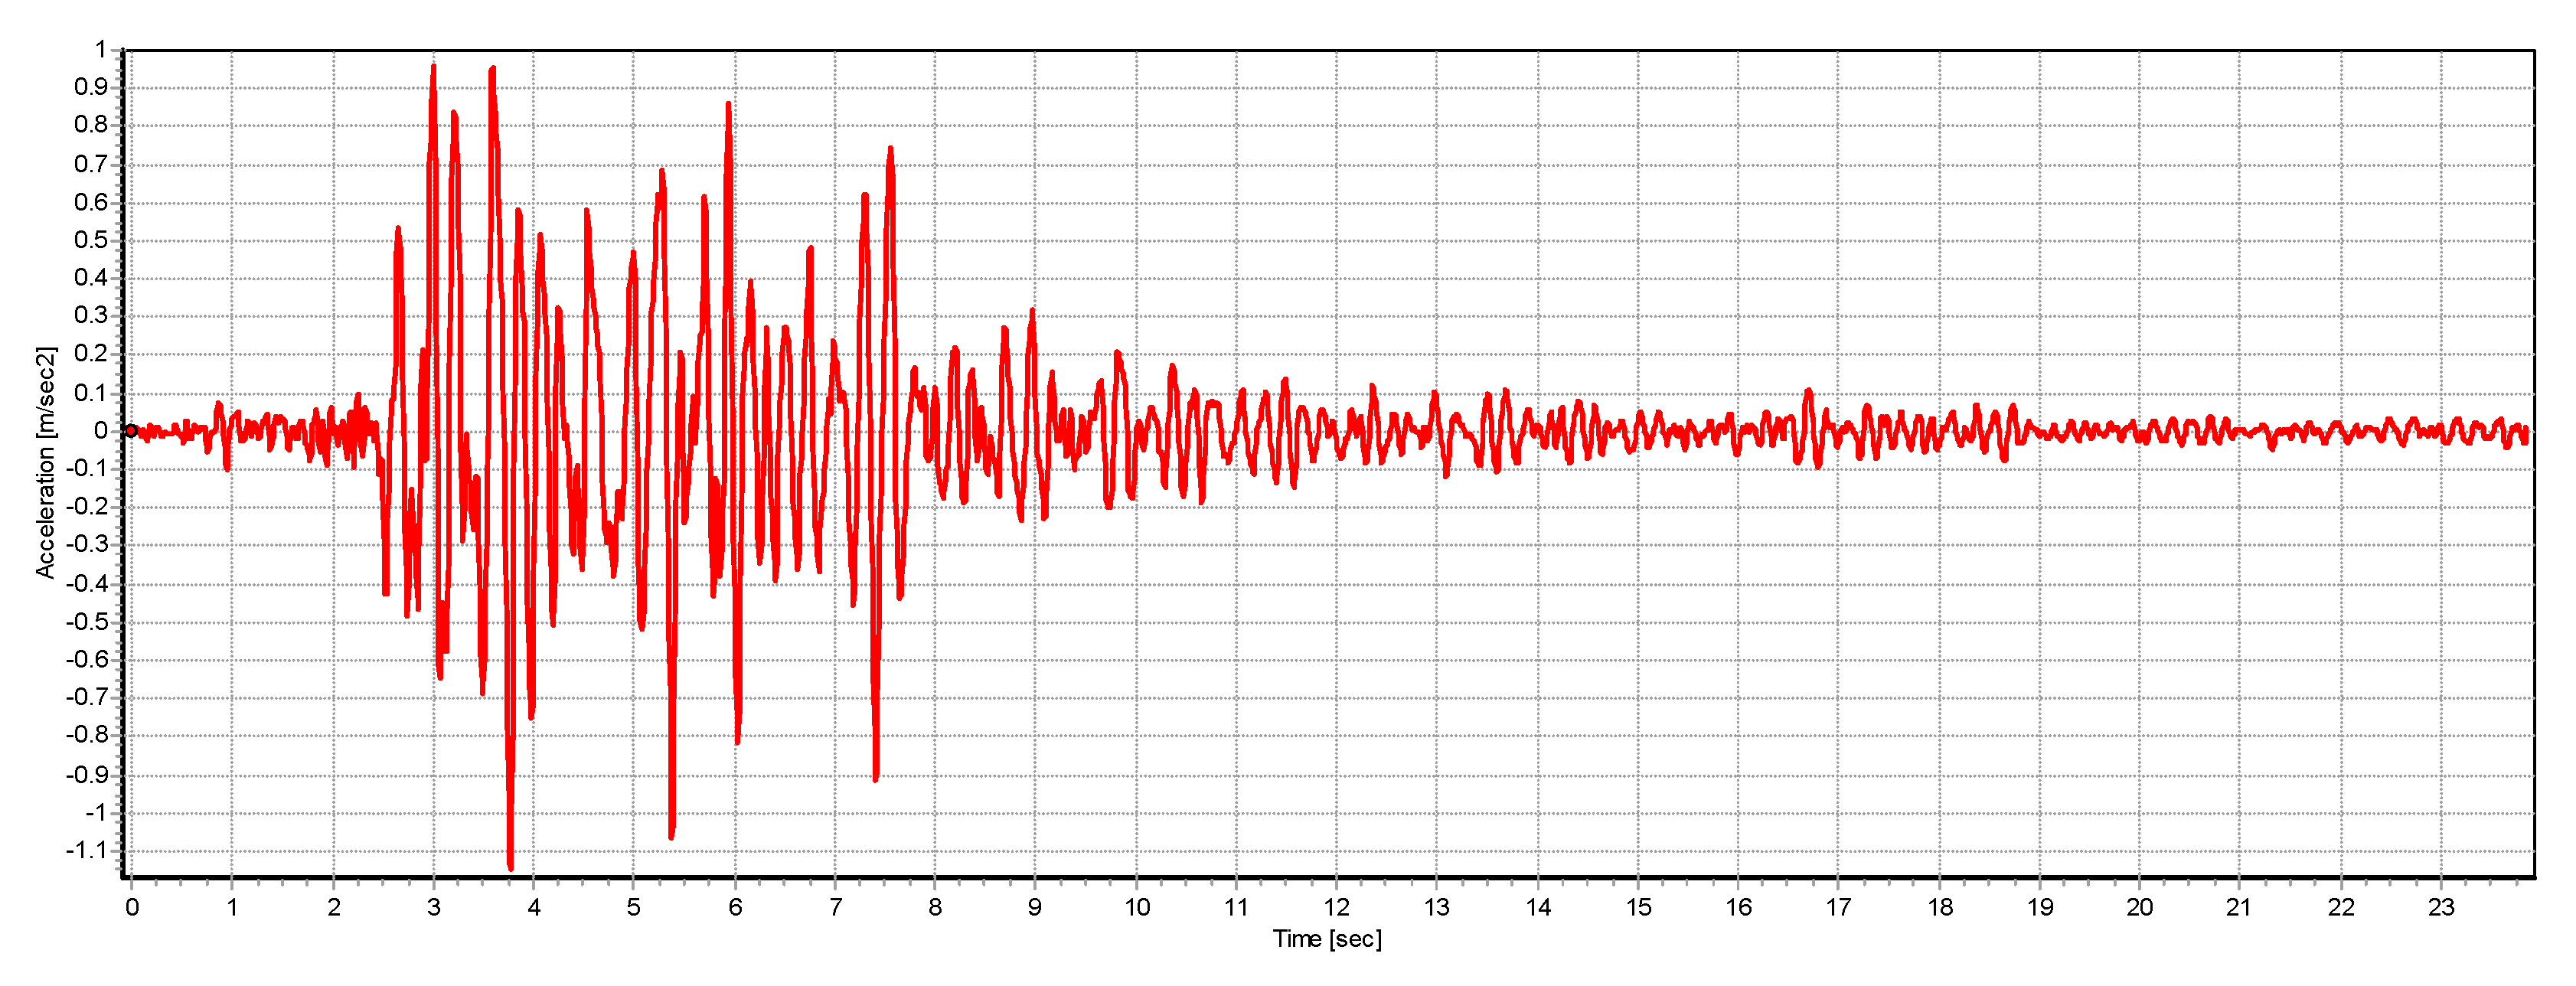
In order to generate the response of the structure to various PGA values, the structure was exposed to the short-period 1979 Petrovac strong earthquake motion registered at Montenegro. This acceleration record is commonly used for seismic structural assessment throughout the region [
34,
35]. In order to take into account the ground motion in Sarajevo, according to the new seismic hazard map, the accelerogram from the Petrovac earthquake (with a PGA of 0.43 g) was scaled down to 0.1 g (
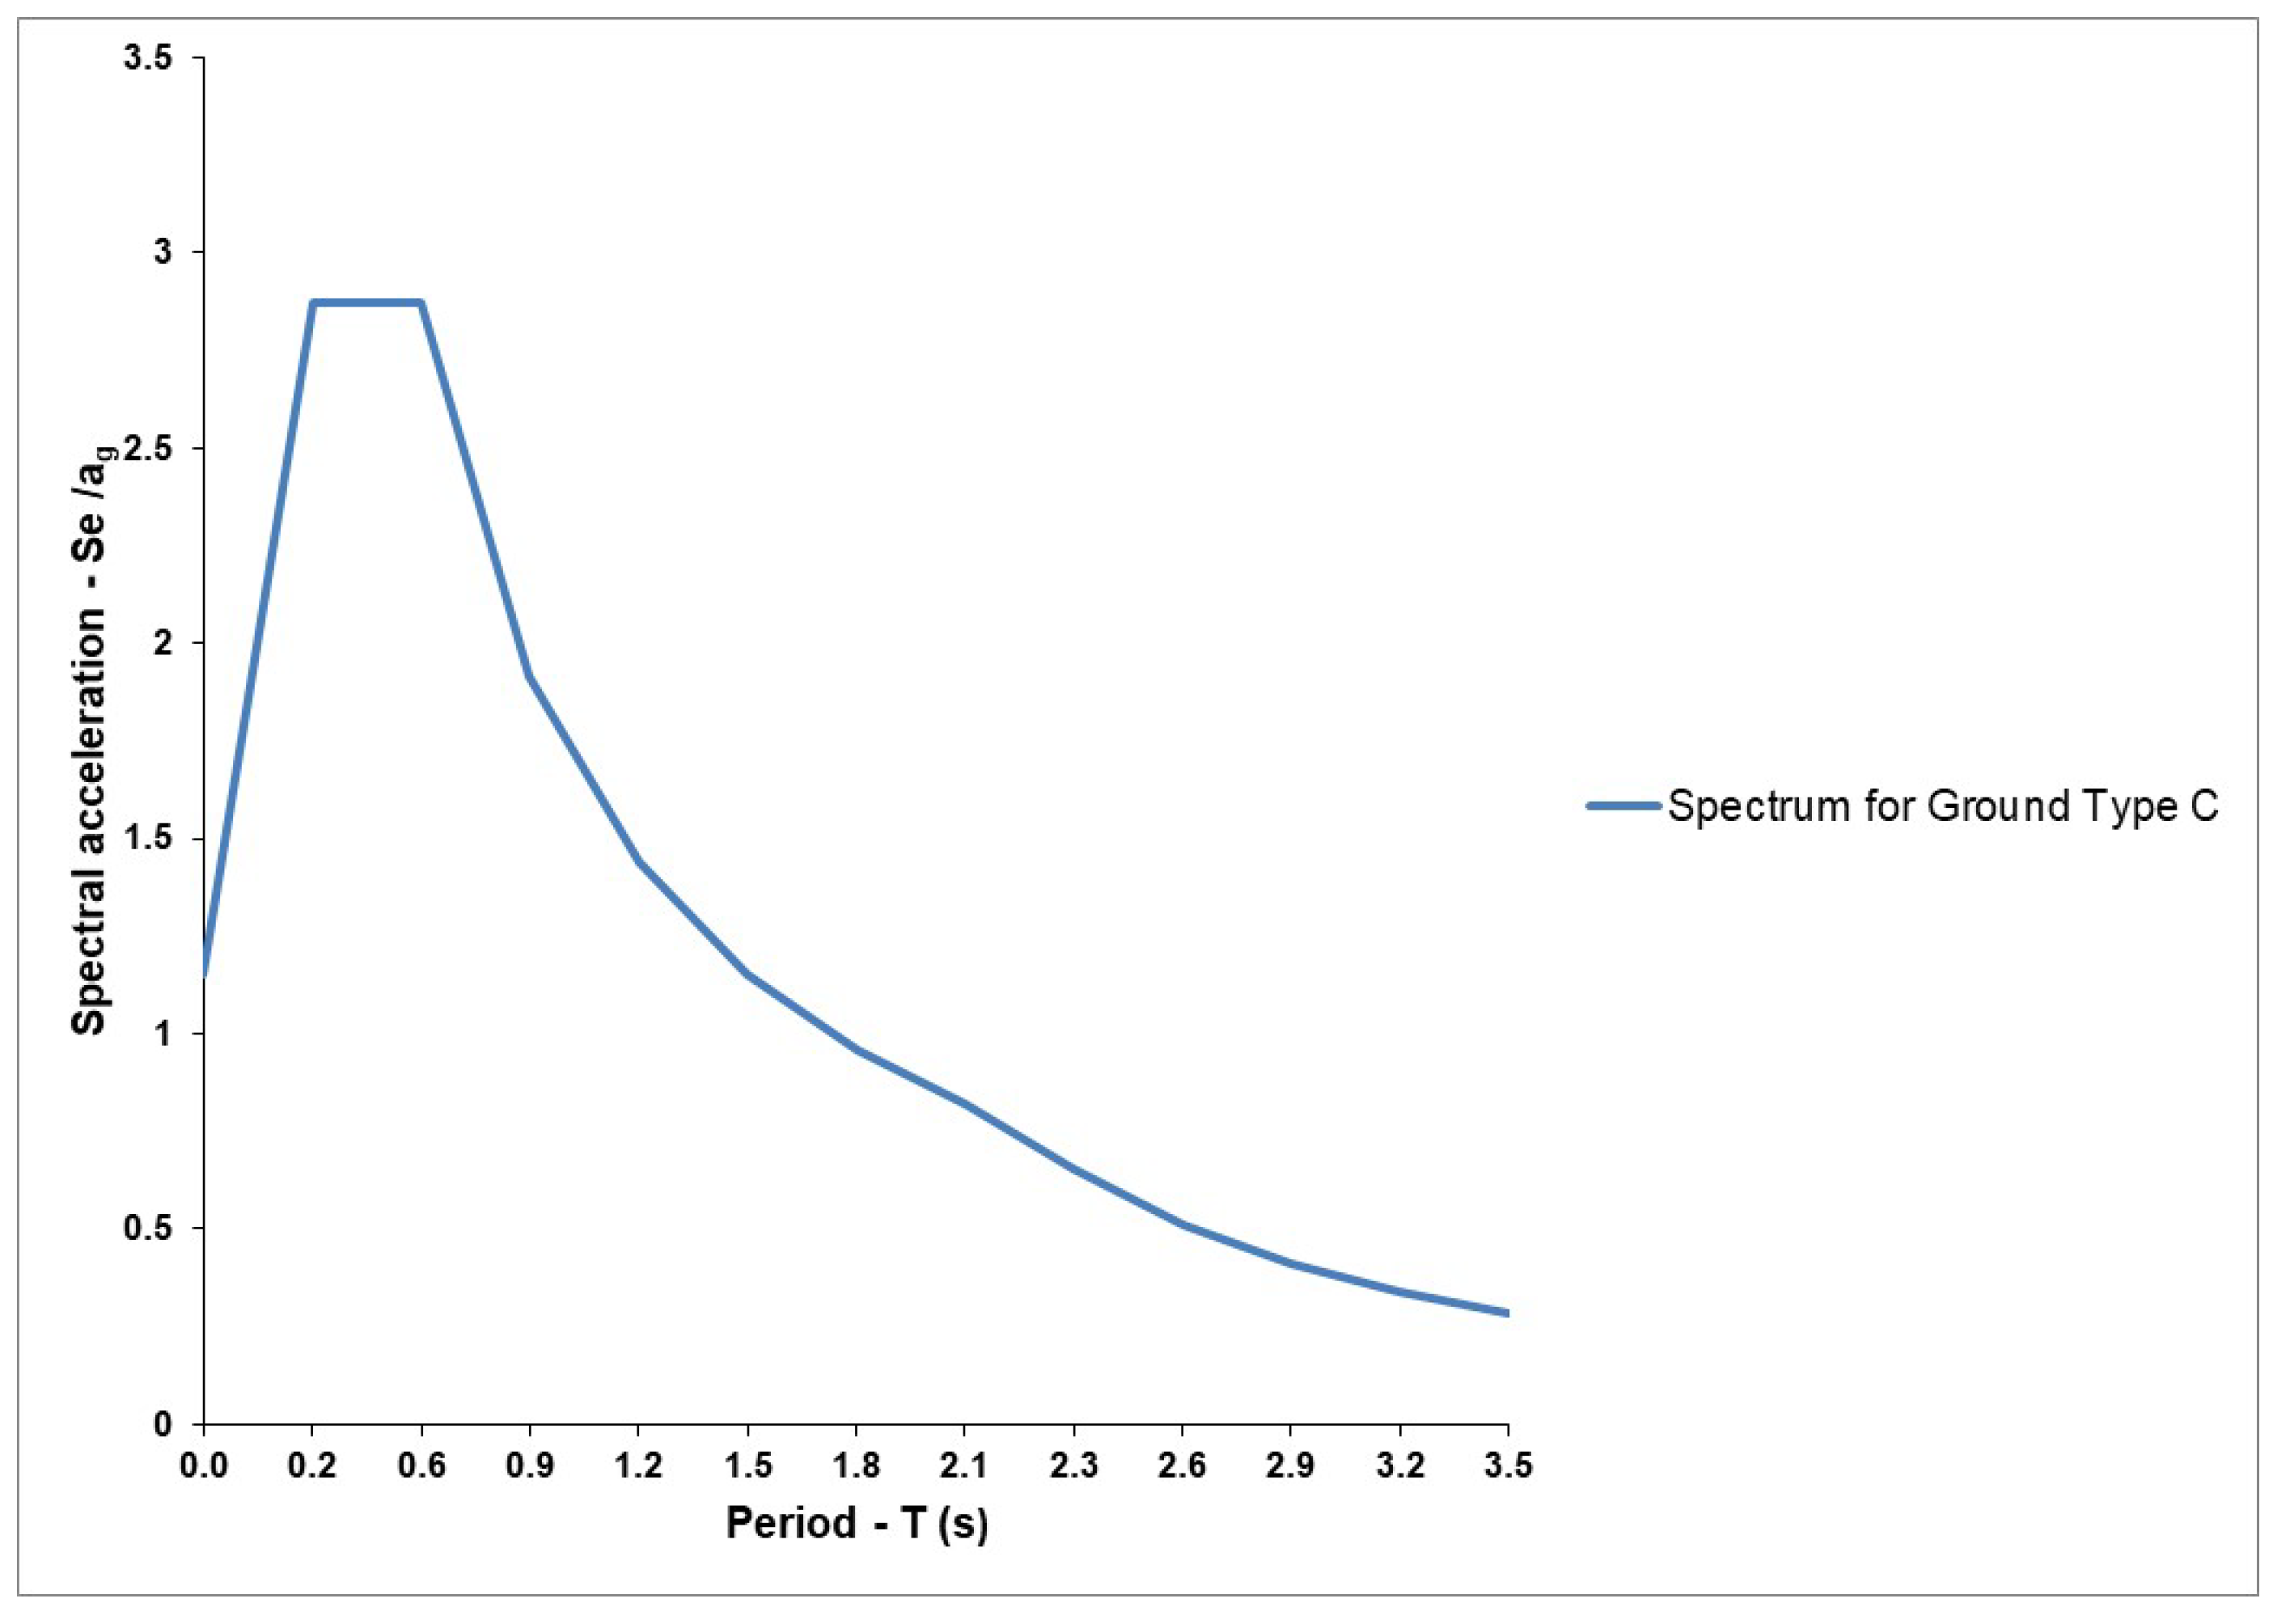
Figure 7) and 0.2 g. Seismosignal software [
36] was used for scaling and filtering the acceleration record. The code response spectrum used in the EFM model is presented in
Figure 8 for 0.1 g.
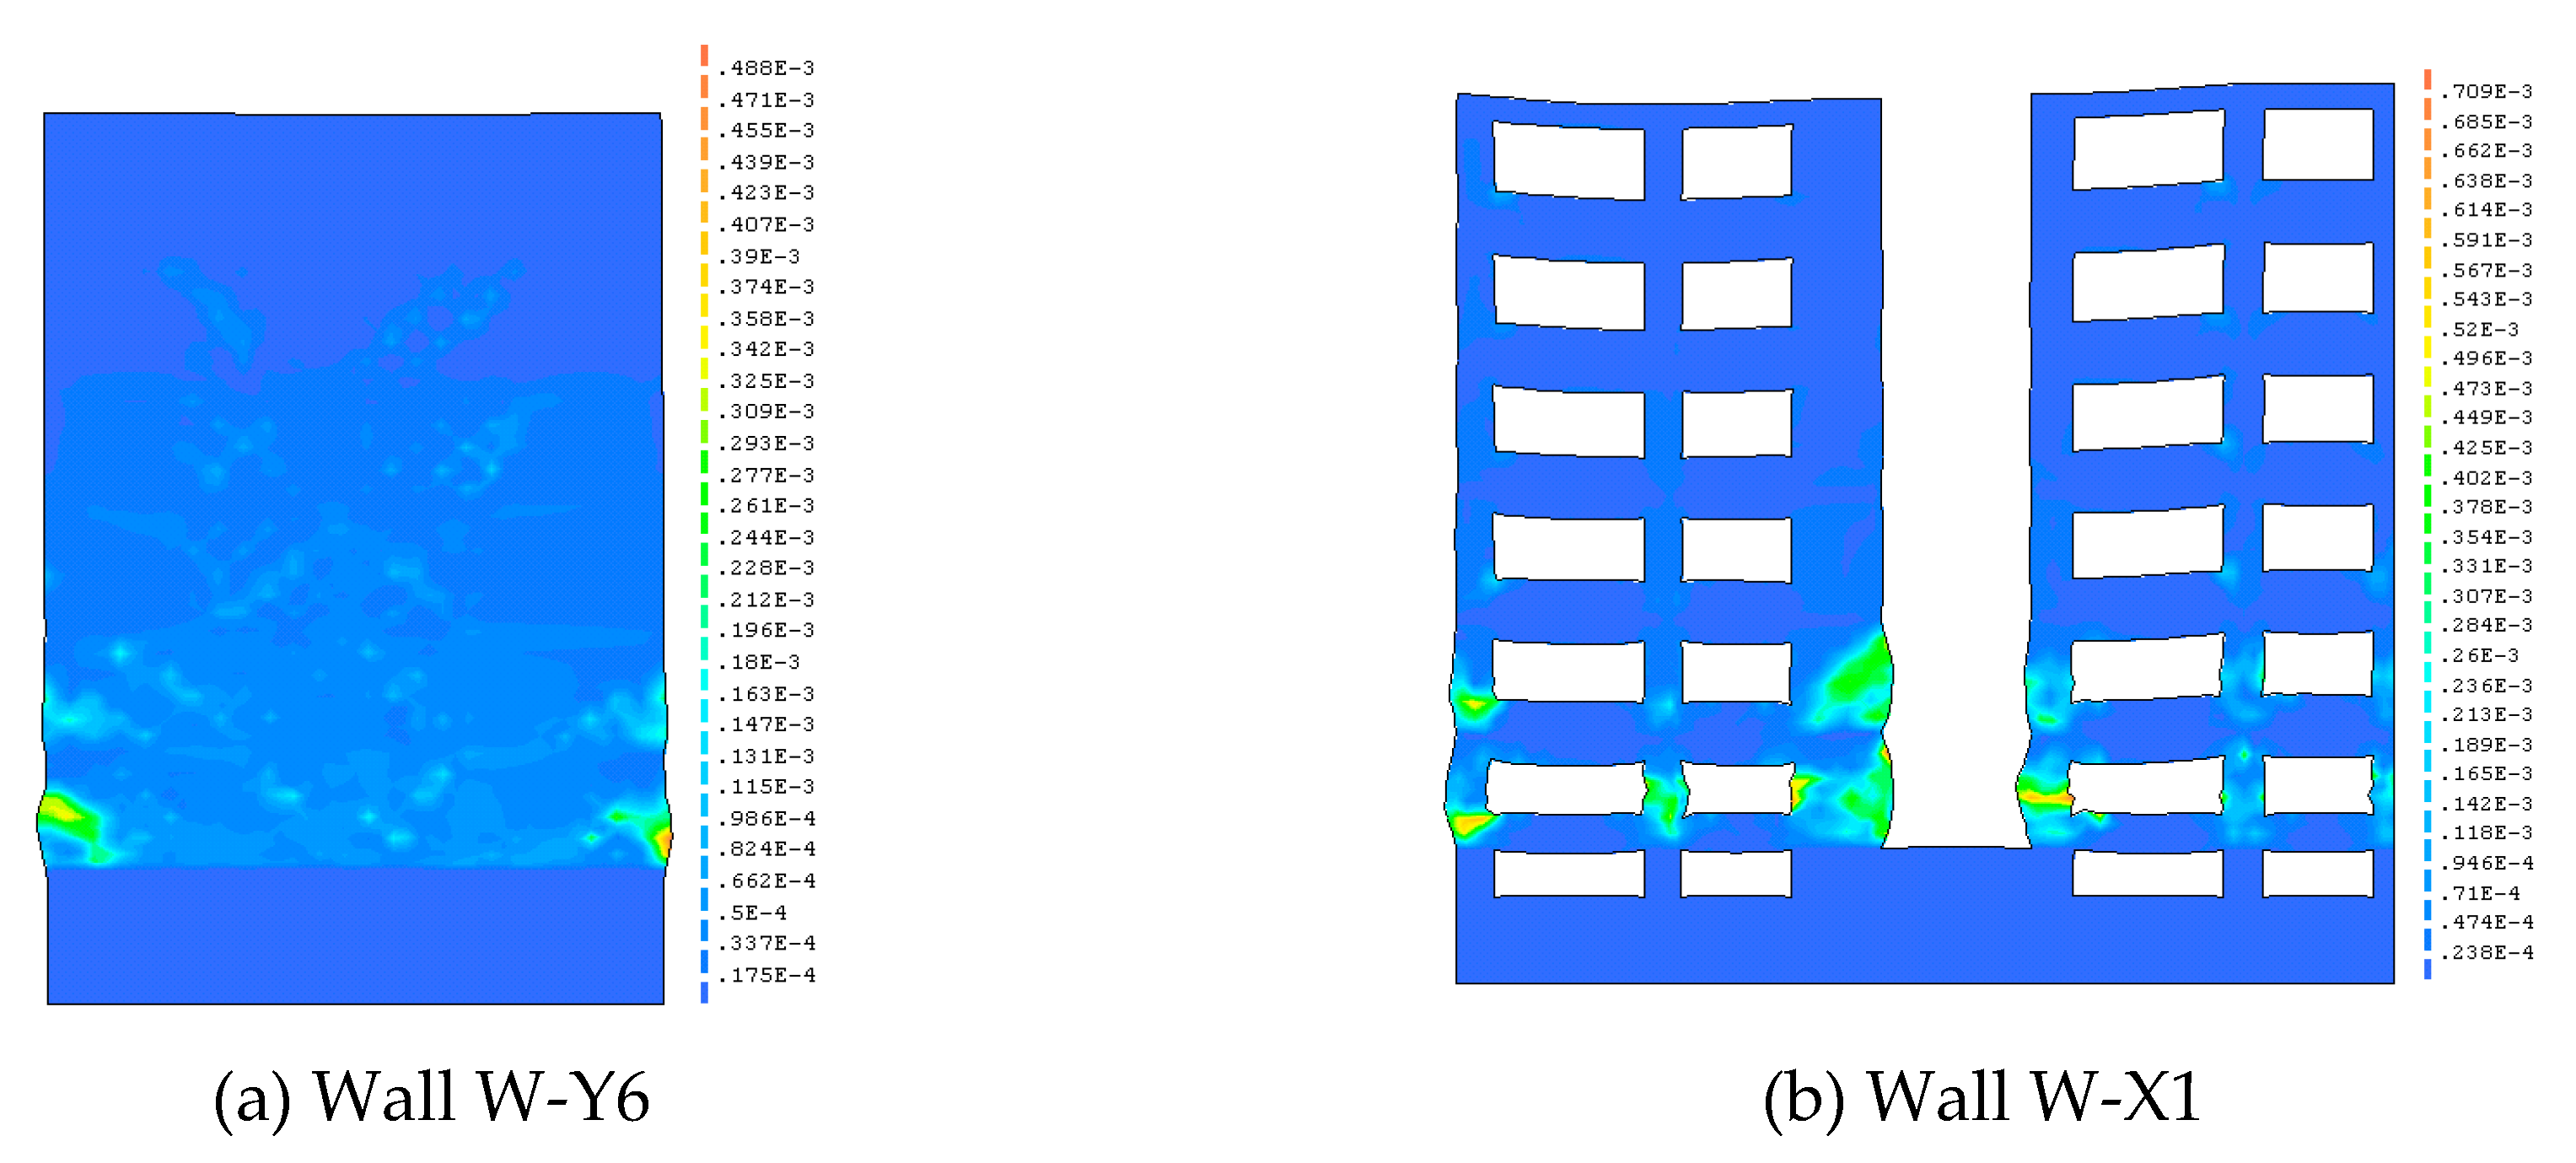
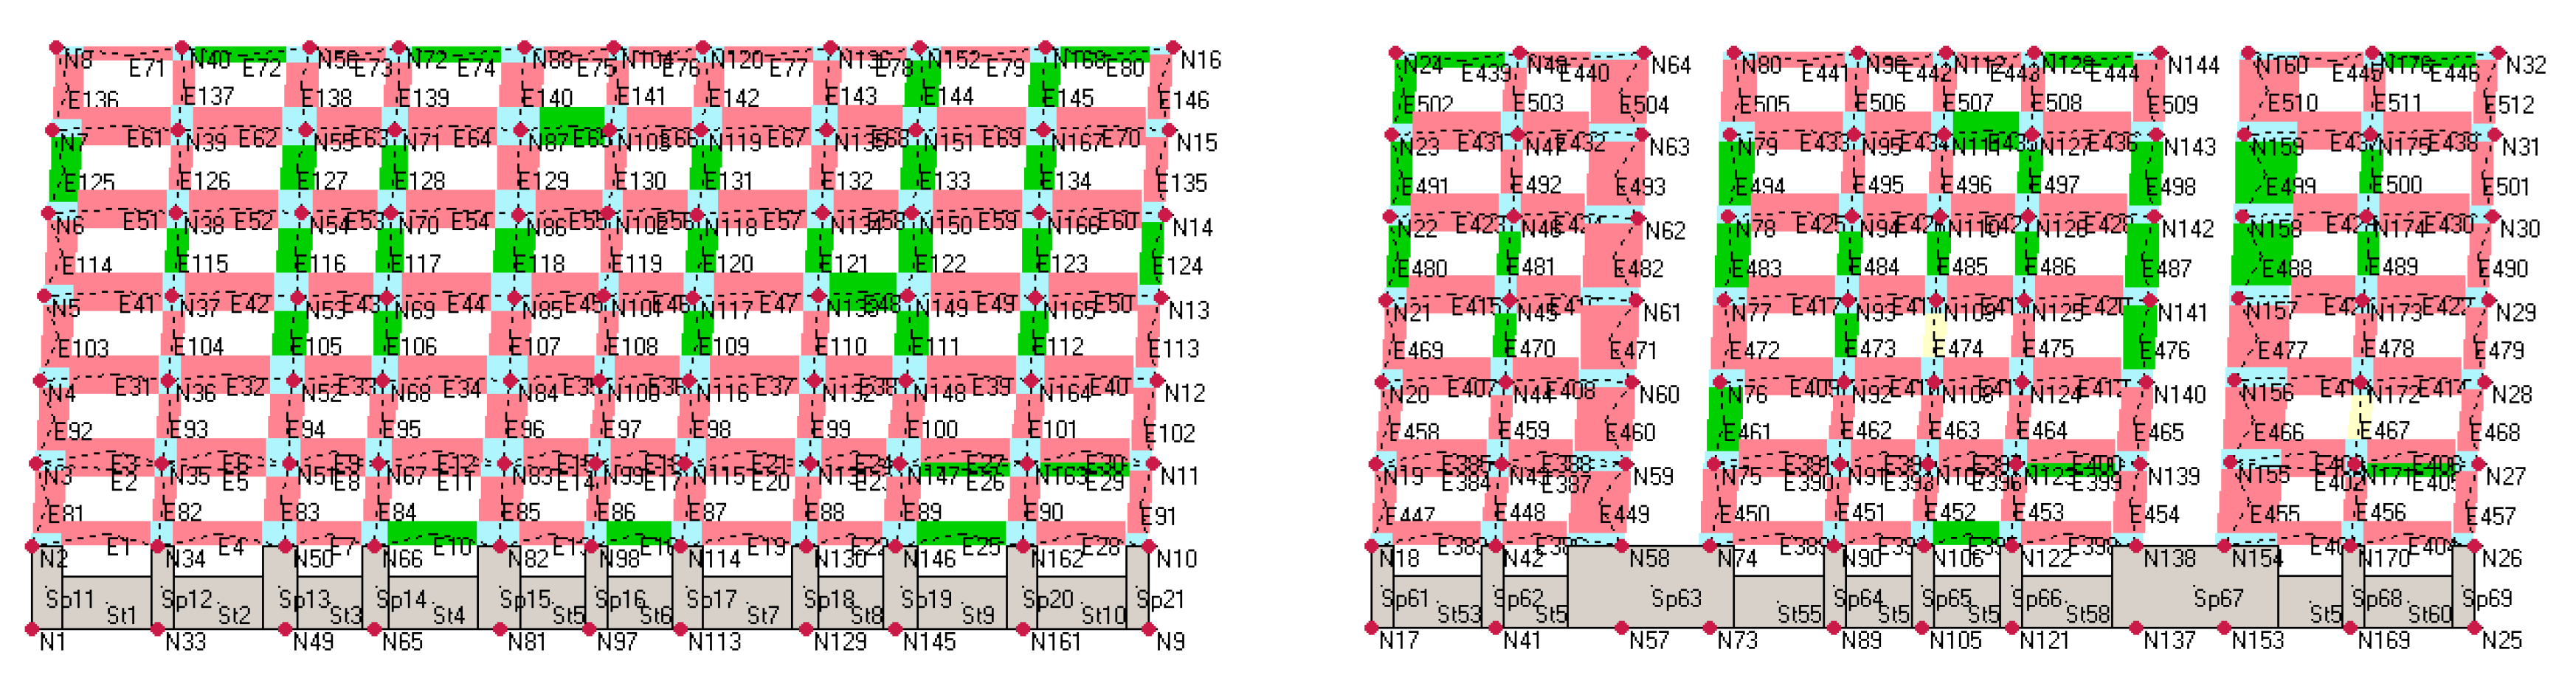
Due to the earthquake action of 0.1 g, in the Y direction, formation of typical diagonal cracks (
Figure 9a) were noticed with concentration of the damage at the ground level (
Figure 9b) (connection between the concrete basement and masonry structure) after 24 seconds.
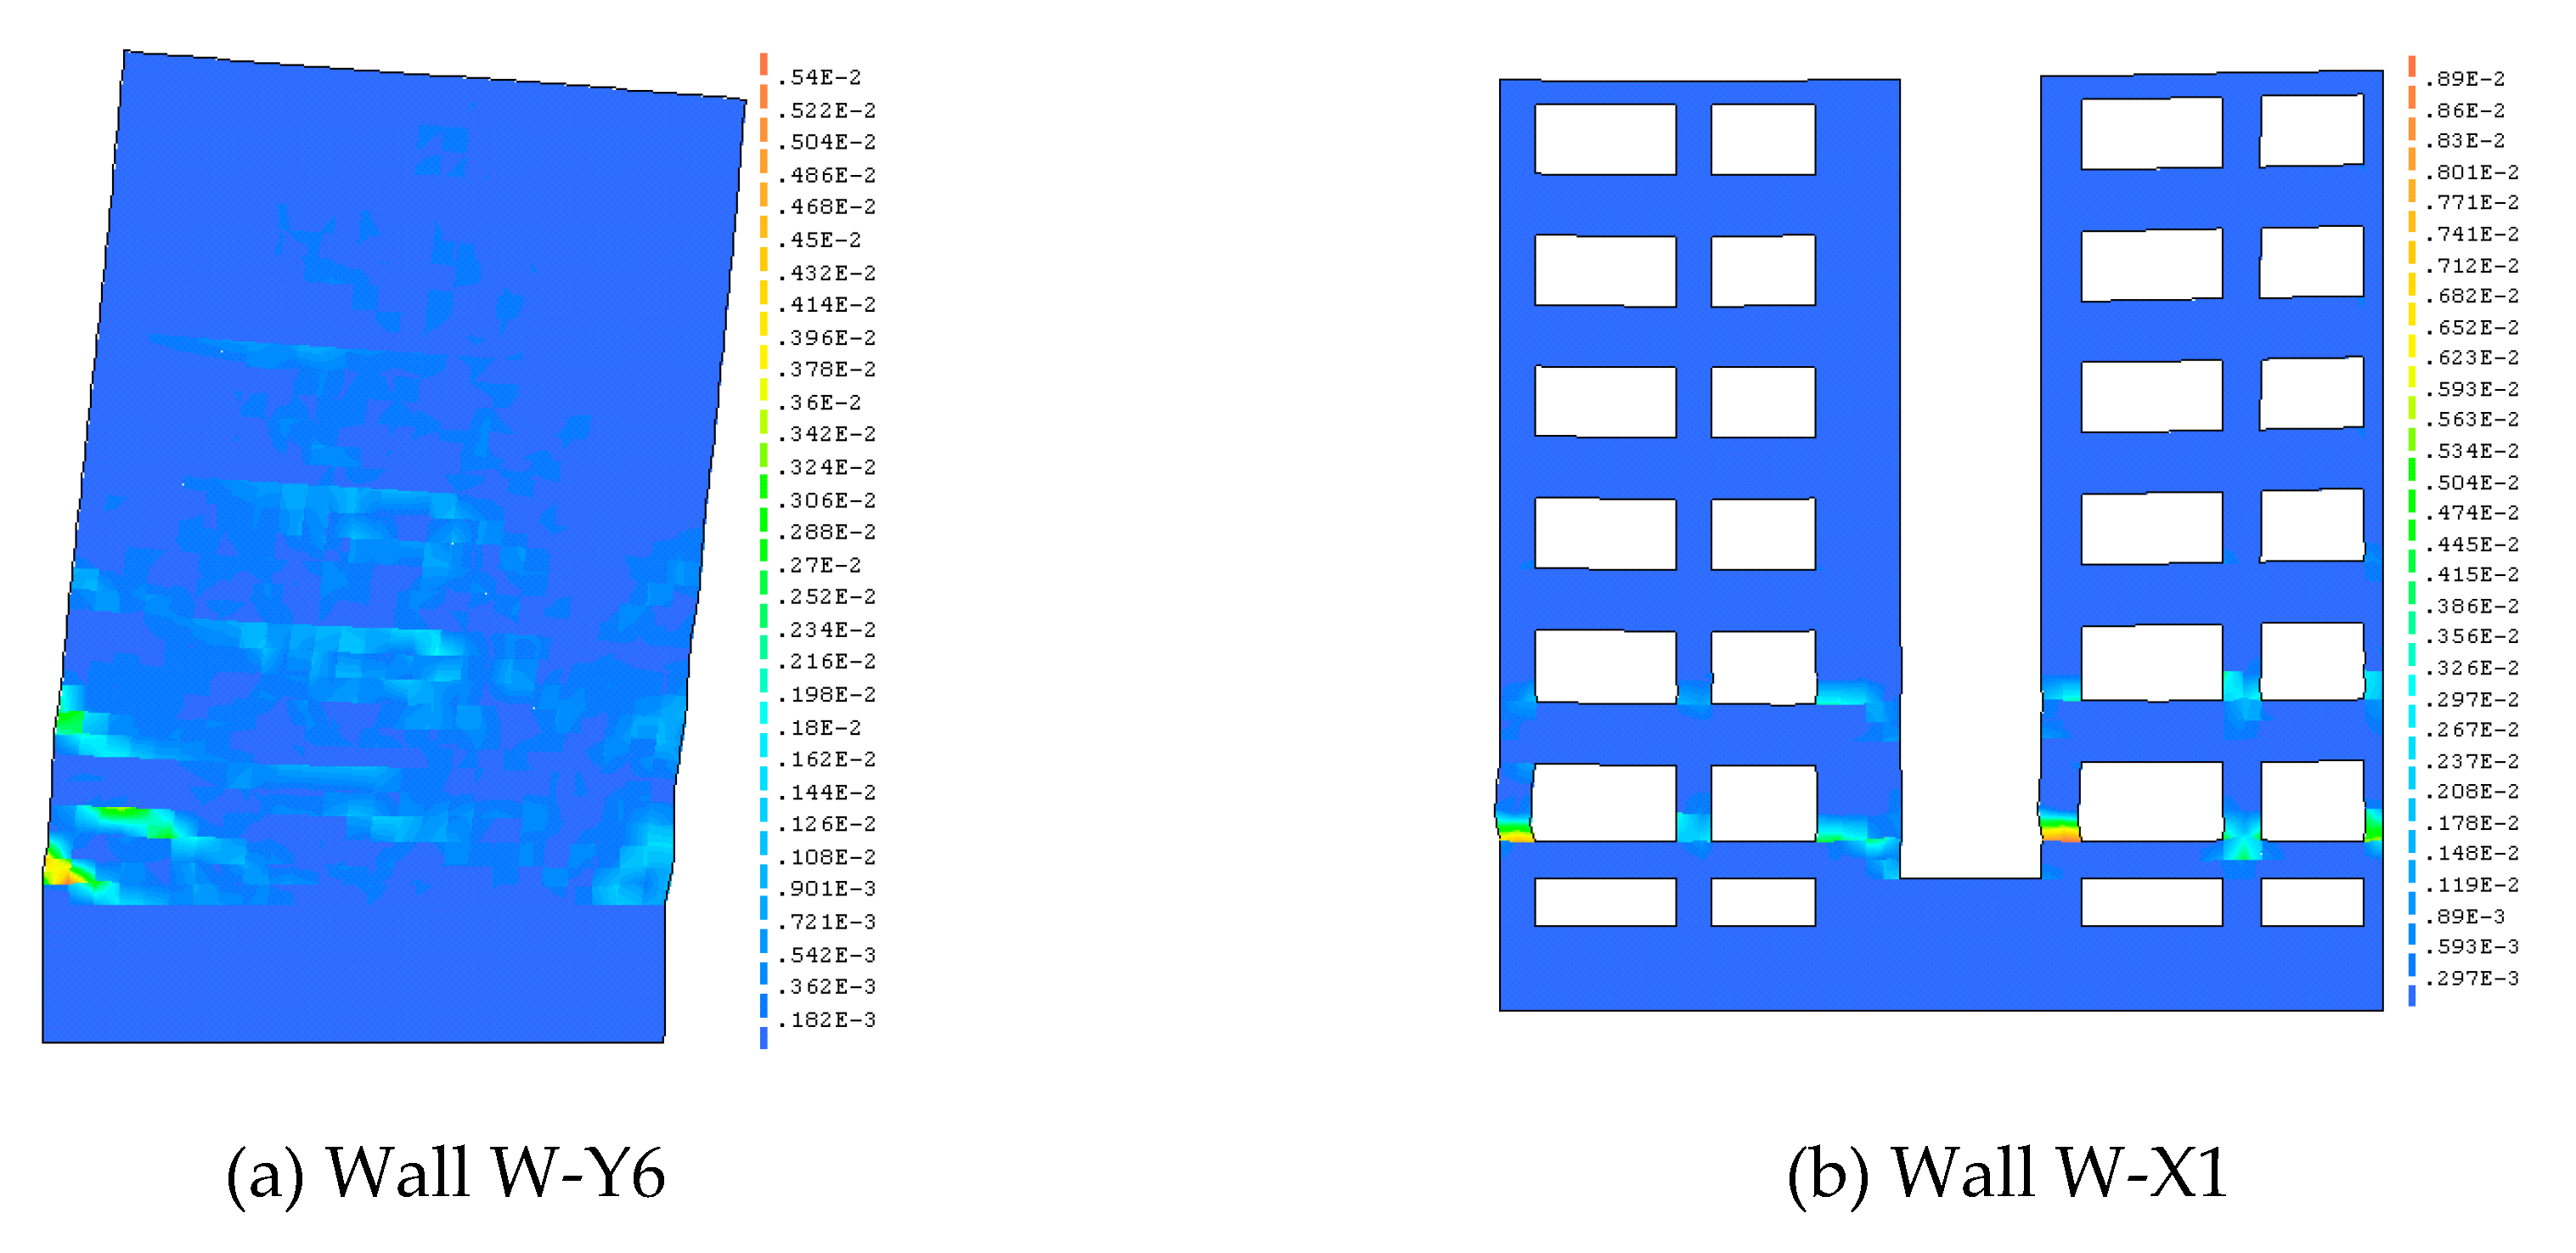
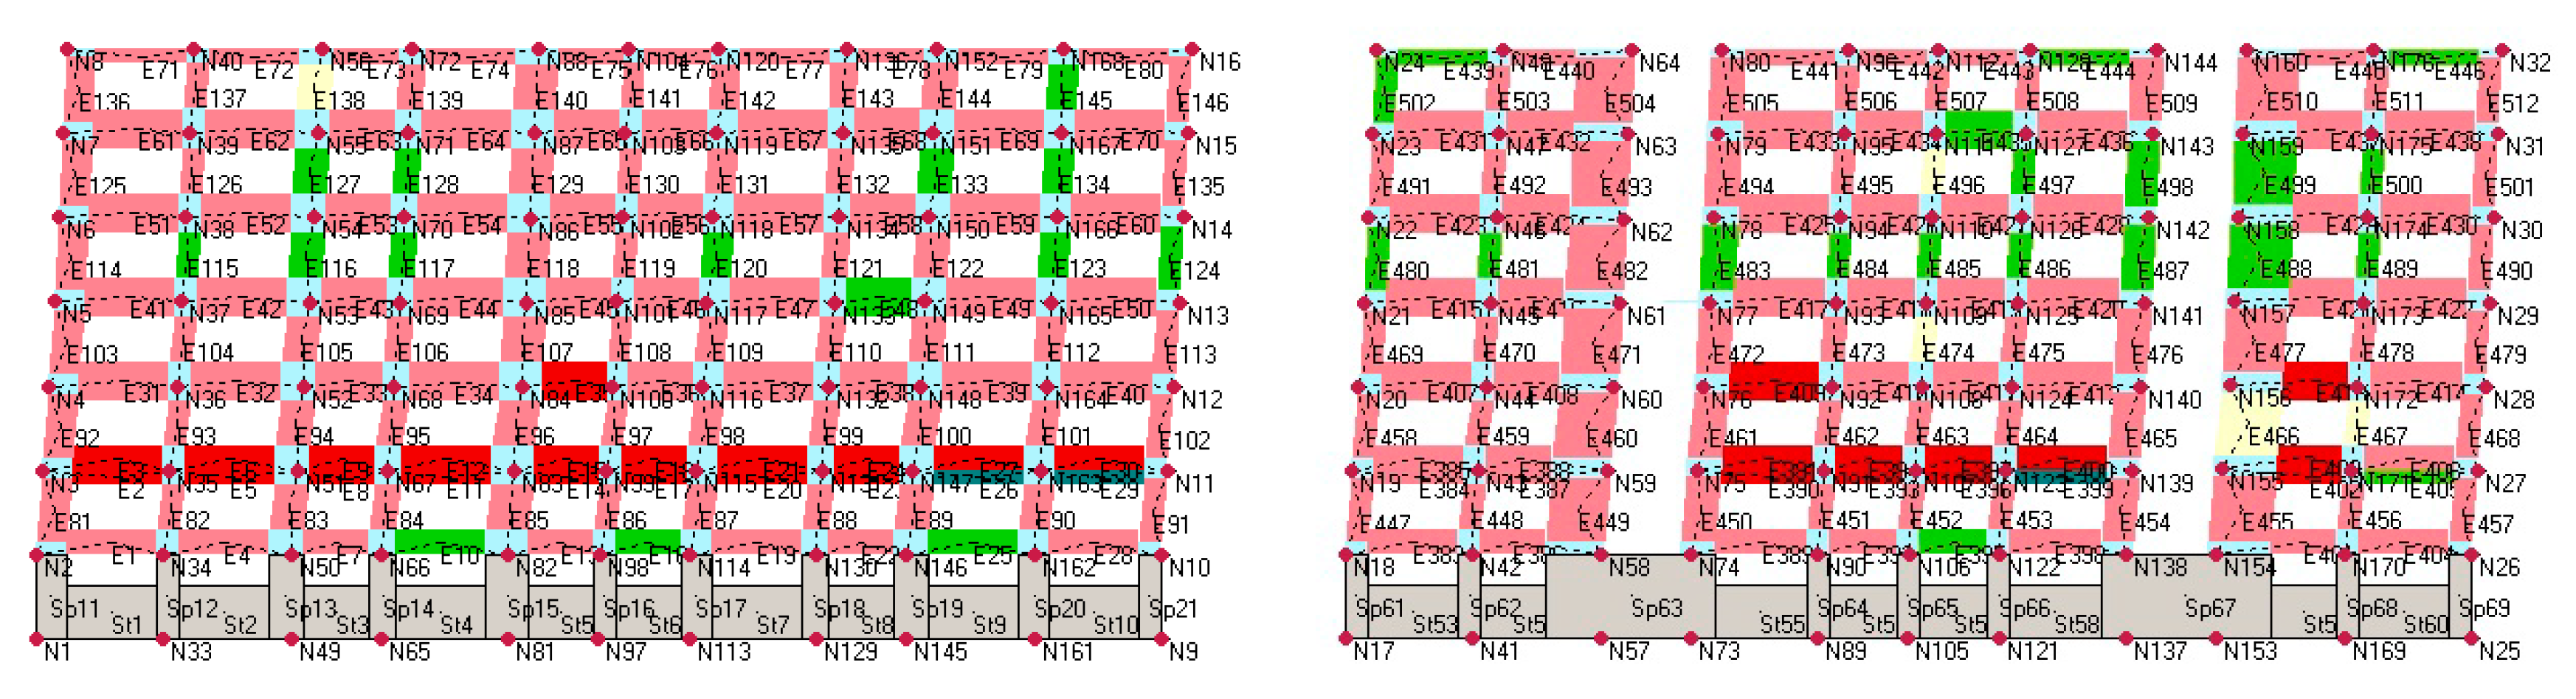
On the other hand, it was only after 3.89 seconds that the structure showed significant damage, which caused the collapse of the structure, when the structure was exposed to 0.2 g of the same earthquake (
Figure 10a,b).
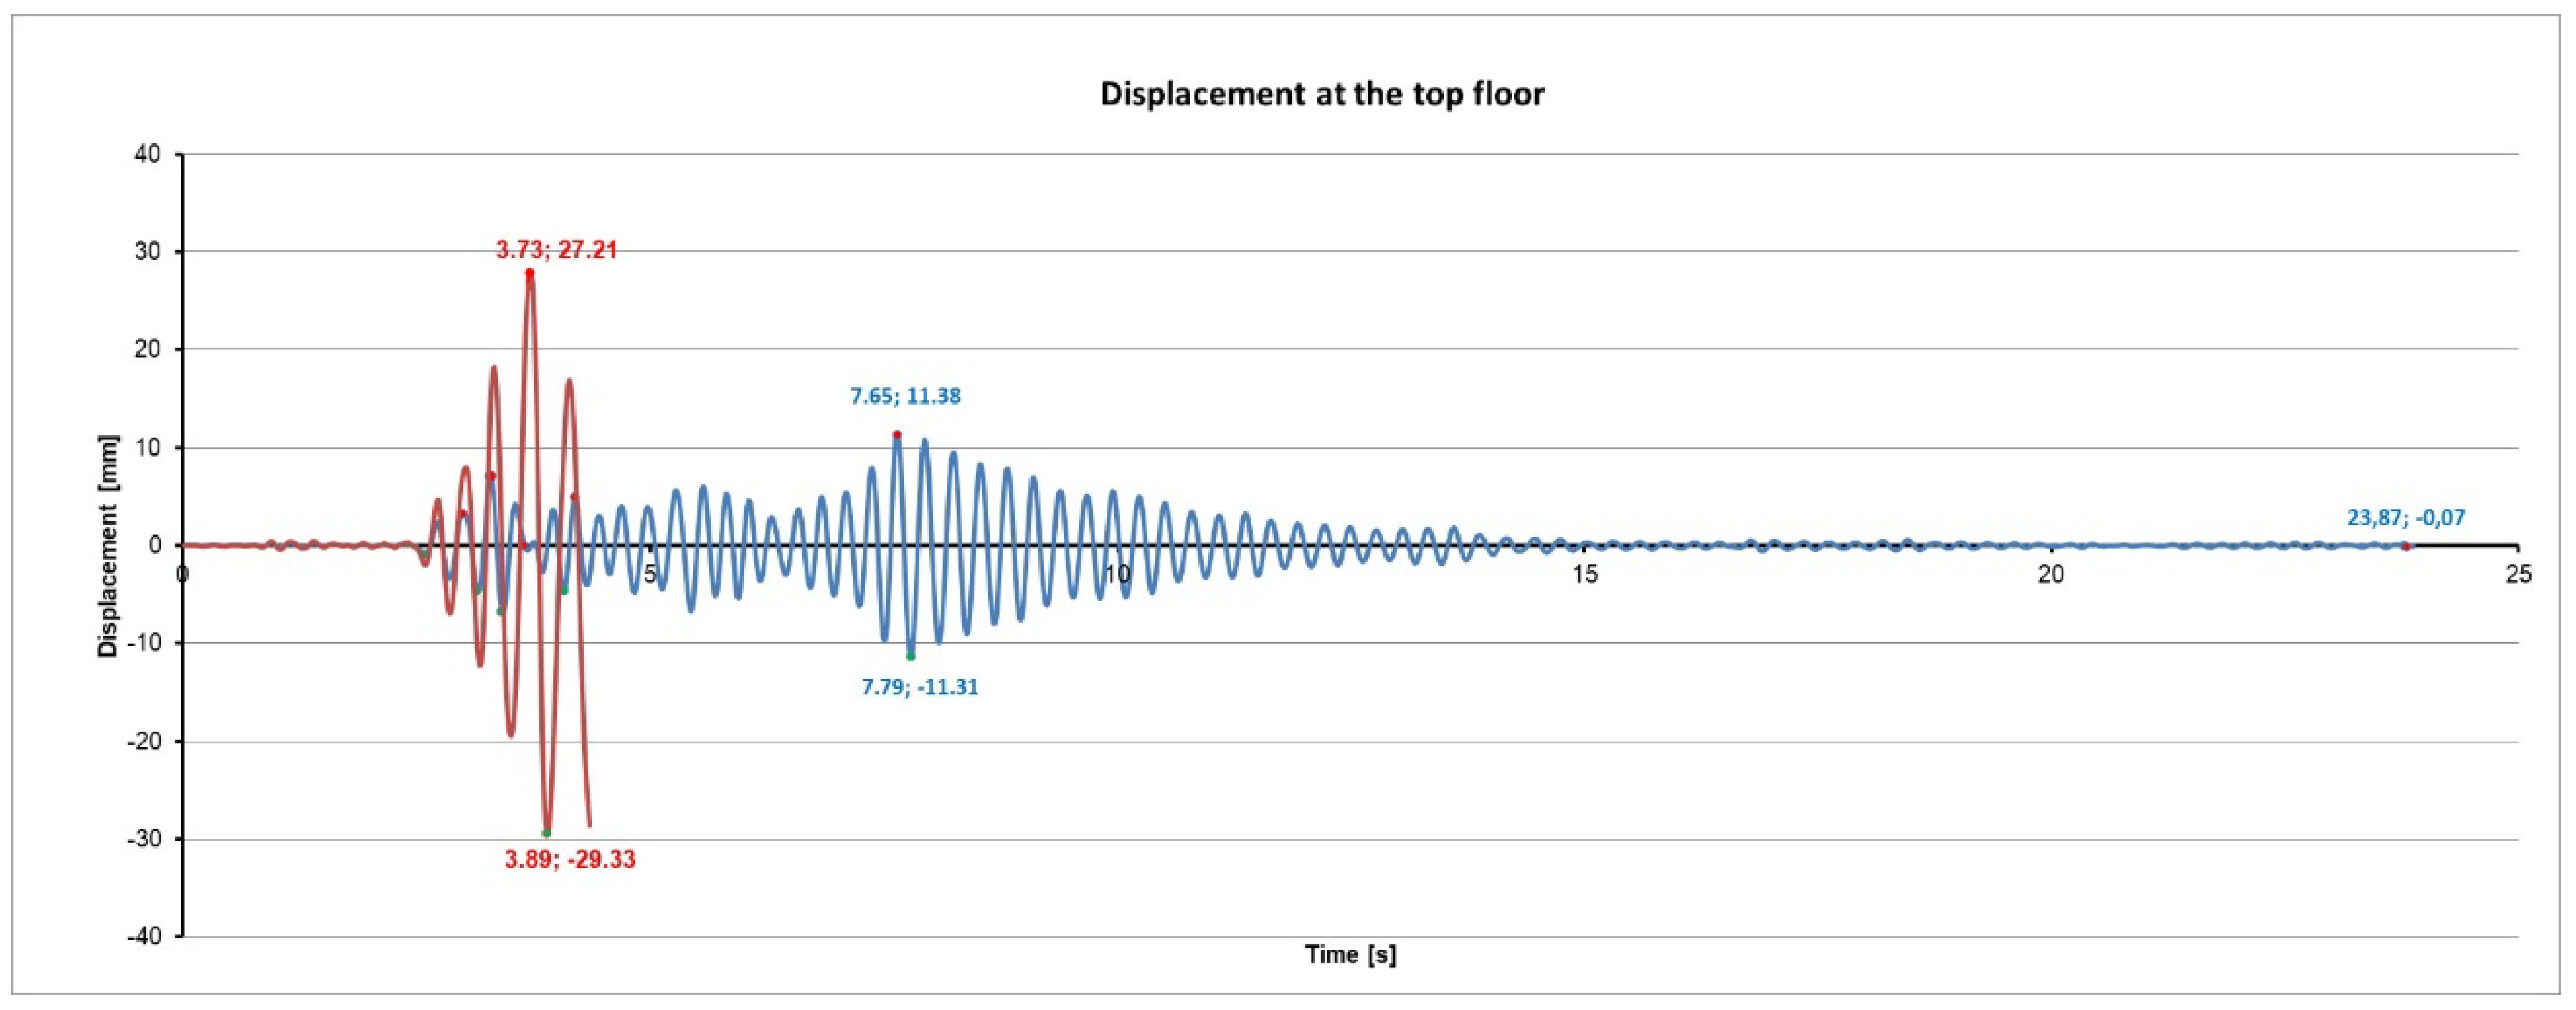
From
Figure 11 it is evident that, once the structure is exposed to the Petrovac ground motion scaled to 0.2 g, it undergoes very large displacements with a maximum of 29.33 cm after only 3.89 s, which is 2.6 times larger than when the structure was exposed to a 0.1 g scaled accelerogram. It is evident that these types of structures are highly vulnerable to such seismic actions and strengthening measures should be proposed.
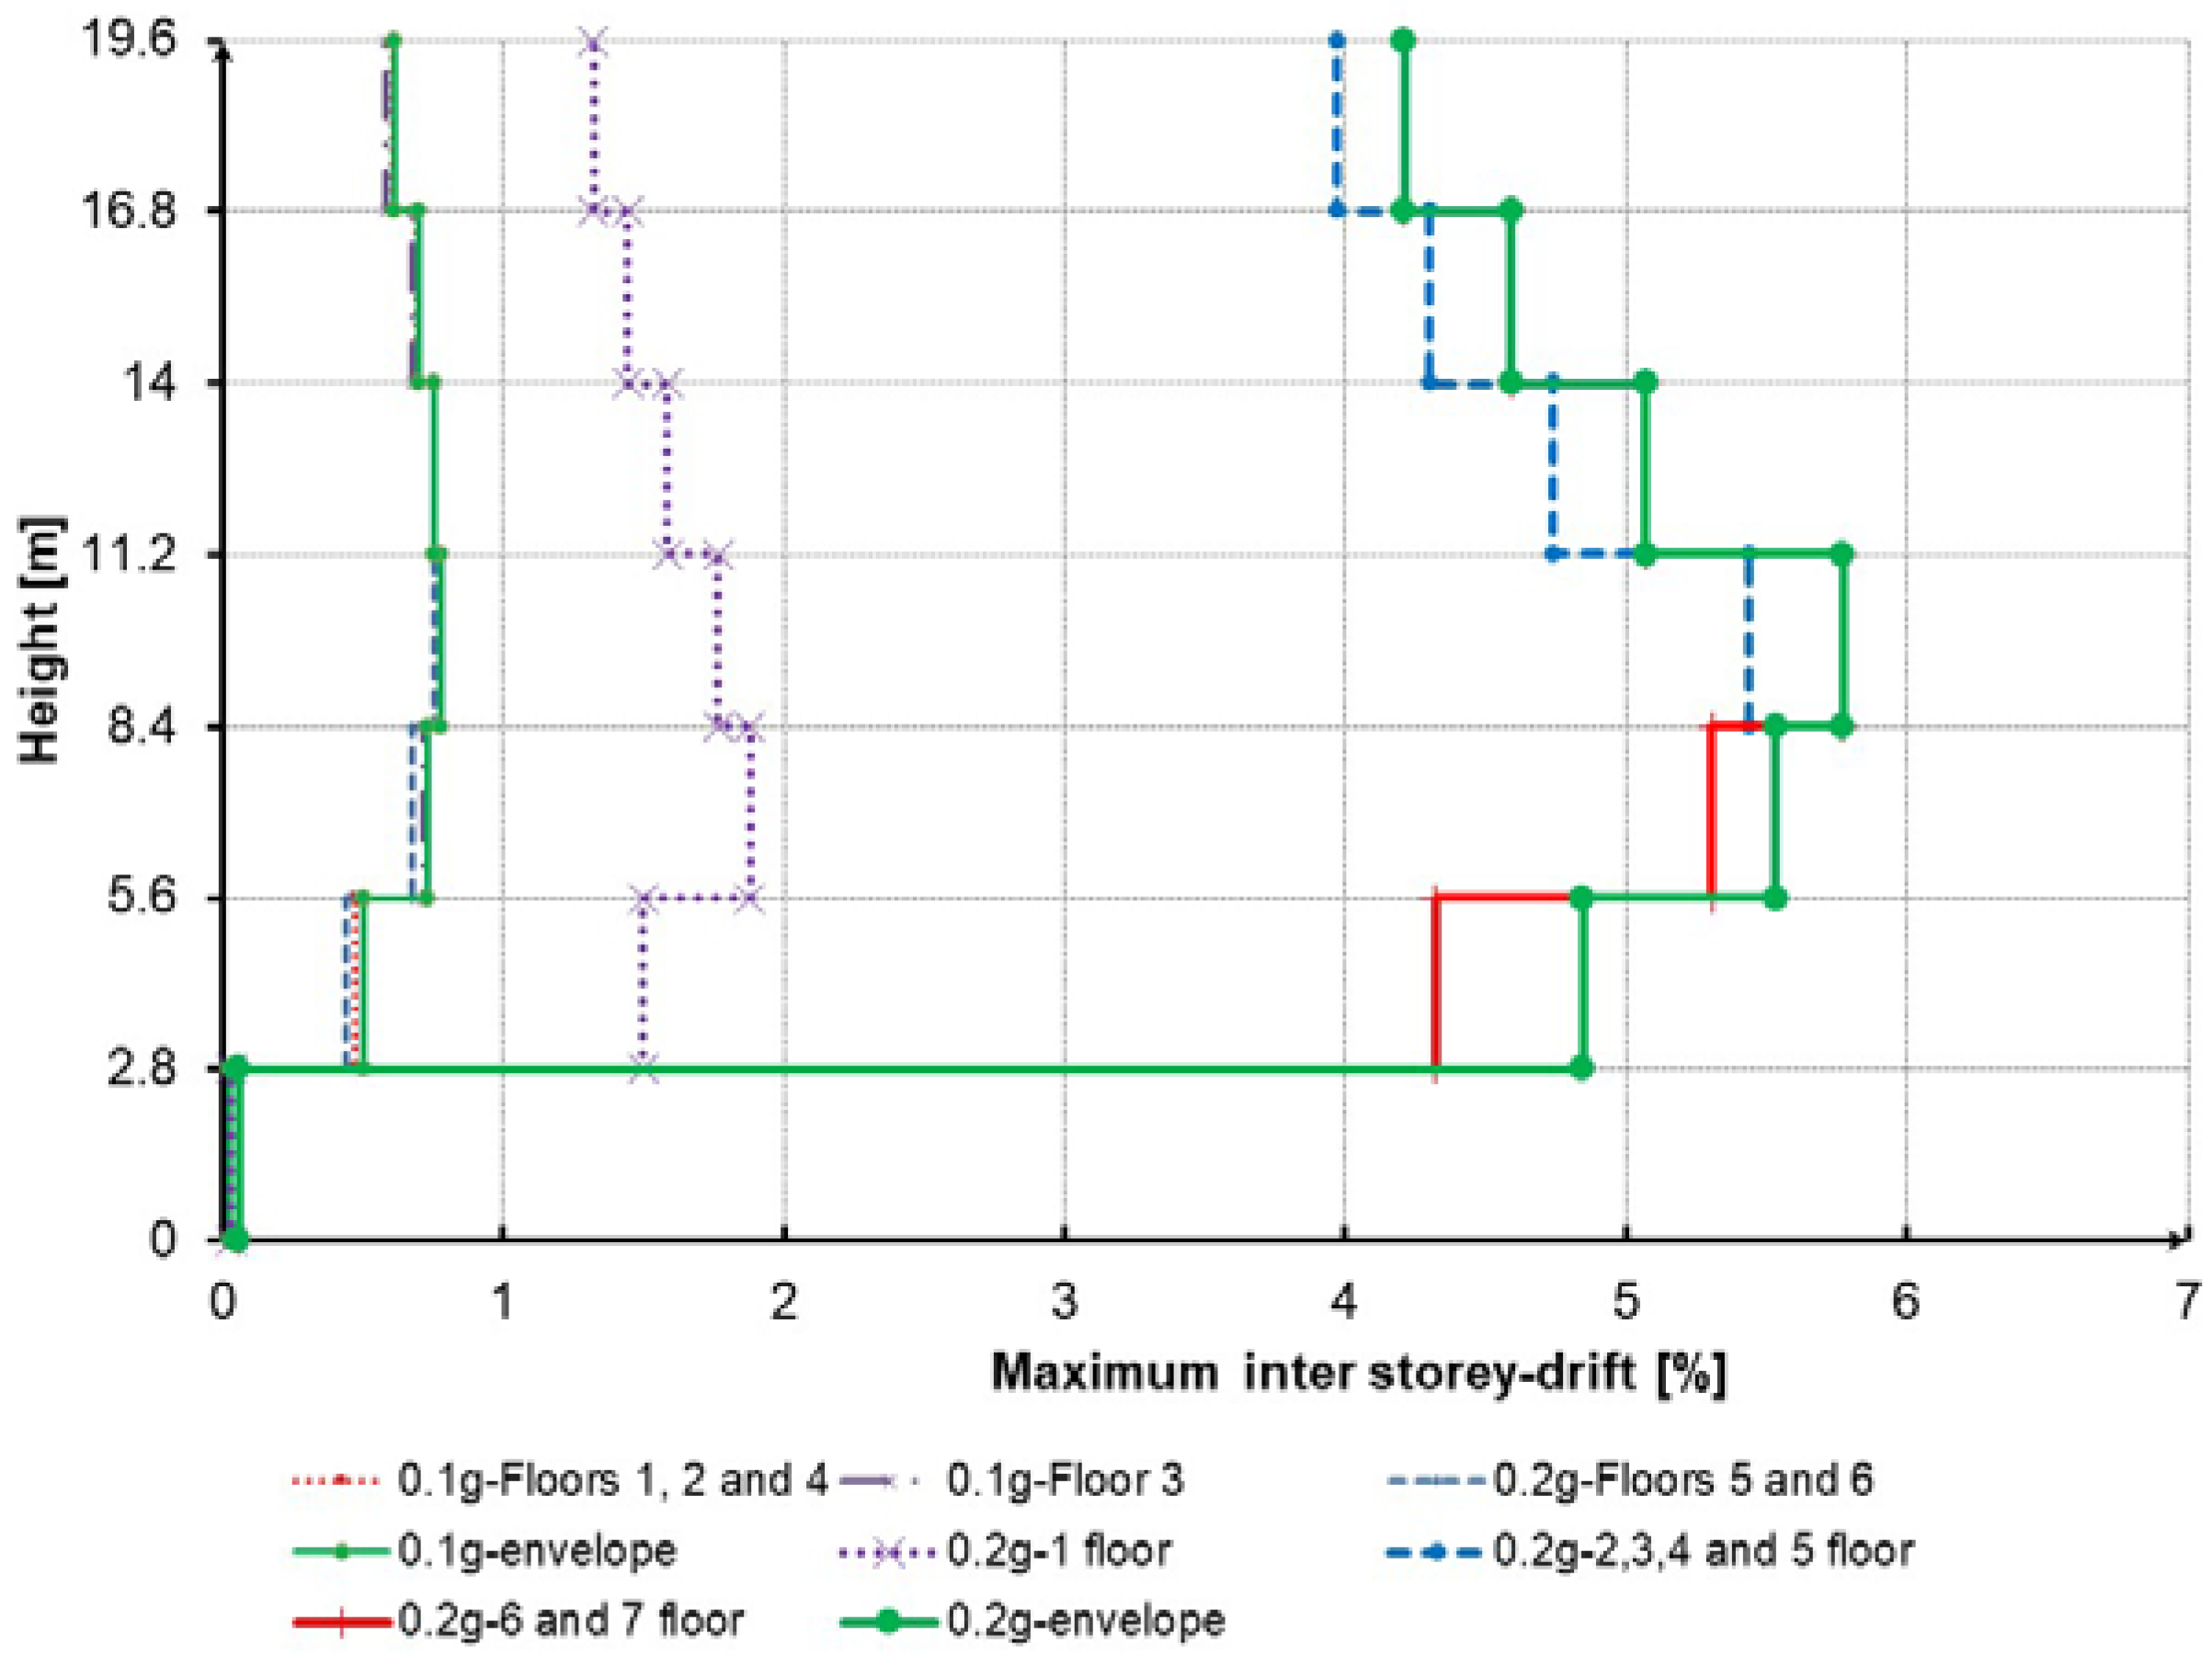
The maximum displacement in the case of 0.1 g is rather small and it amounts to 11.38 cm while for the case of higher seismic activity (0.2 g) the displacement increased to 29.33 cm, which is 2.6 times larger. The maximum inter-storey drift per each floor was calculated separately (as it does not happen simultaneously). The maximum value of inter-story drift of each floor was identified, and an envelope of the inter-story drift was created. Further, the maximum inter-storey drift (envelope) moved from 0.8 % to 5.8 % (
Figure 12) as the PGA increased from 0.1 g to 0.2 g, making the structure more vulnerable, and showing that severe damage will occur if exposed to an earthquake of higher PGA (0.2 g).
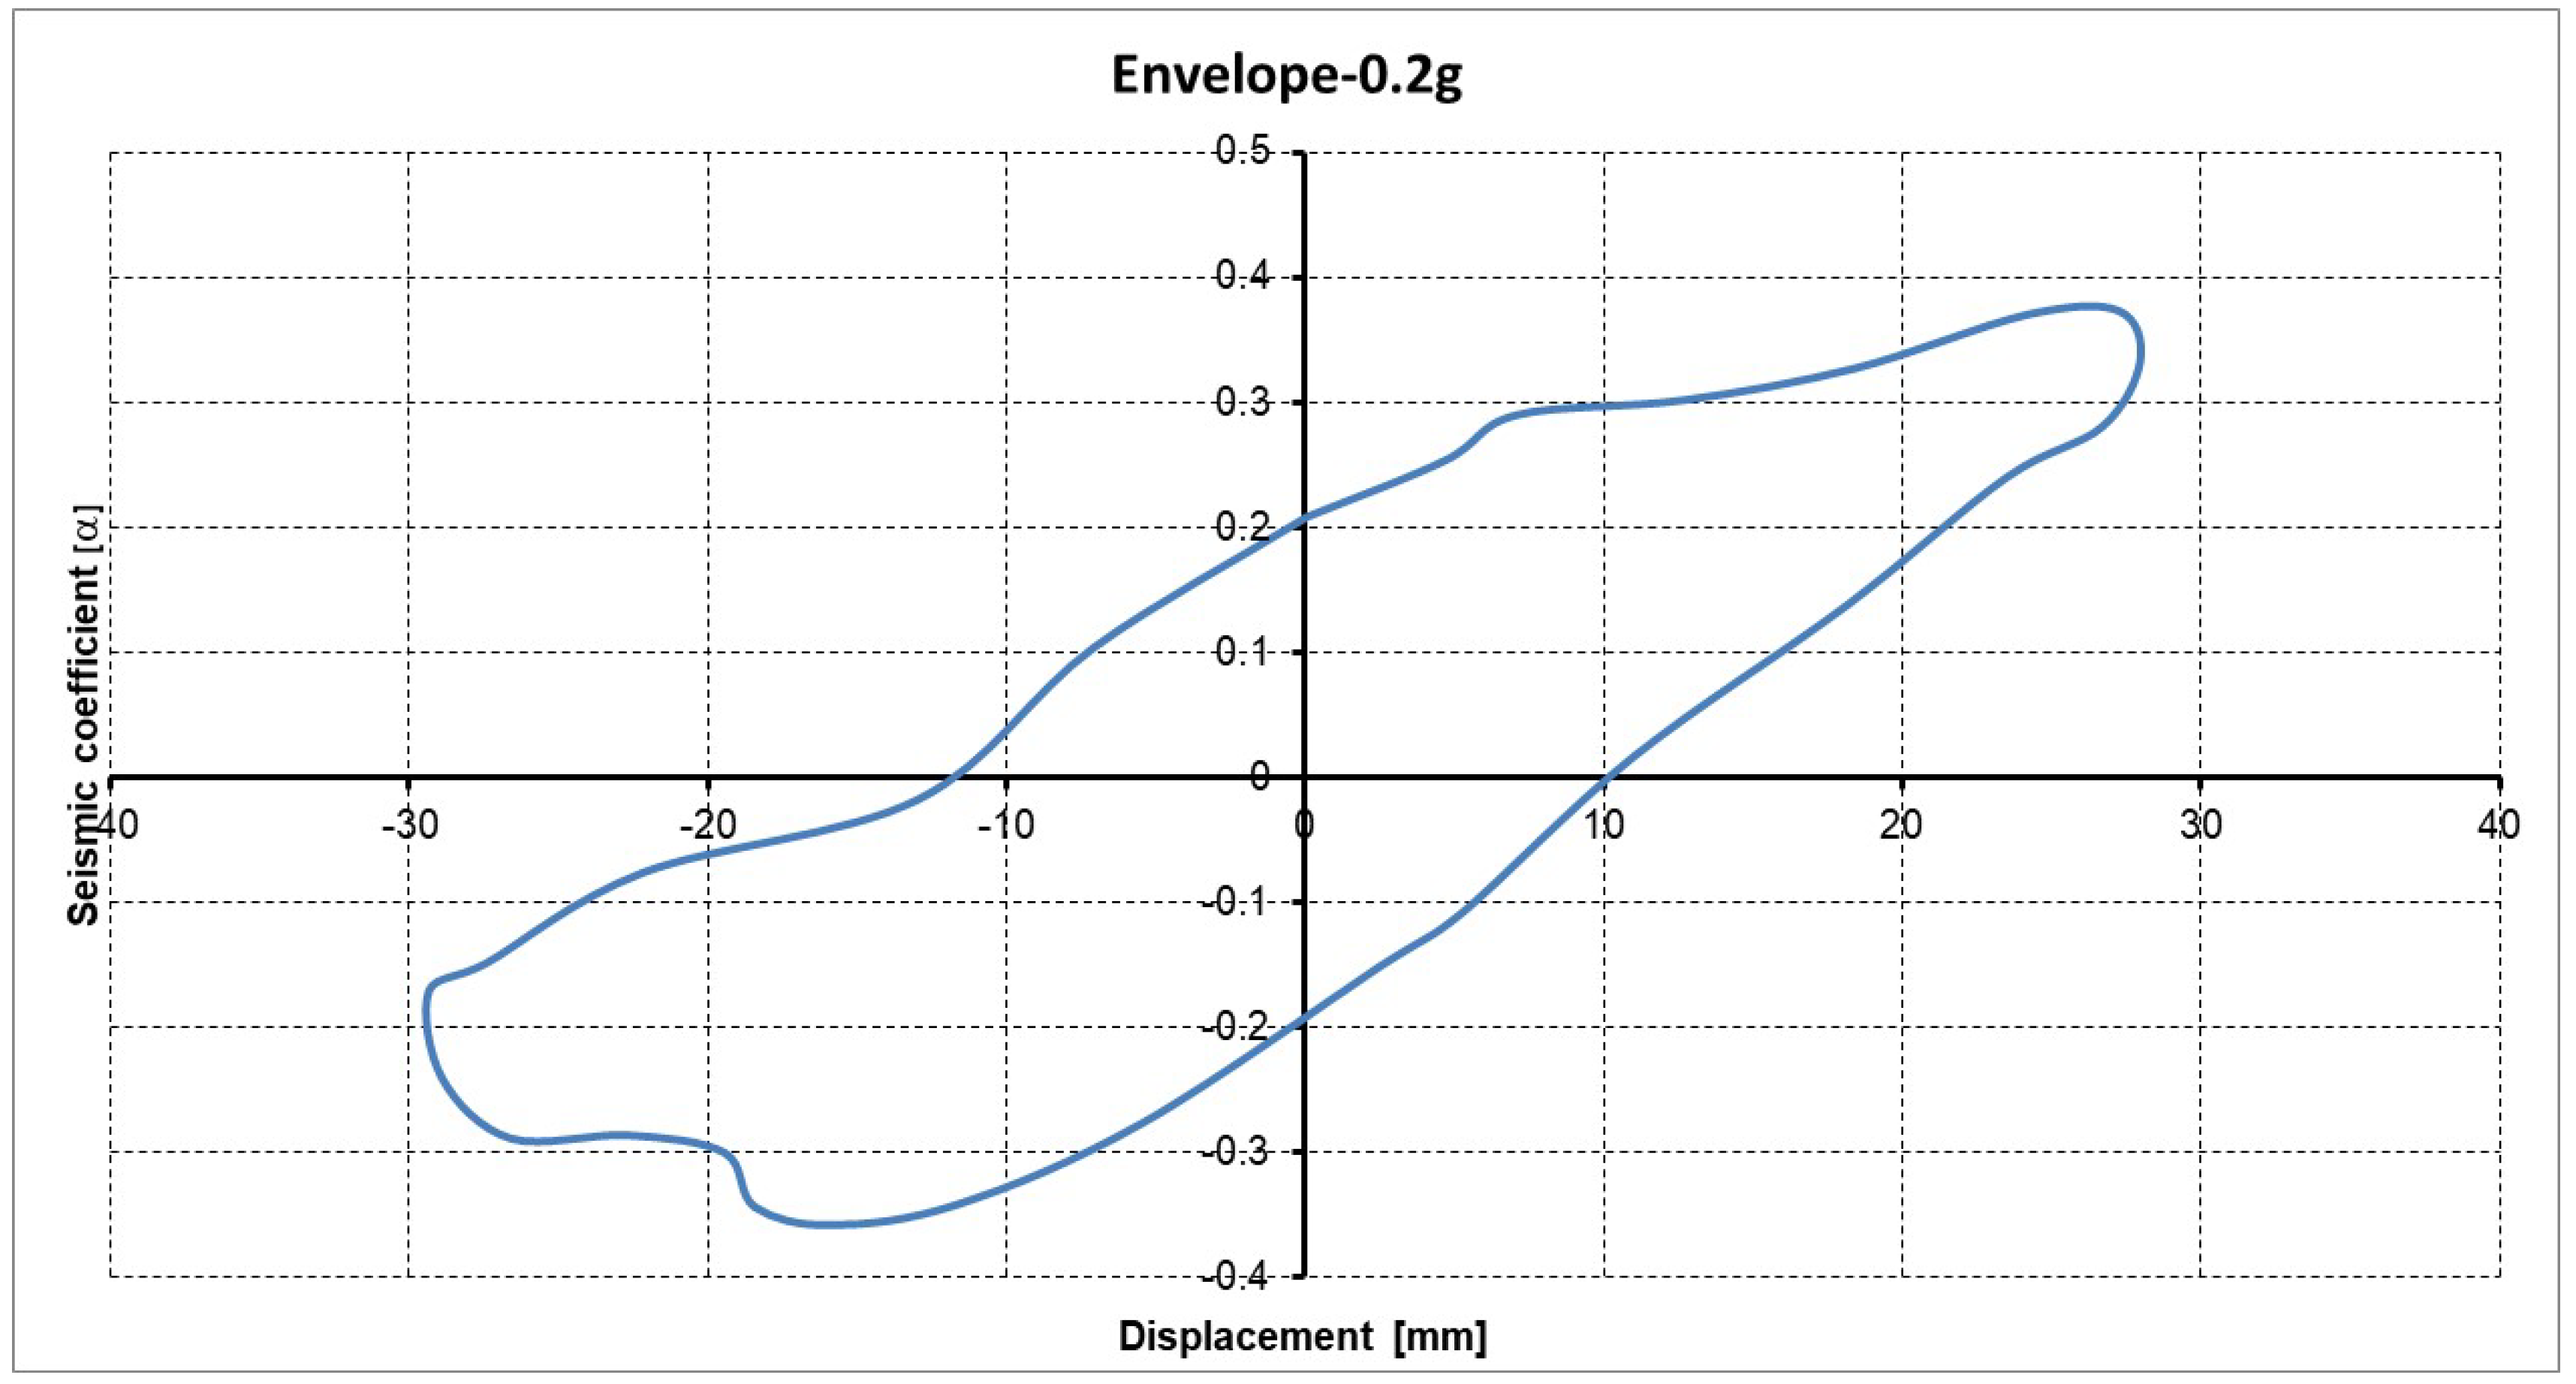
The hysteresis curve originated by the 0.2 g scaled accelerogram was determined for the control node 44014 and the relationship between the seismic coefficient (ratio between base shear and gravity forces) and displacement has been obtained as shown in
Figure 13. The maximum seismic coefficient of 0.37 was reached while the maximum displacement was 29.3 mm. From
Figure 13, energy dissipation was observed due to flexural and shear phenomena. However, in order to understand the behavior of a structure besides the amount of dissipated energy, it is important to know the equivalent viscous damping ratio and dissipated energy ratio.
The structural analysis of the case study was also performed with the EFM (additional information could be found in references [
5,
6,
29]). Here, only the results in the X direction of the façade walls will be shown. Damage was again concentrated in the lower floor of the structure with bending and compression failure at the ground level of the structure (
Figure 14). The observed damage shown in
Figure 14 (damage in masonry piers) is consistent with the damage observed on the building after the Skopje earthquake (
Figure 2b). As results obtained by both FEM and EFM approaches regarding the pushover analysis were in a very good agreement, it was decided not to report the respective results here. In addition, due to the much less computational time required, it was decided to conduct further analysis in the X direction utilizing only the EFM approach. As stated before, one of the major flaws of this type of building is the nonexistence of adequate number of load bearing walls in the longitudinal (X) direction and the large number of openings causing a lower lateral stiffness in this direction with respect to the transversal (Y) direction.
4. Strengthening Intervention (EFM Model)
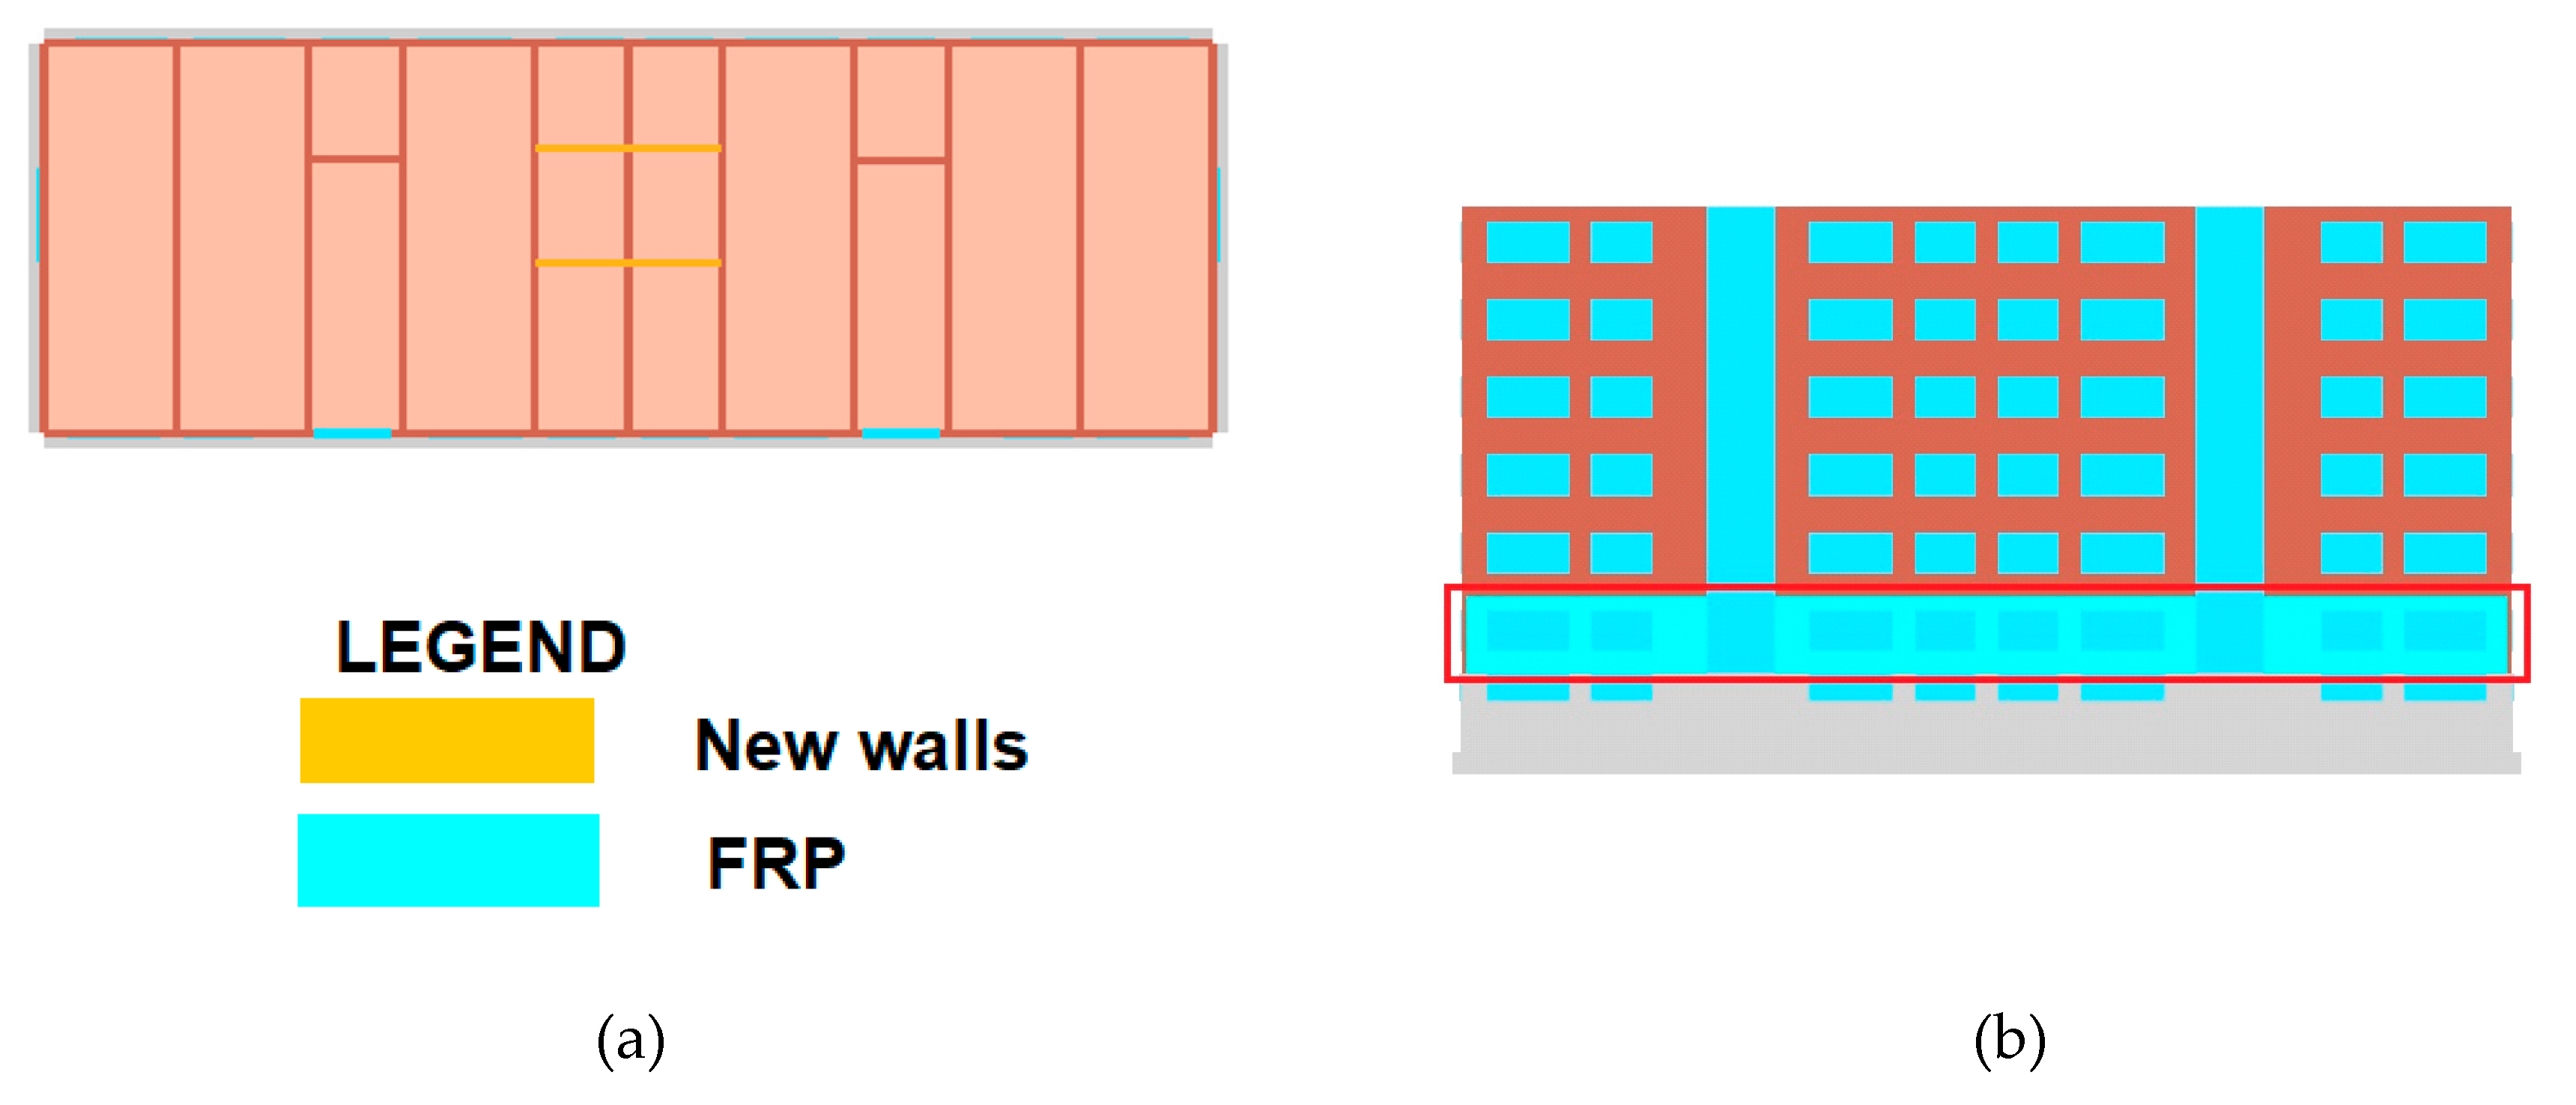
The proposed strengthening method followed here is a combination of traditional and modern strengthening techniques. This envisaged solution includes the construction of four new walls (
Figure 15a) and strengthening the ground floor with fiber reinforced polymers (FRP) where concentration of damage was observed, see
Figure 14. In this way, the structure moved from inadequate to the adequate positioning of the structural walls in plan [
32]. The walls were positioned in such a way as to keep the symmetry of the structure and in that way circumvent possible undesirable torsional effects. The new walls are made of solid clay bricks connected with lime mortar in order to be compatible with the existing walls. The four new structural walls were built in place of existing separation walls in order to not affect the serviceability of the structure, besides being the most convenient location. The walls are founded on new continuous wall footings connected to the existing foundation. The two longitudinal walls surrounded with a red rectangle in
Figure 15b were reinforced at the ground floor with carbon FRP bidirectional strips, having thickness of 2 mm and a width of 200 mm and spaced every 0.5 m, see S
d in
Figure 15c. The used FRP material has the following mechanical properties: E = 240,000 MPa (modulus of elasticity),
ffd = 3182 MPa (tensile strength) and ε = 1.45% (ultimate elongation), area of the corresponding strips is 2 × 200 mm
2.
The comparison of the performance of the unstrengthen and strengthened structure exposed to the elastic response spectra as defined in Eurocode 8 [
37] for PGA equal to 0.1 g and 0.2 g and C soil type (
Figure 16), shows that the strengthening procedure adopted could not overcome the problem of seismic vulnerability of this type of structures for larger earthquake motions. The structure has an adequate behavior if exposed to a smaller PGA, however bending failure occurs at the lower floors of the structure with the increase of PGA.
Both analyses satisfied the Damage Limit State (DLS) check according to Eurocode 8 [
37]. However, the structure exposed to the excitation of 0.2g did not pass the Ultimate Limit State (ULS) check, where the obtained value of q* (the relationship between the elastic response force and the yield strength of the equivalent system) as defined in reference [
38] was 4.90, which is larger than the maximum acceptable value of 3 [
38], while in the case of 0.1g this value was equal to 2.45. The available ductility (the ratio between the ultimate displacement and the elastic limit displacement) was 16.78 for the two analyzed cases. If the structure is to be exposed to an earthquake with PGA of 0.1g this intervention would be acceptable (
Figure 17). However, this cannot be stated for an earthquake of a higher magnitude, where the concentration of damage due to bending is seen on the lower levels of the strengthened building (
Figure 18) causing major damage on the masonry spandrels.


