1. Introduction
How do we keep track of where we are and where we need to go in large-scale environments, where physical landmarks and final destinations are often out of view? Cognitive scientists have been intrigued by this question since the inception of the field. Many studies have focused on uncovering the mental representations–for example “cognitive maps” and “route lists”–that people use to perform various wayfinding tasks [
1,
2]. Reliance on each type of mental representation appears to be associated with performance benefits and costs that are contingent on the type and location of the task being performed. Furthermore, the likelihood that a person will develop and use the “better” representation for a given scenario varies tremendously, as a function of many experiential factors as well as basic cognitive and perceptual capacities [
3,
4,
5]. This paper examines how spatial cognition influences individual wayfinding performing controlling how the format of the information is used to describe a building’s interior.
Individuals differ in their ability to visualize and process spatial information or “spatial cognition” [
4]. The present research focuses on understanding how different factors influence individual wayfinding in unknown environments. Individuals have two kinds of wayfinding strategies: route knowledge, which consists of memorizing successive movement at each intersection of an environment before reaching a destination and survey knowledge, where the subject builds a mental visualization of the environment to orientate oneself [
1,
2]. It has been observed that men tend to use survey knowledge while women use route knowledge [
6].
Nowadays, two-dimensional (2D) plan sets are the main form of communication for spatial information of a building interior during its operations and occupancy [
7] Two research questions guided the paper’s research: (1) how does the format of information influence wayfinding performance, and (2) does spatial cognition influence the effectiveness of the format of information in wayfinding? Previous studies have investigated the influence of different factors such as spatial cognition and engineering information format on construction workers’ performance and found that three-dimensional (3D) information effected their work positively [
8,
9,
10,
11,
12]. The present research reviews and analyzes previous studies to study the interdependency of information display, spatial cognition, and demographic background on individual wayfinding in unknown environments. Participants were required to find their way to two different checkpoints in a building unknown to them after analyzing either a 2D plan or a 3D model within a building information model for 60 s. Participants’ behavior was recorded to analyze their performance, in terms of distance and time traveled. Participants were then asked to complete a series of two spatial cognition tests, and their answers were matched to their recorded performance. The findings of this research are intended to improve route navigation during high stress events, such as the response of emergency responders or the evacuation of building occupants during extreme events [
13,
14] and construction workers in hazardous site conditions [
15] or even improving productivity on construction sites [
9,
10,
12].
2. Context
Golledge [
16] defined wayfinding as the method of assessing and following a path from one place to another. Wayfinding is not to be confused with navigation. Wayfinding refers to how people find their way around environments, while navigation refers to specific means by which people find their way, including route navigation, landmark navigation, and map navigation (Webster, 1995). Navigation does not fall within the scope of the present research and will not be studied. Individuals develop two kinds of wayfinding strategies called route and survey knowledge. Route knowledge develops a series of landmark actions like those given by navigation software (e.g., Google Maps: “turn right at the traffic light”) [
1,
2] Survey knowledge is achieved by individuals through mentally visualizing map-like representation of the environment [
1,
2].
Lawton [
17] developed a questionnaire to study the relationship existing between wayfinding strategies and gender. Lawton’s [
17] research emphasized that women were likely to rely on a route knowledge strategy, where men maintained a sense of their position in relation with the environment using survey knowledge. Lawton also highlighted that women tend to develop an anxiety about environmental navigation unlike men [
18] Taylor et al. [
6] studied the goal-specific influences on spatial perspective. The participants in Taylor’s 1999 study had two ways to study an unknown environment, studying a plan or navigating through the environment. The results indicated a better performance (more accuracy) for survey tasks when studying a plan and the route tasks responses were more accurate when navigating through the environment [
6]. Therefore, wayfinding strategies are dependent on several factors, which in a broad context includes complexity of a building interior, signage, spatial cognition, format of information used in planning wayfinding, gender, familiarity with a building interior, and number of other individuals travelling the same or similar route [
19]. Understanding how individuals create a cognitive map and the whole process of wayfinding could lead to findings that would help diminish the mental demand of wayfinding tasks allowing individuals to focus on other aspects of their job or environment.
Spatial cognition is an important factor in the wayfinding process and has been long studied by different researchers, such as neuroscientists focusing on the biological relationships between the brain and behavior [
20]. Vecchi and Bottini [
21] studied the relationships between perception and imagery to understand how the brain, behavior and cognition interact. This research did not discuss the neurologic aspects, but focuses on behavioral aspects and the impact of spatial cognition on task performance. Lohman [
22] defines spatial ability as the generation, retention, and manipulation of abstract visual images to encode, remember, and transform spatial stimuli.
The influence of spatial cognition and engineering information on performance has been investigated in other contexts, such as the construction industry [
10,
12] Goodrum et al. [
10] indicate information format, including 3D visual aids through Building Information Modeling (BIM), help decrease workers’ workload, and therefore, improve their productivity. Goodrum et al. [
10] stated that the performance of the lower spatial cognition workers matched the performance of the higher spatial cognition workers when provided with 3D visual enhancement. Sweany [
12] measured the cognitive demands of three types of information: 2D plan sets, 3D computer-aided design (CAD), and 3D printed models on construction workers. Statistical analyses proved that subjects of both low and high spatial cognition performed best with 3D physical models. Additionally, both industry experience and training impact the performance of workers [
10,
12]. A better performance was statistically proven for workers who were familiar with the type of information used [
10,
12]. Formal training was close to having a statistical impact on workers’ performance when using 2D plans [
9,
10,
12].
3. Research Hypotheses
The objectives of this research were to explore the performance levels, wayfinding strategies, and cognitive workloads of participants using 2D and 3D information displays. Based on previous research studies [
10,
12] construction workers performed better with a 3D physical model than with 2D plan sets. Based on this prior experience, we examined three hypotheses. First, our primary hypothesis is that individuals are more efficient in wayfinding when provided with 3D versus 2D information about their environment. Performance levels of participants were assessed by a chi-square test on the ability of participants to reach the two checkpoints. Other variables were assessed by Analysis of Variance (ANOVA) to determine any significance. Our second hypothesis examined the correlation between the type of information display and the use of wayfinding strategies. Thus, our second hypothesis was that 3D information is more critical in wayfinding scenarios that rely on survey knowledge versus route knowledge. The researchers hypothesized that the route from the start of the waypoint experiment to checkpoint A addressed route knowledge, while the route from checkpoint A to checkpoint B was prevalent in survey knowledge. The performance of each participant at each of the two checkpoints investigated this wayfinding strategy hypothesis. Third, Goodrum et al.’s (2016) [
7] paper confirmed that 3D information displays improved the productivity among industrial pipefitters. This research attempted to prove that cognitive workload affects performance positively when incorporating 3D information displays, which led to our third hypothesis that cognitive demand in a wayfinding experiment is lowered when 3D versus 2D information is used. NASA Raw Task Load Index (NASA-rTLX) test scores were used to study the effects of cognitive workload on the participant’s performance.
4. Methodology
Our research attempts to understand the interdependency of information display, spatial cognition, and individual demographics during a waypoint task requiring each participant to reach two checkpoints after studying a plan for sixty seconds. We tested our hypotheses using empirical based field trials using a control and experimental group in order to involve a realistic simulation to accurately understand the influence of information format and cognitive demand on wayfinding performance. To test the hypotheses regarding the influence of information displays and the use of different wayfinding strategies, participants were given a 2D plan or a 3D model and their performance was recorded. The experiment was conducted in the University of Colorado at Boulder with 48 students/staff ranging from 18 to 33 years old. Participants were selected based on the capability to physically complete the wayfinding experiment and familiarity with the ability to reading building plans. While the wayfinding experiments involved students in a university, each student was prescreened to assure that they were not familiar with the location and spatial environment of our experiment location. In order to test the hypothesis of the effect of human cognition, a series of tests on spatial cognition and cognitive demand were administered to each participant.
The experiment consists of a time-framed analysis of human navigation performance using a combination of maps in the form of 2D plan sets or a 3D BIM model. A highlighted path to reach two different checkpoints was shown on participants’ plans. As each participant attempted to navigate both checkpoints, their success of reaching a waypoint, time, distance, and route selection was recorded by the researchers. The data from the experiments was used to test the proposed three hypotheses.
Tests already exist that quantify the spatial abilities of individuals. The Educational Testing Service (ETS) created two tests to assess the “ability to perceive spatial patterns or to maintain orientation with respect to objects in space” [
23] These include the card rotation and cube comparison tests. The card rotation test assesses the subject’s ability to see differences in a pair of 2D figures. The figures can be rotated, in which case the participant marks them as “same” or they can be flipped over and the subject marks them as “different”. The cube comparison test compares two cubes. Participants mark the cubes as “same” if they match by rotation or “different.” Sweany [
12] analyzed the cognitive demand of engineering information on construction workers. His research deduced that a card rotation test is best suited to study 2D information and a cube comparison test is best suited to study 3D information. The results of the two spatial cognition tests were used to assess individuals’ spatial cognition and, additionally, to compare the results with the performance metrics to study the influence of individual spatial cognition on the participants’ success. The card rotation test contains 40 questions and the cube comparison test contains 14 questions. The maximum scores are therefore respectively 40 out of 40 and 14 out of 14. When a participant answers a question incorrectly, the resulting score for that question is counted as negative. This explains why some of the observed test scores in the study’s experiments are negative.
Additionally, the National Aeronautics and Space Administration-Task Load Index (NASA-TLX) is probably the best-known tool to assess cognitive workload [
18]. Workload represents the mental cost of accomplishing a task for the human operator [
24]. The concept is important if a task is not considered easy or quick to accomplish. Indeed, the NASA-TLX assesses the “difficulty” of a task in terms of different concepts or subscales that are well-defined. It was used in the present research to compare participants’ cognitive workload during the experiment.
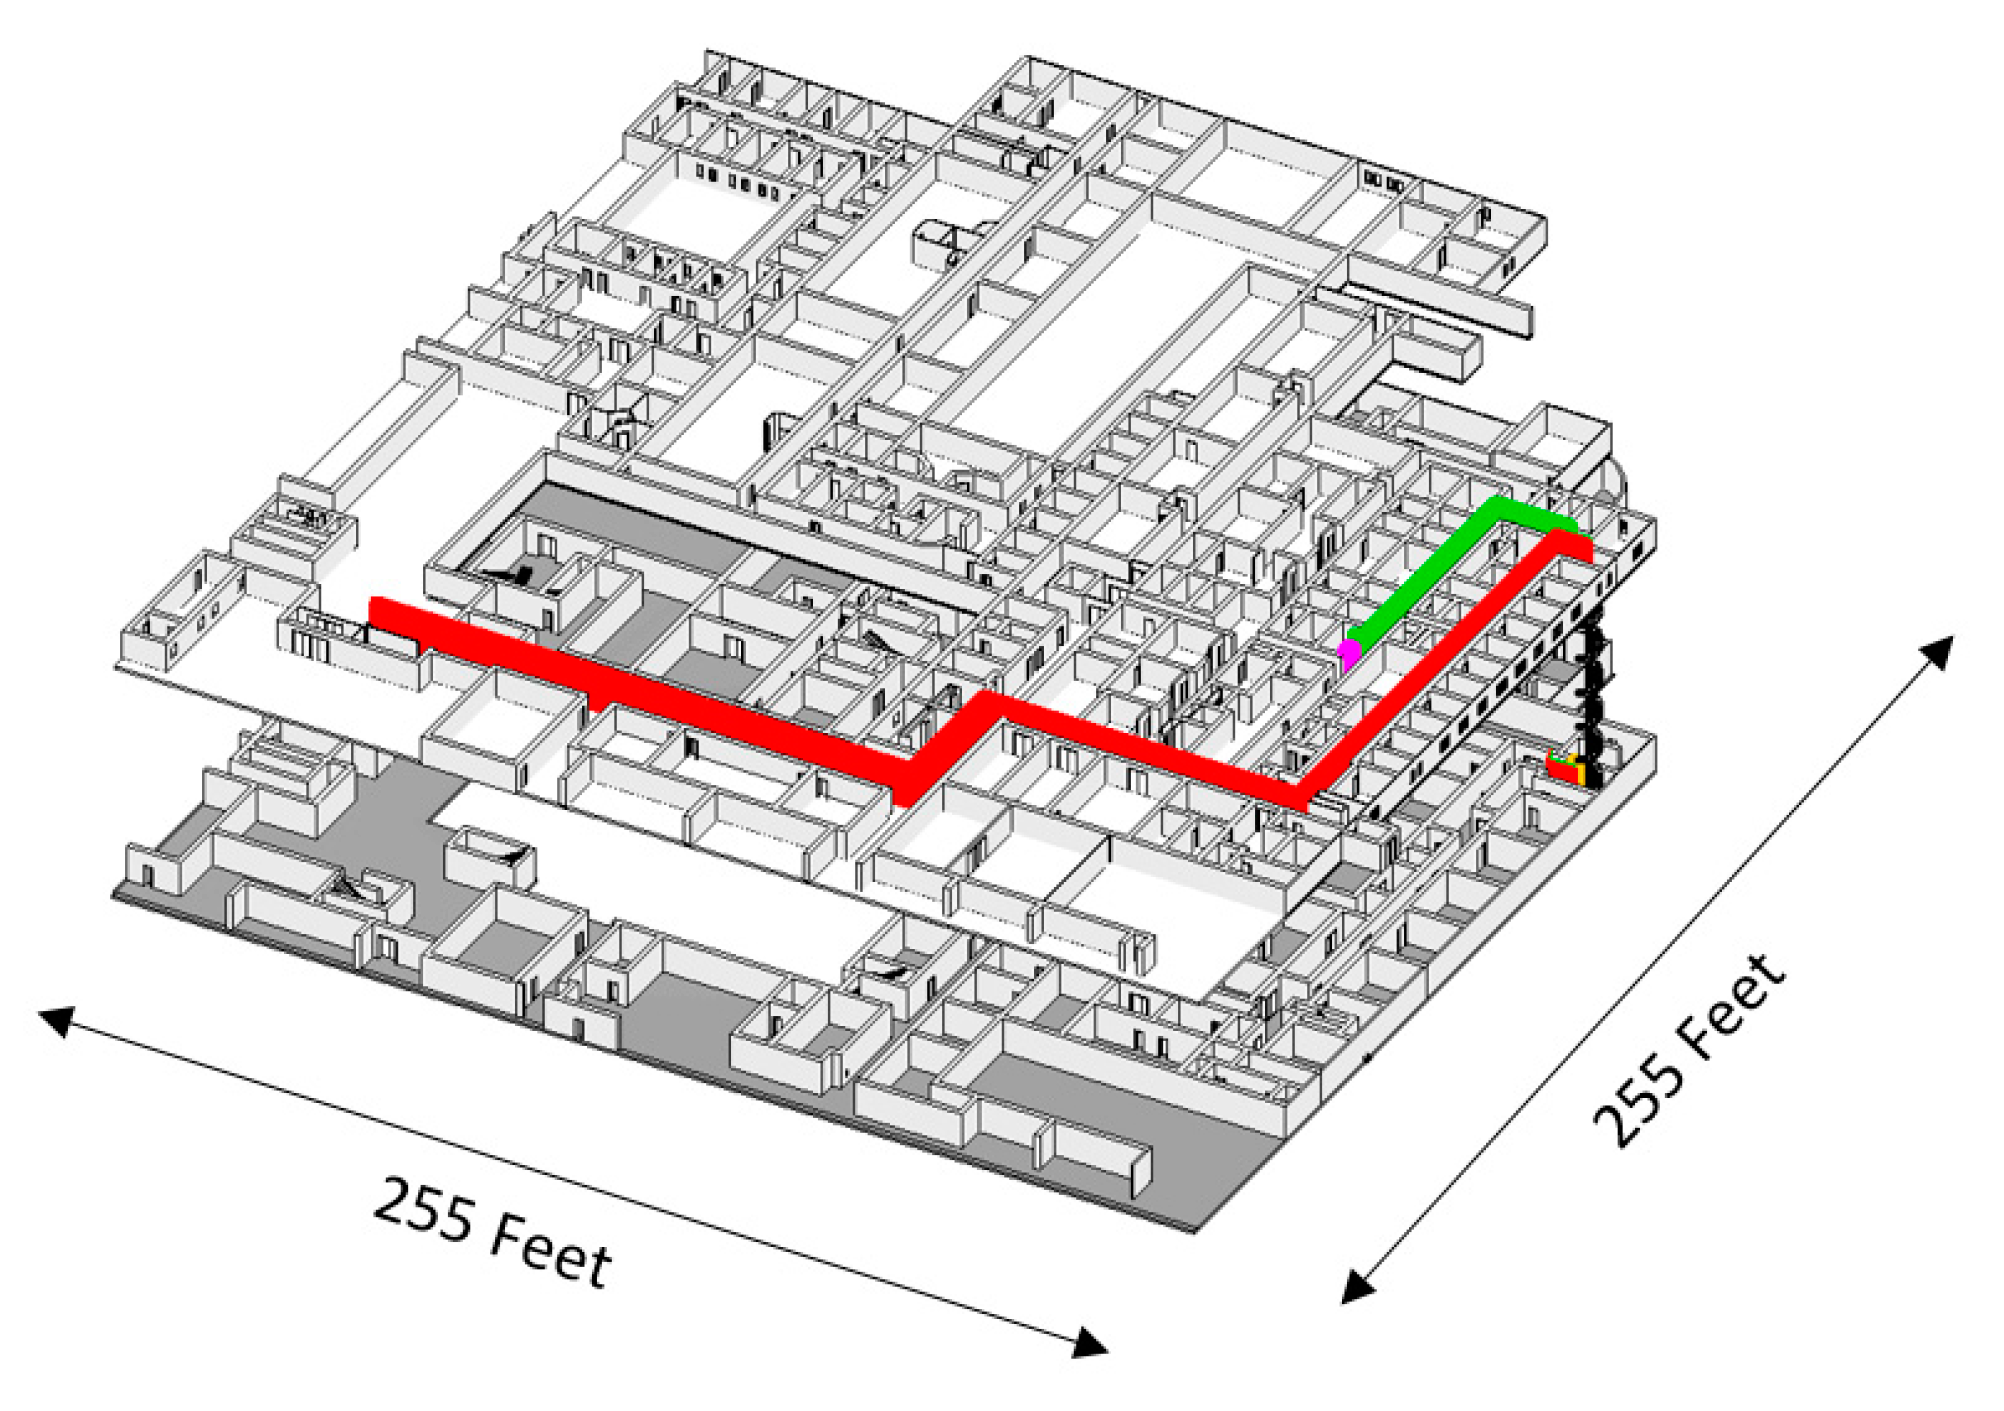
Two types of information formats were used in the experiment. The first was a traditional 2D plan. The set that was given to the students was the plan view of the ground and basement floor (below grade). The path to checkpoint A (on the basement) is highlighted in red, and the path from checkpoint A to checkpoint B (on the ground floor) is highlighted in green as shown on
Figure 1 (ground floor) and
Figure 2 (basement). A 3D view of the BIM model showing the total route over both floors is shown in
Figure 3. The checkpoints were selected to define a route that accomplished two objectives: (1) the route avoided windows so that participants could not use the local exterior terrain and other features outside of the building to orient themselves and (2) the path included a moderately complex route that required individuals to travel between floors. The first 10 students used a laptop and the remainder used a tablet computer to view the plans or model.
As part of the study’s methodology, the experimental protocol for each participant began with a briefing to explain the experiment, including a short orientation of the 2D and 3D displays. The experiment was completed once by each participant, with a sample of the participants completing the waypoint navigation using 2D plans and the remaining using the 3D model. Participants were given the opportunity to study the 2D plans for 60 s. The 3D model analysis included two different parts, as seen in
Figure 3. Participants using the 3D model had 60 s to understand how to rotate and view the model in the BIM environment and practice on a warm-up model. Then, each 3D participant had 60 s to analyze the 3D model for the experiment. The interval of 60 s was given for each of the before mentioned opportunities to allow individuals enough time to orient themselves with the software and model, while not allowing too much time to use the session as a tutorial on how to use the software. More time in warm-up could have biased the results based on the effectiveness or ineffectiveness of a possible tutorial; rather, the focus of the experiments was intended to involve understanding the influence of the format of information on human wayfinding performance regardless of the participants prior experience with BIM. Finally, the subjects were shown where they were initially located in the building and the four cardinal directions.
As soon as participants studied the plans, they began the experiment by proceeding from the starting point to checkpoint A and then onto B. During the experiment, a coordinator filmed the path used by the participants. However, the coordinator was not allowed to say anything to the participants. At each checkpoint, they were asked to point out two directions: the starting point and direction to the south. If the students were unable to find the checkpoint, they were conducted back to the starting point and the wayfinding task of the experiment was ended. After completing the experiment, the subject and the coordinator came back to the starting point to complete a questionnaire, which included the NASA-RTLX Mental Workload Rating Scale, Card Rotation, and Cube Comparison tests.
During the experiment, the participants were filmed to monitor their performance. Different measures were used to assess the task, including the following:
Duration of each part of the wayfinding task;
Distance traveled for each part;
Number of major deviations if the participant wandered out off a radius of 30 feet from the correct right path. Each deviation is counted as one;
Number of minor deviations if the participant wandered off the right path, but was still within a radius of 30 feet from the correct path. The minor deviations were counted in term of steps;
At each checkpoint, the subject was asked to point out the direction of the south and the starting point. Those questions showed if the subject could visualize themselves in the environment.
5. Data Analysis
Different performance metrics were statistically analyzed as reported in our results (
Section 8) with two tests: the chi-squared test of independence and analysis of variance (ANOVA). In summary, the chi-squared test of independence exam if two populations X (e.g., low vs. high spatial cognition) were independent from each other based on their criteria Y (e.g., age, experience), which was binary or categorical. Specifically for this research, the chi-square test was used to examine if difference in completion rates of the wayfinding experiment were related to the difference in the information format used by each participant in the experiment. The ANOVA analysis was used to evaluate significance between checkpoints and information displays. For this research, ANOVA was used to determine if difference in performance (time, distance travelled, and the number of questions correctly answered afterward) based on the information format.
6. Result Group
The study included 38 participants. All participants were university students and had a mean age of 23.8 years and a median age of 22 years. The group was composed of males and females, 82% and 18%, respectively. Most of the students were engineering students and had prior experience of working in industry. The participants’ mean years of experience reading engineering drawings was 1.84 years.
Figure 4 displays the results of the two tests with a box plot, which shows the minimum, maximum, and the second and third quartile. For the cube comparison test, the median was 10.5, and the mean was 10.3. Participants scored high on both tests. The card rotation test scores had a median of 32.5 and a mean of 31.1. The fact that the medians are higher than the means indicates that some participants experienced very low scores making the distribution negatively skewed.
7. Results Analysis
The following results were used to answer the hypotheses stated previously. If the metric was significant, it is highlighted in green and if it was close to significance, it is highlighted in orange.
The format of the information display, in terms of the utilized 2D and 3D formats, was found to not influence the performance of participants in reaching Checkpoint A, as indicated in
Table 1. Participants using the 2D and 3D information displays experienced the same completion ratios and a time requirement of two minutes in reaching Checkpoint A. However,
Table 1 highlights a significant difference in the participants’ completion rates when using the 3D model from checkpoint A to checkpoint B. The route from the starting point to Checkpoint A relied more on route knowledge, which may be a contributing factor to explain why no difference was observed based on the format of information. Additionally, when monitoring the low spatial cognition subjects in
Table 2, the difference in completion rate shows a significant influence of the 3D model when traveling from Checkpoint A to Checkpoint B. However,
Table 3 indicates the 3D model significantly improved performance of participants with low spatial cognition, however, this did not affect participants with high spatial cognition. All participants did benefit from the 3D model when traveling from Checkpoint A to Checkpoint B, as they relied on their survey knowledge.
Based on the completion rate, the information displays seem to have had no influence on the first checkpoint, because participants were most likely employing route knowledge. On the other hand, the influence of 3D models was found significant for the second checkpoint. The researchers observed that the participants remembered the Checkpoint B via its location more than the route, which suggests that participants who successfully reached Checkpoint B relied on their survey knowledge rather than their route knowledge. However, this assumption needs to be verified more thoroughly.
As noted earlier, the participants’ required mental demand in completing the experiments was measured using the NASA rTLX index. Mental demand of the participants using the 3D versus the 2D information plans was lowered nearly (93%), marking it as statistically significant. The 2D plan yielded a score of 62.3 and three-dimensional model yielded a score of 51.0. The majority of the factors resulted in lower workloads when using a 3D computer model; however, further experiment would need to be conducted to produce more accurate results.
Finally, the authors acknowledge that while previous research has noted differences in wayfinding results by gender, no observed difference was noted in the described experiments. However, the authors readily acknowledge that the small sample size of males and females controlling for differences in information format and spatial cognition limited the ability for a thorough analyses of any gender differences.
8. Conclusions
The importance of studying the factors influencing individual wayfinding is emphasized by the need of emergency response teams’ efficiency in the growing number of extreme events in recent years (Blair and Schweit 2013, 2014). Improving wayfinding in a complex interior has other benefits as well during the operation and maintenance phases of facility. Through different solutions, improving the information display through a BIM environment is a direct and efficient way to help these outcomes.
Based on previous research studies on spatial cognition and engineering information formats, the research discovered new findings on individual wayfinding (
Table 4). When analyzing overall performance, the results demonstrated inconclusive results about wayfinding strategies and spatial cognition levels. 3D information displays enhanced participants’ performance in the second part of the experiment, suggesting that survey knowledge, which is linked to the mental representation of the surrounding, improved using a 3D information display. This finding was found especially significant for low spatial cognition participants. The results indicated, without proving, that 3D information displays induced a lower workload than 2D displays.
Individual ability is a strong factor in wayfinding task. It was not possible to assess training experience; however, it was possible to assess spatial cognition. Neither information display was significantly able to even the performance of low spatial cognition participants to the participants with high spatial cognition. This first research on the interdependency of factors on individual wayfinding does however set the basis for further research studies on the topic. This area of research could specifically help a wayfinding task during emergency responses; however, the findings concerning the interdependency of information display and spatial cognition could potentially be applied to several fields.


