1. Introduction
Biosolids are the product of dewatered and appropriately treated wastewater sludge, resulting from the wastewater treatment process. Untreated wastewater sludge mainly consists of water and organic material, and, prior to further treatment, comprises approximately 8% dry solids. After undergoing treatment, wastewater sludge is referred to as biosolids and can contain between 15% and 90% dry solids [
1].
The European Union produces over 9 million tonnes of biosolids annually [
2]. The production of biosolids is also significant in the USA, where 7.1 million tonnes are produced yearly, of which 28% is estimated to go to landfills [
3,
4]. Australia produces approximately 300,000 tonnes of biosolids per year, and, of this amount, 55% is recycled for use in agricultural applications, 15% is used for land rehabilitation, compost or forestry and the remaining 30% is either discarded in landfills or stockpiled [
1,
5,
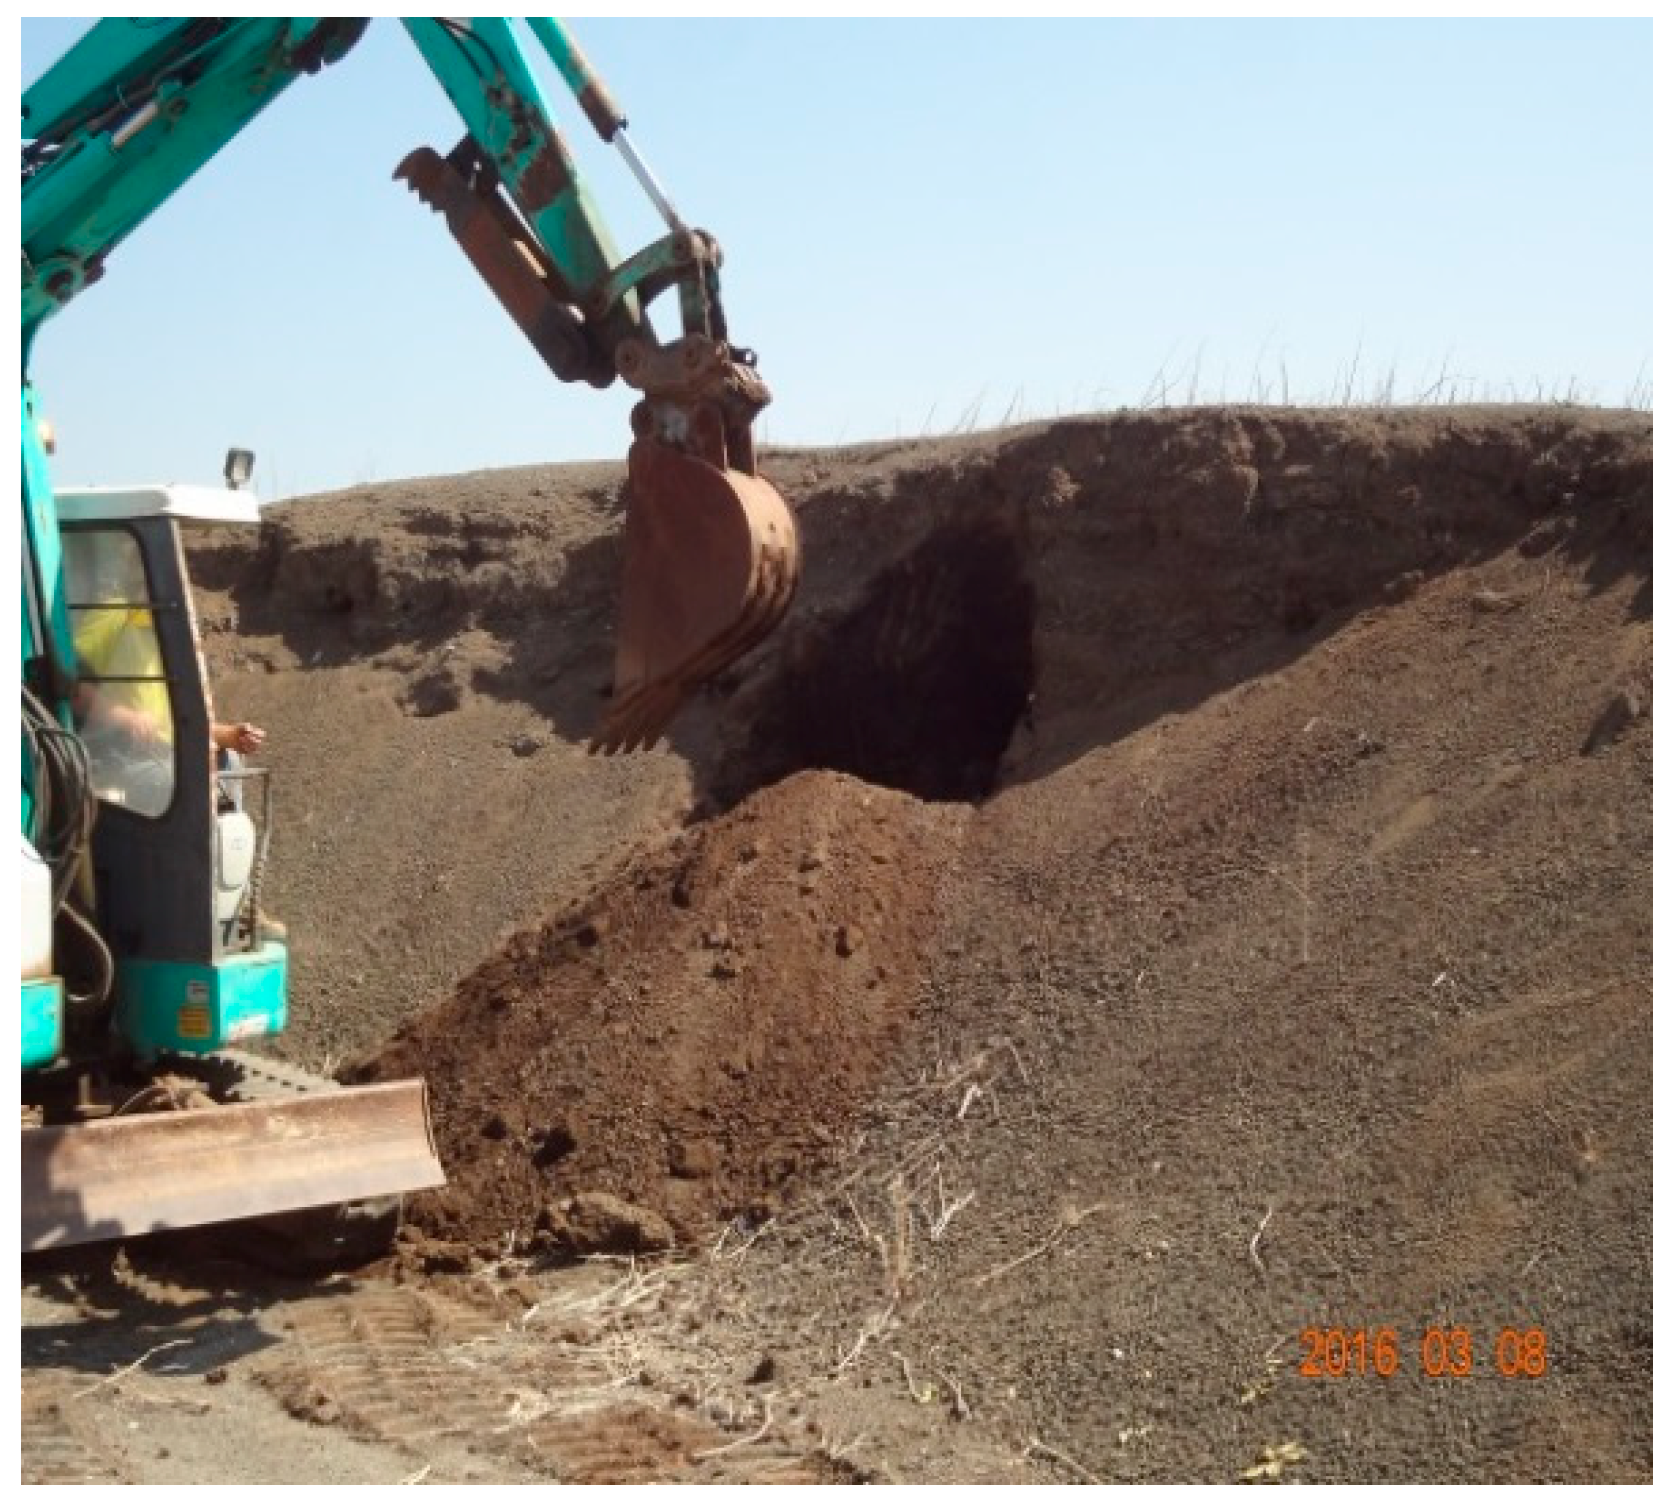
6]. The Eastern Treatment Plant (ETP) and Western Treatment Plant (WTP) (
Figure 1) in Melbourne combined have over 3 million cubic metres of biosolids stockpiled. Unless suitable pathways for reuse are found, stockpiles will increase with time, as the population of Victoria is forecast to experience significant growth over the next 40 years. Developing sustainable recycling options will lead to diminishing biosolid stockpiles over time. Stockpiling biosolids can cause the emission of greenhouse gases, and may result in the loss of valuable nutrients. Therefore, strategies for recycling leftover biosolids generated from the wastewater treatment process are essential for reducing the amount of biosolids deposited into stockpiles.
The production of biosolids has increased significantly, and is mainly due to the increased development of municipal wastewater treatment strategies globally [
7,
8,
9,
10]. These strategies include the construction of new treatment facilities, the expansion of existing treatment plants and the introduction of legislative measures. This increase is expected to continue as populations surge and developing nations improve their wastewater treatment processes.
Recently, sustainable development methods have been targeting the reuse of construction, pavement and concrete materials [
6,
11,
12,
13,
14,
15,
16]. The use of biosolids in civil engineering applications, however, is a relatively new and innovative approach. One such study that yielded positive results examined the use of biosolids and fine recycled glass in road embankments [
17,
18]. Another study [
19] conducted an extensive laboratory evaluation of the geotechnical properties of biosolids and found that when blended with an additive they can be used as an embankment fill material. Maghoolpilehrood et al. [
20] had a similar finding when using cement or lime as the additive.
The extensive use of bricks in the construction industry, combined with the structural composition of bricks, offers a unique opportunity for recycling waste [
21,
22]. A recent review paper provided an extensive review of numerous studies that have analysed the effects of recycling varying waste materials in bricks, including sawdust, petroleum waste, recycled paper process residue and steel slag, to name only a few [
23,
24]. Approximately 1500 billion bricks are produced globally every year [
25,
26]. Australia alone produced 1.31 billion in 2013 [
27]. The varying composition of clay means that bricks can tolerate high percentages of waste and remain a viable construction option [
28]. Waste materials that have been incorporated in bricks include cigarette butts [
25], paper processing residue [
29], sludge [
30,
31,
32,
33,
34,
35], fly ash [
36], rice husk ash [
37], granulated blast furnace slag [
38], polystyrene [
24], sawdust [
39,
40], and waste glass [
41]. Liew et al. [
28,
34] used dewatered sewage sludge to make fired–clay bricks with different waste compositions; bricks were produced with a proportion of sludge ranging from 10–40% by dry weight. The properties of these bricks were analysed and the results indicated that the sludge content used in the mixture plays an essential role in determining the quality of the brick.
This study presents an analysis of clay fired bricks incorporating 25%, 20%, 15% and 10% by weight of biosolids from Melbourne’s Eastern Treatment Plant and Western Treatment Plant in their raw mixture. The results demonstrate that incorporating 15% of biosolids in 15% of fired–clay brick production would completely alleviate the environmental stress of biosolids stockpiling. In addition, the utilisation of biosolids in brick production would reduce the carbon footprint of brick manufacturing whilst satisfying all the environmental and engineering requirements for bricks.
2. Materials and Methods
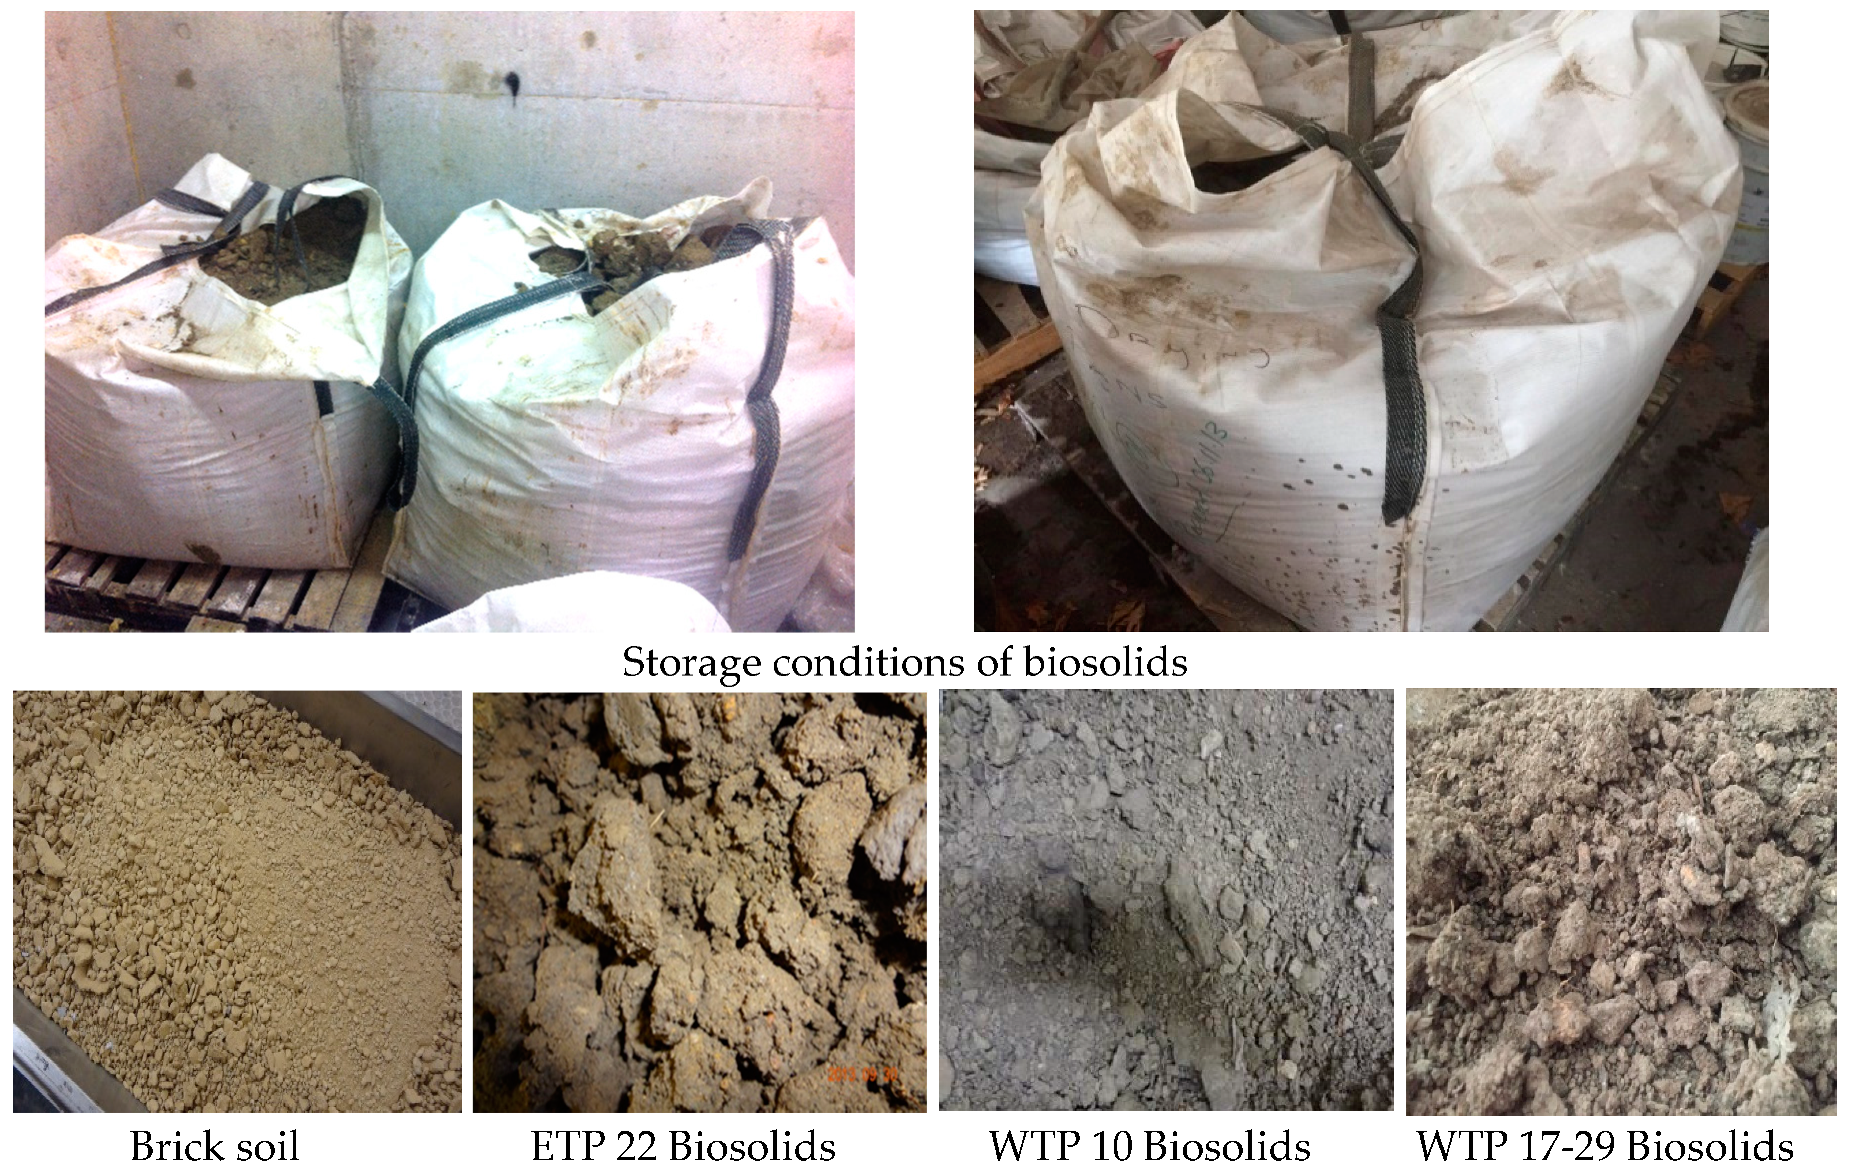
The biosolids samples were collected from existing stockpiles at both the ETP (Stock pile No. 22) and WTP (Stock pile No. 10 and Nos. 17–29). Boral Bricks Pty Ltd. provided the brick soil for this investigation (
Figure 2).
The chemical composition of the brick soil and biosolids were tested by X-ray fluorescence (XRF) using a Bruker AXS S4 pioneer spectrometer. This was in addition to a Bruker X-ray Diffractometer, which was used to characterise their major crystalline phases. The leaching of heavy metals was determined according to the Australian Bottle Leaching Procedure (ABLP) [
42]. Laboratory tests to determine the geotechnical properties of the biosolids and brick soil were conducted with the liquid limit, plastic limit, particle size distribution and linear shrinkage determined in accordance with the Australian Standards [
43,
44]. The organic content was evaluated in accordance with Standards [
45]. All tests performed were triplicated and the average values obtained.
Bricks formed from clay and biosolids were manufactured for each sample and incorporated by weight 25% biosolids and 75% brick soil. Control–clay bricks were manufactured with 0% biosolids and 100% brick soil to ensure the reliability of the results. All biosolids samples were oven dried at a temperature of 105 °C for 24 h before being added to the brick soil.
The high calorific nature of the organic content in the biosolids reduces the energy required during firing. Studies have shown that the specific firing energy required per brick is approximately between 2 and 3 MJ kg
−1 [
46], while the calorific value of the organic content in the biosolids is between 10 and 14 MJ kg
−1 [
47]. The calculations in this analysis have been determined assuming that the specific firing energy of the bricks is 2 MJ kg
−1 and the calorific value of the organic content in the biosolids is approximately 12 MJ kg
−1. The estimated energy saved during firing through the incorporation of biosolids in the bricks is calculated using Equation (1) [
25].
Energy saved during firing
| Mass of brick soil per brick: | Q1 = q × m1 | (1a) |
| Mass of brick soil per brick: | m2 = m1 − (m1 × OC) | (1b) |
| Mass of organic content in clay–biosolids mixture from biosolids only: | m3 = m1 × OC | (1c) |
| Energy used to fire one clay–biosolids brick: | Q2 = q × m2 − CV × m3 | (1d) |
| Energy saved: | Q1 − Q2 = q × m1 − (q × m2 − CV × m3) | (1e) |
| Energy saved: | | (1f) |
where:
q = 2 MJ kg−1 energy used for brick firing,
m1 = 3.3 kg mass of regular control clay brick (kg),
m2 = Mass of brick soil per dry green brick (kg),
m3 = Mass of organic content in a clay–biosolids mixture from biosolids only (kg),
OC = Percentage of organic content in a mixture from biosolids only (%),
CV = Approximate calorific value of organic content in biosolids = 12 MJ kg−1.
The optimum moisture content (OMC) of the brick soil and biosolids are adjusted to match the results that would be obtained through gyratory compaction. This method of compaction allows a large number of uniform brick samples to be produced, hereby providing more controlled testing. The Australian State Road Authorities extensively use gyratory compaction and have specified the Gyropac (
Figure 3) as the preferred method for compacting specimens to international standards and for research requirements. Compaction is achieved by the simultaneous static compression and shearing actions resulting from the motion of the centre line of the test specimen, while its end remains perpendicular to the axis of the conical surface. The confining pressure and number of gyrations can be pre-set on the hand held control pendant before beginning a test. The angle and rate of gyration were held constant in this study at 3° and 25 gyrations per minute, respectively.
Once the OMC was determined, the brick soil and biosolids samples were oven-dried at 105 °C for 24 h. A Hobart mechanical mixer was used for 20 min to ensure that large particles were broken down and that the mixture was smooth. The samples were then compacted with the same compaction pressure of 240 kPa in a mould of 100 mm diameter and 50 mm height. Following this, the green (unfired) bricks were air-dried for 48 h followed by a 24-h oven drying period at 105 °C, before being placed in a muffle furnace with a ramp rate of 0.7 °C/min up to 1100 °C. They were held at this temperature for 3 h, and, after firing the bricks, remained in the furnace until they cooled to room temperature. A series of tests were then conducted to determine the shrinkage, density, compressive strength, water absorption, initial rate of absorption (IRA), weight loss on ignition and potential for efflorescence. All the tests were conducted according to the Australian Standards [
48,
49,
50].
The effect on the microstructure of the brick samples from adding biosolids was determined using a Philips XL30 scanning electron microscope. The brick samples were mounted on a 25 mm pin stub and then attached using carbon tape. Moreover, the samples were then coated with approximately 20 nm of gold using an SPI sputter coater and analysed.
The possible environmental impacts that may arise due to the leaching of heavy metals were determined according to the Australian bottle leaching procedure (ABLP) method, as prescribed by the Australian Standards [
42]. Brick samples were crushed and filtered through a standard 2.4 mm sieve and an applicable extraction fluid was determined by measuring the pH of the test sample. The samples were then obtained through the use of the extraction fluid that was equal to 20 times the weight of the crushed brick particles used in the test. Following this, the samples were secured in an agitation device and rotated at 30 revolutions per minute for 18 h while maintaining a temperature of between 21 and 25 °C. They were then acidified to a pH of < 2 using nitric acid. In turn, the solid phase was separated from the liquid by means of a 0.45 μm filter and analysed for heavy metals using Inductively Coupled Plasma Mass Spectrometry (ICP-MS). This method has been used in the past by many researchers for trace metal analysis [
51,
52,
53,
54,
55].
3. Results and Discussion
3.1. Characterisation of Biosolids and Brick Soil
X-ray fluorescence (XRF) was used to determine the chemical composition of the brick soil and biosolids samples; the results are presented in
Table 1. The most prevalent elements were Silica (SiO
2), Alumina (Al
2O
3) and Ferric Oxide (Fe
2O
3). It should be noted that WTP 17–29 comprised a substantial amount of Sulphur Trioxide (SO
3) in comparison with the brick soil or other biosolids samples that recorded negligible amounts. Furthermore, the WTP samples contained significantly greater amounts of Calcium Oxide (CaO) than either of the other samples. Other than these two exceptions, the biosolids samples were very similar to the brick soil, and, therefore, have the potential to act as a partial replacement material in bricks.
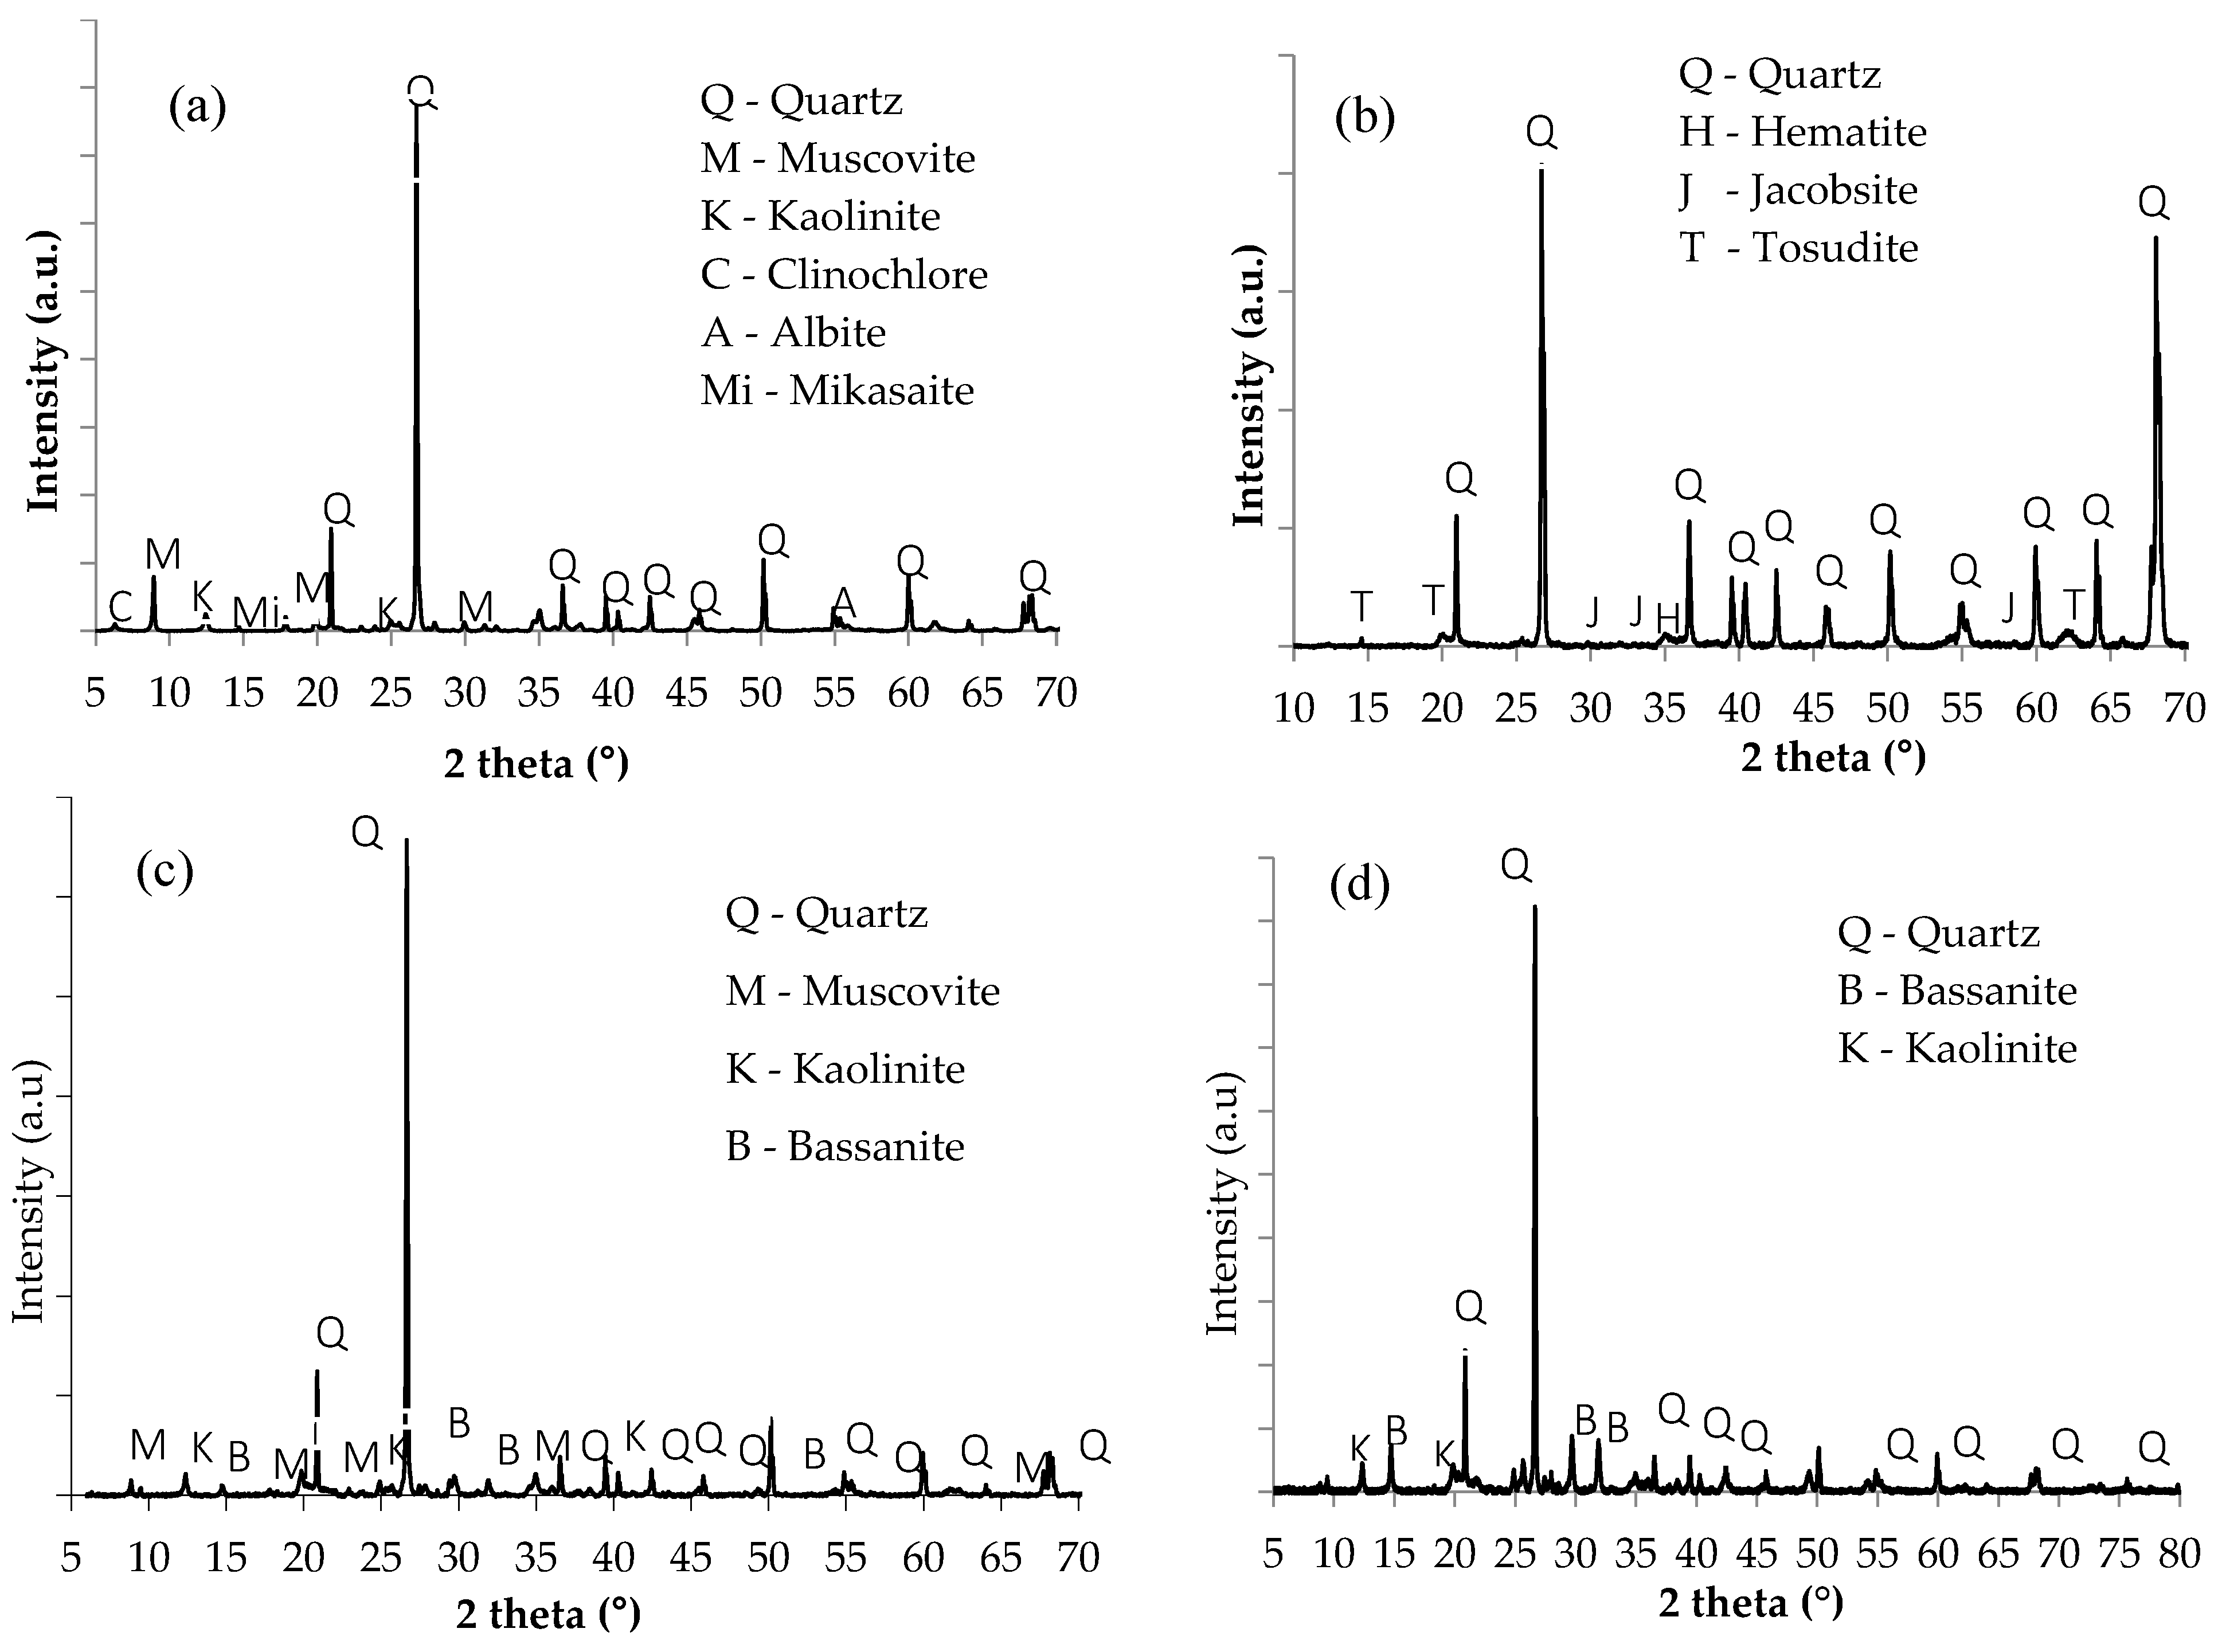
An X-ray diffractometer (XRD) was used to determine the major crystalline phases on a <75 μm sample of the brick soil and biosolids. As expected, all samples conveyed that Quartz (SiO
2) was the leading crystalline phase, with minor changes in the other constituents. The brick soil (
Figure 4a) displayed relatively higher levels of Muscovite (KAl
2(AlSi
3O
10)(F,OH)
2) and Kaolinite (Al
4(OH)
8(Si
4O
10)) than the other samples, while ETP 22 biosolids (
Figure 4b) registered notable traces of Hematite (Fe
2O
3), Jacobsite (MnFe
2O
4), and Tosudite ((K,Ca)
0.8A
l6(SI, Al)
8O
20(OH)
10.4H
2O). Additionally, WTP 10 biosolids (
Figure 4c) were shown to comprise Muscovite, Kaolinite and Bassanite (CaSO
40.5H
2O) similar to WTP 17-29 (
Figure 4d), which also contained Kaolinite and Bassanite.
3.2. Physical Properties of the Brick Soil and Biosolids Samples
The geotechnical properties of the brick soil and biosolids samples can be found in
Table 2. By testing the Atterberg limits it was found that the liquid limit ranged from 53–70% in the biosolids; which is substantially greater than the brick soil at 32%. The plastic limit range of the biosolids samples was also higher than the brick soil at 27–62% compared to 19%. The higher values for the plastic limits and liquid limits correspond to the higher organic content.
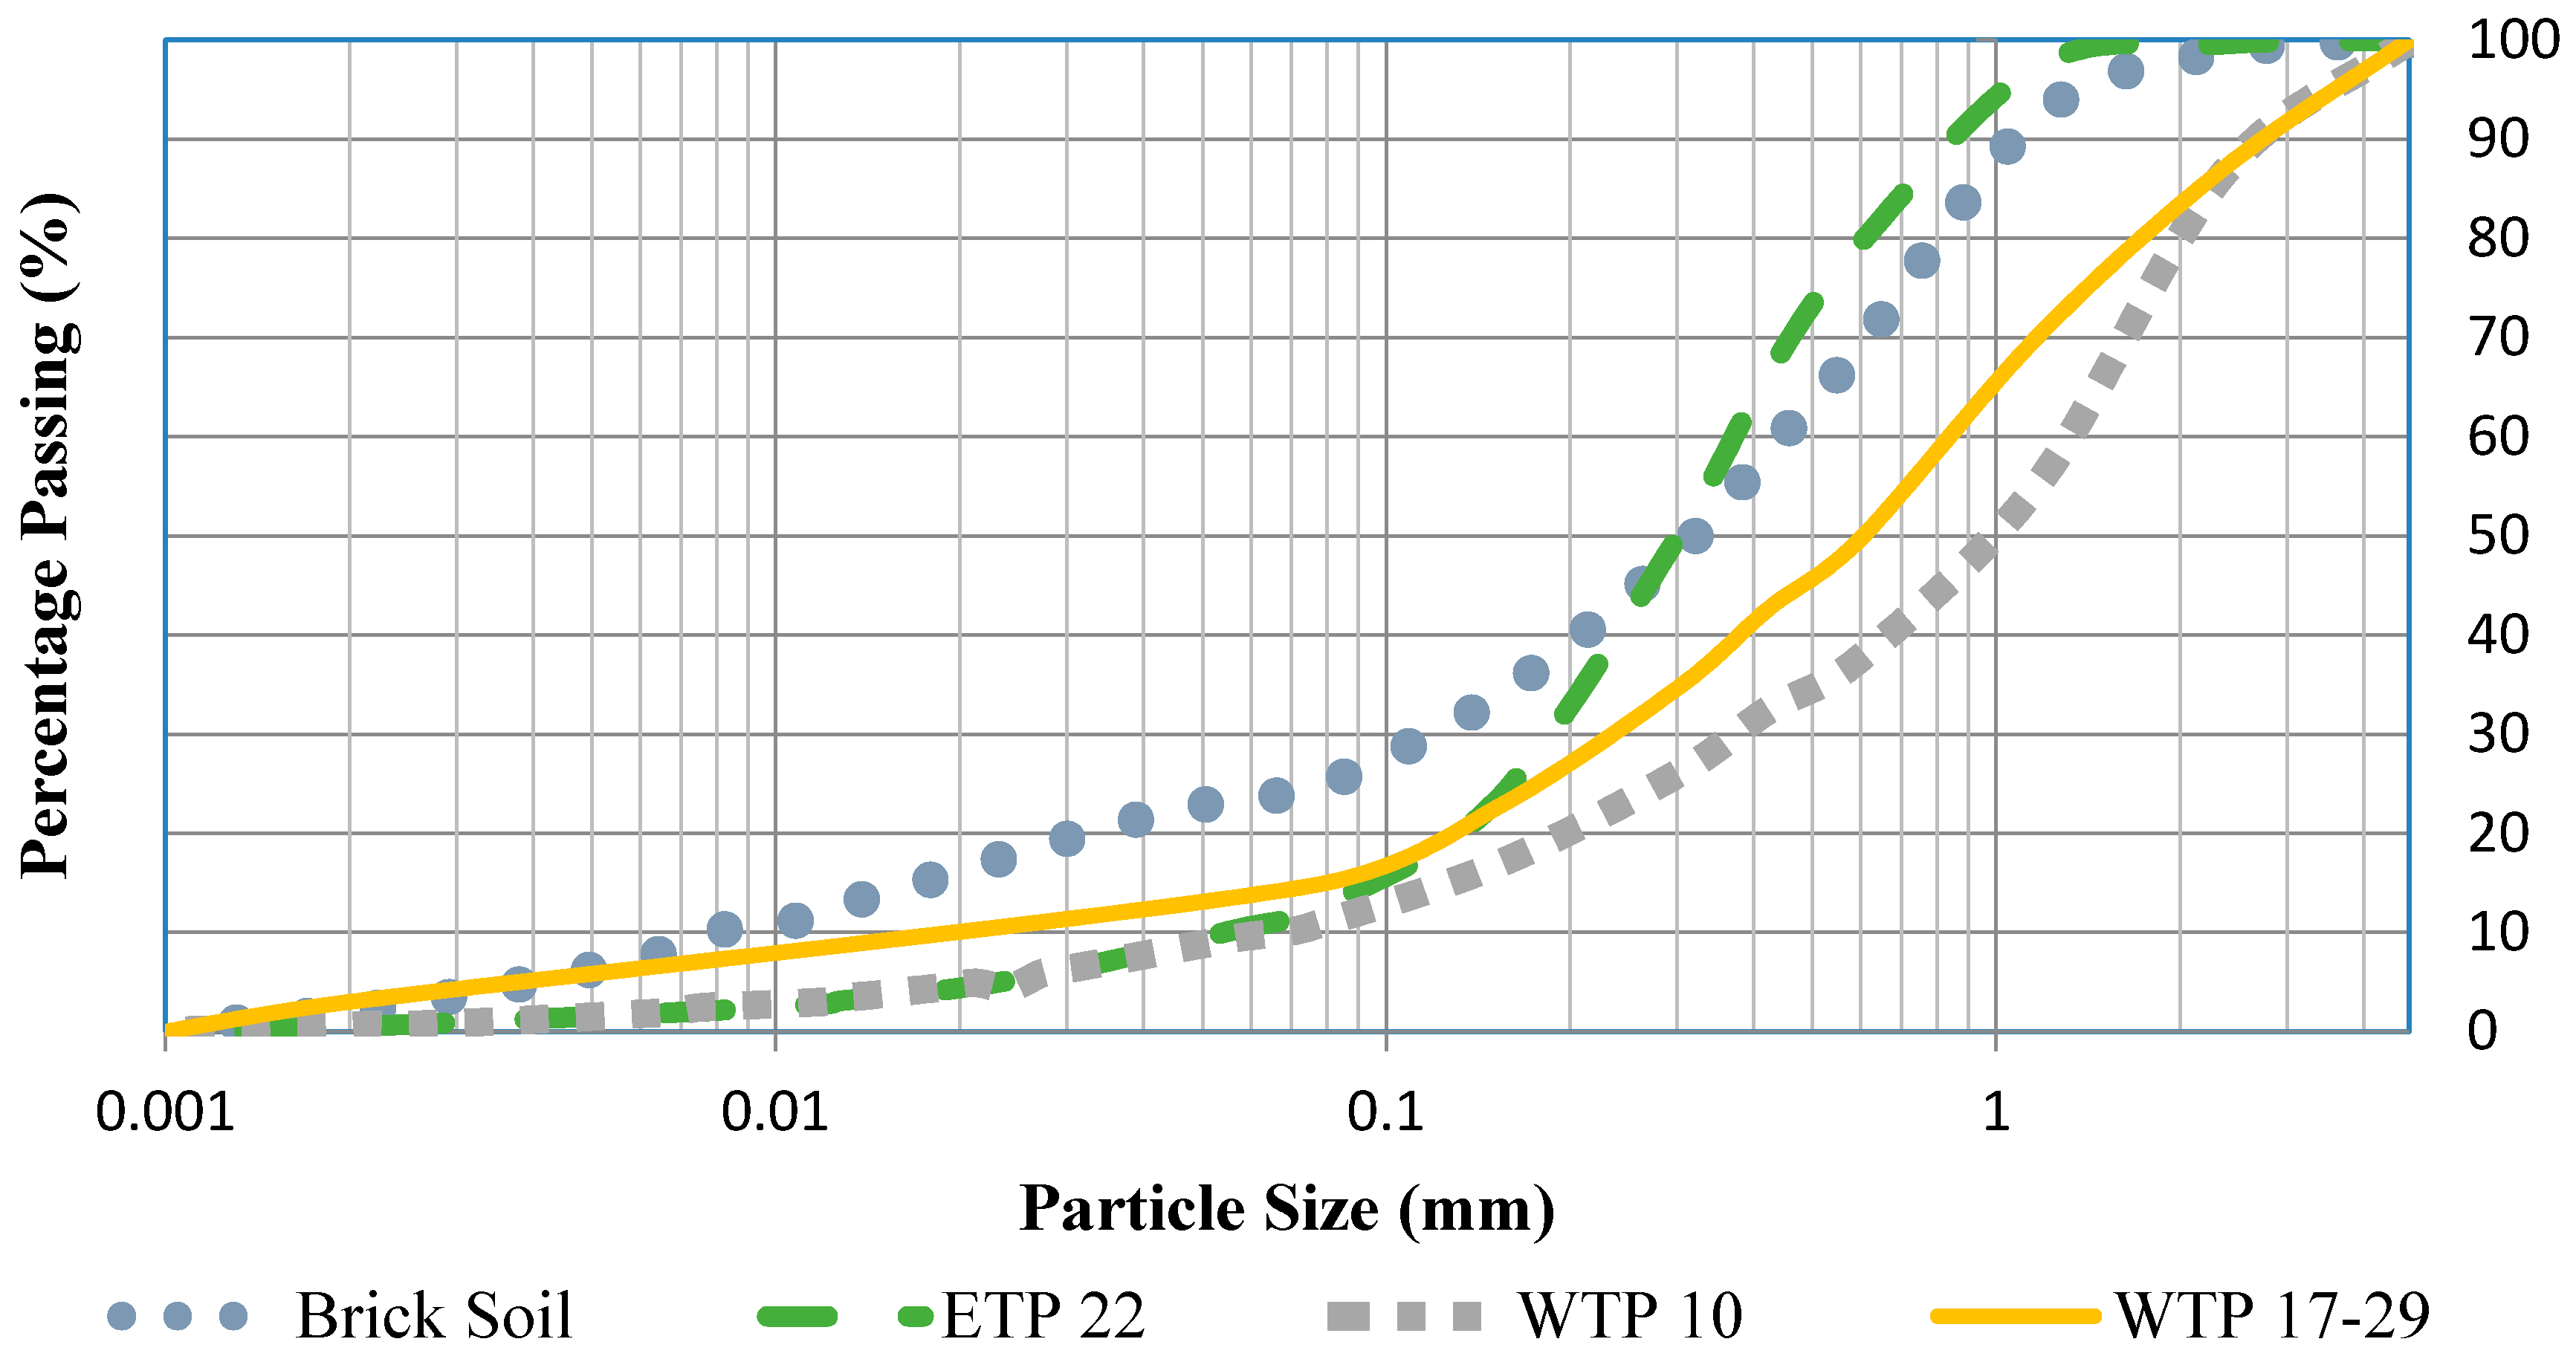
The particle size distributions for the samples were determined through sieve analysis and are shown in
Figure 5 [
56]. It was found that the WTP 10 and WTP 17–29 samples comprised significantly higher gravel content (13.4% and 12.94%, respectively) than ETP 22 (0.4%). In addition, brick soil comprised 24.2% fine particles (<0.075 mm), the highest of all the samples. The coarse fraction of the raw material has a significant impact on the reduction in the shrinkage of fired-clay bricks. Based on these results and those obtained from the Atterberg limits testing, the brick soil, ETP 22 and WTP 17–29 were all classified as clayey sand, while WTP 10 was well-graded silty sand.
The specific gravity of the biosolids samples and the brick soil was determined in accordance with the appropriate Australian Standards [
56]. Kerosene was substituted in preference to deionized or distilled water to avoid dissolving the soluble salts that may exist in the biosolids. The specific gravity for the brick soil, ETP 22, WTP 10 and WTP 17-29 was found to be 2.69, 2.51, 2.14 and 2.03, respectively. As anticipated, WTP biosolids demonstrated the lowest specific gravity; this was due to the higher levels of organic content [
57].
The shrinkage of the raw mixture is an influential indicator for determining the quality of bricks. Shrinkage and strain have a direct relationship, and a higher level of shrinkage increases the likelihood of cracks appearing. Linear shrinkage was calculated by determining the percentage reduction in the length of the bars of soil samples that were prepared at their liquid limit [
43,
44]. The linear shrinkage of the brick soil, ETP 22, WTP 10 and WTP 17–29 were calculated to be 6.6%, 14.2%, 10% and 6.7%, respectively.
The organic content was determined according to British Standards [
45]. The study found that both WTP samples contained substantially greater amounts of organic content than the ETP and brick soil samples. The WTP 17–29 sample comprised the most organic content (27.29%) with WTP 10 recording the second most (23.31%) and ETP 22 third (7.1%), compared to the brick soil (1.23%). Organic matter is prone to burning up during the firing process, which, in turn, leads to higher porosity, and results in decreased density and compressive strength. However, an increase in porosity would improve the thermal insulating properties of the brick, and, therefore, the desirable organic content should balance the engineering properties of the brick with associated environmental consequences.
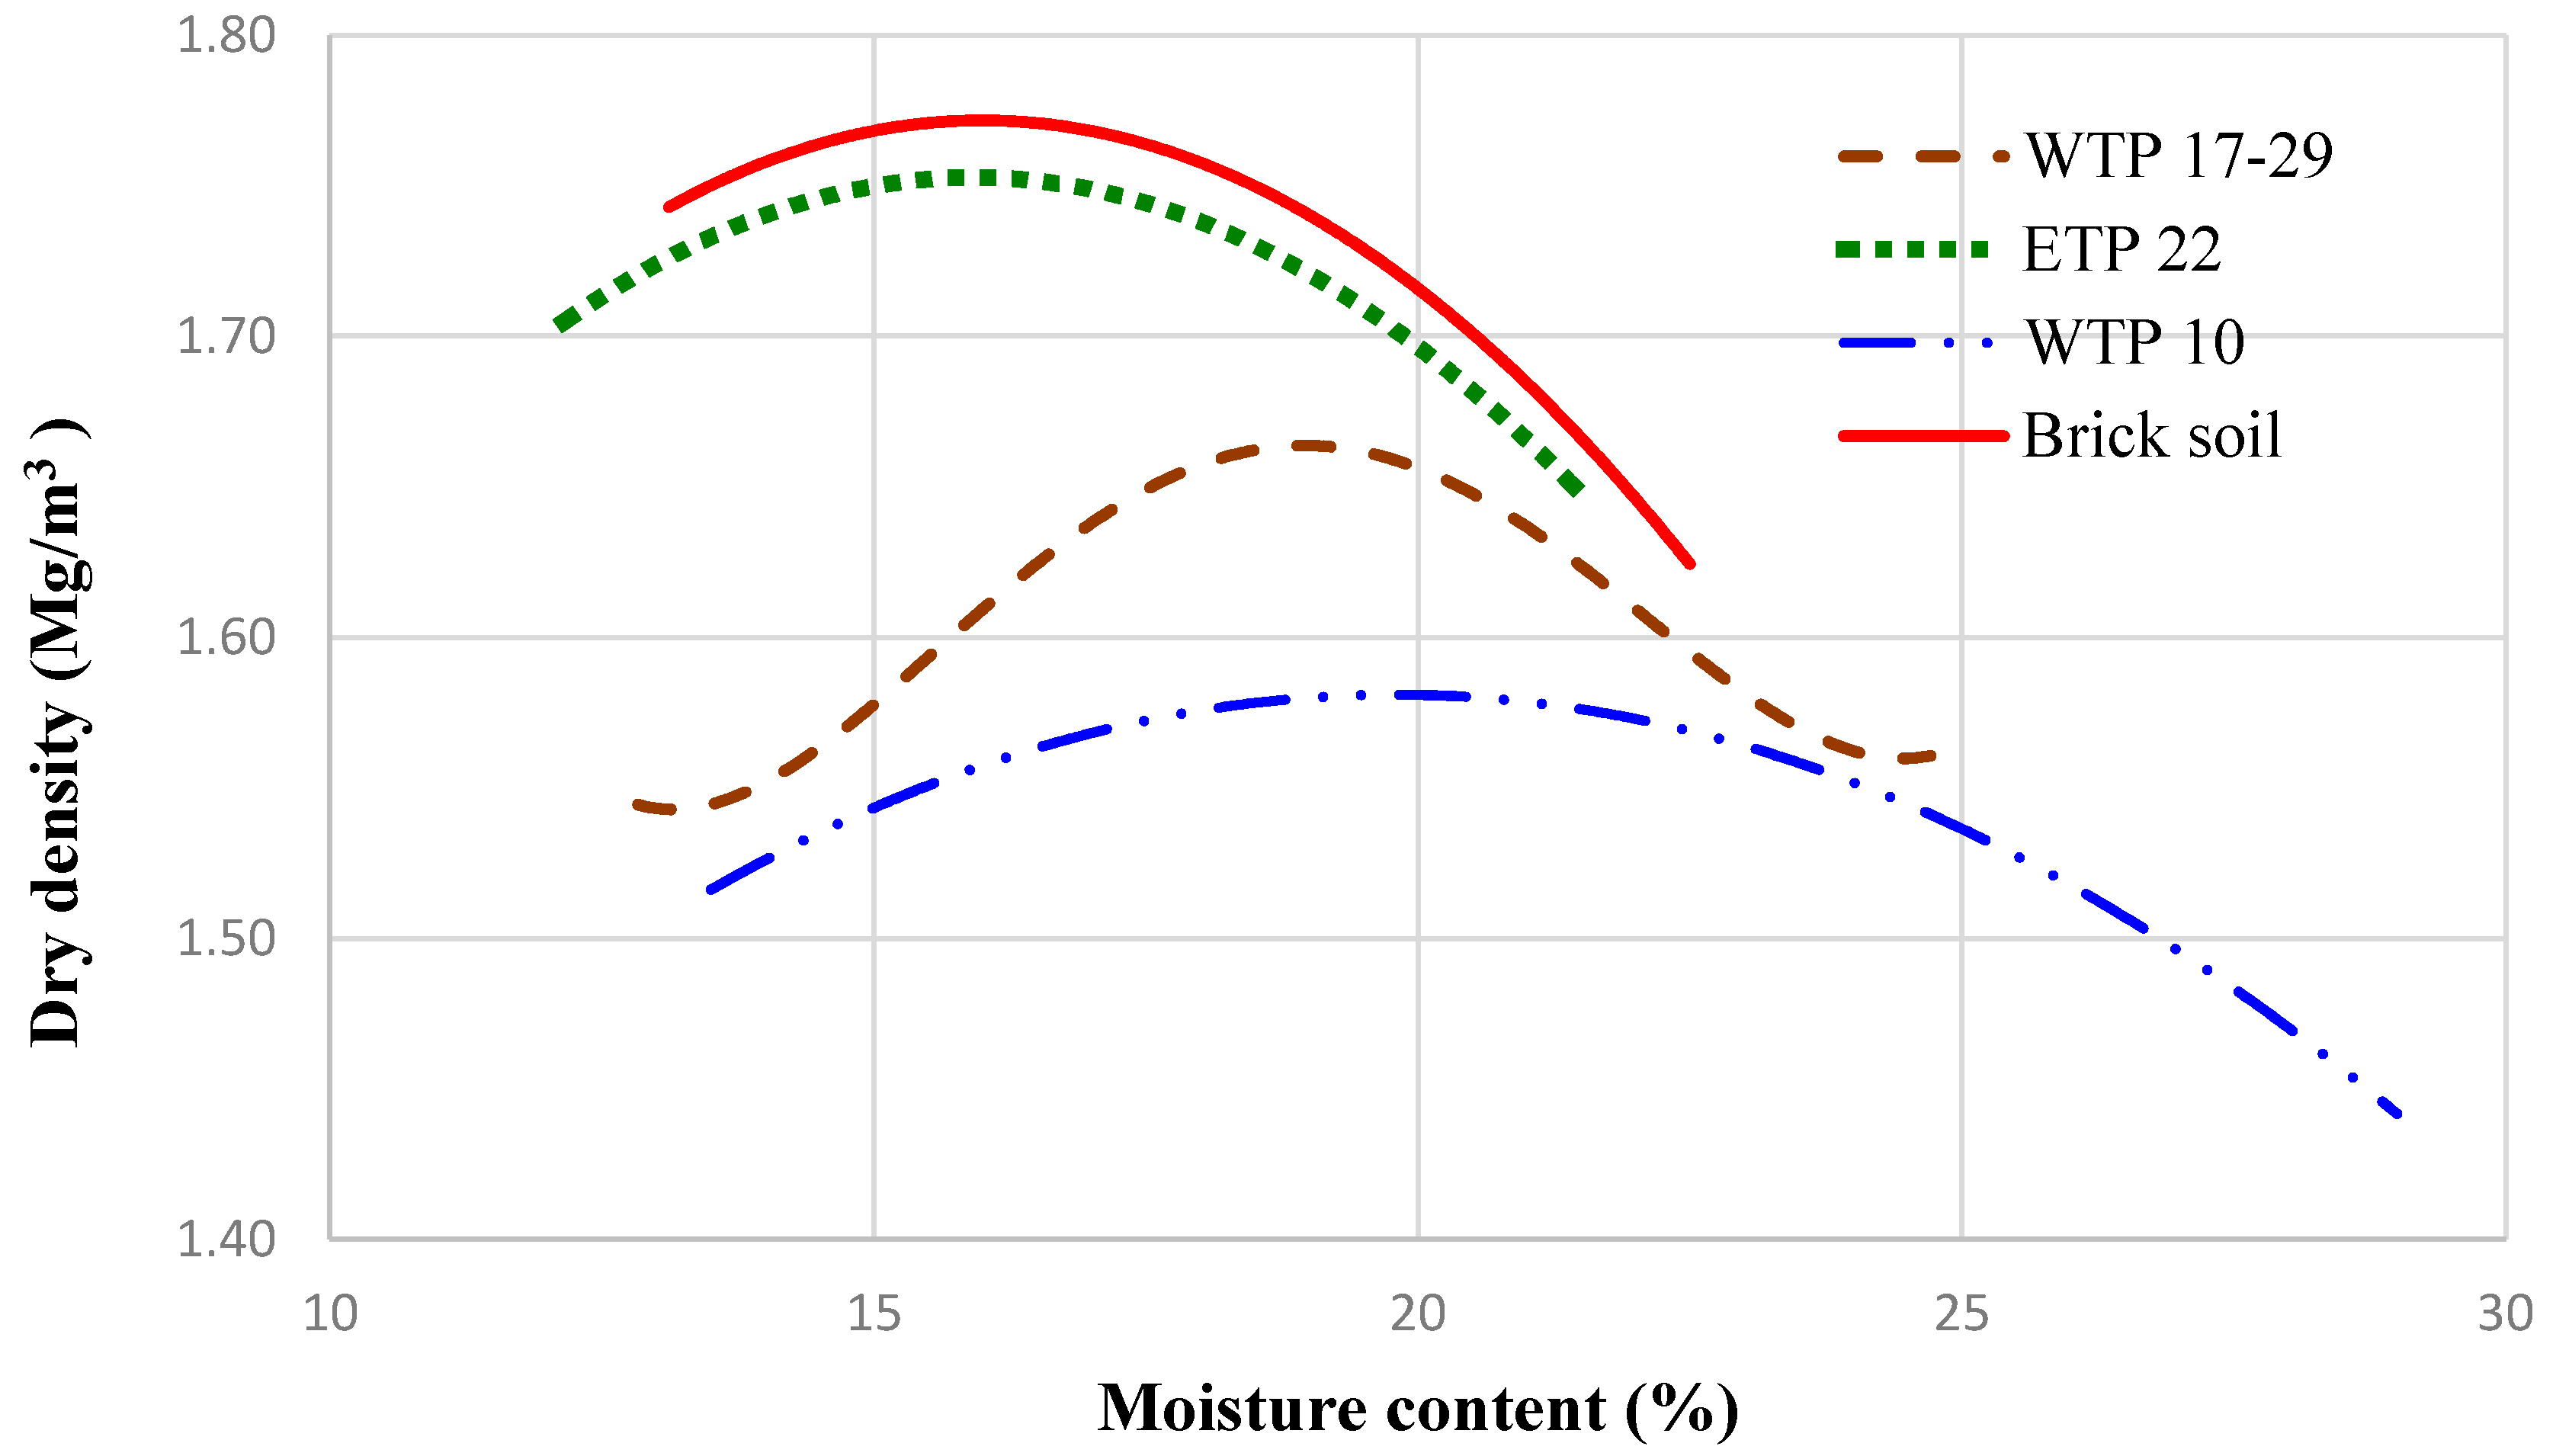
The optimum moisture content (OMC) of the samples was adjusted for use with the gyratory compaction machine. As shown in
Figure 6, the OMC of the clay–soil mixture with 25% ETP biosolids was found to be 17%, while that for the mixture comprising clay–soil and 25% WTP 10, and WTP 17–29 were 20% and 18%, respectively.
3.3. Properties of Bricks
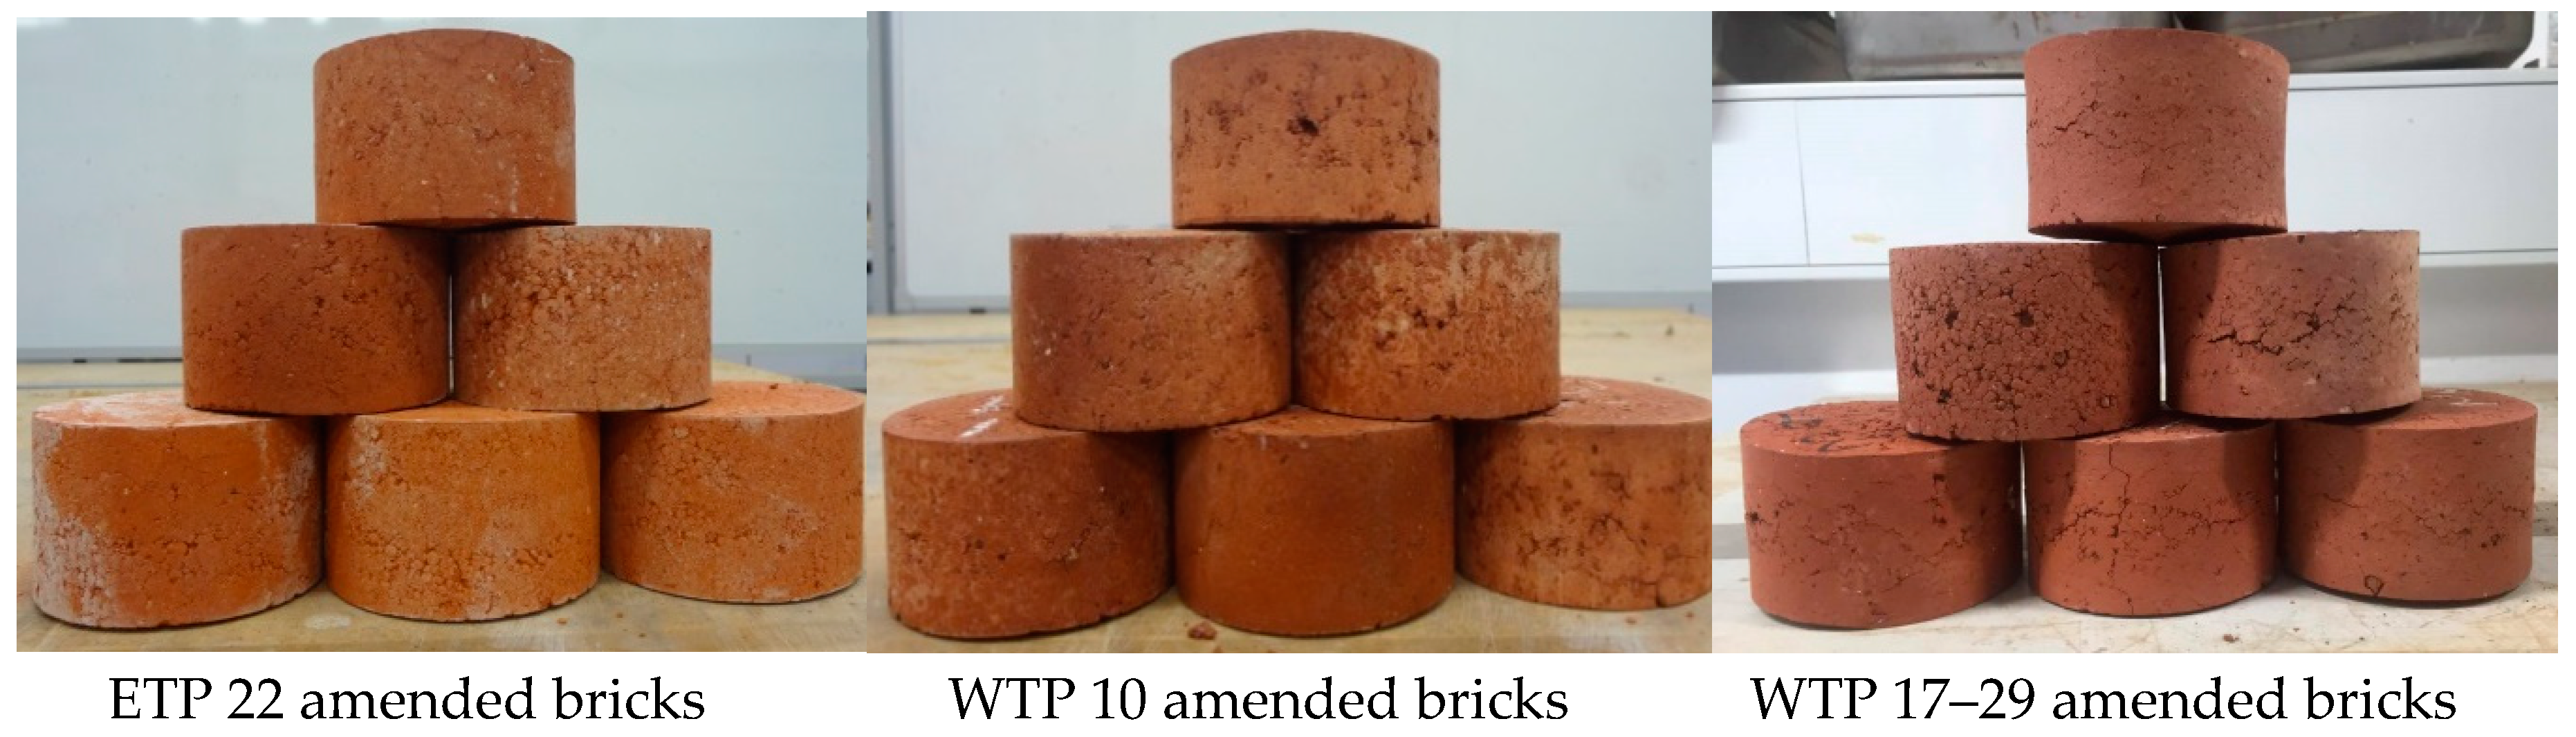
Clay–biosolids bricks comprising 25% by weight of ETP 22, WTP 10 or WTP 17–29 were manufactured alongside 100% clay–soil control bricks (
Figure 7).
The shrinkage properties of the manufactured bricks were evaluated. The removal of water from the green bricks during the initial drying period causes contraction of the bonding particles with the higher surface area, which eventually results in a decrease in the overall dimensions [
58]. This is essential, as greater shrinkage results in an increase in stress in the ceramic body, and, in turn, an increase in the likelihood of cracks to appear [
39]. Three brick samples from the control and each of the clay–biosolids batches were measured for initial and firing shrinkage with the average of their values represented in terms of height, diameter and volumetric shrinkage (
Table 3).
As shown in
Table 3, Clay–ETP 22 biosolids bricks showed the lowest firing diametric and height shrinkages with 1.78% and 1.70%, respectively. Conversely, Clay–WTP 10 biosolids bricks showed the highest values in both cases. This was largely due to different organic contents and particle size distributions. Generally, a good quality brick exhibits a total shrinkage of less than 8% [
58,
59] this benchmark was met by all bricks except the WTP 10 incorporated bricks, which failed in terms of their diametric firing shrinkage (9.71%). In order to improve the result, the initial mixing moisture content and compaction energy used in manufacturing could be reduced. This could also be achieved by decreasing the percentage of WTP 10 biosolids in the mixture.
The densities of the bricks were examined and are shown in
Table 4. The control bricks with 0% biosolids recorded the greatest density (2122 kg/m
3), while the bricks that incorporated WTP 17–29 recorded the lowest (1866 kg/m
3). As the data indicates, clay–biosolids bricks record lower level densities due to having greater amounts of organic content that is burned off during the firing process, which, in turn, increases their porosity.
The weight loss on ignition (LOI) of clay–ETP 22, clay–WTP 10 and clay–WTP 17–29 bricks were 5.5%, 11.3% and 11%, respectively. The control bricks showed the lowest weight loss of 4.7% (
Table 4). Due to the organic content in biosolids, an increase in weight loss on ignition is to be expected.
The initial rate of absorption (IRA) takes into account the amount of water that is soaked into the bed face of the brick in 1 minute. Low water infiltration is a contributing factor to the bricks durability and ensures greater resistance to the natural environment. High IRA values should be avoided as they can lead to defects and lower durability. The typical range for the IRA varies between 0.2 and 5 kg/m
2/min. All the manufactured bricks in this study satisfied this requirement (
Table 4).
Compressive strength testing was conducted to determine the structural properties of the bricks. The results indicate that clay–ETP 22 bricks have significantly greater compressive strength (27.9 MPa) than both its WTP 10 and WTP 17–29 counterparts at 14.3 MPa and 12.04 MPa, respectively. An acceptable compressive strength for bricks in most low-rise buildings is about 5 MPa [
60,
61]. All bricks overwhelmingly satisfied this minimum requirement for the compressive strength. The organic content present in the raw mixture has a significant impact on the compressive strength of the final product. This is a result of the increased porosity due to the thermal destruction of the organic matter.
Table 5 provides a comparison of the compressive strengths expected from bricks that incorporate varying percentages of biosolids.
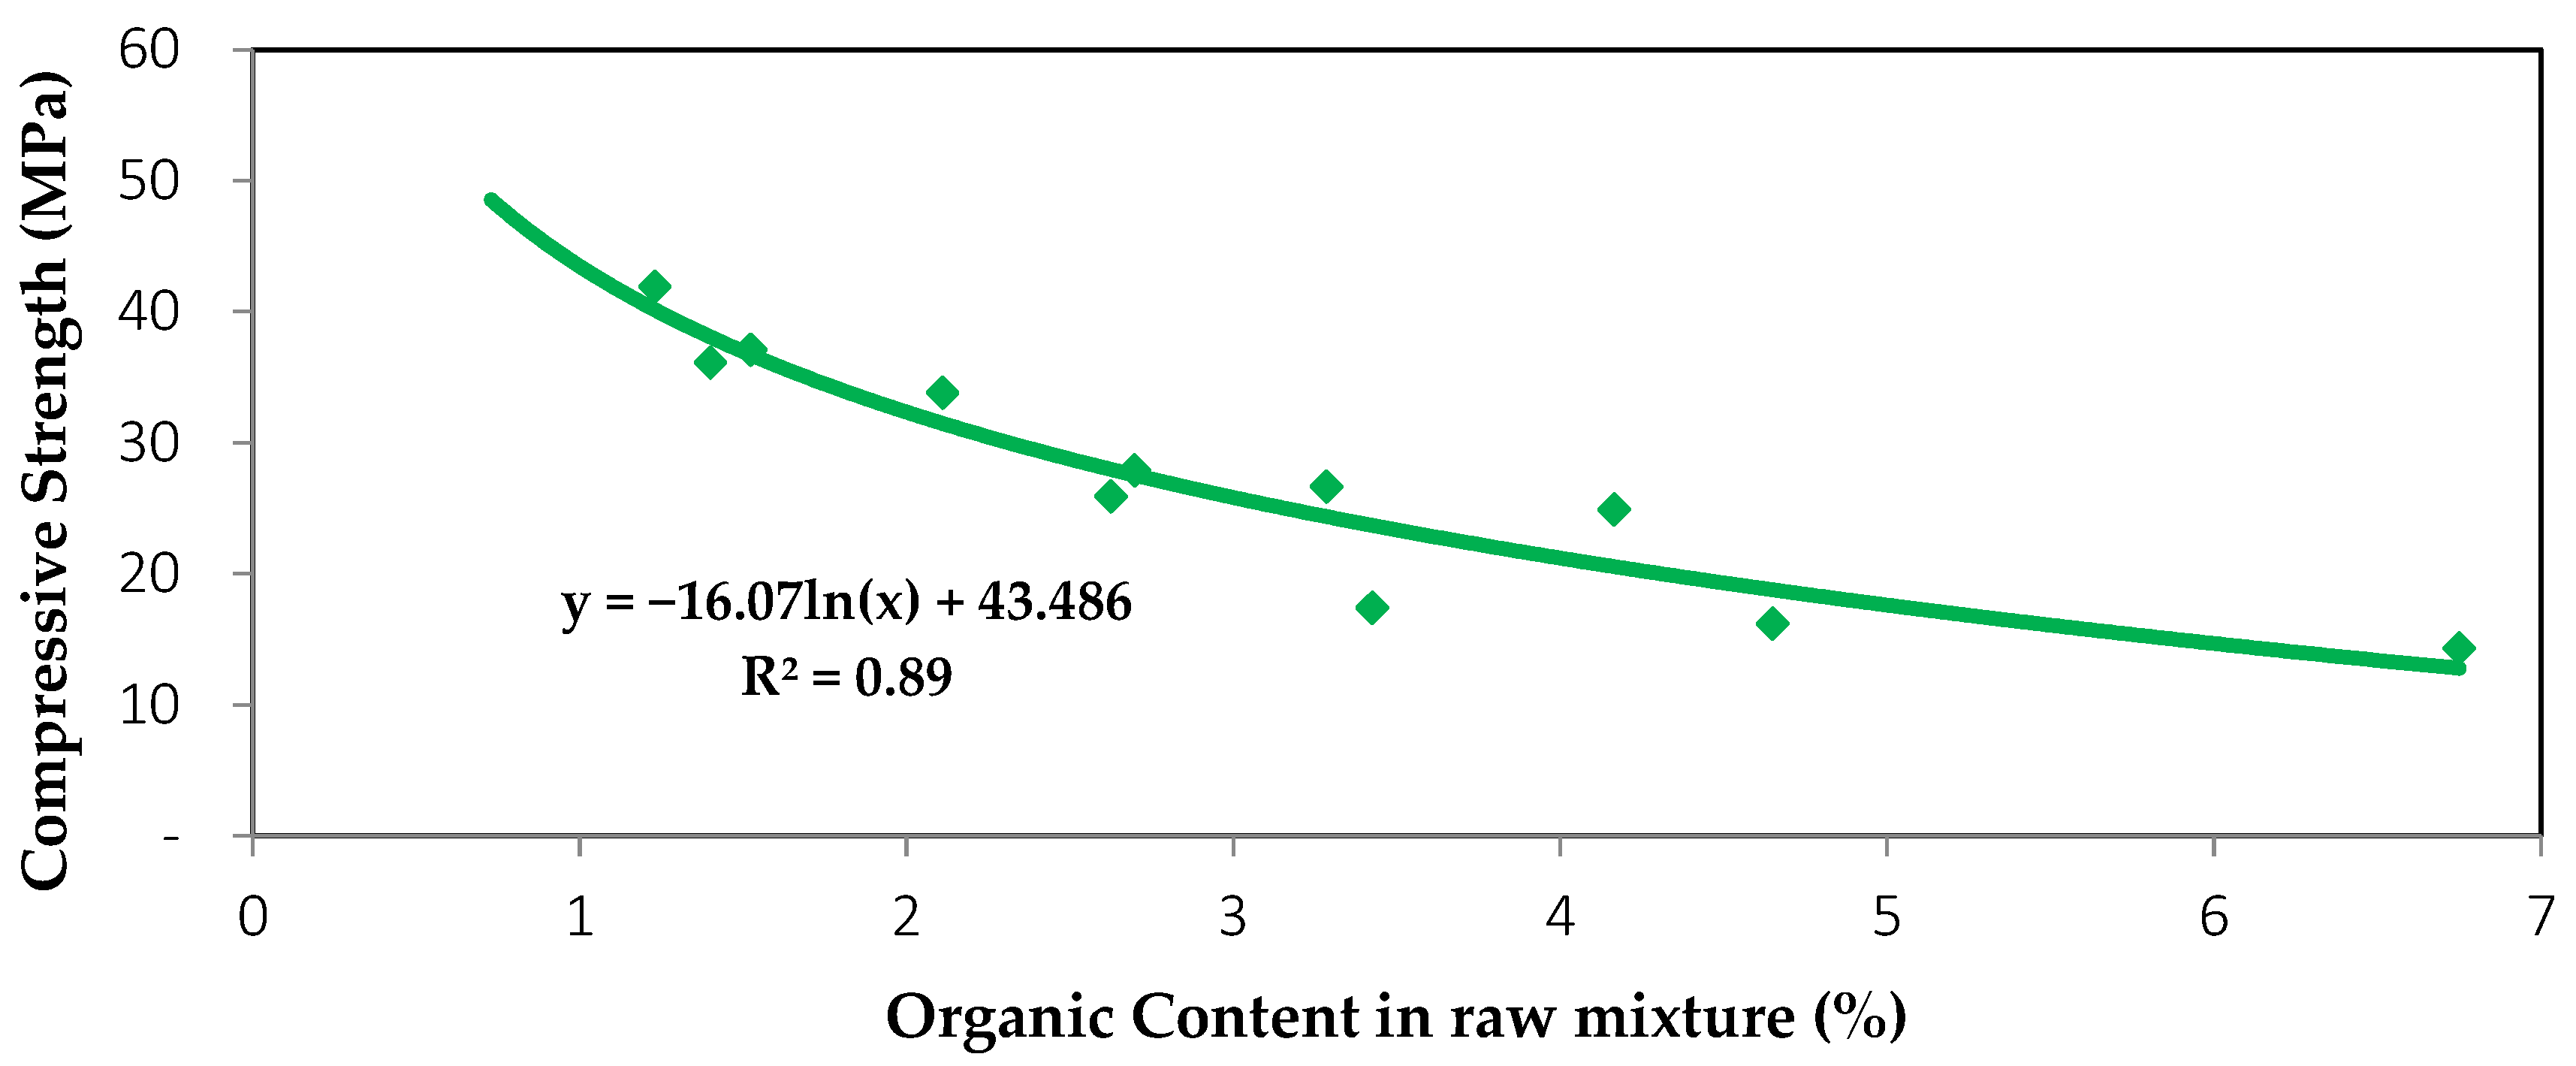
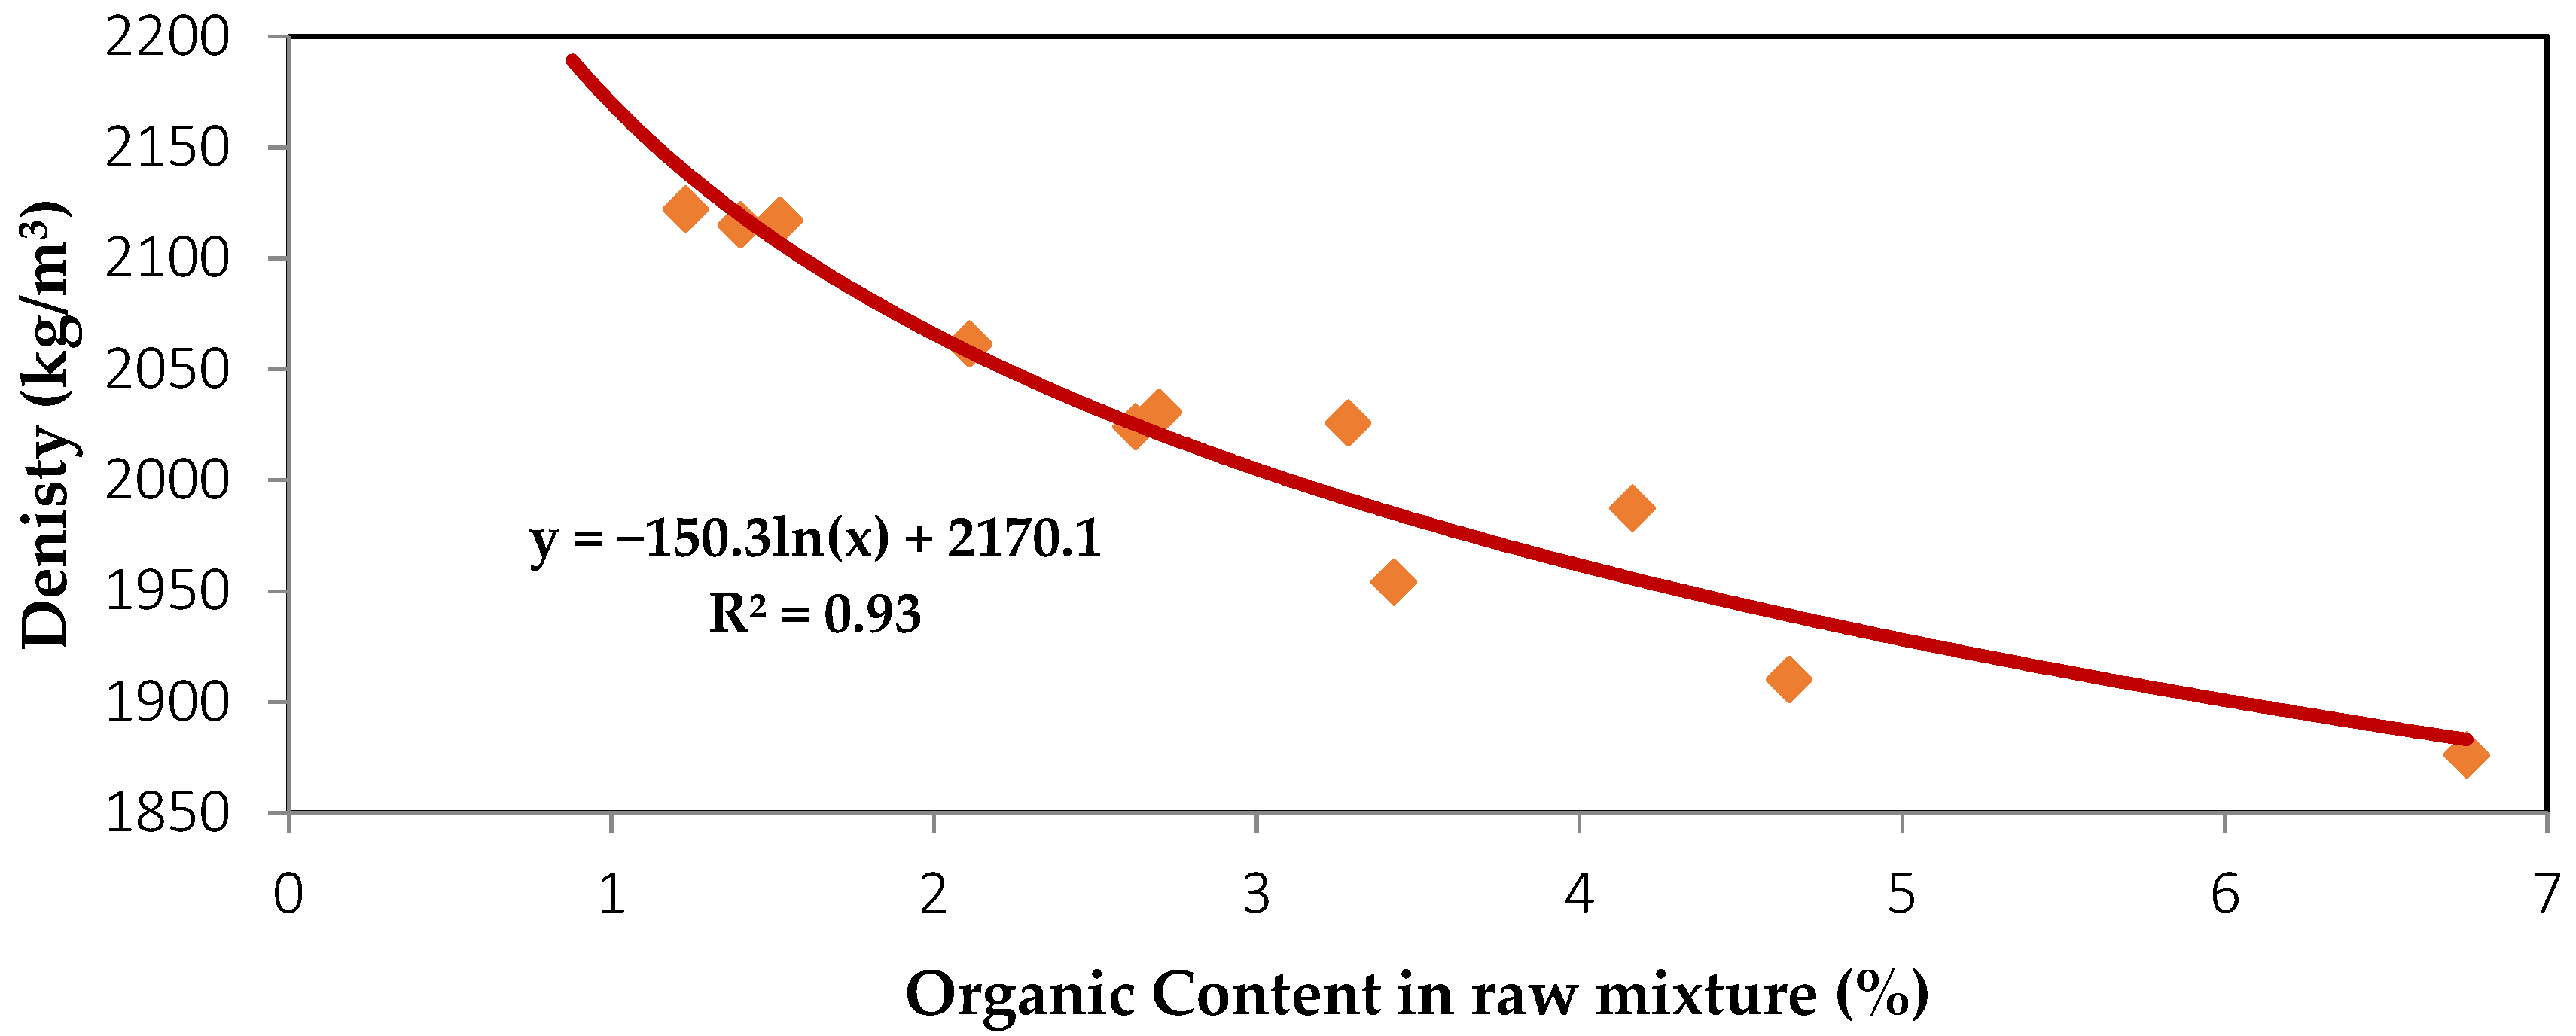
Some of the published and unpublished results from this study have been used to derive
Figure 8 and
Figure 9, which illustrate the strong correlation between compressive strength and density with respect to organic content. The obtained R
2 values of 0.89 and 0.93, respectively, indicate strong direct relationships.
The bricks were also analysed for water absorption. The values for 24-h water absorption in cold water (Ac) and 5-h absorption in boiling water (Ab) were determined, and the results are presented in
Table 6. The saturation coefficient (SC) is the ratio of absorption by 24-h submersion in cold water to that after 5-h submersion in boiling water. The water absorption results for the biosolids-amended bricks and control bricks were in agreement with the ASTM C62 [
62] standard specification for building bricks. The 5-h boiling water absorption of all bricks was far below the maximum acceptable limit of 17% for bricks exposed to severe weathering (SW).
Efflorescence is the crystallisation of soluble salts that leak from the interior of the brick to its surface. This phenomenon is an aesthetic issue that appears as a thin white salt deposit on the surface of porous building materials [
61,
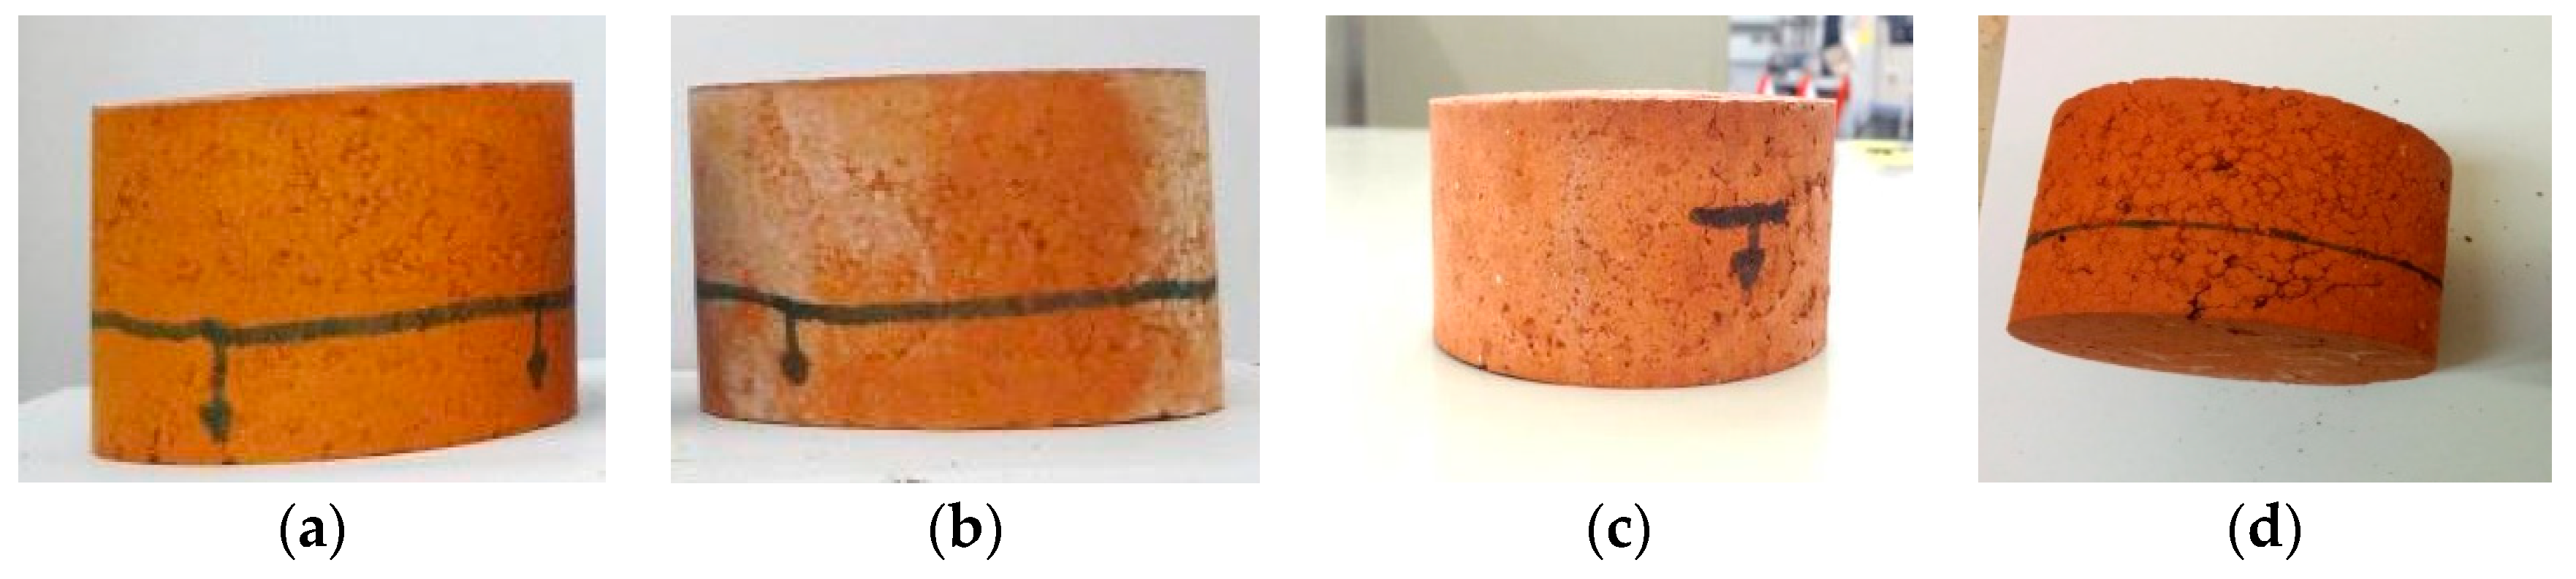
63]. To evaluate the efflorescence potential, brick samples were placed in distilled water and allowed to soak through for 7 days. The water level was maintained at 25 ± 5 mm depth and then samples were air dried for 2 days and compared with specimens that were not subjected to soaking. It was found that the ETP 22 biosolids bricks (
Figure 10b) had “slight efflorescence” according to the Australian standards [
50]. All other samples recorded no observable efflorescence. The efflorescence tendencies of the samples are shown in
Figure 10.
Thermal conductivity was estimated using Equation (2), which was developed in a previous study [
25]. This equation was developed using 256 test results for the thermal conductivity of different types of brick, concrete and aggregate.
where:
The estimated thermal conductivity of the control bricks was higher than that of the biosolids bricks. The thermal conductivity of the ETP 22, WTP 10 and WTP 17–29 25% biosolids-amended bricks decreased by approximately 12%, 29% and 39%, respectively, when compared to that of the control bricks (
Table 4). Thermal conductivity is an essential component in gauging energy saving due to its thermal insulating abilities. A low thermal conductivity corresponds to greater insulating properties of a material. As evident from the results presented in
Table 4, it was found that there is a strong direct relationship between the density and thermal conductivity.
3.4. Macrostructure of Bricks
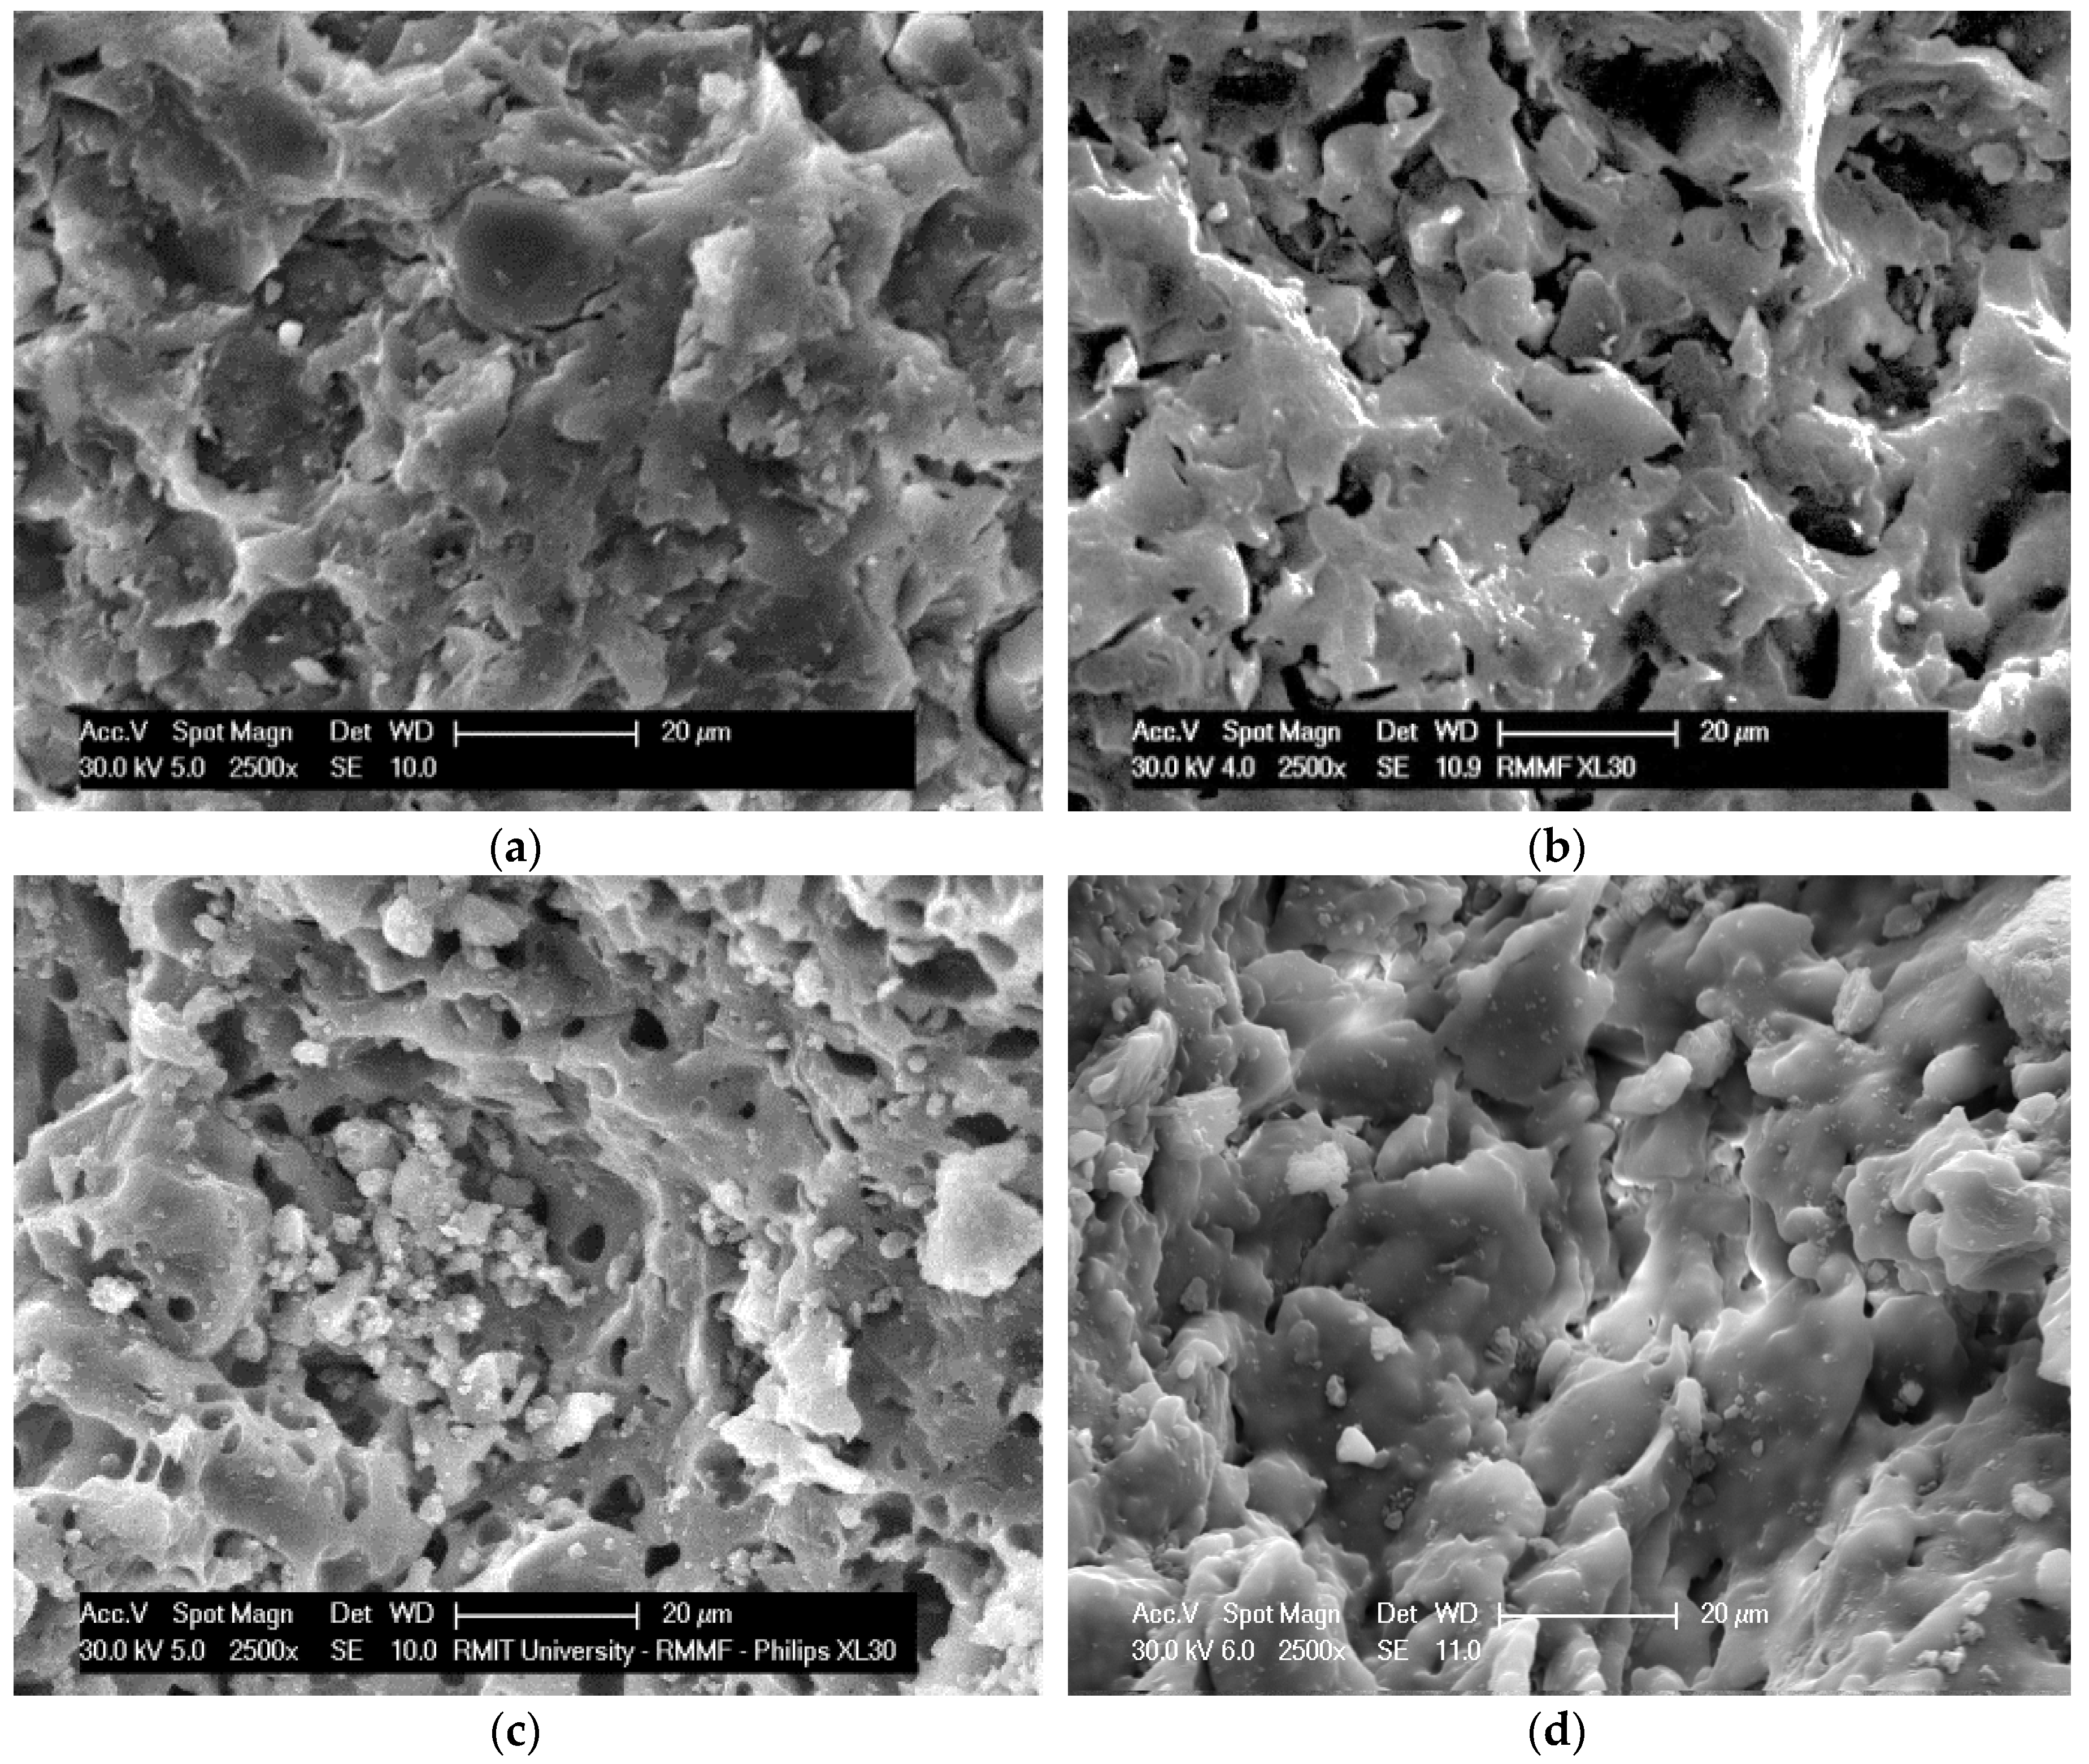
The captured SEM images of the control brick and the three biosolids-amended bricks are shown in
Figure 11. The frequency and size of the pores increase in the clay-biosolids bricks. The increase in porosity is due to the thermal destruction of organic matter during the firing stage. Due to this, lightweight bricks with lower strength can be expected which has been revealed in the density and compressive strength results.
3.5. Leachate Analysis
The comprehensive leachate results from this study indicate that the leaching of heavy metals from fired bricks was significantly lower than that for the unfired samples. Between 43–99% of heavy metals tested (As, Ag, Ba, Be, Cd, Cr, Cu, Mo, Ni, Pb, Sb, Se, and Zn) were immobilized inside all the fired bricks compared to the unfired green bricks.
The leaching of heavy metals from the brick soil, biosolids samples and the fired bricks were determined using the ABLP method, and the results are shown in
Table 7 and
Table 8. From the results, it can be seen that the heavy metal concentrations are insignificant compared with regulatory benchmarks for potable water and solid waste materials [
64,
65,
66,
67,
68]. The limits for potable water have been included for reference.
The ABLP tests for the green and fired bricks presented in this study were performed for single standard pH and liquid-to-solid ratio values. According to these results, it can be anticipated that biosolids-amended bricks are safe under various states of pH and liquid-to-solid ratio, because the concentrations of heavy metals in both green bricks and fired bricks are far below the regulatory benchmarks shown. However, the tests conducted may not be sufficient for characterizing leaching over the range of possible environmental conditions expected in various different uses or disposal scenarios, or over the lifetime of materials subject to shifting environmental conditions [
69,
70,
71]. The framework and methodologies first proposed by Kosson et al. in 2002 [
72], and published in 2013 by US EPA as new test methods [
71,
73], are strongly recommended for assessing the leachates of heavy metals from secondary materials such as waste-amended bricks.
3.6. Energy Saved during Firing
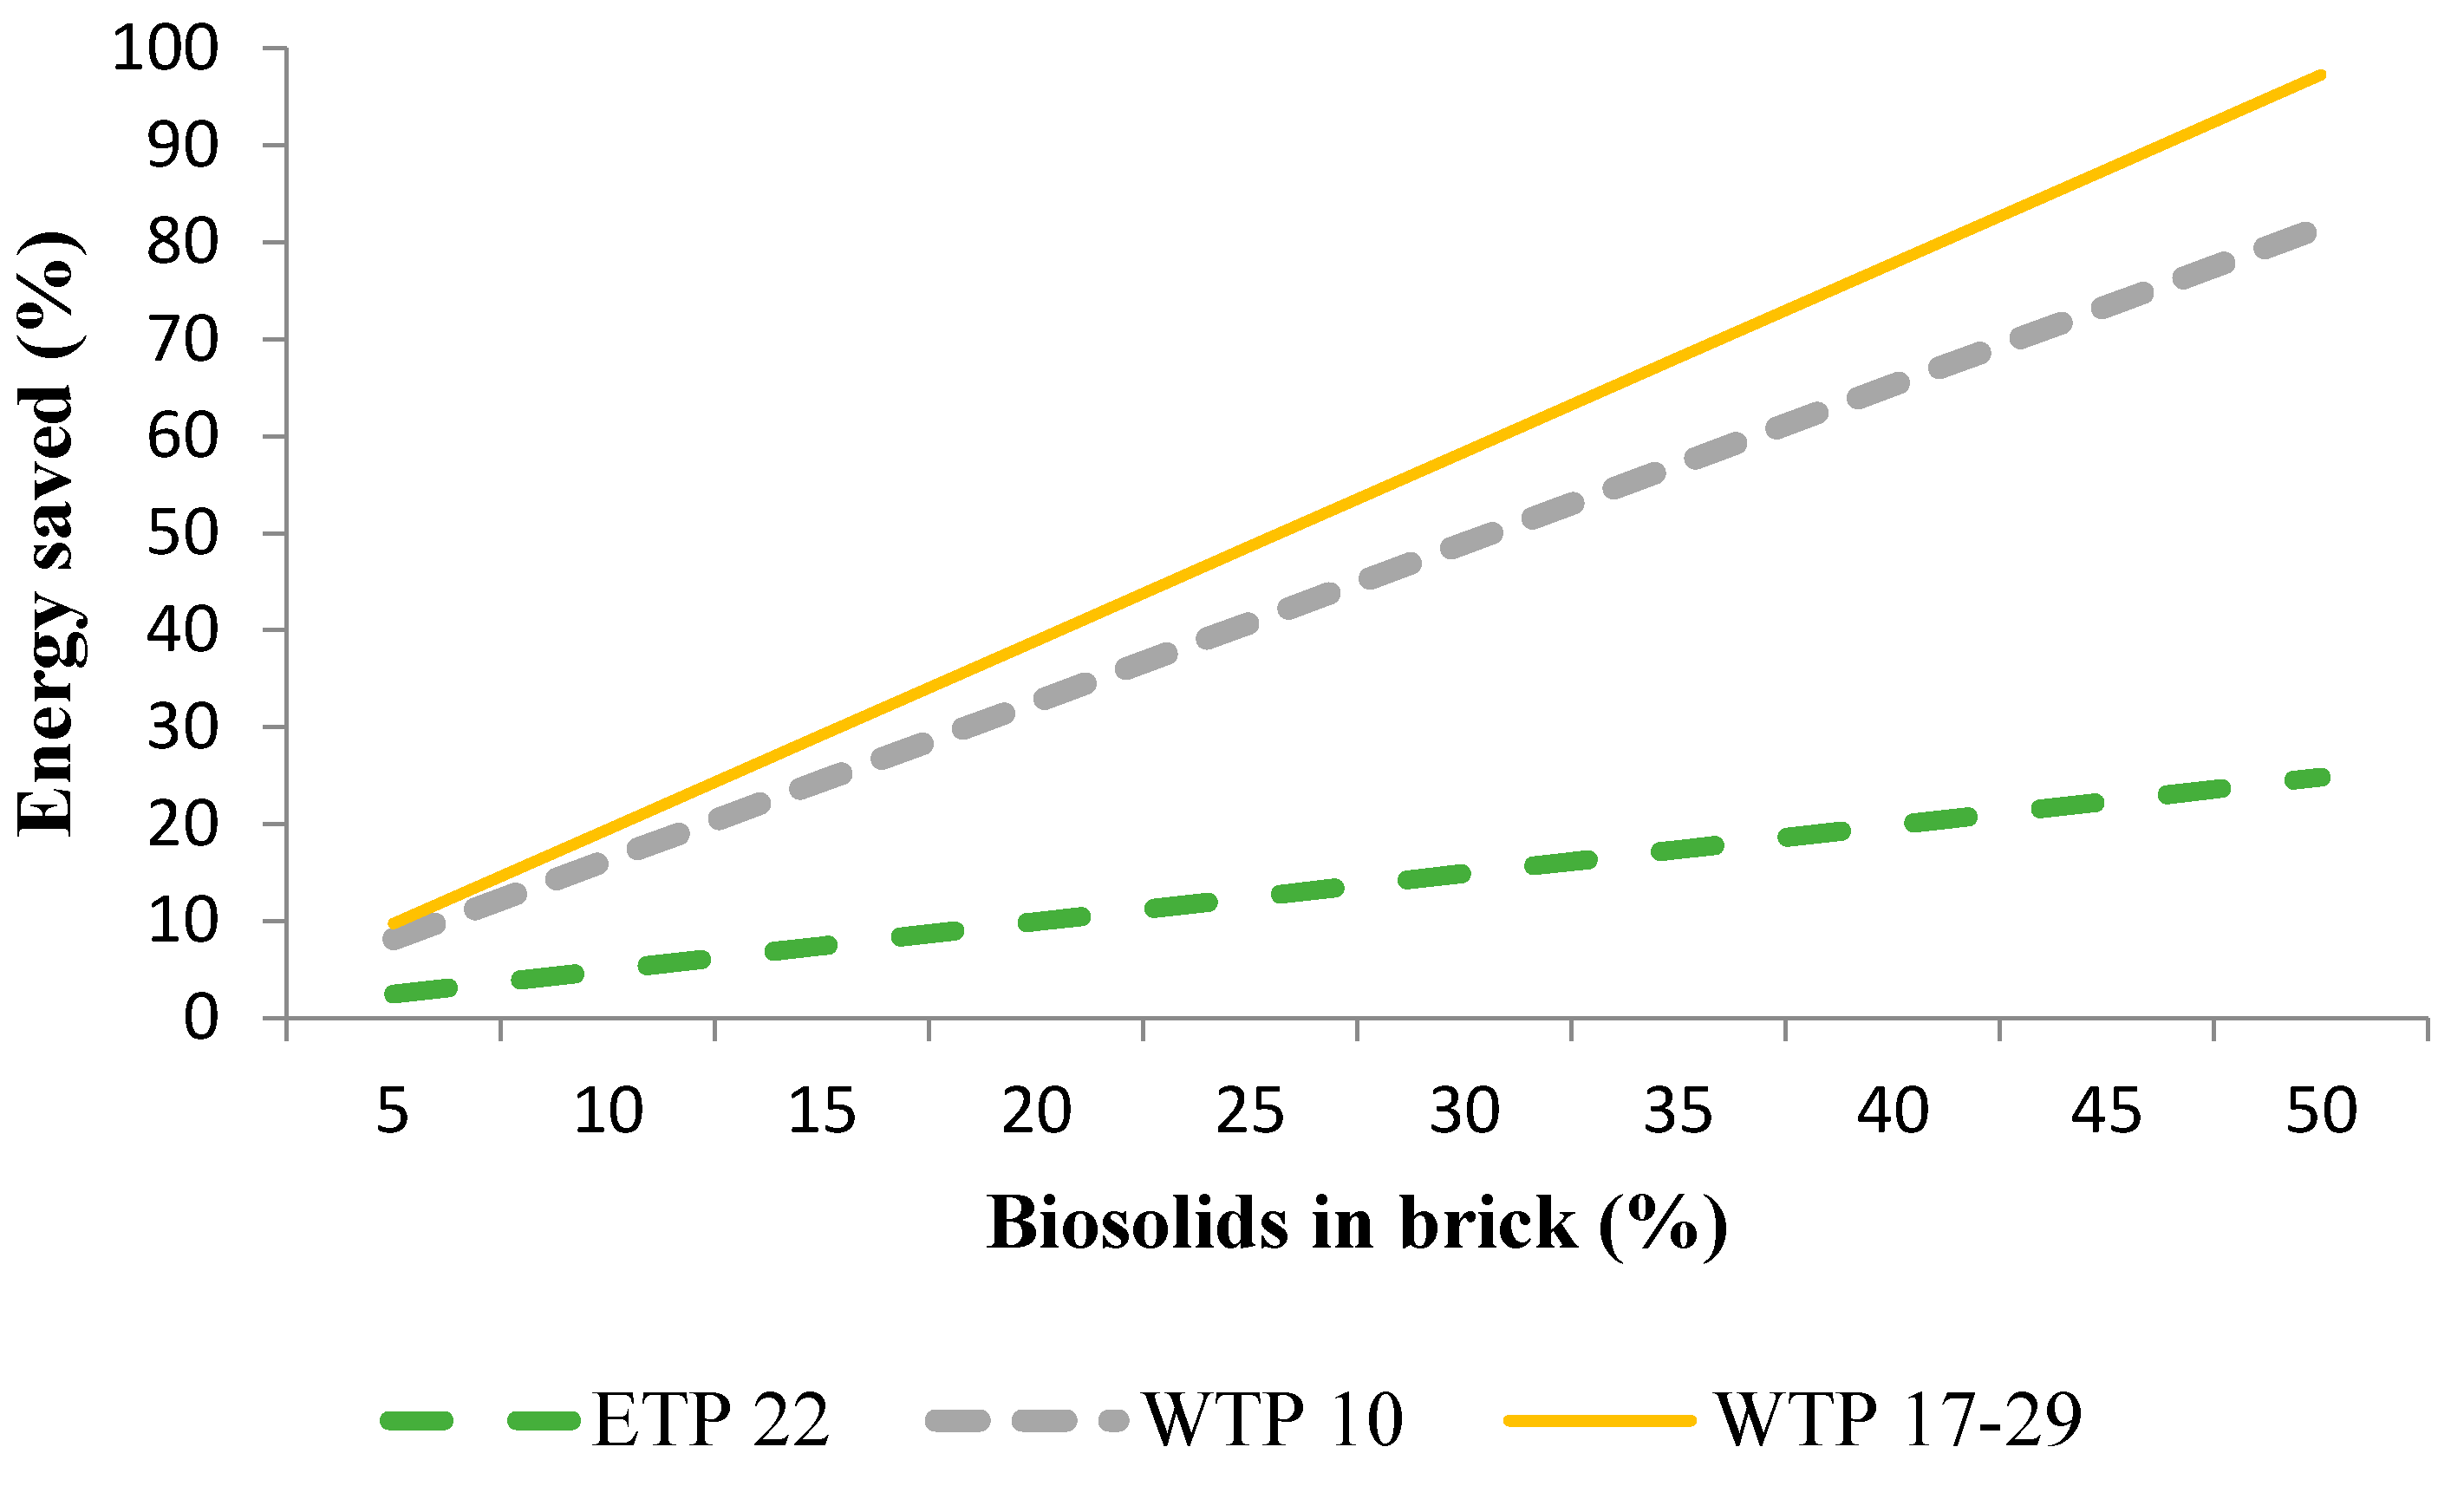
Equation (1f) allows us to estimate the amount of energy saved when firing clay–biosolids bricks due to the contribution of the organic content in the biosolids. The results calculated from this equation are noted in
Table 9 and
Table 10, and convey that with a 25% contribution of WTP 17–29 into a regular fired–clay brick, a 48.6% energy saving can be made during firing. This figure is extremely encouraging, as the 25% contribution of biosolids used in this study complies with all the regulatory standards, as discussed in previous sections, and would save up to 50% of the total firing energy used. This would act to greatly reduce the carbon footprint of brick-manufacturing companies.
The significant saving in firing energy is due to the substantial amount of organic content found in biosolids. It reduces the firing energy required by aiding the generation of heat inside the furnace.
Figure 12 illustrates the theoretical saving of energy during firing when incorporating different percentages of biosolids into the brick mixture. The amount of biosolids that can be used in the mixture depends on its organic content as it is the distinguishing factor in determining the physical, mechanical and chemical properties of the bricks [
57,
74]. In this study, it was determined that bricks incorporating 25% biosolids from the ETP 22, WTP 10 and WTP 17–29 stockpiles meet and surpass all the applicable standards regarding brick performance.
3.7. Environmental Impacts
The addition of biosolids to global brick production is a promising approach for preventing the greenhouse gas emissions and land demand of biosolid stockpiles. In addition, the possible energy savings during the firing process of biosolids-amended bricks positively affect the environmental impacts of brick production. Incorporating biosolids into bricks also reduces the demand for the excavation of large amounts of virgin soil from the earth’s crust.
The environmental impact associated with the production of conventional bricks compared to bricks incorporating different percentages of ETP and WTP biosolids has been studied as part of a life cycle assessment (LCA) study of biosolids-amended bricks, using SimaPro software (version 8.0.5.13) [
10]. The scope of the LCA study ranges from “cradle to gate”, which involves the clay and biosolids extraction, transportation, crushing and proportioning, grinding and screening, brick shaping, drying, firing and packaging. The energy used and the emissions produced have been quantified, and the potential environmental impacts were assessed and compared. The LCA results show that the incorporation of biosolids into bricks is a positive and promising alternative approach with respect to all the environmental impacts of biosolids treatment and brick manufacturing [
10,
75].
The LCA results indicate that biosolids can be utilised as an environmentally friendly replacement material for clay in fired clay bricks. This statement is supported by the results of this study, which demonstrate the entrapment of leachates within the bricks during the firing process. In addition, the LCA found that the embodied energy of biosolids bricks are significantly lower than that of conventional fired clay bricks without replacement materials. It was also found that biosolids bricks achieved better long-term environmental performance in terms of acidification and ozone depletion impacts. In summary, the LCA results indicate that the incorporation of biosolids in bricks significantly reduces all negative environmental impacts when compared to control bricks, with the exception of water depletion impact. It should be noted that the distance of biosolid stockpiles from manufacturing plants will affect these results.
4. Proposal
This study proposes the inclusion of a minimum of 15% biosolids content in 15% of global brick production in order to recycle all leftover biosolids and to reduce the demand for excavated soil.
In Australia, 30% of the 300 thousand dry tonnes of biosolids produced are stockpiled each year—equating to about 90 thousand dry tonnes [
1]. Australia also produces approximately 1.31 billion bricks each year. Estimating an average mass of 3.2 kg per brick, the total mass of bricks produced is therefore 4.192 million tonnes. Utilising 15% of this total to incorporate biosolids means that 628.8 thousand tonnes of brick production should include biosolids. Recycling biosolids into 15% of 628.8 thousand tonnes of brick mixture would recycle approximately 94.32 thousand tonnes of excess biosolids. This is greater than the estimated amount of annually unused biosolids in Australia, and, therefore, could help achieve the depletion of existing biosolids stockpiles and account for future increases in biosolids production. In addition, brick production would have significant energy savings during the firing process, varying from 12.4% to 48.6% for biosolids with organic contents of 7.1% to 27.79%.
The bricks incorporating only 15% of biosolids used in this study, are excellent quality bricks, suitable for use as standard high-quality bricks (
Table 11). The results from this study show that up to 25% biosolids can be incorporated for manufacturing normal bricks.
Incorporating biosolids into global brick production would also save a substantial amount of virgin soil from being excavated, which offers further environmental incentive for recycling biosolids in clay–fired bricks.
Over 1500 billion bricks are produced globally [
26], with Asia being the largest producer. Concurrently, the entire world produces significant amounts of biosolids that are deposited into stockpiles.
The production of bricks that incorporate biosolids is very simple and easily achieved. Brick producers will need to source biosolids from local stockpiles. The biosolids retrieved need to be from below the root zone to avoid extra organic matter from grass growing on the top layer of the stockpile. Biosolids samples must then be transported to the brick production site and added to the mixture of excavated clay and soil prior to the crushing and grinding of the raw materials. Approved local recommended safety requirements for excavation, transportation and handling biosolids should be adhered to.
As can be seen from this study, the mechanical properties of biosolids bricks are directly related to the organic content contributed from the inclusion of biosolids. Around the world, biosolids are produced in different environments, treated utilizing varying methods and stored in conditions which will not necessarily be similar or identical to those used in this study. As a result, it is essential that small-scale localised testing of biosolids be undertaken prior to incorporation in bricks, so that the organic and chemical contents of local unused biosolids is known. With this information, the expected performance of the bricks can be determined from
Figure 8. This is an essential first step in identifying suitable biosolids stockpiles for recycling in fired–clay bricks.
Leachate concentrations from the biosolids bricks were found to be insignificant, for the biosolids samples used in this study [
76]. Biosolids could have significantly different chemical characteristics depending on the origin of the wastewater and the treatment procedure. Therefore, it is essential that suitable leachate analysis be undertaken on test bricks before large scale production is endorsed according to US EPA methods 1314 and 1315, which shall explore the leaching behaviour of heavy metals at different liquid-to-solid ratios and pH values [
71,
73,
77].
5. Conclusions
This study has investigated the potential of incorporating biosolids into the raw material of clay–fired bricks. The chemical, physical and mechanical properties of bricks incorporating 25%, 20%, 15% and 10% by weight of biosolids samples, sourced from Melbourne Water’s Eastern and Western treatment plants (ETP 22, WTP 10 & WTP 17–29), were evaluated.
Organic content is the most important variable for the mechanical performance of the biosolids-amended bricks. SEM analysis confirmed that organic matter in bricks is burned away during firing, resulting in the development of greater pore volume. The increase in pore volume ultimately resulted in lower compressive strength values, reduced density and increased shrinkage for the biosolids-amended bricks compared to the control bricks. Average compressive strength testing results were between 35.5 MPa and 12.04 MPa for the bricks incorporated with 10% to 25% biosolids respectively. Acceptable compressive strength for bricks in most low-rise buildings is about 5 MPa.
In determining the geotechnical properties of the biosolids samples, it was found that ETP 22 and WTP 17–29 are classified as clayey silty sand and silty sand, respectively, while WTP 10 is well-graded silty gravelly sand. Importantly, the WTP samples were found to contain significantly more organic content than the ETP sample. The chemical characterisation of the biosolids samples and brick soil was determined through the use of X-ray fluorescence and X-ray diffraction. The results obtained convey no abnormalities that would hinder their suitability as a clay-replacement material. In fact, the composition of biosolids is very similar to the clay used in brick manufacturing.
The increased organic content also resulted in a drop in thermal conductivity for the biosolids samples. The ETP 22 clay–biosolids brick recorded 0.96 W/m/K, significantly higher than the WTP 10 and WTP 17–29 clay–biosolids bricks (0.77 W/m/K and 0.75 W/m/K, respectively) but lower than the control brick (1.09 W/m/K). Lower thermal conductivity would enhance the insulating abilities of the bricks. The contribution of the organic content to energy savings during firing was also estimated and conveys extremely positive results. Utilising biosolids in fired–clay bricks can save up to 48.6% of the firing energy for the biosolids samples used in this study.
Efflorescence testing also recorded positive results with all brick samples. Additionally, the water absorption of the bricks was found to comply with the requirement for building bricks. Furthermore, a leachate analysis was conducted to determine the amount of leaching of heavy metals from the ceramic body. The results indicate that between 43 and 99% of heavy metals in the raw mixture are immobilised in the brick after firing. Leachate concentrations from both the biosolids and biosolids bricks were found to be insignificant, for the biosolids samples used in this study.
The environmental impact associated with the production of conventional bricks compared to bricks incorporating different percentages of ETP and WTP biosolids have been studied as part of a Life Cycle Assessment (LCA) study of biosolids-amended bricks. The emissions study and comparative Life Cycle Assessment results show that the inclusion of biosolids in fired–clay bricks appears to have promising and significant positive benefits for the environment.
Based on the results found in this study, recycling biosolids in fired–clay bricks would significantly reduce the carbon footprint of brick production. In addition, brick production would have significant energy savings during the firing process, varying from 12.4% to 48.6% for biosolids with organic contents of 7.1% to 27.79%, as used in this study.
Bricks incorporating only 15% biosolids are excellent quality clean bricks suitable for use as standard high-quality bricks, for biosolids with organic contents up to about 35%. Furthermore, inclusion of biosolids into bricks also reduces the ongoing and growing demand for the excavation of large amounts of virgin soil from the earth’s crust.
Author Contributions
A summary of each author’s contribution to this work is provided below. Conceptualization, Supervision, Project leader and administration: A.M.; Original commencing research group: A.M., N.E., S.S.; Methodology: A.M., A.U.; Major Laboratory investigation and data analysis: A.U. under the supervision of A.M.; Laboratory investigation: M.S., M.A.; Data analysis: A.M., A.U., T.J.-B. and M.S.; LCA: A.U., A.M.; Literature review: A.M., A.U., T.J.-B., G.R. and S.B.; Writing, editing and reviewing: A.M., T.J.-B., G.R., A.U. and S.B.; Contribution to Supervision: N.E. and S.S.
Funding
This research received external funding from Melbourne Water, Australia.
Acknowledgments
The authors would like to thank Melbourne Water, RMIT University and Australian Government Research Training Program scholarship for their financial and in-kind support. In addition, the technical assistance of the Civil and Chemical Engineering and Rheology and Materials Characterization laboratories, and Microscopy and Microanalysis Facility, RMIT University, is gratefully acknowledged. Also, the authors are very grateful to Boral Bricks Pty Ltd. and PGH Bricks and Pavers (Victoria) for their support in providing the brick soil for this research.
Conflicts of Interest
The authors declare no conflicts of interest.
Abbreviations
| ETP | Eastern treatment plant |
| WTP | Western treatment plant |
| SEM | Scanning electron microscopy |
| XRF | X-ray fluorescence |
| XRD | X-ray diffraction |
| ABLP | Australian bottle leaching procedure |
| OC | Organic content |
| CV | Calorific value |
| OMC | Optimum moisture content |
| LOI | Weight loss on ignition |
| IRA | Initial rate of absorption |
| Ac | Cold water absorption |
| Ab | Boiling water absorption |
| SC | Saturation coefficient |
| R2 | Coefficient of correlation |
| SW | Severe weathering |
References
- ANZBP. What Are Biosolids? Australian Water Association. 2018. Available online: https://www.biosolids.com.au/info/what-are-biosolids/ (accessed on 28 December 2018).
- Lyberatos, G.; Sklyvaniotis, M.; Angelakis, A. Management of biosolids in EU countries: Challenges and Prospective. Fresenius Environ. Bull. 2011, 20, 2489–2495. [Google Scholar]
- Davis, R.; Slaughter, B. Biosolids Management: Options, Opportunities and Challenges; NACWA: Washington, DC, USA, 2006. [Google Scholar]
- Rigby, H.; Clarke, B.O.; Pritchard, D.L.; Meehan, B.; Beshah, F.; Smith, R.S.; Porter, N.A. A critical review of nitrogen mineralization in biosolids-amended soil, the associated fertilizer value for crop production and potential for emissions to the environment. Sci. Total Environ. 2016, 541, 1310–1338. [Google Scholar] [CrossRef] [PubMed]
- AWA. The Management of Biosolids in Australia; Australian Water Association: Sydney, Australia, 2012. [Google Scholar]
- EPA Victoria. Guidelines for Environmental Management—1288; Use of Biosolids as Geotechnical Fill; EPA Victoria: Melbourne, Australia, 2009.
- Melbourne Water. Waste to Resources. 2016. Available online: https://www.melbournewater.com.au/community-and-education/about-our-water/liveability-and-environment/waste-resources (accessed on 28 December 2018).
- Rulkens, W. Sewage Sludge as a Biomass Resource for the Production of Energy: Overview and Assessment of the Various Options. Energy Fuels 2007, 22, 9–15. [Google Scholar] [CrossRef]
- Australian Government. National Waste Reporting 2013: Factsheet—Biosolids Profile. Department of the Environment and Energy, 2013. Available online: http://www.environment.gov.au/system/files/resources/0a517ed7-74cb-418b-9319-7624491e4921/files/factsheet-biosolids.pdf (accessed on 18 December 2018).
- Mohajerani, A.; Ukwatta, A.; Setunge, S. Fired-Clay Bricks Incorporating Biosolids: A Comparative Life Cycle Assessment. J. Mater. Civ. Eng. 2018, 30, 1–12. [Google Scholar] [CrossRef]
- D’Andrea, A.; Fustaino, C.; Tozzo, C. Recycling dredged sludge in asphalt pavement. J. Mater. Civ. Eng. 2014, 26, 05014005. [Google Scholar] [CrossRef]
- Mohajerani, A.; Lound, S.; Liassos, G.; Kurmus, H.; Ukwatta, A.; Nazari, M. Physical, mechanical and chemical properties of biosolids and raw brown coal fly ash, and their combination for road structural fill applications. J. Clean. Prod. 2017, 166, 1–11. [Google Scholar] [CrossRef]
- Paranavithana, S.; Mohajerani, A. Effects of recycled concrete aggregates on properties of asphalt concrete. Resour. Conserv. Recycl. 2006, 48, 1–12. [Google Scholar] [CrossRef]
- Arulrajah, A.; Maghoolpilehrood, F.; Disfani, M.M.; Horpibulsuk, S. Spent coffee grounds as a non-structural embankment fill material: Engineering and environmental considerations. J. Clean. Prod. 2014, 72, 181–186. [Google Scholar] [CrossRef]
- Mohajerani, A.; Tanriverdi, Y.; Nguyen, B.; Wong, K.; Dissanayake, H.; Johnson, L.; Whitfield, D.; Thomson, G.; Alqattan, E.; Rezaei, A. Physico-mechanical properties of asphalt concrete incorporated with encapsulated cigarette butts. Constr. Build. Mater. 2017, 153, 69–80. [Google Scholar] [CrossRef]
- Mohajerani, A.; Vajna, J.; Cheung, T.; Kurmus, H.; Arulrajah, A.; Horpibulsuk, S. Practical recycling applications of crushed waste glass in construction materials: A review. Constr. Build. Mater. 2017, 156, 443–467. [Google Scholar]
- Disfani, M.M.; Arulrajah, A.; Suthagaran, V.; Bo, M.W. Geotechnical characteristics of recycled glass-biosolids mixtures. In Proceedings of the 17th International Conference on Soil Mechanics and Geotechnical Engineering, Alexandria, Egypt, 5–9 October 2009; Hamza, M., Shahien, M., El-Mossallamy, Y., Eds.; IOS Press: Amsterdam, The Netherlands, 2009. [Google Scholar]
- Disfani, M.; Arulrajah, A.; Suthagaran, V.; Bo, M. Shear strength behavior of recycled glass-biosolids mixtures. In Proceedings of the 62nd Canadian Geotechnical Conference and 10th Joint CGS/IAH-CNC Groundwater Conference, Halifax, NS, Canada, 20–24 September 2009. [Google Scholar]
- Arulrajah, A.; Disfani, M.M.; Suthagaran, V.; Bo, M.W. Laboratory Evaluation of the Geotechnical Characteristics of Wastewater Biosolids in Road Embankments. J. Mater. Civ. Eng. 2013, 25, 1682–1691. [Google Scholar] [CrossRef]
- Maghoolpilehrood, F.; Disfani, M.M.; Arulrajah, A. Geotechnical characteristics of aged biosolids stabilized with cement and lime. Aust. Geomech. J. 2013, 48, 113–120. [Google Scholar]
- Kadir, A.A.; Mohajerani, A. Bricks: An Excellent Building Material for Recycling Wastes—A Review. In Proceedings of the IASTED International Conference on Environmental Management and Engineering (EME 2011), Calgary, AB, Canada, 4–6 July 2011; pp. 108–115. [Google Scholar]
- Raut, S.P.; Ralegaonkar, R.V.; Mandavgane, S.A. Development of sustainable construction material using industrial and agricultural solid waste: A review of waste-create bricks. Constr. Build. Mater. 2011, 25, 4037–4042. [Google Scholar] [CrossRef]
- Muñoz Velasco, P.; Morales Ortíz, M.P.; Mendívil Giró, M.A.; Muñoz Velasco, L. Fired clay bricks manufactured by adding wastes as sustainable construction material—A review. Constr. Build. Mater. 2014, 63, 97–107. [Google Scholar] [CrossRef]
- Veiseh, S.; Yousefi, A.A. The use of polystyrene in lightweight brick production. Iran. Polym. J. 2003, 12, 323–329. [Google Scholar]
- Mohajerani, A.; Kadir, A.; Larobina, L. A practical proposal for solving the world’s cigarette butt problem: Recycling in fired clay bricks. Waste Manag. 2016, 52, 228–244. [Google Scholar] [CrossRef]
- Weyant, C.; Athalye, V.; Ragavan, S.; Rajarathnam, U.; Lalchandani, D.; Maithel, S.; Baum, E.; Bond, T.C. Emissions from South Asian Brick Production. Environ. Sci. Technol. 2014, 48, 6477–6483. [Google Scholar] [CrossRef]
- Australian Bureau of Statistics. Production of Selected Construction Materials. Belconnen, ACT 2616: Australian Bureau of Statistics. 2014. Available online: http://www.abs.gov.au/ausstats%5Cabs@.nsf/0/EE82154EA7605B0CCA256B5C007900AF?Opendocument (accessed on 27 January 2015).
- Liew, A.G.; Idris, A.; Wong, C.H.; Samad, A.A.; Noor, M.J.M.; Baki, A.M. Incorporation of sewage sludge in clay brick and its characterization. Waste Manag. Res. 2004, 22, 226–233. [Google Scholar] [CrossRef]
- Sutcu, M.; Akkurt, S. The use of recycled paper processing residues in making porous brick with reduced thermal conductivity. Ceram. Int. 2009, 35, 2625–2631. [Google Scholar] [CrossRef]
- Tay, J.H. Sludge as brick making material. In Proceedings of the New Directions and Research in Waste Treatment and Residual Management, Vancouver, BC, Canada, 23–28 June 1985; pp. 661–688. [Google Scholar]
- Tay, J. Bricks Manufactured from Sludge. J. Environ. Eng. 1987, 113, 278–284. [Google Scholar] [CrossRef]
- Wiebusch, B.; Seyfried, C.F. Utilization of sewage sludge ashes in the brick and tile industry. Water Sci. Technol. 1997, 36, 251–258. [Google Scholar] [CrossRef]
- Schirmer, T.; Mengel, K.; Wiebusch, B. Chemical and mineralogical investigations on clay bricks containing sewage sludge ash. Tile Brick Int. 1999, 15, 166–174. [Google Scholar]
- Liew, A.G.; Idris, A.; Samad, A.A.; Wong, C.H.K.; Jaafar, M.S.; Baki, A.M. Reusability of sewage sludge in clay bricks. J. Mater. Cycles Waste Manag. 2004, 6, 41–47. [Google Scholar] [CrossRef]
- Tay, J.; Show, K.; Hong, S. The application of industrial sludge and marine clay in brick-making. J. Chin. Inst. Environ. Eng. 2001, 11, 203–208. [Google Scholar]
- Kayali, O. High Performance Bricks from Fly Ash. In Proceedings of the World of Coal Ash Conference, Lexinton, Kentucky, 11 April 2005. [Google Scholar]
- Rahman, M.A. Properties of clay-sand-rice husk ash mixed bricks. Int. J. Cem. Compos. Lightweight Concr. 1987, 9, 105–108. [Google Scholar] [CrossRef]
- Malhotra, S.K.; Tehri, S.P. Development of bricks from granulated blast furnace slag. Constr. Build. Mater. 1996, 10, 191–193. [Google Scholar] [CrossRef]
- Demir, I. Effect of organic residues addition on the technological properties of clay bricks. Waste Manag. 2008, 28, 622–627. [Google Scholar] [CrossRef]
- Menezes, R.R.; Ferreira, H.S.; Neves, G.A.; Lira, H.D.L.; Ferreira, H.C. Use of granite sawing wastes in the production of ceramic bricks and tiles. J. Eur. Ceram. Soc. 2005, 25, 1149–1158. [Google Scholar] [CrossRef]
- Dondi, M.; Guarini, G.; Raimondo, M.; Zanelli, C. Recycling PC and TV waste glass in clay bricks and roof tiles. Waste Manag. 2009, 29, 1945–1951. [Google Scholar] [CrossRef]
- AS 4439.3. Wastes, Sediments and Contaminated Soils; Part 3: Preparation of Leachates-Bottle Leaching Procedure; Standards Australia International Ltd.: Sydney, Australia, 1997. [Google Scholar]
- AS 1289.0. Method of Testing Soils for Engineering Purposes; Part 0: General Requirements and List of Methods; Standards Australia International Ltd.: Sydney, Australia, 2000. [Google Scholar]
- AS 1289.3.4.1. Methods of Testing Soils for Engineering Purposes—Soil Classification Tests; Determination of the Linear Shrinkage of a Soil—Standard Method; Standards Australia International Ltd.: Sydney, Australia, 2008. [Google Scholar]
- BS 1377-3. Methods of Test for Soils for Civil Engineering Purposes; Chemical and Electro-Chemical Tests; British Standards Institution: London, UK, 1990. [Google Scholar]
- Prasetsan, S. Preliminary Study on Brick Making Industry in ASEAN Countries; Final Report; NRCT: Bangkok, Thailand, 1995. [Google Scholar]
- Spinosa, L.; Vesilind, P.A. Sludge into Biosolids. In Characterisation; Kopp, J., Dichtl, N., Eds.; IWA Publishing: London, UK, 2001; pp. 19–38. [Google Scholar]
- AS/NZS 4455.1. Masonry Units, Pavers, Flags and Segmental Retaining Wall Units; Part 1: Masonry Units; Standards Australia/Standards New Zealand: Sydney, Australia, 2008.
- AS/NZS 4456. Masonry Units, Segmental Pavers and Flags—Methods of Test; General Introduction and List of Methods; Standards Australia/Standards New Zealand: Sydney, Australia, 2003.
- AS/NZS 4456.6. Masonry Units, Segmental Pavers and Flags; Method 6: Determining Potential to Effloresce; Standards Australia/Standards New Zealand: Sydney, Australia, 2003.
- Dutré, V.; Vandecasteele, C. Solidification/stabilisation of hazardous arsenic containing waste from a copper refining process. J. Hazard. Mater. 1995, 40, 55–68. [Google Scholar] [CrossRef]
- Domínguez, E.A.; Ullman, R. ‘Ecological bricks’ made with clays and steel dust pollutants. Appl. Clay Sci. 1996, 11, 237–249. [Google Scholar] [CrossRef]
- Kadir, A.A.; Mohajerani, A. Recycling cigarette butts in lightweight fired clay bricks. Proc. Inst. Civ. Eng. Constr. Mater. 2011, 164, 219–229. [Google Scholar] [CrossRef]
- Quijorna, N.; Coz, A.; Andres, A.; Cheeseman, C. Recycling of Waelz slag and waste foundry sand in red clay bricks. Resour. Conserv. Recycl. 2012, 65, 1–10. [Google Scholar] [CrossRef]
- Zhou, J.; Li, T.; Zhang, Q.; Wang, Y.; Shu, Z. Direct-utilization of sewage sludge to prepare split tiles. Ceram. Int. 2013, 39, 9179–9186. [Google Scholar] [CrossRef]
- AS 1289.3.5.1. Methods of Testing Soils for Engineering Purposes; Determination of the Soil Particle Density of a Soil-Standard Method; Standards Australia International Ltd.: Sydney, Australia, 2006.
- Ukwatta Pitiye, A.; Mohajerani, A. Effect of Organic Content in Biosolids on the Properties of Fired-Clay Bricks Incorporated with Biosolids. J. Mater. Civ. Eng. 2017, 29, 1–11. [Google Scholar] [CrossRef]
- Mezencevova, A.; Yeboah, N.N.; Burns, S.E.; Kahn, L.F.; Kurtis, K.E. Utilization of Savannah Harbor river sediment as the primary raw material in production of fired brick. J. Environ. Manag. 2012, 113, 128–136. [Google Scholar] [CrossRef] [PubMed]
- Shih, P.-H.; Wu, Z.-Z.; Chiang, H.-L. Characteristics of bricks made from waste steel slag. Waste Manag. 2004, 24, 1043–1047. [Google Scholar] [CrossRef] [PubMed]
- Hendry, A.W.; Sinha, B.P.; Davies, S.R. Design of Masonry Structures; Taylor Francis: London, UK, 2004. [Google Scholar]
- Andrés, A.; Díaz, M.C.; Coz, A.; Abellán, M.J.; Viguri, J.R. Physico-chemical characterisation of bricks all through the manufacture process in relation to efflorescence salts. J. Eur. Ceram. Soc. 2009, 29, 1869–1877. [Google Scholar] [CrossRef]
- ASTM C62. Standard Specification for Building Brick (Solid Masonry Units Made from Clay or Shale); ASTM International: West Conshohocken, PA, USA, 2013. [Google Scholar]
- Ukwatta Pitiye, A.; Mohajerani, A. Characterisation of fired-clay bricks incorporating biosolids and the effect of heating rate on properties of bricks. Constr. Build. Mater. 2017, 142, 11–22. [Google Scholar] [CrossRef]
- USEPA. National Primary Drinking Water Regulations. United States Environmental Protection Agency, 2017. Available online: https://www.epa.gov/ground-water-and-drinking-water/national-primary-drinking-water-regulations#one (accessed on 17 July 2017).
- Australian Government. Australian Drinking Water Guidelines. National Health and Medical Research Council, 2011. Available online: https://www.nhmrc.gov.au/_files_nhmrc/file/publications/nhmrc_adwg_6_version_3.3_2.pdf (accessed on 17 July 2017).
- Industrial Waste Resource Guidelines (IWRG 631). Solid Industrial Waste Hazard Categorization and Management; Environment Protection Authority: Carlton, Australia, 2009.
- Code of Federal Regulations 261.24—Toxicity Characteristics; US Government Printing Office: Washington, DC, USA, 2012.
- Mohajerani, A.; Vajna, J.; Ellcock, R. Chromated copper arsenate timber: A review of products, leachate studies and recycling. J. Clean. Prod. 2018, 179, 292–307. [Google Scholar] [CrossRef]
- Garrabrants, A.C.; Kosson, D.S.; Delapp, R.; Van der Sloot, H.A. Effect of coal combustion fly ash use in concrete on the mass transport release of constituents of potential concern. Chemosphere 2014, 103, 131–139. [Google Scholar] [CrossRef]
- Kosson, D.S.; Garrabrants, A.C.; Delapp, R.; Van der Sloot, H.A. pH-dependent leaching of constituents of potential concern from concrete materials containing coal combustion fly ash. Chemosphere 2014, 103, 140–147. [Google Scholar] [CrossRef] [PubMed]
- USEPA. Method 1315—Mass Transfer Rates of Constituents in Monolithic or Compacted Granular Materials Using a Semi-Dynamic Tank Leaching Procedure; U.S. Environmental Protection Agency: Washington, DC, USA, 2013.
- Kosson, D.S.; Van der Sloot, H.A.; Sanchez, F.; Garrabrants, A.C. An Integrated Framework for Evaluating Leaching in Waste Management and Utilization of Secondary Materials. Environ. Eng. Sci. 2002, 19, 159–204. [Google Scholar] [CrossRef]
- USEPA. Method 1314—Liquid-Solid Partitioning as a Function of Liquid-Solid Ratio for Constituents in Solid Materials Using an Up-Flow Percolation Column Procedure; U.S. Environmental Protection Agency: Washington, DC, USA, 2013.
- Ukwatta, A.; Mohajerani, A.; Eshtiaghi, N.; Setunge, S. Variation in physical and mechanical properties of fired-clay bricks incorporating ETP biosolids. J. Clean. Prod. 2016, 119, 76–85. [Google Scholar] [CrossRef]
- Ukwatta Pitiye, A.; Mohajerani, A.; Setunge, S.; Eshtiaghi, N. A study of gas emissions during the firing process from bricks incorporating biosolids. J. Waste Manag. 2018, 74, 413–426. [Google Scholar] [CrossRef] [PubMed]
- Ukwatta, A.; Mohajerani, A. Leachate analysis of green and fired-clay bricks incorporated with biosolids. J. Waste Manag. 2017, 66, 134–144. [Google Scholar] [CrossRef] [PubMed]
- Abdul Kadir, A.; Mohajerani, A. Physico-mechanical properties and leahate analysis and thermal performance of clay fired bricks incorporated with cigarette butts. In Environmental Management and Technologies Towards Sustainable Development; Ahmad, A.L., Lee, K.T., Eds.; Universiti Sans Malaysia: Penang, Malaysia, 2008; pp. 1–9. [Google Scholar]
Figure 1.
Western Treatment Plant Stockpile.
Figure 1.
Western Treatment Plant Stockpile.
Figure 2.
The storage conditions of the biosolids and close-up views of each sample.
Figure 2.
The storage conditions of the biosolids and close-up views of each sample.
Figure 3.
The gyratory machine used in this study.
Figure 3.
The gyratory machine used in this study.
Figure 4.
XRF patterns of (a) Brick soil; (b) ETP 22; (c) WTP 10 and (d) WTP 17–29.
Figure 4.
XRF patterns of (a) Brick soil; (b) ETP 22; (c) WTP 10 and (d) WTP 17–29.
Figure 5.
Particle size distribution curves of brick soil and biosolids samples.
Figure 5.
Particle size distribution curves of brick soil and biosolids samples.
Figure 6.
Compaction curves for the brick soil and 25% clay–biosolids mixtures.
Figure 6.
Compaction curves for the brick soil and 25% clay–biosolids mixtures.
Figure 7.
Samples of manufactured ETP 22, WTP 10 and WTP 17–29 brick samples.
Figure 7.
Samples of manufactured ETP 22, WTP 10 and WTP 17–29 brick samples.
Figure 8.
Variation of compressive strength of bricks with organic content in the raw mixture.
Figure 8.
Variation of compressive strength of bricks with organic content in the raw mixture.
Figure 9.
Variation of density of bricks with organic content in the raw mixture.
Figure 9.
Variation of density of bricks with organic content in the raw mixture.
Figure 10.
Efflorescence on (a) Control brick; (b) ETP amended brick; (c) WTP amended brick; (d) WTP 17–29 amended brick.
Figure 10.
Efflorescence on (a) Control brick; (b) ETP amended brick; (c) WTP amended brick; (d) WTP 17–29 amended brick.
Figure 11.
SEM images of (a) Control brick; (b) 25% amended ETP 22 brick; (c) 25% amended WTP 10 brick and (d) 25% amended WTP 17–29 brick.
Figure 11.
SEM images of (a) Control brick; (b) 25% amended ETP 22 brick; (c) 25% amended WTP 10 brick and (d) 25% amended WTP 17–29 brick.
Figure 12.
Percentage of energy saved during firing of clay–biosolids bricks.
Figure 12.
Percentage of energy saved during firing of clay–biosolids bricks.
Table 1.
Chemical composition of the brick soil and biosolids samples used in the study (wt.%).
Table 1.
Chemical composition of the brick soil and biosolids samples used in the study (wt.%).
| Oxide Content | Brick Soil | ETP 22 | WTP 10 | WTP 17–29 |
|---|
| SiO2 | 64.75 | 59.43 | 46.91 | 41.17 |
| Al2O3 | 19.20 | 17.60 | 15.90 | 13.2 |
| Fe2O3 | 6.60 | 9.58 | 8.60 | 7.018 |
| K2O | 4.96 | 0.91 | 2.82 | 1.71 |
| MgO | 1.73 | 1.59 | 1.35 | 1.28 |
| TiO2 | 1.14 | 2.18 | 2.15 | 2.07 |
| P2O5 | 1.04 | 3.66 | 4.75 | 6.11 |
| CaO | 0.25 | 2.45 | 7.70 | 10.31 |
| SO3 | - | - | - | 12.92 |
Table 2.
Geotechnical properties of biosolids samples and brick soil.
Table 2.
Geotechnical properties of biosolids samples and brick soil.
| Properties | Brick Soil | ETP 22 | WTP 10 | WTP 17–29 |
|---|
| Liquid limit (%) | 32 | 53 | 54 | 70 |
| Plastic Limit (%) | 19 | 27 | 41 | 62 |
| Plasticity Index (%) | 13 | 26 | 13 | 8 |
| Gravel (>2.36 mm) (%) | 1.2 | 0.4 | 13.4 | 12.94 |
| Sand (0.075–2.36 mm) (%) | 74.6 | 87.5 | 76.0 | 72.37 |
| Silt (0.002–0.075 mm) (%) | 22.32 | 11.6 | 9.6 | 12.3 |
| Clay (<0.002 mm) (%) | 1.88 | 0.5 | 1.0 | 3.0 |
| Coefficient of uniformity (Cu) | 50.00 | 8.00 | 18.6 | 40 |
| Coefficient of curvature (Cc) | 4.17 | 2.00 | 1.8 | 3.6 |
| Unified soil classification | SC | SC | SW-SM | SC |
| Specific gravity | 2.69 | 2.51 | 2.14 | 2.03 |
| Linear shrinkage (%) | 6.6 | 14.2 | 10 | 6.7 |
| Organic content (%) | 1.23 | 7.1 | 23.31 | 27.79 |
Table 3.
Shrinkage of control and biosolids-amended bricks.
Table 3.
Shrinkage of control and biosolids-amended bricks.
| Type of Shrinkage | Type of Brick | Diametric (%) | Height (%) |
|---|
| Initial drying shrinkage | Control | 1.26 | 0.92 |
| ETP 22 | 2.28 | 2.15 |
| WTP 10 | 4.48 | 3.24 |
| WTP 17–29 | 2.37 | 2.6 |
| Firing shrinkage | Control | 3.24 | 3.54 |
| ETP 22 | 1.78 | 1.7 |
| WTP 10 | 5.23 | 4.47 |
| WTP 17–29 | 3.0 | 3.2 |
| Total shrinkage | Control | 5 | 4.46 |
| ETP 22 | 4.06 | 3.85 |
| WTP 10 | 9.71 | 7.71 |
| WTP 17–29 | 5.4 | 5.7 |
Table 4.
Physical and mechanical properties of control and 25% biosolids-amended bricks.
Table 4.
Physical and mechanical properties of control and 25% biosolids-amended bricks.
| Property | Unit | Control Bricks | ETP 22 Bricks | WTP 10 Bricks | WTP 17–29 Bricks |
|---|
| Compressive Strength of brick (25% biosolids) | MPa | 41.9 | 27.9 | 14.3 | 12.04 |
| Bulk Density | kg/m3 | 2122 | 2030 | 1876 | 1866 |
| IRA | kg/m2/min | 1.83 | 2.74 | 3.41 | 2.64 |
| Weight loss on Ignition (LOI) | % | 4.7 | 5.5 | 11.3 | 11.0 |
| Thermal Conductivity | W/m/K | 1.09 | 0.96 | 0.77 | 0.75 |
| Average organic content | % | 1.23 | 2.70 | 6.75 | 7.87 |
Table 5.
Comparison of compressive strength of control bricks and bricks incorporating varying percentages of biosolids.
Table 5.
Comparison of compressive strength of control bricks and bricks incorporating varying percentages of biosolids.
| Compressive Strength for Different Parentage of Biosolids | Unit | Control Bricks | ETP 22 Bricks | WTP 10 Bricks | WTP 17-29 * Bricks |
|---|
| Compressive Strength (25% biosolids) | MPa | 41.9 | 27.9 | 14.3 | 12.04 |
| Compressive Strength (20% biosolids) | MPa | 41.9 | 30.6 | 16.5 | 15.4 |
| Compressive Strength (15% biosolids) | MPa | 41.9 | 32.0 | 19.1 | 16.9 |
| Compressive Strength (10% biosolids) | MPa | 41.9 | 35.5 | 23.7 | 21.5 |
Table 6.
Water absorption properties of manufactured 25% biosolids-amended bricks.
Table 6.
Water absorption properties of manufactured 25% biosolids-amended bricks.
| Brick Type | Cold Water Absorption % (Ac) | Boiling Water Absorption % (Ab) | Saturation Coefficient (SC) | ASTM Grade |
|---|
| Control Bricks | 7.5 | 8.5 | 0.88 | SW |
| ETP 22 | 9.8 | 11.0 | 0.89 | SW |
| WTP 10 | 9.4 | 11.5 | 0.82 | SW |
| WTP 17–29 | 13 | 14.3 | 0.91 | SW |
Table 7.
Leachate test results for fired–clay bricks with 25% biosolids.
Table 7.
Leachate test results for fired–clay bricks with 25% biosolids.
| Heavy Metal | Concentration Limit (mg/L) * | Concentration Limit (mg/L) ** | Detected Concentrations (mg/L) |
|---|
| Control Brick | ETP 22 Brick | WTP 10 Brick | WTP 17–29 Brick |
|---|
| Sb | 0.006 | N/A | <0.01 | <0.01 | <0.01 | <0.01 |
| As | 0.01 | 0.01 | <0.01 | 0.01 | 0.1 | 0.21 |
| Ba | 2 | 2 | 0.22 | 0.23 | 0.14 | 0.15 |
| Be | 0.004 | 0.06 | <0.01 | <0.01 | <0.01 | <0.01 |
| Cd | 0.005 | 0.002 | <0.002 | <0.002 | <0.002 | 0.002 |
| Cr | 0.1 | 0.05 | <0.01 | <0.01 | <0.01 | 0.01 |
| Cu | 1.3 | 2 | 0.11 | 0.04 | 0.05 | 0.31 |
| Pb | 0.015 | 0.01 | <0.01 | <0.01 | <0.01 | 0.01 |
| Mo | N/A | 0.05 | <0.01 | <0.01 | 0.04 | 0.06 |
| Ni | N/A | 0.02 | <0.01 | <0.01 | 0.01 | <0.01 |
| Se | 0.05 | 0.01 | <0.01 | <0.01 | <0.01 | <0.01 |
| Ag | N/A | 0.1 | <0.01 | <0.01 | <0.01 | <0.01 |
| Zn | N/A | N/A | 0.09 | 0.02 | 0.14 | 0.12 |
Table 8.
Leachate test results for the brick soil and biosolids.
Table 8.
Leachate test results for the brick soil and biosolids.
| Heavy Metal | Concentration Limit (mg/L) * | Detected Concentrations (mg/L) |
|---|
| Brick Soil | ETP 22 | WTP 10 | WTP 17–29 |
|---|
| Sb | 8 | <0.01 | 0.01 | 0.06 | 0.06 |
| As | 2.8 | <0.01 | 0.02 | 0.02 | 0.06 |
| Ba | 280 | 0.18 | 0.03 | 0.12 | 0.05 |
| Be | 4 | <0.01 | <0.01 | <0.01 | <0.01 |
| Cd | 0.8 | <0.002 | 0.009 | 0.013 | 0.17 |
| Cr | 20 | <0.01 | <0.01 | 0.01 | 0.10 |
| Cu | 800 | <0.01 | 0.18 | 0.33 | 1.6 |
| Pb | 4 | 0.01 | <0.01 | <0.01 | 0.04 |
| Mo | 20 | <0.01 | <0.01 | 0.13 | 0.05 |
| Ni | 8 | <0.01 | 0.14 | 0.21 | 0.78 |
| Se | 4 | <0.01 | <0.01 | 0.01 | 0.02 |
| Ag | 40 | <0.01 | <0.01 | <0.01 | <0.01 |
| Zn | 1200 | 0.03 | 1.4 | 3.1 | 18 |
Table 9.
Sample computations for determining the percentage of energy saved during the firing of bricks containing 25% biosolids.
Table 9.
Sample computations for determining the percentage of energy saved during the firing of bricks containing 25% biosolids.
| Biosolids Sample | Average Organic Content in Raw Mixture (%) | m1 (kg) | m2 (kg) | m3 (kg) | Q1 (MJ kg−1) | Q2 (MJ kg−1) | ΔE * (%) |
|---|
| ETP 22 | 1.78 | 3.3 | 3.241 | 0.059 | 6.6 | 5.78 | 12.4% |
| WTP 10 | 5.83 | 3.3 | 3.108 | 0.192 | 6.6 | 3.908 | 40.1% |
| WTP 17-29 | 6.95 | 3.3 | 3.071 | 0.229 | 6.6 | 3.390 | 48.6% |
Table 10.
Approximate percentage of energy saved during firing of clay–biosolids bricks.
Table 10.
Approximate percentage of energy saved during firing of clay–biosolids bricks.
| Biosolids (%) | Energy Saved (%) |
|---|
| ETP 22 | WTP 10 | WTP 17–29 |
|---|
| 5 | 2.5 | 8.2 | 9.7 |
| 10 | 5.0 | 16.3 | 19.5 |
| 15 | 7.5 | 24.5 | 29.2 |
| 20 | 9.9 | 32.6 | 38.9 |
| 25 | 12.4 | 40.8 | 48.6 |
| 30 | 14.9 | 49.0 | 58.4 |
| 35 | 17.4 | 57.1 | 68.1 |
| 40 | 19.9 | 65.3 | 77.8 |
| 45 | 22.4 | 73.4 | 87.5 |
| 50 | 24.9 | 81.6 | 97.3 |
Table 11.
Estimated properties and energy savings of 15% biosolids content bricks from this study.
Table 11.
Estimated properties and energy savings of 15% biosolids content bricks from this study.
| Biosolids | Compressive Strength (MPa) | Energy Savings (%) | Organic Content of Biosolids (%) | Average Organic Content of Raw Mixture (%) | Bulk Density of Bricks kg/m3 |
|---|
| Control | 41.9 | 0.0 | 0.00 | 1.23 | 2122 |
| ETP 22 | 32.0 | 7.5 | 7.10 | 2.11 | 2058 |
| WTP 10 | 19.1 | 24.5 | 23.31 | 4.54 | 1943 |
| WTP 17–29 | 16.9 | 29.2 | 27.79 | 5.21 | 1922 |
© 2019 by the authors. Licensee MDPI, Basel, Switzerland. This article is an open access article distributed under the terms and conditions of the Creative Commons Attribution (CC BY) license (http://creativecommons.org/licenses/by/4.0/).

 ,
, 


