1. Introduction
The transit-oriented development (TOD) model enables the optimization of rail transit vehicle depot construction and related land resources. Guided by the TOD concept, the commercial facilities in depot overbuilds evolve from early-stage community service-oriented commerce to multi-level commercial developments integrated with the urban context through close linkage with public transit. In recent years, overbuild projects above vehicle depots have become a typical model in urban rail development, playing an important role in promoting regional coordinated development and recouping investments in metro construction [
1,
2,
3,
4]. However, the construction and operation of the metro bring a series of challenges: during train operation, the interaction between wheels and rails generates vibrations that propagate as vibrational waves to the overlying and surrounding buildings, causing structural vibrations and inducing secondary structure-borne noise, which seriously affects people’s daily life and work quality [
5,
6,
7], and in severe cases, may pose risks to human health. At the same time, TOD projects are often located at major public transportation nodes, where high traffic volumes generate complex noise, further exacerbating the deterioration of the regional acoustic environment [
8,
9,
10].
The impact of vibration and noise on civil engineering structures and their service performance has become a common research topic in the fields of civil and environmental engineering, with implications spanning virtually all building types and the entire engineering lifecycle [
11]. Multi-source dynamic excitations, including road traffic loads, rail transit operation, industrial equipment operation, and civil engineering construction activities, can all induce dynamic responses of the site and building structures, as well as secondary noise radiation. For civil buildings such as residential, commercial, and office buildings, the primary concern lies in their influence on indoor environmental comfort and user experience [
12,
13]. For special buildings such as high-precision research facilities, laboratories for precision instruments, and semiconductor manufacturing workshops, however, the sensitivity to ground microvibration and environmental noise is extremely high. Even nanometer-scale vibration displacement may lead to a decline in equipment accuracy, distortion of experimental data, or even system failure [
14]. Relevant engineering practice has already carried out source intensity measurements and long-term monitoring of ground-motion conditions during construction for the High-Luminosity Large Hadron Collider upgrade project, thereby establishing quantitative criteria for microvibration control. Owing to the significant differences in spectral characteristics, propagation patterns, and action intensities among different vibration sources, the vibration and noise effects under multi-source coupling are considerably more complex and may produce differentiated impacts on buildings with different structural forms and functional purposes [
15].
Scholars both domestically and internationally have conducted extensive research on vibrations and secondary noise induced by metro operation. In terms of the mechanism of vibration propagation, studies have shown that irregularities among train wheels, rails, and track structures increase vibration intensity during operation, and the vehicle-induced vibration source exhibits characteristics of mobility and intermittency [
16,
17]. The impact of vehicle-induced vibration on adjacent buildings is related to factors such as building height and structural system, and the vertical vibration response is significantly greater than the horizontal vibration response. In terms of prediction methods, some scholars have employed two-dimensional finite element methods to predict ground vibrations generated by underground train operation, finding that when the distance from the tunnel exceeds 50 m, the vibration reduction form of the track has little influence on ground vibration; other scholars have adopted three-dimensional finite element methods to investigate the vibration effects caused by overlapping stations and train operations [
18,
19]. In recent years, the FE–SEA hybrid method has been applied to the broadband vibration and noise analysis of overbuild structures. Studies have shown that the dominant vibration frequencies of floor slabs in overbuild structures are mainly located in the low-frequency range of 31.5–50 Hz, and the sound pressure of secondary structure-borne noise in typical rooms is primarily concentrated within the 20–80 Hz range. In the field of acoustic environment research, scholars both domestically and internationally have systematically analyzed the spatiotemporal distribution, statistical characteristics, and influencing factors of road traffic noise, revealing that vehicle speed, traffic volume, and vehicle type proportion are the primary factors affecting road traffic noise. Environmental noise tests of metro viaduct lines have also shown that strong structural noise is mainly concentrated in the mid-span region of bridges [
20,
21,
22]. In response to problems induced by metro operation, scholars both domestically and internationally have conducted related studies from the perspective of vibration and noise reduction. The floating slab track bed has been shown to provide significant vibration mitigation effects; the effectiveness of vibration isolation measures such as isolation trenches, infilled trenches, and wave barriers has been comparatively analyzed; structural vibration isolation measures, including spring isolation bearings and tuned mass dampers (TMDs), have been demonstrated to achieve good vibration reduction performance; and the height and distance of noise barriers, as well as the installation of sound-absorbing materials, have been found to significantly influence the effectiveness of noise reduction [
23,
24].
Although the aforementioned studies have been conducted, systematic and comprehensive investigations on the vibration characteristics of metro overbuild building clusters, the propagation mechanisms of secondary noise, and the spatial distribution characteristics of the acoustic environment under the TOD model remain relatively limited. In particular, studies that simultaneously consider structure-borne vibrations induced by metro operation and the regional acoustic environment dominated by road traffic, while proposing integrated mitigation measures, are still scarce.
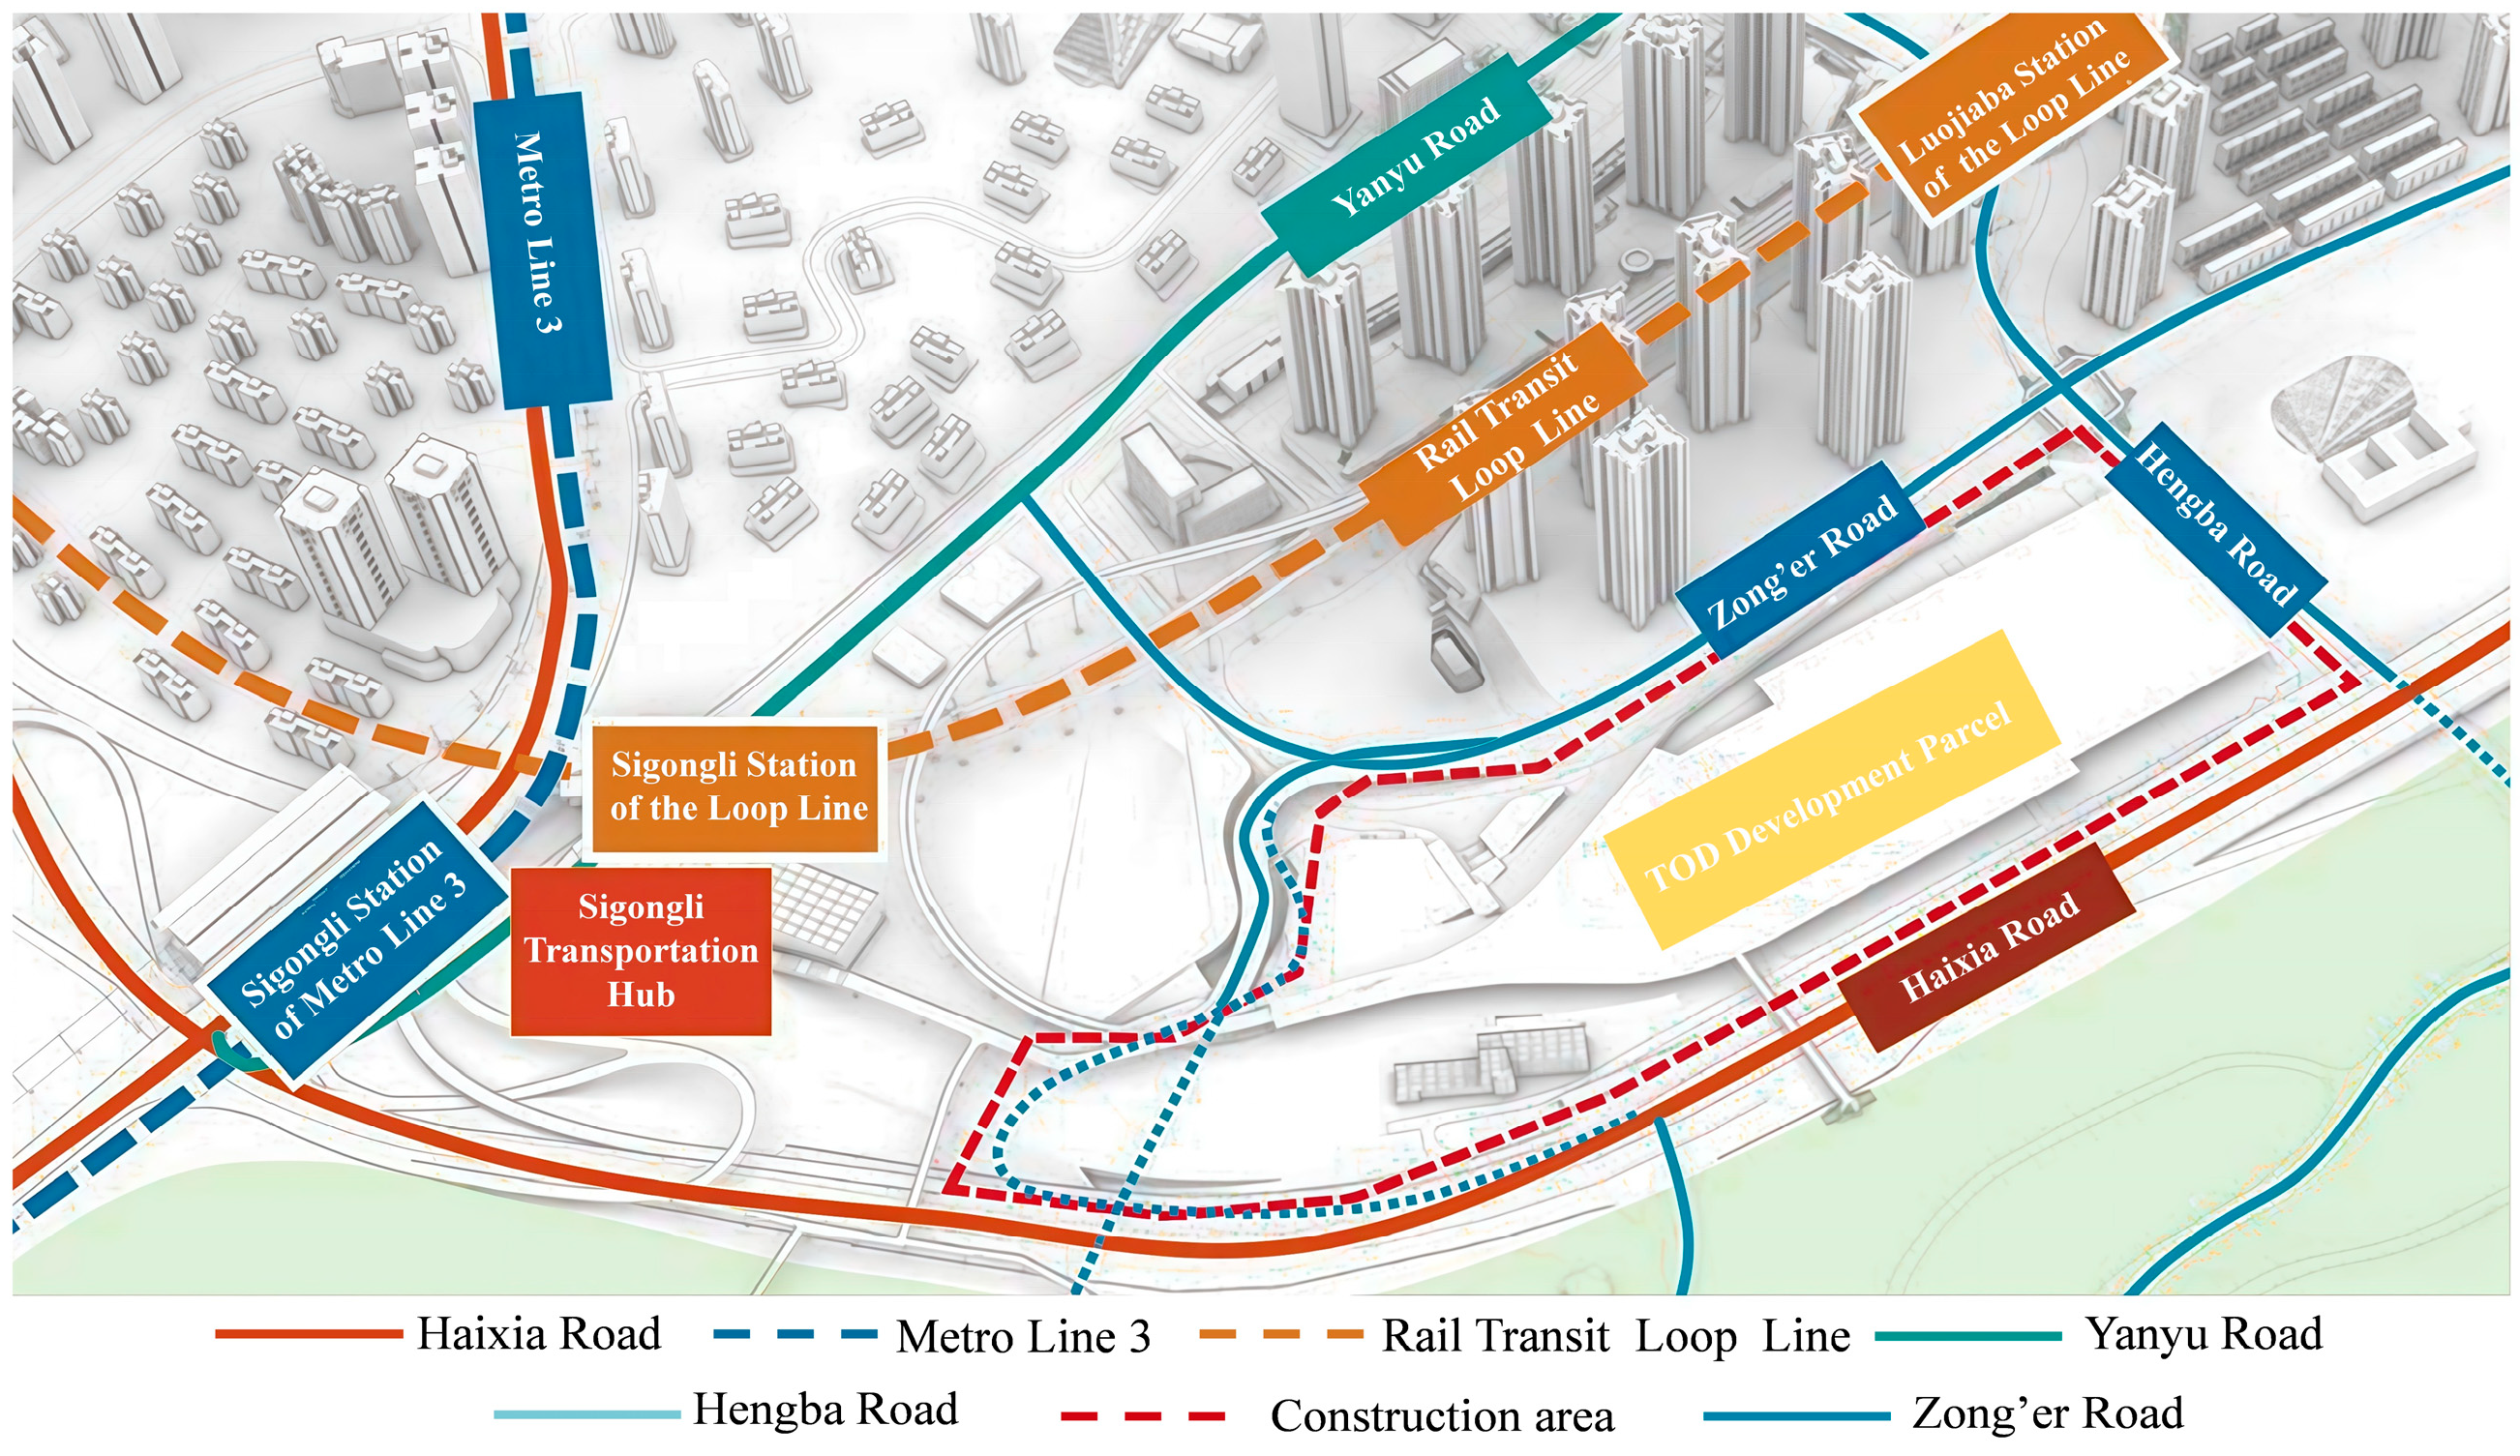
To address this issue, the present study takes a TOD project in Chongqing as the engineering background and adopts a combined approach of field measurements and numerical simulation. A coupled analytical framework integrating a three-dimensional finite element model of the train–track–tunnel–soil–building system with a regional acoustic model is established, thereby enabling the synchronous simulation and combined assessment of metro-induced structural vibration, structure-borne secondary noise, and road traffic noise. On this basis, the vibration response characteristics and secondary noise propagation patterns of building clusters in different functional zones, including residential, office, rental housing, and reserved areas, are systematically analyzed, and the combined influence mechanism of road traffic and rail transit on the regional acoustic environment is further investigated. In addition, an integrated mitigation strategy is proposed, covering track vibration reduction, building vibration isolation, propagation path interruption, and receiver protection, and its effectiveness in controlling vibration and noise is verified through numerical simulation. The findings of this study are expected to provide a useful reference for the integrated control of vibration and acoustic environments in similar TOD projects.
3. Characteristics of Environmental Vibration and Propagation Patterns of Secondary Noise
3.1. Establishment of the Vibration Characteristics Model
In this project, the general-purpose finite element software ABAQUS 2021 was adopted to establish a finite element (FE) model of the coupled soil–track–building system. The model was built at a 1:1 scale according to the design drawings and actual site conditions, incorporating detailed representations of the structural layers of the Chongqing Rail Transit Loop Line parking yard, the overlying buildings, and the track, thereby enabling simulation of the vibration response of different buildings as trains pass at varying speeds. The soil strata were divided into three layers based on geotechnical survey results, with parameters adopted from
Table 1. The train model consisted of a 6-car As-type train operating at 15 km/h in the throat area and 5 km/h in the depot area, with detailed parameters listed in
Table 2. The track is a conventional ballasted track, with parameters provided in
Table 3. To more effectively excite soil vibrations, track irregularities were modeled by superimposing the U.S. five-level spectrum and Sato short-wave irregularities [
26]. Additionally, to eliminate the influence of boundary-reflected waves, the model simulates the semi-infinite soil domain beyond the FE model by extending a layer of identical elements along the normals at the established boundaries, representing the surrounding semi-infinite soil outside the modeled region [
27].
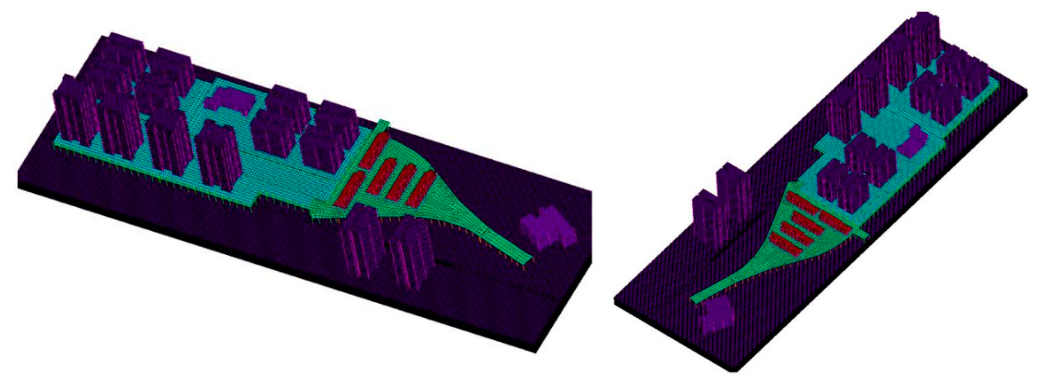
Based on the above description, the model contains a total of 6.125 × 10
6 elements and 6.234 × 10
6 nodes, with an element length of 0.5 m and a time integration step of 2 ms. The finite element simulation model is shown in
Figure 3.
3.2. Model Validation Based on Field Measurements
3.2.1. Field Measurement System and Parameter Settings
To ensure the accuracy and reliability of the test data, a 941B ultra-low-frequency vibration sensor (Institute of Engineering Mechanics, China Earthquake Administration, Beijing, China) was employed in this study for vibration acceleration measurements. This sensor is a piezoelectric seismic sensor. Compared with conventional geophones, which typically have a frequency response range of 1–100 Hz and exhibit a pronounced reduction in sensitivity in the high-frequency range, the adopted sensor provides a frequency response range of 0.25–1000 Hz, thereby fully covering the vibration frequency band of building structures induced by metro operation. The sensor sensitivity is 300 mV/(m·s−2), and the measurement range is ±20 m/s2, which satisfies the requirements of low-amplitude and broadband vibration testing for this project. Data acquisition was carried out using an INV3060S 24-bit multi-channel synchronous data acquisition system. The sampling frequency was set to 1024 Hz, and the sampling duration for a single train pass was 30 s. Effective data were collected using a level-triggered acquisition mode, with the trigger threshold set at 0.005 m/s2, so as to avoid interference from environmental background noise.
In this study, the upper limit of the analysis frequency band for vibration signals was set to 125 Hz, mainly for the following reasons:
- (1)
A large number of studies, both domestic and international, have shown that more than 95% of the vibration energy of building structures induced by metro train operation is concentrated in the low-frequency range of 10–125 Hz, with the dominant frequencies mainly distributed within 31.5–63 Hz. The proportion of vibration energy above 125 Hz is generally less than 5%, and its influence on building structures and human comfort can therefore be regarded as negligible.
- (2)
According to the evaluation standards applicable to this study, namely the Standard for Limits and Measurement Methods of Building Vibration and Structure-Borne Secondary Noise Induced by Urban Rail Transit (JGJ/T 170-2009) and the Standard for Urban Regional Environmental Vibration (GB 10070-1988) [
28], the specified vibration evaluation frequency band is 1–80 Hz.
- (3)
The VC curve method is mainly used for evaluating special buildings that are highly sensitive to microvibration, such as precision instrument facilities and semiconductor manufacturing workshops, and its evaluation upper limit is 80 Hz. In contrast, the present study focuses on the assessment of occupant comfort in civil buildings such as residential, office, and rental buildings. In order to comprehensively capture potentially existing high-frequency vibration components and avoid overlooking possible exceedance frequency bands, the upper limit of the analysis frequency band was moderately extended to 125 Hz.
3.2.2. Layout of Monitoring Points and Model Validation
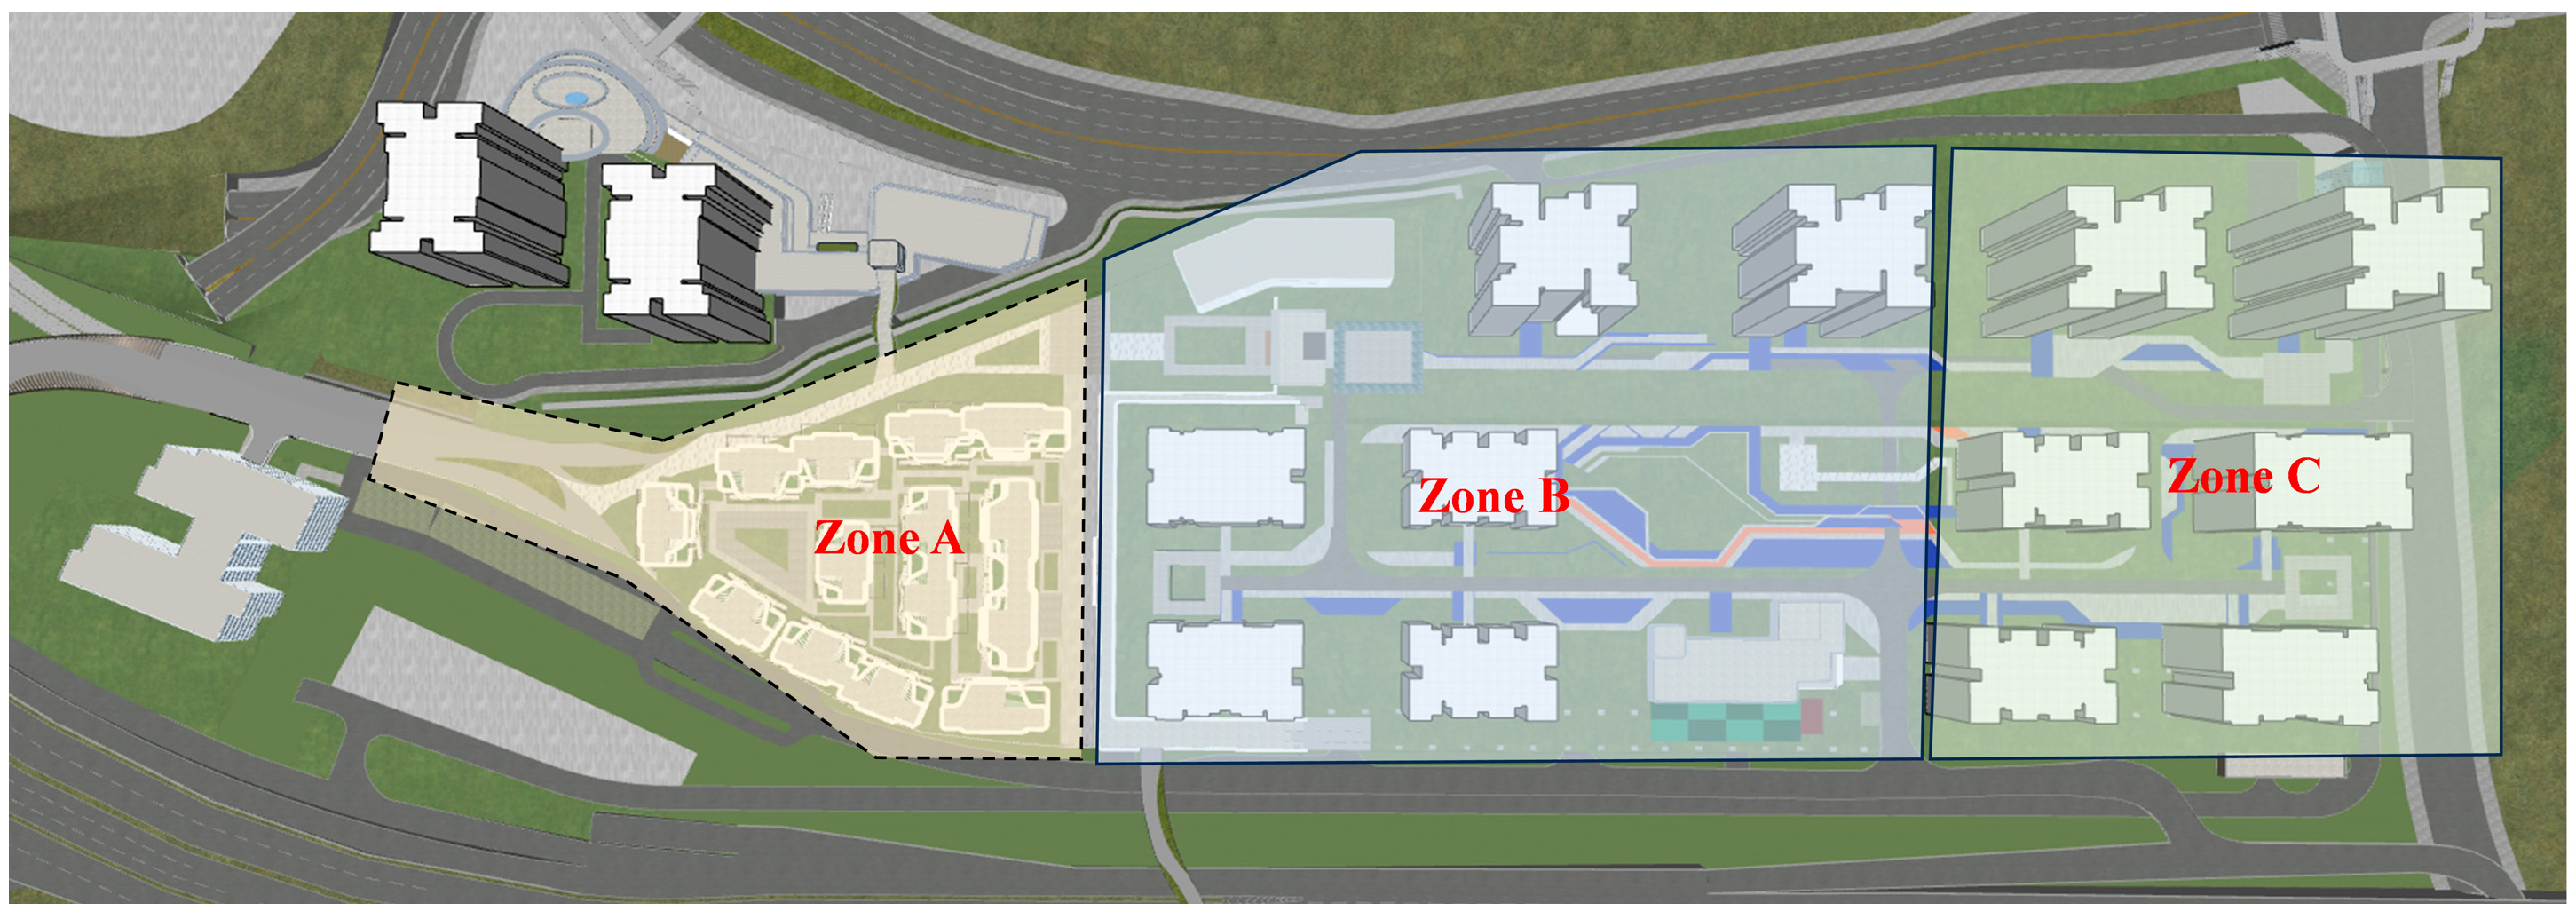
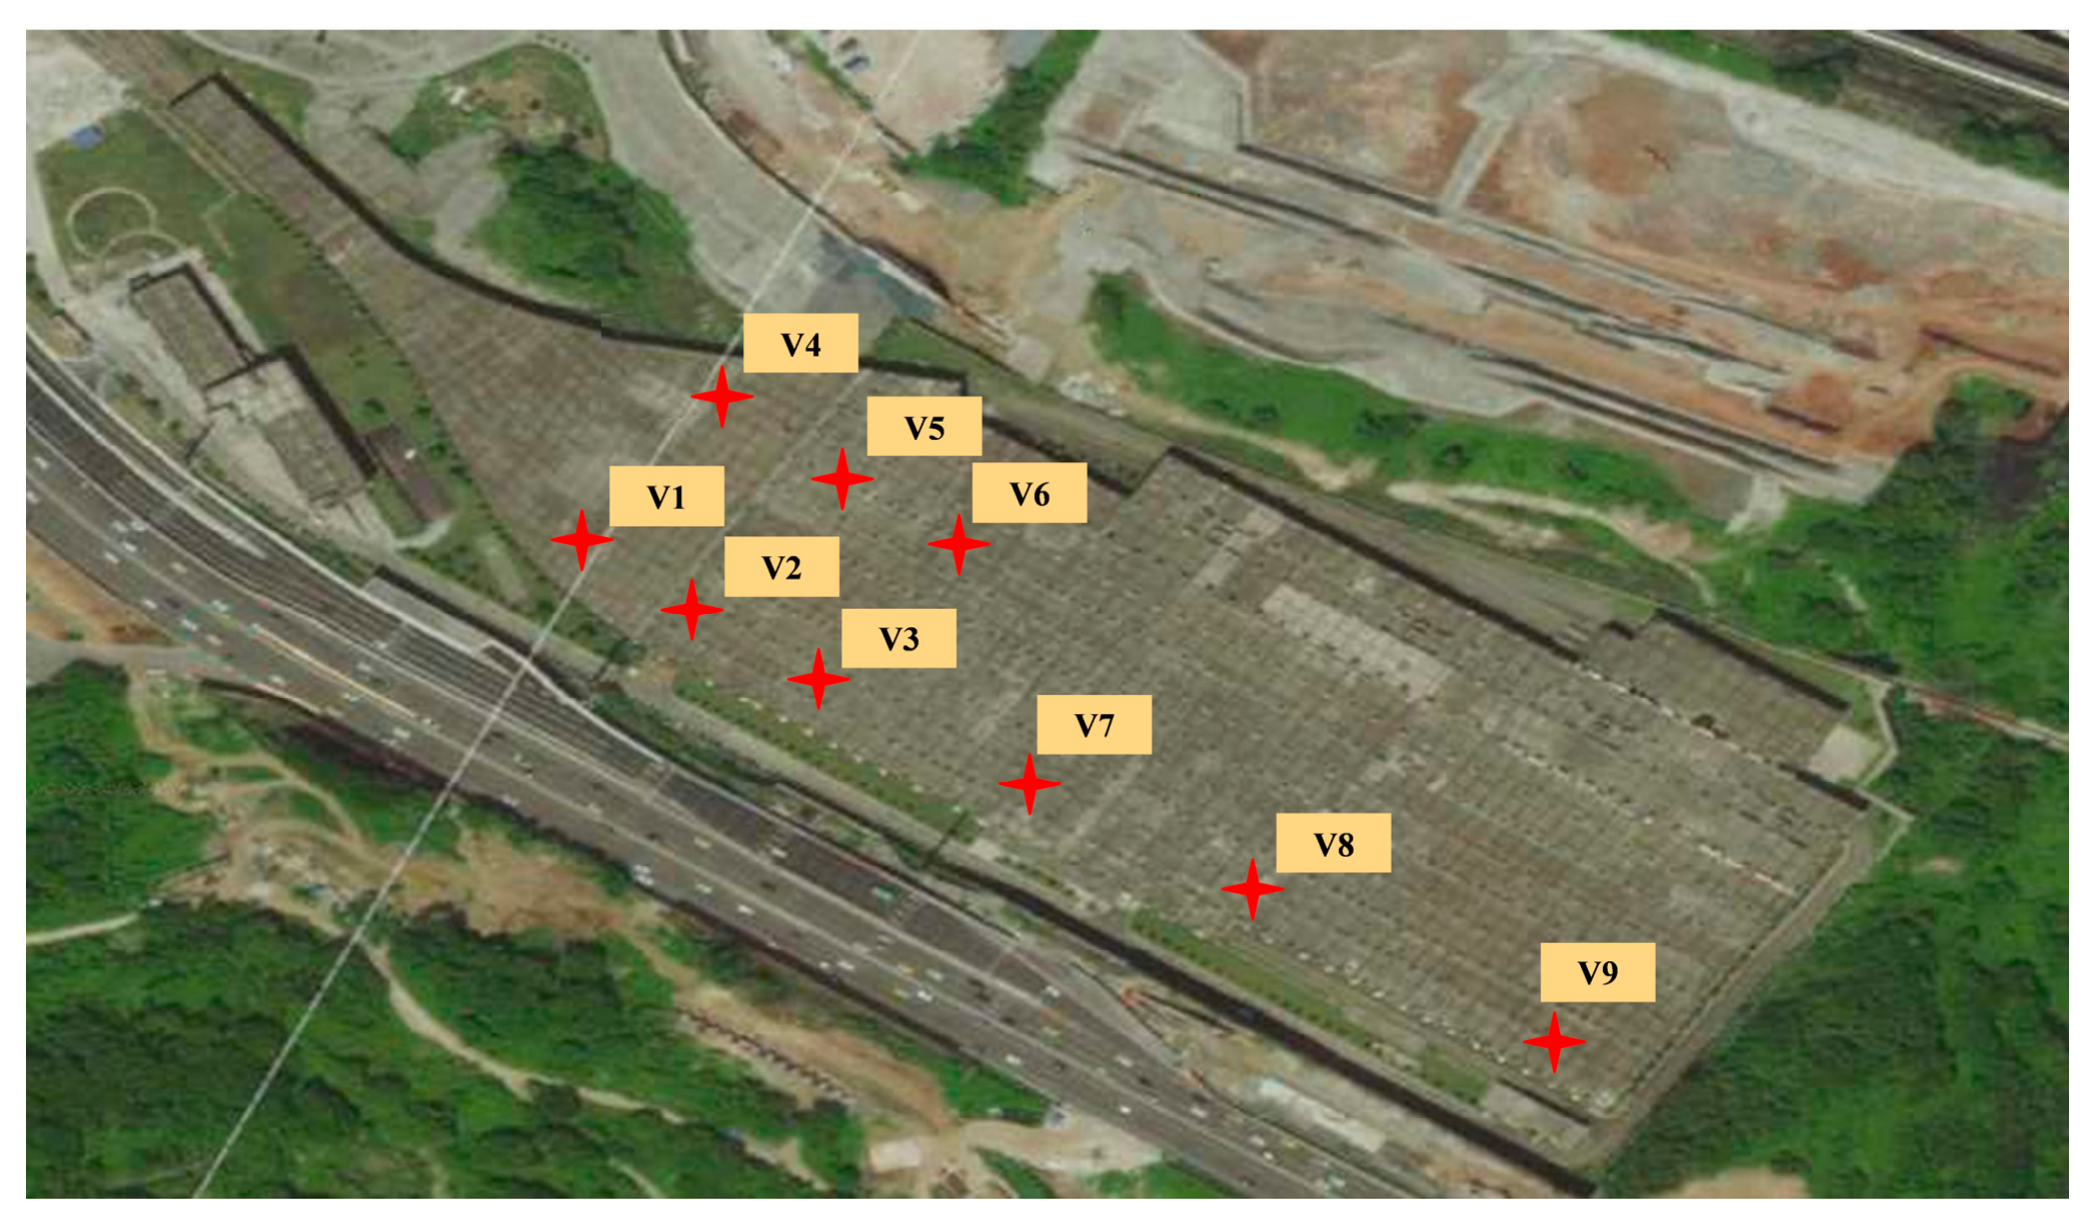
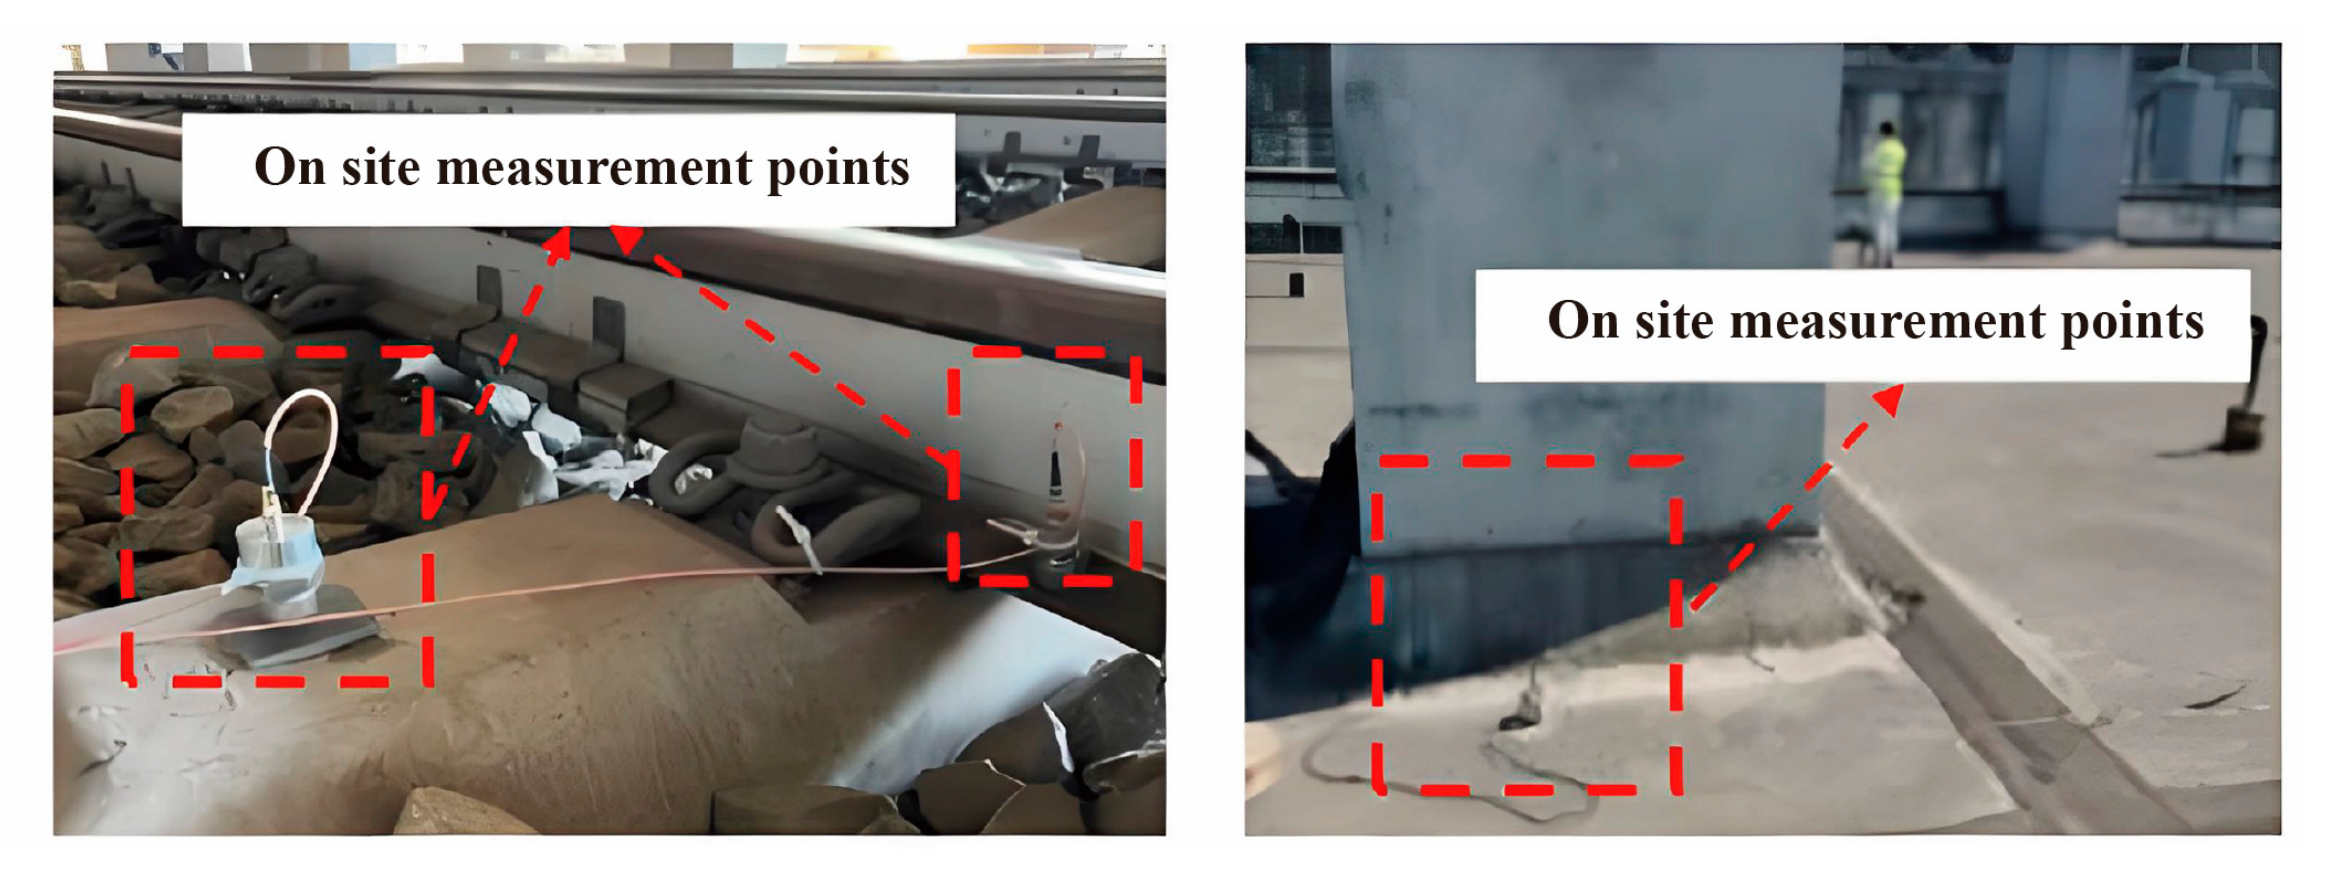
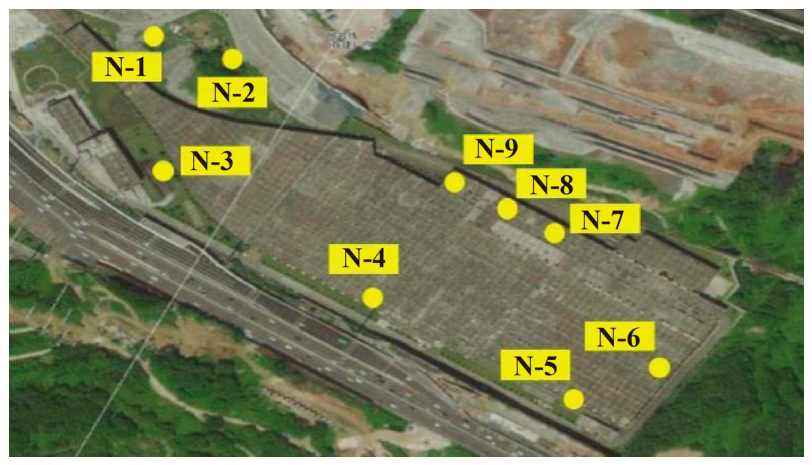
To ensure the reliability of the simulation results, field vibration measurements were conducted under the operational conditions of the parking yard, and the test results at corresponding monitoring points were compared with the simulation outputs to assess the accuracy of the model calculations. During the tests, trains passed through the throat area at approximately 12 km/h and entered the depot at around 5 km/h. Based on the distribution of buildings and the site zoning, representative locations were selected for monitoring points, as shown in
Figure 4. A total of nine monitoring sections were established:
Section 1,
Section 2,
Section 3,
Section 4,
Section 5 and
Section 6 were symmetrically arranged in Zone B (measuring points 1–3 on one side, measuring points 4–6 on the opposite side), and measuring points 7–9 were located in Zone C, as shown in
Figure 5 and
Figure 6. For the underground layer, monitoring points were placed at the pile foundations and outside the track bed, while surface points were positioned either above the pile foundations or at structurally weaker locations between piles.
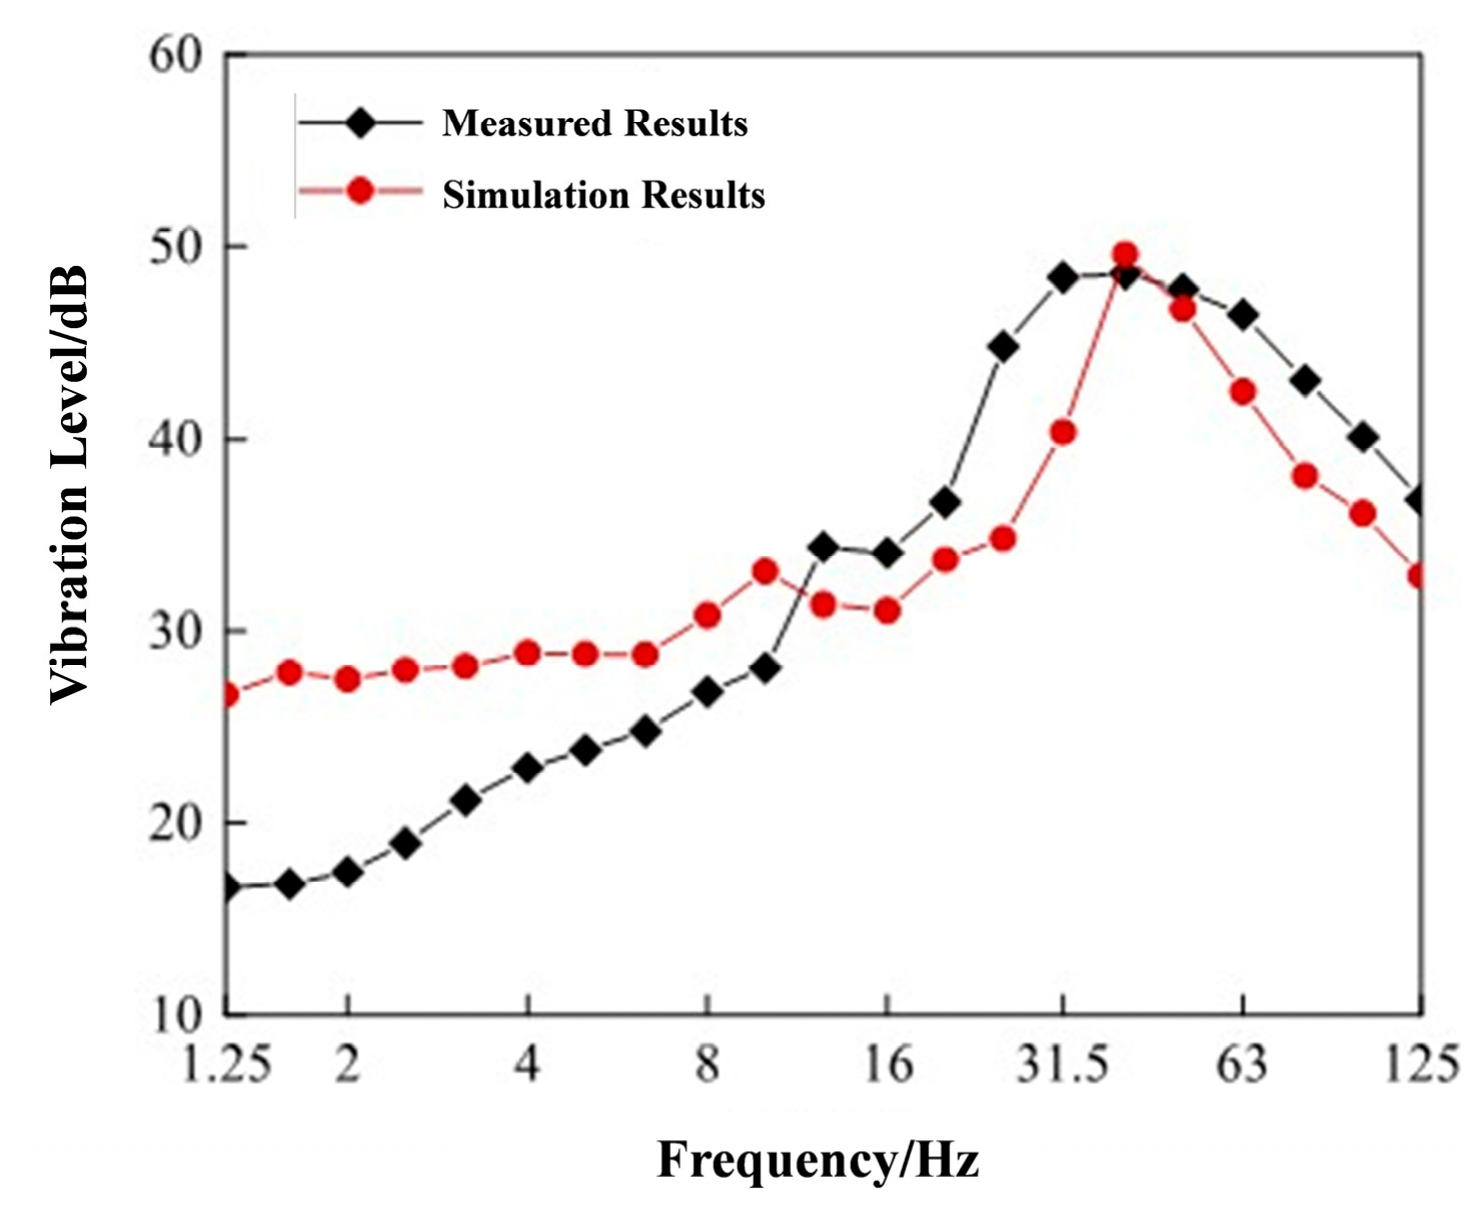
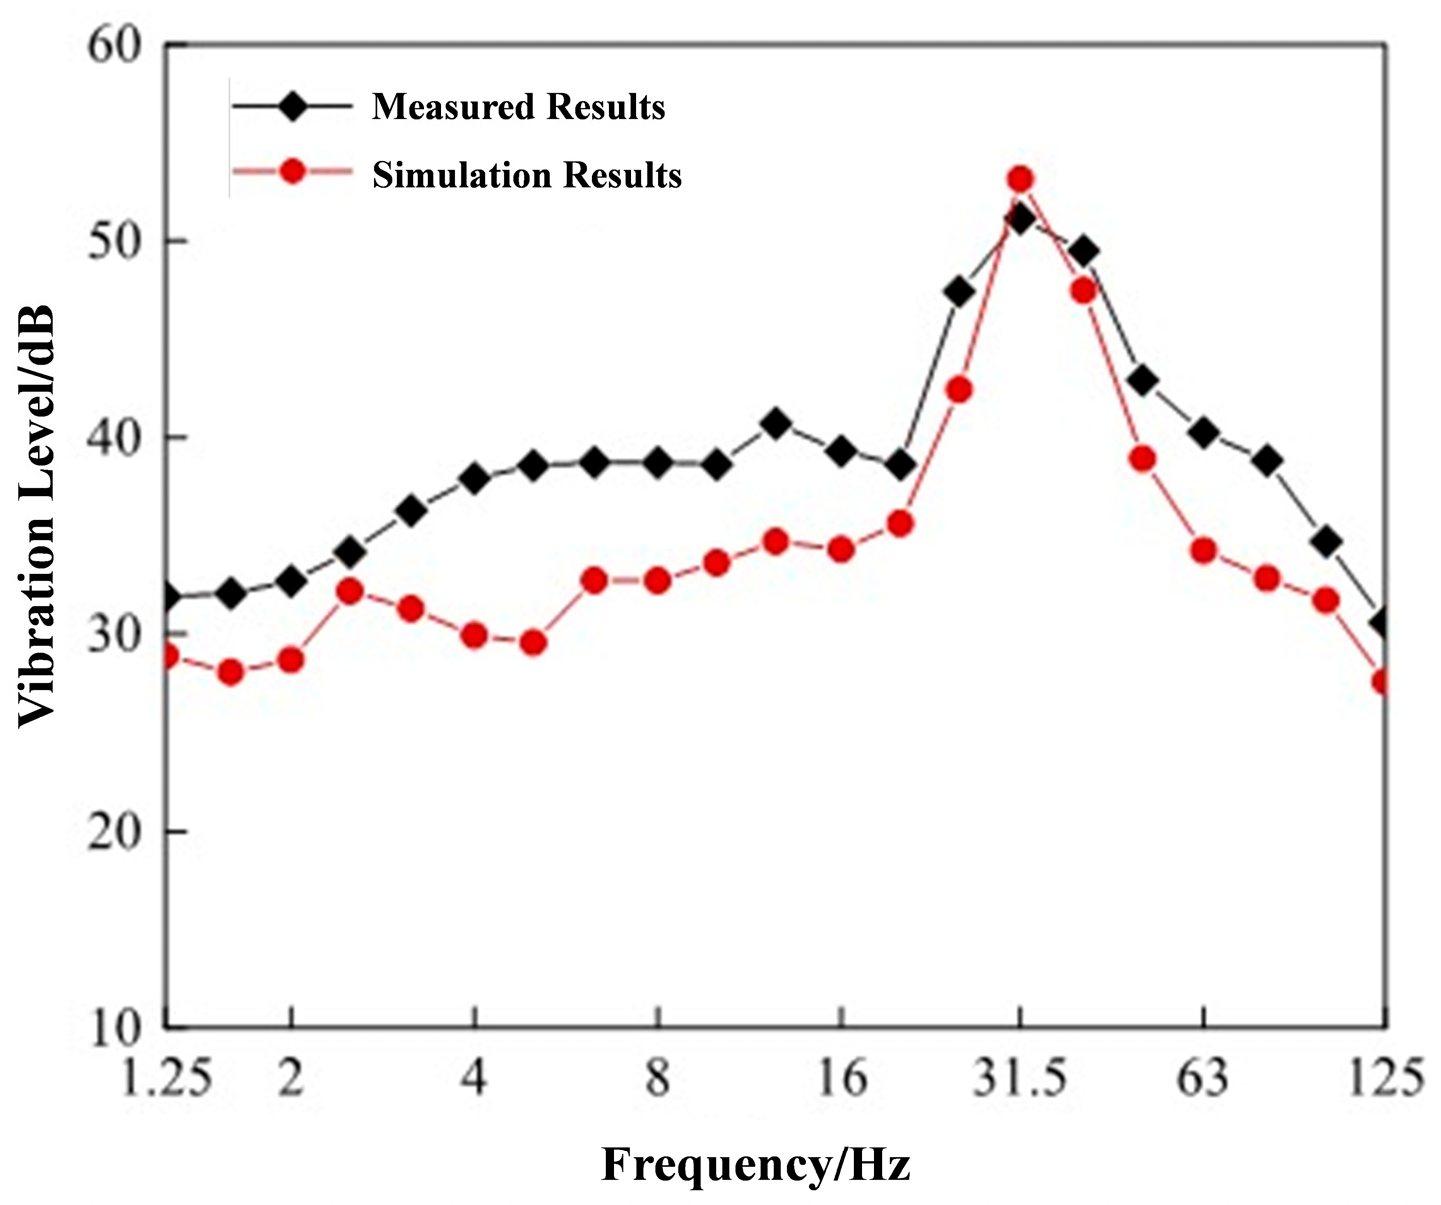
According to the “Standard for Limits and Measurement Methods of Building Vibration and Structure-Borne Secondary Noise Induced by Urban Rail Transit” (JGJ/T 170-2009), the measured acceleration data were converted into Z-weighted vibration acceleration levels using the prescribed calculation formula. The monitoring results at the V3 and V6 surface points were compared with the corresponding simulation results, as shown in
Figure 7 and
Figure 8. A summary of the comparison between the measured and calculated results at the remaining monitoring points is provided in
Table 4.
According to the time-domain and frequency-domain comparison plots at measuring points V3 and V6, the simulated and measured acceleration amplitudes are generally in good agreement. However, owing to non-stationary factors during actual train operation, such as stopping, horn sounding, and slight speed fluctuations, local abrupt changes may appear in the measured time–history curves. In contrast, in the simulation, the train operates at a constant prescribed speed, resulting in stronger continuity of the time-domain signals [
29]. Although certain differences exist in local peak values and octave-band vibration levels, the dominant vibration frequencies agree well, and the response patterns at all measuring points are generally consistent. As shown in
Table 4, both the vibration level and the peak acceleration at the measuring points above the throat section are significantly higher than those in other areas. This result is consistent with the engineering reality that the turnout throat section of the parking yard is the principal vibration source, thereby verifying the rationality and reliability of the established model. Further analysis of
Table 4 shows that the percentage difference in peak acceleration ranges from 0.00% to 12.50%, with an average of 7.21%, while the percentage difference in the maximum Z vibration level ranges from 0.47% to 4.00%, with an average of 2.68%.
Overall, the relative deviation of the maximum Z vibration level is clearly smaller than that of the peak acceleration, indicating that the model has relatively high accuracy in characterizing vibration levels. By comparison, the deviation in peak acceleration is slightly larger, which is mainly attributable to fluctuations in actual train operating conditions, locally intensified excitation in the turnout section, and the high sensitivity of transient peaks to working-condition variations. Nevertheless, these differences remain within an acceptable range, and the model can therefore be regarded as reasonable and reliable.
3.3. Analysis of Vibration Characteristics in Different Functional Zones
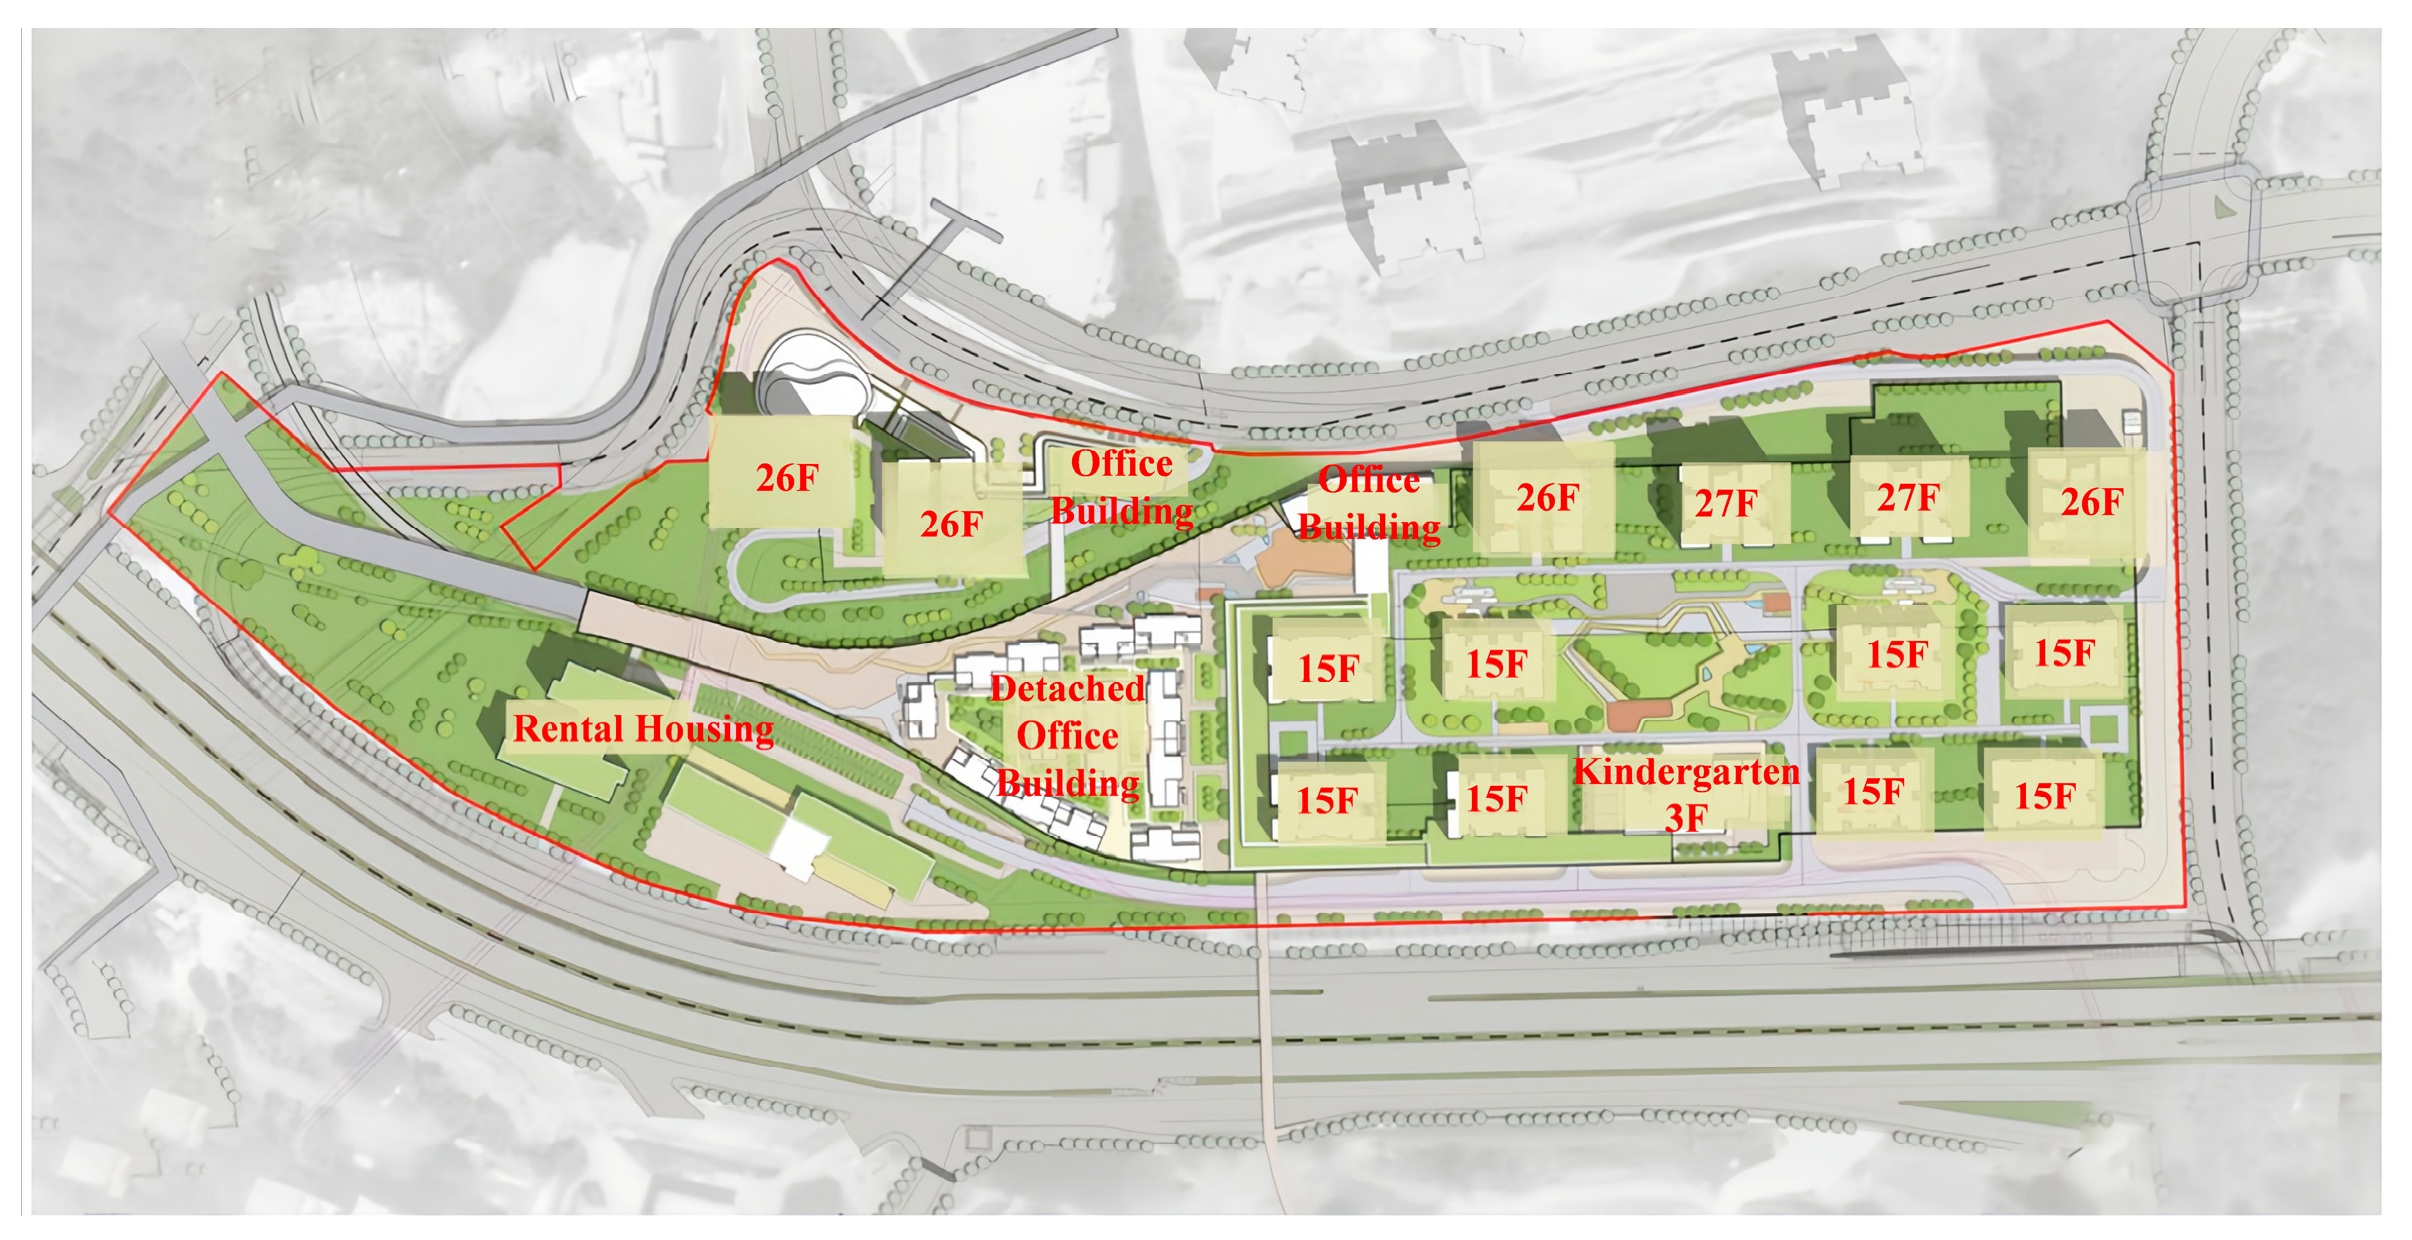
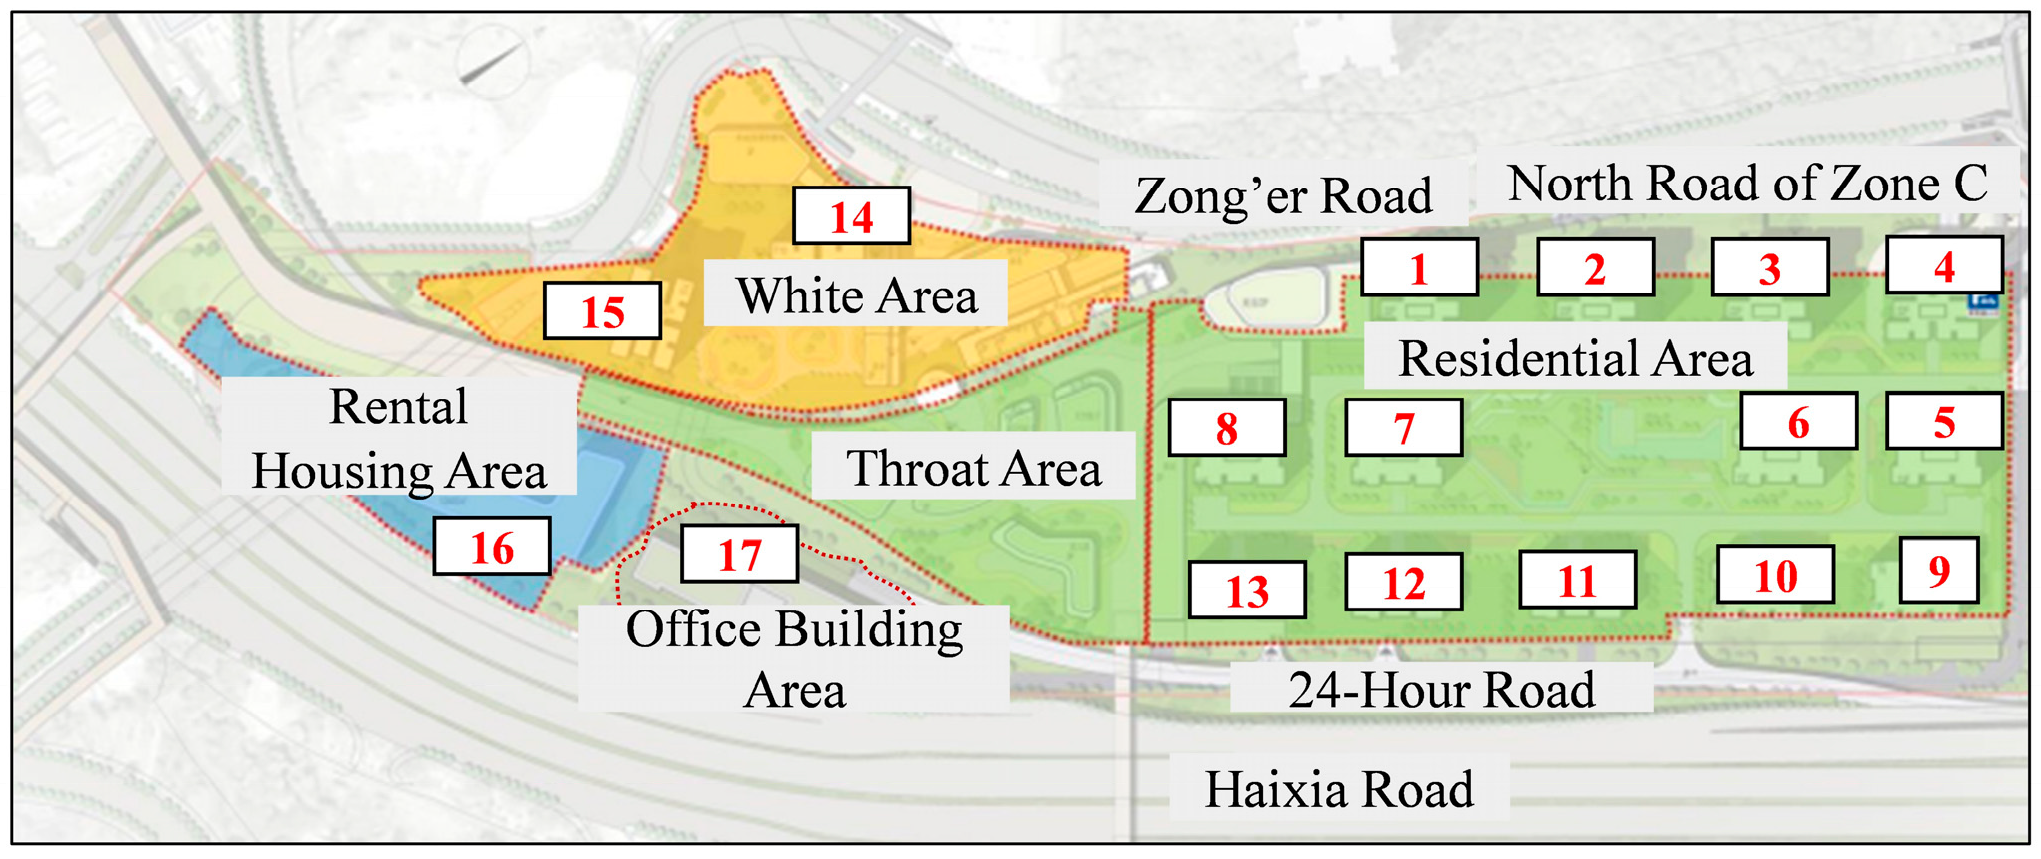
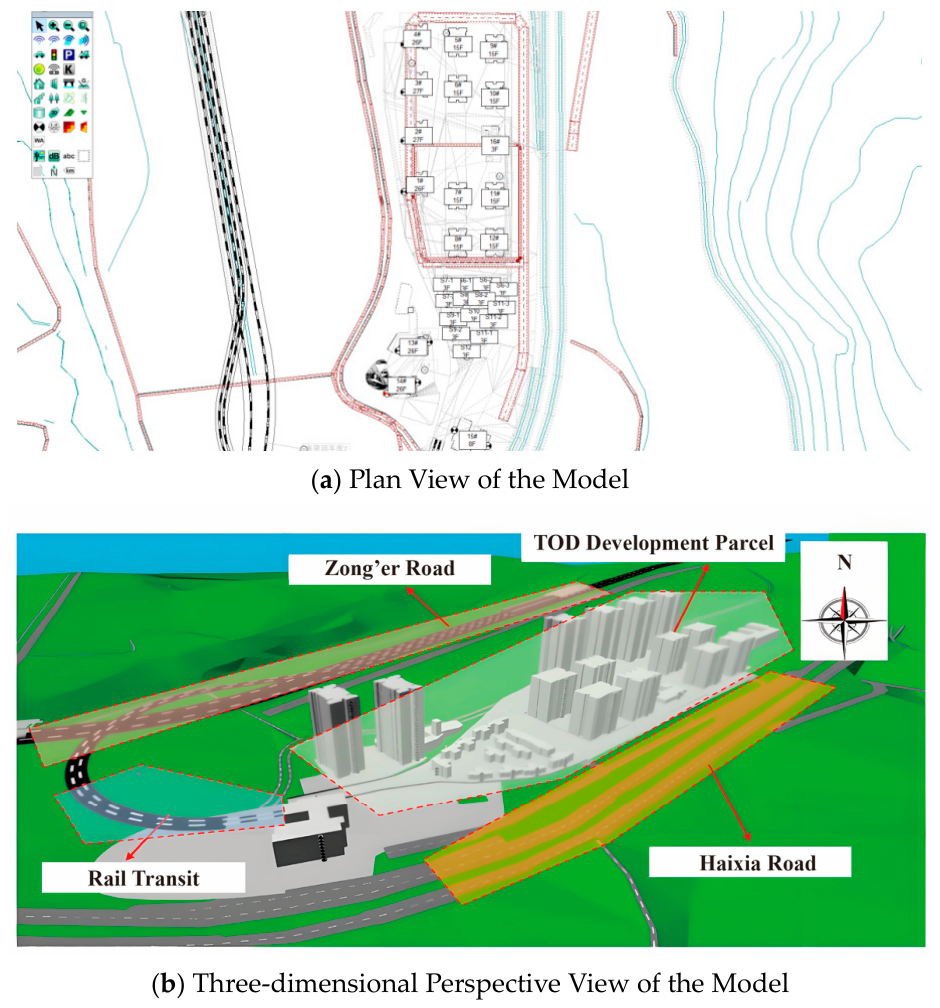
The buildings on the project development site and the surrounding existing building clusters are divided into functional zones: residential area, reserved area, rental housing area, and office area. The residential area comprises the planned high-rise Buildings 1–13, the reserved area includes the existing Buildings 14 and 15, the rental housing area contains the existing Building 16, and the office area corresponds to the existing Building 17. The functional zones and the plan locations of the buildings are shown in
Figure 9.
According to the “Standard for Environmental Vibration of Urban Areas” (GB 10070-1988) and the “Standard for Limits and Measurement Methods of Building Vibration and Structure-Borne Secondary Noise Induced by Urban Rail Transit” (JGJ/T 170-2009), which specify the frequency-dependent vibration limits and maximum Z-weighted vibration levels for residential buildings, commercial buildings, and basements, and based on the site conditions, this study conducts a vibration characteristics analysis at selected monitoring points.
The vibration monitoring points are located at the floor slab centers of the following levels:
- (1)
Residential area (Buildings 1–13): 1st, 5th, and 13th floors;
- (2)
Reserved area (Buildings 14 and 15): 1st, 6th, 11th, 16th, and 21st floors;
- (3)
Rental housing area (Building 16): 1st, 4th, and 7th floors;
- (4)
Office area (Building 17): 1st, 4th, and 7th floors.
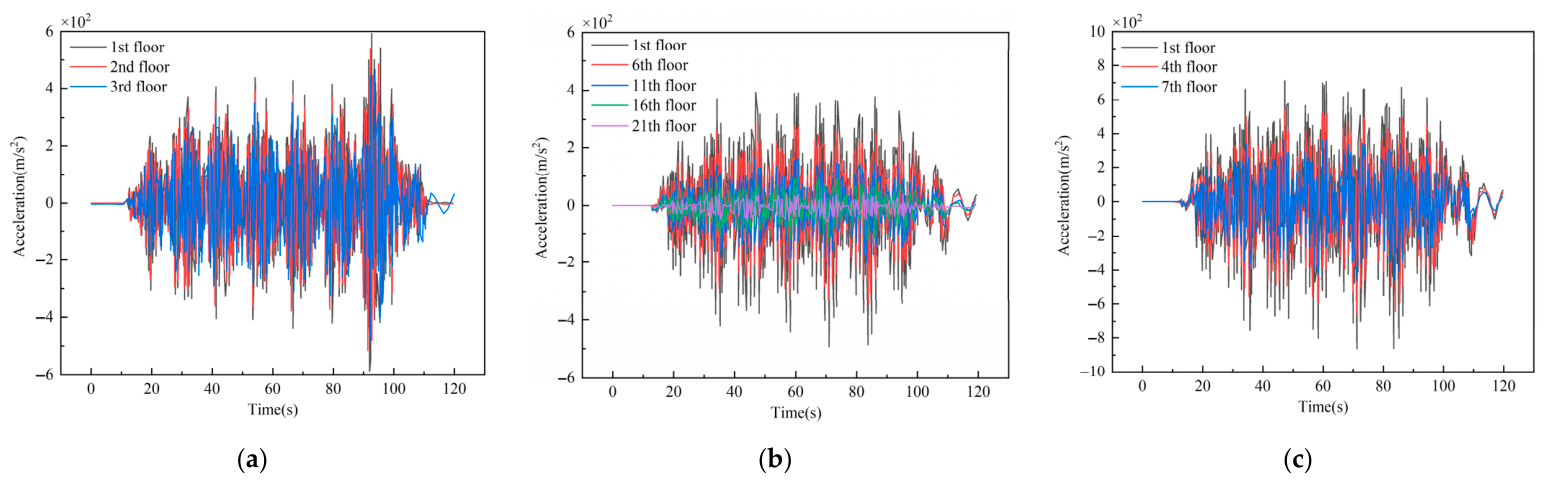
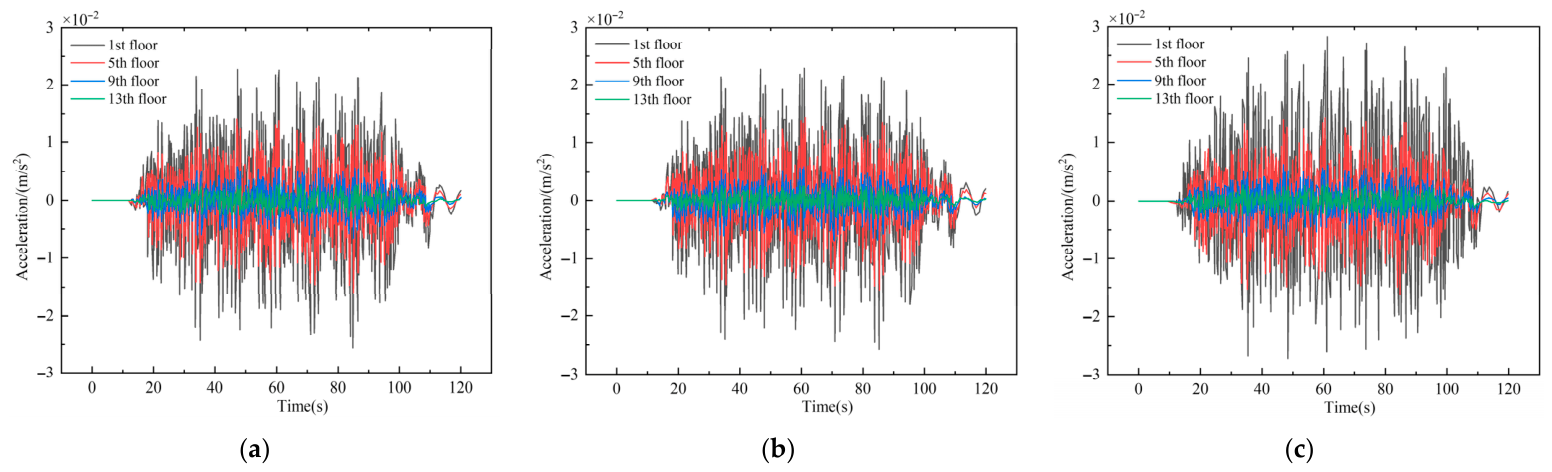
Figure 10 shows the time-domain vibration results for Buildings 1–13 in the residential area. To more intuitively examine the vibration of each floor within different frequency bands, the time-domain data were further analyzed using one-third octave band analysis, and the resulting frequency-specific vibration levels and maximum Z-weighted vibration levels are summarized in
Table 5. The analysis indicates that, for the residential building cluster above the depot, the dominant vibration frequency of the floor slabs induced by the metro is concentrated around 63 Hz. Vibration gradually decays from lower to higher floors, but both the maximum vibration levels and the frequency-specific levels remain within the standard limits. Further analysis shows that Buildings 5–8 exhibit higher peak vibration acceleration and maximum Z-weighted vibration levels compared with adjacent buildings. This is because these buildings are located directly above the track, closer to the vibration source, resulting in more pronounced vibration responses. It is also observed that along the direction of metro movement, the peak vibration accelerations and Z-weighted levels of successive buildings gradually decrease. This is due to the reduction in train speed after passing the throat area, causing the trailing buildings to experience lower vibration levels compared with those closer to the source.
By applying a similar analysis method as used for the residential area, the time-domain vibration results and corresponding vibration levels for the office area buildings, reserved area buildings, and rental housing buildings are summarized in
Figure 11 and
Table 6, respectively.
The analysis indicates that the floor slab vibrations of the office area buildings, reserved area buildings, and rental housing buildings induced by the metro also have dominant frequencies concentrated around 63 Hz, and their vibration characteristics follow the same variation patterns as those observed in the residential area. However, because the reserved area, office area, and rental housing buildings are located closer to the depot throat, and the metro operates at a relatively higher speed when entering the depot, the vibration responses in these zones are greater than those in the residential area. In particular, the 1st floor of Building 16 in the rental housing area exhibits a frequency-specific vibration level of 69.3 dB, approaching the standard limits of 70 dB/67 dB. Although frequency-specific levels at other locations do not exceed the limits, the safety margins are relatively small.
3.4. Analysis of Structure-Borne Secondary Noise Characteristics
Building on the analysis of vibration characteristics, this study further examines the secondary noise characteristics in each functional zone. According to the “Standard for Limits and Measurement Methods of Building Vibration and Structure-Borne Secondary Noise Induced by Urban Rail Transit” (JGJ/T 170-2009), the indoor secondary structure-borne noise limits for buildings along urban rail lines are specified as follows:
- (1)
Residential buildings are classified under “residential and educational areas”, with allowable sound pressure levels of 38/35 dB (daylight/nighttime).
- (2)
Commercial buildings and basements are classified under “mixed residential-commercial areas and commercial centers”, with allowable sound pressure levels of 41/38 dB (daylight/nighttime).
The maximum sound pressure levels of structure-borne secondary noise in each functional zone are summarized in
Table 7. It can be observed that, when evaluating the environmental impact induced by train operations, the standards for secondary noise are stricter than those used for vibration assessment. As a result, most monitoring points show exceedances in secondary noise levels. Specifically, the 1st and 4th floors of the rental housing area exceed the limits, and the office area shows exceedances on the 1st, 2nd, and 3rd floors, with a maximum exceedance of 8.7 dB. Only the reserved area and residential buildings remain within the limits, though with relatively small safety margins. Therefore, based on the combined analysis of vibration characteristics and secondary noise characteristics, it is necessary to implement appropriate vibration mitigation and noise reduction measures to ensure compliance with the relevant standards.
3.5. Preceptions Levels
According to the Standard of Environmental Vibration in Urban Areas (GB 10070-1988) and the Standard for Limit and Measuring Method of Building Vibration and Secondary Radiated Noise Caused by Urban Rail Transit (JGJ/T 170-2009), both building vibration and indoor secondary radiated noise can serve as important indicators for evaluating human perception levels. Among them, the maximum Z vibration level can characterize the degree to which floor vibration induced by train operation affects occupants, while the sound pressure level of secondary radiated noise reflects the subjective perceptibility of indoor low-frequency vibration-induced noise. Because the assessment criteria for secondary radiated noise are generally more stringent than those for vibration control, occupants may still perceive environmental disturbance through audible indoor noise even when vibration levels do not obviously exceed the prescribed limits.
As shown in
Table 5 and
Table 6, the maximum Z vibration levels on different floors in the residential area range from 31.1 to 51.6 dB, and those in the daytime-use area range from 25.4 to 48.6 dB, both of which are significantly below the corresponding limit values. This indicates that the vibration induced by train operation in these two types of areas is generally within an acceptable range, with weak human vibration perception and little likelihood of causing noticeable discomfort. In contrast, the maximum Z vibration levels in the office area range from 65.4 to 67.8 dB, while those in the rental area range from 61.3 to 70.8 dB. Among them, the first floor of the rental area has exceeded the limit, and the fourth floor of the rental area as well as the lower floors of the office area are close to the control threshold. These results indicate that low-rise buildings located near the throat section of the depot are more sensitive to train-induced vibration, leading to a markedly enhanced level of human perceptibility during train passage and a potential risk of reduced comfort at certain locations. Overall, human perception of vibration exhibits a distribution pattern characterized by decreasing intensity with increasing floor height and increasing intensity with decreasing distance to the vibration source.
Further analysis based on
Table 7 shows that the secondary structure-borne noise levels in both the residential area and the daytime-use area do not exceed the prescribed limits, indicating that noise disturbance induced by structural vibration in these indoor environments is relatively minor and that the overall subjective perception of occupants remains weak. By contrast, different degrees of exceedance are observed on Floors 1 to 3 of the office area and on Floors 1 and 4 of the rental area, with the maximum exceedance in the office area reaching 8.7 dB. This result suggests that, at these locations, human perception of the environmental impact of rail transit is not limited to floor vibration itself, but is more likely to manifest first as indoor low-frequency rumbling noise or audible structure-borne noise. Therefore, for the lower floors of the office and rental areas, secondary radiated noise is a more sensitive indicator affecting human perception and environmental comfort.
A comprehensive analysis of both vibration and secondary radiated noise results indicates that the human perception level varies significantly across different functional areas of this project. The residential area and the daytime-use area remain generally at a low perception level and can satisfy normal habitation and usage requirements. In contrast, the lower floors of the office and rental areas exhibit relatively high perception levels. In particular, the first floor of the rental area and the lower floors of the office area near the throat section are more likely to cause noticeable vibration and noise perception during train passage, and targeted vibration and noise mitigation measures are therefore required to further improve indoor comfort.
5. Study on Integrated Vibration and Noise Mitigation Measures
5.1. Principles and Design of Mitigation Measures
The primary principle for vibration and noise mitigation is “source priority and hierarchical control.” Source control is the most direct and effective approach. By optimizing the track structure to reduce wheel–rail interaction forces, the input of vibration energy can be minimized at its origin. When source control alone cannot meet the requirements, isolation barriers or sound-absorbing and vibration-damping facilities should be installed along the propagation path to block or attenuate the transmission of vibration waves and sound waves, as shown in
Figure 17. For sensitive buildings, protective measures on the receiving structures serve as the last line of defense, further reducing structural vibration responses and indoor noise levels.
Based on the above principles and the exceedance characteristics of each functional area in this project, the vibration and noise mitigation measures are determined as follows:
- (1)
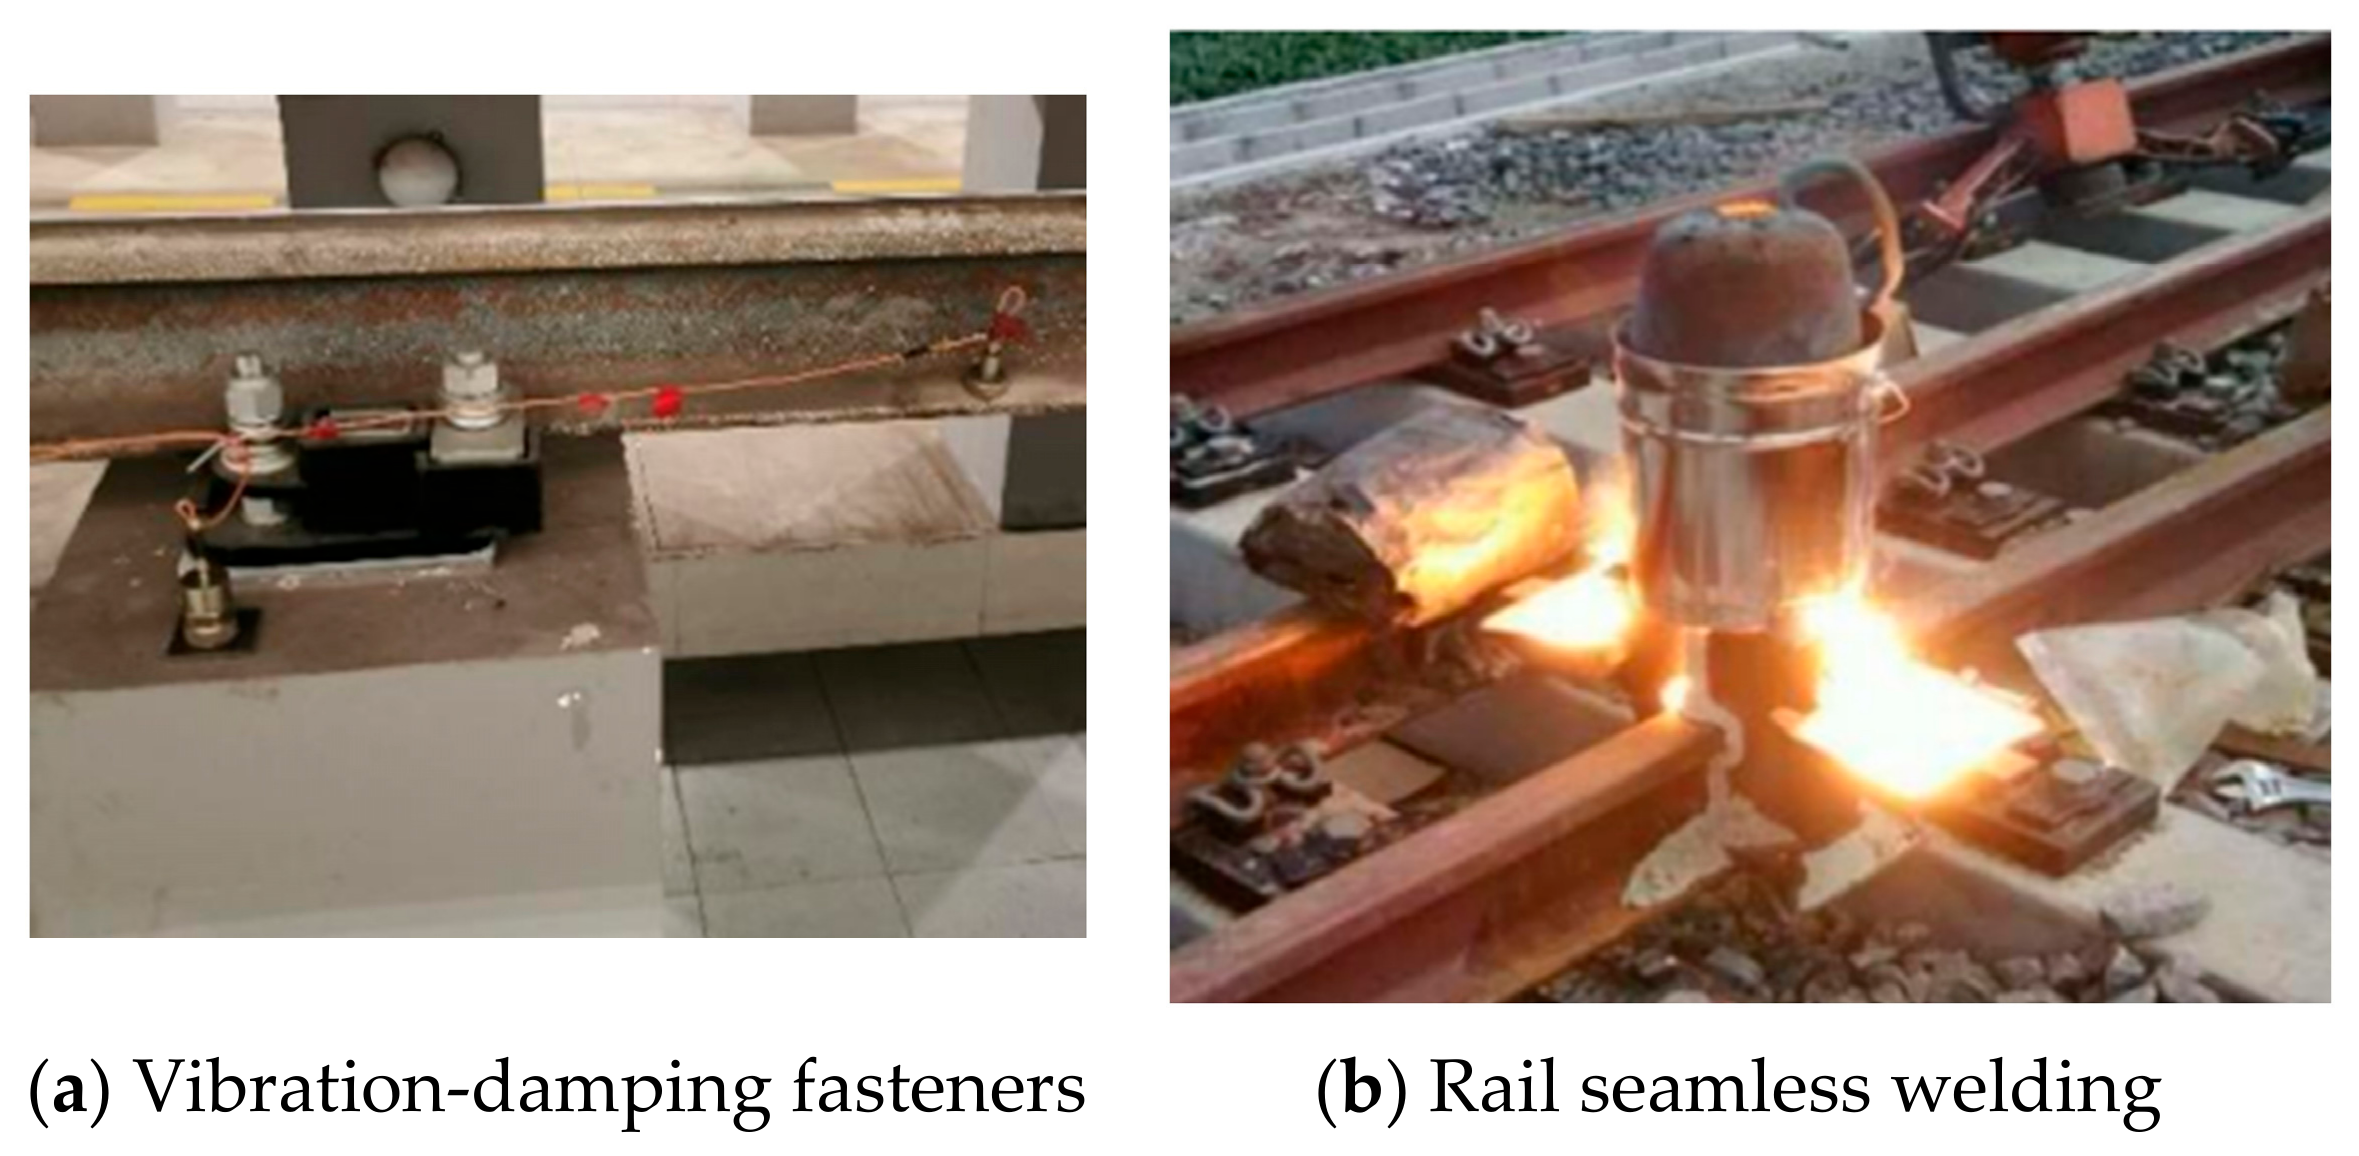
Vibration-damping fasteners are adopted within the residential area. Owing to the large number of buildings and their wide spatial distribution in this zone, the overall vibration levels do not exceed the prescribed limits; however, some buildings located close to the tracks still exhibit relatively pronounced vibration responses, and the overlying track coverage is extensive. Therefore, vibration-damping fasteners are preferentially employed to achieve source control of the wheel–rail interaction excitation, thereby reducing the vibration energy input from the track. This measure does not require modification of the superstructure system and is therefore suitable for large-scale, integrated control of multiple buildings.
For the office area, vibration-isolation supports are installed at the base of the buildings. The vibration and structure-borne secondary noise in the office area are mainly concentrated on the lower floors, indicating that after train-induced vibration enters the superstructure through the foundation, its influence on the indoor environment is more significant in the lower stories. By installing vibration-isolation supports at the building base, the transmission of vibration from the lower structure to the upper floors can be weakened at the entry point of the receiving structure, thereby providing more effective control of floor vibration and the associated secondary radiated noise in the lower floors.
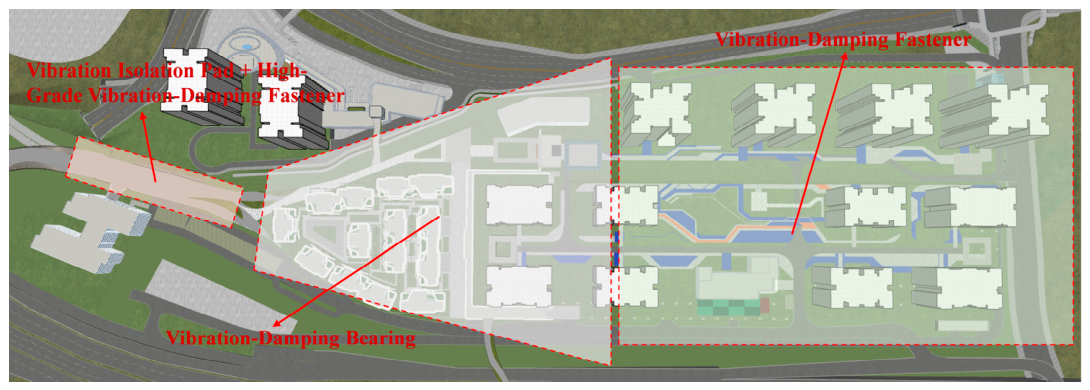
The rental housing area is located close to the throat section of the depot. Under the combined influence of the relatively high train speed during depot entry and the intensified vibration excitation in the turnout zone, the first-floor vibration level and structure-borne secondary noise are the most pronounced, with exceedances mainly concentrated on the side facing the throat section. Therefore, a combined measure consisting of vibration-isolation pads and high-performance vibration-damping fasteners is adopted on this side. The high-performance vibration-damping fasteners are used to further reduce the vibration source intensity of the wheel–rail system, while the vibration-isolation pads are used to locally block the near-field transmission path, thereby mitigating the lateral and vertical propagation of vibration from the track bed and adjacent structures to the over-track buildings. The layout range is shown in
Figure 18, and the parameters of the vibration-isolation pads, vibration-damping fasteners, and vibration-isolation supports are listed in
Table 9,
Table 10 and
Table 11, respectively.
- (2)
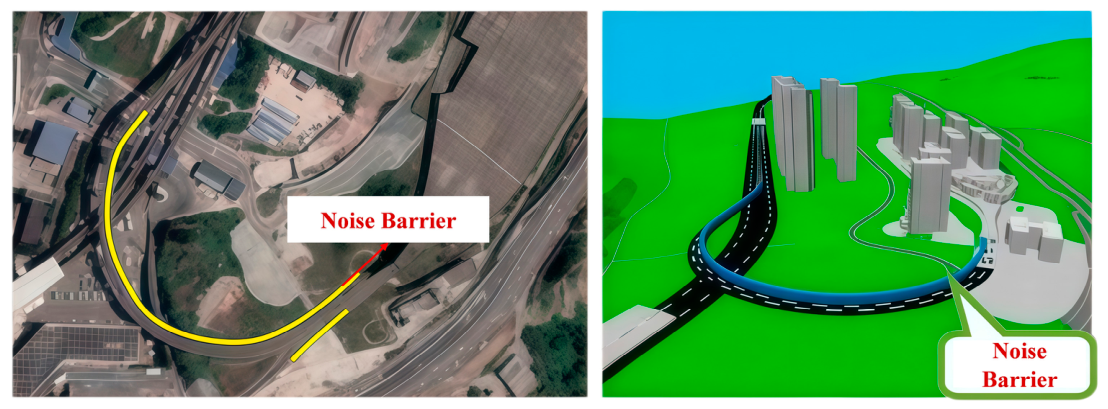
A 4 m high vertical noise barrier is installed along Haixia Road, and semi-enclosed noise barriers are arranged around the depot line. At the same time, considering that airborne noise from road traffic is the dominant factor in the regional outdoor acoustic environment, and that some buildings may still face a risk of local indoor or outdoor exceedance even after the aforementioned active control measures have been implemented, high-performance sound-insulating windows are further adopted for the buildings that still exceed the limits in accordance with the indoor noise standard requirements. In this way, an integrated control system combining source vibration reduction, path noise attenuation, and receiver protection is established, as shown in
Figure 19.
5.2. Analysis of Vibration Mitigation Effectiveness
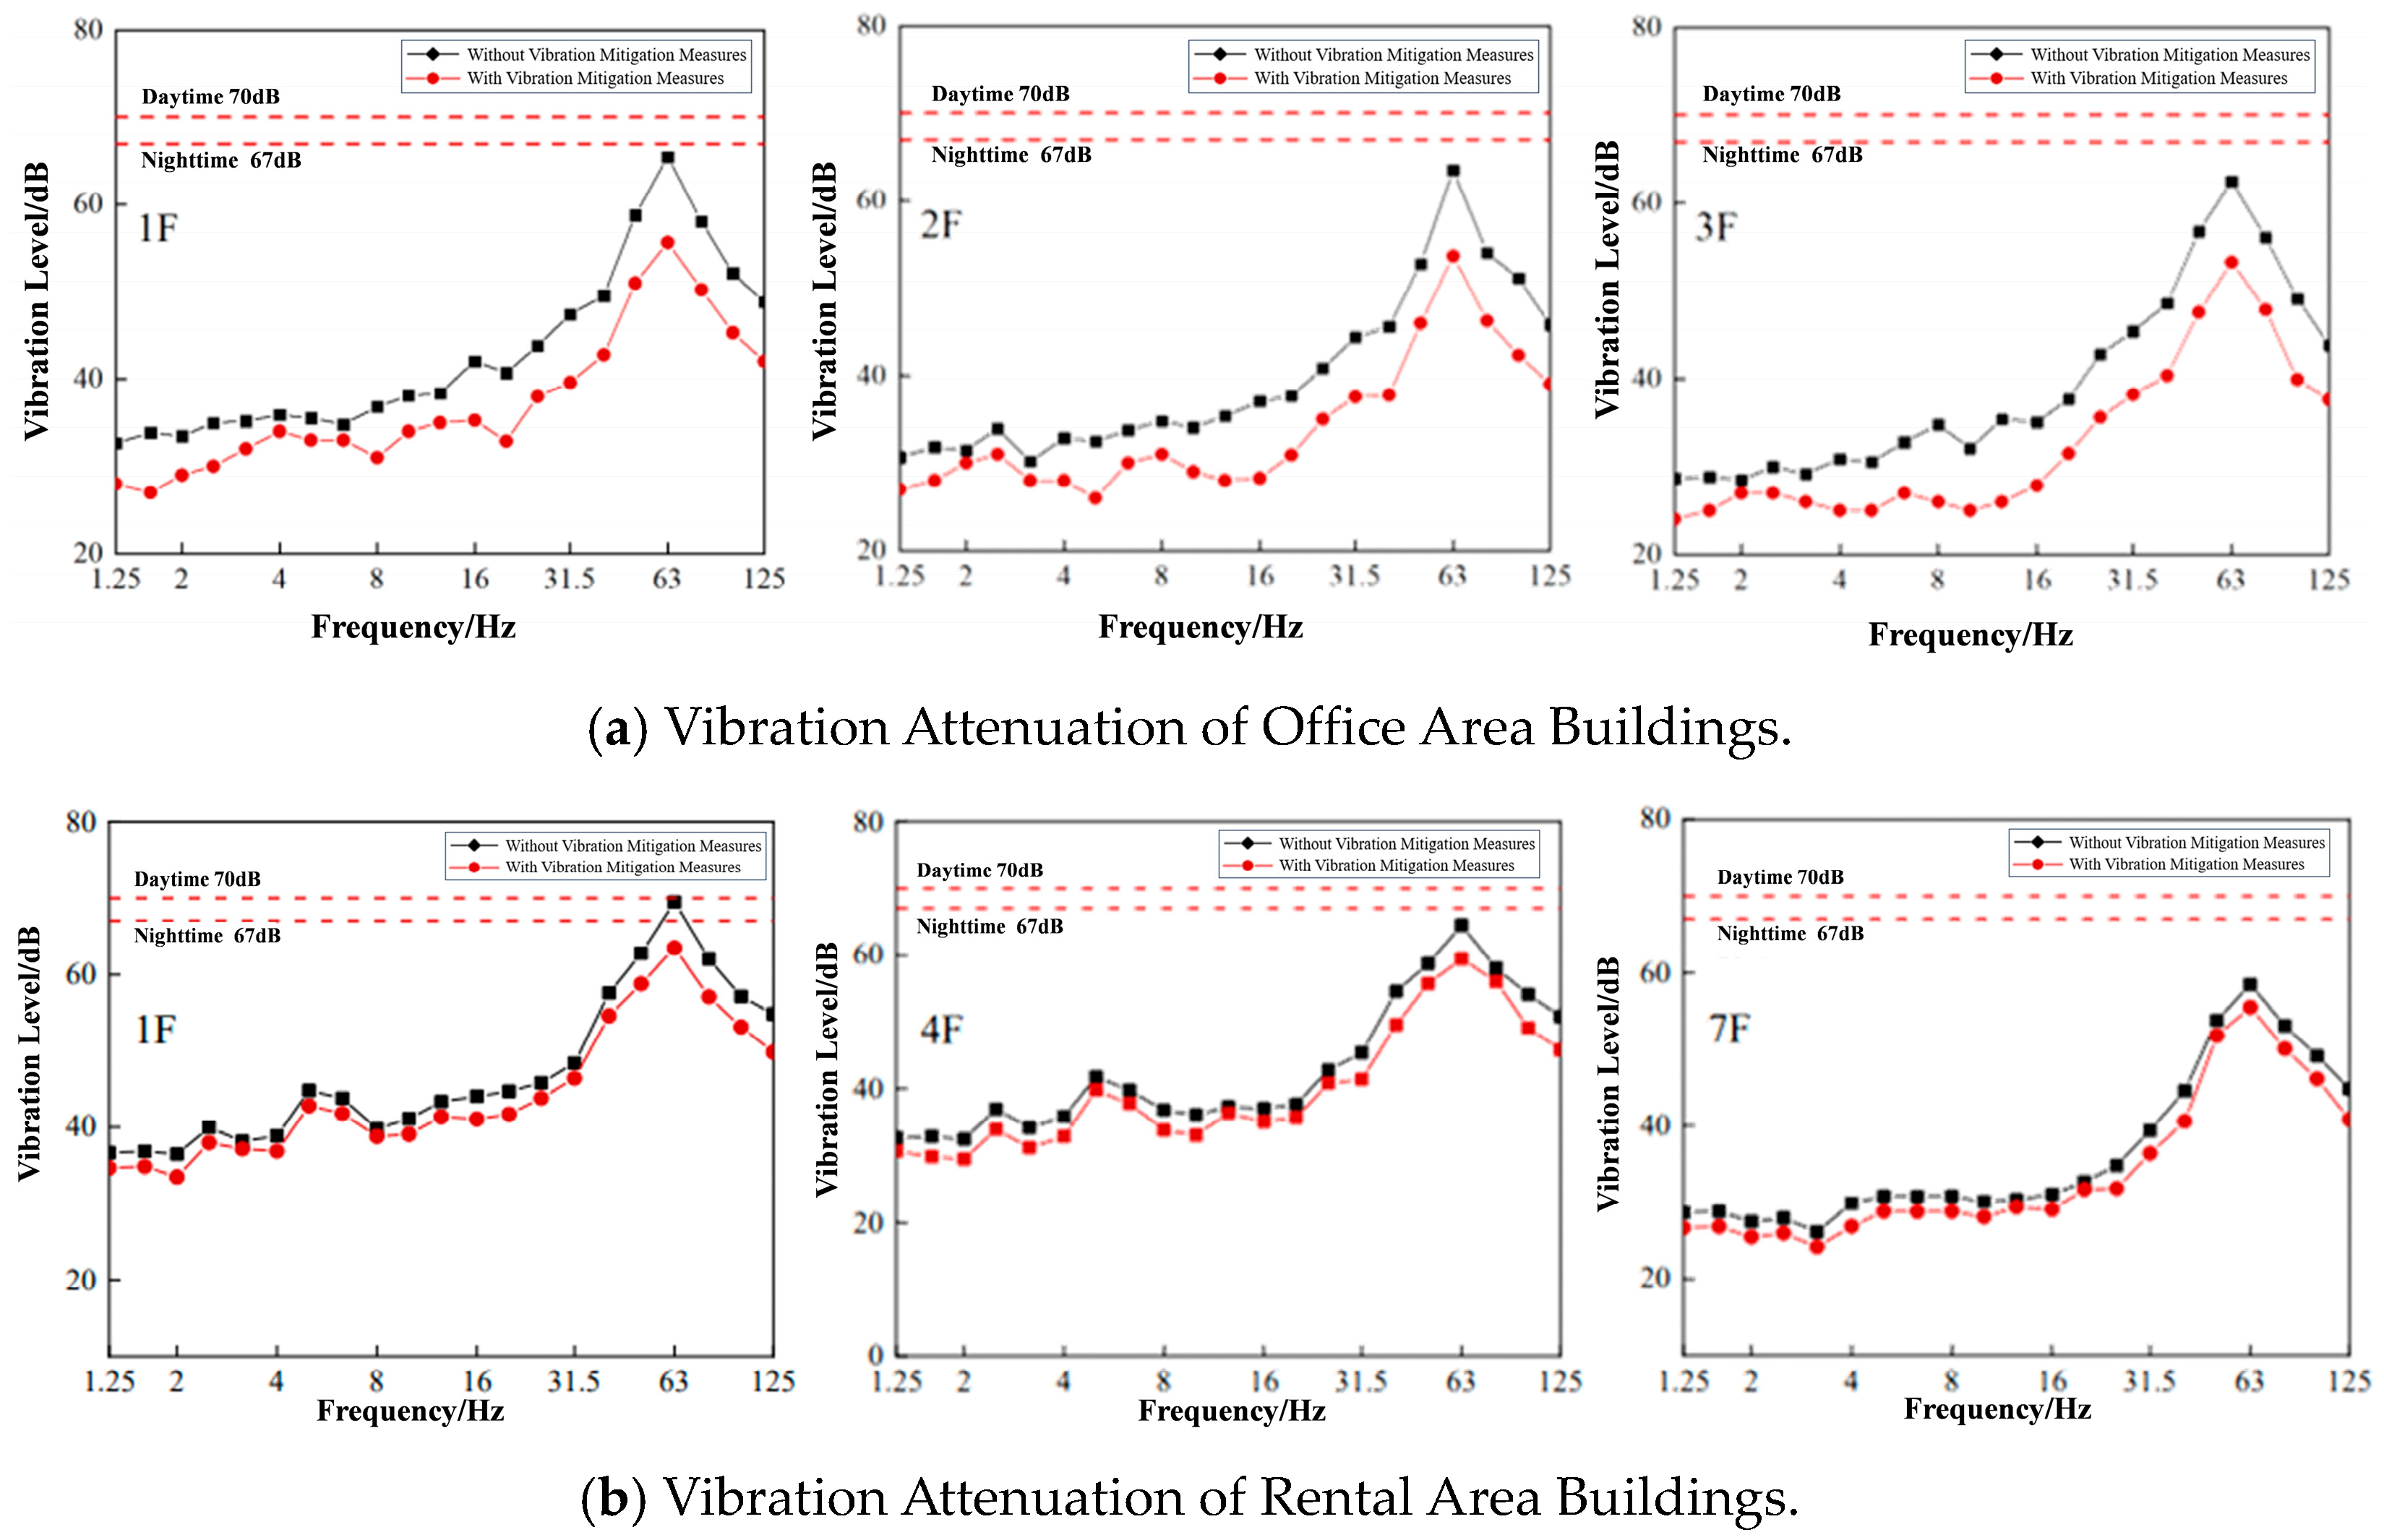
Based on the vibration mitigation methods and parameters described in the previous section, finite element simulations were conducted for this project, and the vibration and secondary radiation noise of buildings exceeding limits after mitigation were extracted and summarized in
Table 12 and
Figure 20.
After implementing the corresponding vibration isolation and mitigation measures in each functional area, the vibration and secondary noise at the observation points significantly decreased, with all indicators reduced to within the standard limits. The maximum Z-direction vibration level decreased by 4–8.9 dB, and the maximum sound pressure level decreased by 6.2–9.6 dB, indicating that the vibration isolation and mitigation measures adopted in this project are effective in controlling structural vibration and secondary noise.
5.3. Analysis of Noise Reduction Effectiveness
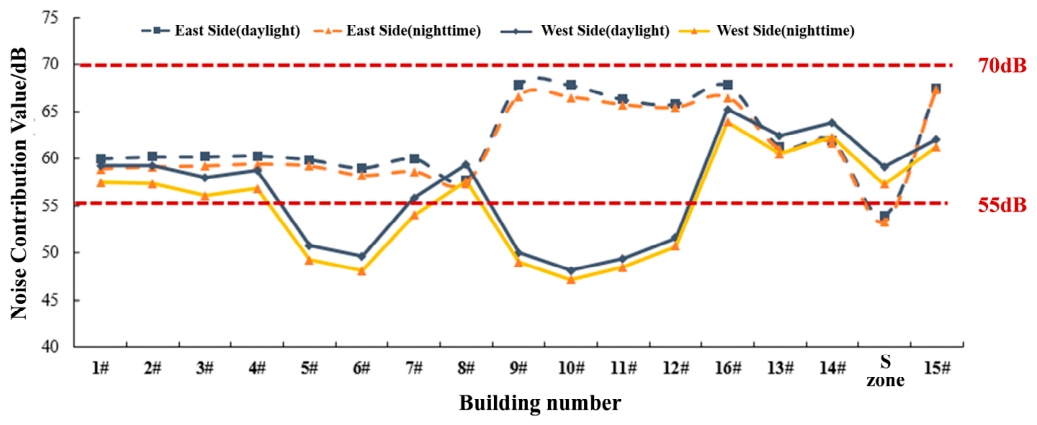
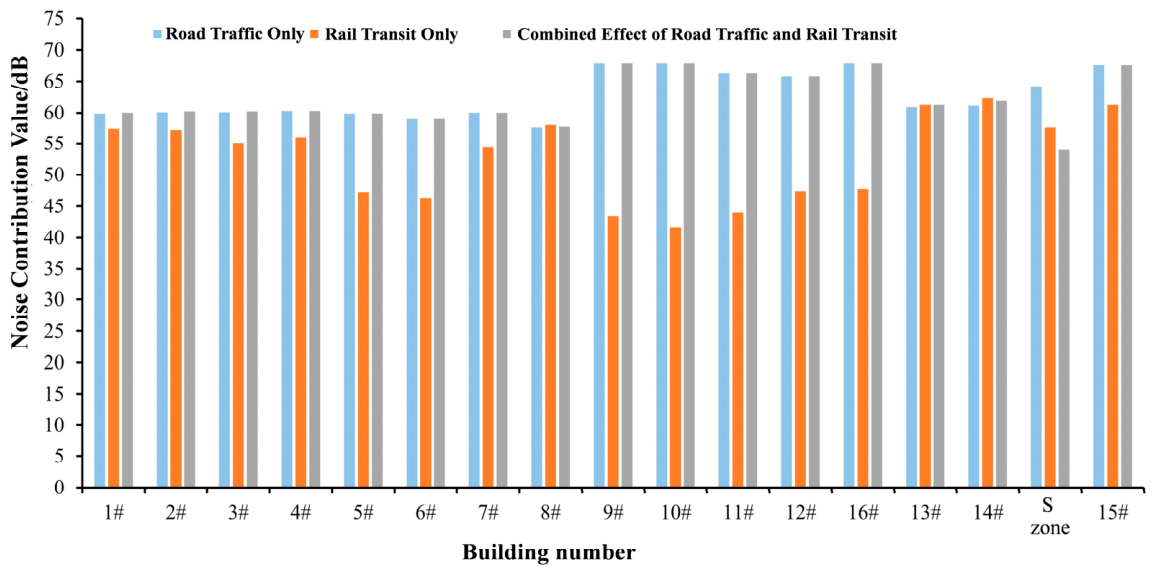
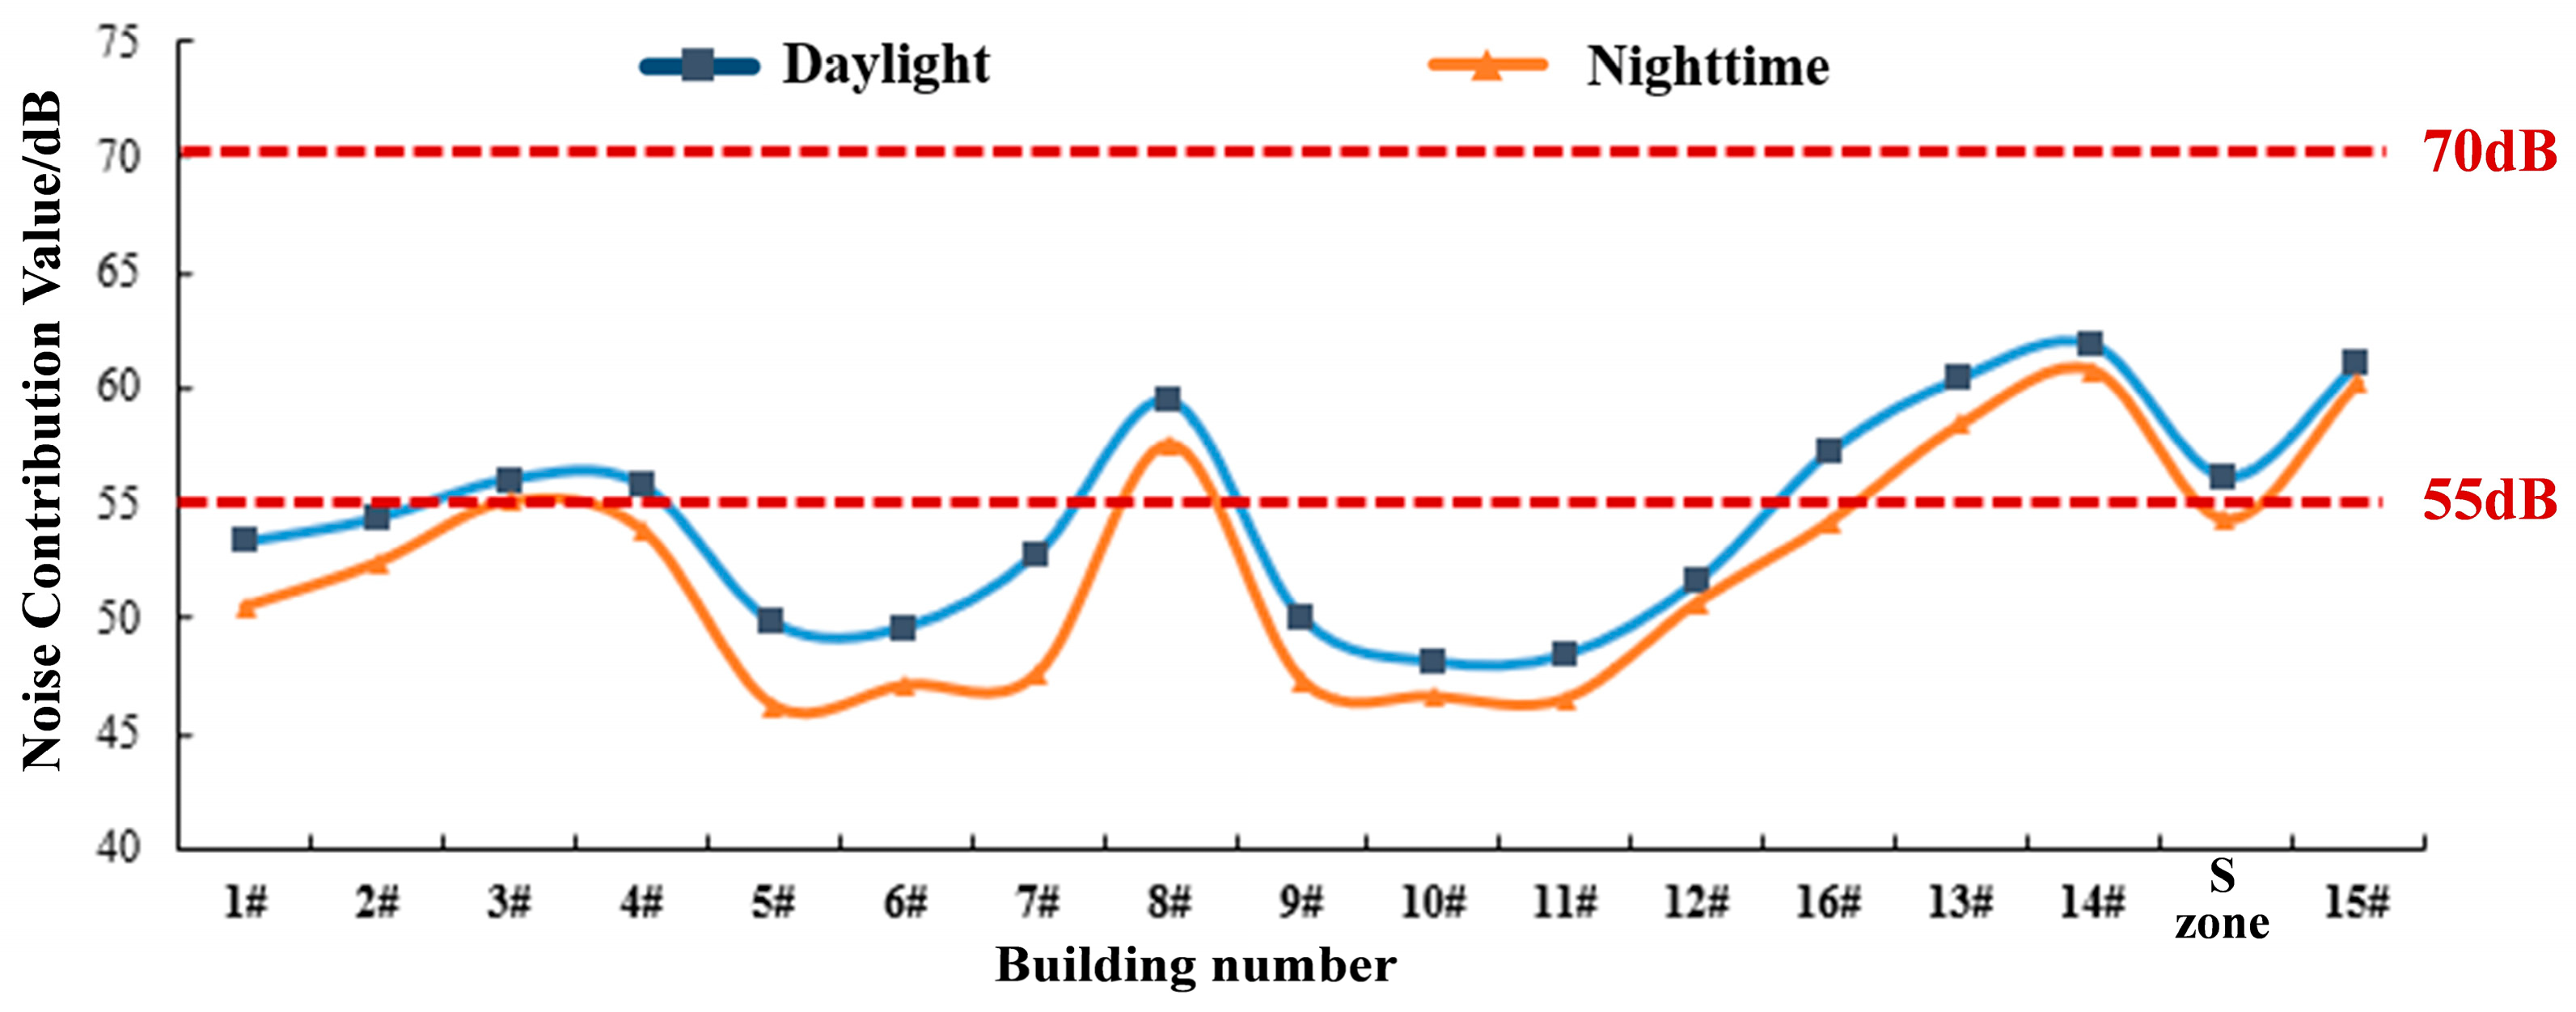
By implementing active noise reduction measures, such as vertical noise barriers and semi-enclosed noise barriers, the noise contribution values at each monitoring point are summarized in
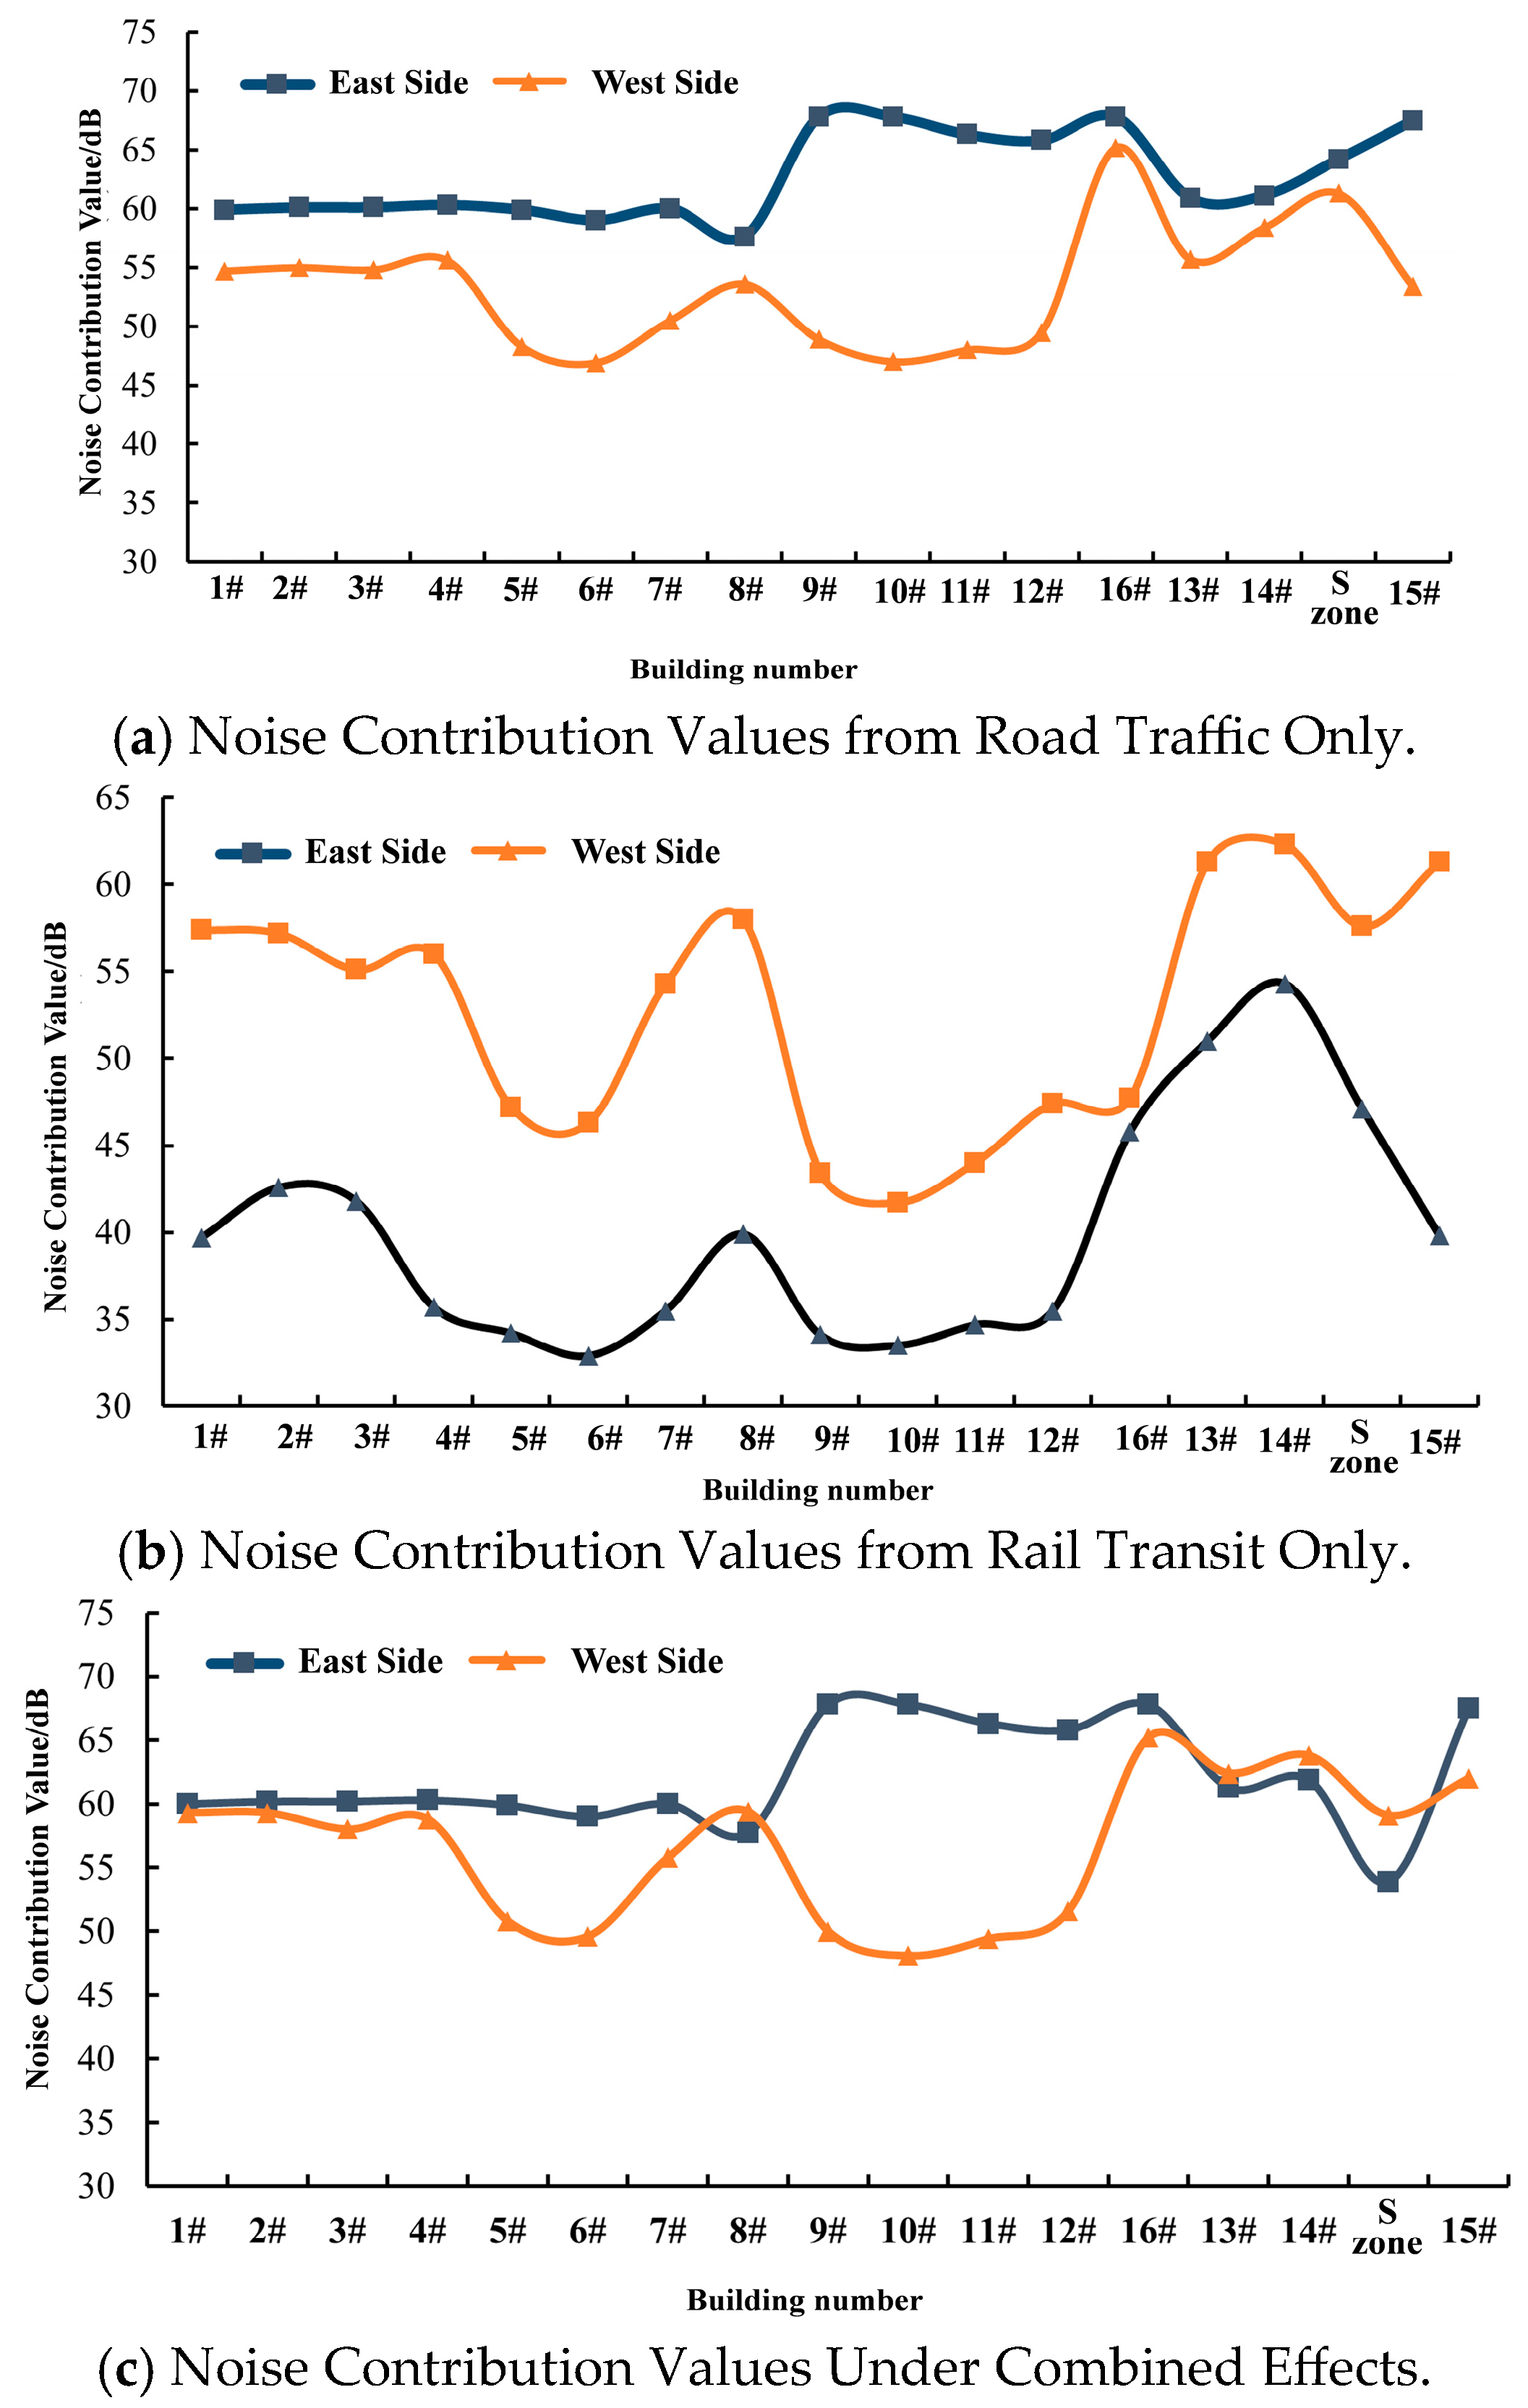
Figure 21. It can be observed that the site’s acoustic environment has been significantly improved, with the number of buildings exceeding the limit reduced from 10 to 4, showing a marked decrease. Subsequently, high-performance sound-insulating windows were installed in buildings that still exceeded the limits, thereby ensuring that the daily living and working acoustic environment requirements within the area are met.
Based on the numerical simulation analysis of the aforementioned vibration mitigation and noise reduction measures, the integrated control system adopted in this project demonstrates satisfactory control performance. In terms of vibration control, the combined application of multi-level mitigation measures, including the replacement of conventional fasteners with resilient fasteners, the installation of spring vibration-isolation supports, and the addition of side-wall vibration-isolation pads, effectively suppresses the vibration response in the office and rental housing areas. The frequency-specific vibration levels and the maximum Z-weighted vibration levels at all monitoring points are reduced to within the prescribed limits, with the most pronounced improvement observed on the first floor of the rental housing area, where the exceedance was previously the most severe. The control effect on secondary noise is highly correlated with the attenuation of structural vibration. As the vibration energy of the floor slabs decreases, the structurally radiated noise correspondingly declines significantly, and the maximum sound pressure levels on all floors in the office and rental housing areas are reduced to within the applicable daytime and nighttime limits for their respective functional zones. Among them, the most remarkable improvement is observed on the first floor of the office area, where the exceedance had originally been the most prominent.
With regard to the improvement of the acoustic environment, the combined installation of vertical noise barriers and semi-enclosed noise barriers effectively blocks the propagation of airborne noise from both road traffic and rail transit. Together with the supplementary application of high-performance sound-insulating windows, the daytime and nighttime noise contribution values of all buildings within the project area are reduced to meet the requirements of the Class 4a area standard. The nighttime noise reduction effect is particularly significant for several high-rise buildings located close to the arterial road. Further analysis indicates that the acoustic environment problem in this project exhibits a “dual-dominant” characteristic. From the perspective of regional overall sound level control, airborne noise from road traffic is the primary source responsible for the exceedance of the outdoor acoustic environment. In contrast, from the perspective of indoor comfort control, the low-frequency structure-borne noise induced by metro vibration constitutes an important influencing factor for sensitive low-floor spaces in the office and rental housing areas. Therefore, it is difficult for external noise reduction measures alone, such as noise barriers, to effectively mitigate indoor structure-borne secondary noise, while vibration mitigation measures alone are also insufficient to resolve the exceedance of the overall outdoor sound level dominated by road traffic.
Overall, the coordinated implementation of vibration mitigation and noise reduction measures leads to a systematic improvement in both the vibration environment and the acoustic environment within the project area. Among these measures, track vibration reduction and building vibration isolation mainly target metro-induced vibration and the associated low-frequency structure-borne noise, whereas noise barriers and sound-insulating windows are primarily intended to control airborne noise from road traffic and externally radiated noise from rail transit. These two categories of measures correspond to different control requirements associated with distinct propagation mechanisms and spectral characteristics, and together they constitute an integrated mitigation path suitable for TOD over-track development projects. All key evaluation indices satisfy the relevant code requirements, thereby verifying the scientific basis and engineering applicability of the proposed integrated mitigation scheme.
5.4. Cost–Benefit Analysis of Integrated Control Measures
Considering that different control measures vary in terms of implementation scope, construction complexity, maintenance requirements, and control effectiveness, a brief cost–effectiveness analysis is conducted in this study from the perspective of engineering applicability. In general, track vibration mitigation measures act directly on the vibration source or the initial transmission path and therefore usually exhibit relatively high vibration control efficiency, particularly in areas where both structural vibration and structure-borne secondary noise need to be controlled. Building vibration isolation measures are more targeted in their application and are thus suitable for the focused treatment of locally sensitive buildings. Measures aimed at propagation path interruption and receiver protection are more applicable to the control of outdoor acoustic environments dominated by road traffic, as well as to localized supplementary mitigation.
From the perspective of vibration mitigation, vibration-damping fasteners are mainly arranged within the residential area. Their implementation is relatively mature, they have limited impact on the modification of existing track systems, and the investment required per unit coverage is relatively controllable, making them suitable for large-scale application. Their main advantage lies in reducing the vibration input generated by wheel–rail interaction at the source, thus offering good overall cost-effectiveness. Vibration-isolation supports are mainly installed at the base of the office buildings. Although they require relatively higher standards for local structural treatment and installation, they provide a marked control effect on vibration in sensitive low-rise buildings and are therefore suitable for buildings with higher comfort requirements and concentrated exceedances. The combined use of vibration-isolation pads and high-performance vibration-damping fasteners is applied on the side of the rental housing area close to the throat section. This scheme is highly targeted and produces a particularly significant improvement in the area where the original exceedance was most pronounced. However, its implementation scope is relatively concentrated and the structural treatment is more refined, making it a localized high-efficiency mitigation solution. A comprehensive comparison indicates that, for areas where both vibration and secondary noise exceed the limits, priority should be given to a combination of source-level vibration reduction and local building vibration isolation, as this approach can achieve a better balance between control effectiveness and engineering investment.
From the perspective of noise reduction, vertical noise barriers and semi-enclosed noise barriers can significantly attenuate the noise transmitted from road traffic and rail transit to building facades. These measures are suitable for scenarios in which multiple buildings are simultaneously affected and thus provide good group-level control benefits. By contrast, high-performance sound-insulating windows are mainly applied to individual buildings that still approach or exceed the prescribed limits after the implementation of the aforementioned active measures. They serve as supplementary receiver-oriented enhancement measures, with a more concentrated control target and a smaller implementation scope, and are therefore more suitable as terminal optimization measures. In the present project, after the implementation of the active noise reduction measures, the number of buildings exceeding the limits was reduced from 10 to 4, indicating that the noise barrier measures played a dominant role in the overall improvement of the acoustic environment. The sound-insulating windows were then used to further eliminate the remaining exceedance points, thereby ensuring that all buildings complied with the daytime and nighttime limits. This demonstrates that, for TOD projects dominated by road traffic noise and involving a relatively large number of affected buildings, priority should be given to propagation path control measures because of their higher overall benefit, whereas receiver protection measures are more suitable as local supplements. Overall, for areas where vibration and structure-borne secondary noise are prominent, priority should be given to measures such as vibration-damping fasteners, vibration-isolation supports, and vibration-isolation pads so as to improve the vibration control benefit per unit investment. For areas where nighttime outdoor noise generally exceeds the limits, priority should be given to propagation path interruption measures such as noise barriers so that multiple buildings can benefit simultaneously. For buildings that still exhibit local exceedance after the adoption of the aforementioned measures, the use of high-performance sound-insulating windows as supplementary treatment is more economical and reasonable.
6. Conclusions
This study, taking a Chongqing metro-overlaid TOD project as the engineering background, employs a combination of field measurements and numerical simulations to systematically investigate the vibration characteristics of building clusters induced by metro operation, the propagation patterns of secondary noise, and the spatial distribution of the regional acoustic environment. Targeted comprehensive mitigation measures were proposed and their effectiveness was validated. The main conclusions are as follows:
- (1)
The vibration response patterns and secondary noise exceedance characteristics of building clusters in different functional zones above the depot under the TOD model were systematically analyzed. The dominant vibration frequency of the floor slabs in all functional zones induced by metro operation is concentrated around 63 Hz, and the vibration response shows a decreasing trend with increasing floor height. A significant vibration amplification effect is observed in the throat area, resulting in the vibration indices on the first floor of the rental housing area, which is closest to this section, exceeding the code limits. The evaluation criteria for secondary noise are more stringent than those for vibration. Exceedances are identified on the 1st to 3rd floors of the office area and on the 1st and 4th floors of the rental housing area, with the maximum exceedance on the first floor of the office area reaching 8.7 dB (A). These results clearly identify the key areas and priority levels for the prevention and control of structure-borne secondary noise in over-track buildings.
- (2)
The regional acoustic environment is influenced by both road traffic and metro operation, with road traffic being the dominant factor. Under the road-only scenario, buildings 9, 10, 11, 12, and 16 near Haixia Road have noise contributions of 65.8–67.8 dB; under the metro-only scenario, noise contributions are related to train speed and distance from the track, with higher values observed in buildings near the throat section. Noise levels increase with floor height, with the maximum values occurring at the top floors, and east-facing facades generally experience higher noise levels than west-facing ones due to road influence. Daytime noise generally meets Class 4a area standards, while many buildings exceed limits at night.
- (3)
For vibration control, through the replacement of resilient fasteners, installation of spring isolation bearings, and addition of side-wall isolation pads, the maximum Z-weighted vibration level is reduced by 4–8.9 dB, and the maximum sound pressure level of secondary noise is reduced by 6.2–9.6 dB, bringing all indicators in the office and rental zones within standard limits. Regarding acoustic environment improvement, the combined use of vertical and semi-enclosed noise barriers reduces the number of buildings exceeding limits from 10 to 4, and with the addition of high-performance soundproof windows, noise levels for all buildings during daytime and nighttime comply with Class 4a area standards.
- (4)
This study addresses the limitation of previous research in which metro-induced vibration and the regional acoustic environment were investigated separately. It achieves the synchronous simulation and combined assessment of coupled train–track–tunnel–soil–building vibration and regional acoustics, thereby enriching the technical methodology for the integrated evaluation of multi-source vibration and noise in metro over-track TOD projects. The differentiated integrated mitigation scheme proposed in this study provides a feasible solution to engineering problems characterized by substantial differences in vibration and noise control requirements among different functional zones and by the difficulty of quantifying the coordinated effects of multiple mitigation measures. The results can provide a useful reference for environmental impact assessment and refined prevention and control design in similar high-density rail transit over-track development projects.
This study focuses on a metro over-track TOD project in Chongqing, and its conclusions are therefore more applicable to depot over-track development projects with similar site conditions, structural systems, and traffic environments. When extending the findings to other types of projects, project-specific modifications are still required. The evaluation of the integrated mitigation effect is mainly based on numerical models calibrated against field measurements. Although these models can reasonably capture the vibration and noise response characteristics, long-term field data after the implementation of mitigation measures are still needed. In addition, due to the computational limitations of the three-dimensional finite element method in broadband mid- and high-frequency analysis, this study mainly concentrates on low-frequency vibration and the associated secondary noise, while the coupled vibration–noise propagation characteristics over a wider frequency range still require further investigation.
Future research will incorporate comparative analyses of multiple projects under different urban contexts, geological conditions, and overbuild structural forms, so as to further identify the common response characteristics of vibration and acoustic environment in building clusters above metro depots and improve the general applicability of the conclusions. At the same time, long-term operational monitoring data collected after project implementation will be used to continuously calibrate the vibration and acoustic model parameters, with the aim of establishing an integrated analytical framework of “field measurement–simulation–feedback optimization.” This will help improve the evaluation accuracy and engineering applicability of comprehensive mitigation measures under long-term operating conditions.