Article

Model Test Study on the Effect of Quasi-Rectangular Shield Tunnel Excavation on Adjacent Pile Foundation in Sand

1
School of Engineering, Hangzhou City University, Hangzhou 310015, China
2
College of Civil Engineering and Architecture, Zhejiang University, Hangzhou 310058, China
3
School of Civil Engineering, The University of Sydney, Camperdown, NSW 2006, Australia
4
PowerChina Huadong Engineering (Shenzhen) Corporation Limited, Shenzhen 518100, China
*
Authors to whom correspondence should be addressed.
Buildings 2026, 16(9), 1704; https://doi.org/10.3390/buildings16091704
Submission received: 8 March 2026 / Revised: 19 April 2026 / Accepted: 23 April 2026 / Published: 26 April 2026
(This article belongs to the Section Building Materials, and Repair & Renovation)

Abstract

Tunneling activity inevitably induces soil stress redistribution and ground deformation, which may affect adjacent existing pile foundations. Since many previous studies have mainly focused on circular tunnels, the effects of quasi-rectangular shield (QRS) tunneling on adjacent existing pile foundations are not well investigated and understood. In this study, a series of physical model tests were carried out to investigate the response of a single pile and pile group subjected to newly QRS tunneling beneath an existing circular tunnel in dry sand. Two distinct underpass cases were considered: an orthogonal underpass (QRS tunnel axis perpendicular to the circular tunnel axis) and an overlapping underpass (QRS tunnel axis aligned with the circular tunnel axis). The test results indicate that QRS tunneling-induced ground surface settlement and single-pile settlement in the overlapping underpass case were 3.6 and 1.2 times that in the orthogonal underpass case, respectively, with a narrower settlement trough. The axial force distribution along the single pile remained qualitatively consistent in both underpass cases, consistently exhibiting a downward load-transfer mechanism, and further leading to a monotonic growth pattern in axial force with progressive QRS tunnel excavation. The additional stress of the single pile was consistently higher in the overlapping underpass case, which had maximum axial force, negative bending moment, and maximum positive bending moment increases of 20%, 13%, and 6%, respectively, relative to the orthogonal underpass case. The front pile in the pile group exerted a pronounced shielding effect on the rear pile, while the restraining action of the pile cap also contributed measurably to the overall pile responses.

1. Introduction

The rapid pace of urban development has led to problems such as population concentration, land scarcity, and traffic congestion, making the development of underground space an essential solution. As of 31 December 2025, a total of 382 urban rail transit lines had been put into operation in 58 cities in mainland China, with a total length of 13,071.58 km [1]. Due to its advantages, such as a high degree of mechanization, a small environmental effect, a fast construction speed, and safety, the shield-tunneling method has been widely used as the preferred construction method for urban tunnels. However, traditional single-circle shield tunneling, when constructed under narrow old city roads, constantly encounters engineering and technical problems, such as “cannot be placed” and “cannot be touched”. Compared with single-circle shield tunneling, quasi-rectangular shield (QRS) tunneling has a larger space utilization rate and has obvious advantages when underground space is limited. QRS tunneling generally possesses advantages such as good structural performance and high space utilization. A single excavation can form a twin tunnel during construction, maximizing the conservation of underground space resources and significantly improving the tunnel’s ability to pass through narrow roads or between high-rise buildings [2,3]. Therefore, studying the effect of QRS tunneling on adjacent pile foundations is of great significance.
Currently, most shield tunnels studied in domestic and international research on the effect of shield tunneling on adjacent existing pile foundations are circular tunnels. Research methods can be categorized into field measurement methods [4], theoretical and numerical analysis methods [5,6,7], and model-testing methods [8,9,10]. For field measurement methods, due to the deep burial of existing pile foundations, installing sensors is not advisable, resulting in limited reports of relevant field measurements. Furthermore, the measured data mainly focus on the settlement of the pile foundation or superstructure, and the horizontal displacement of the surrounding soil or pile foundation, with only a few cases including observations of pile axial force and bending moment [11,12,13,14,15]. The earliest report dates back to the study by Attewell et al. [11] in 1986 on the side passage of tunnels through existing pile foundation buildings. By using an asphalt coating on the pile body, they effectively reduced the negative skin friction of the pile caused by tunnel excavation. Subsequently, Mair [12] and Lee et al. [13] reported an engineering case of a tunnel in London passing through an adjacent pile foundation building in hard clay. Kaalberg et al. [14] studied the range of influence of tunneling on existing pile foundations and divided it into three types of areas based on the comparison of pile foundations and surface settlement. Boonyarak et al. [15] found that the additional response of existing pile foundations is related to the relative position of the tunnel–pile, including the clear spacing and the longitudinal relative distance between the tunnel face and the pile. For theoretical and numerical analysis methods, they can be generally divided into two categories, including the global analysis method and the two-stage analysis method. The global analysis method analyzes the pile foundation and the soil on the pile side as a whole while simulating the excavation process. It considers the interaction between pile and soil and the interaction between piles in the pile group, as well as the anisotropy of the soil and complex boundary conditions. It is usually analyzed and calculated using the finite element method (FEM) or the finite difference method (FDM) [16,17]. The two-stage analysis method analyzes the effect of tunneling on the pile foundation in two stages: the first stage calculates the free-field soil displacement caused by tunneling without piles; the second stage uses the boundary element method or load-transfer method to apply the free-field soil displacement to the pile and analyze the deformation and internal force changes in the pile [18,19]. For model-testing methods, they can be divided into two types, including constant-gravity-scaled model tests [20,21,22,23] and geotechnical centrifuge model tests [23,24,25,26,27]. These tests mainly study the influence of parameters, such as the relative position of the tunnel and pile, the tunnel volume loss, the working load on the pile top, and the pile type, on the additional pile responses. Most of the soil materials used in the tests are homogeneous dry sand or remolded kaolin clay due to the complexity of the granular-materials [28,29,30,31], which- differ significantly from naturalundisturbed soils in stress history, structure, and anisotropy [32,33,34]. Some special materials, such as aluminum rods [35,36] and transparent soil [37,38], have also been used in model tests.
However, the research on the effect of QRS tunneling on adjacent pile foundations is relatively limited and mainly focuses on theoretical and numerical analyses. Based on stochastic medium theory, an equation was proposed for calculating QRS tunneling-induced transverse ground settlement [39]. A three-dimensional numerical model was developed for the gradual construction of rectangular pipe jacking based on the quasi-rectangular pipe jacking metro station project on Shanghai Line 14, and the interaction between the subsequent construction of double-line pipe jacking and the pile foundation was examined [40]. As underground engineering construction becomes more diversified and spatially intersecting, the effect of QRS tunneling crossing existing tunnels on surrounding buildings has gradually become a challenge for future tunnel construction.
Therefore, based on the Ningbo Metro Line 3 Project in China, this paper focuses on the effect of QRS tunneling on existing pile foundations when it orthogonally or overlappingly underpasses existing circular tunnels. Several constant-gravity-scaled model tests were conducted to analyze the additional deformation, internal forces, and load-transfer mechanisms of the pile foundations during QRS tunneling.

2. Model Test

2.1. Test Program

The model tests in this study are designed for phenomenon simulation and mechanism identification, rather than strict similarity reproduction. This study focused on the fundamental mechanical interaction between the QRS tunnel and adjacent pile foundations. To isolate these core mechanisms, dry sand was used to eliminate pore water pressure effects. Two idealized underpass configurations (orthogonal and overlapping) were examined to represent end-member scenarios.
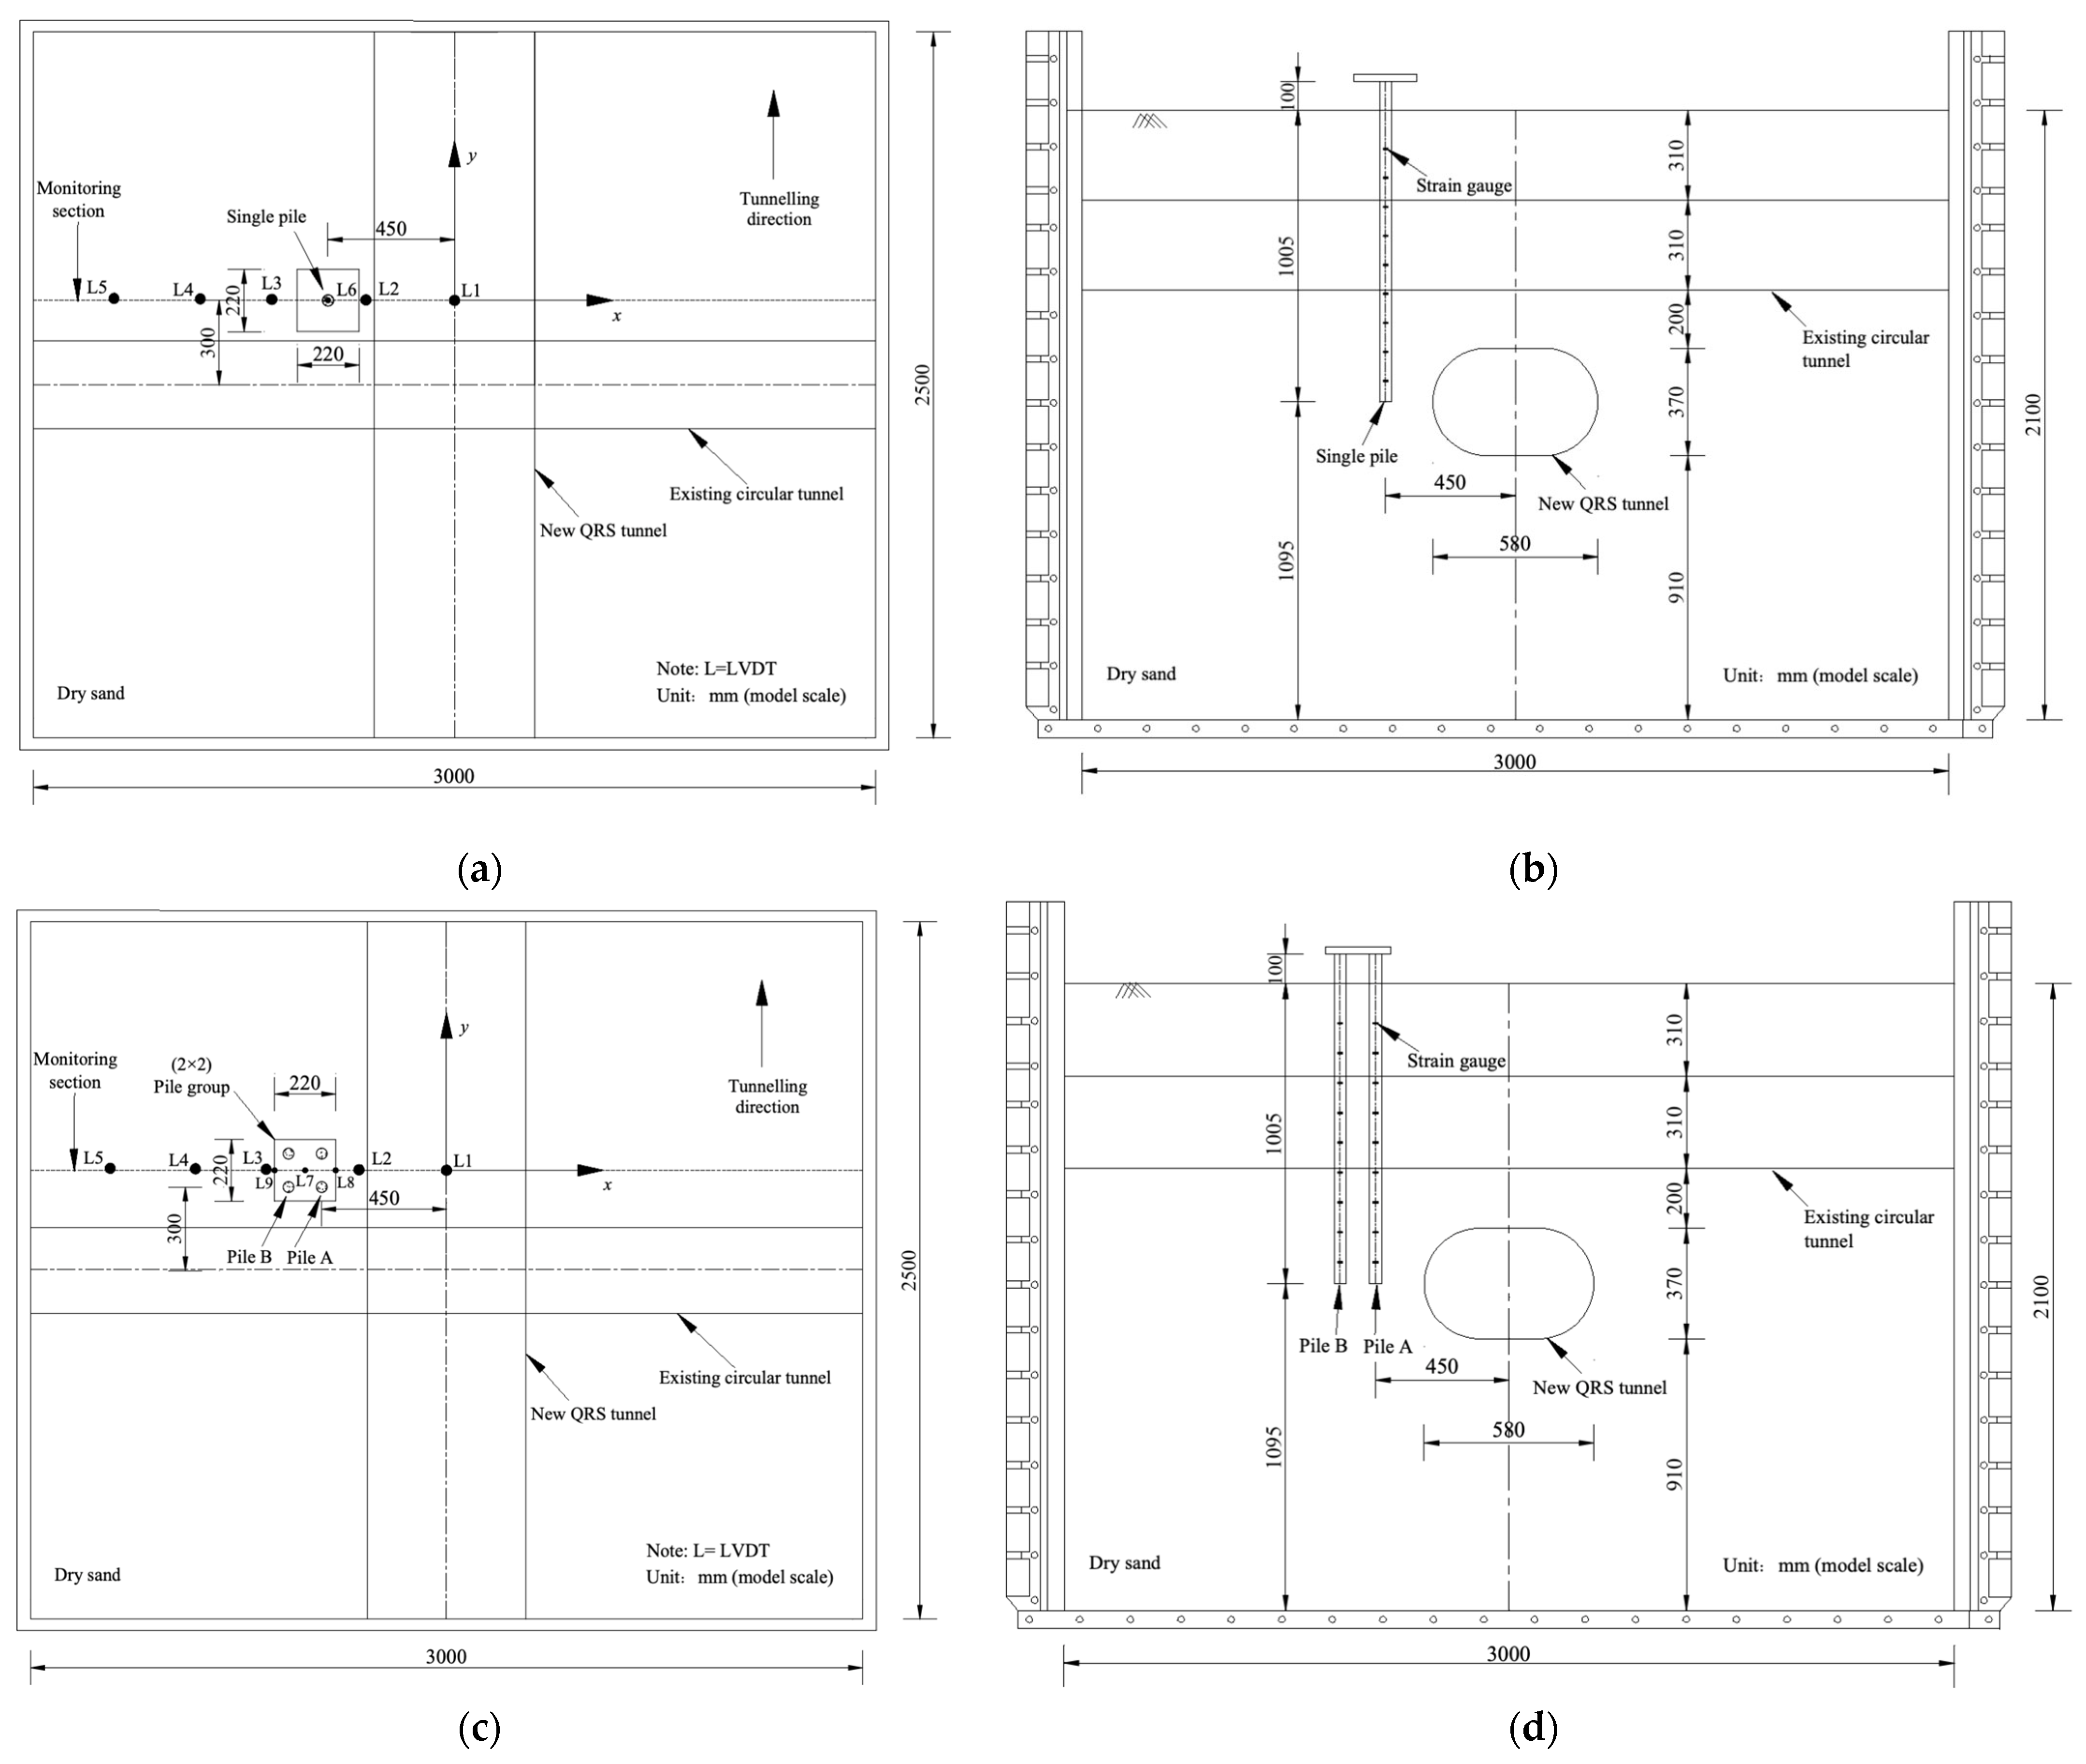
Table 1 lists the test program in the 1 g condition conducted in this paper, where T denotes the tunnel, P denotes a single pile, and PG denotes a pile group. Taking TP1 as an example, this test investigated the effect of QRS tunneling orthogonally underpassing an existing circular tunnel on an existing single pile.
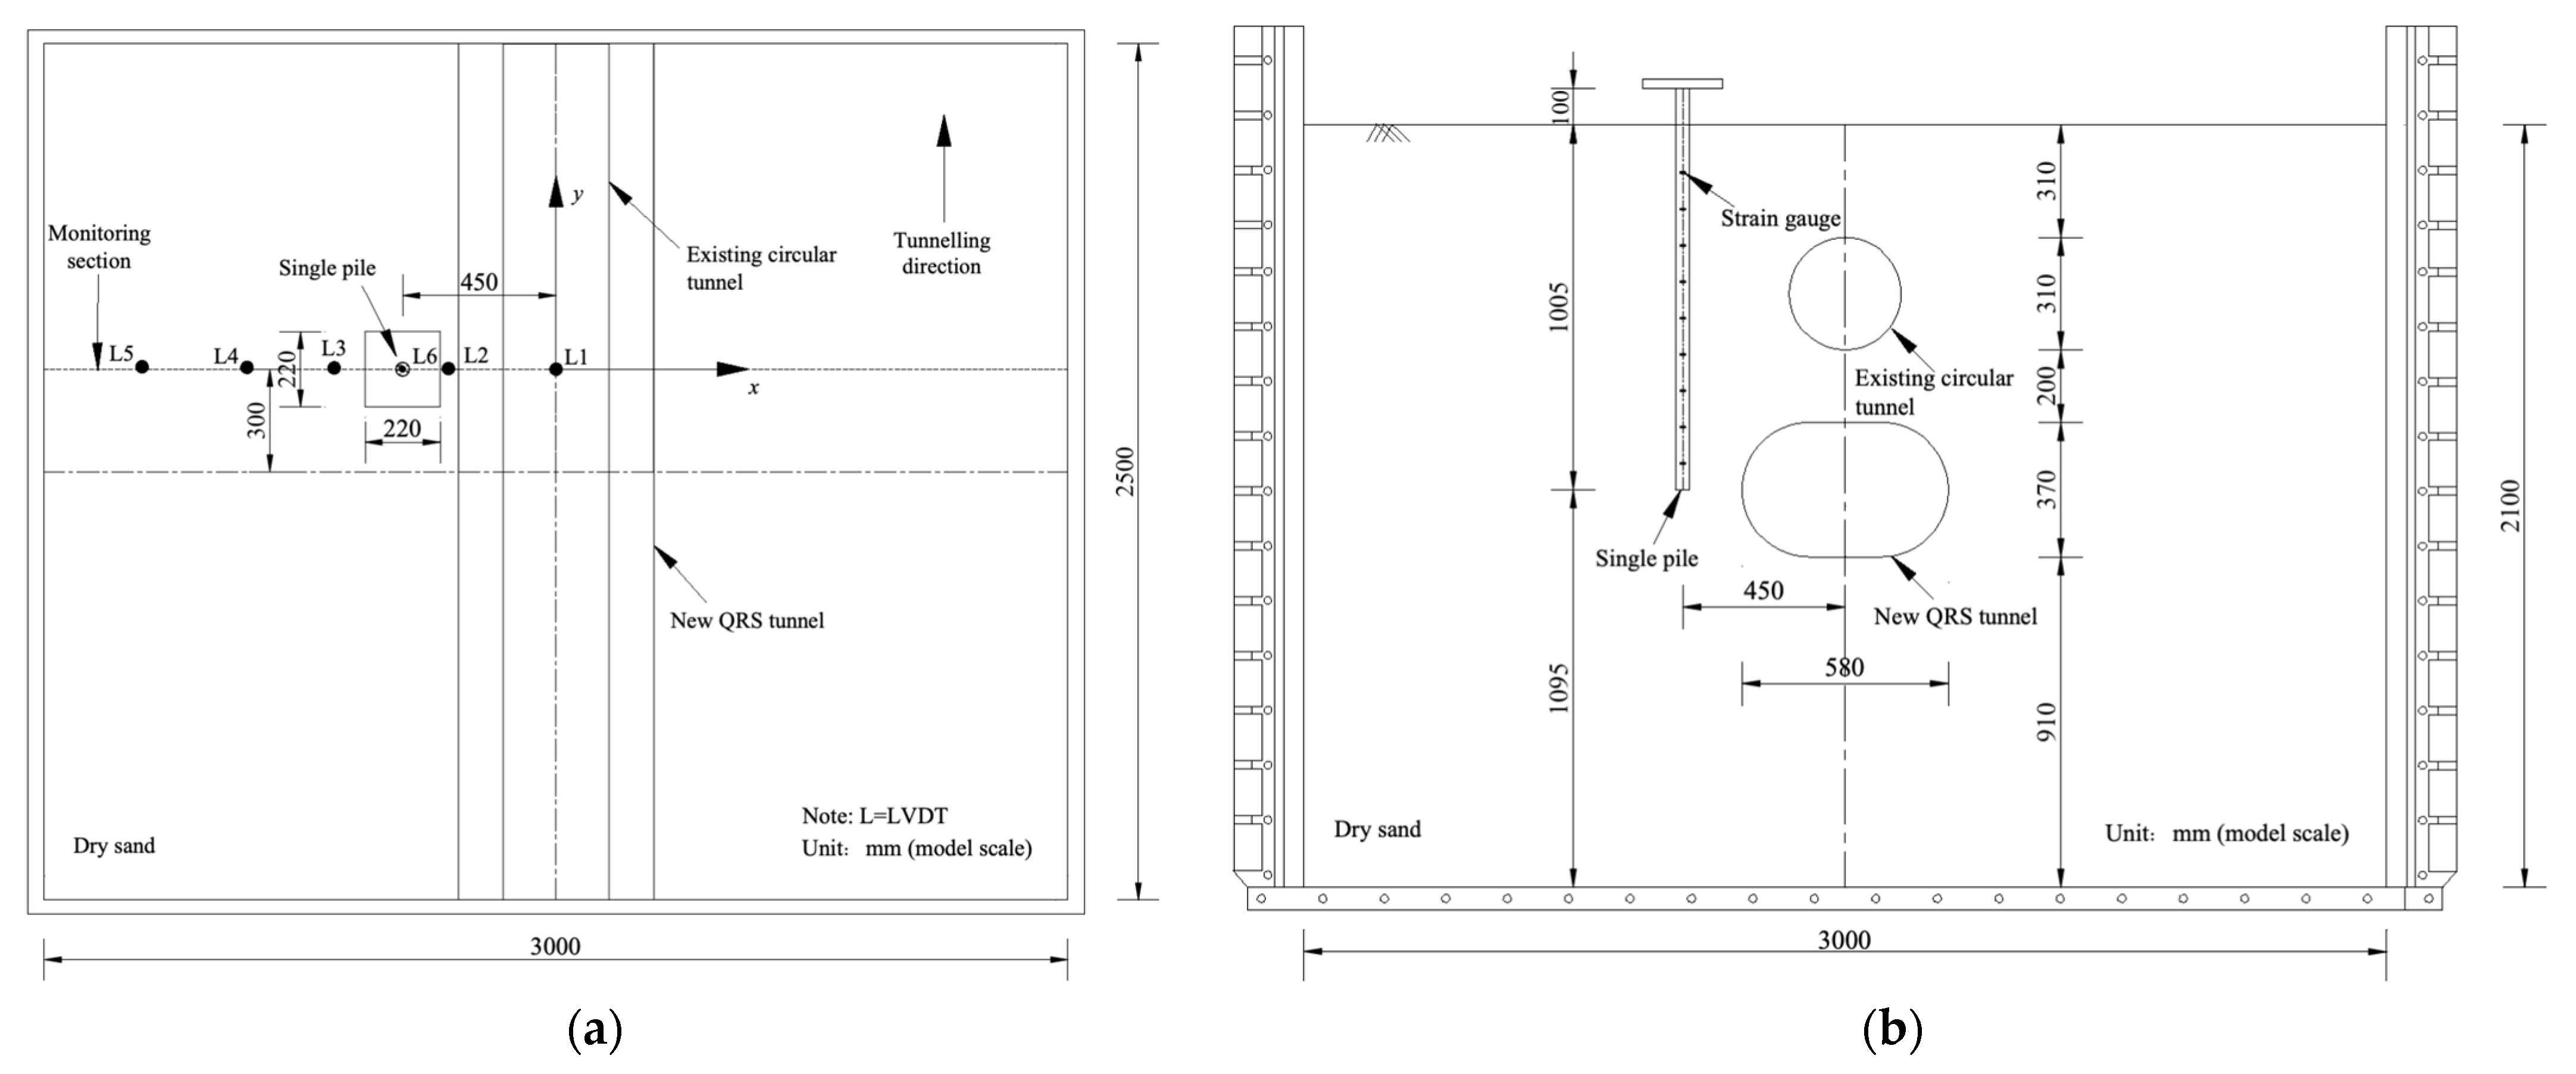
Figure 1 and Figure 2 show schematic diagrams of a new QRS tunnel underpassing orthogonally or overlappingly an existing circular tunnel. The vertical clearance between the QRS tunnel and the circular tunnel is 200 mm. For both the single pile and pile group, the distance from pile A in the pile group to the QRS tunnel axis is 450 mm, and the pile bottom is flush with the QRS tunnel axis.

2.2. Test Material

Fine sand was selected as the soil material for this model test. Gui et al. [41] suggested that when the ratio of the average particle size of the soil material to the size of the structural model is less than 1/20, the influence of the particle size effect can be avoided in scaled model tests. Therefore, to eliminate the particle size effect, the sand was dried and sieved using a standard test sieve, and dry sand with a particle size of less than 1 mm was selected for the model test. The physical and mechanical properties of the dry sand are shown in Table 2.

2.3. Model and Instrumentation

2.3.1. Model Box

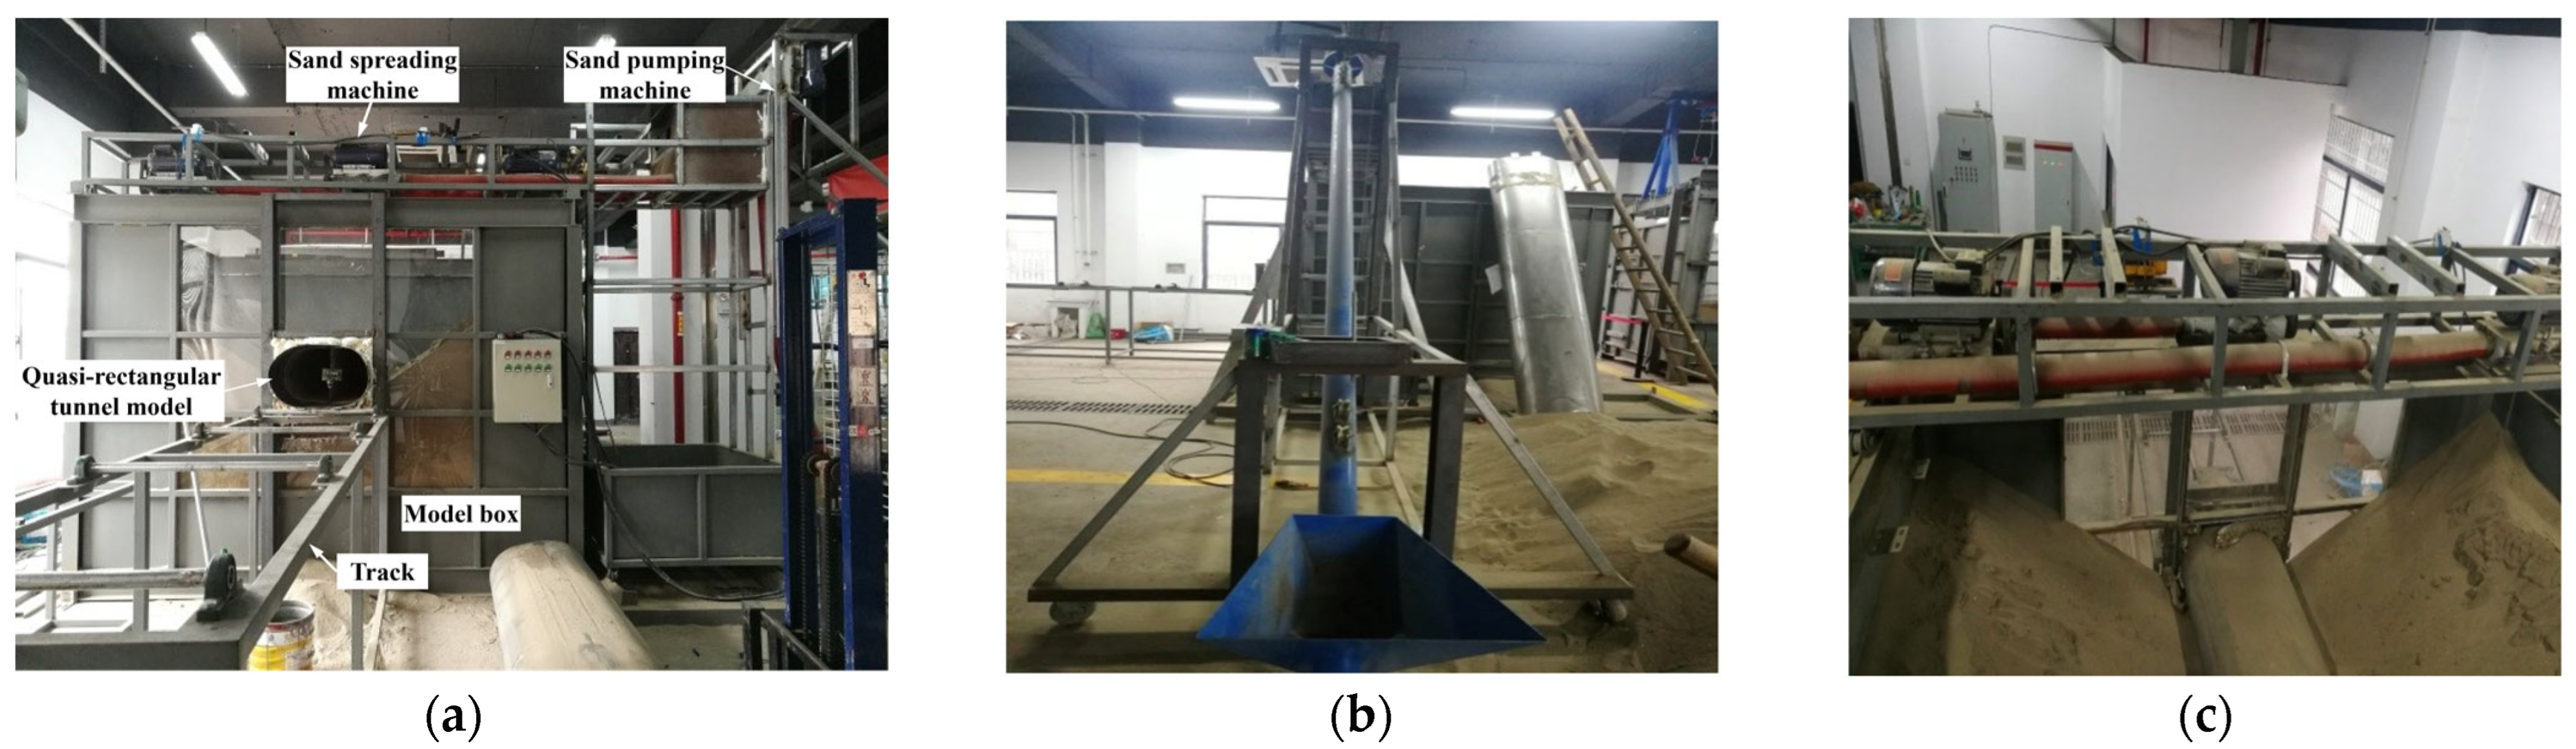
The geometric scale ratio for this test was 1:20, and the net dimensions of the model box were 3 m (length) × 2.5 m (width) × 2.1 m (height), as shown in Figure 3a. To facilitate observation of the soil height and tunnel depth, the front side of the model box was made of organic glass. The bottom of the model box was reinforced with steel plates, while the left, right and rear sides were reinforced with steel plates and square steel pipes. Angle steel was used for reinforcement around the perimeter to ensure the overall rigidity of the model box. A quasi-rectangular opening was provided 1.1 m from the bottom of the model box for installing the QRS tunnel model. A conveying system was installed above the model box, including a sand-pumping machine (Figure 3b) and a sand-spreading machine (Figure 3c). The sand-pumping machine, with a pipe diameter of 120 mm and a total length of 6 m, was mainly used to transport dry sand to a temporary sand box for subsequent loading into the model box. The sand-spreading machine was erected on the left and right sides of the top of the model box via a truss structure and spreads sand evenly by moving along a chute.

2.3.2. Model Tunnels

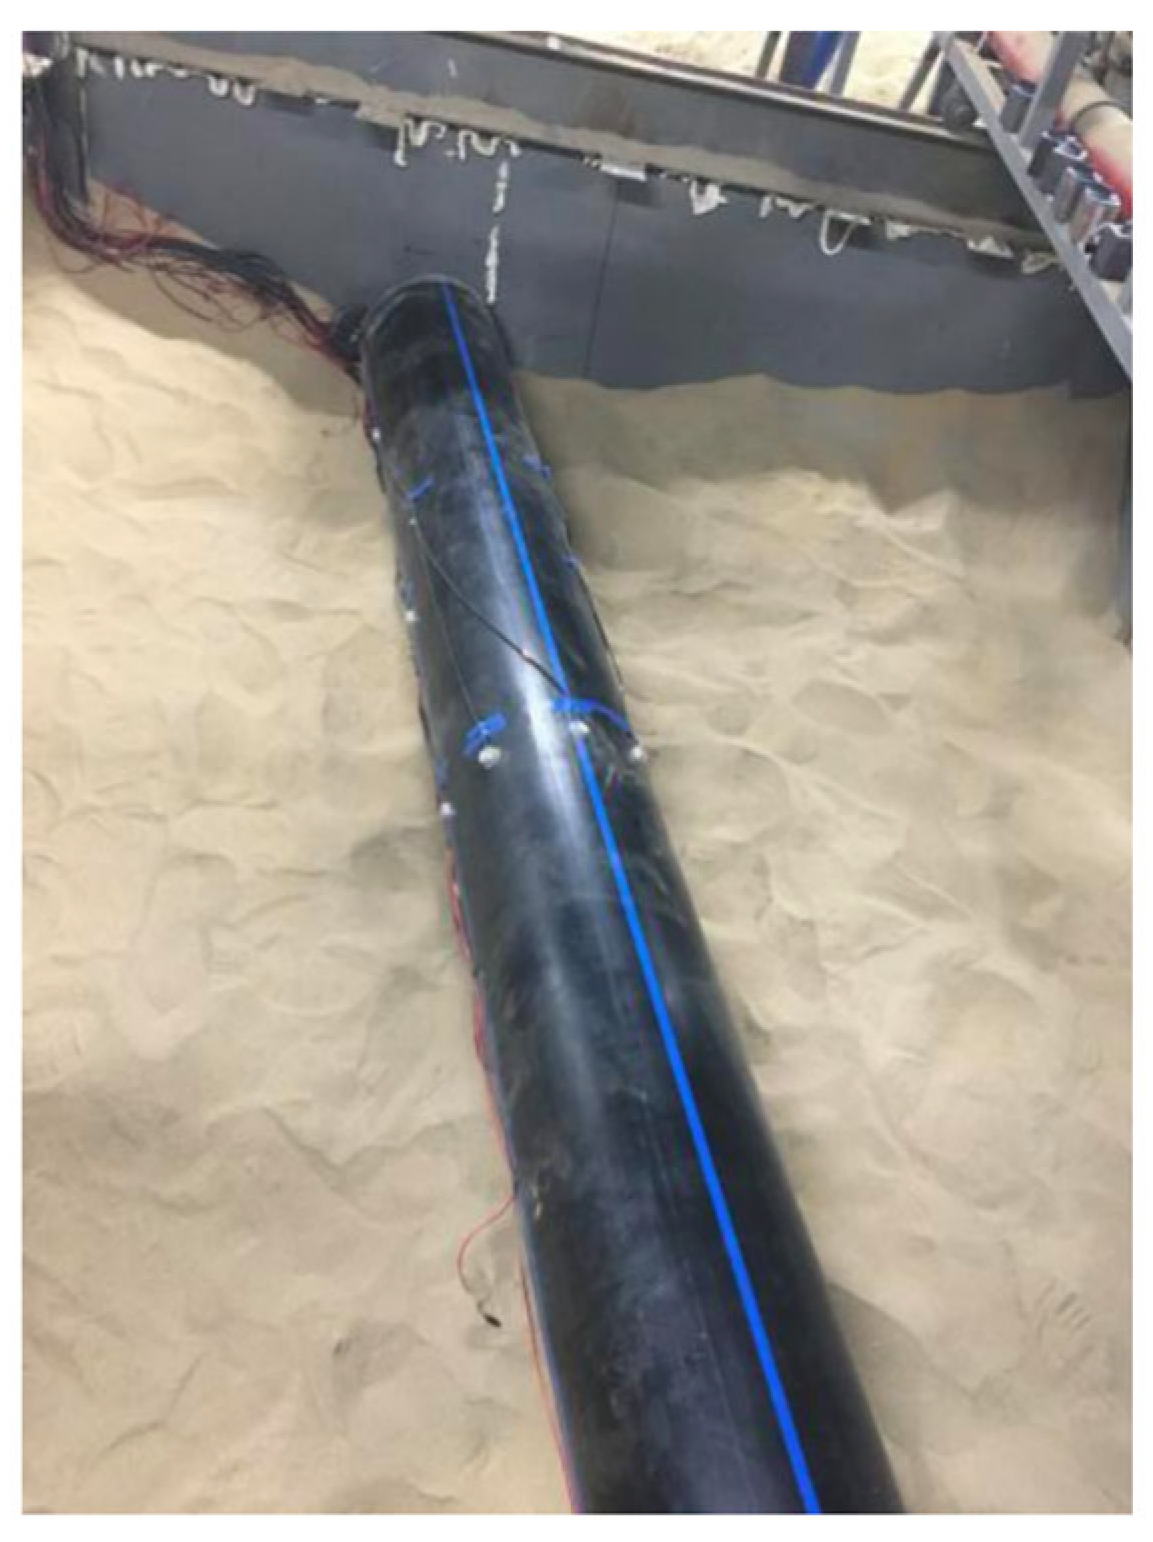
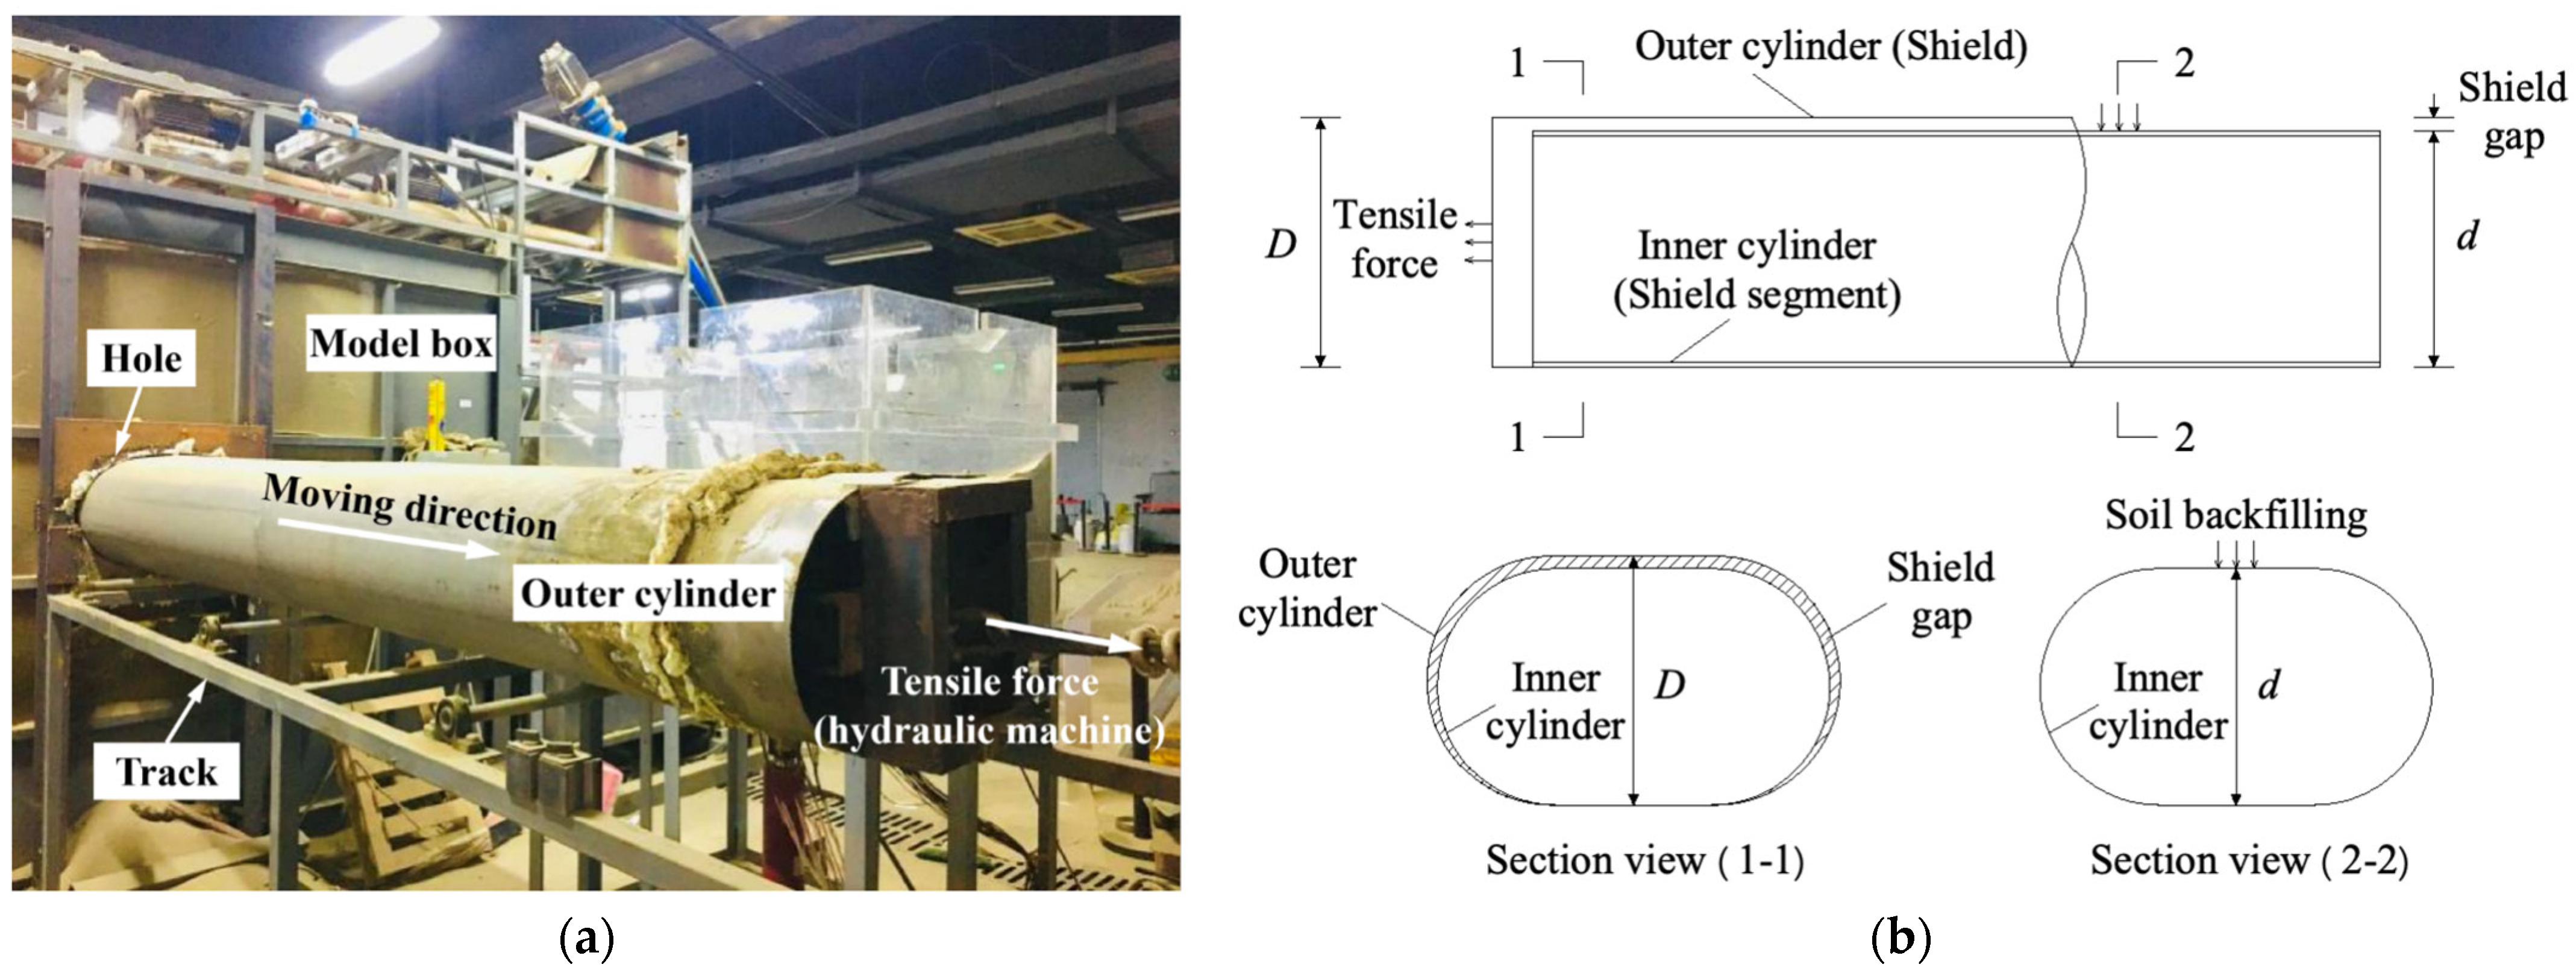
Taking the QRS tunnel in the Ningbo Metro Line 3 Project as the engineering background, the cross-sectional width and height of the QRS tunnel were 11.83 m and 7.26 m, respectively. An adjacent circular tunnel existed, with a diameter of 6.2 m. In order to reflect the main effects of tunneling, the soil volume loss was used as the control parameter to simulate tunnel excavation, which has become the most commonly used and recognized method [24,25,26,27]. As shown in Figure 4, this study used an outer cylinder to enclose an inner cylinder to simulate the excavation of the QRS tunnel, which was applied by Zhao et al. [42]. The outer cylinder represented the shield machine, and the inner cylinder represented the shield segment. The outer cylinder was pulled outward by a hydraulic press to simulate shield construction, with a maximum tensile force of 100 kN. The vertical diameters of the outer cylinder and the inner cylinder were D and d, respectively. The gap between the inner and outer cylinders was regarded as the tunnel volume loss, with a value of 5% in this study. As shown in Figure 5, the existing circular tunnel model was simulated using a polyethylene pipe with an outer diameter of 315 mm, a wall thickness of 18.7 mm, an elastic modulus of 1.77 GPa, and Poisson’s ratio of 0.45.

2.3.3. Model Piles

A friction pile without a working load was used in this study. The pile body was made of PVC pipe with an outer diameter of 40 mm (dp) and an embedment depth of 1005 mm (Lp), simulating a prototype pile with a diameter of 0.8 m and a length of 20.1 m. The pile spacing of the 2 × 2 pile group was 120 mm (prototype: 2.4 m), approximately 3 times the pile diameter. The pile cap models for both the single pile and pile group were made of organic glass plates measuring 220 mm (length) × 220 mm (width) × 25 mm (height), with the bottom of the pile cap being 100 mm higher than the ground surface. PVC pipes were used to provide a consistent elastic modulus, allowing this study to focus on the primary load-transfer mechanism.

2.3.4. Instrumentation

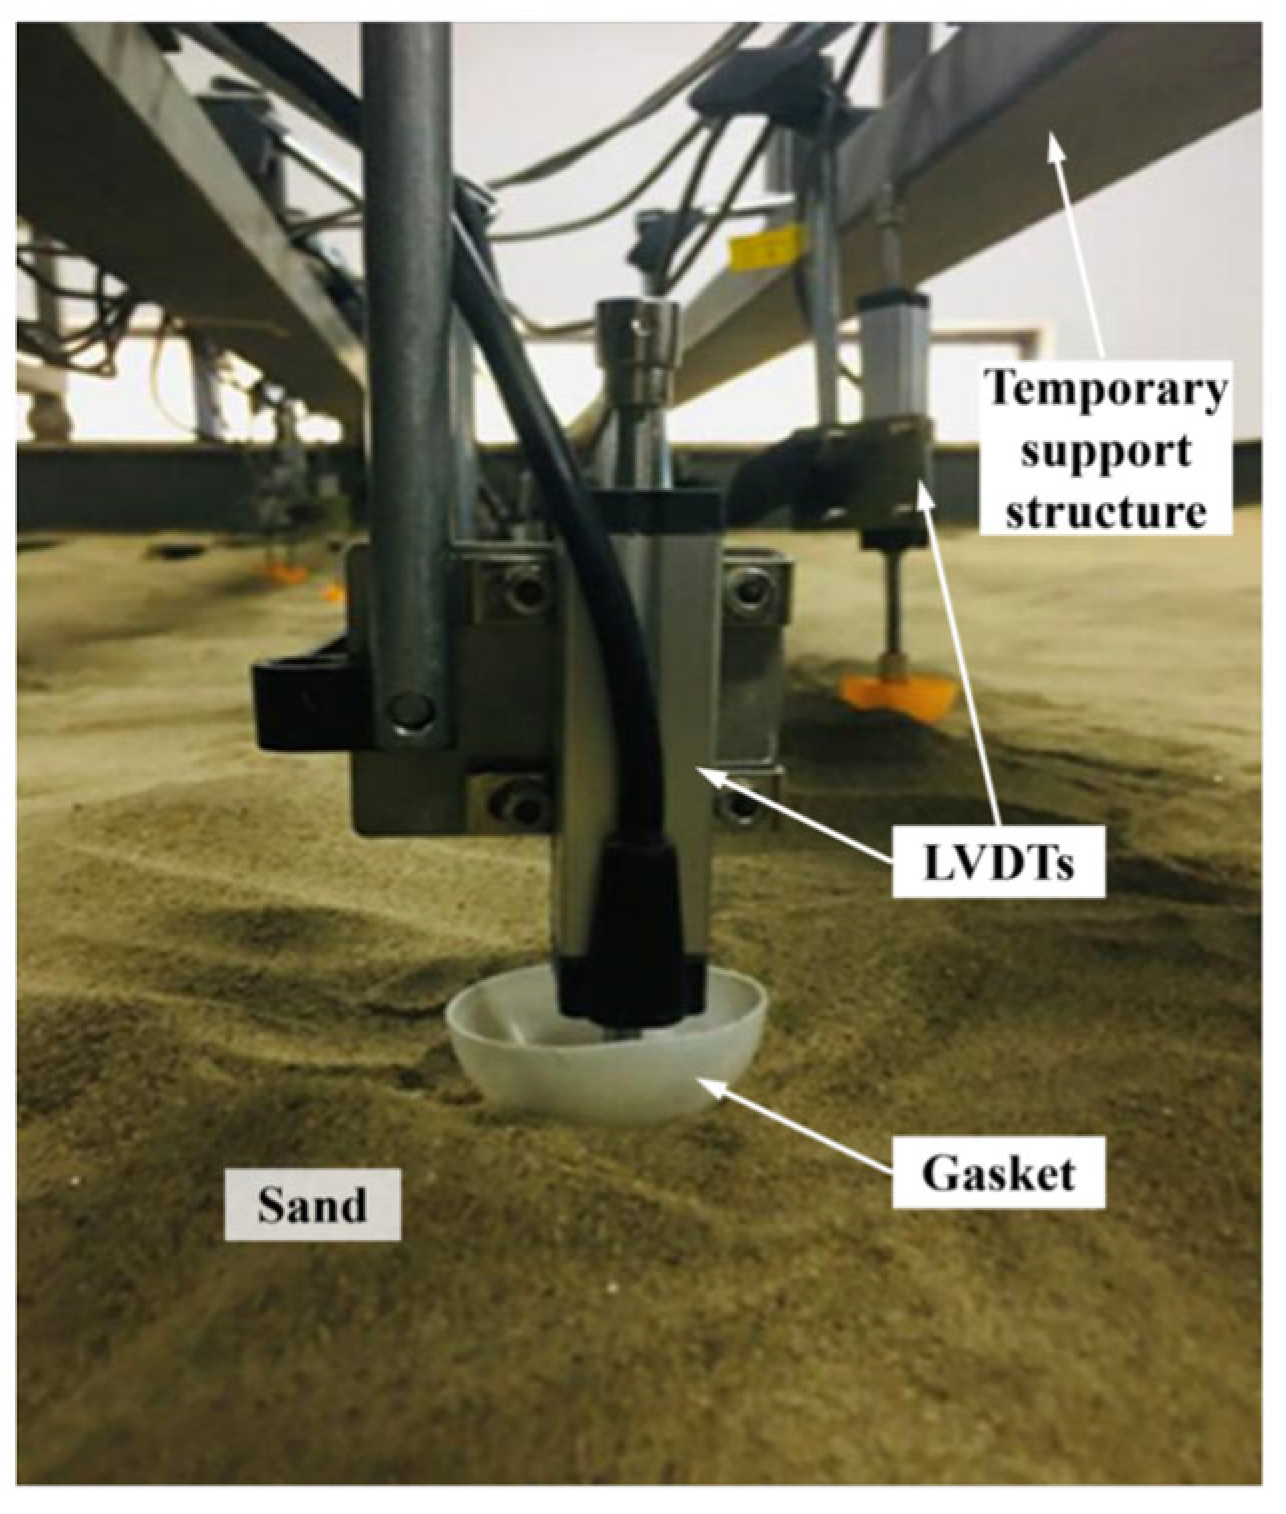
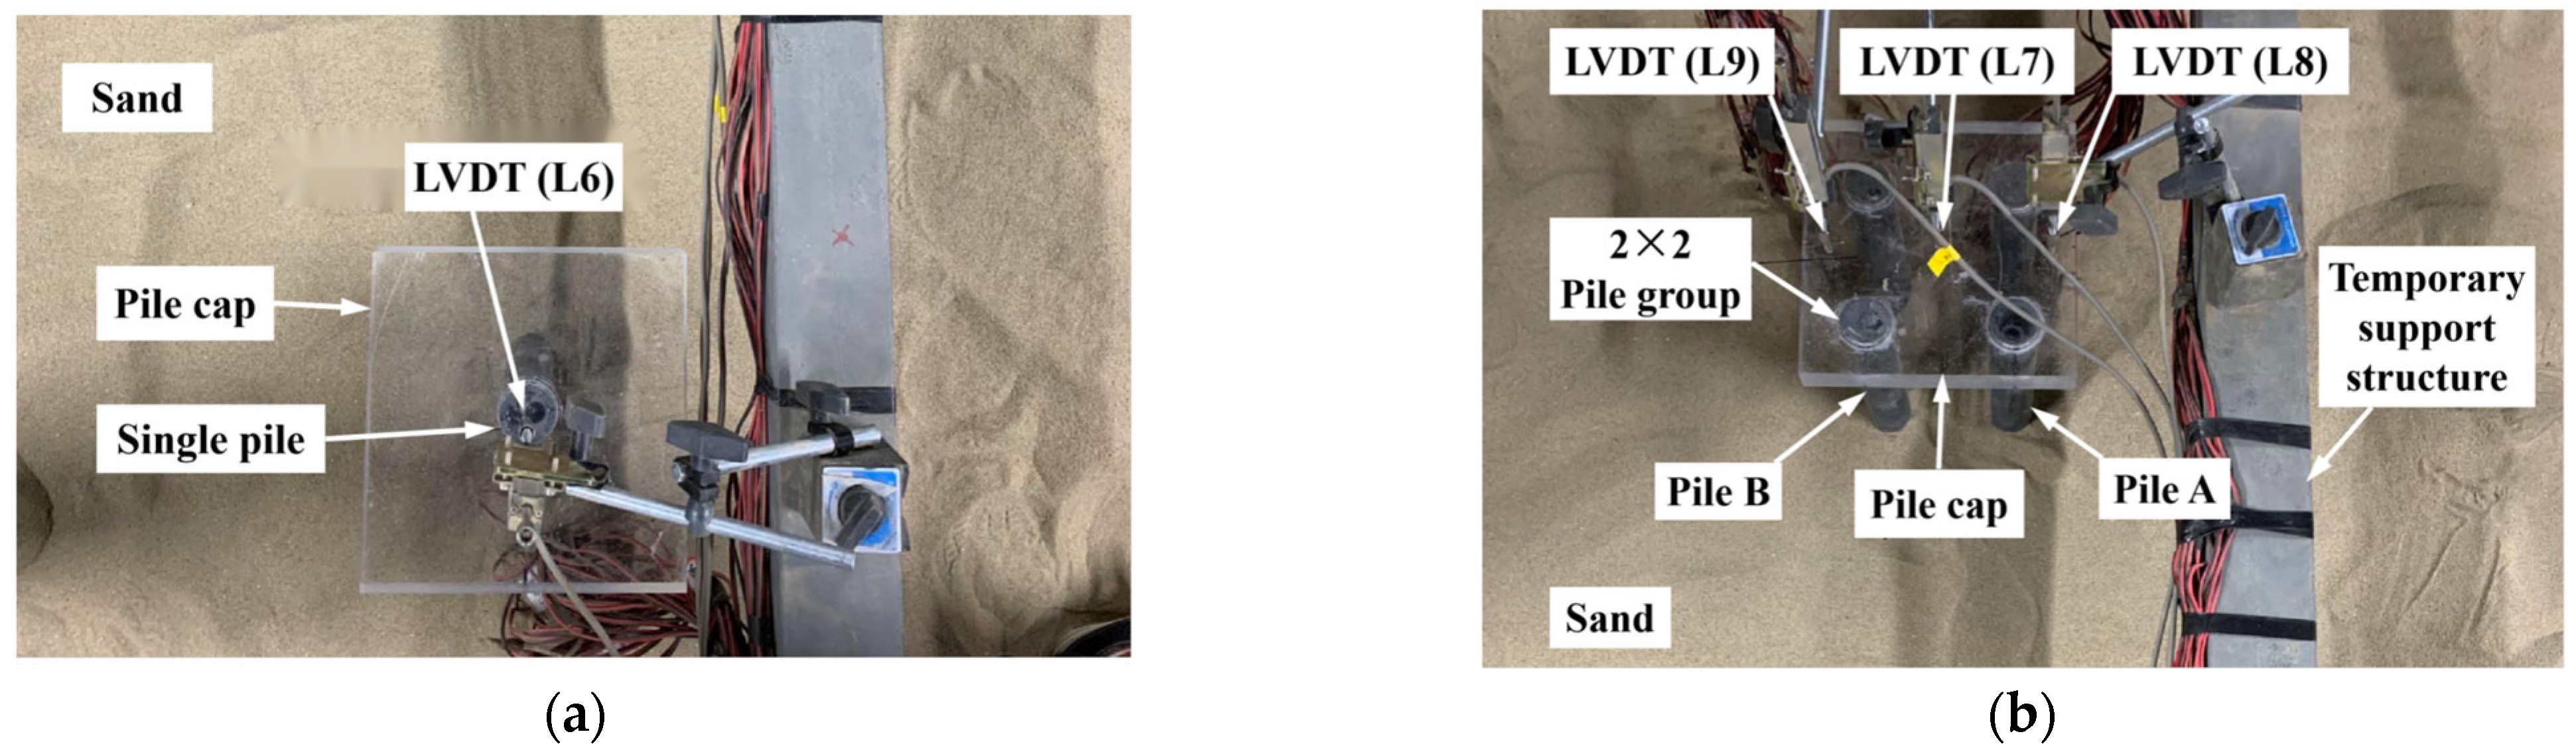
LVDTs were used to measure the ground surface settlement, pile settlement, and pile group tilting. As shown in Figure 6, LVDTs for ground surface settlement measurement were fixed to a temporary support structure, and the bottom was in contact with the gasket on the ground surface. Measuring points L1 to L5 were evenly arranged along the monitoring section, with L1 located directly above the QRS tunnel (Figure 1a). As shown in Figure 7a, the LVDT for pile settlement measurement was located at the center of the pile cap, with L6 as the measuring point for single-pile settlement and L7 as the measuring point for pile group settlement. As shown in Figure 7b, the LVDTs for pile group tilting measurement were located at two edges of the pile cap, and the tilting could be obtained by the ratio of the differential settlements measured by L8 and L9 to the distance between them.
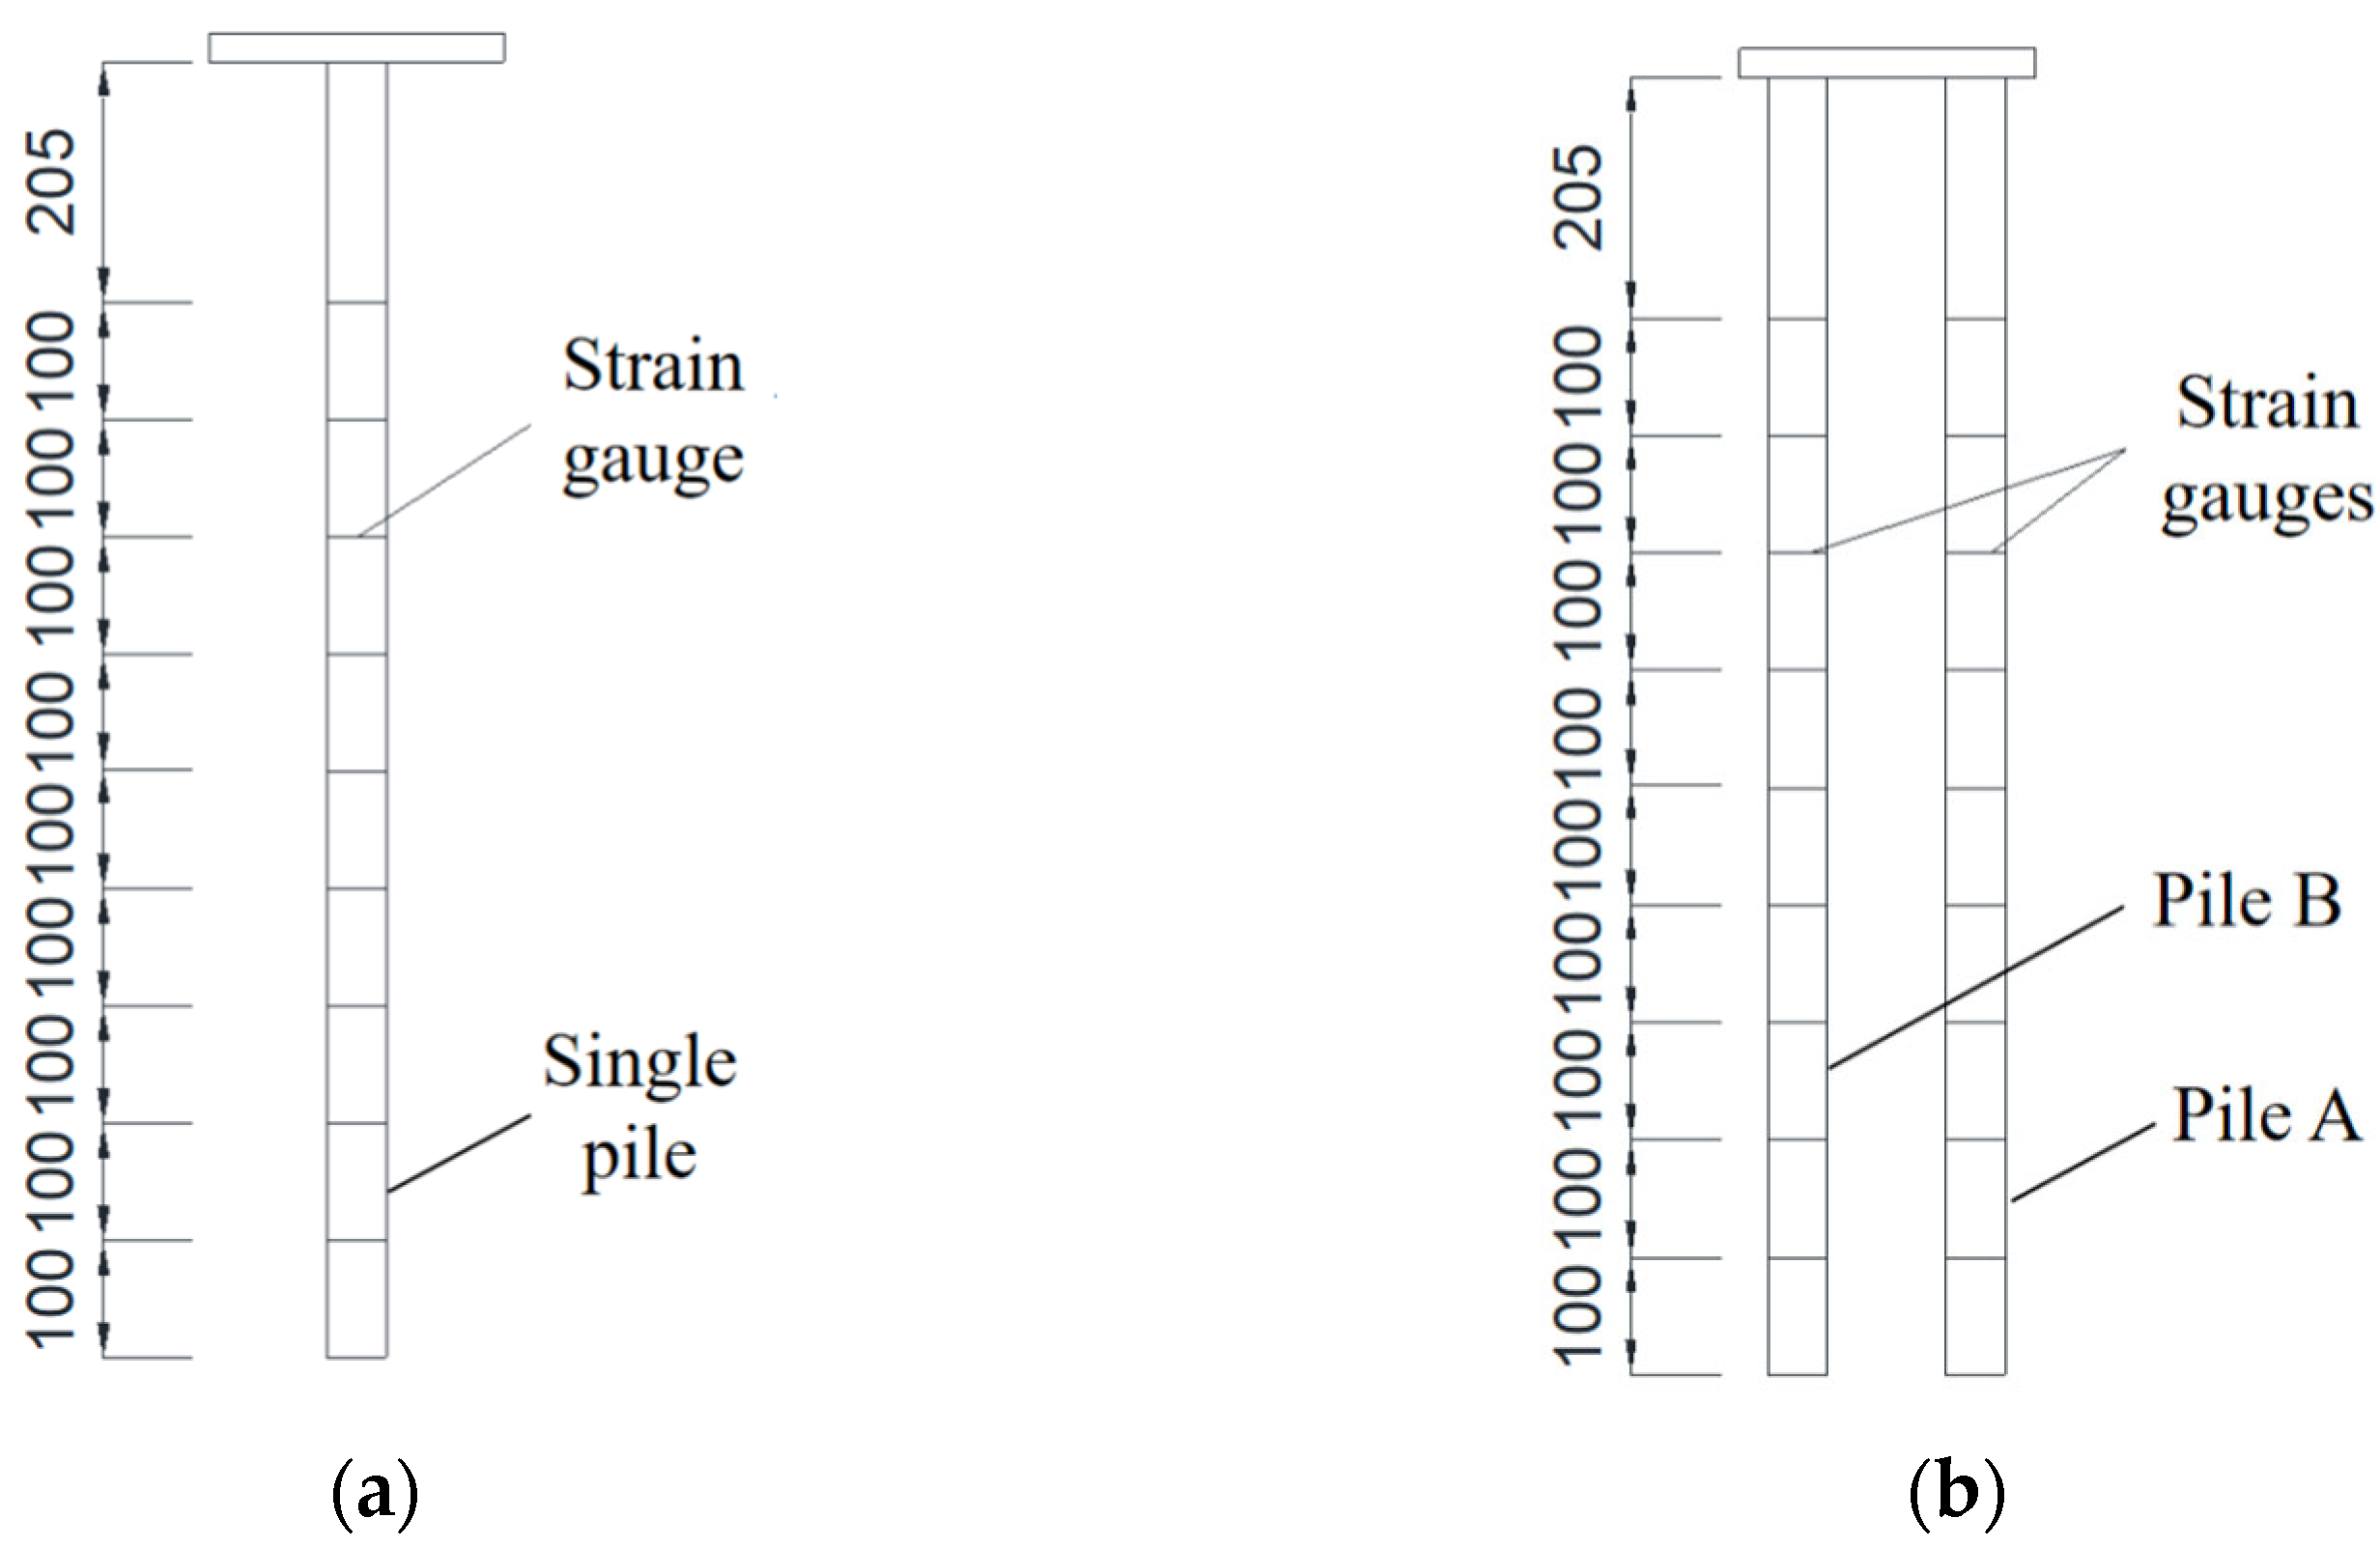
The axial force and bending moment of the pile were measured using a DH3816N static resistance strain gauge. In the test, BX120-3AA type resistance strain gauges, with a resistance value of 120 Ω, sensitivity coefficient of 2.0 ± 1%, and wire grid size of 3 mm × 2.2 mm, were attached to 10 equidistant sections in the pile and connected using a Wheatstone bridge arrangement, as shown in Figure 8. The LVDTs used in this study had an accuracy of ±0.1 mm. The strain gauges (BX120-3AA; resistance: 120 Ω; sensitivity coefficient: 2.0 ± 1%) were calibrated prior to installation. The measured strains were converted into axial force and bending moment using the standard formulas based on the Wheatstone bridge arrangement. Parallel tests were conducted for each case, and the data scatter was within an acceptable range (less than 5%), indicating the good repeatability of the experimental results.

2.4. Test Procedure

The tests were carried out in the following steps:
(1)
Turn on the sand-pumping machine and transport the sand to a temporary box. Turn on the sand-spreading machine and spread the sand into the model box. Compact the sand every 100 mm with wooden boards until the sand reaches a height of 1.1 m.
(2)
Then, push the inner cylinder into the model box on the track, and place the outer cylinder on the track. Using a hydraulic machine, steel ropes, and a gantry frame, fit the outer cylinder around the inner cylinder to form a QRS tunnel model.
(3)
Adjust the QRS tunnel model to the designed position and secure it to the vertical supports with high-strength bolts. Seal the gaps at both ends of the tunnel model and the opening in the model box with foam adhesive. Let it stand for one day to allow the foam adhesive to stabilize before continuing to spread sand.
(4)
When the sand is spread to the pile toe, use the baseline to erect the pile at the marked location and spread 50 mm of sand to fix the pile, continuing to spread sand until the filling height reaches the bottom of the existing circular tunnel arch. Then, place the existing circular tunnel in the design position, and spread sand to the design height.
(5)
Install the LVDTs and connect all wires to the terminals of the strain gauge and the computer. Then, open the data acquisition and analysis system software and perform the initial settings for sensitivity and other relevant parameters.
(6)
Start the hydraulic machine to apply tensile force to the outer cylinder so that it is pulled out at a uniform speed of 60 mm/s, simulating the segmented excavation of the QRS tunnel. The computer automatically reads data every 3 s until the excavation is completed.

3. Test Results

3.1. The Effects of QRS Tunnel Excavation on an Existing Single Pile

3.1.1. Ground Surface Settlement

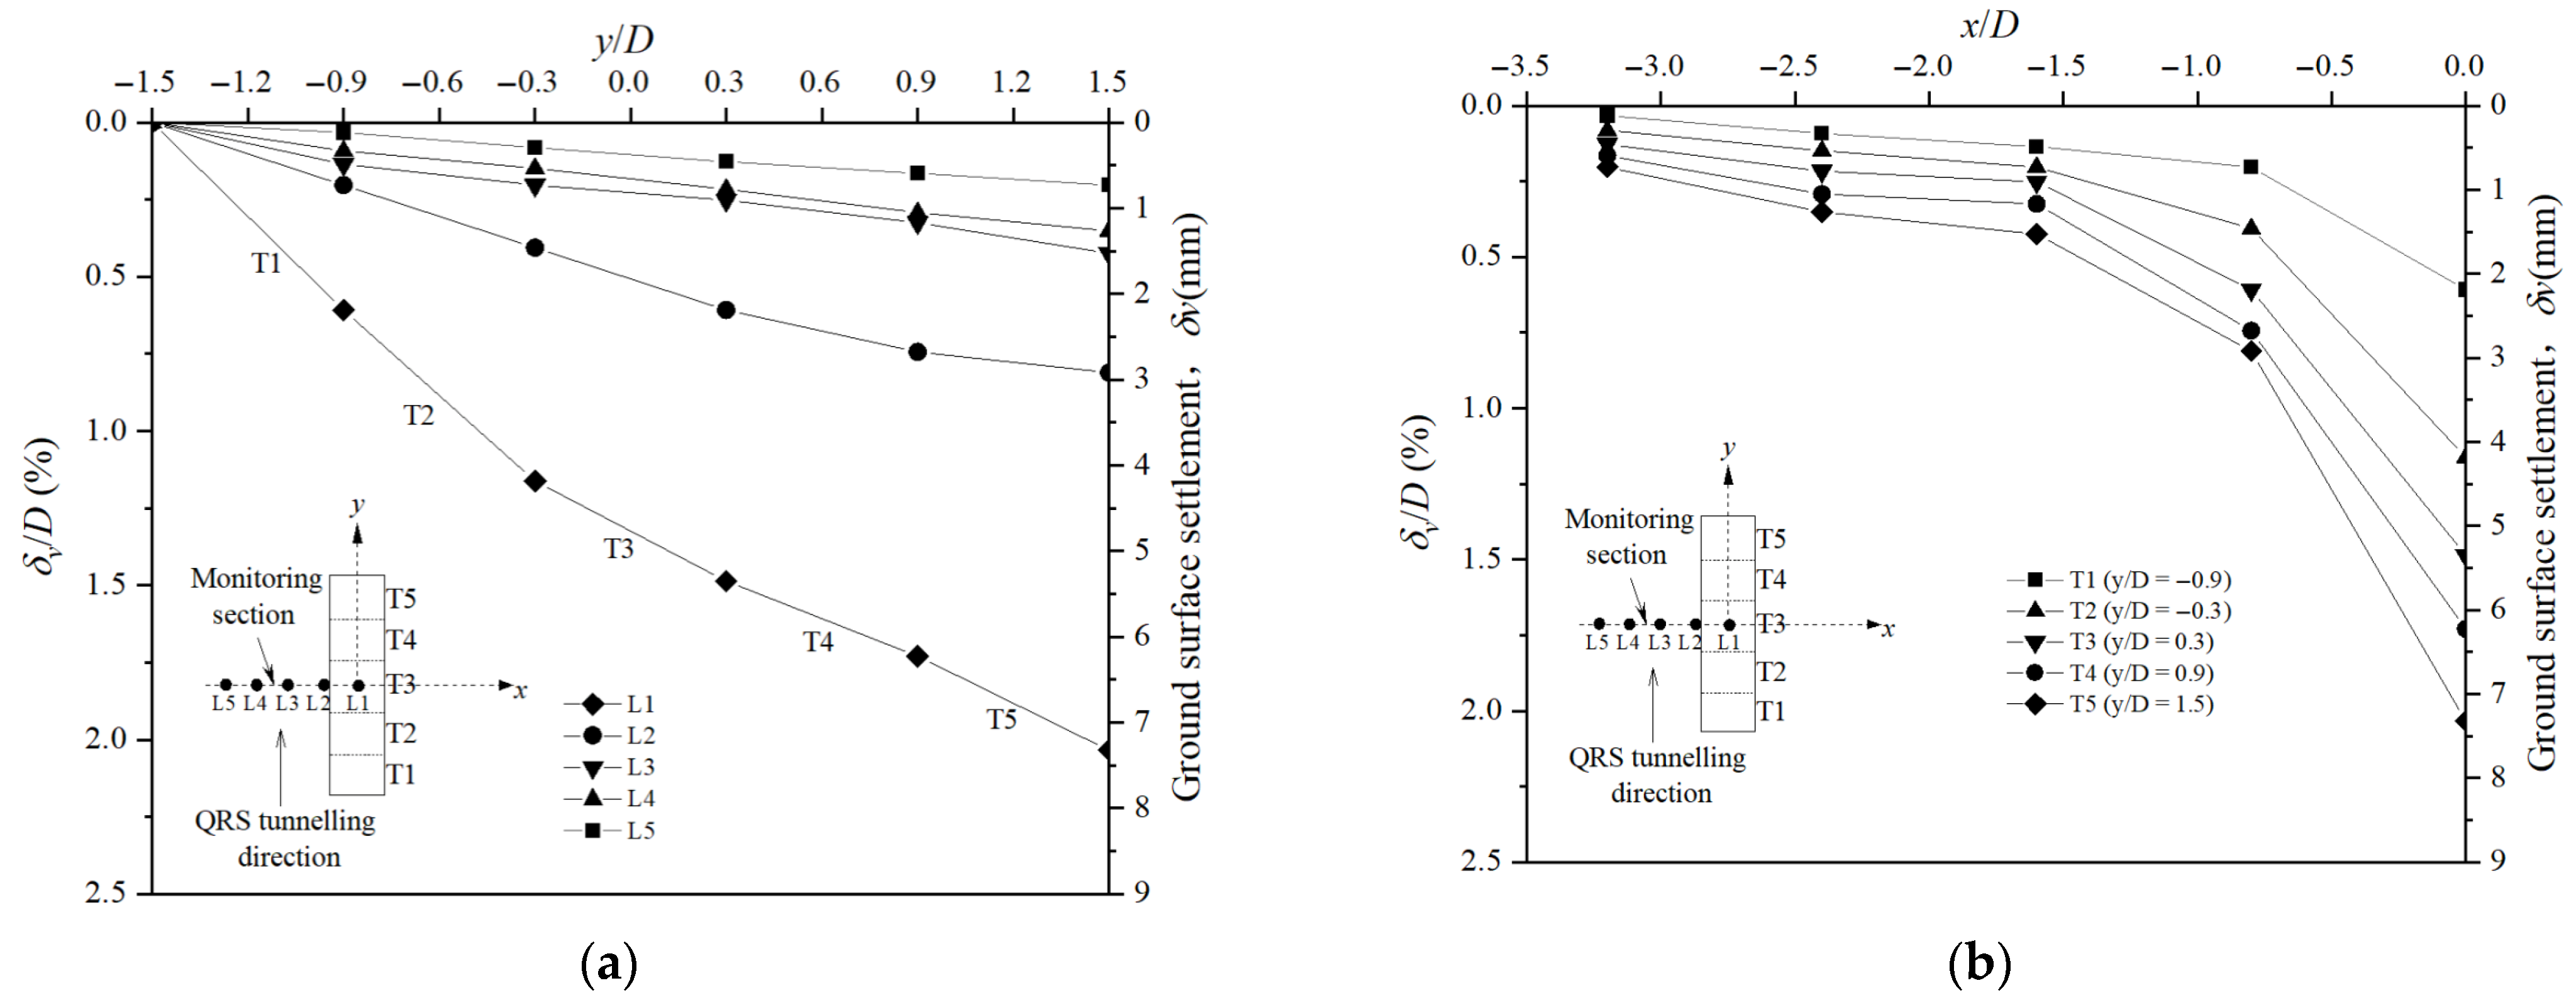
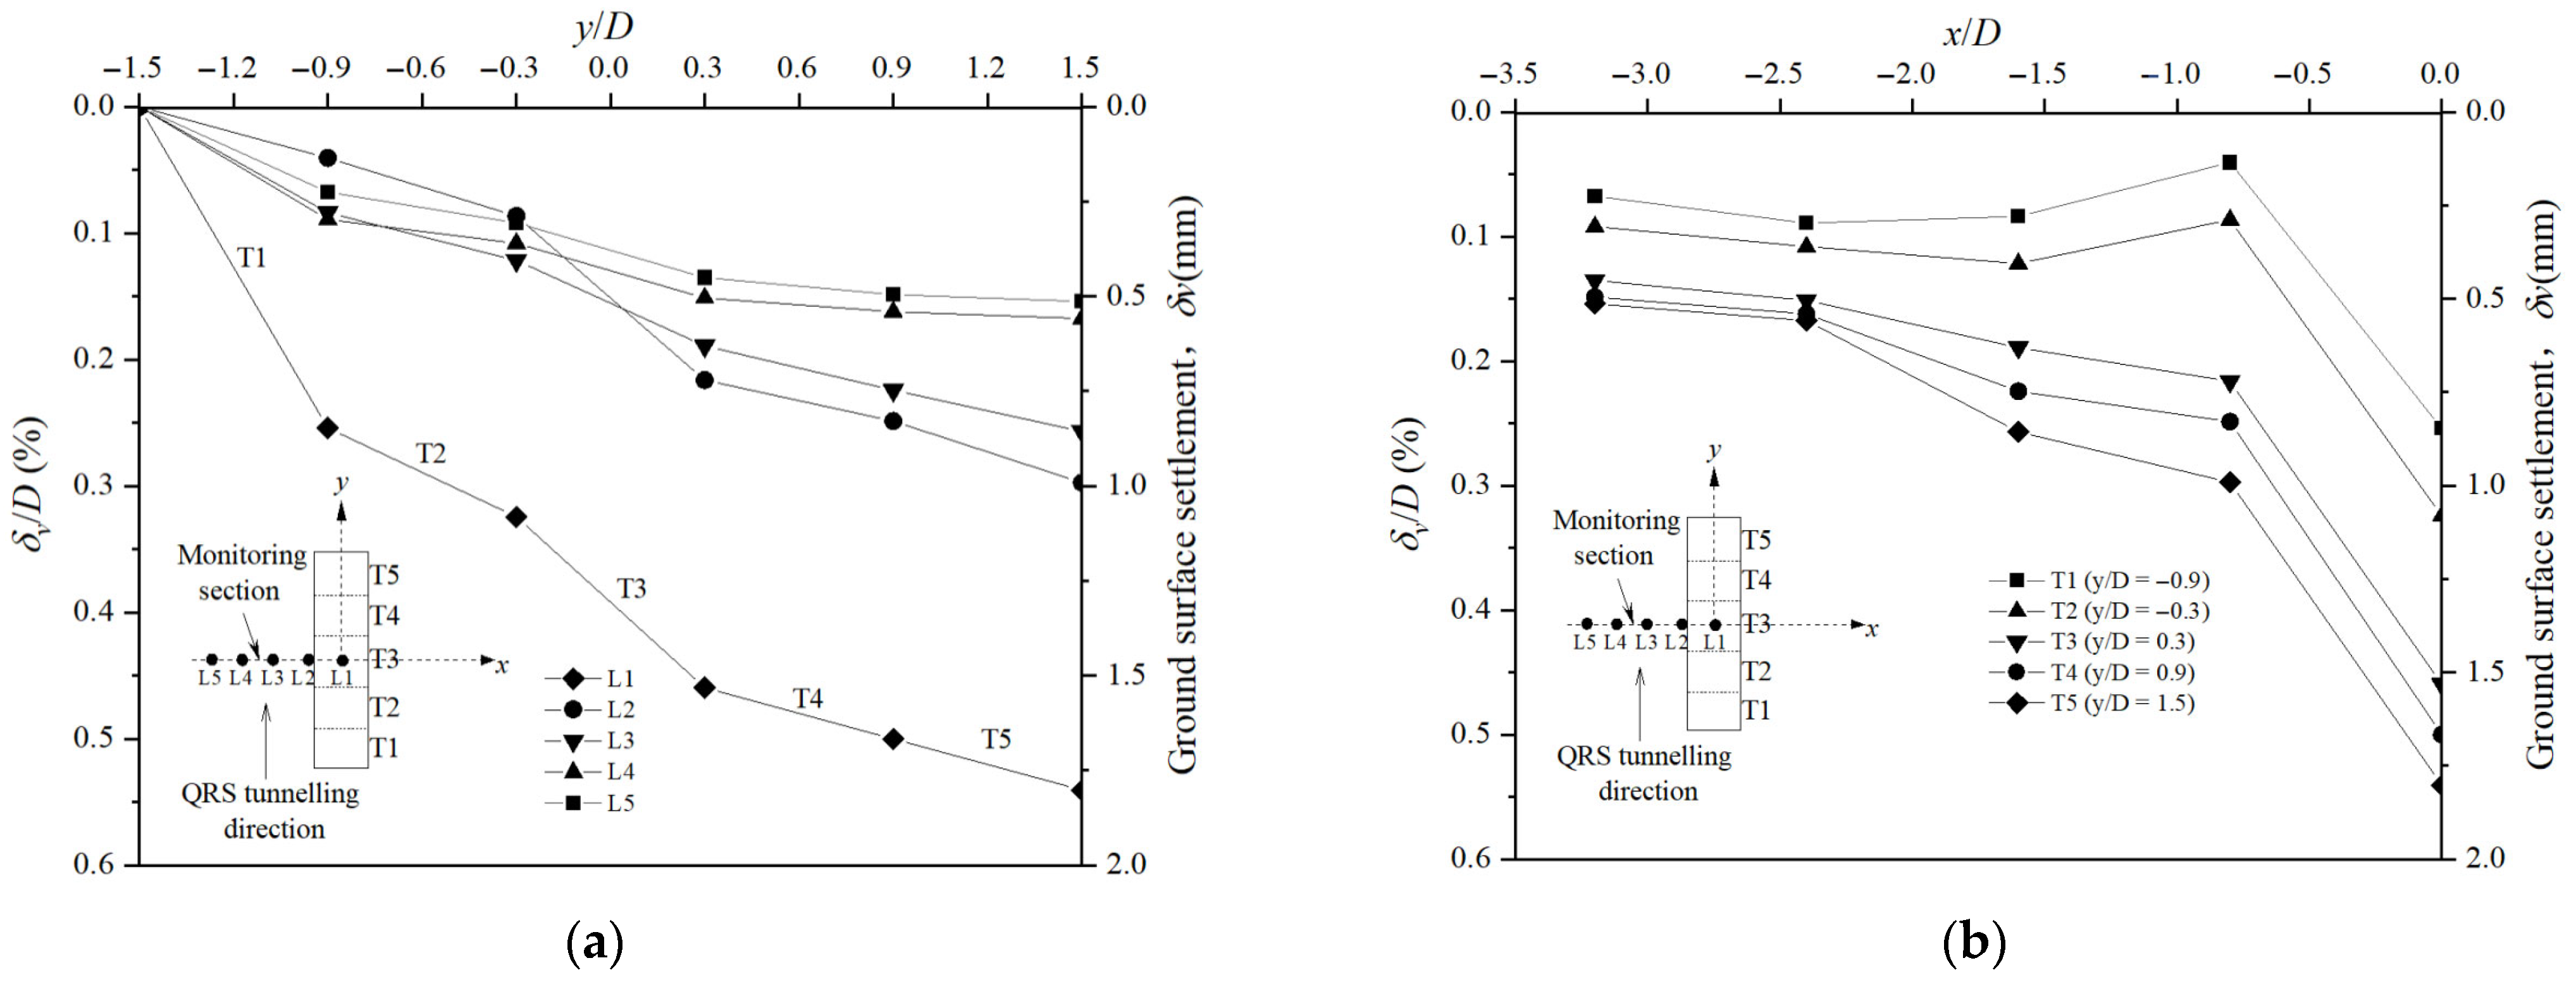
Figure 9 and Figure 10 show the ground surface settlement caused by QRS tunneling in tests TP1 and TP2, respectively. In the figures, x represents the horizontal distance from the tunnel axis, and y represents the horizontal distance from the tunnel face to the centerline of the pile. Since the tests were conducted in dry, free-draining sand, the settlements discussed in this section represent immediate elastic–plastic deformations of the granular skeleton and do not include consolidation or creep components. Both the measured ground surface settlement ( δ υ ) and the distance y were normalized by the QRS tunnel diameter (D). For consistency, this paper defines the tunnel excavation into five stages based on the y/D values, where y/D = −1.5 to −0.9 is stage T1, y/D = −0.9 to −0.3 is stage T2, y/D = −0.3 to 0.3 is stage T3, y/D = 0.3 to 0.9 is stage T4, and y/D = 0.9 to 1.5 is stage T5. It is evident that significant ground surface settlement was caused by the excavation of the QRS tunnel, and the settlement at different monitoring points increased with varying levels as the excavation length increased.
As shown in Figure 9a, taking L1 as an example, it is indicated that the ground surface settlement was small in the initial stage T1, with a value of 0.15%D. As the tunnel was excavated, the ground surface settlement increased to 0.25%D in stage T2. When the tunnel passed through the pile in stage T3, the ground surface settlement increased significantly to 0.46%D and increased to 0.49%D in stage T4. After the tunnel excavation was completed, the maximum ground surface settlement was reached in stage T5, which was about 0.55%D. The cumulative ground surface settlement was about 0.35%D during stages T2–T4, accounting for about 65% of the total settlement. It can be considered that the main longitudinal influence zone of QRS tunneling in the orthogonal underpass case on ground surface settlement was concentrated within ±0.9D before and after the tunnel face. As shown in Figure 9b, the transverse ground surface settlement troughs caused by different excavation stages exhibited the same distribution pattern. The maximum settlement was directly above the tunnel axis, while the minimum settlement occurred at a position approximately −3D away from the tunnel axis, indicating that the transverse influence zone of QRS tunneling in the orthogonal underpass case was at least ±3D.
As shown in Figure 10a, the ground surface settlement in test TP2 exhibited a similar variation pattern with the tunnel excavation length as in test TP1. Taking L1 as an example, the ground surface settlement occurring in stages T2–T4 accounted for approximately 62% of the total settlement, reaching a maximum of 2.0%D in stage T5. This indicates that the main longitudinal influence zone of QRS tunneling in the overlapping underpass case on ground surface settlement was also concentrated within ±0.9D before and after the tunnel face. However, the cumulative ground surface settlement in test TP2 (2.0%D) was greater than that in test TP1 (0.55%D), which may be due to the influence of the existing circular tunnel. As shown in Figure 10b, the ground surface settlement trough in TP2 showed a similar distribution pattern to that in test TP1. The maximum settlement also occurred directly above the tunnel axis, while the minimum settlement occurred approximately −3D from the tunnel axis, indicating that the lateral influence zone of QRS tunneling in the overlapping underpass case was also ±3D at this point.
Comparing those two underpass cases in tests TP1 and TP2, it can be indicated that the ground surface settlement curves due to QRS tunneling conformed to a normal distribution and exhibited a V-shape. However, the ground surface settlement in the overlapping underpass case was much greater than that in the orthogonal underpass case, with a narrower settlement trough, indicating greater soil disturbance in the overlapping underpass case.
It is worth noting that the present experiments were performed in homogeneous dry sand. In natural ground, soil properties often exhibit spatial variability (e.g., stratified layers [43] and spatial correlation [44]). The 1D settlement and internal force data reported here can serve as reference benchmarks for future studies that adopt neural network-based models or geostatistical methods (e.g., Kriging [45]) to convert limited 1D geological borehole data into 3D spatial distributions of soil parameters.

3.1.2. Pile Settlement

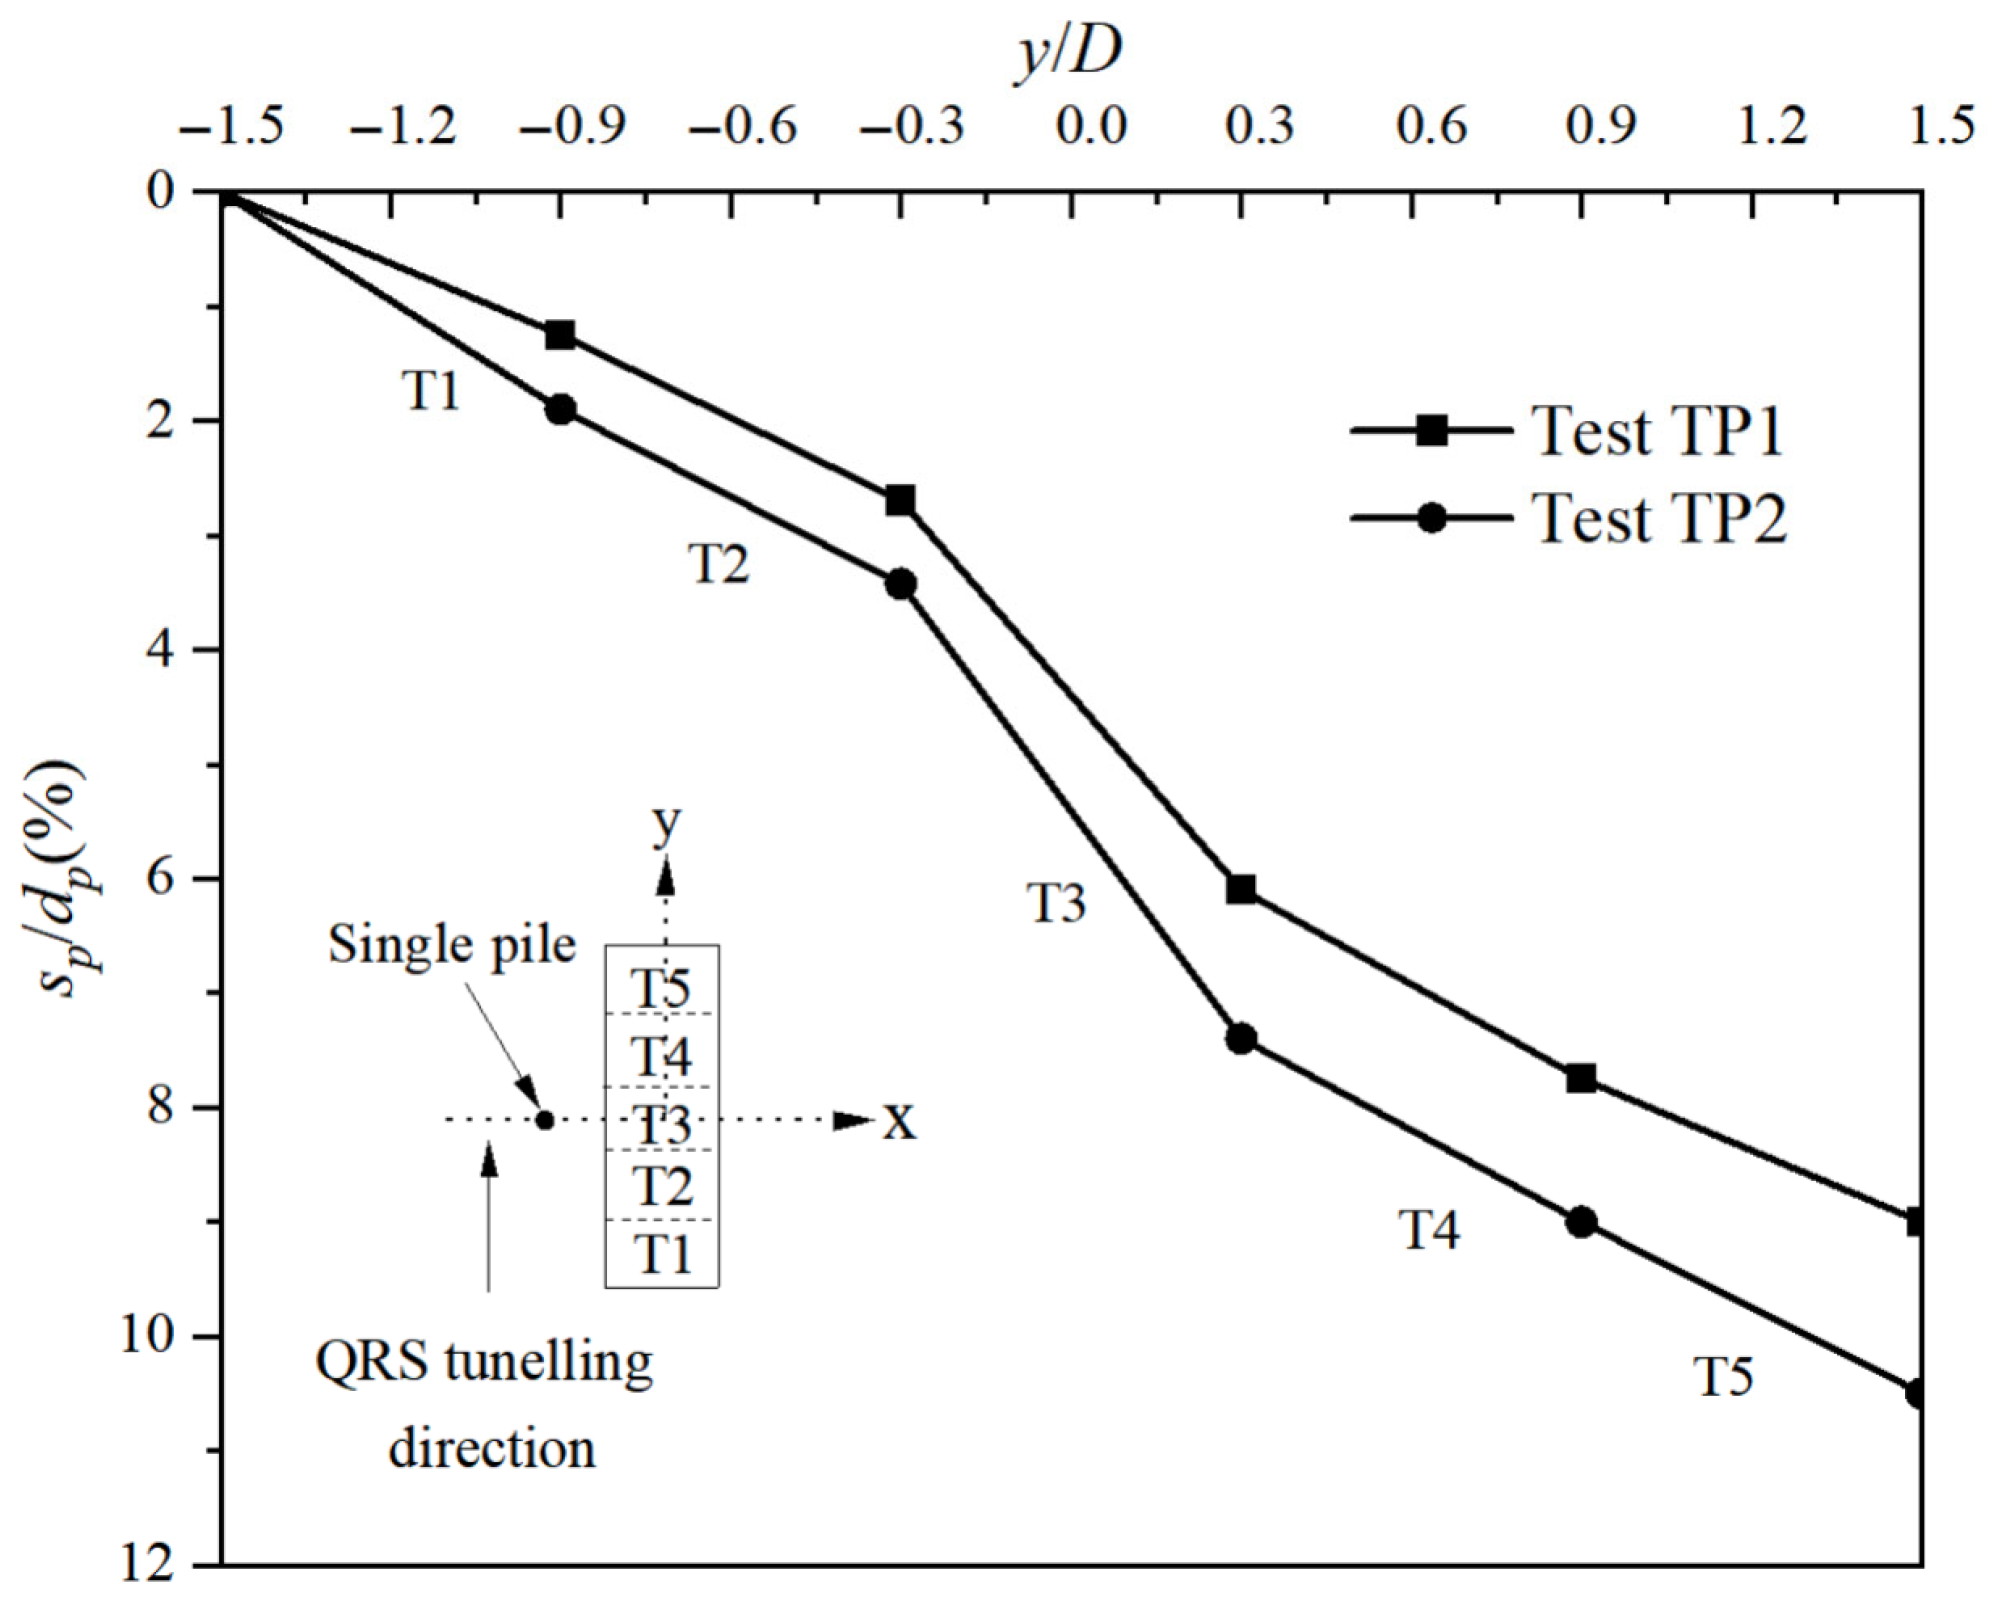
Figure 11 shows the settlement of a single pile caused by QRS tunneling in tests TP1 and TP2. The pile settlement (sp) was normalized by the pile diameter (dp). In test TP1, the single pile experienced settlement of 0.5%dp and 1.8%dp in stages T1 and T2, respectively, due to the soil volume loss. In stage T3, the pile settlement increased sharply to 3.9%dp when the tunnel passed through the pile. As the tunnel continued to excavate further away from the pile, the pile continued to settle, but the rate of increase decreased. The settlement in stages T4 and T5 was 1.3%dp and 1.0%dp, respectively. Finally, a cumulative pile settlement of 8.5%dp was caused by QRS tunneling in test TP1. Comparing the results in tests TP1 and TP2, it can be seen that the single pile settlement in both underpass cases had similar variation patterns. During the excavation stage T3, the pile settlement increased suddenly because the tunnel was closest to the single pile at this time. During the excavation stage with y/D = −0.9~0.9, the pile settlement accounted for about 80% of the total settlement. The main longitudinal influence zone of QRS tunneling in sand on the pile was identified to be between y/D = −0.9 and 0.9, which was basically similar to the conclusion of Lee and Ng [46] that the longitudinal influence zone of the circular tunnel was about ±1.0D, obtained by numerical simulation. In addition, Figure 11 also shows that the cumulative pile settlement in the overlapping and orthogonal underpass cases was 10.2%dp and 8.5%dp, respectively, where the former was about 1.2 times that of the latter.

3.1.3. Axial Forces Along the Single Pile

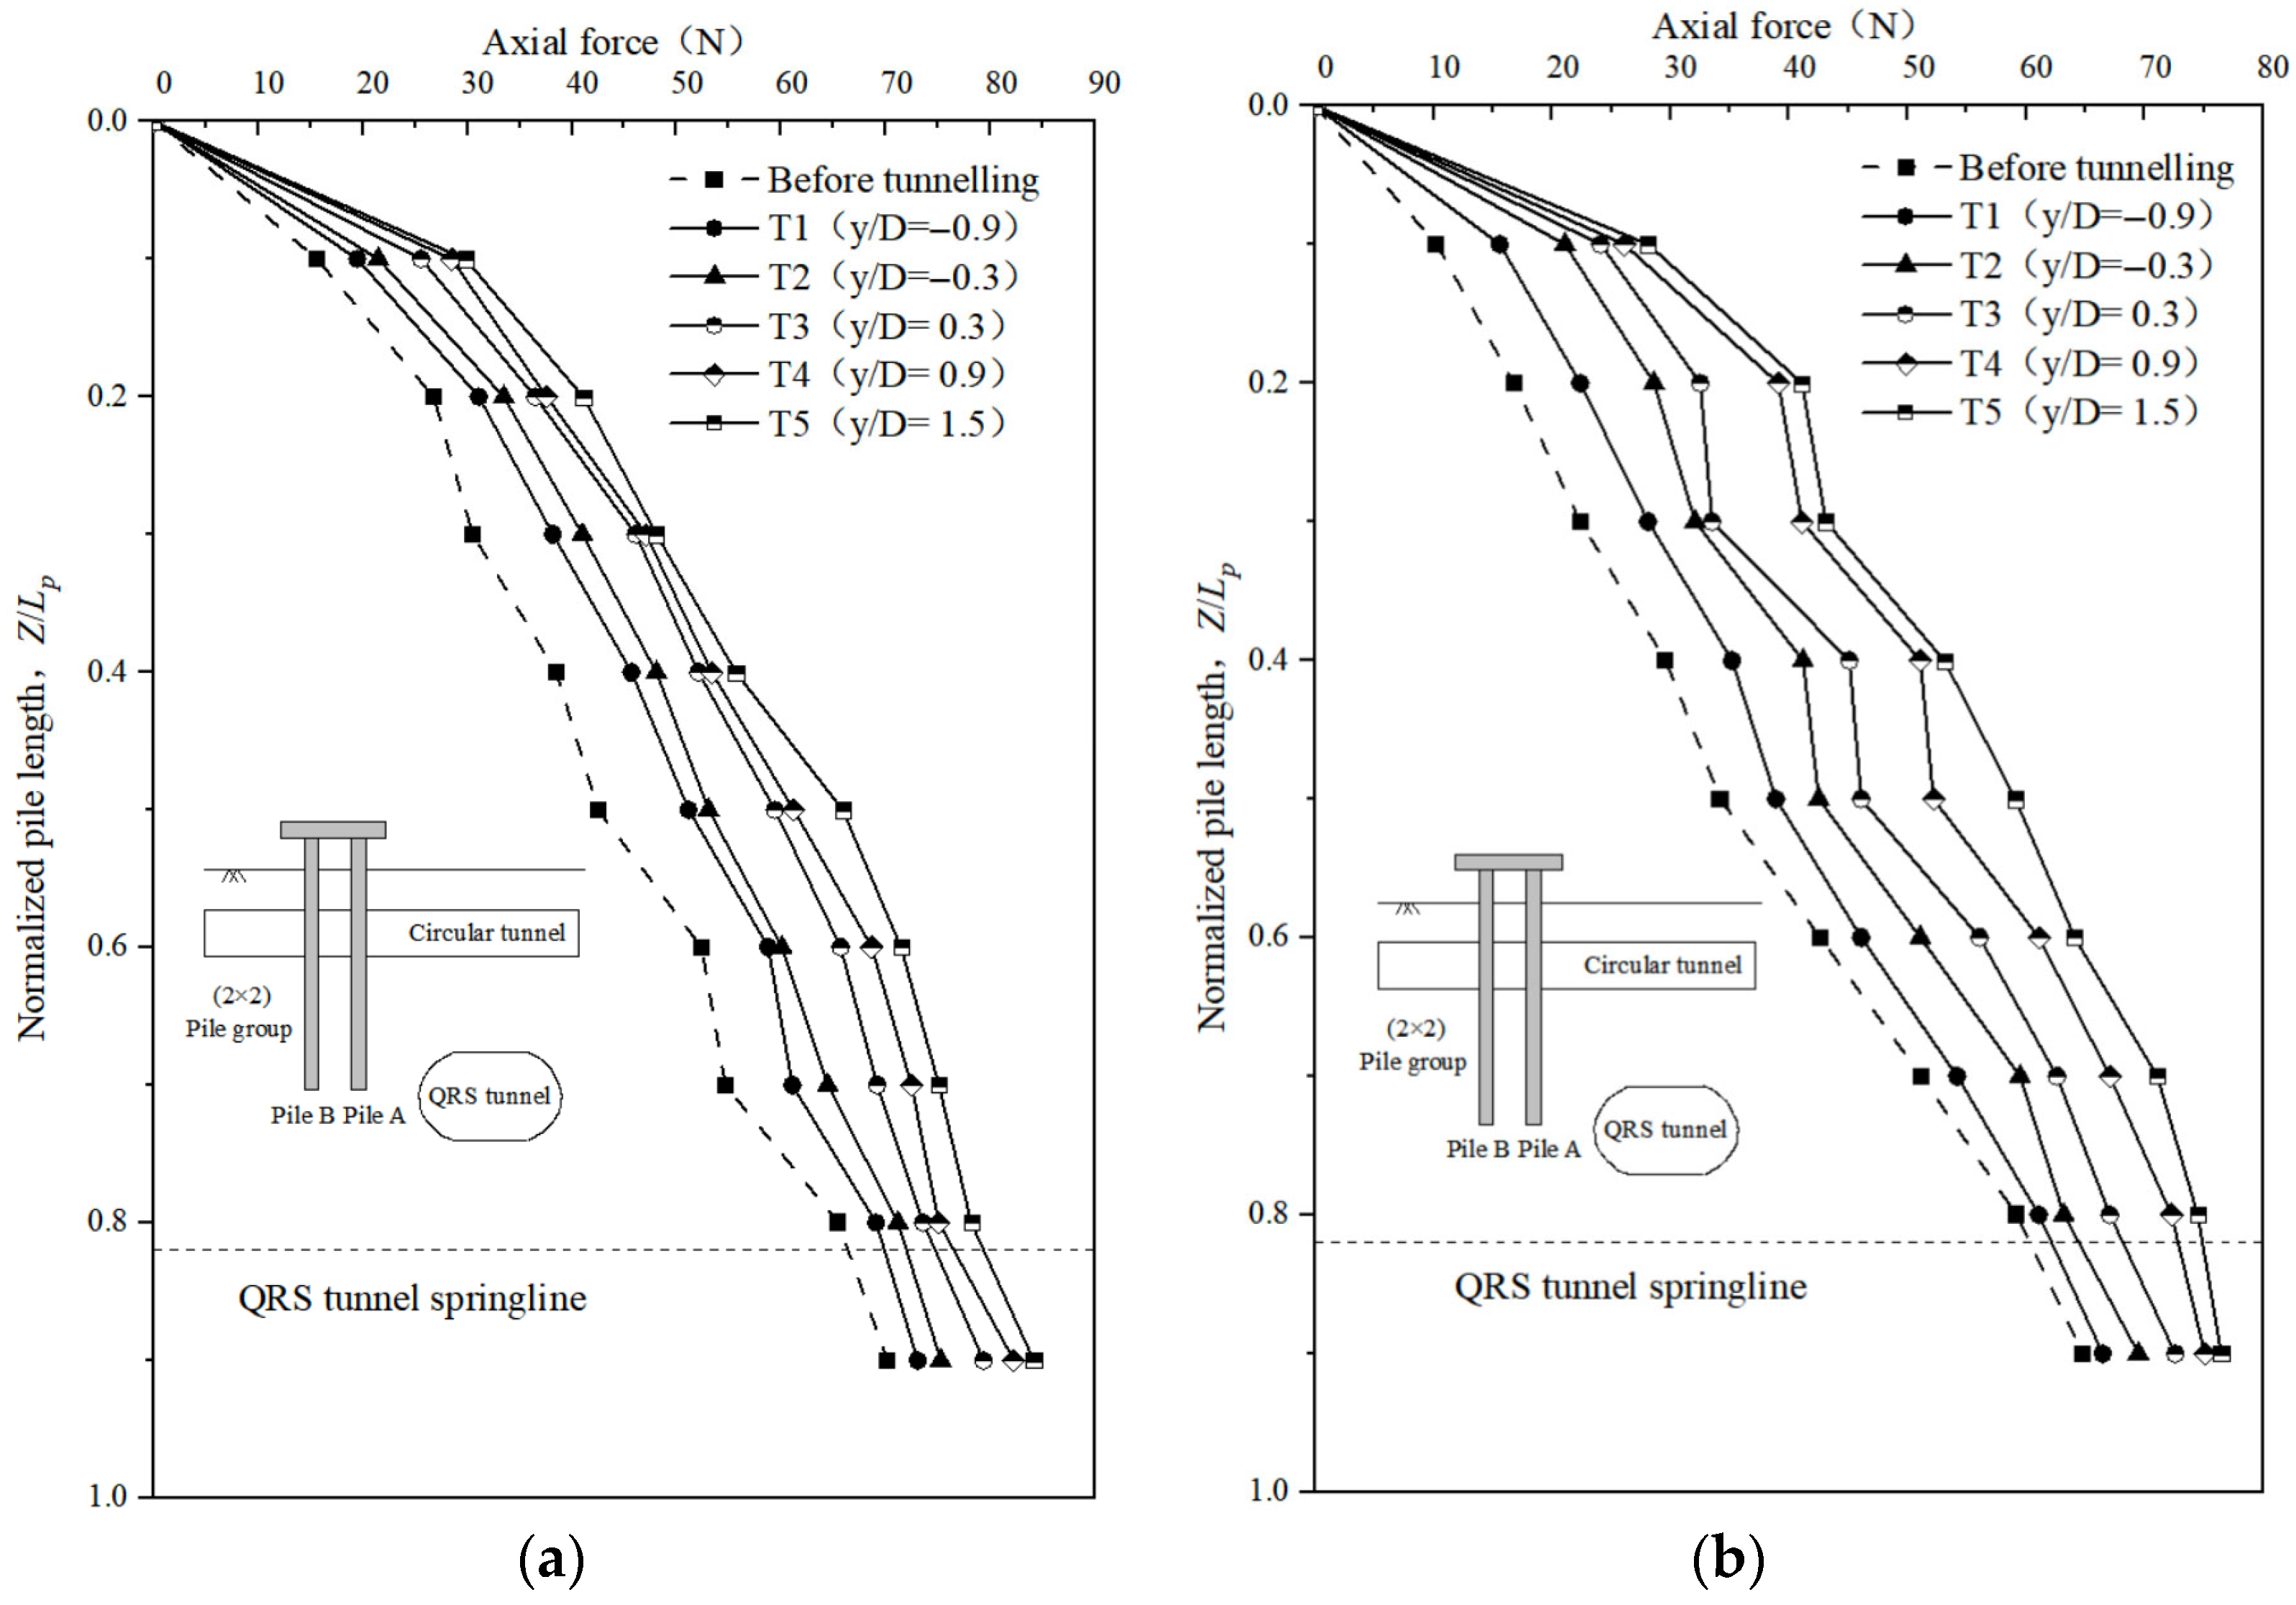
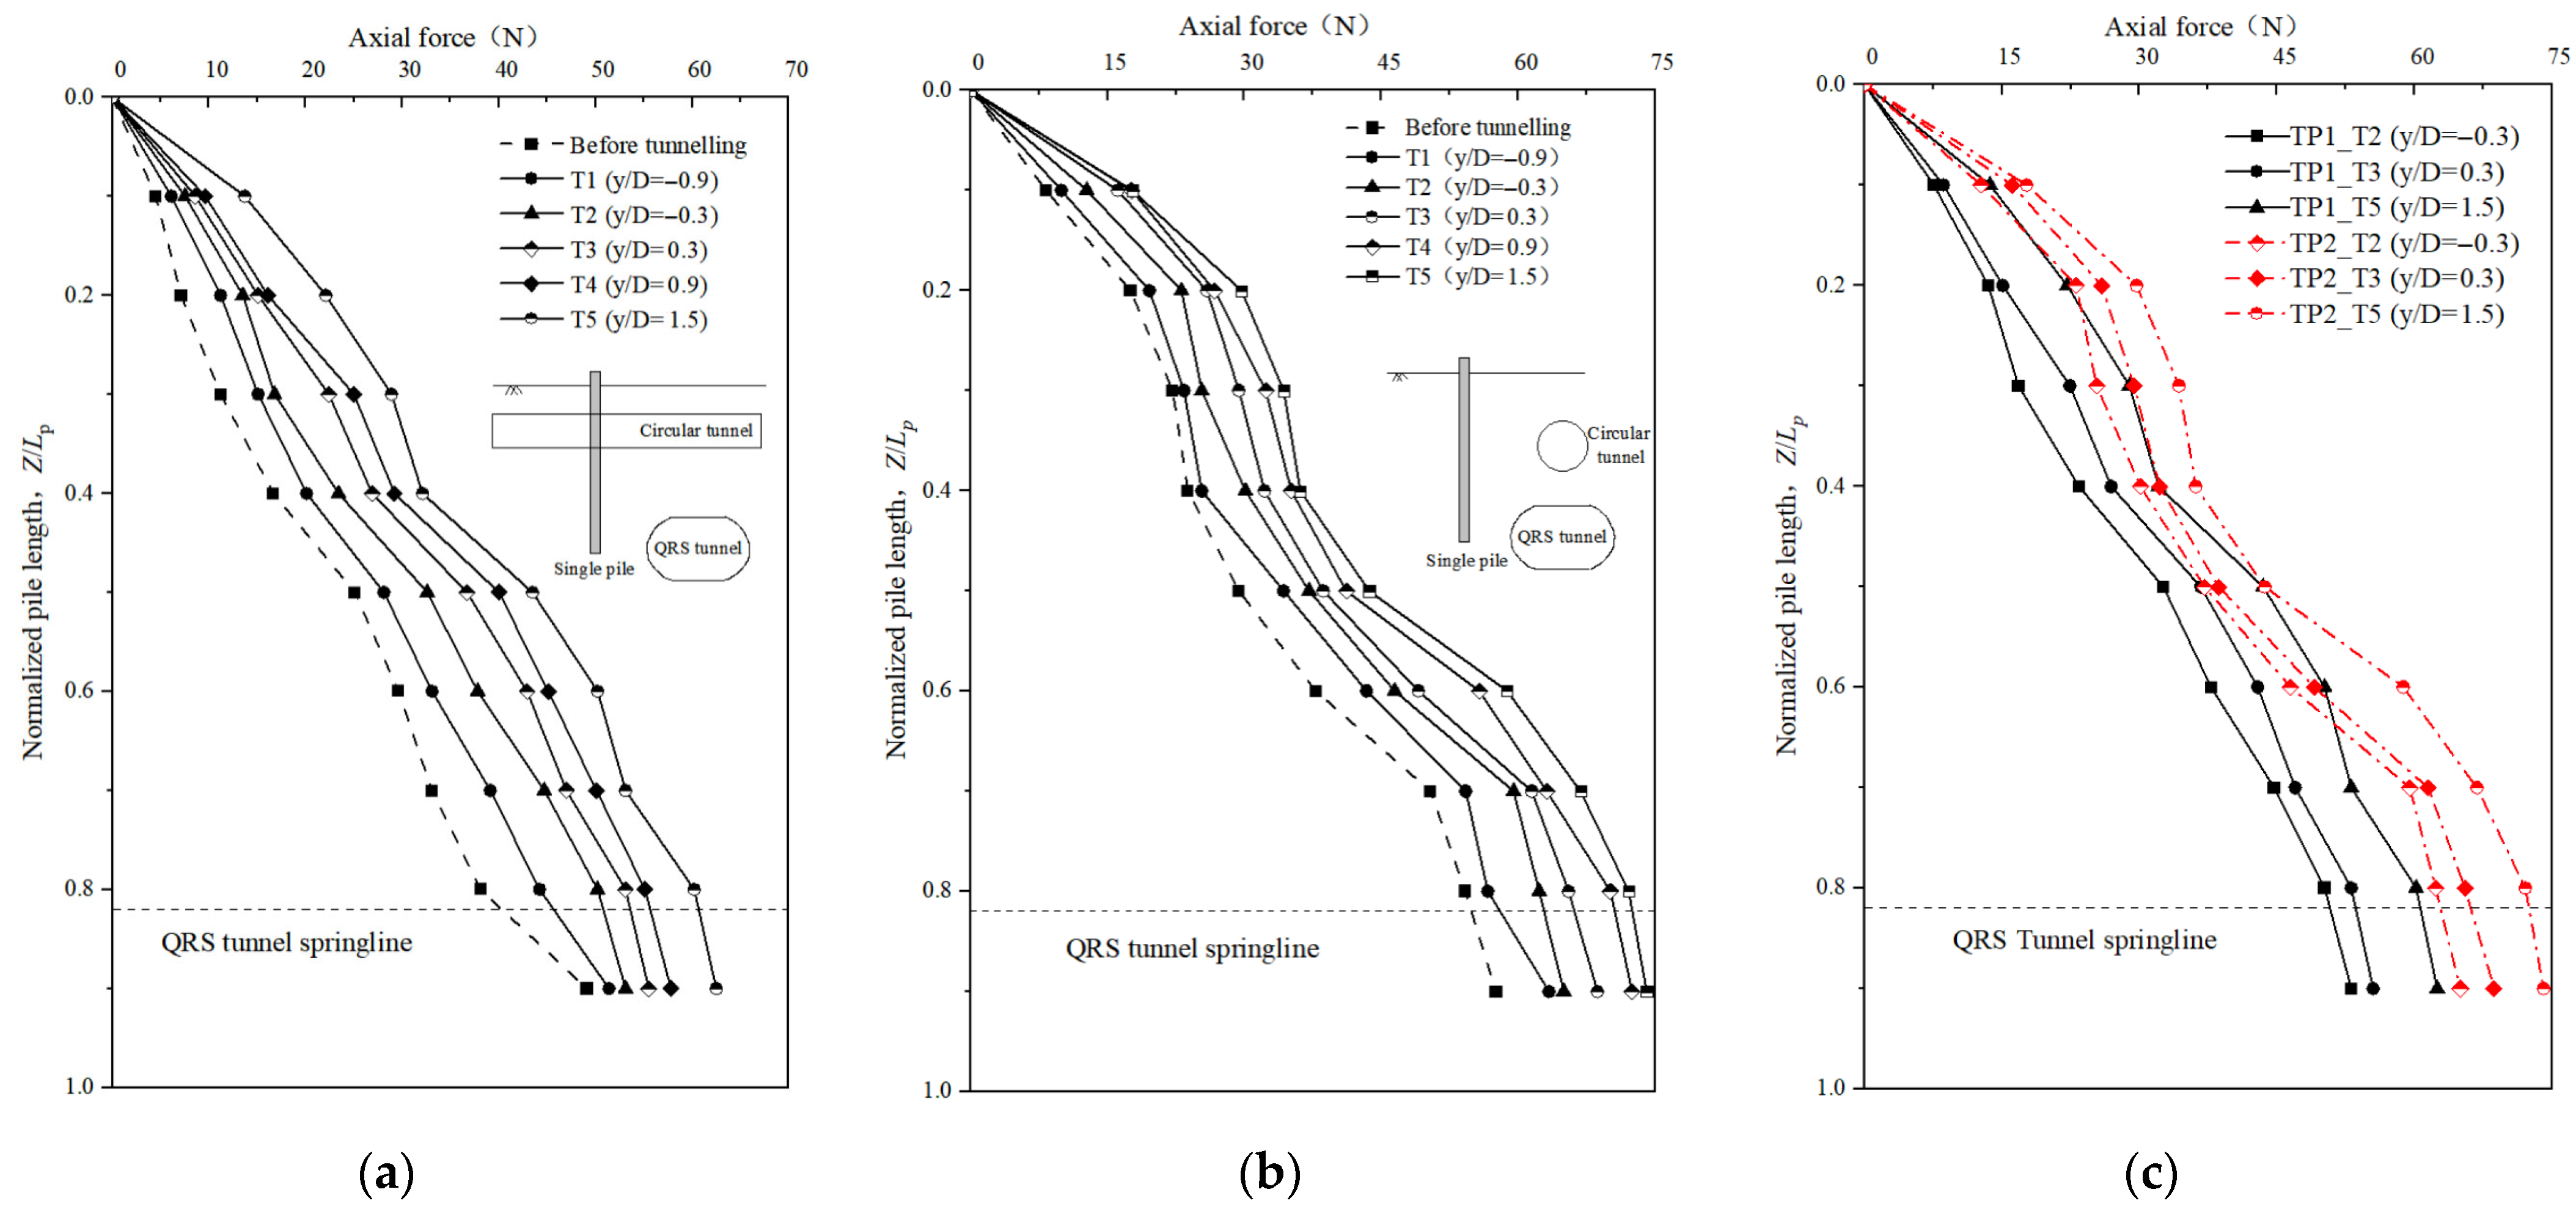
Figure 12 shows the axial forces along the single pile in tests TP1 and TP2. The depth (Z) was normalized by the pile length (Lp). As shown in Figure 12a, the axial force increased progressively along the pile in test TP1. This is because downward soil displacement above the arch crown was caused by QRS tunneling, and the surrounding soil settled more than the pile without a working load, leading to negative skin friction. During different excavation stages, the settlement of the surrounding soil was consistently greater than the pile, causing a downward load-transfer mechanism in the pile, and a continuous increase in the axial force, with a maximum value at the neutral plane. From the perspective of the tunnel excavation stages, in the initial stages T1 and T2, the increased pile–soil relative displacement allowed the negative skin friction on the upper part of the pile to be fully utilized, gradually increasing the axial force. In stages T3–T5, as the tunnel approached and moved away from the pile, the negative skin friction of the pile continuously increased with the excavation progress, and the pile end resistance was further developed. The end resistance after tunneling was approximately 27.3% higher than that before tunneling in test TP1. As shown in Figure 12b, the axial force distribution and load-transfer mechanism in test TP2 were basically consistent with those in test TP1, where a downward load transfer occurred continuously during tunneling, and the axial force gradually increased downward along the pile, with a further development of the pile end resistance. After tunneling in stage T5, the pile end resistance in test TP2 was approximately 28.6% higher than that before tunneling, which was greater than the increase in test TP1.
As compared in Figure 12c, the variation in the axial force was basically the same during stages T2 to T5 as the tunnel passed through and moved away from the pile in both underpass cases. However, the axial force in test TP2 was generally larger than that in test TP1, with the maximum value reaching 1.2 times that in test TP1. This is because the pile–soil relative displacement in the overlapping underpass case was larger than that in the orthogonal underpass case, resulting in greater negative skin friction along the pile, which led to downward load transfer and generated larger pile axial force and end resistance. In terms of pile axial force, the overlapping underpass case is more unfavorable than the orthogonal underpass case, consistent with the previous analysis conclusions on ground surface settlement and pile settlement.

3.1.4. Induced Bending Moments in the Single Pile

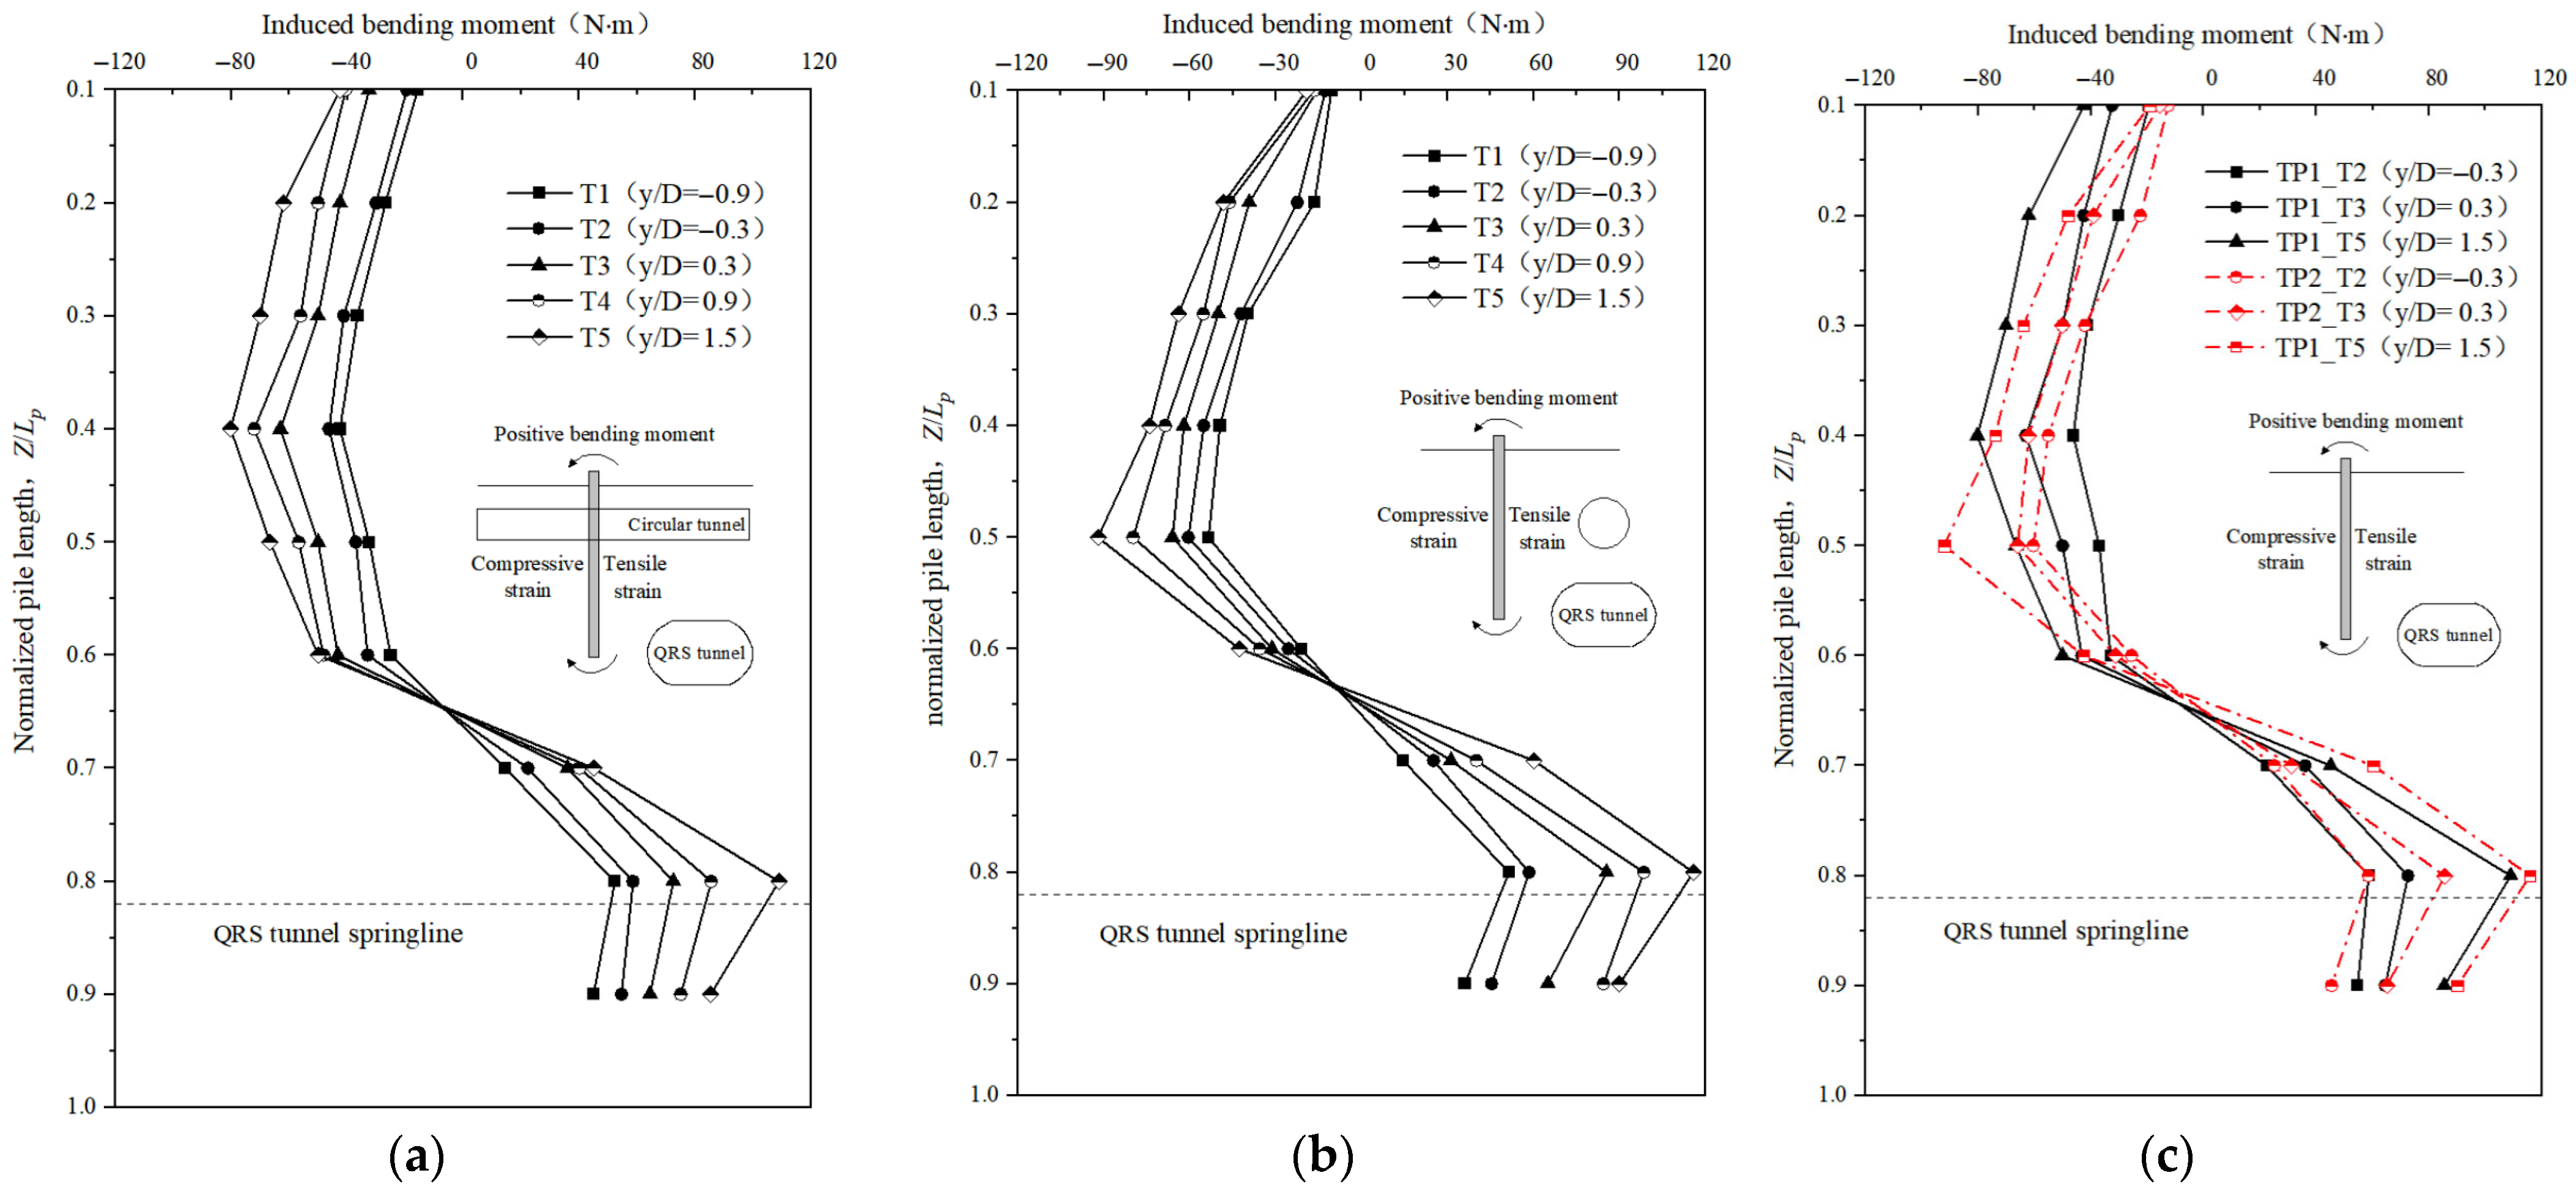
Figure 13 shows the pile bending moments in tests TP1 and TP2. A positive bending moment was defined if tensile strain was induced on the pile surface facing the QRS tunnel. As shown in Figure 13a, the bending moments generated by a single pile in test TP1 were relatively small in the initial excavation stages T1 and T2. The pile bending moment increased significantly in stage T3, where the tunnel passed through the pile, and then further increased in stages T4 and T5. Finally, the maximum negative bending moment of 81.2 N∙m appeared at a depth of 0.4 Lp, and the maximum positive bending moment of 109 N∙m appeared at a depth of 0.8 Lp near the arch crown of the QRS tunnel in test TP1. Throughout the excavation process, the upper part of the pile (Z/Lp < 0.65) generated a negative bending moment, while the lower part (Z/Lp > 0.65) generated a positive bending moment, indicating that the upper part of the pile bent away from the tunnel, while the lower part bent closer to the tunnel. This may be because although both the upper and lower parts of the pile underwent horizontal displacement, the horizontal displacement of the lower part of the pile was larger due to the proximity of the tunnel to the pile toe. As shown in Figure 13b, the variation law of the pile bending moment in test TP2 is basically consistent with that in test TP1. Throughout the excavation period, the pile bending moment also exhibited a distribution law of “a negative bending moment in the upper part and a positive bending moment in the lower part”. Finally, the maximum negative bending moment of 92.1 N∙m appeared at a depth of 0.5 Lp, and the maximum positive bending moment of 115.9 N∙m appeared at a depth of 0.8 Lp near the arch crown of the QRS tunnel in test TP2.
As compared in Figure 13c, the variation law of the bending moment during stages T2 to T5 was basically consistent in both underpass cases. In the upper part of the pile, the maximum negative bending moment in test TP2 was 1.13 times that in test TP1. In the lower part of the pile, the maximum positive bending moment in test TP2 was 1.06 times that in test TP1. This indicates that the bending moment induced in the pile was greater when a new QRS tunnel underpassed overlappingly an existing circular tunnel. Combined with the pile axial force results, it can be seen that the influence of different underpass cases on the pile axial force and bending moment was not significant, while the overlapping underpass case was relatively more unfavorable to the pile.

3.2. The Effects of QRS Tunnel Excavation on an Existing (2 × 2) Pile Group

3.2.1. Settlement of Pile Group

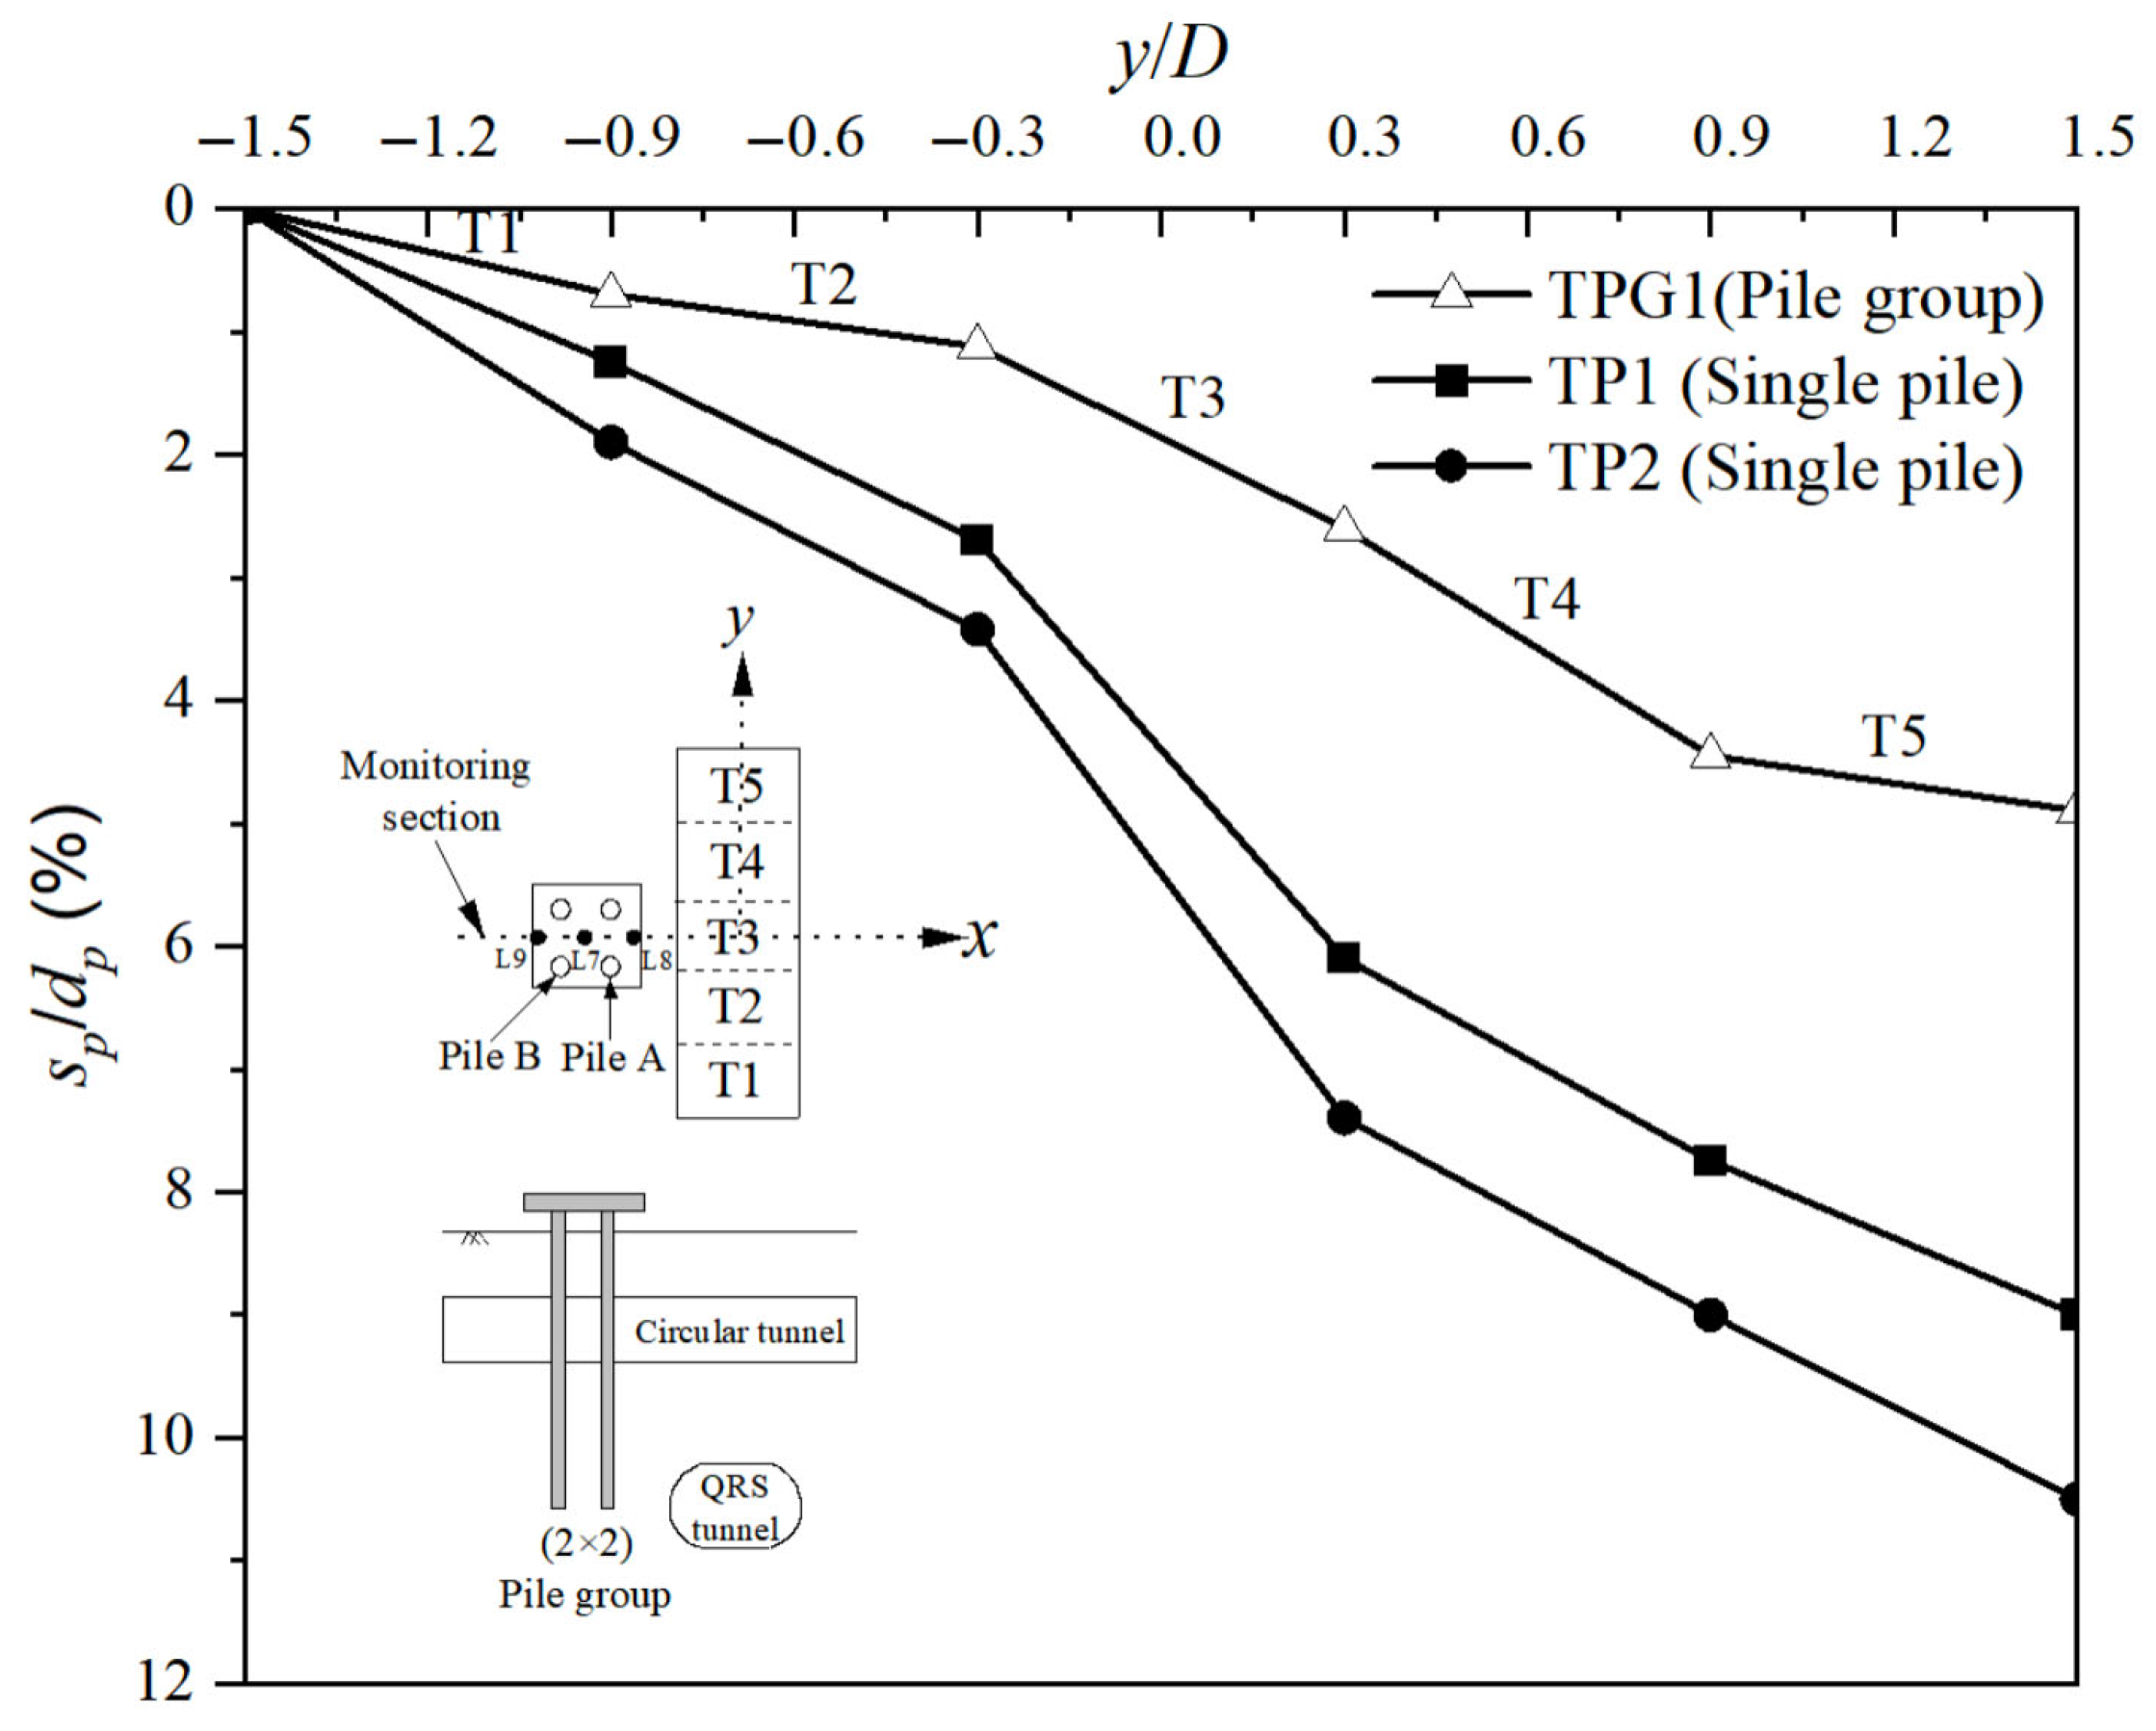
Figure 14 shows the settlement of the pile group in test TPG1. It can be seen that the pile group experienced a settlement of 1.1% dp in stages T1 and T2. The settlement increased sharply to 2.6% dp during stage T3 and further increased in stages T4 and T5, ultimately resulting in a total settlement of 4.9% dp. Comparing test TPG1 and test TP1, it can be seen that the settlement of the pile group in each excavation stage was less than that of a single pile, with a total settlement reduction of approximately 46%. This may be due to the restraining action of the pile cap in the pile group.

3.2.2. Transverse Tilting of Pile Cap in Pile Group

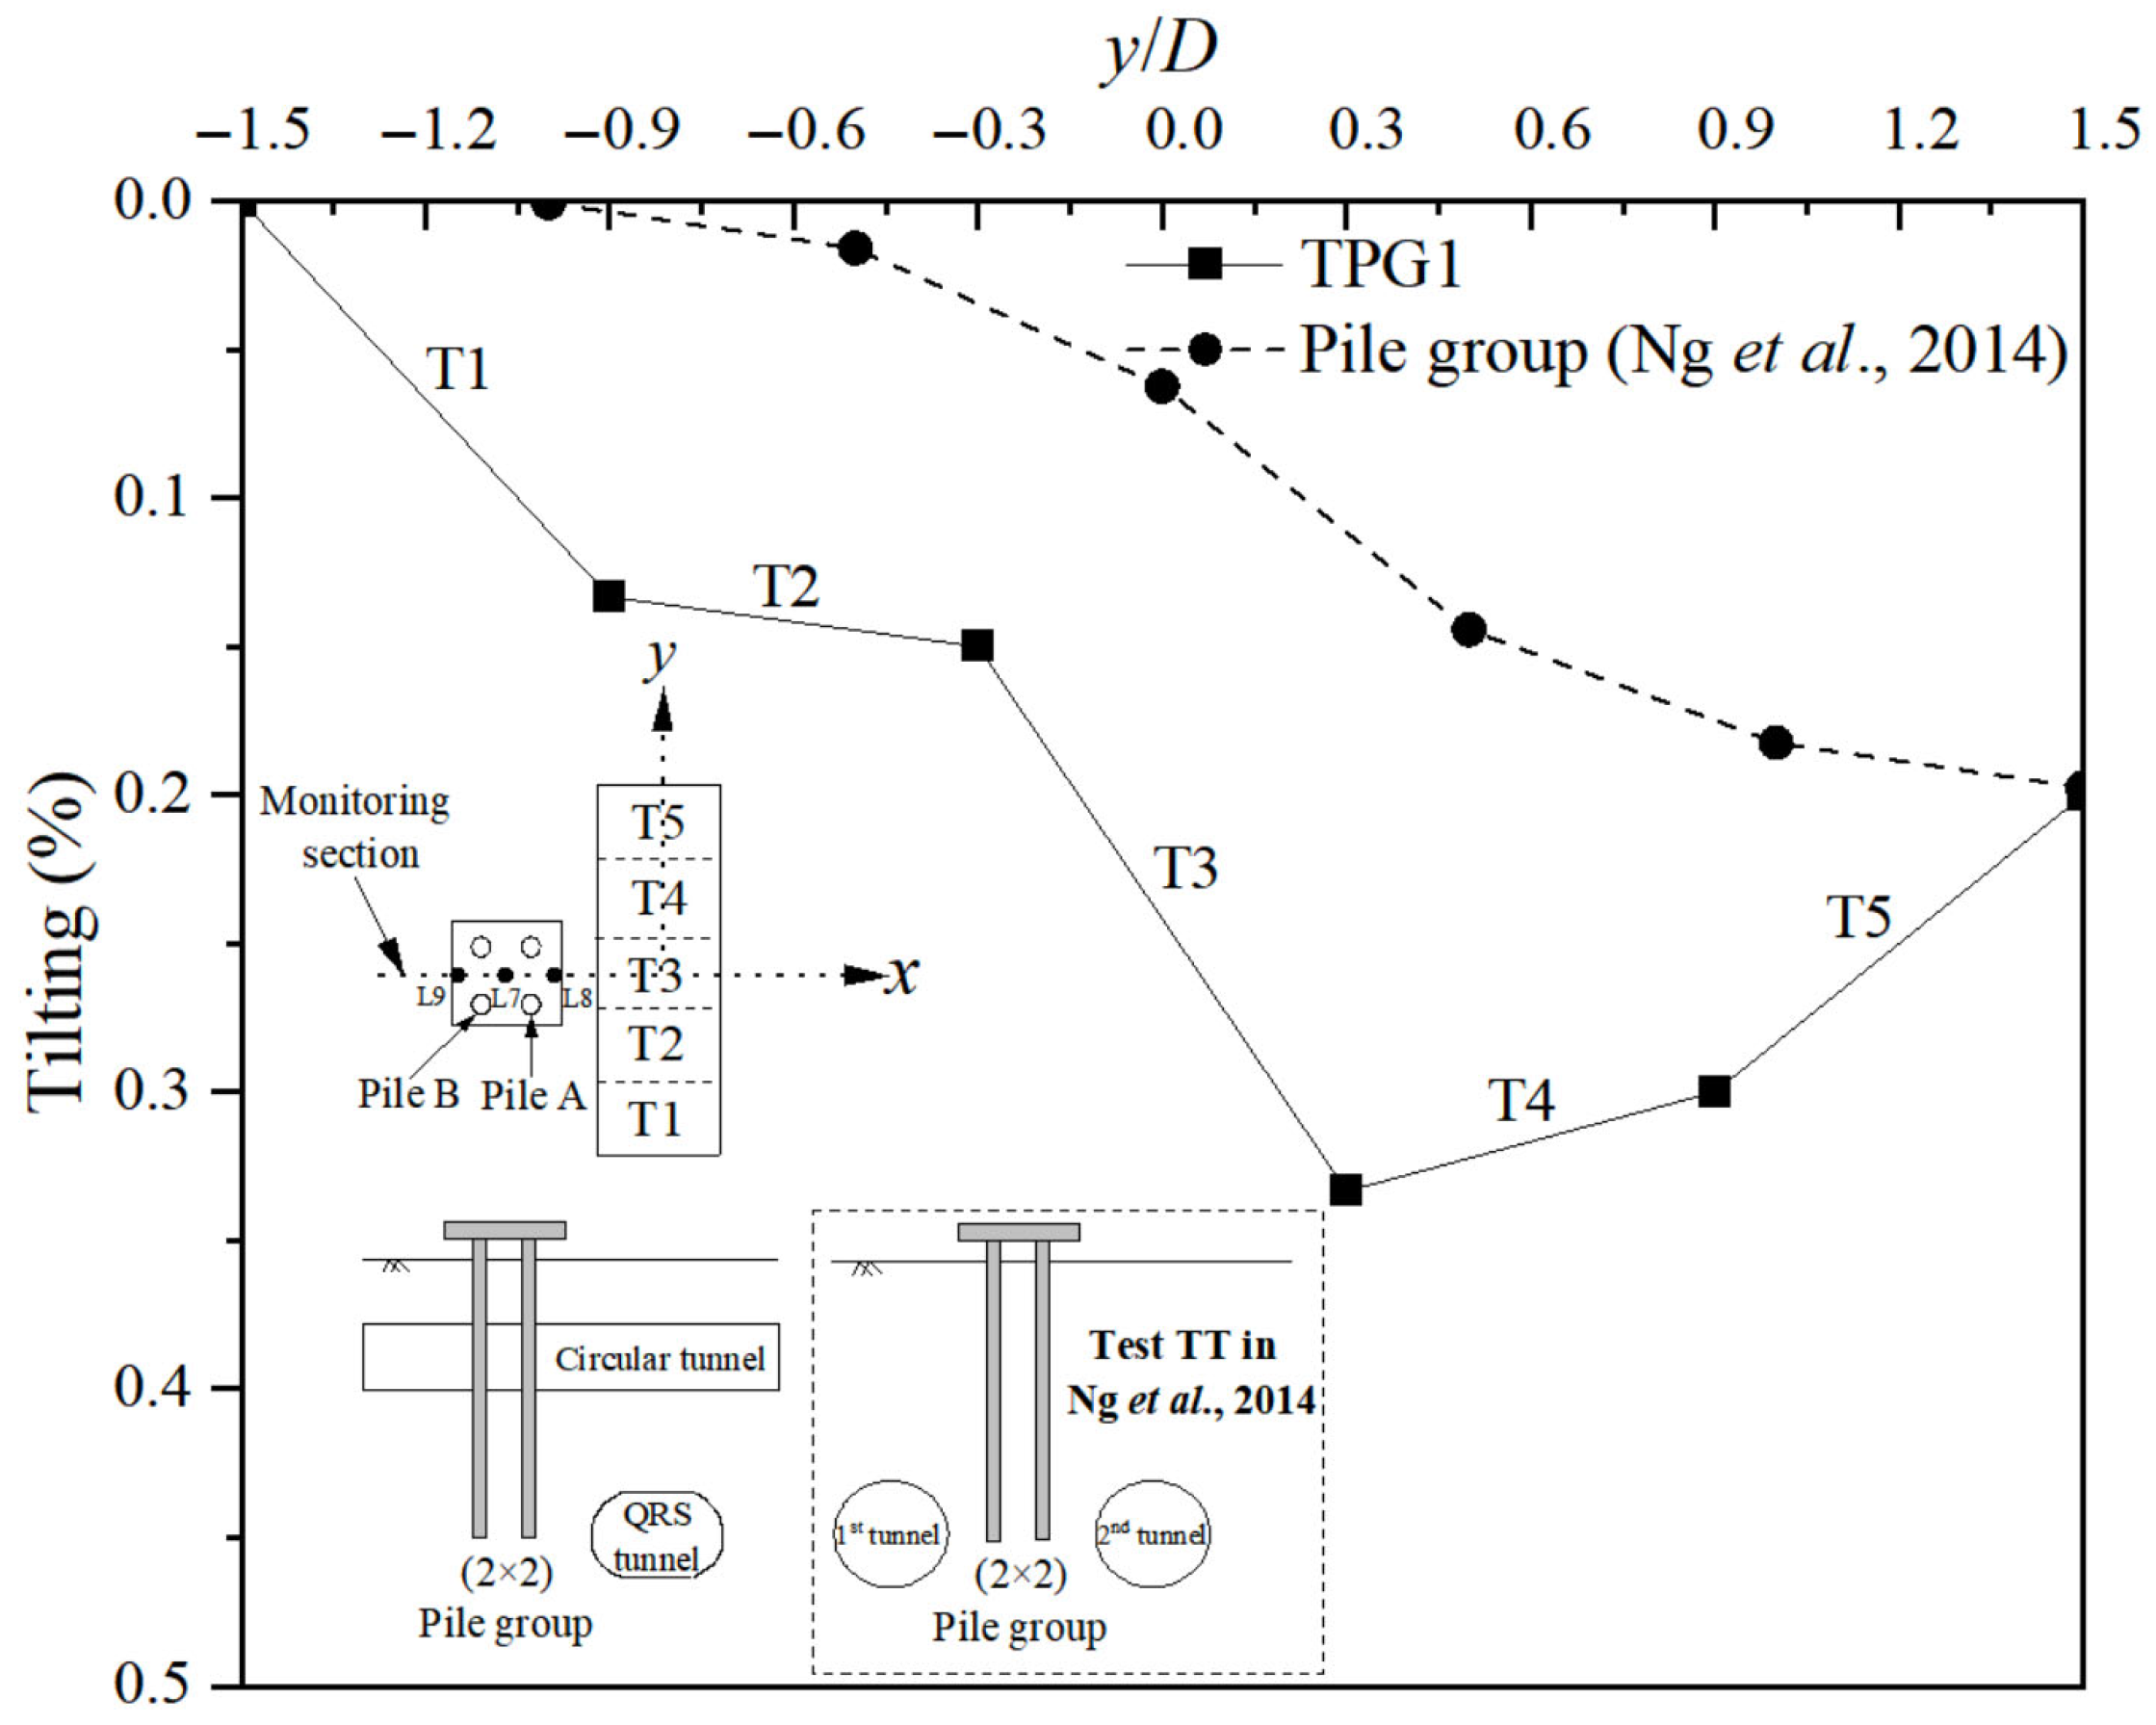
Figure 15 shows the transverse tilting of the pile cap in test TPG1. It can be seen that the pile settlement in the pile group was differential due to the influence of the shielding effect and restraining action in the pile group, which led to the pile group tilting towards the QRS tunnel. The overall trend was “increase first and then decrease” during tunneling. In stages T1 and T2 approaching the pile group, the settlement of pile B was less than that of pile A, and the tilting gradually increased. In stage T3, while crossing the pile group, the tilting increased significantly, reaching a maximum value of 0.33%, which exceeded the allowable value (0.20%) suggested by Eurocode 7 [47]. In stages T4 and T5, away from the pile group, the tilting rebounded and decreased, which is because the settlement of pile B was greater than that of pile A during this period. Finally, the cumulative tilting of the pile group was 0.20%. Figure 15 also shows the measured tilting of a 2 × 2 pile group caused by one circular tunnel in test TT by Ng et al. [25]. It can be seen that the pile tilting always increased with the excavation of the circular tunnel. This may be due to the different influence range of the equivalent QRS tunnel and circular tunnel excavation on the surrounding soil [39].

3.2.3. Axial Forces Along the Piles in Pile Group

Figure 16 shows the axial force of piles A and B in test TPG1. Comparing Figure 16a with Figure 12a, the variation of axial force of pile A was basically consistent with that of the single pile in test TP1, showing a monotonic growth pattern with QRS tunneling. However, the axial force of pile A was larger than that of the single pile at each excavation stage, with the maximum axial force reaching 1.3 times that of the single pile in test TP1. This may be attributed to the restraining action of the pile cap on pile A, which increased the negative pile–soil relative displacement, thereby generating greater negative skin friction. Comparing Figure 16a,b, the variation in the axial force of pile B was also basically the same as that of pile A. That is, the settlement of pile B was always less than the settlement of the surrounding soil throughout the excavation process. The negative skin friction caused the axial force to gradually increase along the pile, with a downward load-transfer mechanism. Nevertheless, the end resistance of pile B increased by 18% compared with before tunneling, which was smaller than the 20% increase for pile A. The maximum axial force of pile B was 13% smaller than that of pile A. This may be because the distance between pile B and the tunnel was greater than that between pile A and the tunnel, resulting in less disturbance to the surrounding soil and thus a smaller negative pile–soil relative displacement.

3.2.4. Induced Bending Moments in Pile Group

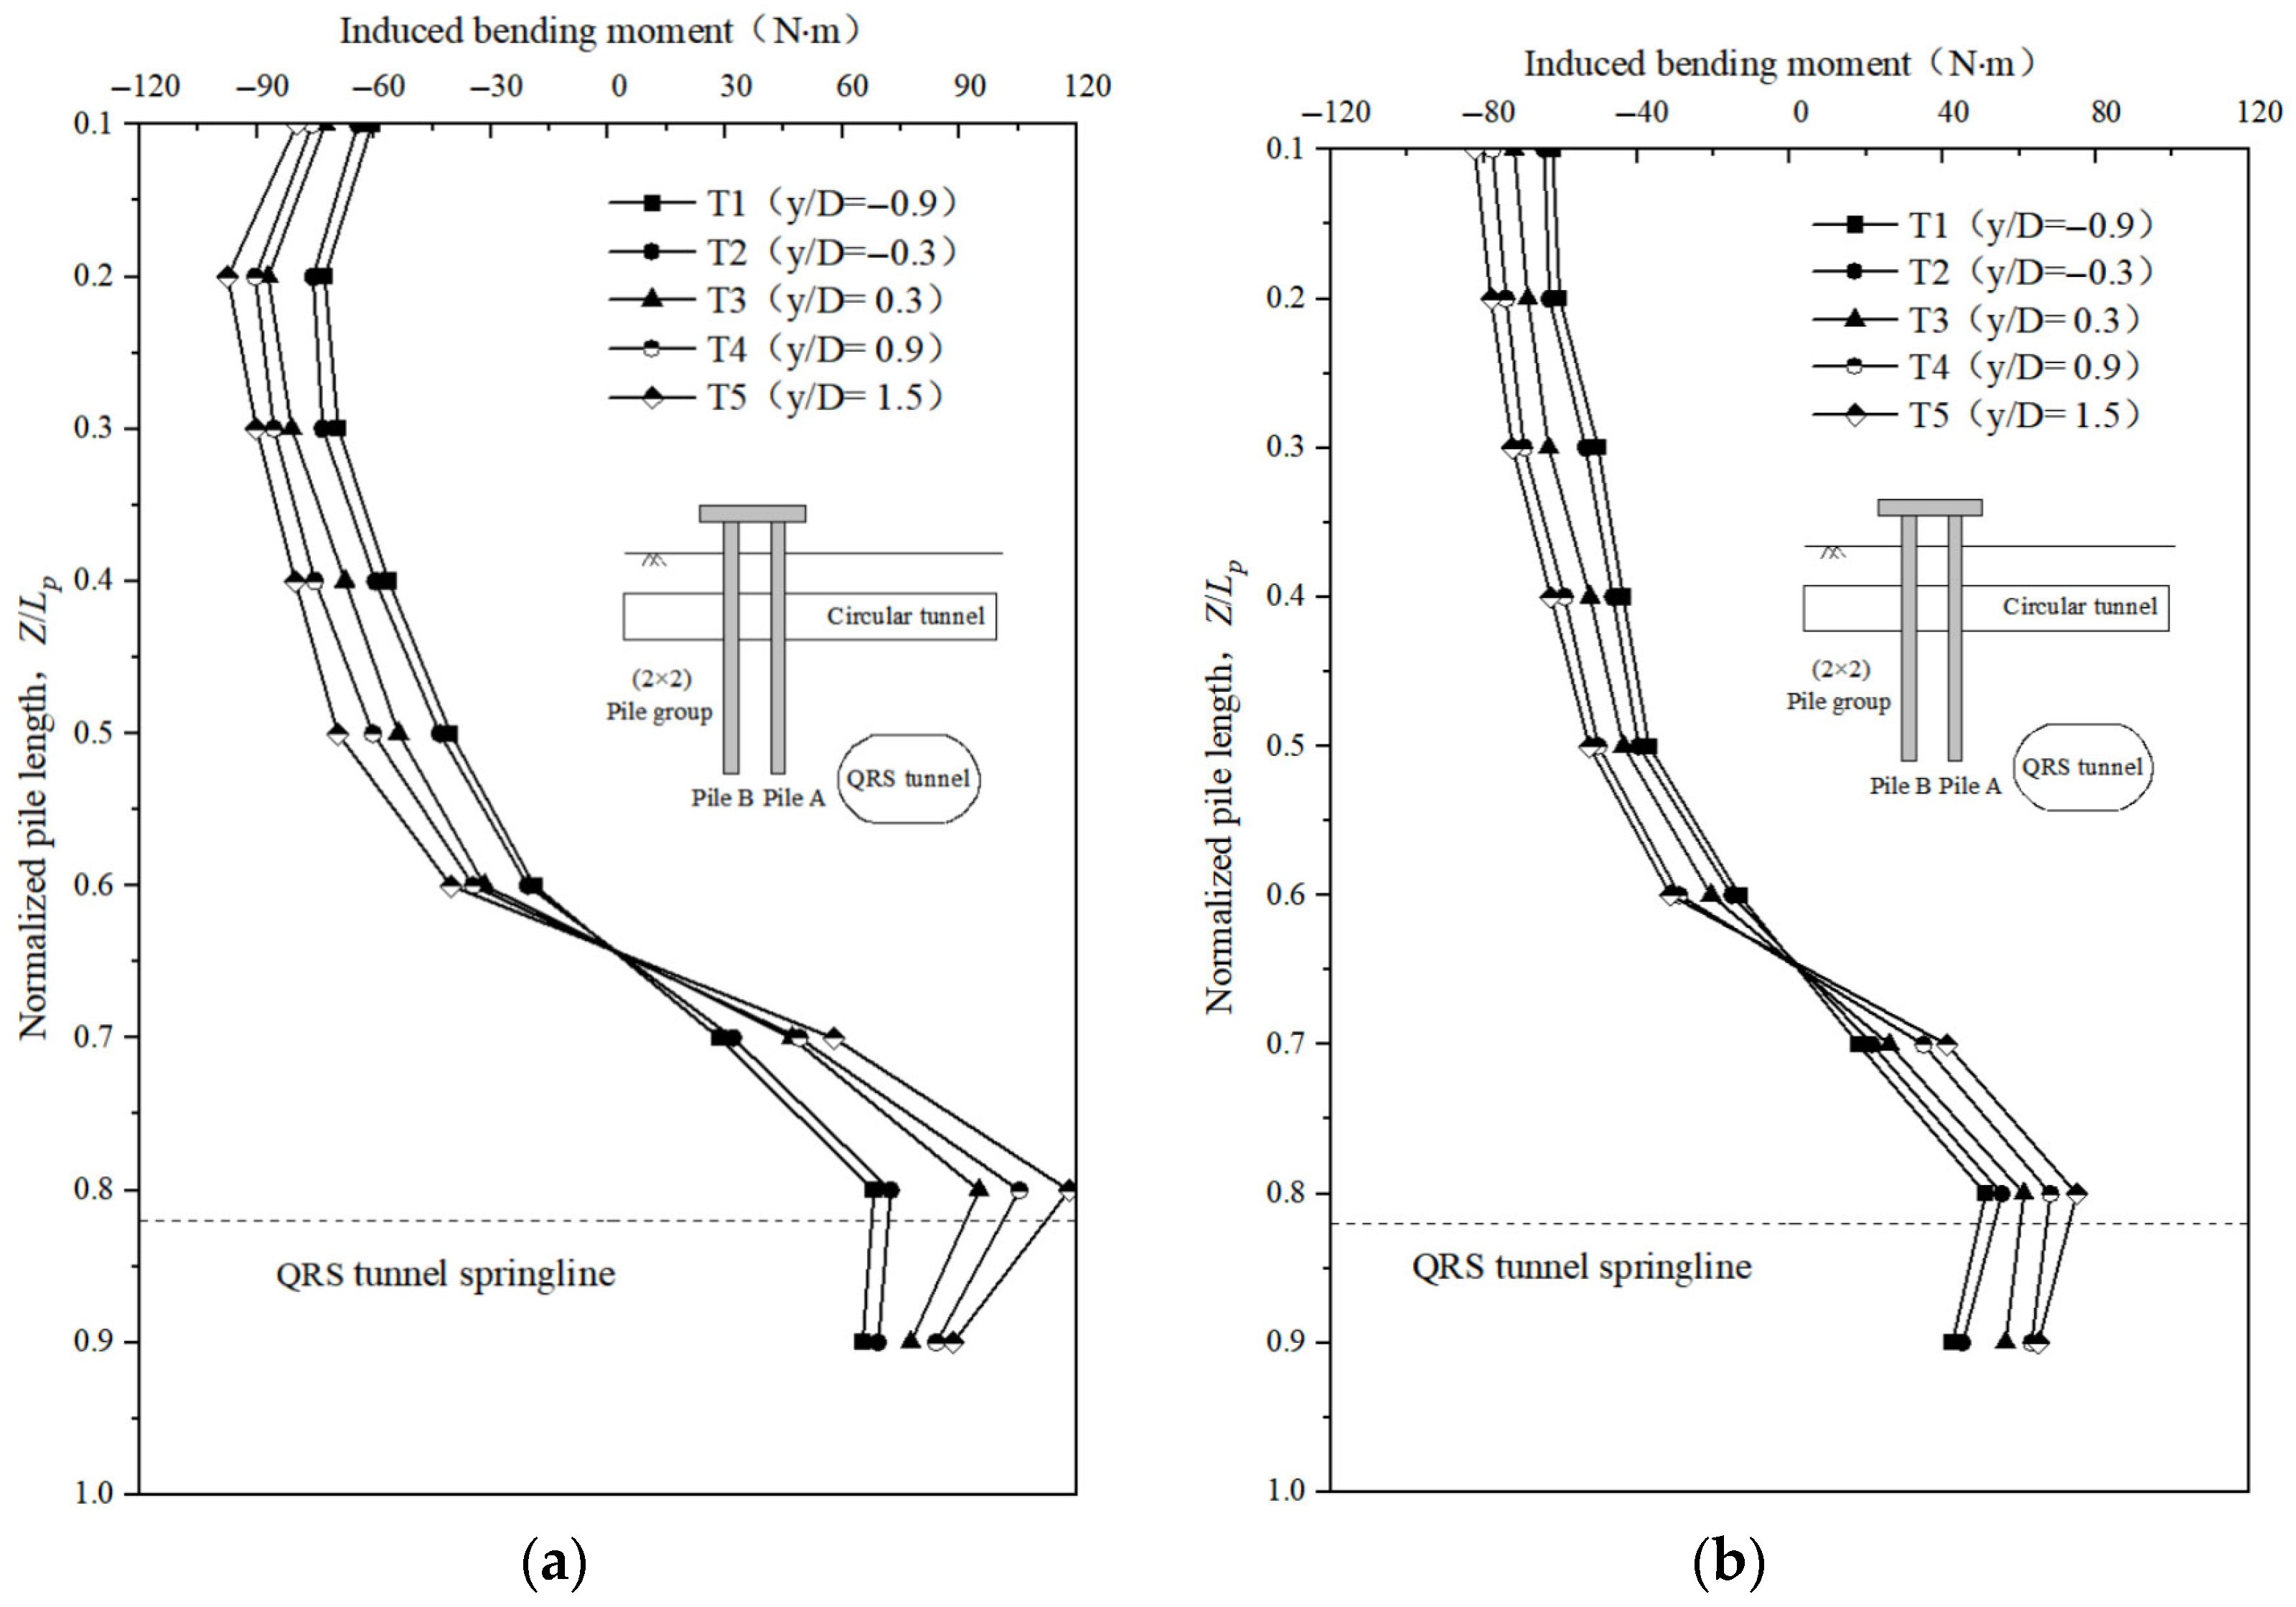
Figure 17 shows the induced bending moments of piles A and B in test TPG1. Comparing Figure 17a and Figure 13a, it can be seen that the distribution pattern of the bending moment of pile A in the pile group was different from that of the single pile in test TP1. Throughout the excavation process, the upper part of pile A generated a negative bending moment, and the lower part generated a positive bending moment. Finally, the maximum negative bending moment of 97.5 N∙m was generated at 0.2 Lp of pile A, which was about 20% larger than that of the single pile in test TP1. The maximum positive bending moment of 118.1 N∙m was generated at 0.8 Lp of pile A, which was about 8.3% larger than that of the single pile in test TP1. This may be because the pile top of pile A was constrained by the pile cap, which limited its horizontal displacement and rotation to a certain extent. The bending moment at the pile top was no longer zero, thus increasing the bending moment along the pile.
Comparing Figure 17a,b, it can be seen that the distribution pattern of the bending moment of pile B is different from that of pile A. The maximum bending moment at the top of pile B was 82.5 N∙m, which was greater than that at the top of pile A (79.8 N∙m). This may be because the restraining action of the pile cap on pile B was stronger than that on pile A, thus enhancing its ability to limit horizontal movement, resulting in a larger bending moment at the top of pile B. The maximum negative bending moment of pile B (82.5 N∙m) occurred at a depth of 0.1 Lp near the pile top, which was 15.4% smaller than that of pile A (97.5 N∙m), and its position was shifted upwards. The maximum positive bending moment of pile B (75 N∙m) also occurred at 0.8 Lp, which was 36.5% smaller than that of pile A (118.1 N∙m). Besides the restraining action of the pile cap, this may also be because pile B was farther from the QRS tunnel, resulting in less disturbance to the surrounding soil and a smaller horizontal pile displacement, which, in turn, led to a smaller bending moment. Furthermore, due to the shielding effect of pile A, the influence of the bending moment on pile B was somewhat delayed, manifested as a higher increase in the bending moment at stage T4 compared with pile A.

4. Summary and Conclusions

A series of model tests in sand were conducted to investigate the effect of QRS tunneling on an adjacent single pile and a 2 × 2 pile group in two cases, where a new QRS tunnel underpassed orthogonally or overlappingly an existing circular tunnel. The following conclusions are drawn based on the test conditions of this study:
(1)
The main longitudinal effect zone of QRS tunneling on the piles was concentrated within ±0.9D before and after the tunnel face. Furthermore, the ground surface settlement and single pile settlement in the overlapping underpass case were 3.6 times and 1.2 times that in the orthogonal underpass case, respectively, indicating that the overlapping underpass case was more detrimental to the piles.
(2)
The distribution pattern of axial force in the single pile was basically consistent in both cases, experiencing a downward load-transfer mechanism and a monotonic growth pattern during tunneling. The additional internal forces on a single pile in the overlapping underpass case were generally greater than those in the orthogonal underpass case, where the maximum axial force and negative and positive bending moments in the former case were 1.2, 1.13 and 1.06 times those of the latter, respectively.
(3)
Due to the influence of the shielding effect and restraining action in the pile group, a maximum tilting of 0.33% was reached during the QRS tunnel passing through the pile group. The front pile A in the pile group exerted a pronounced shielding effect on rear pile B, where the maximum axial force and negative and positive bending moment of pile B were 13%, 15.4% and 36.5% smaller than those of pile A, respectively.
(4)
While most previous studies focused on circular tunnels, this research provides the first systematic 1 g model test data on QRS tunnel–pile interaction under orthogonal and overlapping underpass configurations. The results quantify the differences in settlement, axial force, and bending moment between the two cases, and identify the shielding effect within a 2 × 2 pile group.
The present study focused on the fundamental mechanisms under the specified test configurations. Building upon this work, future research could extend the investigation to include the overlapping underpass case for pile groups, as well as explore the effects of key parameters such as clear distance, buried depth, pile diameter, pile spacing, and volume loss rates.

Author Contributions

Conceptualization, H.D. and G.W.; methodology, H.D.; validation, Z.Z. and Y.T.; formal analysis, Z.Z. and Y.T.; investigation, H.D. and Y.T.; resources, X.W.; data curation, H.H. and Q.L.; writing—original draft preparation, H.D., Y.T. and Z.Z.; writing—review and editing, H.D. and Z.Z.; visualization, H.D.; supervision, X.W.; project administration, X.W.; funding acquisition, H.D. and X.W. All authors have read and agreed to the published version of this manuscript.

Funding

This research was funded by the National Natural Science Foundation of China (Grant No. 52009122 and No. 52278373) and the Research Cultivation Fund Project of Hangzhou City University (Grant No. J-202405).

Data Availability Statement

The data presented in this study are available upon request from the corresponding authors. The raw/processed data needed to reproduce these findings cannot be shared publicly at this time, as they are also part of an ongoing study.

Conflicts of Interest

Author Qiang Li is employed by the PowerChina Huadong Engineering (Shenzhen) Corporation Limited. The remaining authors declare that the research was conducted in the absence of any commercial or financial relationships that could be construed as a potential conflict of interest.

References

  1. Statistical analysis of urban rail transit lines in Mainland China in 2025. Mod. Urban Rail Transit. 2026, 108–109. (In Chinese)
  2. Ma, S.J.; Hong, K.R.; Ding, Y.G.; Cao, M.M.; Guo, T.J.; Lou, X.Z. Measurement analysis of strata deformation caused by construction of quasi-rectangular shield. Sci. Rep. 2025, 15, 28807. [Google Scholar] [CrossRef]
  3. Liu, X.; Liu, Z.; Yuan, Y.; Zhu, Y. Quasi-rectangular shield tunnelling technology in the Ningbo rail transit project. In High Tech Concrete: Where Technology and Engineering Meet: Proceedings of the 2017 fib Symposium, Held in Maastricht, The Netherlands, 12–14 June 2017; Springer International Publishing: Cham, Switzerland, 2017; pp. 2765–2773. [Google Scholar]
  4. Jiao, N.; Ding, J.; Liao, Z.; Wan, X.; Gao, P. Impact of double shield tunnel construction on adjacent pile foundation in silty fine sand strata. J. Perform. Constr. Facil. 2025, 39, 04025033. [Google Scholar] [CrossRef]
  5. He, C.; Wei, J.; Liang, H.; Chen, Z.; Ding, W.; Li, B. Structural Behavior Analysis for Existing Pile Foundations Considering the Effects of Shield Tunnel Construction. Buildings 2025, 15, 3263. [Google Scholar] [CrossRef]
  6. Su, J.; Pan, Y.; Niu, X.; Zhang, C. Effect of shield tunneling on adjacent pile foundations in water-rich strata. Transp. Geotech. 2025, 52, 101557. [Google Scholar] [CrossRef]
  7. Li, Y.; Wu, Z.; Zhang, W. Numerical analysis of mechanical response in bridge and pile foundations due to shield cutting of residual piles. Sci. Rep. 2025, 15, 13249. [Google Scholar] [CrossRef] [PubMed]
  8. Liu, S.W.; Zhang, Q.Q.; Feng, R.F. Small-scale test on the response of adjacent piles caused by shield tunnel excavation in sand. Transp. Geotech. 2026, 58, 101942. [Google Scholar] [CrossRef]
  9. Dias, T.G.S.; Bezuijen, A. Data analysis of pile tunnel interaction. J. Geotech. Geoenviron. Eng. 2015, 141, 04015051. [Google Scholar] [CrossRef]
  10. Sohaei, H.; Namazi, E.; Hajihassani, M.; Marto, A. A review on tunnel-pile interaction applied by physical modeling. Geotech. Geol. Eng. 2020, 38, 3341–3362. [Google Scholar] [CrossRef]
  11. Attewell, P.B.; Yeates, J.; Selby, A.R. Soil Movements Induced by Tunnelling and Their Effects on Pipelines and Structures; Methuen Inc.: New York, NY, USA, 1986. [Google Scholar]
  12. Mair, R.J. Unwin memorial lecture 1992. Developments in geotechnical engineering research, application to tunnels and deep excavations. Civ. Eng. 1993, 97, 27–41. [Google Scholar]
  13. Lee, R.G.; Turner, A.J.; Whitworth, L.J. Deformations caused by tunnelling beneath a piled structure. In International Conference on Soil Mechanics and Foundation Engineering; A.A. Balkema: Rotterdam, The Netherlands, 1994; pp. 873–878. [Google Scholar]
  14. Kaalberg, F.J.; Teunissen, E.A.; van Toi, A.F.; Bosch, J.W. Dutch research on the effect of shield tunnelling on pile foundation. In Proceedings of the 5th International Symposium on Geotechncial Aspects of Underground Construction in Soft Ground, Amsterdam, The Netherlands, 15–17 June 2005; pp. 123–131. [Google Scholar]
  15. Boonyarak, T.; Phisitkul, K.; Ng, C.W.W.; Teparaksa, W.; Aye, Z.Z. Observed ground and pile group responses due to tunnelling in Bangkok stiff clay. Can. Geotech. J. 2014, 51, 479–495. [Google Scholar] [CrossRef]
  16. Soomro, M.A.; Hong, Y.; Ng, C.W.W.; Lu, H.; Peng, S. Load transfer mechanism in pile group due to single tunnel advancement in stiff clay. Tunn. Undergr. Space Technol. 2015, 45, 63–72. [Google Scholar] [CrossRef]
  17. Zheng, G.; Wang, R.; Lei, H.; Zhang, T.; Fan, Q. Load-transfer-associated settlements of a piled building during shield tunnelling in soft ground. Tunn. Undergr. Space Technol. 2023, 133, 104964. [Google Scholar] [CrossRef]
  18. Huang, M.; Zhang, C.; Li, Z. A simplified analysis method for the influence of tunnelling on grouped piles. Tunn. Undergr. Space Technol. 2009, 24, 410–422. [Google Scholar] [CrossRef]
  19. Zhang, R.J.; Zheng, J.J.; Yu, S. Responses of piles subjected to excavation-induced vertical soil movement considering unloading effect and interfacial slip characteristics. Tunn. Undergr. Space Technol. 2013, 36, 66–79. [Google Scholar] [CrossRef]
  20. Lee, Y.J.; Bassett, R.H. Influence zones for 2D pile-soil-tunnelling interaction based on model test and numerical analysis. Tunn. Undergr. Space Technol. 2007, 22, 325–342. [Google Scholar] [CrossRef]
  21. Meguid, M.A.; Mattar, J. Investigation of tunnel-soil-pile interaction in cohesive soils. J. Geotech. Geoenviron. Eng. 2009, 135, 973–979. [Google Scholar] [CrossRef]
  22. Guo, X.; Li, Z.; Zhang, X.; Pu, M. Model test study on a shield tunnel adjacent to pile in the sub-clay of a coastal area. Appl. Sci. 2022, 12, 7718. [Google Scholar] [CrossRef]
  23. Xia, Y.; Zhou, C.; Jiang, N.; Meng, X.; Luo, X.; Wu, T. Physical model tests on the dynamic behaviors of pile foundations subjected to adjacent tunnel blasting. Acta Geotech. 2024, 19, 4655–4674. [Google Scholar] [CrossRef]
  24. Loganathan, N.; Poulos, H.G.; Stewart, D.P. Centrifuge model testing of tunnelling-induced ground and pile deformations. Géotechnique 2000, 50, 283–294. [Google Scholar] [CrossRef]
  25. Ng, C.W.W.; Soomro, M.A.; Hong, Y. Three-dimensional centrifuge modelling of pile group responses to side-by-side twin tunnelling. Tunn. Undergr. Space Technol. 2014, 43, 350–361. [Google Scholar] [CrossRef]
  26. Soomro, M.A.; Mangi, N.; Xiong, H.; Kumar, M.; Mangnejo, D.A. Centrifuge and numerical modelling of stress transfer mechanisms and settlement of pile group due to twin stacked tunnelling with different construction sequences. Comput. Geotech. 2020, 121, 103449. [Google Scholar] [CrossRef]
  27. Soomro, M.A. Influence of twin stacked tunnels on the performance of laterally loaded pile group. Can. Geotech. J. 2025, 62, 1–23. [Google Scholar] [CrossRef]
  28. Ding, Z.; He, S.H.; Sun, Y.; Xia, T.D.; Zhang, Q.F. Comparative study on cyclic behavior of marine calcareous sand and terrigenous siliceous sand for transportation infrastructure applications. Constr. Build. Mater. 2021, 283, 122740. [Google Scholar] [CrossRef]
  29. Yu, J.; Sun, M.; He, S.; Huang, X.; Wu, X.; Liu, L. Accumulative deformation characteristicsmicrostructure of saturated softclay under cross-river subway-loading. Materials 2021, 14, 537. [Google Scholar] [CrossRef]
  30. Jin, Z.; Liu, J.; Sun, H.; Sun, M.; Xu, X. Influence- of gradation range on strong contact network ingranular materials. Granular. Matter 2024, 26, 37. [Google Scholar] [CrossRef]
  31. Wei, G.; Tong, J.; Liang, L.; Yu, C.; Feng, G.; Wei, X. Evolution: Lawof contact force chain networkstructure of geotechnical granular materials under unloading stress paths. Materials 2026, 19, 1158. [Google Scholar] [CrossRef]
  32. Sun, M.; Yu, J.; He, S.; Ding, Z. Cyclic degradation characteristics of undisturbed soft dlayconsidering anisotropy. Adv. Mater.-Sci. Eng. 2021, 3978415. [Google Scholar] [CrossRef]
  33. He, S.H.; Goudarzy, M.; Ding, Z.; Sun, Y.; Xu, T.; Zhang, Q.F. Small-strain shear modulus (Gmax) and microscopic pore structure of calcareous sand with different grain size distributions. Granul. Matter 2022, 24, 112. [Google Scholar] [CrossRef]
  34. Ding, Z.; Chen, Y.; He, S.H.; Sun, M.M. Investigating the long-term deformation behaviour and non-coaxiality of siliceous sand under traffic cyclic loading. Constr. Build. Mater. 2023, 408, 133672. [Google Scholar] [CrossRef]
  35. Lee, Y.J.; Yoo, C.S. Behaviour of a bored tunnel adjacent to a line of loaded piles. In Proceedings of the ITA-AITES 2006 World Tunnel Congress and 32nd ITA General Assembly, Safety in the Underground Space, Seoul, Republic of Korea, 22–27 April 2006. [Google Scholar]
  36. Lee, Y.; Yoo, C. Two distinctive shear strain modes for pile-soil-tunnelling interaction in a granular mass. In Proceedings of the 6th International Symposium on Geotechnical Aspects of Underground Construction in Soft Ground, Balkema, Leiden, The Netherlands, 16 April 2008; pp. 683–688. [Google Scholar]
  37. Zhang, W.; Gu, X.; Zhong, W.; Ma, Z.; Ding, X. Review of transparent soil model testing technique for underground construction, ground visualization and result digitalization. Undergr. Space 2022, 7, 702–723. [Google Scholar] [CrossRef]
  38. Zhu, Y.; Zeng, B.; Ye, S.; He, L.; Zheng, Y.; Ma, R. Physical model tests and discrete-element simulation of pile and soil displacement response induced by DOT shield tunnelling based on transparent soil technology. Int. J. Geomech. 2023, 23, 04023124. [Google Scholar] [CrossRef]
  39. Wei, G.; Zhang, X.H.; Xu, Y.F.; Wang, Z. Prediction of ground settlement due to excavation of a quasi-rectangular shield tunnel based on stochastic medium theory. Geotech. Geol. Eng. 2019, 37, 3605–3618. [Google Scholar] [CrossRef]
  40. Yan, Y.; Zhang, M.; Cao, M. Study on the effect of large cross-section quasi-rectangular pipe jacking near side crossing viaduct piles in soft soil areas. Appl. Sci. 2023, 13, 9799. [Google Scholar] [CrossRef]
  41. Gui, M.; Bolton, M.D.; Garnier, J.; Corte, J.F.; Bagge, G.; Laue, J. Guidelines for cone penetration tests in sand. In Proceedings of the International Conference Centrifuge 98; CRC Press/A.A. Balkema: Leiden, The Netherlands, 1998; pp. 155–160. [Google Scholar]
  42. Zhao, D.; Wei, G.; Liang, L.; Jiang, H.; Xiang, P.; Mu, Z. Experimental study on responses of existing tunnels to adjacent quasi-rectangular shield tunnelling in sand. Tunn. Constr. 2024, 44, 1000–1011. [Google Scholar]
  43. Zhou, X.; Sheil, B.; Suryasentana, S.; Shi, P. Uncertainty-guided U-Net for soil boundary segmentation using Monte Carlo dropout. Comput.-Aided Civ. Infrastruct. Eng. 2025, 40, 1370–1387. [Google Scholar] [CrossRef]
  44. Milan, H.; Dienstmann, G. Assessment of vertical spatial variability in a marine sedimentary deposit based on standard penetration tests. Mar. Georesour. Geotechnol. 2026, 44, 81–91. [Google Scholar] [CrossRef]
  45. Utepov, Y.; Aldungarova, A.; Mukhamejanova, A.; Awwad, T.; Karaulov, S.; Makasheva, I. Voxel Interpolation of Geotechnical Properties and Soil Classification Based on Empirical Bayesian Kriging and Best-Fit Convergence Function. Buildings 2025, 15, 2452. [Google Scholar] [CrossRef]
  46. Lee, G.T.K.; Ng, C.W.W. Effects of advancing open face tunnelling on an existing loaded pile. J. Geotech. Geoenviron. Eng. 2005, 131, 193–201. [Google Scholar] [CrossRef]
  47. CEN. Eurocode 7 Part 1: Geotechnical Design: General Rules, Final Draft prEN 1997-1; European Committeef or Standardization (CEN): Brussels, Belgium, 2001. [Google Scholar]
Figure 1. Orthogonal underpass case: (a) plan view of test TP1; (b) elevation view of test TP1; (c) plan view of test TPG1; and (d) elevation view of test TPG1.
Buildings 16 01704 g001
Figure 2. Overlapping case model: (a) plan view of test TP2; (b) elevation view of test TP2. All dimensions are in mm in model scale.
Buildings 16 01704 g002
Figure 3. Model box: (a) front view; (b) sand-pumping machine; and (c) sand-spreading machine.
Buildings 16 01704 g003
Figure 4. Quasi-rectangular tunnel model: (a) physical picture; (b) working principle diagram.
Buildings 16 01704 g004
Figure 5. Existing circular tunnel model.
Buildings 16 01704 g005
Figure 6. Measurement of ground surface settlement.
Buildings 16 01704 g006
Figure 7. Measurement of piles: (a) single pile; (b) pile group.
Buildings 16 01704 g007
Figure 8. Layout drawing of strain gauge for measuring bending moment and axial force: (a) single pile; (b) 2 × 2 pile group. All dimensions are in mm in model scale.
Buildings 16 01704 g008
Figure 9. Ground surface settlement caused by QRS tunnel in test TP1: (a) distributions in longitudinal direction y; (b) distributions in transverse direction x.
Buildings 16 01704 g009
Figure 10. Ground surface settlement caused by QRS tunnel in test TP2: (a) distributions in longitudinal direction y; (b) distributions in transverse direction x.
Buildings 16 01704 g010
Figure 11. Settlement of single pile in tests TP1 and TP2.
Buildings 16 01704 g011
Figure 12. Axial forces along the pile: (a) test TP1; (b) test TP2; and (c) comparison of test TP1 and TP2.
Buildings 16 01704 g012
Figure 13. Induced bending moments in the pile: (a) test TP1; (b) test TP2; and (c) comparison of tests TP1 and TP2.
Buildings 16 01704 g013
Figure 14. Settlement of pile group in test TPG1.
Buildings 16 01704 g014
Figure 15. Transverse tilting of pile cap in test TPG1 [25].
Buildings 16 01704 g015
Figure 16. Axial forces along the pile in test TPG1: (a) pile A; (b) pile B.
Buildings 16 01704 g016
Figure 17. Induced bending moments in piles in test TPG1: (a) pile A; (b) pile B.
Buildings 16 01704 g017
Table 1. Test program.
TestPile TypeQRS Tunneling CaseRemark
TP1Single pileOrthogonal underpass (QRS tunnel axis perpendicular to the circular tunnel axis (Figure 1a,b))i. Comparison of TP1 and TPG1 for studying the influence of pile foundation type.
ii. Comparison TP1 and TP2 for studying the influence of tunnel underpass case.
TPG12 × 2 pile groupOrthogonal underpass (QRS tunnel axis perpendicular to the circular tunnel axis (Figure 1c,d))
TP2Single pileOverlapping underpass (QRS tunnel axis aligned with the circular tunnel axis (Figure 2))
Table 2. Parameters of sand in tests.
SoilDensity (g/cm3)Internal Friction Angle (°)PorosityCompression Modulus (MPa)
Dry sand1.8134.30.4756.28
Disclaimer/Publisher’s Note: The statements, opinions and data contained in all publications are solely those of the individual author(s) and contributor(s) and not of MDPI and/or the editor(s). MDPI and/or the editor(s) disclaim responsibility for any injury to people or property resulting from any ideas, methods, instructions or products referred to in the content.