Article

Influence of Welding Sequence of T-Rib on Welding Deformation and Residual Stress of Steel Box Girder

1
Chongqing Expressway Juneng Construction Group Co., Ltd., Chongqing 400020, China
2
Civil Engineering School, Chongqing Jiaotong University, Chongqing 400074, China
3
CCCC Highway Consultants Co., Ltd., Beijing 100010, China
*
Author to whom correspondence should be addressed.
Buildings 2026, 16(8), 1598; https://doi.org/10.3390/buildings16081598
Submission received: 21 March 2026 / Revised: 11 April 2026 / Accepted: 16 April 2026 / Published: 18 April 2026

Abstract

Traditionally, the calibration of welding heat source model parameters mainly relies on empirical trial-and-error methods, which lack clear guidance and generally lead to low computational efficiency. To address this problem, this paper establishes a quantitative relationship between heat source parameters and weld pool dimensions, which significantly improves the efficiency and accuracy of the simulation. Furthermore, the influence of laws of key parameters of the double-ellipsoid heat source and welding thermal efficiency on the geometric characteristics of the weld pool is systematically analyzed via numerical simulation. On this basis, finite element models considering different welding sequences are established for single and multiple T-rib components, and appropriate welding process parameters are determined according to the influence laws of heat source parameters. The thermo-elastic–plastic finite element method is then adopted to analyze the effects of welding sequences on the welding residual stress and deformation of T-rib and top-plate joints in steel box girders. By comparing different welding schemes, optimized welding strategies for single and multi-rib welding are proposed. The results show that for single T-ribs, simultaneous welding in the same direction produces the minimum residual stress and deformation with almost no distortion, followed by sequential bilateral welding in the same direction. For multi-rib welding with a spacing of 300 mm, synchronous welding yields the smallest deformation, followed by symmetric double-pass synchronous welding from inside to outside. For continuous single-pass welding, an inside-to-outside skip welding sequence is recommended to effectively control residual stress and deformation.

1. Introduction

Steel box girder bridges are widely used in engineering owing to their light weight, high bearing capacity, and fast construction efficiency [1,2]. In industrial production, top plates, bottom plates, diaphragms, and longitudinal and transverse stiffeners are first assembled and welded into segments in a factory. These segments are then transported to the site for erection, completing the full construction of steel box girder bridges. Welding is critical for connecting individual steel components into an integral structure. This study focuses on the mechanical performance of longitudinally stiffened T-ribs under single-rib and multi-rib welding during factory fabrication [3,4].
Uneven temperature distributions during welding, heating and cooling inevitably cause residual stress and deformation in steel box girders, which seriously reduce assembly accuracy and mechanical performance. To reduce welding deformation and residual stress, many control methods have been proposed. Among them, the welding sequence significantly affects the distribution of residual deformation and stress, while being economically efficient in engineering. Therefore, determining the optimal welding sequence is an effective way to reduce welding residual stress and deformation [5].
Over recent decades, researchers have carried out extensive investigations into the welding effects and design methodologies of welded structures. A critical technical issue in the manufacture of welded components is to determine the optimal welding sequence for minimizing residual stress and deformation. Tajik et al. [6] used the finite element method to perform thermo-mechanical coupling simulation and realized numerical modeling of welding residual stress through Abaqus and Fortran programming. The numerical results were verified against published test data, showing that the welding sequence strongly influences maximum residual stress. Based on this, an optimized multi-pass welding scheme was proposed to reduce deformation and residual stress in angle-welded steel box components. Ghafouri et al. [7] used the finite element method to numerically analyze the influences of welding sequence and external constraints on angular deformation and residual stress of short fillet welds in S700 high-strength steel. Results showed that external constraints have a strong effect on angular deformation and peak residual stress, while the welding sequence has a relatively mild impact. Yan et al. [8] combined experiments and numerical simulation to establish three-dimensional thermo-elastic–plastic finite element models for corrugated web I-beams and traditional flat web I-beams. The residual stress field of corrugated web I-beams was measured using the resistance strain gauge method. It was found that the welding residual stress distribution is generally similar to that of flat web members, while welding deformation is closely related to web geometry. Samadi et al. [9] carried out experimental research on welded structural members, including welding processes and post-fabrication fatigue crack detection. Test results indicated that more welding passes increase residual compressive stress and maximum deformation, while gradually improving the fatigue life of the structure. Khoshroyan and Darvazi [10] studied the influences of welding parameters on residual stress and deformation in T-joints and established a thermo-mechanical coupling finite element model using ANSYS. It was concluded that increasing welding speed reduces vertical displacement and angular deformation of the flange, while higher welding current intensifies residual stress and deformation in the flange and stiffeners. Wei et al. [11] used theoretical derivation and experimental testing to analyze the full welding process of composite box girders with corrugated steel webs, revealing the formation mechanism and spatial distribution of welding residual stress, and proposing a special theoretical calculation method for such residual stress. Based on the derived residual stress formula and verified finite element model, the team performed nonlinear buckling analysis on corrugated steel webs. Tests and simulations showed that considering welding residual stress provides more accurate predictions of failure modes and load–displacement curves than traditional specification methods that only introduce initial structural defects. Uaje and Murakoshi [12] used the effective notch stress method to evaluate the influences of different wheel load distributions on local stress characteristics and analyzed cases where the load position slightly deviates from the U-rib central axis. Their study clarified that reducing weld penetration may change local stress distribution and alter the initial crack direction in welded joints. Long et al. [13] focused on the mechanical performance of internal welding of U-ribs in orthotropic steel bridge decks and established a three-dimensional thermo-mechanical coupling numerical model for U-ribs using ABAQUS. Results showed that the stress distribution of single-sided welded structures is basically consistent with that of double-sided welded structures. Under severe loading conditions, structural stress at the outer weld toes of the deck and U-rib exceeds 80 MPa. Among all factors, weld penetration depth most significantly affects the structural stress of external welds. Reasonable design of internal welds can effectively suppress stress concentration and improve the overall welding quality of related components. Jiang et al. [14] used numerical simulation to analyze welding residual stress in U-ribs and revealed the mechanism of welding parameters and geometric dimensions on residual stress generation and distribution. For double-sided welded U-ribs, Zhang et al. [15] performed finite element calculations and obtained detailed residual stress distribution features. Liang et al. [16] proposed a regression-based residual stress calculation formula for full-penetration double-sided welded U-ribs, which is closely related to actual weld length. Lan et al. [17] studied the influence of welding sequence on residual stress and deformation of T-joints and found that finishing one side before welding the opposite side produces the lowest residual stress. In previous studies [18,19], the welding process of individual T-ribs in steel box girders—especially the connection between multiple longitudinal T-ribs and top/bottom plates—was generally considered to have little effect on the mechanical performance of the whole box girder system. In addition, the determination of heat source model parameters has long relied on empirical experience, despite the large number of variables involved. Without clarifying the distribution laws of relevant indicators and conducting targeted quantitative analysis, overall research efficiency is low and simulation accuracy cannot be guaranteed.
Current welding standards and specifications for bridge steel structures mainly focus on macroscopic requirements such as welding materials, process parameters, weld quality inspection, and residual stress limits. Although these standards provide basic quality control for steel structure welding, they do not offer specific and quantifiable guidelines for welding path and sequence optimization for typical members such as T-ribs in steel box girders. Existing standards emphasize the control of welding results rather than the thermal input timing and coordinated welding paths in multi-pass and multi-rib welding. As a result, welding sequences in engineering practice are highly dependent on on-site experience, making it difficult to achieve precise control of residual stress and deformation. Against the background of mass industrial manufacturing of steel box girders, such gaps in standards restrict the optimization of welding processes and the improvement of structural forming quality. Therefore, quantitative research on welding paths and sequences for T-ribs is of great theoretical and engineering value to fill the gap in welding process optimization specifications, establish standardized welding procedures for engineering applications, and improve the durability and assembly accuracy of steel box girder welded structures.
Therefore, this study employs the double-ellipsoid heat source model as the theoretical foundation for numerical simulation. Firstly, the effects of key heat source parameters and welding thermal efficiency on the characteristic parameters of the post-weld molten pool are systematically investigated, and a quantitative parametric calibration method is proposed to replace conventional empirical trial-and-error procedures, thereby significantly improving simulation efficiency and accuracy. On this basis, numerical simulation is performed on the welding process between longitudinally stiffened T-ribs and top plates. The influences of welding sequence on residual stress and deformation are further explored under single-rib and multi-rib conditions with varied spacing. This research not only reveals the fundamental laws governing welding-induced residual stress and deformation but also provides optimized welding sequences for practical engineering. The findings are of great significance for enhancing the manufacturing quality, structural durability, and assembly accuracy of steel box girder bridges, while offering a reliable theoretical basis and technical support for the formulation of standardized welding procedures and relevant industrial specifications.

2. Numerical Investigation on Welding Simulation and Parameterized Heat Source Analysis

2.1. Geometric Models and Mesh Division

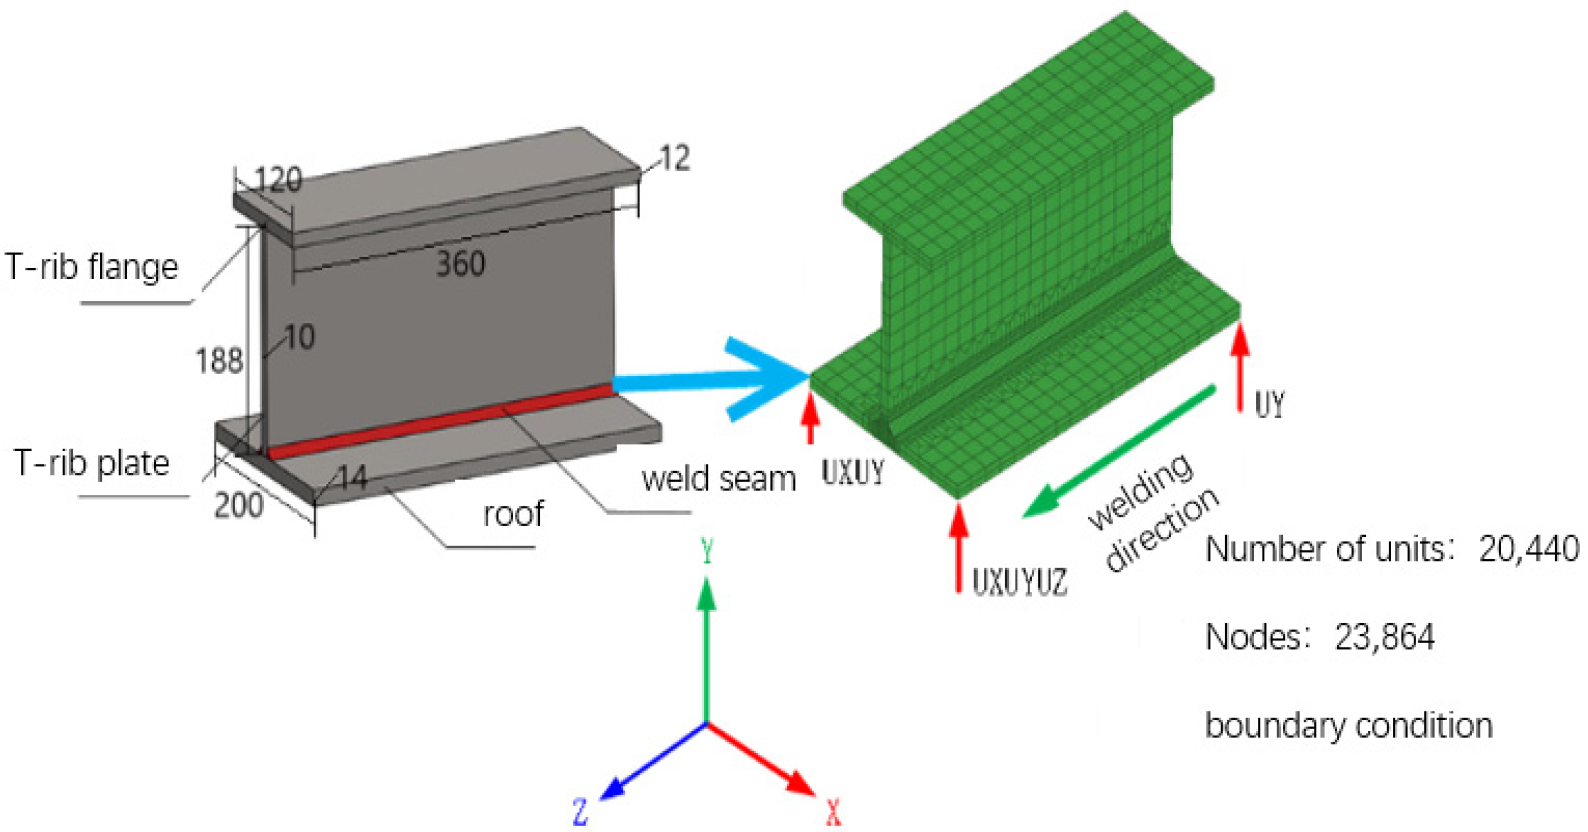
This study uses the thermo-elastic–plastic finite element method to calculate welding deformation and stress fields of T-rib and top plate composite members. A graded mesh strategy is adopted: dense meshes are used near the weld, relatively sparse meshes in regions far from the weld, and transition meshes in between. All elements adopt the eight-node hexahedral element type. Meanwhile, to ensure the accuracy of numerical simulation results, there are at least four layers of elements along both the depth and width directions of the molten pool. The finite element model is discretized into 20,440 elements and 23,864 nodes. The geometric model and mesh division are shown in Figure 1.
Two types of boundary conditions are applied to the model: thermal boundary conditions and mechanical boundary conditions. For the thermal boundary conditions, Newton’s law of cooling and the Stefan–Boltzmann law are adopted to consider the convection and radiation between the T-rib, top plate and the external environment, respectively. In Visual Mesh, the outer surface 2D elements are extracted from the 3D elements to act as heat transfer elements. The ambient temperature is set to 20 °C. For the mechanical boundary conditions, displacement constraints are imposed to prevent rigid-body displacement while ensuring the free release of stress. Full displacement constraints (UX, UY, UZ) are applied at the support locations.

2.2. Selection of Heat Source Model

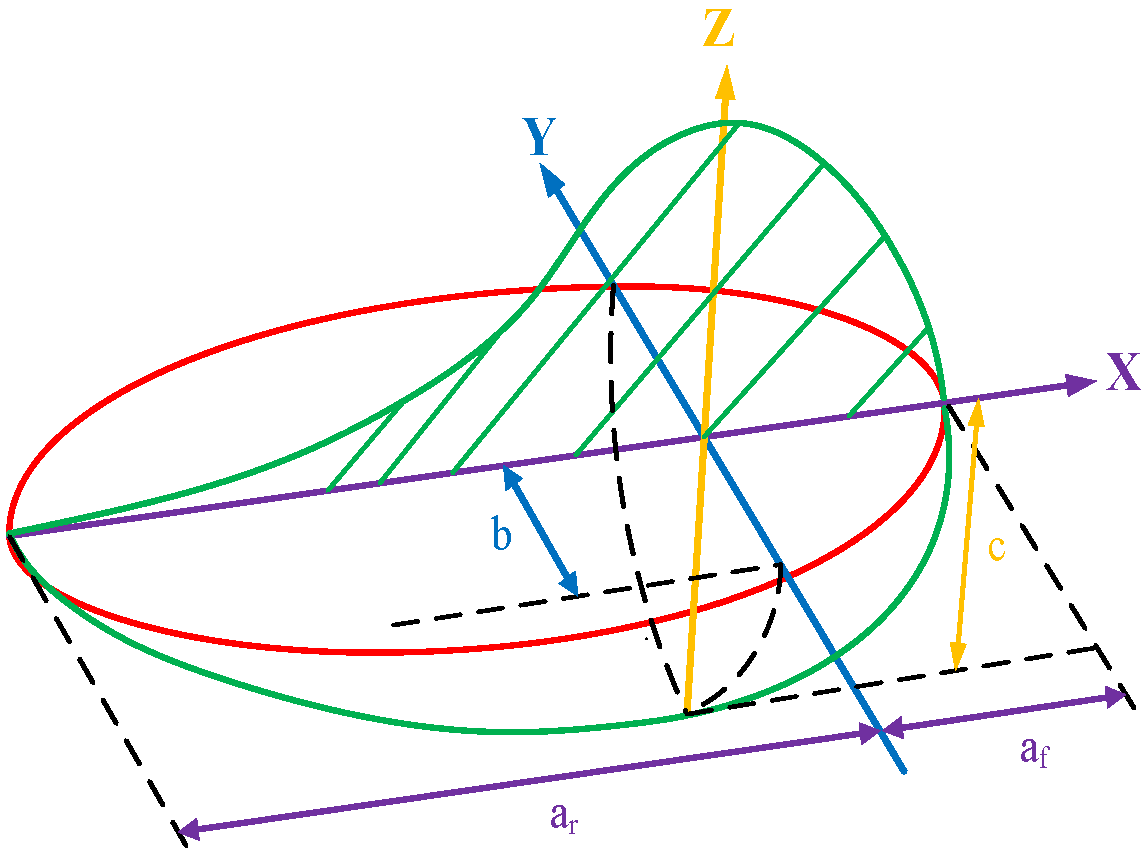
Submerged arc welding is widely used in bridge engineering. Considering the arc penetration effect, Goldak et al. [20] developed the double-ellipsoid heat source model, whose weld pool shape matches actual welding conditions and can accurately predict the temperature field of welded components. Subsequent analyses in this study are based on this model, with core parameters shown in Figure 2.
The parameters controlling heat source distribution are: a f , a r , b , and c . According to the double-ellipsoid heat source theory, the heat flux distribution functions of the front and rear ellipsoids are expressed as
q f x , y , z = 6 3 f f Q a f b c π π exp 3 x 2 a f 2 3 y 2 b 3 z 2 c 2 , x 0
q r x , y , z = 6 3 f r Q a r b c π π exp 3 x 2 a r 3 y 2 b 3 z 2 c , x < 0
Heat input in the front half:
2 0 0 0 q f x , y , z d x d y d z = 6 3 f f Q a f b c π π 0 exp 3 x 2 a f 2 d x 0 exp 3 y 2 b 2 d y 0 exp 3 z 2 c 2 d z = 2 × 6 3 f f Q a f b c π π × a f 3 π 2 × b 3 π 2 c 3 π 2 = 1 2 f f Q
Similarly, the heat input in the rear half can be obtained as follows:
2 0 0 0 q r x , y , z d x d y d z = 1 2 f r Q
Since:
η I U = 1 2 f f Q + 1 2 f r Q = 1 2 Q f f + f r = Q
Therefore, we obtain:
f f + f r = 2
where
  • Q—effective thermal power of the electric arc.
  • η—hermal efficiency of the electric arc.
  • I—welding current.
  • U—arc voltage.
In these equations, f f and f r represent the energy distribution coefficients for the front and rear ellipsoids, respectively. Meanwhile, a f , a r , b , and c represent the front semi-axis length, rear semi-axis length, width, and depth of the actual weld pool.
During heat source calibration, these parameters are determined following certain rules. Among them, a f , a r , b , and c are determined by the front half-length, rear half-length, width, and depth of the actual weld pool, combined with methods from relevant literature. When the methods in the literature are not applicable, it is necessary to conduct iterative numerical simulation trials using experimentally obtained parameters until the weld pool obtained from numerical simulation matches the experimental weld pool within the allowable error range.

2.3. Comparative Analysis of Numerical Simulation and Experiment

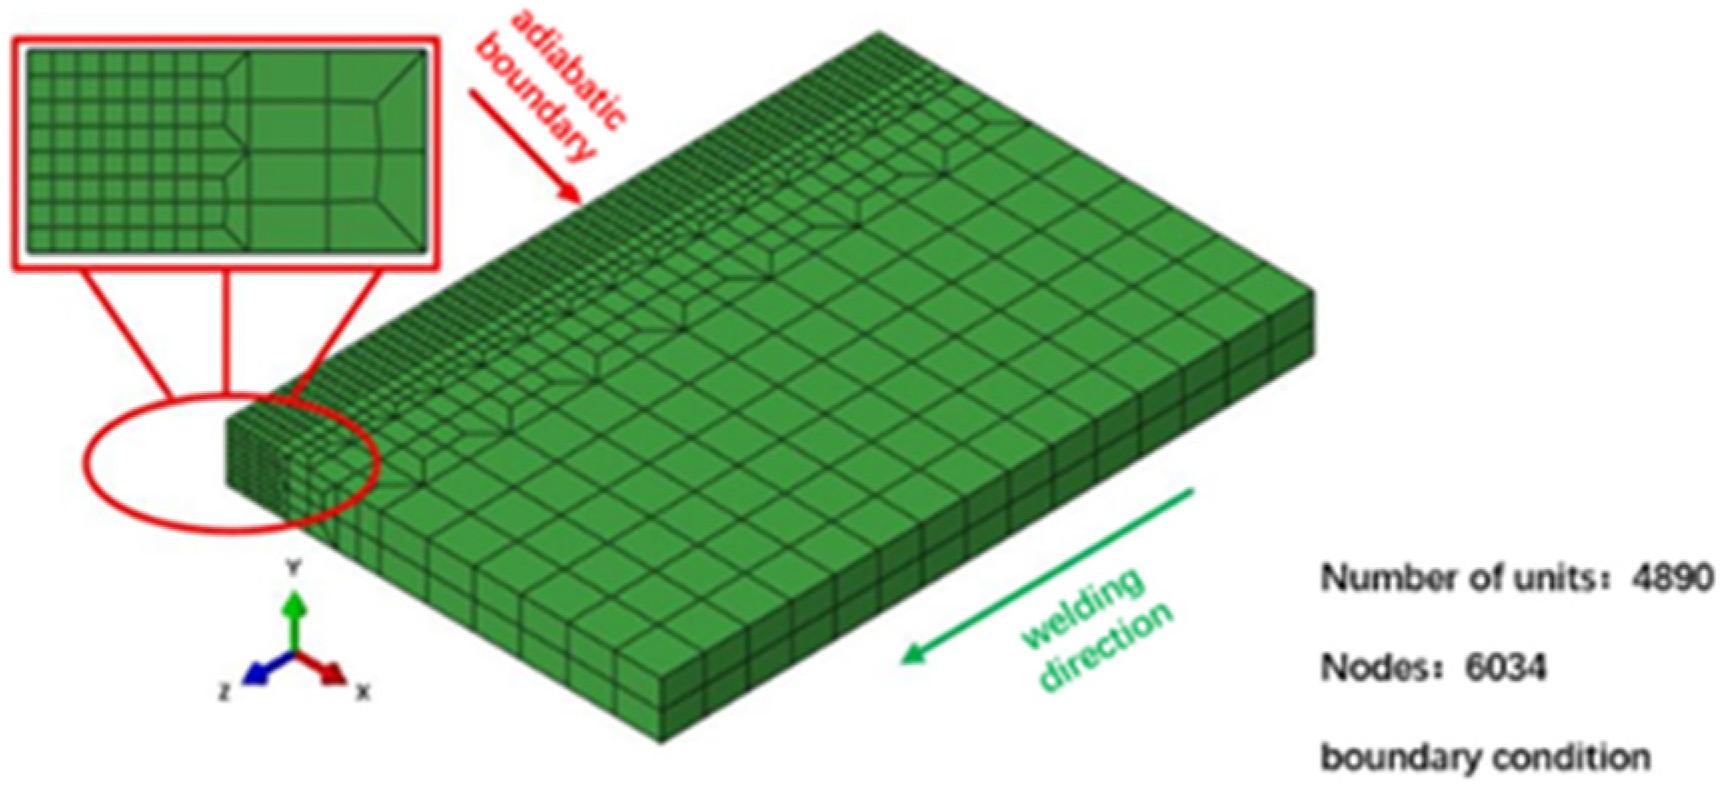
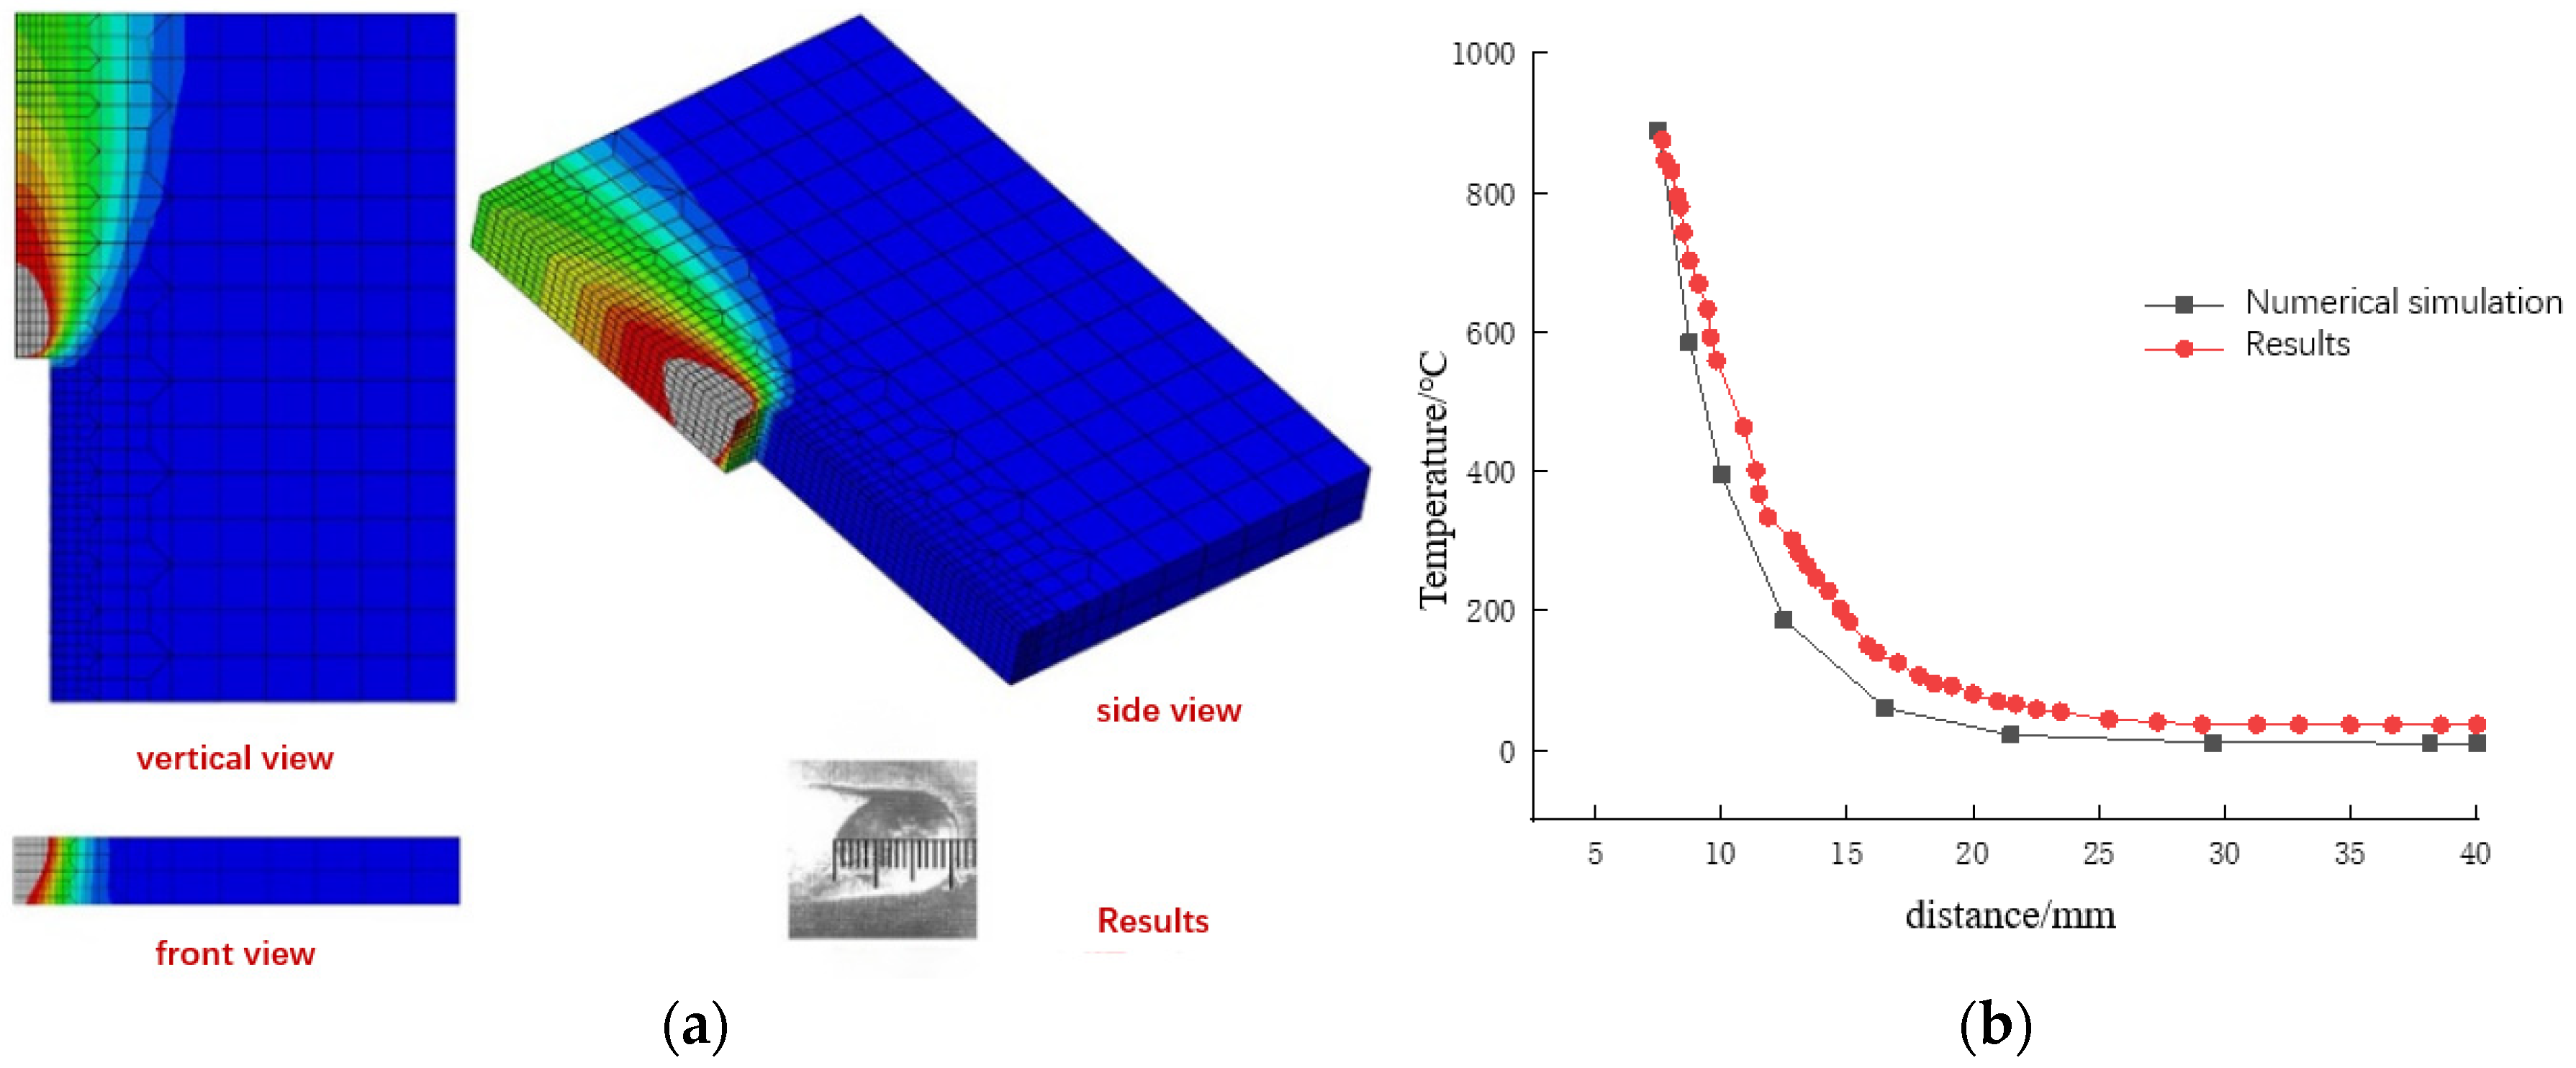
To verify the accuracy of the finite element welding simulation method, numerical simulations were compared with experimental data from literature [21]. The model size is taken as 80 × 20 × 100 mm3, and two plates are butt-welded. The corresponding finite element model is depicted in Figure 3. The convective exchange coefficient in the model is set to 9 W/m2/K according to relevant literature, and the external temperature is 20 °C. The thermal parameters of the materials used in the model and experiment are the same. Using the welding process parameters from the literature: current I = 200 A, voltage U = 13.5 V, and welding speed v = 2 mm/s. Based on previous relevant methods and combined with actual melt pool shape parameters, continuous calculations were conducted to determine the heat source model parameters as a = 2 mm, a = 6 mm, b = 6.5 mm, and c = 8 mm.
Figure 4a presents a comparison of the weld pool morphology between the simulation and experimental results at a welding time of 29.2 s. As shown in Table 1, the relative errors of the weld width and weld length are 3.8% and 3.1%, respectively. The simulated weld depth achieves full penetration, which is consistent with the experimental observations, and the overall weld pool morphology exhibits good agreement between the simulation and experiment. Figure 4b compares the surface temperature distribution perpendicular to the welding direction at 50 s, showing consistent trends and values. Because heat source parameters are affected by welding conditions, the determination of heat source parameters will be further analyzed. In summary, the finite element analysis results of the temperature field reflect the basic characteristics of the actual welding process and are in good agreement with the temperature distribution and molten pool morphology during actual welding. Therefore, the heat source parameters determined above can be used as benchmark values in the subsequent discussion of the post-weld molten pool.

2.4. Analysis on Heat Source Parameters of Double-Ellipsoid Model

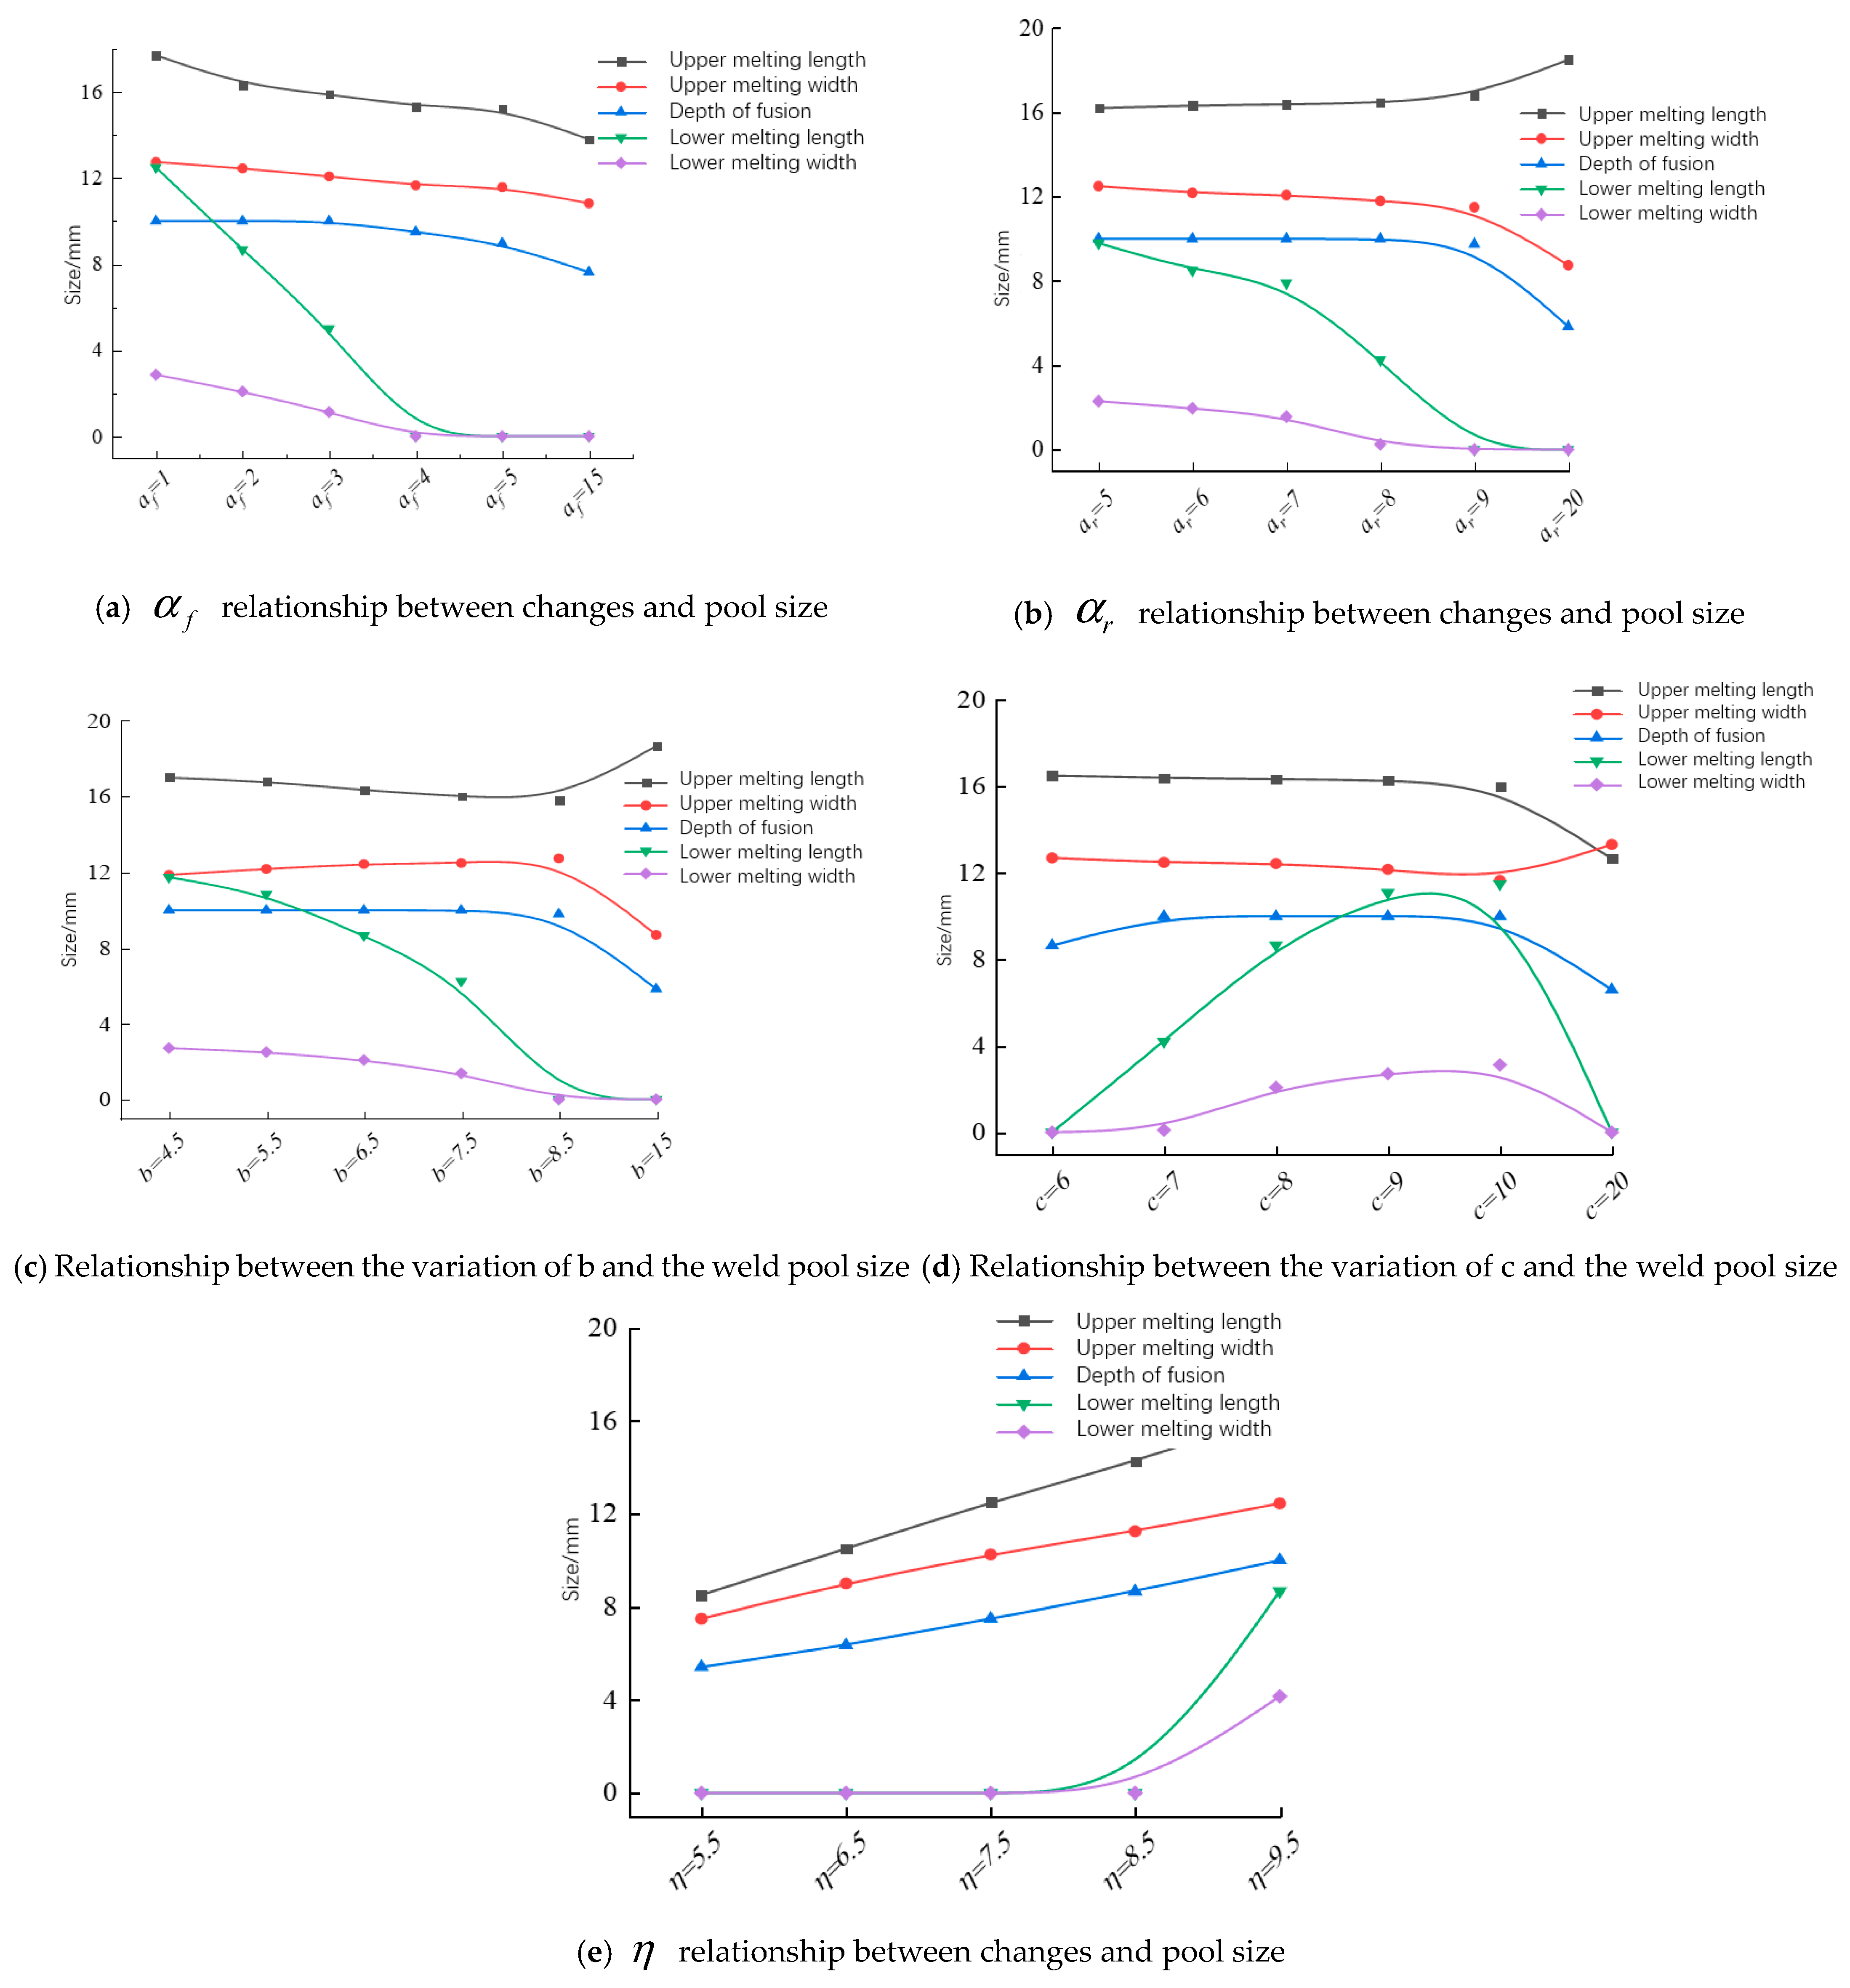
Based on the above welding test model (Figure 3), this section explores the influences of double-ellipsoid heat source parameters and thermal efficiency on weld pool morphology. The influences of a f , a r , b , and c and thermal efficiency m on molten pool shape, with basic parameter values consistent with Table 2.
At a welding duration of 29.2 s, the variation curve of the molten pool is plotted according to the welding temperature cloud diagram. The correlations between variations in various parameters and molten pool dimensions are illustrated in Figure 5a–e. Quantitative analysis was carried out on the influence of double-ellipsoid heat source parameters and thermal efficiency on weld pool geometry. With other parameters kept constant, each key parameter was increased by 10%, and the changes are as follows: When the front semi-axis α f increases by 10%, the weld width decreases by 4.2%, penetration decreases by 3.5%, and weld length decreases by 8.7%. When the rear semi-axis α r increases by 10%, the weld width increases by 3.8%, penetration increases by 2.9%, and weld length increases by 5.3%. When the heat source width b increases by 10%, the weld width increases by 6.5%, penetration increases by 4.1%, and weld length decreases by 2.2%. When the heat depth c increases by 10%, the weld width decreases by 2.1%, penetration increases by 7.8%, and weld length decreases by 3.4%. When the thermal efficiency m increases by 10%, the weld width increases by 8.3%, penetration increases by 9.1%, and weld length increases by 11.2%, showing the most significant linear effect. Among all parameters, thermal efficiency has the strongest influence on the molten pool size, and the growth rate of weld length is higher than that of penetration and weld width.
Traditional parameter calibration of welding heat sources primarily relies on empirical trial and error, which requires repeated manual adjustment and iterative calculation. Typically, 10 to 20 iterations are needed to obtain viable parameters, resulting in low computational efficiency and a high degree of subjectivity. In this paper, a strategy combining quantitative parametric scanning with geometric feature matching of the molten pool is proposed. By establishing quantitative relationships between the heat source parameters ( a f , a r , b, c) and thermal efficiency, as well as the characteristic dimensions of the molten pool (fusion length, fusion width, and fusion depth), the target parameters can be determined in only 3 to 5 iterations. This represents a reduction of over 60% in the number of iterations. Furthermore, the geometric morphology of the molten pool is used as the direct objective function for parameter matching, which eliminates artificial errors and further improves the efficiency and accuracy of parameter calibration.

2.5. Loading Calculations and Material Properties

Based on the analysis of the effects of shape parameters and thermal efficiency parameters of various heat sources on the post-weld molten pool shape, and in accordance with the relevant specification requirements for the weld pool, the parameter values adopted in the simulation analysis of T-rib and top plate welding are listed in Table 3. The welding process adopted automatic submerged arc welding, with a welding speed of 4 mm/s, an ambient temperature of 20 °C, an intermediate cooling duration of 400 s, and a uniform cooling time of 3600 s after the completion of the second fillet weld.
The test plate used in this study is Q345 steel. The welding process involves thermo-elastic–plastic deformation and phase transformation of the base metal. According to ref. [22], the thermal and mechanical properties of Q345 steel varying with temperature are listed in Table 4.

3. Welding Sequence Analysis of Single T-Rib Double-Sided Fillet Weld

3.1. Simulation Sequence of Double-Seam Welding

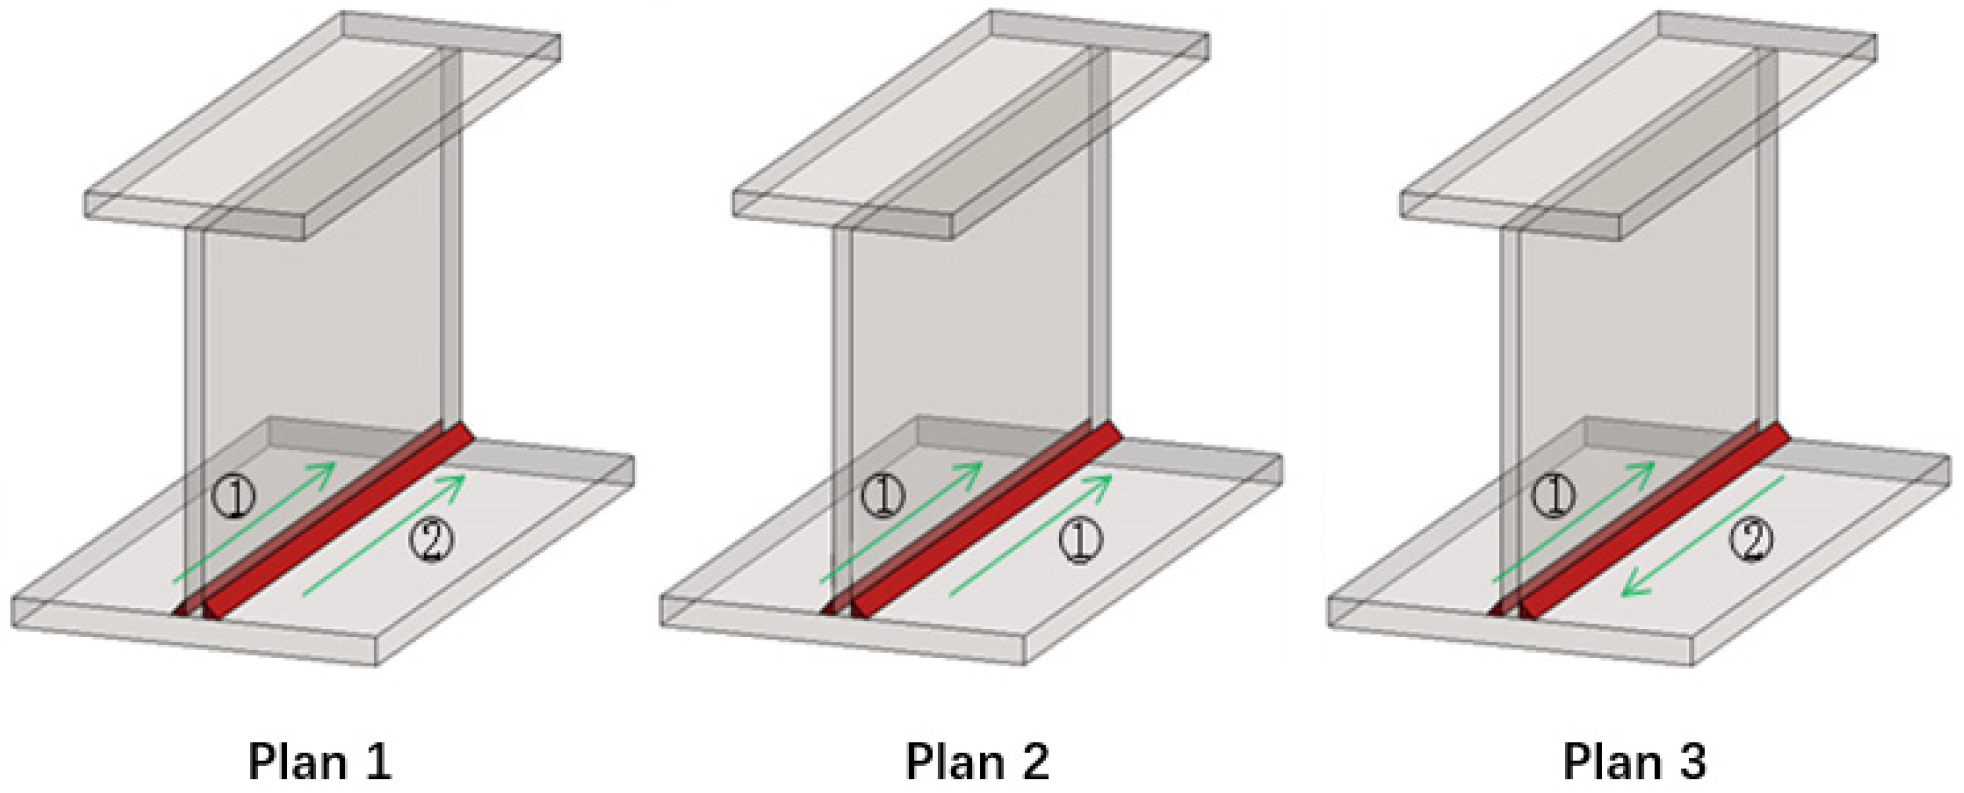
The longitudinally stiffened T-rib is connected to the top plate through two bilateral fillet welds. This paper takes the assembly of a single T-rib segment and top plate as the research object, with the core goal of determining the optimal welding sequence for the two fillet welds. For a single T-rib, the three most commonly used bilateral fillet welding sequences in engineering are selected: same-direction simultaneous welding, sequential same-direction welding, and reverse-direction welding. The detailed welding sequence scheme is shown in Figure 6, where welding is performed according to weld numbering, and arrows indicate welding direction.

3.2. Effects of Double-Seam Welding Sequence on Single Rib Welding Deformation

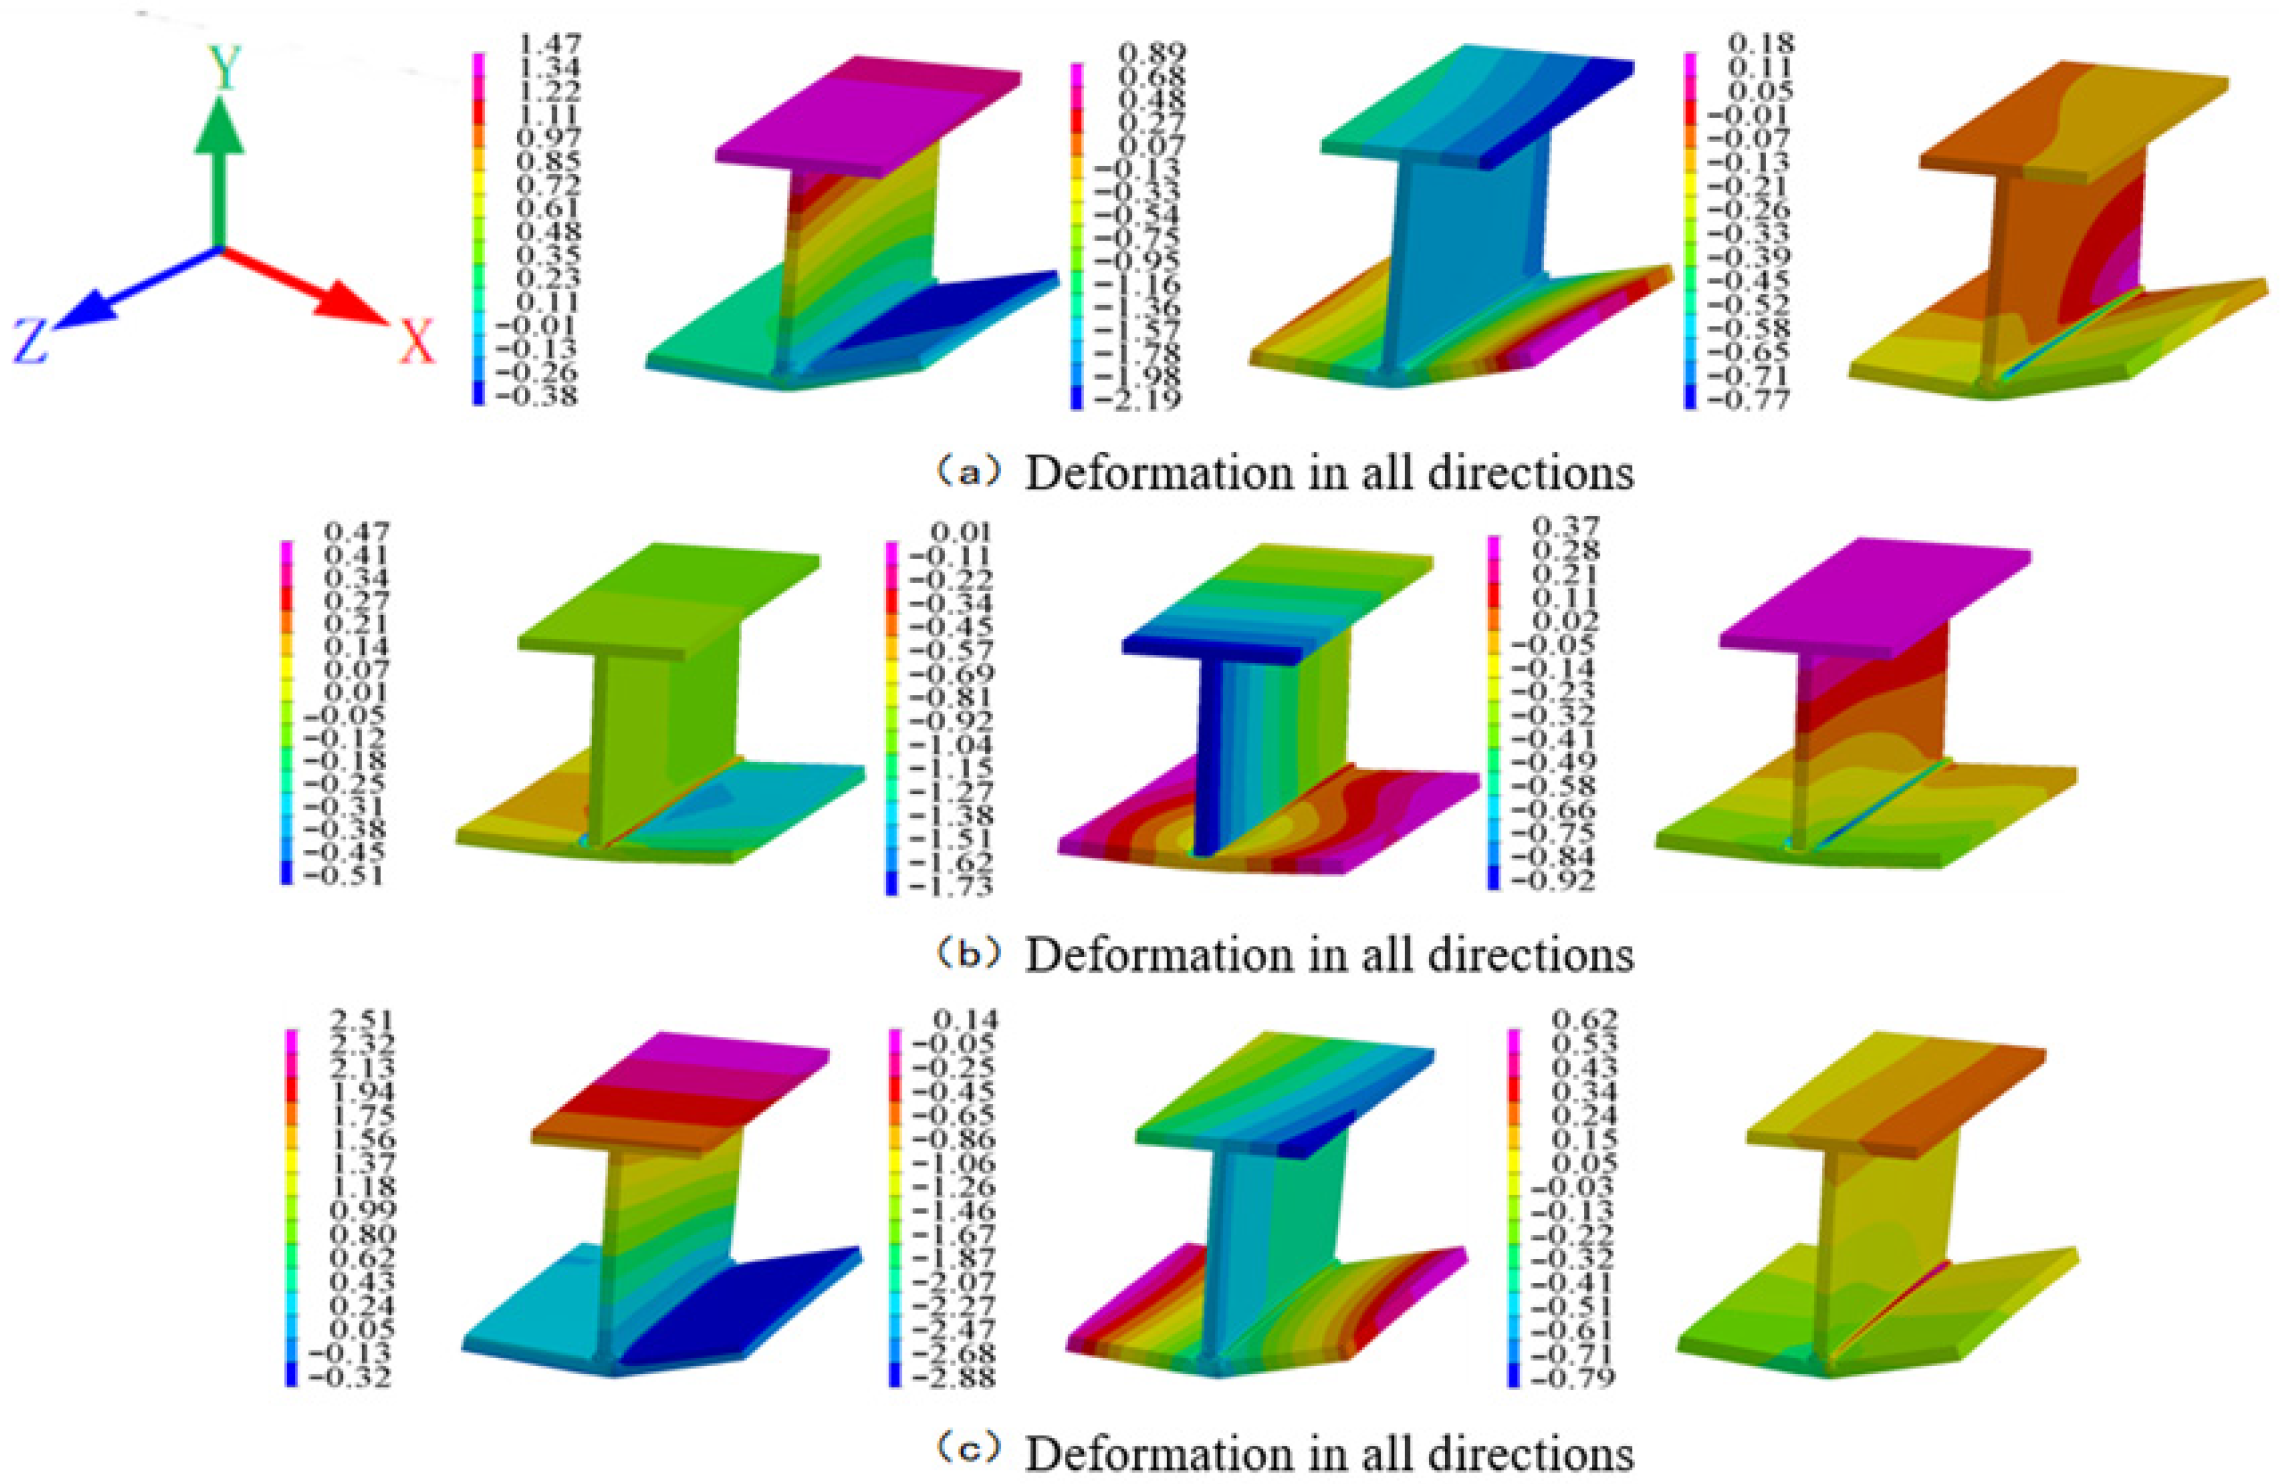
Figure 7a–c show the deformation cloud maps of different welding schemes in various directions after welding, corresponding to the x, y, and z directions in sequence. It can be clearly seen from these cloud maps that the welding deformation caused by all three schemes is mainly characterized by angular deformation of the top plate. In addition, noticeable twisting deformation occurs in the top plate, rib plate and flange under Scheme 3. This is because when welding the angular welds in reverse, the angular deformation law is opposite, causing twisting deformation of the flange plate and rib plate. For Plan 2, adopting simultaneous same-direction welding, the induced deformations are equivalent in magnitude and opposite in direction, which can effectively suppress the torsional deformation of the welded structure.
As listed in Table 5, taking the maximum deformation of Scheme 2 as the benchmark, the maximum angular deformation of Scheme 1 is 123.3% of Scheme 2, and the maximum torsional deformation is 108.5%; while the maximum angular deformation of Scheme 3 reaches 156.8% of Scheme 2, and the maximum torsional deformation is as high as 212.4%. The quantitative comparison fully demonstrates that Scheme 2 outperforms the other two schemes. Furthermore, nearly no distortion deformation is observed under the simultaneous same-direction welding adopted in Scheme 2, and its overall deformation is reduced by 23.3% compared with Scheme 1 and by 56.8% compared with Scheme 3.

3.3. The Influence of Double-Seam Welding Sequence on the Stress of Single Rib Welding

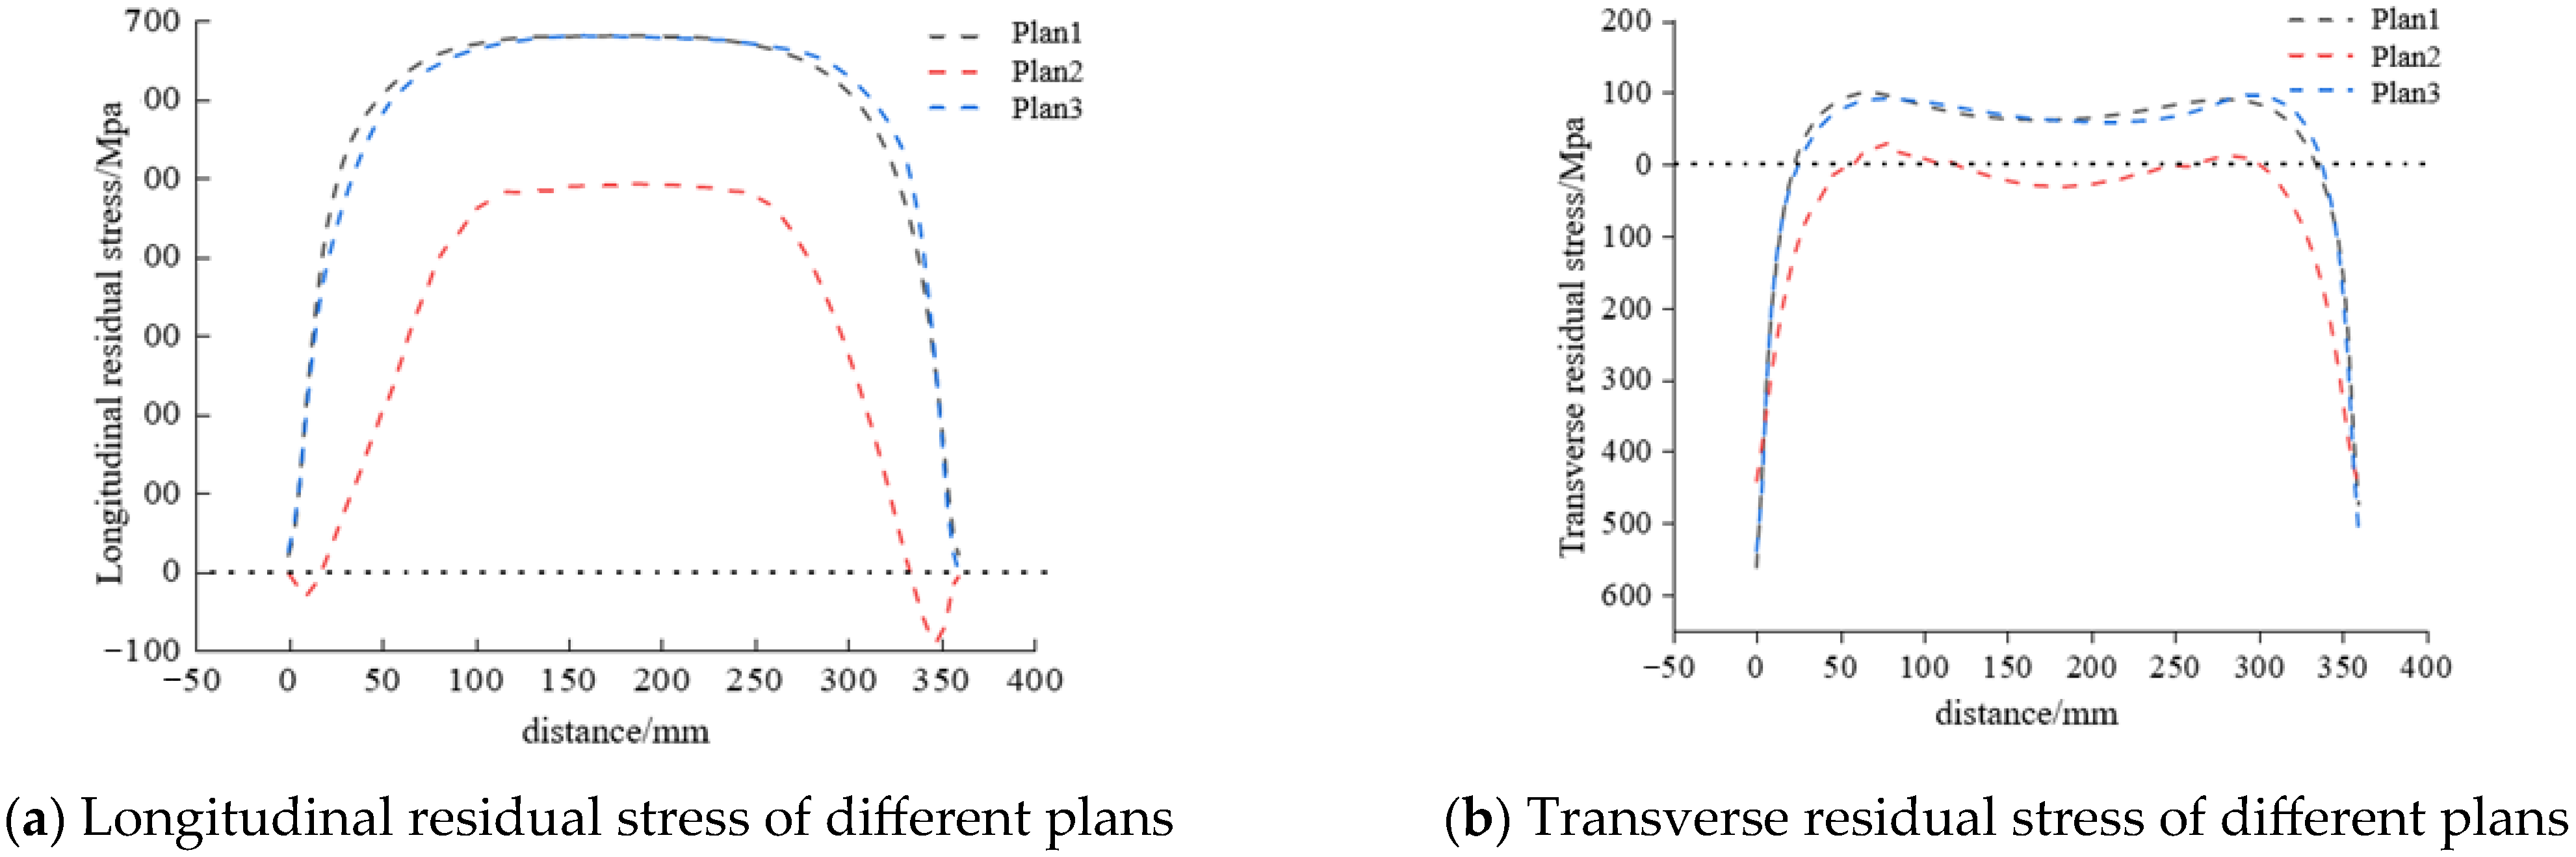
The residual stresses in the longitudinal and transverse directions (x direction) of each plan of the longitudinal path (z direction) are shown in Figure 8, with the starting position of the horizontal axis being the arc starting end of the steel plate edge weld. The residual stress exhibits identical variation trends in both the horizontal and vertical directions, while the residual stress in the middle welding section remains stable around a fixed value. Residual stress exhibits consistent variation trends in both horizontal and vertical directions, with its value in the middle welding section staying stable around a fixed level. It can be seen from Table 6 that, taking Scheme 2 as the benchmark (100%), the quantitative comparison results are as follows. Scheme 1: maximum longitudinal residual stress is 118.5% and maximum transverse residual stress is 114.2%; Scheme 3: maximum longitudinal residual stress is 132.7% and maximum transverse residual stress is 127.9%. Compared with Scheme 1, Scheme 2 reduces the longitudinal residual stress by 18.5%; compared with Scheme 3, it reduces it by 32.7%. As shown in Figure 8a, the residual tensile stress of the three plans increases as the weld distance narrows, and local stress even exceeds the yield strength of Q345 steel, which is the main cause of cracking in steel box girder welded components.
Based on a comprehensive analysis of deformation and stress fields, it can be concluded that Plan 2 is better than the other two for single T-rib structures with bilateral fillet welds. For cases where only one-sided fillet weld can be welded at a time, Table 5 shows that Plan 3 has larger maximum deformation in three coordinate directions than Plan 1, indicating that Plan 1 is slightly better than Plan 3.

4. Study on the Influence of Spacing During Multi-Rib Welding

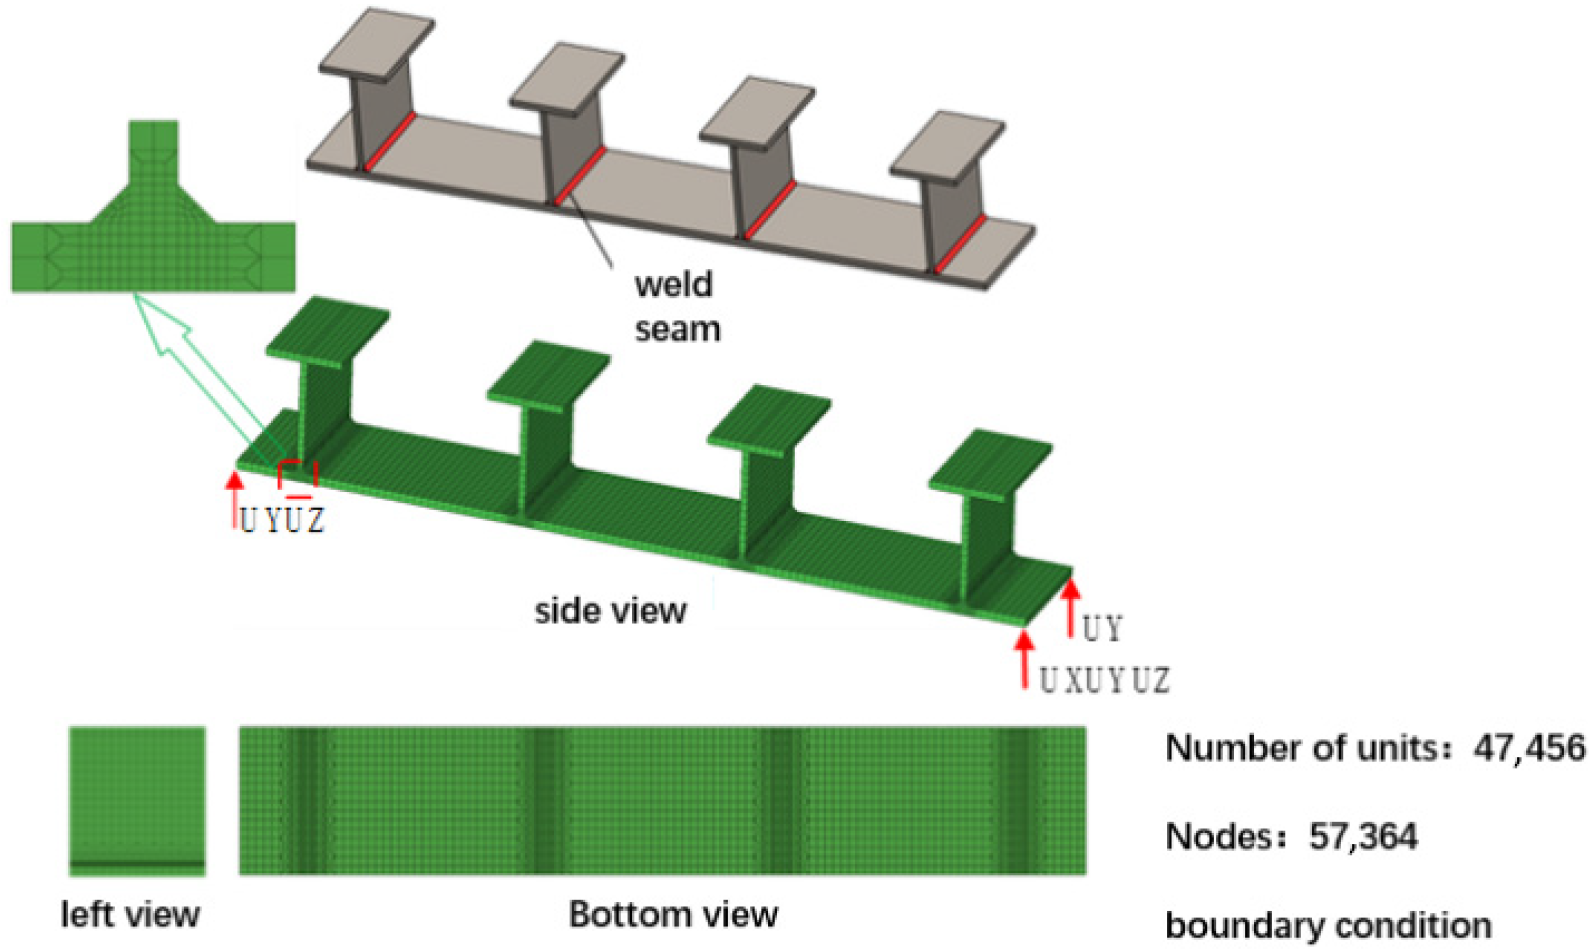
The mesh generation strategy, material properties, boundary conditions, and heat source model employed in this section remain consistent with those in the preceding analysis. The geometric dimensions are largely identical, except that three additional T-ribs connected to the top plate are introduced, and the spacing between adjacent T-ribs is varied from 150 mm to 550 mm. To reduce computational cost without compromising the research objectives, the model length is simplified to 320 mm. The geometric configuration and corresponding finite element model are illustrated in Figure 9, using a model with 350 mm T-rib spacing as a representative example.

4.1. Welding Sequence Scheme Setting

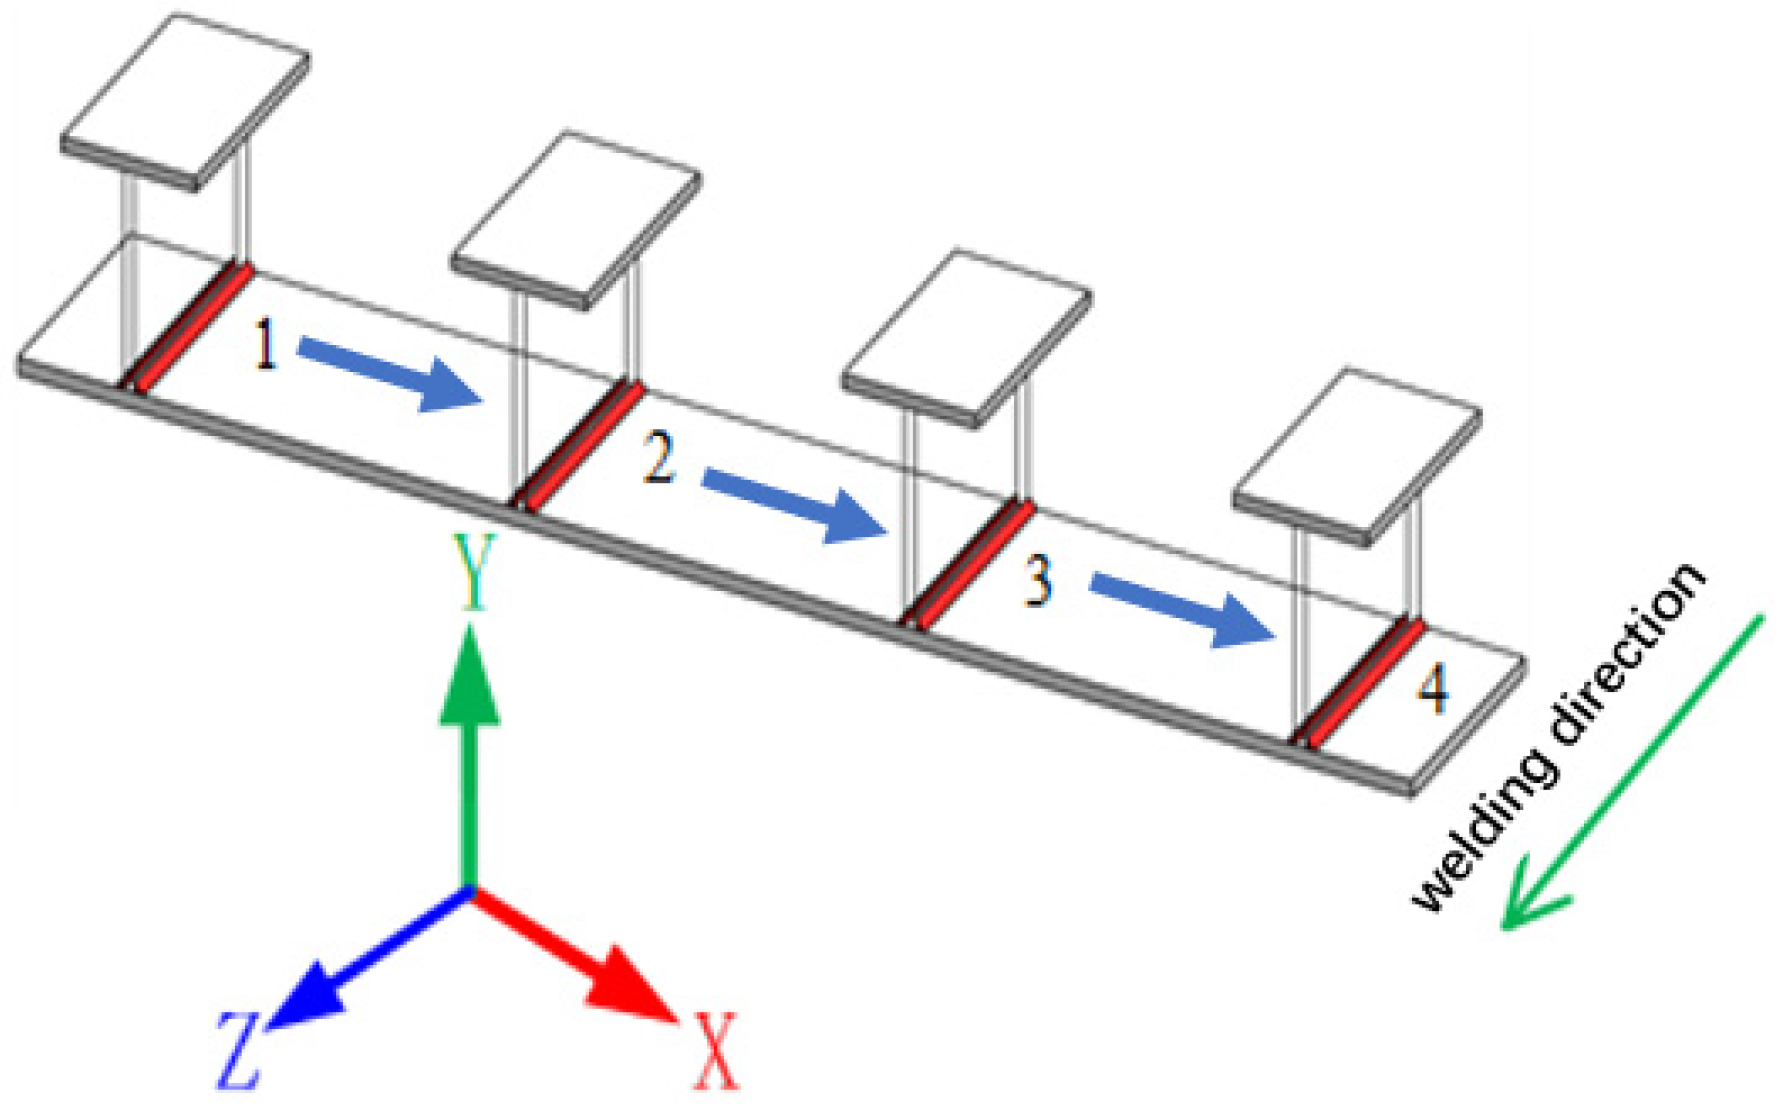
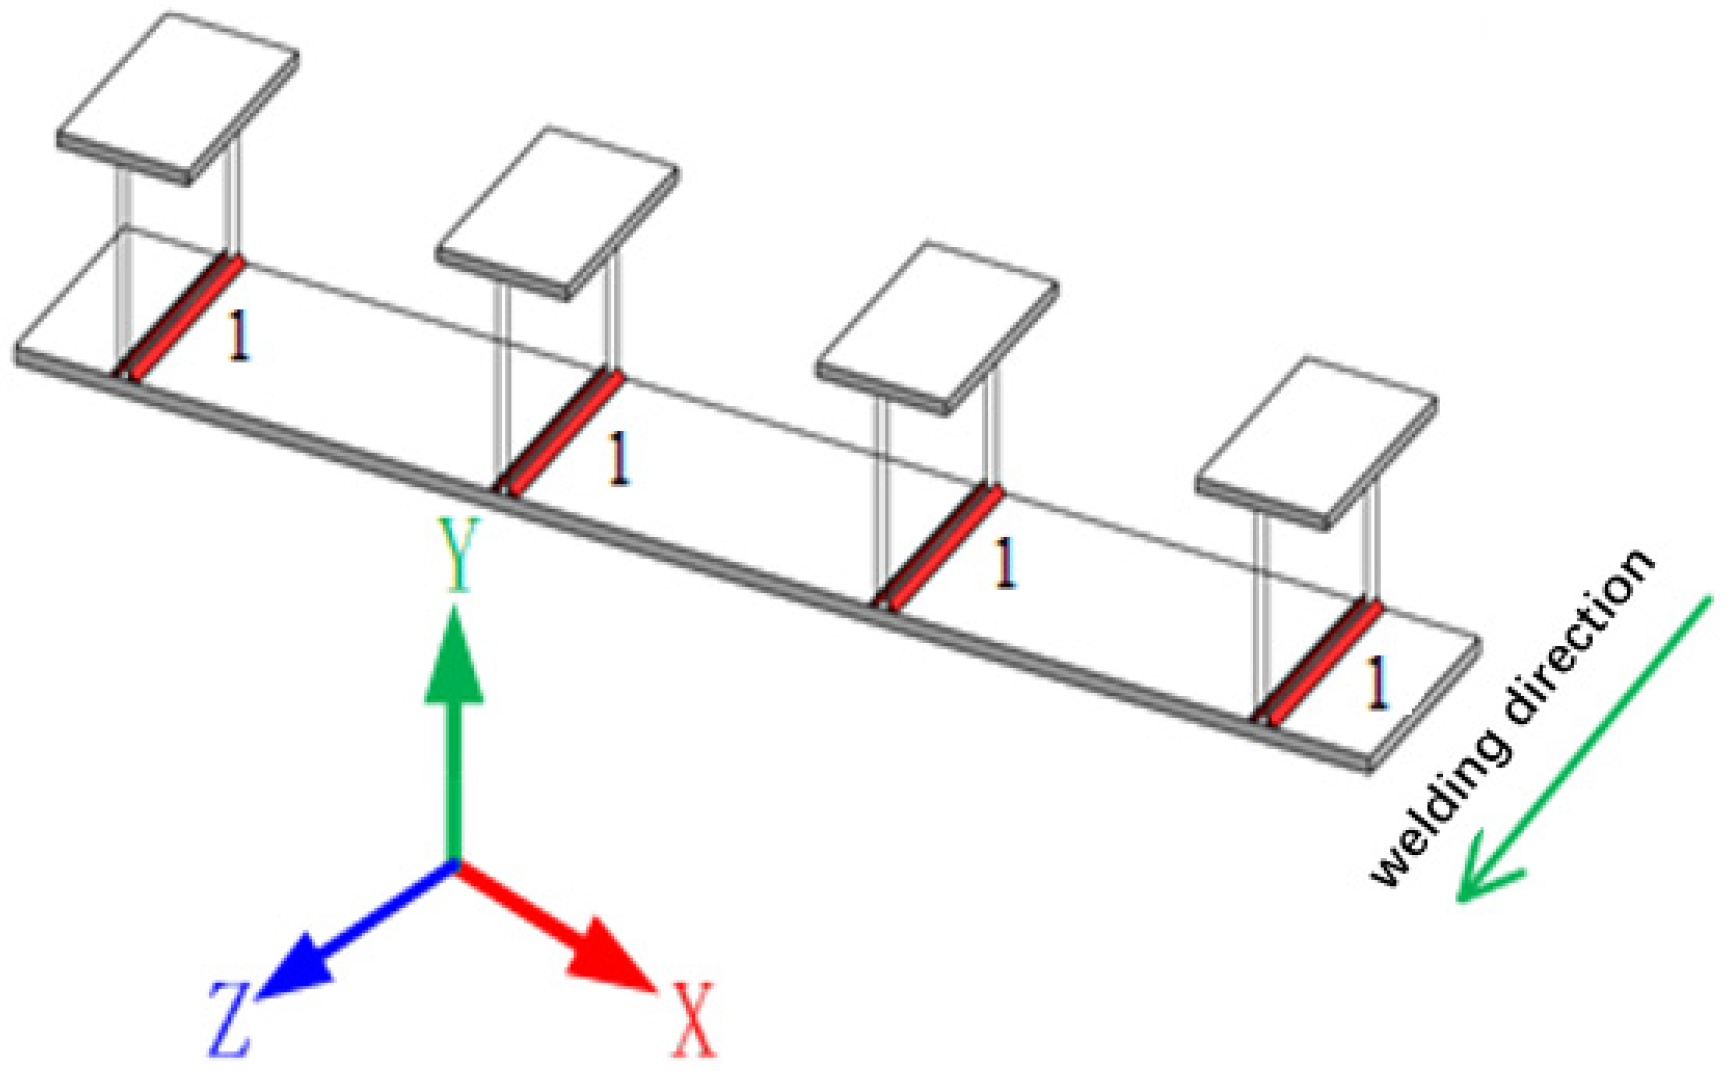
The weld seam numbers are shown in Figure 10, and the same two extreme welding sequences have been set for nine models, as shown in Figure 11. Arabic numerals represent weld seam numbers, solid arrows represent welding in sequence according to the numbering order, dashed arrows represent simultaneous welding, arrows represent welding direction, and line segments represent welding path. By simulating the welding sequence of four welds in order of numbering and four welds simultaneously and in the same direction, we aim to obtain the minimum spacing between T-ribs that will not affect each other. Then, we select a certain spacing from the spacing that will affect each other between T-ribs as a benchmark to discuss the advantages and disadvantages of different welding sequence schemes when welding multiple longitudinal T-ribs.

4.2. Results of Deformation Field Analysis

Welding deformation mainly includes transverse shrinkage deformation, longitudinal shrinkage deformation, and angular deformation, and angular deformation can be reflected through deflection (i.e., vertical deformation). It is expected that welding deformation varies with the increase in weld spacing. When its variation becomes negligible or ceases entirely, the condition can be defined as a stable state in which adjacent T-ribs exert no mutual influence. The weld spacing corresponding to such stable deformation is regarded as the minimum distance between adjacent welds without interactive effects.
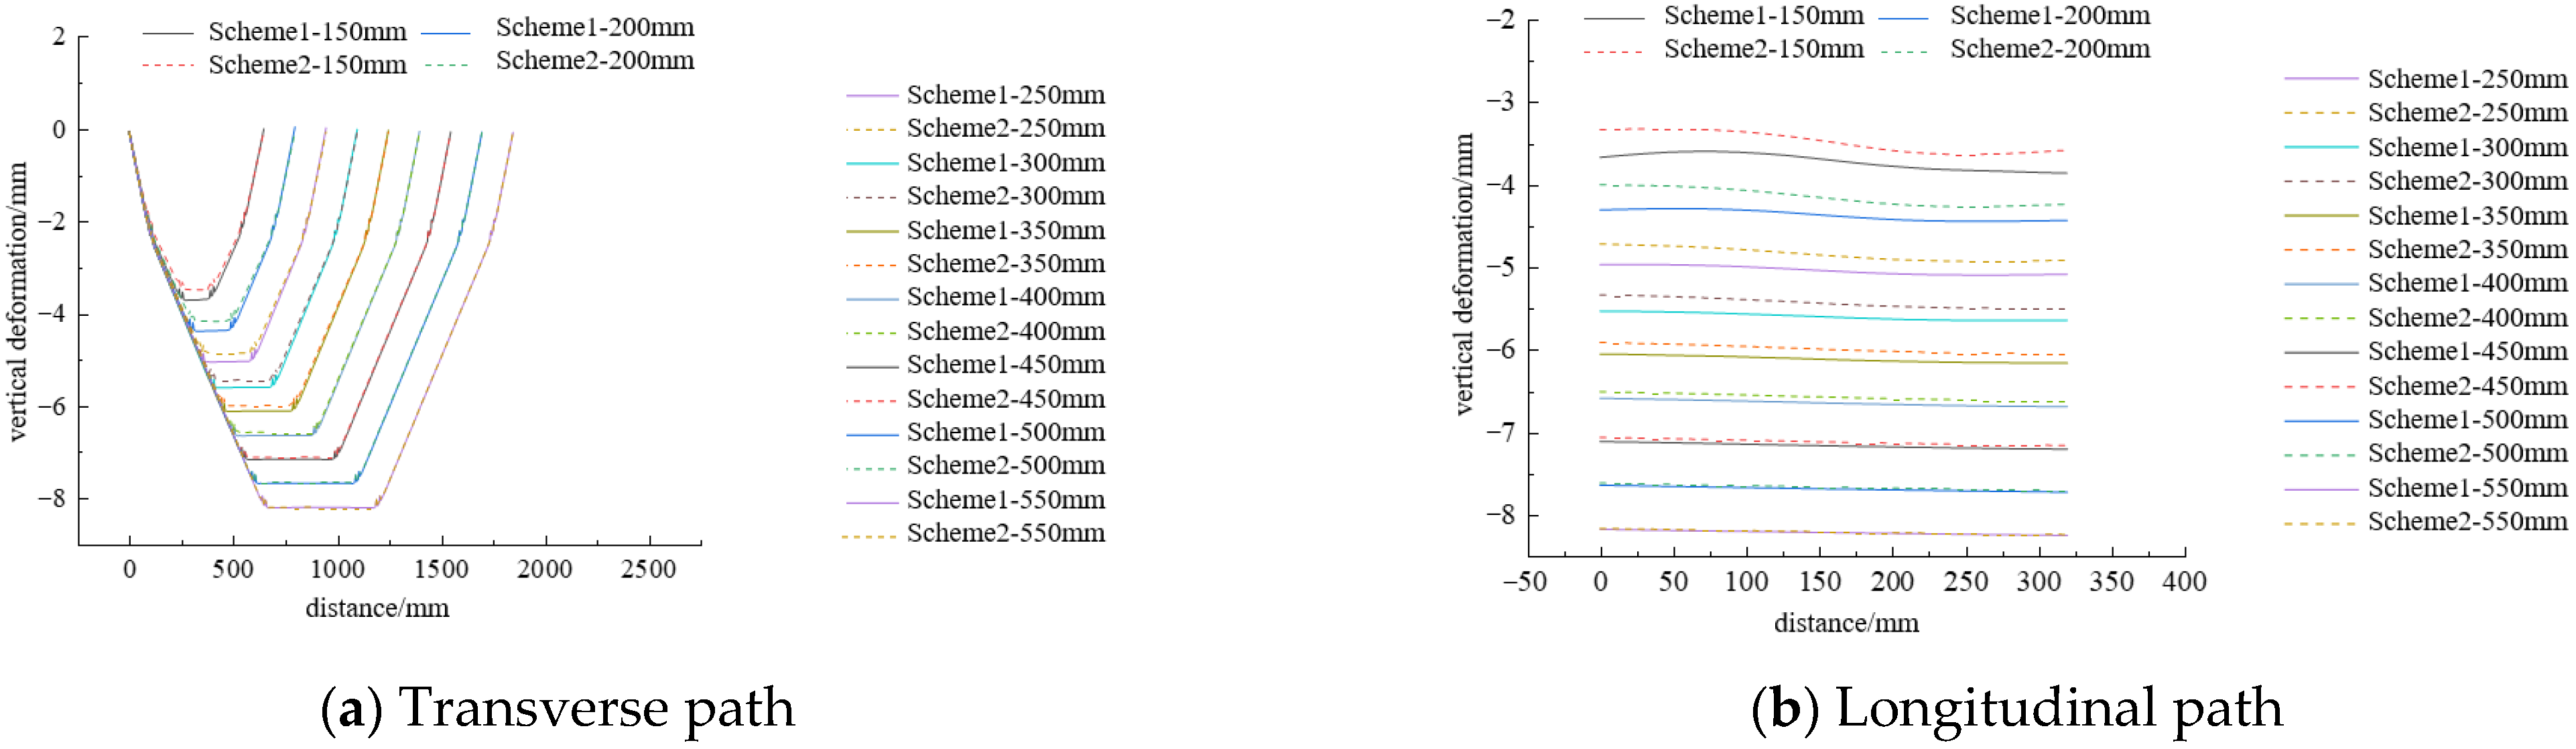
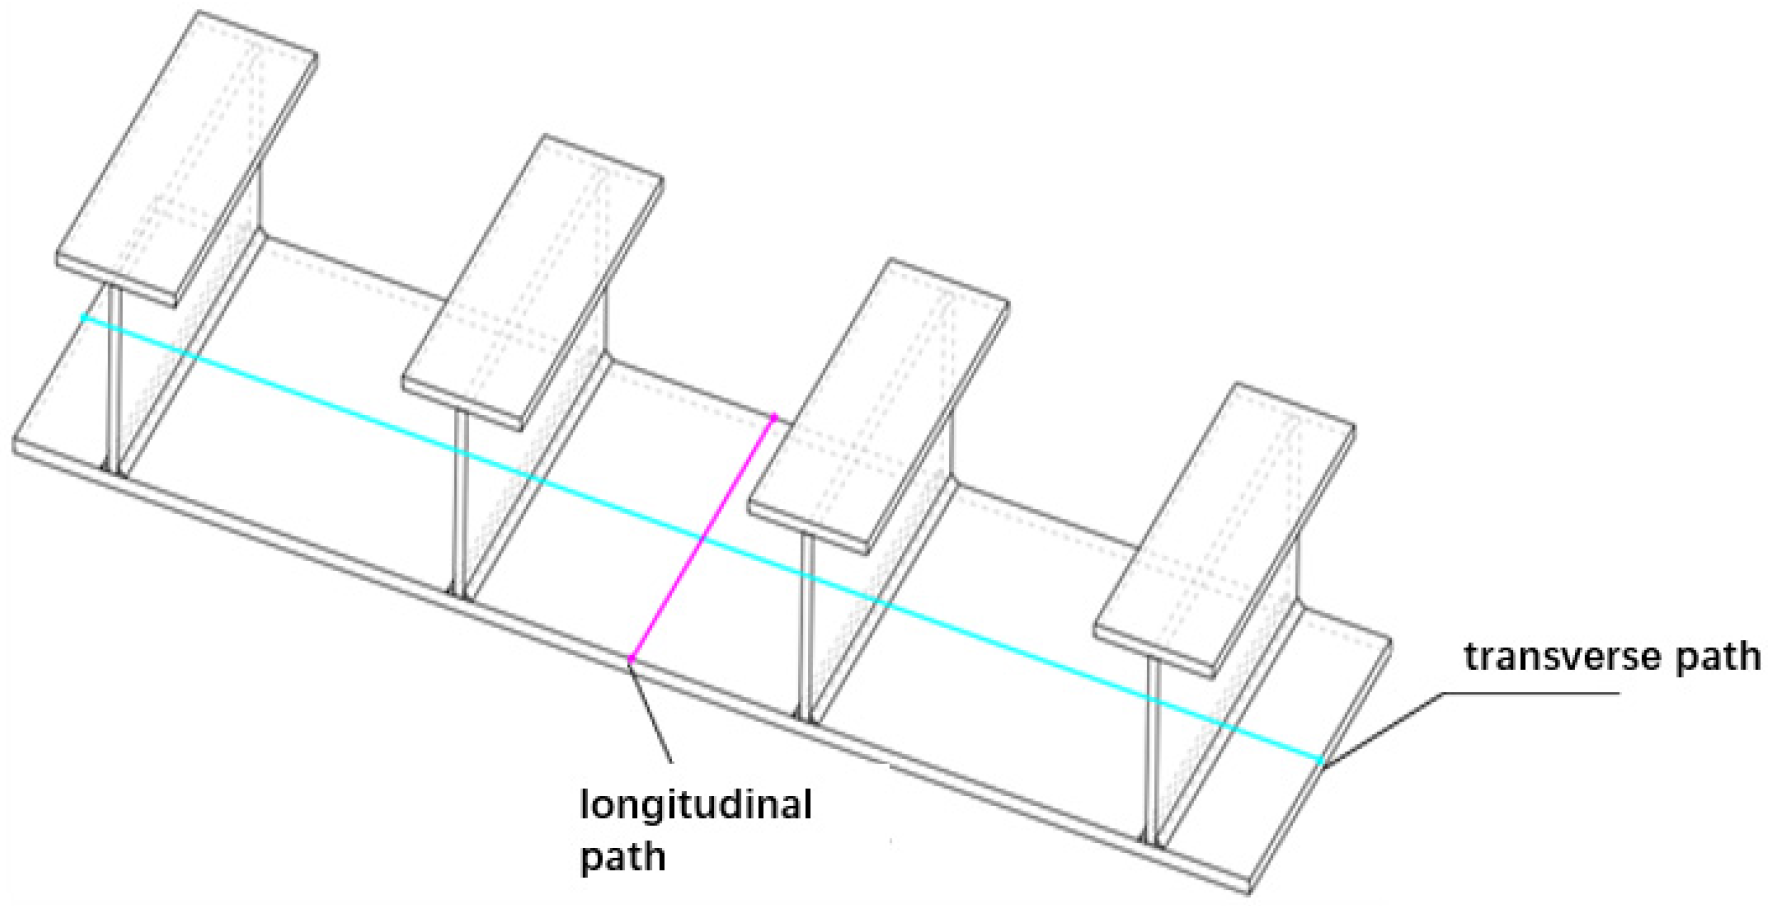
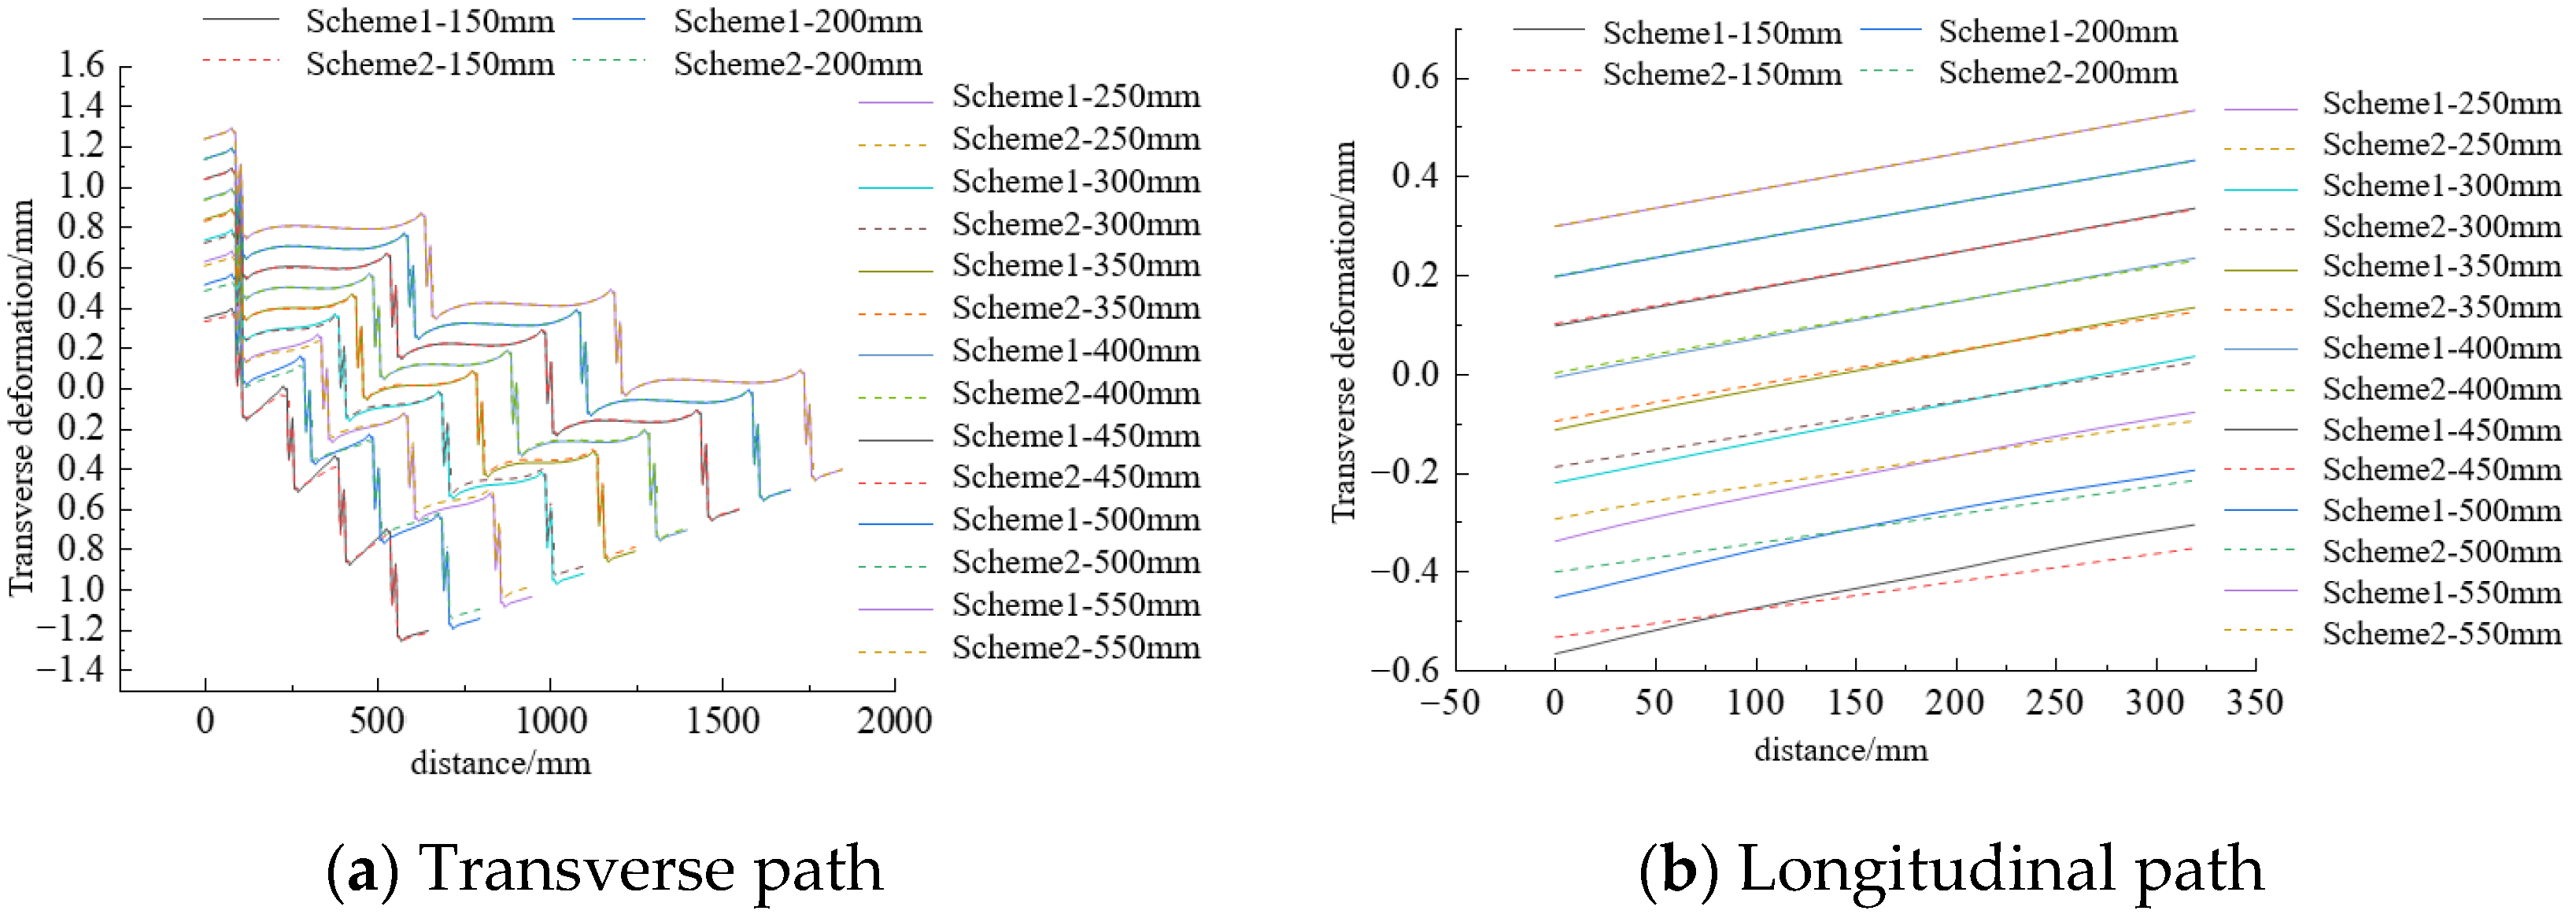
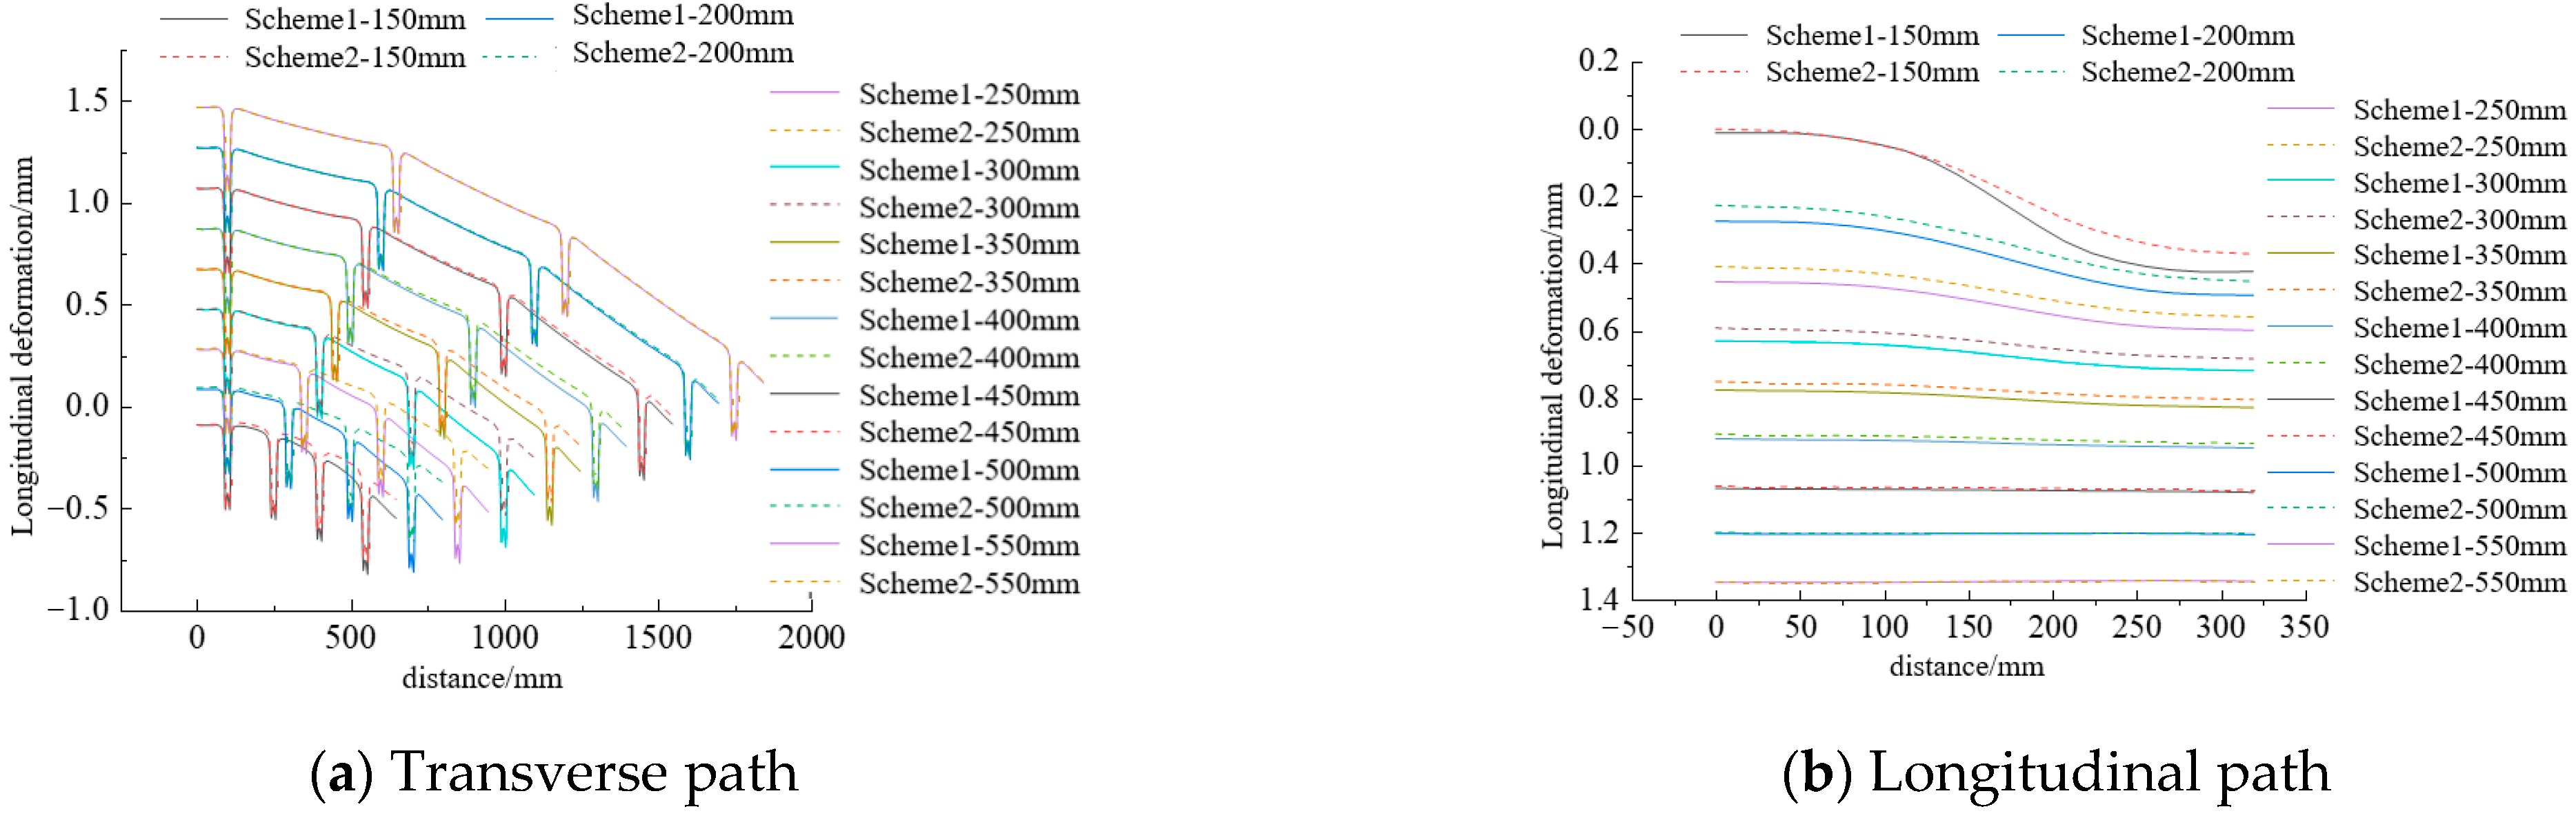
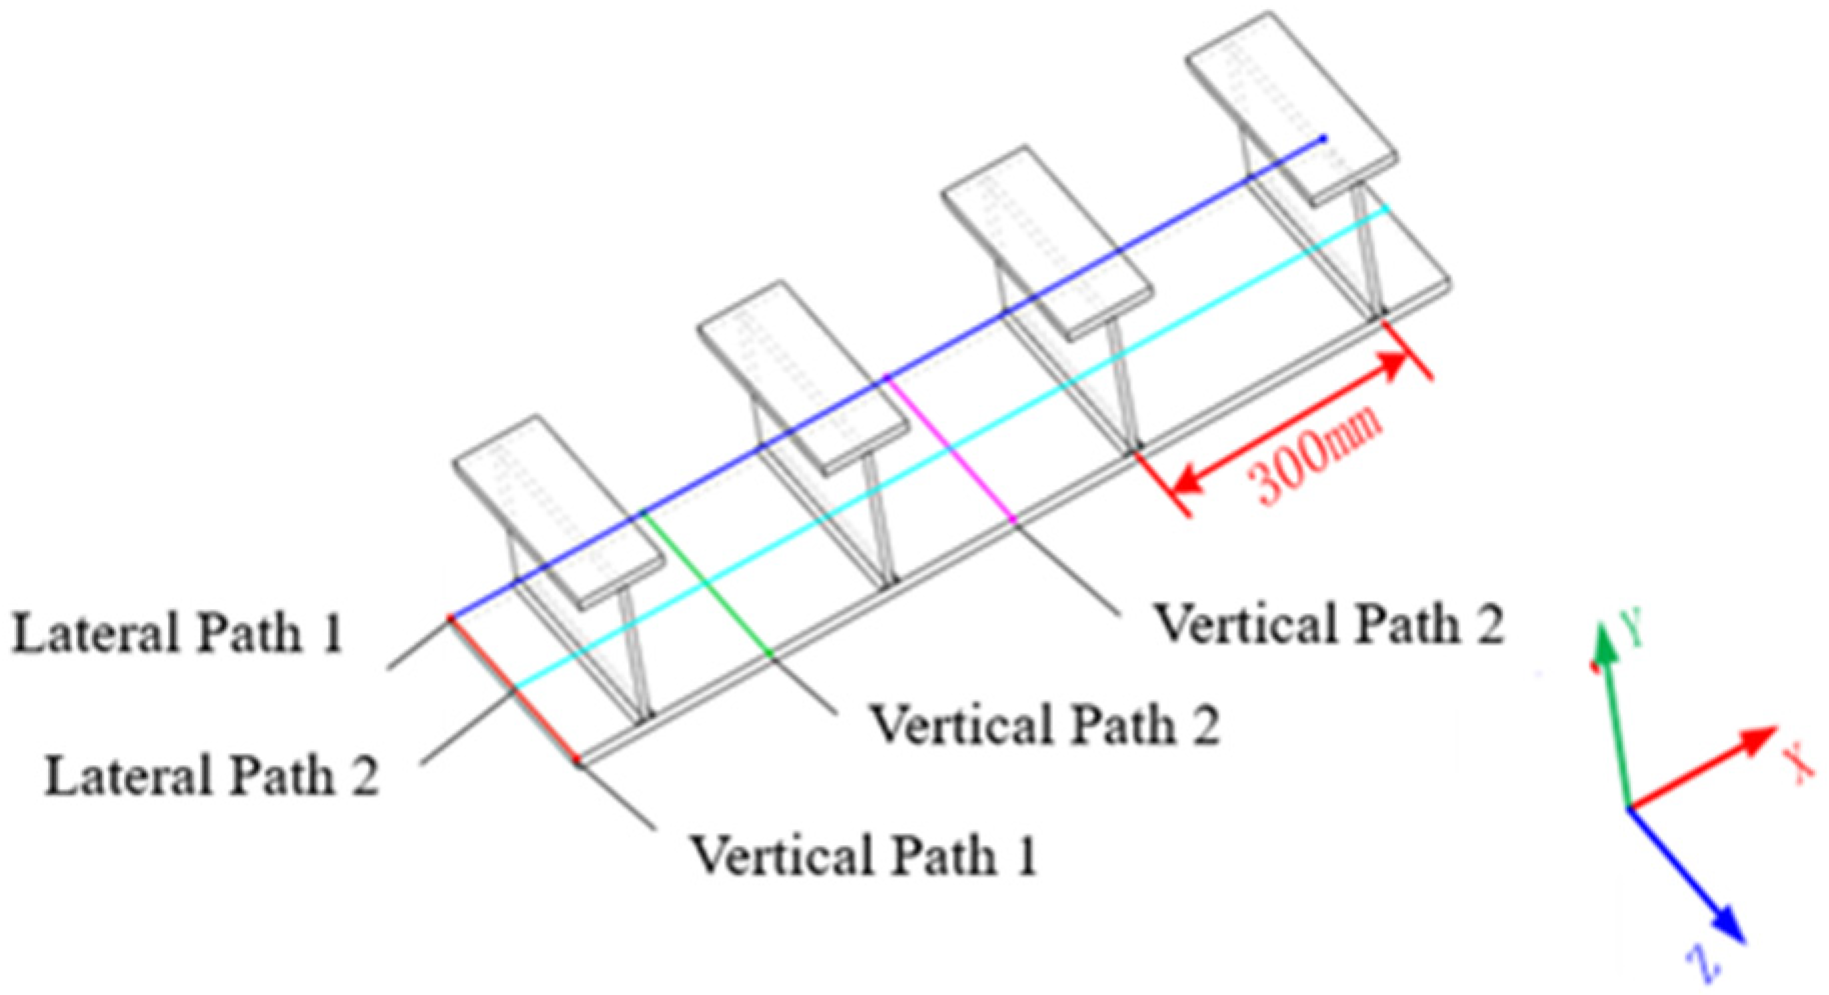
In terms of the deformation field, in order to obtain accurate and reliable results, deformation results were extracted from two paths and three directions for analysis and comparison, and the spacing range of mutual influence between T-ribs was obtained. The extraction path is shown in Figure 12. Except for the horizontal path and vertical deformation field, the results of other deformation fields are moved a certain distance in the direction of the dependent variable to reflect some potential patterns in the data and also to increase readability. The deformation field results under different paths, directions, and distances are shown in Figure 13, Figure 14 and Figure 15.
From Figure 13, Figure 14 and Figure 15, it can be seen that the deformation diagram with a spacing of 150 mm is somewhat abnormal compared to the deformation diagrams with other spacing. This may be due to the small spacing, which leads to different patterns of deformation in certain local areas during sequential welding and simultaneous welding in the same direction compared to other spacing. However, at a spacing of 150 mm, regardless of the direction of deformation, the mutual influence between the T ribs is very significant. This is obviously not the minimum spacing value we want to obtain for the mutual influence between the T ribs. Therefore, we will not consider the 150 mm data in the following analysis and only analyze the mutual relationship between the other eight spacings.
The T-rib spacing transitions from 200 mm to 550 mm at equal intervals, and the deformation of the two paths and three directions shows a high degree of regularity under the extreme two welding sequences. The deformation trend between different spacing and welding sequences is consistent. The deformation difference between the two extreme welding sequences gradually decreases with increasing spacing and eventually approaches zero. Quantitative results show that the deformation difference between simultaneous welding and sequential welding gradually decreases with the increase in T-rib spacing. At 300 mm spacing: simultaneous welding reduces deformation by 28.7% compared with sequential welding; at 400 mm spacing: the deformation reduction rate is 15.3%; at 500 mm spacing: the deformation difference is only 3.2%, and the mutual influence can be ignored; and at 550 mm spacing: the deformation difference is less than 1.1%, reaching complete non-interference. Therefore, the critical spacing for mutual non-interference between T-ribs is 500 mm.
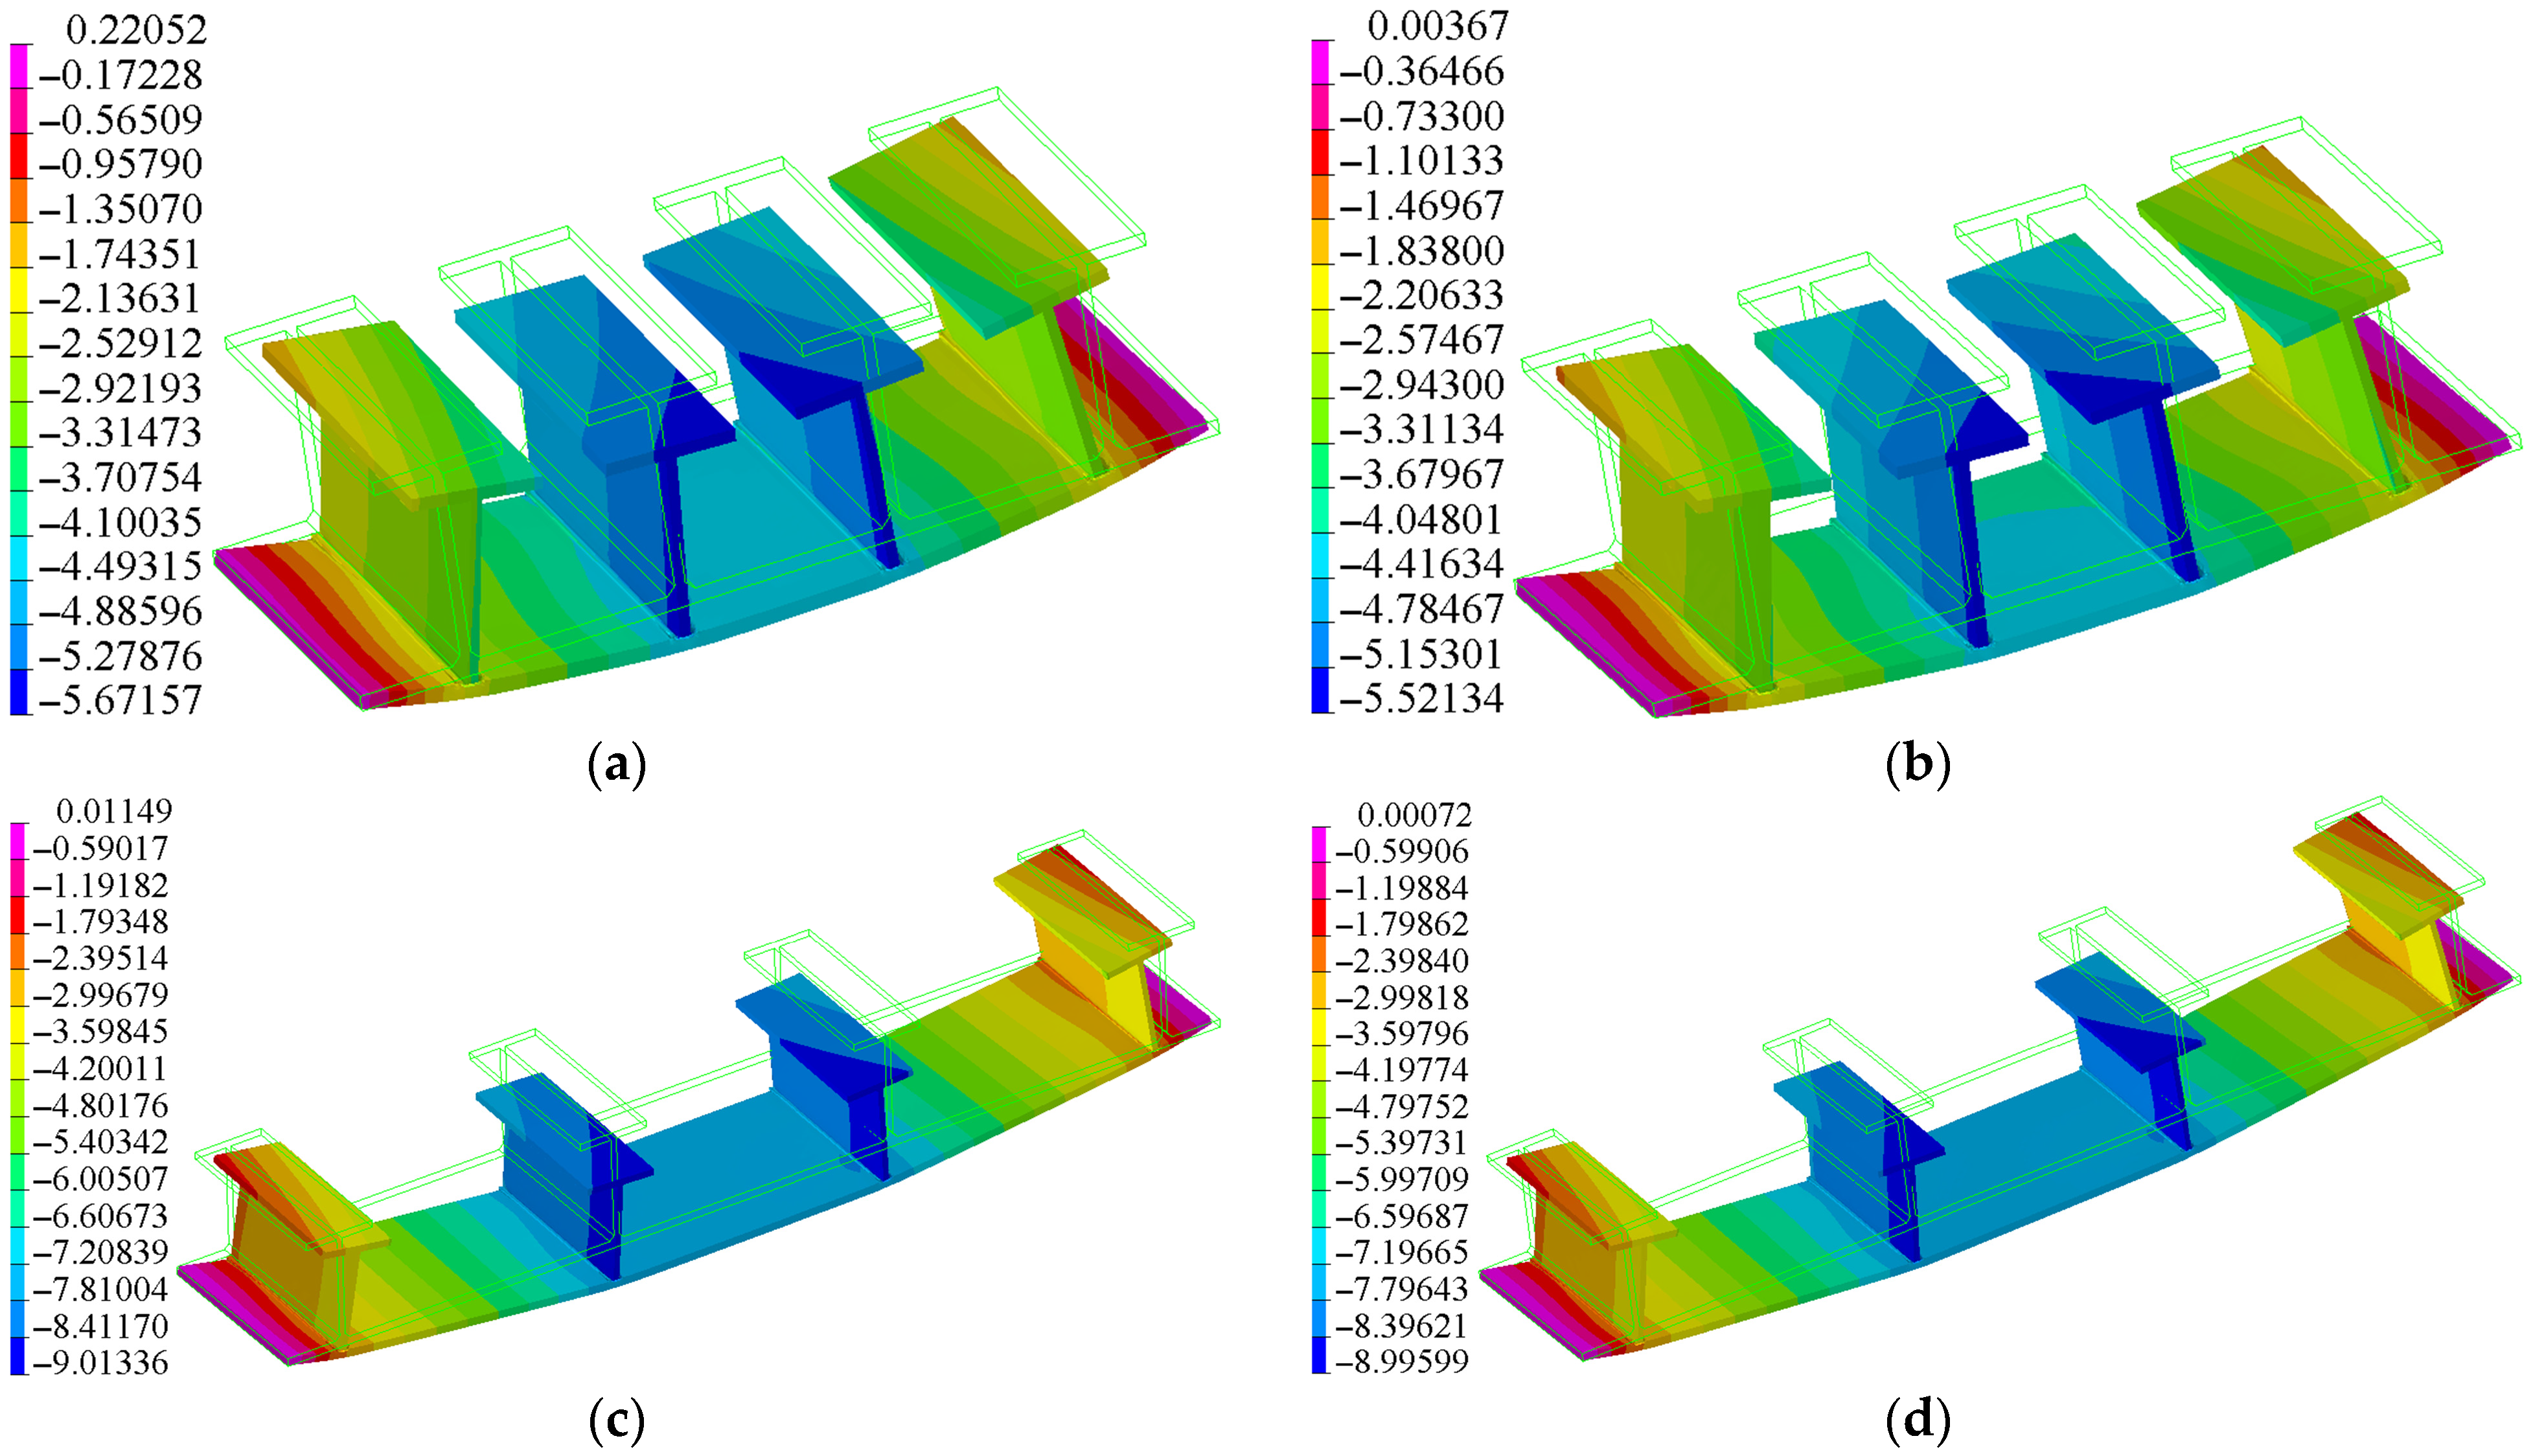
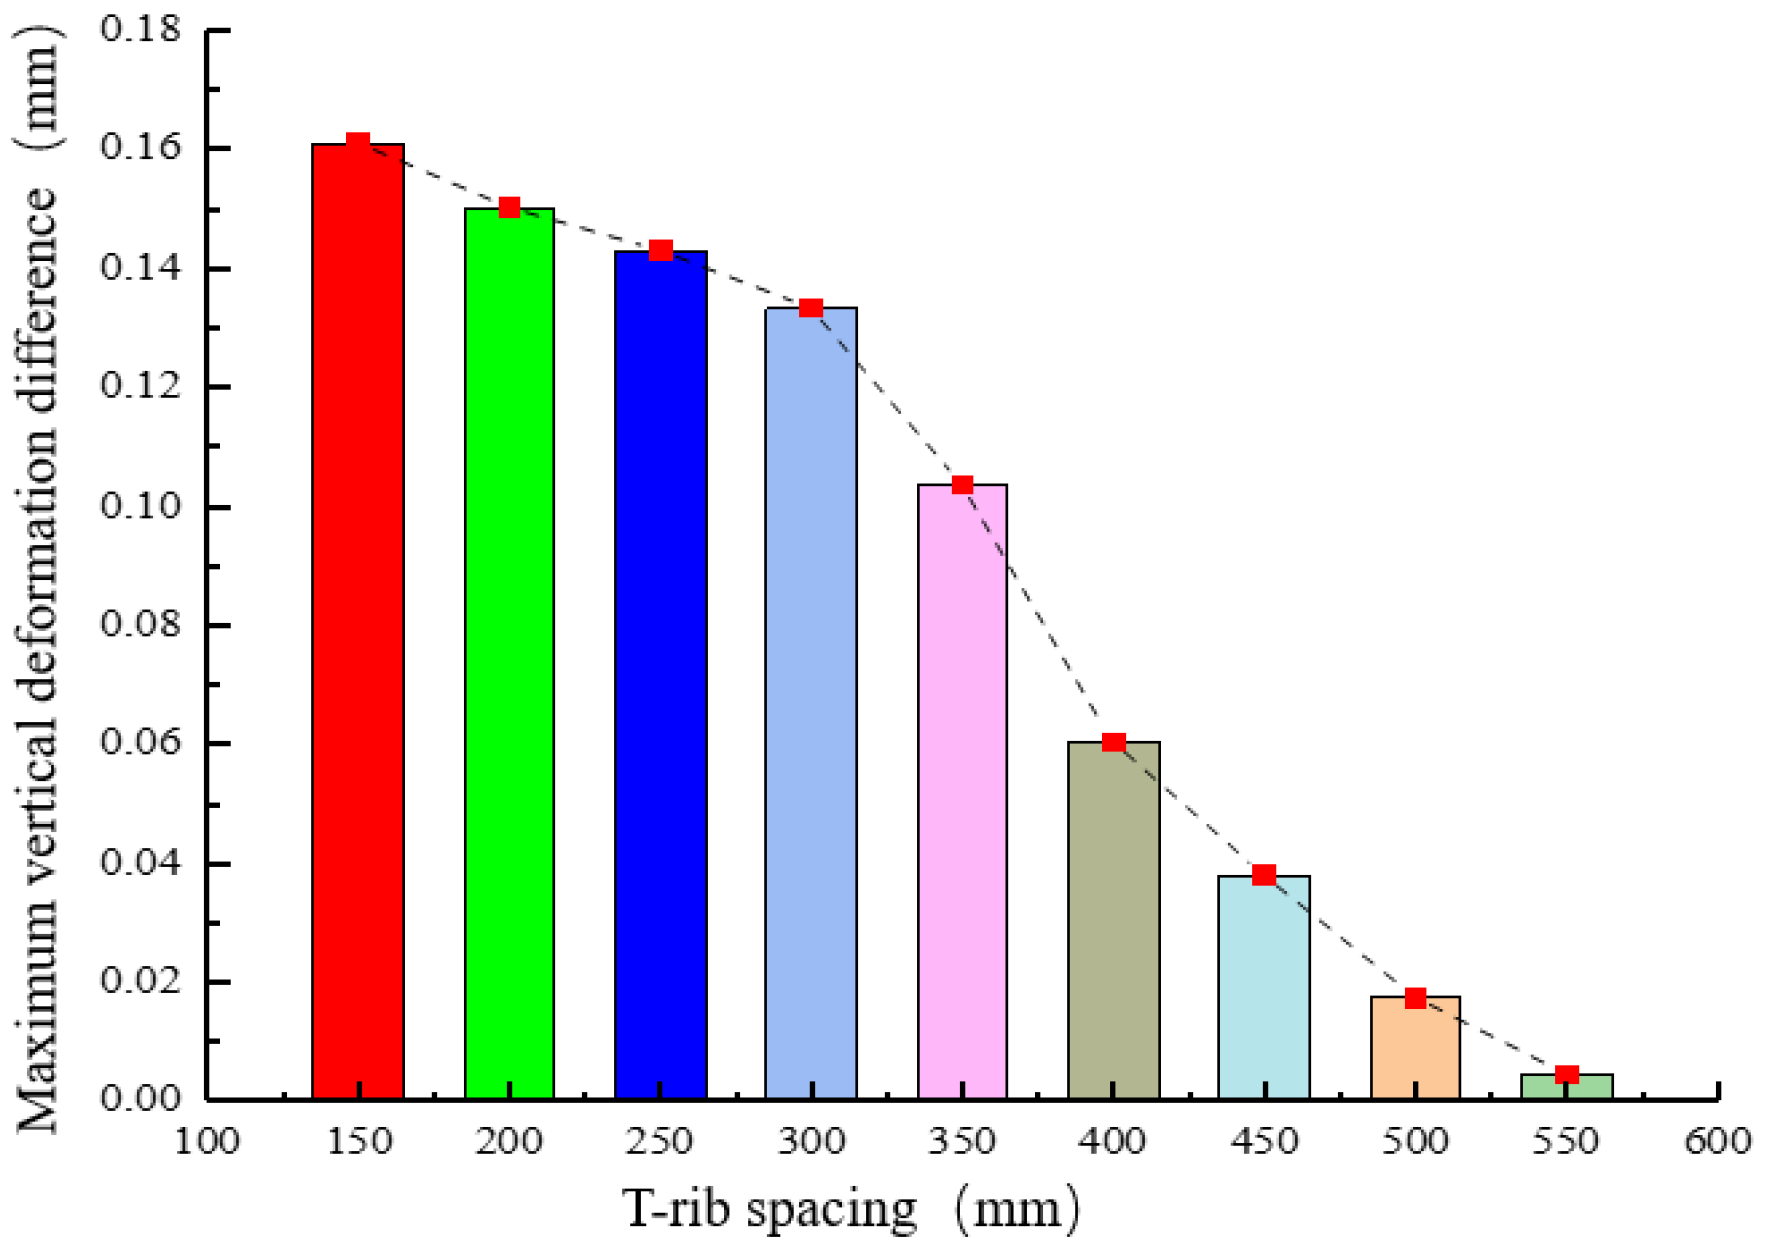
Figure 16 presents the deformation contour plots following welding under two extreme welding sequences, for models with T-rib spacings of 200 mm and 500 mm. For clear visualization, all deformation magnitudes are magnified by a factor of 10. As observed, the discrepancy in vertical deformation between the two extreme welding sequences is noticeably smaller at 500 mm spacing than at 200 mm spacing. To enable a more direct quantitative comparison, the maximum vertical deformation values were extracted from post-processing for nine models with varying spacings under both welding sequences. The differences in maximum vertical deformation between the two sequences at identical spacing were then calculated and plotted in the bar chart shown in Figure 17.
As shown in Figure 17, the deformation gap between the two extreme welding schemes under the same rib spacing gradually narrows as spacing increases. Specifically, the reduction rate is relatively slow in the initial stage, accelerates in the middle stage, and slows down again in the later stage. Excluding interference from other factors, it is not difficult to determine the critical deformation spacing without mutual influence between T-ribs, which can be set at 500 mm. This is consistent with the conclusion drawn from Figure 13, Figure 14 and Figure 15.

4.3. Analysis of Stress Field Calculation Results

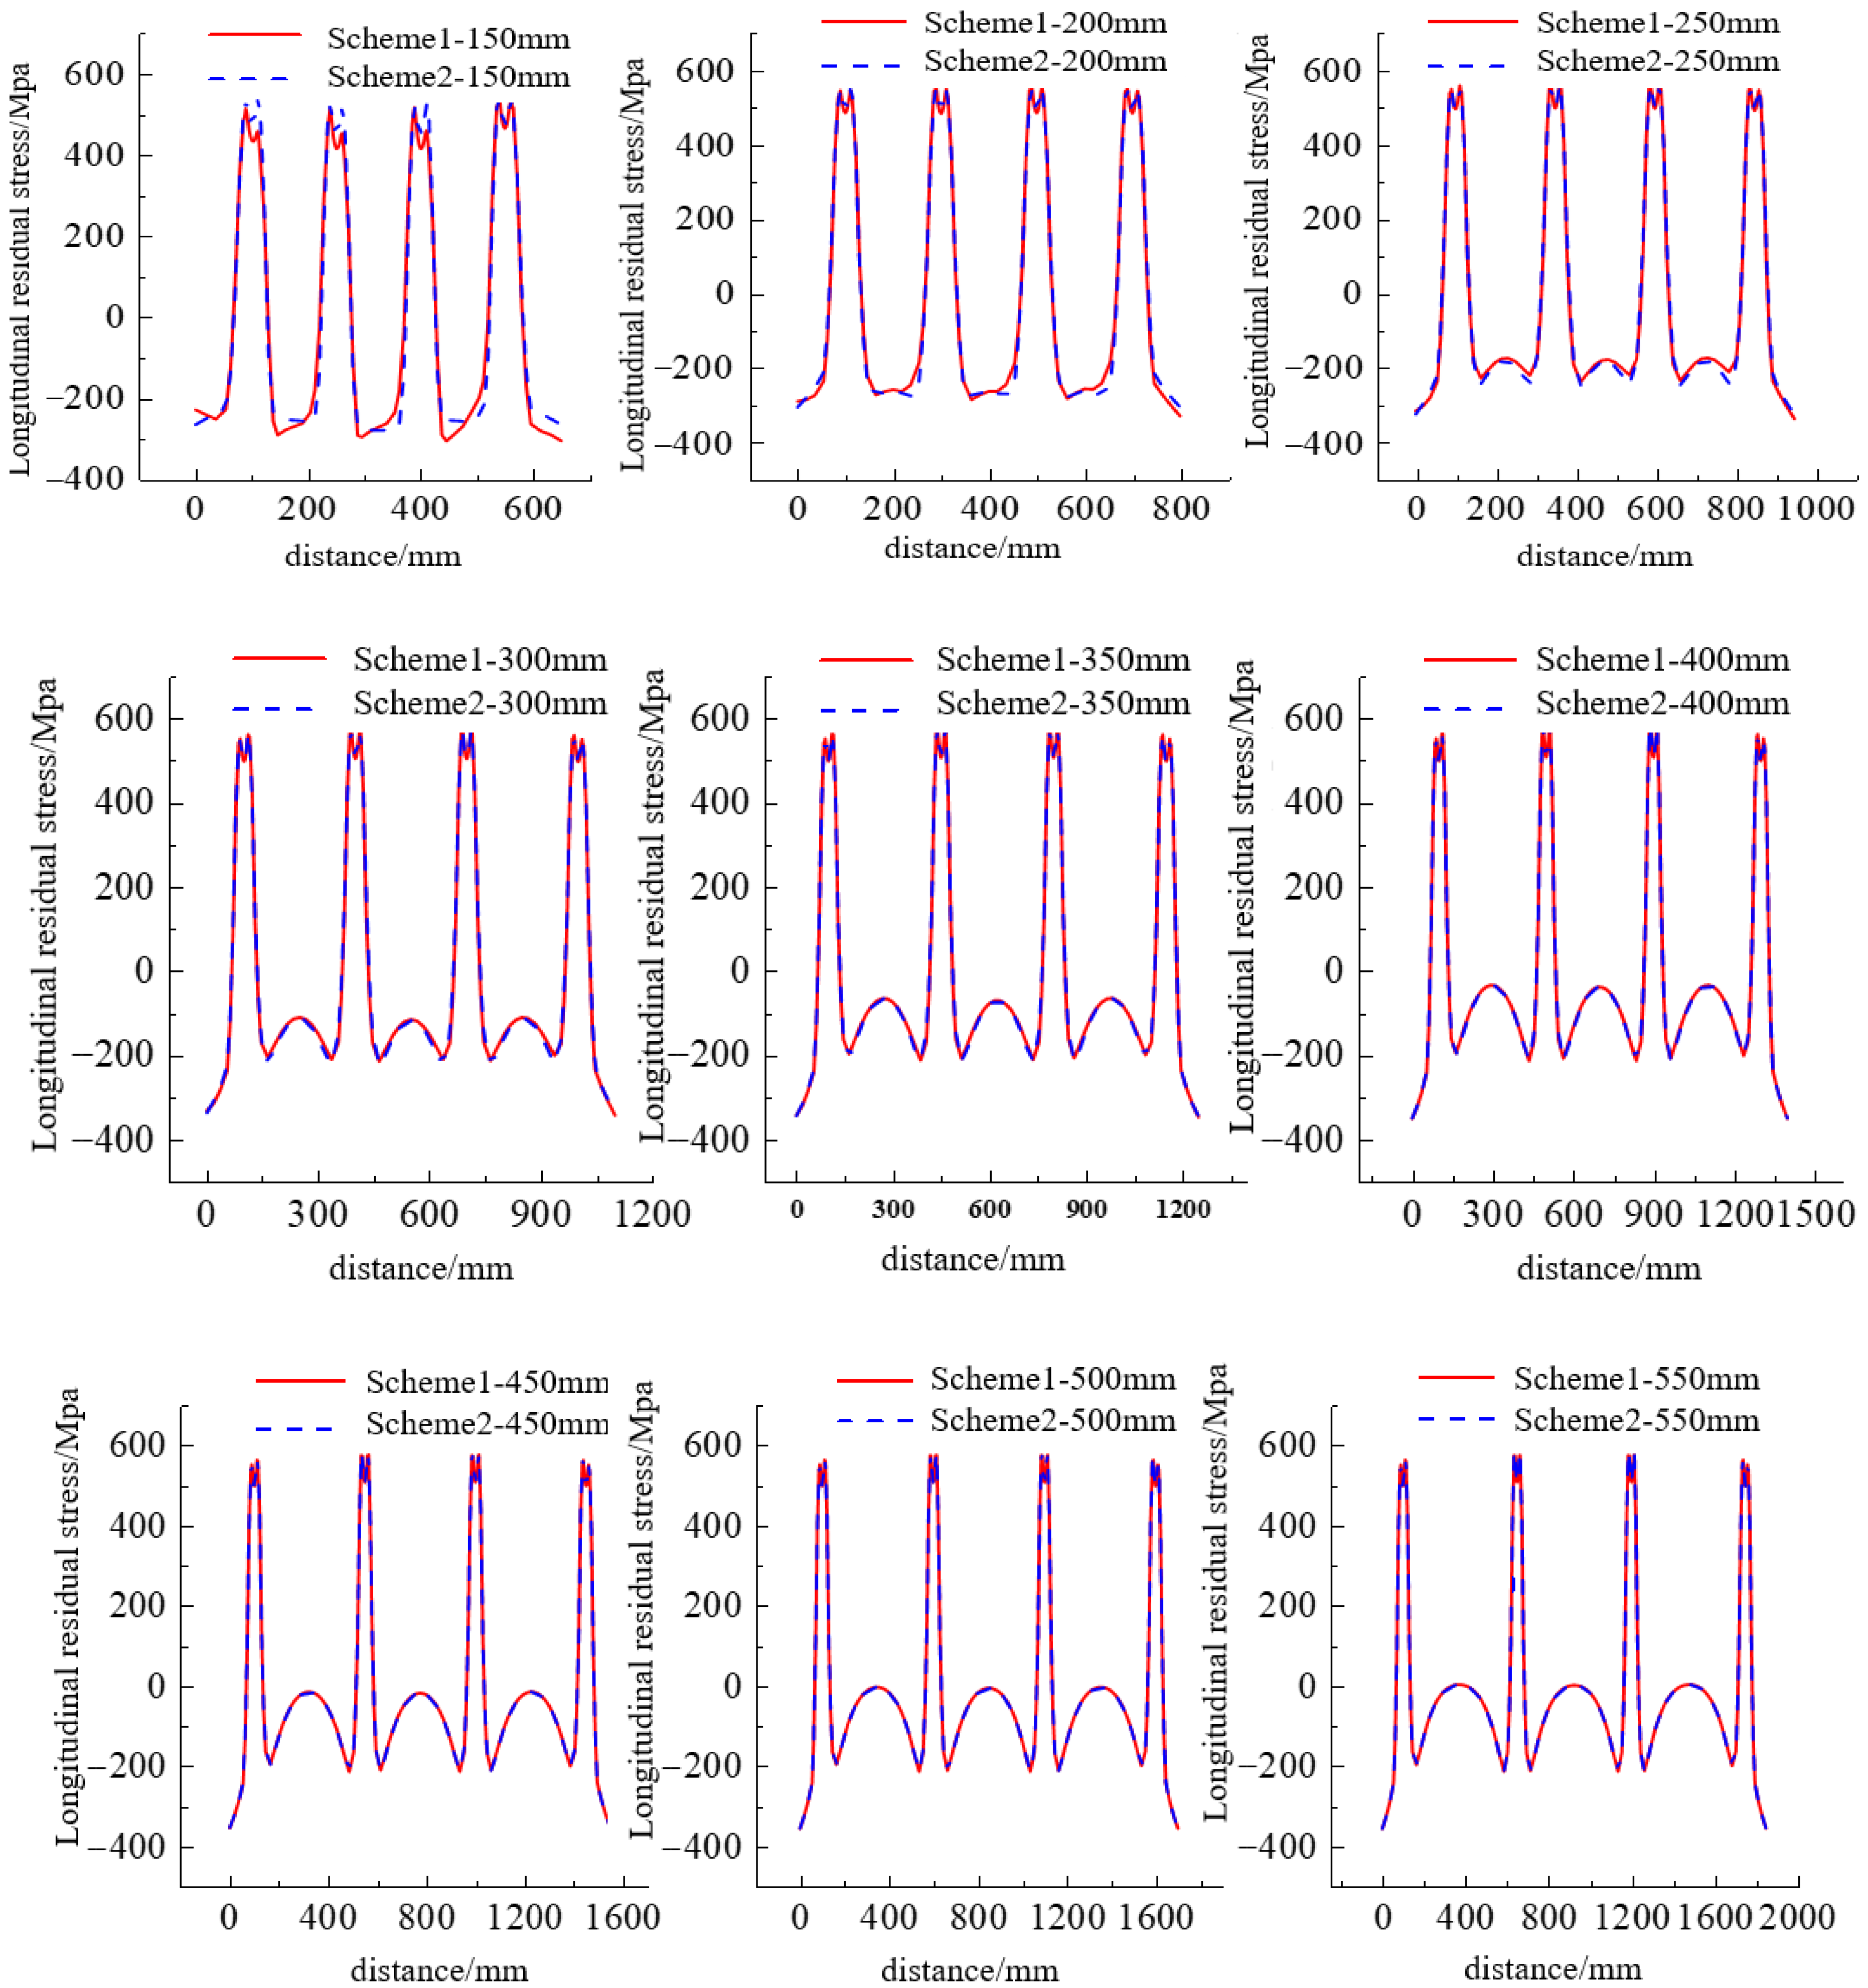
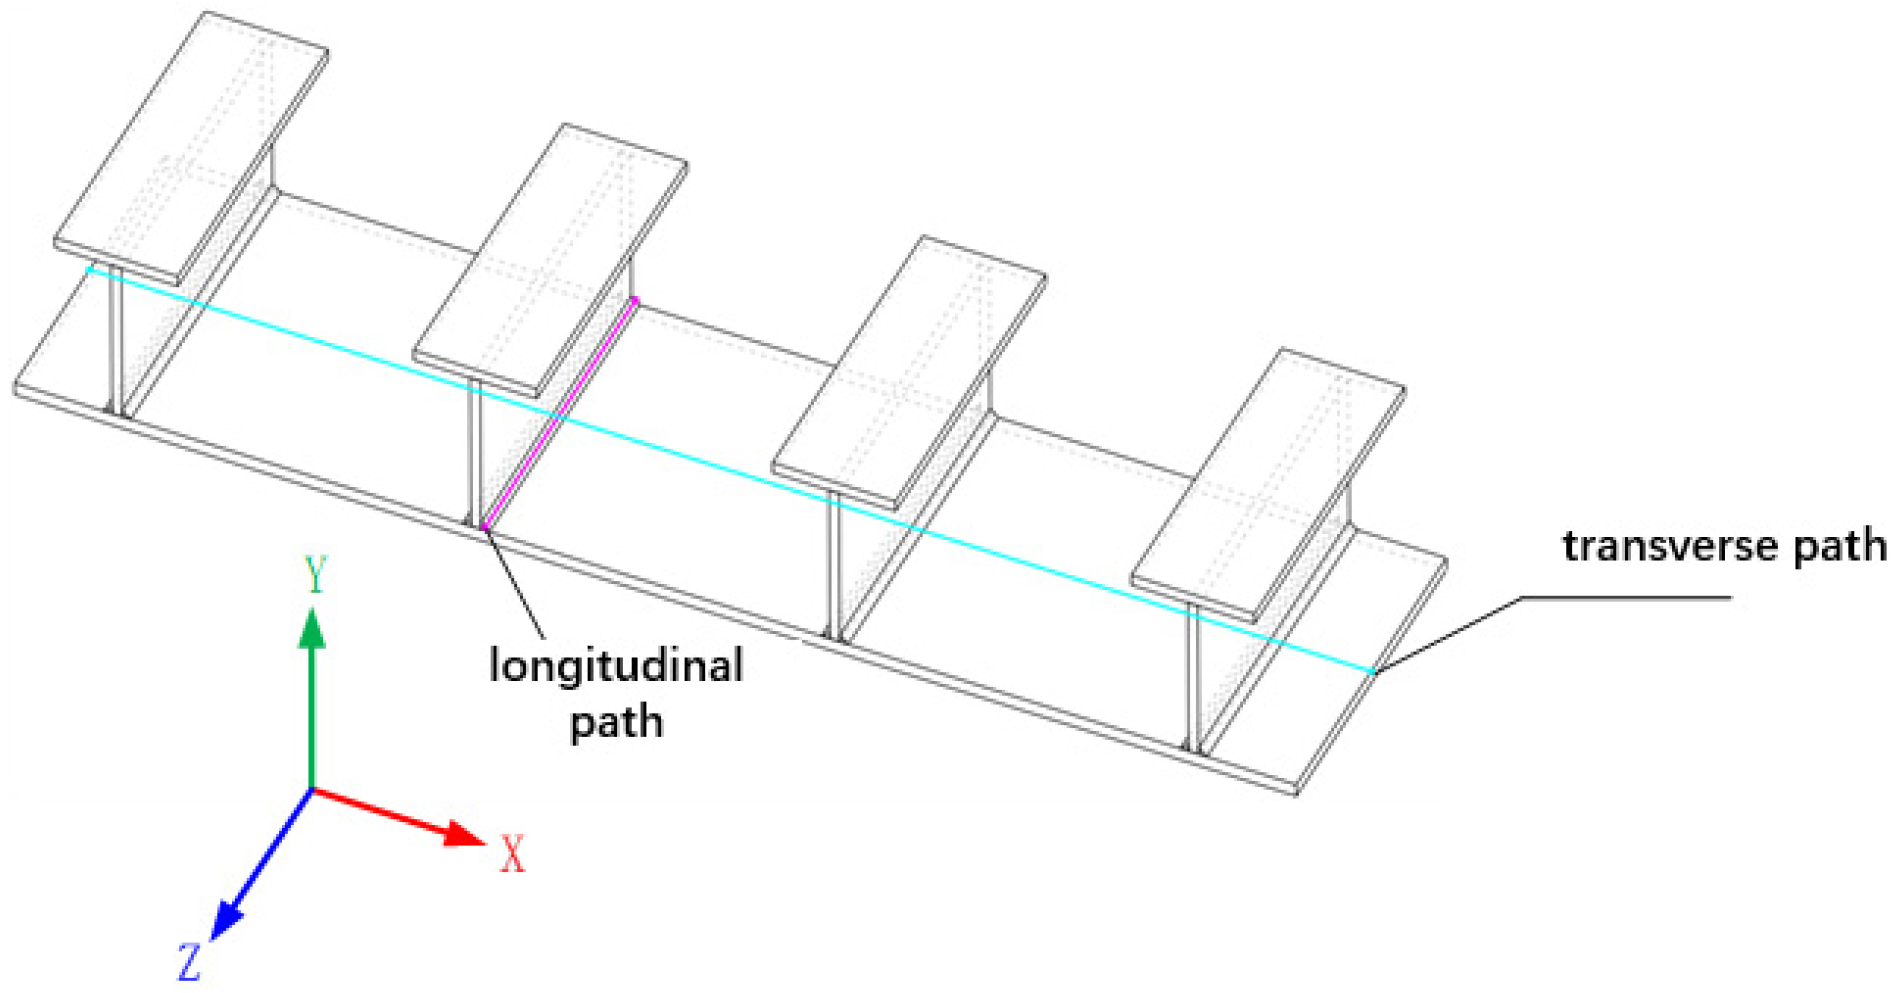
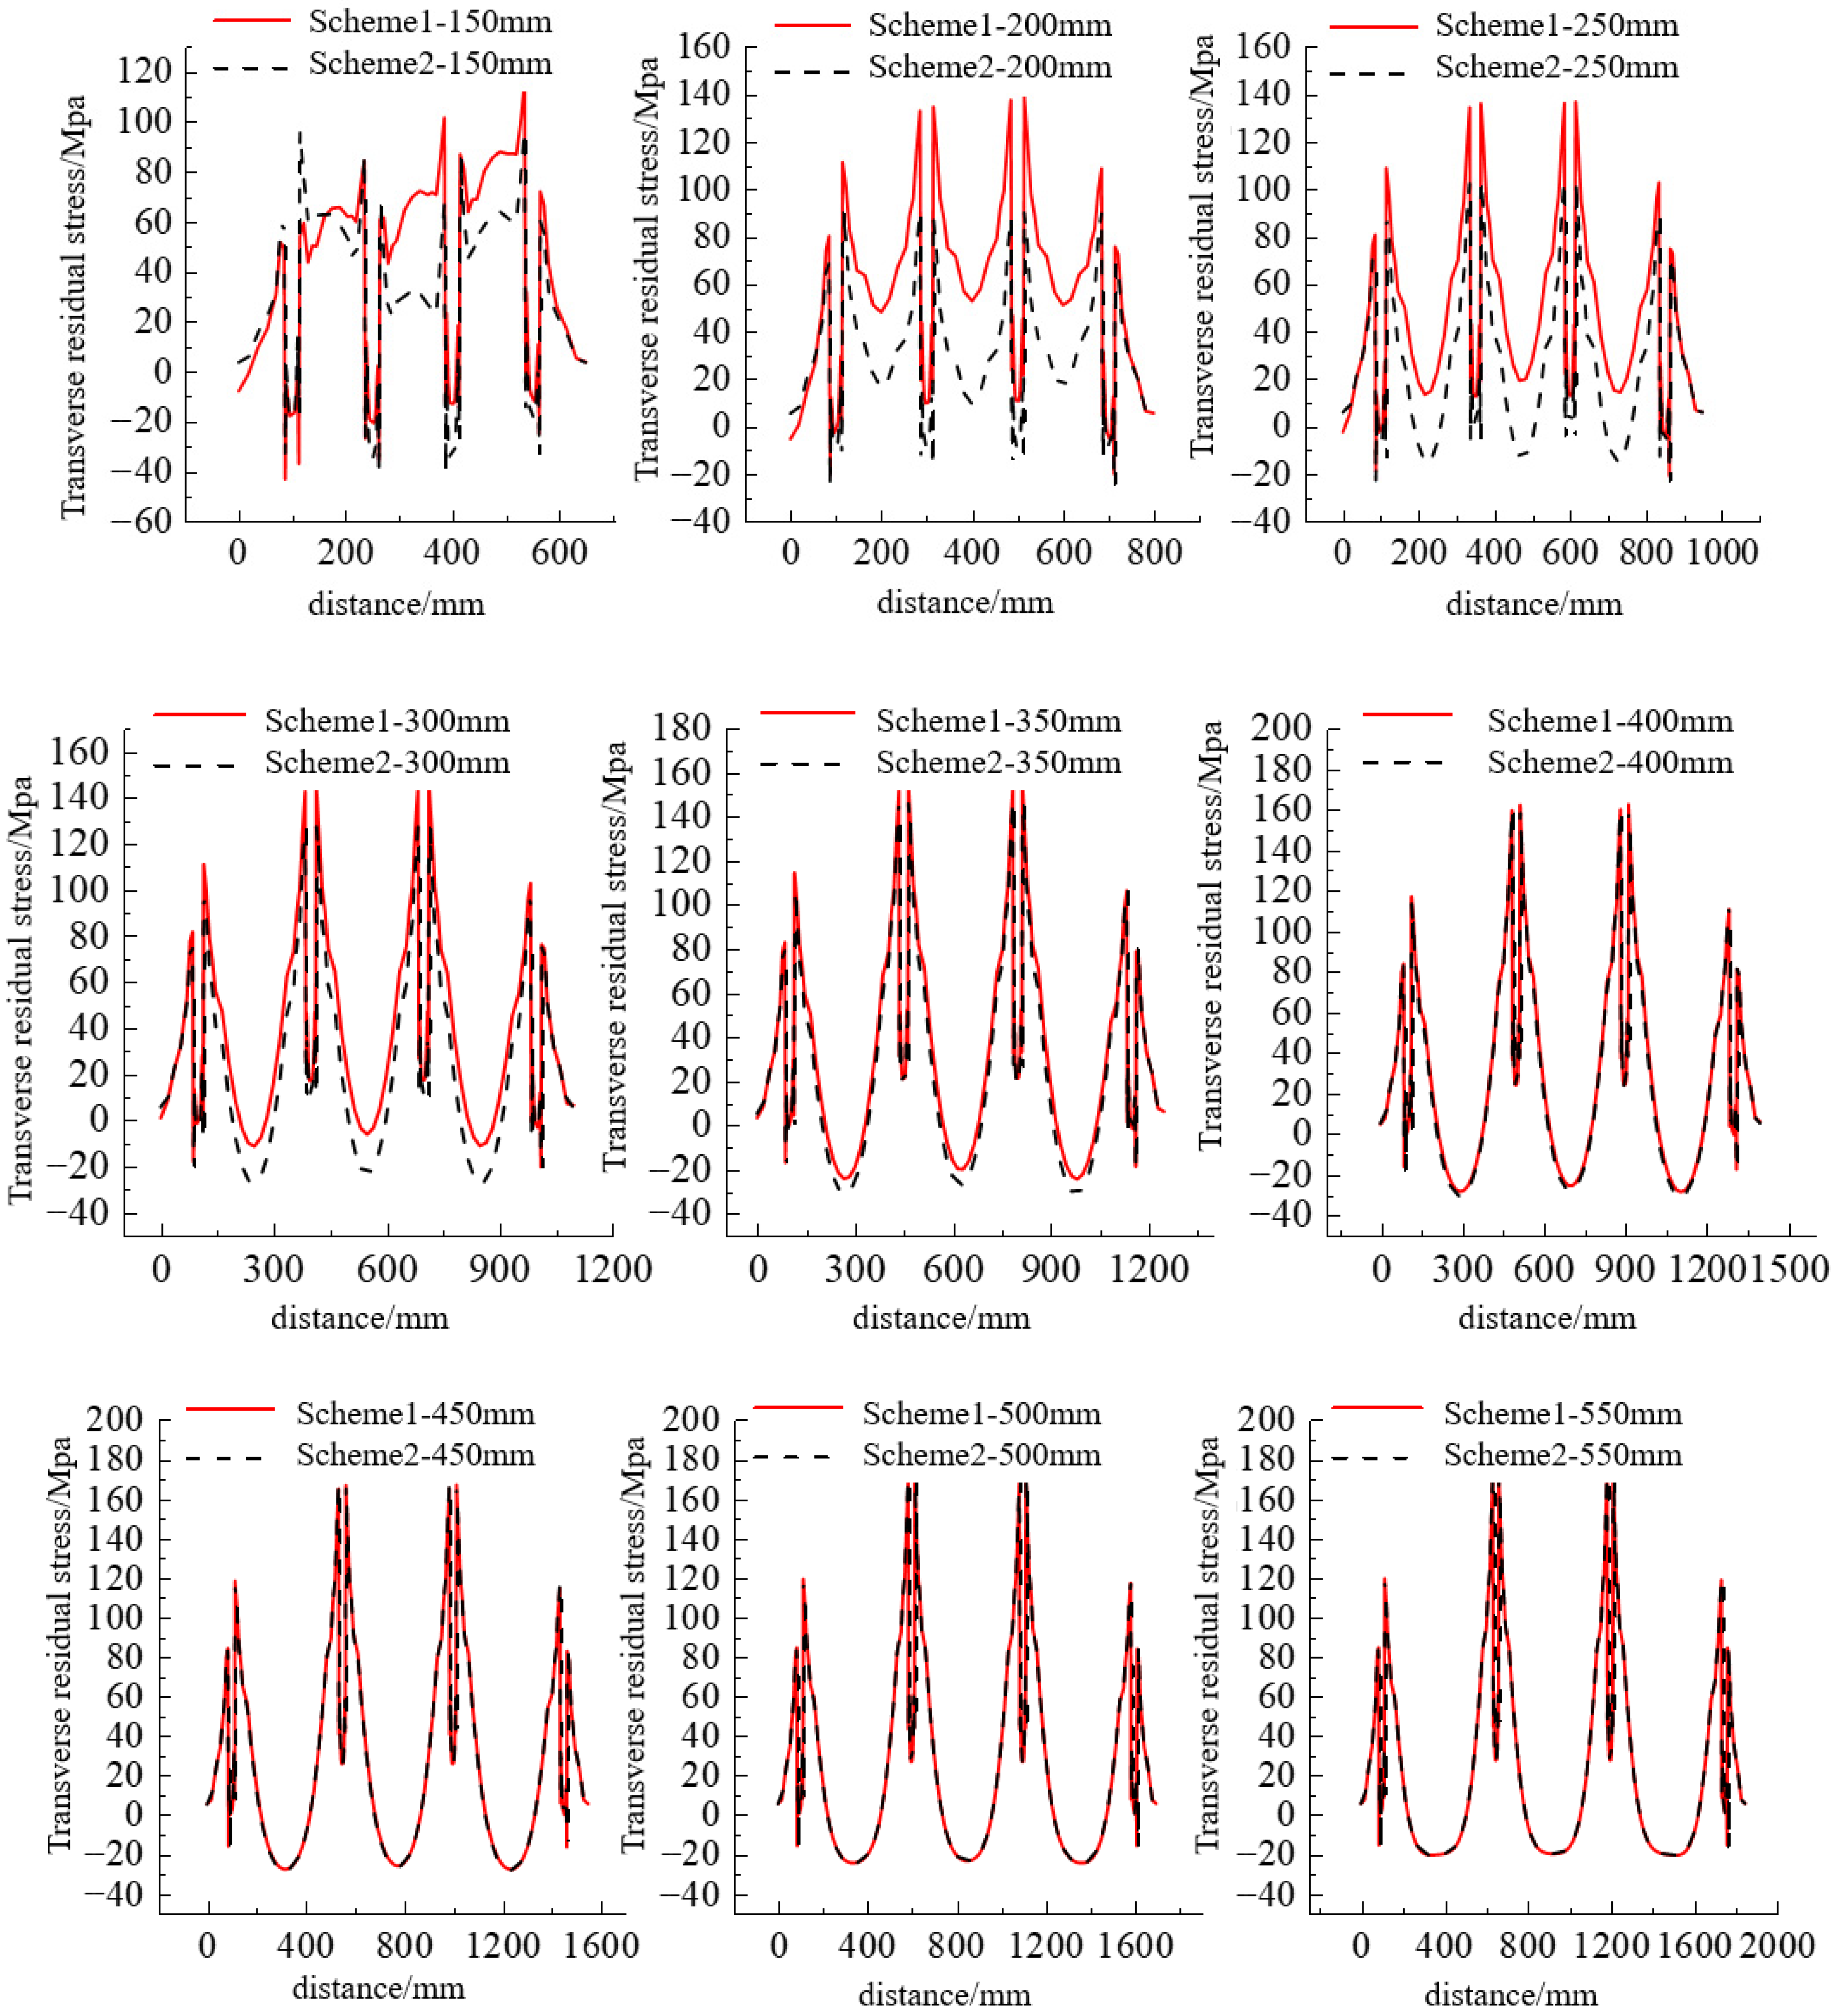
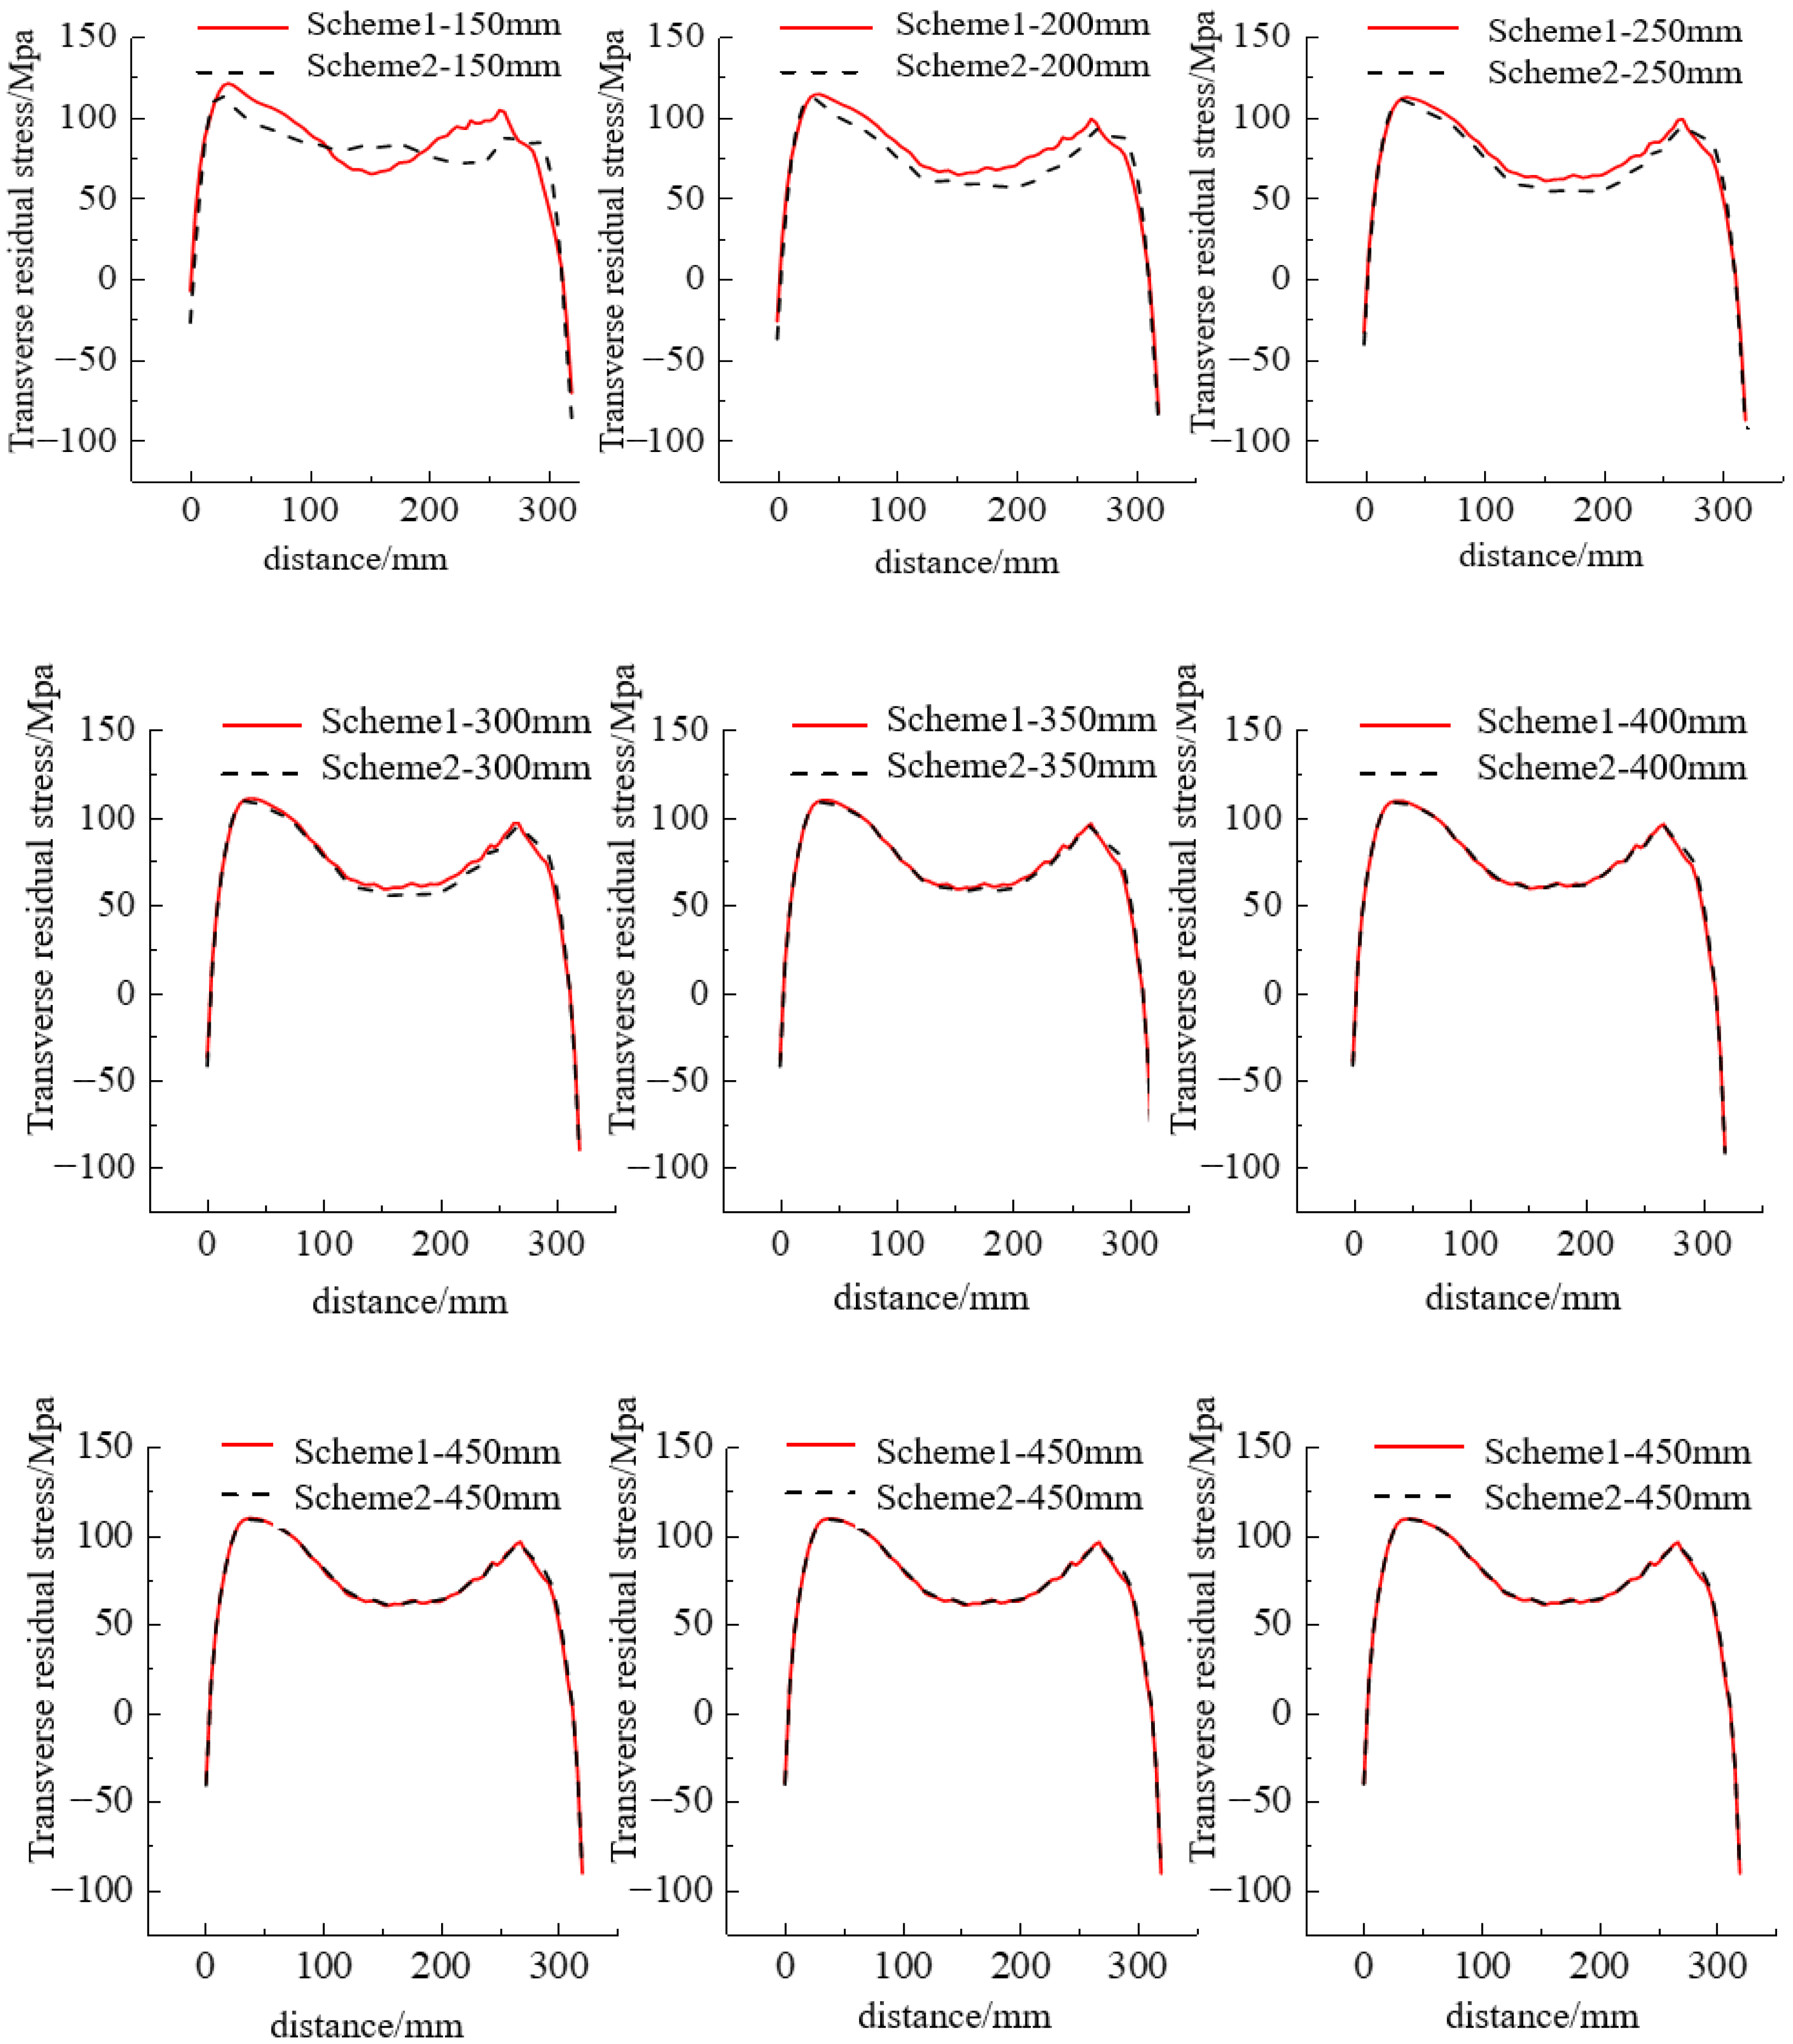
From the perspective of stress field distribution, the interval corresponding to the minimum spacing without mutual interaction is determined. Two paths are adopted for stress extraction: the first is a transverse path within the same deformation field, and the second is a longitudinal path defined by the centerline of the fourth fillet weld slope, as illustrated in Figure 18. Since vertical stress is generally small for thin plates, it is not considered. Here, we only discuss the differences in transverse and longitudinal stress under two extreme welding sequences when the spacing between T-ribs is different. The extracted transverse and longitudinal stresses on the two paths are shown in Figure 19 and Figure 20.
Figure 19 only indicates that the longitudinal stress variation trends of the two schemes are similar along the transverse path at the same spacing, yet it fails to directly reflect their relative magnitude relationship. This is mainly because the transverse path spans a large range of longitudinal stress values, resulting in a relatively large stress interval of 200 Mpa for the longitudinal stress values on the y-axis. Moreover, as the distance between the two extreme welding sequences increases, the difference in longitudinal stress at the same node rapidly decreases.
As illustrated in Figure 20, the discrepancy between the transverse stress evolution curves of the two extreme welding sequences diminishes gradually as the T-rib spacing continues to increase. When the spacing between T-ribs is 400 mm, the transverse stress variation curves of simultaneous and sequential welding almost completely overlap, which means that there is no mutual influence between T-ribs in terms of transverse stress.
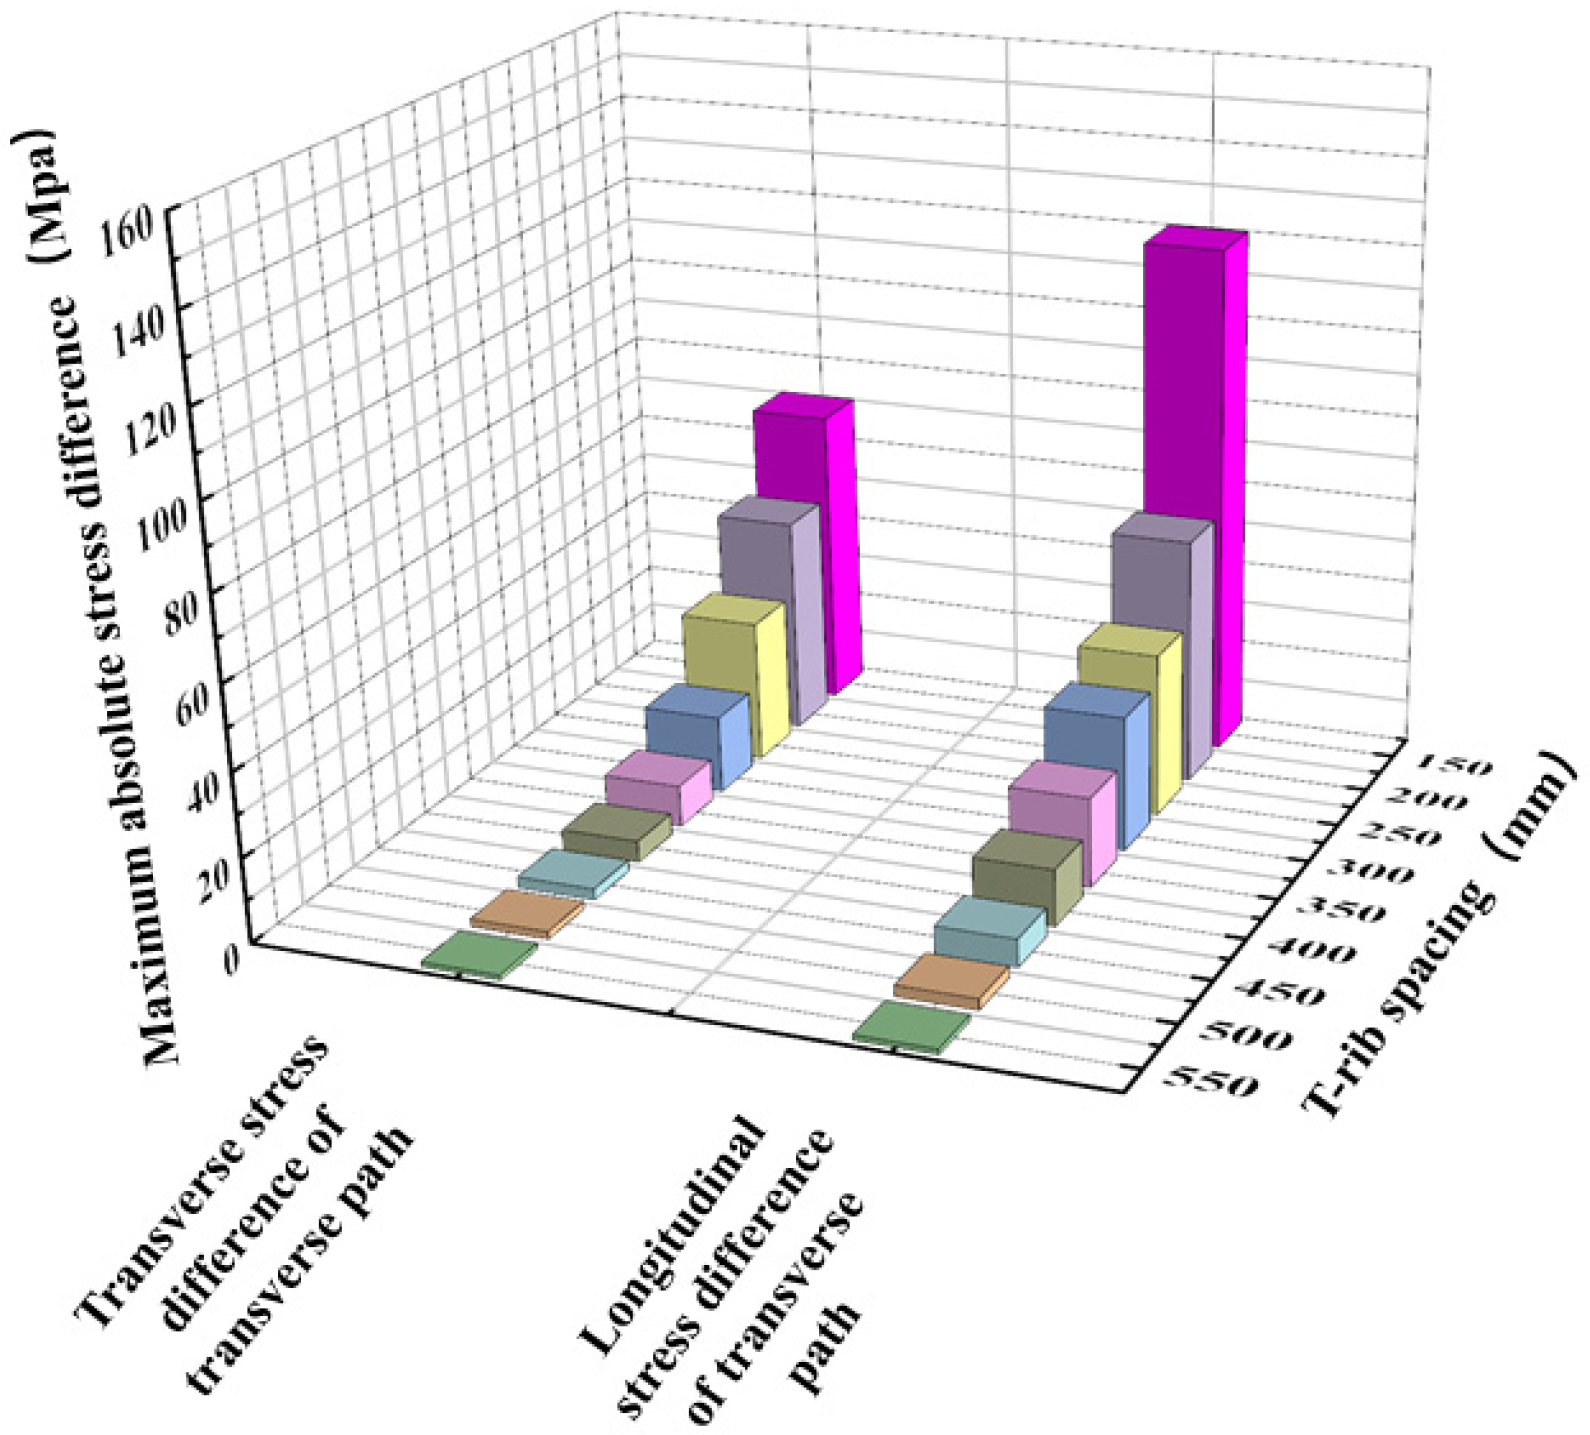
To quantitatively characterize the dependence of longitudinal and transverse stress discrepancies between the two welding schemes on T-rib spacing, stress differences were first calculated via post-processing. The stress variations corresponding to each welding scheme were then determined. Using the same procedure, the maximum longitudinal and transverse stress discrepancies were derived for all remaining spacing conditions. All data were compiled to generate the three-dimensional bar chart illustrated in Figure 21.
As shown in Figure 21, the stress difference corresponding to the maximum absolute residual stress in both longitudinal and transverse directions under the two extreme welding sequences decreases continuously with increasing T-rib spacing, and the rate of decrease gradually slows down. When the spacing between T-ribs is 150 mm, the maximum absolute residual stresses in the longitudinal and transverse directions are 120.509 Mpa and 71.23 Mpa, respectively. But at 450 mm, the maximum absolute difference in longitudinal and transverse residual stresses is only 6.65 Mpa and 2.59 Mpa, respectively. The latter is only 5.5% and 3.6% of the former, which means that when the T-rib spacing is 450 mm, there will be no mutual influence between them. Next, we will discuss the critical spacing value from the longitudinal path.
As depicted in Figure 22 and Figure 23, with a continuous increase in T-rib spacing, the correlation between the longitudinal and transverse stress evolution curves for the two extreme welding sequences exhibits a similar trend to that observed on the transverse path for both schemes. The relationship between the longitudinal stresses of the two welding schemes is not clearly distinguished, whereas the difference in transverse stresses is more pronounced. At a T-rib spacing of 450 mm, the transverse stress evolution curves for synchronous welding and sequential welding almost completely overlap, indicating negligible mutual interference between adjacent T-ribs under this spacing.
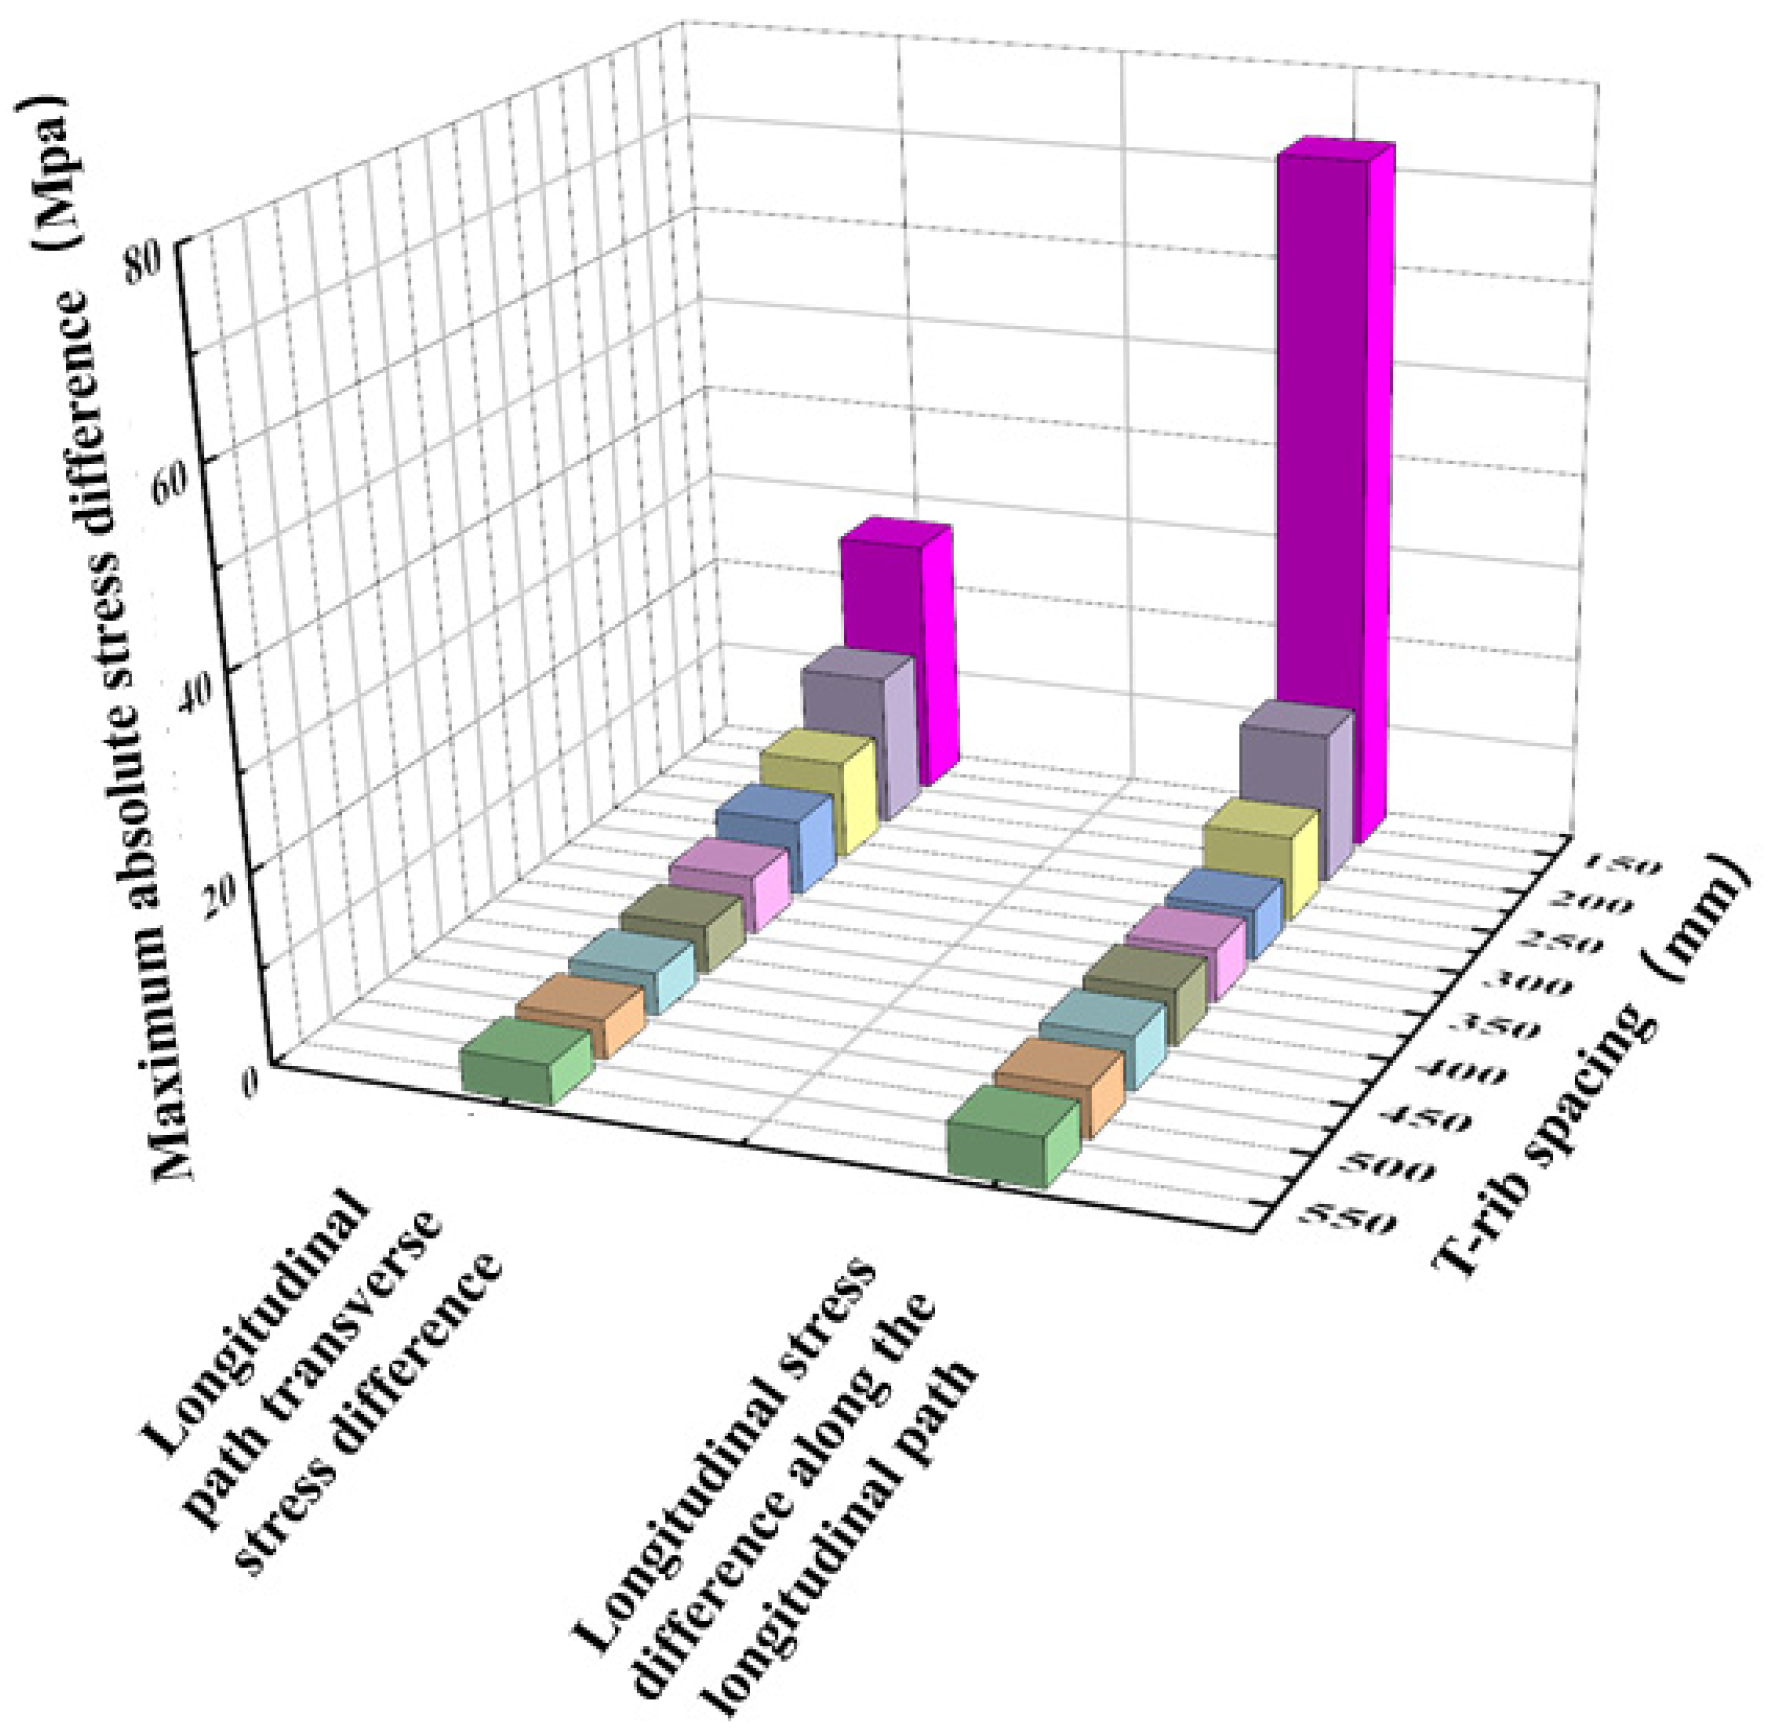
In order to more intuitively reflect the corresponding changes in longitudinal and transverse stress differences between two different schemes with the change in spacing size from the perspective of numerical changes, first, the longitudinal and transverse stress differences in each node on the longitudinal path under two extreme welding sequences are obtained through data processing, and then the maximum longitudinal and transverse stress differences on the longitudinal path of different welding schemes with the same spacing are obtained. Then, the same method is used to obtain the maximum longitudinal and transverse stress differences corresponding to other spacings. Finally, the three-dimensional bar chart shown in Figure 3, Figure 4, Figure 5, Figure 6, Figure 7, Figure 8, Figure 9, Figure 10, Figure 11, Figure 12, Figure 13, Figure 14, Figure 15, Figure 16, Figure 17, Figure 18, Figure 19, Figure 20, Figure 21, Figure 22, Figure 23, Figure 24, Figure 25, Figure 26, Figure 27, Figure 28 and Figure 29 is made by summarizing the data.
Figure 24 indicates that the stress difference associated with the maximum absolute residual stress in both directions for the two extreme welding sequences declines continuously as the T-rib spacing increases, with the decreasing rate gradually slowing down. When the spacing between T-ribs is 150 mm, the maximum absolute residual stress differences in the longitudinal and transverse directions are 73.01 Mpa and 27.60 Mpa, respectively. When T-rib spacing reaches 400 mm, the longitudinal and transverse residual stress differences are 5.92 MPa and 5.13 MPa, respectively. Beyond this spacing threshold, the fluctuation of stress differences becomes insignificant and remains stable within 4–5 MPa.
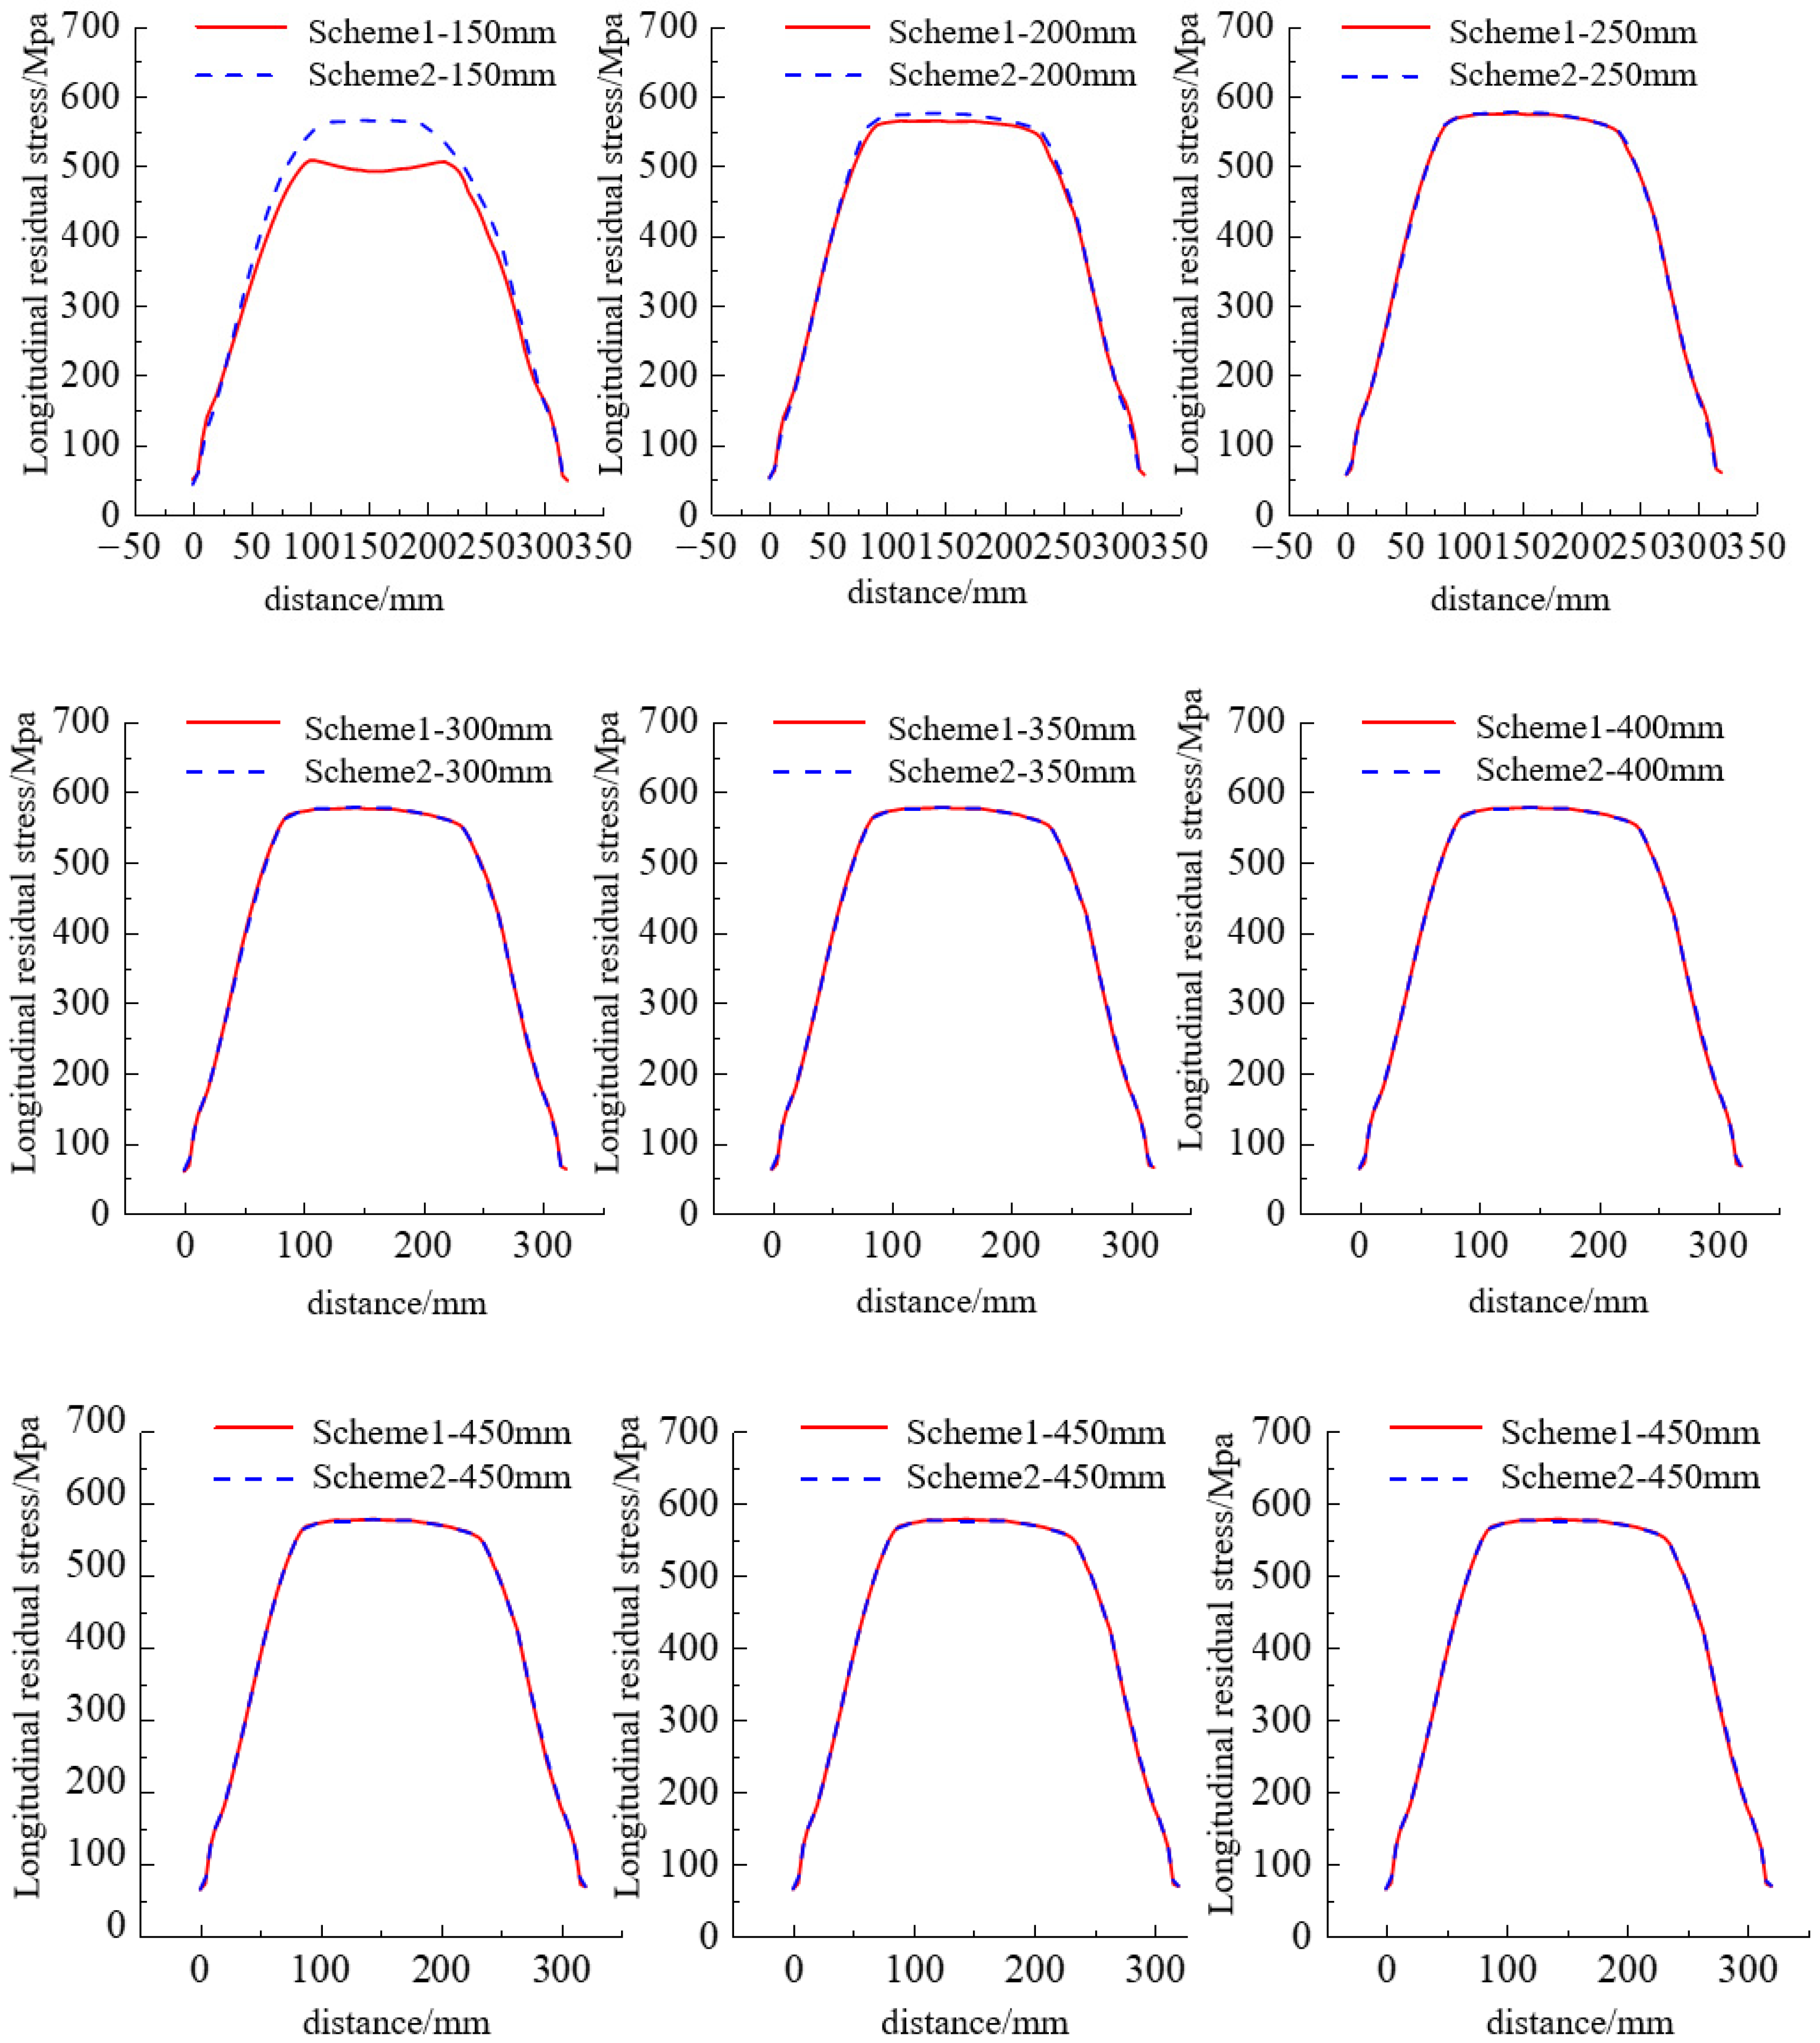
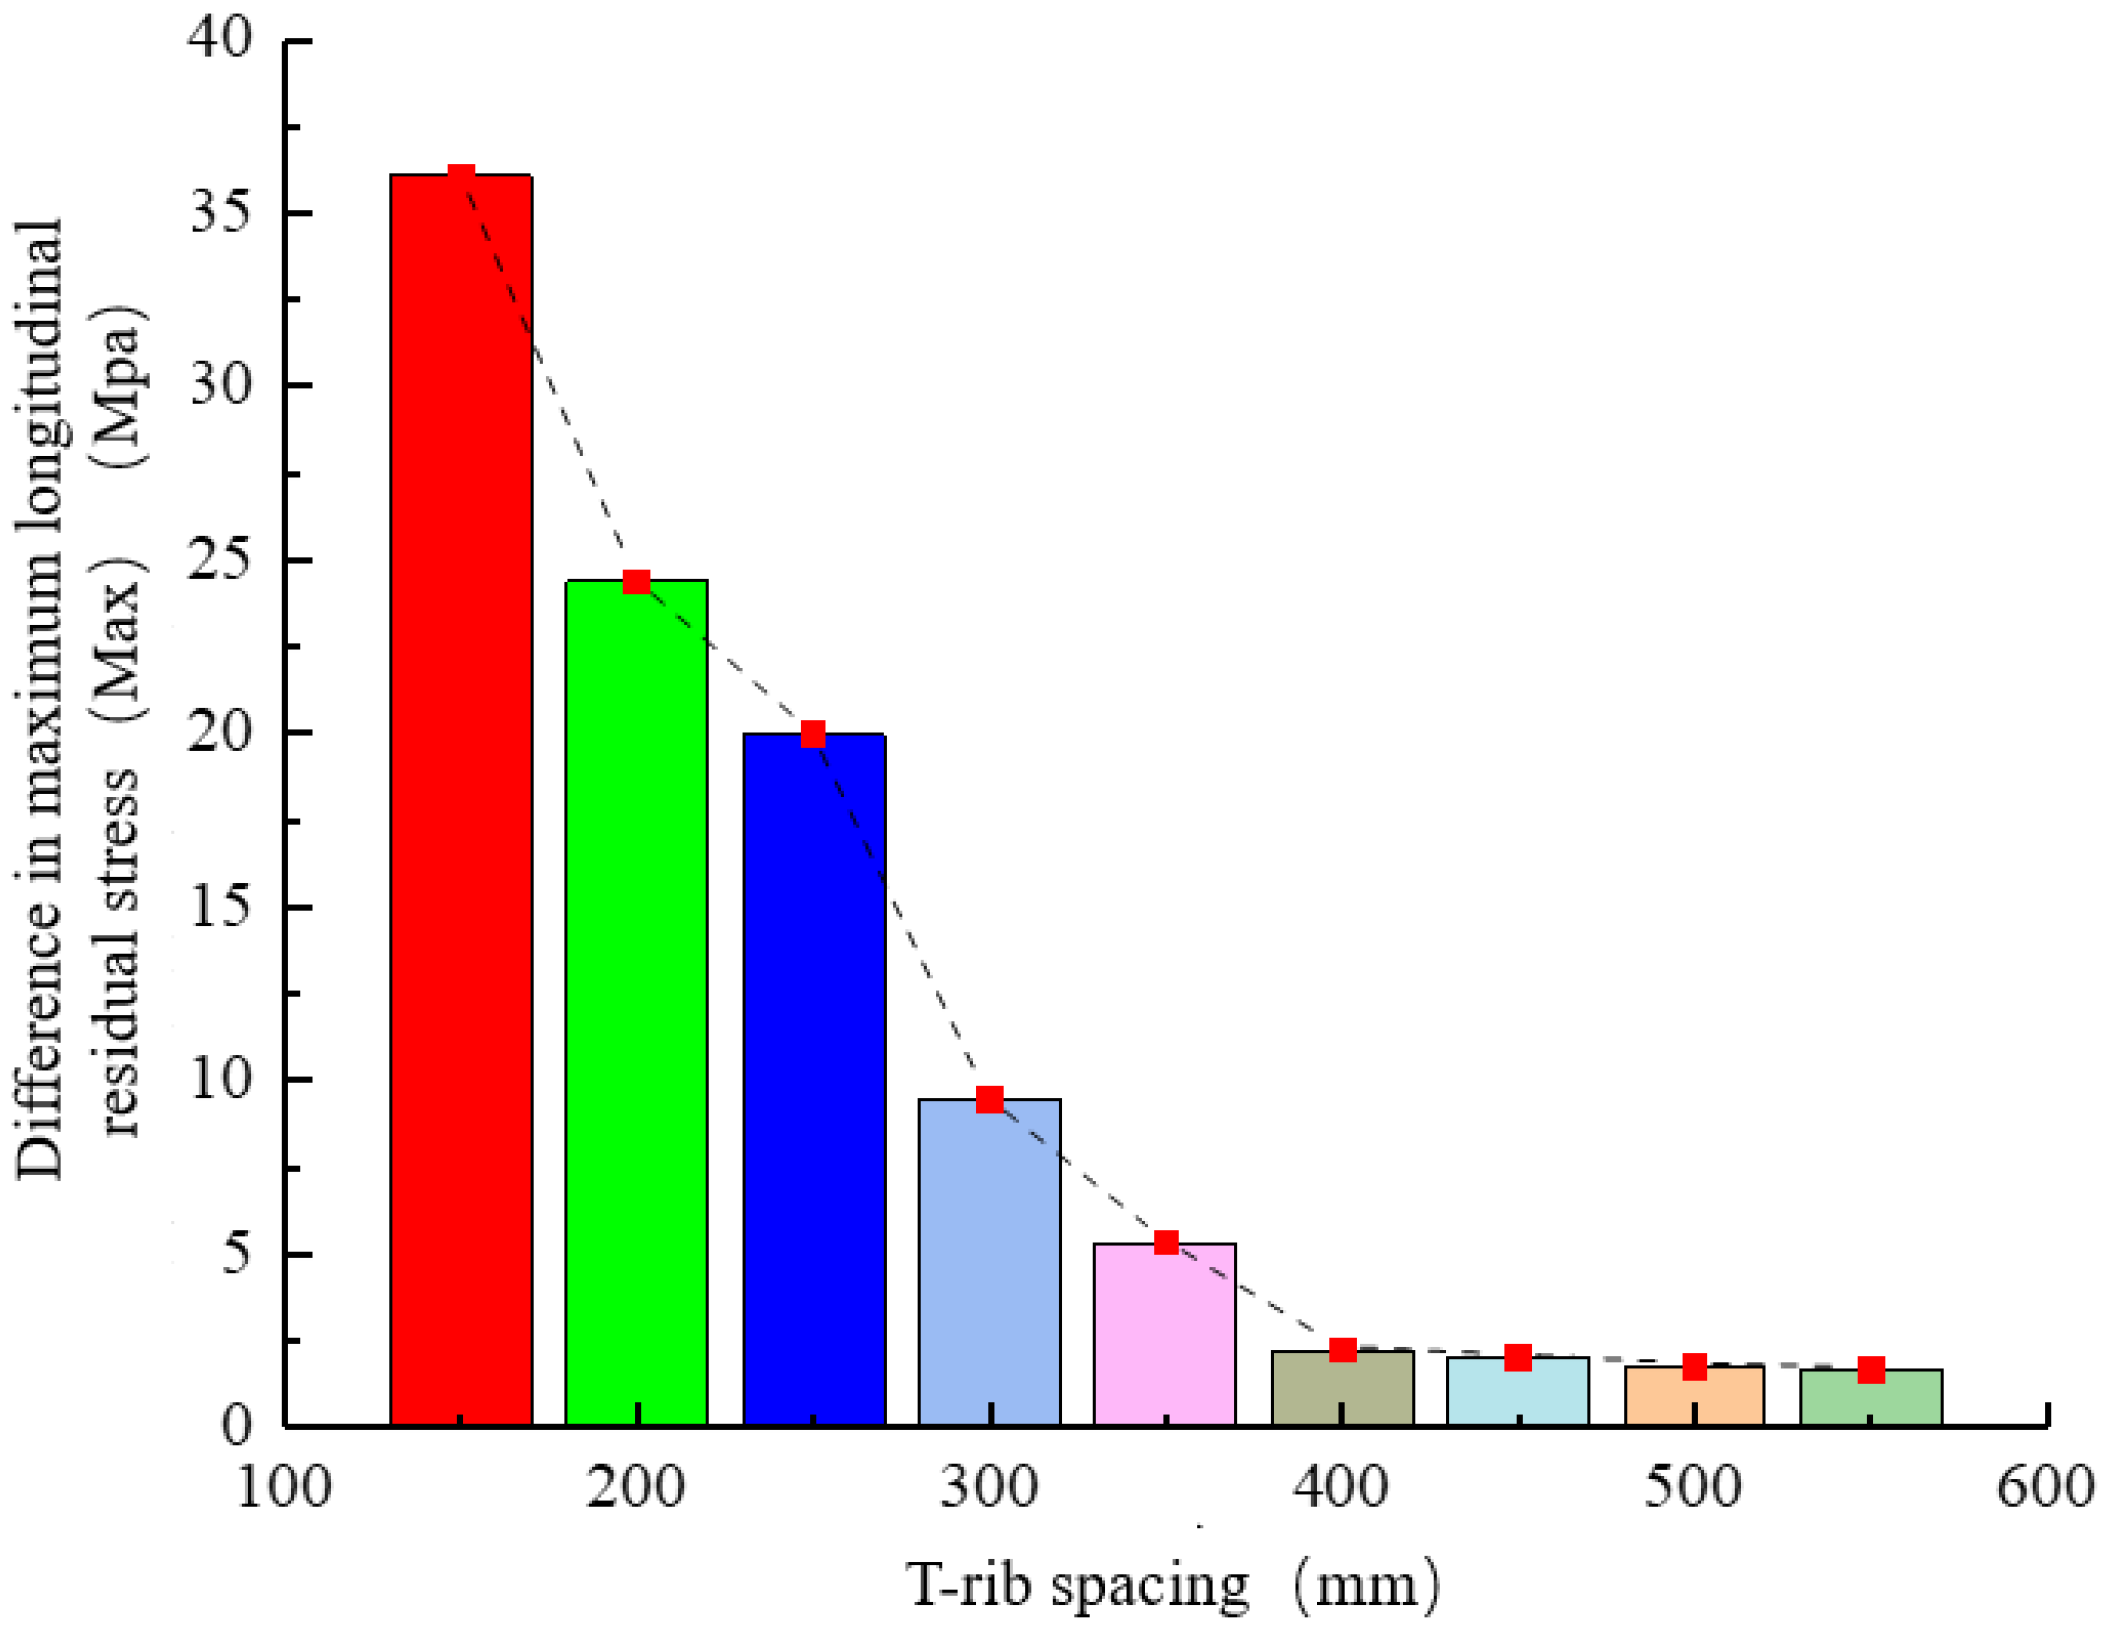
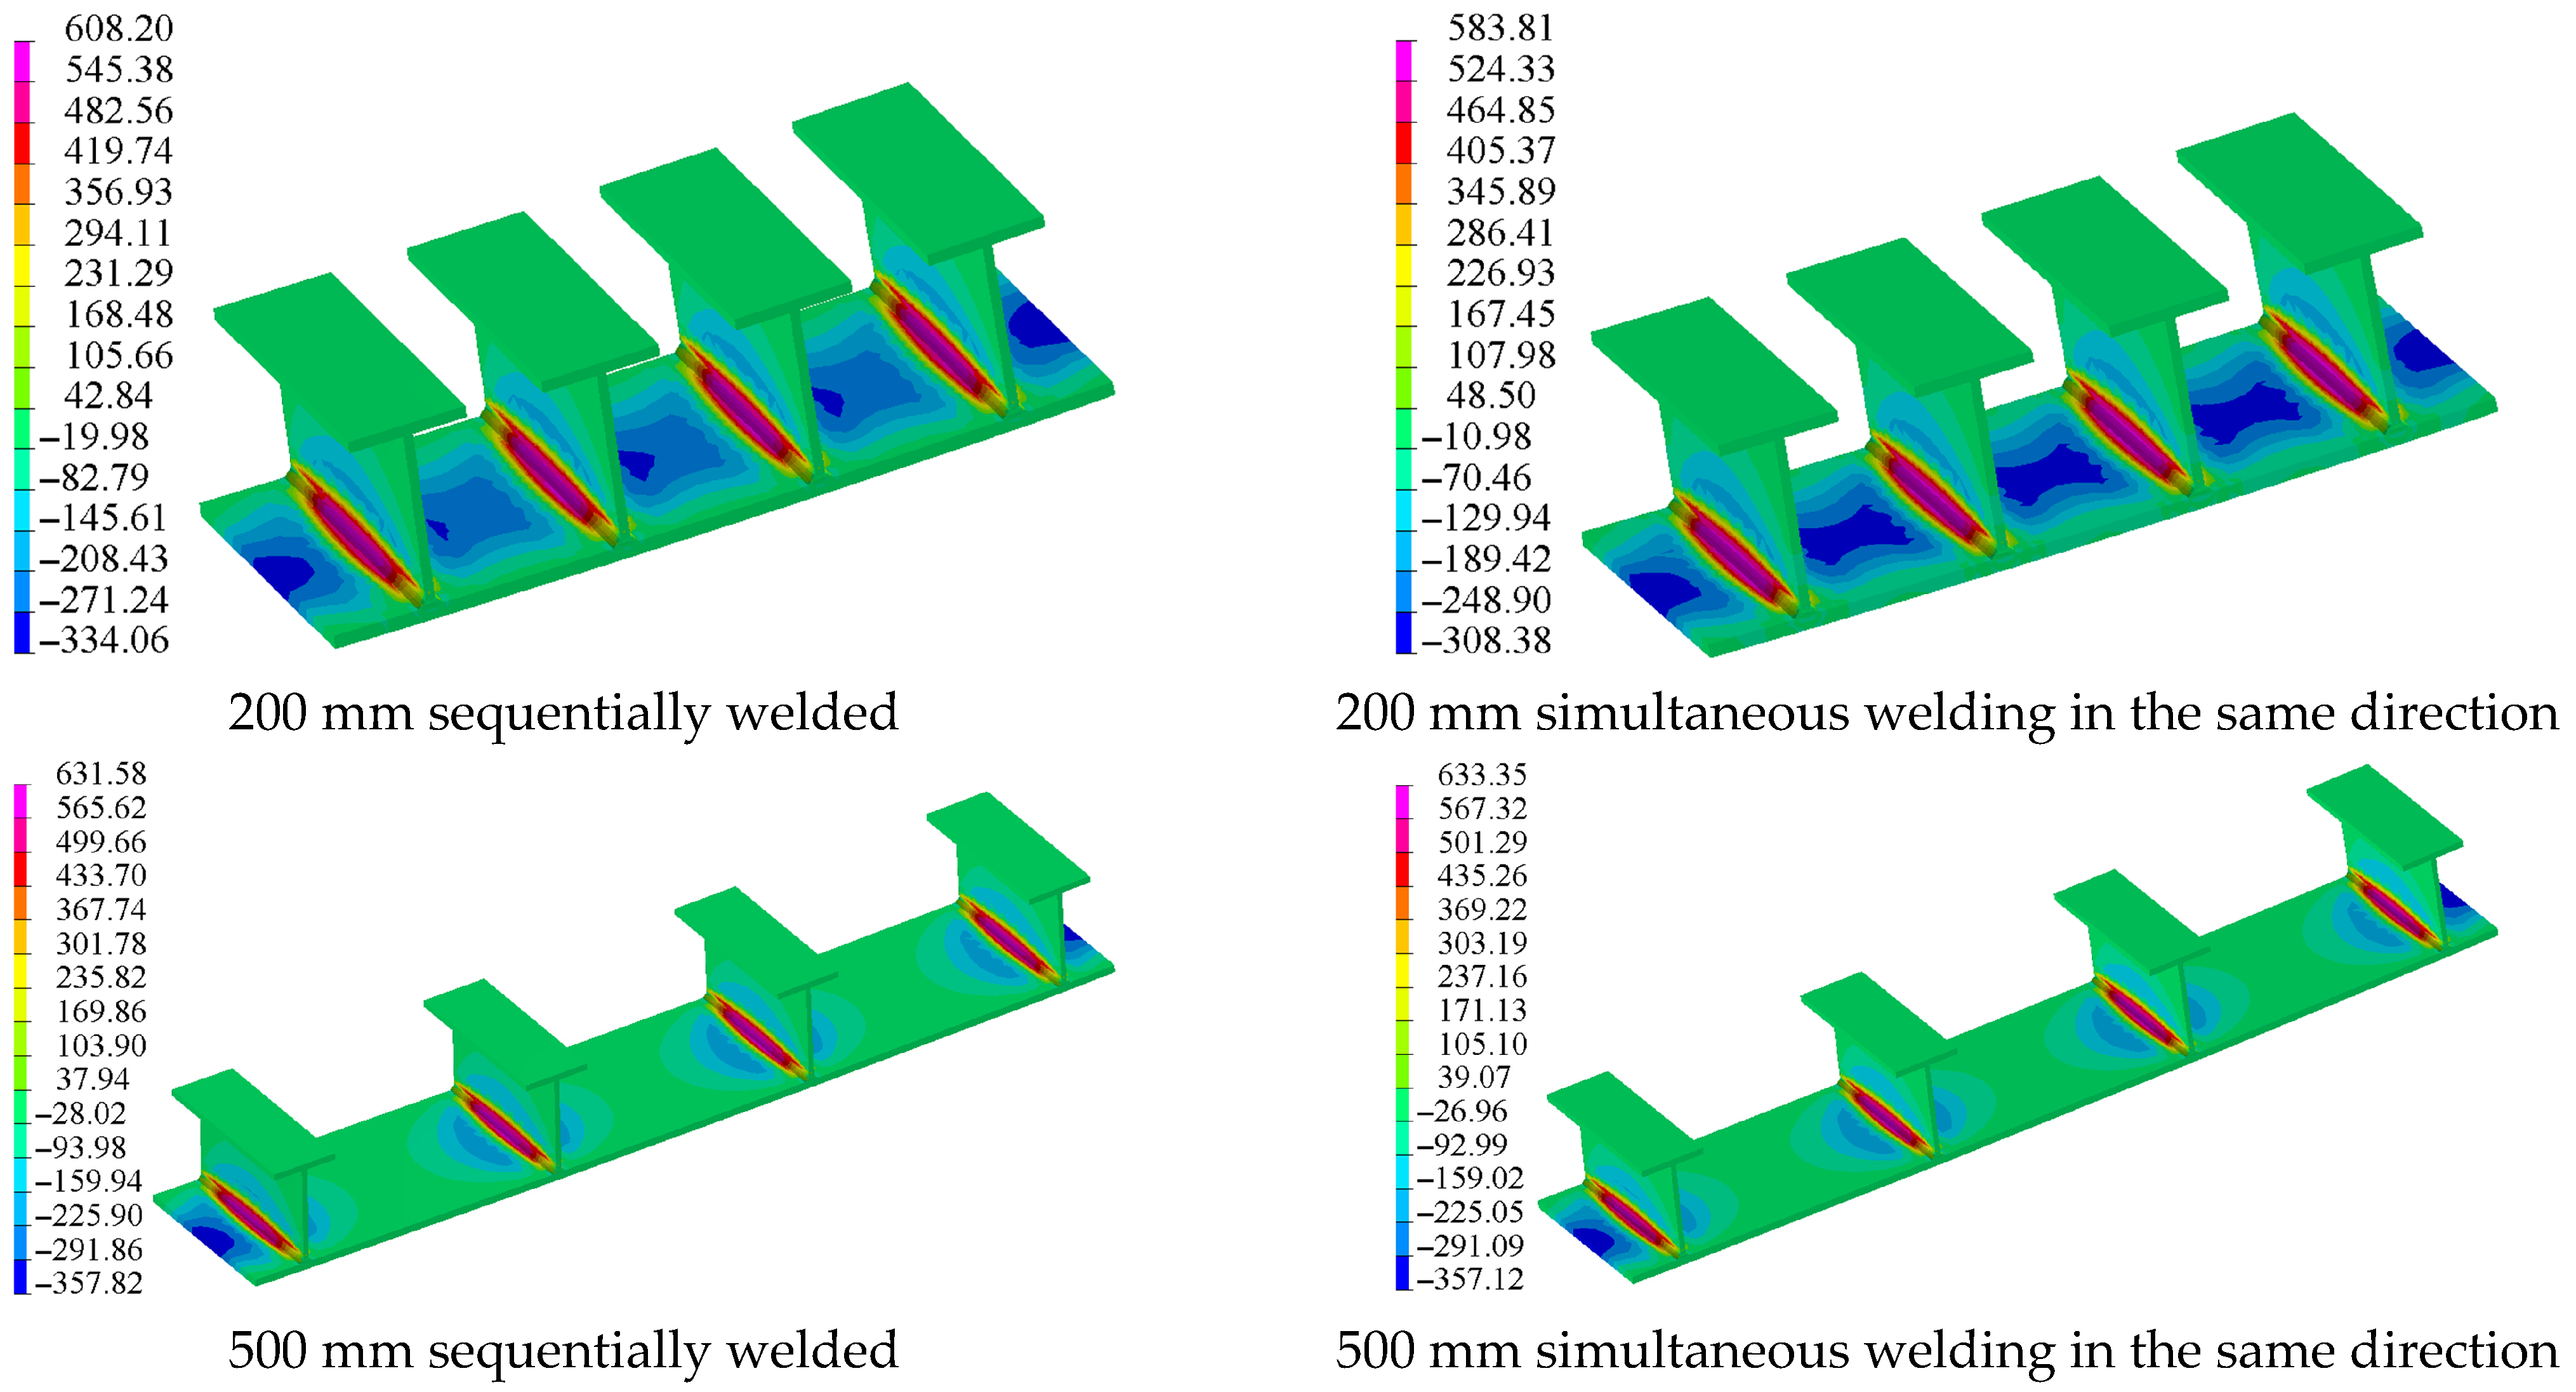
Figure 25 presents the longitudinal residual stress cloud diagrams for 200 mm and 500 mm rib spacing under two extreme welding sequences after welding. It can be observed that the longitudinal residual stress discrepancy between the two sequences is notably smaller at 500 mm spacing than at 200 mm. For clearer visualization, the peak longitudinal residual stresses of nine models with different spacing and welding sequences were extracted through post-processing. The absolute differences in these peak stresses under identical spacing but varying welding sequences were further calculated and presented as a bar chart in Figure 26.
As shown in Figure 26, the difference in maximum longitudinal residual stress between the two extreme welding sequences with the same spacing gradually decreases with increasing spacing. When the T-rib spacing is between 400 and 550 mm, the difference stabilizes at around 2 Mpa. When the spacing between T-ribs is 150 mm, the maximum absolute difference in longitudinal residual stress after welding between the two schemes is 36.08 Mpa. However, when the spacing is 450 mm, the difference is only 2.013 Mpa, which is only 5.6% of the former.
Based on the above analysis of deformation and stress fields under two extreme welding sequences across various T-rib spacings, the critical spacing thresholds can be quantitatively determined. Specifically, 500 mm is identified as the critical T-rib spacing for the deformation field, while 450 mm is regarded as the critical spacing for the stress field.

5. The Influence of Multi-Rib Welding Sequence on Welding Deformation

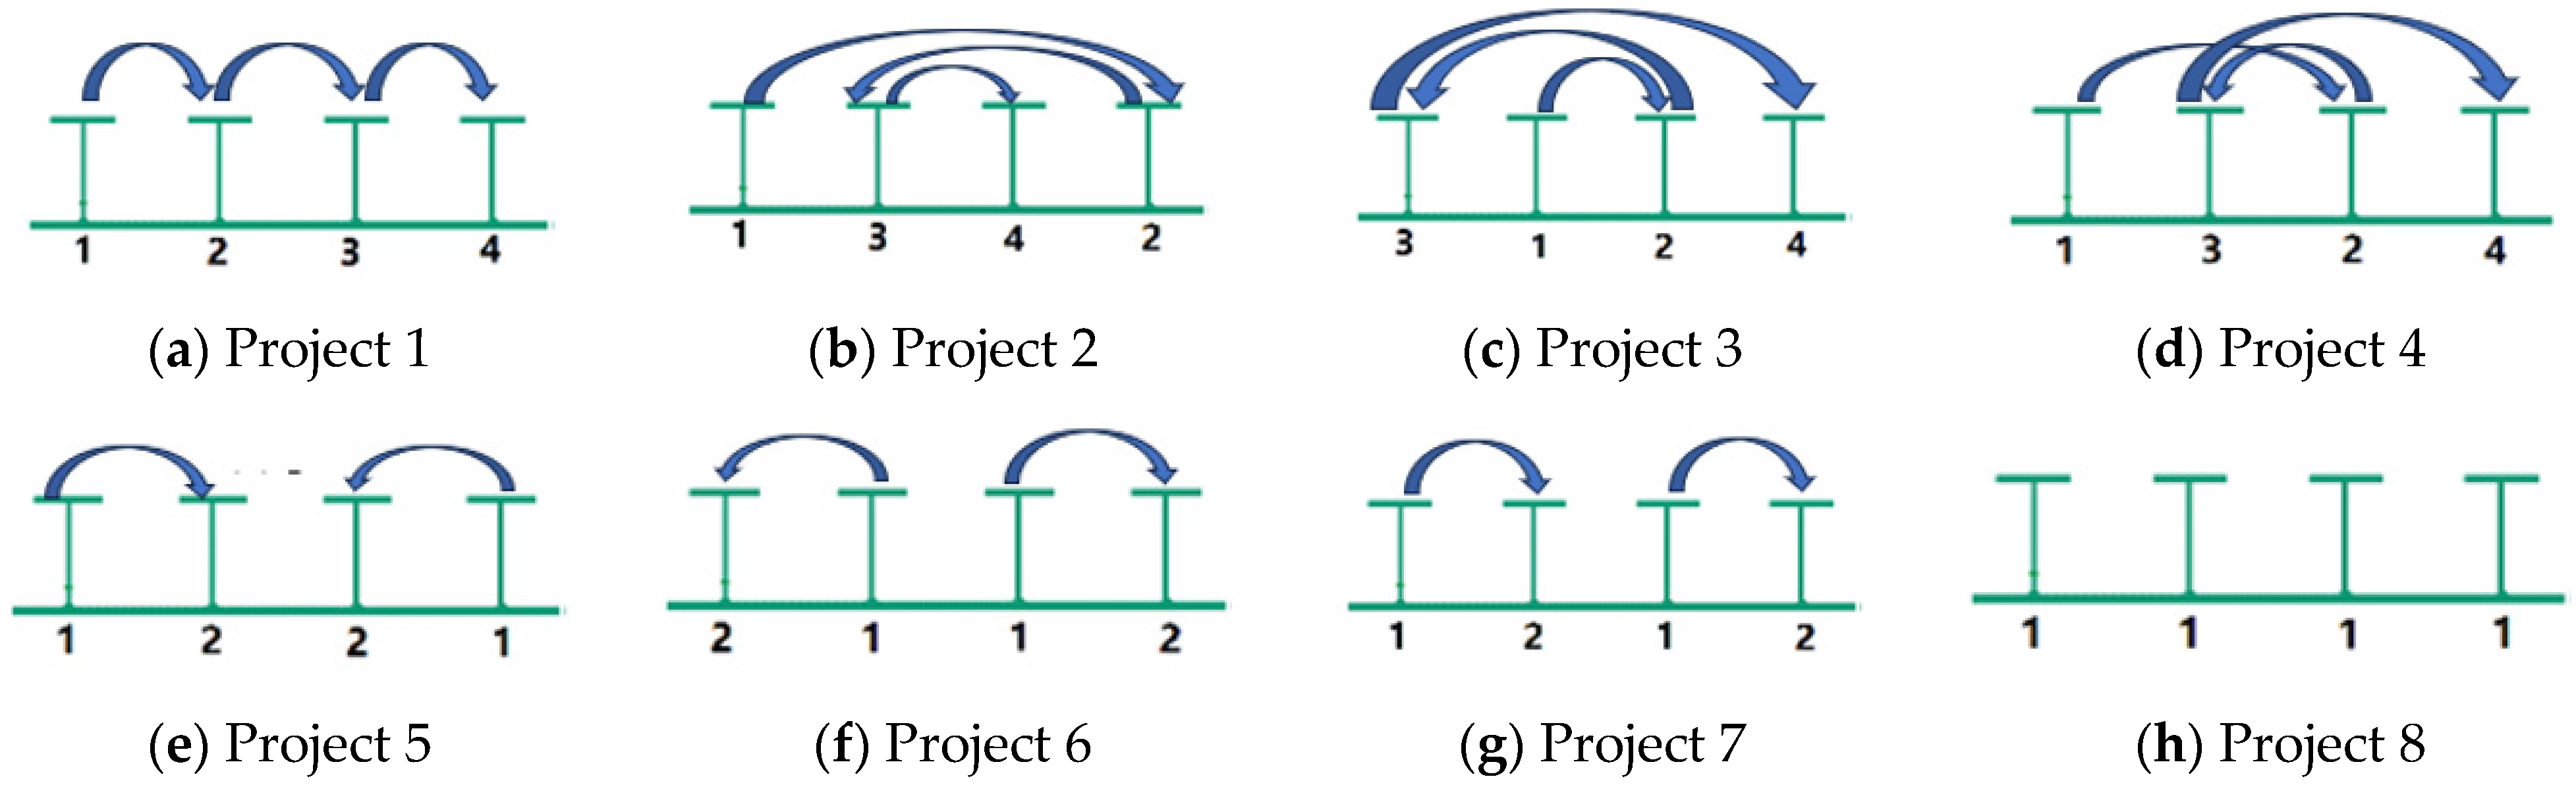
For the purpose of discussing the effect of multi-rib welding on welding deformation, the welding behavior of four adjacent T-ribs with steel plates is examined in this section at a T-rib spacing of 300 mm. The optimal welding scheme for a single T-rib obtained in the second section is used to simultaneously weld in the same direction to explore the mechanical behavior of eight different welding sequences for multiple ribs, and the optimal multi-rib welding sequence scheme is obtained. Figure 1, Figure 2, Figure 3, Figure 4 and Figure 9 represent the welding sequence of each rib. Both sides of the T rib are welded in the same direction at the same time, and the interlayer cooling time is 400 s to maintain an appropriate preheating temperature. After the final weld is completed, it is uniformly cooled for 4000 s.

5.1. Maximum Deformation Analysis

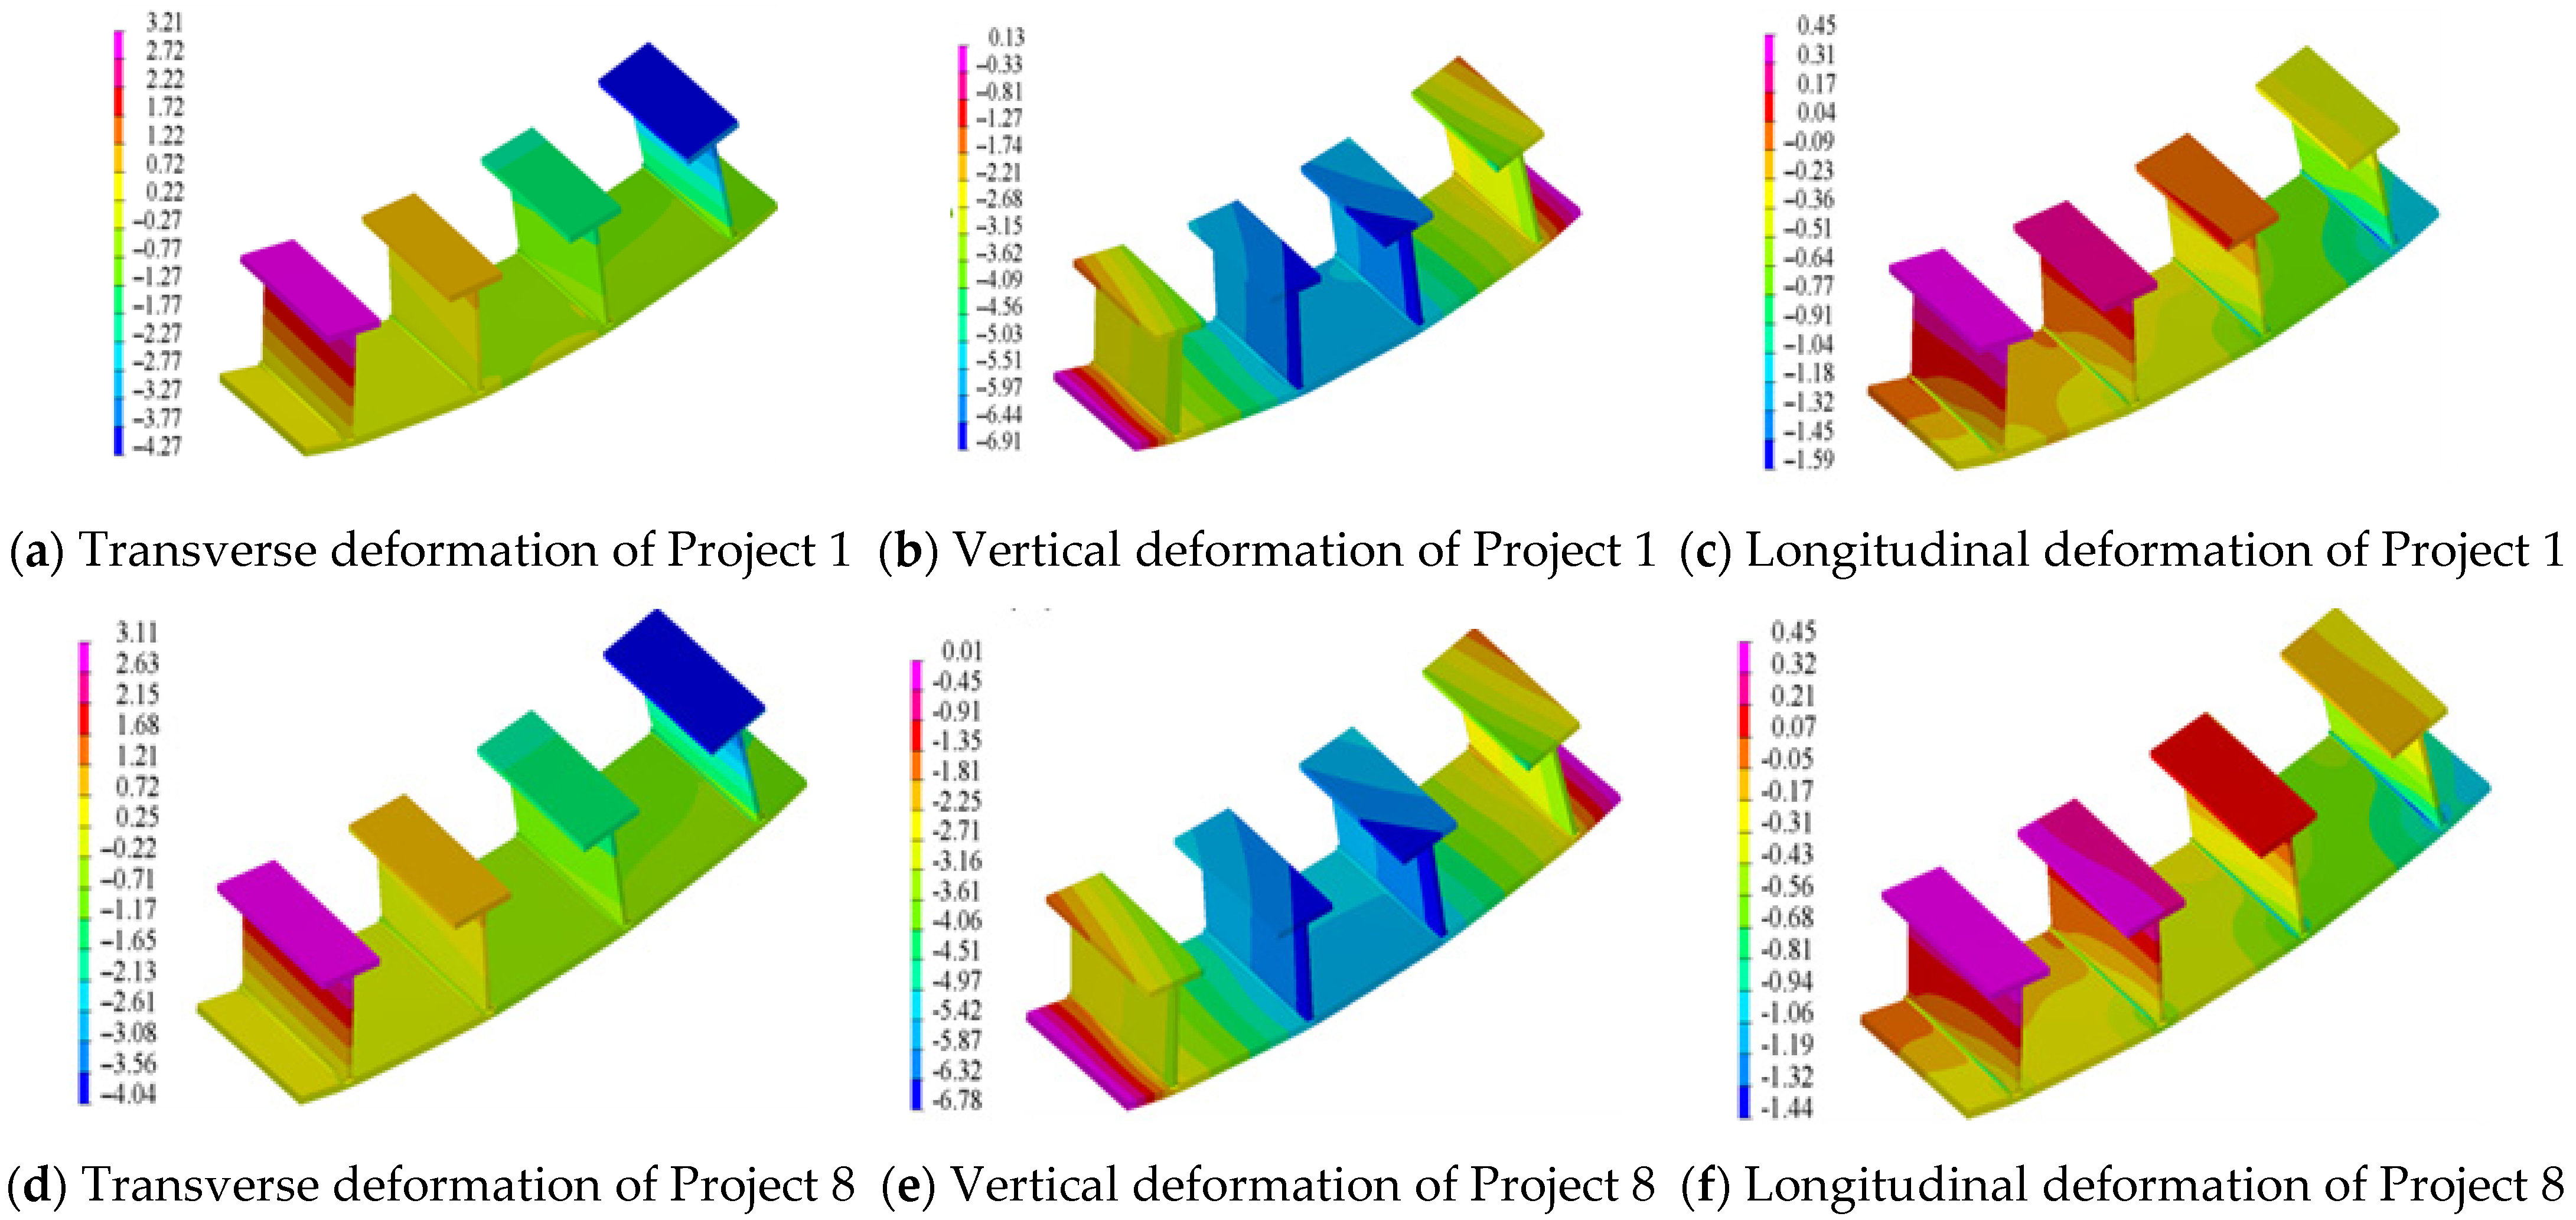
Taking the deformation in three directions under the two welding sequences of Project 1 and Project 8 as an example, the deformation after cooling is shown in Figure 28. In Project 1, the transverse deformation of the T-rib flange after welding is the largest, and the longitudinal stress near the weld is significant. The overall vertical deformation of the two adjacent T-ribs welded in the middle is significant. The deformation trends of Project 1 and Project 8 are roughly the same, and the absolute values of the maximum deformation in all three directions in Project 8 are smaller than those in Project 1. In order to make a more comprehensive comparison, the absolute values of the maximum deformation in all three directions from Project 1 to Project 8 are summarized in Table 7.
The results demonstrate that the welding deformation of the eight schemes is dominated by vertical deflection. The maximum absolute deformations in the three coordinate directions of Scheme 8 are lower than those of the other seven schemes, verifying that synchronous welding constitutes the optimal strategy. For two-rib synchronous welding, Scheme 6 yields the best performance. For single-rib sequential welding, Scheme 3 is identified as the optimum, whereas Scheme 1 represents the most unfavorable configuration. Since maximum deformation serves as a local evaluation index, engineering applications usually place greater emphasis on the global deformation characteristics. Accordingly, the deformation fields along the longitudinal and transverse paths are further analyzed in the following section.

5.2. Analysis of Lateral Path Deformation Field Result

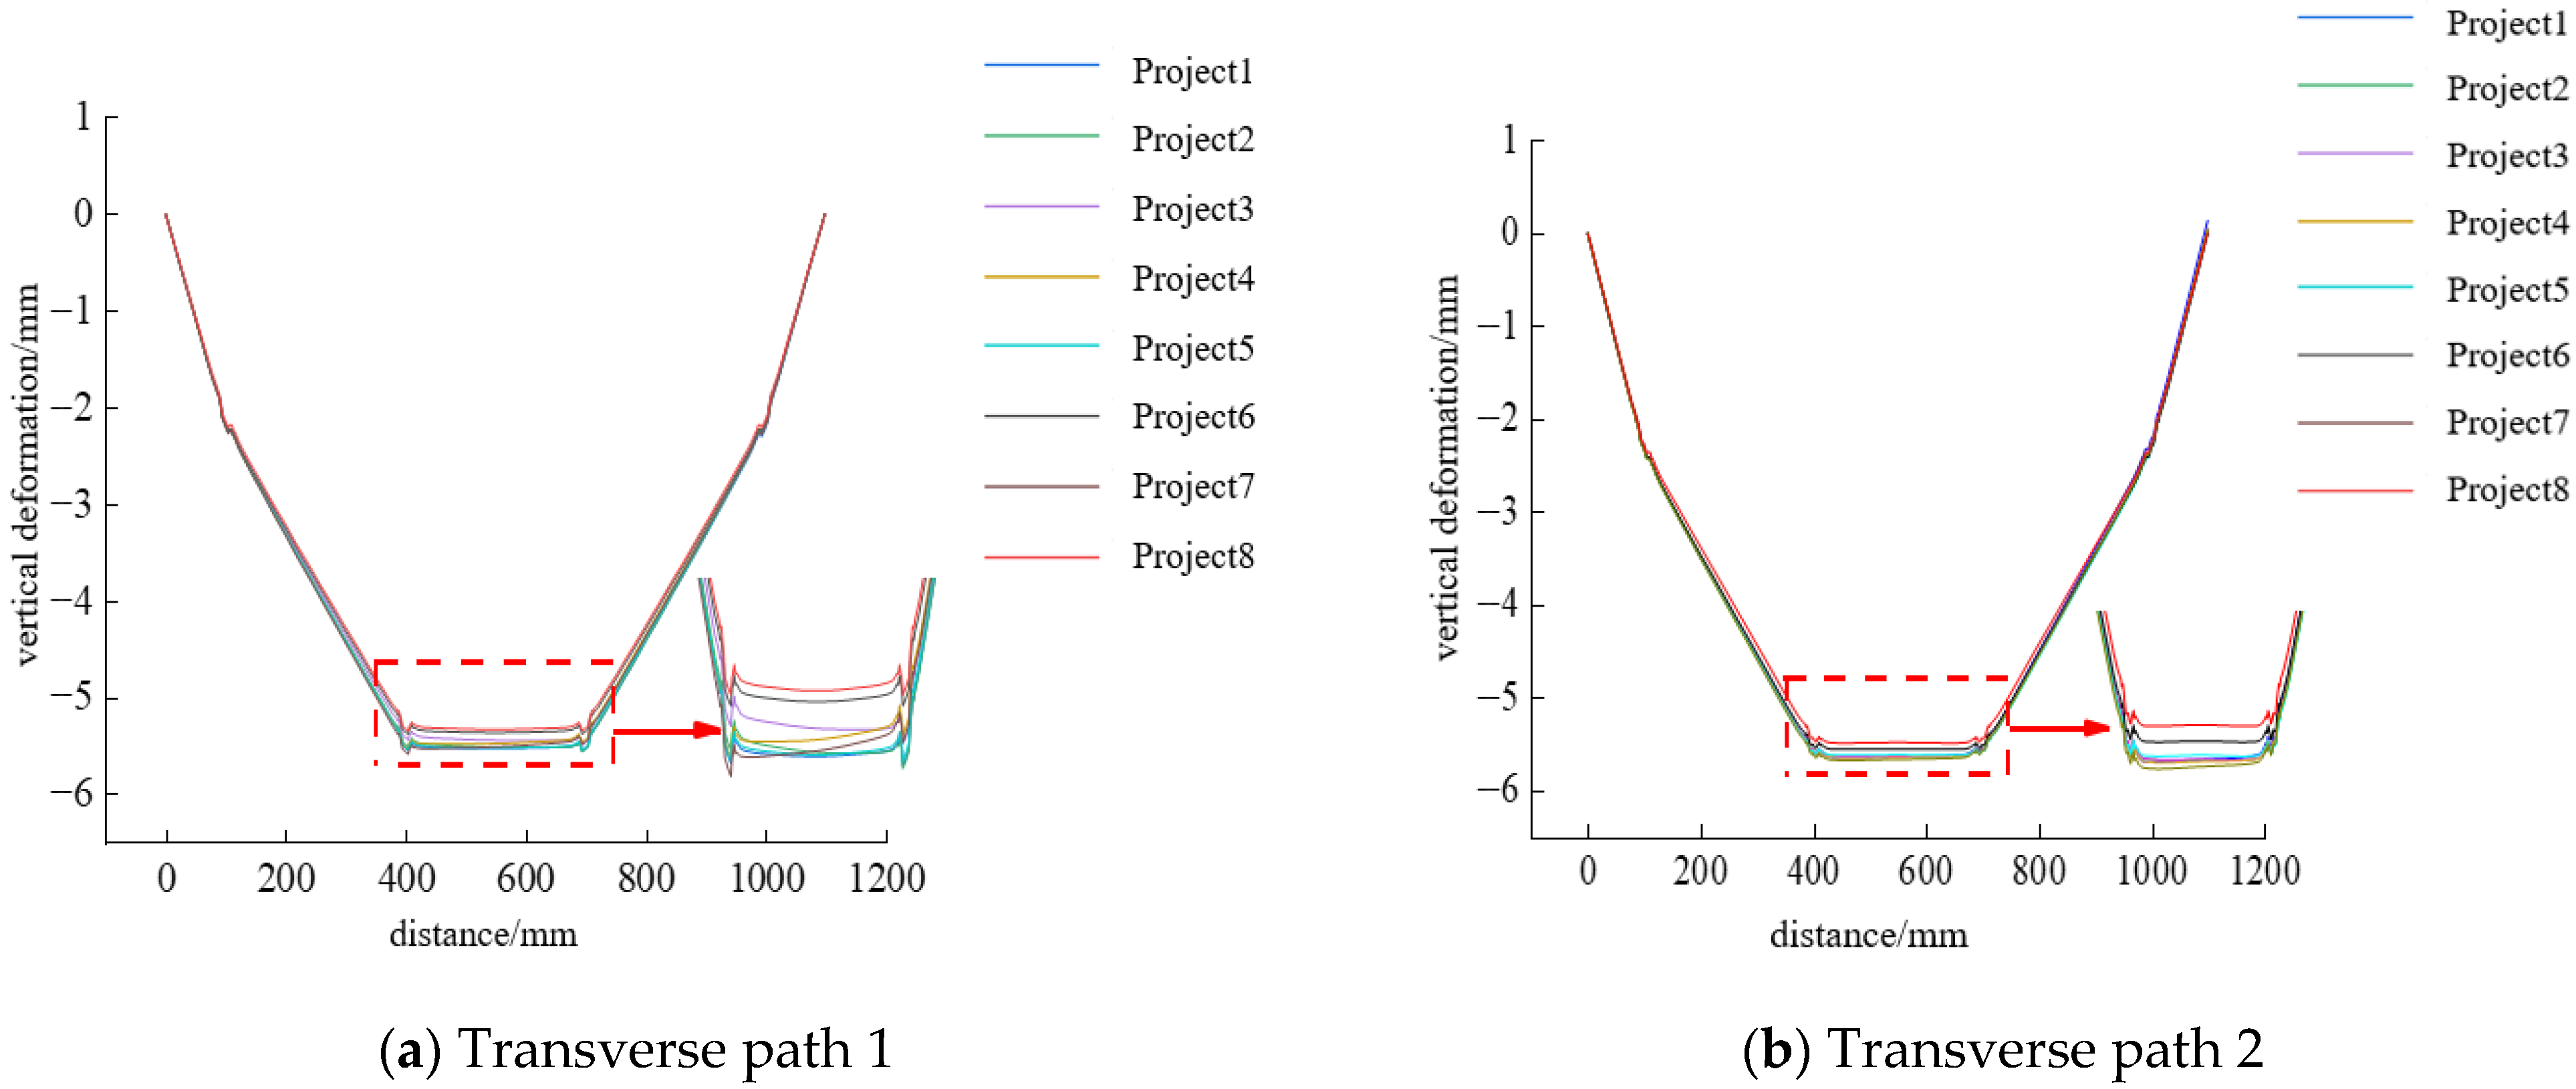
The horizontal and vertical paths are shown in Figure 29. In post-processing, the vertical deformations of horizontal paths 1 and 2 under different welding sequences are extracted, and the deformation results are shown in Figure 30a,b.
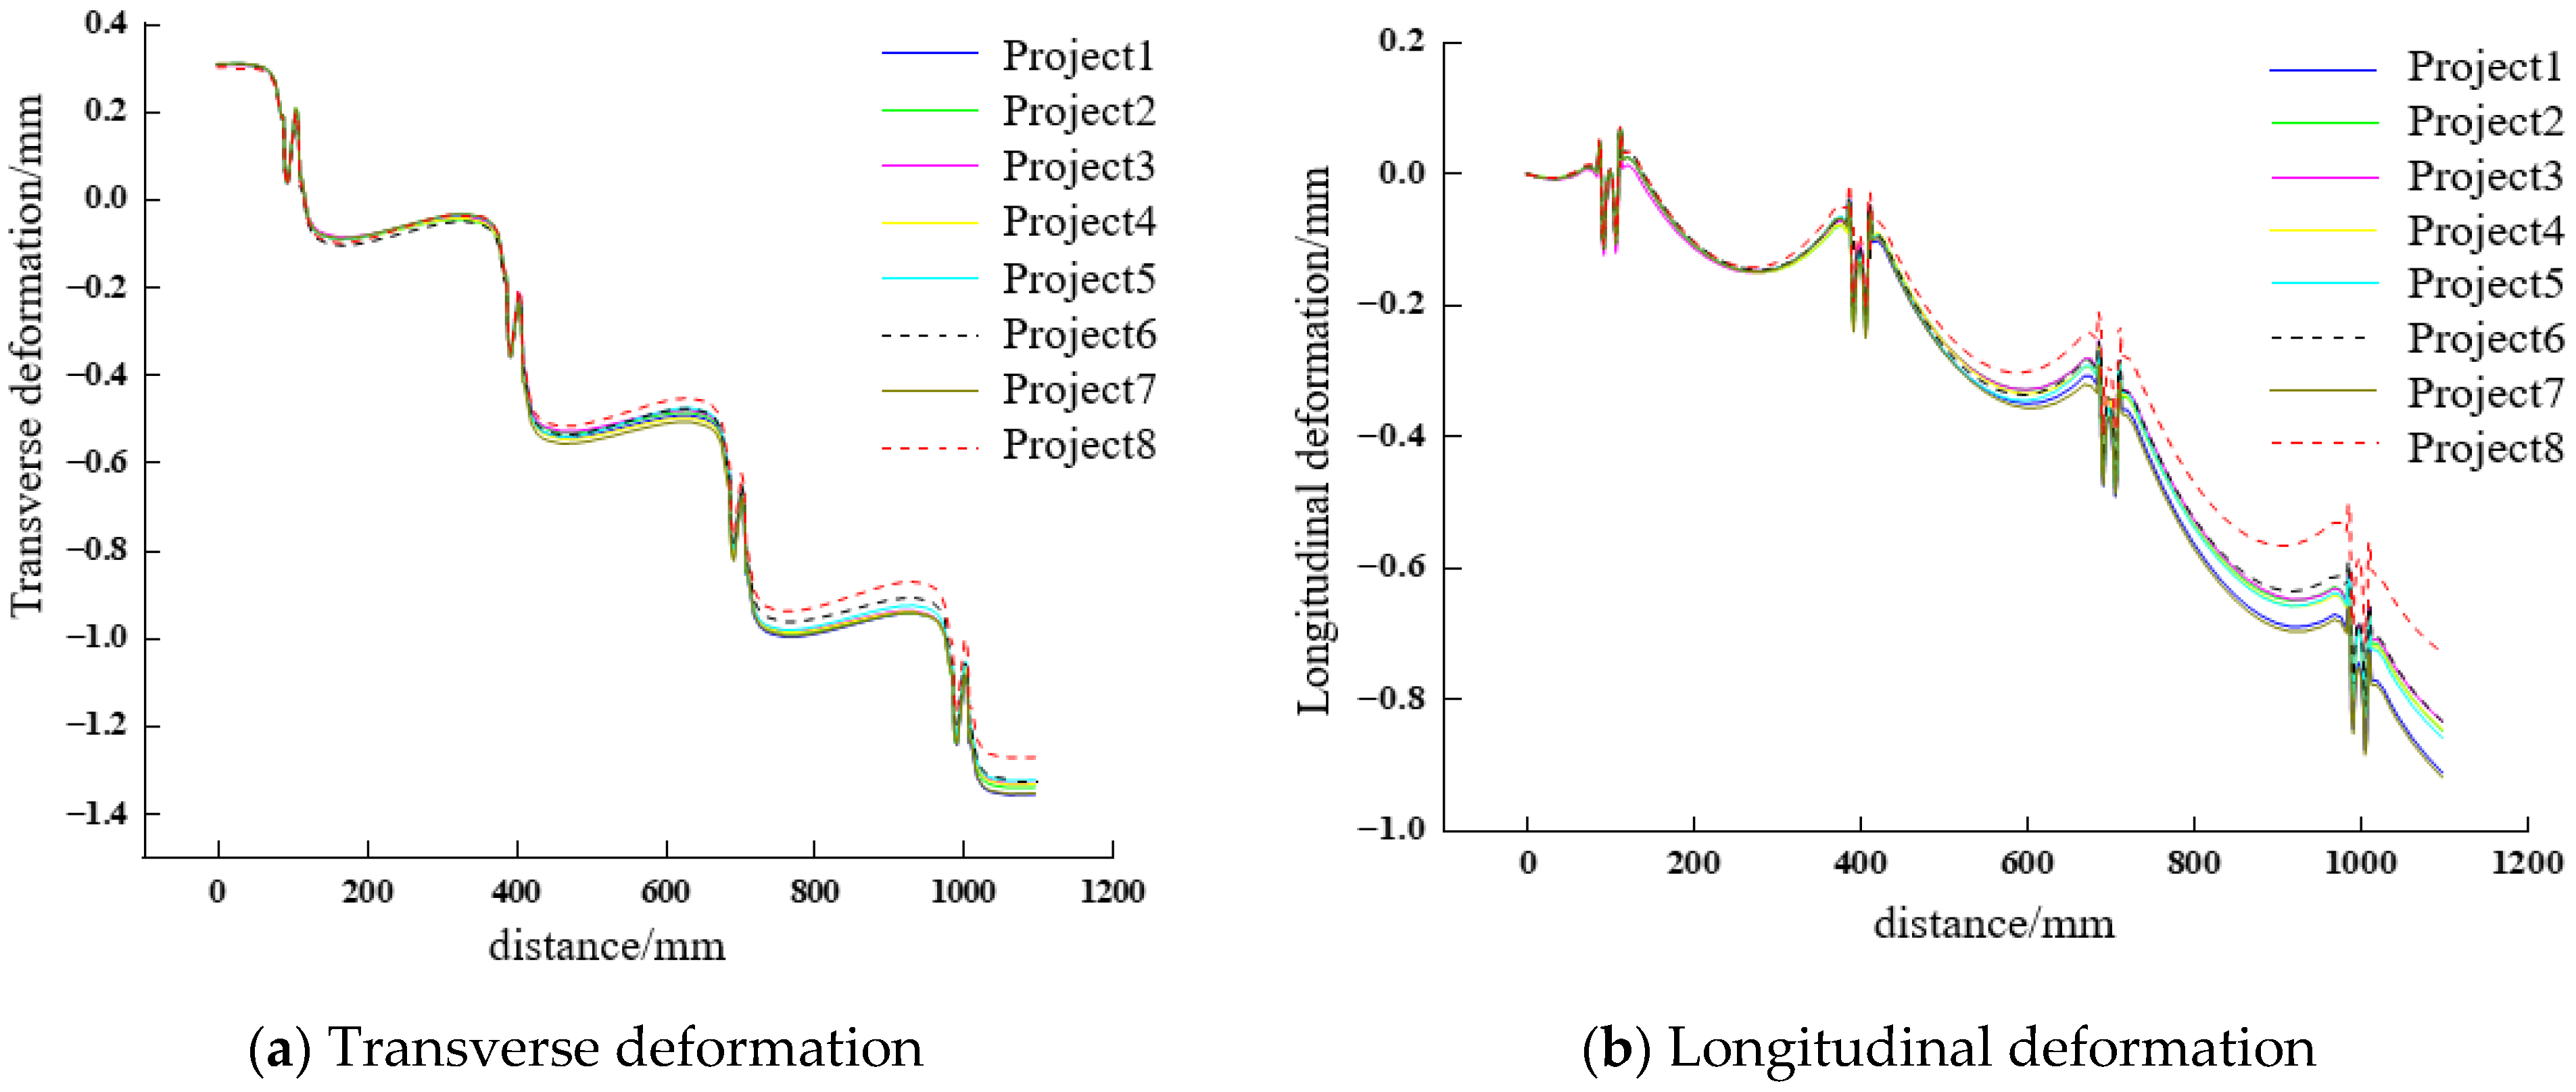
From the vertical deformation diagrams of transverse paths 1 and 2 for various welding sequences, Scheme 8 shows notably less vertical deformation than the other schemes, followed by Scheme 6, while Scheme 1 performs the worst. When welding the weld seam simultaneously, the dispersion of heat input will also cause the transverse and longitudinal deformation values to be smaller in most positions compared to other welding schemes, as shown in Figure 31a,b.

5.3. Analysis of Longitudinal Path Deformation Field Results

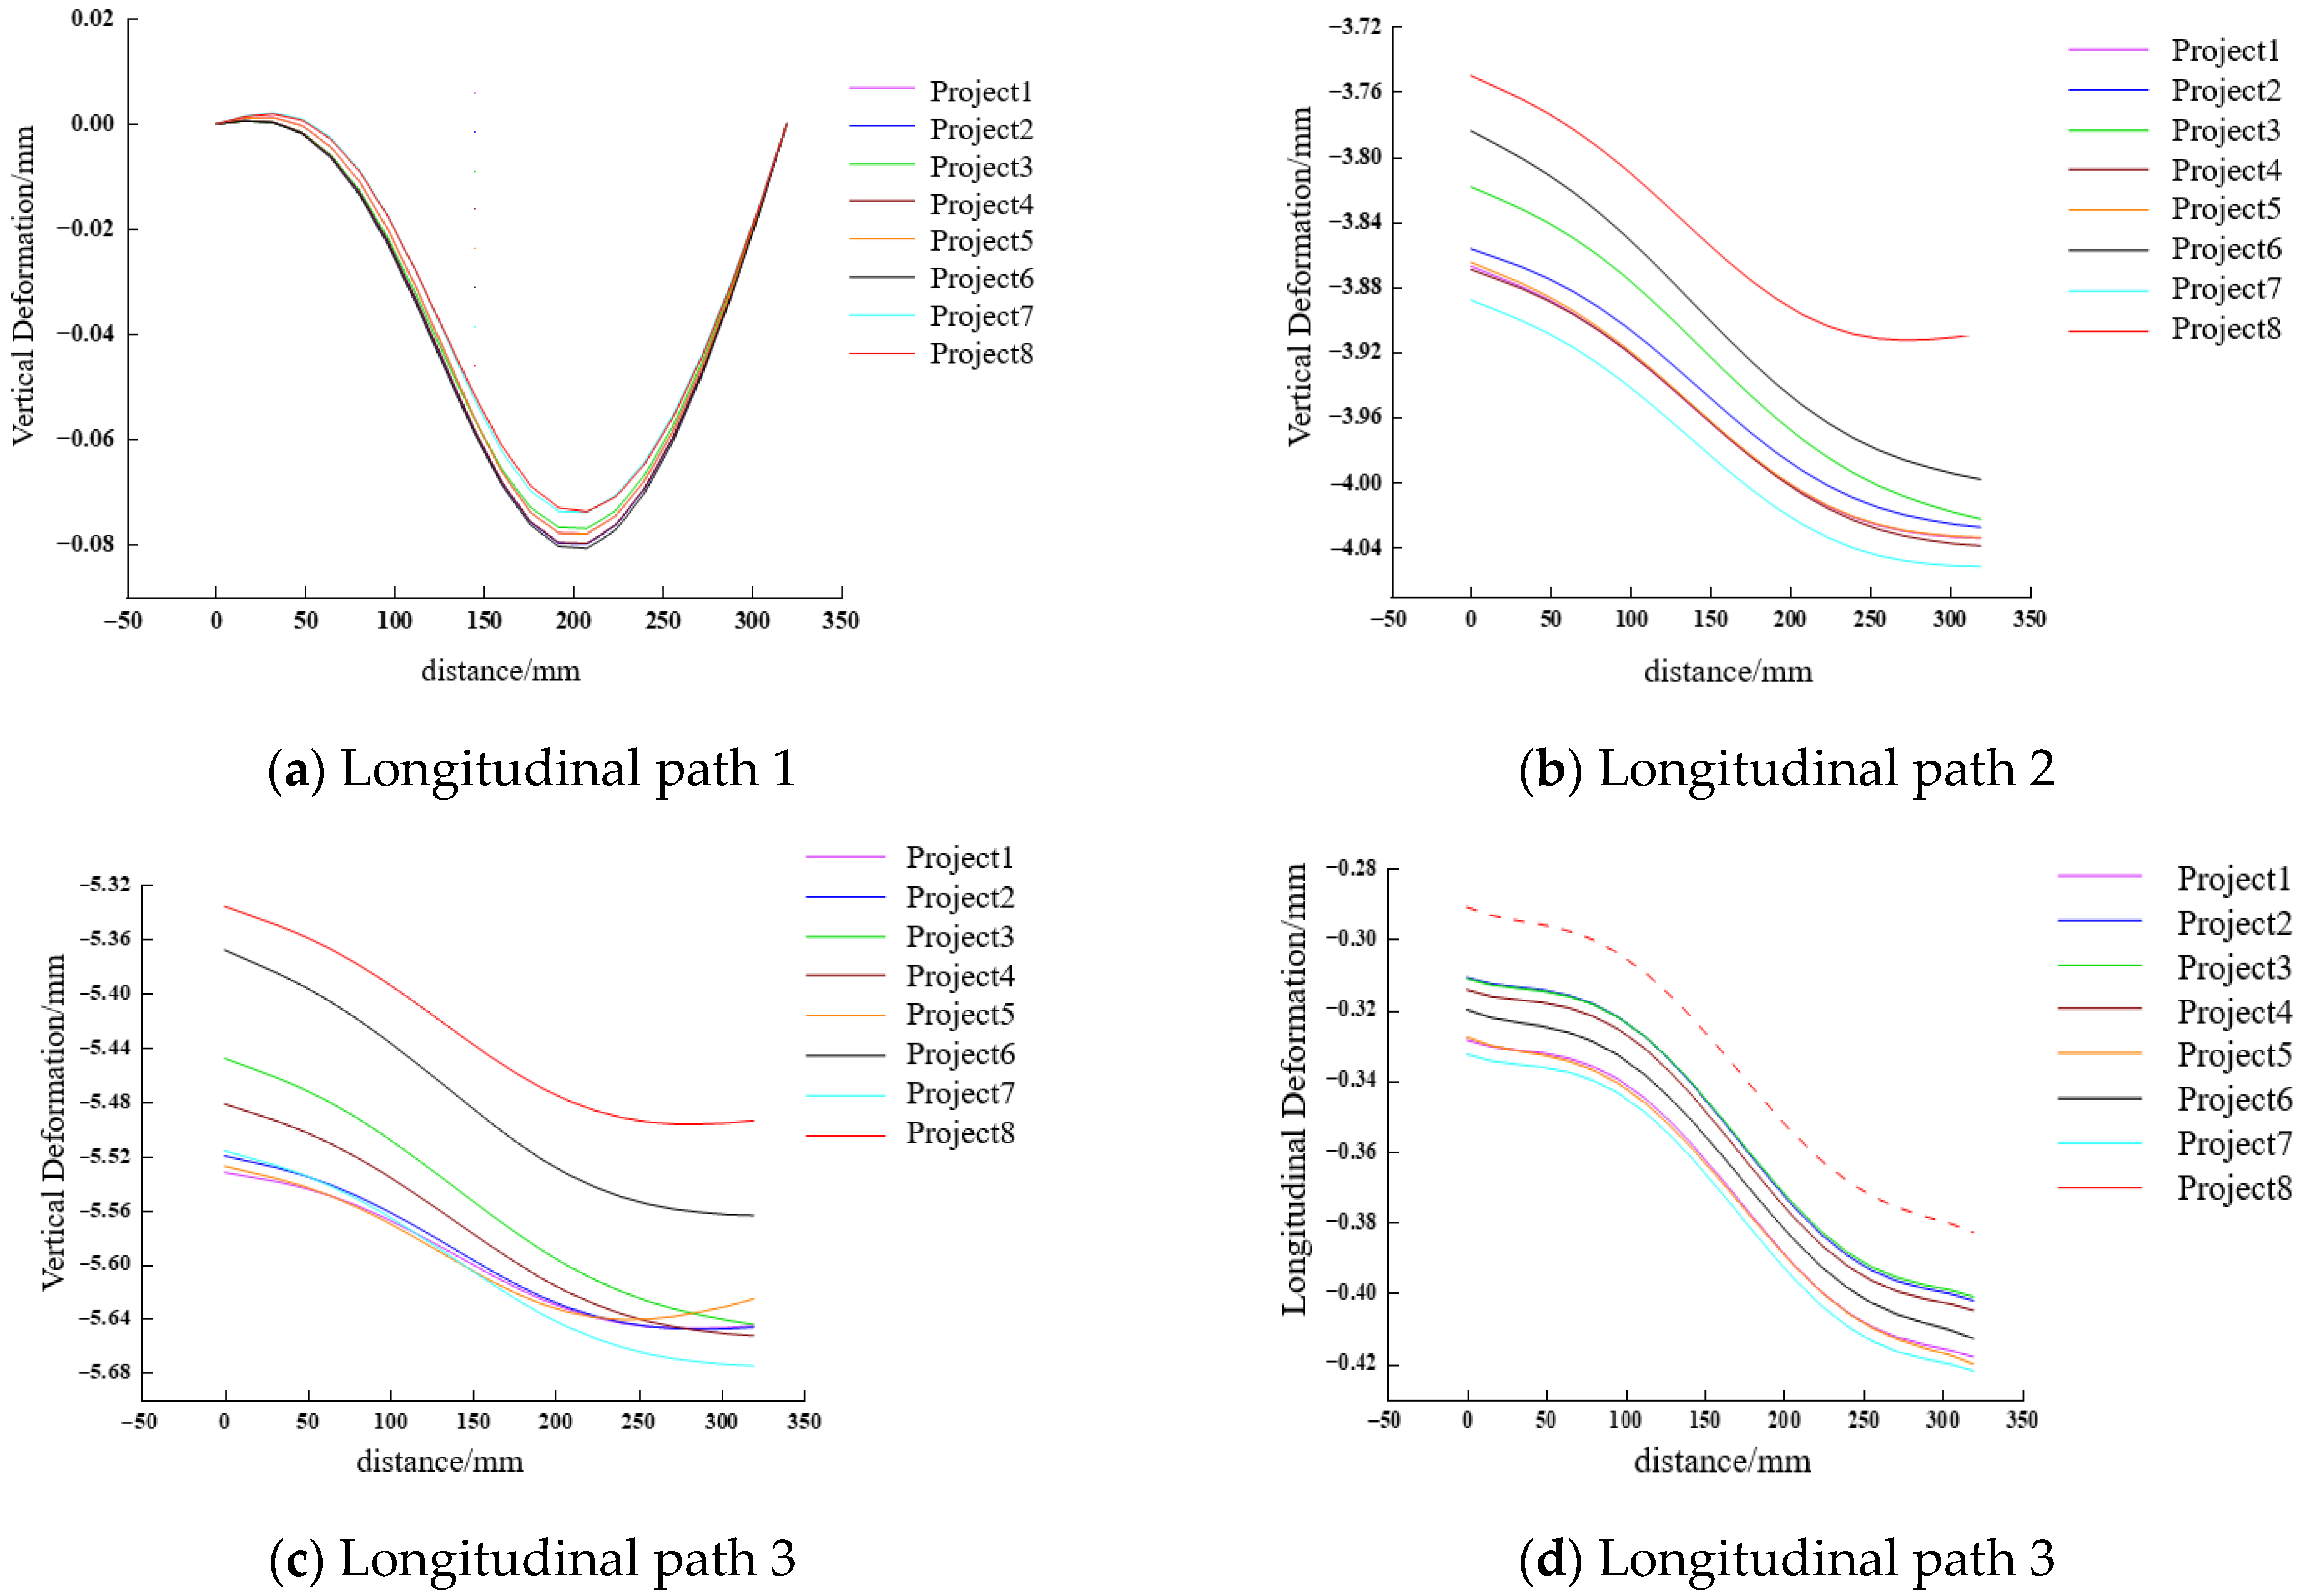
Extract the vertical deformations of longitudinal paths 1, 2, and 3, select representative longitudinal path 3, and extract its transverse and longitudinal deformations in different welding schemes. The results are presented in Figure 32.

6. Conclusions

Based on steel plate welding experiments, this paper adopts numerical simulation to investigate the influence of double-ellipsoid heat source parameters and welding thermal efficiency on weld pool morphology, and determines the welding parameters suitable for the T-rib and steel plate joints used in this model. Aiming at the component geometry, Q345 steel, submerged arc welding process parameters, and corresponding boundary conditions adopted in this study, the effects of welding sequence on welding residual stress and deformation of single and multiple T-ribs are systematically analyzed, and the conclusions are drawn as follows:
(1)
Double-ellipsoid heat source parameters: When each key parameter is increased by 10%, thermal efficiency m shows the strongest effect, increasing weld width by 8.3%, penetration by 9.1%, and weld length by 11.2%. The front semi-axis α f negatively affects all pool dimensions, while the rear semi-axis α r positively affects them, providing a quantitative basis for accurate calibration of heat source parameters.
(2)
Single T-rib welding: Simultaneous same-direction welding (Plan 2) achieves the optimal effect. Compared with sequential same-direction welding, it reduces longitudinal residual stress by 18.5% and angular deformation by 23.3%. Compared with reverse welding, it reduces longitudinal residual stress by 32.7% and angular deformation by 56.8%, with almost no torsional deformation.
(3)
Establish a numerical analysis model for the welding of 9 multi-T-rib steel plates with T-rib spacing of 150 mm~550 mm. By analyzing the welding deformation field and stress field under two sequences of simultaneous welding and sequential welding, it was found that the critical influence spacing of the deformation field was 500 mm and the critical spacing value of the stress field was 450 mm. After exceeding the critical influence spacing, the influence was significantly reduced.
(4)
Results indicate that at a T-rib spacing of 300 mm, synchronous welding reduces deformation by 28.7% relative to sequential welding. The second optimal scheme is inside-out symmetrical double-sided synchronous welding. For single-pass continuous welding, inside-out skip welding decreases both residual stress and deformation by over 20%.
(5)
Same-direction simultaneous welding achieves the best deformation and stress control and is suitable for efficient factory mass production. Sequential same-direction welding features low equipment cost and easy operation. Inside-out skip welding effectively reduces residual stress with slightly longer working hours, suitable for high-precision components. All strategies are consistent with practical steel box girder welding and feasible in engineering.
(6)
This study has limitations: Only single-pass submerged arc welding is considered, without multi-pass welding, defects, or assembly gaps. Simulation results lack direct validation using field measurements. Further research will address these issues.

Author Contributions

Conceptualization, S.S. and L.F.; methodology, S.S., L.F. and H.Q.; software, F.G., W.W. and N.Z.; validation, H.Q., W.W. and N.Z.; formal analysis, S.S. and L.F.; investigation, F.G. and N.Z.; data curation, F.G. and H.Q.; writing—original draft preparation, F.G., W.W. and N.Z.; writing—review and editing, S.S., H.Q. and L.F.; visualization, H.Q. and W.W.; supervision, L.F.; project administration, S.S. and H.Q.; funding acquisition, S.S. and W.W. All authors have read and agreed to the published version of the manuscript.

Funding

This study was funded by the Chongqing Technical Innovation and Application Development Special Key Project (No.: CSTB2022TIAD-KPX0103); the Chongqing Construction Science and Technology Plan Project (Grant No. Cheng Ke Zi [2024] 3-5); and the JN Beihuan Interchange Section Renovation Project 6 (2025) No. 2.

Data Availability Statement

The original contributions presented in this study are included in the article. Further inquiries can be directed to the corresponding author.

Conflicts of Interest

Authors Shuyi Song and Huiwen Qu were employed by the company Chongqing Expressway Juneng Construction Group Co., Ltd. Author Wenfei Wang was employed by the company CCCC Highway Consultants Co., Ltd. The remaining authors declare that the research was conducted in the absence of any commercial or financial relationships that could be construed as a potential conflict of interest.

References

  1. Editorial Department of China Journal of Highway. Summary of academic research on bridge engineering in China 2021. Chin. J. Highw. 2021, 34, 1–97. [Google Scholar]
  2. Meng, F.C.; Liu, M.H.; Wu, W.S.; Zhang, G.J.; Zhang, L. Design concept and bridge innovation technology of Hong Kong-Zhuhai-Macao Bridge. Chin. Eng. Sci. 2015, 17, 27–35+41. [Google Scholar]
  3. Feng, P.C.; Fu, K.; Chen, Y.M. Key technology of main bridge design of Zhuankou Yangtze River Highway Bridge. Bridge Constr. 2017, 47, 7–12. [Google Scholar]
  4. Yang, H.M.Z. Discussion on site installation and construction technology of all welded steel structure in road and bridge construction of South Expressway. Highw. Eng. 2018, 43, 152–155+161. [Google Scholar]
  5. Liu, G.N.; Li, N.N.; Song, X.H.; Ma, L.W.; Zhou, M.Y.; Yao, P.; Xing, J.W. Effect of welding sequence on welding temperature field, strain field and stress field of T-joint. Hot Work. Process. 2019, 48, 142–147. [Google Scholar]
  6. Tajik, N.; Marmarchinia, S.; Mahmoudian, A.; Asghari, A.; Mirghaderi, S.R. The effect of multi-pass welding on residual stresses in fillet welded built-up steel box sections. Asian J. Civ. Eng. 2025, 26, 955–974. [Google Scholar] [CrossRef]
  7. Ghafouri, M.; Ahola, A.; Ahn, J.; Björk, T. Numerical and experimental investigations on the welding residual stresses and distortions of the short fillet welds in high strength steel plates. Eng. Struct. 2022, 260, 114269. [Google Scholar] [CrossRef]
  8. Yan, L.; Guan, Y.; Luo, K.; Wang, Q. Corrugated steel web I-girder welding deformation and residual stress research. Structures 2023, 58, 105602. [Google Scholar] [CrossRef]
  9. Samadi, F.; Mourya, J.; Wheatley, G.; Khan, M.N.; Nejad, R.M.; Branco, R.; Macek, W. An investigation on residual stress and fatigue life assessment of T-shape welded joints. Eng. Fail. Anal. 2022, 141, 106685. [Google Scholar] [CrossRef]
  10. Khoshroyan, A.; Darvazi, A.R. Effects of welding parameters and welding sequence on residual stress and distortion in Al6061-T6 aluminum alloy for T-shaped welded joint. Trans. Nonferr. Met. Soc. China 2020, 30, 76–89. [Google Scholar] [CrossRef]
  11. Ji, W.; Zhao, Y.; Liu, Y. Welded residual stresses in corrugated steel webs: Theoretical and experimental analyses. J. Constr. Steel Res. 2024, 221, 108874. [Google Scholar] [CrossRef]
  12. Uaje, M.J.B.; Murakoshi, J. Investigation of Effective Notch Stress at the Root of the Rib-to-Deck Weld in an OSD Box Girder Bridge Considering the Wheel Load Position. Int. J. Steel Struct. 2024, 24, 1368–1379. [Google Scholar] [CrossRef]
  13. Piao, L.; Gao, X.; Ma, N.; Wang, C.; Zeng, X.; Shi, C.; Chen, H. Mechanical Characteristics of Orthotropic Steel Bridge Decks with U-Rib Internal Welding. KSCE J. Civ. Eng. 2024, 28, 5750–5764. [Google Scholar] [CrossRef]
  14. Jiang, F.; Fu, Z.; Ji, B.; Wan, L. Fatigue life evaluation of deck to U-rib welds in orthotropic steel deck integrating weldment size effects on welding residual stress. Eng. Fail. Anal. 2021, 124, 105359. [Google Scholar] [CrossRef]
  15. Zhang, Q.H.; Ma, Y.; Cui, C.; Chai, X.Y.; Han, S.H. Experimental investigation and numerical simulation on welding residual stress of innovative double-side welded rib-to-deck joints of orthotropic steel decks. J. Constr. Steel Res. 2021, 179, 106544. [Google Scholar] [CrossRef]
  16. Liang, S.; Jie, Z.; Wang, K. Numerical simulation and ultrasonic measurement on welding residual stresses of full penetration U-shaped stiffening ribs. Structures 2022, 46, 322–335. [Google Scholar] [CrossRef]
  17. Lan, L.; Shao, G.; Zhang, Y.; Wang, Y. Influence of Welding Sequence on Residual Stress and Deformation of T-Joint of Q690 Steel. J. Northeast. Univ. Nat. Sci. 2020, 41, 1741–1746. [Google Scholar] [CrossRef]
  18. Xu, Z.B.; Zhou, W.J.; Qian, J. Effect of boundary constraints on welding residual stress of medium and thick plates. Sci. Technol. Eng. 2020, 20, 14039–14045. [Google Scholar]
  19. Ma, B.; Deng, Y.; Liu, T.L. Simulation analysis of explosive reduction of welding residual stress of steel deck roof longitudinal rib. Sci. Technol. Eng. 2022, 22, 3011–3019. [Google Scholar]
  20. Goldak, J.; Chakravarti, A.; Bibby, M. A new finite element model for welding heat sources. Metall. Trans. A 1984, 15, 299–305. [Google Scholar] [CrossRef]
  21. Dong, Z.B.; Wei, Y.H.; Liu, R.P. Three dimensional numerical simulation of stainless steel welding temperature field. J. Weld. 2004, 25, 9–14. [Google Scholar]
  22. Deng, D.; Murakawa, H. Numerical Simulation of Temperature Field and Residual Stress in Multi-Pass Welds in Stainless Steel Pipe and Comparison with Experimental Measurements. Comput. Mater. Sci. 2003, 37, 269–277. [Google Scholar] [CrossRef]
Figure 1. Geometric and finite element model of single T-rib/mm.
Buildings 16 01598 g001
Figure 2. Double-ellipsoid heat source model.
Buildings 16 01598 g002
Figure 3. Butt welding simulation finite element model.
Buildings 16 01598 g003
Figure 4. Comparison of molten pool and temperature field between numerical simulation and test. (a) Comparison of numerical simulation and experimental results of molten pool. (b) Surface temperature distribution perpendicular to the weld seam direction.
Buildings 16 01598 g004
Figure 5. Relationship between the change in heat source shape parameters and the size of molten pool.
Buildings 16 01598 g005
Figure 6. Welding sequence plan of single T-rib.
Buildings 16 01598 g006
Figure 7. Deformation diagram in different directions of scheme/mm.
Buildings 16 01598 g007
Figure 8. Distribution curve of welding residual stress in longitudinal path.
Buildings 16 01598 g008
Figure 9. The influence of welding multiple T-ribs on geometric and finite element models.
Buildings 16 01598 g009
Figure 10. Scheme 1: welding in sequence.
Buildings 16 01598 g010
Figure 11. Scheme 2: simultaneous welding.
Buildings 16 01598 g011
Figure 12. Extracting paths in the longitudinal and transverse directions of the deformation field.
Buildings 16 01598 g012
Figure 13. Vertical deformation of longitudinal and transverse paths.
Buildings 16 01598 g013
Figure 14. Transverse deformation of longitudinal and transverse paths.
Buildings 16 01598 g014
Figure 15. Longitudinal deformation of longitudinal and transverse paths.
Buildings 16 01598 g015
Figure 16. Vertical deformation under two extreme welding sequences with different spacing. (a) Vertical deformation diagram after 200 mm sequential welding. (b) Vertical deformation diagram of 200 mm simultaneous welding in the same direction after welding. (c) Vertical deformation diagram after 500 mm sequential welding. (d) Vertical deformation diagram of 500 mm simultaneous welding in the same direction after welding.
Buildings 16 01598 g016
Figure 17. Maximum vertical deformation difference after welding with different spacing and welding sequence.
Buildings 16 01598 g017
Figure 18. Stress field longitudinal and transverse extraction paths.
Buildings 16 01598 g018
Figure 19. Longitudinal stress of transverse path.
Buildings 16 01598 g019
Figure 20. Transverse stress of transverse path.
Buildings 16 01598 g020
Figure 21. The maximum absolute residual stress difference in the longitudinal and transverse directions at different distances along the transverse path.
Buildings 16 01598 g021
Figure 22. Longitudinal stress of longitudinal path.
Buildings 16 01598 g022
Figure 23. Transverse stress of longitudinal path.
Buildings 16 01598 g023
Figure 24. The maximum absolute residual stress difference in the longitudinal and transverse directions at different distances along the longitudinal path.
Buildings 16 01598 g024
Figure 25. Longitudinal residual stress under two extreme welding sequences with different spacing.
Buildings 16 01598 g025
Figure 26. Maximum difference in longitudinal residual stress after welding with different spacing and welding sequence.
Buildings 16 01598 g026
Figure 27. Comparison project of multi-rib welding sequence.
Buildings 16 01598 g027
Figure 28. Cloud diagram of typical multi-rib welding deformation/mm.
Buildings 16 01598 g028
Figure 29. Extraction path of deformation field results.
Buildings 16 01598 g029
Figure 30. Vertical deformation of transverse paths 1 and 2 in different welding sequences.
Buildings 16 01598 g030
Figure 31. Transverse and longitudinal deformation of horizontal path 1 in different welding sequences.
Buildings 16 01598 g031
Figure 32. Deformation of longitudinal paths 1–3 in different welding sequences.
Buildings 16 01598 g032
Table 1. Comparison between simulated value and measured value/mm.
Numerical SimulationResultsError Value
Weld width b12.5133.8%
Depth of fusion c10100
Melt length α r + α f 16.5163.1%
Table 2. Values of heat source shape parameters and thermal efficiency parameters/mm.
Front Half Axis Length α f Rear Half Axis Length α r Half Heat Source Width
b
Heat Depth
c
Thermal Efficiency
η
154.560.55
375.570.65
487.590.75
598.5100.85
15201520
Table 3. Welding process parameters of T-rib and top plate/mm.
Heat Source Length
α f   +   α r
Width of Heat Source b Heat Depth c Thermal Efficiency η Specific Energy f f / f r
131260.91.33
Table 4. Thermal and mechanical property parameters of Q345 material.
Temperature / ° C Thermal Conductivity W · m 1 · ° C 1 Specific Heat Capacity J · kg 1 · ° C 1 Linear Expansion Coefficient / 10 6   ° C 1 Yield Strength / MPa Elastic Modulus
/ GPa
204846111.9343210
2004753313.0276199
4004161114.2168184
6003677814.80.6163
15003578115.00.372
Table 5. Maximum deformation value in each direction and the ratio of Plan 1, Plan 3 and Plan 2.
Serial NumberMaximum Deformation/mm (Ratio)
X DirectionY DirectionZ Direction
Plan 11.47
(284.0%)
−2.19
(126.0%)
−0.77
(83.9%)
Plan 2−0.51−1.73−0.92
Plan 32.51
(484.4%)
−2.88
(165.7%)
−0.79
(85.9%)
Table 6. Ratio of maximum stress value of Plan 1 and Plan 3 to Plan 2.
Serial NumberStress Ratio/Mpa
Maximum Longitudinal Residual Tensile StressMaximum Transverse Residual Tensile Stress
Plan 1138.27%125.19%
Plan 2//
Plan 3138.22%120.22%
Table 7. Absolute differences in maximum deformation in all directions under various welding sequences.
Serial NumberMaximum Deformation/mm
TransverseVerticalLongitudinal
Project 14.286.911.60
Project 24.236.911.55
Project 34.216.901.53
Project 44.206.921.54
Project 54.196.911.56
Project 64.166.841.53
Project 74.246.941.60
Project 84.046.781.45
Minimum value4.046.781.45
Disclaimer/Publisher’s Note: The statements, opinions and data contained in all publications are solely those of the individual author(s) and contributor(s) and not of MDPI and/or the editor(s). MDPI and/or the editor(s) disclaim responsibility for any injury to people or property resulting from any ideas, methods, instructions or products referred to in the content.