The Influence of Spatial Characteristics on Crowd Behaviors: A Behavioral Proxy Approach for Street Quality Assessment



Abstract
1. Introduction
2. Literature Review
2.1. Evaluation of Street Space Quality
2.2. Research on Behavioral Representation
- fragmentation between spatial analysis and behavioral research, as systematic frameworks explicitly linking spatial configuration and observable behavior remain insufficiently developed;
- over-simplification of behavioral classification, which fails to uncover the multifaceted nature of street vitality;
- a focus on spatially discrete environments rather than continuous streets;
- a methodological imbalance where big data lacks behavioral depth, while micro-scale observations are rarely integrated with quantitative spatial indicators;
- the absence of consensus on behavioral metrics for measuring street vitality.
2.3. Synthesis and Research Question
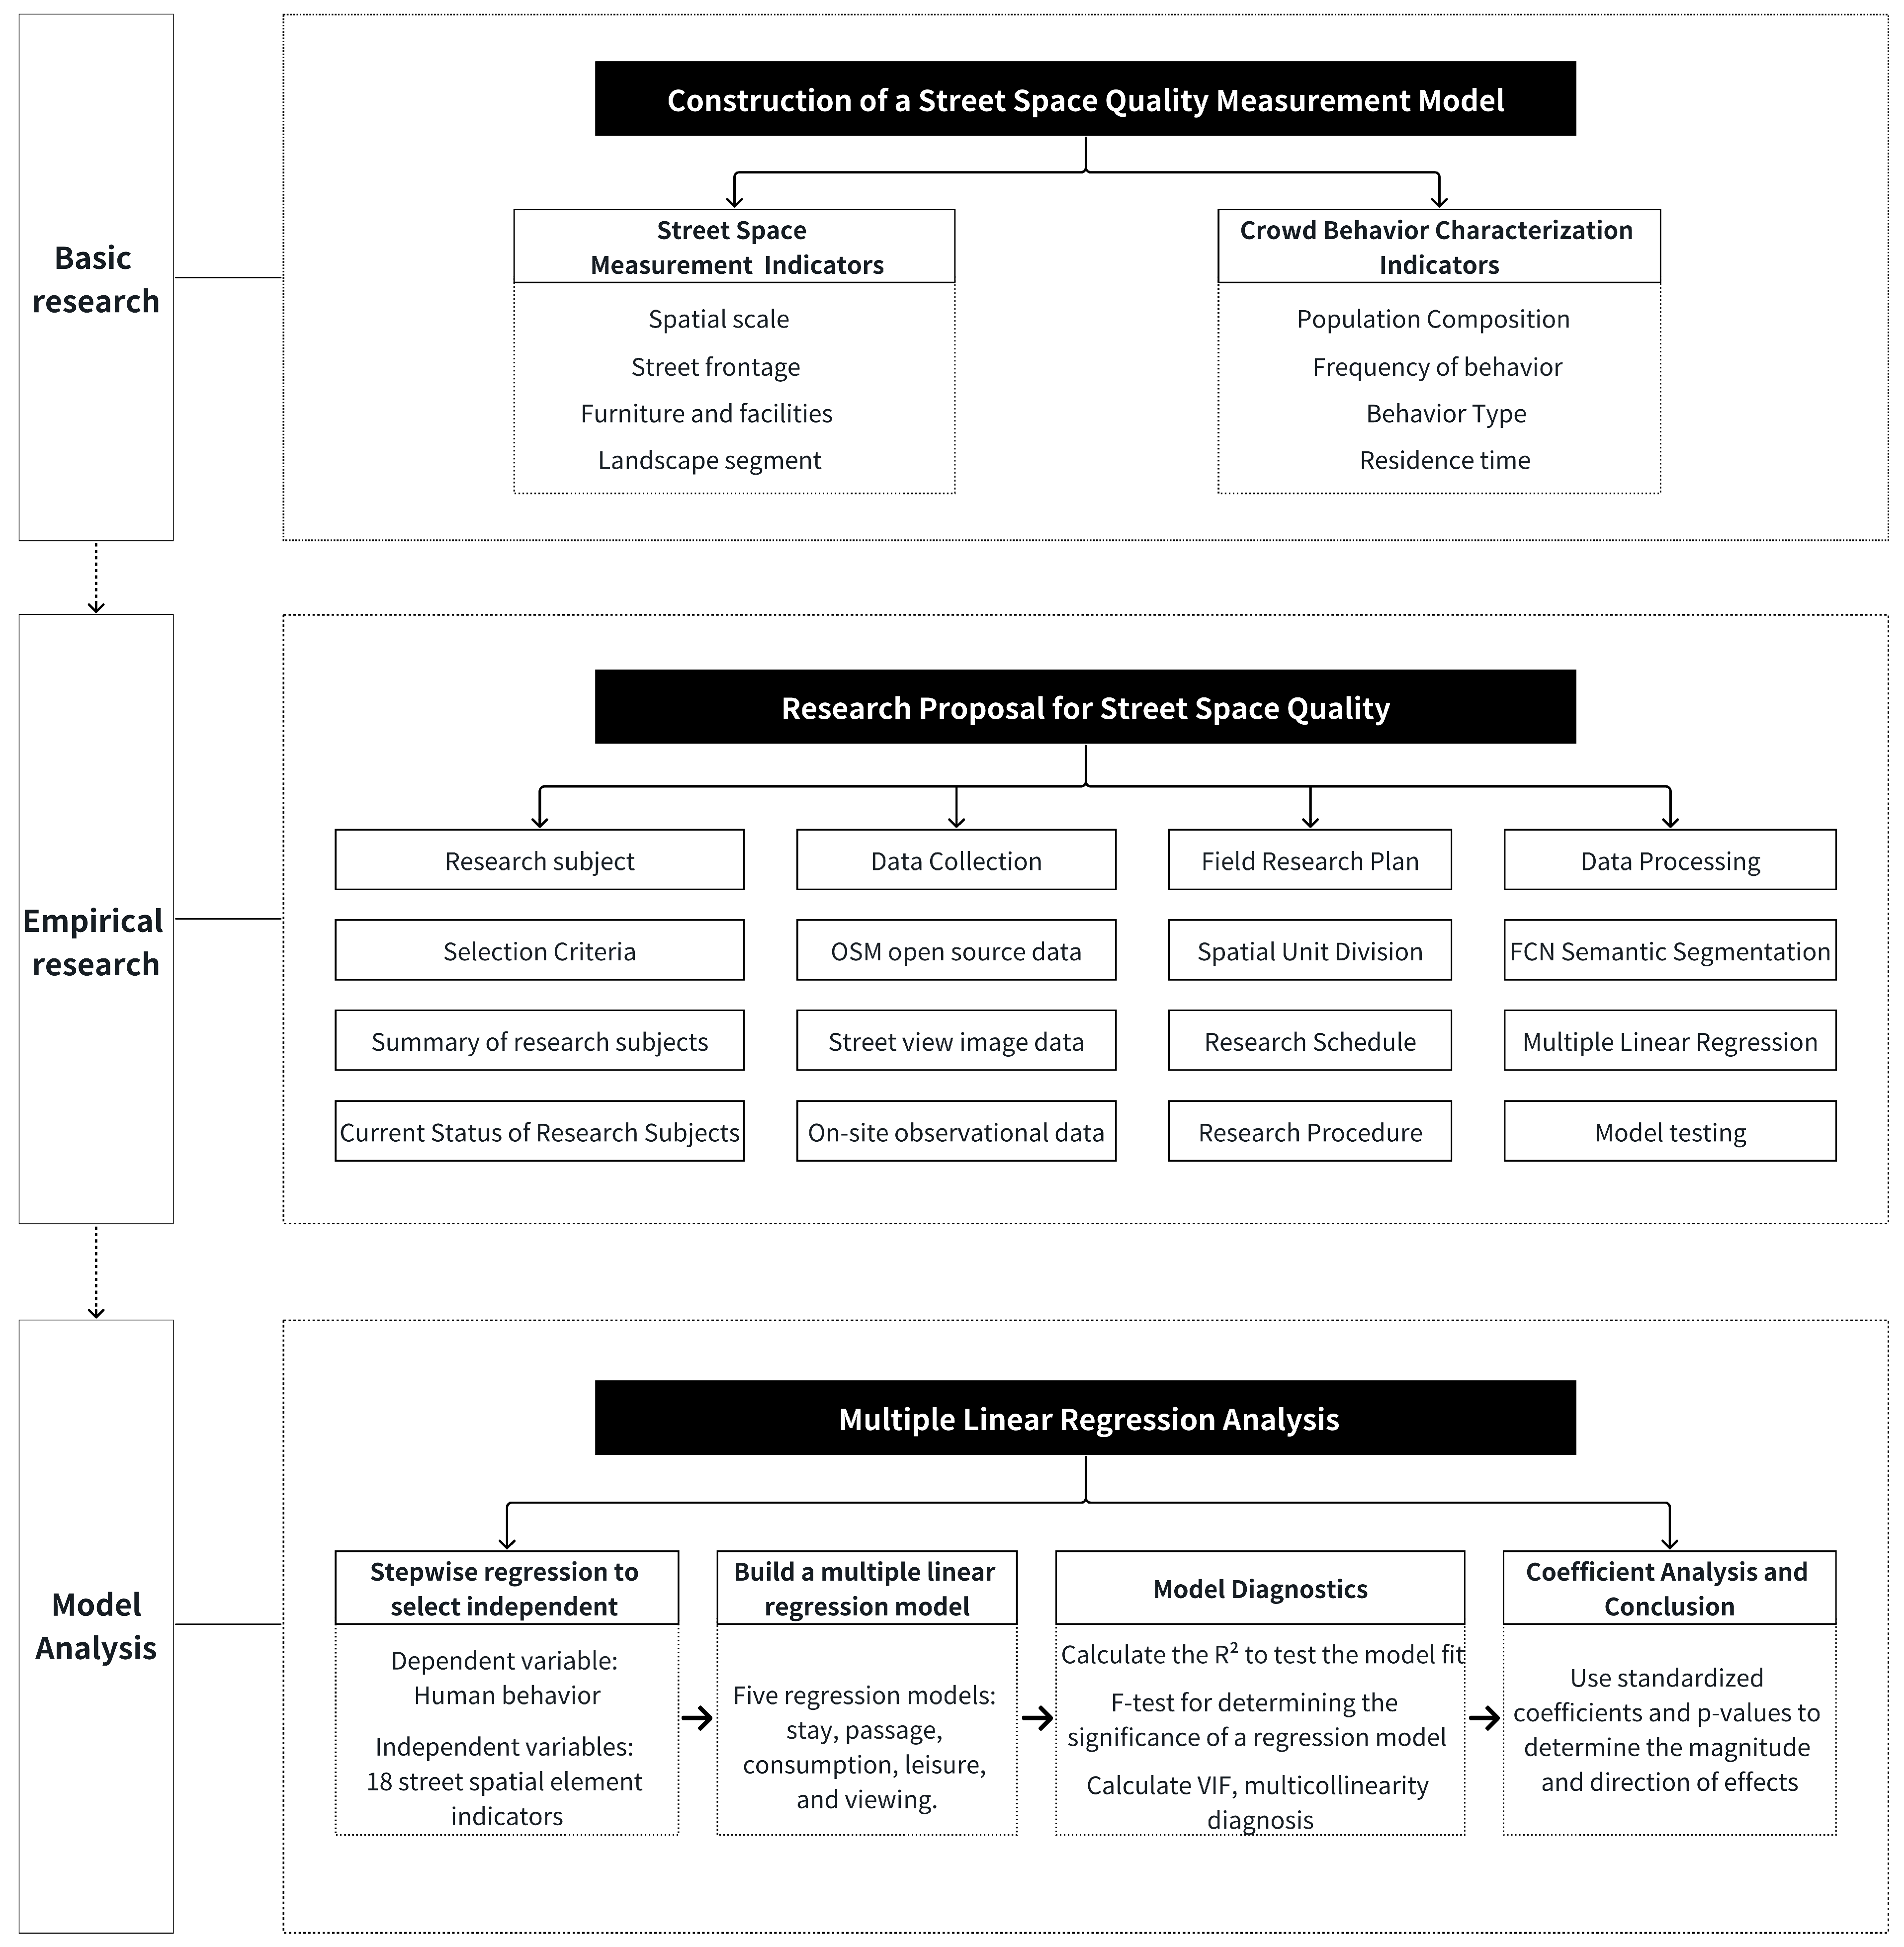
3. Materials and Methods
- Construction of the street space quality measurement model (Section 3.1).
- Research proposal for street space quality (Section 3.2).
- Multiple linear regression analysis (Section 3.3).
3.1. Construction of the Street Space Quality Measurement Model
3.2. Research Proposal for Street Space Quality
- Spatial scale.
- Street interface.
- Street furniture.
- Landscape environment.
3.3. Multiple Linear Regression Analysis
- Data preprocessing and normalization (Section 3.3.1).
- Variable selection (Section 3.3.2).
- Model construction (Section 3.3.3)
- Model validation (Section 3.3.4).
- Regression interpretation (Section 3.3.5).
3.3.1. Data Preprocessing and Normalization
3.3.2. Variable Selection
3.3.3. Model Construction
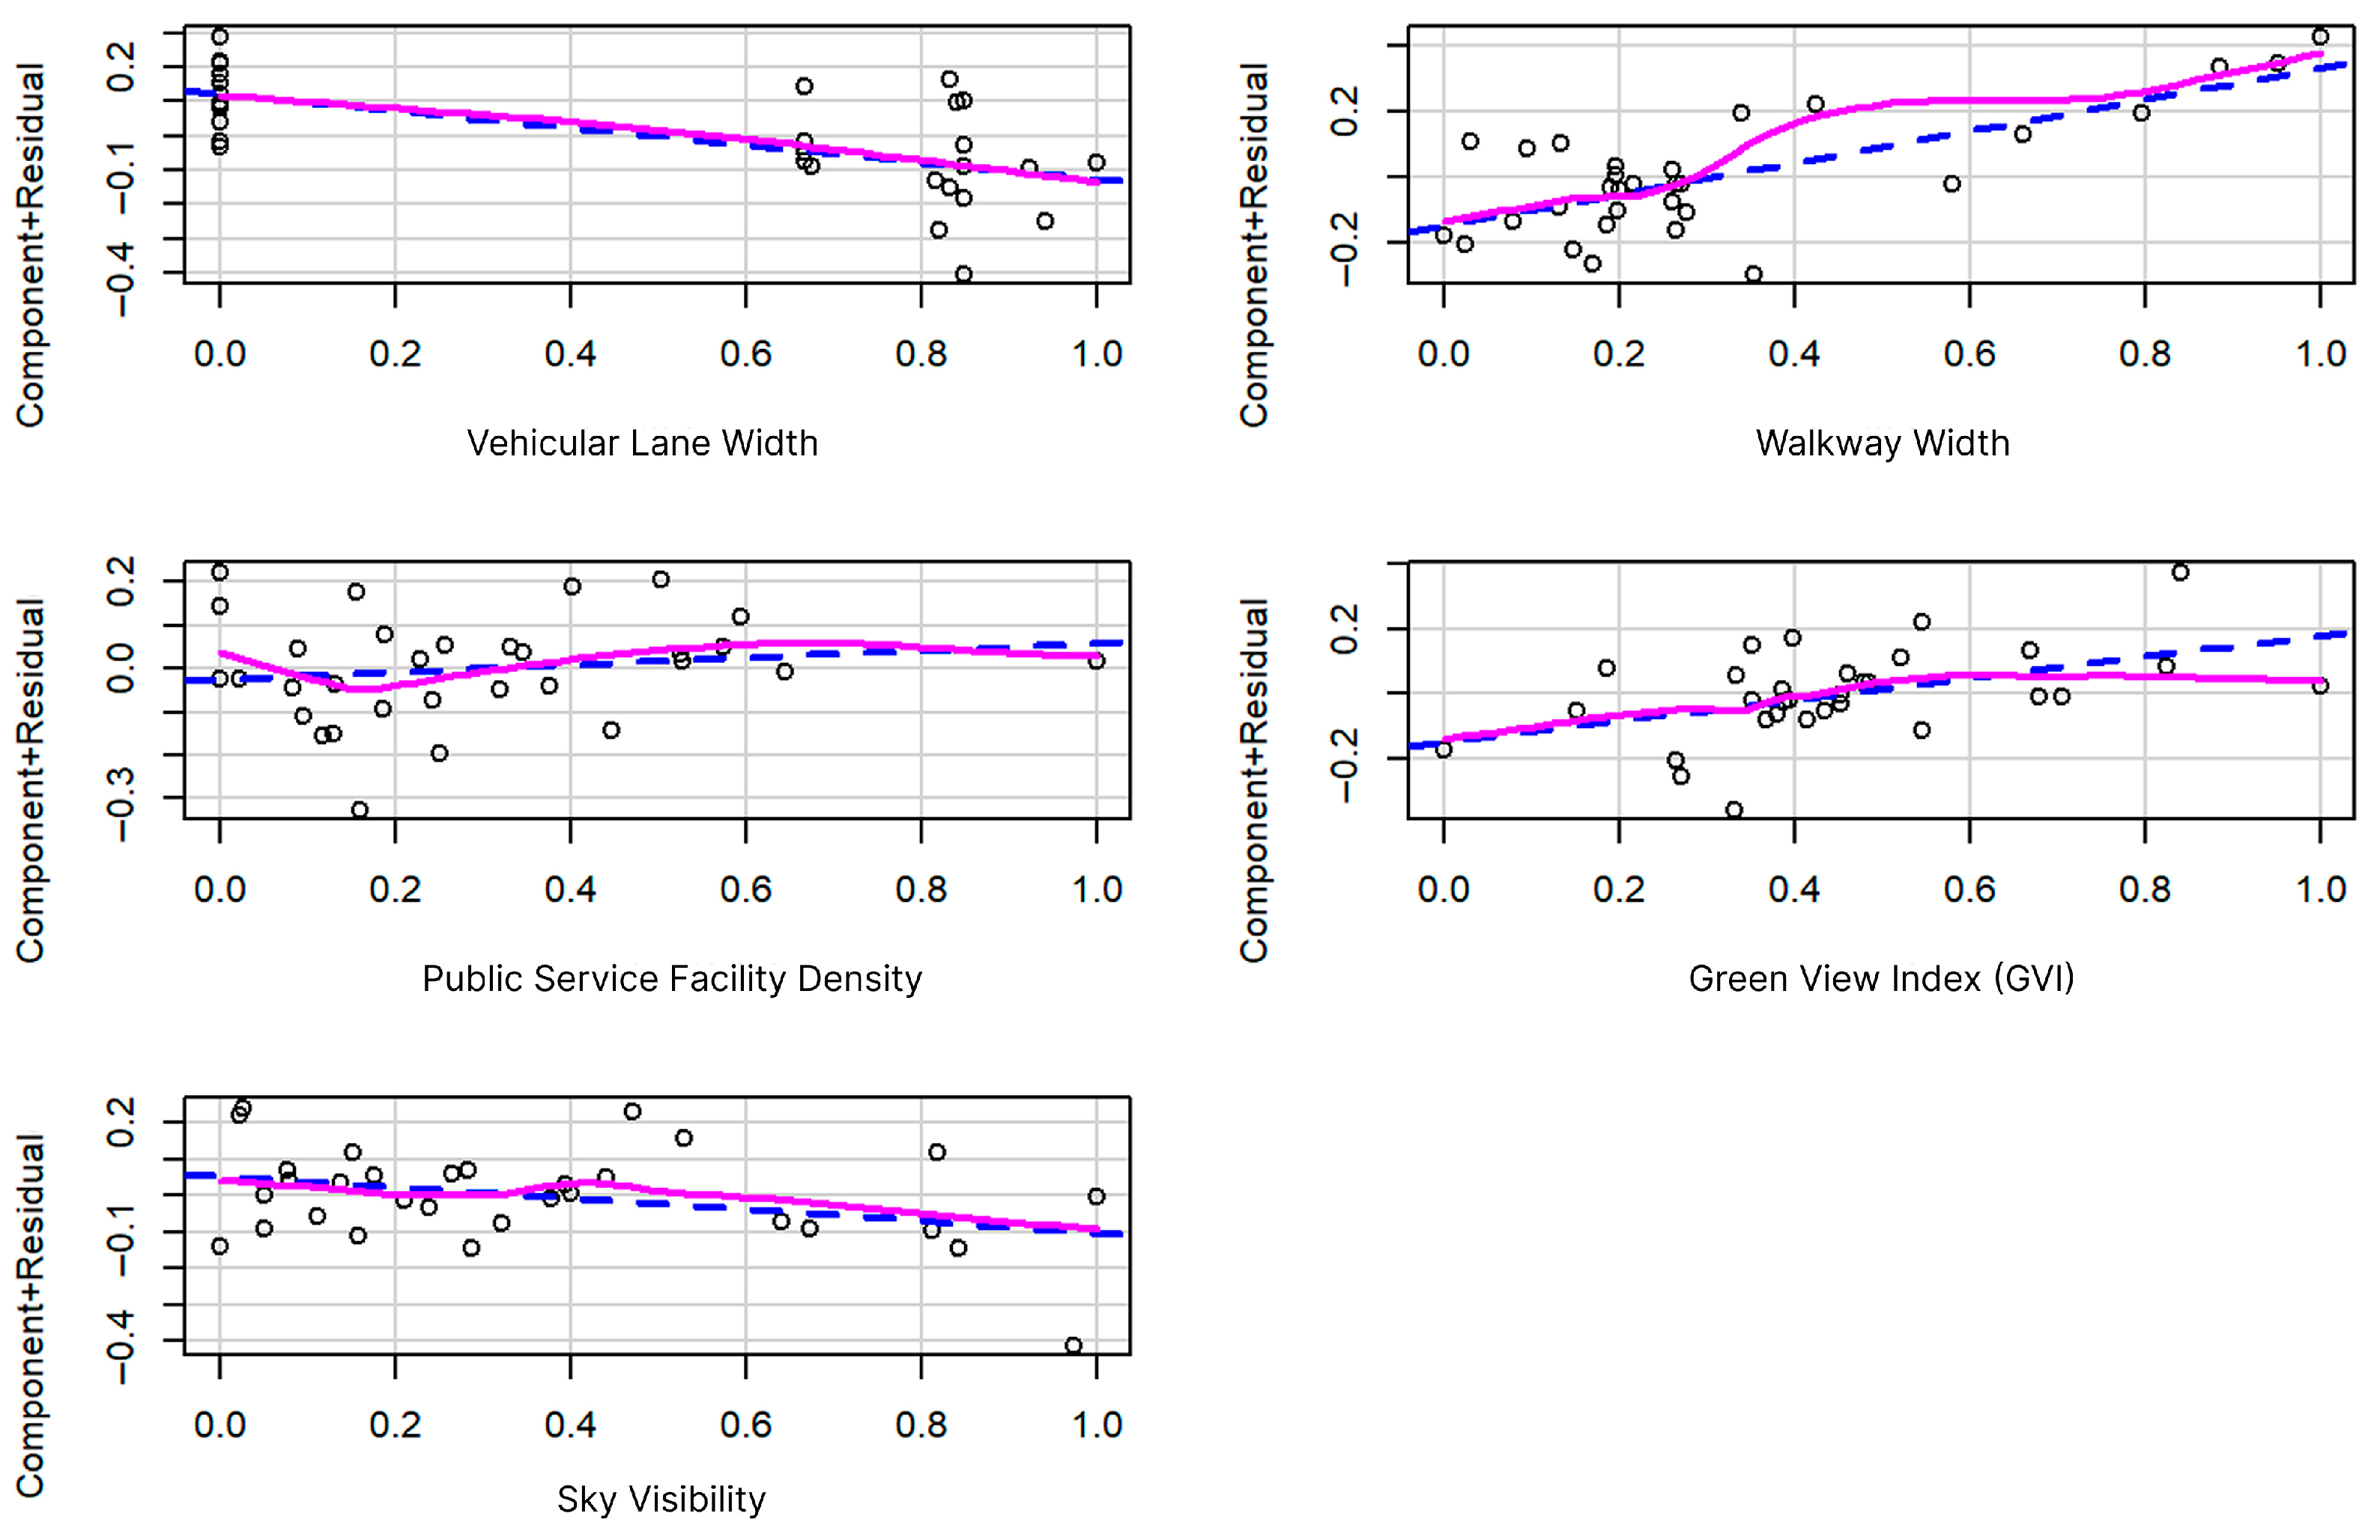
3.3.4. Model Validation
3.3.5. Regression Interpretation
4. Case Study Application
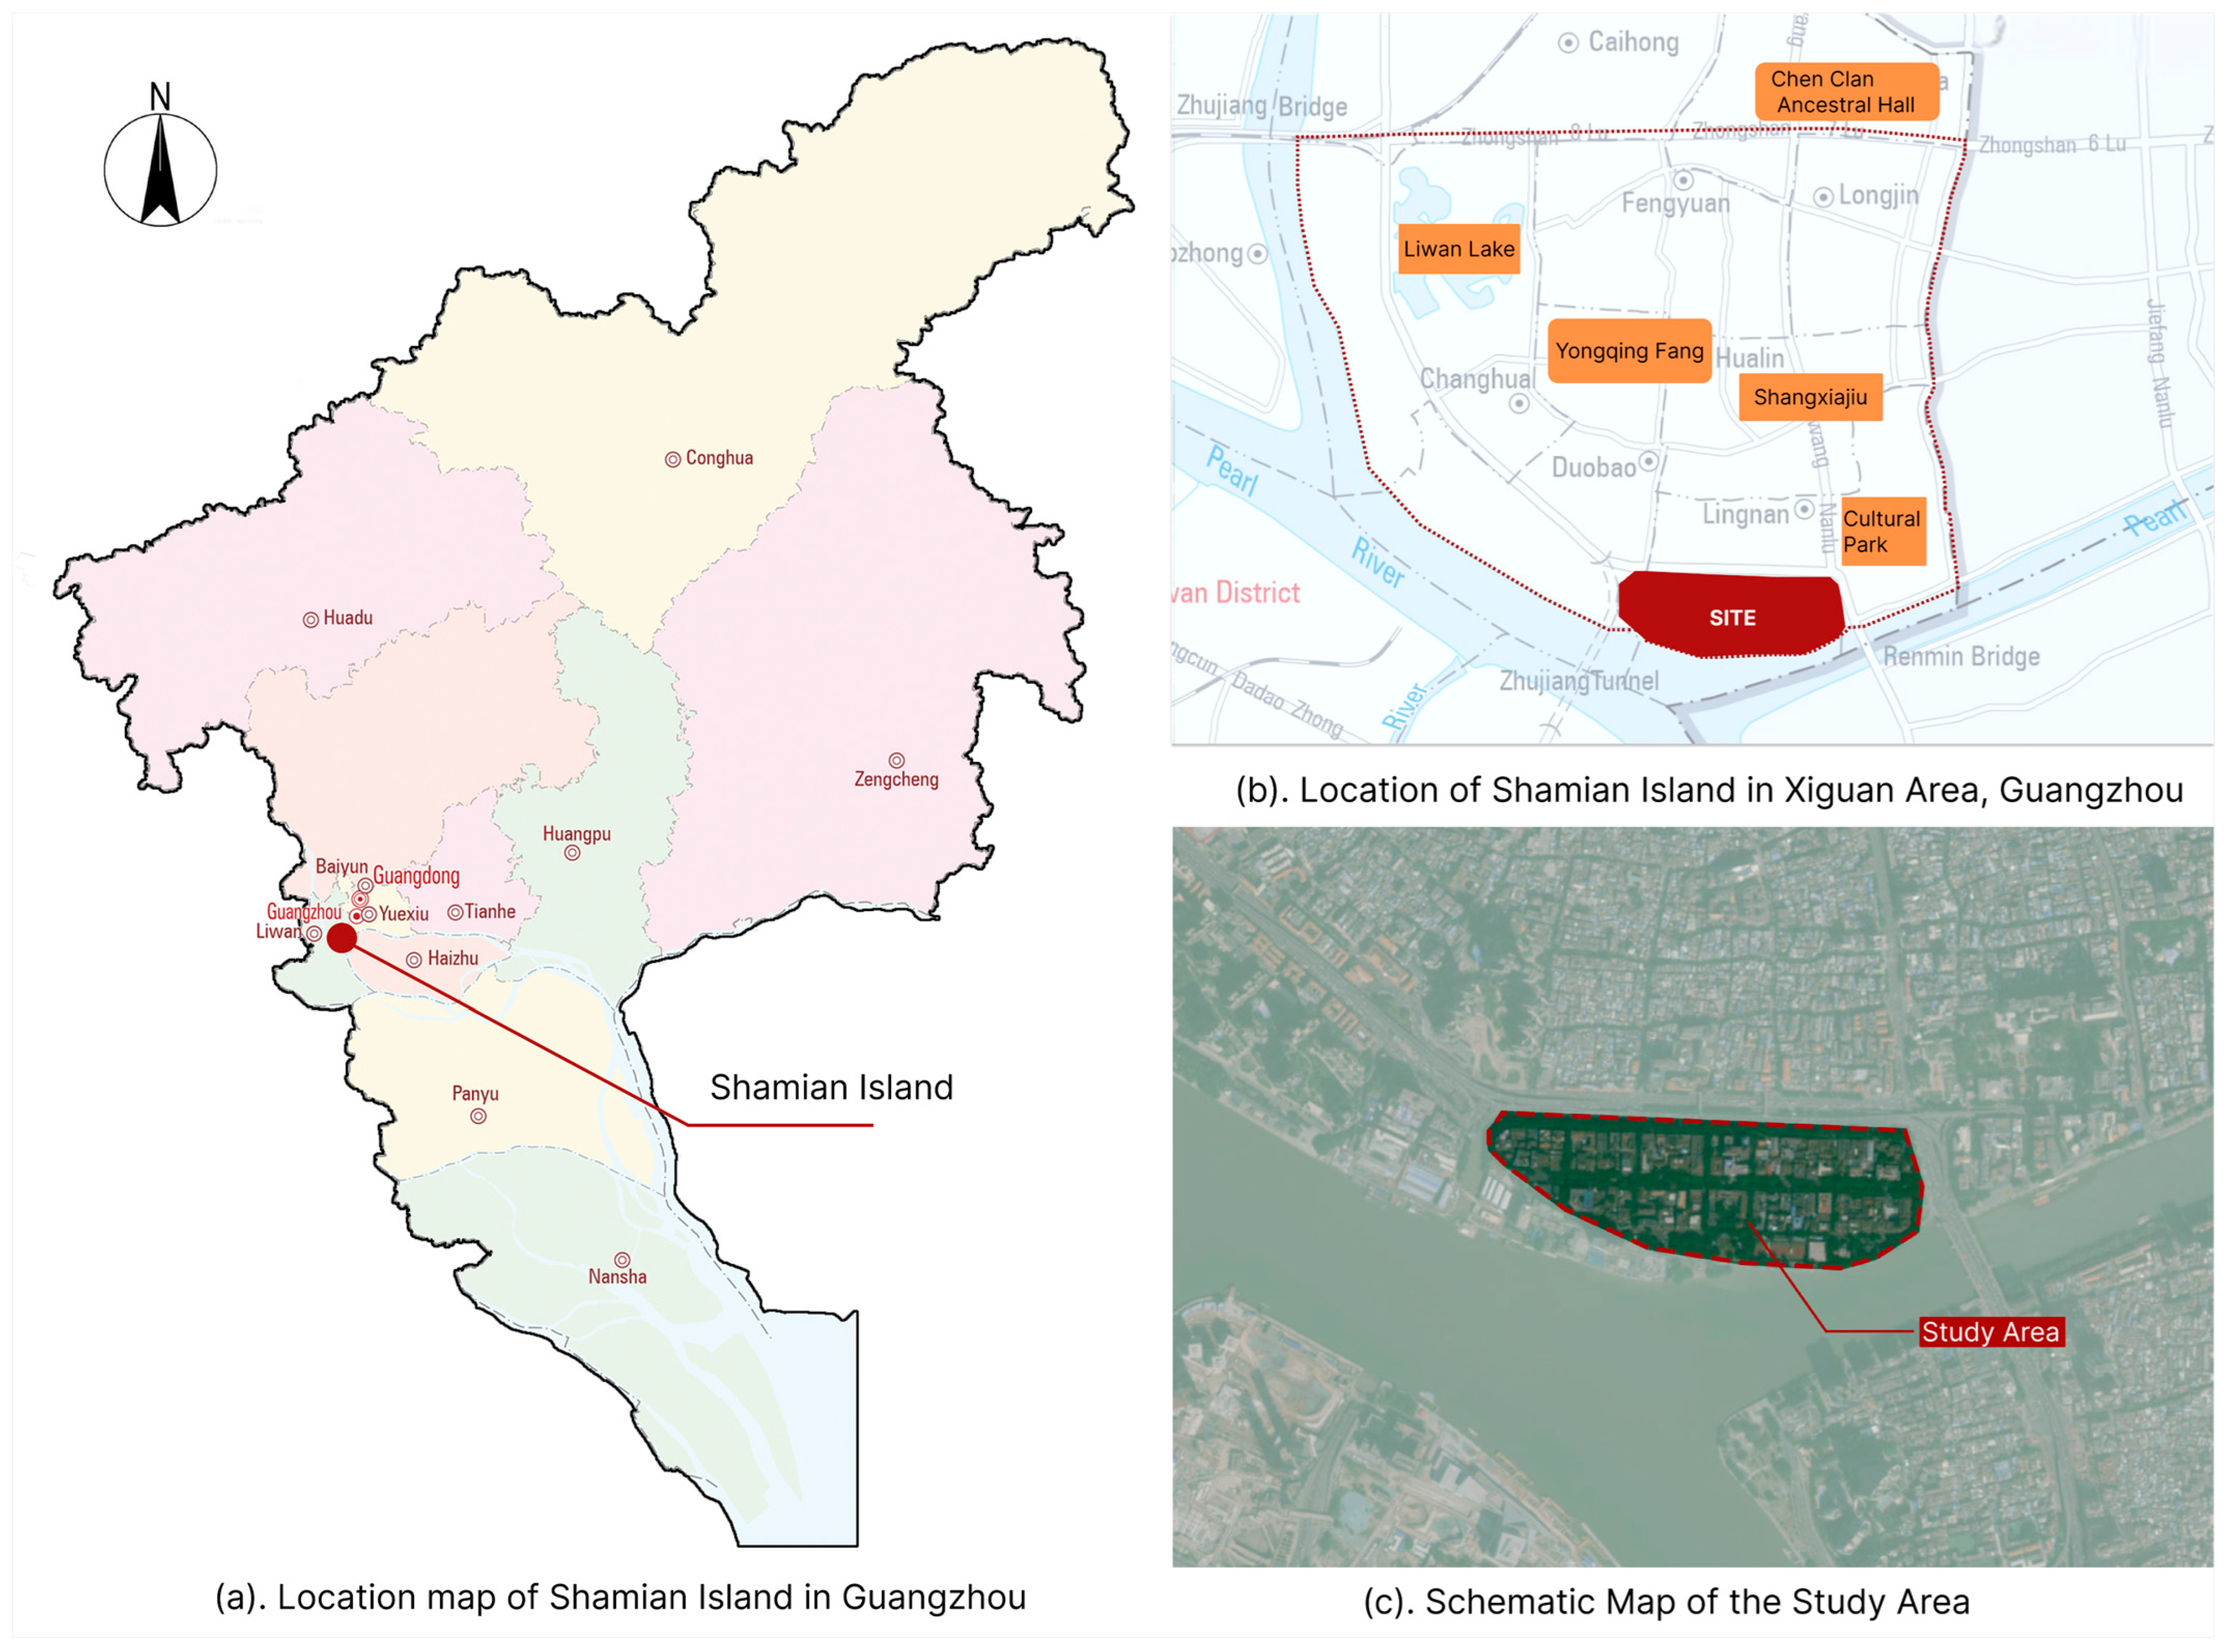
4.1. Study Area
4.2. Data Collection
4.2.1. Environmental Data
- Road Network Data: Extracted from OpenStreetMap (OSM) and processed via ArcGIS 10.8 (Esri, Redlands, CA, USA). Raw datasets underwent cleaning, simplification, and topological inspection to eliminate errors such as dangles, pseudo-nodes, and overlapping segments.
- Building Vector Data: Footprints and story counts were extracted from Baidu Maps, with discrepancies corrected through street-view imagery and on-site measurements.
- Street Morphology Data: Field surveys used tape measures and infrared rangefinders to measure street, sidewalk, and roadway widths, building heights, and frontage lengths.
- Street Functional Data: On-site surveys recorded functional types and quantified the distribution of street furniture, safety facilities, service amenities, and art landscape features to assess functional density and diversity.
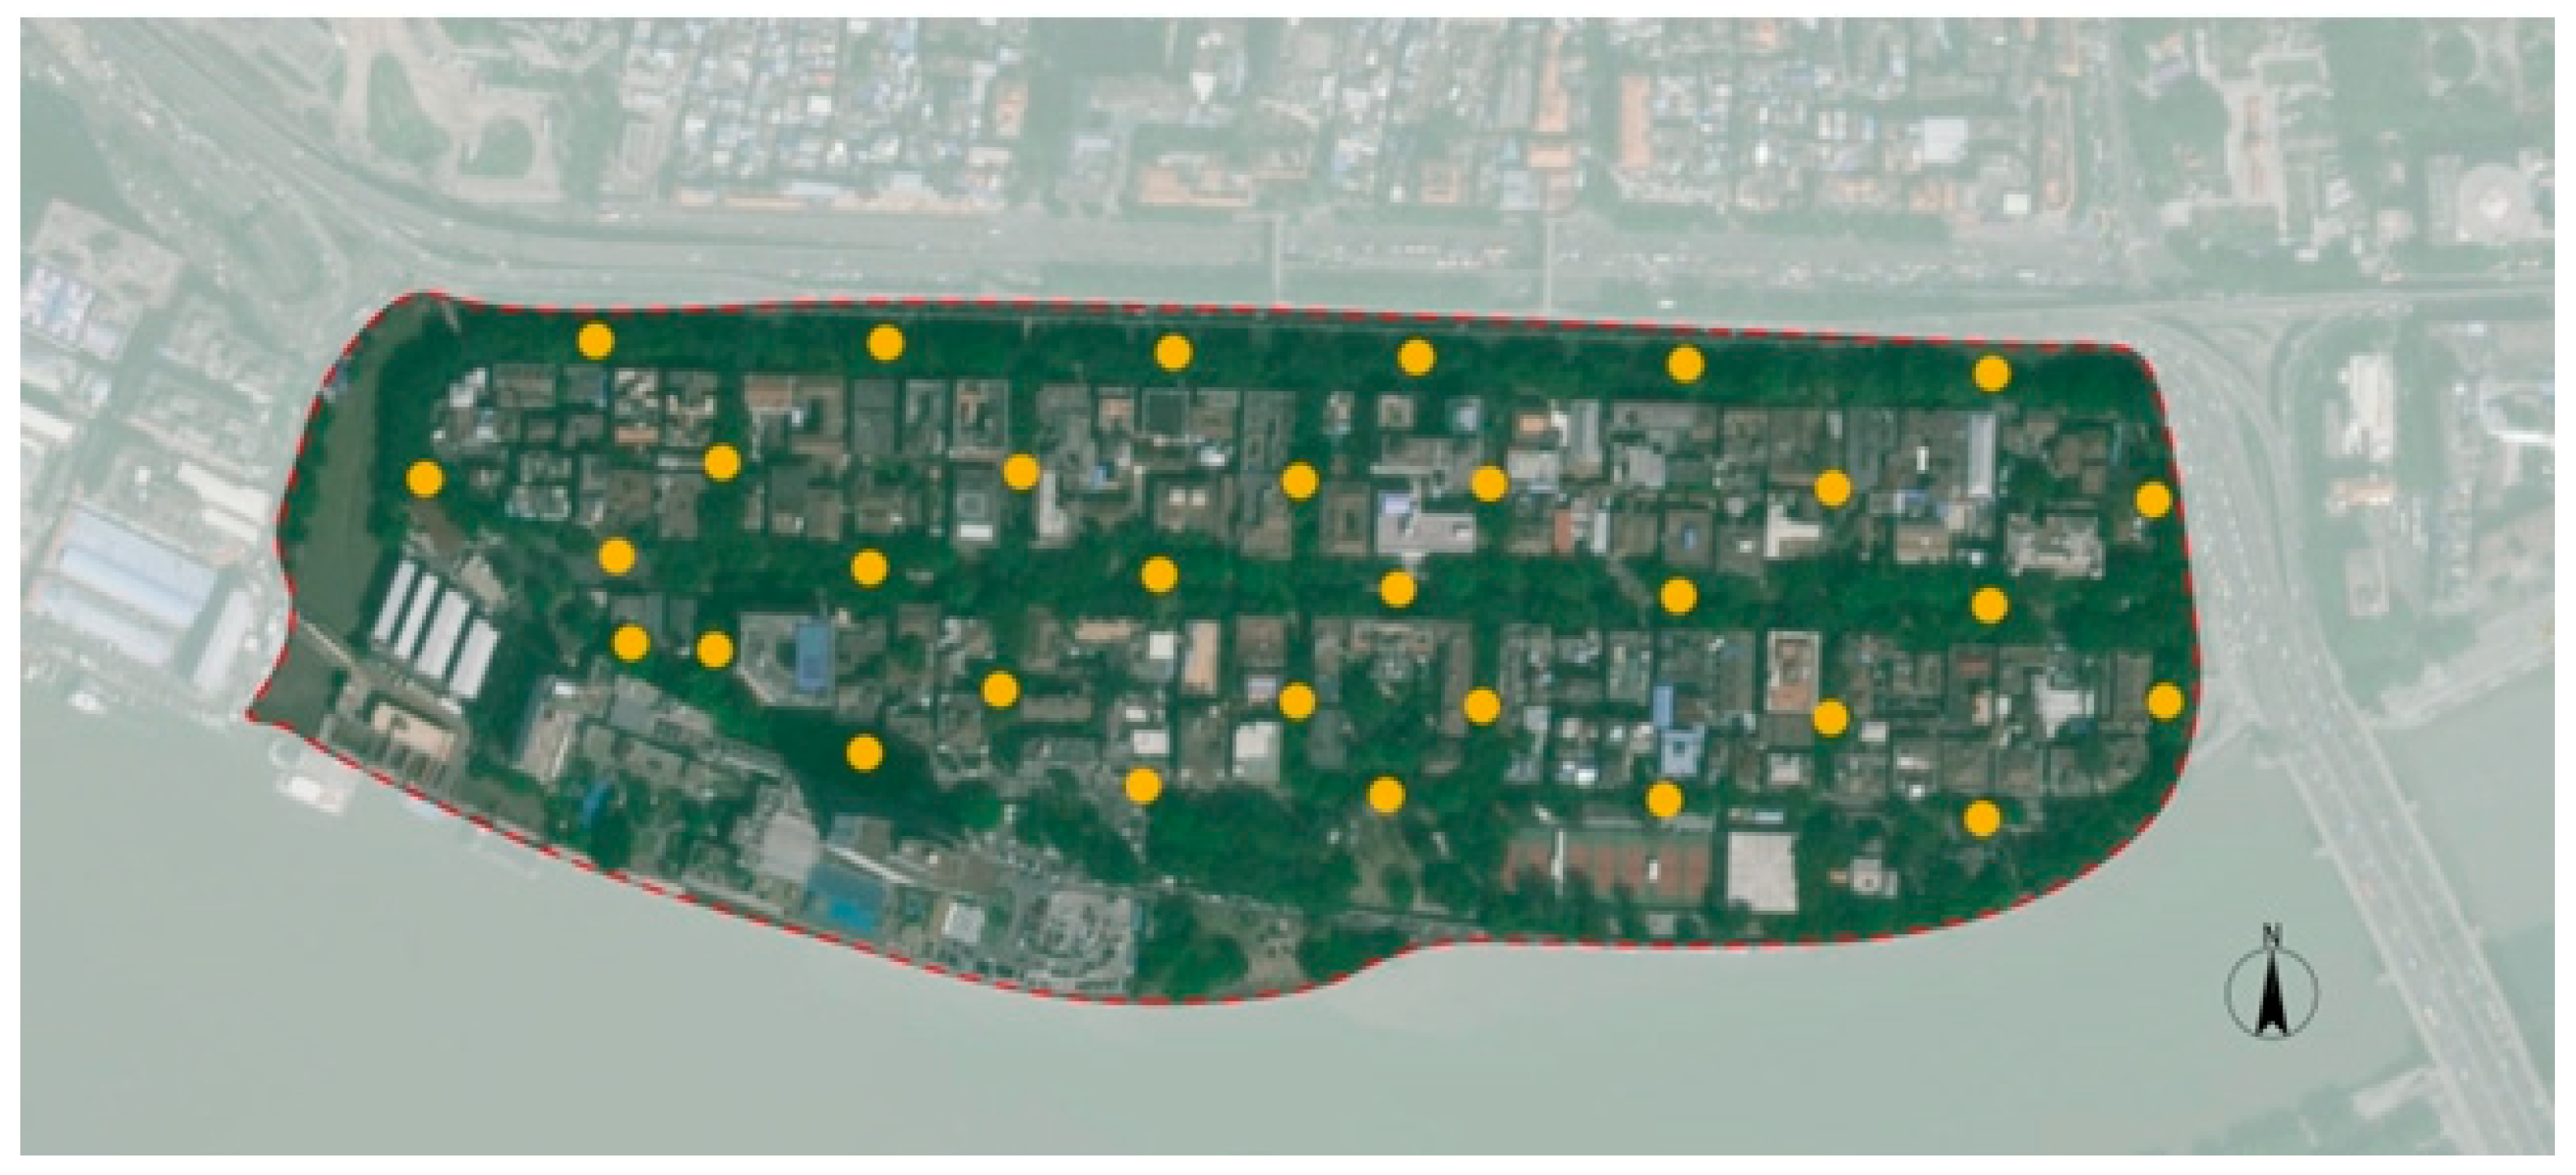
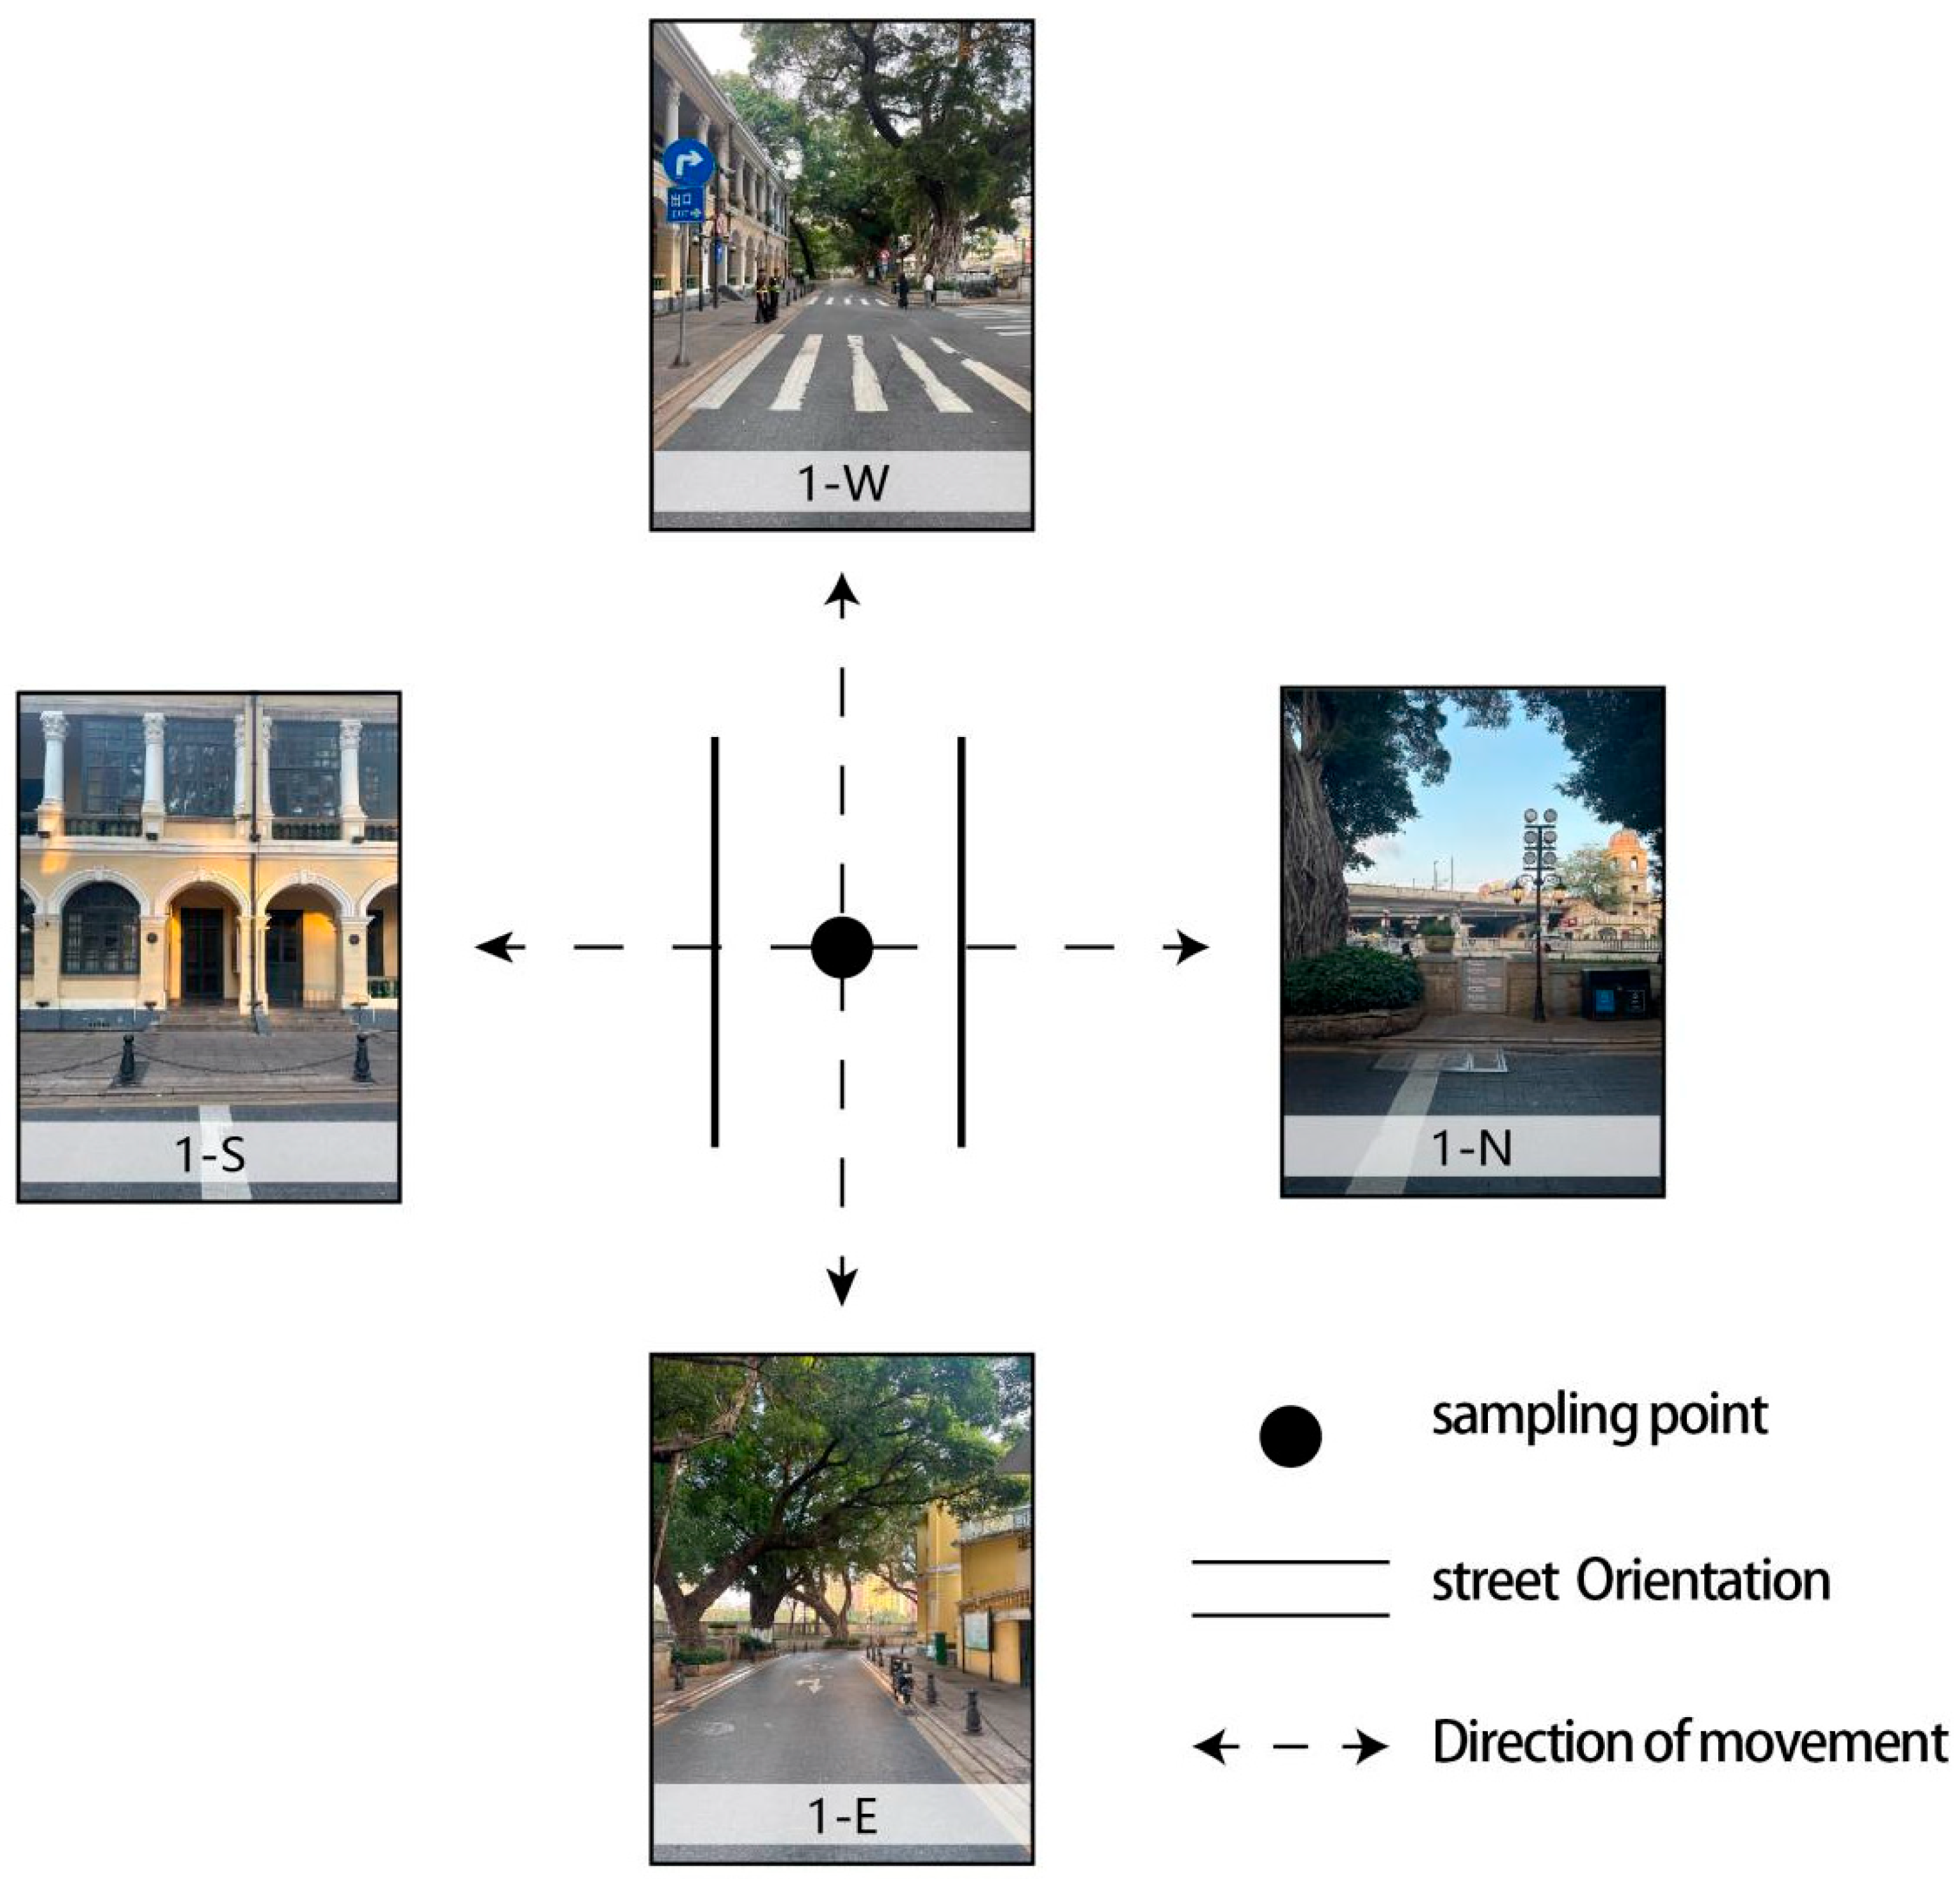
- Street View Imagery (SVI) Data: A total of 124 images were collected in May 2024 from 31 sampling points under optimal conditions. Guided by human-scale theory [38], points were spaced at 100–180 m intervals along the centerline. Images were captured at a 1.72-m eye-level height using an iPhone 15 Pro Max (Apple Inc., Cupertino, CA, USA) on a 3-axis stabilizer (resolution 1279 × 1706 pixels) in four cardinal directions to achieve 360° coverage (Figure 3).
- Data Coding: Each sampling point and its corresponding orientation were systematically coded (e.g., 1-N) to ensure traceability.
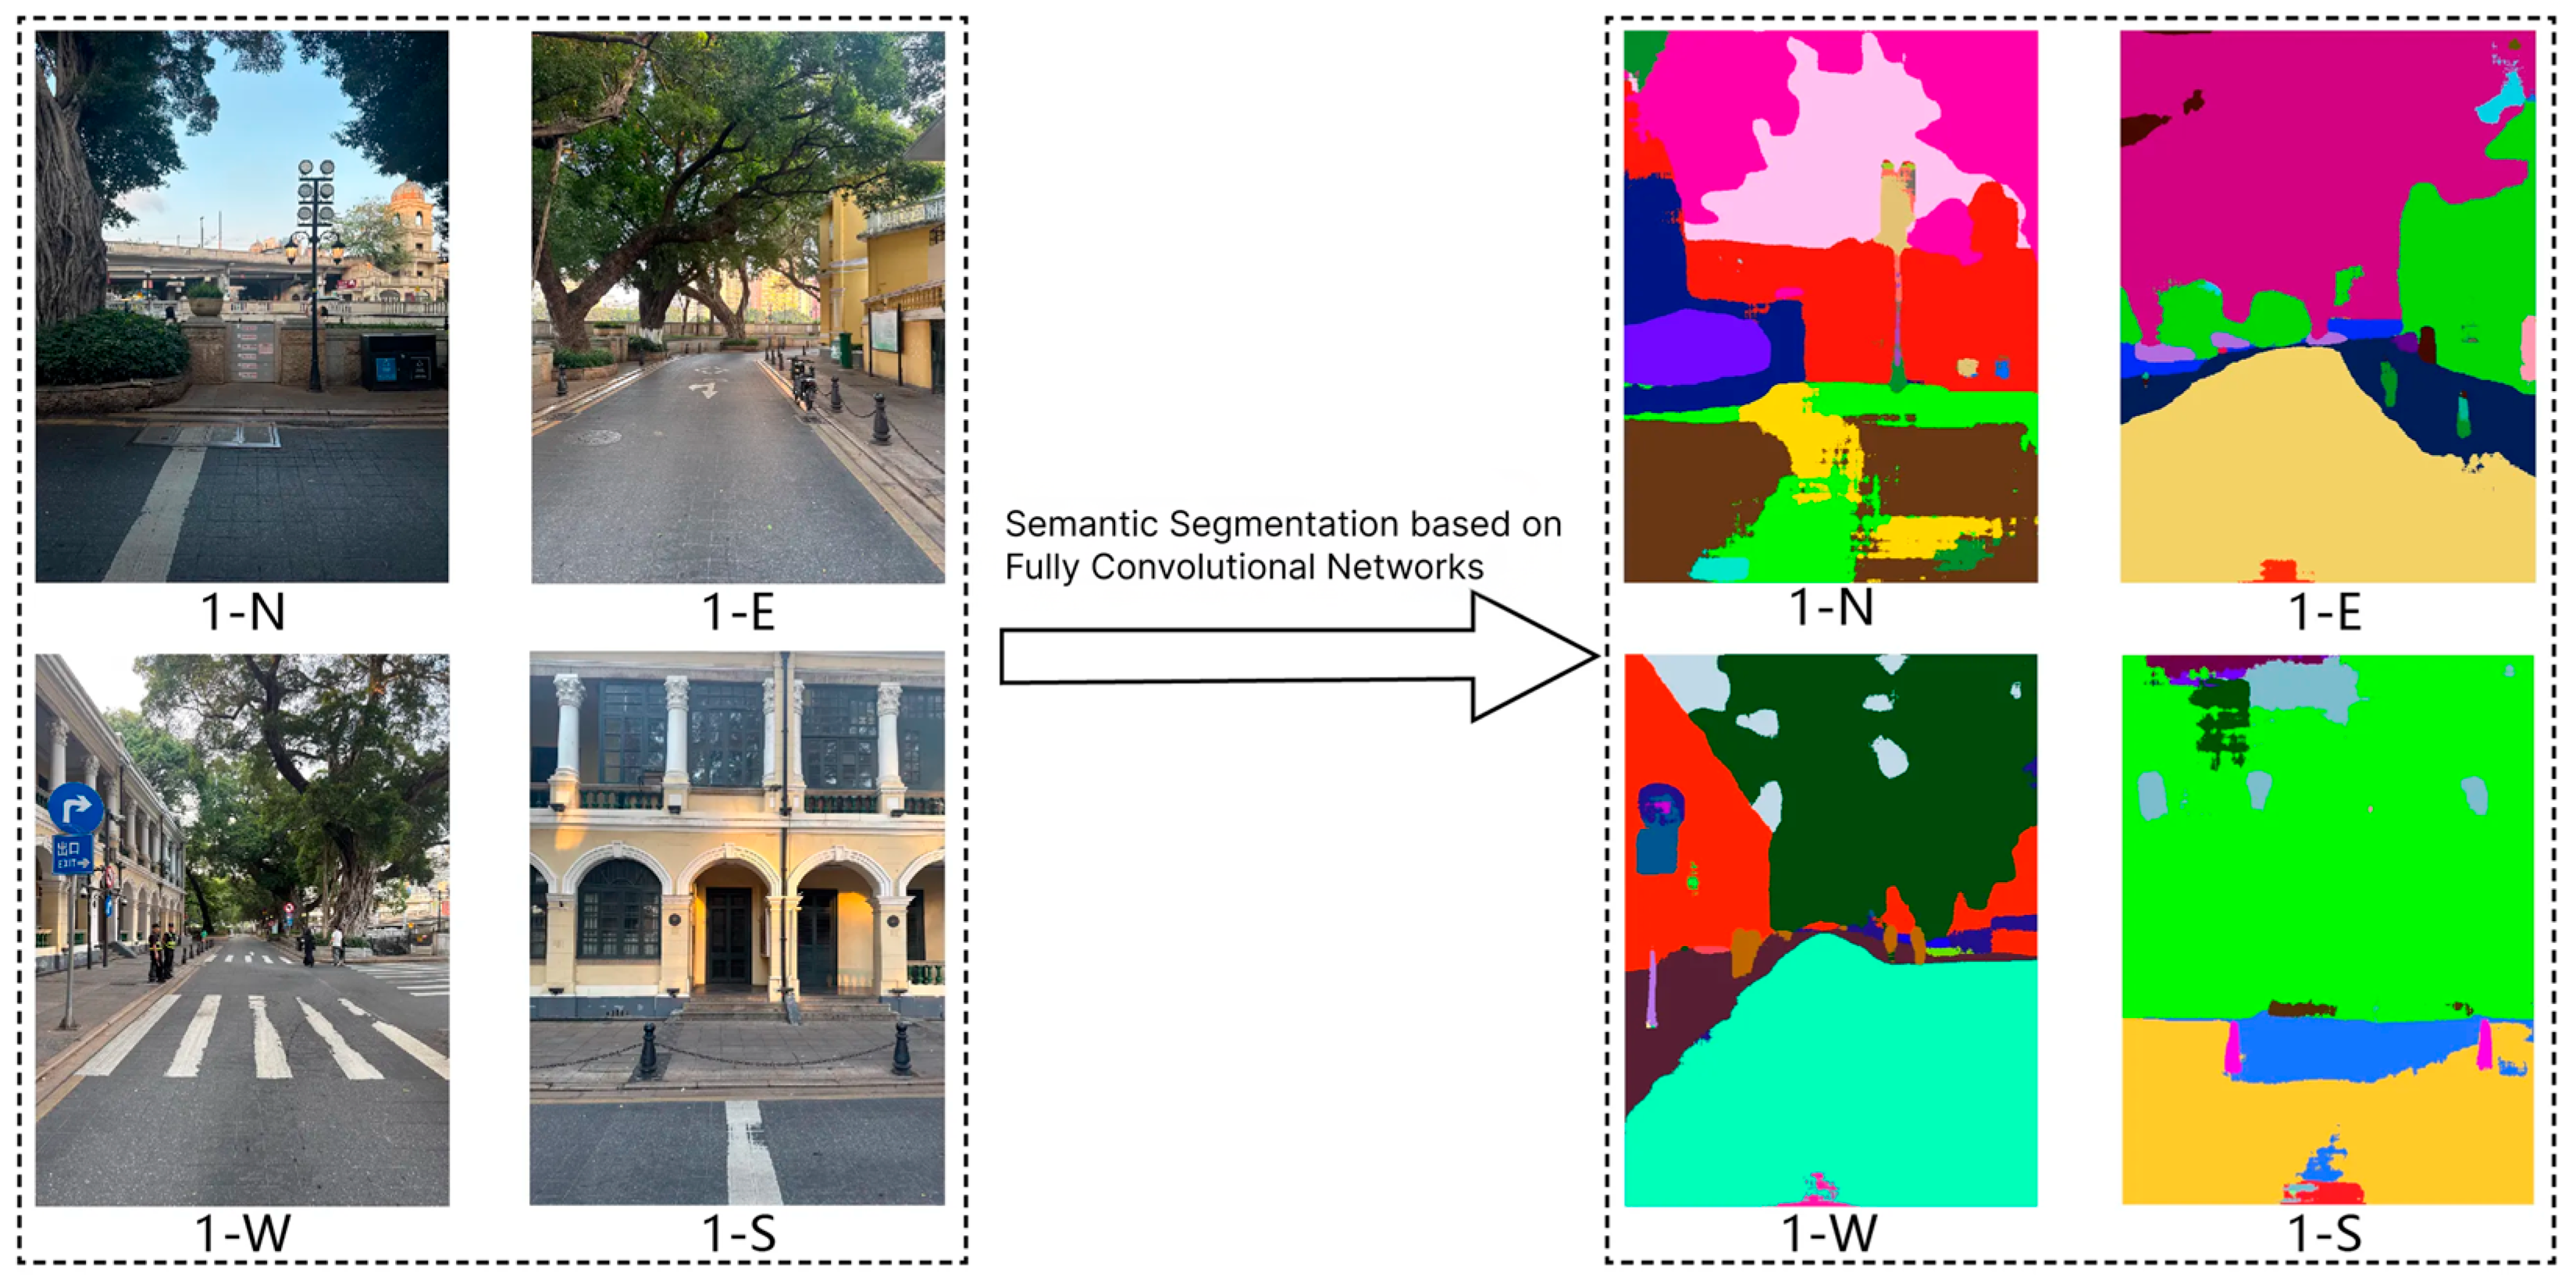
- Semantic Segmentation: A pre-trained Fully Convolutional Network (FCN) model was directly applied for semantic segmentation (Figure 4). Trained on the ADE20K dataset, to quantitatively validate the model’s local reliability on the Shamian Island dataset, a limited test set of 6 representative street-view images was manually annotated to establish ground truth. The segmentation outputs were compared against the manual annotations to calculate the pixel accuracy. The results demonstrated a high level of precision for the main target classes, achieving an average accuracy of 94.5% for vegetation, 91.2% for sky, and 93.8% for buildings. This local validation strongly confirms the reliability of the FCN model in accurately recognizing and quantifying these key visual elements [42,43].
- Parameter Calculation: Derived indicators, such as “building interface visibility” and “Green View Index (GVI),” were quantified using pixel proportions from the segmentation outputs. Based on the segmentation results, the average visual parameters for each category were calculated using Equation (3):
4.2.2. Behavioral Data
5. Results
- Model 1: Effective stationary behavior (Section 5.1).
- Model 2: Movement behavior (Section 5.2).
- Model 3: Consumption behavior (Section 5.3).
- Model 4: Leisure behavior (Section 5.4).
- Model 5: Viewing behavior (Section 5.5).
5.1. Model 1: Effective Stationary Behavior
5.2. Model 2: Movement Behavior
5.3. Model 3: Consumption Behavior
5.4. Model 4: Leisure Behavior
5.5. Model 5: Viewing Behavior
6. Discussion
6.1. Summary of Findings
6.2. Urban Design Guidelines
6.3. Research Implications
6.4. Limitations and Future Research
7. Conclusions
Author Contributions
Funding
Data Availability Statement
Conflicts of Interest
Glossary
| Behavioral Proxy | An observable action used as a quantifiable metric to represent and evaluate underlying subjective human perceptions. |
| Behavioral Representation | The overt actions (e.g., lingering, moving, consuming) reflecting how users interact with spatial environments. |
| Effective Stationary | Long-duration stays or lingering activities that indicate a higher depth of spatial attractiveness and user engagement. |
| FCN | Fully Convolutional Network: A deep learning architecture used in this study for the semantic segmentation of street-view imagery |
| GVI | Green View Index: The proportion of vegetation elements visible in a street-view image, reflecting perceptual exposure to greenery. |
| SVF | Sky View Factor: The proportion of sky elements visible in a street-view image, indicating spatial openness and daylight availability. |
| SVI | Street View Imagery: 360-degree panoramic images captured at eye level to objectively assess the physical and visual street environment. |
| Interface Continuity | The proportion of the building frontage that is continuously aligned with the street building line, indicating spatial enclosure. |
| MLR | Multiple Linear Regression: A statistical technique utilized to model the quantitative relationship between spatial characteristics |
| VIF | Variance Inflation Factor: A diagnostic metric used to detect multicollinearity among independent variables. |
Appendix A

| Predictors | Unstandardized B | Lower 95% CI | Upper 95% CI |
|---|---|---|---|
| (Constant) | 0.125 | −0.057 | 0.307 |
| Building Interface Visibility | 0.280 | 0.088 | 0.472 |
| Commercial Density | 0.276 | 0.051 | 0.501 |
| Functional Diversity | 0.195 | −0.079 | 0.469 |
| Walkway Width | 0.224 | 0.038 | 0.410 |
| Art Landscape Facility Density | 0.325 | 0.135 | 0.515 |
| Street Length | −0.253 | −0.414 | −0.092 |
| Predictors | Unstandardized B | Lower 95% CI | Upper 95% CI |
|---|---|---|---|
| (Constant) | 0.345 | 0.188 | 0.502 |
| Functional Density | 0.423 | 0.186 | 0.660 |
| Sky View Factor (SVF) | 0.351 | 0.200 | 0.502 |
| Walkway Width | 0.288 | 0.059 | 0.517 |
| Vehicular Lane Width | −0.295 | −0.425 | −0.165 |
| Shortest Distance to Public Transport | −0.245 | −0.410 | −0.080 |
| Public Service Facility Density | −0.268 | −0.487 | −0.049 |
| Predictors | Unstandardized B | Lower 95% CI | Upper 95% CI |
|---|---|---|---|
| (Constant) | 0.158 | −0.003 | 0.319 |
| Commercial Density | 0.318 | 0.091 | 0.545 |
| Functional Diversity | 0.308 | 0.054 | 0.562 |
| Building Interface Visibility | 0.241 | 0.043 | 0.439 |
| Walkway Width | 0.306 | 0.118 | 0.494 |
| Shortest Distance to Public Transport | −0.334 | −0.501 | −0.167 |
| Safety Facility Density | −0.322 | −0.545 | −0.099 |
| Predictors | Unstandardized B | Lower 95% CI | Upper 95% CI |
|---|---|---|---|
| (Constant) | 0.386 | 0.197 | 0.575 |
| Vehicular Lane Width | −0.248 | −0.409 | −0.087 |
| Walkway Width | 0.484 | 0.210 | 0.758 |
| Public Service Facility Density | 0.081 | −0.179 | 0.341 |
| Green View Index (GVI) | 0.327 | 0.076 | 0.578 |
| Sky View Factor (SVF) | −0.154 | −0.331 | 0.023 |
| Predictors | Unstandardized B | Lower 95% CI | Upper 95% CI |
|---|---|---|---|
| (Constant) | 0.228 | 0.012 | 0.444 |
| Walkway Width | 0.124 | −0.136 | 0.384 |
| Vegetation Species Diversity | 0.247 | 0.051 | 0.443 |
| Interface Continuity | 0.292 | 0.076 | 0.508 |
| Art Landscape Facility Density | 0.120 | −0.121 | 0.361 |
| Vehicular Lane Width | −0.303 | −0.480 | −0.126 |
References
- Abusaada, H.; Elshater, A. Effect of people on placemaking and affective atmospheres in city streets. Ain Shams Eng. J. 2021, 12, 3389–3403. [Google Scholar] [CrossRef] [Scilit]
- Miranda, A.S.; Fan, Z.; Duarte, F.; Ratti, C. Desirable streets: Using deviations in pedestrian trajectories to measure the value of the built environment. Comput. Environ. Urban Syst. 2021, 86, 101563. [Google Scholar] [CrossRef] [Scilit]
- Ashihara, Y. The Aesthetic of the Street; Baihua Literature and Art Publishing House: Tianjin, China, 2006. [Google Scholar]
- Xie, W.; Yao, L.; Xia, D.; Zou, Y.; Lou, S.; Yang, L. Occupant Behavior and Building Type Jointly Shape Indoor Heat Stress in Guangzhou Urban Villages. Build. Environ. 2026, 296, 114505. [Google Scholar] [CrossRef] [Scilit]
- Zou, Y.; Xie, W.; Lou, S.; Huang, Y.; Xia, D.; Yang, X.; Feng, C. Prediction Model Establishment for Residential Community Occupancy Considering Urban Environment. J. Build. Eng. 2024, 96, 110463. [Google Scholar] [CrossRef] [Scilit]
- Juan, Y.-K.; Chen, Y. The Influence of Indoor Environmental Factors on Learning: An Experiment Combining Physiological and Psychological Measurements. Build. Environ. 2022, 221, 109299. [Google Scholar] [CrossRef] [Scilit]
- Asim, F.; Chani, P.S.; Shree, V.; Rai, S. Restoring the mind: A neuropsychological investigation of university campus built environment aspects for student well-being. Build. Environ. 2023, 244, 110810. [Google Scholar] [CrossRef] [Scilit]
- Ye, Y.; Zhang, Z.; Zhang, X.; Zeng, W. Human-scale quality on streets: A large-scale and efficient analytical approach based on street view images and new urban analytical tools. Urban Plan. Int. 2019, 34, 18–27. [Google Scholar] [CrossRef] [Scilit]
- Xu, L.; Shi, J. Walking activity quality and built environment: Take three commercial streets in Shanghai as examples. Shanghai Urban Plan. Rev. 2017, 1, 17–24. [Google Scholar]
- Sun, H.; Xu, H.; He, H.; Wei, Q.; Yan, Y.; Chen, Z.; Li, X.; Zheng, J.; Li, T. A spatial analysis of urban streets under deep learning based on street view imagery: Quantifying perceptual and elemental perceptual relationships. Sustainability 2023, 15, 14798. [Google Scholar] [CrossRef] [Scilit]
- Guo, X.; Lai, J.; Ma, Z. Consistency analysis of virtual evaluation and field survey methods for street quality: A case study of rail transit core areas in Shenzhen. Planners 2022, 6, 70–78. [Google Scholar]
- Huang, J.X.; Liang, J.Q.; Yang, M.S.; Li, Y. Street space visual quality evaluating method of tourism sites based on street view images. J. Geo-Inf. Sci. 2024, 26, 352–366. [Google Scholar]
- Xiao, Y.; Song, M. How are urban design qualities associated with perceived walkability? An AI approach using street view images and deep learning. Int. J. Urban Sci. 2025, 29, 66–91. [Google Scholar] [CrossRef] [Scilit]
- Jeon, J.Y.; Jo, H.I. Effects of audio-visual interactions on soundscape and landscape perception and their influence on satisfaction with the urban environment. Build. Environ. 2020, 169, 106544. [Google Scholar] [CrossRef] [Scilit]
- Kasraian, D.; Adhikari, S.; Kossowsky, D.; Luubert, M.; Hall, B.G.; Hawkins, J.; Nurul Habib, K.; Roorda, M.J. Evaluating pedestrian perceptions of street design with a 3D stated preference survey. Environ. Plan. B Urban Anal. City Sci. 2021, 48, 1787–1805. [Google Scholar] [CrossRef] [Scilit]
- Lan, W.; Duan, J.; Yang, B. A public perception-oriented evaluation model of urban spatial identity and its empirical research: Taking the main urban area of Wuhan as an example. City Plan. Rev. 2021, 45, 67–76. [Google Scholar]
- Shi, J.; Yan, Y.; Li, M.; Zhou, L. Measuring the convergence and divergence in urban street perception among residents and tourists through deep learning: A case study of Macau. Land 2024, 13, 345. [Google Scholar] [CrossRef] [Scilit]
- Zhao, X.; Qiu, X.; Xu, J.; Hou, Y. Review of research methods for green spatial behavioral activities and environmental cognition. Landsc. Archit. 2020, 27, 56–62. [Google Scholar]
- Hu, G.; Huang, J.; Li, F. Spatial network structure analysis of Xia-Zhang-Quan metropolitan area: LBS big data analysis based on crowds’ activities characteristics. Mod. Urban Res. 2019, 11, 13–19. [Google Scholar]
- Fu, Y.; Yang, F.; Bao, Z. Research on accessibility of Hangzhou comprehensive parks based on spatial syntax and LBS big data. Landsc. Archit. 2021, 28, 69–75. [Google Scholar]
- Yin, Z.; Wang, D.; Zhai, B.; Zhang, T.; Yan, L. Inferring non-work activity purposes from mobile phone signaling data: Insights from Shanghai. Prog. Geogr. 2025, 44, 583–593. [Google Scholar]
- Komossa, F.; van der Zanden, E.H.; Verburg, P.H. Characterizing outdoor recreation user groups: A typology of peri-urban recreationists in the Kromme Rijn area, the Netherlands. Land Use Policy 2019, 80, 246–258. [Google Scholar] [CrossRef] [Scilit]
- Chen, J.; Jin, X.; Shi, X. Research on commercial space design strategies for metro stations based on passenger behavioral preferences. Mod. Urban Res. 2025, 72–77. [Google Scholar]
- Fu, X.; Qin, T.; Sun, H.; Ye, R.; Yang, Q.; Zhou, T. Inclusive design strategy research of urban green space based on behavior preference. J. Southwest China Norm. Univ. (Nat. Sci. Ed.) 2022, 47, 86–96. [Google Scholar] [CrossRef]
- Whyte, W.H. The Social Life of Small Urban Spaces; Project for Public Spaces: New York, NY, USA, 1980. [Google Scholar]
- Mao, Z.-R.; Chen, X.-K.; Xiang, Z.-H.; Chen, Y. Research on the measurement and influencing factors of street vigour in historic districts: A case study of Wenming Street historic district in Kunming. S. Archit. 2021, 4, 48–55. [Google Scholar]
- Xuan, X.; Yan, M.; Zou, J.; Zheng, Y.; Zhang, Z. Exploring the influences of the tourist path space quality on visitor behaviors under a physical environment intervention: A case study based on Sanhe ancient town in Hefei city. S. Archit. 2024, 5, 14–28. [Google Scholar]
- Katzmarzyk, P.T.; Tremblay, M.S. Limitations of Canada’s physical activity data: Implications for monitoring trends. Appl. Physiol. Nutr. Metab. 2007, 32, S185–S194. [Google Scholar] [CrossRef] [Scilit]
- Mayor of London. Streetscape Guidance 2017 Revision; Transport for London: London, UK, 2019. [Google Scholar]
- New York City Department of Transportation. Street Design Manual; NYC DOT: New York, NY, USA, 2015. [Google Scholar]
- Abu Dhabi Urban Planning Council. Abu Dhabi Urban Street Design Manual; Abu Dhabi UPC: Abu Dhabi, United Arab Emirates, 2015. [Google Scholar]
- Shanghai Municipal Planning and Land Resource Administration Bureau; Shanghai Municipal Transportation Commission; Shanghai Urban Planning and Design Research Institute. Shanghai Street Design Guidelines; Tongji University Press: Shanghai, China, 2016. [Google Scholar]
- Guangzhou Municipal Housing and Urban-Rural Development Bureau; Guangzhou Urban Planning and Design Survey Research Institute. Guangzhou Urban Road All-Elements Design Manual; China Architecture & Building Press: Beijing, China, 2018. [Google Scholar]
- Beijing Municipal Commission of Planning and Natural Resources; Beijing Municipal Institute of City Planning and Design. Urban Design Guidelines for Beijing Street Renewal and Governance; Beijing Municipal Commission of Planning and Natural Resources: Beijing, China, 2018. [Google Scholar]
- Aboulnaga, M.; Ashour, F.; Elsharkawy, M.; Lucchi, E.; Gamal, S.; Elmarakby, A.; Haggagy, S.; Karar, N.; Khashaba, N.H.; Abouaiana, A. Urbanization and drivers for dual capital city: Assessment of urban planning principles and indicators for a ‘15-Minute City’. Land 2025, 14, 382. [Google Scholar] [CrossRef] [Scilit]
- Gehl, J. Cities for People; Island Press: Washington, DC, USA, 2010. [Google Scholar]
- Ewing, R.; Handy, S. Measuring the unmeasurable: Urban design qualities related to walkability. J. Urban Des. 2009, 14, 65–84. [Google Scholar] [CrossRef] [Scilit]
- Gehl, J. Life Between Buildings: Using Public Space; Van Nostrand Reinhold: New York, NY, USA, 1987. [Google Scholar]
- Mehta, V. Lively streets: Determining environmental characteristics to support social behavior. J. Plan. Educ. Res. 2007, 27, 165–187. [Google Scholar] [CrossRef] [Scilit]
- Lucchi, E.; Romano, G.; Altamura, P.; Baiani, S. Criticity mapping and integration quantity evaluation of solar installations in Mediterranean heritage territories. In Sustainability in Energy and Buildings 2023; Littlewood, J.R., Jain, L., Howlett, R.J., Eds.; Springer: Singapore, 2024; pp. 367–378. [Google Scholar] [CrossRef] [Scilit]
- Hair, J.F.; Black, W.C.; Babin, B.J.; Anderson, R.E. Multivariate Data Analysis, 8th ed.; Cengage Learning: Boston, MA, USA, 2019. [Google Scholar]
- Long, J.; Shelhamer, E.; Darrell, T. Fully convolutional networks for semantic segmentation. IEEE Trans. Pattern Anal. Mach. Intell. 2015, 39, 640–651. [Google Scholar]
- Yao, Y.; Liang, Z.; Yuan, Z.; Liu, P.; Bie, Y.; Zhang, J.; Wang, R.; Wang, J.; Guan, Q. A human-machine adversarial scoring framework for urban perception assessment using street-view images. Int. J. Geogr. Inf. Sci. 2019, 33, 2363–2384. [Google Scholar] [CrossRef] [Scilit]
- Belaroussi, R.; Issa, E.; Cameli, L.; Lantieri, C.; Adelé, S. Exploring Virtual Environments to Assess the Quality of Public Spaces. Algorithms 2024, 17, 124. [Google Scholar] [CrossRef] [Scilit]
- Belaroussi, R. Subjective Assessment of a Built Environment by ChatGPT, Gemini and Grok: Comparison with Architecture, Engineering and Construction Expert Perception. Big Data Cogn. Comput. 2025, 9, 100. [Google Scholar] [CrossRef] [Scilit]





| Research Methods | Advantages | Disadvantage | Scope of Application |
|---|---|---|---|
| Behavioral Research Based on Location Recognition | Large sample size; wide coverage | Low behavioral detail; data anonymity leads to a lack of individual social attributes; insufficient effectiveness in refined diagnosis of spatial quality | Analysis of Macroscopic Patterns of Population Movement |
| Research on self-reported behaviors | Deeply reveal the psychological motivations and subjective cognitive mechanisms of actors | Dependent on the accuracy of the participants’ memory; the data is highly subjective | Research on Behavioral Motivation and Perception Mechanisms at the Micro and Meso Levels |
| Behavioral Research Based on Field Observations | Accurately capture multi-dimensional features such as behavior type, spatiotemporal location, and duration | High manual recording intensity and limited sample size | Analysis of the Direct Impact of Micro and Mesoscale Spatial Element Configuration on Behavior |
| Dimension | Measurement Indicator | Measurement Method | Formula Description | Unit |
|---|---|---|---|---|
| Spatial Scale | Carriageway Width | Width of roadway used by motorized and non-motorized vehicles | — | m |
| Sidewalk Width | Width exclusively for pedestrian use | — | m | |
| Street Width | Total width between street red lines in the cross-section | — | m | |
| Street Length | Continuous distance along the road centerline from start point to end point | — | m | |
| Average Building Height | Arithmetic mean of building eave heights on both sides of the street | — | m | |
| Street Height-to-Width Ratio | H/W = Havg/Wtotal | Havg: Average building height on both sides of the street; Wtotal: Street width | / | |
| Shortest Distance to Public Transport | Atrans = Dmetro + Dbus | Dmetro: Shortest walking distance from the street midpoint to the nearest metro station; Dbus: Shortest walking distance from the street midpoint to the nearest bus stop | m | |
| Street Interface | Interface Continuity | BCLR = (Lwall/Lroad) × 100% | Lwall: Length of building frontage continuously aligned with the building line; Lroad: Street length | % |
| Building Interface Visibility | Based on street-view image data, a Fully Convolutional Network (FCN) is used for semantic segmentation to obtain the average proportion of building interfaces across four-view street images | — | % | |
| Furniture and Facilities | Functional Density | Dfunc = (Nf/Lroad) × 100 | Nf: Number of independent functional units on both sides of the street; Lroad: street length | units/100 m |
| Commercial Density | Dcom = (Nc/Lroad) × 100 | Nc: Number of commercial shops on both sides of the street; Lroad: street length | units/100 m | |
| Functional Diversity | Mixnew = n/Lroad | n: Actual number of functional categories on both sides of the street segment (excluding categories with zero count); Lroad: street length | units/100 m | |
| Safety Facilities Density | Ds = (Ns/Lroad) × 100 | Ns: Number of safety facilities on both sides of the street; Lroad: street length | units/100 m | |
| Public Service Facilities Density | Dp = (Np/Lroad) × 100 | Np: Number of public service facilities on both sides of the street; Lroad: street length | units/100 m | |
| Art Landscape Facilities Density | DArt = (NArt/Lroad) × 100 | NArt: Number of art landscape facilities on both sides of the street; Lroad: street length | units/100 m | |
| Landscape Environment | Green View Index (GVI) | Based on street-view image data, using fully convolutional network model (FCN) for semantic segmentation, getting the average proportion of vegetation elements in four-view street-view images | — | % |
| Vegetation Types | Dveg = (Nplants/Lroad) × 100 | Nplants: Number of tree and shrub species on both sides of the street; Lroad: street length | % | |
| Sky View Factor (SVF) | Based on street-view image data, using fully convolutional network model (FCN) for semantic segmentation, getting the average proportion of sky elements in four-view street-view images | — | % |
| Model | R | R2 | Adjusted R2 | F | Durbin-Watson (DW) | Moran’s I |
|---|---|---|---|---|---|---|
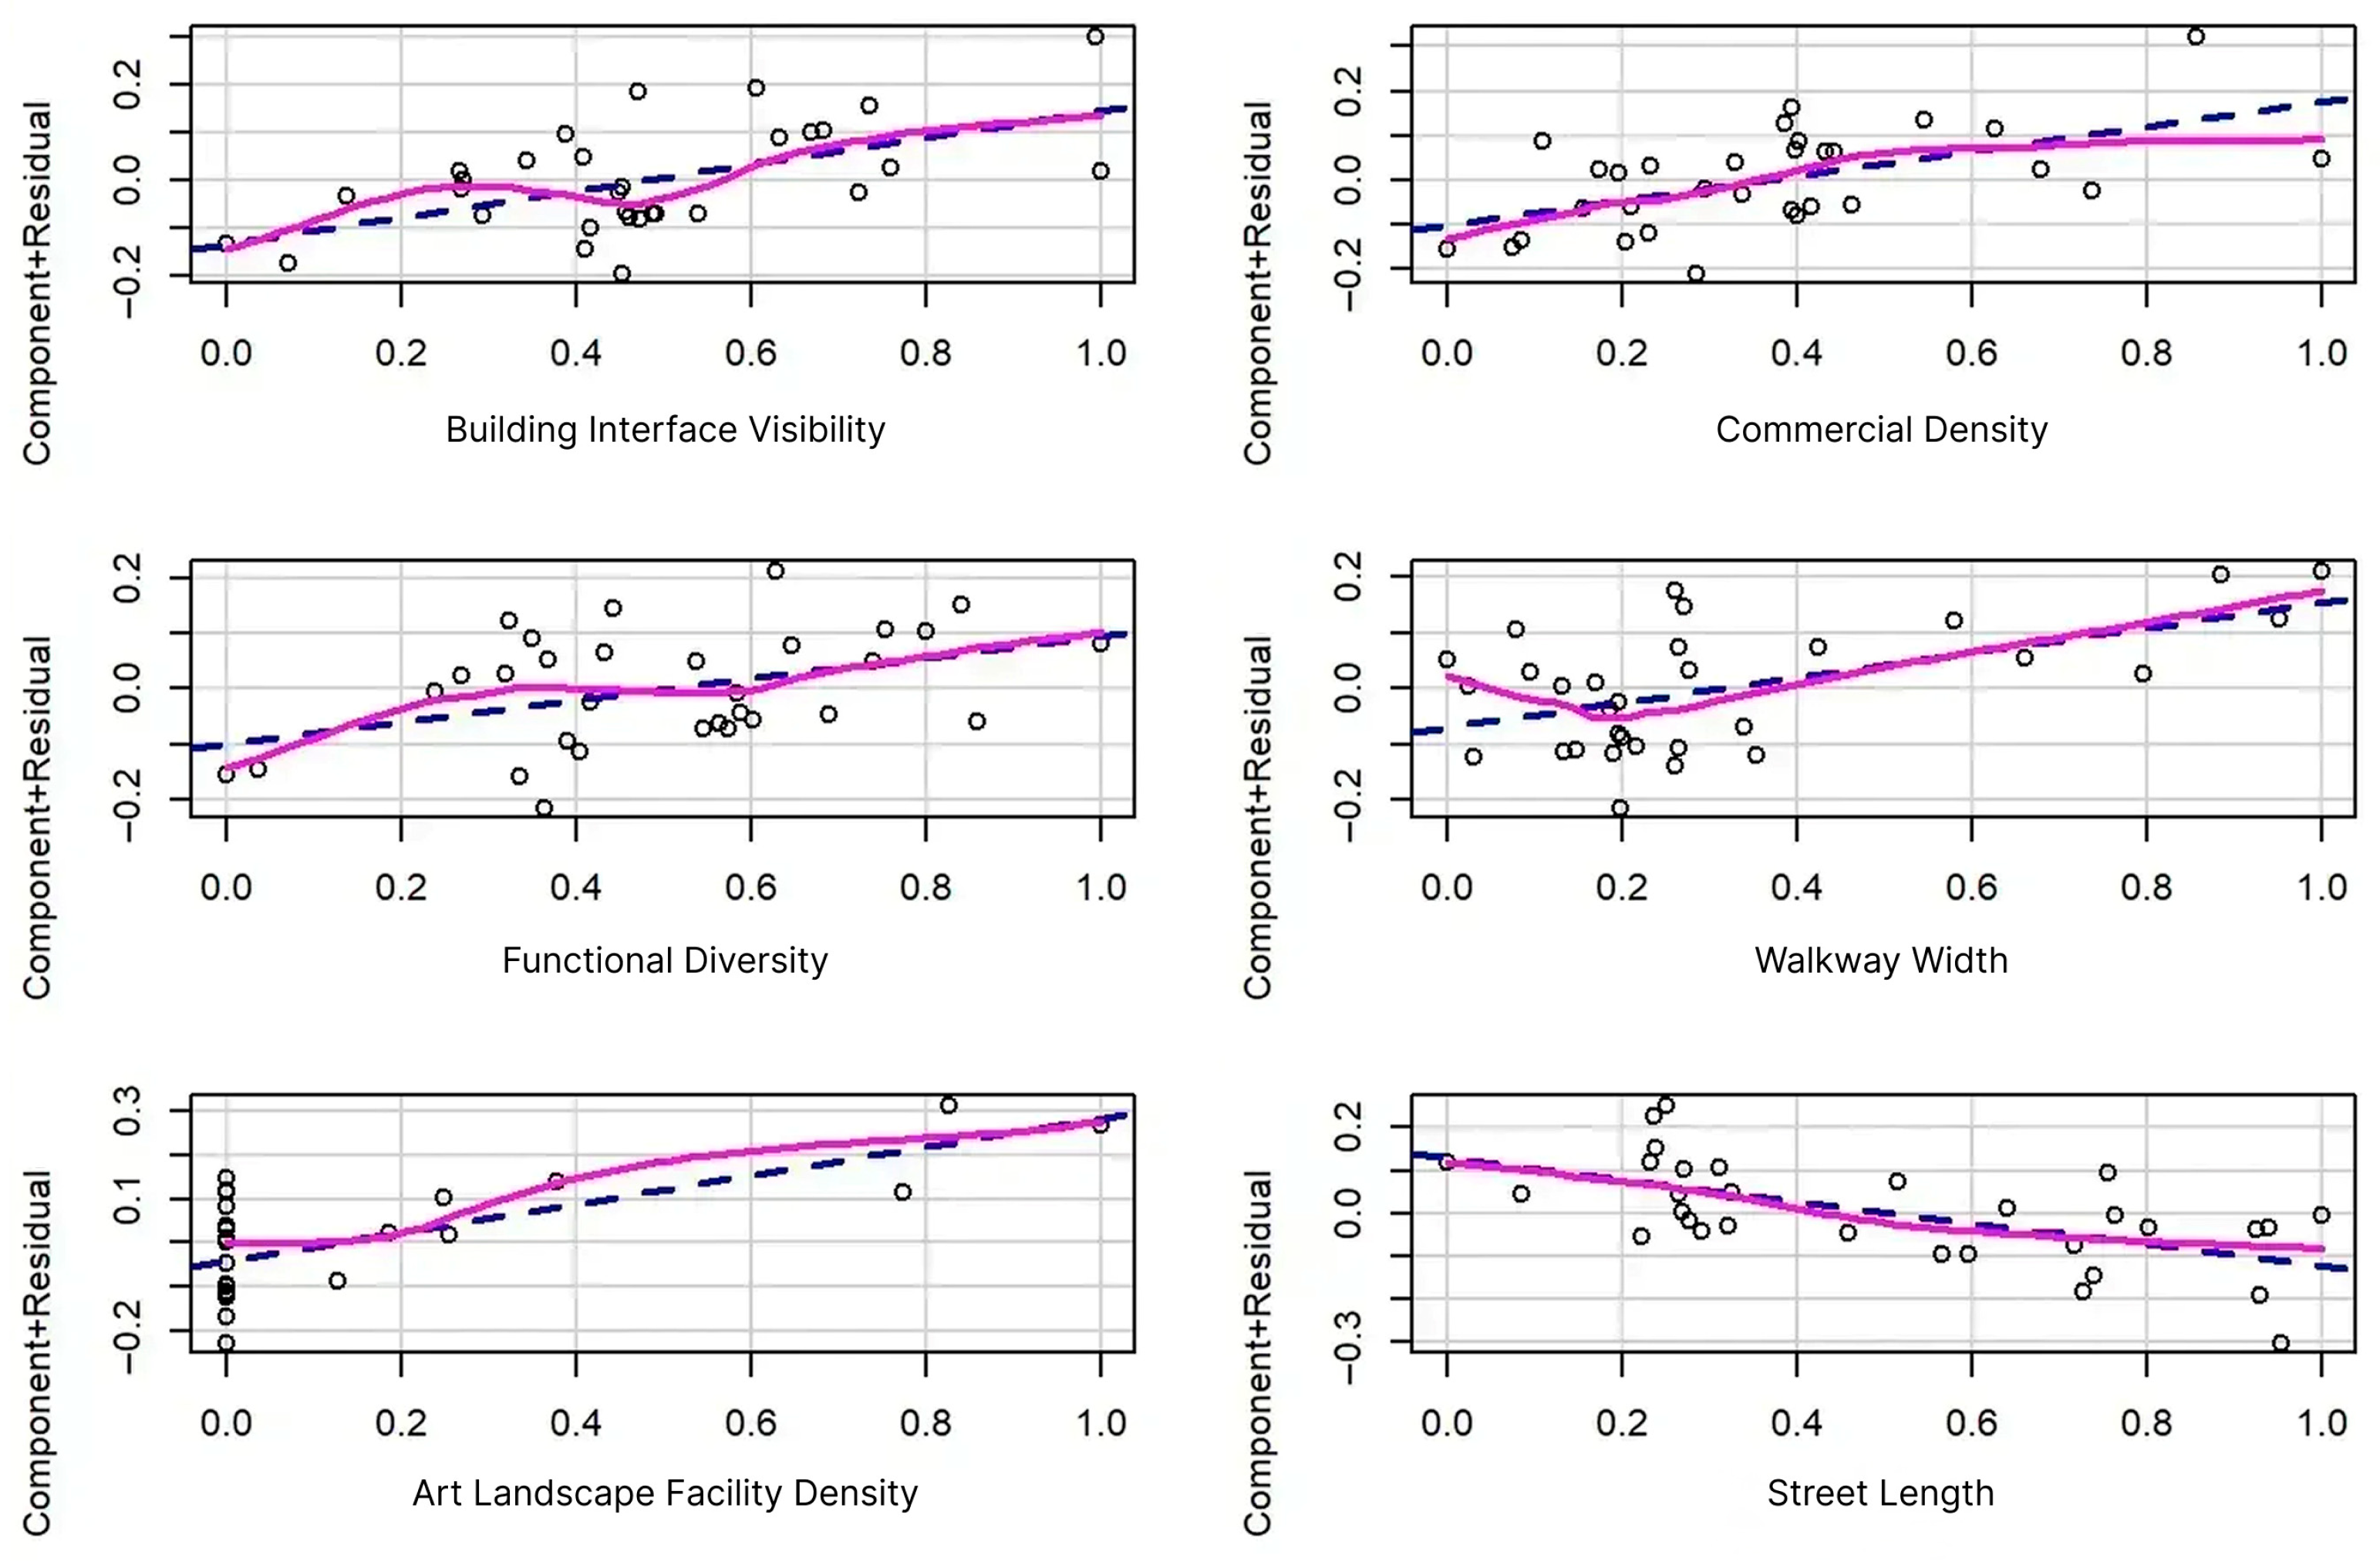
| 1 | 0.922 | 0.849 | 0.812 | 22.55 *** | 1.865 | −0.167 |
| B | Std. Error | Beta | t | Significance | Tolerance | VIF | |
|---|---|---|---|---|---|---|---|
| (Constant) | 0.125 | 0.088 | — | 1.42 | 0.169 | — | — |
| Building Interface Visibility | 0.28 | 0.093 | 0.266 | 3.028 | 0.006 | 0.811 | 1.233 |
| Commercial Density | 0.276 | 0.109 | 0.262 | 2.522 | 0.019 | 0.582 | 1.718 |
| Functional Diversity | 0.195 | 0.133 | 0.186 | 1.47 | 0.154 | 0.392 | 2.548 |
| Walkway Width | 0.224 | 0.09 | 0.253 | 2.5 | 0.02 | 0.615 | 1.626 |
| Art Landscape Facility Density | 0.325 | 0.092 | 0.359 | 3.556 | 0.002 | 0.616 | 1.624 |
| Street Length | −0.253 | 0.078 | −0.306 | −3.238 | 0.004 | 0.704 | 1.421 |
| Model | R | R2 | Adjusted R2 | F | Durbin-Watson (DW) | Moran’s I |
|---|---|---|---|---|---|---|
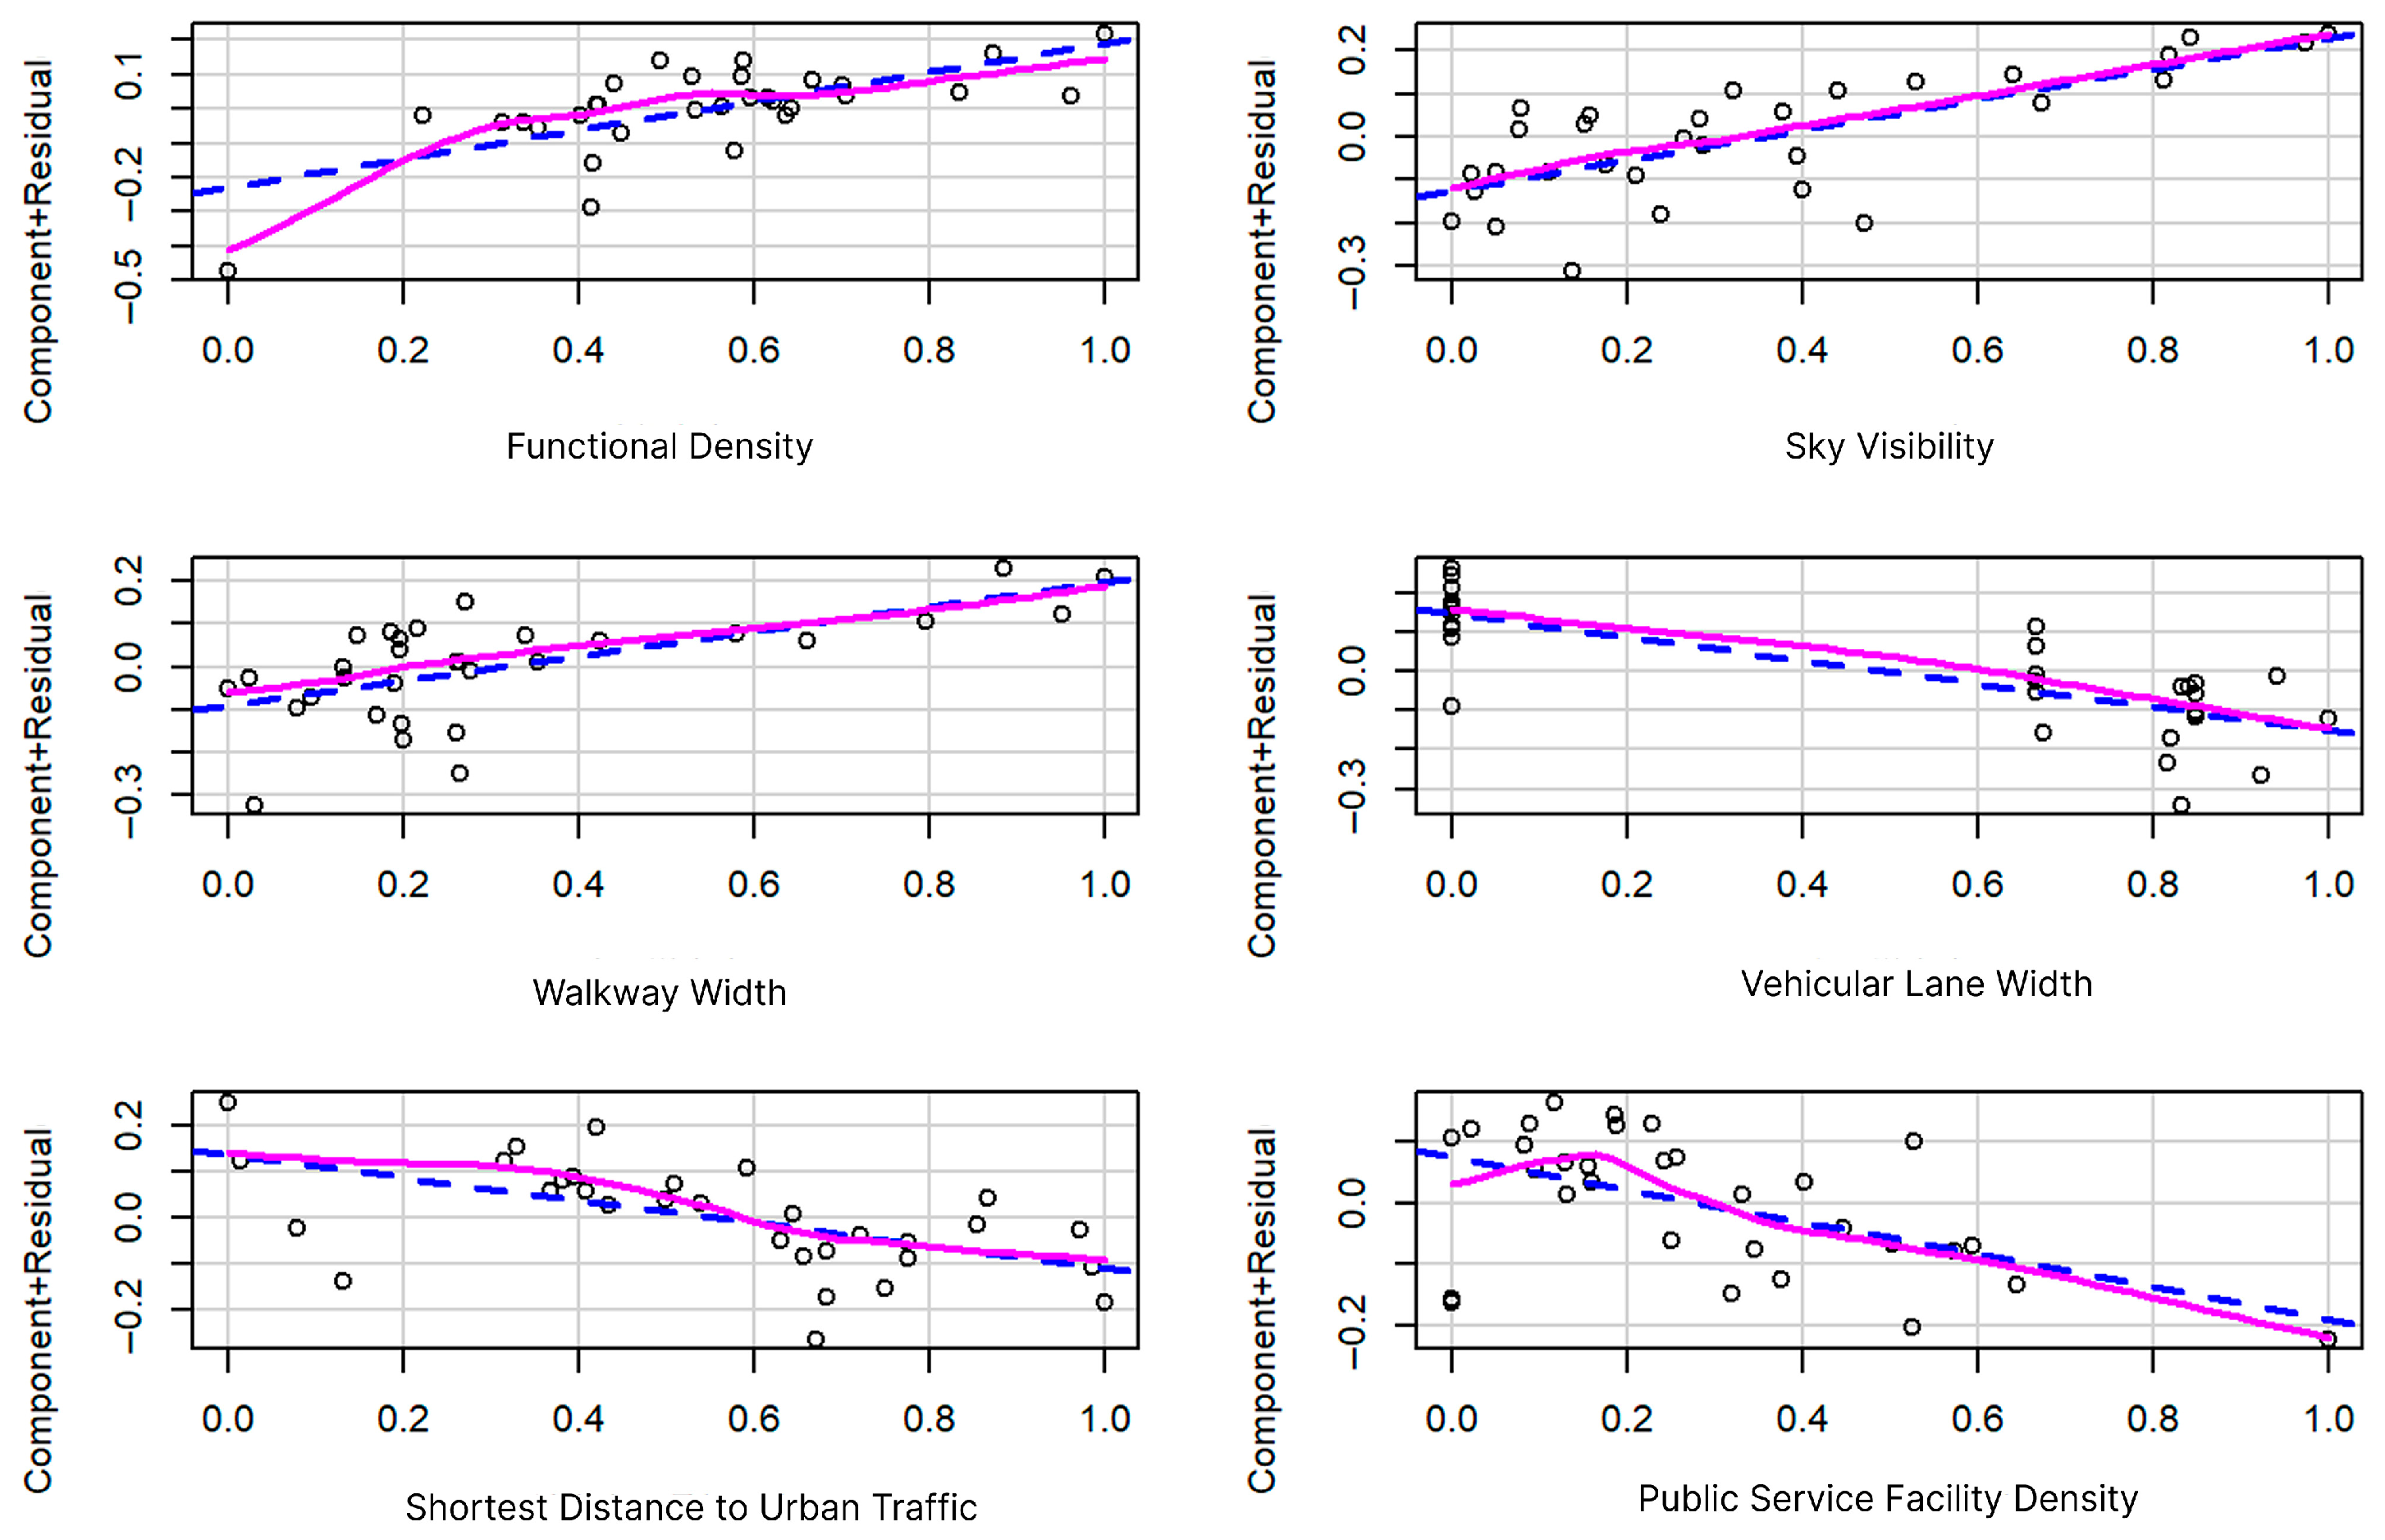
| 2 | 0.905 | 0.820 | 0.775 | 18.204 *** | 1.117 | 0.152 |
| B | Std. Error | Beta | t | Significance | Tolerance | VIF | |
|---|---|---|---|---|---|---|---|
| (Constant) | 0.345 | 0.076 | — | 4.549 | <0.001 | — | — |
| Functional Density | 0.423 | 0.115 | 0.39 | 3.676 | 0.001 | 0.665 | 1.503 |
| Sky View Factor (SVF) | 0.351 | 0.073 | 0.46 | 4.805 | <0.001 | 0.817 | 1.223 |
| Walkway Width | 0.288 | 0.111 | 0.346 | 2.594 | 0.016 | 0.422 | 2.37 |
| Vehicular Lane Width | −0.295 | 0.063 | −0.527 | −4.642 | <0.001 | 0.582 | 1.717 |
| Shortest Distance to Public Transport | −0.245 | 0.08 | −0.295 | −3.075 | 0.005 | 0.815 | 1.227 |
| Public Service Facility Density | −0.268 | 0.106 | −0.273 | −2.541 | 0.018 | 0.65 | 1.538 |
| Model | R | R2 | Adjusted R2 | F | Durbin-Watson (DW) | Moran’s I |
|---|---|---|---|---|---|---|
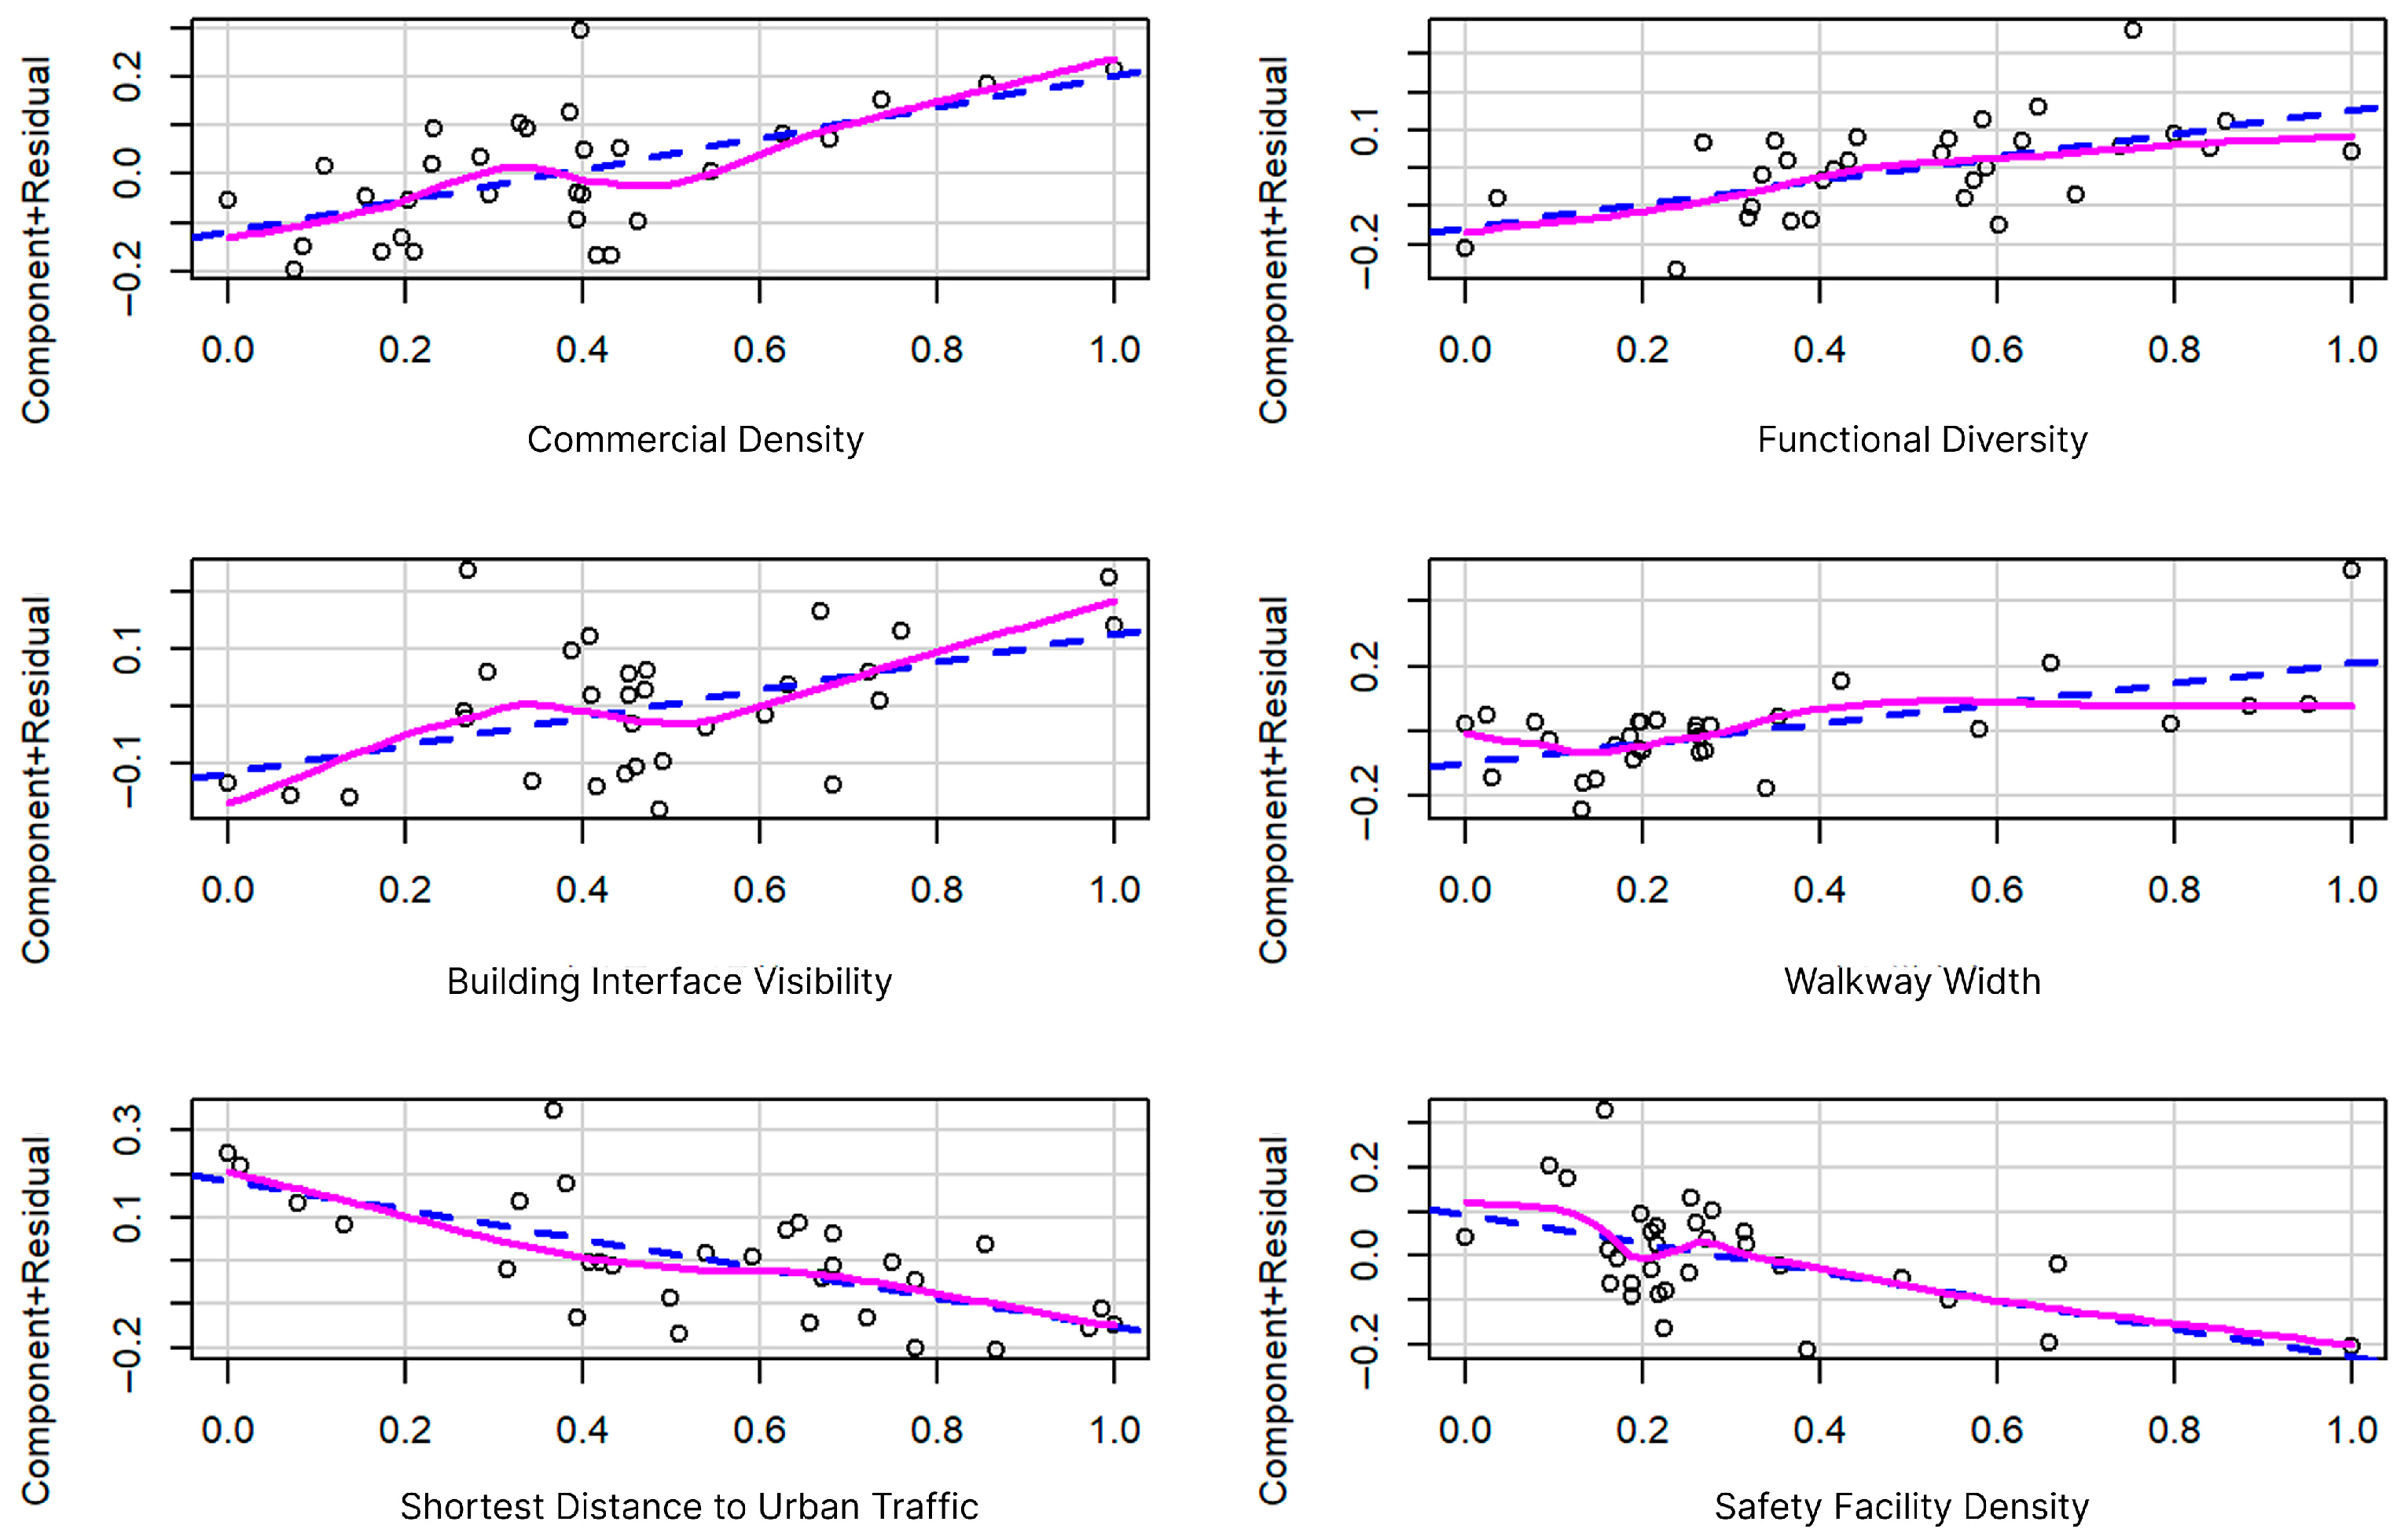
| 3 | 0.891 | 0.794 | 0.743 | 15.462 *** | 2.242 | −0.053 |
| B | Std. Error | Beta | t | Significance | Tolerance | VIF | |
|---|---|---|---|---|---|---|---|
| (Constant) | 0.158 | 0.078 | — | 2.023 | 0.054 | — | — |
| Commercial Density | 0.318 | 0.11 | 0.326 | 2.905 | 0.008 | 0.68 | 1.471 |
| Functional Diversity | 0.308 | 0.123 | 0.316 | 2.495 | 0.02 | 0.534 | 1.873 |
| Building Interface Visibility | 0.241 | 0.096 | 0.247 | 2.497 | 0.02 | 0.875 | 1.142 |
| Walkway Width | 0.306 | 0.091 | 0.372 | 3.364 | 0.003 | 0.7 | 1.429 |
| Shortest Distance to Public Transport | −0.334 | 0.081 | −0.408 | −4.136 | <0.001 | 0.881 | 1.135 |
| Safety Facility Density | −0.322 | 0.108 | −0.286 | −2.979 | 0.007 | 0.928 | 1.078 |
| Model | R | R2 | Adjusted R2 | F | Durbin-Watson (DW) | Moran’s I |
|---|---|---|---|---|---|---|
| 4 | 0.884 | 0.781 | 0.737 | 17.791 *** | 1.711 | 0.125 |
| B | Std. Error | Beta | t | Significance | Tolerance | VIF | |
|---|---|---|---|---|---|---|---|
| (Constant) | 0.386 | 0.092 | 4.196 | <0.001 | |||
| Vehicular Lane Width | −0.248 | 0.078 | −0.384 | −3.192 | 0.004 | 0.608 | 1.645 |
| Walkway Width | 0.484 | 0.133 | 0.503 | 3.627 | 0.001 | 0.456 | 2.194 |
| Public Service Facility Density | 0.081 | 0.126 | 0.071 | 0.638 | 0.529 | 0.708 | 1.412 |
| Green View Index (GVI) | 0.327 | 0.122 | 0.258 | 2.691 | 0.013 | 0.954 | 1.048 |
| Sky View Factor (SVF) | −0.154 | 0.086 | −0.175 | −1.8 | 0.084 | 0.929 | 1.076 |
| Model | R | R2 | Adjusted R2 | F | Durbin-Watson (DW) | Moran’s I |
|---|---|---|---|---|---|---|
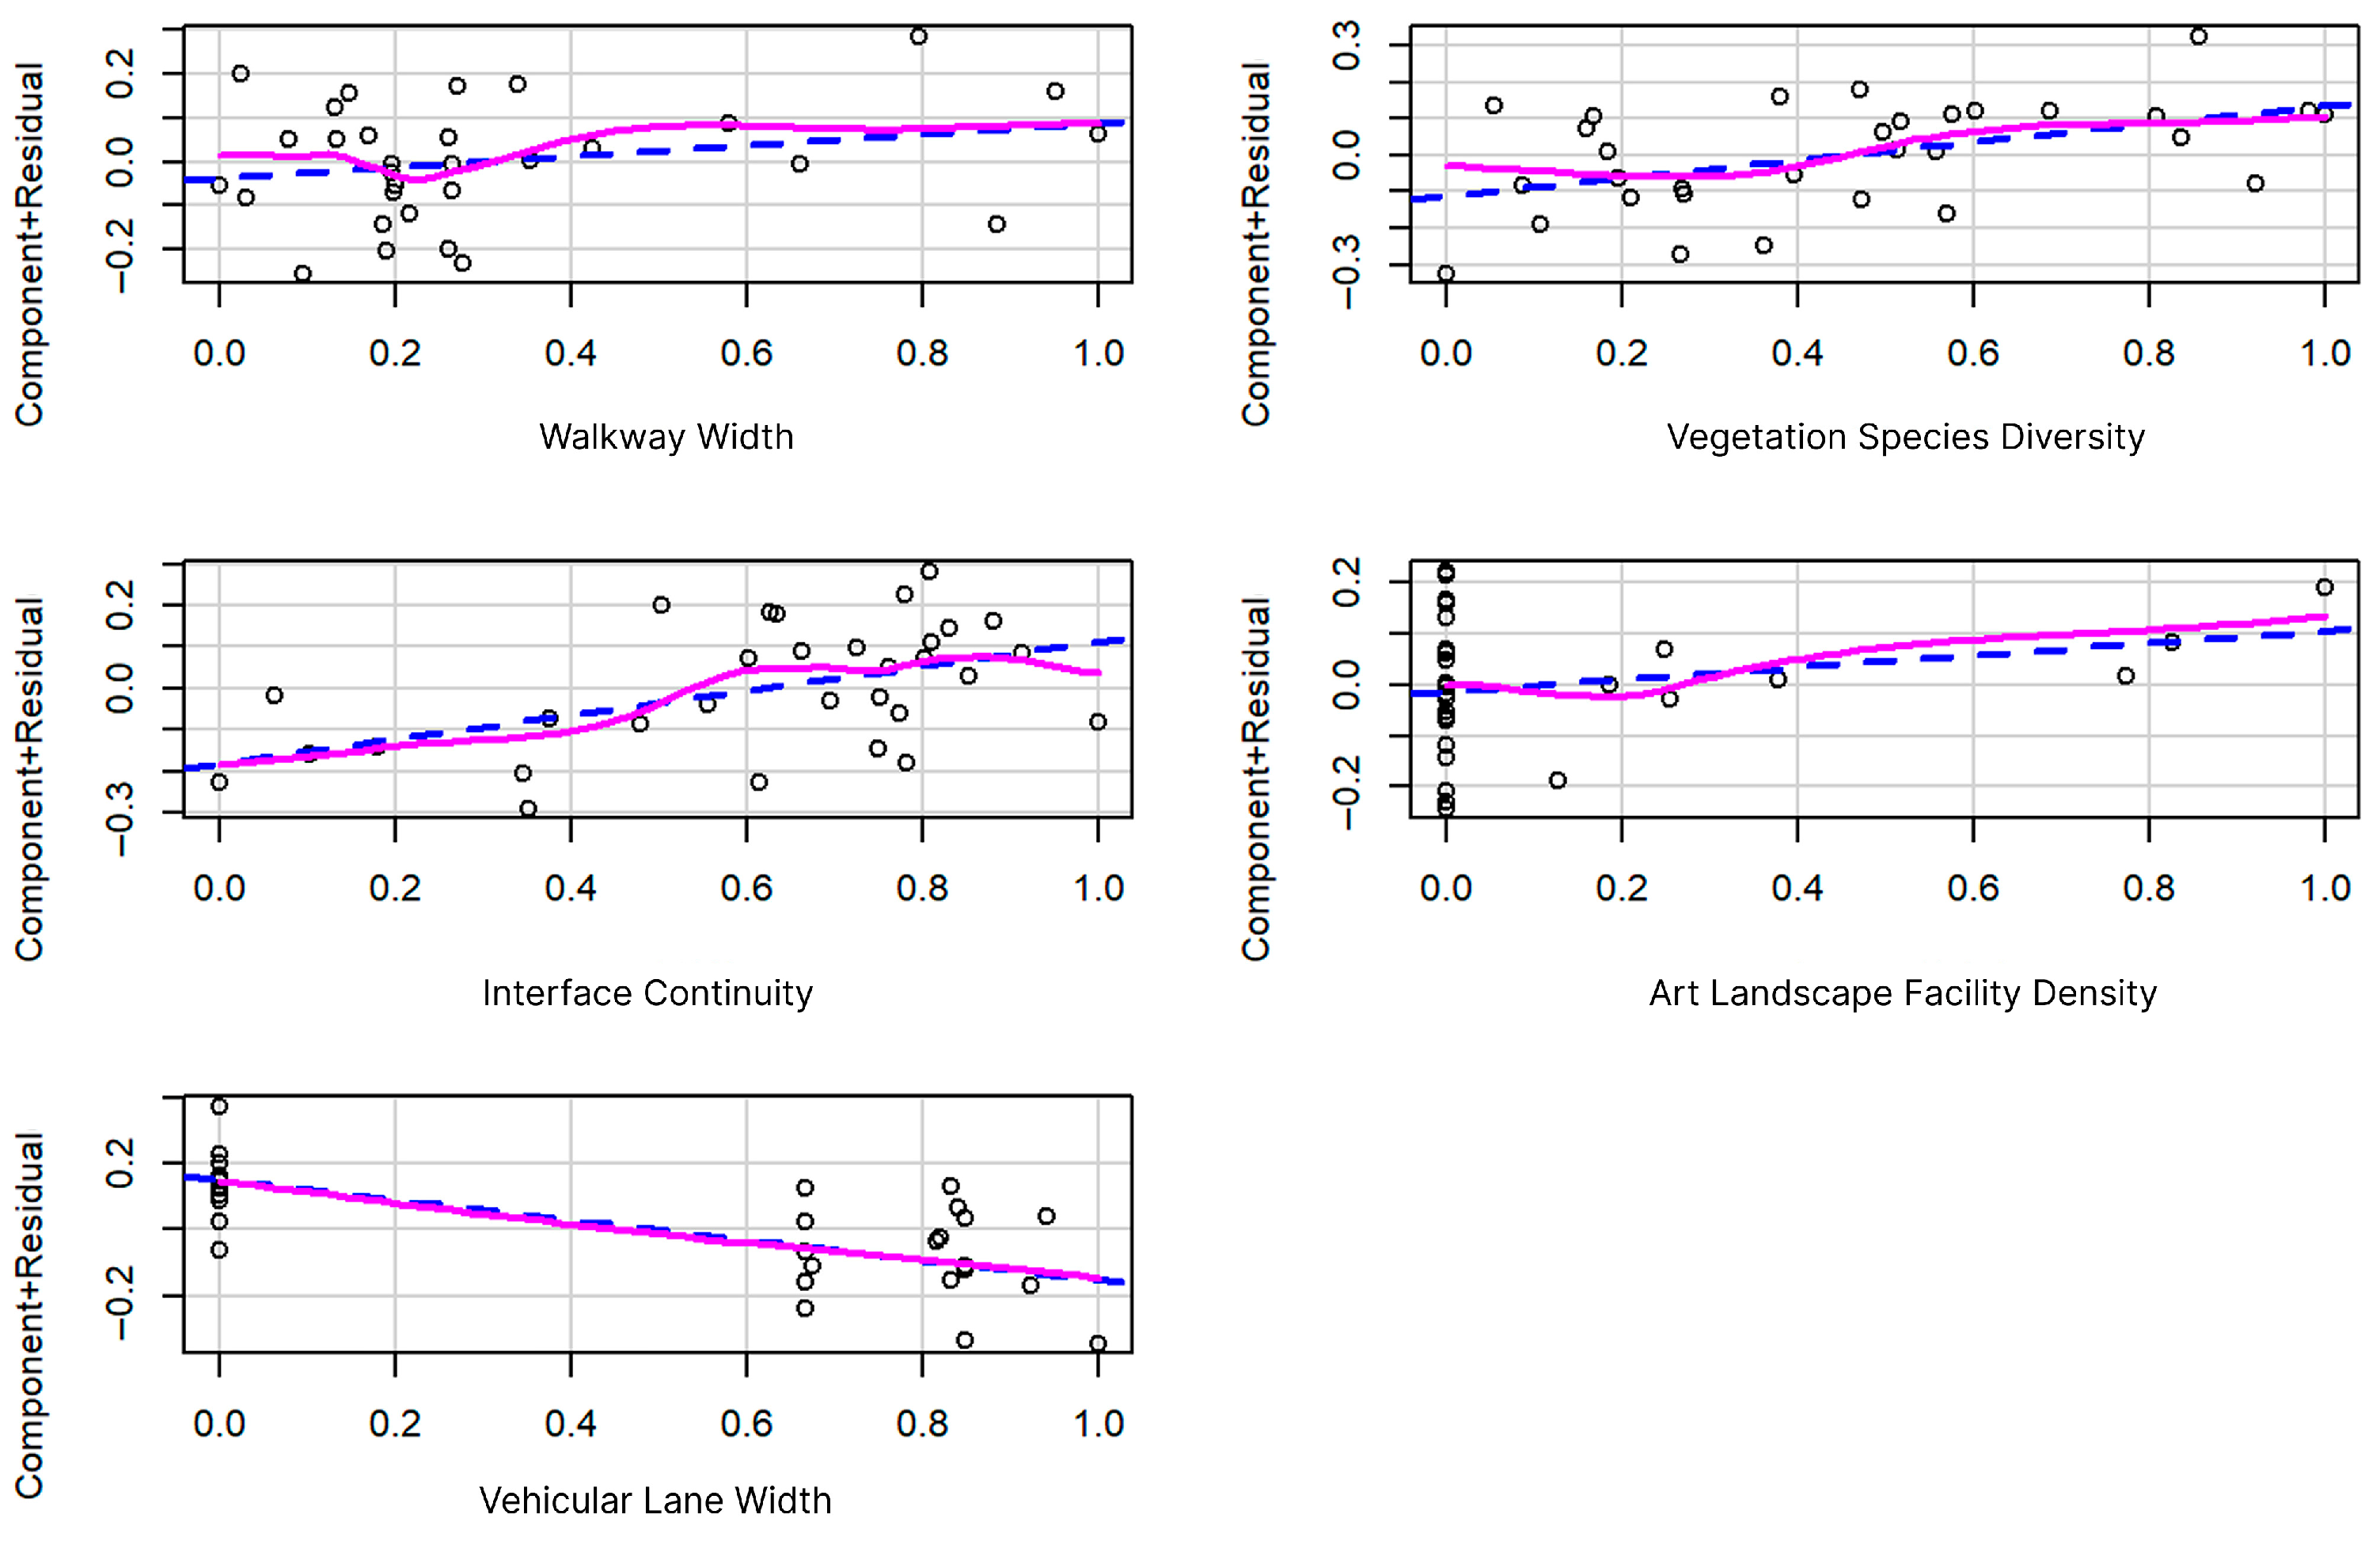
| 5 | 0.853 | 0.727 | 0.672 | 13.3 *** | 2.599 | −0.142 |
| B | Std. Error | Beta | t | Significance | Tolerance | VIF | |
|---|---|---|---|---|---|---|---|
| (Constant) | 0.228 | 0.105 | 2.177 | 0.039 | |||
| Walkway Width | 0.124 | 0.126 | 0.135 | 0.983 | 0.335 | 0.58 | 1.723 |
| Vegetation Species Diversity | 0.247 | 0.095 | 0.282 | 2.604 | 0.015 | 0.93 | 1.075 |
| Interface Continuity | 0.292 | 0.105 | 0.305 | 2.79 | 0.01 | 0.914 | 1.094 |
| Art Landscape Facility Density | 0.12 | 0.117 | 0.128 | 1.026 | 0.315 | 0.706 | 1.416 |
| Vehicular Lane Width | −0.303 | 0.086 | −0.491 | −3.514 | 0.002 | 0.56 | 1.786 |
| Design Principle | Key Spatial Predictors | Promoted Behaviors | Specific Design Guidelines | Applicable Contexts & Generalizability |
|---|---|---|---|---|
| Pedestrian Priority & Spatial Generosity | Walkway Width, Vehicular Lane Width | All behaviors (Dominant in Leisure & Movement) | Prioritize pedestrian right-of-way by expanding sidewalks and compressing vehicular lanes. Minimize physical barriers and traffic-related psychological deterrence to ensure safety and comfort. | Universal: Highly applicable to almost all urban street optimization contexts globally. |
| Interface Permeability & Visual Interaction | Building Interface Visibility, Interface Continuity | Effective Stay, Consumption, Viewing | Maximize ground-level façade transparency (e.g., continuous glass storefronts or arcades). Avoid extensive blank walls to foster indoor–outdoor visual interaction and perceived safety. | Universal: Foundational for commercial streets, mixed-use neighborhoods, and historical districts. |
| Amenity & Cultural Enrichment (Based on Art Landscape Facilities) | Art Landscape Facility Density | Effective Stay, Viewing | Deploy culturally resonant sculptures, aesthetic installations, and integrated seating to create localized visual anchors that encourage pedestrians to linger and observe. | Context-Specific: Highly applicable to historical, cultural, and tourism-oriented districts (like Shamian Island) or urban plazas; less relevant for pure transit corridors. |
| Micro-Functional Density & Diversity | Commercial Density, Functional Density, Functional Diversity | Movement, Consumption | Maintain a fine-grained layout with diverse micro-commercial formats. Concentrate retail and service amenities to shorten destination distances and stimulate spontaneous purchasing. | Context-Specific: Most effective in dense urban cores, commercial pedestrian zones, and tourist streets; less applicable to low-density residential areas. |
| Biophilic Design & Environmental Comfort | Green View Index (GVI), Vegetation Species Diversity, Sky View Factor (SVF) | Leisure, Viewing, Movement | Integrate diverse, multi-layered vegetation species to provide psychological restoration and visual texture. Balance tree canopy coverage with sufficient Sky View Factor (SVF) to ensure daylighting and spatial openness. | Universal: A foundational requirement for creating high-quality, comfortable human-scale pedestrian environments. |
Disclaimer/Publisher’s Note: The statements, opinions and data contained in all publications are solely those of the individual author(s) and contributor(s) and not of MDPI and/or the editor(s). MDPI and/or the editor(s) disclaim responsibility for any injury to people or property resulting from any ideas, methods, instructions or products referred to in the content. |
© 2026 by the authors. Licensee MDPI, Basel, Switzerland. This article is an open access article distributed under the terms and conditions of the Creative Commons Attribution (CC BY) license.
Share and Cite
Xiang, K.; Liang, Z.; Ouyang, Y.; Xiang, S.; Lucchi, E. The Influence of Spatial Characteristics on Crowd Behaviors: A Behavioral Proxy Approach for Street Quality Assessment. Buildings 2026, 16, 1584. https://doi.org/10.3390/buildings16081584
Xiang K, Liang Z, Ouyang Y, Xiang S, Lucchi E. The Influence of Spatial Characteristics on Crowd Behaviors: A Behavioral Proxy Approach for Street Quality Assessment. Buildings. 2026; 16(8):1584. https://doi.org/10.3390/buildings16081584
Chicago/Turabian StyleXiang, Ke, Zhuoyue Liang, Yiyu Ouyang, Shuyin Xiang, and Elena Lucchi. 2026. "The Influence of Spatial Characteristics on Crowd Behaviors: A Behavioral Proxy Approach for Street Quality Assessment" Buildings 16, no. 8: 1584. https://doi.org/10.3390/buildings16081584
APA StyleXiang, K., Liang, Z., Ouyang, Y., Xiang, S., & Lucchi, E. (2026). The Influence of Spatial Characteristics on Crowd Behaviors: A Behavioral Proxy Approach for Street Quality Assessment. Buildings, 16(8), 1584. https://doi.org/10.3390/buildings16081584