Article

Structural Behaviour of Aluminium Alloy Angle Sections After Elevated Temperatures

1
School of Civil Engineering, Chongqing University, Chongqing 400045, China
2
School of Management Science and Real Estate, Chongqing University, Chongqing 400045, China
3
Department of Civil Engineering, The University of Hong Kong, Hong Kong, China
4
State Key Laboratory of Safety and Resilience of Civil Engineering in Mountain Area, Chongqing 400045, China
*
Author to whom correspondence should be addressed.
Buildings 2026, 16(8), 1565; https://doi.org/10.3390/buildings16081565
Submission received: 12 March 2026 / Revised: 1 April 2026 / Accepted: 13 April 2026 / Published: 16 April 2026
(This article belongs to the Section Building Materials, and Repair & Renovation)

Abstract

This study investigated the post-fire resistances of 6063-T5 aluminium alloy angle section stub columns (SCs). The post-fire mechanical properties of 6063-T5 aluminium alloy were assessed using tensile coupon tests. Instead of exhibiting a yield plateau, the stress–strain curves indicated a shift from an elastic to a strain-hardening phase. The impacts of elevated-temperature exposure on the residual elastic modulus were negligible. Strength properties decreased while ductile properties increased within the elevated-temperature range of 200 to 450 °C, with a subsequent strength increase observed beyond 450 °C. After the SC tests, gradual decreases in ultimate resistance were observed within 200–450 °C, followed by an increase beyond 450–500 °C. These trends in the ultimate resistance closely paralleled those strength characteristics observed in the stress–strain curves. As regards the failure mode, all specimens experienced local buckling after exposure to the range of elevated temperatures. The failure mode, ultimate resistance, and load–end shortening curve were used to evaluate a numerical modelling approach that was created to simulate the residual resistance of SCs after exposure to different elevated temperatures was applied. The EC9, ADM-2020, AS/NZS 1664, and GB 50429-2007 were among the design approaches that were evaluated using the experimental and numerical data. Due to the increased strain-hardening behaviour caused by elevated temperatures, the existing design methods proved excessively conservative when applied to the direct prediction of ultimate resistances of 6063-T5 aluminium alloy angle section SCs. The modified design provisions in light of the observed post-fire strain-hardening behaviour improved the accuracy in predicting the residual bearing capacity of 6063-T5 aluminium alloy angle section SCs, which showed better agreement with test and numerical results, offering enhanced applicability for post-fire design.

1. Introduction

Aluminium alloy is becoming more and more popular in building structures because of the exceptional corrosion resistance, recyclability, and high strength-to-weight ratio [1]. Aluminium alloy components formed by extrusion are widely used in structures servicing corrosive environments, such as angles, channels, and hollow sections. Investigations have been conducted on aluminium alloy stub columns (SCs) with different cross-sections, encompassing hollow sections [2,3], channel sections [4], and I-sections [5]. The suitability of the design methodologies described in the current standards was examined in these investigations. Mazzolani et al. [6] performed many experimental investigations on aluminium alloy angle sections exposed to local buckling to assess the precision of the current design regulations. Wang et al. [7] experimentally and numerically investigated the axial-compression behaviour of 7A04 high-strength aluminium alloy angle columns and demonstrated that existing design methods could not always accurately predict their buckling resistance, prompting the development of a modified design approach. Evangelia et al. [8] provided numerical evidence on the local buckling response and strength of aluminium alloy angle SCs, and showed that the accuracy of existing design methods could be further improved. Nevertheless, the study did not consider behaviour after fire exposure. Su et al. [9] gathered a large amount of test and simulation data on various sections of different members in order to evaluate the slenderness limits in current aluminium alloy design codes. Zhou et al. [10,11] further investigated aluminium alloy columns in composite forms and showed that the structural response and strength were influenced by geometric parameters and concrete strength. However, the extant investigations into aluminium alloy materials, members, and structures have predominantly focused on ambient-temperature conditions. Notably, studies focusing on aluminium alloy members and structures under post-fire conditions have been scarce.
Fire safety remains a paramount concern for metal structures because the elevated temperatures during fires can significantly weaken the mechanical properties of structural alloys [12,13,14]. Understanding the residual capacity of structures following fire exposure, particularly in cases where collapse does not occur, is crucial for post-fire service performance evaluations [15,16,17]. Research on the post-fire mechanical properties of structural steels has garnered considerable attention [18,19]. As regards aluminium alloys, Liu et al. [20] and Chen et al. [21] investigated the post-fire mechanical properties of various grades of aluminium alloys by considering different cooling methods. These scholars devised predictive equations to assess residual mechanical properties, considering the effects of cooling methods and elevated temperatures. Wang et al. [22] studied the residual factors and a two-stage Ramberg–Osgood material model through experimental studies on a heated 7A04-T6 aluminium alloy subject to cooling. Furthermore, Sun et al. [23] studied the mechanical properties of 6063-T5 aluminium alloy after fire exposure, revealing the impacts of the elevated temperatures on key mechanical parameters. Zhong et al. [15,24] examined the post-fire compression behaviour and load-bearing capacity of S700 SCs with rectangular and circular hollow sections via experiments and numerical simulations. Zuo et al. [25] investigated post-fire cold-formed elliptical hollow sections and devised modified design approaches for ultimate resistance. He et al. [26] performed a test involving 16 austenitic stainless-steel circular hollow-section SCs in order to evaluate the applicability of established design approaches for post-fire stainless-steel structures. As regards aluminium alloy SCs, Sun et al. [27] studied the post-fire compressive behaviour of aluminium alloy channel-section SCs and showed that existing design rules were overly conservative because they did not properly account for post-fire strain-hardening. However, studies focusing on the post-fire load-bearing capacity of aluminium alloy angle section SCs are lacking.
On the basis of clarifying the bearing performance of SCs, the bearing performance of slender columns could be revealed by considering the influence of overall buckling. Therefore, the post-fire load-bearing capacity of SCs is the key foundation to assess the post-fire serviceability of aluminium alloy structures after fire exposure. In this context, the present study investigates the post-fire compressive behaviour of 6063-T5 aluminium alloy angle section SCs through experimental and numerical analyses with different geometric dimensions and elevated temperatures.

2. Experimental and Numerical Methods

2.1. Test Specimen Preparation

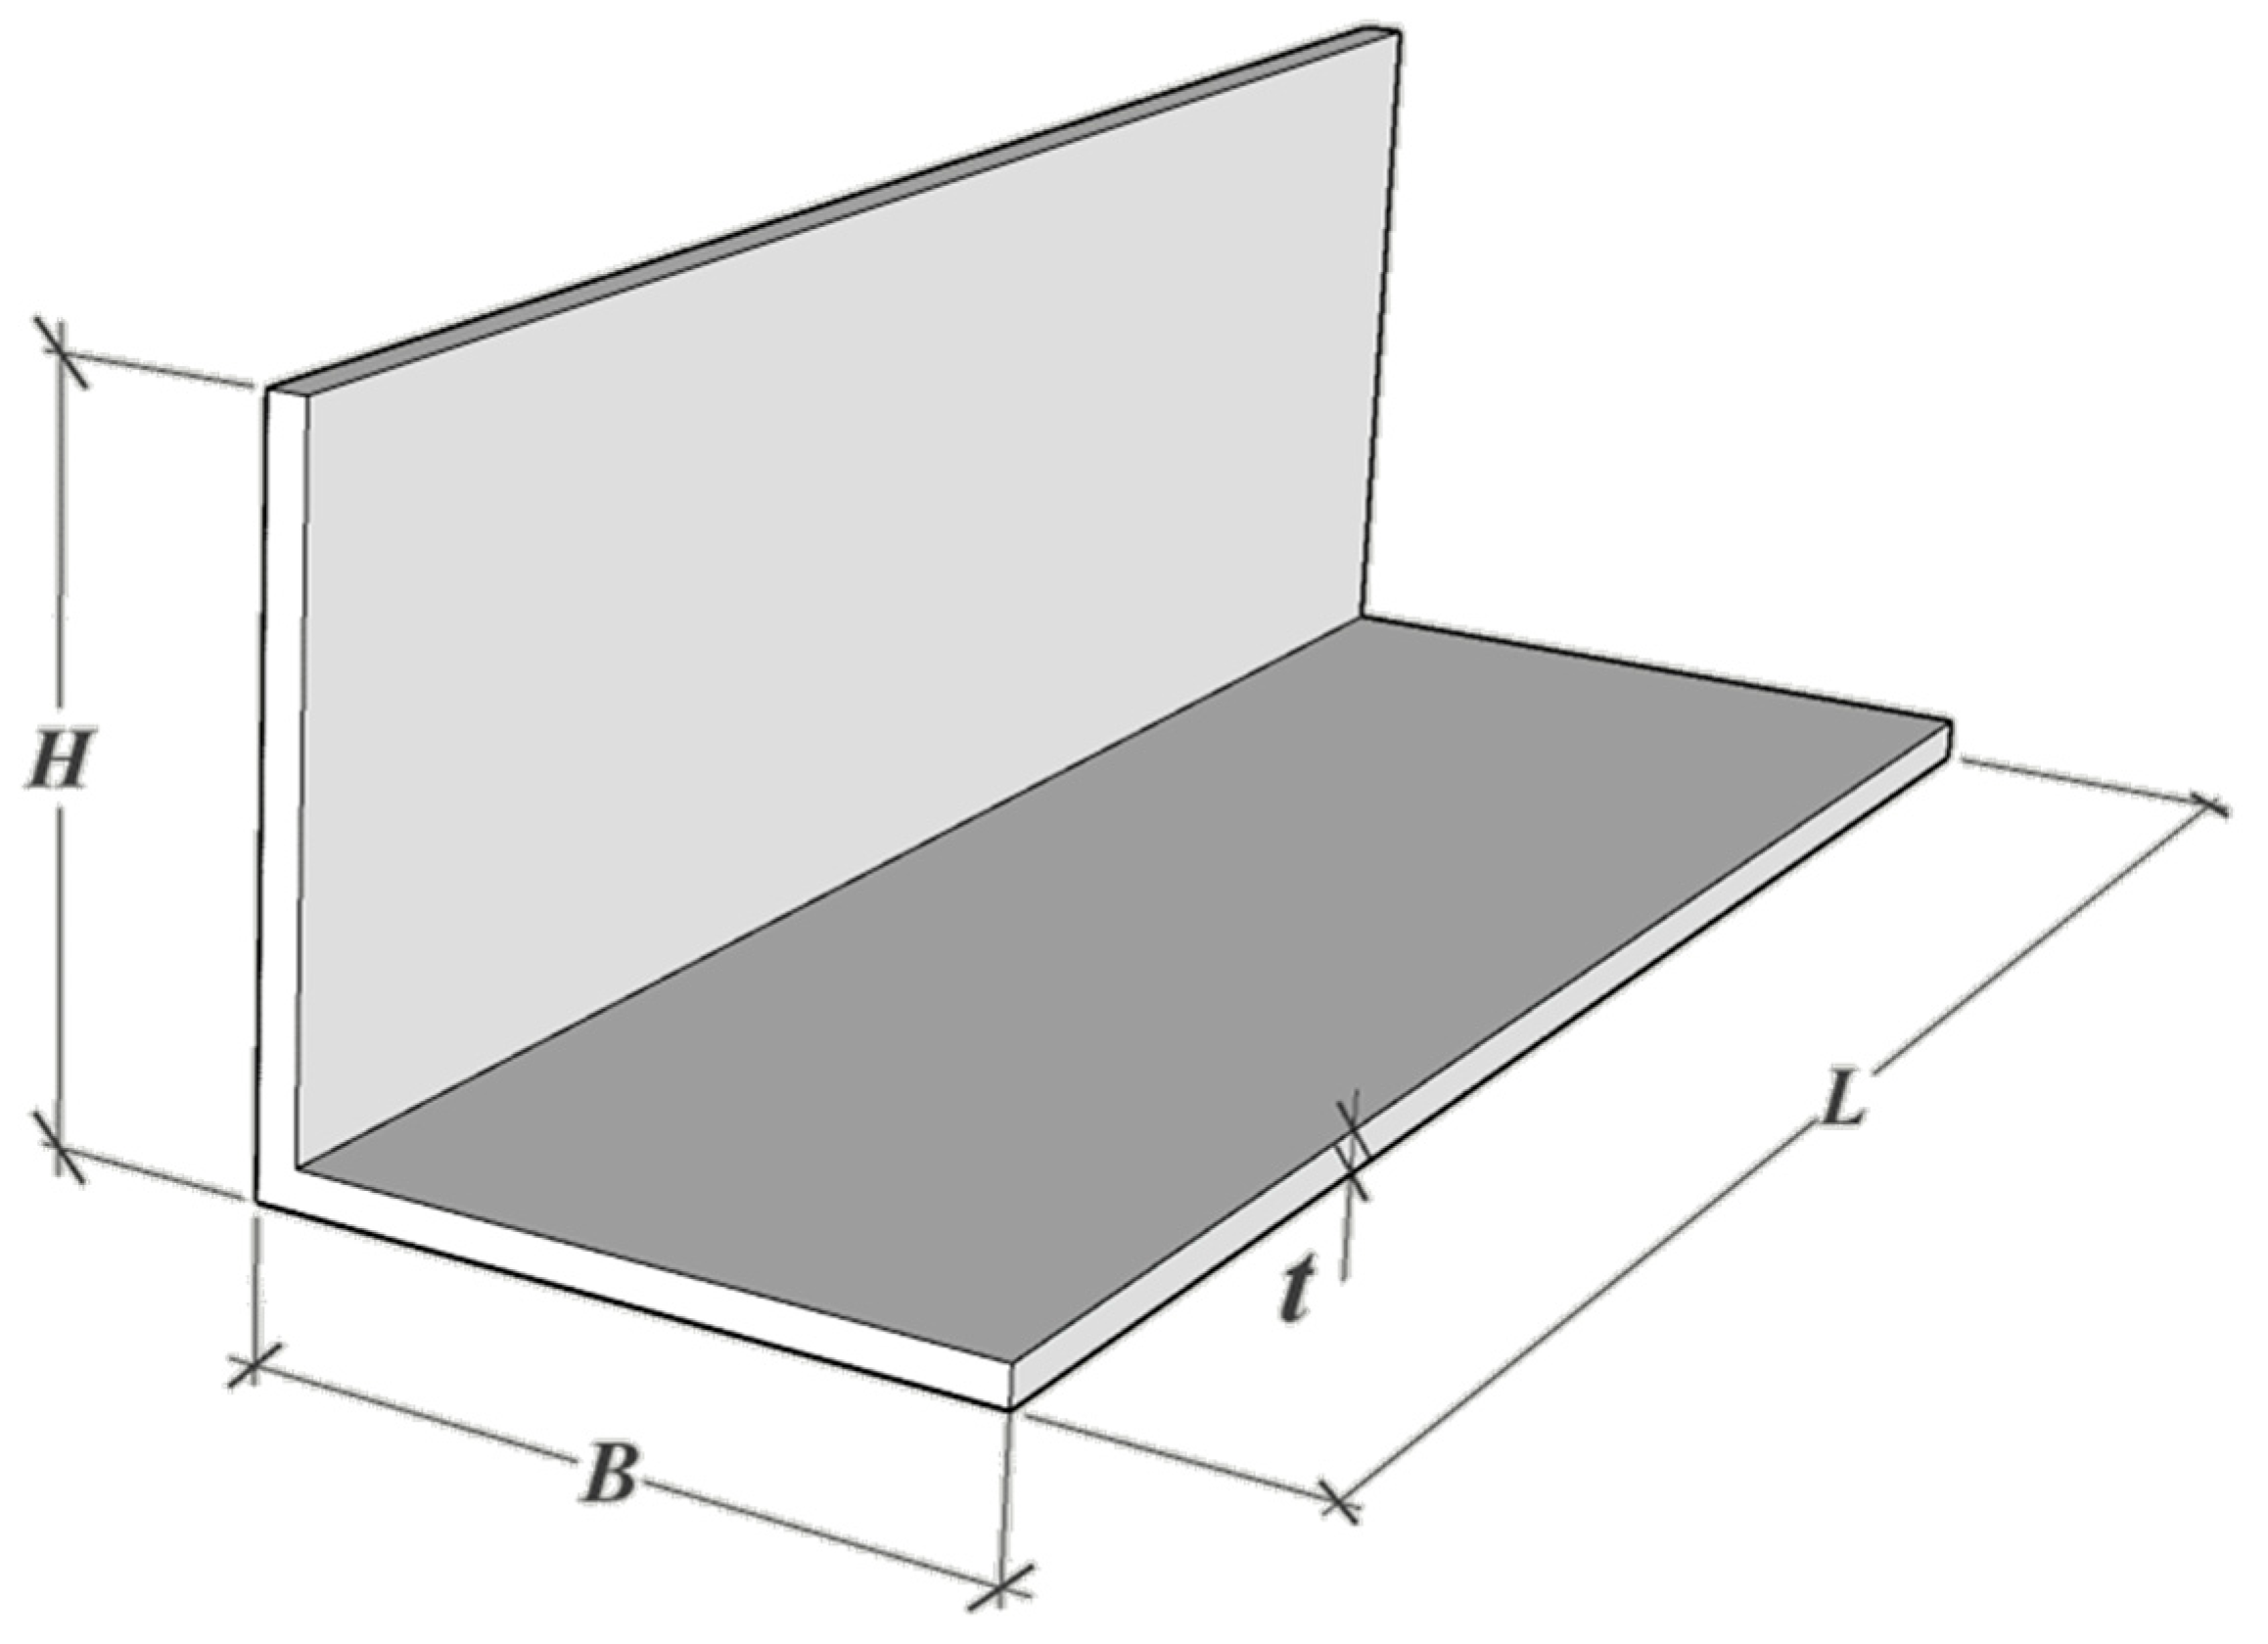
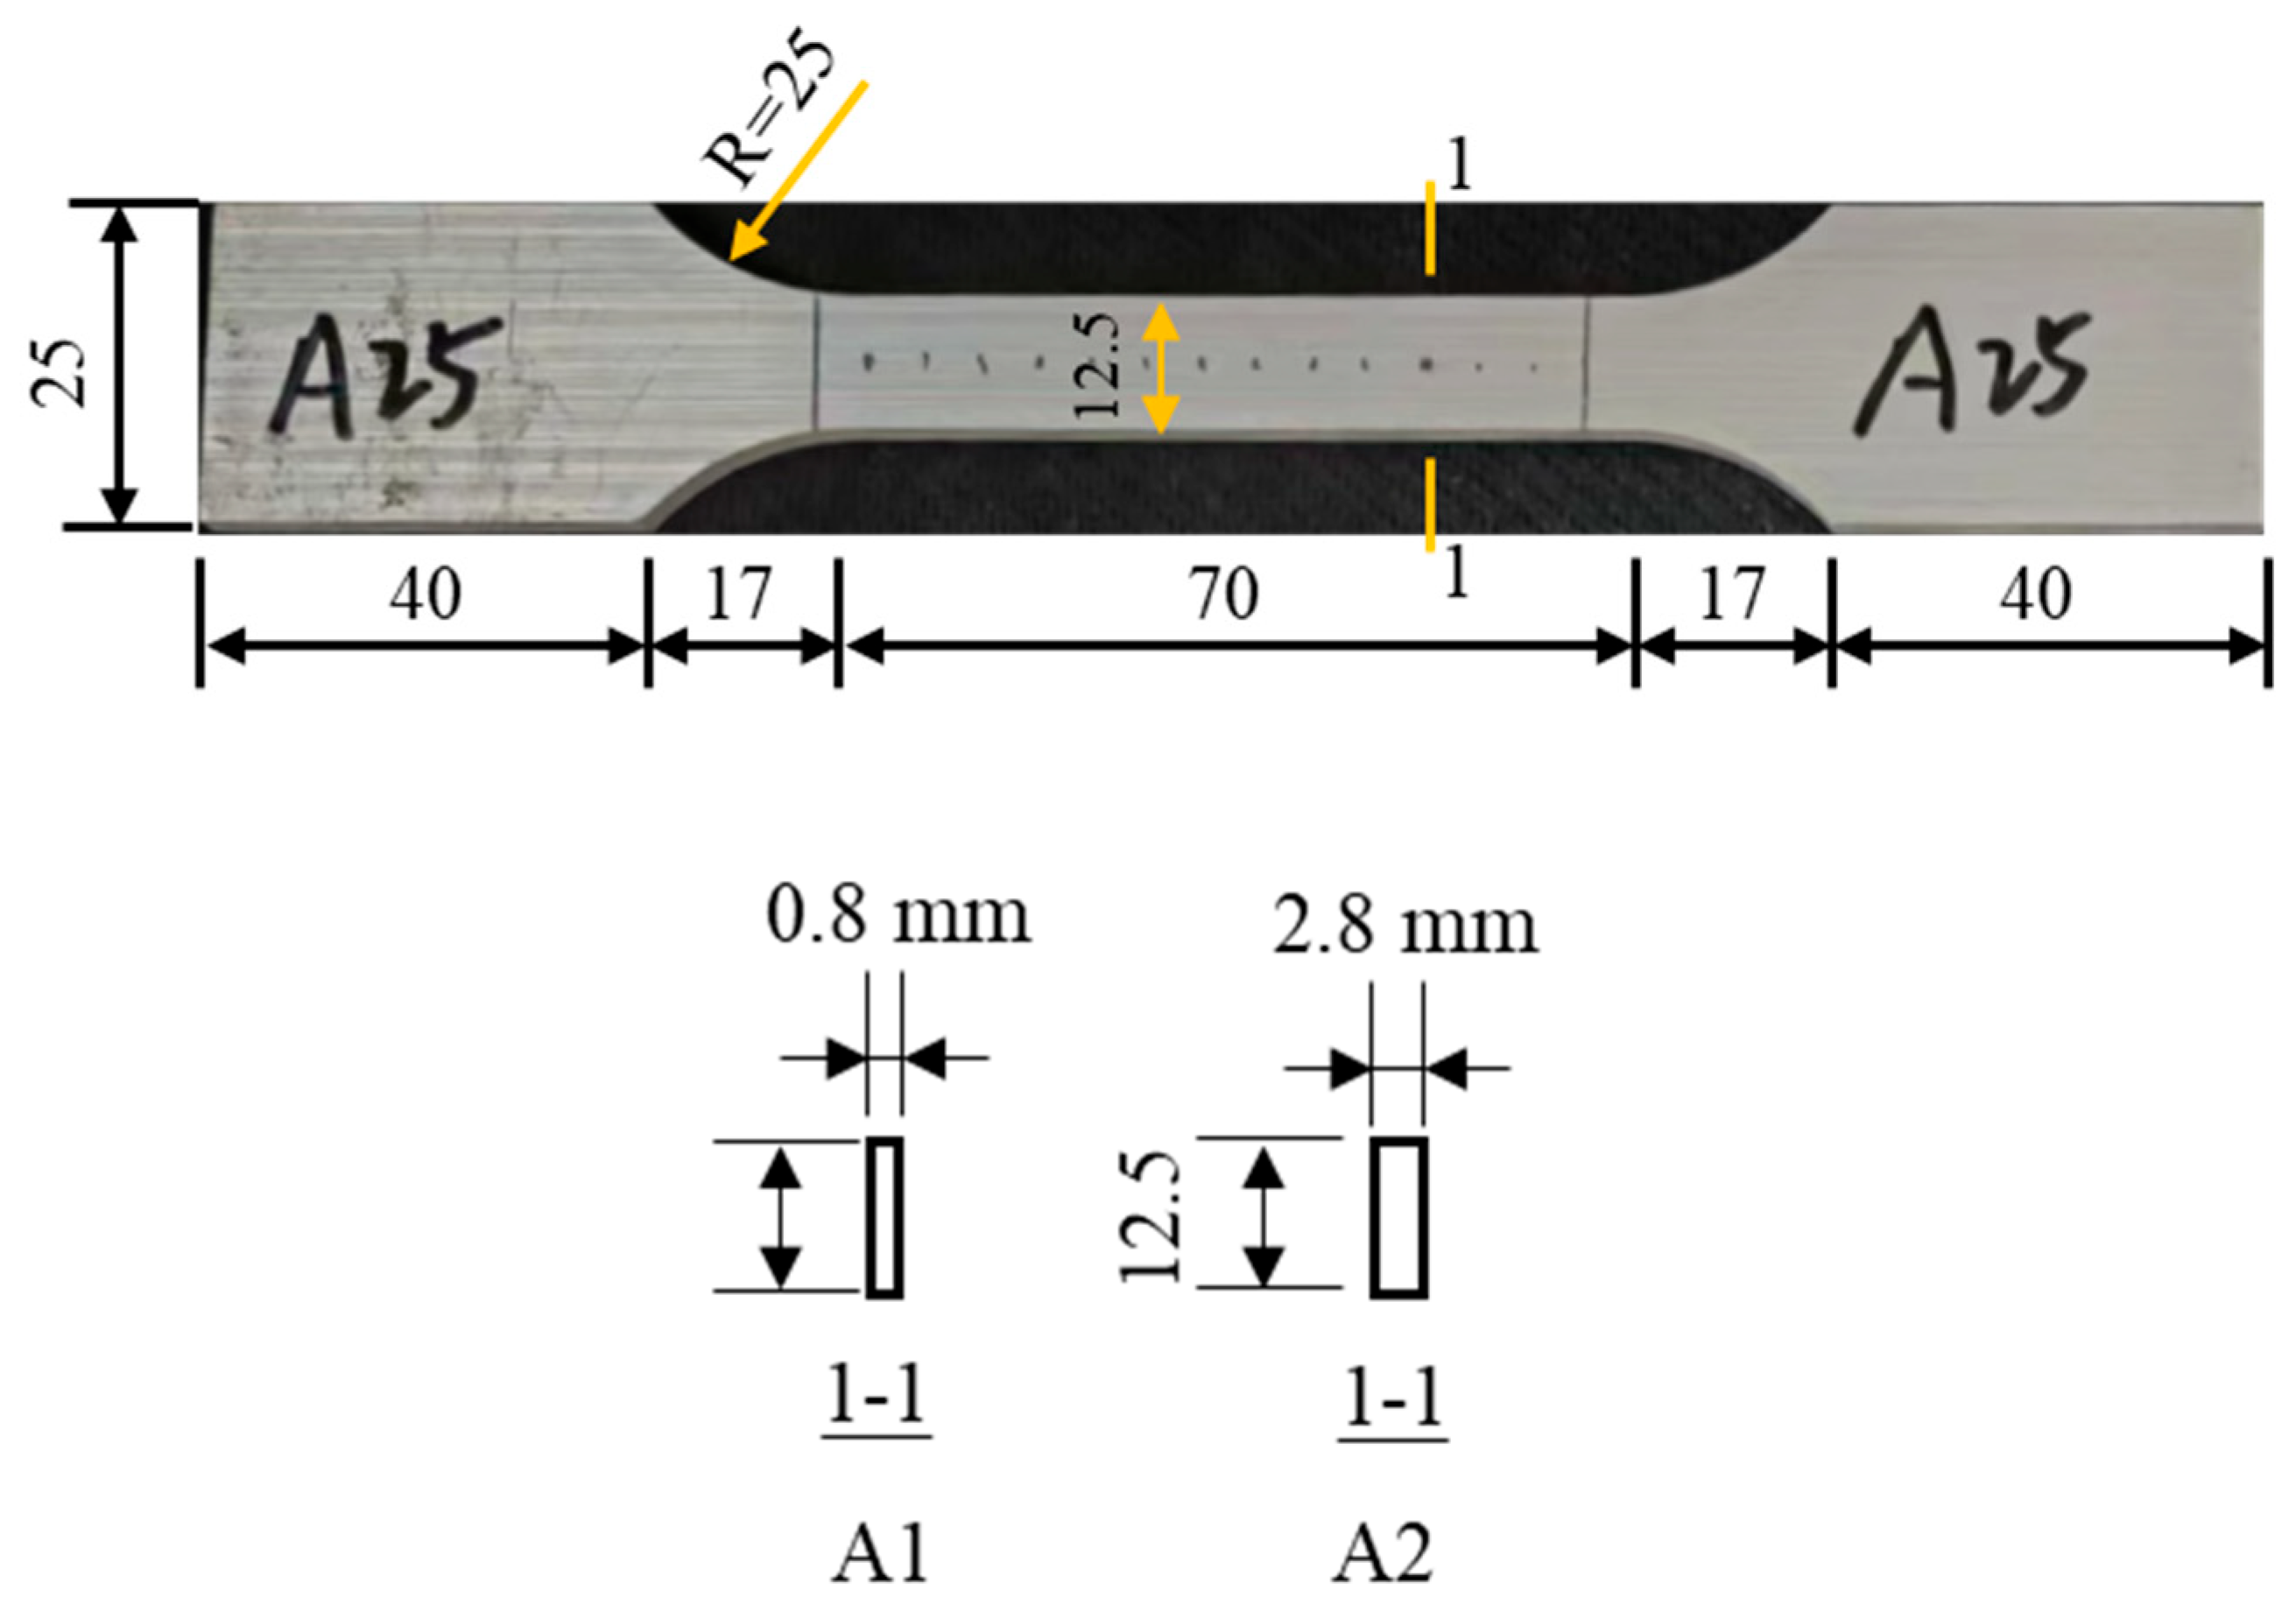
To examine the post-fire capacity of the 6063-T5 aluminium alloy angle section SCs, a tensile coupon test on the aluminium alloy specimen and an axial-compressive-loading process on the angle section SCs were performed. For the 6063-T5 aluminium alloy angle section SC specimens, the geometric cross-section is shown in Figure 1. The dimensions are listed in Table 1. The length L of the SC is 3B. The primary purpose of the axial-compressive-loading test on SCs is to determine their cross-sectional bearing capacity, which provides a critical foundation for predicting the bearing capacity of slender columns. Table 2 shows the chemical composition of the aluminium alloy specimens in this study. For the design approach in EC9 [28], four classes of cross-sections were considered. For Classes 1, 2, and 3 (non-slender), the yield loading of the cross-section could be achieved. For Class 4 (slender), local buckling occurred before attaining the yield loading. To comprehensively investigate the post-fire resistant capacity of the angle section SCs, the two different slender cross-sections, presented in Table 1, were considered. It should be noted that Class 4 aluminium alloy angle sections were selected in the present study because they are more susceptible to local buckling, which governs their structural response. Therefore, the conclusions drawn herein are mainly applicable to slender sections. The same batch of 6063-T5 aluminium alloy extrusions was used to prepare the angle section SC specimens. Thus, for SCs with the same cross-sections, the material properties were considered to be the same. Hence, elevated-temperature exposure was selected to simulate the impacts of fire. Figure 2 displays the geometry size of the tensile coupon specimens, according to the recommendations in GB/T 228-2021 [29].

2.2. Elevated-Temperature Exposure Treatment

An elevated-temperature exposure process was employed to simulate the effects of fire on 6063-T5 aluminium alloy specimens. The experimental findings reported by Sun et al. [27] suggest that the impacts of elevated temperatures on the post-fire mechanical properties of the 6063-T5 aluminium alloy could be ignored for elevated temperatures that were not higher than 200 °C. The lowest elevated temperature in this study was determined to be 200 °C. There was an evident decrease in the strength characteristics of the 6063-T5 aluminium alloy for elevated temperatures within 200–400 °C. To meticulously examine the post-fire resistant performance of the 6063-T5 aluminium alloy angle section SCs, 250 and 350 °C were included among the elevated temperatures in this study. For the cases of exposure to 500–550 °C, previous test results indicated that the changes among the stress–strain properties for 6063-T5 aluminium alloy were negligible [27]. Accordingly, elevated temperatures of 200, 250, 300, 350, 400, 450, and 500 °C were considered in this study. For each target temperature, two angle section SC specimens and six tensile coupon specimens were prepared, giving a total of 16 aluminium alloy SC specimens and 48 tensile coupon specimens. All specimens were fabricated from the same batch of 6063-T5 aluminium alloy extrusions to ensure material consistency throughout the test programme.
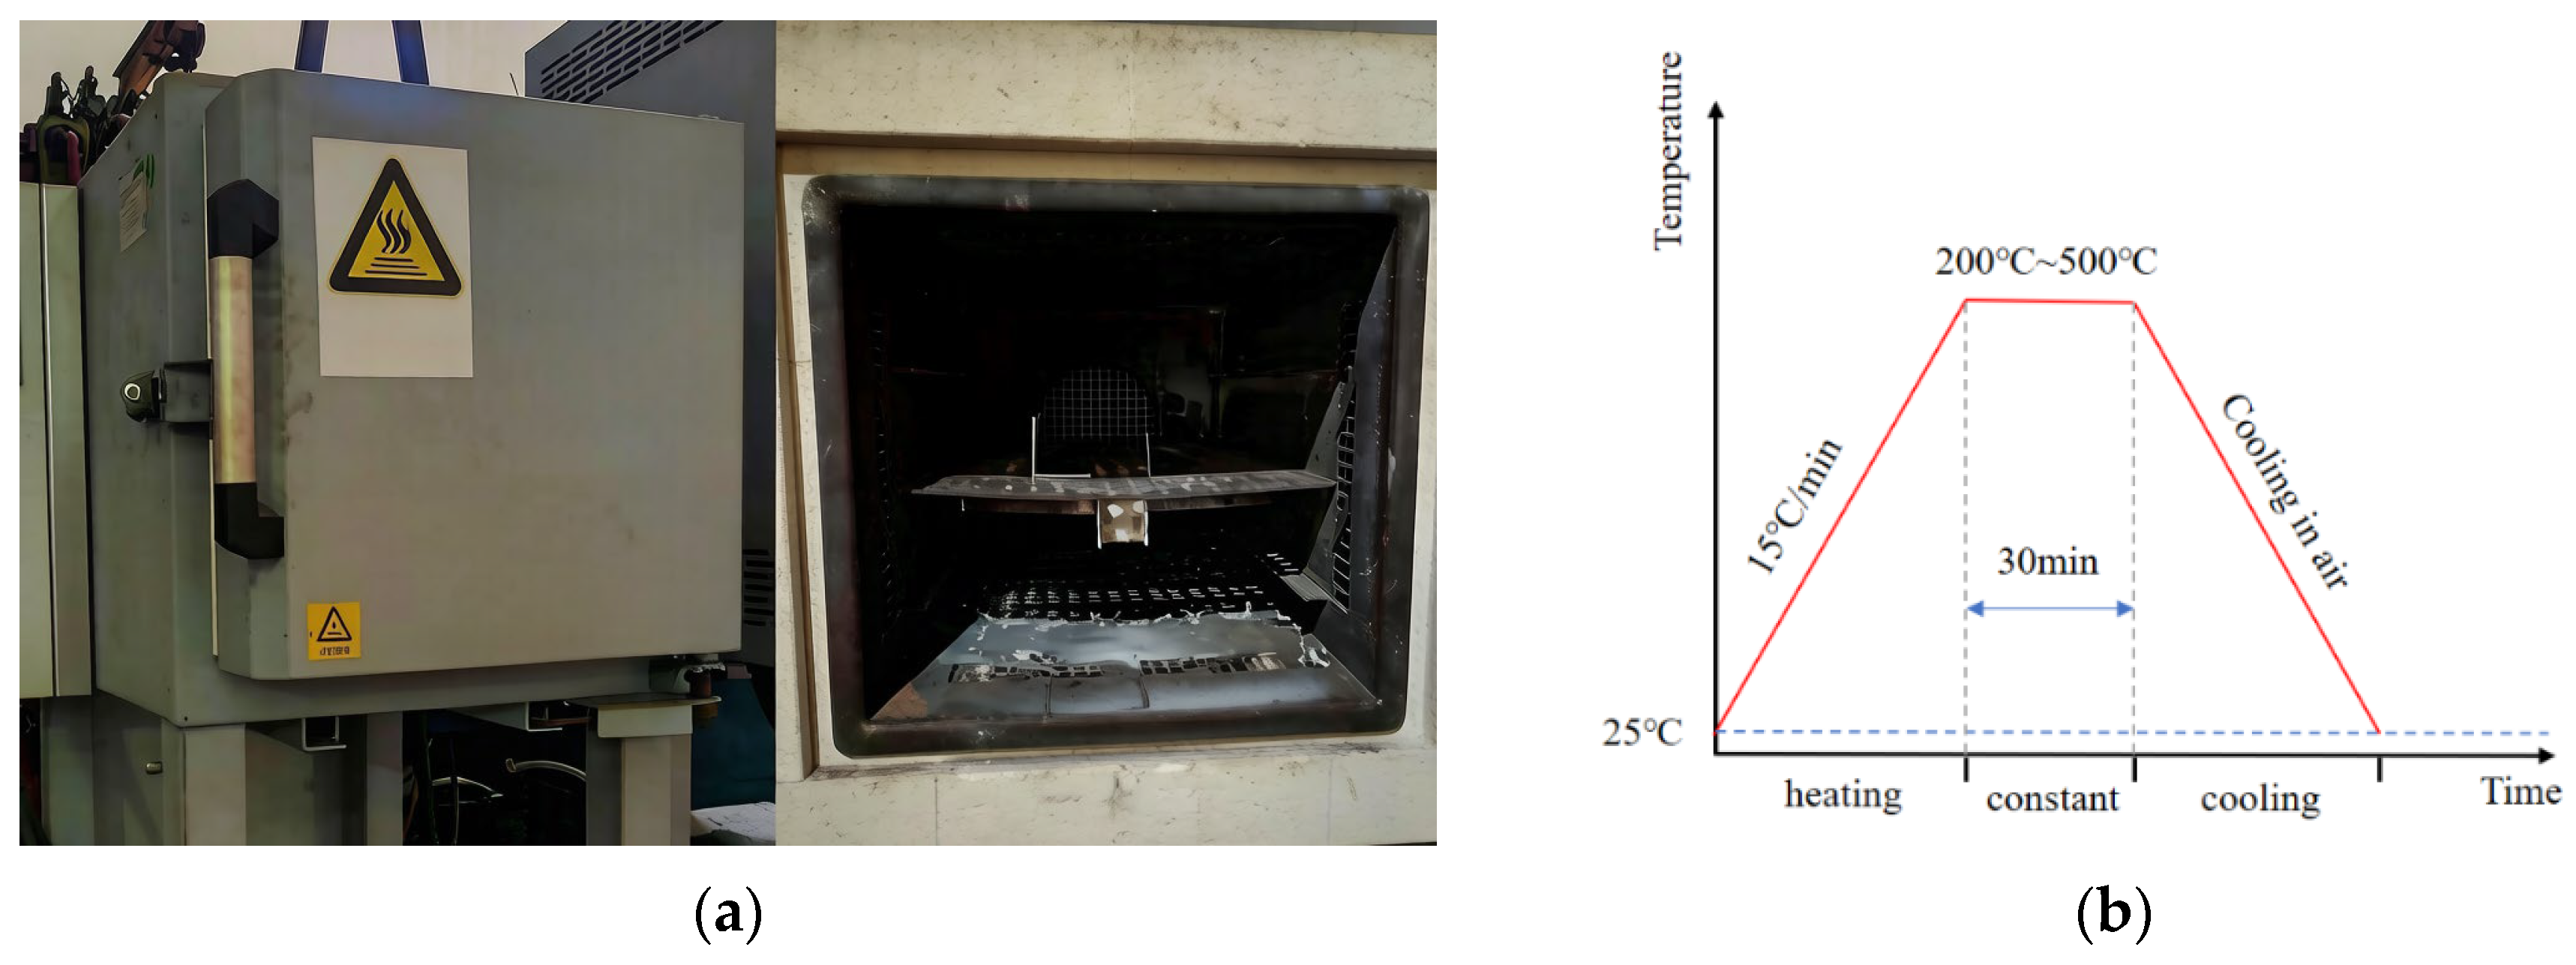
After determining the elevated temperatures, an elevated-temperature exposure treatment was conducted to obtain post-fire SCs and tensile coupons. A N30/85HA (Nabertherm GmbH, Lilienthal, Germany) air circulation box furnace was employed in this experiment (Figure 3). The furnace temperature was increased from ambient temperature to the target temperature at a constant heating rate of 15 °C/min, as this rate can provide a stable temperature increase while ensuring a relatively uniform temperature distribution within the specimens during heating [23]. The tensile coupon and SC specimens were soaked for 30 min after reaching the pre-set elevated temperature to achieve uniform heating. Subsequently, the tensile coupon and SC specimens were removed from the furnace and cooled in an ambient-temperature (25 °C) air environment. This testing methodology has been widely used to investigate post-fire materials and members [30,31].

2.3. Tensile Coupon Test

After the elevated-temperature exposure treatment, a tensile coupon test was performed to quantify the effect of the elevated temperatures on the residual stress–strain responses of the 6063-T5 aluminium alloy specimens with cross-sections A1 and A2 (as shown in Figure 4). A mechanical testing machine (CMT 5305, MTS Industrial Systems (China) Co., Ltd., Shanghai, China) was used to perform the tensile coupon tests. An extensometer with a 50 mm original gauge length was used to record the deformation of the coupon specimen’s test section. The testing machine could provide the requisite tensile loads, and 30 Hz was chosen as the data-gathering frequency. The tensile stress was regulated by displacement at 0.2 mm/min and continued until fracture occurred. Then, by using the experimental results of deformation and tensile loading, the post-fire stress–strain curves of 6063-T5 aluminium alloy were measured.

2.4. Stub Column Test

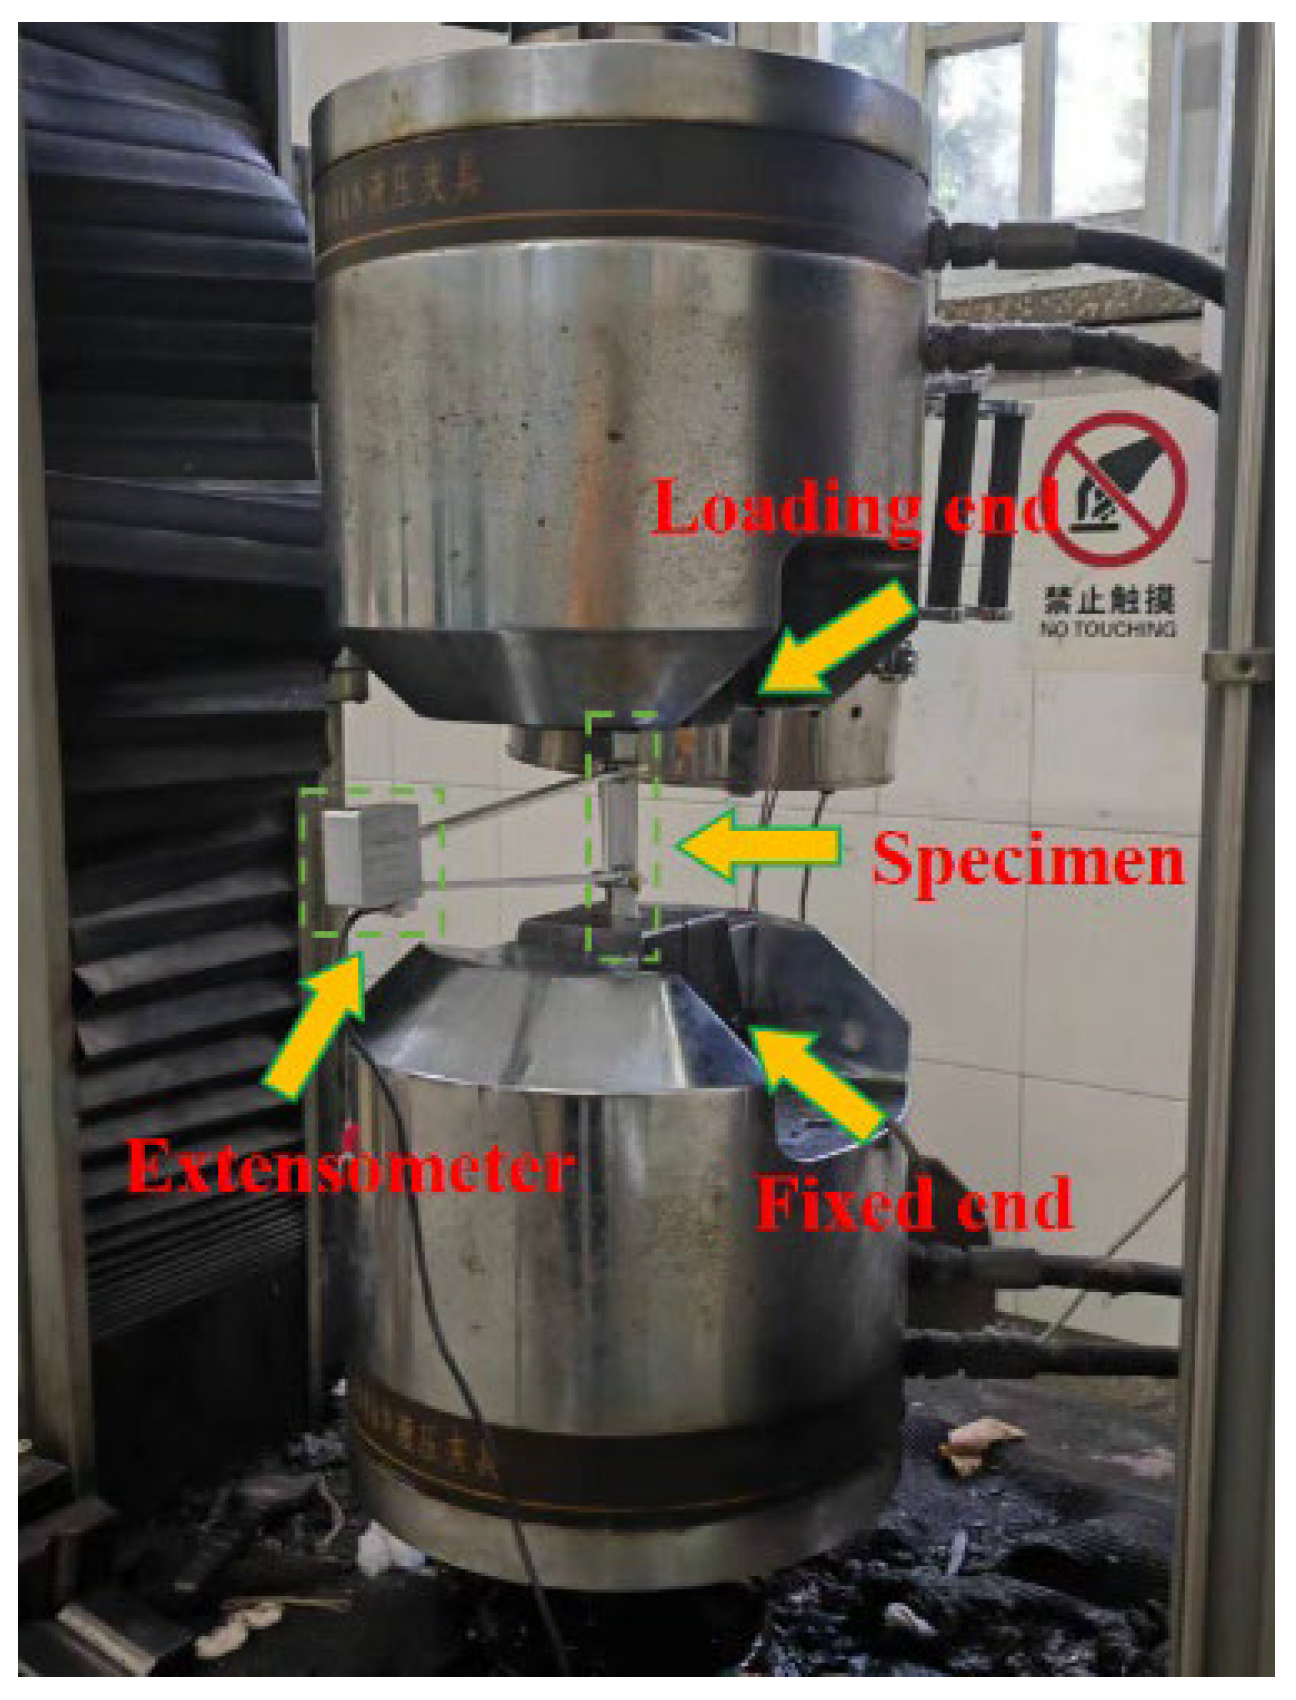
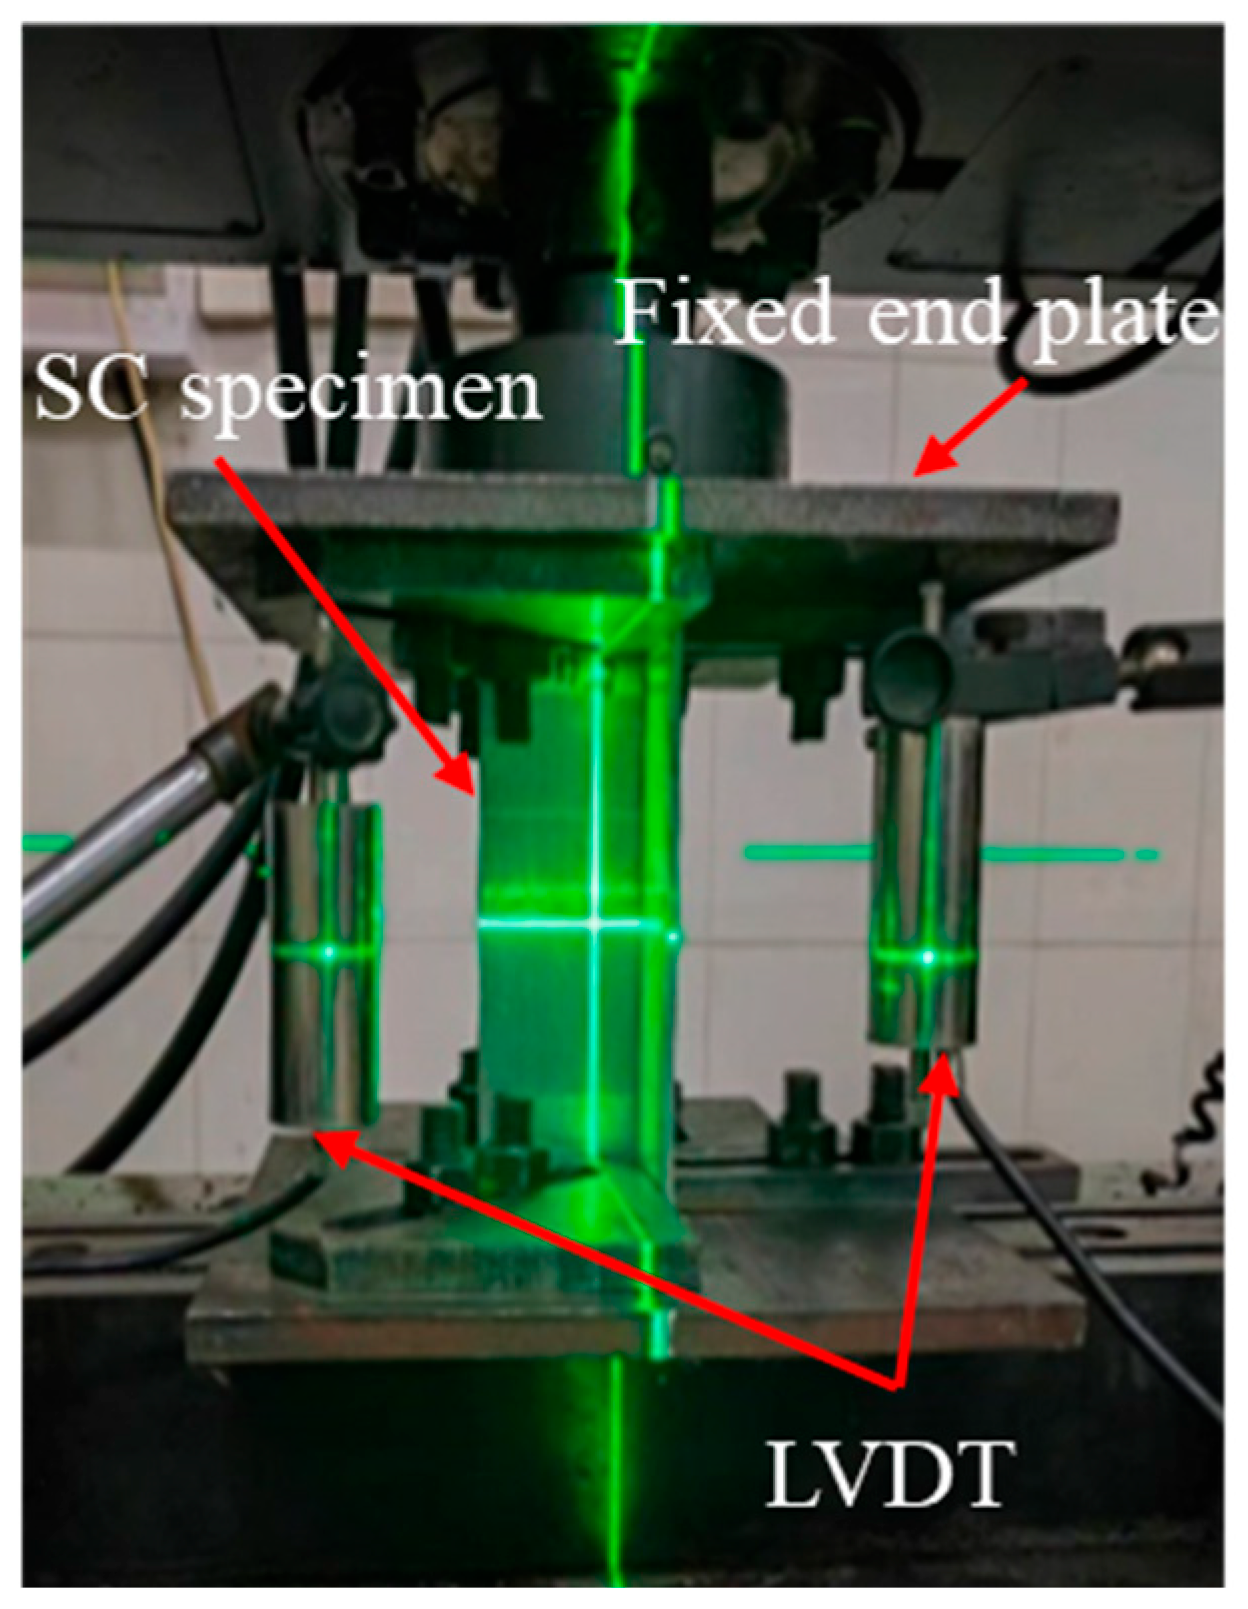
After exposure to fire, axial-loading tests were conducted on the 6063-T5 aluminium alloy angle section SCs to determine their failure modes and load-bearing capacity. The significance of accounting for the initial geometric imperfection in the SC has been acknowledged by numerous scholars [32,33]. Consequently, before performing the axial-stress test, the initial geometric flaws of the SCs were assessed. The highest plane deflections of the basic plates of the SC specimens with the A1 cross-section were 0.03 mm, and those of the A2 cross-section were 0.05 mm. The experimental setup for axial-loading tests is shown in Figure 5. The axial-loading tests were conducted using the CMT 5105 tester system. The axial end shortening of the specimens was recorded by two linear variable differential transformers. Stiffeners were employed to maintain fixed-end boundary conditions and to suppress local buckling at the specimen ends. Displacement-controlled loading was applied at a constant rate of 0.05 mm/min. The applied load was recorded through the testing system with a data acquisition frequency of 30 Hz. Once the ultimate load was reached, the test was paused for one minute to permit stress relaxation, following recommendations from earlier studies [32,33,34]. Loading ceased when a significant reduction in load was observed after reaching the peak value. Additionally, the failure mode of the SC specimen was carefully documented.

2.5. Numerical Modelling

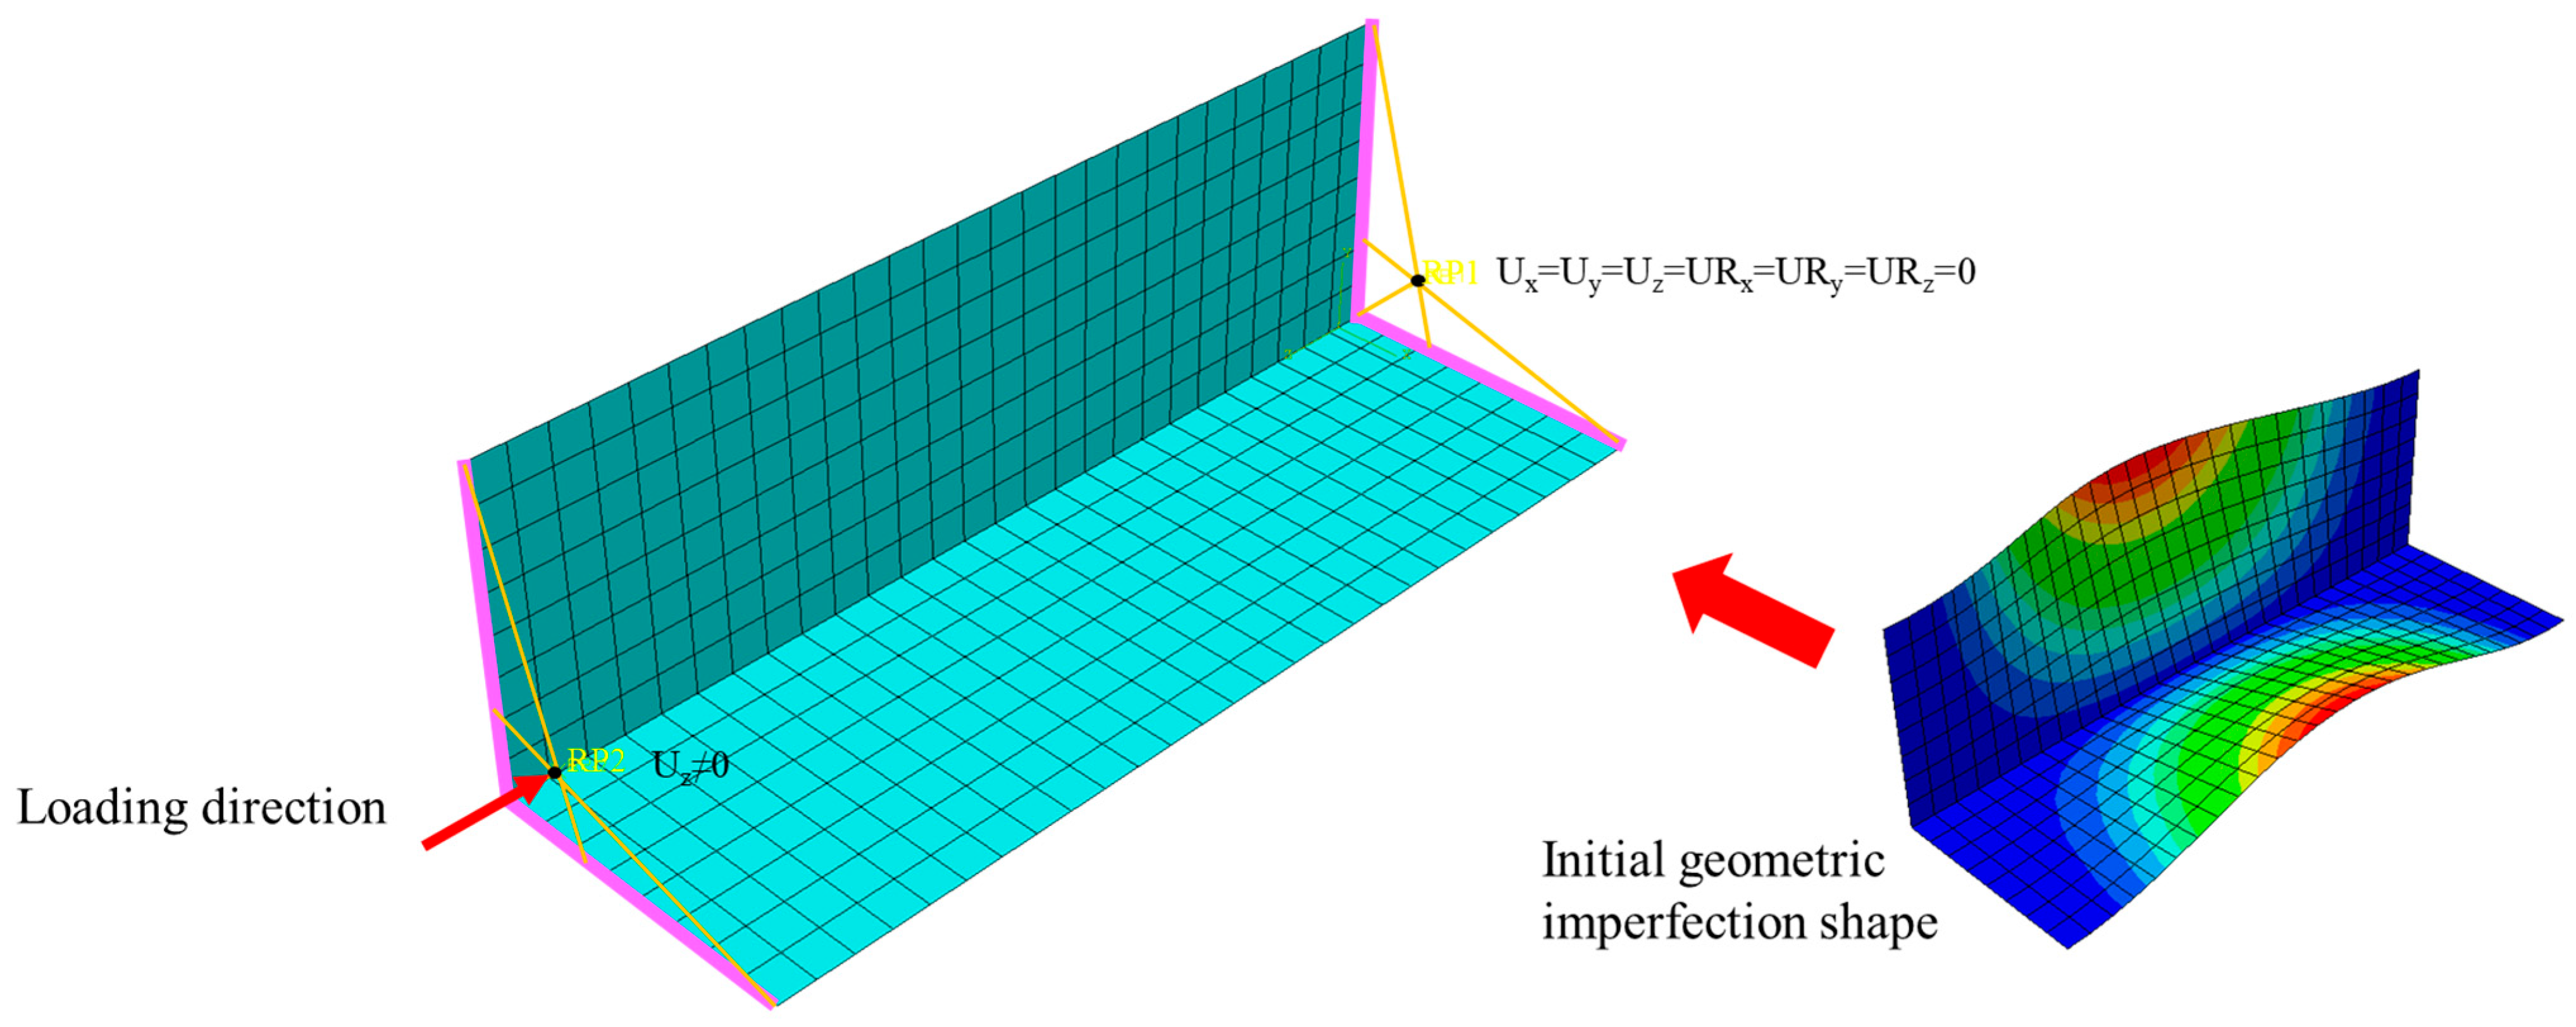
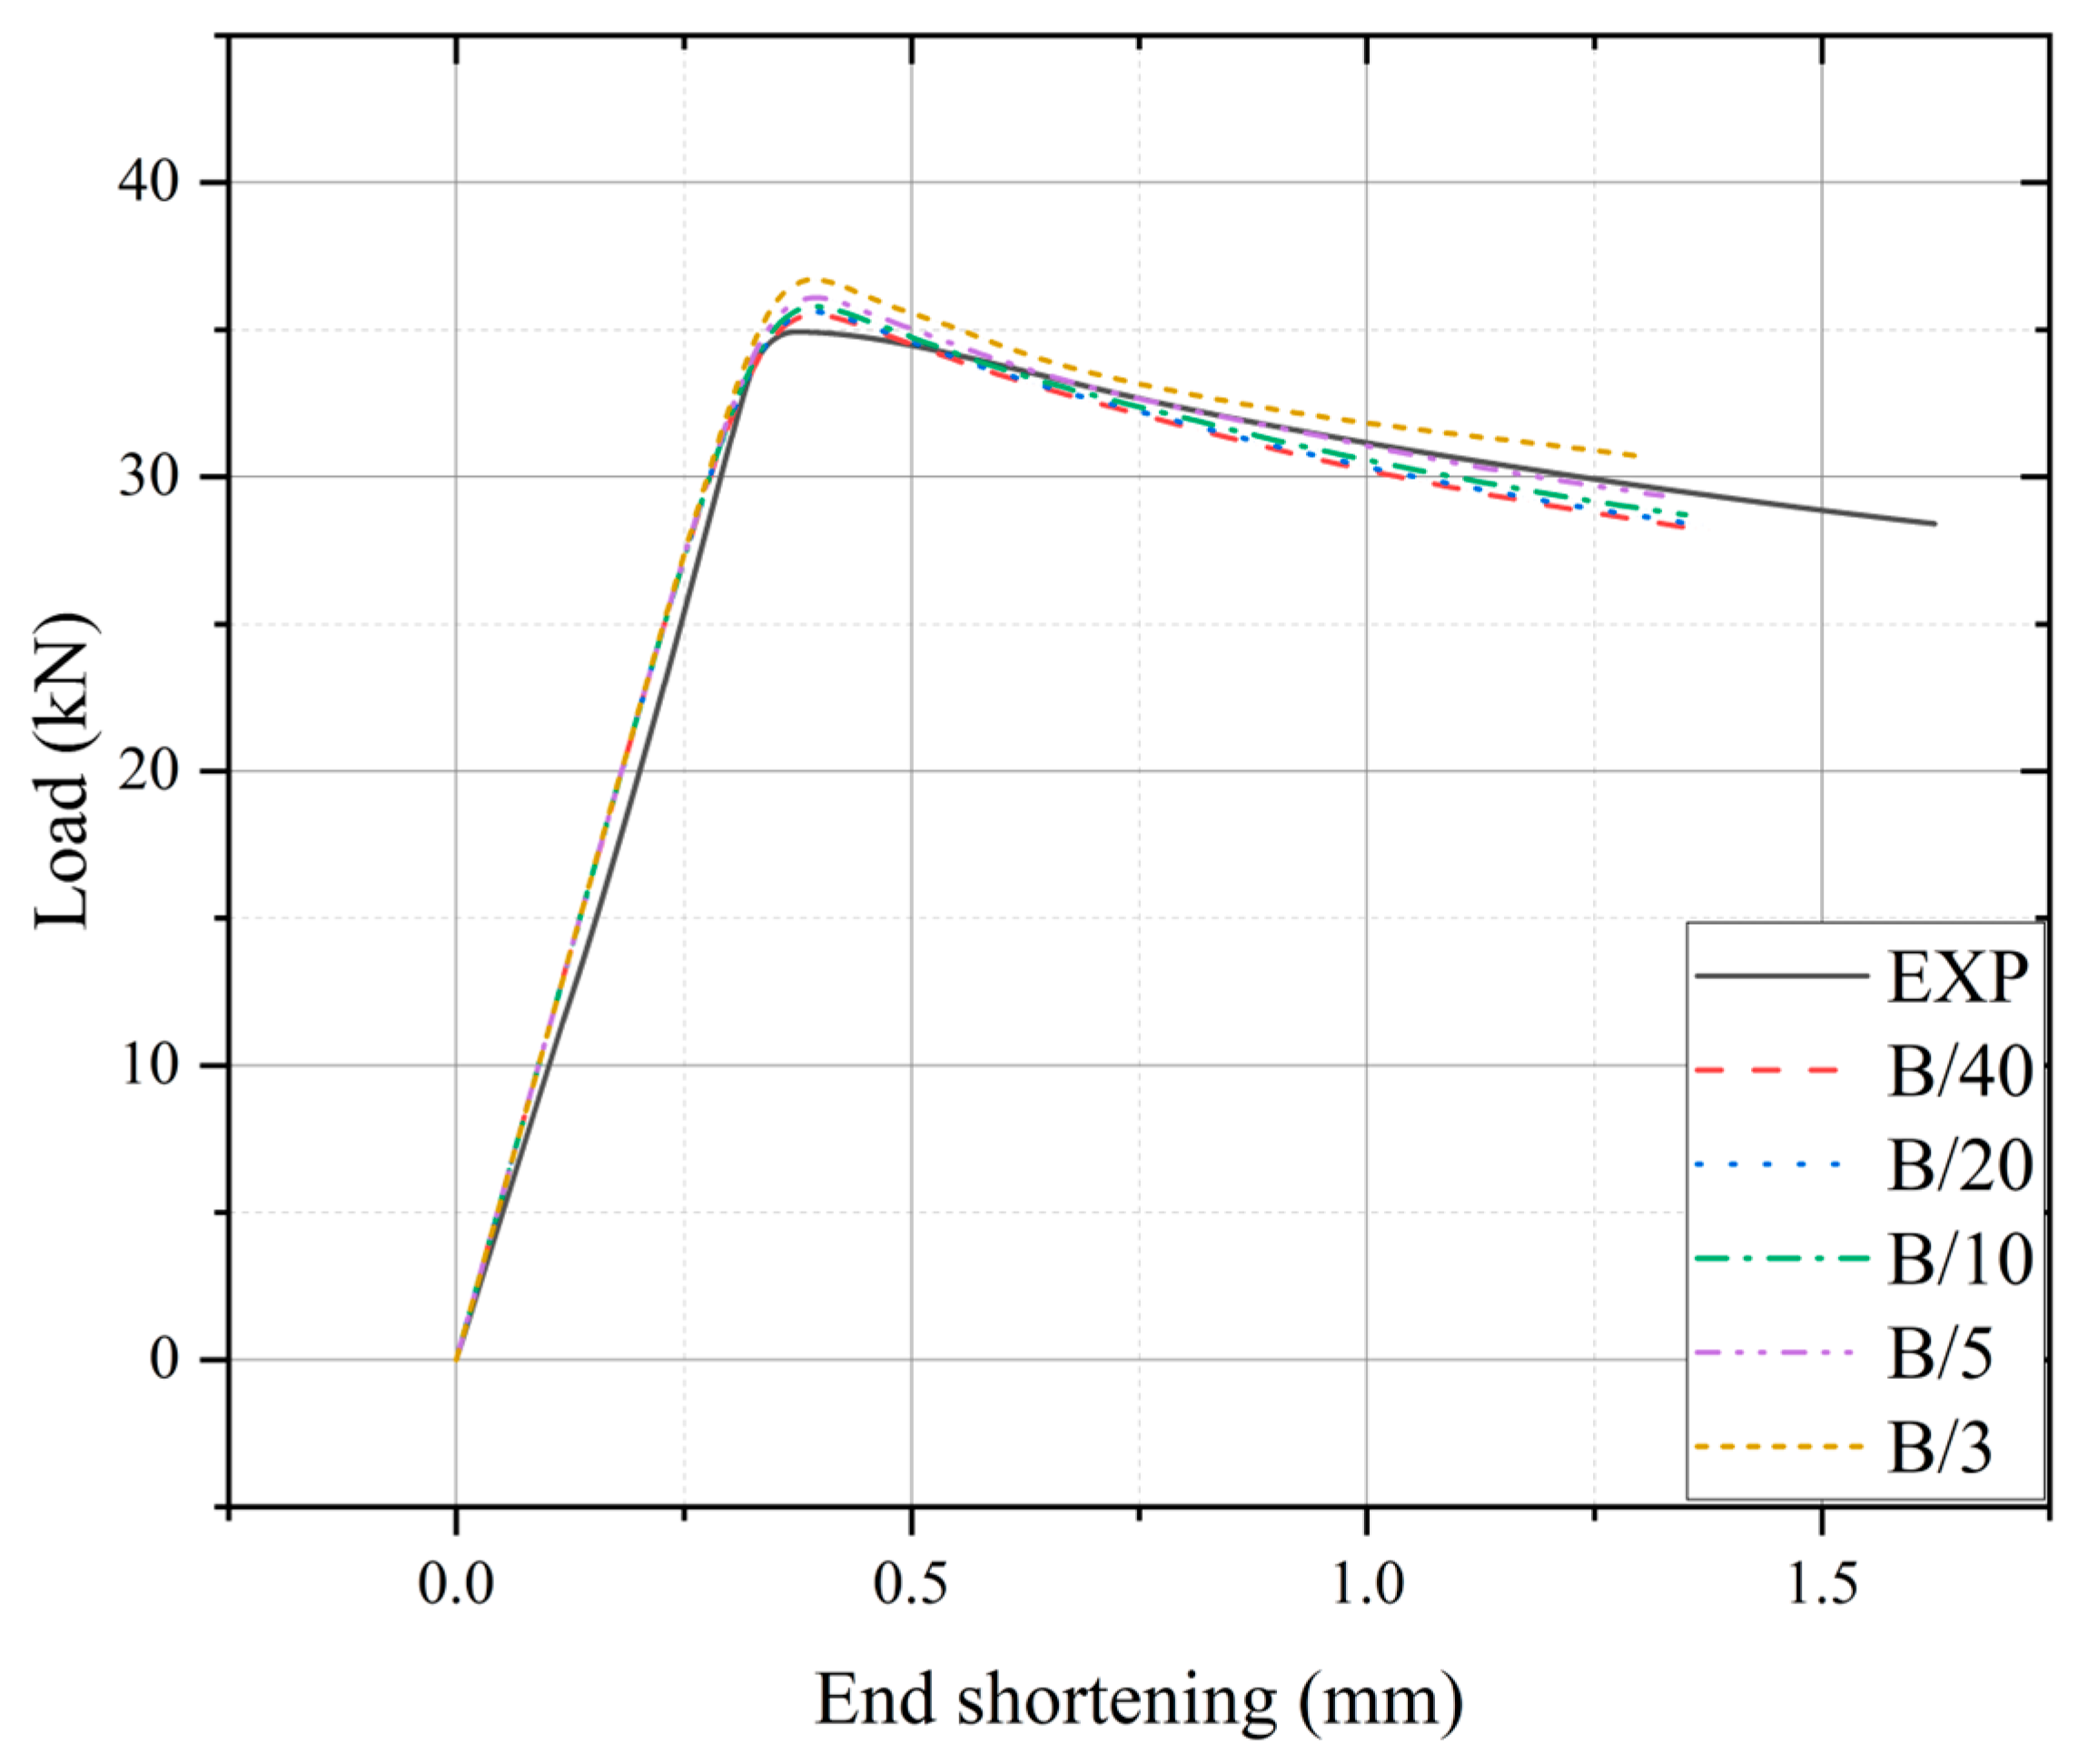
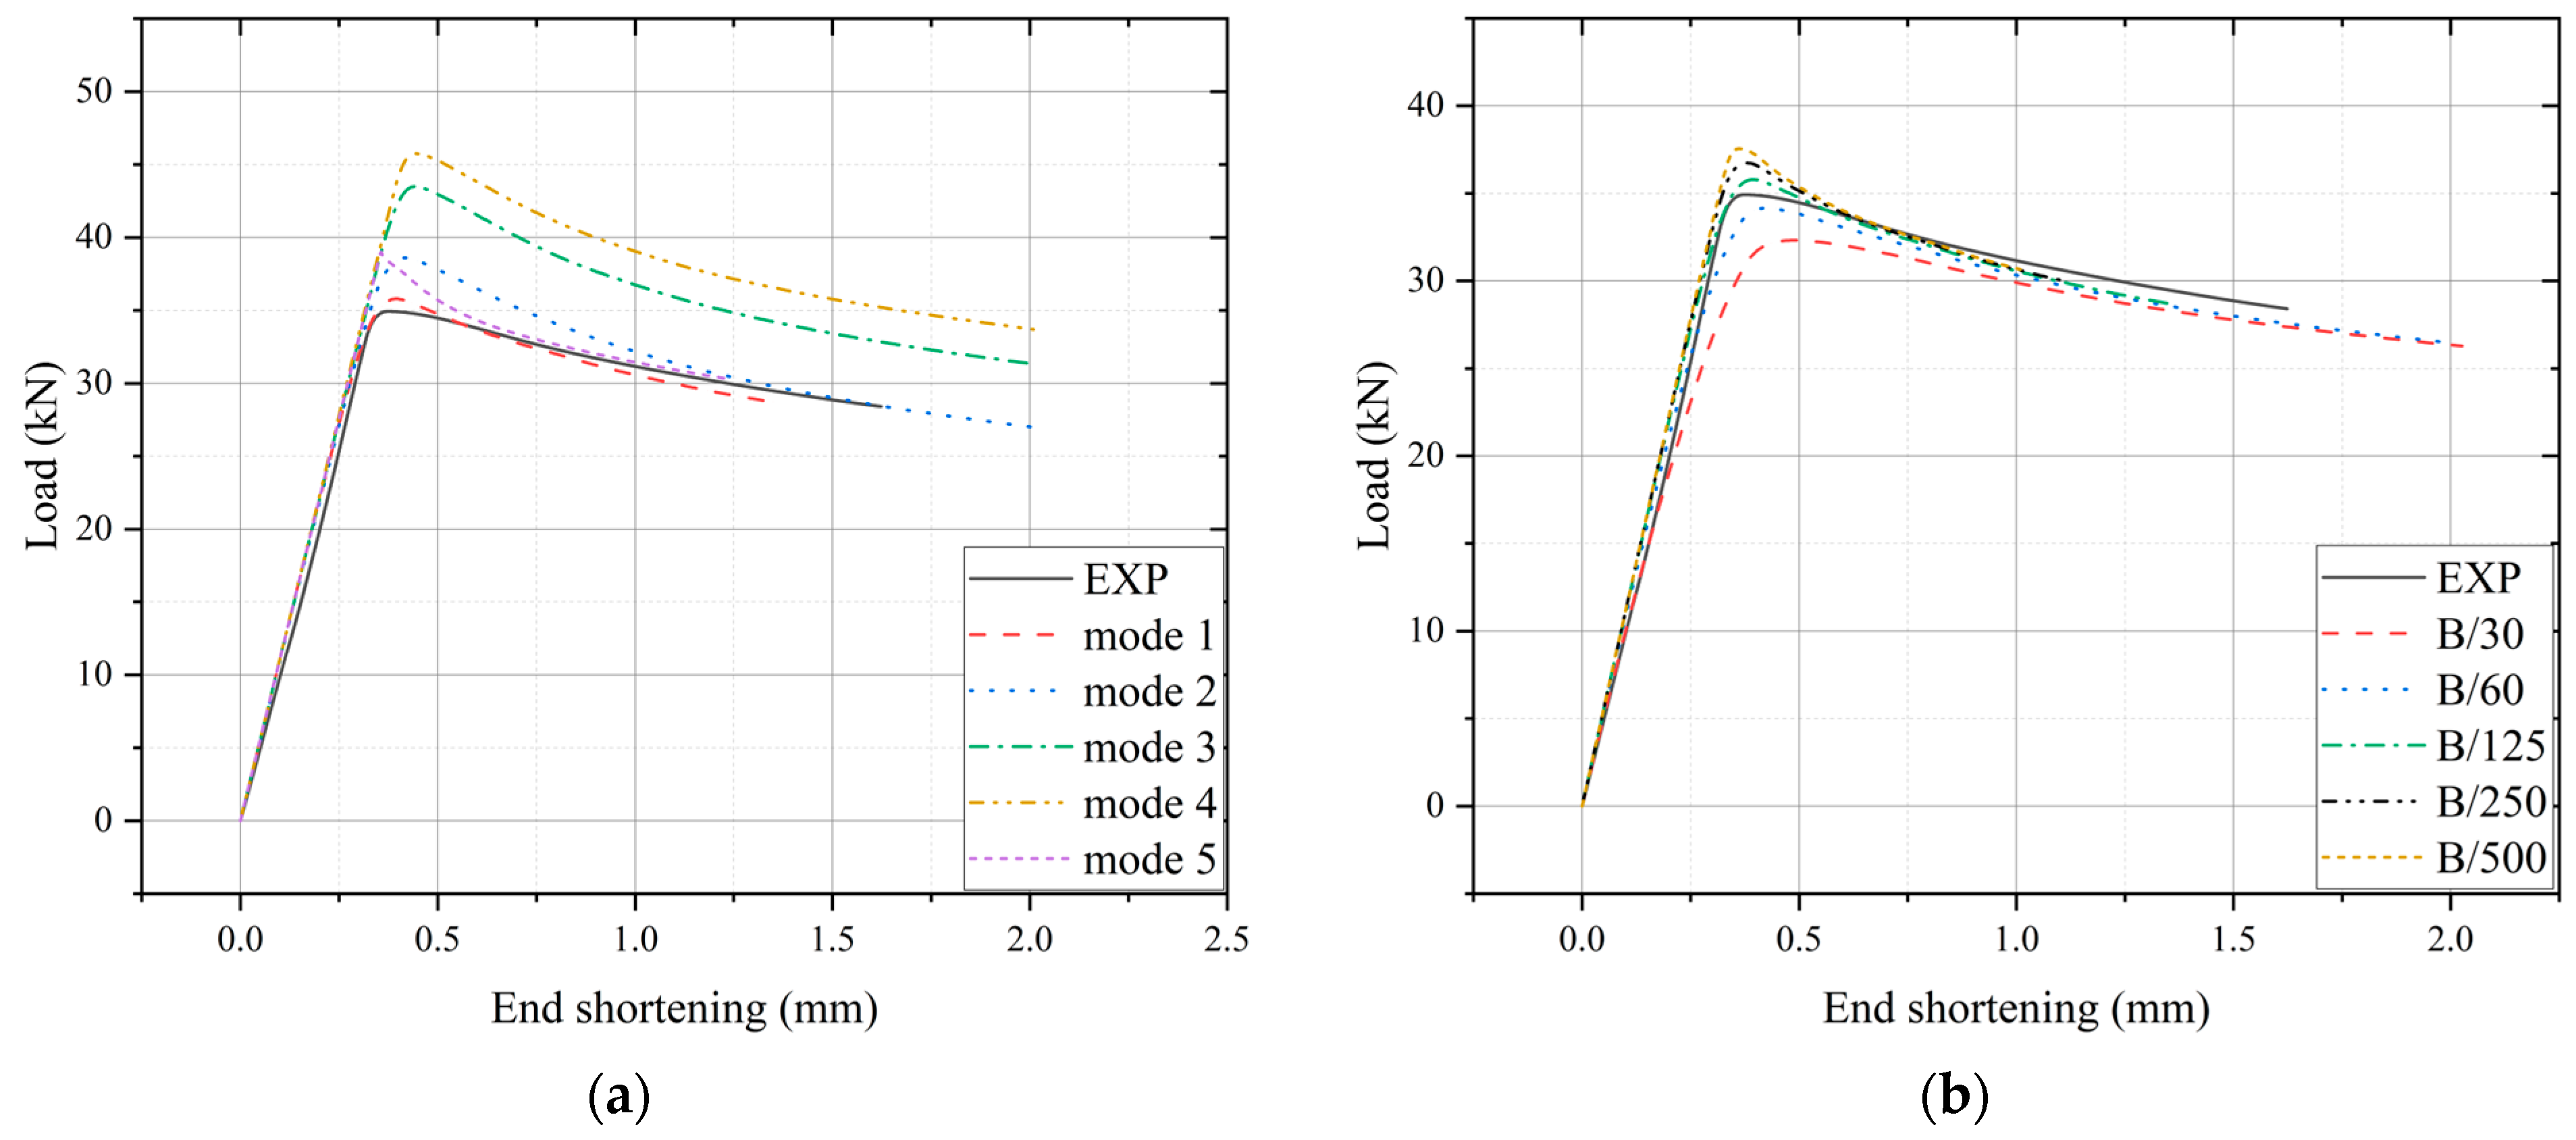
Numerical analyses of the post-fire 6063-T5 aluminium alloy angle section SCs were performed using ABAQUS 2022, as shown in Figure 6. The stress–strain behaviour of the post-fire alloy was obtained from tensile coupon testing and converted into true stress–strain curves for numerical input. The finite element analysis was performed using a residual-material modelling approach, in which the experimentally obtained post-fire stress–strain curves were directly assigned to the structural model after cooling to ambient temperature. Therefore, thermal expansion, temperature gradients, and thermally induced residual stresses were not considered in the present analysis. The model is intended to evaluate the structural response based on residual-material properties after fire exposure. By utilizing the S4R shell element, 6063-T5 aluminium alloy angle section SC numerical models were constructed, enabling the effective simulation of the elastic buckling pattern. This feature is well-suited for thin-walled components, as widely acknowledged in the literature [32,33,35,36,37,38]. The fixed-end boundary conditions in the axial-loading test were reproduced numerically by coupling the column ends with two reference points. At one reference point, both translational and rotational degrees of freedom were fully constrained, while at the other, axial translation was permitted. Mesh convergence analyses were performed to identify the optimal element size, with mesh densities varying from B/40 to B/3. Relevant results depicted in Figure 7 indicated that a mesh size of B/10 was applicable and was employed in subsequent numerical analyses. The numerical analysis considered the influence of initial geometric imperfections. The initial geometric imperfection profile was derived from the buckling modes predicted by the elastic buckling analysis of perfect numerical models. Relevant results of the virgin angle section SC are presented in Figure 8, showing various initial geometric imperfection distribution forms and amplitudes. Subsequently, the first buckling mode and B/125 imperfection amplitude were deemed appropriate.

3. Results and Parametric Study

3.1. Stress–Strain Curves

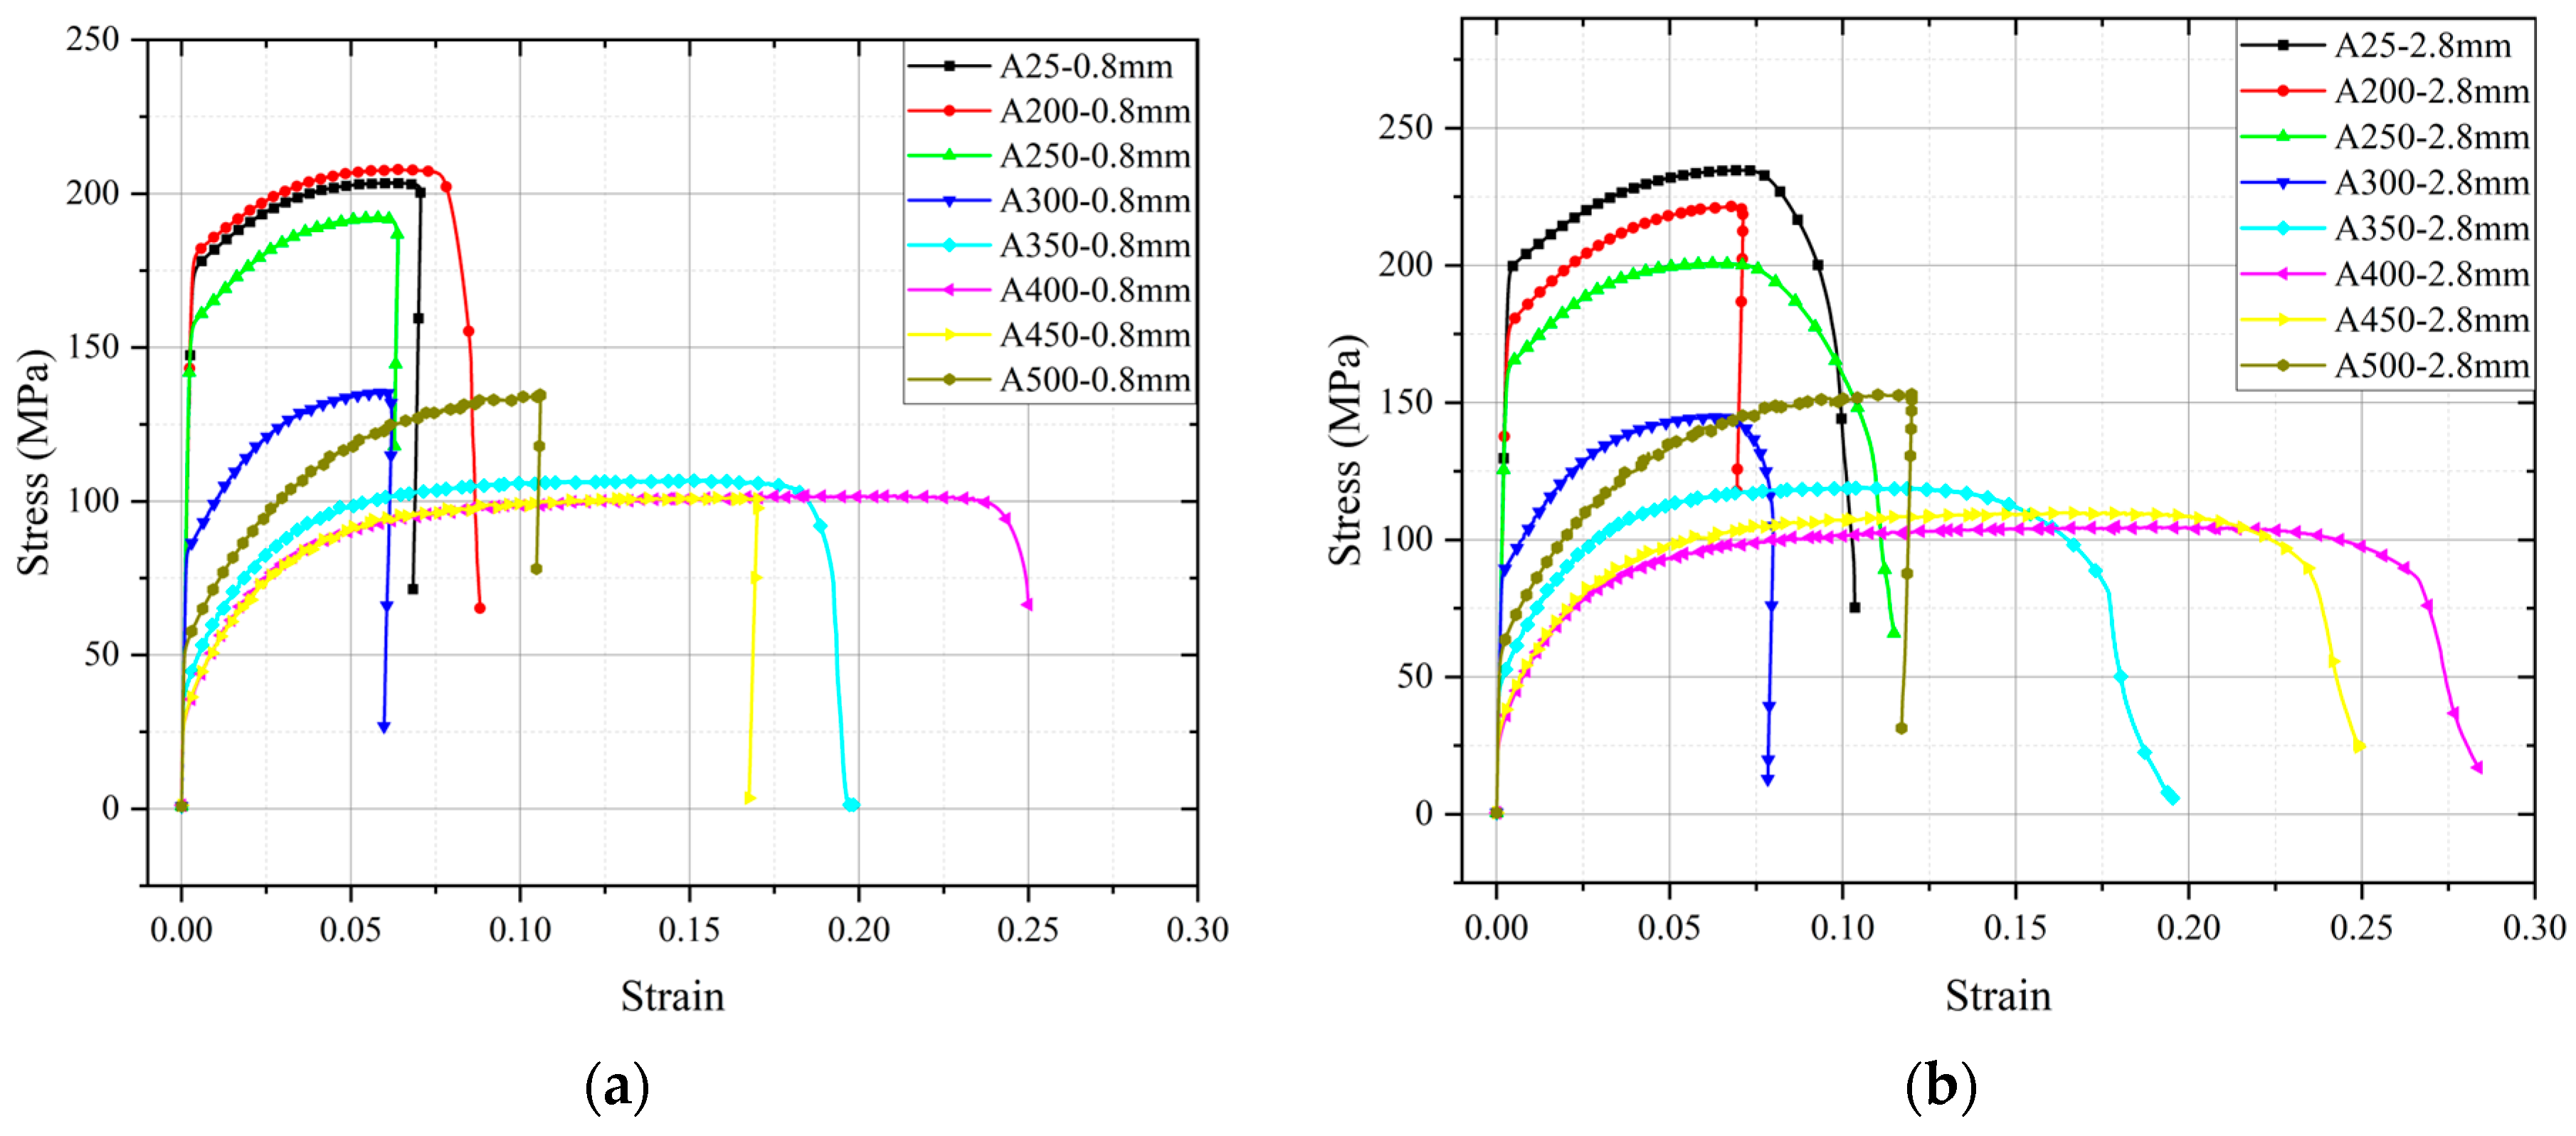
The post-fire stress–strain curves of the 6063-T5 aluminium alloy specimens with both A1 and A2 cross-sections are shown in Figure 9. No clear yield plateaus were observed. Strain-hardening is observed after the initial elastic segment. The yield strength fo is defined as the stress corresponding to a residual strain of 0.2% [39]. As the ultimate stress was achieved, the stress decreased with increasing strain. The elastic moduli of the specimens remained almost the same as the elevated temperatures varied. The specimens with both A1 and A2 cross-sections exhibited similar variation trends for the key mechanical properties. The virgin specimen and the specimen with an elevated temperature of 200 °C showed very little variation in their stress–strain curves. This is also observed in the experimental results presented in the prior study [27]. For 200 °C ≤ T ≤ 400 °C, the strength dropped, while the ductility qualities rose. Thereafter, the strength properties were enhanced for the elevated temperatures within 400–500 °C. The related numerical study of the aluminium alloy angle section SCs with the A1 or A2 cross-section was conducted using the residual stress–strain curves after exposure to elevated temperatures (Figure 9).

3.2. Load–End Shortening Curves

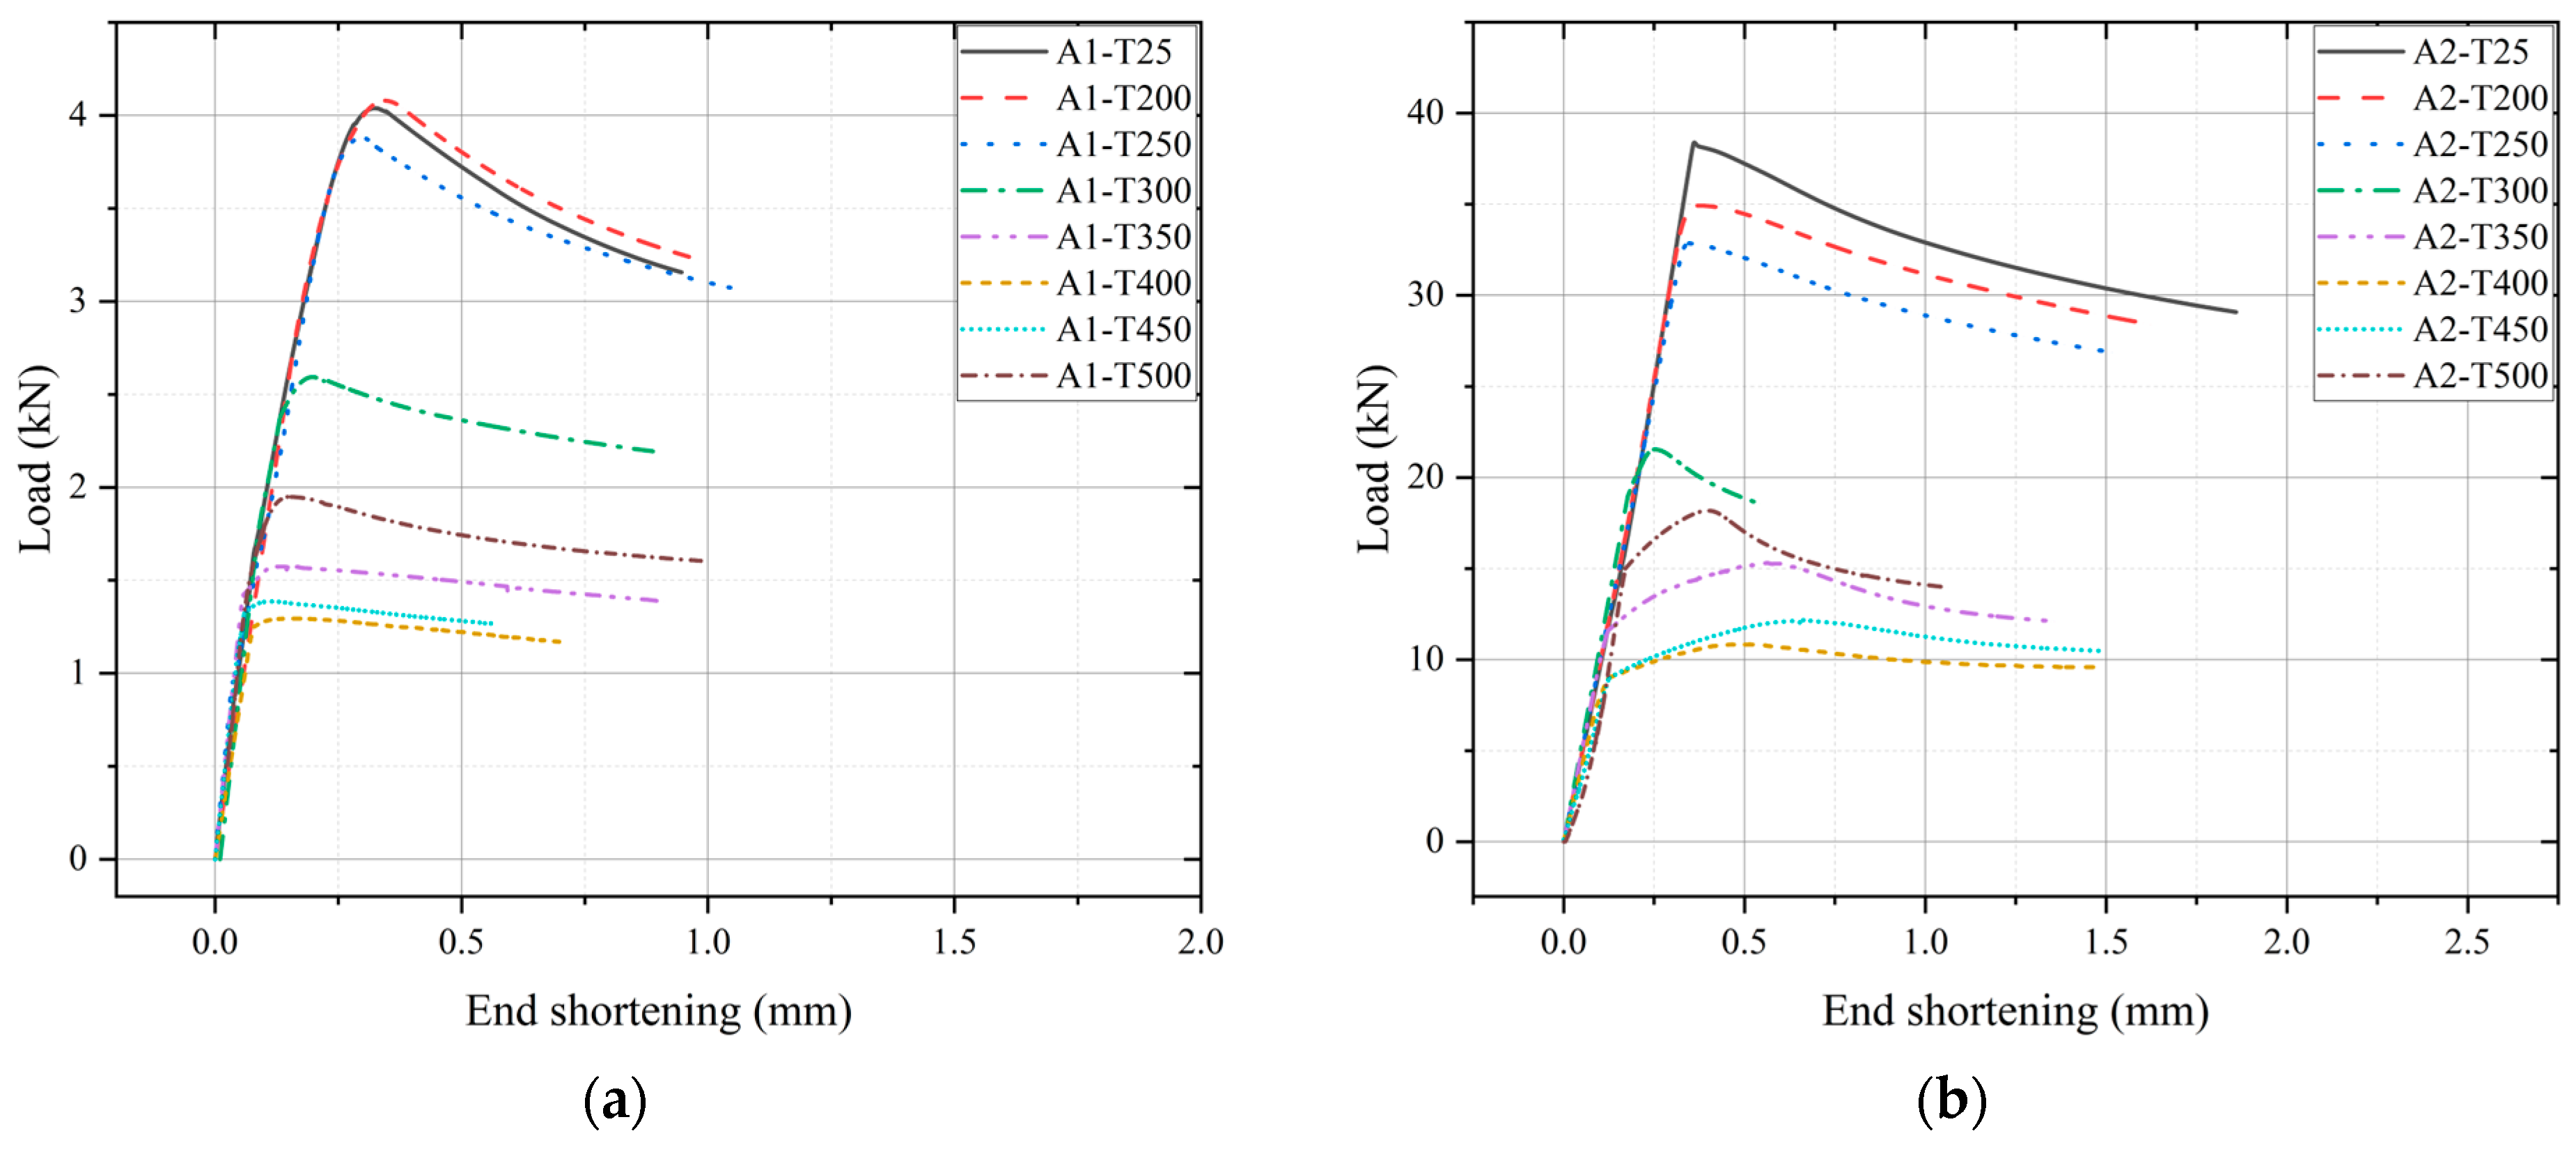
After conducting the axial-loading test, the post-fire load–end shortening curves of the 6063-T5 aluminium alloy angle section SCs were obtained, as illustrated in Figure 10. For instance, the designation A1-T200 indicated the A1 angle section with an elevated temperature of 200 °C. The test findings indicated that the initial resistance stiffness was negligibly affected by the elevated temperatures. All the resistance curves demonstrated a unimodal shape. The ultimate resistance of the specimens after exposure to various elevated temperatures is presented in Table 3. Within 200–400 °C, the ultimate resistance gradually decreased. Subsequently, a rise in ultimate resistance was detected between 400 and 500 °C. The ultimate resistance trends were found to be consistent with the strength behaviour reflected in the stress–strain responses (Figure 9). Both the A1 and A2 cross-sections belong to Class 4 (EC9), and the effects of the elevated temperatures on the resistance curves of the SC specimens with both cross-sections were similar. Specifically, δ represents the end shortening corresponding to the peak load of the specimen. Afo denotes the axial yield capacity of the cross-section, calculated as the product of the cross-sectional area A and the yield strength fo. The ratio Nᵤ,test/Afo, therefore, represents the normalized ultimate capacity obtained from the test results relative to the cross-sectional yield capacity. Notably, the influence of the elevated temperatures on the ratio Nu,test/Afo was evident, resulting in differences in the cross-sectional classification of the SCs. As the failure modes of the 6063-T5 aluminium alloy angle section SC specimens, all SCs exposed to different elevated temperatures showed modes of local buckling. The influence of the elevated temperatures on the specimens’ failure modes was comparatively minor.

3.3. Validation

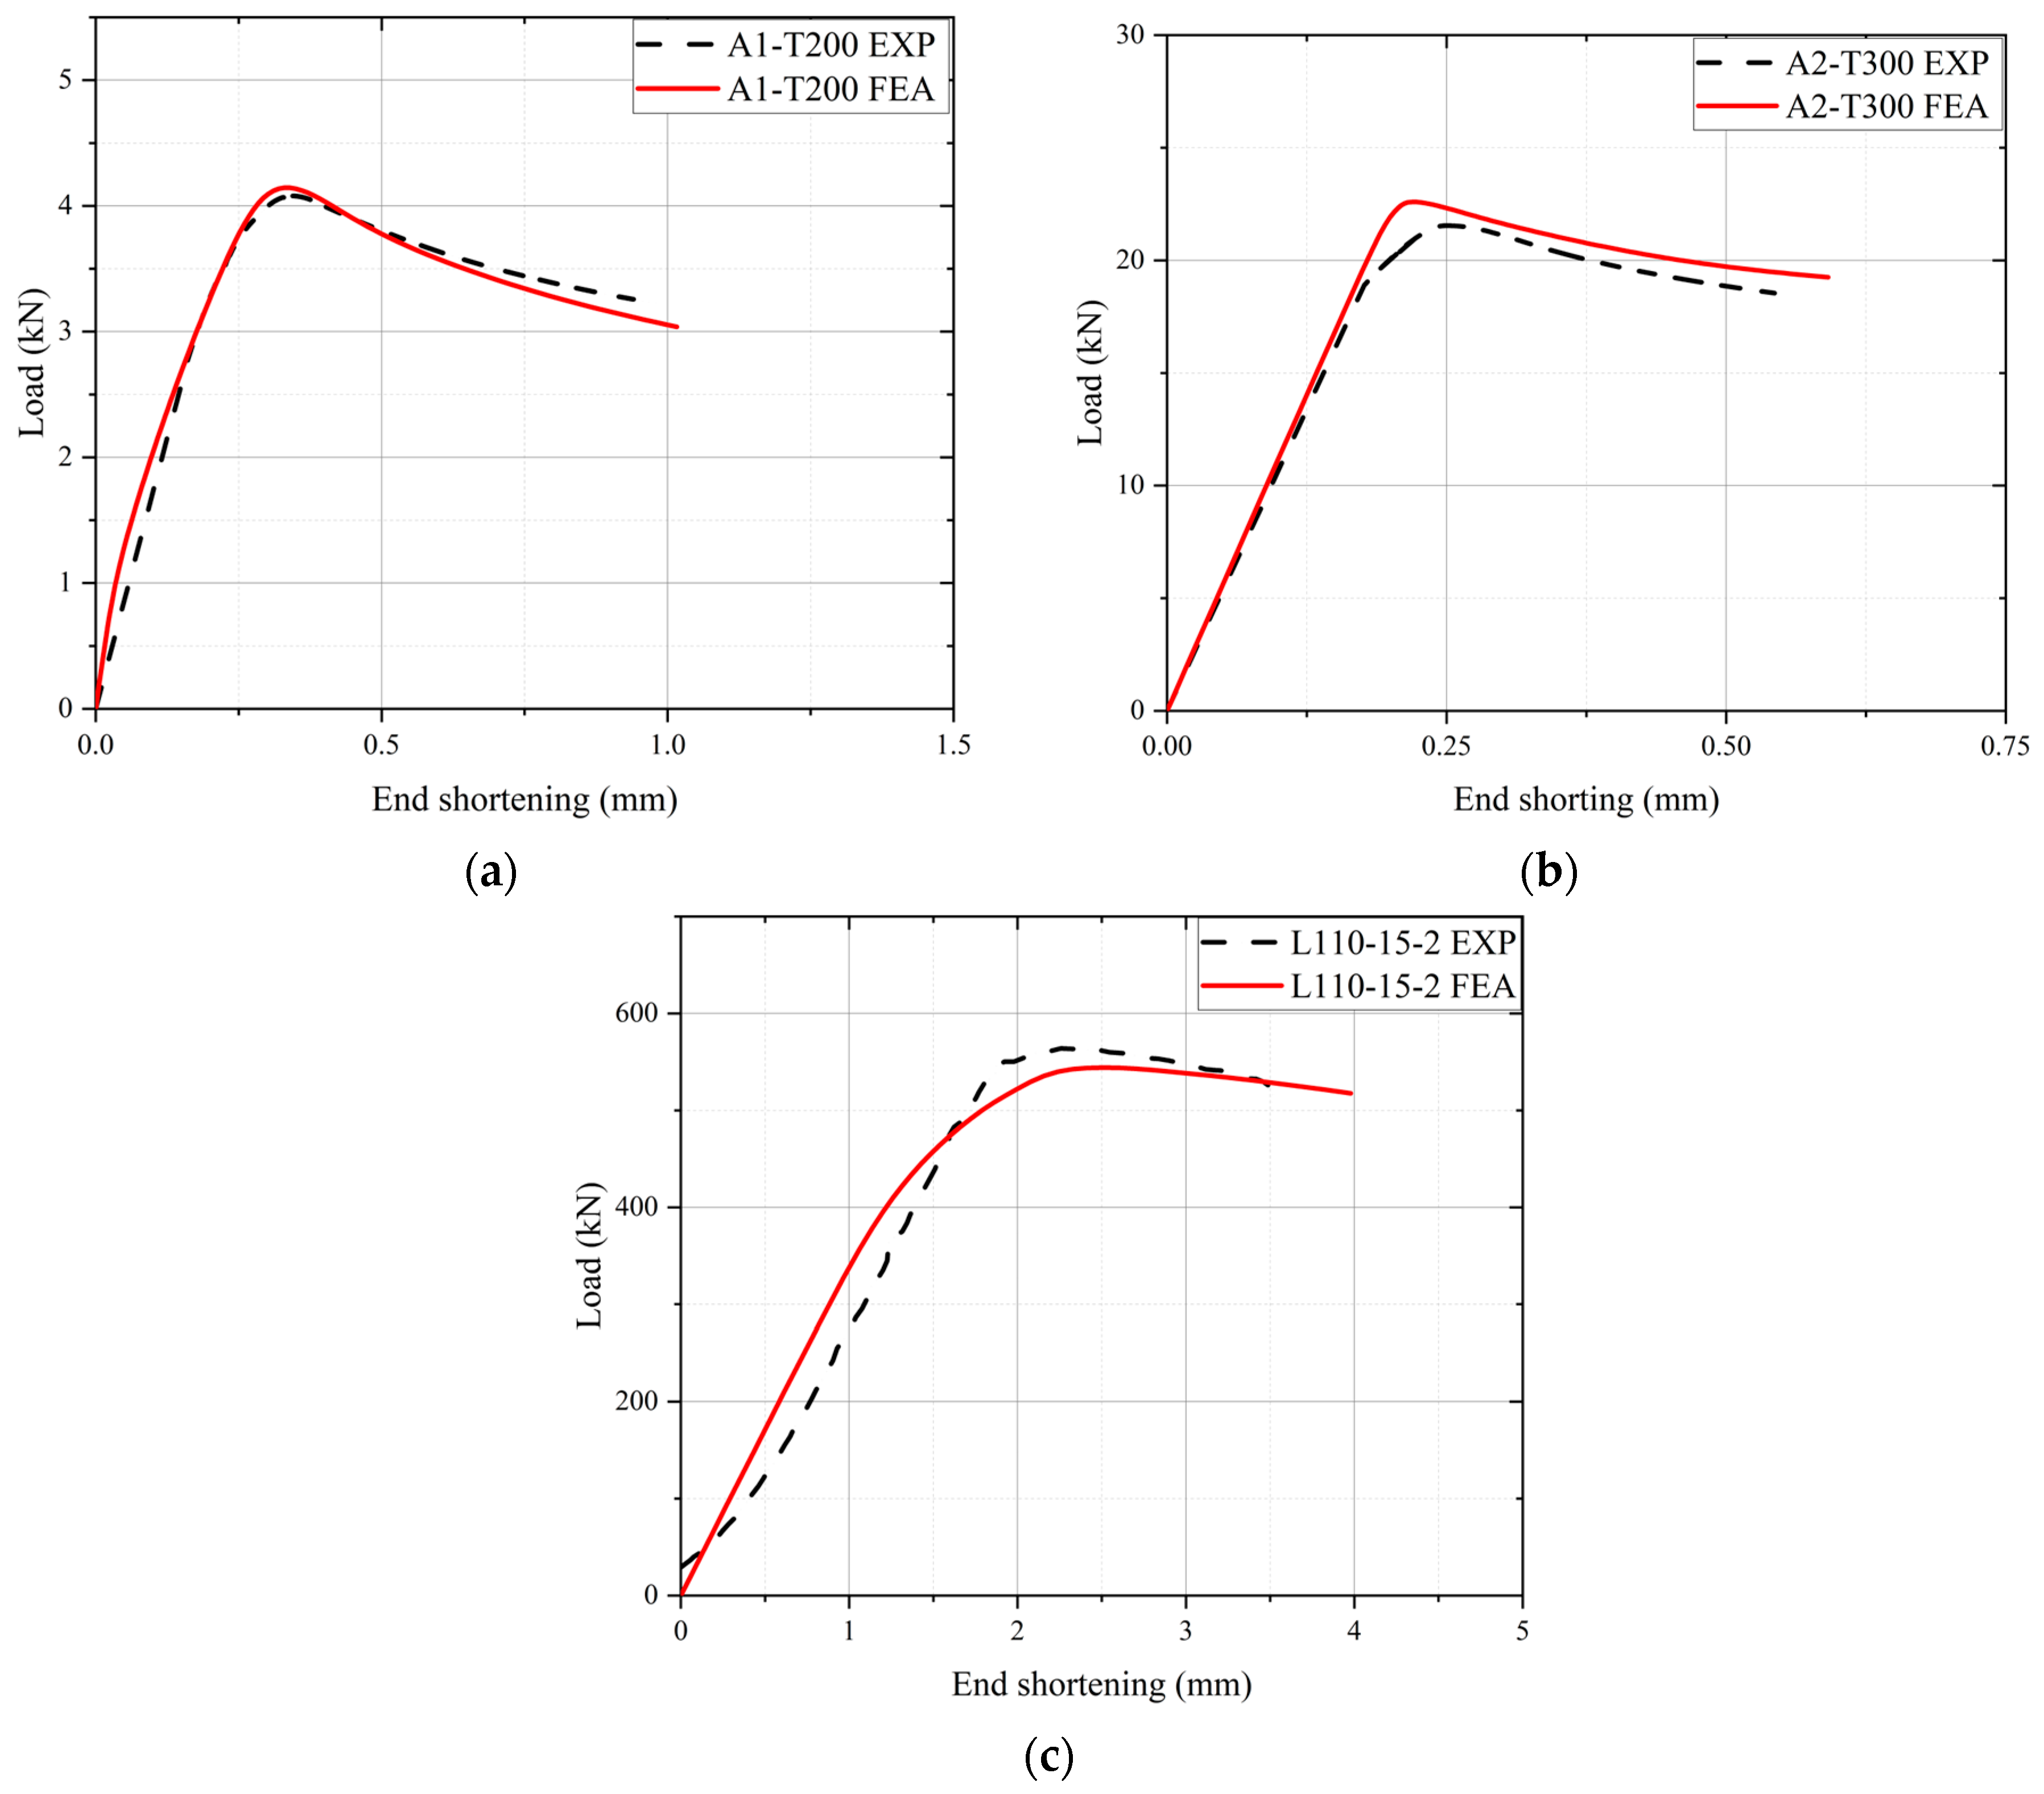
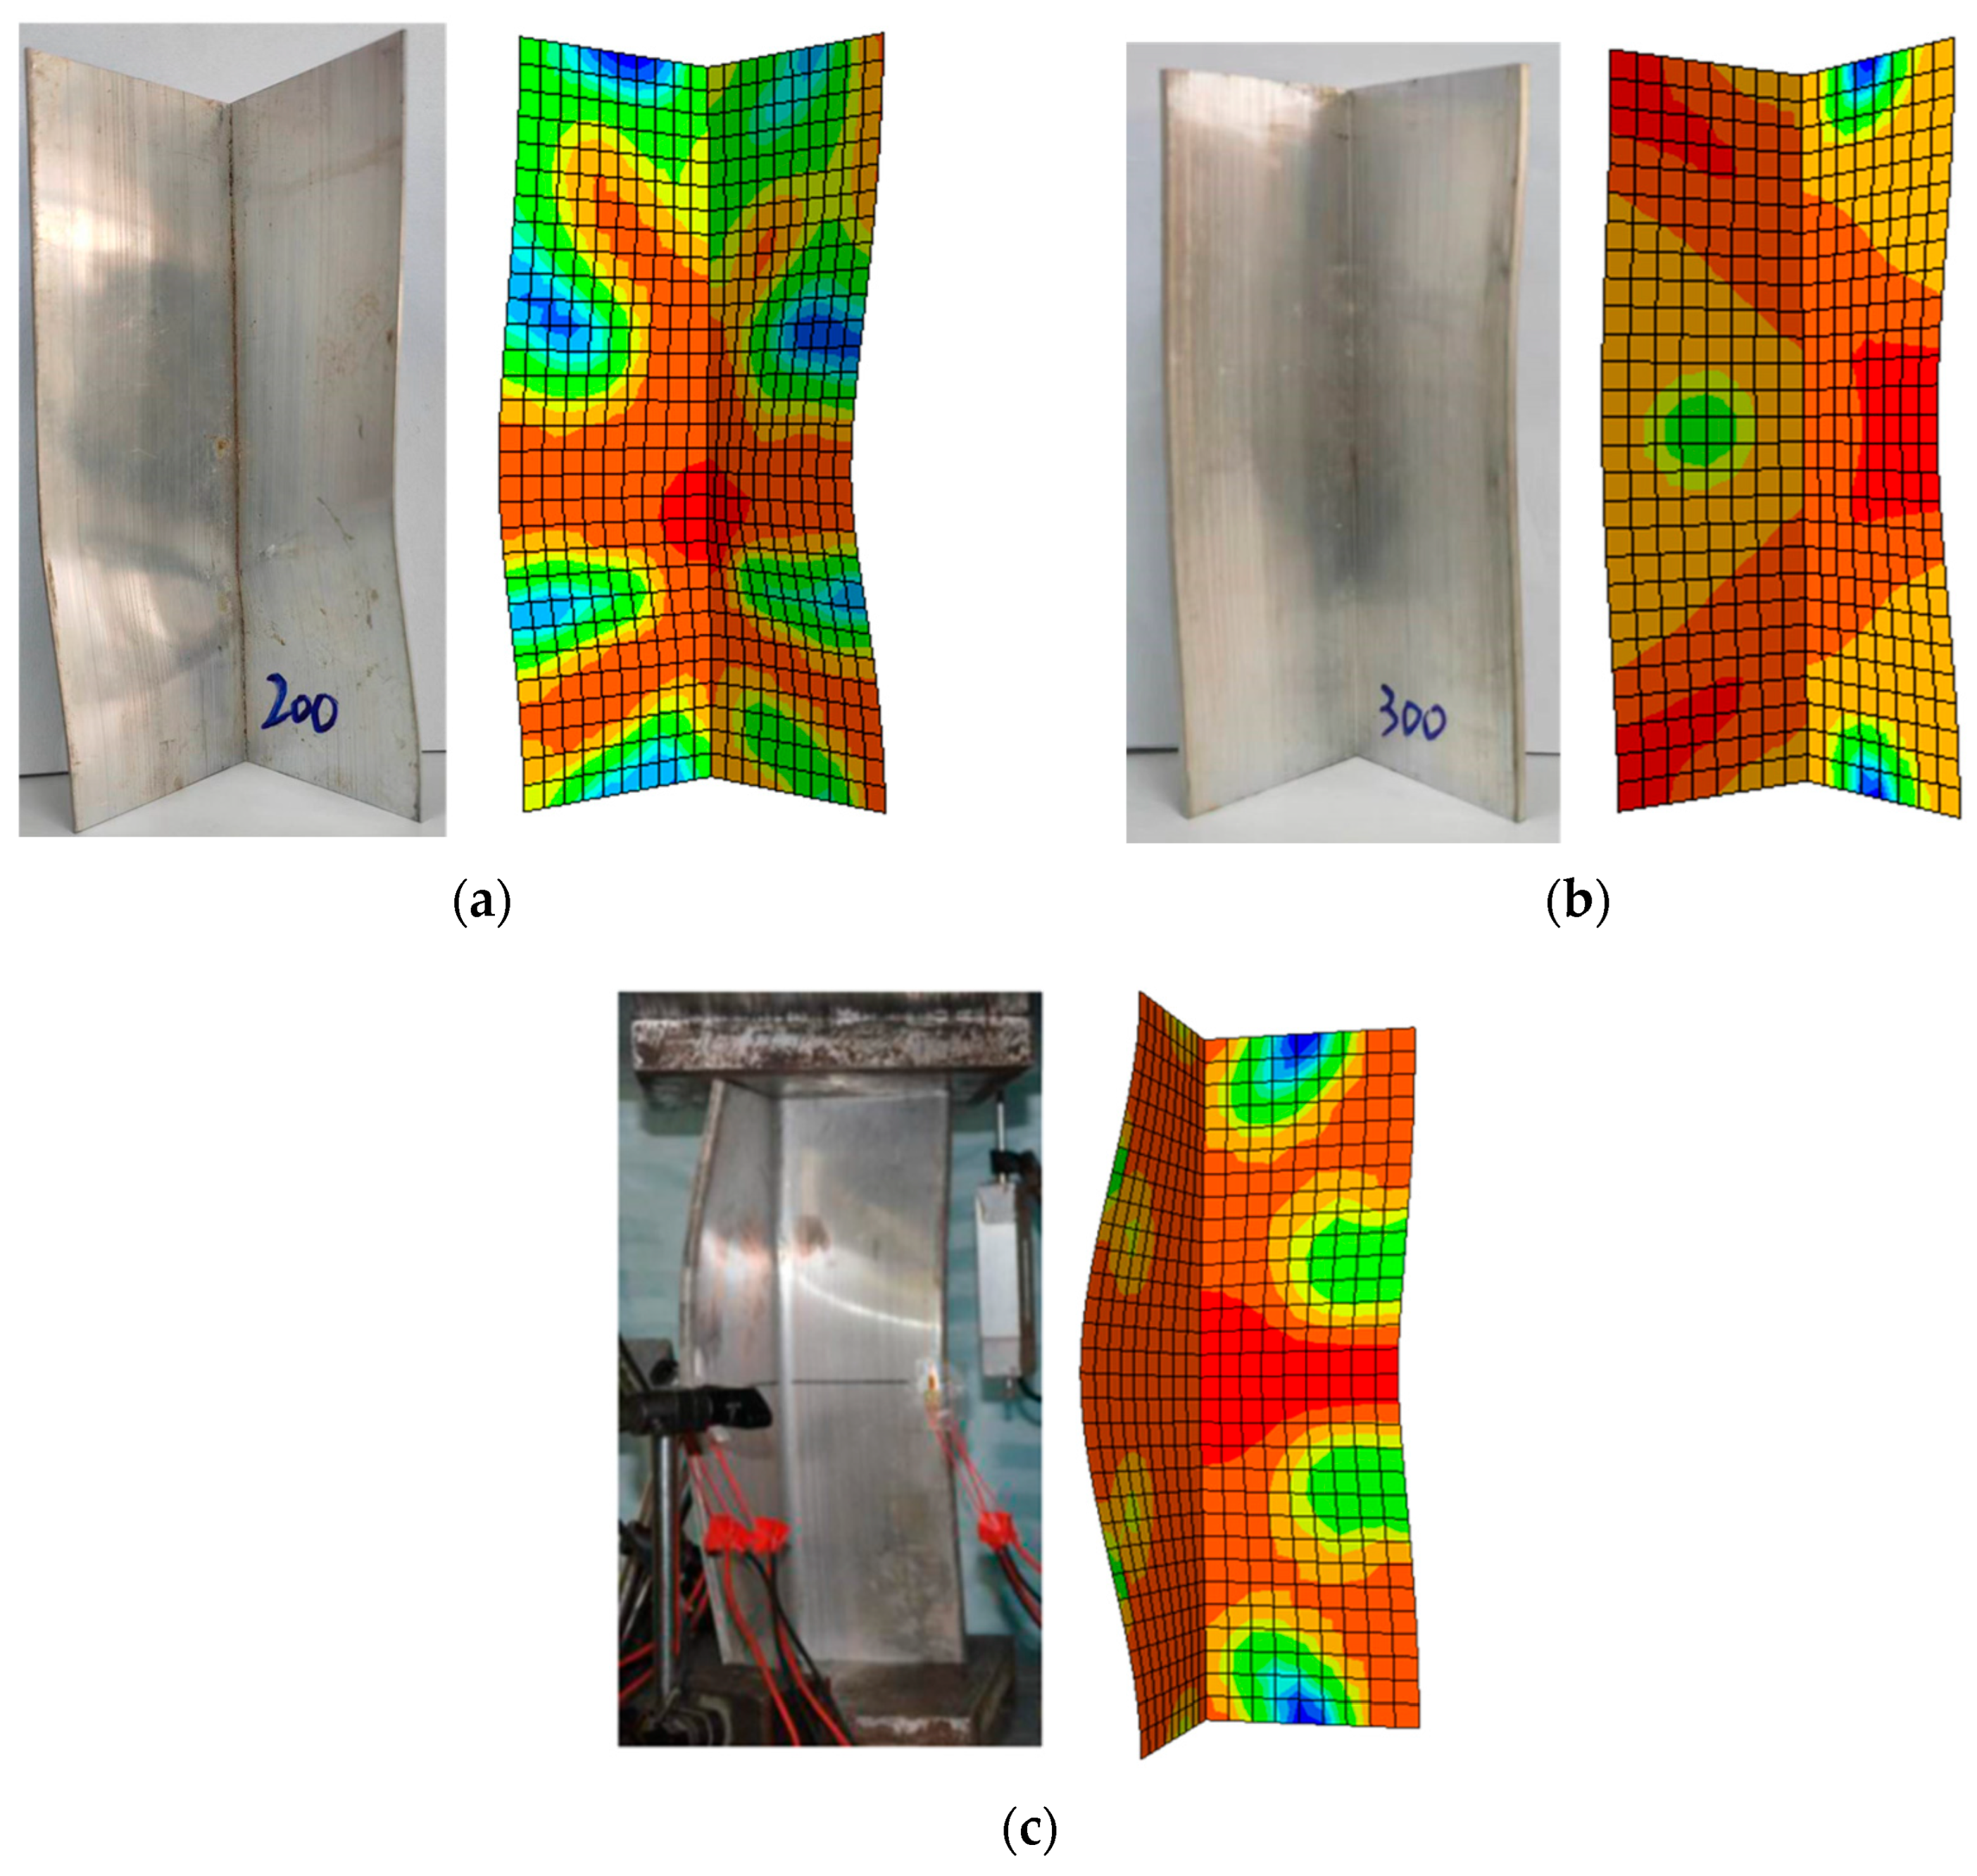
To validate the numerical modelling approach for assessing the post-fire load-bearing capacity of 6063-T5 aluminium alloy angle section SCs, a comparative analysis was conducted on experimental and numerical outcomes. It is noteworthy that a remarkable consistency in the load–end shortening curves from the experiment and numerical analysis was observed (Figure 11), particularly before reaching the peak point. Table 3 presents a comparison of the experimental and numerical ultimate-resistance results. The ratio Nu,FE/Nu,test has a mean value of 1.027 and a coefficient of variation (COV) of 0.017. The numerical modelling method accurately simulated the weakening effects of fire exposure on the residual bearing capacity of 6063-T5 aluminium alloy angle section SCs. The numerical study correctly identified the buckling performance of the SCs after fire exposure with respect to the failure mechanism (Figure 12), with particular emphasis on the local buckling of flanges. Therefore, this study’s numerical modelling approach works well for examining the 6063-T5 aluminium alloy angle section SC’s residual resistance after fire exposure.

3.4. Parametric Study

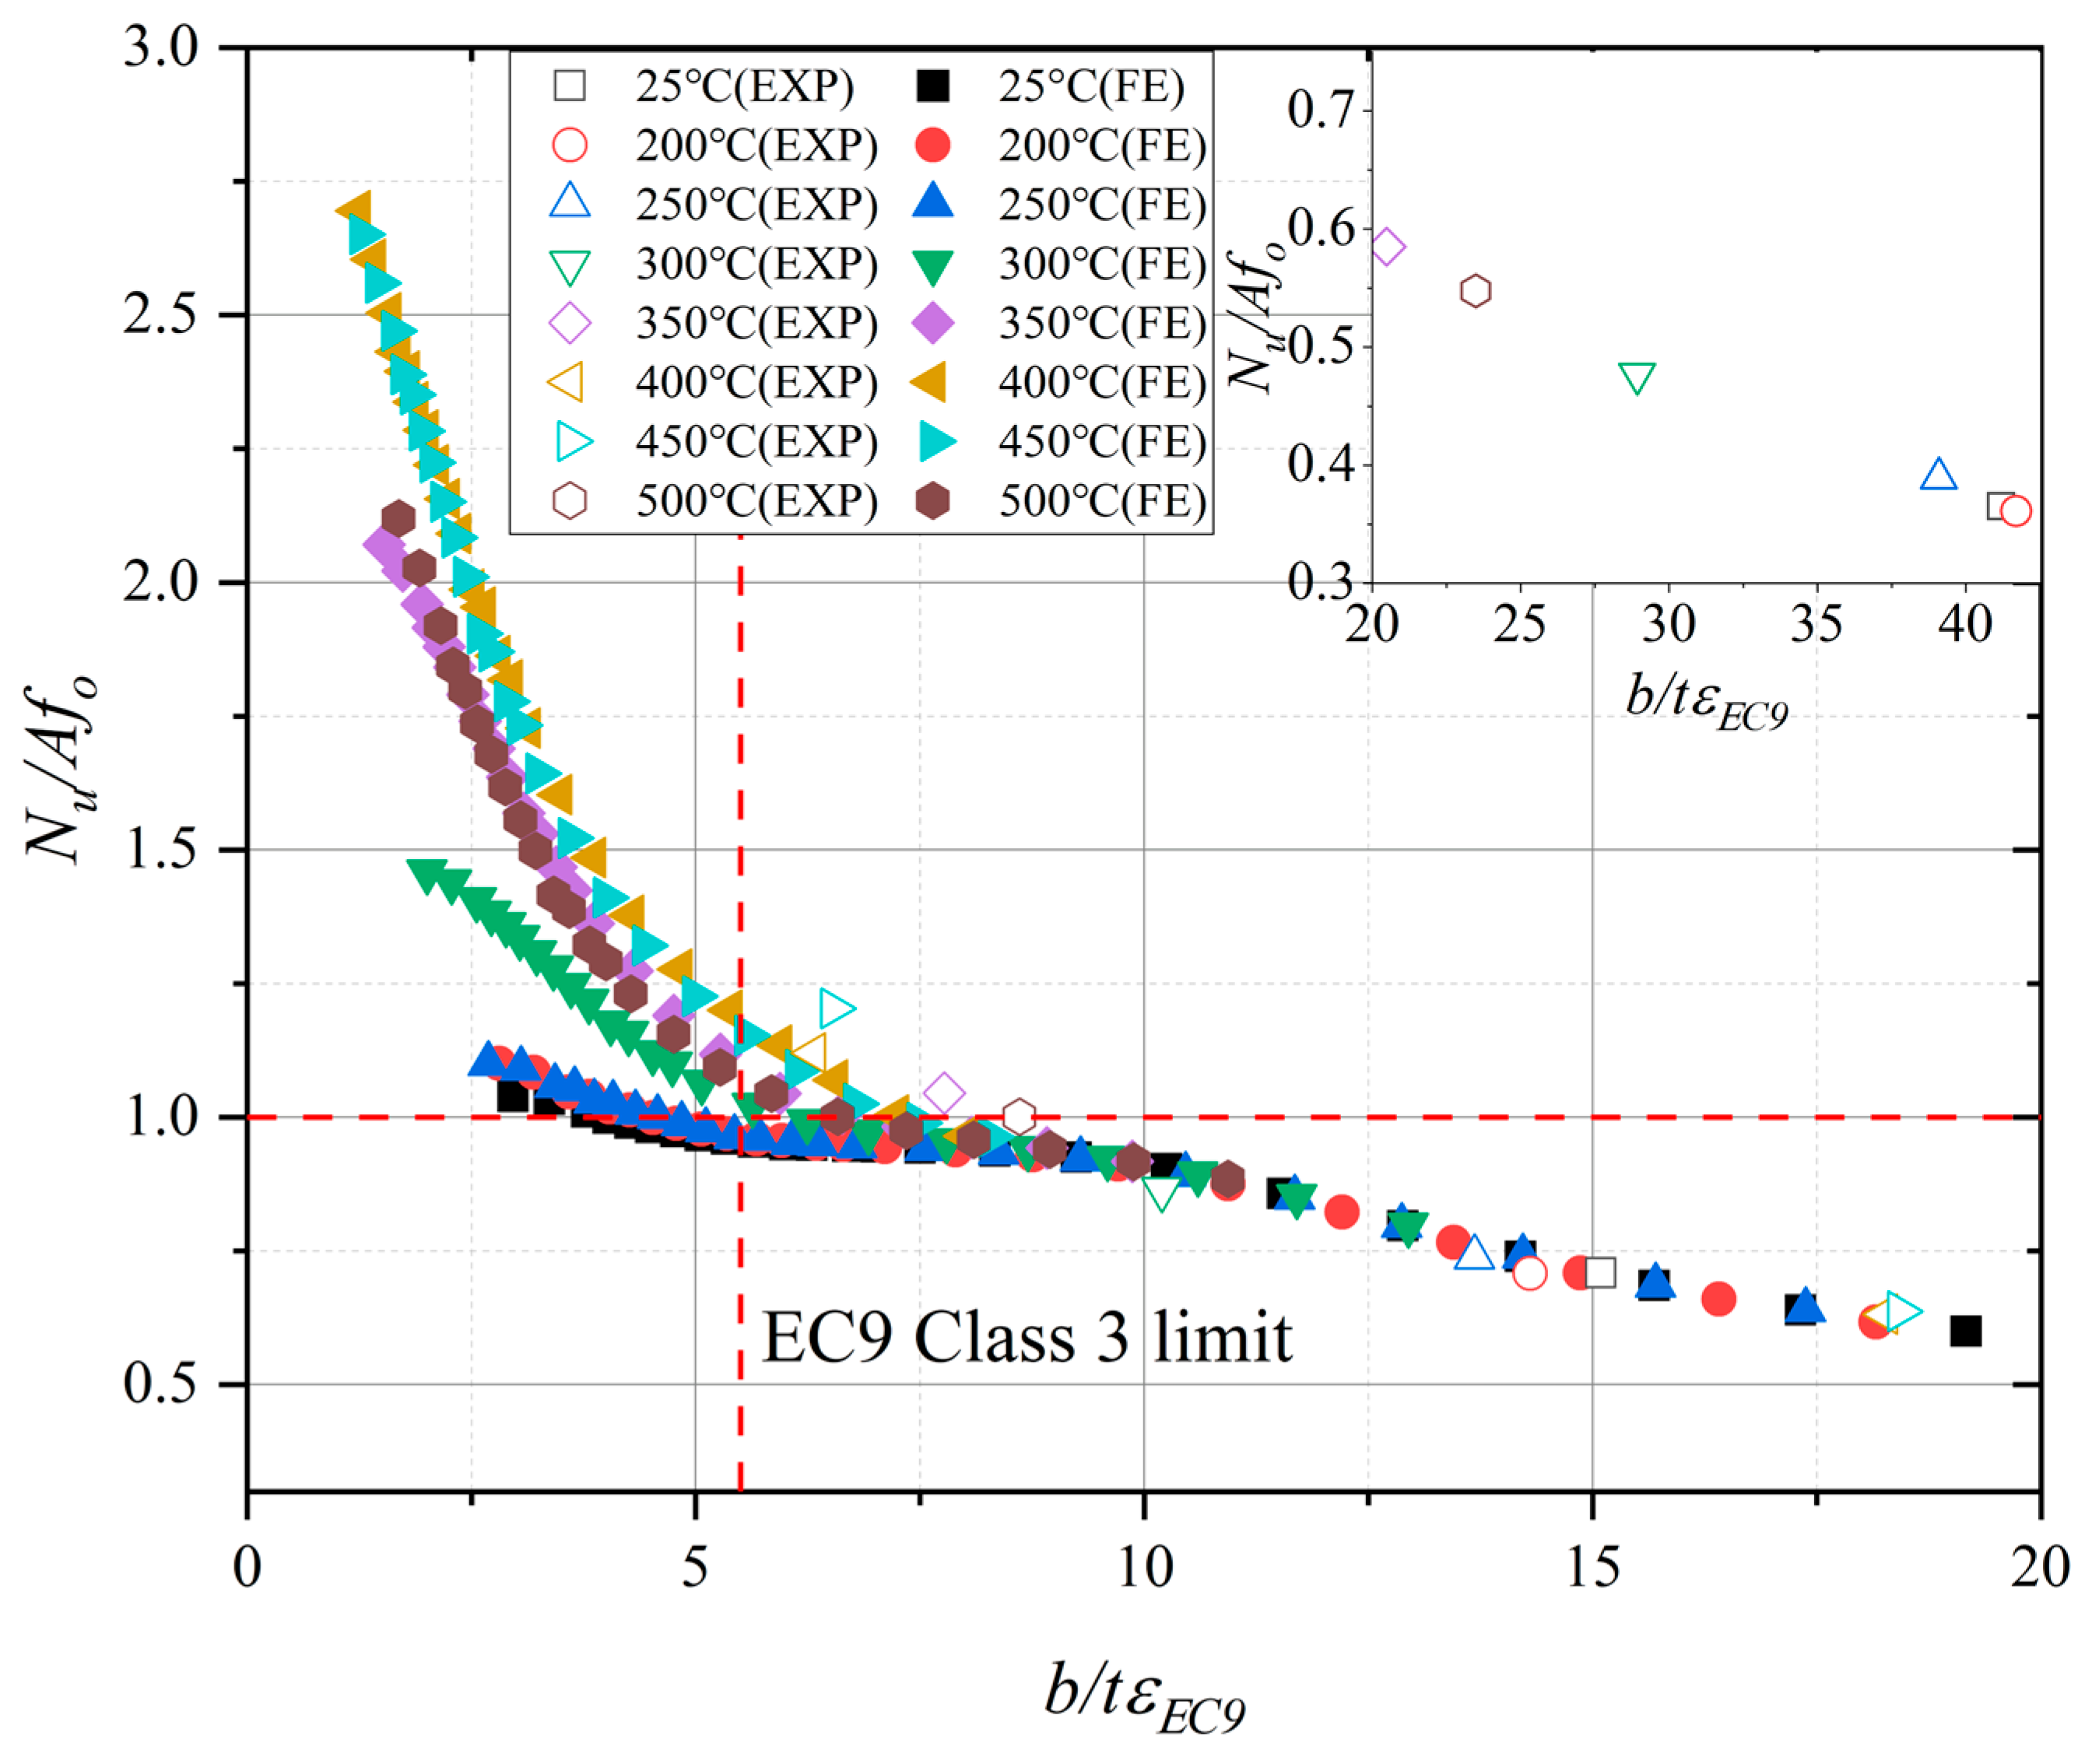
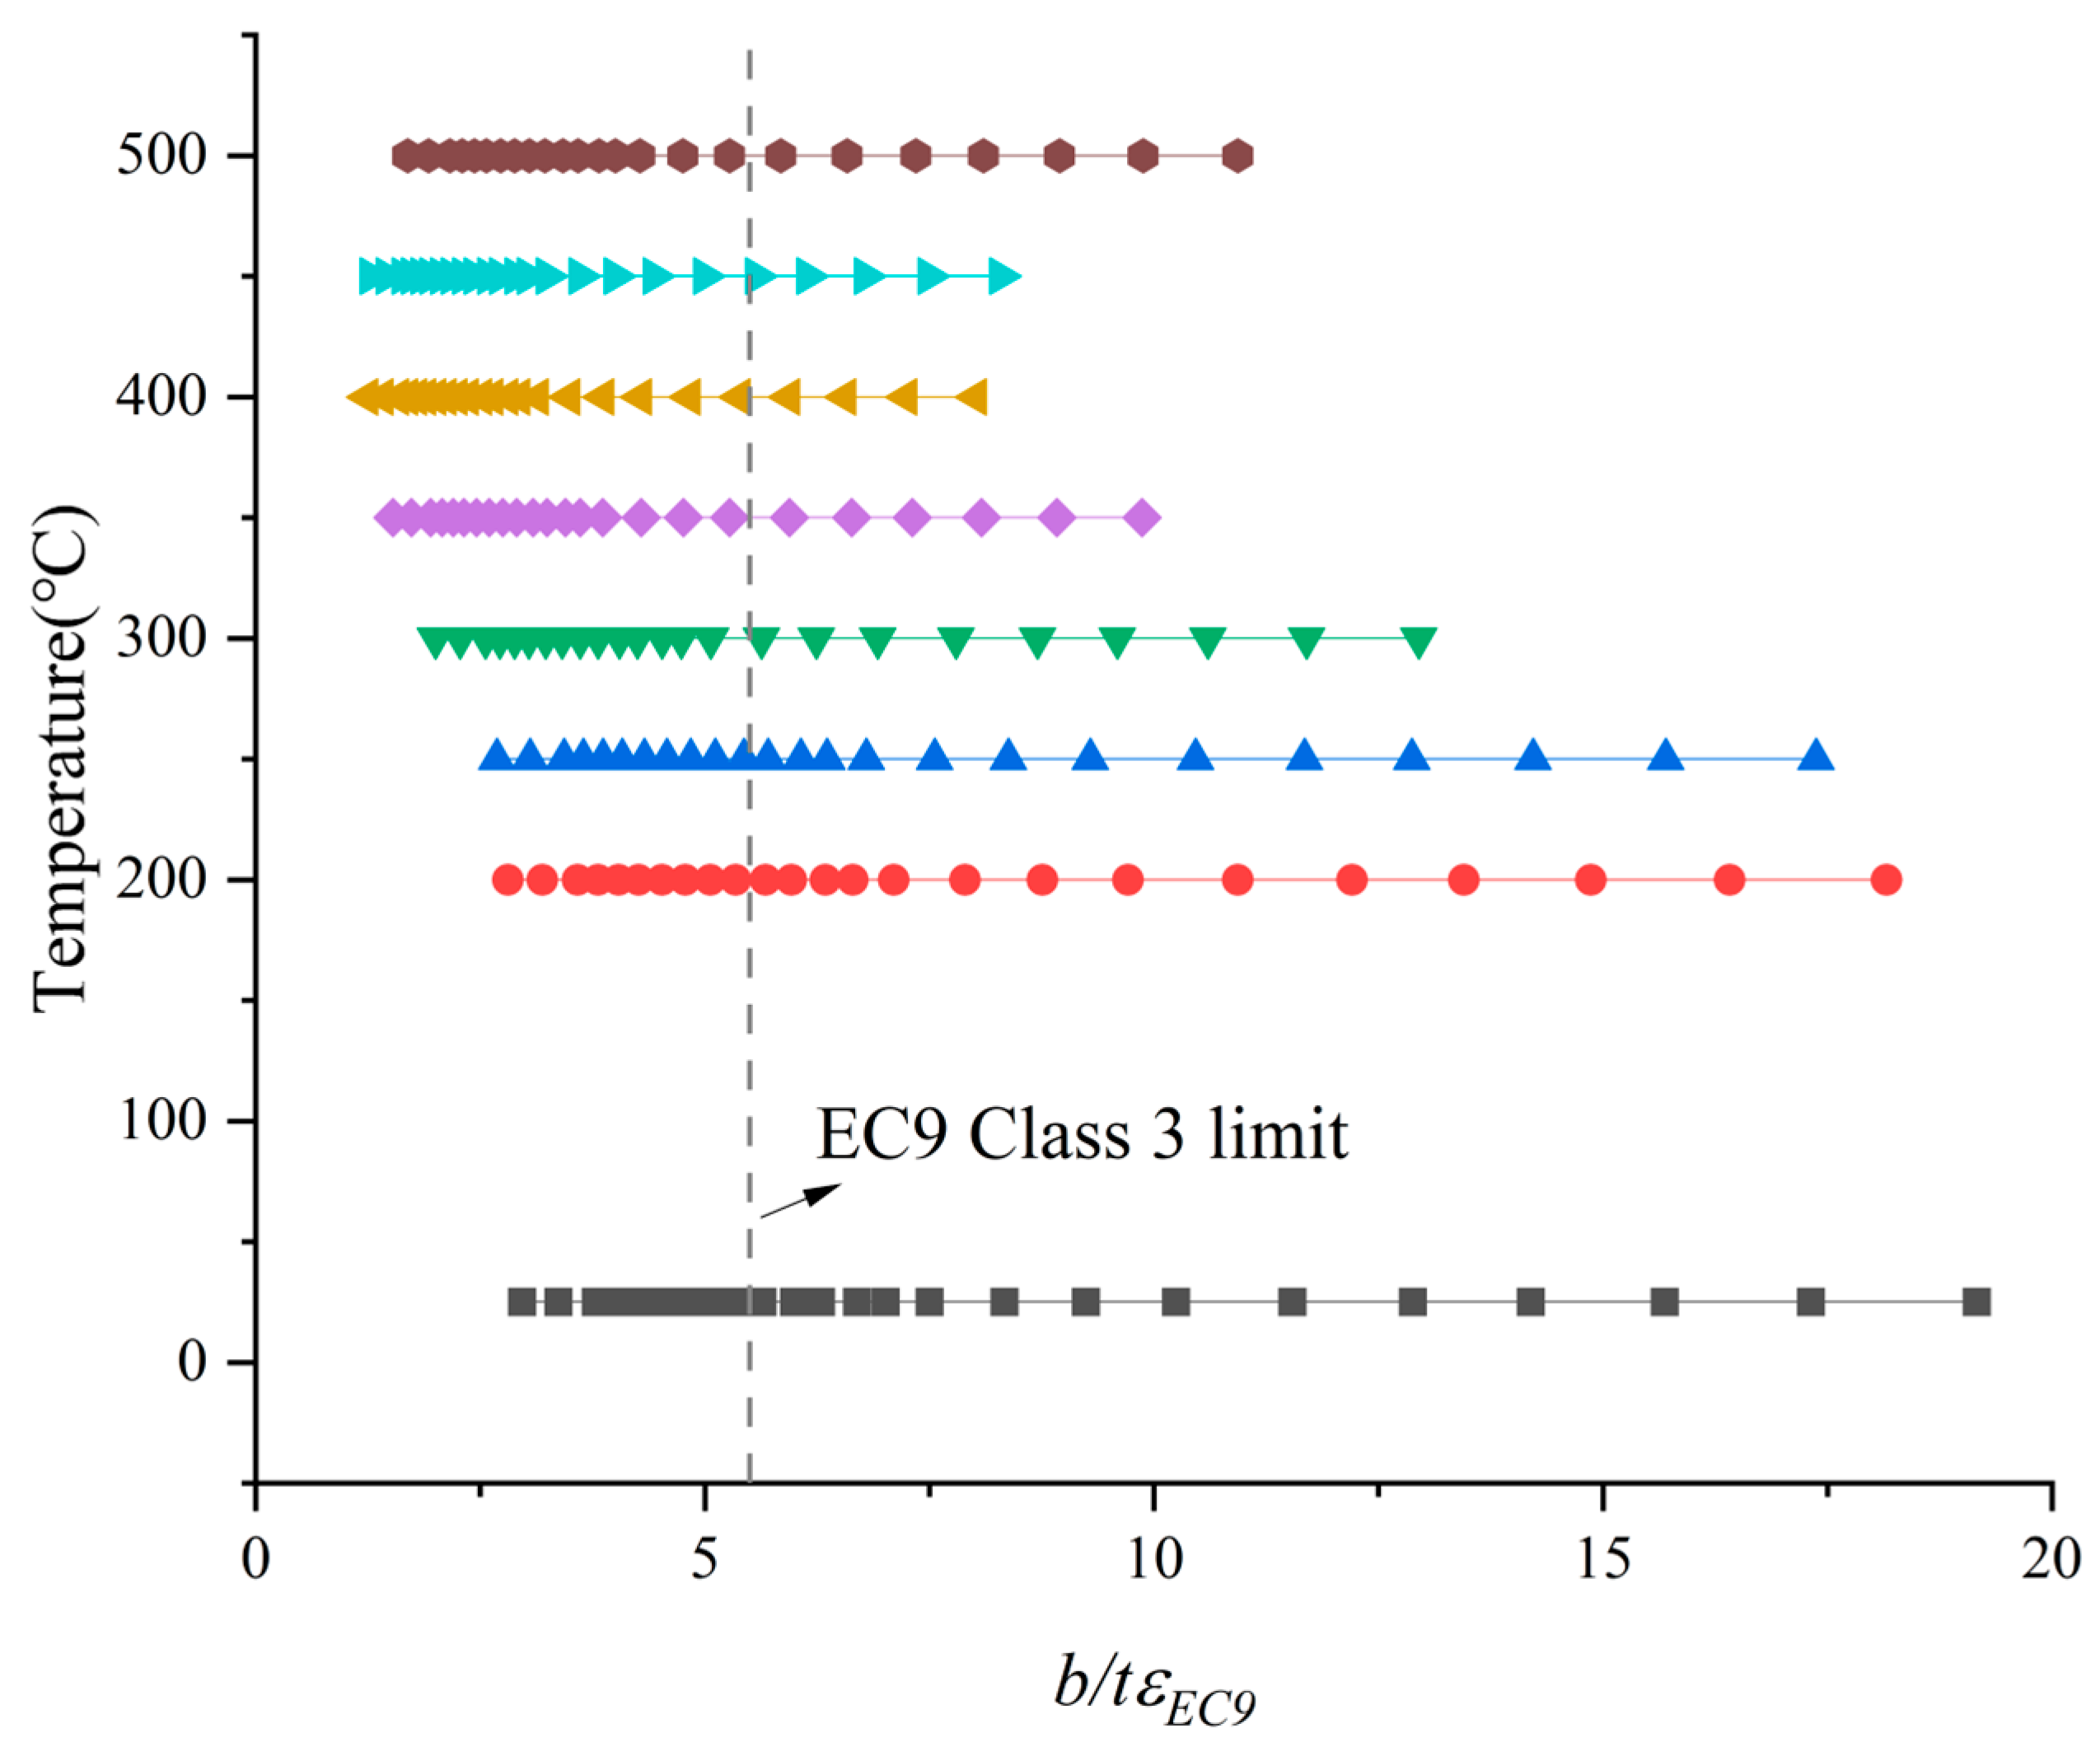
The experiments were carefully compared with the findings of the study using the numerical modelling approach. The previously indicated numerical modelling technique was then used to perform a parametric analysis. The key parameters considered were the geometric dimensions and elevated temperatures, as outlined in Table 4. The geometric dimensions include the width and thickness of the outer flanges. The outer flange width varied from 50 to 280 mm, and the thickness was in the range of 3.6–40.2 mm. The length was three times the outer flange height in every numerical model. Elevated temperatures ranged from 200 to 500 °C, where the interval was 50 °C. A virgin specimen without exposure to elevated temperatures was also included as a benchmark. In total, 192 numerical models were used in the parametric study. Notably, εEC9 = (250/fo)0.5, where fo represented the 0.2% proof strength. εEC9 exerted influence on slenderness parameters, thereby affecting cross-section classes. For the 6063-T5 aluminium alloy angle section SCs studied, the threshold value distinguishing Classes 3 and 4 was set to 5.5, as depicted in Figure 13. Variations in the mechanical properties of 6063-T5 aluminium alloy were induced by varying the elevated temperatures. Consequently, different εEC9 values were derived from the experimental results of the mechanical properties. All of the numerical models in this parametric investigation had their b/EC9 values calculated. It is clear that this parametric analysis includes the non-slender (Classes 1, 2, and 3) and slender (Class 4) cross-sections listed in EC9 [28]. The effects of the elevated temperatures on the ultimate resistance of 6063-T5 aluminium alloy angle section SCs were comprehensively revealed through a parametric study. The geometric dimensions used for the numerical models in the parametric investigation were thus deemed suitable.

4. Post-Fire Ultimate-Resistance Evaluation

Despite the changes in the mechanical properties of the 6063-T5 aluminium alloy following exposure to elevated temperatures, the nonlinear features of the stress–strain curves remained largely parallel. Notably, research pertaining to 6063-T5 aluminium alloy SCs unaffected by fire exposure served as the foundation for the development of current design codes. Thus, it is imperative to assess whether these current design codes are applicable for predicting the resistance performance of 6063-T5 aluminium alloy SCs after exposure to elevated temperatures. This assessment considered the design codes outlined in EC9 [28], ADM-2020 [40], AS/NZS 1664 [41], and GB 50429-2007 [42].

4.1. Eurocode (EC9)

The EC9 [28] provides design methods for aluminium alloy structures without exposure to elevated temperatures. The SC’s ultimate resistance was determined using the cross-section categorization framework (Classes 1 through 4), with the flange used to establish the cross-section classification for the angle section. Cross-sectional yield resistance can be attained for members with Class 1, 2, and 3 cross-sections prior to local buckling. However, for Class 4 cross-sections, local buckling developed prior to attaining the cross-sectional yield resistance. Consequently, the design compressive strength for Class 1–3 sections was calculated by Equation (1), with a partial factor γM1 of 1.1. For Class 4 sections, the ultimate resistance was evaluated using the effective area Aeff, defined as the sum of the component plate areas based on the effective thickness teff. Because of the local buckling, the teff = ρct. Equation (2) was used to calculate the local buckling factor ρc, where ψ = 1. Notably, for flat outstand parts in asymmetrical cross-sections, the ρc value should not be larger than the limit in Equation (3). According to EC9 provisions [28], the values of these classification constants C1 and C2 for unwelded outstand flanges were taken as 9.5 and 22, respectively. In this study, the 6063-T5 aluminium alloy tubes were classified as buckling class B in EC9 [28]. Subsequently, using the slenderness limits outlined in EC9 [28], the values of β2/ε and β3/ε were determined to be 4.5 and 5.5, respectively, for the outstand flange. A class of numerical models can be established with reference to slenderness limits. Subsequently, the ultimate resistance of the 6063-T5 aluminium alloy angle section SC was determined using Equation (1).
The EC9 slenderness boundary distinguishing Class 3 from Class 4 was evaluated by numerical findings, which are presented in Figure 14. For flat outstand elements without stress gradients, β was defined as b/t, and the b/EC9 of the slenderest plate element within the cross-section. In equal-leg angle sections, b was taken as B-t, where B denotes the full width of the plate, and t was the thickness. Here, εEC9 = (250/fo)0.5. According to EC9, the slenderness limit for outstand plate elements in compression, distinguishing slender from non-slender sections, was 5.5. The nondimensional ratio Nu/Afo was employed to illustrate the evolution of plastic resistance in the cross-section. In the fire-unexposed numerical model, when the ratio b/EC9 was below 5.5, the ratio Nu/Afo typically exceeded 1. Conversely, when b/EC9 exceeded 5.5, Nu/Afo gradually decreased below 1. Thus, the slenderness limit specified in EC9 is applicable for 6063-T5 aluminium alloy angle section SCs without fire exposure. After subjecting the SCs to various elevated temperatures, the aforementioned slenderness limit in EC9 remained deemed appropriate and safe, as depicted in Figure 14. Consequently, the differences in the slenderness limitation for Class 3 and Class 4 sections might be disregarded for the 6063-T5 aluminium alloy angle section SCs after exposure to different elevated temperatures.
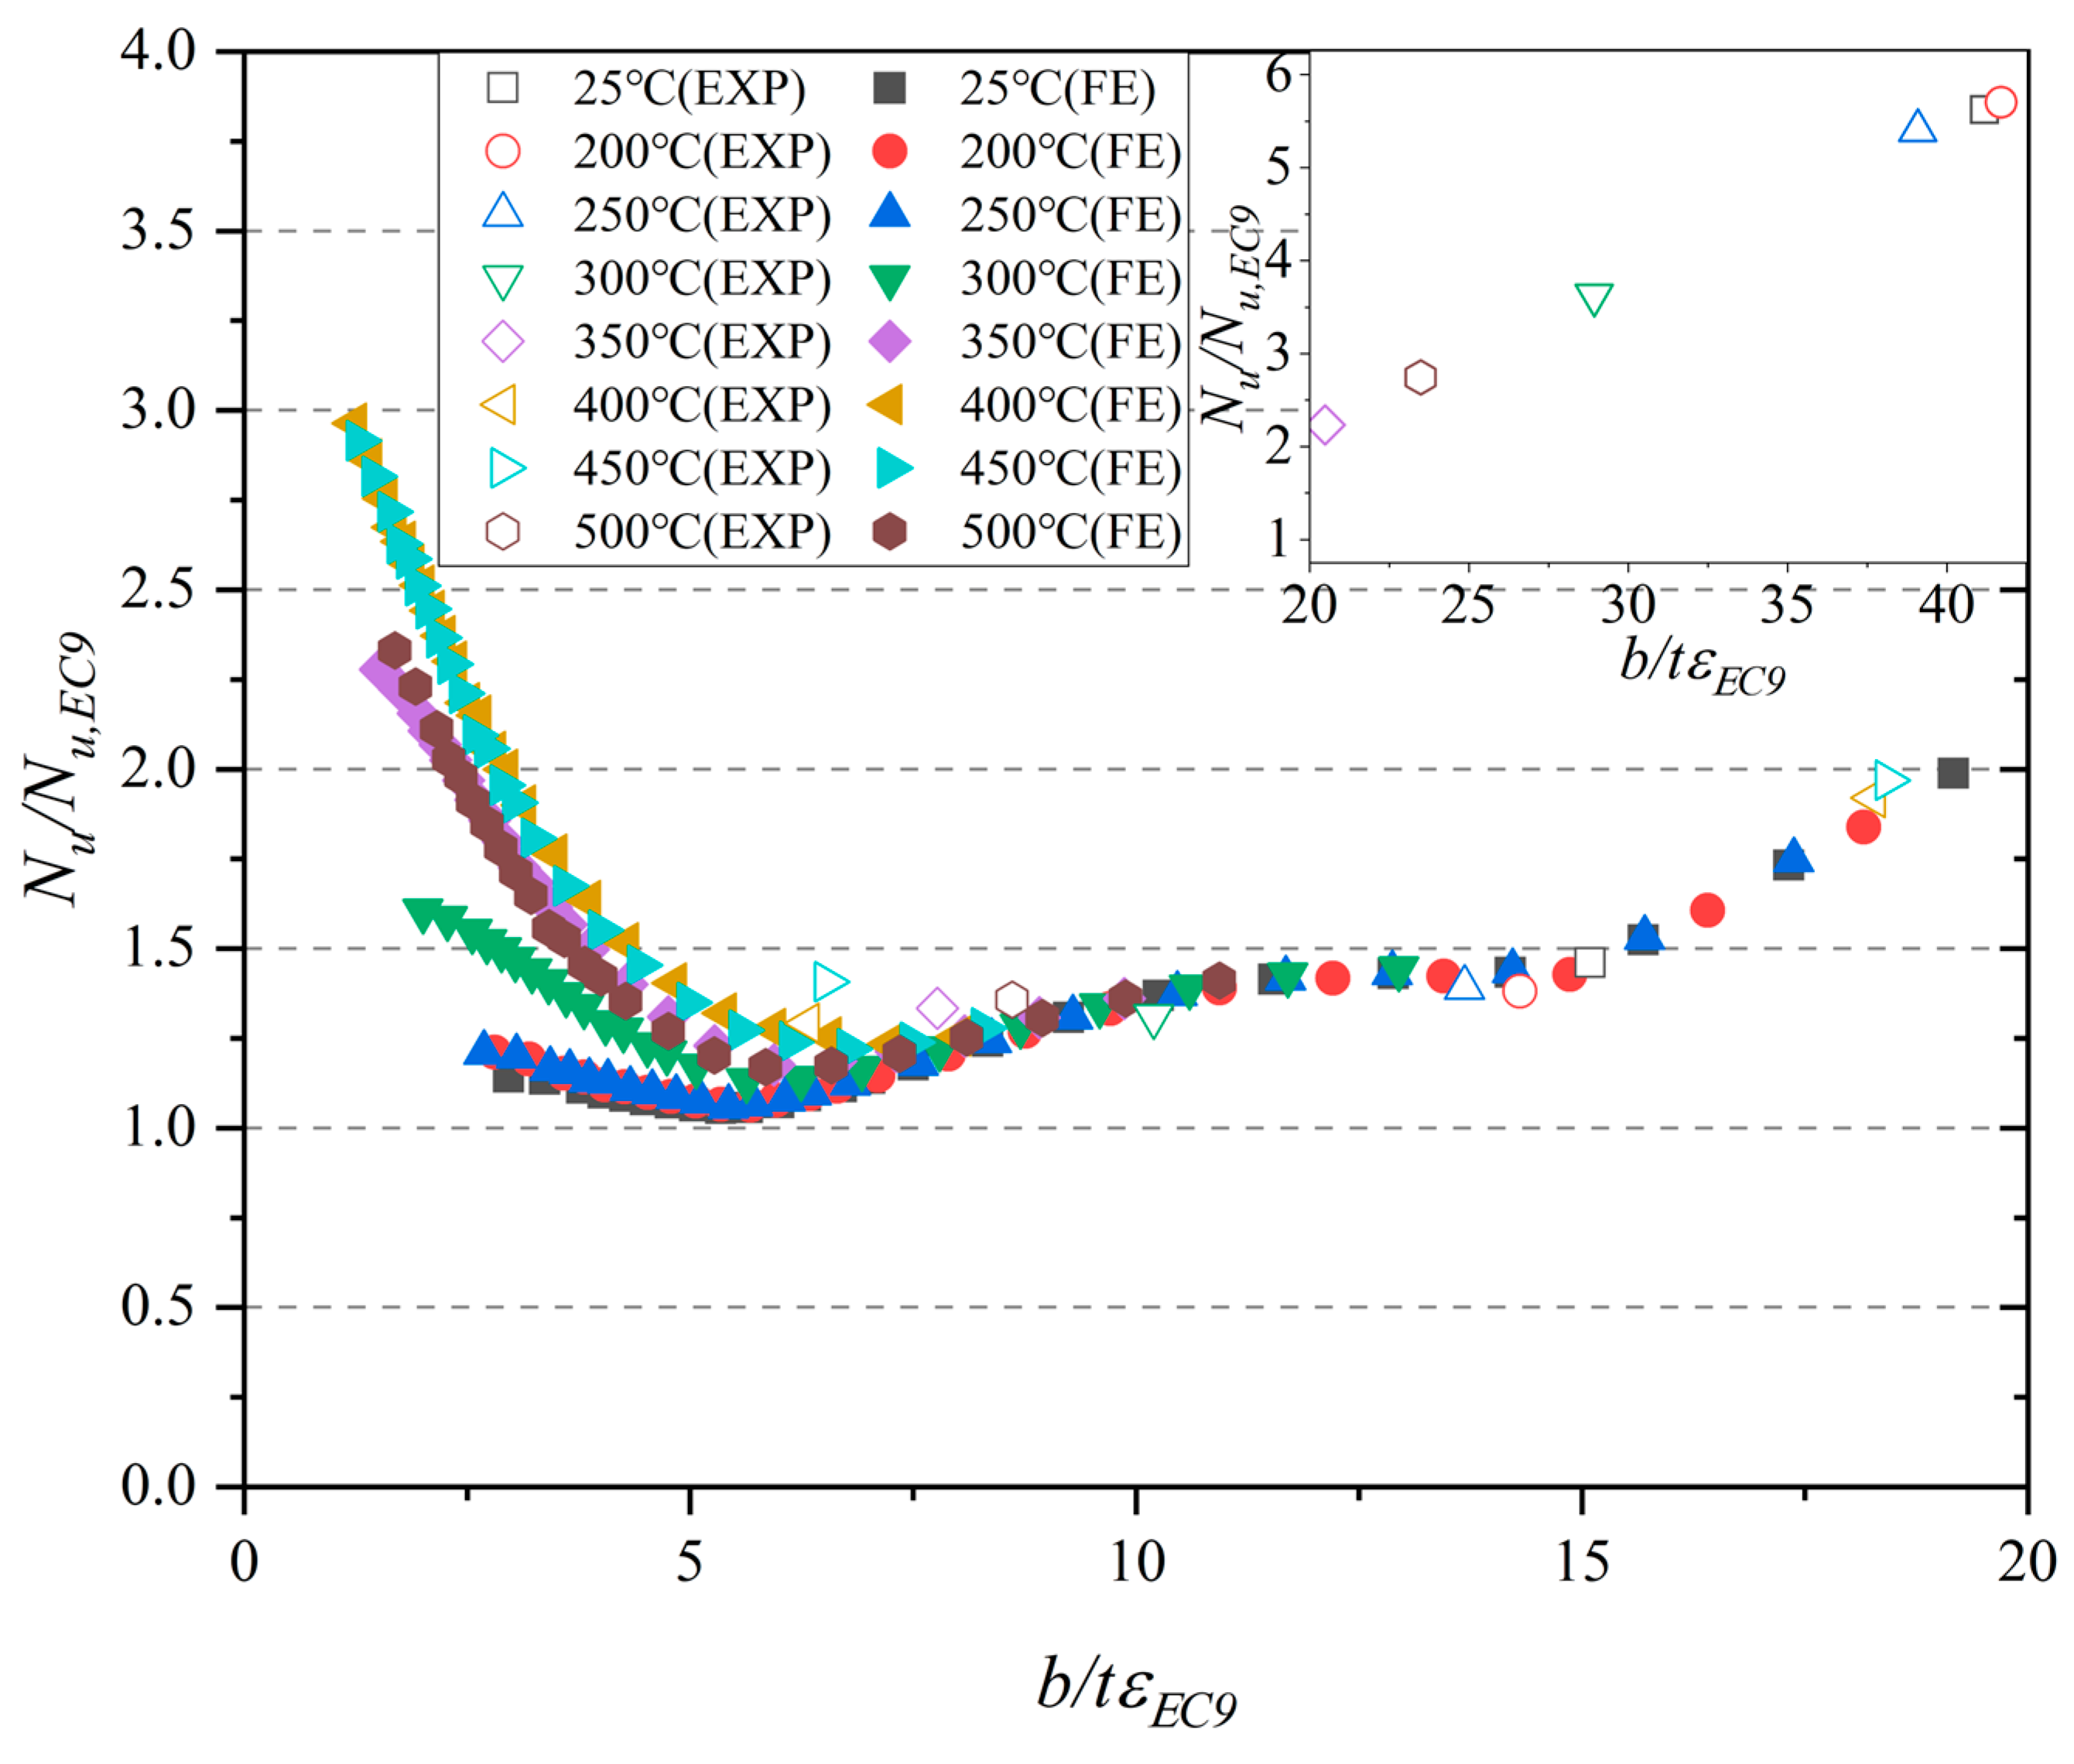
A comparison of the numerical, experimental, and EC9-predicted results of the ultimate resistances is illustrated in Figure 15. The mean values and COVs of Nu,FE/Nu,EC9 for the SCs with and without exposure to various elevated temperatures were as follows: 1.25/0.19 (25 °C), 1.24/0.15 (200 °C), 1.23/0.14 (250 °C), 1.35/0.10 (300 °C), 1.66/0.22 (350 °C), 2.04/0.28 (400 °C), 1.98/0.28 (450 °C), and 1.59/0.22 (500 °C). For the ratio Nu,test/Nu,EC9, the mean values and COVs were 3.54/0.59 (25 °C), 3.54/0.61 (200 °C), 3.40/0.59 (250 °C), 2.47/0.47 (300 °C), 1.78/0.25 (350 °C), 1.61/0.20 (400 °C), 1.69/0.17 (450 °C), and 2.05/0.34 (500 °C). Figure 15 indicates that the design approaches outlined in EC9 are suitable for 6063-T5 aluminium alloy angle section SCs without fire. Even after exposure to elevated temperatures of 200 °C and 250 °C, it exhibited good accuracy. However, at temperatures exceeding 300 °C, the accuracy of the EC9 design provisions significantly diminished. When b/EC9 was less than 5.5, the EC9 design approaches were overly conservative for predicting the ultimate resistance of 6063-T5 aluminium alloy angle section SCs after exposure to elevated temperatures. For 6063-T5 aluminium alloy, the strain-hardening behaviour was pronounced as temperatures surpassed 300 °C. Consequently, for specimens with non-slender cross-sections, strain-hardening transpires subsequent to the attainment of yield strength fo. Thus, values of the ultimate resistances of SCs with non-slender cross-sections were notably higher than the results predicted by the EC9 design approaches when exposed to temperatures exceeding 300 °C. When the b/EC9 value was relatively large, ρc was controlled on the basis of Equation (3). The methodology of EC9 [28] was overly conservative for direct application to 6063-T5 aluminium alloy angle section SCs with and without exposure to elevated temperatures.
N u , E C 9 = A f o / γ M 1 for   Class   1 3   sections A e f f f o / γ M 1 for   Class   4   sections
ρ C = C 1 β ε 3 + ψ C 2 4 β / ε 2       if β ε > 1 2 C 1 + C 1 2 C 2 3 + ψ
ρ C 120 β / ε 2

4.2. American Design Manual (ADM-2020)

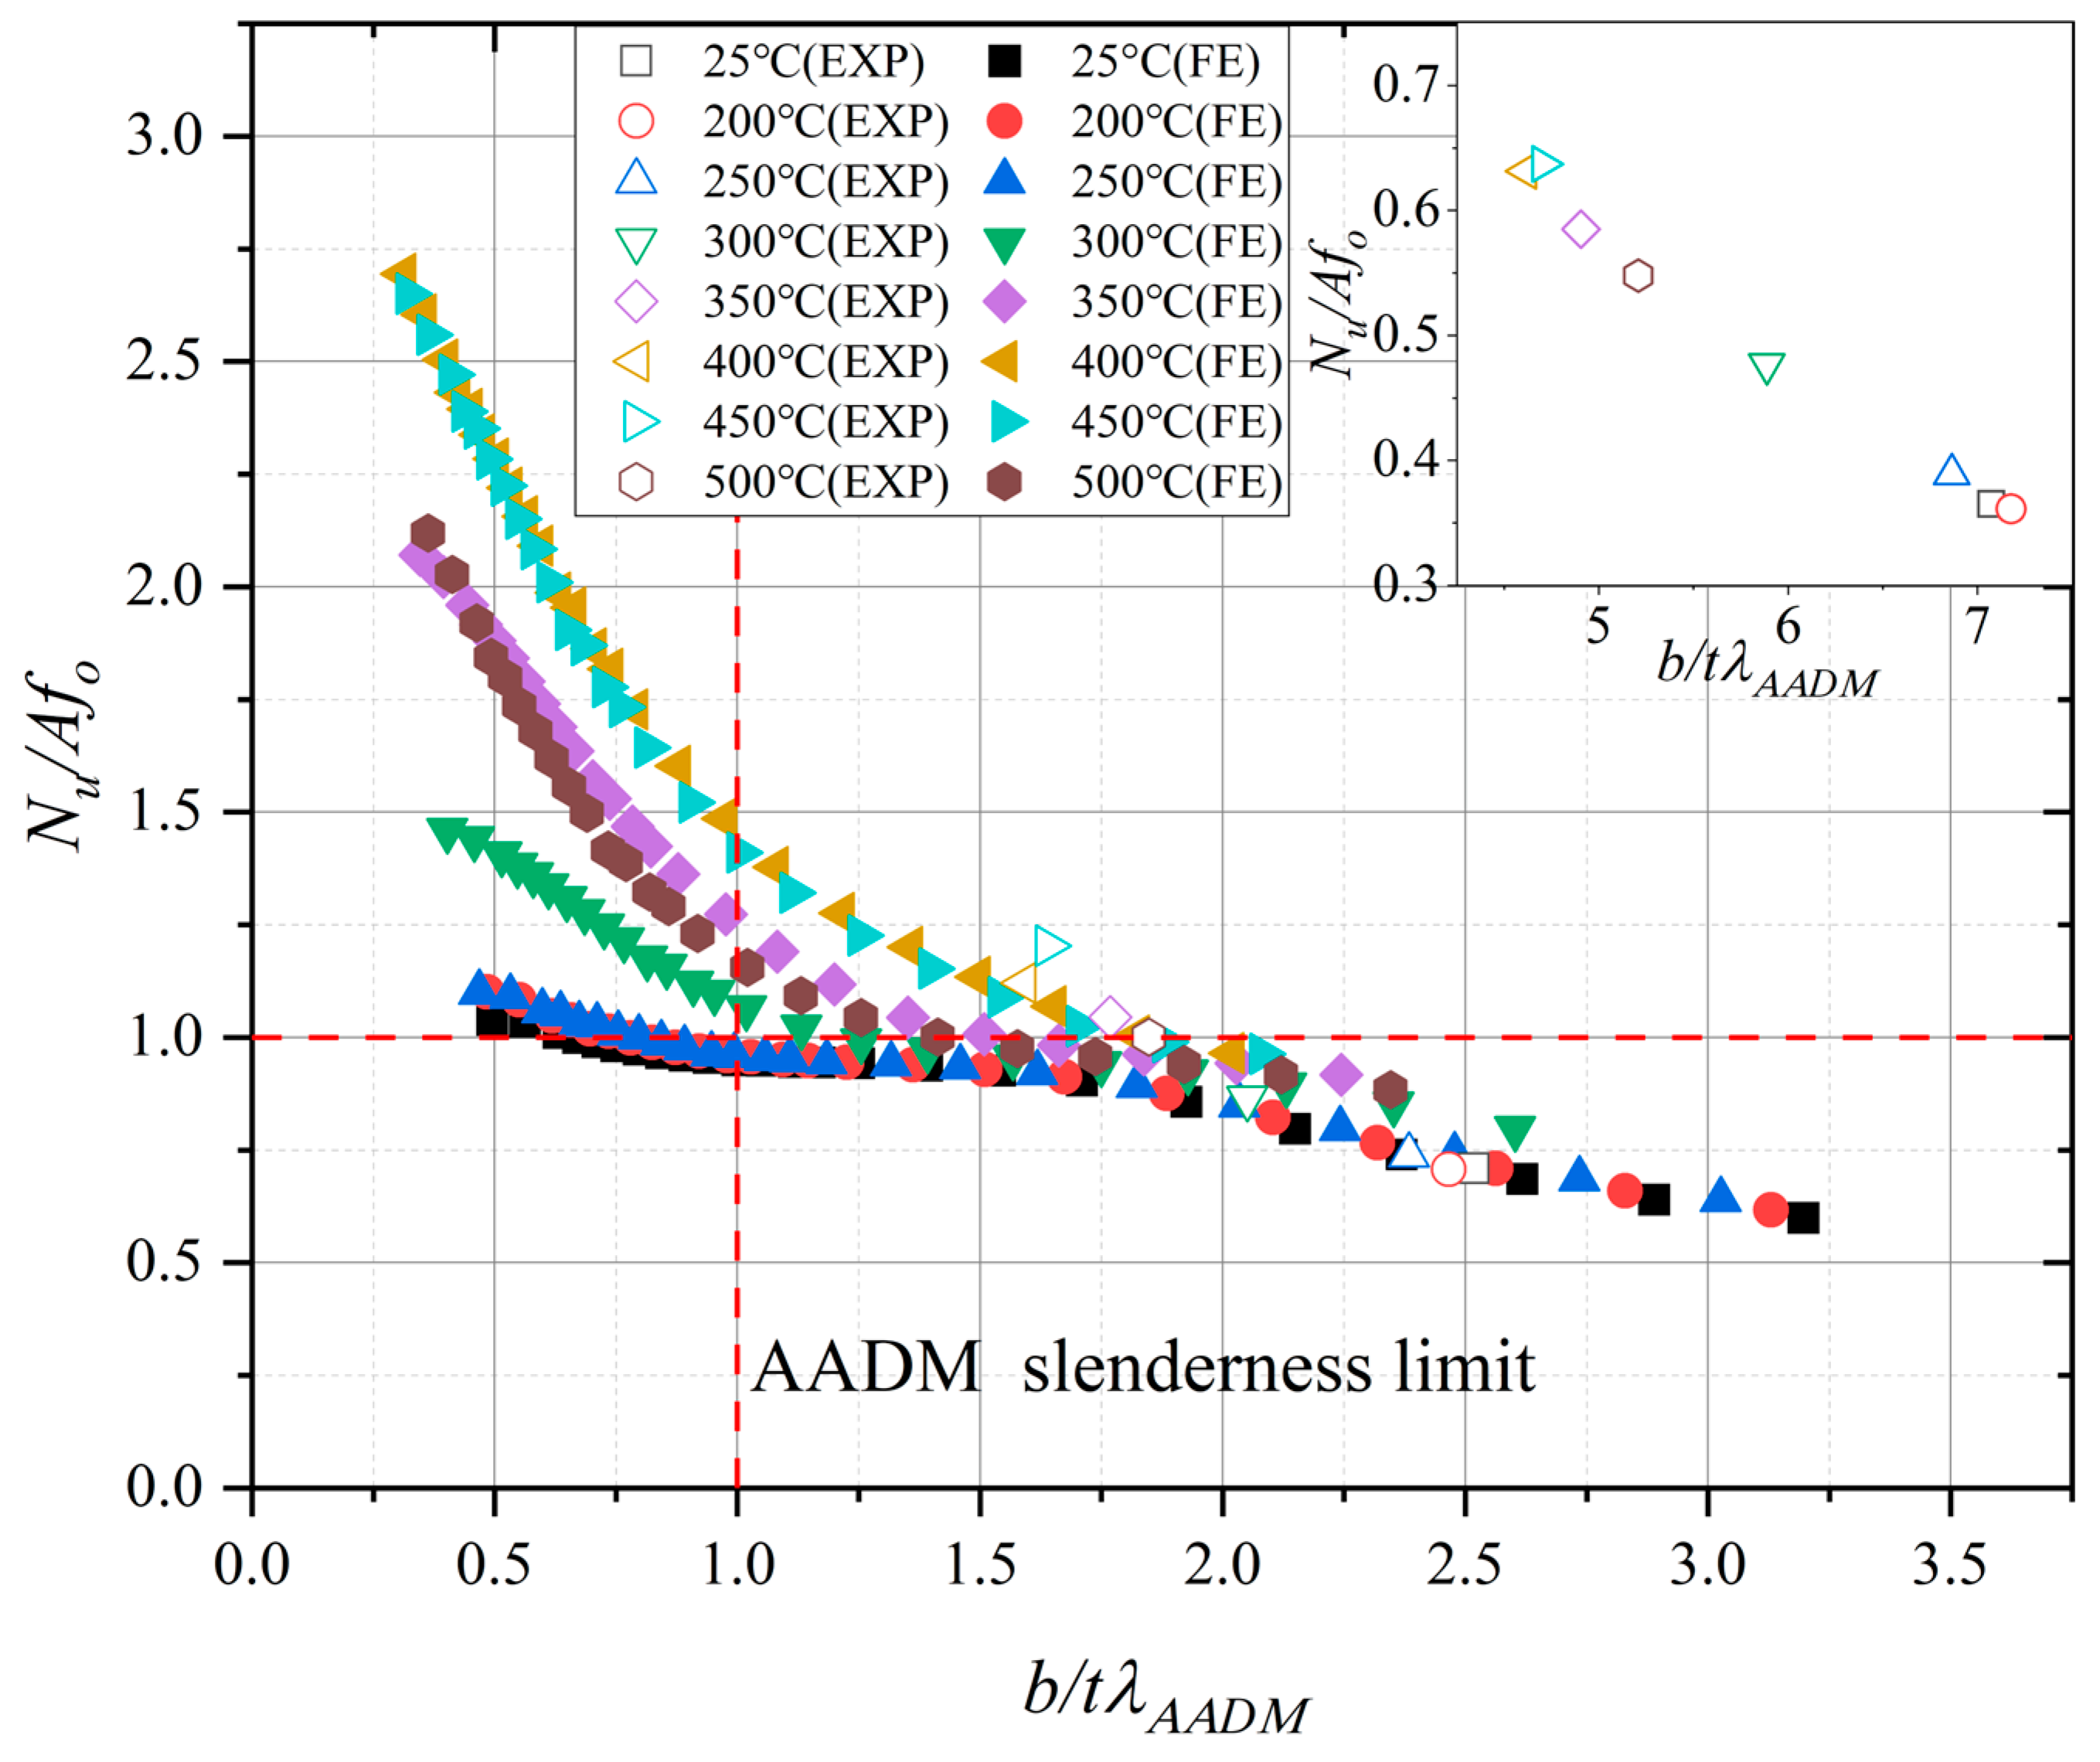
For ADM-2020 [40], the ultimate resistance of the aluminium alloy SC was calculated by the full cross-sectional area, as expressed in Equation (4), and Pnc was calculated using Equation (5). Ai represents the area of each constituent plate element i. Further, ϕc denotes the resistance factor, set at 0.9. fc represents the compressive critical stress determined using Equation (6) and is influenced by various factors, including the width-to-thickness ratio of constituent plate β, nominal yield strength fo, elastic modulus E, and buckling constants Bp and Dp. The values of λ1 = (Bp fo)/(5.0Dp) and λ2 = Cp/5.0. According to ADM-2020 [40], buckling constants Bp and Dp can be determined using Equations (7) and (8). κ = 6.895 MPa, and Cp is determined using Bp and Dp, as shown in Equation (9). As shown in Figure 16, an evaluation of the slenderness limitation in the ADM-2020 [40] was conducted, where λ1 = (Bp fo)/(5.0Dp) was the slenderness limitation between the slender and non-slender cross-sections. The relevant results indicate that the aforementioned slenderness limitation in ADM-2020 [40] accurately classified slender and non-slender cross-sections for 6063-T5 aluminium alloy angle section SCs without fire exposure. When the elevated temperatures did not exceed 250 °C, the effectiveness and safety of the above slenderness limitation in ADM-2020 [40] persisted. However, at temperatures exceeding 300 °C, the conservative nature of the ADM-2020 [40] was attributed to differences in the post-fire mechanical properties of the 6063-T5 aluminium alloy.
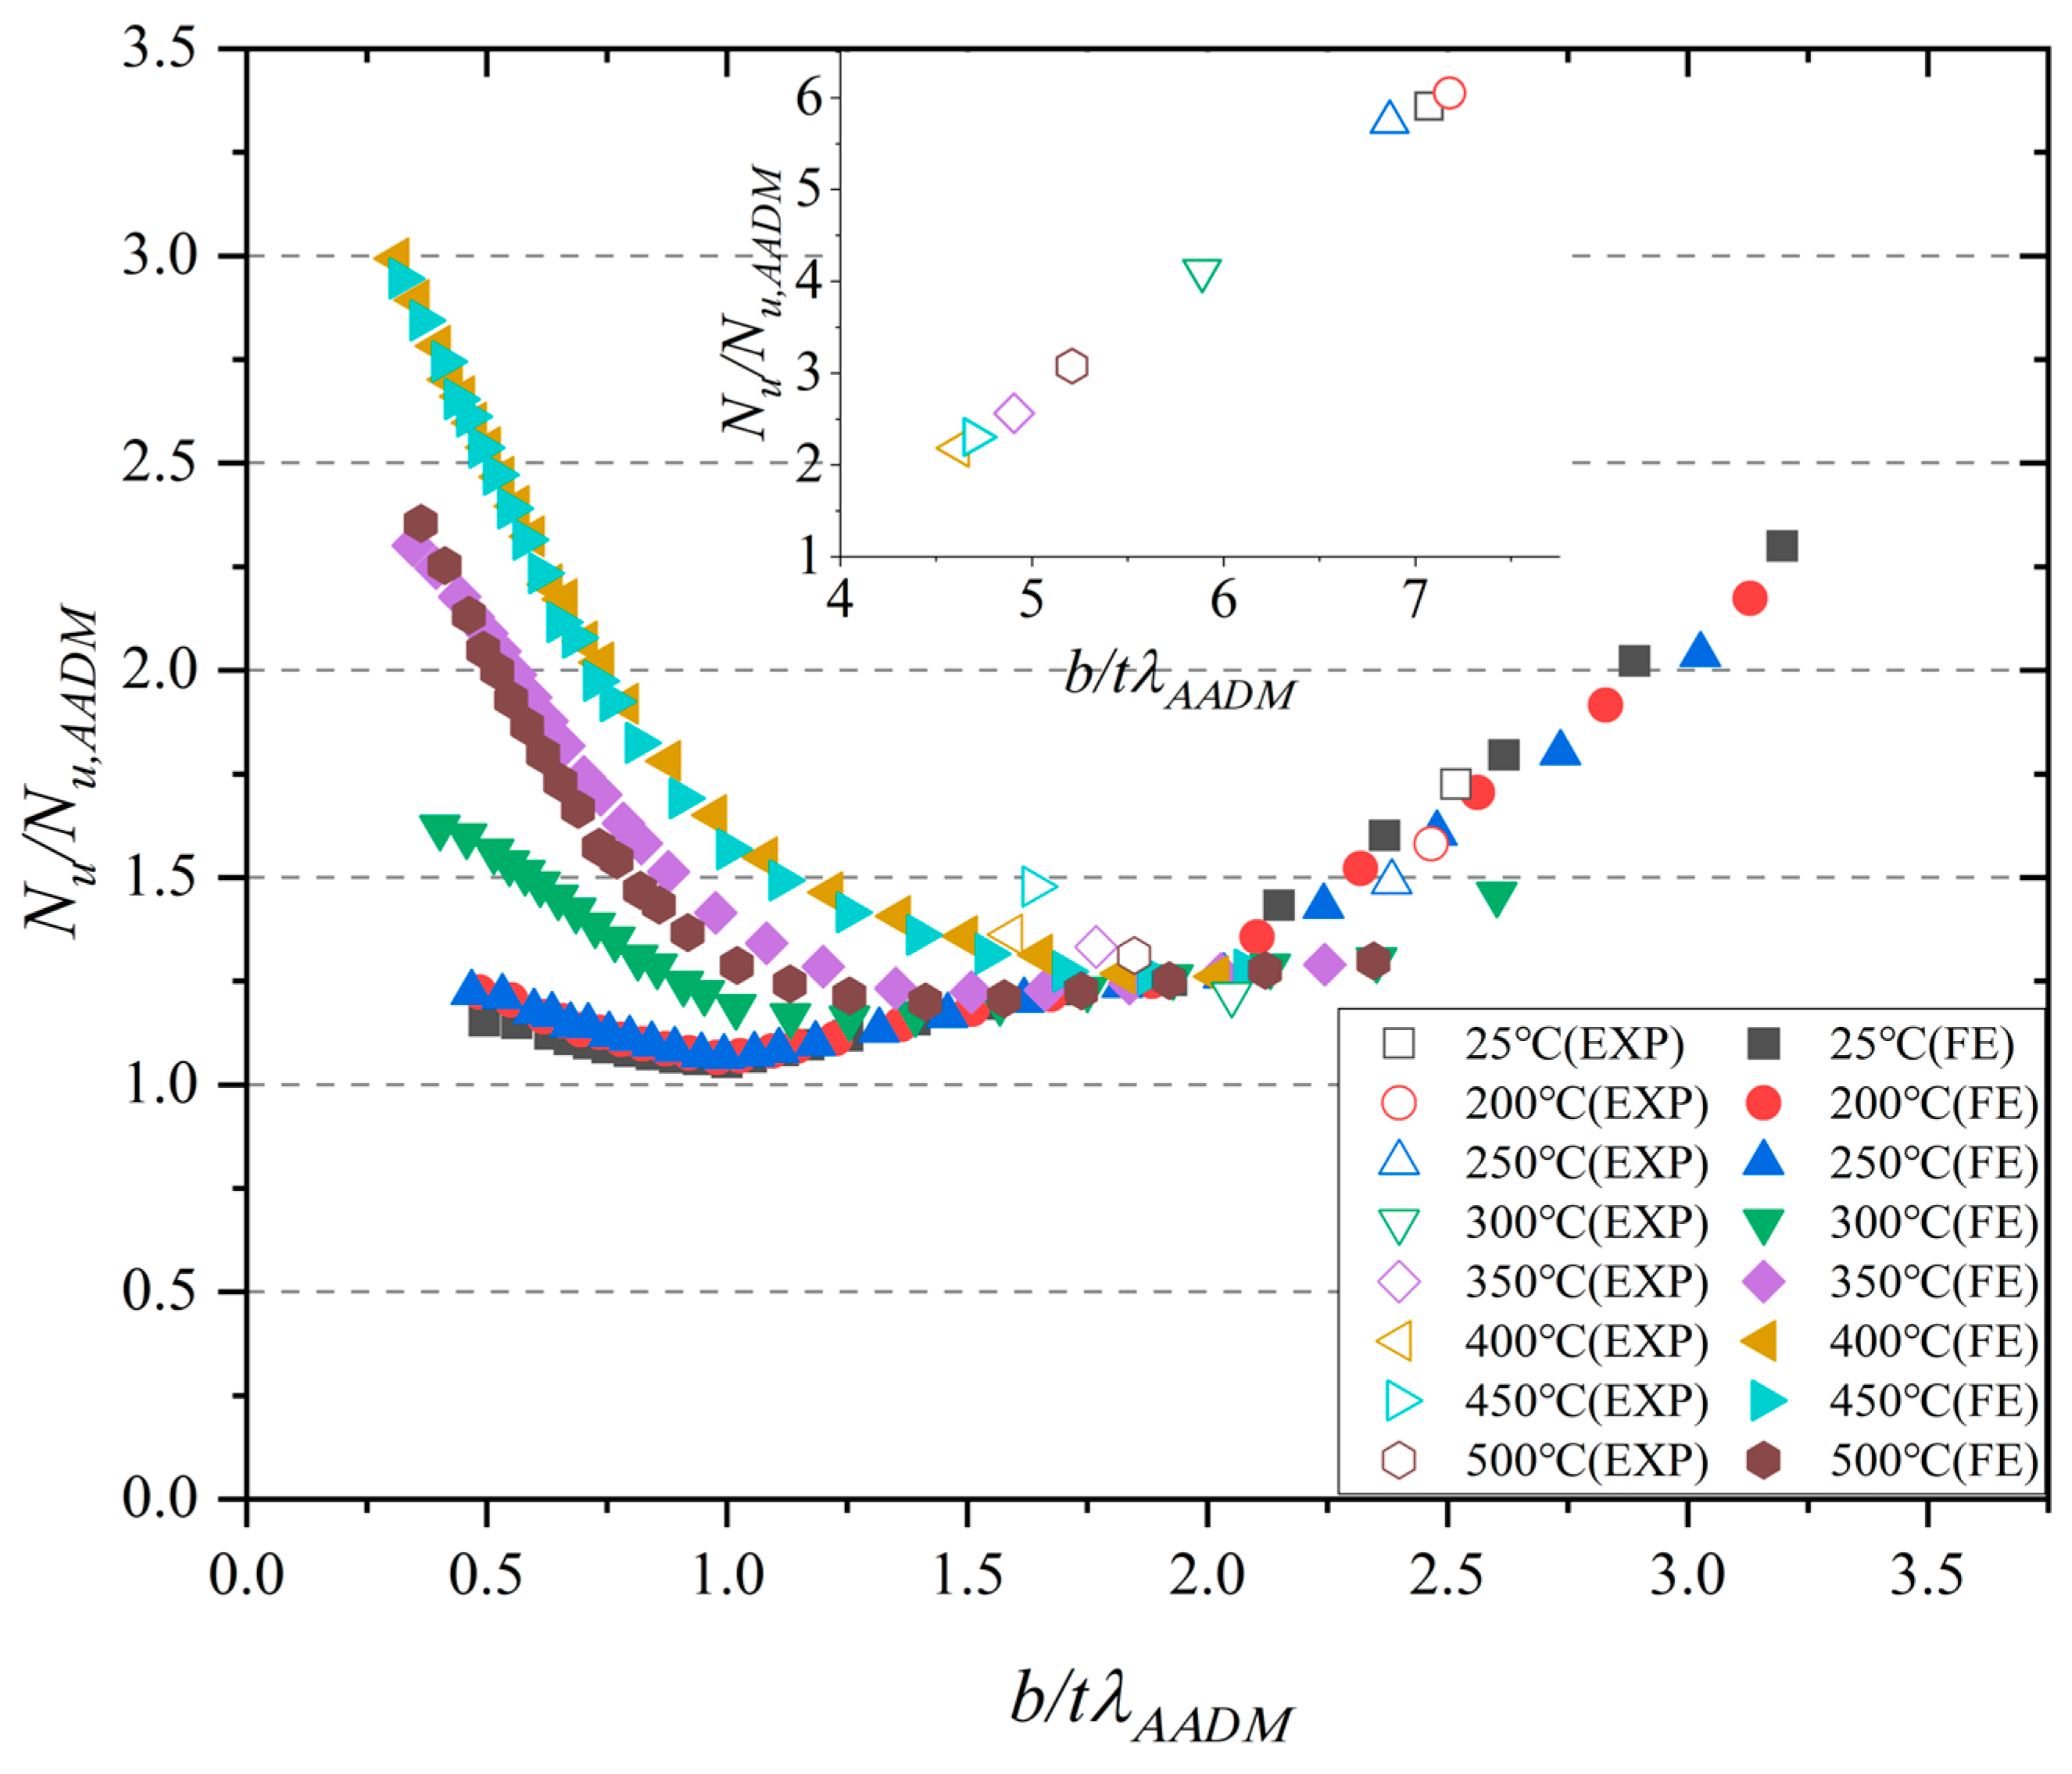
A comparison of the numerical and experimental results and ADM-2020 [40]-predicted results of the ultimate resistance is depicted in Figure 17. The mean values and COVs of Nu,FE/Nu,AADM for the SCs, both without fire and after exposure to various temperatures, were 1.27/0.26 (25 °C), 1.26/0.22 (200 °C), 1.24/0.19 (250 °C), 1.35/0.11 (300 °C), 1.68/0.22 (350 °C), 2.07/0.27 (400 °C), 2.01/0.27 (450 °C), and 1.60/0.23 (500 °C). For the ratio Nu,test/Nu,AADM, the mean values and COVs were 3.82/0.55 (25 °C), 3.82/0.59 (200 °C), 3.66/0.59 (250 °C), 2.67/0.54 (300 °C), 1.95/0.32 (350 °C), 1.77/0.23 (400 °C), 1.89/0.22 (450 °C), and 2.20/0.40 (500 °C). According to ADM-2020, the ultimate resistance of unexposed 6063-T5 aluminium alloy angle SCs could be accurately predicted when b/AADM < 2. For relatively large b/AADM, ADM-2020 provided conservative predictions for unexposed 6063-T5 aluminium alloy angle SCs. At elevated temperatures that remained below 300 °C, the ADM-2020 remained suitable for the SCs after exposure to elevated temperatures, when the b/AADM < 2. However, for temperatures at or above 300 °C, the predictive accuracy of ADM-2020 significantly diminished. For b/AADM < 1, ADM-2020 was excessively conservative for predicting the ultimate resistance of the 6063-T5 aluminium alloy angle section SCs after exposure to elevated temperatures higher than 300 °C. This prediction error was ascribed to differences in the nonlinear characters of the residual stress–strain responses of the 6063-T5 aluminium alloy after exposure to elevated temperatures.
N u , A A D M = ϕ c P n c
P n c = n i = 1 f c i A i + f o A g n i = 1 A i
f c = f o   for b t B p f o 5.0 D p B p 5.0 D p b t   for B p f o 5.0 D p < b t < C p 5.0 π 2 E ( 5.0 b / t ) 2   for b t C p 5.0
B p = f o 1 + f o 1500 κ 1 3
D p = B p 10 B p E 1 2
C p = 0.41 B p D p

4.3. AS/NZS 1664

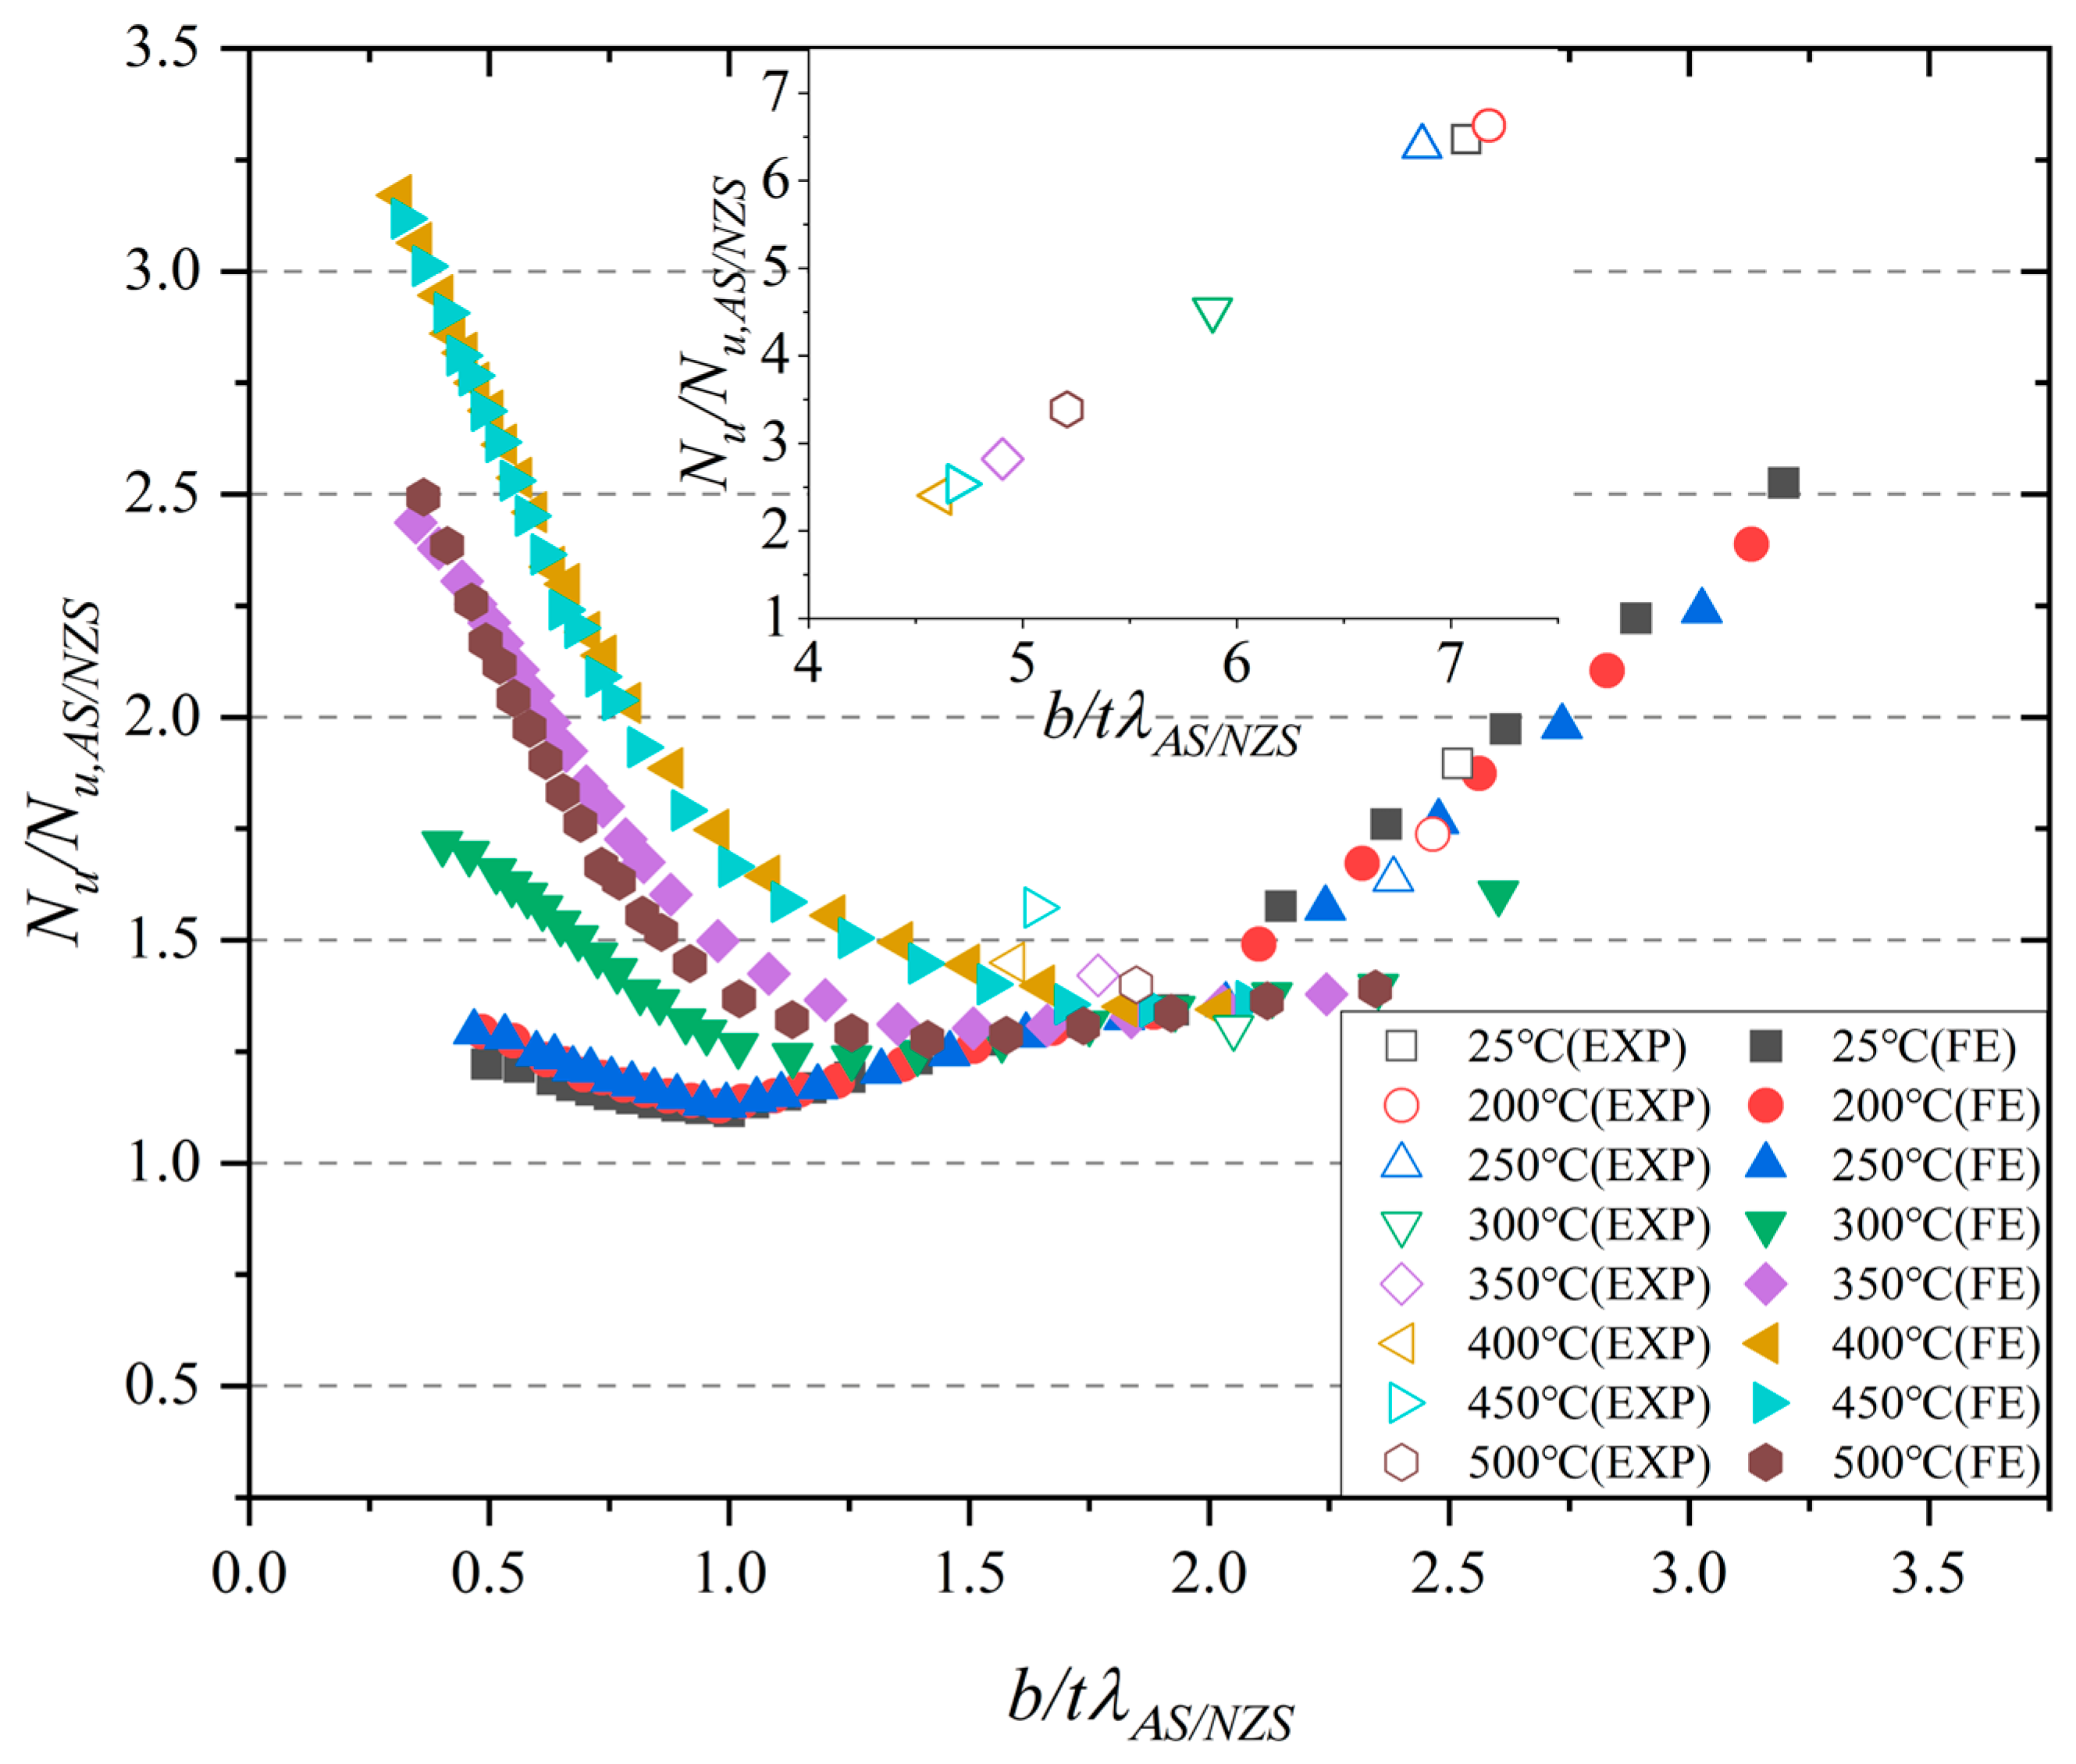
The design approaches of AS/NZS 1664 [41] closely resemble those of ADM 2020 [40]. The ultimate resistances of 6063-T5 aluminium alloy angle section SCs were calculated using the uniform compression provisions, as shown in Equation (10), with factors Φc = 0.85, Φy = 0.95, kc = 1.12, and buckling constants Bp and Dp from Equations (7) and (8) respectively. Since AS/NZS 1664 [41] adopts the same slenderness limitation for slender cross-sections as ADM-2020 [40], it was not reassessed in this section. A comparison of the numerical and experimental results and the AS/NZS 1664 [41]-predicted results of the ultimate resistance is illustrated in Figure 18. The mean values and COVs of Nu,FE/Nu,AS/NZS for the 6063-T5 aluminium alloy angle section SCs, both without fire and after exposure to various temperatures, were 1.36/0.27 (25 °C), 1.35/0.24 (200 °C), 1.33/0.21 (250 °C), 1.44/0.11 (300 °C), 1.78/0.21 (350 °C), 2.20/0.27 (400 °C), 2.13/0.27 (450 °C), and 1.70/0.22 (500 °C). For the ratio Nu,test/Nu,AS/NZS, the mean values and COVs were 4.18/0.55 (25 °C), 4.18/0.58 (200 °C), 4.01/0.59 (250 °C), 2.91/0.55 (300 °C), 2.12/0.33 (350 °C), 1.93/0.25 (400 °C), 2.05/0.23 (450 °C), and 2.39/0.42 (500 °C). The comparison results for AS/NZS 1664 [41] closely resemble those for ADM 2020 [40], owing to their similar design approaches. However, owing to the presence of kc and Φy, the predicted results using AS/NZS 1664 [41] were smaller than those from ADM 2020 [40]. Thus, for 6063-T5 aluminium alloy angle section SCs with non-slender cross-sections, the design approaches in AS/NZS 1664 [41] yielded more conservativeness. When the b/AS/NZS ratio was relatively large, the design approaches in AS/NZS 1664 [41] yielded notably conservative results for the ultimate resistance of 6063-T5 aluminium alloy angle section SCs, both with and without exposure to elevated temperatures.
Φ F L = Φ y f o k c   for b t ( B p Φ y f o Φ c k c ) / 5.1 D p Φ c ( B p 5.1 D p b t )   for ( B p Φ y f o Φ c k c ) / 5.1 D p < b t < C p 5.1 Φ c π 2 E ( 5.1 b / t ) 2   for b t C p 5.1

4.4. GB 50429-2007

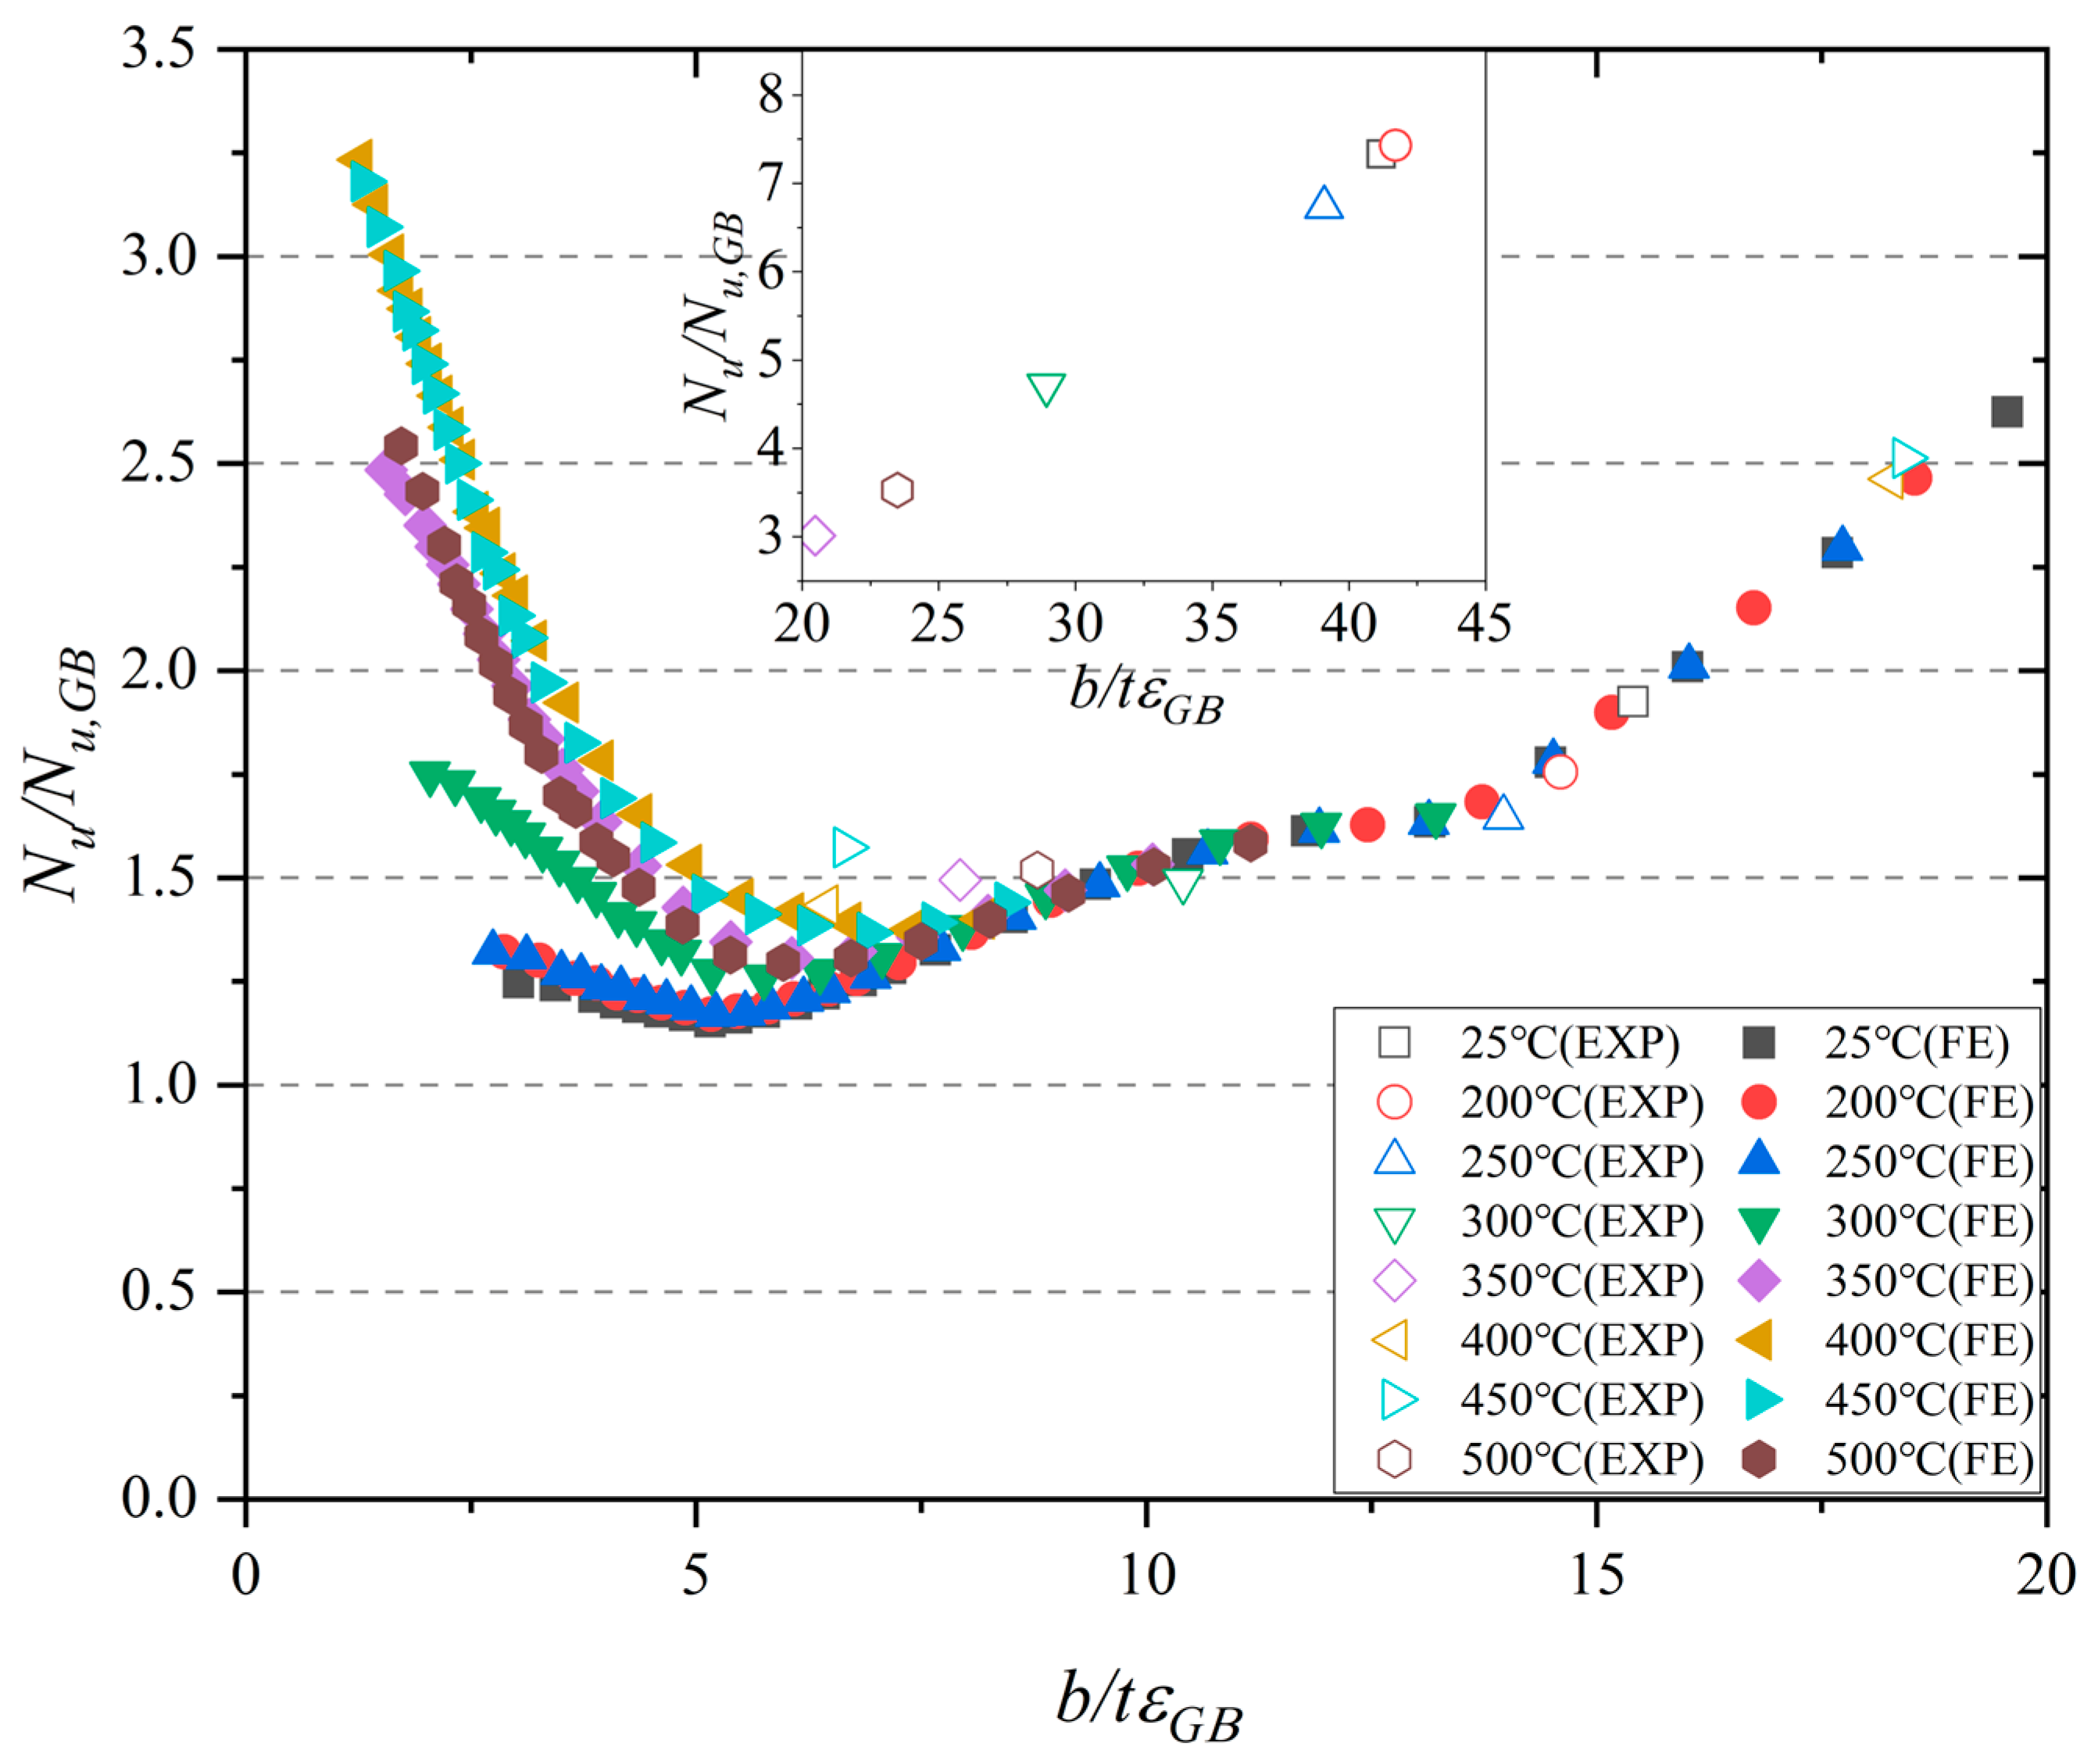
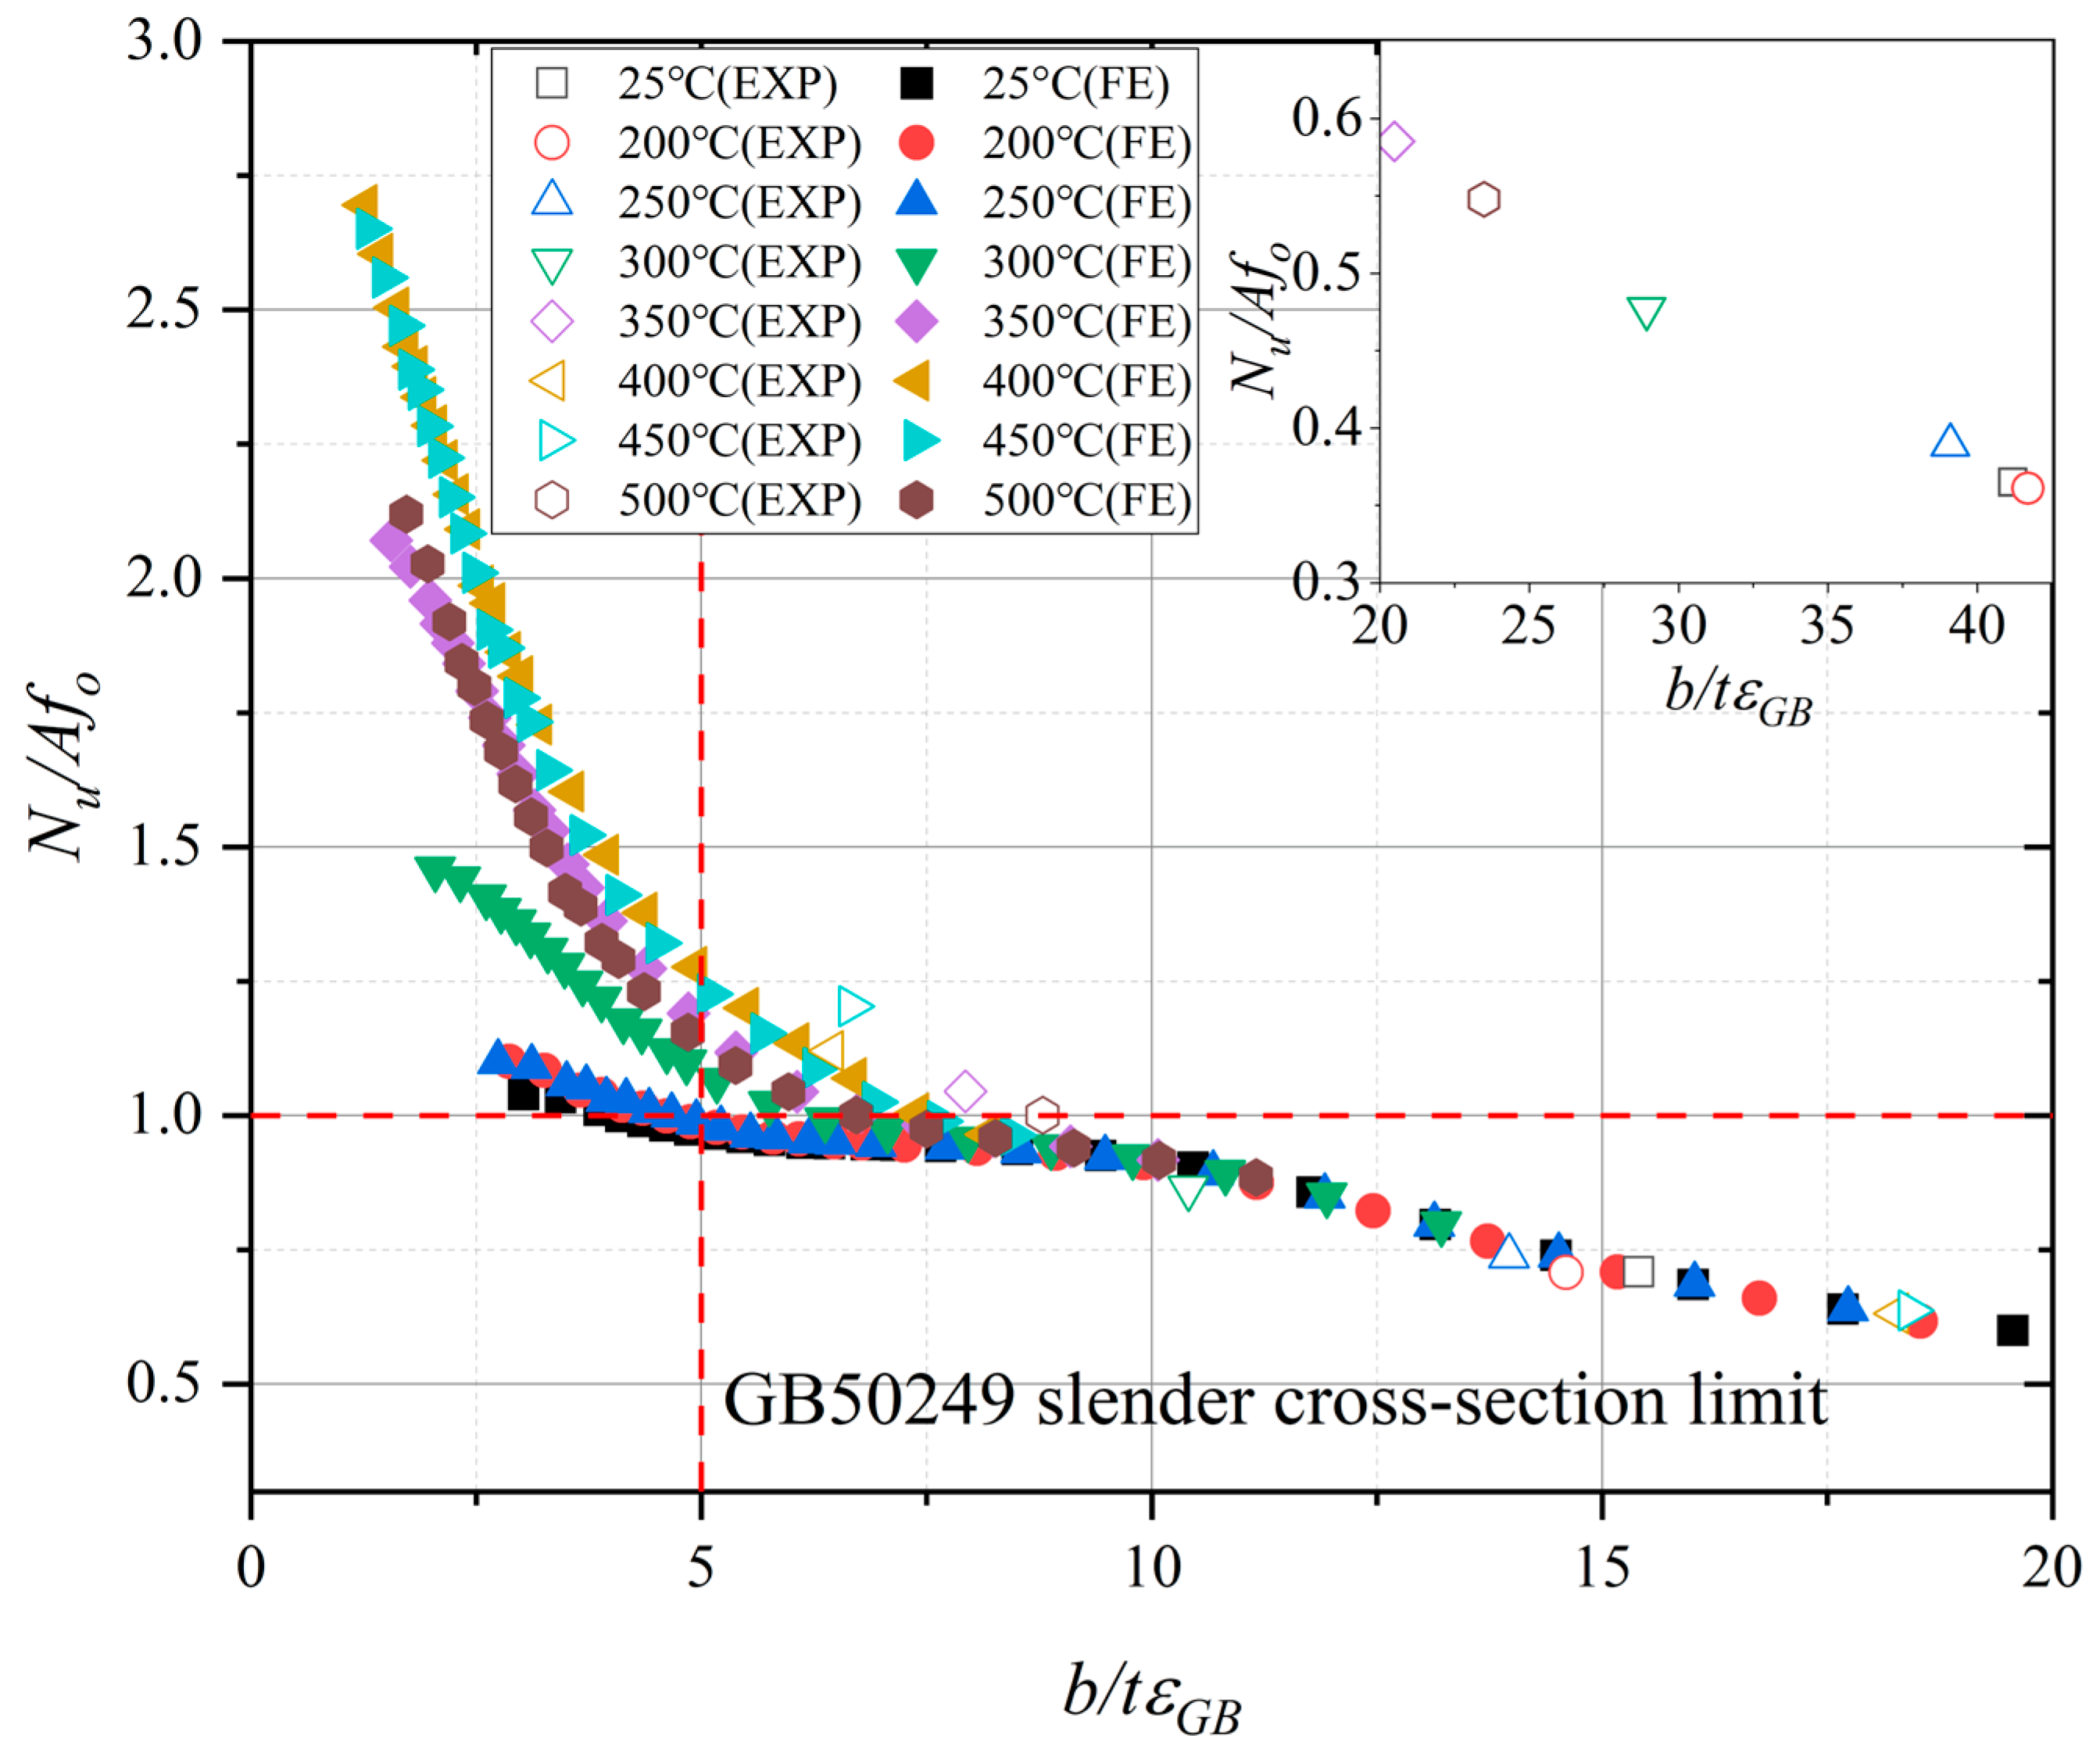
The Chinese code GB 50429-2007 [42], similar to EC9 [28], applies an effective thickness approach. The ultimate resistance of the 6063-T5 aluminium alloy angle section SC was determined using Equation (11), where the Aeff represented the effective cross-section area, and γR,GB = 1.2. The effective cross-section thickness teff value could be obtained from Equation (12). Given the strong hardening nature of the 6063-T5 AA, calculation coefficients α1 and α2 were set to 0.9 each. For biaxially symmetrical sections, teff should also conform to Equation (13). The conversion flexibility coefficient is denoted as λ ¯   = (fo/σcr)0.5, where σcr is determined using Equation (14). Notably, the code specifies a slenderness limitation of 5εGB for slender and non-slender cross-sections, where εGB = (240/fo)0.5. The evaluation of the slenderness limitation in GB 50429-2007 [42] is presented in Figure 19, showing its appropriateness for a 6063-T5 aluminium alloy angle section SC without elevated-temperature exposure. However, with increasing elevated temperatures, the slenderness limitation for the Class 4 and Class 3 cross-sections in GB 50429-2007 [42] gradually became unsuitable.
A comparison of the numerical and experimental outcomes and the GB 50429-2007 [42] calculations of the ultimate resistance is shown in Figure 20. The mean values and COVs of Nu,FE/Nu,GB for 6063-T5 aluminium alloy angle section SCs, both without fire and after exposure to different temperatures, were 1.44/0.26 (25 °C), 1.43/0.23 (200 °C), 1.40/0.20 (250 °C), 1.50/0.10 (300 °C), 1.82/0.21 (350 °C), 2.23/0.27 (400 °C), 2.17/0.27 (450 °C), and 1.75/0.21 (500 °C). As regards Nu,test/Nu,GB, the mean values and COVs were 4.63/0.58 (25 °C), 4.59/0.62 (200 °C), 4.19/0.61 (250 °C), 3.10/0.52 (300 °C), 2.25/0.34 (350 °C), 1.95/0.26 (400 °C), 2.04/0.23 (450 °C), and 2.53/0.40 (500 °C). The design approaches in GB 50429-2007 [42] exhibited slight conservatism for the 6063-T5 aluminium alloy angle section SC without elevated-temperature exposure. However, with the rise in elevated temperatures, the accuracy of the GB 50429-2007 [42] diminished, particularly for b/GB < 5.0. This is attributable to the enhanced strain-hardening of the post-fire 6063-T5 AA.
N u , G B = A e f f f o γ R , G B
t e f f t = α 1 1 λ ¯ α 2 0.22 λ ¯ 2 1
t e f f t 1 λ ¯ 2
σ c r = k π 2 E 12 1 ν 2 b / t 2

5. Modified Design Approach

Based on the above discussion, it was found that the strain-hardening behaviour of 6063-T5 aluminium alloy after exposure to elevated temperatures led to overly conservative predictions by existing design codes when estimating the residual bearing capacity of aluminium alloy angle section SCs. To improve the predictive accuracy, the design provisions in EC9 [28] and GB 50249-2007 [42]—which are based on similar design principles—were modified in this study.
Following the Direct Strength Method [43], the linear strain-hardening material model of the 6063-T5 aluminium alloy after exposure to elevated temperatures is shown as Equation (15). All key mechanical parameters were derived from the post-fire experimental results of 6063-T5 aluminium alloy tension coupons. The coefficient p was introduced to characterize the post-yield strain-hardening response after fire exposure. Its value was calibrated using the combined database of SC test results and the validated numerical results. Specifically, regression-based calibration was carried out by comparing the predicted ultimate resistances with the corresponding experimental and numerical resistances over the investigated temperature range; analyses and the resulting values of p are summarized in Table 5.
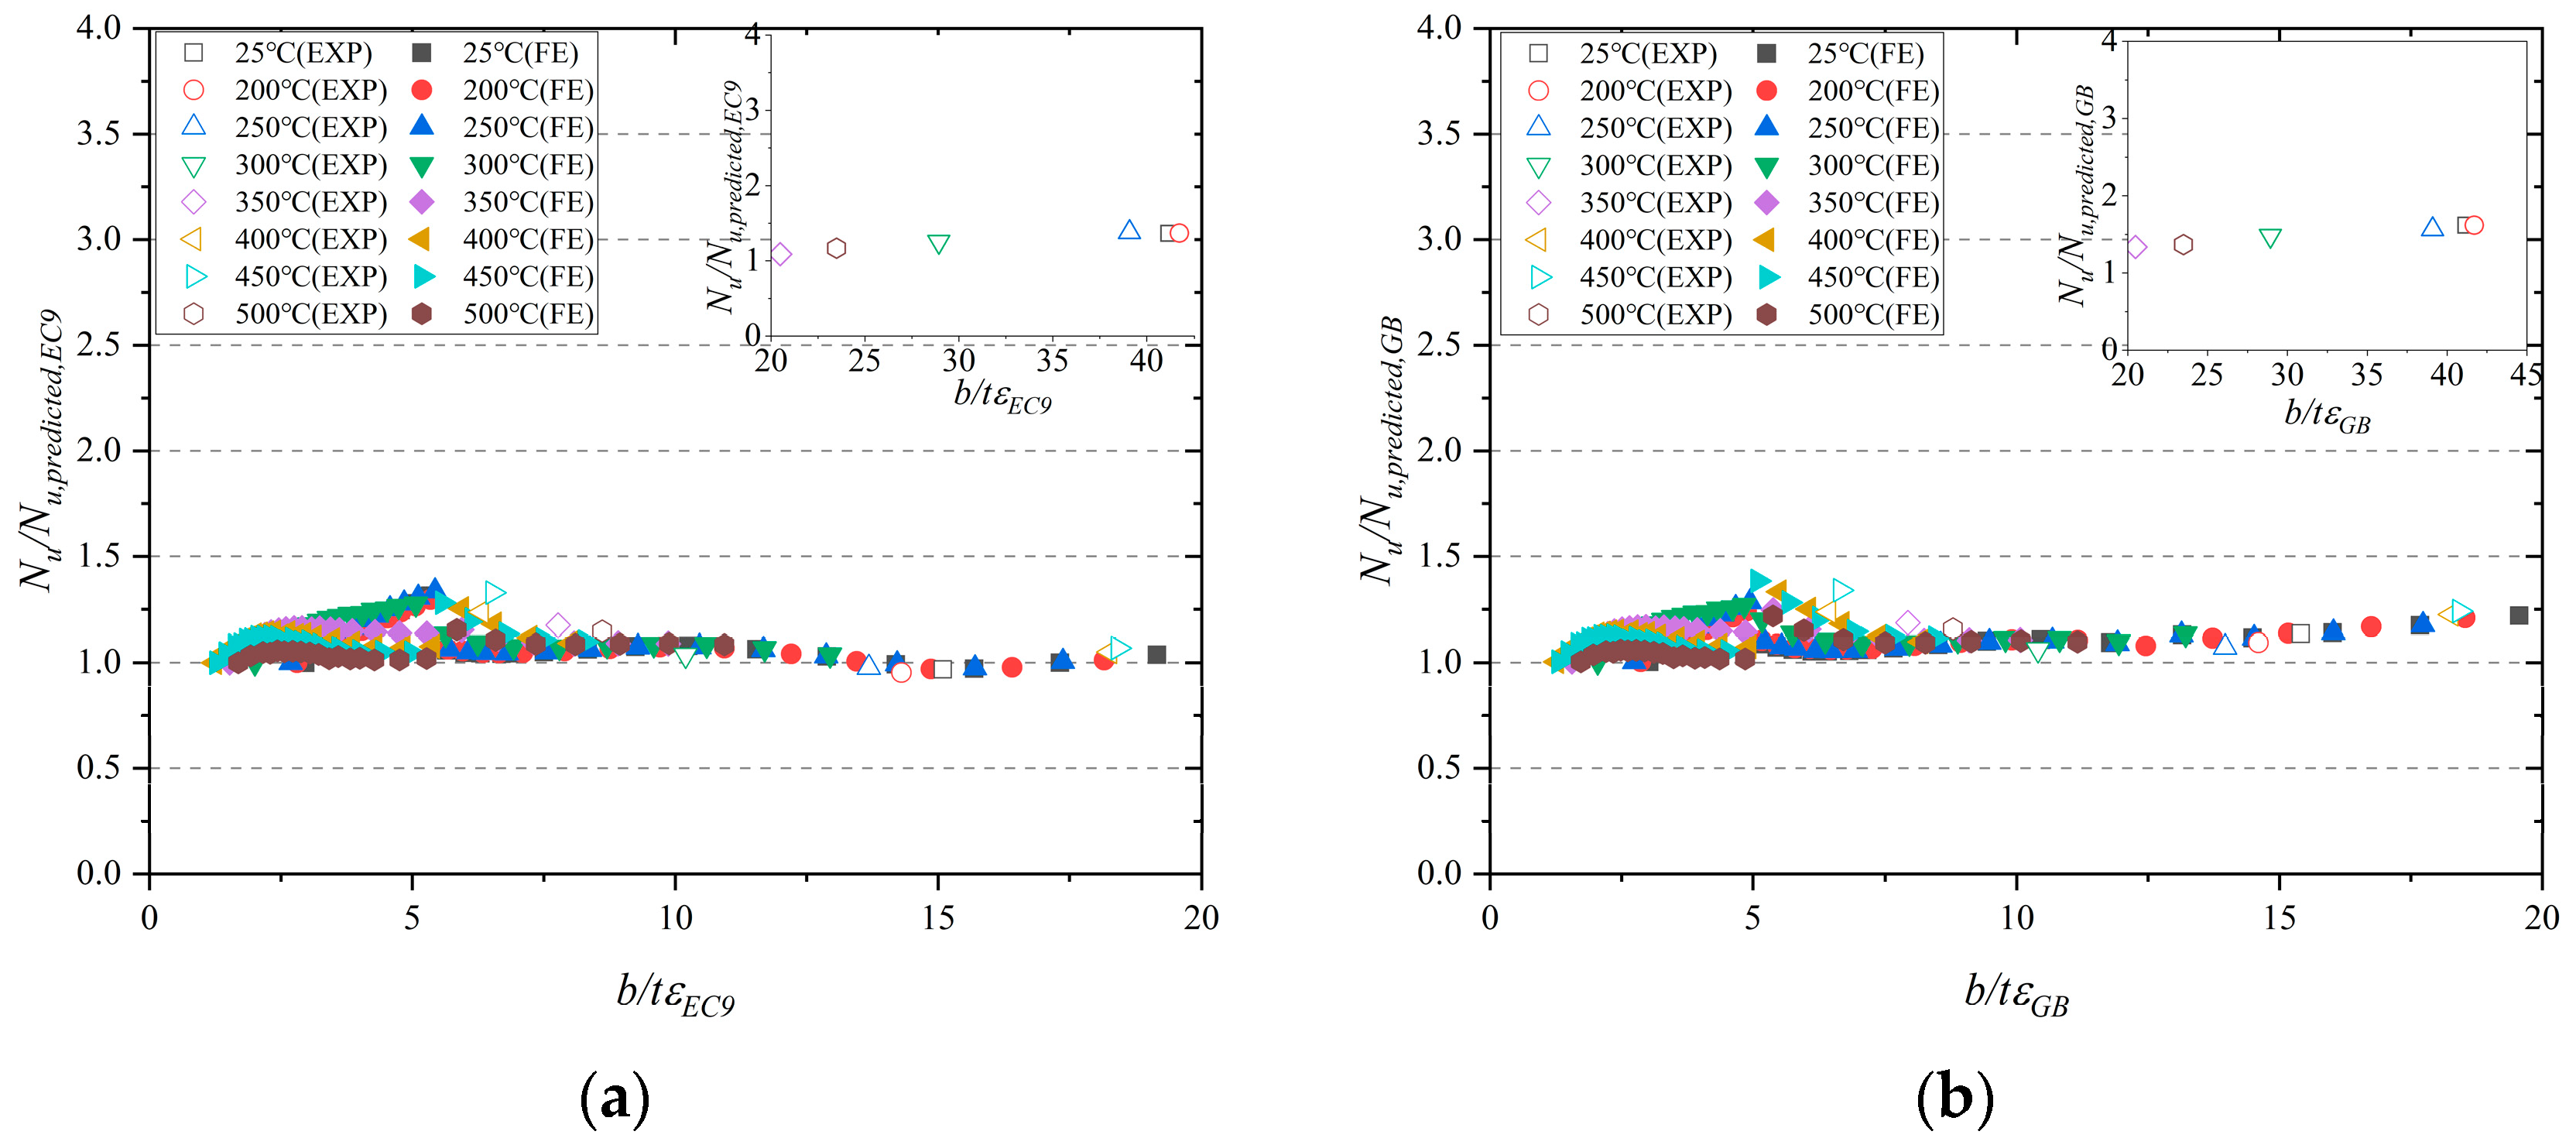
Considering the influence of the cross-section class of the SC, the ultimate-resistance calculation regulations in EC9 [28] and GB 50249-2007 [42] were modified in a segmented manner according to different member slenderness. The modified equations are given as Equations (16) and (17), in which Nu,predicted,EC9 and Nu,predicted,GB represent the modified ultimate resistance. The λEC9 and λGB denote the slenderness limitation b/EC9 and b/GB, respectively.
For non-slender sections, the residual bearing capacity was governed by both post-fire material properties and slenderness, whereas for slender sections, it was mainly controlled by the slenderness of the SCs. It was worth noting that for flat outstand parts in non-biaxially symmetric cross-sections, the thickness reduction factors of the cross-section defined in Equations (3) and (13) were found to be overly conservative at high cross-section class values. This issue was also considered in the modified design approaches, in which cross-section class limits are 15 for EC9 [28] and 13 for GB 50249-2007 [42].
To verify the accuracy of the modified equations, comparisons were made against both experimental and numerical results, as shown in Figure 21. The corresponding mean values and COVs of the Nu/Nu,predicted,EC9 and Nu/Nu,predicted,GB ratios are summarized in Table 5. The results confirmed that the modified design methods in EC9 [28] and GB 50249-2007 [42] provided accurate predictions of the post-fire ultimate resistances of 6063-T5 aluminium alloy angle section SCs.
σ s h = f o + E p ( ε u ε y )
N u , p r e d i c t e d , E C 9 = σ s h f o λ E C 9 0.6 N u , E C 9 for   λ E C 9 5.5 λ E C 9 0.4 2 N u , E C 9 for   5 < λ E C 9 15 λ E C 9 10 N u , E C 9 for   λ E C 9 > 15
N u , p r e d i c t e d , G B = 1.1 σ s h f o λ G B 0.6 N u , G B for   λ G B 5 0.55 λ G B 0.4 N u , G B for   5 < λ G B 13 0.11 λ G B N u , G B for   λ G B > 13

6. Conclusions

This paper investigated the residual capacity of 6063-T5 aluminium alloy angle section SCs after exposure to elevated temperatures through experiments and numerical analyses, the results of which were meaningful for the assessment of the residual resistance performance of aluminium alloy structures after fire. The key findings of this study are as follows:
  • A fire exposure treatment was adopted to simulate the influence of fire on the residual load-bearing capacity of 6063-T5 aluminium alloy angle section SCs. The post-fire mechanical properties of the alloys were determined using tensile coupon tests. After exposure to elevated temperatures, the stress–strain curves exhibited no yield plateau, transitioning from an elastic segment to a strain-hardening section. The elevated-temperature exposure generated negligible influences on the post-fire elastic modulus of the 6063-T5 AA. Strength properties decreased while ductile properties increased within 200–450 °C, with subsequent strength increase observed beyond 450 °C.
  • Following the SC tests, all load–end shortening curves exhibited a unimodal form. Gradual decreases in ultimate resistance were observed within the range of 200 to 450 °C, followed by an increase beyond 450 to 500 °C. These trends in the ultimate resistance closely paralleled those observed in the strength properties of the stress–strain curves. In the failure mode, all of the 6063-T5 aluminium alloy angle section SCs after exposure to different elevated temperatures manifested local buckling.
  • A finite element modelling method was developed to simulate the residual load-bearing performance of 6063-T5 aluminium alloy angle section SCs after exposure to different elevated temperatures, validated by the failure modes, ultimate resistances, and load–end shortening curves obtained from the tests. Based on the validated numerical model together with the experimental results for Class 4 sections, the applicability of current design codes, including EC9, ADM-2020, AS/NZS 1664, and GB 50429-2007, was assessed. These design approaches demonstrated satisfactory accuracy in predicting the ultimate resistances of unexposed 6063-T5 aluminium alloy angle section SCs with non-slender cross-sections. However, with increasing elevated temperatures and cross-sectional slenderness, the accuracy generally decreased. Owing to the enhanced strain-hardening of the alloy after exposure to elevated temperatures, these design approaches were found to be overly conservative for the direct prediction of the ultimate resistances of 6063-T5 aluminium alloy angle section SCs with non-slender cross-sections, based on the accompanying numerical analyses.
  • To improve the accuracy of current design codes in predicting the residual bearing capacity of aluminium alloy angle section SCs after exposure to elevated temperatures, the design provisions in EC9 and GB 50249-2007 were revised based on the experimental and numerical findings for 6063-T5 aluminium alloy SCs. The modified formulations considered the strain-hardening effect observed in post-fire materials and demonstrated improved agreement with both experimental and numerical results. The proposed design modifications, therefore, provide a more reliable basis for evaluating the post-fire resistance of 6063-T5 aluminium alloy angle section SCs under axial compression within the investigated parameter range.

Author Contributions

Z.D.: Investigation, writing—original draft. F.W.: Validation. N.W.: Visualization. S.L.: Software. X.X.: Methodology, funding acquisition, and writing—review and editing. All authors have read and agreed to the published version of the manuscript.

Funding

This study was financially supported by the National Natural Science Foundation of China (grant no. 52308143) and Chongqing Talents (CSTB2024YCJH-KYXM0125).

Data Availability Statement

Data will be made available on request.

Conflicts of Interest

The authors declare that they have no known competing financial interests or personal relationships that could have appeared to influence the work reported in this paper.

References

  1. Zhi, X.; Wang, Y.; Li, B.; Zhang, Y.; Ouyang, Y. Axial compression behaviour of 7A04-T6 high-strength aluminium alloy SHS and RHS stub columns. Thin-Walled Struct. 2022, 180, 109816. [Google Scholar] [CrossRef]
  2. Zhu, J.-H.; Young, B. Tests and design of aluminum alloy compression members. J. Struct. Eng. 2006, 132, 1096–1107. [Google Scholar] [CrossRef]
  3. Zhu, J.H.; Young, B. Experimental investigation of aluminum alloy circular hollow section columns. Eng. Struct. 2006, 28, 207–215. [Google Scholar] [CrossRef]
  4. Zhu, J.-H.H.; Li, Z.Q.; Su, M.-N.N.; Young, B. Behaviour of aluminium alloy plain and lipped channel columns. Thin-Walled Struct. 2019, 135, 306–316. [Google Scholar] [CrossRef]
  5. Yuan, H.X.; Wang, Y.Q.; Chang, T.; Du, X.X.; Bu, Y.D.; Shi, Y.J. Local buckling and postbuckling strength of extruded aluminium alloy stub columns with slender I-sections. Thin-Walled Struct. 2015, 90, 140–149. [Google Scholar] [CrossRef]
  6. Mazzolani, F.M.; Piluso, V.; Rizzano, G. Local buckling of aluminum alloy angles under uniform compression. J. Struct. Eng. 2011, 137, 173–184. [Google Scholar] [CrossRef]
  7. Wang, Y.Q.; Wang, Z.X.; Hu, X.G.; Han, J.K.; Xing, H.J. Experimental study and parametric analysis on the stability behavior of 7A04 high-strength aluminum alloy angle columns under axial compression. Thin-Walled Struct. 2016, 108, 305–320. [Google Scholar] [CrossRef]
  8. Georgantzia, E.; Gkantou, M.; Kamaris, G.S. Numerical Modelling and Design of Aluminium Alloy Angles under Uniform Compression. CivilEng 2021, 2, 632–651. [Google Scholar] [CrossRef]
  9. Su, M.N.; Young, B.; Gardner, L. Classification of aluminium alloy cross-sections. Eng. Struct. 2017, 141, 29–40. [Google Scholar] [CrossRef]
  10. Zhou, F.; Young, B. Tests of concrete-filled aluminum stub columns. Thin-Walled Struct. 2008, 46, 573–583. [Google Scholar] [CrossRef]
  11. Zhou, F.; Young, B. Concrete-filled double-skin aluminum circular hollow section stub columns. Thin-Walled Struct. 2018, 133, 141–152. [Google Scholar] [CrossRef]
  12. Hua, J.; Ren, Z.; Wang, F.; Wu, J.; Feng, D.; Xue, X. Residual mechanical behavior of Q1100 ultra high strength steel after elevated temperatures. J. Constr. Steel Res. 2026, 236, 110011. [Google Scholar] [CrossRef]
  13. Ban, H.; Zeng, Z.; Yang, L.; Zhang, L.; Dai, P. Post-fire mechanical properties of 316L + Q355 stainless-clad bimetallic steels. Structures 2025, 78, 109359. [Google Scholar] [CrossRef]
  14. Yin, L.; Ni, Z.P.; Liu, J.Y.; Fan, F.; Zhi, X.D.; Ye, J.H.; Pan, Y.C.; Guo, Y. hang High-temperature mechanical properties of constructional 6082-T6 aluminum alloy extrusion. Structures 2023, 48, 1244–1258. [Google Scholar] [CrossRef]
  15. Zhong, Y.; Tan, K.H.; Zhao, O. Experimental and numerical investigations of S700 high strength steel tubular section stub columns after exposure to elevated temperatures. Thin-Walled Struct. 2021, 163, 107669. [Google Scholar] [CrossRef]
  16. Cai, Y.; Young, B. Mechanical properties of thin sheet steel after exposure to high temperatures. Thin-Walled Struct. 2019, 142, 460–475. [Google Scholar] [CrossRef]
  17. Xue, X.; Wang, F.; Hua, J.; Wang, N.; Yan, S. Cooling methods impact on post-fire residual bond properties of bimetallic steel bars in seawater concrete. Fire Saf. J. 2026, 159, 104569. [Google Scholar] [CrossRef]
  18. Li, H.T.; Young, B. Residual mechanical properties of high strength steels after exposure to fire. J. Constr. Steel Res. 2018, 148, 562–571. [Google Scholar] [CrossRef]
  19. Zhang, C.; Wang, R.; Song, G. Post-fire mechanical properties of Q460 and Q690 high strength steels after fire-fighting foam cooling. Thin-Walled Struct. 2020, 156, 106983. [Google Scholar] [CrossRef]
  20. Liu, Y.; Liu, H.; Chen, Z. Post-fire mechanical properties of aluminum alloy 6082-T6. Constr. Build. Mater. 2019, 196, 256–266. [Google Scholar] [CrossRef]
  21. Chen, Z.; Lu, J.; Liu, H.; Liao, X. Experimental investigation on the post-fire mechanical properties of structural aluminum alloys 6061-T6 and 7075-T73. Thin-Walled Struct. 2016, 106, 187–200. [Google Scholar] [CrossRef]
  22. Wang, Z.; Ma, C.; Li, M.; Han, Q.; Li, H.T.; Zhao, D. Mechanical properties of 7A04-T6 high strength structural aluminium alloy at elevated temperatures and after cooling down. Thin-Walled Struct. 2022, 180, 109930. [Google Scholar] [CrossRef]
  23. Sun, Y.; Zhang, K.; Gong, G. Material properties of structural aluminium alloys after exposure to fire. Structures 2023, 55, 2105–2111. [Google Scholar] [CrossRef]
  24. Zhong, Y.; Su, A.; Zhao, O. Post-fire local buckling behaviour of cold-formed S700 high strength steel circular hollow sections under axial compression: Experiments, modelling and design. Thin-Walled Struct. 2023, 184, 110511. [Google Scholar] [CrossRef]
  25. Zuo, W.; Chen, M.T.; Young, B. Structural behaviour of cold-formed steel elliptical hollow section stub columns after exposure to ISO-834 fire curve. Thin-Walled Struct. 2024, 197, 111309. [Google Scholar] [CrossRef]
  26. He, A.; Liang, Y.; Zhao, O. Experimental and numerical studies of austenitic stainless steel CHS stub columns after exposed to elevated temperatures. J. Constr. Steel Res. 2019, 154, 293–305. [Google Scholar] [CrossRef]
  27. Yao, S.; Ziyang, F.; Yuwei, S.; Jun, X. Cross-Sectional Behavior of Aluminum Alloy Channel Section Stub Columns after Exposure to Fire. J. Struct. Eng. 2023, 149, 4023085. [Google Scholar] [CrossRef]
  28. EN1999-1-1; Eurocode 9: Design of Aluminium Structures—Part 1-1: General Structural Rules. European Committee for Standardization Brussels (CEN): Brussels, Belgium, 2021.
  29. GB/T 228-2021; Metallic Materials—Tensile Testing—Part 1:Method of Test at Room Temperature. China Standard Press: Beijing, China, 2021.
  30. Chen, M.T.; Pandey, M.; Young, B. Post-fire residual material properties of cold-formed steel elliptical hollow sections. J. Constr. Steel Res. 2021, 183, 106723. [Google Scholar] [CrossRef]
  31. Wang, F.; Ren, Z.; Feng, D.; Xue, X.; Wu, J.; Li, S.; Hua, J. Mechanical properties deterioration of ultra-high strength steel after elevated temperature exposure. Structures 2026, 84, 111026. [Google Scholar] [CrossRef]
  32. Wang, F.; Zhao, O.; Young, B. Testing and numerical modelling of S960 ultra-high strength steel angle and channel section stub columns. Eng. Struct. 2020, 204, 109902. [Google Scholar] [CrossRef]
  33. Zhang, L.; Wang, F.; Liang, Y.; Zhao, O. Press-braked S690 high strength steel equal-leg angle and plain channel section stub columns: Testing, numerical simulation and design. Eng. Struct. 2019, 201, 109764. [Google Scholar] [CrossRef]
  34. Li, S.; Xue, X.; Wang, F.; Chan, T.-M.; Young, B. Behaviour of cold-formed Q1100 ultra-high strength steel unequal-leg angle section stub columns. Thin-Walled Struct. 2026, 219, 114290. [Google Scholar] [CrossRef]
  35. Li, H.T.; Young, B. Cold-formed high strength steel SHS and RHS beams at elevated temperatures. J. Constr. Steel Res. 2019, 158, 475–485. [Google Scholar] [CrossRef]
  36. Cai, Y.; Young, B. Structural behaviour of cold-formed stainless steel bolted connections at post-fire condition. J. Constr. Steel Res. 2019, 152, 312–321. [Google Scholar] [CrossRef]
  37. Zhao, J.; Lai, B.-L.; Fan, S.; Liu, M.; Li, C. Numerical simulation of local-distortional buckling behavior of lipped C-section stainless steel columns. J. Constr. Steel Res. 2023, 211, 108148. [Google Scholar] [CrossRef]
  38. Lai, B.-L.; Zheng, X.-F.; Fan, S.-G.; Chang, Z.-Q. Behavior and design of concrete filled stainless steel tubular columns under concentric and eccentric compressive loading. J. Constr. Steel Res. 2024, 213, 108319. [Google Scholar] [CrossRef]
  39. Lai, B.-L.; Li, Y.-R.; Wang, G.-Y.; Mo, Z.; Mensinger, M.; Fan, S.-G. Buckling behavior of UHPC filled stainless steel tubular columns subjected to eccentric compression. Constr. Build. Mater. 2026, 506, 144965. [Google Scholar] [CrossRef]
  40. Aluminum Association. Aluminum Design Manual. Specification for Aluminum Structures; Aluminum Association (AA): Washington, DC, USA, 2020. [Google Scholar]
  41. AS/NZS 1664.1:1997; Aluminum Structures Part 1: Limit State Design. Australian/New Zealand Standard: Sydney, Australia, 1997; pp. 7823–7830.
  42. GB 50429-2007; Code for Design of Aluminium Structures. China Planning Press: Beijing, China, 2007.
  43. Gardner, L. The continuous strength method. Proc. Inst. Civ. Eng. Struct. Build. 2008, 161, 127–133. [Google Scholar] [CrossRef]
Figure 1. Geometric cross-section of the 6063-T5 aluminium alloy SC.
Buildings 16 01565 g001
Figure 2. Detailed sizes of the tensile coupon specimens.
Buildings 16 01565 g002
Figure 3. Fire exposure treatment: (a) Electric furnace and (b) exposure temperature diagram.
Buildings 16 01565 g003
Figure 4. Tensile coupon test setup.
Buildings 16 01565 g004
Figure 5. SC test setup.
Buildings 16 01565 g005
Figure 6. Finite element modelling method of the angle section SCs.
Buildings 16 01565 g006
Figure 7. Results of convergence study.
Buildings 16 01565 g007
Figure 8. Effects of initial geometric imperfection: (a) Distribution form and (b) amplitude.
Buildings 16 01565 g008
Figure 9. The post-fire monotonic stress–strain curves: (a) A1 section and (b) A2 section.
Buildings 16 01565 g009
Figure 10. Load–end shortening curves of 6063-T5 aluminium alloy SCs: (a) A1 and (b) A2.
Buildings 16 01565 g010
Figure 11. Comparison of experimental and numerical load–end shortening curves: (a) A1-T200; (b) A2-T300; and (c) L110-15-2 [7].
Buildings 16 01565 g011
Figure 12. Comparison of the failure modes obtained via the tests and numerical analyses: (a) A1-T200; (b) A2-T300; and (c) L110-15-2 [7].
Buildings 16 01565 g012
Figure 13. Distribution of different cross-section classifications in parameter analysis.
Buildings 16 01565 g013
Figure 14. Evaluation of slenderness limitation in EC9.
Buildings 16 01565 g014
Figure 15. Comparison of numerical and experimental results and EC9-predicted results of ultimate resistance.
Buildings 16 01565 g015
Figure 16. Evaluation of slenderness limitation in ADM-2020.
Buildings 16 01565 g016
Figure 17. Comparison of the numerical and experimental results and the ADM-2020-predicted results of ultimate resistance.
Buildings 16 01565 g017
Figure 18. Comparison of the numerical and experimental results and AS/NZS 1664 predicted results for ultimate resistance.
Buildings 16 01565 g018
Figure 19. Evaluation of slenderness limitation in GB 50429-2007.
Buildings 16 01565 g019
Figure 20. Comparison of the numerical and experimental results and the GB 50429-2007-predicted results of ultimate resistance.
Buildings 16 01565 g020
Figure 21. Validation of modified design methods: (a) EC9; (b) GB 50249-2007.
Buildings 16 01565 g021
Table 1. Geometric dimensions of the angle section SCs.
Cross-SectionB (mm)H (mm)L (mm)t (mm)B/tClassification in EC9
A140401200.850Class 4
A250501502.817.9 Class 4
Table 2. Chemical composition of the angle section SCs (wt%).
Cross-SectionCuZnMgCrFeMnTiSi
A10.0320.00500.600.00630.2460.0140.00290.427
A20.0310.00510.590.00660.2430.0130.00280.427
Table 3. Test and numerical results of the 6063-T5 aluminium alloy angle section SCs.
Cross-SectionSpecimen IDNu,test (kN)δ (mm)Nu,test/AfoNu,FE (kN)Nu,FE/Nu,test
A1 40 × 40 × 0.8A1-T254.040.3230.3614.091.012
A1-T2004.080.3420.3564.141.016
A1-T2503.880.2960.3853.921.011
A1-T3002.590.1950.4702.631.016
A1-T3501.570.1290.5681.621.030
A1-T4001.290.1520.5881.391.075
A1-T4501.390.1140.5831.431.029
A1-T5001.950.1480.5361.991.022
A2 50 × 50 × 2.8A2-T2538.390.3610.70438.551.004
A2-T20034.930.3720.71335.831.026
A2-T25032.850.3470.73234.221.042
A2-T30021.540.2490.86522.601.049
A2-T35015.310.5621.05815.661.023
A2-T40010.830.4651.13511.071.022
A2-T45012.200.6661.19512.711.042
A2-T50018.180.3981.02418.461.015
Mean----1.027
COV----0.017
Table 4. Parametric study of cross-section geometric dimensions.
Cross-SectionH (mm)B (mm)t (mm)T (°C)
Angle section50503.6, 6.5, 9.1, 11.625, 200, 250, 300, 350, 400, 450, 500
1001006.5, 11.8, 16.6, 21
1501508.9, 16, 22.6, 28.7
20020010.8, 19.4, 27.4, 34.7
24024011.8, 21.2, 29.9, 37.9
28028012.5, 22.5, 31.7, 40.2
Table 5. Coefficients in the modified design approaches for EC9 and GB 50249-2007.
T (°C)pNu/Nu,predicted,EC9
Mean
Nu/Nu,predicted,EC9
COV
Nu/Nu,predicted,GB
Mean
Nu/Nu,predicted,GB
COV
2517.111.090.101.110.10
20017.901.090.081.110.05
25018.391.110.091.120.06
30028.741.150.071.150.06
35062.781.130.041.140.04
400140.781.120.051.130.06
450124.991.110.061.130.08
50053.951.050.041.070.05
Disclaimer/Publisher’s Note: The statements, opinions and data contained in all publications are solely those of the individual author(s) and contributor(s) and not of MDPI and/or the editor(s). MDPI and/or the editor(s) disclaim responsibility for any injury to people or property resulting from any ideas, methods, instructions or products referred to in the content.