1. Introduction
Asphalt concrete remains the predominant material in road construction worldwide, representing over 90% of all paved surfaces. This widespread use is largely due to its economic efficiency and straightforward application [
1]. However, it is susceptible to fatigue cracking, rutting, and moisture damage, particularly under growing traffic loads and extreme temperature fluctuations, which necessitate frequent repairs. These ongoing maintenance interventions can increase the total life-cycle costs of pavements by an estimated 30–50% [
2,
3]. With freight traffic projected to grow by 45% by 2040 [
4], these issues highlight a growing demand for smarter, more durable pavement materials that can enable a shift from routine, schedule-based maintenance to condition-driven repairs informed by real-time performance data [
5,
6,
7].
In response to these durability challenges, recent research has increasingly focused on fiber-reinforced asphalt composites as a promising strategy for enhancing structural performance and longevity [
8,
9]. By improving internal cohesion and impeding crack propagation, microfibers serve as an effective reinforcement mechanism that can significantly extend the functional lifespan of asphalt pavements [
10]. Conventional fibers such as polyester, glass, basalt, and polypropylene offer partial improvements [
11]. Basalt fibers increase stiffness by 15–30% and reduce rutting in repeated load conditions [
12]. Polypropylene fibers can reduce rutting by 25–40% through binder reinforcement mechanisms. Despite these benefits, such fibers are not without critical limitations. Exposure to ultraviolet (UV) radiation can degrade their tensile strength by up to 30% after aging. Additionally, their fatigue performance is often restricted, typically sustaining less than 50% strain under cyclic loading conditions [
13,
14,
15]. In addition, their aging response varies with asphalt type and environmental conditions, limiting reliability in long-term applications [
16,
17]. Such limitations hinder their integration, which requires materials with predictable, resilient performance under field conditions.
Given these limitations, carbon fiber (CF) stands out as a compelling alternative for asphalt reinforcement, offering superior mechanical and thermal properties. CF boasts tensile strengths of 3–7 GPa, elastic moduli of 200–500 GPa, and thermal conductivity between 5 and 100 W/m·K, making it particularly suitable for demanding pavement applications [
18,
19,
20]. Such properties make CF particularly suitable for high-stress, temperature-sensitive pavement applications [
21]. Microstructurally, its nano-scale surface roughness strengthens the bond with the asphalt matrix, improving mechanical interlock. This results in more uniform stress distribution and greater resistance to crack propagation under repetitive loading [
22]. Additionally, CF’s high thermal conductivity reduces temperature-induced stress gradients, while its oxidative resistance contributes to long-term durability [
23,
24]. Empirical studies confirm CF’s potential; the author of [
19] reported a 40% decrease in rutting depth and a 150% increase in fatigue life, outperforming polymer-modified asphalt.
Despite this potential, several critical knowledge gaps still hinder the widespread adoption of carbon fiber in pavement engineering [
25]. A primary limitation is the lack of comprehensive dosage optimization studies, as existing research has predominantly examined CF dosages no greater than 0.6%, a range that may not capture the material’s full reinforcing potential [
26]. This leaves higher dosages (≥1.0%), potentially required for heavily trafficked routes, largely unexplored. Second, although SEM imaging illustrates CF’s load distribution role, quantitative evaluation of the fiber–binder interfacial bond, vital for predicting debonding, remains insufficient. Third, from an implementation standpoint, economic and modeling barriers persist. The significant unit cost of CF calls for detailed life-cycle cost–benefit assessments; however, reductions in maintenance intervals and user delay savings are rarely quantified in the literature [
27,
28]. Importantly, existing literature has yet to establish a clear correlation between the performance enhancements offered by CF in asphalt mixtures and the optimization of CF content.
To address these gaps, this study presents a comprehensive evaluation of carbon fiber (CF)-reinforced asphalt mixtures using a systematic dosage range of 0.5%, 1.0%, and 1.5% by weight of bitumen. Unlike previous studies that often focus on limited performance indicators or narrow dosage ranges, this work integrates mechanical performance, durability assessment, and life-cycle cost analysis within a unified framework. The study further identifies an optimal CF dosage based on a combined performance and economic perspective, providing a more application-oriented evaluation. In addition, the use of locally sourced materials and realistic mix design parameters enhances the practical relevance of the findings for high-traffic pavement applications. By linking laboratory-scale performance improvements with economic implications, this research contributes toward bridging the gap between material-level innovation and field-level implementation of CF-reinforced asphalt systems.
2. Materials and Methods
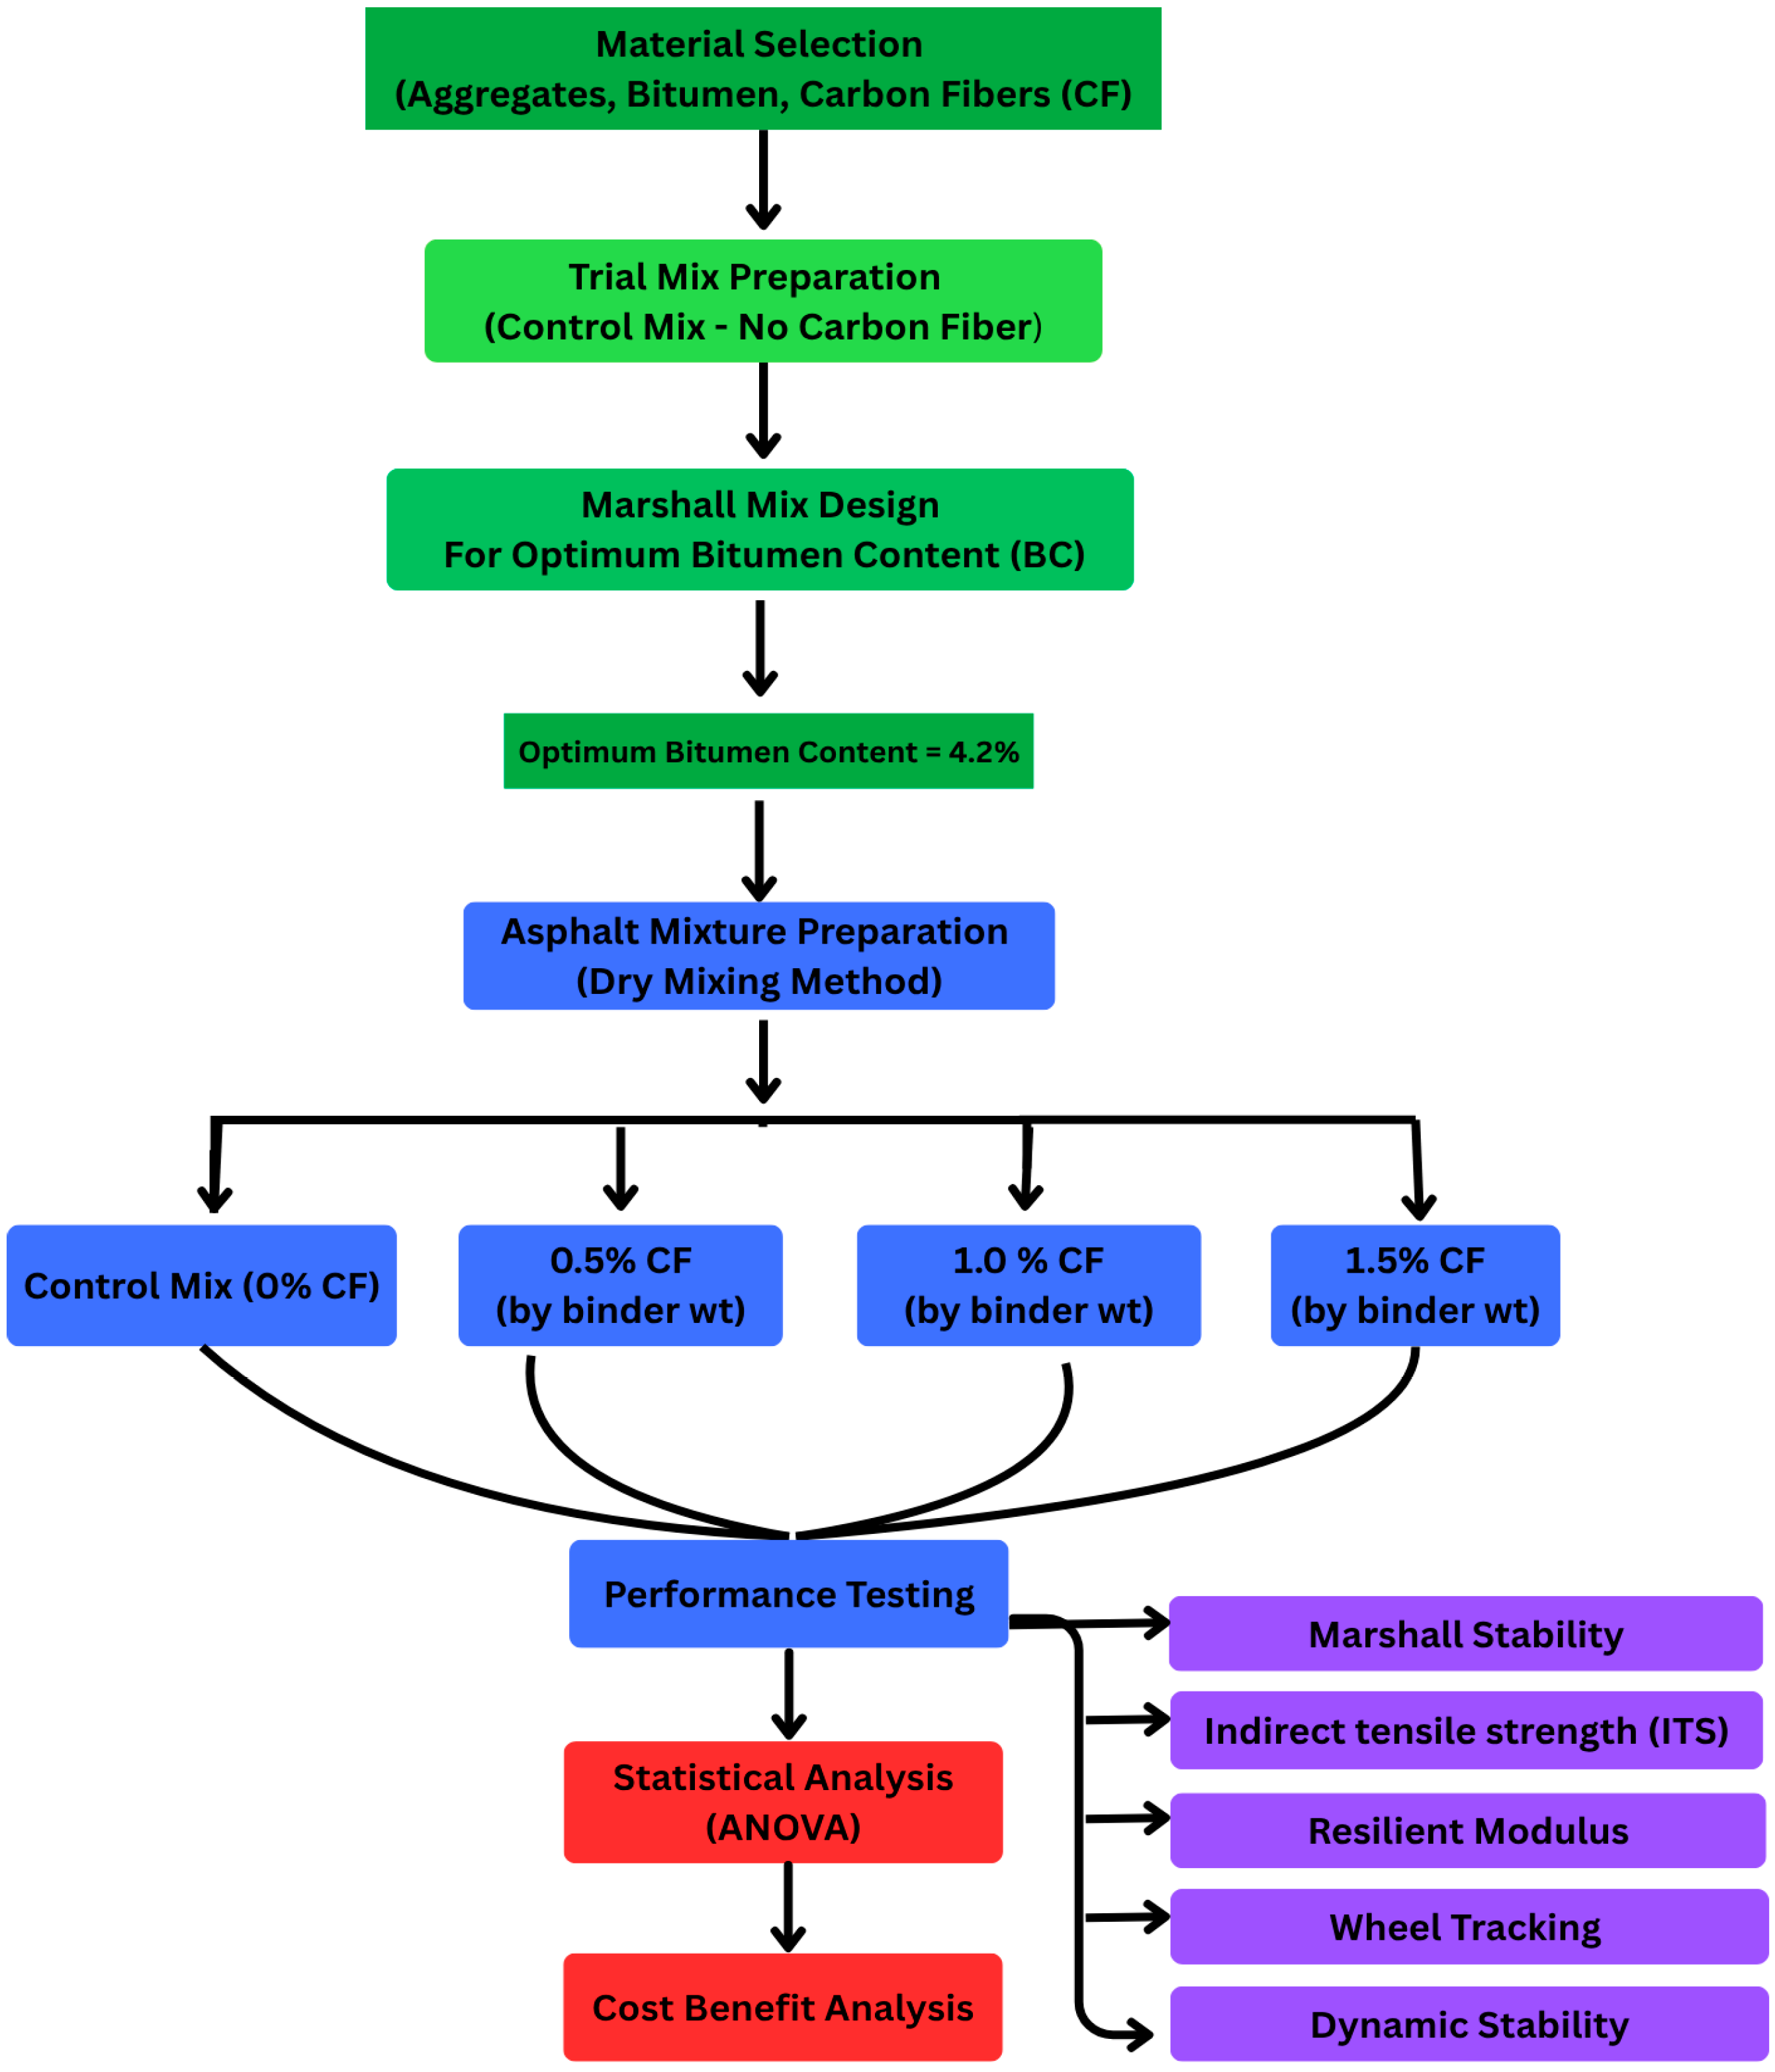
The materials and experimental procedures used in this study are described in detail in the following subsections. A flowchart summarizing the overall methodology is presented in
Figure 1.
2.1. Raw Materials
The details of the materials are given below.
A 60/70 penetration grade bitumen was obtained from the Durrani Bitumen Plant in Nowshera, Pakistan. This grade offers an appropriate balance of stiffness and flexibility for the region’s moderate traffic and climate conditions. Bitumen properties were tested following applicable ASTM standards to confirm compliance with specifications, with results summarized in
Table 1.
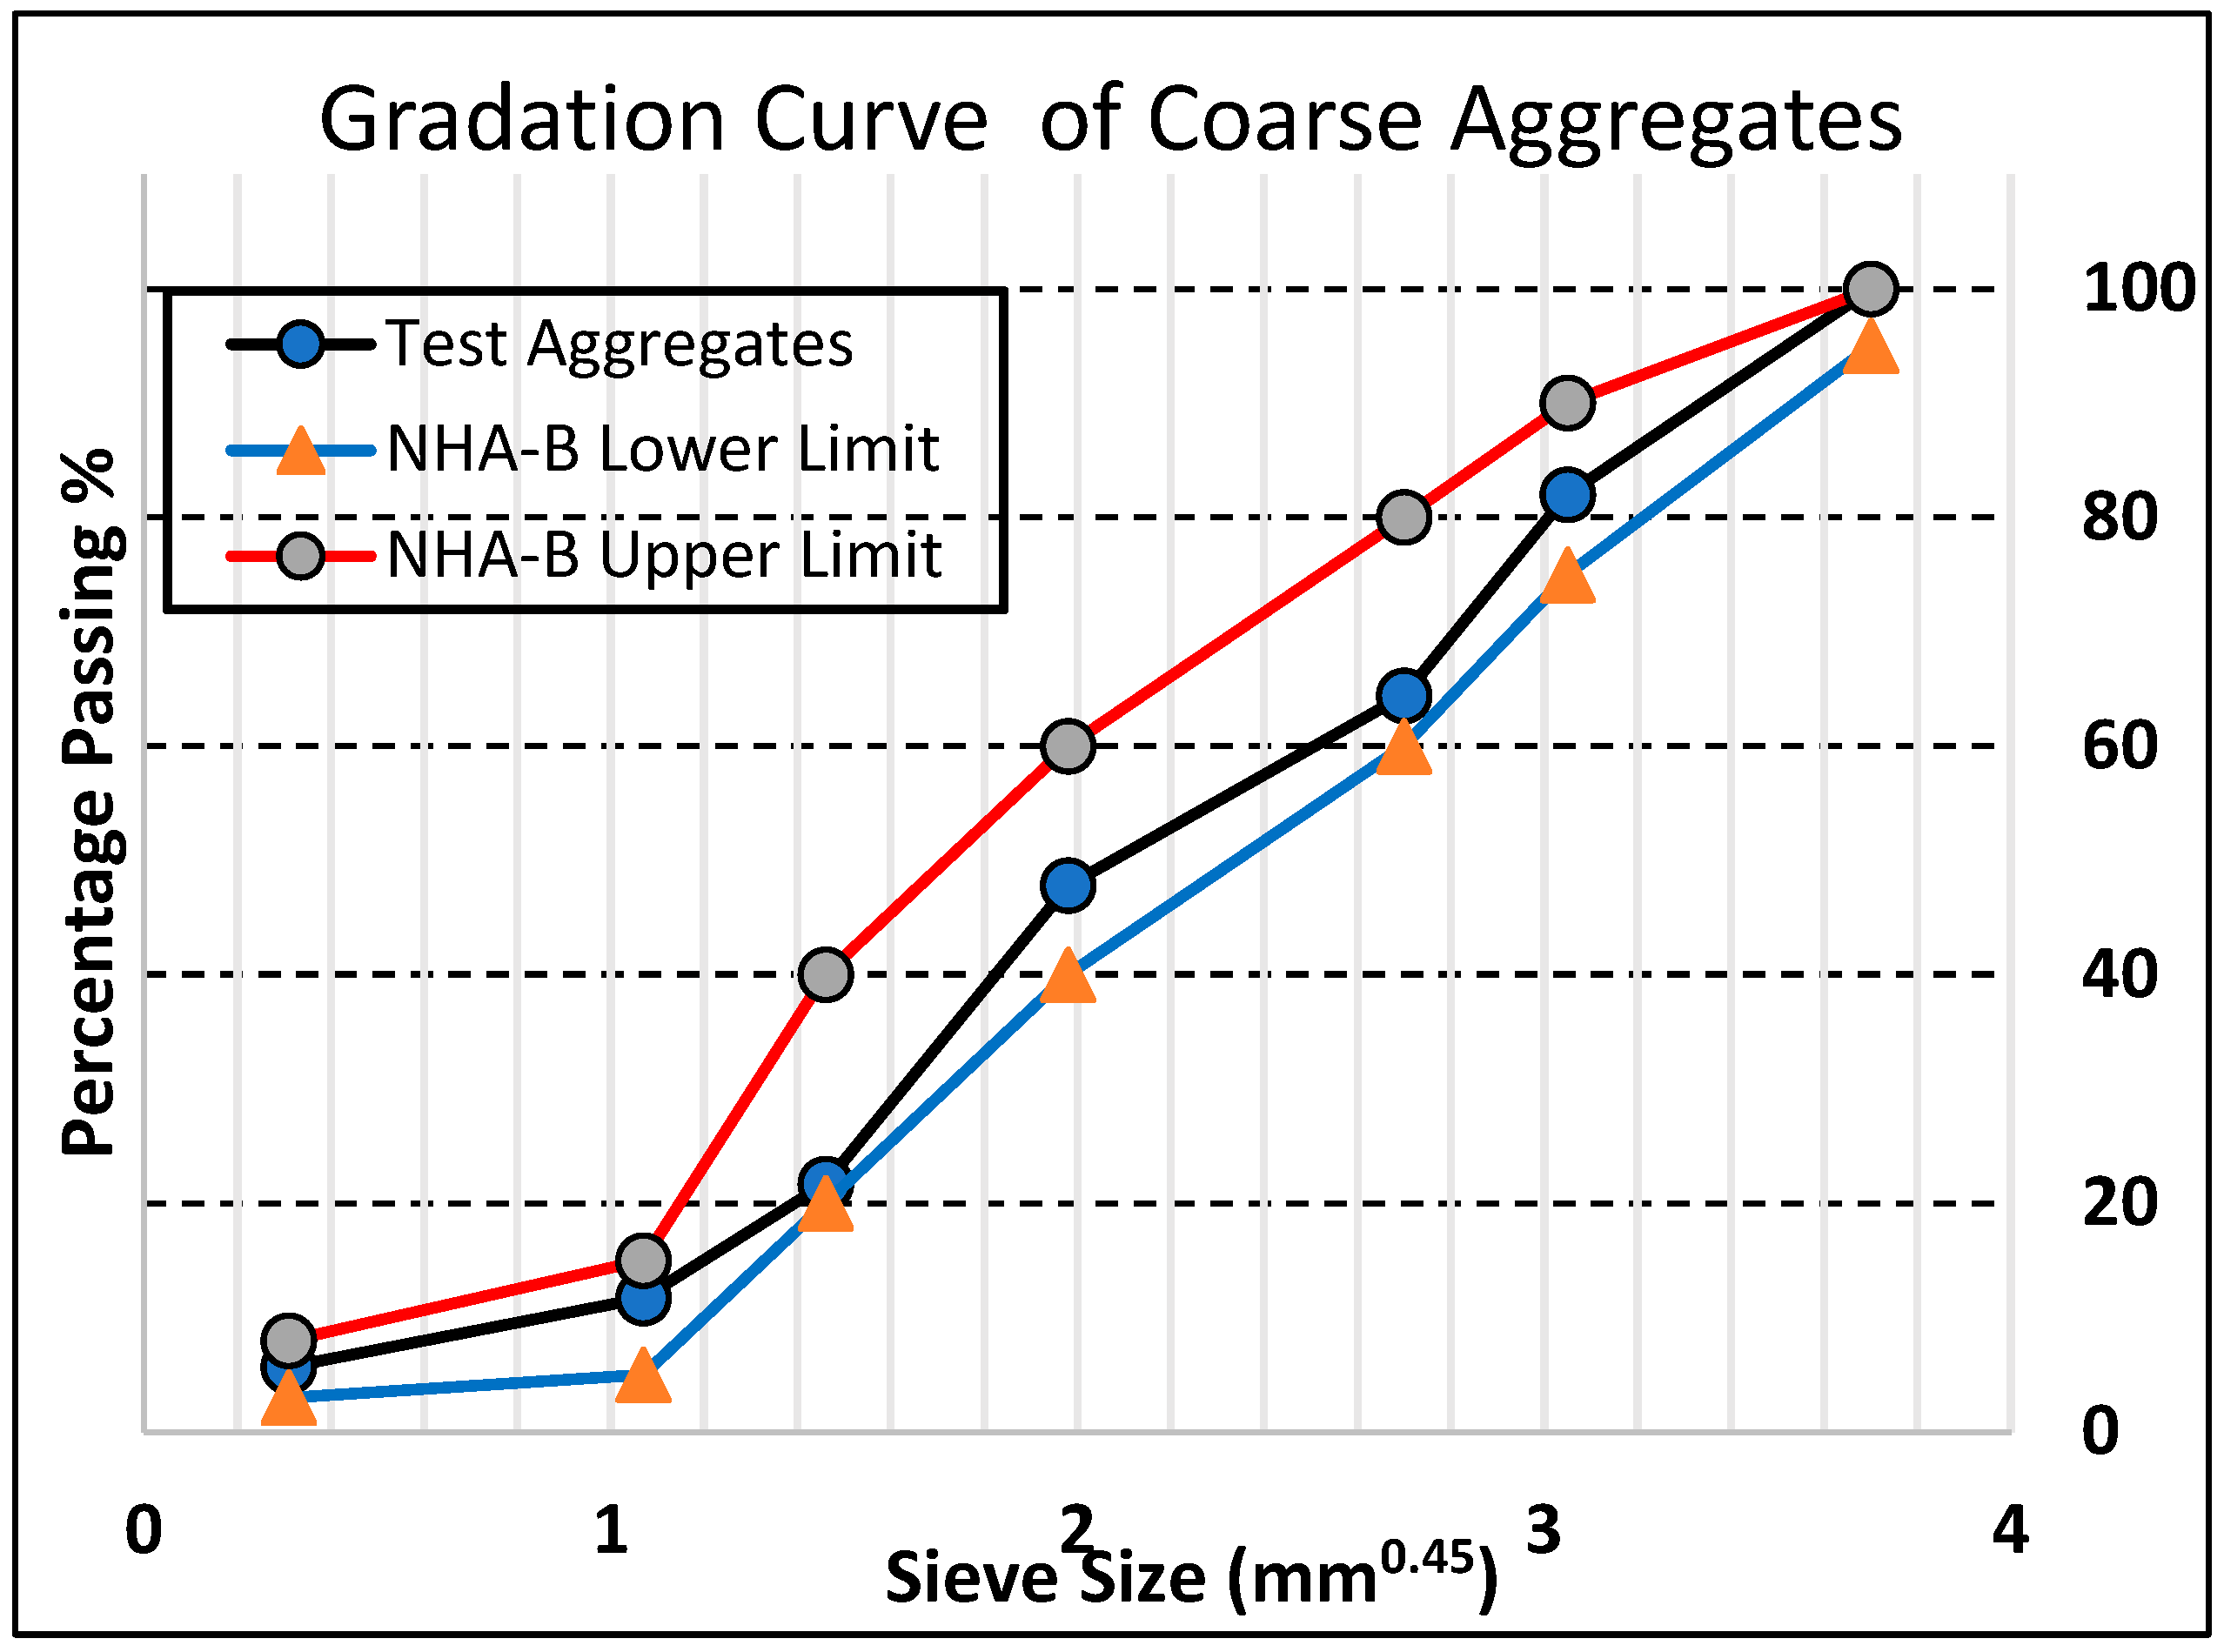
Aggregates and filler were sourced from a local quarry in Nowshera. The coarse aggregates met Class B gradation requirements as specified by the National Highway Authority (NHA) of Pakistan for dense-graded surface courses, in accordance with NHA (1998) guidelines [
29]. A 12.5 mm nominal maximum aggregate size (NMAS) was selected for Class B wearing course gradation in the Marshall mix design. The sieve analysis results for the coarse aggregates are provided in
Table 2, and
Figure 2 illustrates the corresponding gradation curves relative to the NHA Class B specification limits. Physical properties of both coarse and fine aggregates (filler) are summarized in
Table 3.
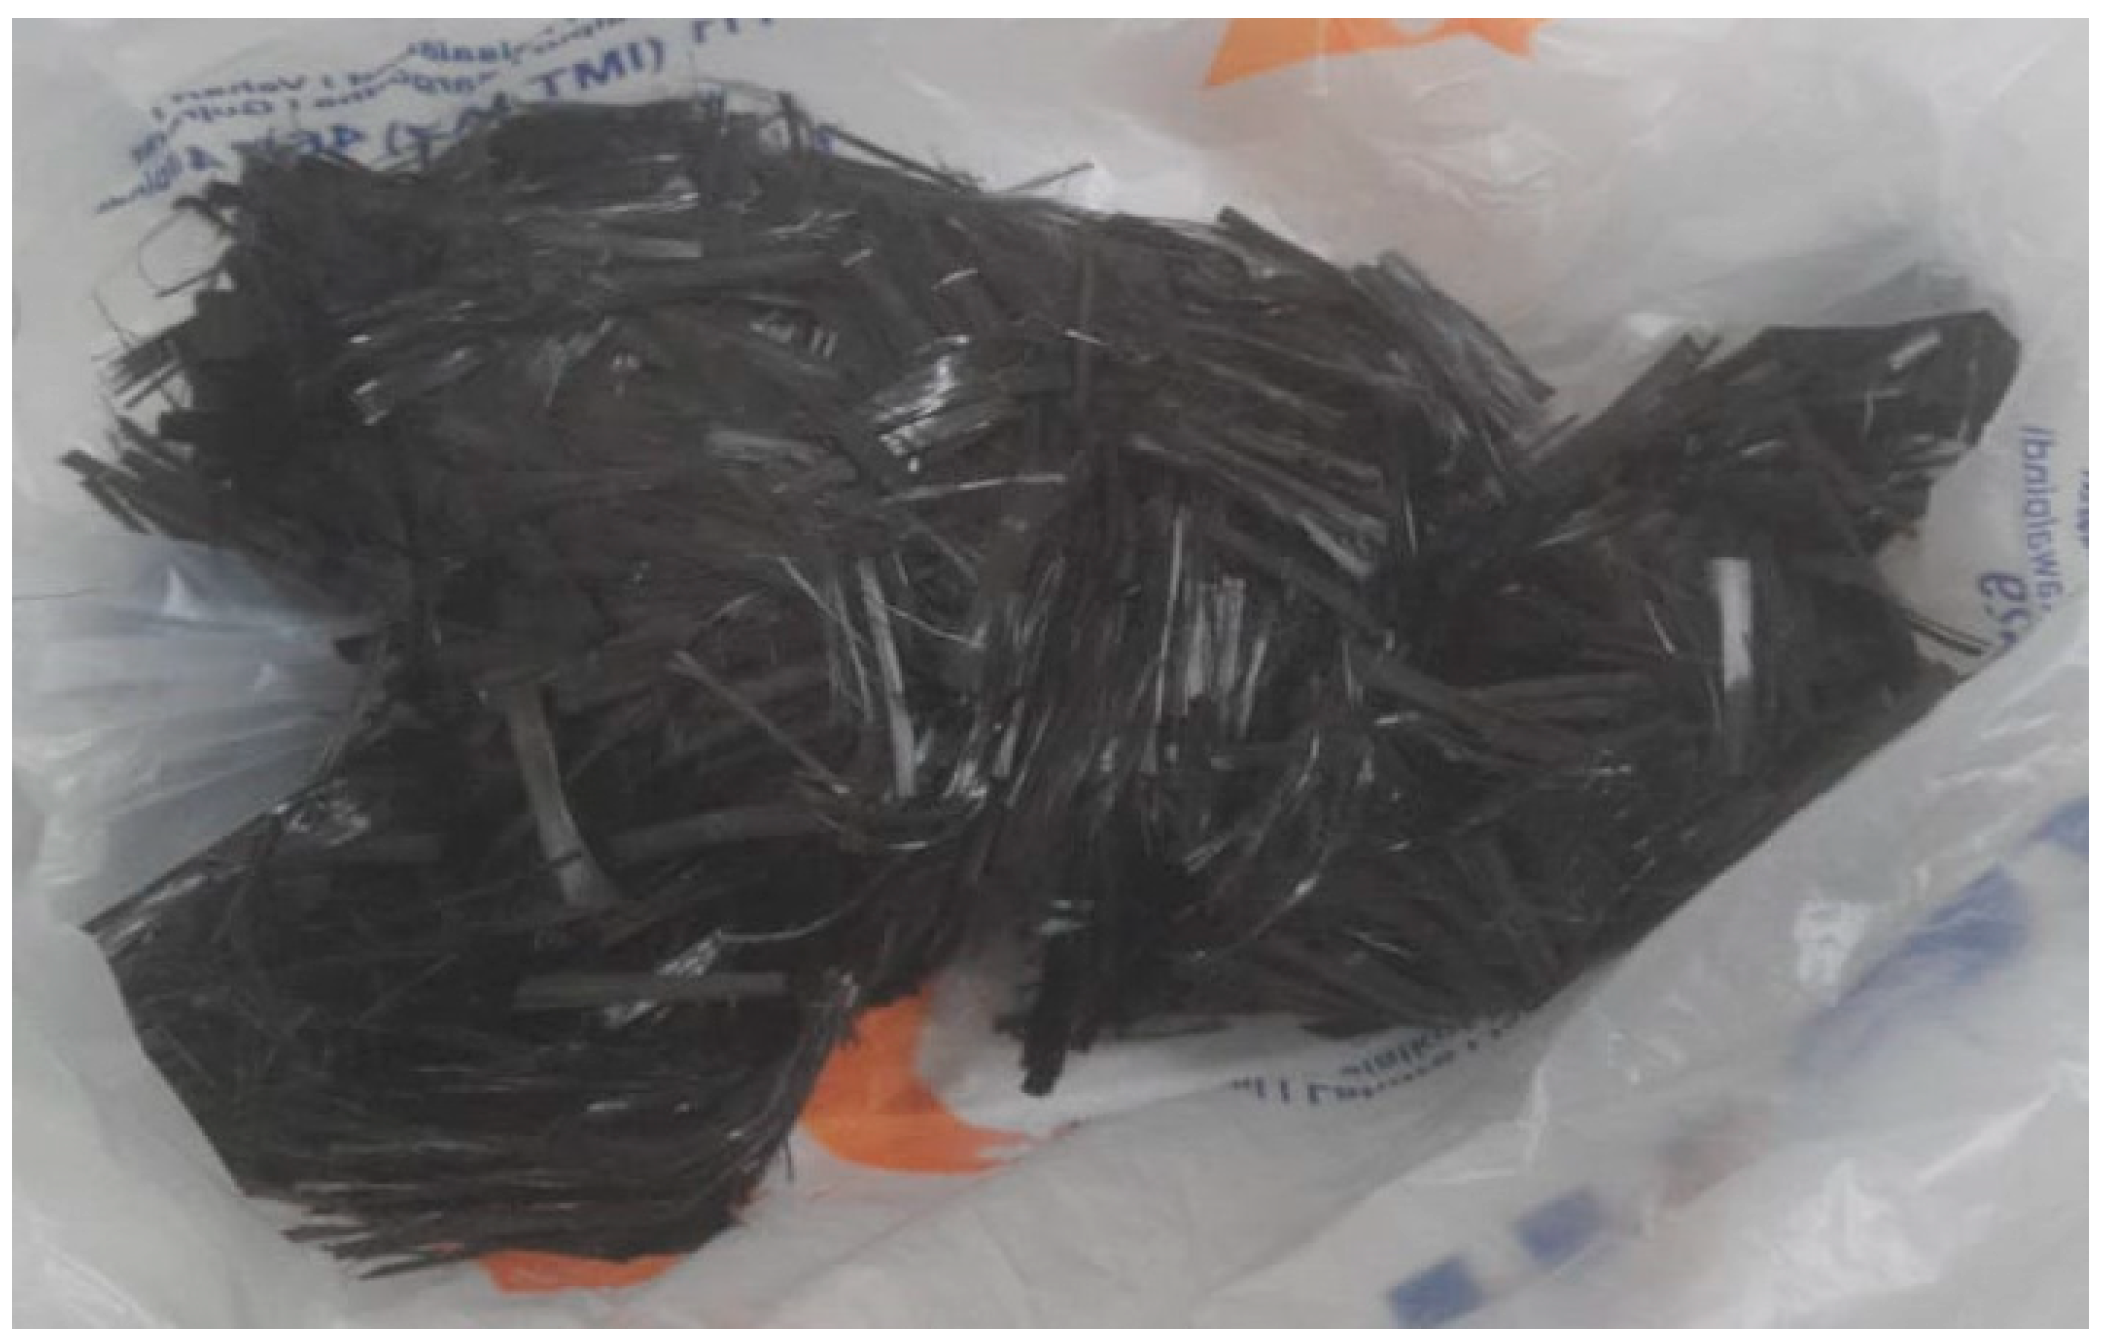
Carbon fibers were procured from Imporient Chemicals, Rawalpindi, Pakistan, supplied as woven wraps. These wraps were manually cut into discrete fibers approximately 0.5 inch (12.7 mm) in length (
Figure 3) to promote uniform dispersion throughout the asphalt concrete matrix. The selected fiber length was based on previous studies [
30,
31], indicating enhanced tensile strength and crack resistance in fiber-reinforced asphalt mixtures. The chopped fibers were then dry-mixed with aggregates before adding bitumen to ensure uniform distribution. The physical and thermal properties of CF are shown in
Table 4.
Table 1.
Basic properties of bitumen with standard specifications.
Table 1.
Basic properties of bitumen with standard specifications.
| Testing Description | Result | Specification | Standard |
|---|
| Penetration @ 25 °C (0.1 mm) | 63 | 60–70 (0.1 mm) | ASTM D5-06 [32] |
| Flash Point (°C) | 283 | ≥232 | ASTM D92-24 [33] |
| Fire Point (°C) | 303 | ≥270 | ASTM D92-24 [33] |
| Specific Gravity (–) | 1.03 | 1.01–1.06 | ASTM D70-97 [34] |
| Softening Point (°C) | 51 | 49–56 | ASTM D36-06 [35] |
| Absolute Viscosity (P) | 2770 | ≥2400 | ASTM D2171 [36] |
| Ductility (cm) | 109 | ≥100 | ASTM D113-17 [37] |
Table 2.
Aggregates sieve analysis.
Table 2.
Aggregates sieve analysis.
| Sieve Size (mm) | Sieve No. | Weight
Retained (g) | Cumulative Weight Retained (g) | Cumulative % Weight Retained | Cumulative % Weight Passing | NHA-B Spec Range (% Passing) |
|---|
| 19.0 | 3/4” | 0 | 0 | 0.00% | 100.00% | 100 |
| 12.5 | 1/2” | 180 | 180 | 18.04% | 81.96% | 75–90 |
| 9.5 | 3/8” | 176 | 356 | 35.67% | 64.33% | 60–80 |
| 4.75 | No. 4 | 166 | 522 | 52.31% | 47.69% | 40–60 |
| 2.36 | No. 8 | 261 | 783 | 78.46% | 21.54% | 20–40 |
| 1.18 | No. 16 | 100 | 883 | 88.46% | 11.54% | 5–15 |
| 0.075 | No. 200 | 60 | 943 | 94.49% | 5.51% | 3–8 |
| Pan | — | 55 | 998 | 100.00% | 0.00% | — |
Table 3.
Physical properties of aggregates.
Table 3.
Physical properties of aggregates.
| Property | Test Method (ASTM) | Fine Aggregate | Coarse Aggregate |
|---|
| Specific Gravity (SSD) | ASTM C128 [38] | 2.63 | 2.68 |
| Apparent Specific Gravity | ASTM C128 [38] | 2.70 | 2.74 |
| Water Absorption (%) | ASTM C128 [38] | 1.4 | 0.9 |
| Bulk Density (kg/m3) | ASTM C29 [39] | 1610 | 1470 |
| Fineness Modulus (FM) | ASTM C136 [40] | 2.85 | - |
| Sand Equivalent (%) | ASTM D2419 [41] | 81.2 | - |
| Soundness Loss (%) | ASTM C88 [42] | 5.1 | 2.8 |
| Angularity Index (%) | ASTM C1252 [43] | 41.3 | 35.6 |
| Los Angeles Abrasion Value (%) | ASTM C131 [44] | - | 24.5 |
Table 4.
Physical and thermal properties of carbon fibers used in asphalt composite.
Table 4.
Physical and thermal properties of carbon fibers used in asphalt composite.
| Property (Unit) | Fiber Length (mm) | Diameter (µm) | Density (g/cm3) | Tensile Strength (MPa) | Tensile Modulus (GPa) | Elongation at Break (%) | Electrical Conductivity (S/m) | Thermal Conductivity (W/m·K) | Chemical Resistance | Water
Absorption |
|---|
| Value | 12.7 | 7–8 | 1.75 | 4500 | 240 | 1.4 | 104 | 6 | Excellent | Negligible |
2.2. Methodology
2.2.1. Optimum Binder Content (OBC) Determination
To evaluate the mechanical and volumetric properties of carbon fiber (CF)-reinforced asphalt concrete, the optimum binder content (OBC) was first determined using the Marshall mix design method. Marshall stability and flow tests were conducted prior to the incorporation of carbon fibers. Cylindrical specimens of 101.6 mm diameter and 63.5 mm height were prepared. Each specimen was compacted using 75 blows per face with a standard Marshall hammer. Asphalt mixtures were produced with bitumen contents ranging from 3.5% to 5.5% (at 0.5% increments by total mix weight) to determine the OBC based on standard mix design criteria.
Aggregates were preheated to 170 °C and bitumen to 150 °C prior to mixing. The materials were thoroughly blended to achieve a homogeneous mixture, which was then placed into Marshall molds and compacted. After compaction, specimens were conditioned in a thermostatically controlled water bath at 60 °C for 30 min (unconditioned state) and 24 h (conditioned state) to evaluate moisture susceptibility. Marshall stability (kN) and flow (mm) values were recorded, and volumetric properties were calculated to determine the OBC corresponding to approximately 4% air voids.
2.2.2. Preparation of Carbon Fiber-Reinforced Mixtures
Following the determination of OBC, carbon fiber-modified mixtures were prepared using the dry mixing method. Carbon fibers were incorporated at 0.5%, 1.0%, and 1.5% by weight of bitumen. In this method, carbon fibers were first blended with preheated aggregates at 150 °C to promote uniform dispersion. Bitumen was then added, and mixing continued at 160–170 °C to produce a homogeneous CF-reinforced hot mix asphalt (HMA).
The selected fiber dosages were based on previous studies [
45,
46] and preliminary laboratory trials, which indicated that fiber contents within the range of 0.3–1.5% improve mechanical performance without significantly affecting binder demand or volumetric properties. Maintaining a constant OBC allowed for the isolation of the independent effect of carbon fiber content on mixture performance.
Higher fiber contents (>1.5%) were not considered due to observed reductions in workability and dispersion. Trial mixes with 2.0% CF exhibited fiber agglomeration, poor coating, and compaction difficulties. Therefore, 1.5% was selected as the upper practical limit.
2.2.3. Specimen Preparation and Conditioning
All mixtures, including the control and CF-modified mixtures, were subjected to short-term aging by oven-conditioning loose mixtures at 135 °C for 2 h prior to compaction, simulating plant production and placement conditions. Gyratory compaction was used to prepare specimens for performance testing. Samples were compacted at 135 °C using 125 gyrations (N design), corresponding to high-traffic conditions (EASLs ≥ 30 million). The resulting specimens had a diameter of 150 mm and a height of approximately 170 mm.
For tests requiring smaller dimensions, cylindrical specimens of 100 mm diameter were cored from the center of the gyratory-compacted samples. These specimens were then trimmed to a height of 150 mm to achieve a consistent height-to-diameter ratio of 1.5 for mechanical testing. Coring and trimming were performed carefully to maintain uniform density and minimize disturbance to the internal structure. Final specimens were inspected to ensure smooth surfaces, parallel ends, and compliance with dimensional requirements.
All specimens were prepared to achieve a consistent air-void content of 4 ± 0.5% to ensure comparability across different tests and mixture types.
2.3. Marshall Stability and Flow Test
Marshall stability and flow tests were conducted in accordance with ASTM D6927 [
47] to determine the optimum binder content (OBC). Marshall-compacted specimens (101.6 mm diameter × 63.5 mm height) were used for this purpose. Prior to testing, specimens were weighed in air and water to determine bulk specific gravity. The specimens were then conditioned in a water bath at 60 °C for 30 min (unconditioned state) and 24 h (conditioned state). Testing was performed using a Marshall stability apparatus at a constant loading rate of 50 mm/min.
The maximum load sustained by each specimen was recorded as Marshall stability. A 100 mm diameter specimen was then cored. The height was also trimmed to 150 mm to comply with the dynamic modulus test specimen requirements, while the corresponding deformation at failure was recorded as flow (mm). These results were used to calculate volumetric properties, including air voids (Va), voids in mineral aggregate (VMA), voids filled with asphalt (VFA), and bulk specific gravity (Gmb). The OBC was selected based on achieving approximately 4% air voids (within the 3–5% range) while satisfying standard stability and flow requirements.
The OBC determined for the control mixture was maintained constant for all carbon fiber (CF)-modified mixtures to isolate the effect of fiber addition. This approach is justified as the CF content is relatively low (0.5–1.5% by weight of bitumen) and primarily acts as a reinforcing material rather than a binder modifier [
48].
2.4. Retained Stability
Moisture susceptibility of the asphalt mixtures was evaluated using the retained stability test based on Marshall stability results. Retained stability (%) was calculated as the ratio of the stability of conditioned specimens (immersed at 60 °C for 24 h) to that of unconditioned specimens (immersed at 60 °C for 30 min), expressed as a percentage, as shown in Equation (1). This parameter offers a quantitative measure of the asphalt mixture’s resistance to moisture damage.
2.5. Indirect Tensile Strength Test (ITS)
The indirect tensile strength (ITS) test was conducted in accordance with ASTM D6931 [
49] to evaluate the tensile strength and cracking resistance of the mixtures. Marshall-compacted specimens were used for ITS testing to ensure consistency with the mix design stage. Specimens were conditioned at 25 °C prior to testing. The test was performed using a MATEST Universal Testing Machine (UTM) equipped with curved loading strips. A vertical diametral load was applied at a constant rate of 50 mm/min until failure.
The ITS was calculated using the following standard equation:
In this context, P is the peak load at failure (N), t is the specimen thickness (mm), and D is the specimen diameter (mm). The ITS results were later used to assess and compare the cracking resistance of control and carbon fiber-reinforced mixtures.
2.6. Resilient Modulus (MR) Test
The resilient modulus (MR) test was conducted following ASTM D7369 [
50] to evaluate the elastic response of asphalt mixtures under repeated loading. Gyratory-compacted specimens were used for MR testing. Cylindrical specimens (100 mm diameter × 150 mm height) were obtained by coring and trimming larger gyratory samples, ensuring a height-to-diameter ratio of 1.5. Specimens were tested at 25 °C.
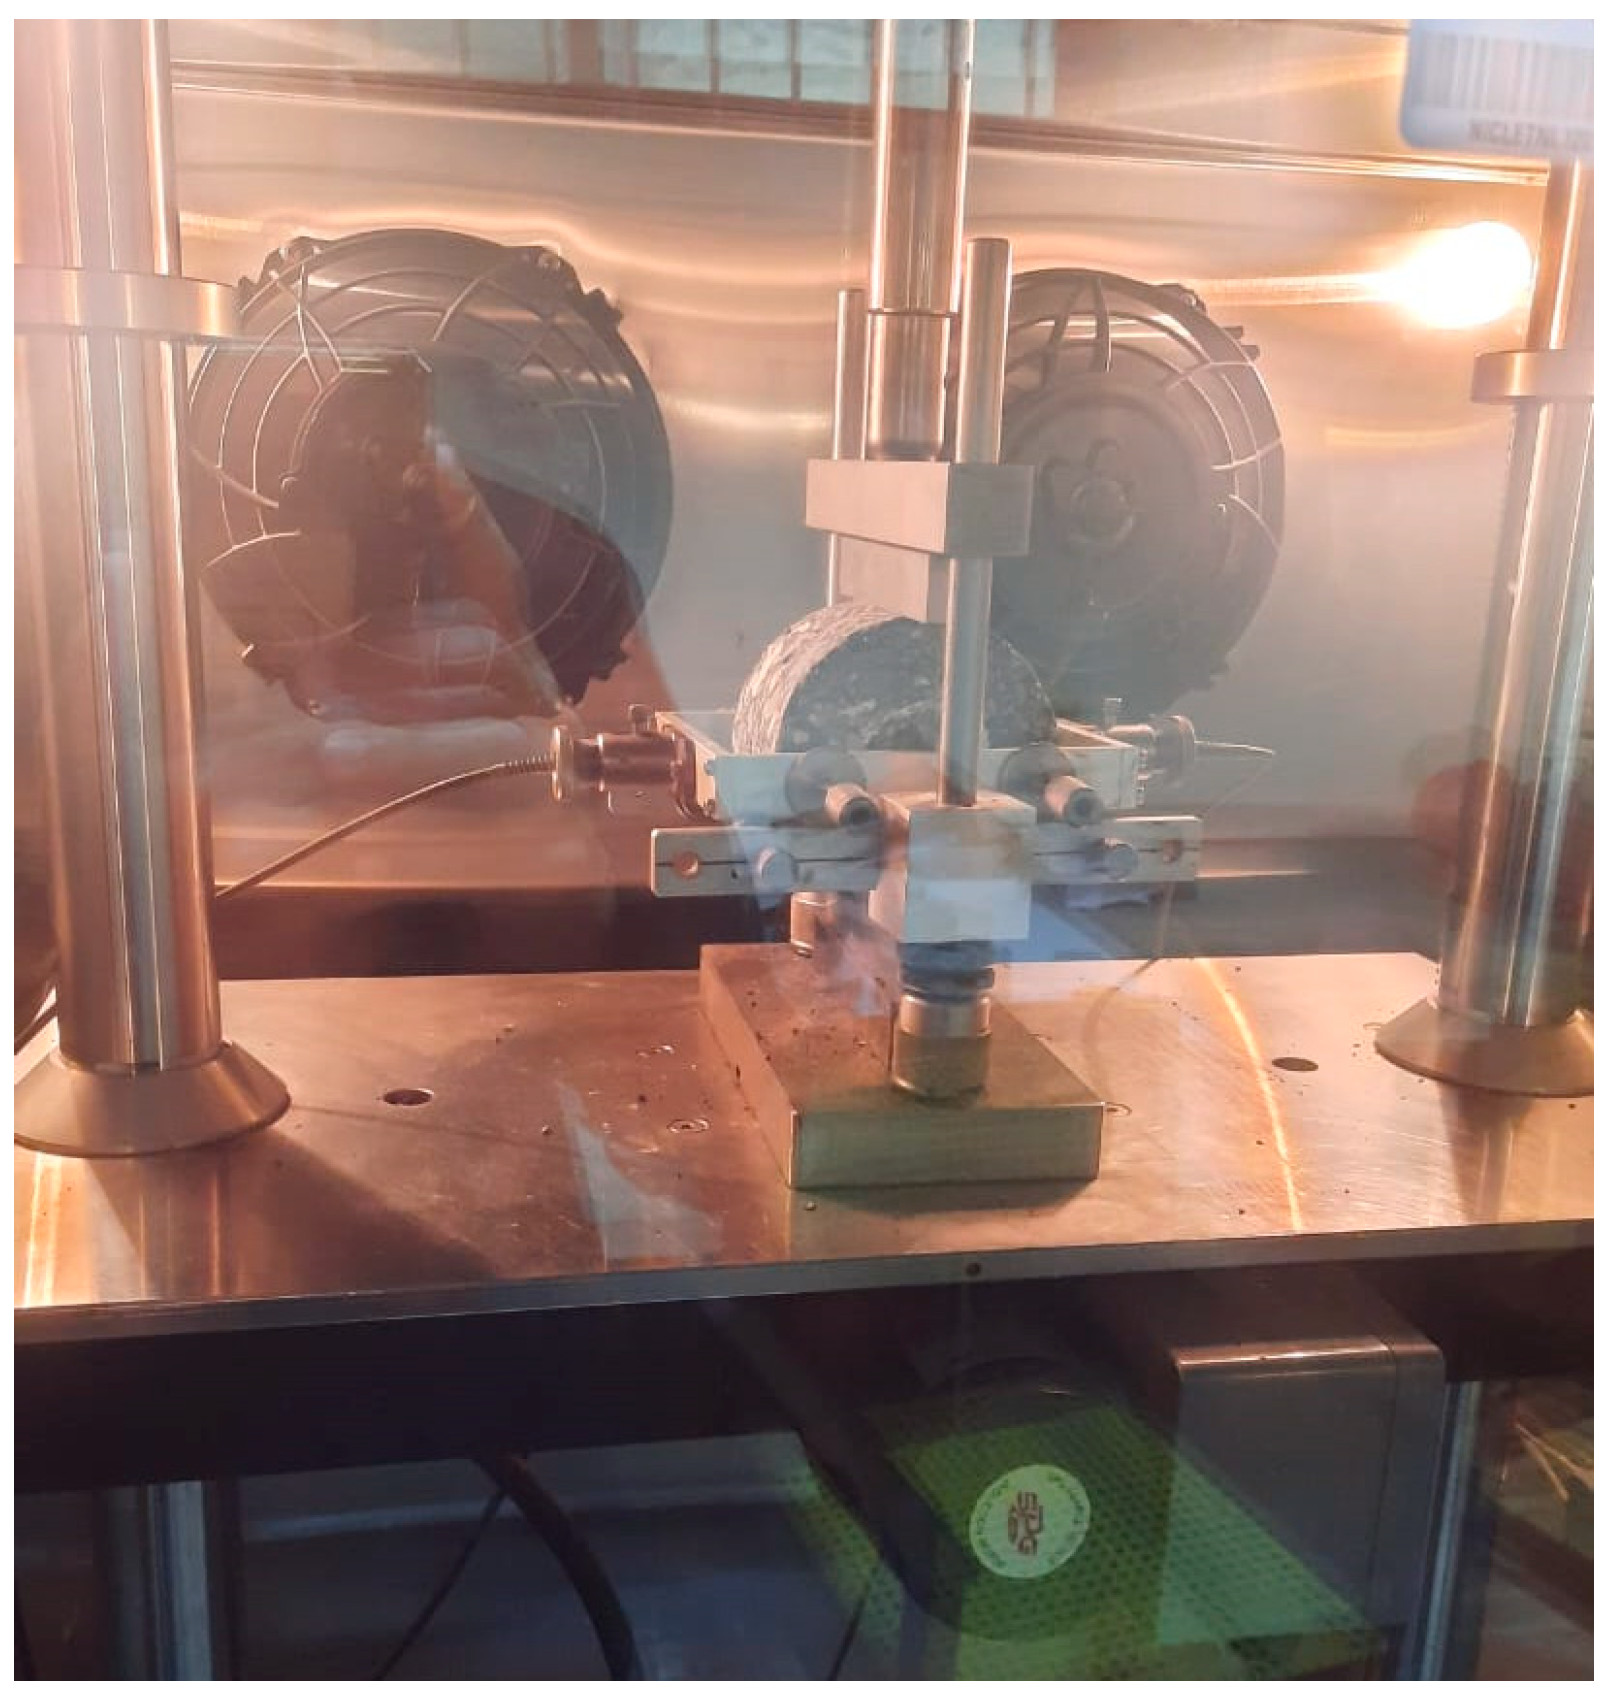
The test was performed using a UTM equipped with a repeated load system, as shown in
Figure 4. A cyclic haversine load was applied, with the peak load set at 5–20% of the ITS value to ensure recoverable deformation. Horizontal recoverable deformation was measured using linear variable differential transformers (LVDTs).
The resilient modulus was calculated as the ratio of applied deviator stress to the corresponding recoverable strain. The MR was calculated with the following equation:
where M
R is the resilient modulus (MPa), σ
d is the applied deviator stress (MPa), and ε
r is the recoverable horizontal strain per cycle. Both control specimens (0% CF) and those reinforced with 0.5%, 1.0%, and 1.5% carbon fiber (by weight of binder) were tested under identical conditions. The results were later used to analyze the impact of carbon fiber reinforcement on the stiffness properties of HMA.
2.7. Hamburg Wheel Tracking Test (HWT)
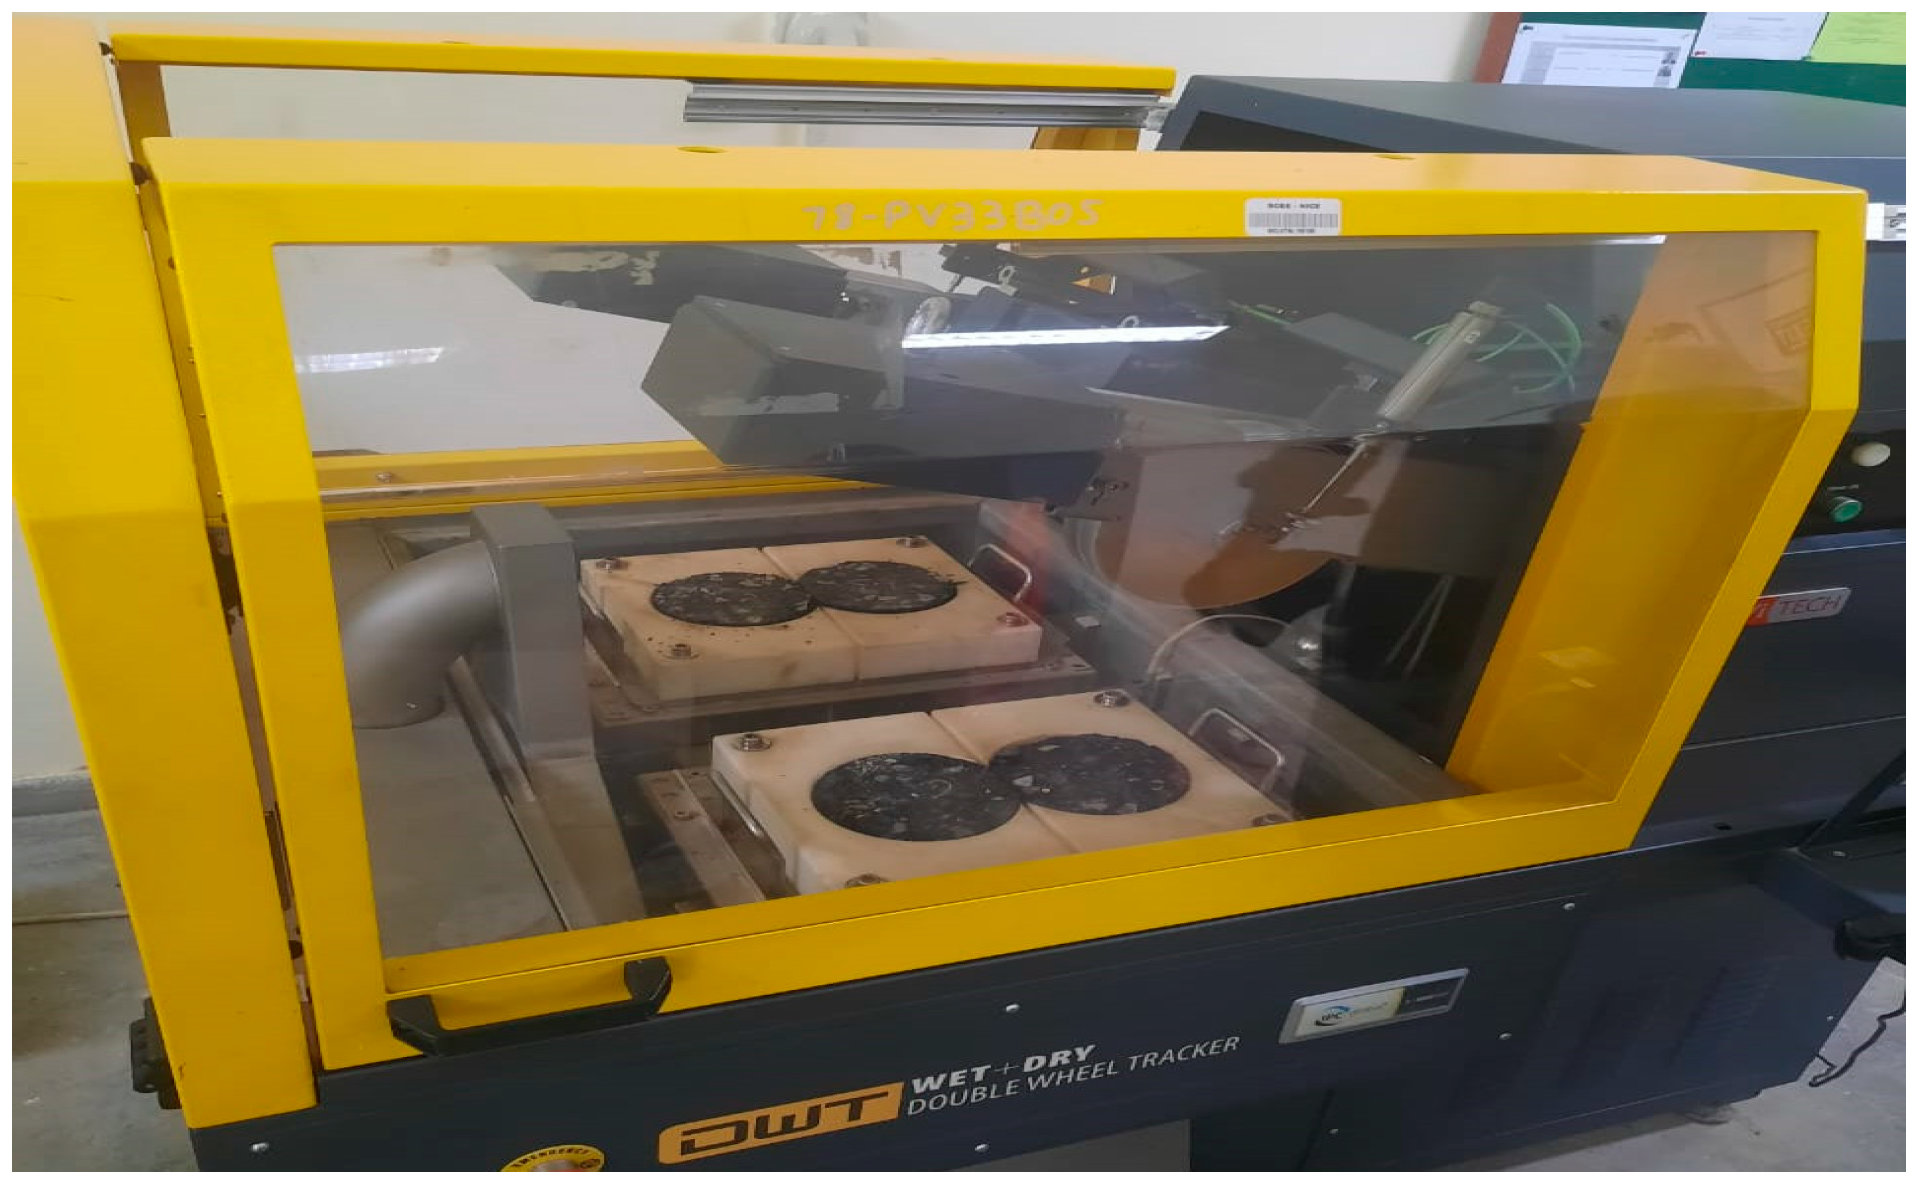
The Hamburg Wheel Tracking (HWT) test (
Figure 5) was conducted in accordance with AASHTO T324 [
51] to evaluate rutting resistance under repeated loading at elevated temperatures. Gyratory-compacted specimens (150 mm diameter × 50 mm height) were prepared for this test. Prior to testing, specimens were conditioned at 60 °C for 6 h.
The test was performed by applying repeated wheel loading under a contact stress of 0.7 MPa. Rut depth was recorded as a function of loading time.
The dynamic stability (DS), representing resistance to permanent deformation, was calculated using:
Both control specimens (0% CF) and CF-reinforced mixtures (containing 0.5%, 1.0%, and 1.5% CF by weight of binder) were tested under identical conditions.
A summary of specimen preparation methods, dimensions, conditioning procedures, and testing standards for each test is presented in
Table 5.
2.8. Cost–Benefit Analysis
A cost–benefit analysis was conducted to compare the life-cycle economic performance of conventional asphalt pavement and carbon fiber (CF)-reinforced asphalt pavement over a 20-year period. A 1 km single-lane section (3.5 m width) with a 50 mm asphalt surface course was used as the reference design. The total asphalt mix mass was calculated from geometric dimensions and compacted density, and bitumen content was taken as 4.2% by mass of the mix. In the CF-reinforced case, 1% of the bitumen mass was replaced with carbon fiber, and unit costs for both bitumen and CF were applied to determine the adjusted initial construction cost. Life-cycle cost modeling incorporated scheduled major maintenance events, with conventional asphalt assumed to require periodic overlays and CF-reinforced asphalt assumed to have an extended service life with reduced maintenance frequency. All future costs were discounted to present value using an 8% annual discount rate, and the benefit–cost ratio was calculated by comparing the present value of total savings to the additional initial investment in CF. The unit costs of bitumen and carbon fiber were taken as PKR 120/kg and PKR 2500/kg, respectively, highlighting the substantially higher material cost of carbon fiber. Nevertheless, due to its low dosage and resulting performance enhancements, the CF-reinforced mixtures demonstrate improved life-cycle cost efficiency.
2.9. Statistical Analysis Using ANOVA
To confirm the reliability and consistency of the experimental findings, statistical analysis was carried out using one-way analysis of variance (ANOVA). This approach was applied to determine whether the variations in performance across mixtures with different carbon fiber (CF) dosages were statistically significant. For each performance test, indirect tensile strength, resilient modulus, and dynamic stability, three replicate specimens were evaluated at each CF content (0%, 0.5%, 1.0%, and 1.5%). The resulting measurements were subjected to ANOVA with a significance level set at α = 0.05. This threshold implies that there is less than 5% probability that the observed differences arose purely by chance.
3. Results and Discussion
3.1. Marshall Mix Test for OBC
The Marshall mix design method was employed to establish OBC by evaluating volumetric and mechanical properties of the asphalt mix. The OBC was selected based on achieving target values for key parameters, including an air void (Va) content of 4%, which lies within the standard specification range of 3–5%, along with desirable bulk density (Gmb) and Marshall stability values. The analysis determined 4.2% as the OBC, satisfying all required binder performance criteria. Additionally, all essential volumetric and mechanical parameters—Va, Gmb, voids in mineral aggregate (VMA), voids filled with asphalt (VFA), Marshall stability, and flow—were calculated and verified for compliance.
3.1.1. Volume of Air Voids (Va)
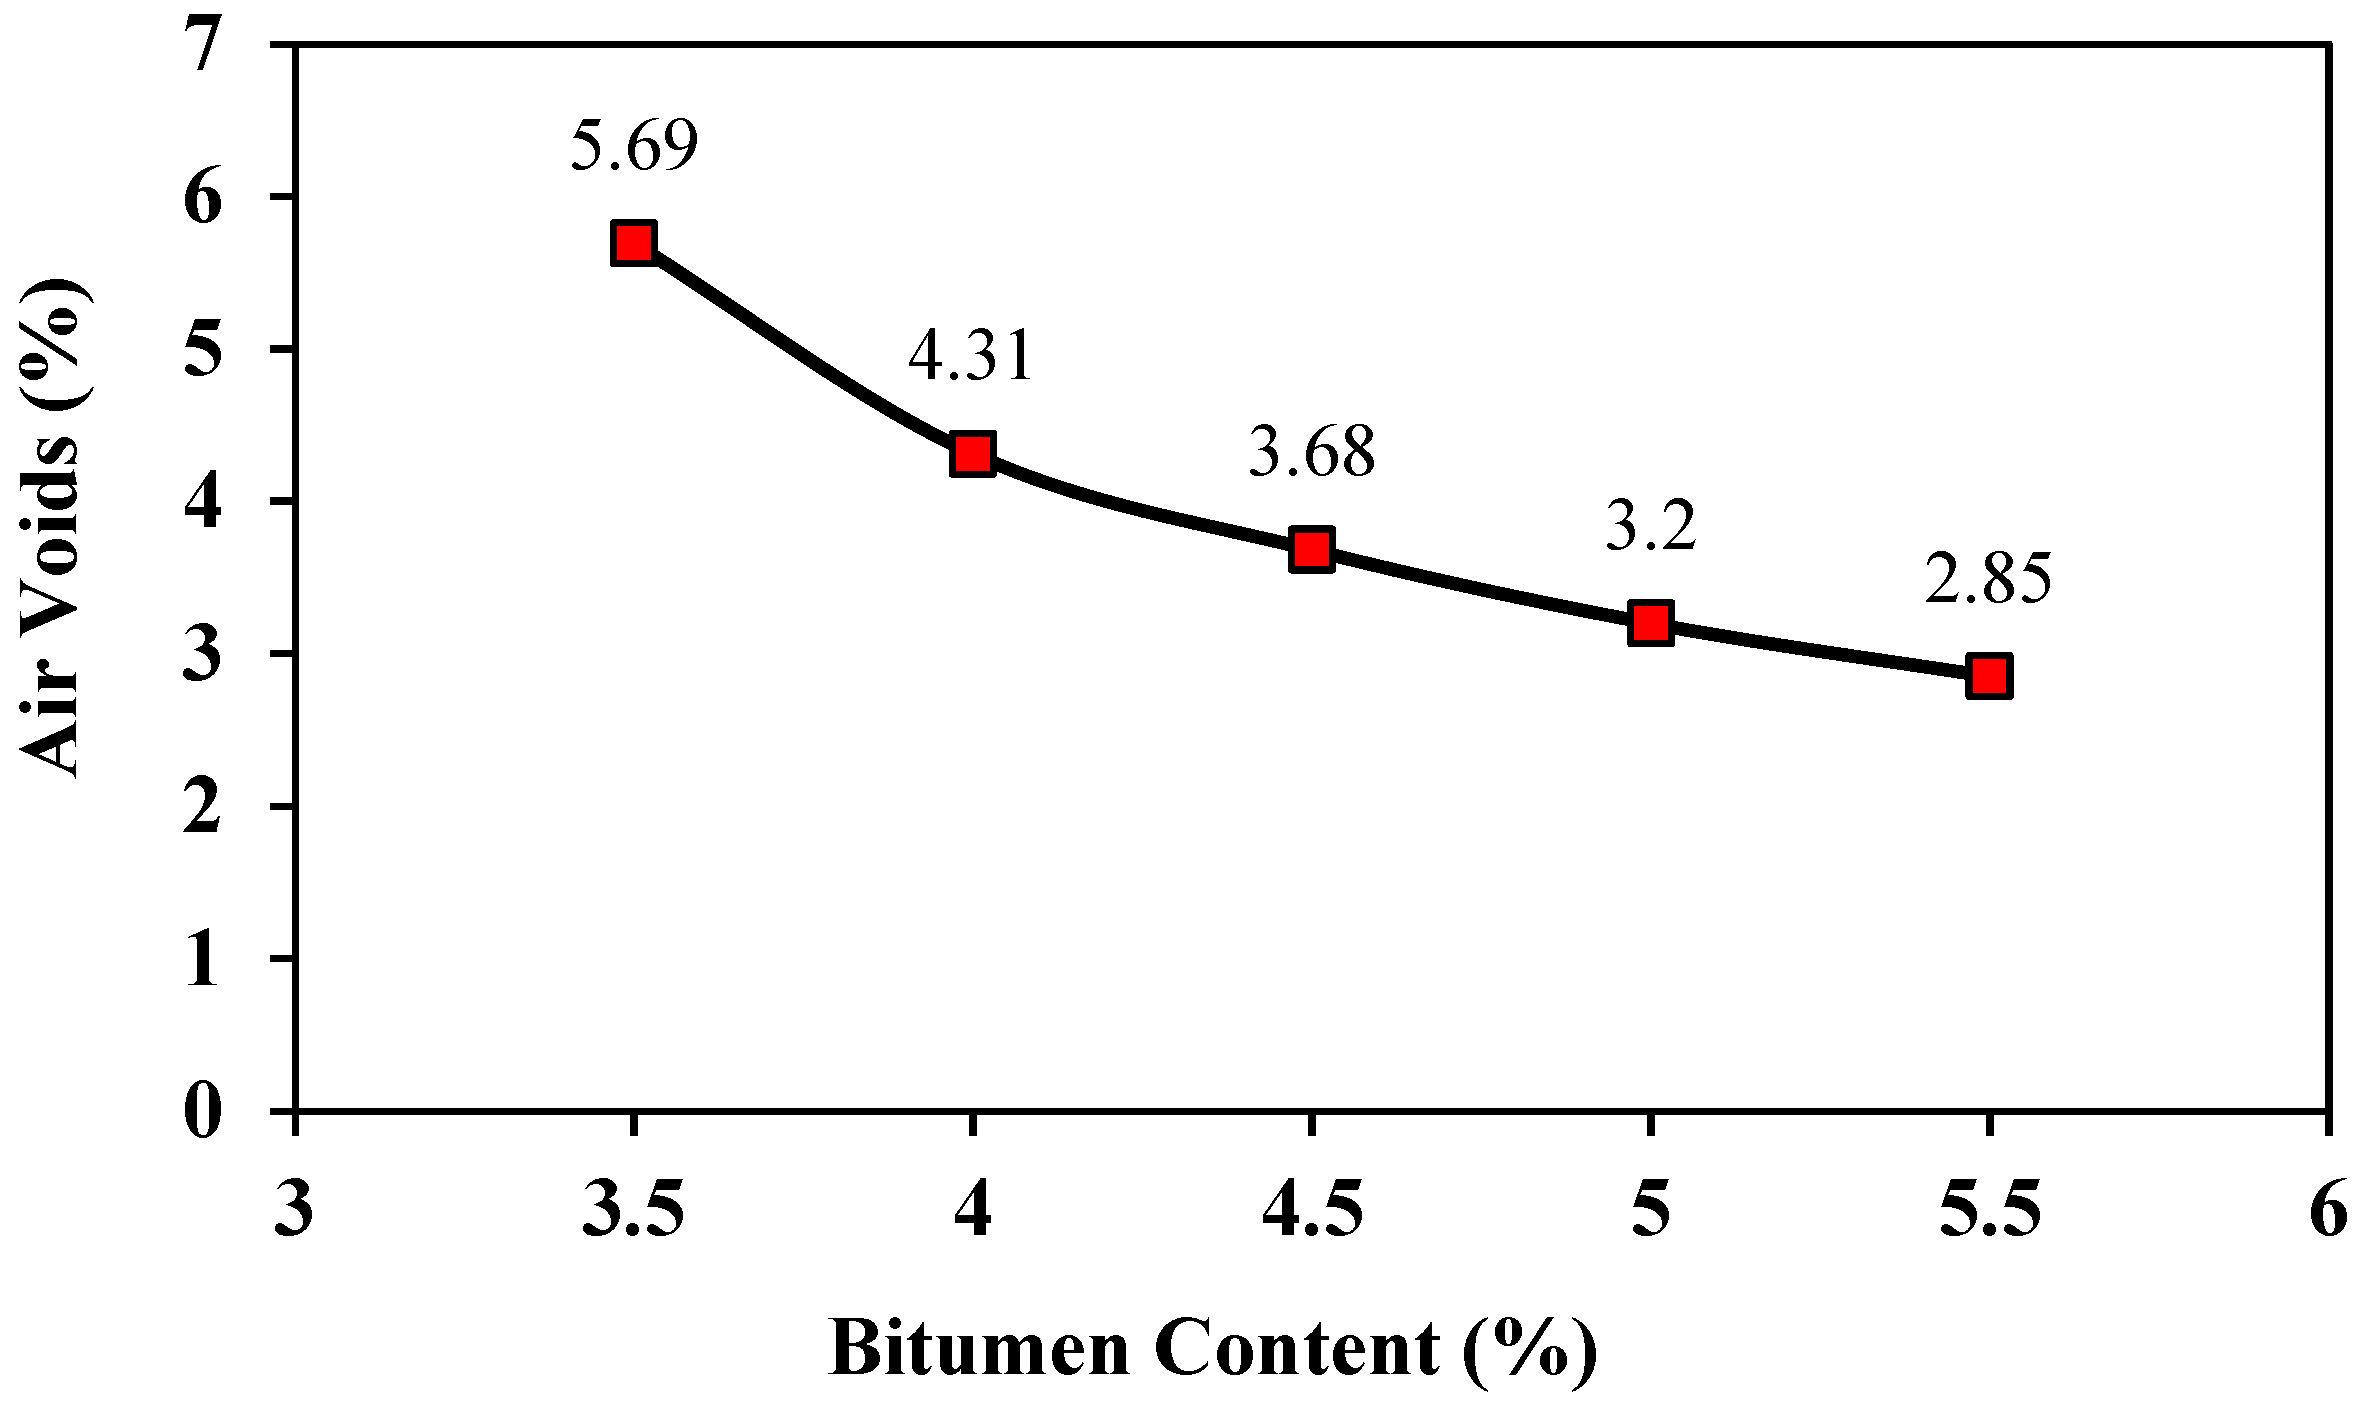
The presence of air voids within compacted asphalt, essentially the empty spaces between coated aggregates, fundamentally governs pavement performance. Too many voids compromise stability and invite moisture damage; too few reduce flexibility and accelerate rutting. This study analysis confirmed that at 4.2% bitumen content, the air void content measured exactly 4.0% (
Figure 6), positioning it ideally within the 3–5% specification range. This value represents a practical midpoint between insufficient and excessive compaction.
Increasing the binder content consistently reduced void percentages, from 5.69% at 3.5% bitumen to just 2.85% at 5.5%. This trend underscores the binder’s role in filling interstitial spaces between aggregates. Selecting 4.2% as the optimum content therefore balances void requirements: enough air to permit slight densification under traffic without creating pathways for water intrusion or premature failure.
3.1.2. Bulk Specific Gravity (Gmb)
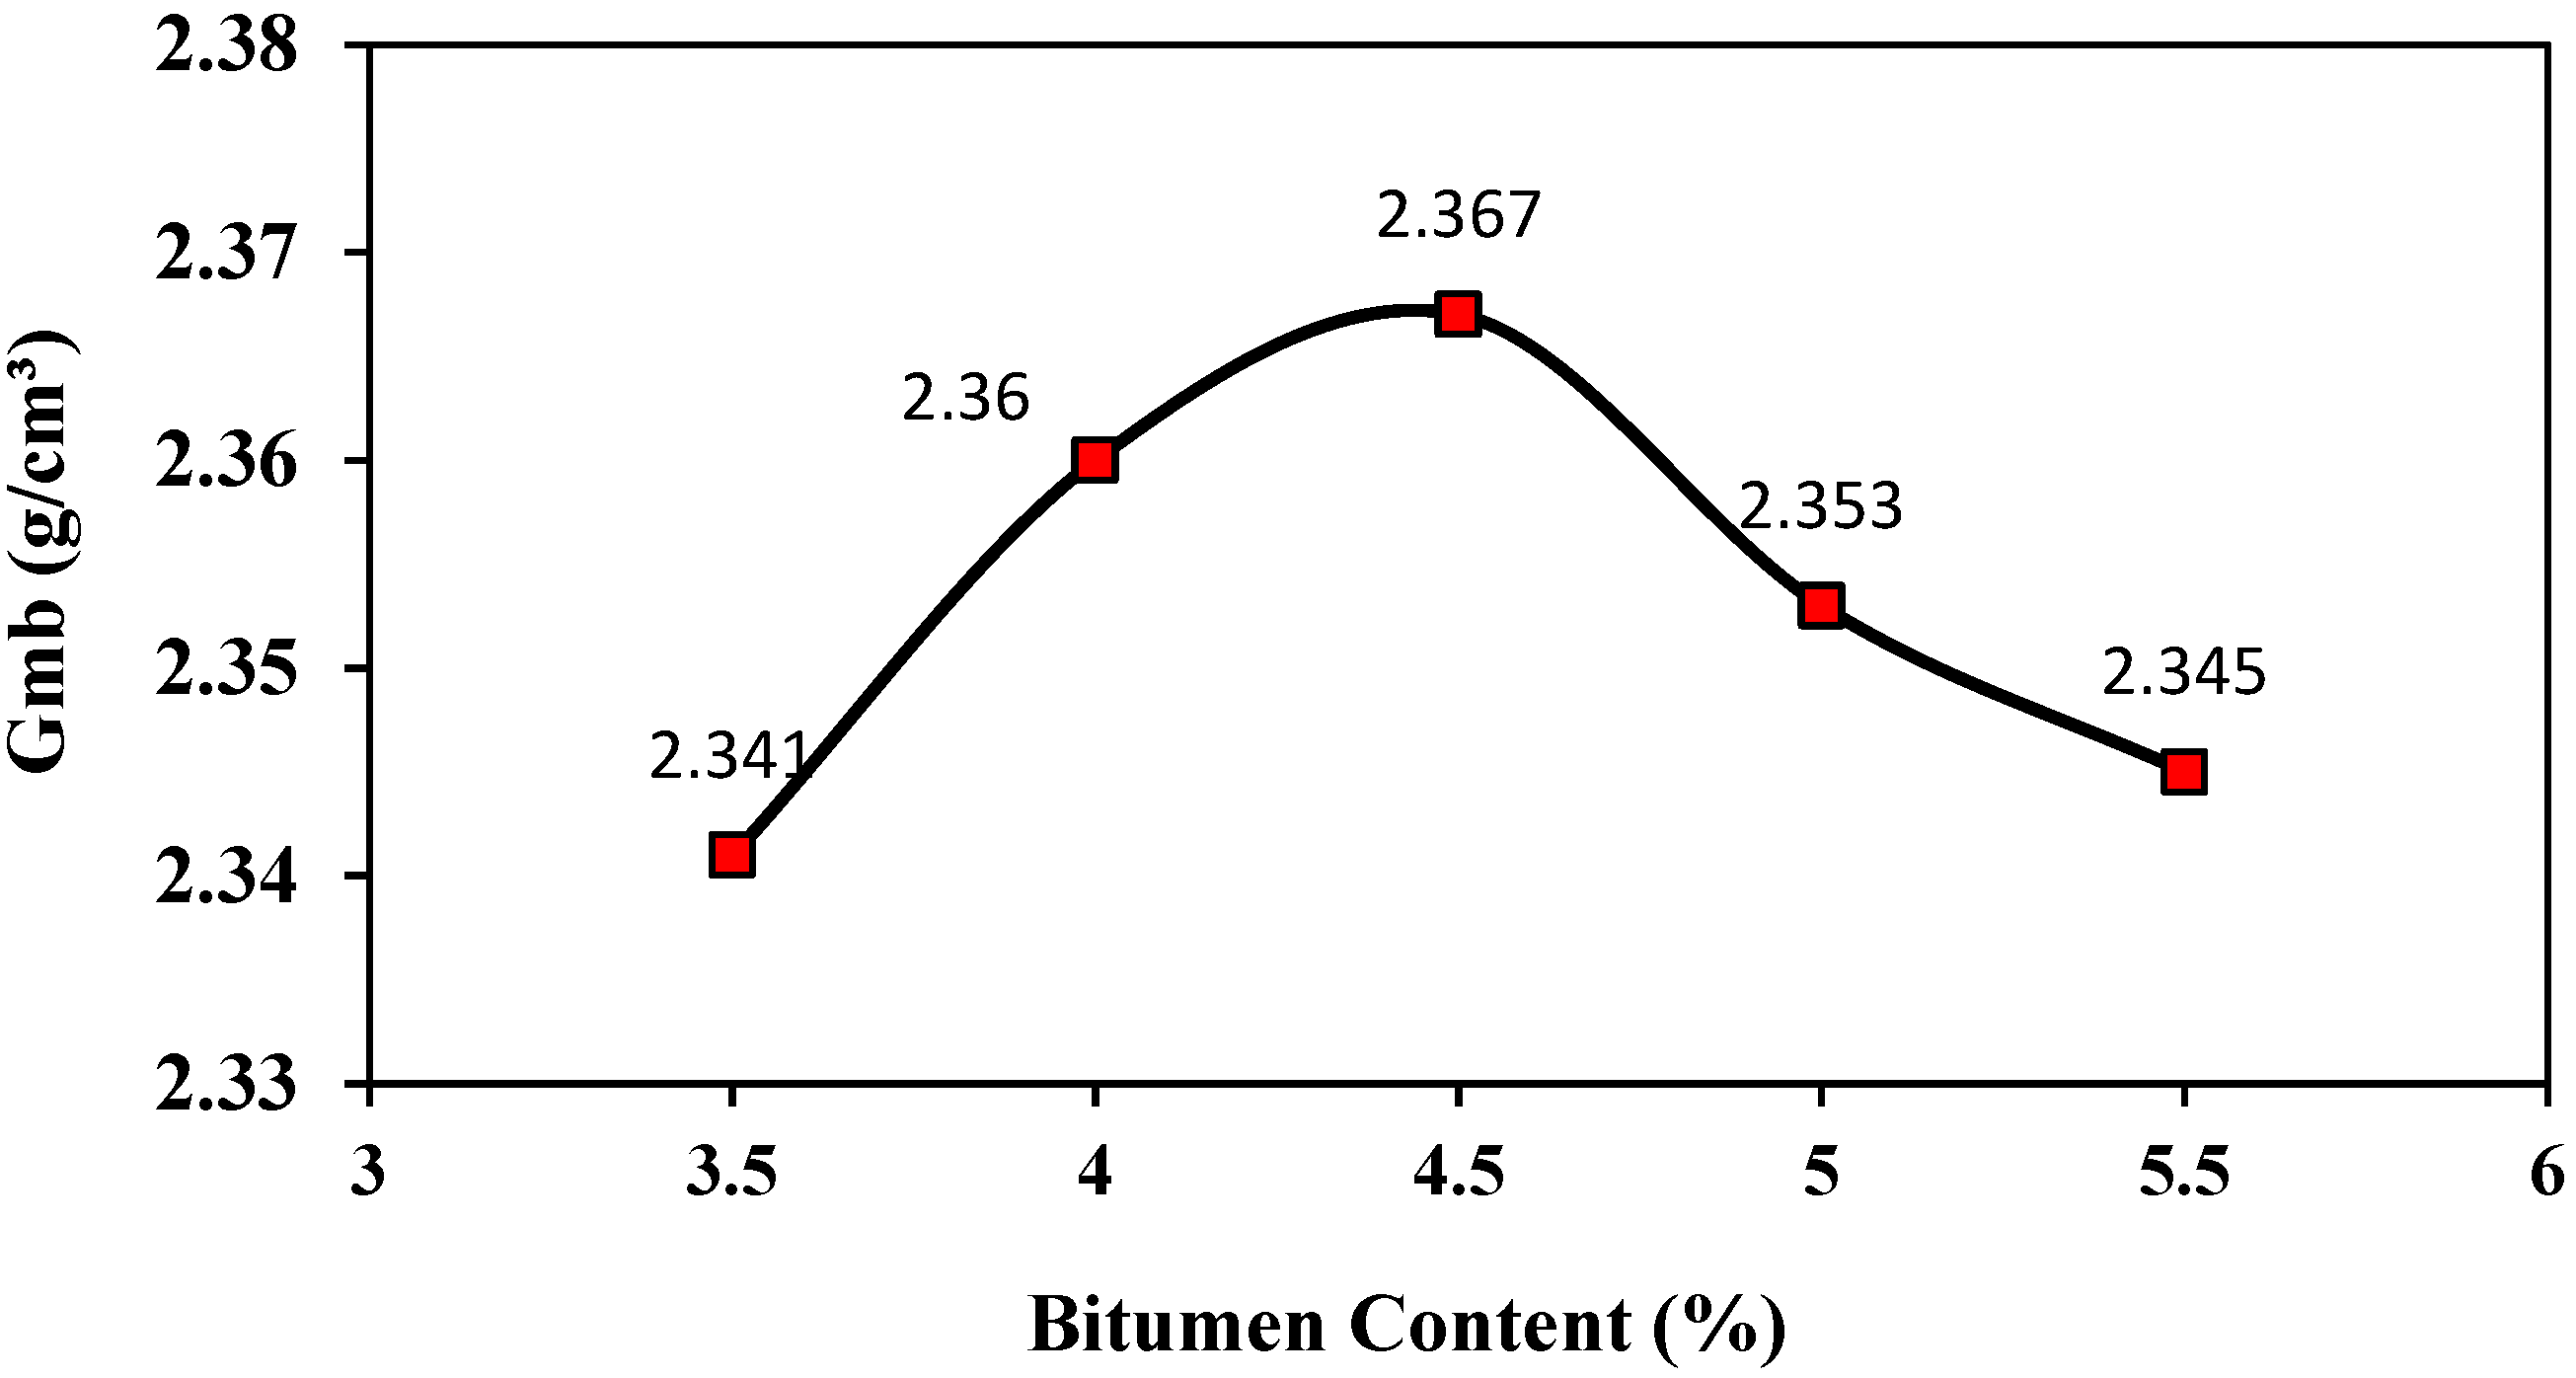
Figure 7 presents the measured bulk specific gravity (Gmb) across varying bitumen contents. The results show that Gmb increased consistently up to a 4.5% bitumen content, reaching a peak value of 2.367 g/cm
3. Beyond this point, Gmb declined slightly. This trend suggests that 4.5% bitumen facilitated optimal packing and distribution of aggregate particles, thereby enhancing the mixture’s load-bearing capacity. Specifically, Gmb rose from 2.341 g/cm
3 at 3.5% binder to its maximum at 4.5%, then decreased to 2.345 g/cm
3 at 5.5% bitumen. The subsequent reduction likely results from over-lubrication of the aggregates, which reduces interparticle friction and compromises compaction efficiency.
3.1.3. Voids in Mineral Aggregate (VMA)
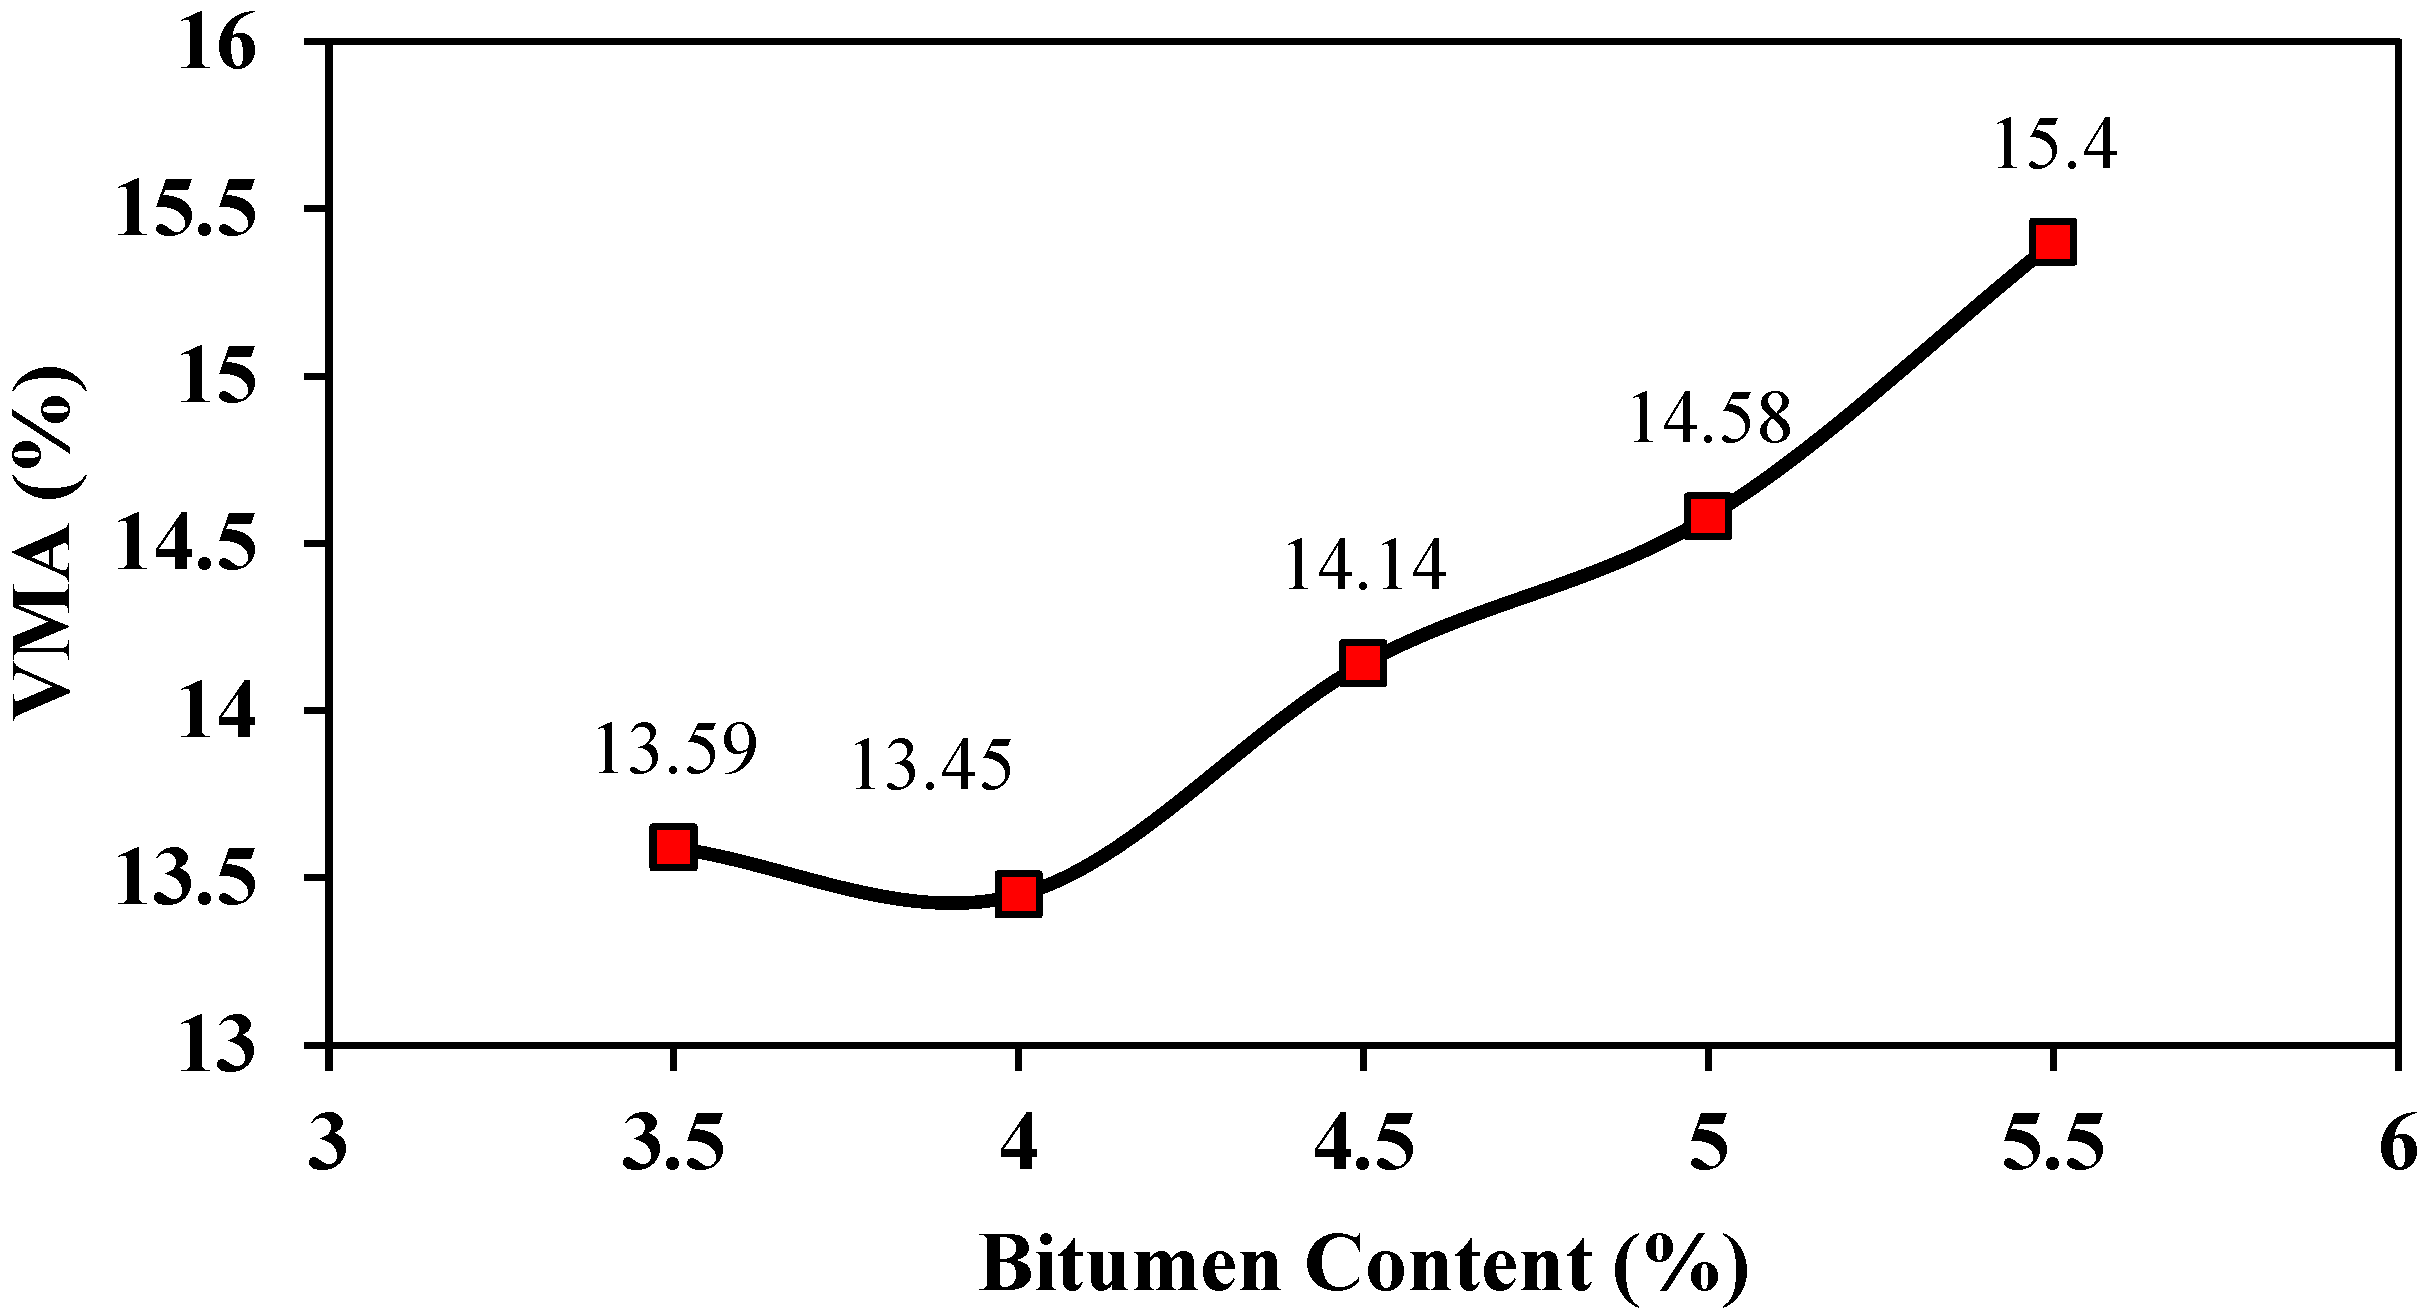
The VMA quantifies the volume of intergranular voids in the compacted mix, critical for ensuring sufficient binder content. As shown in
Figure 8, the VMA initially decreases with increasing bitumen content, reaching its minimum value of 13.45% at 4.0% bitumen content. Beyond this point, a consistent increase in VMA is noted, rising to 15.4% with a 5.5% bitumen content. This trend indicates that at lower bitumen contents, the binder fills the voids effectively, reducing VMA. However, with a further addition of bitumen, the mixture becomes increasingly lubricated, causing particle separation and an increase in VMA. This performance aligns with typical expectations for dense-graded asphalt mixtures, in which excessive bitumen increases total voids due to over-lubrication of the aggregates. At 4%, VMA was found to be 13.45%, which lies well within the recommended 12–15% range of ASTM D3203 [
52].
3.1.4. Voids Filled with Asphalt (VFA)
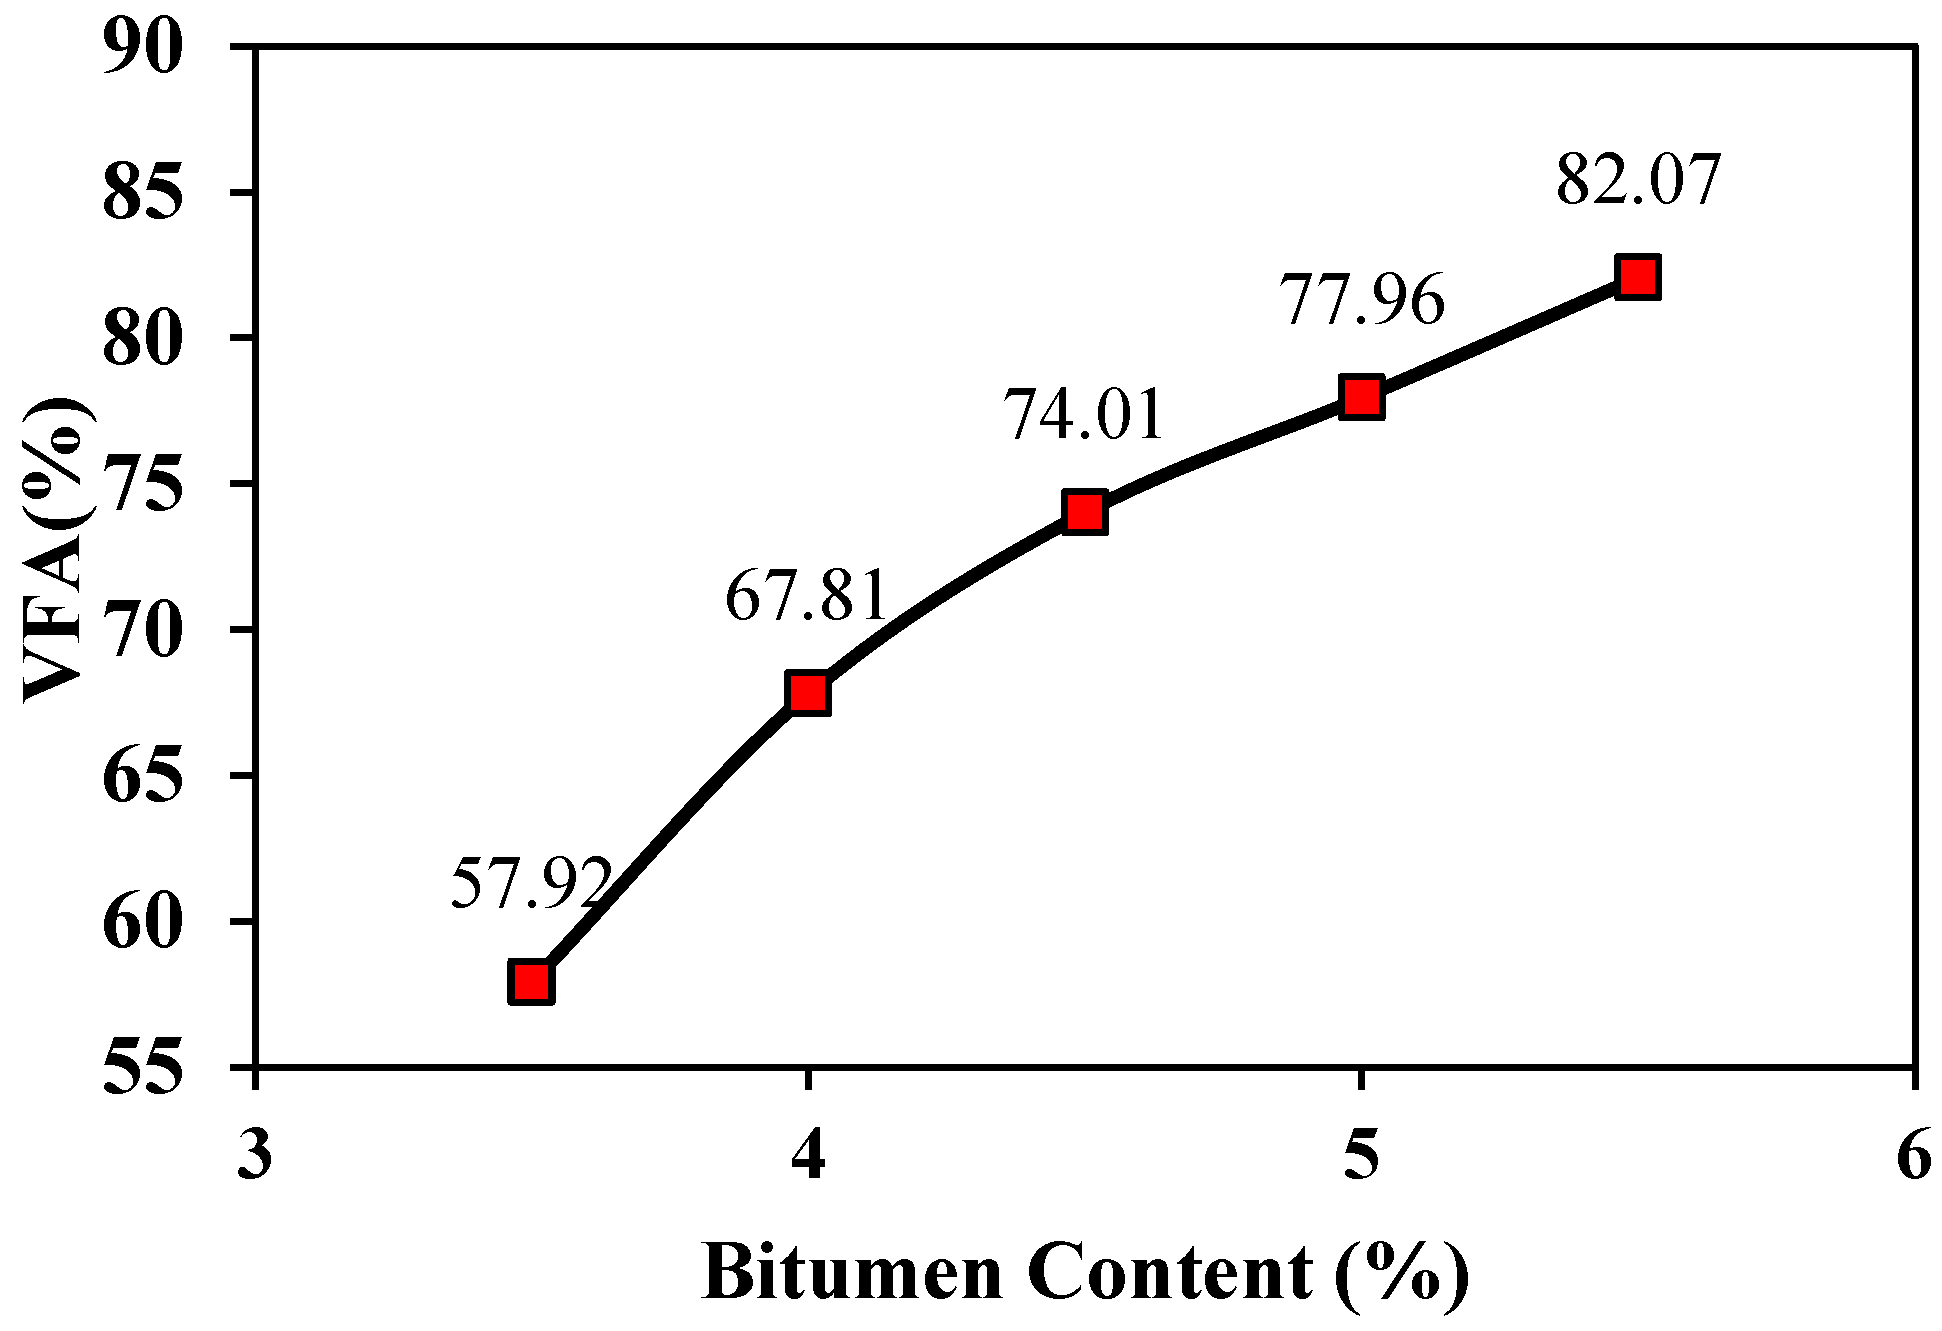
VFA is an important volumetric property that indicates the percentage of air voids in a compacted mix that are filled with bitumen. As shown in
Figure 9, the VFA increased progressively with bitumen content, ranging from 57.92% at 3.5% bitumen to 82.07% at 5.5% bitumen. This trend reflects improved binder coating and interparticle cohesion as binder content increases. The optimal VFA range recommended by standard specifications is typically 65–75% for most dense-graded mixes. At the optimum bitumen content of 4.2%, the VFA was found to be 67.81%, which falls within the acceptable limits, indicating a balanced mixed design with adequate durability and resistance to rutting.
3.1.5. Marshall Stability
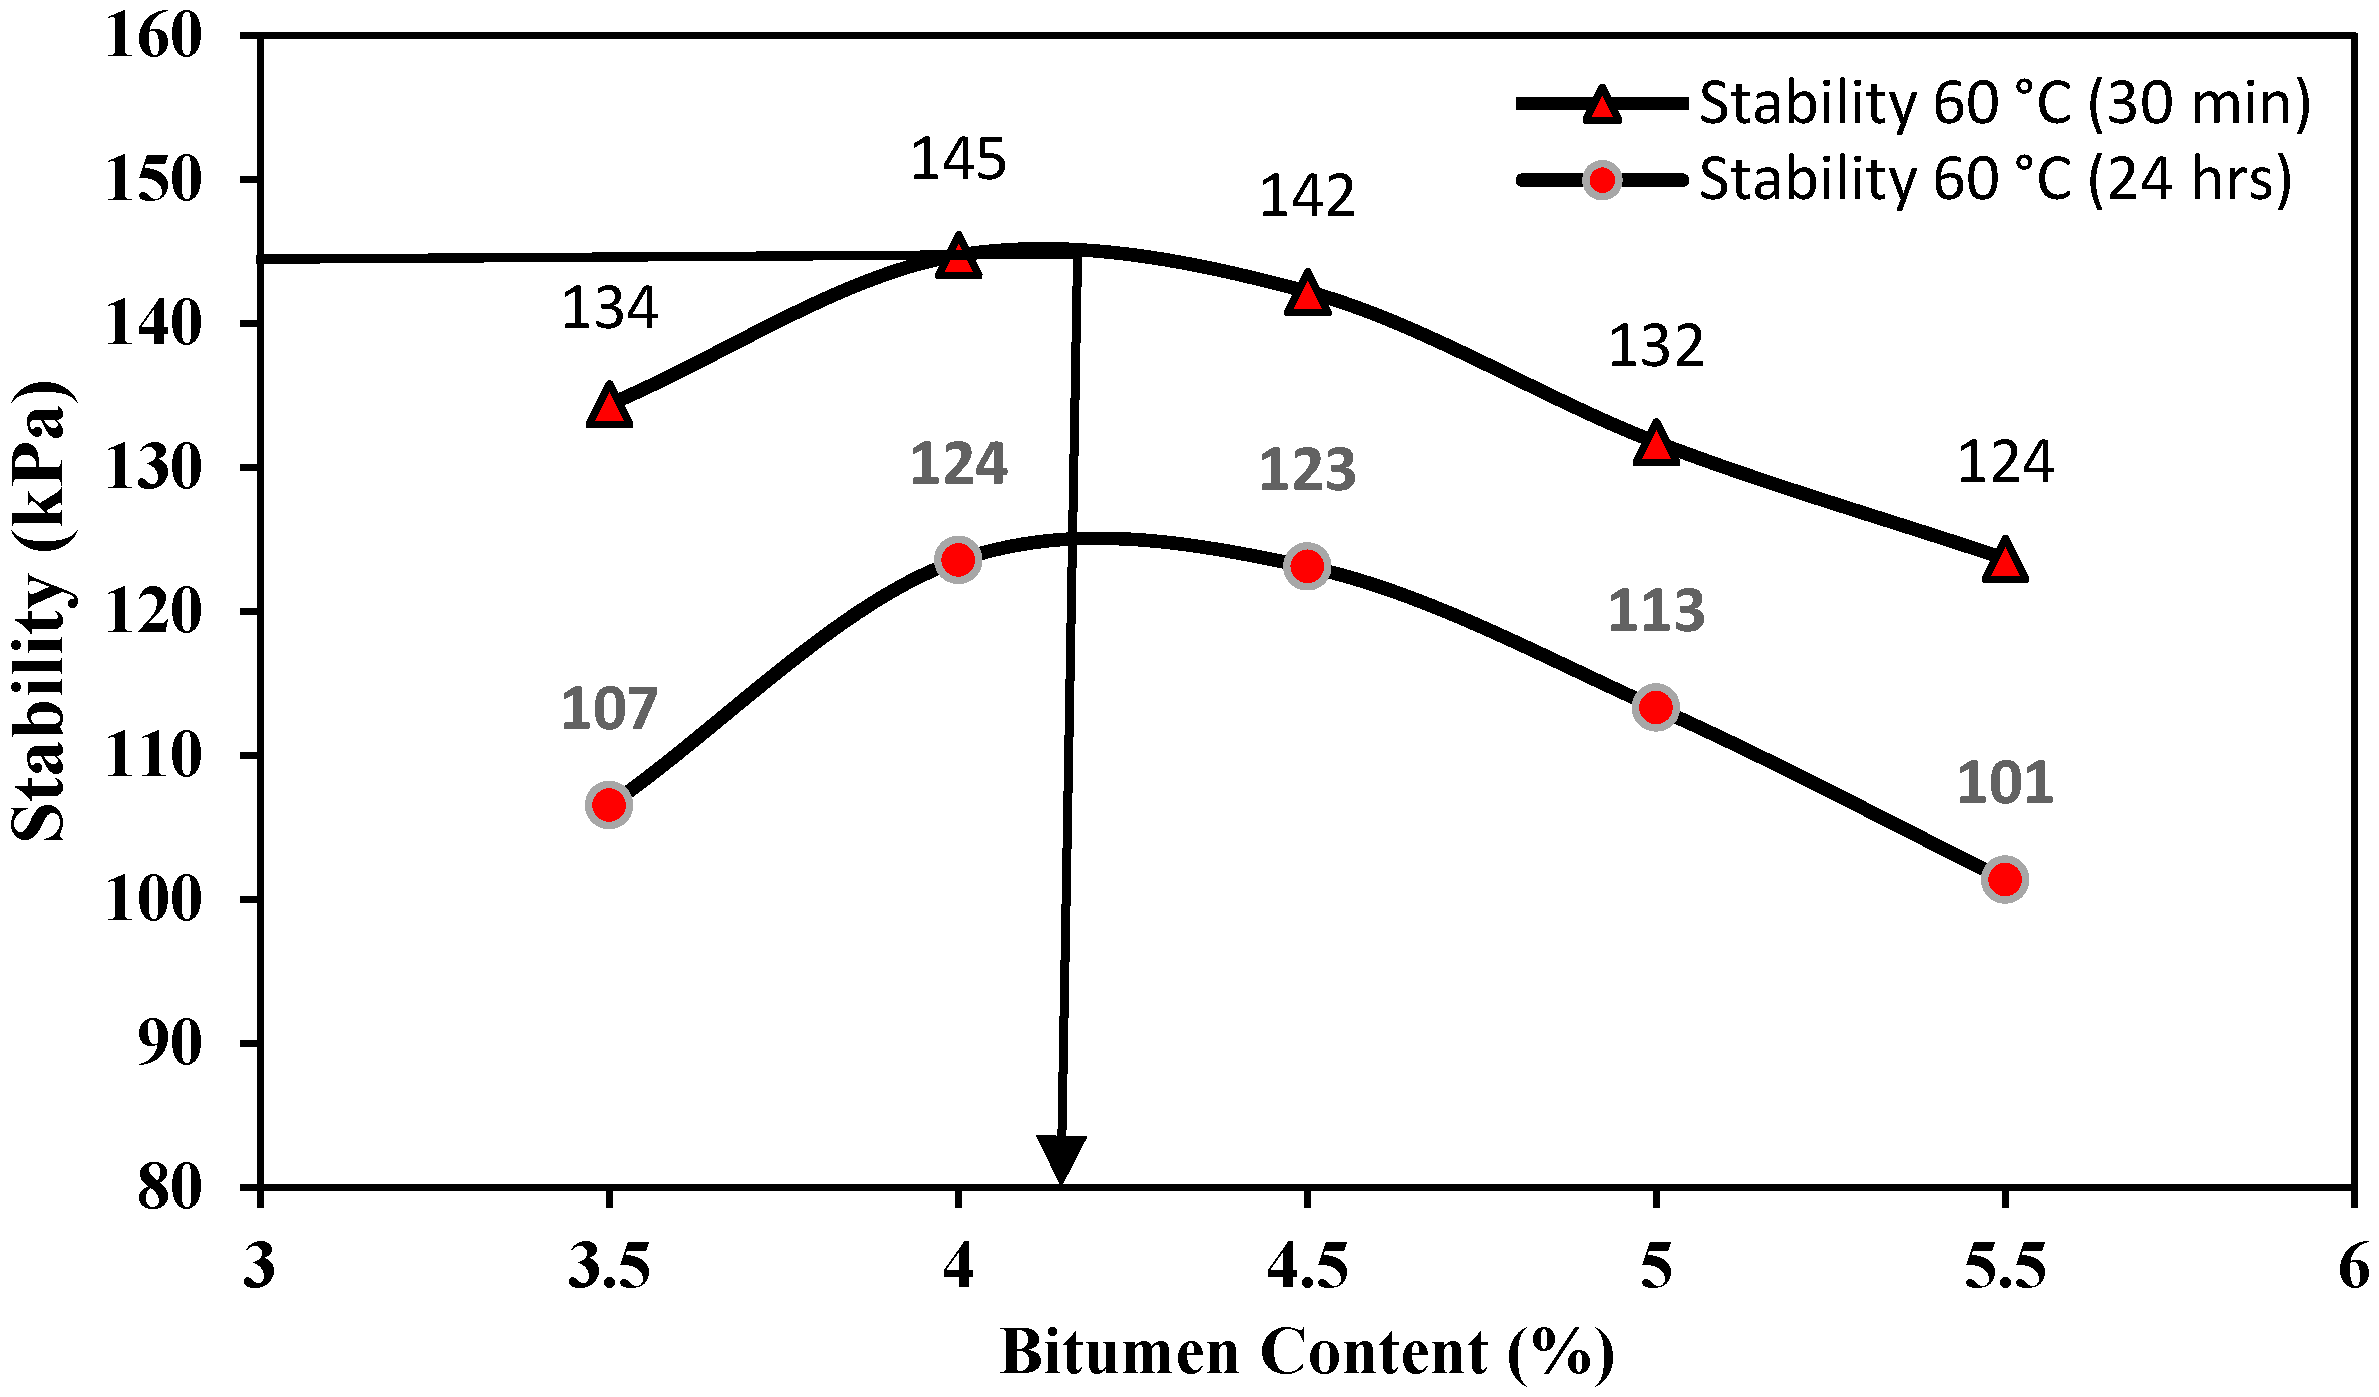
Marshall stability is a direct measure of the mix’s load-carrying capacity under compressive stress.
Figure 10 illustrates the variation in Marshall stability with bitumen content for specimens tested at 60 °C after conditioning for 30 min and 24 h. In both conditions, stability increased with bitumen content up to an optimum value before decreasing. For the 30 min conditioned specimens, stability rose from 134 kPa at 3.5% to a maximum of 145 kPa at 4.2%, followed by a slight drop to 142 kPa at 4.5% and more noticeable decreases to 132 kPa and 124 kPa at 5.0% and 5.5%, respectively. The 24 h conditioned specimens exhibited lower stability values, increasing from 107 kPa at 3.5% to a peak of 124 kPa at 4.2%, before declining to 123 kPa, 113 kPa, and 101 kPa with further increases in binder content.
The optimum bitumen content (OBC) was identified as 4.2%, where maximum stability was achieved for both conditions. Higher values at 30 min suggest reduced binder softening and moisture effects compared to 24 h conditioning. The initial rise in stability is attributed to improved aggregate coating and cohesion, while the decline beyond the OBC is due to excess binder reducing aggregate interlock. Maintaining binder content near the OBC is essential for optimal strength and deformation resistance.
3.1.6. Retained Stability
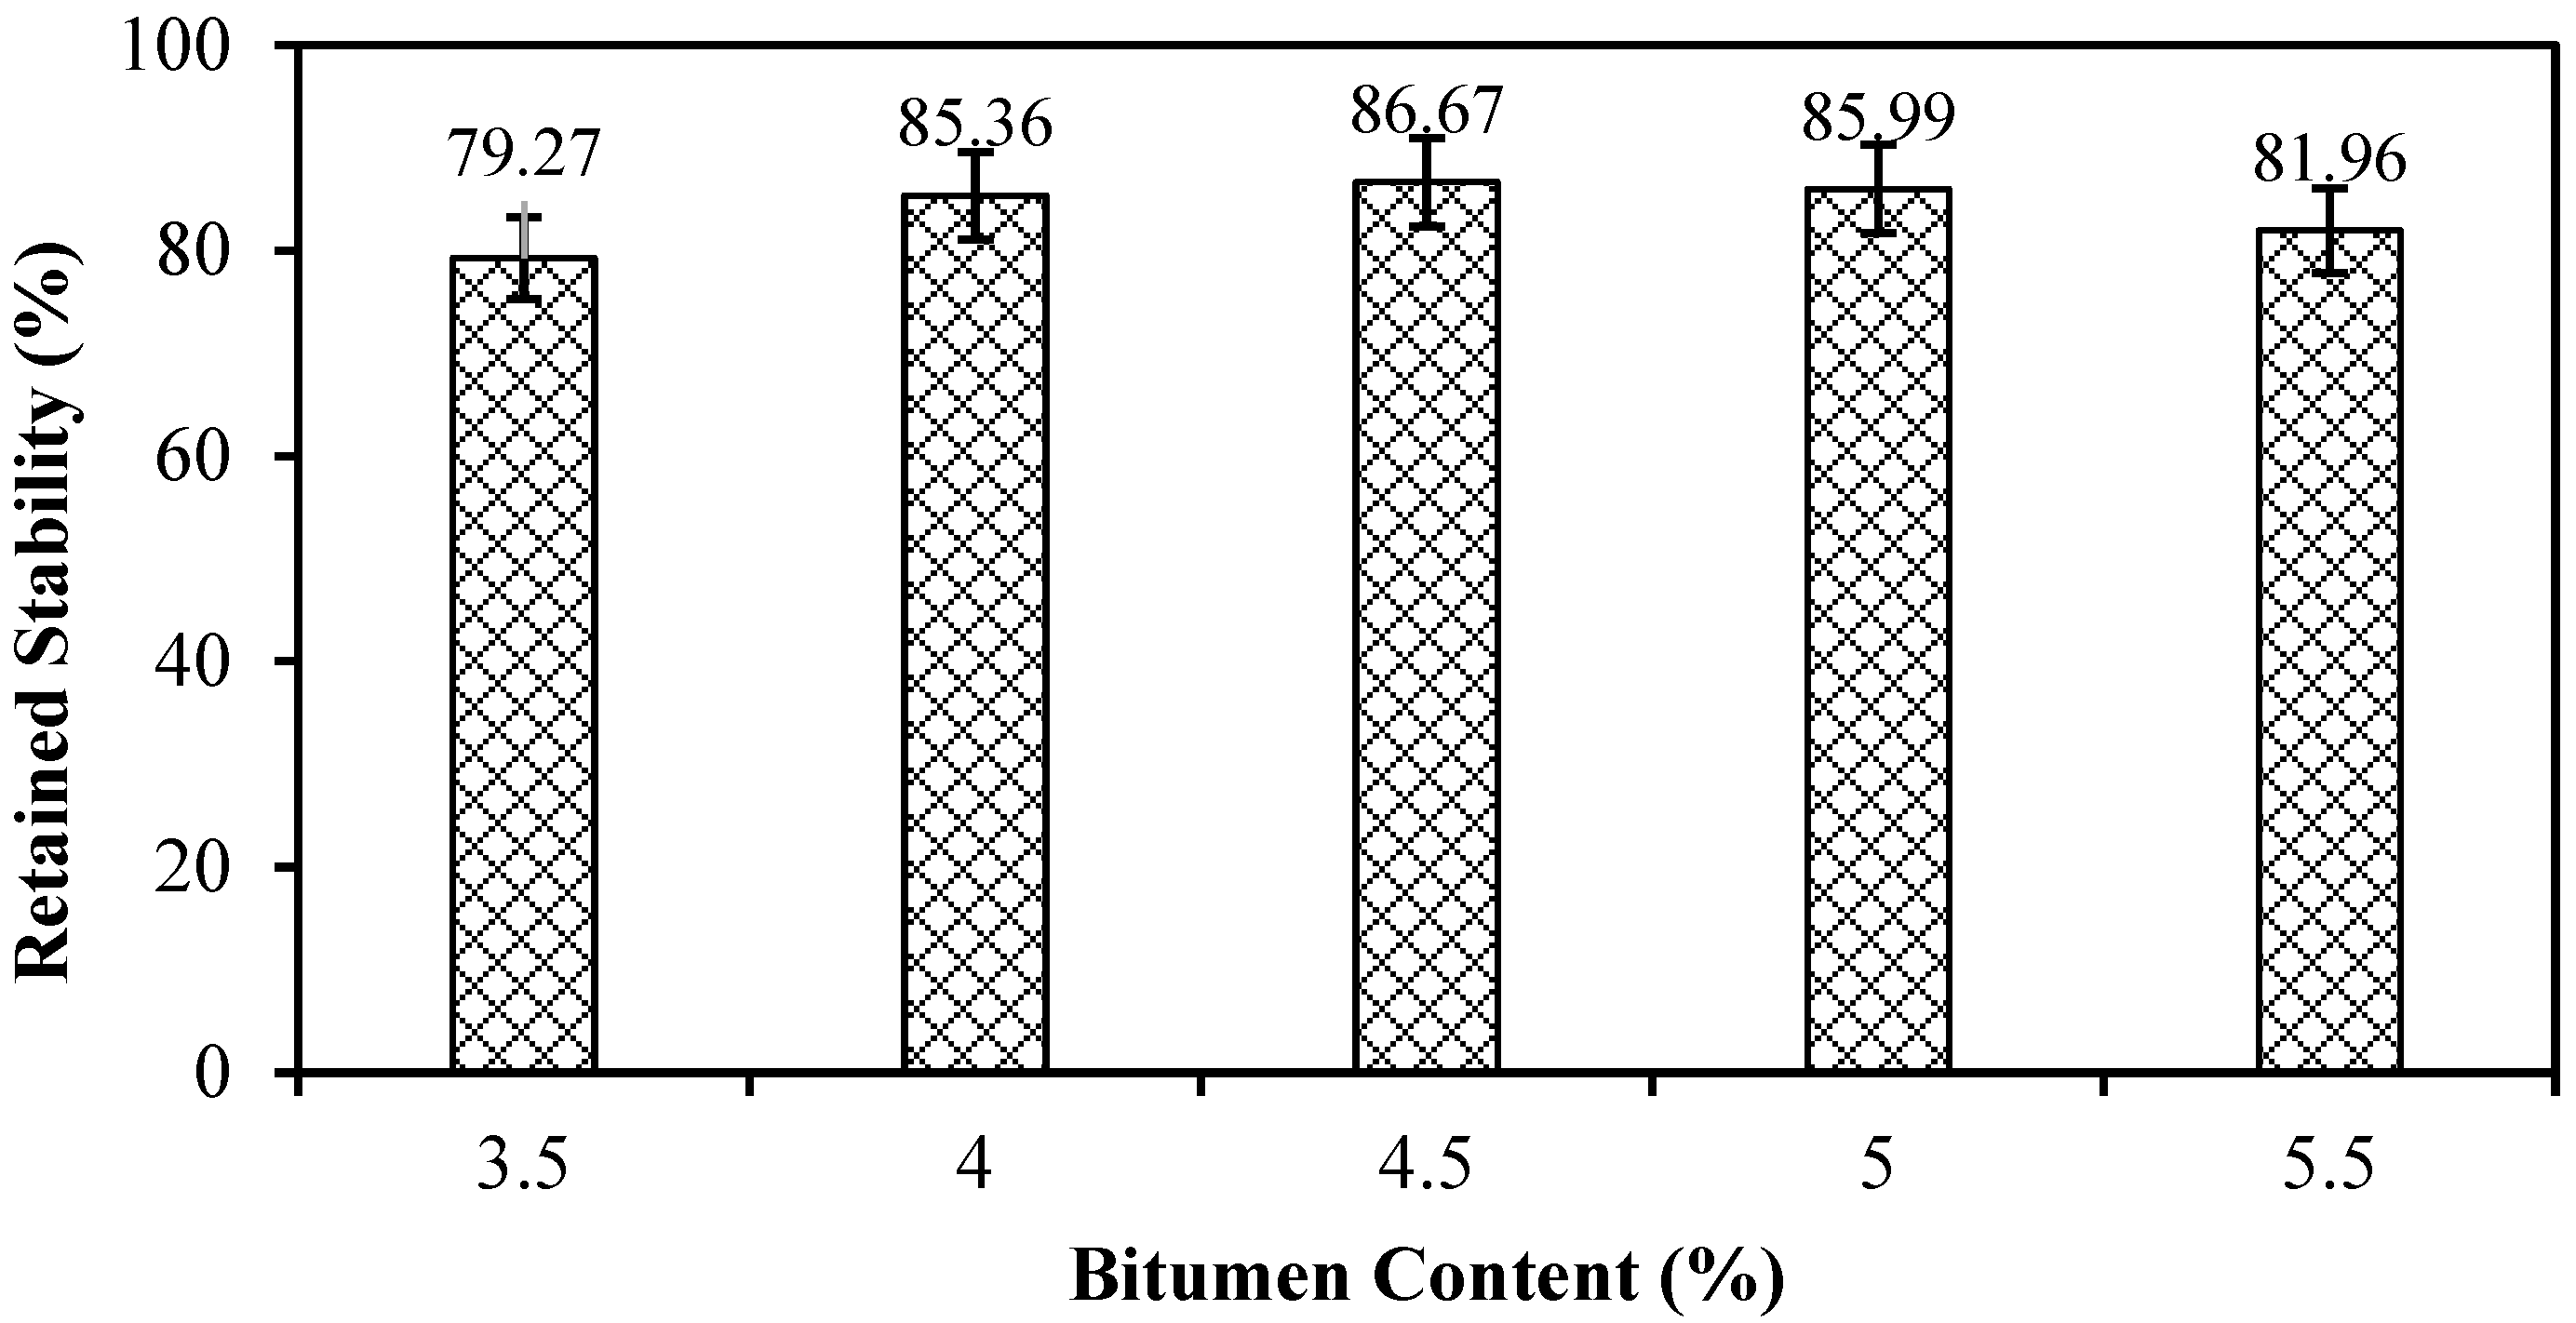
The retained stability (RS) of the Marshall specimens is a key indicator of moisture susceptibility and binder-aggregate adhesion under adverse conditions. The results (
Figure 11) indicate an increasing trend in retained stability as bitumen content rises from 3.5% to 4.5%, with values improving from 79.27% to 85.99%, suggesting enhanced binder coverage and moisture resistance. However, a noticeable decline to 81.96% was observed at 5.0% bitumen content, indicating a reduction in mixture cohesion possibly due to binder excess, which can cause a lubricating effect and weaken the aggregate interlock. All values between 4.0% and 4.5% exceeded the 85% threshold, commonly accepted for satisfactory moisture resistance, while 3.5% and 5.0% fell below this mark. These findings highlight that while increasing bitumen content initially enhances resistance to moisture damage, an excess beyond a certain point compromises the overall durability of the asphalt mix.
3.1.7. Flow Value
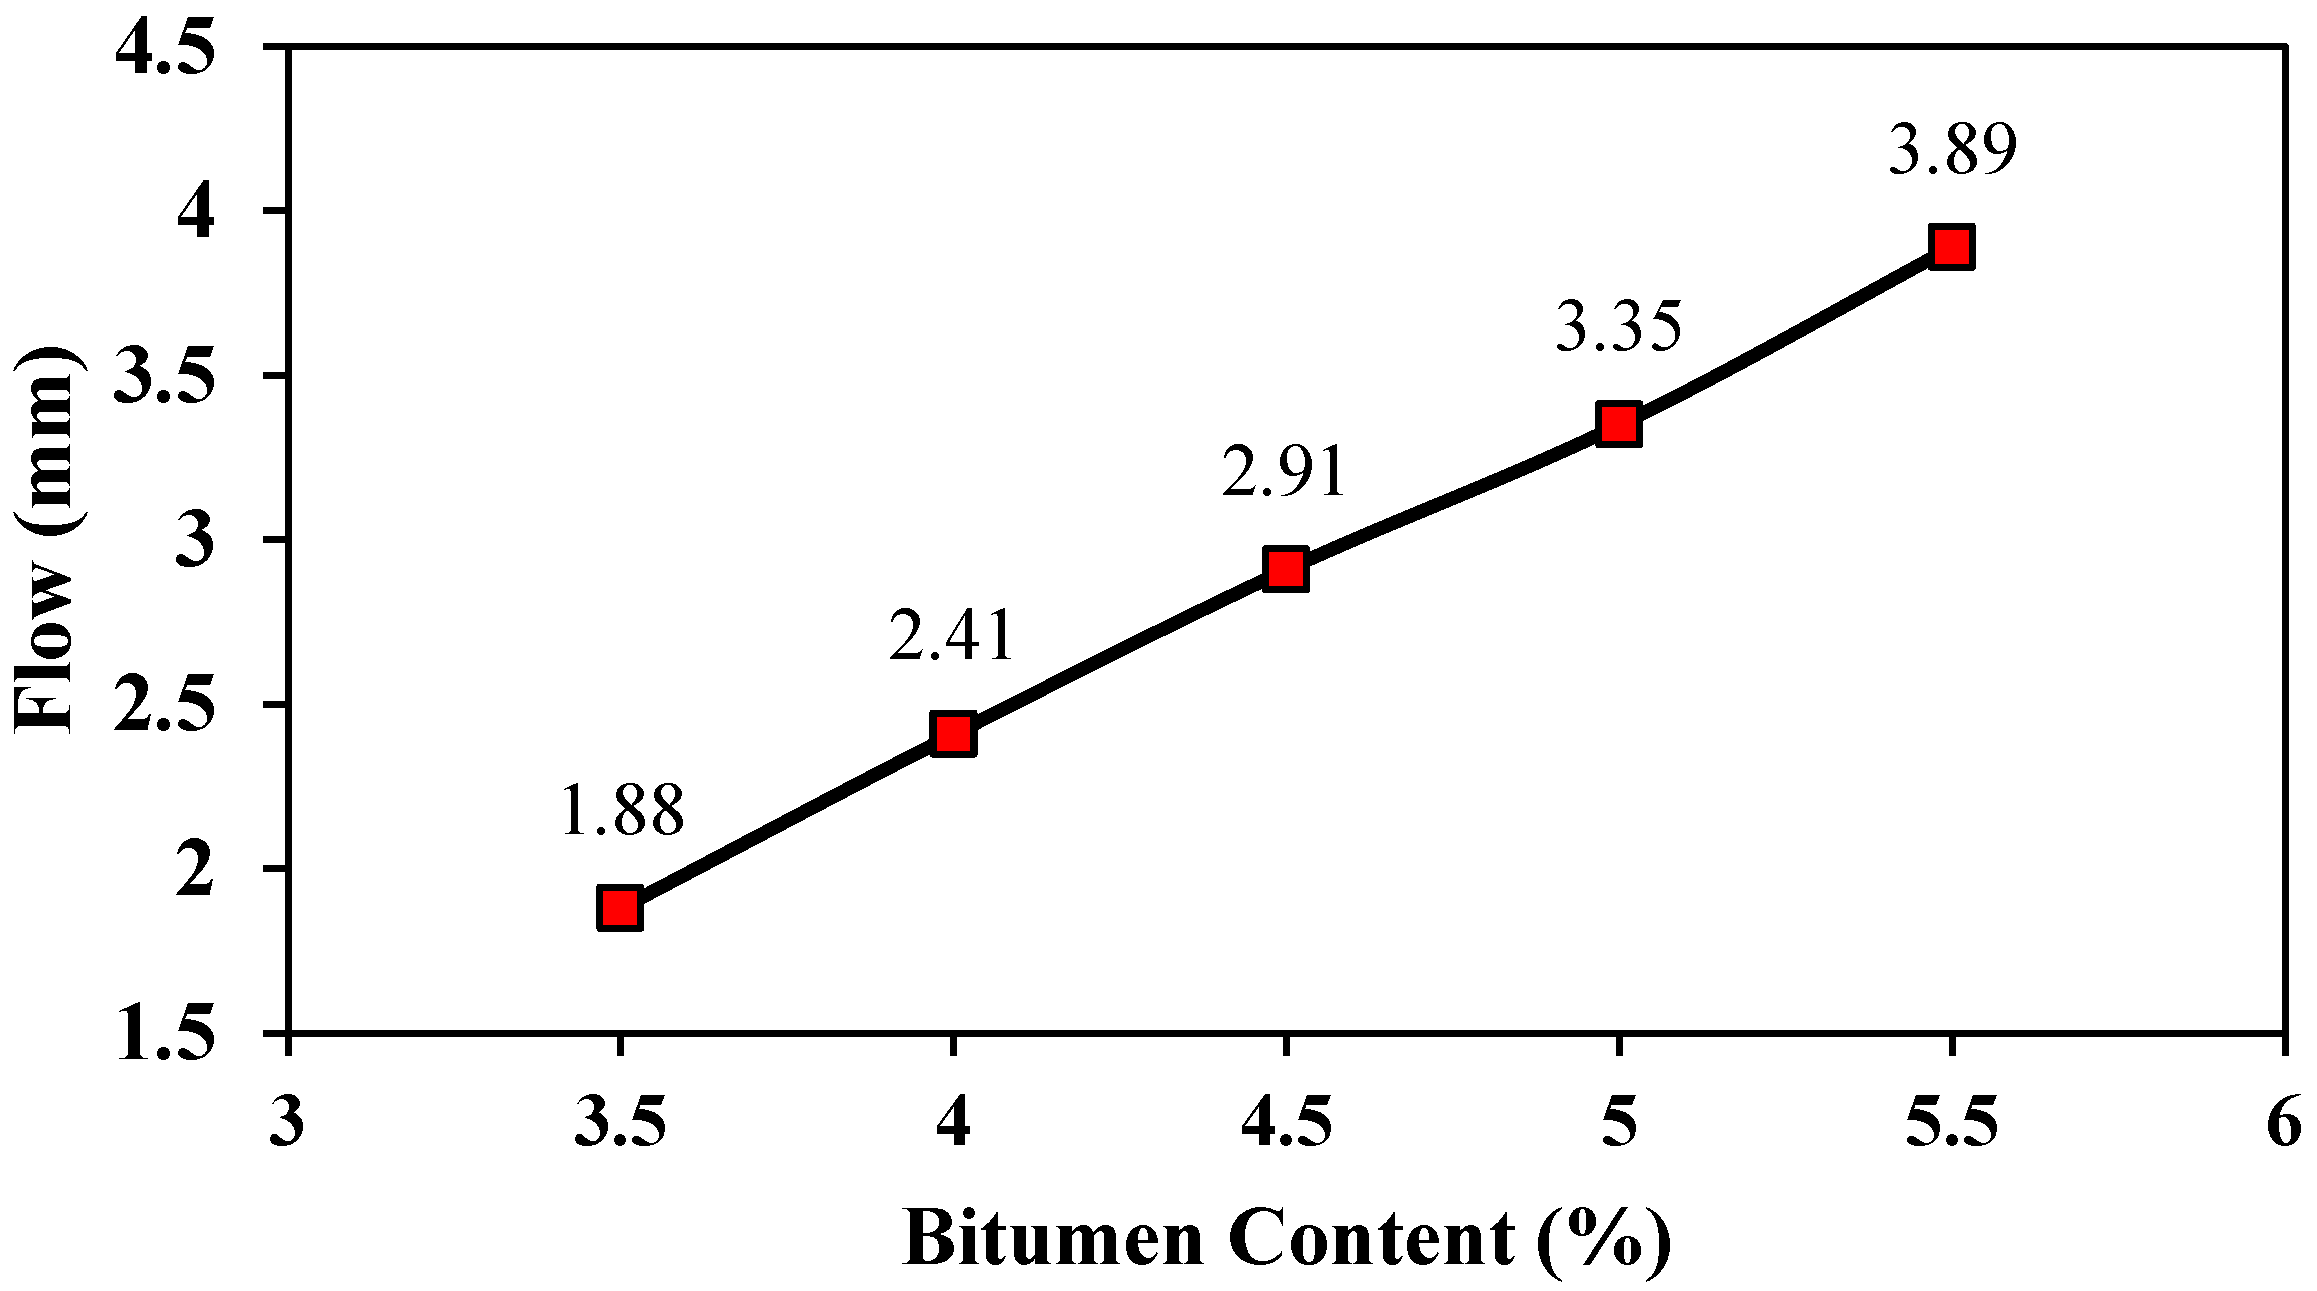
Flow value represents the deformation capacity of asphalt mixtures under load and is a critical indicator of their flexibility and resistance to cracking. As illustrated in
Figure 12, the flow value increased consistently with increasing bitumen content, ranging from 1.88 mm at 3.5% to 3.89 mm at 5.5%. This linear trend is expected due to the softening effect of higher binder content, which permits greater lateral movement under load. At the OBC of 4.2%, the flow value was 2.41 mm, which is within the acceptable range (typically 2–4 mm) prescribed by design standards. This result confirms that the mixture at OBC possesses sufficient flexibility to resist cracking without becoming overly plastic or prone to rutting.
3.2. Results Verification and OBC Finalization
Based on the outcomes of the tests conducted at varying bitumen contents, as presented in
Table 6, the results were evaluated against standard design criteria. Consequently, an OBC of 4.2% was selected for subsequent performance testing of carbon fiber-reinforced asphalt mixtures. The corresponding Marshall parameters and volumetric properties at the selected OBC are detailed in
Table 7.
3.3. Indirect Tensile Test of HMA Specimens
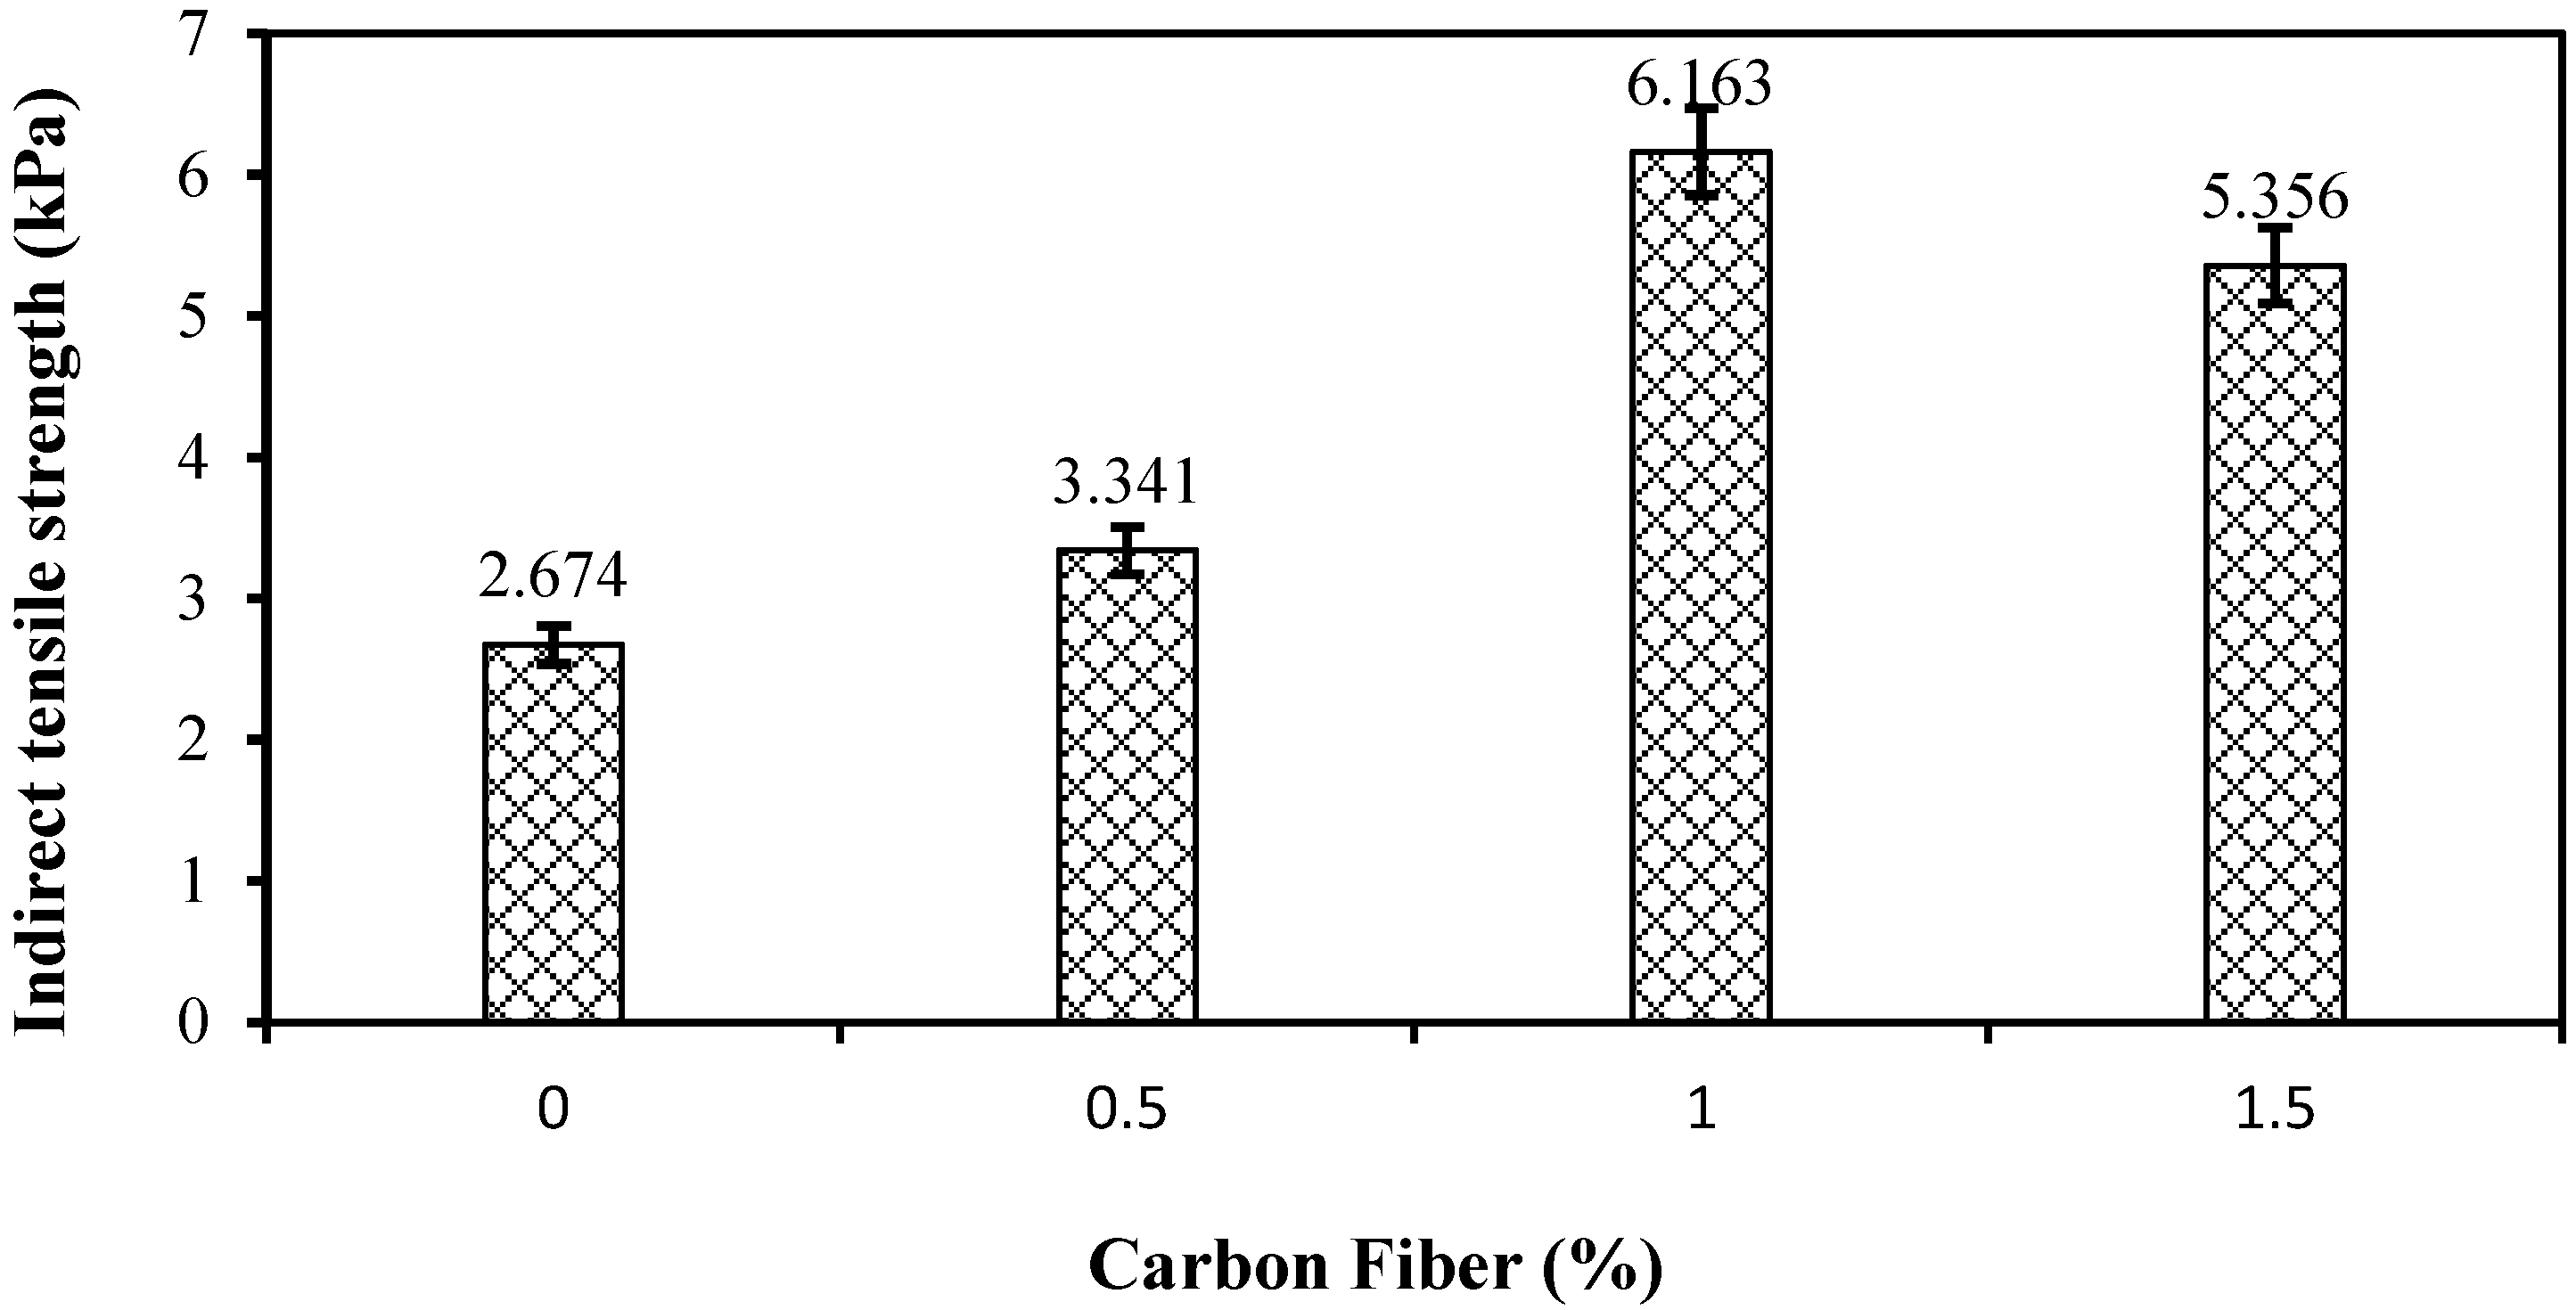
Figure 13 illustrates the variation in indirect tensile strength (ITS) with different carbon fiber contents (0%, 0.5%, 1.0%, and 1.5%). The control mix without carbon fiber exhibited the lowest ITS value of 2.674 ± 0.21 kPa. Incorporation of 0.5% carbon fiber resulted in a moderate increase to 3.341 ± 0.21 kPa, representing a 24.99% improvement over the control. A substantial enhancement was observed at 1.0% carbon fiber, with the ITS reaching 6.163 ± 0.21 kPa, approximately 130.5% higher than the control. At 1.5% carbon fiber, ITS decreased slightly to 5.356 ± 0.21 kPa but remained significantly above the baseline, showing a 100.3% increase compared to the control.
Overall, carbon fiber reinforcement, particularly at 1.0%, provides a significant tensile-strength advantage over conventional mixtures and enhances the overall mechanical integrity of the asphalt matrix. The observed improvements in indirect tensile strength, resilient modulus, and rutting resistance collectively indicate enhanced resistance to deformation and crack initiation under loading. These characteristics are often associated with improved fatigue performance, as they contribute to delaying the onset of microcracking and damage accumulation. However, it is important to note that fatigue resistance is governed by complex interactions between stiffness, ductility, and damage tolerance. Since no direct fatigue testing was conducted in this study, the implications for fatigue performance remain inferential rather than conclusive. Moreover, it is recognized that while increased stiffness (as reflected by higher MR values) improves load distribution, it may also lead to reduced strain tolerance, which can adversely affect fatigue life under certain conditions.
3.3.1. Resilient Modulus of HMA Specimens
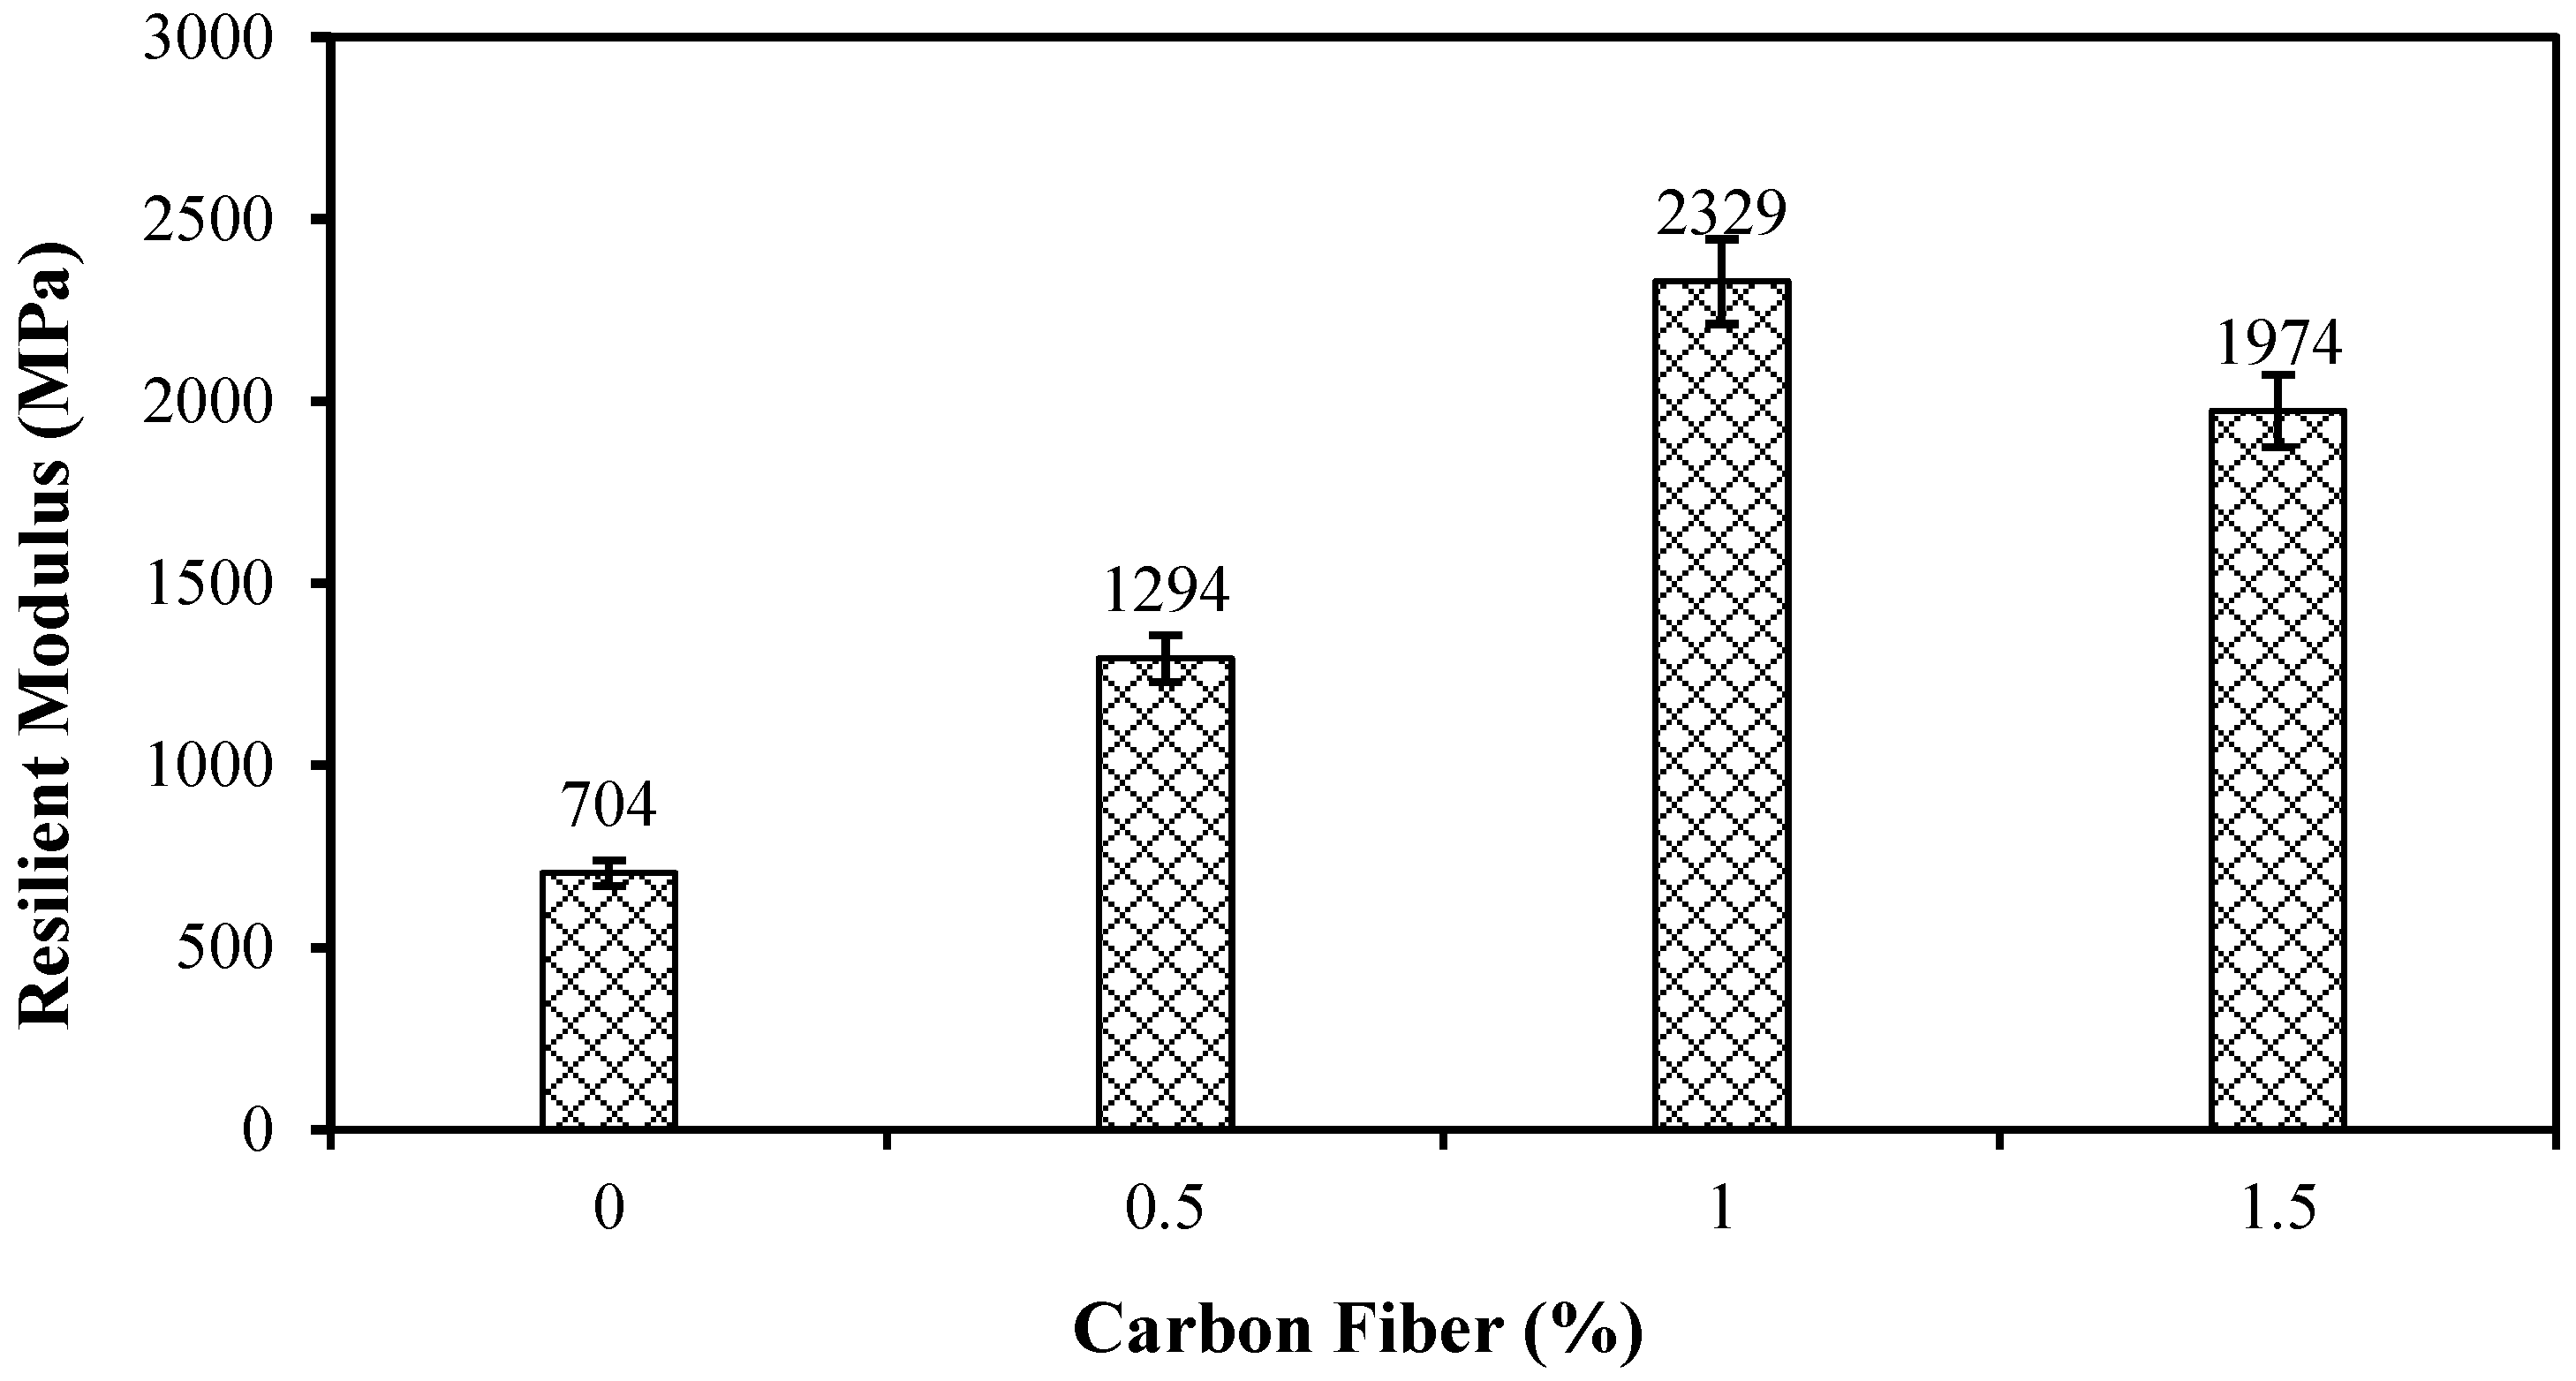
Figure 14 shows the resilient modulus (MR) results for hot mix asphalt (HMA) specimens with different carbon fiber (CF) dosages (0%, 0.5%, 1%, and 1.5%). A clear pattern emerges, where MR increases significantly with CF addition up to an optimal point, then declines slightly at higher contents. At 0% CF (control mix), MR is 704 MPa, representing the baseline stiffness of the unmodified HMA. Adding 0.5% CF raises MR to 1294 MPa, an 83.8% improvement over the control. This improvement is due to the reinforcing network formed by carbon fibers, which enhances load distribution and reduces microcrack growth under repeated loading. The 1% CF mix has the highest MR value at 2329 MPa, a 230.9% increase over control. This indicates that 1% CF provides optimal fiber dispersion and bonding with the asphalt mastic, maximizing elastic recovery and deformation resistance. Conversely, the 1.5% CF mix shows a slightly lower MR at 1974 MPa, but still 180.4% higher than the control. This decrease may be attributed to possible fiber clumping and non-uniform binder coating at higher fiber contents, which can lead to localized stiffness variations and reduced stress-transfer effectiveness. However, it should be noted that no direct microstructural characterization was conducted in this study, and these explanations are based on observed macroscopic performance trends. Overall, a notable improvement in resilient modulus is observed with carbon fiber modification, with 1% CF identified as the optimal dosage for enhancing stiffness and elastic recovery. The results indicate that while moderate fiber addition improves HMA performance, excessive fiber content may reduce mixture uniformity and limit the associated benefits.
3.3.2. Rutting Failure of HMA Specimens
The rutting resistance of CF-reinforced asphalt mixtures was evaluated using the Wheel Tracking Test. This test is critical for simulating high-temperature field conditions where repeated vehicle loading can lead to permanent surface deformation, commonly referred to as rutting. Specimens prepared with 0%, 0.5%, 1.0%, and 1.5% CF by weight of binder were tested to assess the influence of fiber content on rutting behavior.
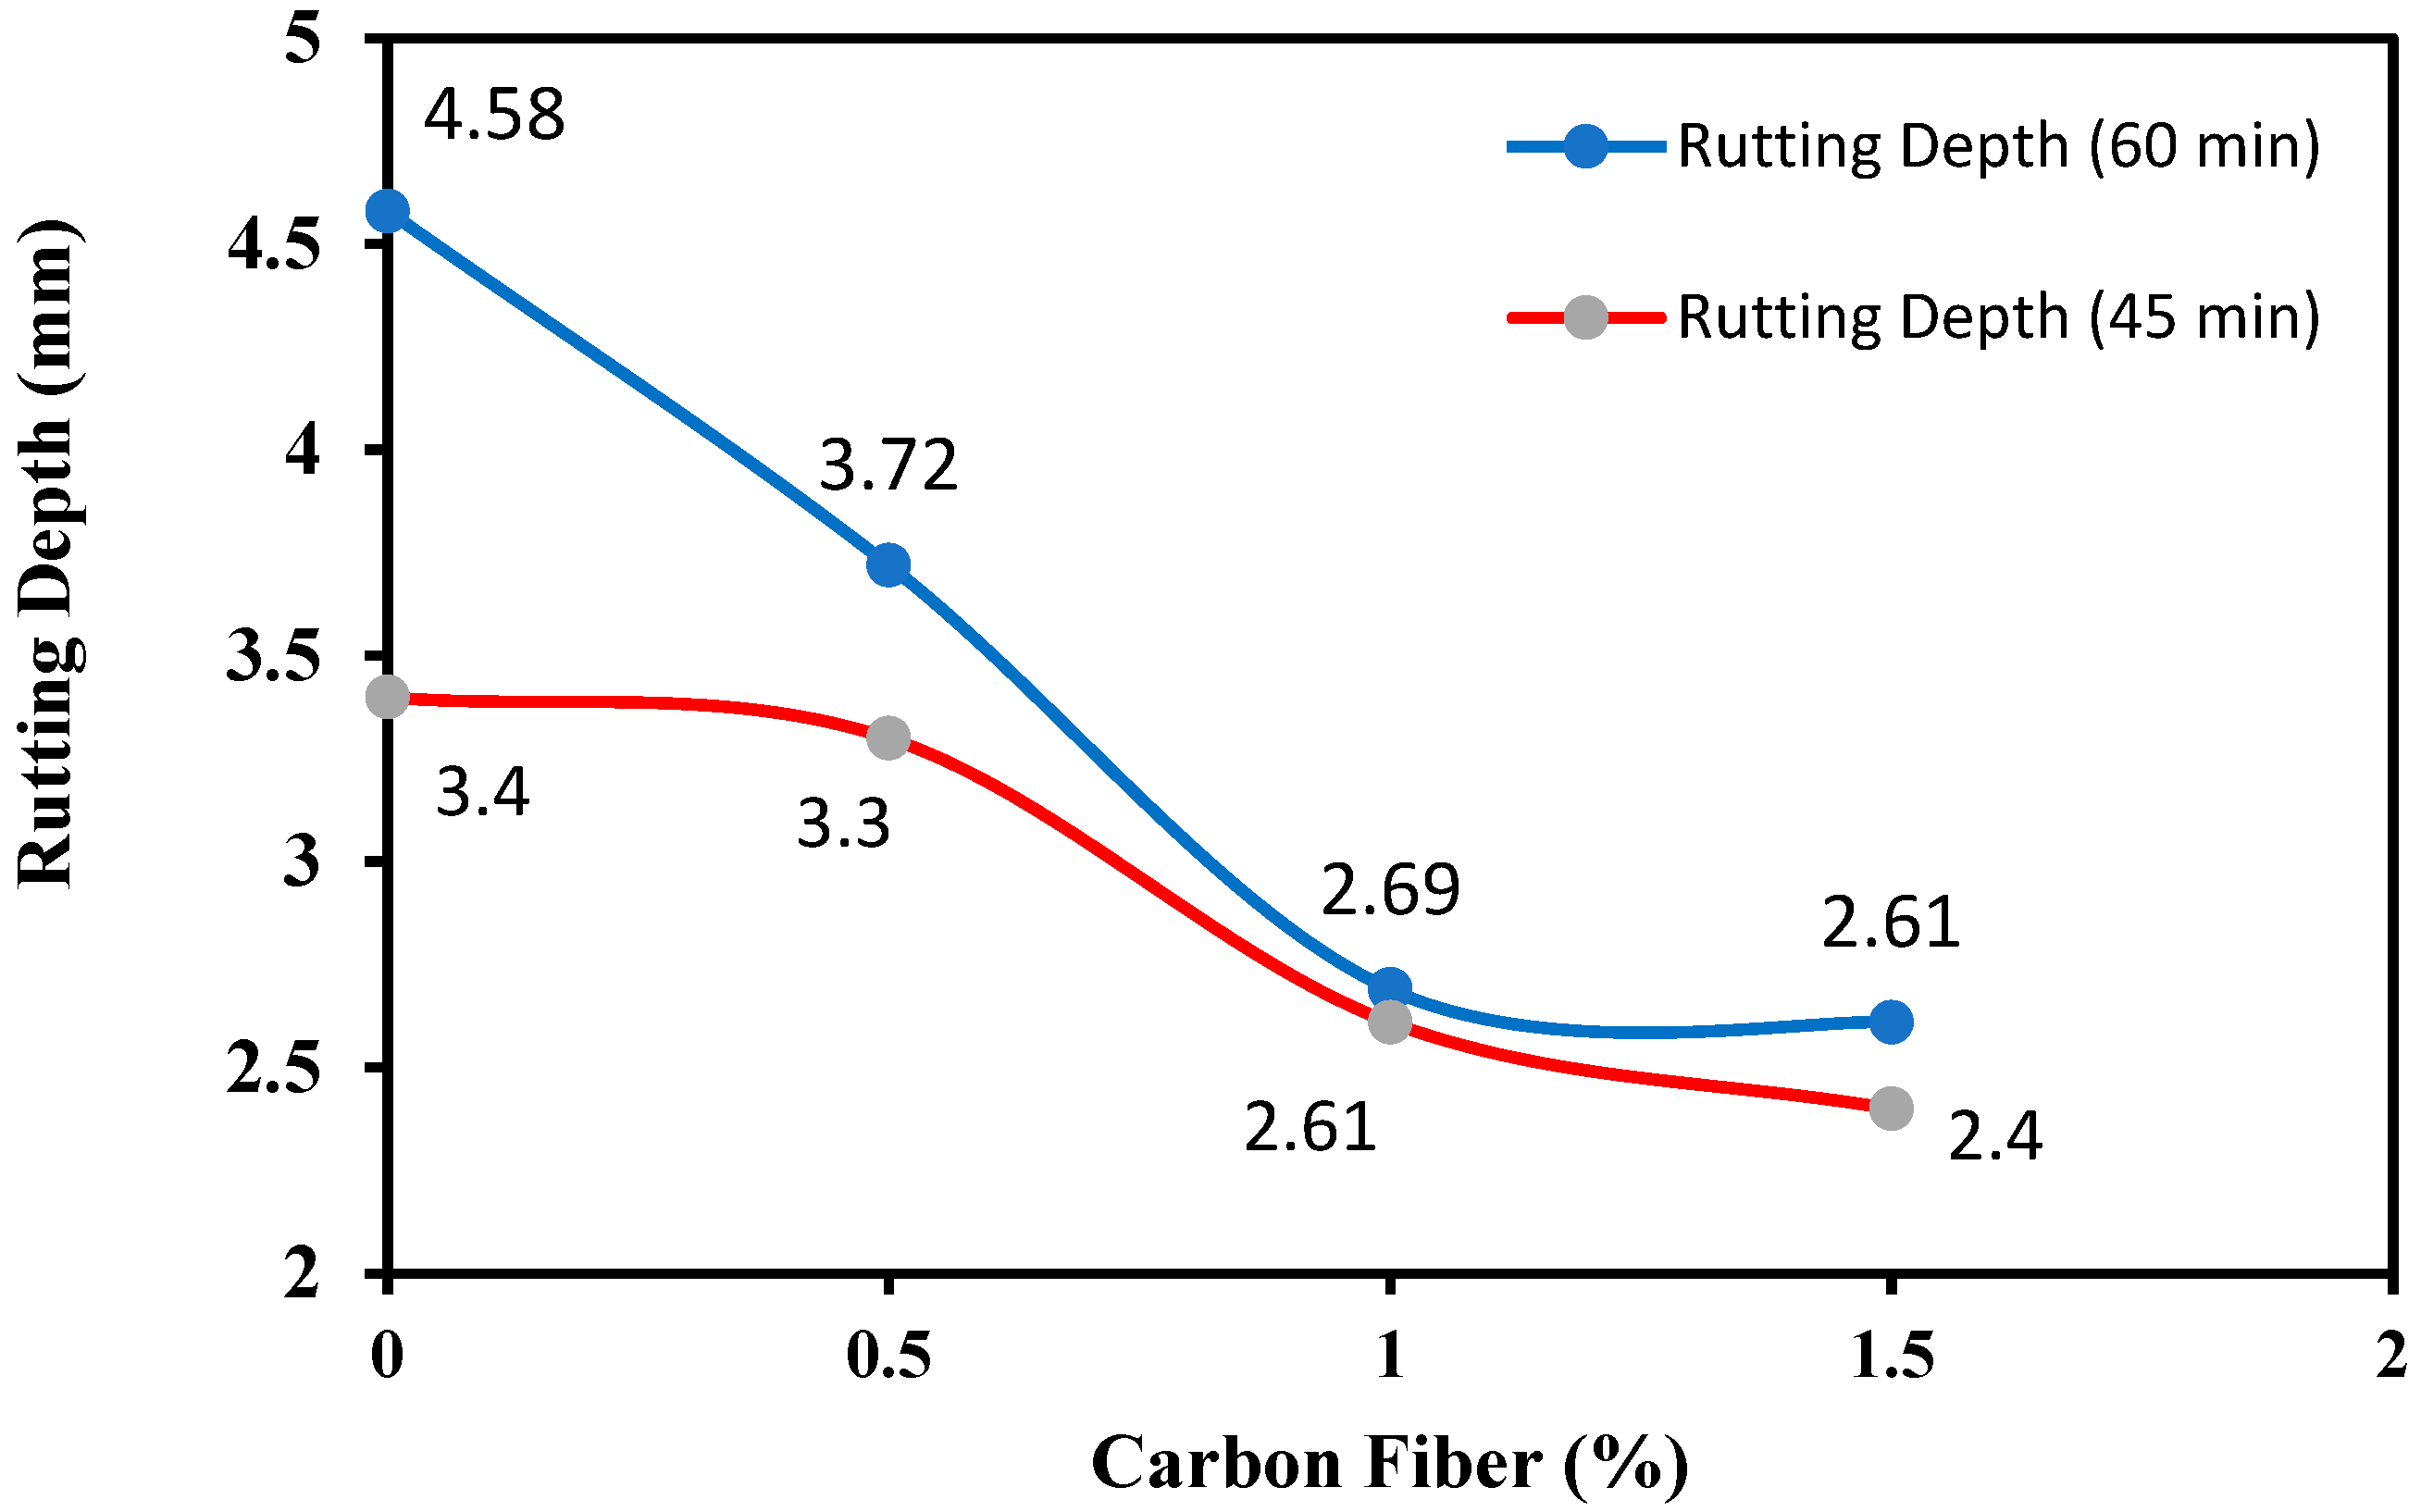
The test results, depicted in
Figure 15, reveal a strong correlation between CF incorporation and improved rutting resistance. The graph illustrates the effect of varying carbon fiber content on the rutting depth of asphalt mixtures subjected to wheel-tracking tests for durations of 45 and 60 min. The rutting depth generally decreases with an increase in carbon fiber content, indicating enhanced rutting resistance due to fiber reinforcement.
For the 60 min test, the rutting depth decreases significantly from 4.58 mm at 0% carbon fiber to 2.61 mm at 1.5%, with the steepest decline occurring between 0% and 1.0%. Similarly, in the 45 min test, the rutting depth reduces from 3.4 mm at 0% to 2.4 mm at 1.5% fiber content. This consistent reduction in both cases highlights the beneficial role of carbon fibers in restricting permanent deformation under repeated loading.
The improvement in rutting performance may be attributed to the high tensile strength and stiffness of carbon fibers, which can reinforce the asphalt matrix, promote more uniform stress distribution, and limit excessive lateral aggregate movement. The fibers are also likely to enhance the internal structure by bridging micro-voids and restricting displacement, thereby contributing to improved load-bearing capacity and elastic response. However, the reduction in rutting depth becomes more gradual beyond 1.0% fiber content, suggesting that the reinforcing effect may reach a plateau, possibly due to minor fiber clustering or reduced dispersion efficiency. It should be noted that these interpretations are based on macroscopic performance observations, and further microstructural analysis would be required for direct validation.
Overall, the data confirm that incorporating carbon fibers significantly improves the rutting resistance of asphalt mixtures, with 1.0% fiber content providing an optimal balance between performance gains and material stability.
The substantial improvement in rutting resistance confirms CF’s utility as a promising additive for enhancing pavement life and reducing maintenance needs, aligning with long-term performance goals in modern pavement design.
3.3.3. Dynamic Stability of HMA Specimens
Dynamic stability (DS) is an essential measure of rutting resistance in asphalt pavements, with higher values indicating greater ability to resist permanent deformation under repeated loads. In this study, DS was calculated using rut depths recorded at 45 and 60 min for both control and carbon fiber-reinforced asphalt samples.
Table 8 shows a clear improvement in dynamic stability with the addition of carbon fibers. The control sample (0% CF) had the lowest DS value (2288.14 passes/mm), showing limited resistance to rutting. When carbon fibers were added, DS increased significantly, reaching a maximum of 33,750 passes/mm at 1.0% CF content, indicating enhanced deformation resistance. However, at 1.5% CF, the DS slightly decreased, likely due to fiber agglomeration, but it still performed much better than the control. These results confirm that carbon fiber reinforcement effectively improves the rutting resistance of asphalt pavements.
3.4. Optimum Carbon Fiber Content
Based on a comprehensive performance evaluation incorporating indirect tensile strength (ITS), resilient modulus (MR), wheel tracking rut depth, and dynamic stability (DS), the optimum carbon fiber content was identified as 1.0% by binder weight. At this dosage, the mixture delivered the highest ITS (6.163 kN), peak MR (2329 MPa), and minimal rut depth (2.69 mm) after 60 min of loading. Dynamic stability also peaked at 33,750 passes/mm, reflecting exceptional resistance to permanent deformation under repeated traffic. Together, these results signify a well-balanced improvement in structural integrity, elasticity, and resistance to both cracking and rutting, likely owing to effective fiber dispersion and efficient stress transfer within the composite matrix.
Although the 1.5% CF mixture still showed clear improvements over the unmodified control, its performance fell slightly below that of the 1.0% CF variant. A modest reduction in key metrics—ITS, MR, and DS—was noted at the higher fiber dosage. This decline can be attributed to fiber clustering and less uniform dispersion, which weakens the interfacial bond between binder and aggregates and ultimately diminishes the composite efficiency of the mix. Thus, increasing CF content beyond 1.0% does not produce proportionate performance gains and may compromise both workability and long-term uniformity.
Overall, the 1.0% CF dosage was identified as the most effective and practical concentration, providing a well-balanced enhancement in strength, elasticity, and deformation resistance. This optimal dosage is therefore recommended for developing high-performance, durable, and cost-efficient asphalt pavements, particularly suitable for heavy traffic and challenging climatic conditions.
3.5. Cost–Benefit Analysis Results
The cost–benefit analysis for a 1 km single-lane pavement reinforced with carbon fiber (CF) at 1% replacement of bitumen is summarized in
Table 9. The total asphalt mass was 420,000 kg, with 4.2% bitumen (17,640 kg). Replacing 176.4 kg of bitumen with CF added PKR 441,000 in material cost but saved PKR 21,168 in bitumen, resulting in a net extra upfront cost of PKR 419,832 and raising the initial construction cost from PKR 6.30 million to PKR 6.72 million. Over 20 years, ordinary asphalt required three major overlays (6, 12, 18 years) costing PKR 1.575 million each, while the CF mix required none. Discounting at 8% yielded a PV of PKR 2.01 million for maintenance in the ordinary case, producing an NPV saving of PKR 1.59 million and a benefit–cost ratio of 4.79 for CF reinforcement.
It is important to note that the life-cycle cost analysis and long-term performance projections presented in this study are based on laboratory results and assumed maintenance scenarios. While the findings indicate promising trends, the extrapolation to field-scale performance should be interpreted with caution. Factors such as environmental conditions, traffic variability, and material heterogeneity may influence long-term behavior.
3.6. ANOVA Analysis Results
To evaluate the statistical significance of performance variations in asphalt mixtures with different carbon fiber (CF) contents, a one-way analysis of variance (ANOVA) was conducted for indirect tensile strength (ITS), resilient modulus (MR), rutting depth, and dynamic stability (DS). The analysis was performed at a 95% confidence level (α = 0.05) based on three replicates for each CF dosage level (0%, 0.5%, 1.0%, and 1.5%). Prior to ANOVA, the assumptions of normality and homogeneity of variance were assessed using the Shapiro–Wilk and Levene’s tests, respectively. The results indicated that the data satisfied the requirements for parametric analysis.
The ANOVA results (
Table 10) indicate that CF content has a statistically significant effect on all evaluated parameters. Specifically, ITS, MR, rutting depth, and DS all exhibited
p-values well below 0.05, indicating significant differences among mixture groups.
Tukey’s HSD post hoc test was conducted to identify statistically significant pairwise differences between carbon fiber dosage levels. For indirect tensile strength (ITS), significant differences were observed between most groups, particularly between the control mixture and fiber-reinforced mixtures. However, the difference between 1.0% and 1.5% CF was not statistically significant, indicating comparable tensile performance at higher fiber contents.
For resilient modulus (MR), all pairwise comparisons were found to be statistically significant, reflecting the strong sensitivity of stiffness to fiber incorporation. In the case of rutting depth, significant reductions were observed between the control and fiber-modified mixtures, as well as between lower and intermediate fiber contents. However, the difference between 1.0% and 1.5% CF was not statistically significant, suggesting a plateau in rutting resistance improvement at higher fiber dosages.
While the statistical analysis indicates strong sensitivity of the measured properties to CF content, it is important to note that the relatively small number of replicates (n = 3) may influence variability estimates. Therefore, the results should be interpreted with consideration of experimental variability. Specifically:
For ITS, the F-value of 2929.16 with a p-value of 1.68 × 10⁻¹² indicates that CF addition significantly influenced the tensile strength of asphalt mixtures.
For MR, an F-value of 2832.89 (p = 1.92 × 10⁻¹²) confirms a substantial effect of fiber reinforcement on mixture stiffness.
For rutting depth, the F-value of 2682.65 and p-value of 2.39 × 10⁻¹² confirm that CF content significantly reduced permanent deformation under load.
Dynamic stability (DS) exhibited the highest sensitivity to CF content, with an F-value of 410,322.27 and an extremely low p-value (4.39 × 10⁻²¹), demonstrating a dramatic enhancement in rutting resistance with fiber reinforcement.
These results validate the hypothesis that carbon fiber reinforcement significantly improves the mechanical performance of asphalt mixtures. In all cases, the p-values were well below the α = 0.05 threshold. Therefore, carbon fiber content plays a statistically significant role in enhancing the structural properties of hot mix asphalt (HMA), with 1.0% CF consistently delivering optimal performance across the evaluated tests.
4. Conclusions
This study presents a comprehensive mechanical and economic evaluation of carbon fiber (CF)-reinforced asphalt composites, with a focus on key performance indicators including indirect tensile strength (ITS), resilient modulus (MR), and rutting resistance. Based on the experimental findings, the following conclusions are drawn:
The addition of carbon fibers significantly enhanced the indirect tensile strength (ITS) of asphalt mixtures, with a maximum value of 6.163 kPa observed at 1.0% CF, representing an increase of over 130% compared to the control mixture.
The resilient modulus increased consistently with CF incorporation, reaching its peak at 1.0% CF, indicating improved stiffness and elastic response under repeated loading.
Resistance to permanent deformation improved markedly with fiber addition, as evidenced by reduced rutting depth. After 60 min of wheel tracking, rut depth decreased from 4.58 mm in the control mix to 2.61 mm at 1.5% CF.
Dynamic stability (DS) increased substantially with CF inclusion, with a maximum value of 33,750 passes/mm at 1.0% CF, demonstrating enhanced resistance to rutting under cyclic loading conditions.
The 1.0% CF content was identified as the optimal dosage, providing the most balanced improvement in mechanical performance, deformation resistance, and economic efficiency, with a benefit–cost ratio of 4.79.
Statistical analysis using one-way ANOVA confirmed that the improvements in ITS, MR, rutting depth, and DS are statistically significant (p < 0.05), supporting the reliability of the observed trends.
These findings demonstrate the potential of carbon fiber as a high-performance reinforcement for asphalt mixtures, particularly in applications requiring enhanced rutting resistance. Although the present study primarily focuses on rutting resistance and stiffness characteristics, fatigue performance is also a critical parameter for asphalt mixtures. Future research will extend this work by incorporating fatigue-related testing to further validate the long-term structural benefits of carbon fiber reinforcement.



 ,
,