1. Introduction
The construction industry plays a pivotal role in economic growth and infrastructure development worldwide, yet it has one of the highest occupational accident rates among industries [
1,
2]. According to the International Labor Organization (ILO), although construction workers account for only approximately 7% of the total industrial workforce, fatal accidents in the construction industry account for approximately 30% of all occupational fatalities [
3]. In Korea, the construction industry’s fatal accident rate per 10,000 workers in 2022 was 1.61, which was approximately 3.7 times the average across all industries (0.43) [
4]. High accident rates not only threaten workers’ lives and health but also lead to economic losses, including construction delays and cost increases [
5].
Understanding differences in accident occurrence patterns based on the structural characteristics of projects is essential for preventing construction accidents [
6,
7]. The ownership of construction projects, that is, the distinction between public and private projects, is a key variable associated with structural differences in on-site safety management and accident occurrence patterns [
8,
9]. Public projects are subject to stringent safety management regulations under the National Contract Act and the Construction Technology Promotion Act, and a direct supervisory system is implemented by the commissioning authority. Public projects are predominantly large-scale civil engineering works, such as roads, bridges, tunnels, and dams, which involve extensive use of construction machinery and transportation vehicles. In addition, the mandatory appointment of safety managers based on construction scale under the Occupational Safety and Health Act is strictly enforced [
10].
In contrast, private projects operate under a relatively autonomous safety management system, and because of the high proportion of small-scale building construction, safety management gaps are prone to occur in projects below the threshold for mandatory safety-manager appointments [
10,
11]. Structural differences in legal regulations, work-type composition, and safety management levels according to project ownership may have different effects on accident type, cause, and severity, and the formulation of safety management strategies tailored to each project ownership type is required. For example, public road and bridge construction sites involve frequent deployment of heavy construction machinery, leading to elevated risks of machinery-related accidents, whereas private apartment building sites, with their high proportion of finishing works, are associated with concentrated risks of falls and scaffolding-related accidents [
12,
13,
14]. These practical differences underscore the need for ownership-specific empirical analysis, yet such analysis has been constrained by data availability.
Studies analyzing the differences in construction accident characteristics according to project ownership have been conducted in several countries, including Taiwan, Singapore, and Korea [
7,
11,
12,
13,
14,
15]. Cheng et al. [
12,
13] identified differences in accident patterns between public and nonpublic projects in Taiwan through association rule mining, and Ling et al. [
14] reported differences in fatality rates between public and private projects in Singapore. However, existing studies have been limited to cases in which project ownership information is included in the source data, and analyses of large-scale databases lacking project ownership information have not been conducted.
The MOEL occupational accident data—the most extensive construction accident database in Korea—were collected under the Occupational Safety and Health Act and contain approximately 270,000 construction industry accident records spanning 2014–2023. A wide range of variables, including workplace, worker, and accident occurrence characteristics, were recorded; however, project ownership information distinguishing between public and private projects was not included [
4]. The Ministry of Land, Infrastructure and Transport (MOLIT) Construction Safety Information (CSI) system contains project ownership information. However, compared to the MOEL data, its collection scale is limited, and the diversity of accident variables is insufficient. Consequently, a structural limitation remains in which accident characteristics of public and private projects cannot be analyzed using the most comprehensive construction accident data in Korea.
Recently, artificial intelligence (AI) and natural language processing (NLP) have been actively utilized in the construction safety domain for hazard identification, accident-type classification, and accident prediction [
16,
17,
18,
19,
20,
21,
22,
23,
24,
25,
26,
27,
28,
29]. In particular, fine-tuned pretrained language models, such as BERT, have demonstrated strong performance in classifying unstructured text in construction accident reports [
20,
24,
28]. However, existing AI/NLP-based construction safety research has primarily focused on the automatic classification of variables already available in the source data. To date, no study has used AI models to generate new analytical variables absent from the original database and subsequently incorporate them as key variables into large-scale statistical analysis.
The objectives of this study are (1) to develop a fine-tuned KLUE-BERT framework that automatically classifies project ownership from unstructured text information (site name, client name, and company name) in MOEL construction accident data and (2) to systematically compare and analyze the accident characteristics of public and private projects across six key accident variables (accident type, accident cause, construction scale, accident severity, occupation, and worker tenure) using 245,998 classified records. By integrating AI-based text classification with multilayered statistical analysis, this study aims to address the limitations of source data and provide empirical evidence for the development of safety management policies tailored to project ownership. The proposed framework can support targeted safety interventions, improve regulatory resource allocation, and ultimately contribute to reducing accident-related costs and enhancing worker safety in the construction industry.
Specifically, this study addresses the following three research questions:
RQ1: Can a fine-tuned KLUE-BERT model accurately classify project ownership from unstructured text fields in accident records, achieving classification performance sufficient for reliable downstream statistical analysis?
RQ2: Do significant structural differences exist in accident characteristics (Accident Types, Accident Causes, Construction Scale, Accident Severity, Occupation, and Tenure) between public and private projects?
RQ3: Can the classified data provide quantitative evidence—in terms of odds ratios and trend statistics—to support the formulation of ownership-specific safety management strategies?
RQ1 is evaluated by classification metrics (F1-score, precision, recall) benchmarked against a rule-based baseline; RQ2 by chi-square tests with Bonferroni correction and effect sizes (Cramér’s V); and RQ3 by odds ratios with 95% confidence intervals, adjusted standardized residuals, and Cochran-Armitage trend tests.
The remainder of this paper is organized as follows.
Section 2 reviews the literature on construction accident analyses based on project ownership and NLP-based text classification.
Section 3 describes the research framework, data collection and preprocessing, classification model development, and statistical analysis methods.
Section 4 presents the classification model performance and statistical analysis results.
Section 5 discusses the findings and practical implications, and
Section 6 presents conclusions.
3. Methodology
3.1. Research Framework
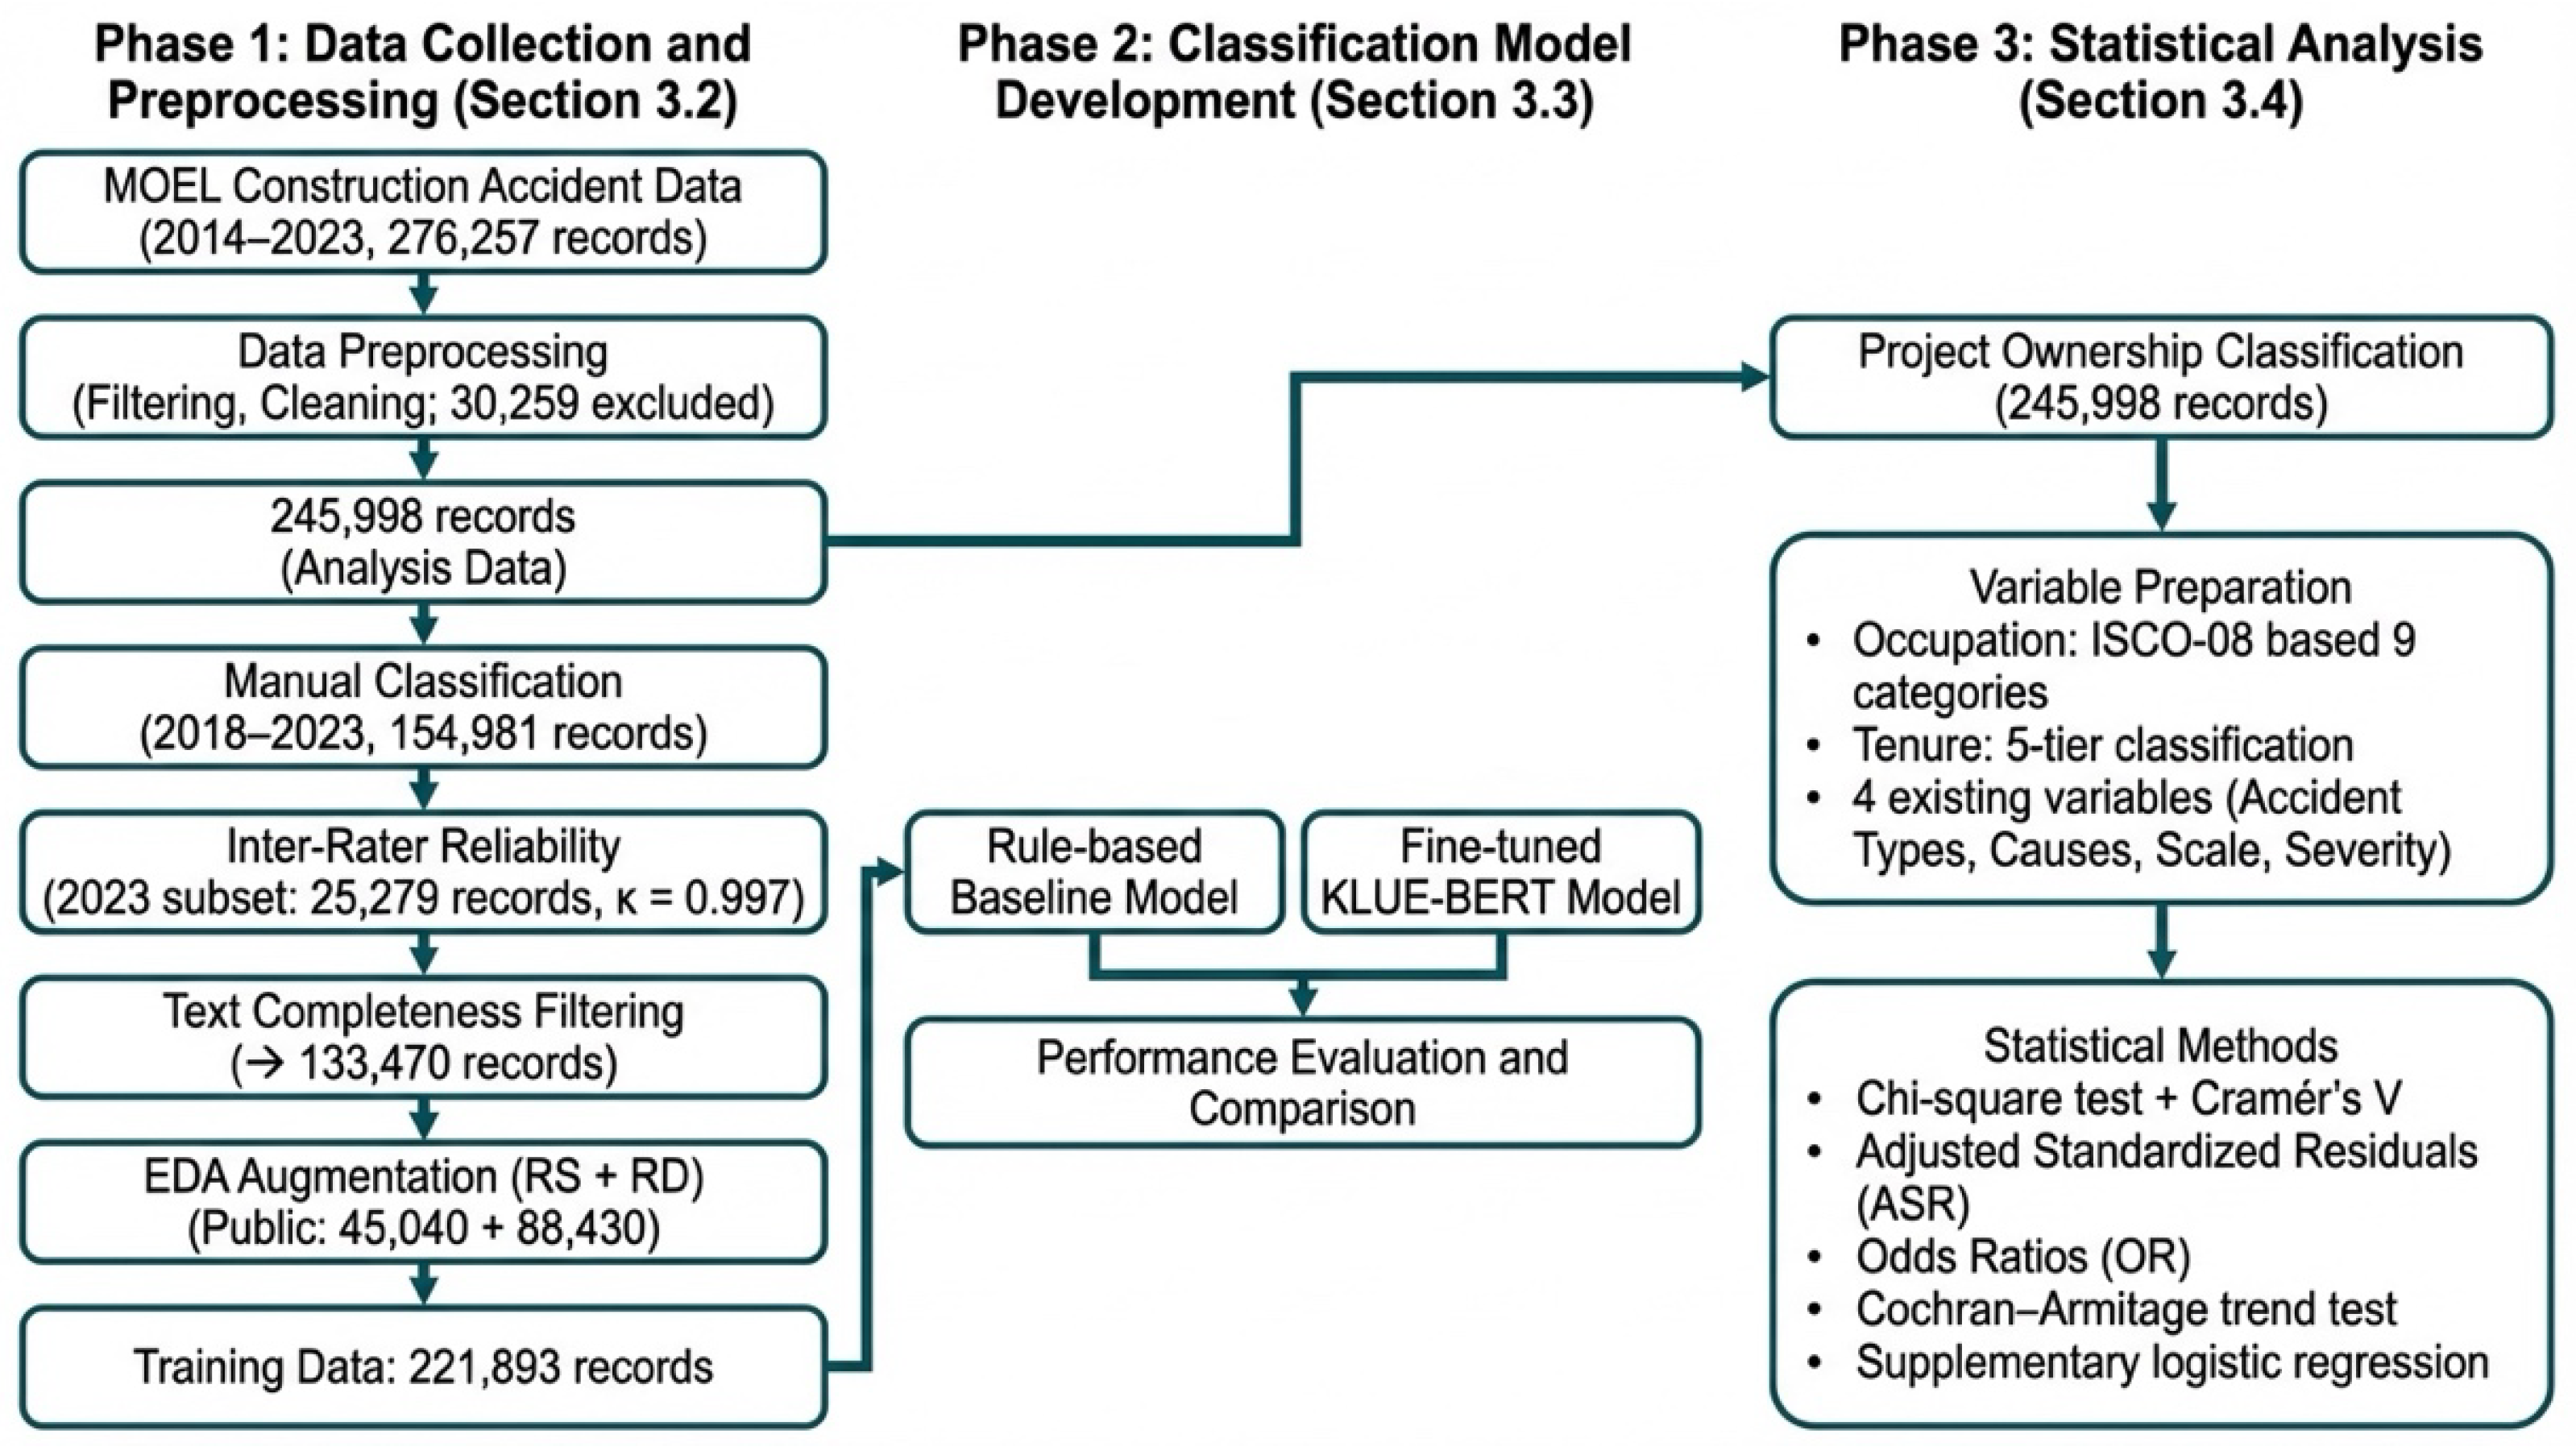
The overall framework of this study consisted of three main stages (
Figure 1). In Stage 1, which involved data collection and preprocessing, the 2014–2023 construction industry occupational accident data from MOEL were collected, preprocessing was performed to exclude unclassifiable cases, 2023 approved statistics were manually classified, and training data were constructed through Easy Data Augmentation (EDA). The objective of this stage was to construct both a preprocessed dataset suitable for statistical analysis and a labeled dataset for classification model training. In Stage 2, the classification model, rule-based baseline model, and fine-tuned KLUE-BERT model were developed, and their performance was compared. A rule-based baseline was first developed to quantify the performance ceiling of keyword-based classification, thereby establishing the added value of the KLUE-BERT approach. In Stage 3, the optimal model was applied to the entire dataset to classify project ownership, category reclassification of occupation and tenure was performed, and statistical analyses were conducted on six key variables to examine the differences in accident characteristics across project ownership types. These six variables were selected as the key categorical variables in the MOEL data for which cross-tabulation with project ownership is analytically meaningful.
3.2. Data Collection and Preprocessing
The MOEL occupational accident data were collected under the Occupational Safety and Health Act, and statistics were compiled based on accidents approved under the Industrial Accident Compensation Insurance Act [
4]. In this study, 276,257 occupational accident records from the construction industry spanning 2014–2023 were collected. The data comprised workplace characteristics (company name, site name, client name, construction scale, subindustry type, administrative district, etc.), worker characteristics (gender, age, occupation, tenure, worker classification, etc.), and accident occurrence characteristics (accident type, accident cause, etc.); however, project ownership information distinguishing between public and private projects was not included. The MOEL data were obtained from the publicly available occupational accident statistics published by the Korean Ministry of Employment and Labor. The data are compiled annually based on accident reports submitted under the Industrial Accident Compensation Insurance Act and are made available for research purposes upon approval.
From the 276,257 records, 30,259 cases were excluded based on the following criteria: (1) cases where the accident type was “unclassifiable,” “animal injury,” “off-site traffic accident,” “sports event accident,” or “act of violence”; (2) cases where the major category of accident cause or occupation was “unclassifiable”; and (3) cases where both the site name and client name were blank. After preprocessing, 245,998 records were retained for statistical analysis.
To construct training data labels, manual classification was performed on construction accident records from 2018 to 2023. The classification criteria were established by cross-referencing project ownership information from the MOLIT CSI system. Public and private projects were then identified by comprehensively reviewing the text fields of client name, site name, and company name. To ensure the consistency of the manual classification, a classification guideline was prepared, and the judgment rules for ambiguous cases were predefined. Classification was conducted independently by three researchers: two with 4 and 20+ years of experience at the MOEL Occupational Safety and Health Bureau, respectively (both doctoral candidates in safety engineering), and one with a doctoral degree in safety engineering. To assess inter-rater reliability, 25,279 records from the 2023 dataset were independently classified by all three researchers. Agreement was achieved on 25,247 records (99.87%; Cohen’s κ = 0.997), and the remaining 32 disagreements were resolved through consensus. Text field completeness was verified: among the training data, the non-blank rates for site name, client name, and company name were 100.0%, 86.2%, and 100.0%, respectively. Records with any incomplete text field were excluded to ensure complete input for the classification model.
To address the class imbalance problem and ensure a sufficient training scale, EDA [
35] was applied. Among the EDA techniques, random swapping (RS) and random deletion (RD), which are suitable for the characteristics of the input text, were used to augment the 133,470 labeled records (after excluding records with incomplete text fields; public: 45,040, private: 88,430) to a total of 221,893. RS randomly swaps the order of tokens within the input text to enhance the robustness of the model to word-order variations, and RD randomly deletes tokens to enable the model to learn classification capabilities from partial information. Because the input text primarily consists of proper nouns (institution names, site names, company names), SR and RI, which rely on synonym dictionaries, are unsuitable. EDA was applied exclusively to the public class (45,040 records), generating 88,430 augmented public records to match the private class size and address the approximately 2:1 class imbalance. After quality filtering, the final augmented dataset comprised 221,893 records. The effectiveness of this augmentation strategy is evaluated in
Section 4.1.
3.3. Classification Model Development
The input text for project ownership classification was constructed by selecting three text fields from the MOEL data: site name, client name, and company name, which reflect characteristics of the project owner. Each field contains distinct information: the site name includes the nature of the project (road, apartment, plant, etc.); the client name includes the commissioning organization or company; and the company name includes contractor information. A [SEP] token was inserted between each field to clearly delineate the boundaries between features, and the final input text was constructed in the format “Site name: {site name} [SEP] Client name: {client name} [SEP] Company name: {company name}.”
A rule-based classification model was constructed as a baseline for a comparative evaluation of the KLUE-BERT model performance. The rule-based model classifies by searching for public institution-related keywords (e.g., “city hall,” “provincial office,” “construction authority,” “corporation,” “land ministry,” and “education office”) in the client name and company name fields. The classification accuracy is limited for institution names not included in the keyword list or ambiguous names such as “OO Construction” that are used in both public and private contexts.
In this study, the KLUE-BERT (klue/bert-base) model was fine-tuned for the project ownership classification task [
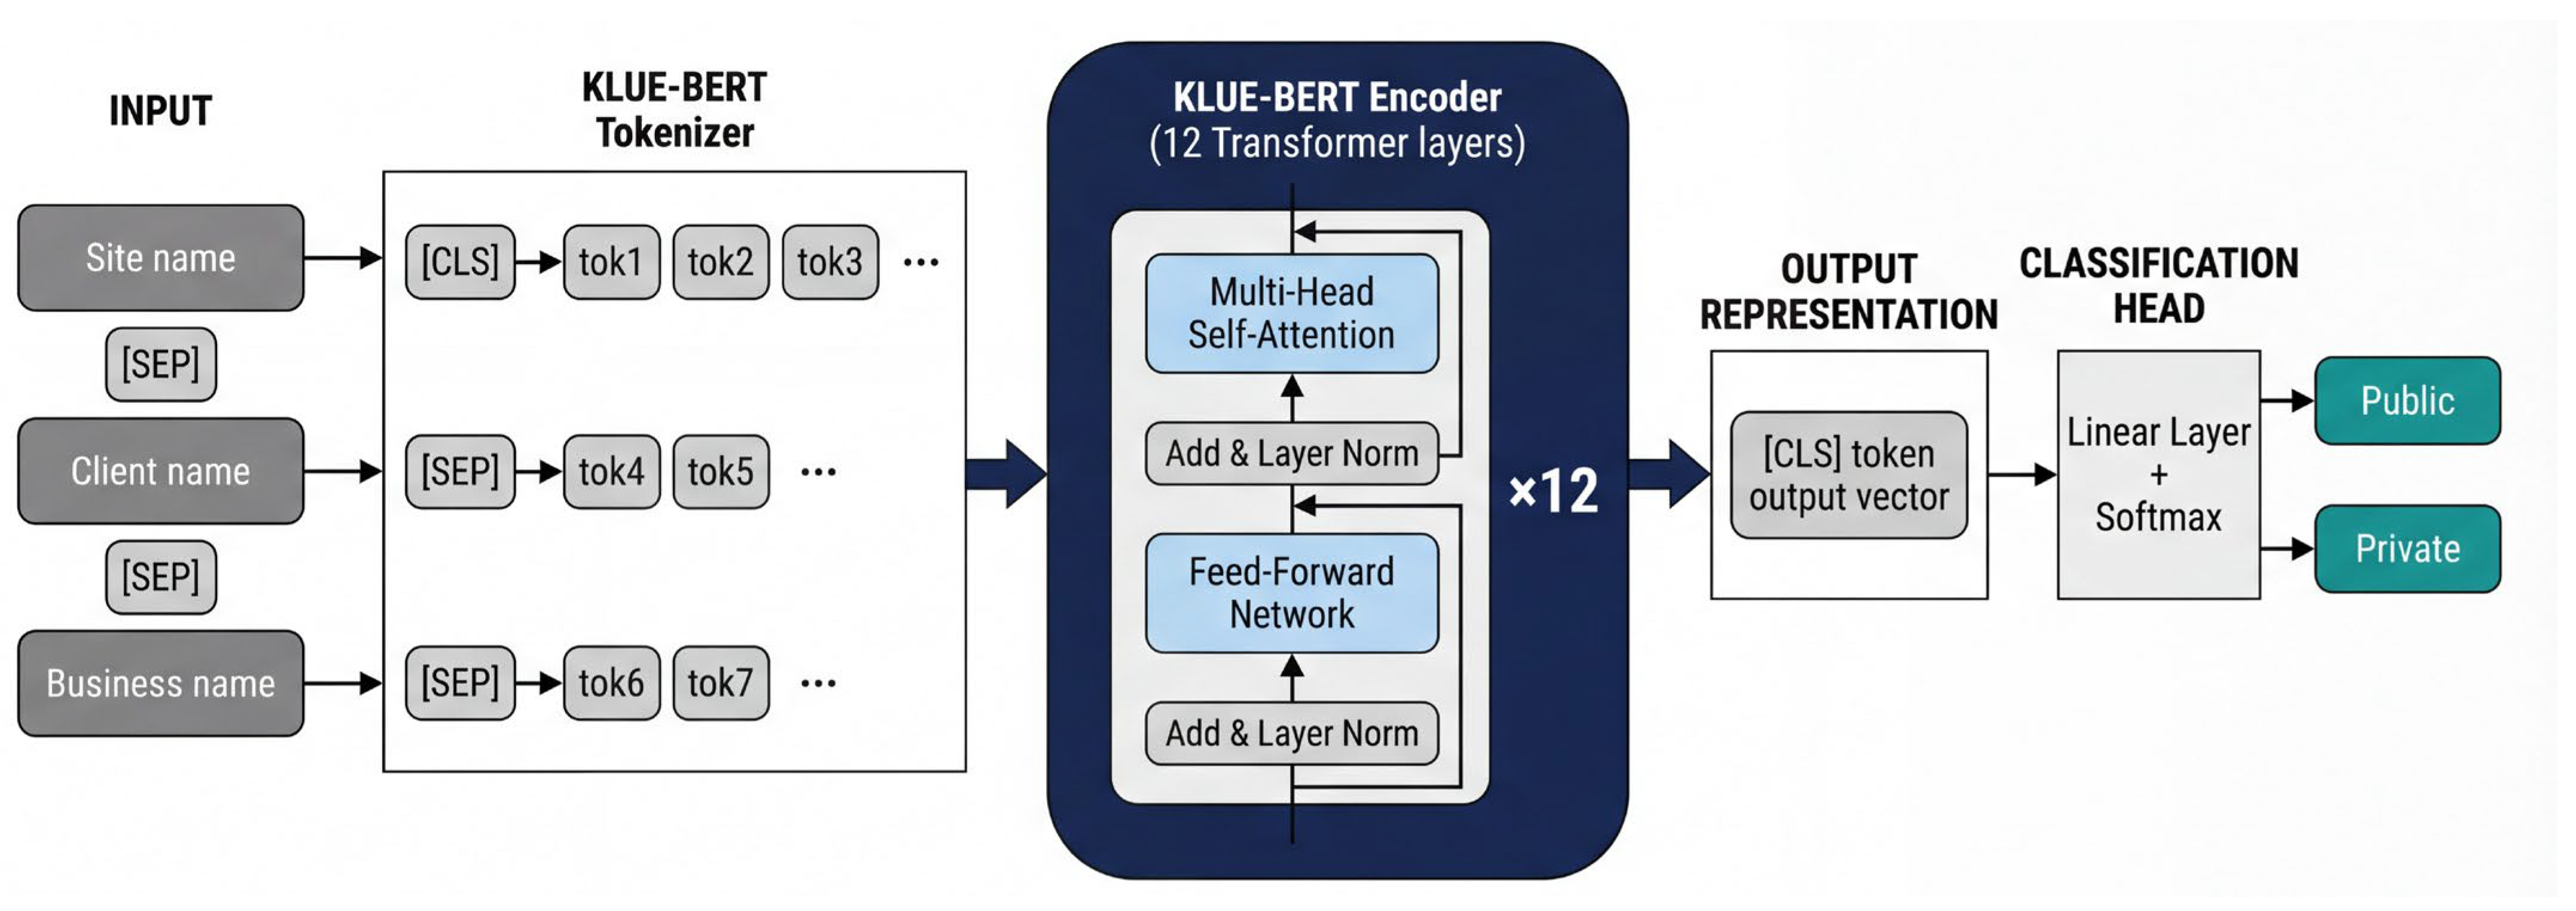
34]. KLUE-BERT was pretrained on a 62-GB Korean corpus (news, Wikipedia, Modu Corpus, etc.) and consisted of 12 transformer encoder layers, 768-dimensional hidden vectors, and 12 attention heads. The output vector (768 dimensions) of the [CLS] token was extracted from the final layer of the KLUE-BERT encoder, and after applying dropout (
p = 0.1), the model was trained to perform binary classification of public projects (0) and private projects (1) through a linear layer (
Figure 2). The 221,893 training data augmented using EDA were split into training (60%), validation (20%), and test (20%) data; the model configuration and key training hyperparameters are presented in
Table 1. It should be noted that augmentation was performed before the data split, which means that augmented variants of the same original record may appear in both the training and test sets, potentially introducing data leakage. Early stopping was implemented, and the model with the highest validation F1-score was selected.
3.4. Statistical Analysis
Statistical analysis was performed on 245,998 accident records for which project ownership was assigned using the classification model.
Chi-square tests of independence were performed to examine the association between project ownership (public/private) and the six categorical accident variables. The Bonferroni correction was applied to control for Type I errors due to multiple testing (six tests,
αadj = 0.00833), and the bias-corrected Cramér’s
V [
36] was computed to evaluate the magnitude of association. Effect-size interpretation followed the criteria of Cohen [
37] (negligible:
V < 0.10, small: 0.10 ≤
V < 0.30, medium: 0.30 ≤
V < 0.50, large:
V ≥ 0.50). The bias-corrected Cramér’s
V was computed as
Among the six analytical variables, four—accident type, accident cause, construction scale, and accident severity—used the categories from the original data as is and were selected with reference to the variable classification scheme of Hwang et al. [
38]. Construction scale was classified into three tiers: small (less than KRW 5 billion), medium (KRW 5–12 billion), and large (KRW 12 billion or more). Accident severity was defined as a binary variable (fatal vs. nonfatal injury), after excluding occupational diseases.
Occupation and tenure were reclassified from the detailed categories in the original data based on international standards. Occupation was classified into 9 categories from the 53 occupation (medium) categories in the MOEL data based on the sub-major group structure of ILO ISCO-08 (International Standard Classification of Occupations) [
39] (
Table 2). This classification is based on the work of Song et al. [
40], who confirmed that the Korean Employment Classification of Occupations (KECO) is a domestic adaptation of ISCO-08, and Kang and Ryu [
41], who used the same KOSHA/MOEL data structure while maintaining consistency with occupation classifications in the international construction safety literature [
13,
14,
42,
43]. Tenure was classified into five tiers (less than one month, one to six months, six months to one year, one to five years, and more than five years) from the 14 categories in the original data by synthesizing the criteria of Cheng et al. [
12,
13] and Dong et al. [
42].
The statistical analysis was conducted in three stages. First, descriptive statistics and chi-square tests of independence for the six variables were used to test their overall association with project ownership. Second, ASR and OR analyses of accident-related variables (accident type, accident cause, construction scale, and accident severity) were performed to quantify the differences by category. Third, category-specific analyses and trend tests were conducted for worker-related variables (occupation, tenure).
The
ASR measures the standardized deviation between observed and expected frequencies in each cell of a contingency table. Under the standard normal approximation, statistical significance is indicated when |
ASR| > 1.96 (
p < 0.05), |
ASR| > 2.58 (
p < 0.01), and |
ASR| > 3.29 (
p < 0.001) [
44]. The
OR quantifies the relative likelihood of occurrence of each accident category in public vs. private projects. Statistical significance was inferred when the 95% confidence interval (
CI) did not include 1. As tenure is an ordinal variable, the Cochran–Armitage trend test [
45] was performed to assess linear trends in the proportion of public vs. private projects across tenure categories. Additionally, the presence of monotonic trends was examined using the nonparametric Mann–Kendall test. The formulas for the key statistical measures are as follows. The adjusted standardized residual (
ASR) was computed as
, where
is the observed frequency,
the expected frequency,
the row total,
the column total, and
the grand total. The odds ratio (
OR) and its 95% confidence interval were computed as
and
.
OR > 1 indicates that the accident category is more likely in public projects relative to private projects;
OR < 1 indicates higher likelihood in private projects. An
OR was considered statistically significant when its 95%
CI did not include 1. The Cochran-Armitage
Z statistic was computed as
, where
are equally spaced scores,
the number of events,
the total at level
, and
.
To assess the robustness of bivariate associations against potential confounding by year and construction scale, supplementary logistic regression analyses were conducted for key outcome variables. Binary logistic regression models were fitted with each accident category as the dependent variable (1 = category present, 0 = otherwise), project ownership as the independent variable, and year (centered at 2018) and construction scale (ordinal: Small = 0, Medium = 1, Large = 2) as covariates. Adjusted odds ratios (aOR) with 95% confidence intervals were estimated to verify whether the direction and magnitude of associations observed in bivariate analyses remained consistent after controlling for these covariates.
4. Results
4.1. Classification Model Performance
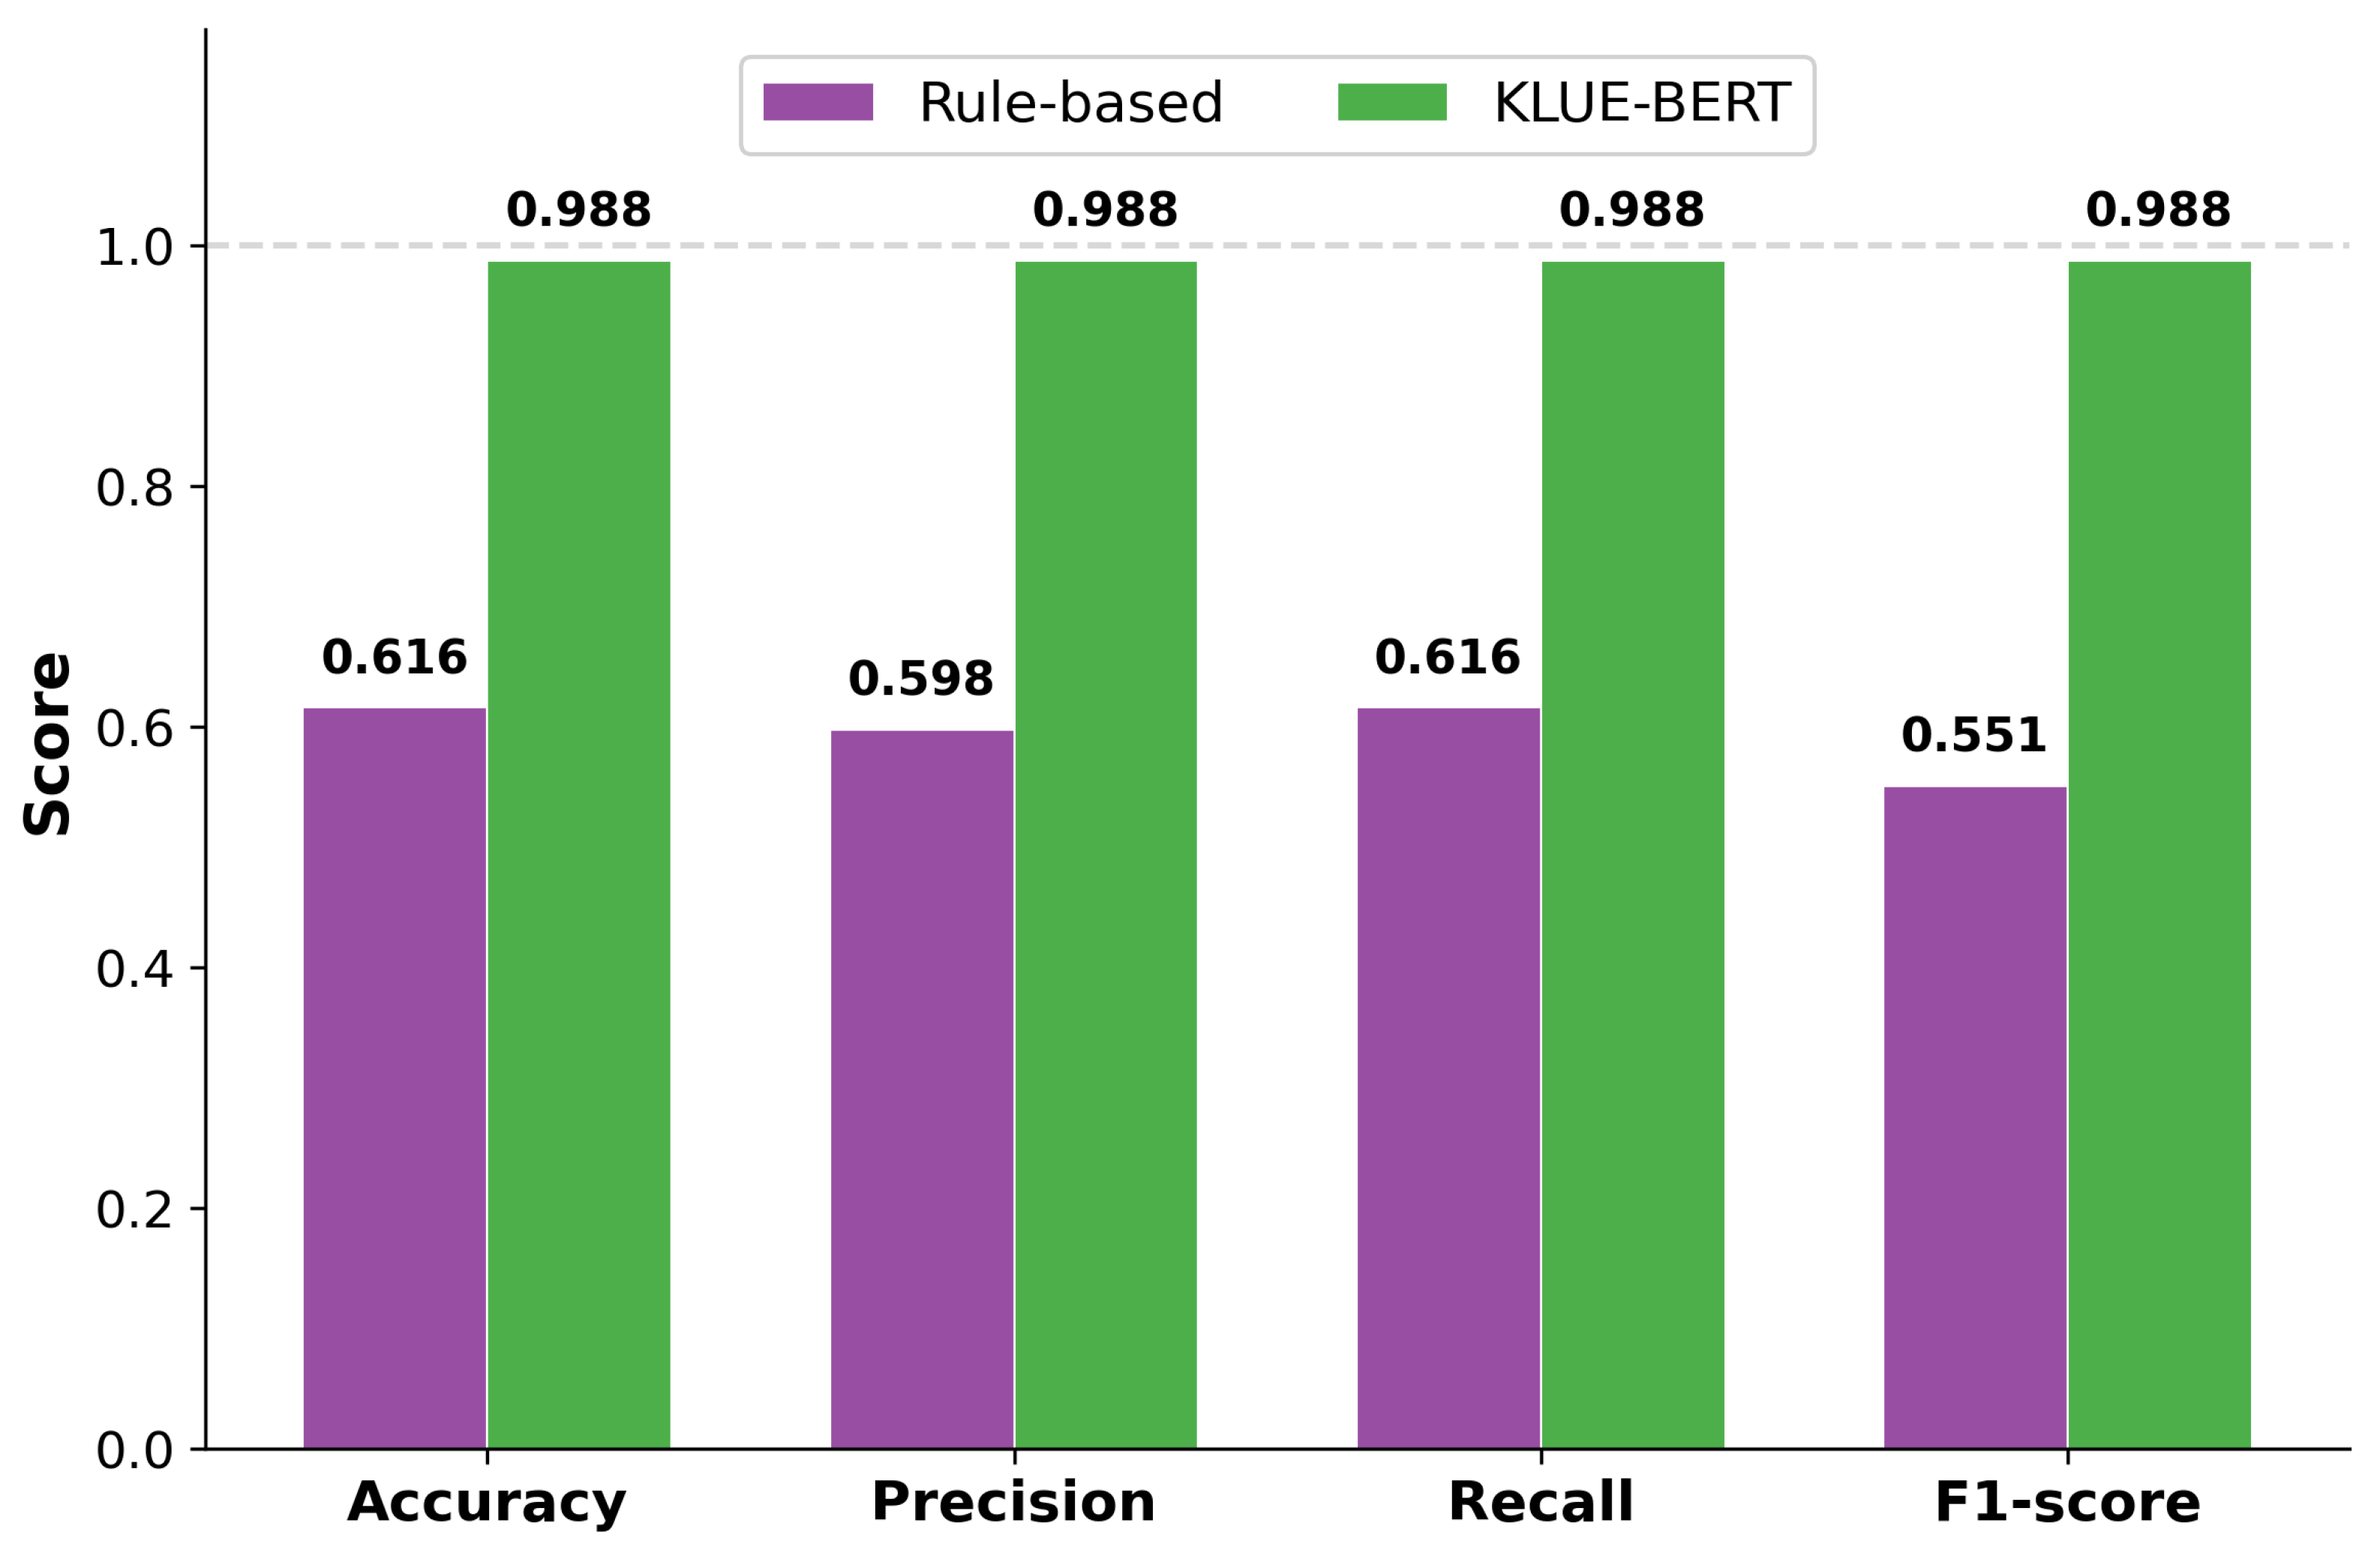
Table 3 presents the performance comparison results between the rule-based and fine-tuned KLUE-BERT models. The rule-based model achieved a weighted F1-score of only 0.5511, whereas the fine-tuned KLUE-BERT model achieved a score of 0.9876, demonstrating a marked performance improvement across all evaluation metrics (
Figure 3).
The confusion matrix indicated the poor performance of the rule-based model. In the test set (
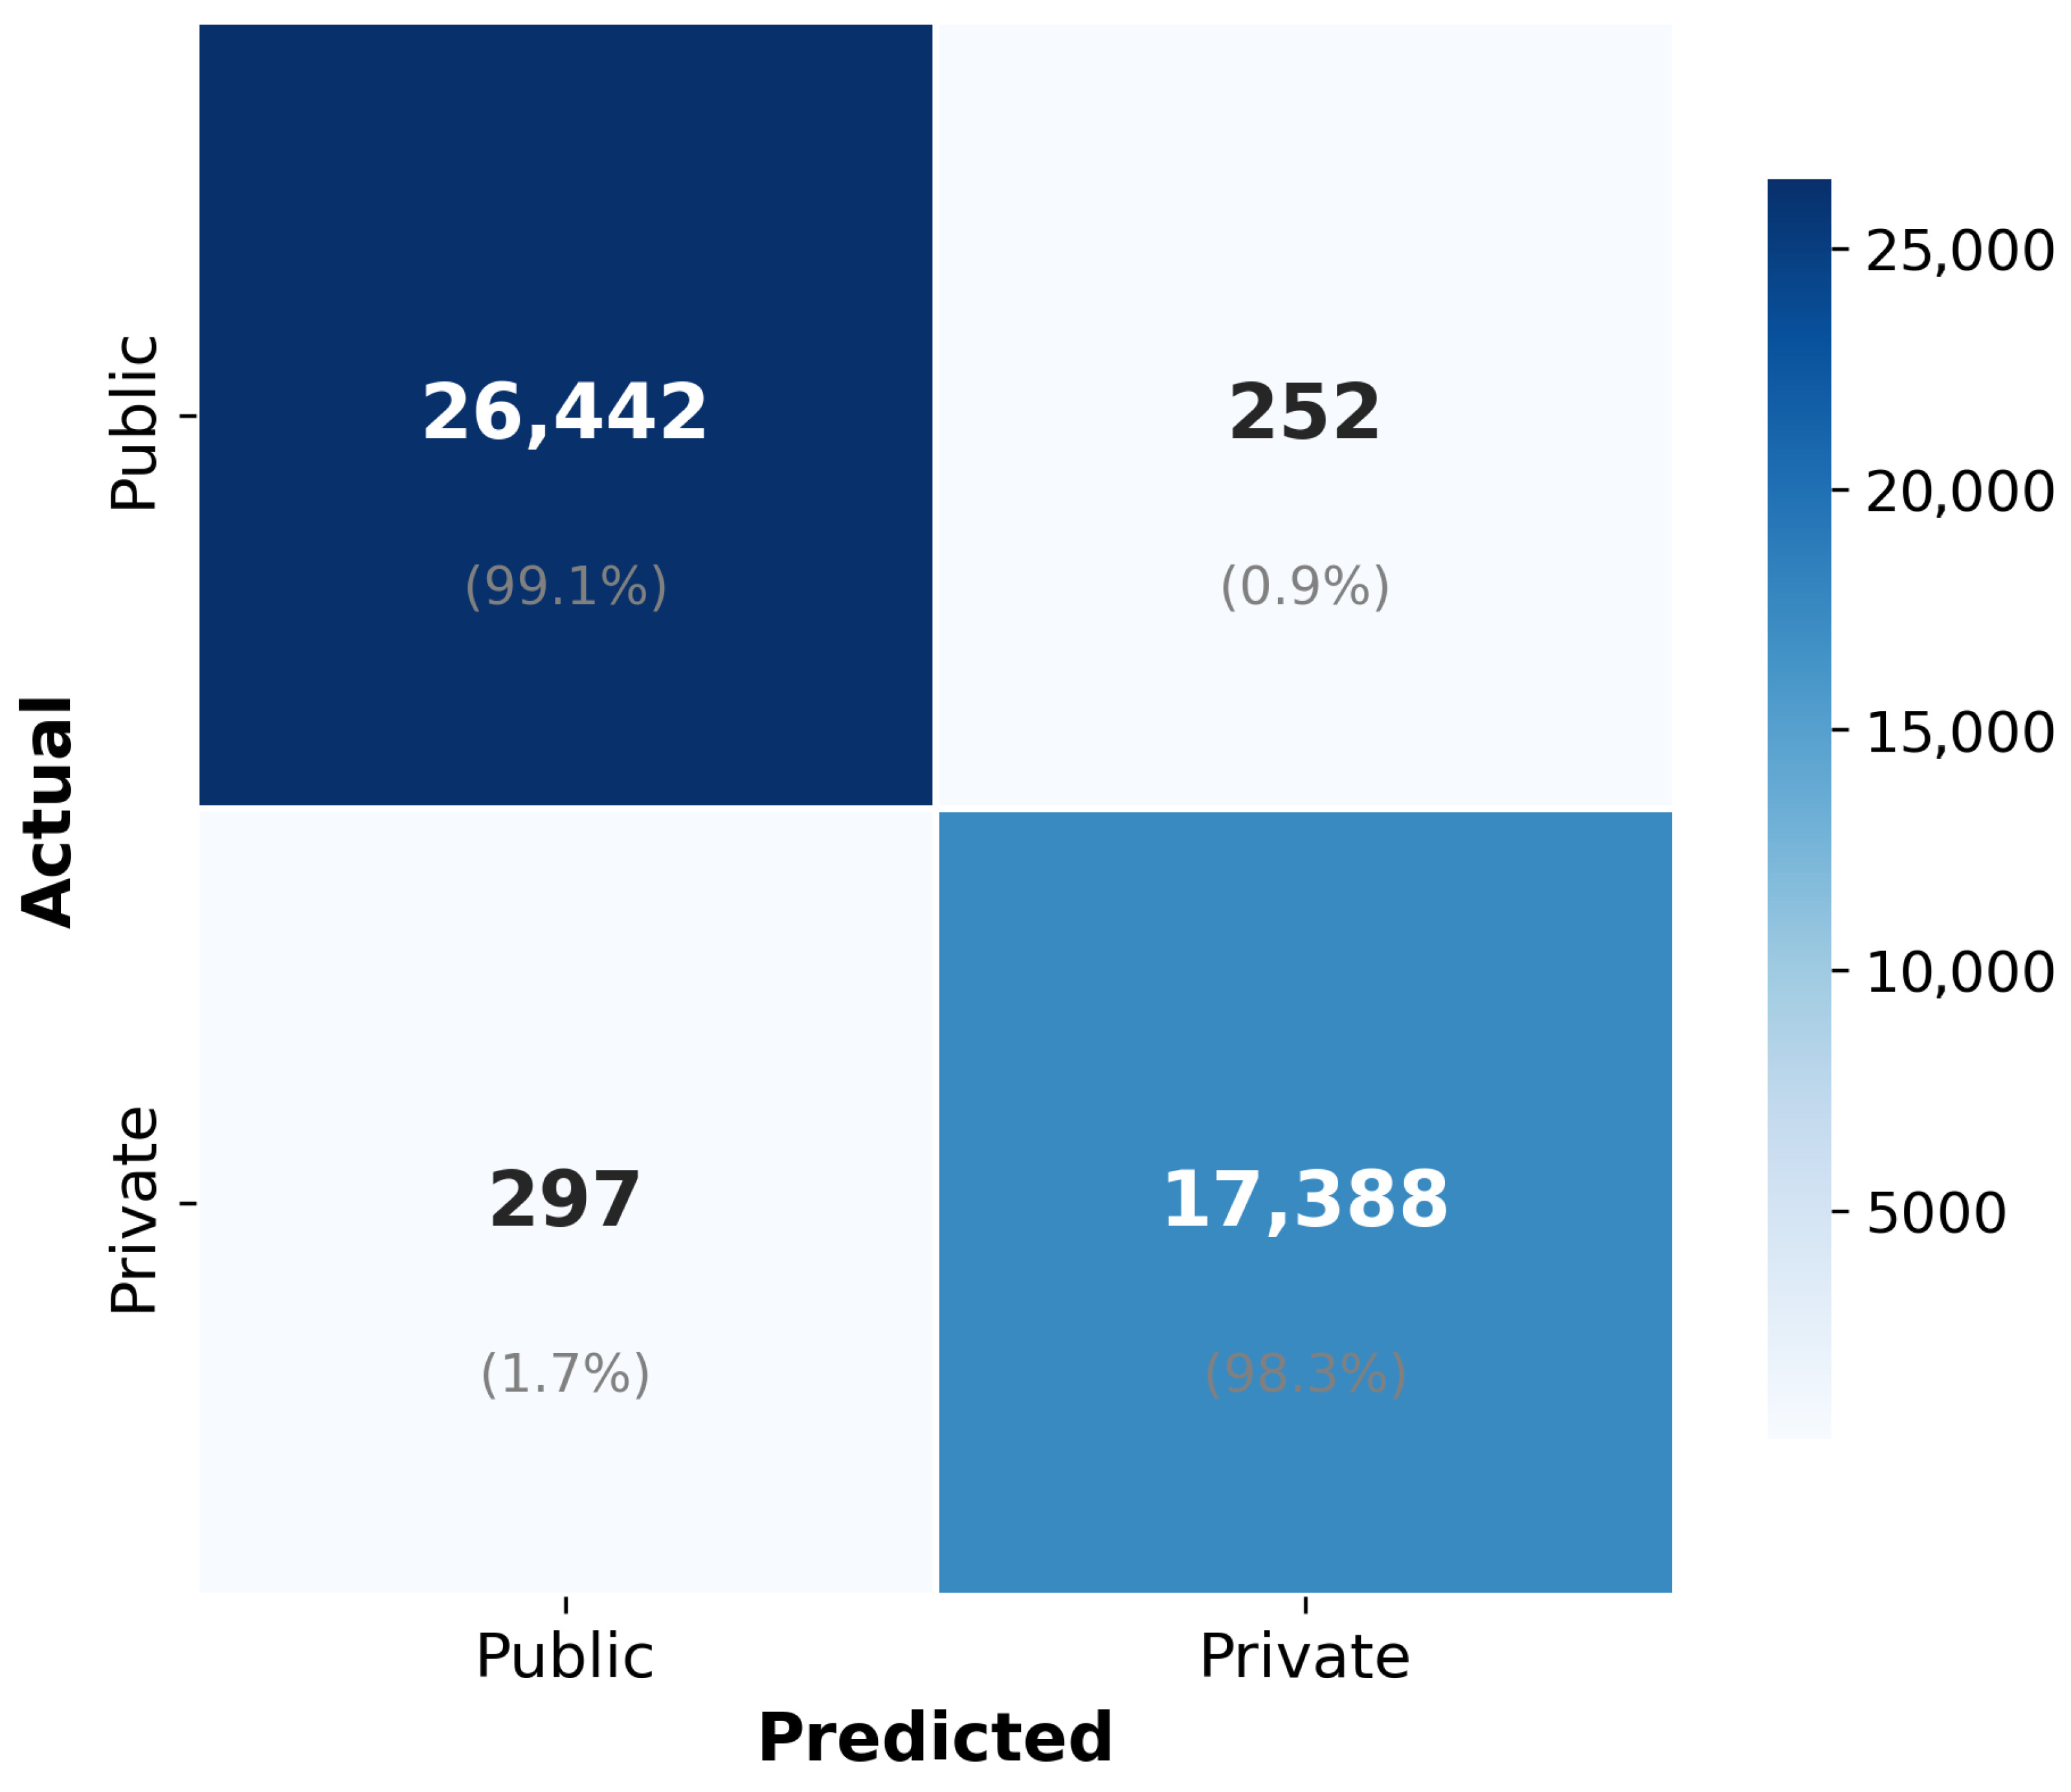
n = 44,379), 82.5% (14,592 of 17,685) of private projects were misclassified as public projects. This misclassification pattern reflects a structural limitation of the rule-based model’s keyword list, which contains broadly common terms (e.g., construction work, Korea) that frequently appear in both public and private project records, causing a large proportion of private records to be erroneously matched to public institution-related keywords and misclassified as public projects. In contrast, the fine-tuned KLUE-BERT model achieved balanced performance across both classes, with a recall of 0.991 for public projects (26,442 of 26,694 correctly classified) and 0.983 for private projects (17,388 of 17,685 correctly classified) (
Figure 4). Notably, the macro F1-score (0.9871) was nearly identical to the weighted F1-score (0.9876), indicating balanced performance across both classes. It should be noted that the test set class distribution (public 60.2% vs. private 39.8%) reflects the augmented data distribution, not the real-world distribution (public 29.1% vs. private 70.9%). This inversion is a consequence of EDA augmentation being applied prior to the train-validation-test split, where the minority class (public, originally 33.7% of labeled data) was augmented at a higher ratio to address class imbalance, resulting in its becoming the majority class in all splits including the test set.
The epoch-wise training history (
Table 4) demonstrates the convergence of the model. The training loss continuously decreased from 0.1117 in epoch 1 to 0.0344 in epoch 3, the validation loss decreased from 0.1027 in epoch 1 to 0.0560 in epoch 3, and the validation F1-score increased from 0.9766 to 0.9877. The difference between the training accuracy (0.9922) and validation accuracy (0.9877) was negligible (0.45 percentage points), indicating stable convergence without overfitting during the three-epoch training.
To verify the effectiveness of EDA, the performance of the model trained on the labeled data without augmentation (133,470 records) was compared with that of the model trained on the augmented data (221,893 records). The test F1-score of the model trained on the original data was 0.9712, which was 1.64 percentage points lower than that of the model trained on the augmented data (0.9876). We consider that data augmentation through RS and RD improved the classification performance by enhancing the robustness of the model to word-order variations and partial information. To assess whether the residual misclassification (1.24% error rate) could materially affect the subsequent statistical findings, a sensitivity analysis was conducted using the confusion matrix-based correction method for non-differential misclassification bias [
46]. The test set confusion matrix yields a sensitivity of 0.991 and specificity of 0.983 for the public class. Applying these rates to correct the observed 2 × 2 contingency tables for each accident category, the corrected odds ratios were computed and compared with the uncorrected (crude) values. For all eight key categories examined—including construction machinery (crude
OR = 3.20, corrected
OR = 3.30), fall (0.73, 0.72), transportation (2.59, 2.65), and scaffolding (0.73, 0.72)—the direction of association (
OR > 1 or
OR < 1) was preserved, with a maximum deviation of less than 4%. This confirms that the 1.24% misclassification rate does not substantively alter the key findings of the subsequent statistical analysis.
4.2. Descriptive Statistics and Overall Associations
When the fine-tuned KLUE-BERT model was applied to the entire dataset of 245,998 records, 71,550 (29.1%) were classified as public projects, and 174,448 (70.9%) were classified as private projects. This distribution, in which private projects account for a higher proportion than public projects, reflects the structure of the domestic construction market.
The categorical distributions of the six variables are presented in
Table 5. Among accident types, falls accounted for the highest proportion of cases (32.6%), with a higher percentage in private projects (34.6%) than in public projects (27.8%). Struck-by-object accidents accounted for 19.7%, followed by slips 13.5%.
Regarding accident causes, building-, structure-, and surface-related causes accounted for the highest proportion of cases (52.1%), with a higher percentage in private projects (53.9%) than in public projects (47.7%). In contrast, construction- and mining machinery-related causes accounted for a higher proportion of cases in public projects (14.3%) than in private projects (5.0%). Additionally, transportation-related causes were approximately 2.6 times more prevalent in public projects (3.9%) than in private projects (1.5%).
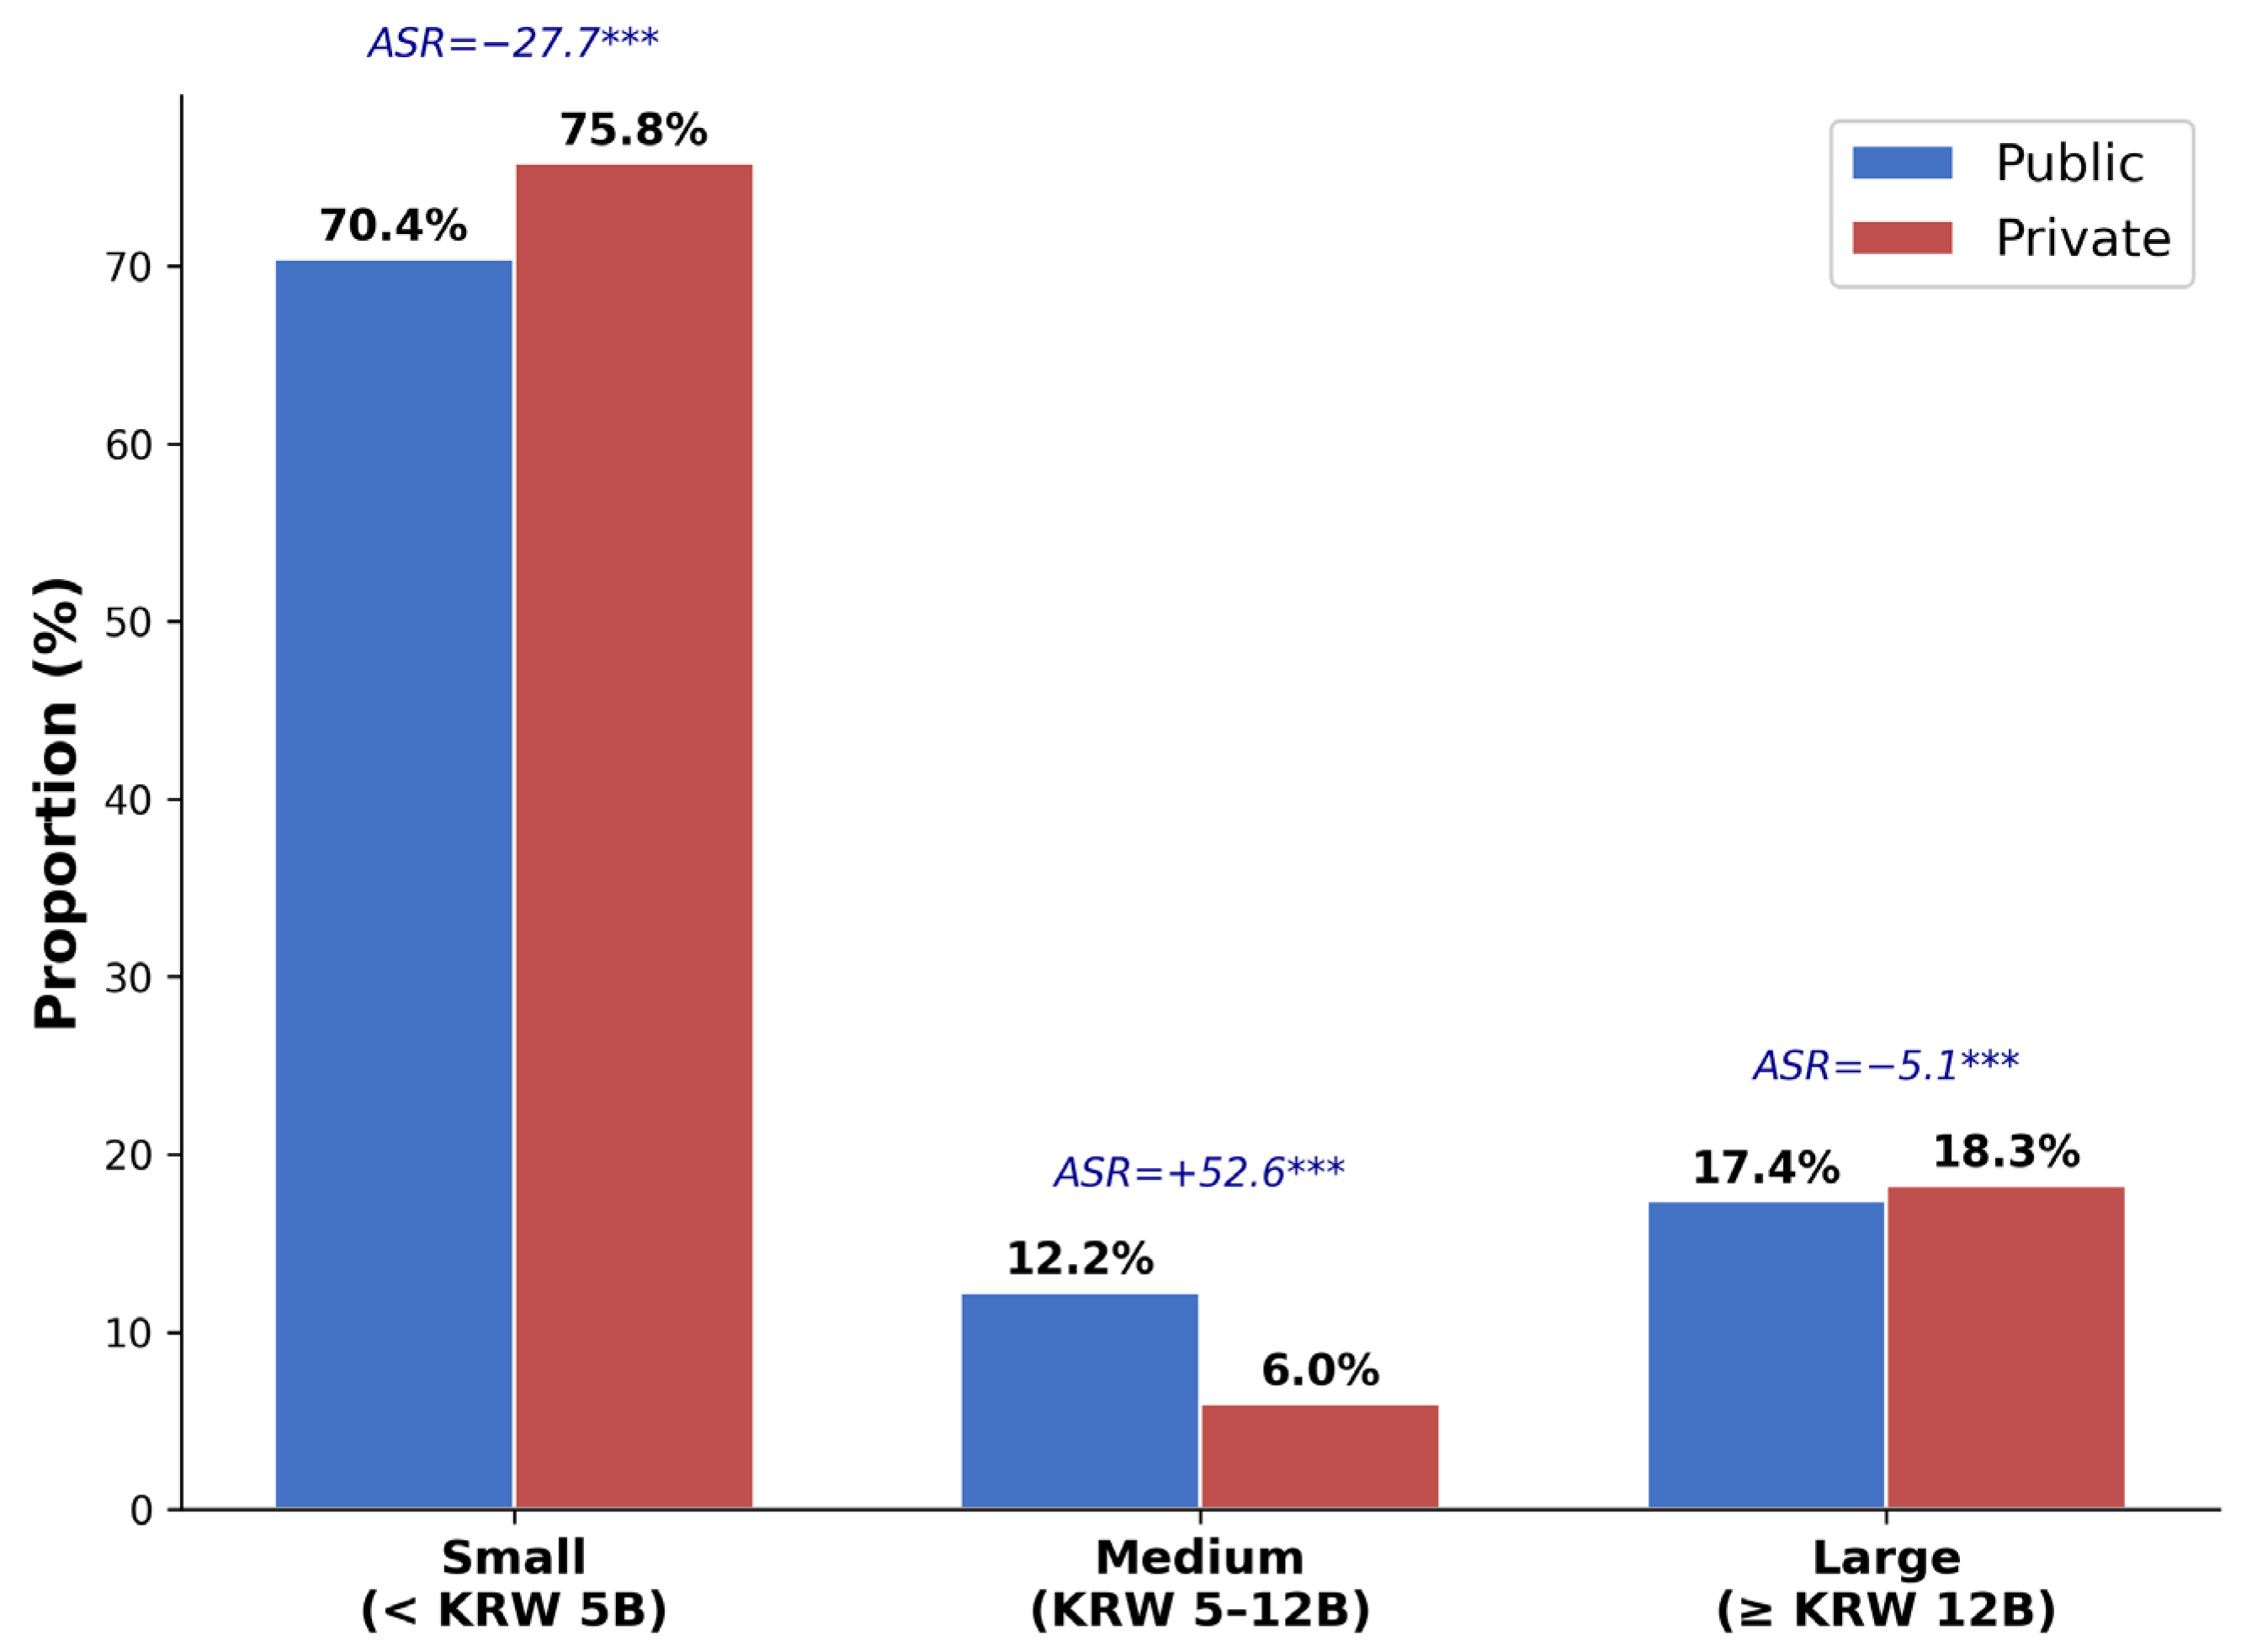
For construction scale, small-scale projects (less than KRW 5 billion) accounted for 74.2% of the total, and the medium-scale category (KRW 5–12 billion) accounted for approximately twice as high a proportion in public projects (12.2%) as in private projects (6.0%).
Regarding accident severity, nonfatal injuries accounted for 98.3% of cases. The proportion of fatal injuries was slightly higher in public projects (1.8%) than in private projects (1.6%); however, the absolute difference was negligible.
For occupation, construction laborers accounted for the highest proportion (44.6%), followed by building trades workers (32.2%). The proportion of building trades workers was higher in private projects (33.8%) than in public projects (28.3%), whereas other/non-construction occupations accounted for a substantially higher proportion in public projects (5.1%) than in private projects (2.2%).
For tenure, less than one month accounted for the highest proportion (71.2%). This proportion was higher in private projects (72.4%) than in public projects (68.2%). In all tenure categories of 1 month or more, the proportion in public projects exceeded that in private projects.
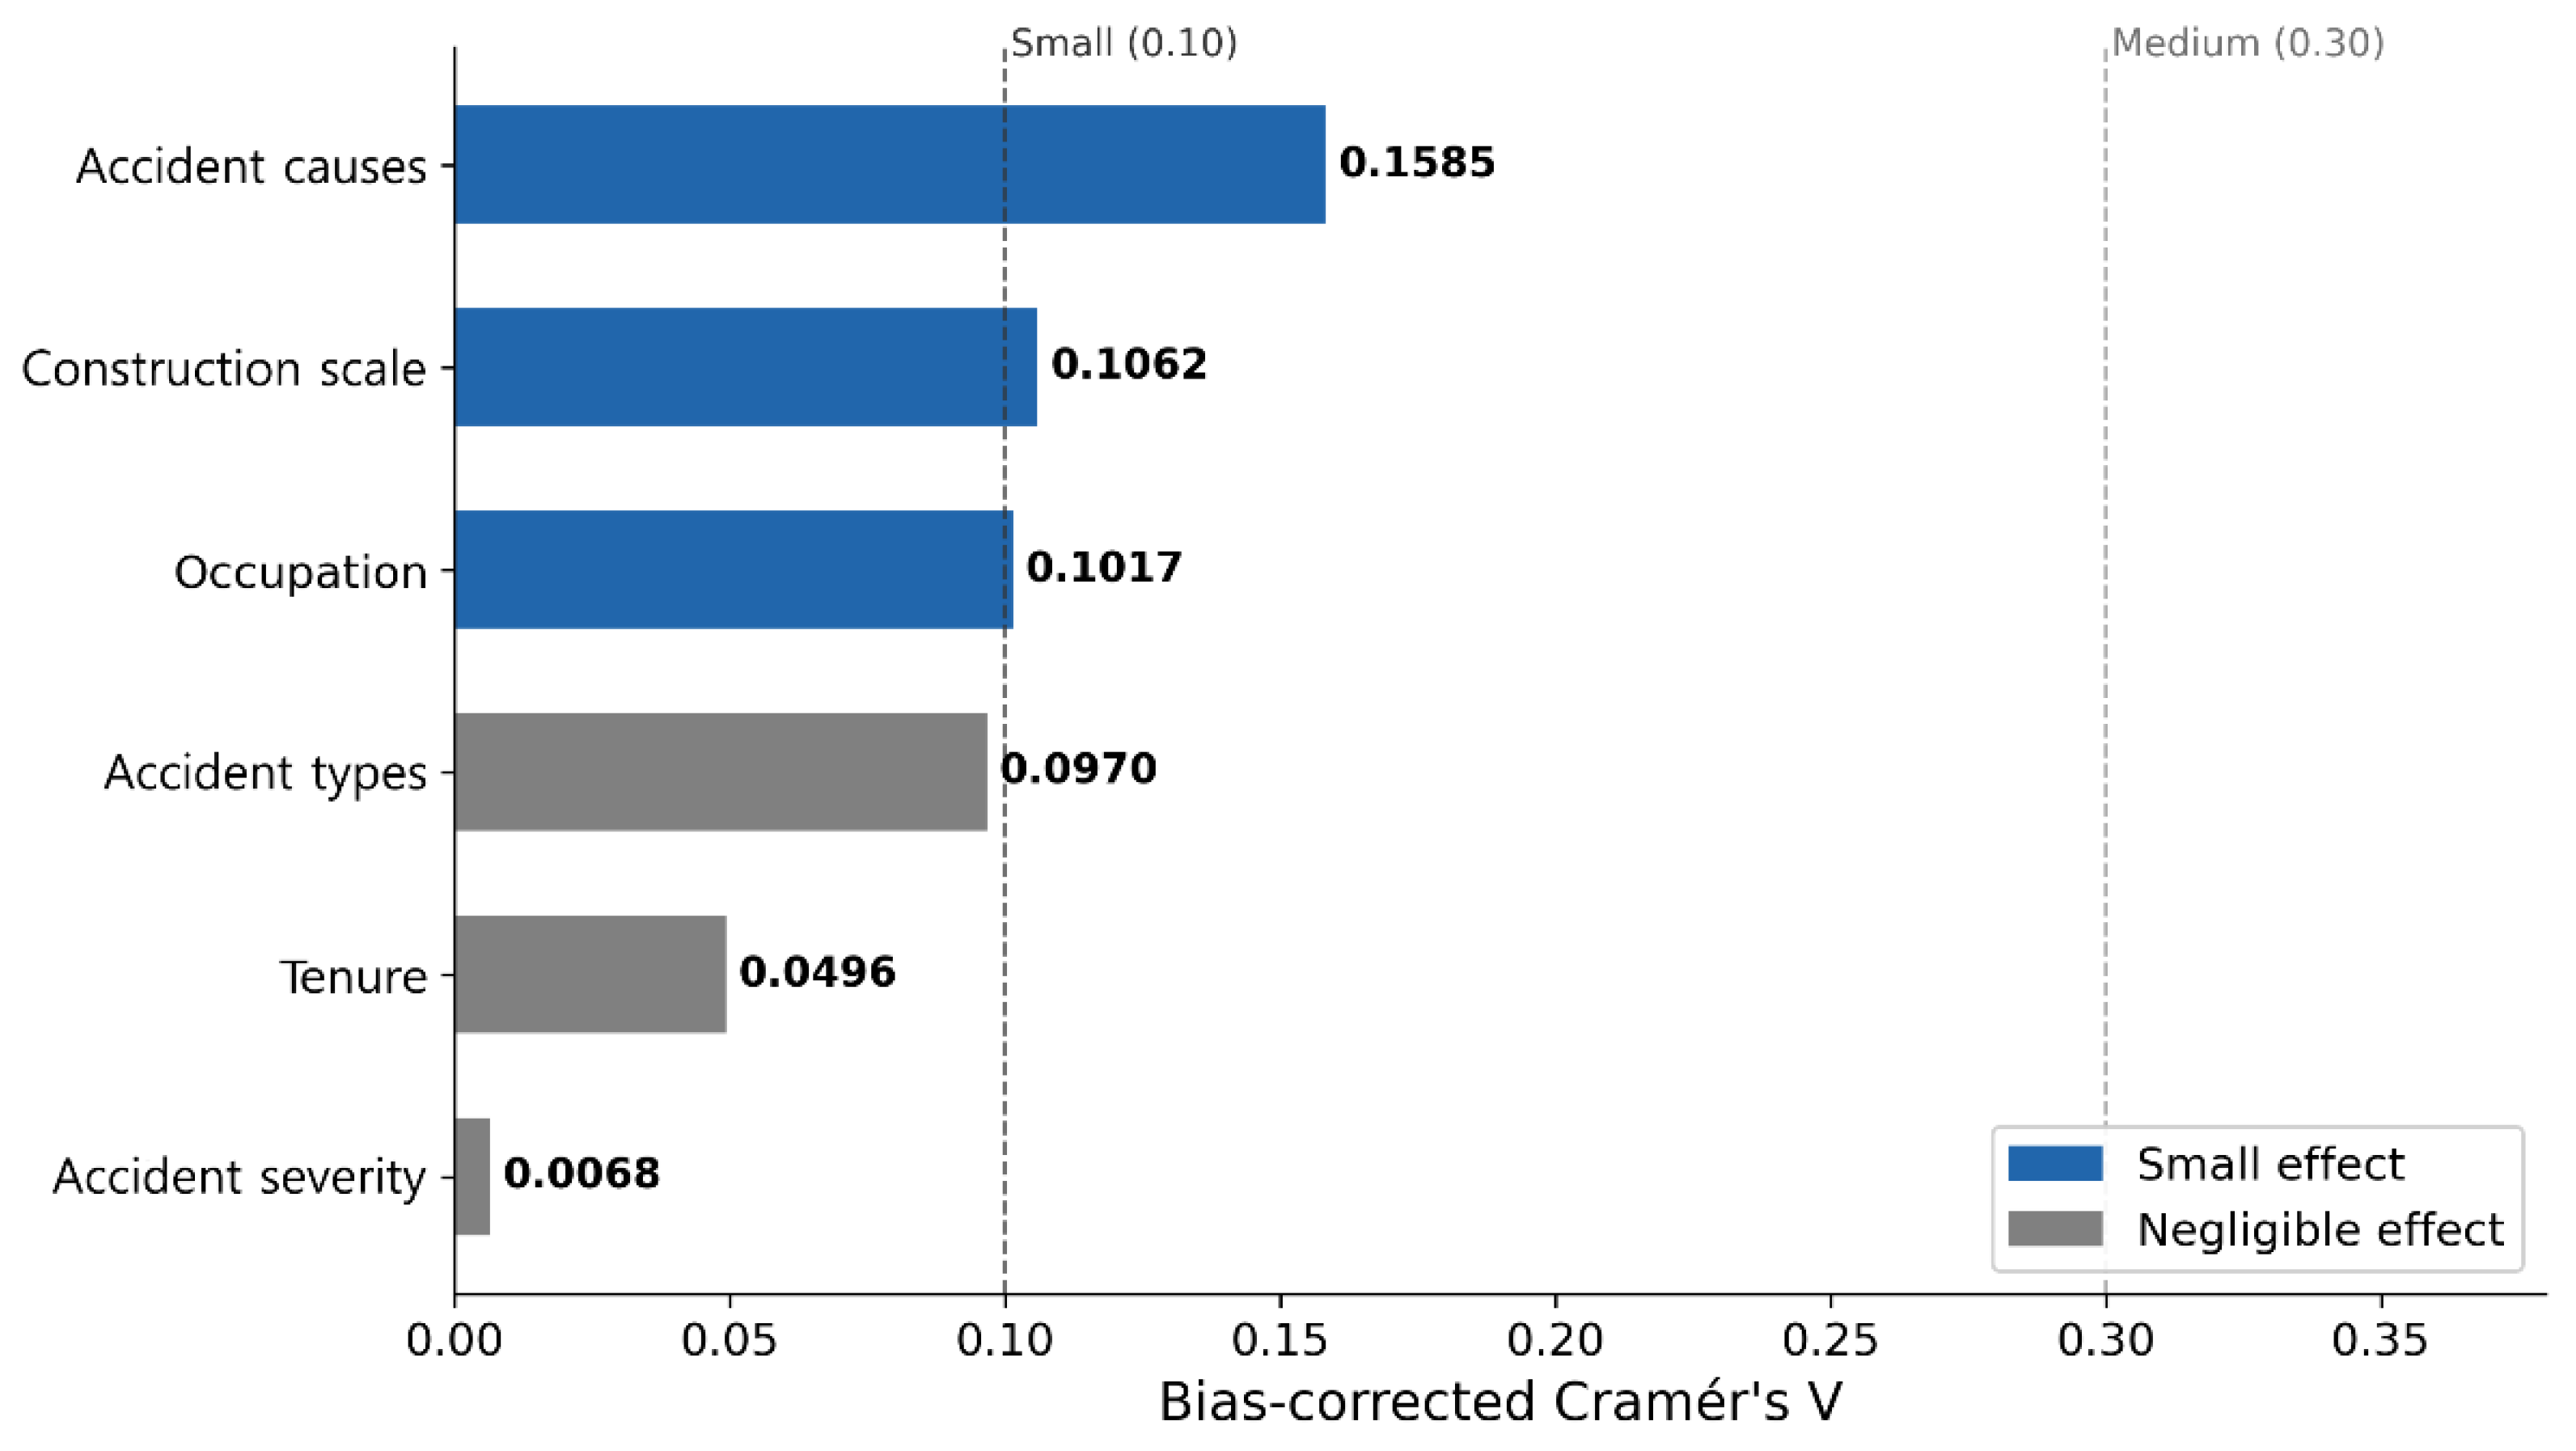
The chi-square test results indicated that all six variables were significantly associated with project ownership under the Bonferroni-corrected significance level (
αadj = 0.00833) (
Table 6). According to the bias-corrected Cramér’s
V, the effect sizes decreased in the following order: accident cause (
V = 0.1585, small), construction scale (
V = 0.1062, small), occupation (
V = 0.1017, small), accident type (
V = 0.0970, negligible), tenure (
V = 0.0496, negligible), and accident severity (
V = 0.0068, negligible) (
Figure 5).
Accident cause, construction scale, and occupation exhibited effect sizes of small or greater, confirming that they had the strongest associations with project ownership. In contrast, although accident severity was statistically significant, its effect size was negligible, indicating that differences in fatal and nonfatal injury proportions between public and private projects were minimal.
In summary, the descriptive statistics and chi-square tests reveal two overarching patterns. First, all six variables showed statistically significant associations with project ownership (p < 0.001 for all, well below the Bonferroni-adjusted α = 0.00833), confirming that accident characteristics systematically differ between public and private projects. Second, the effect sizes measured by Cramér’s V indicate that Accident Causes (V = 0.1585), Construction Scale (V = 0.1062), and Occupation (V = 0.1017) exhibit small but meaningful associations, while Accident Severity (V = 0.0068) shows a negligible effect, suggesting that the public–private difference in fatality rates is statistically significant but practically minimal.
4.3. Accident Characteristics by Project Ownership
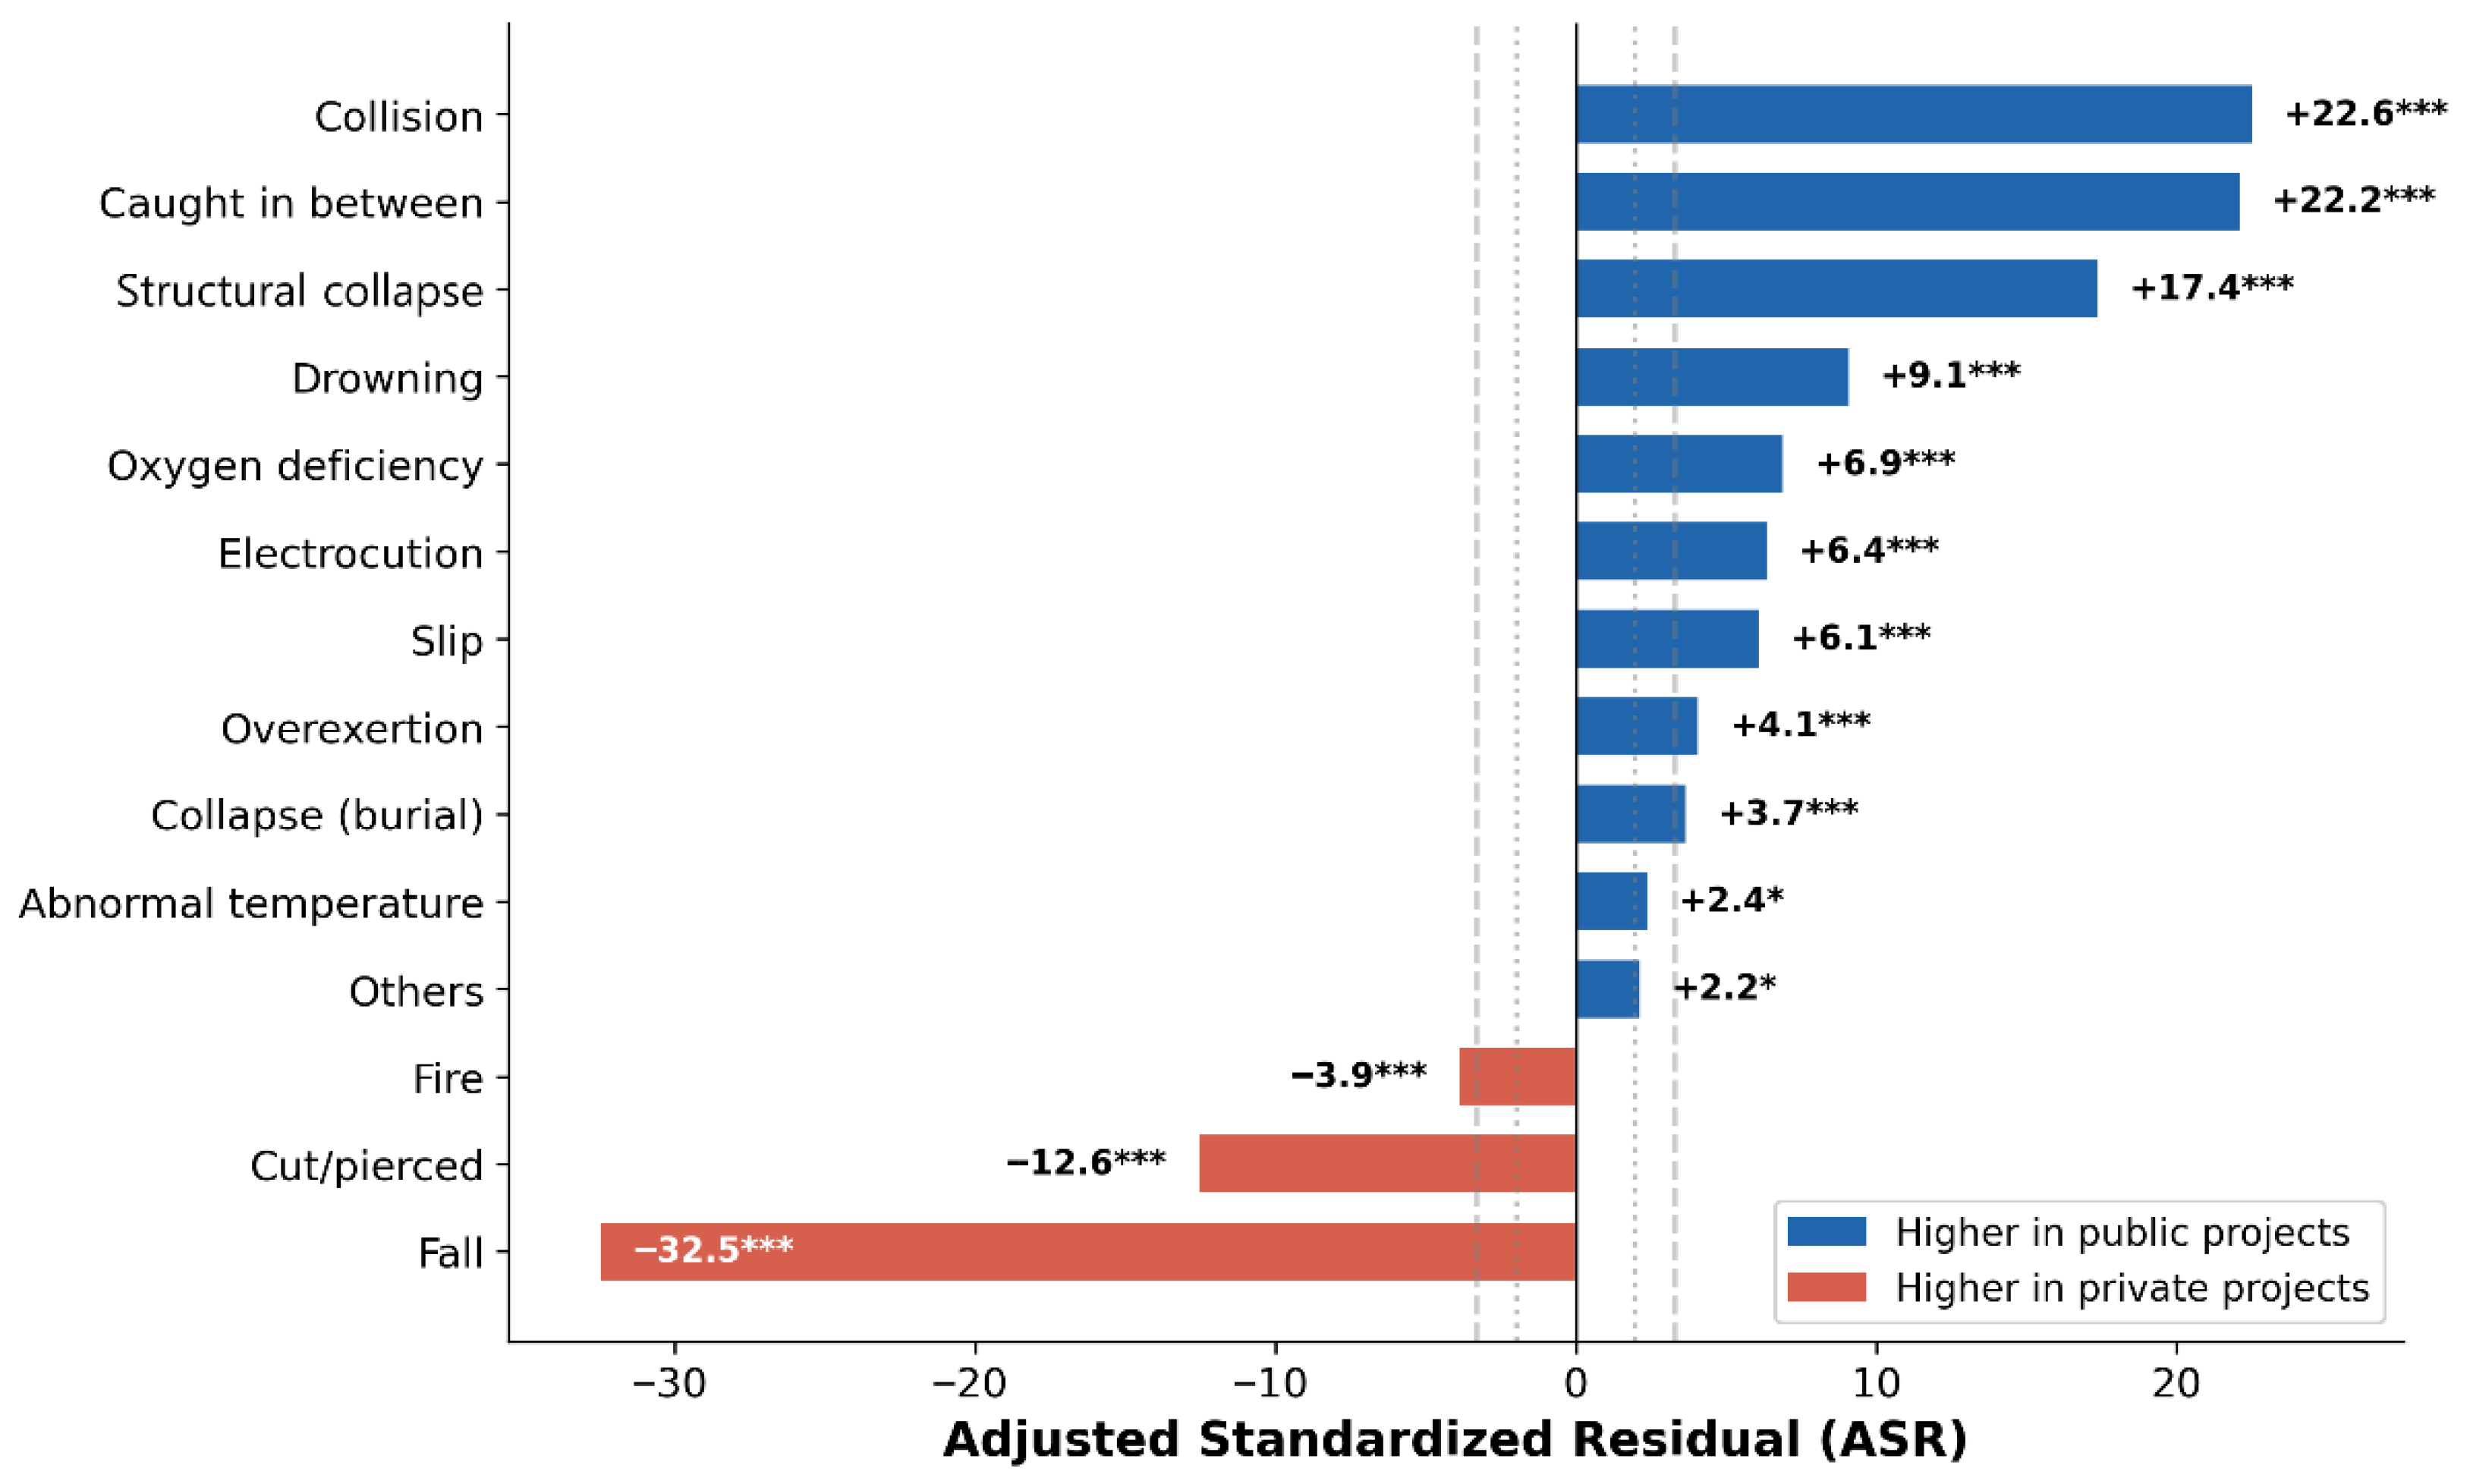
In the
ASR analysis of accident types, falls exhibited the most pronounced difference, with a substantially higher proportion than expected in private projects (
Table 7,
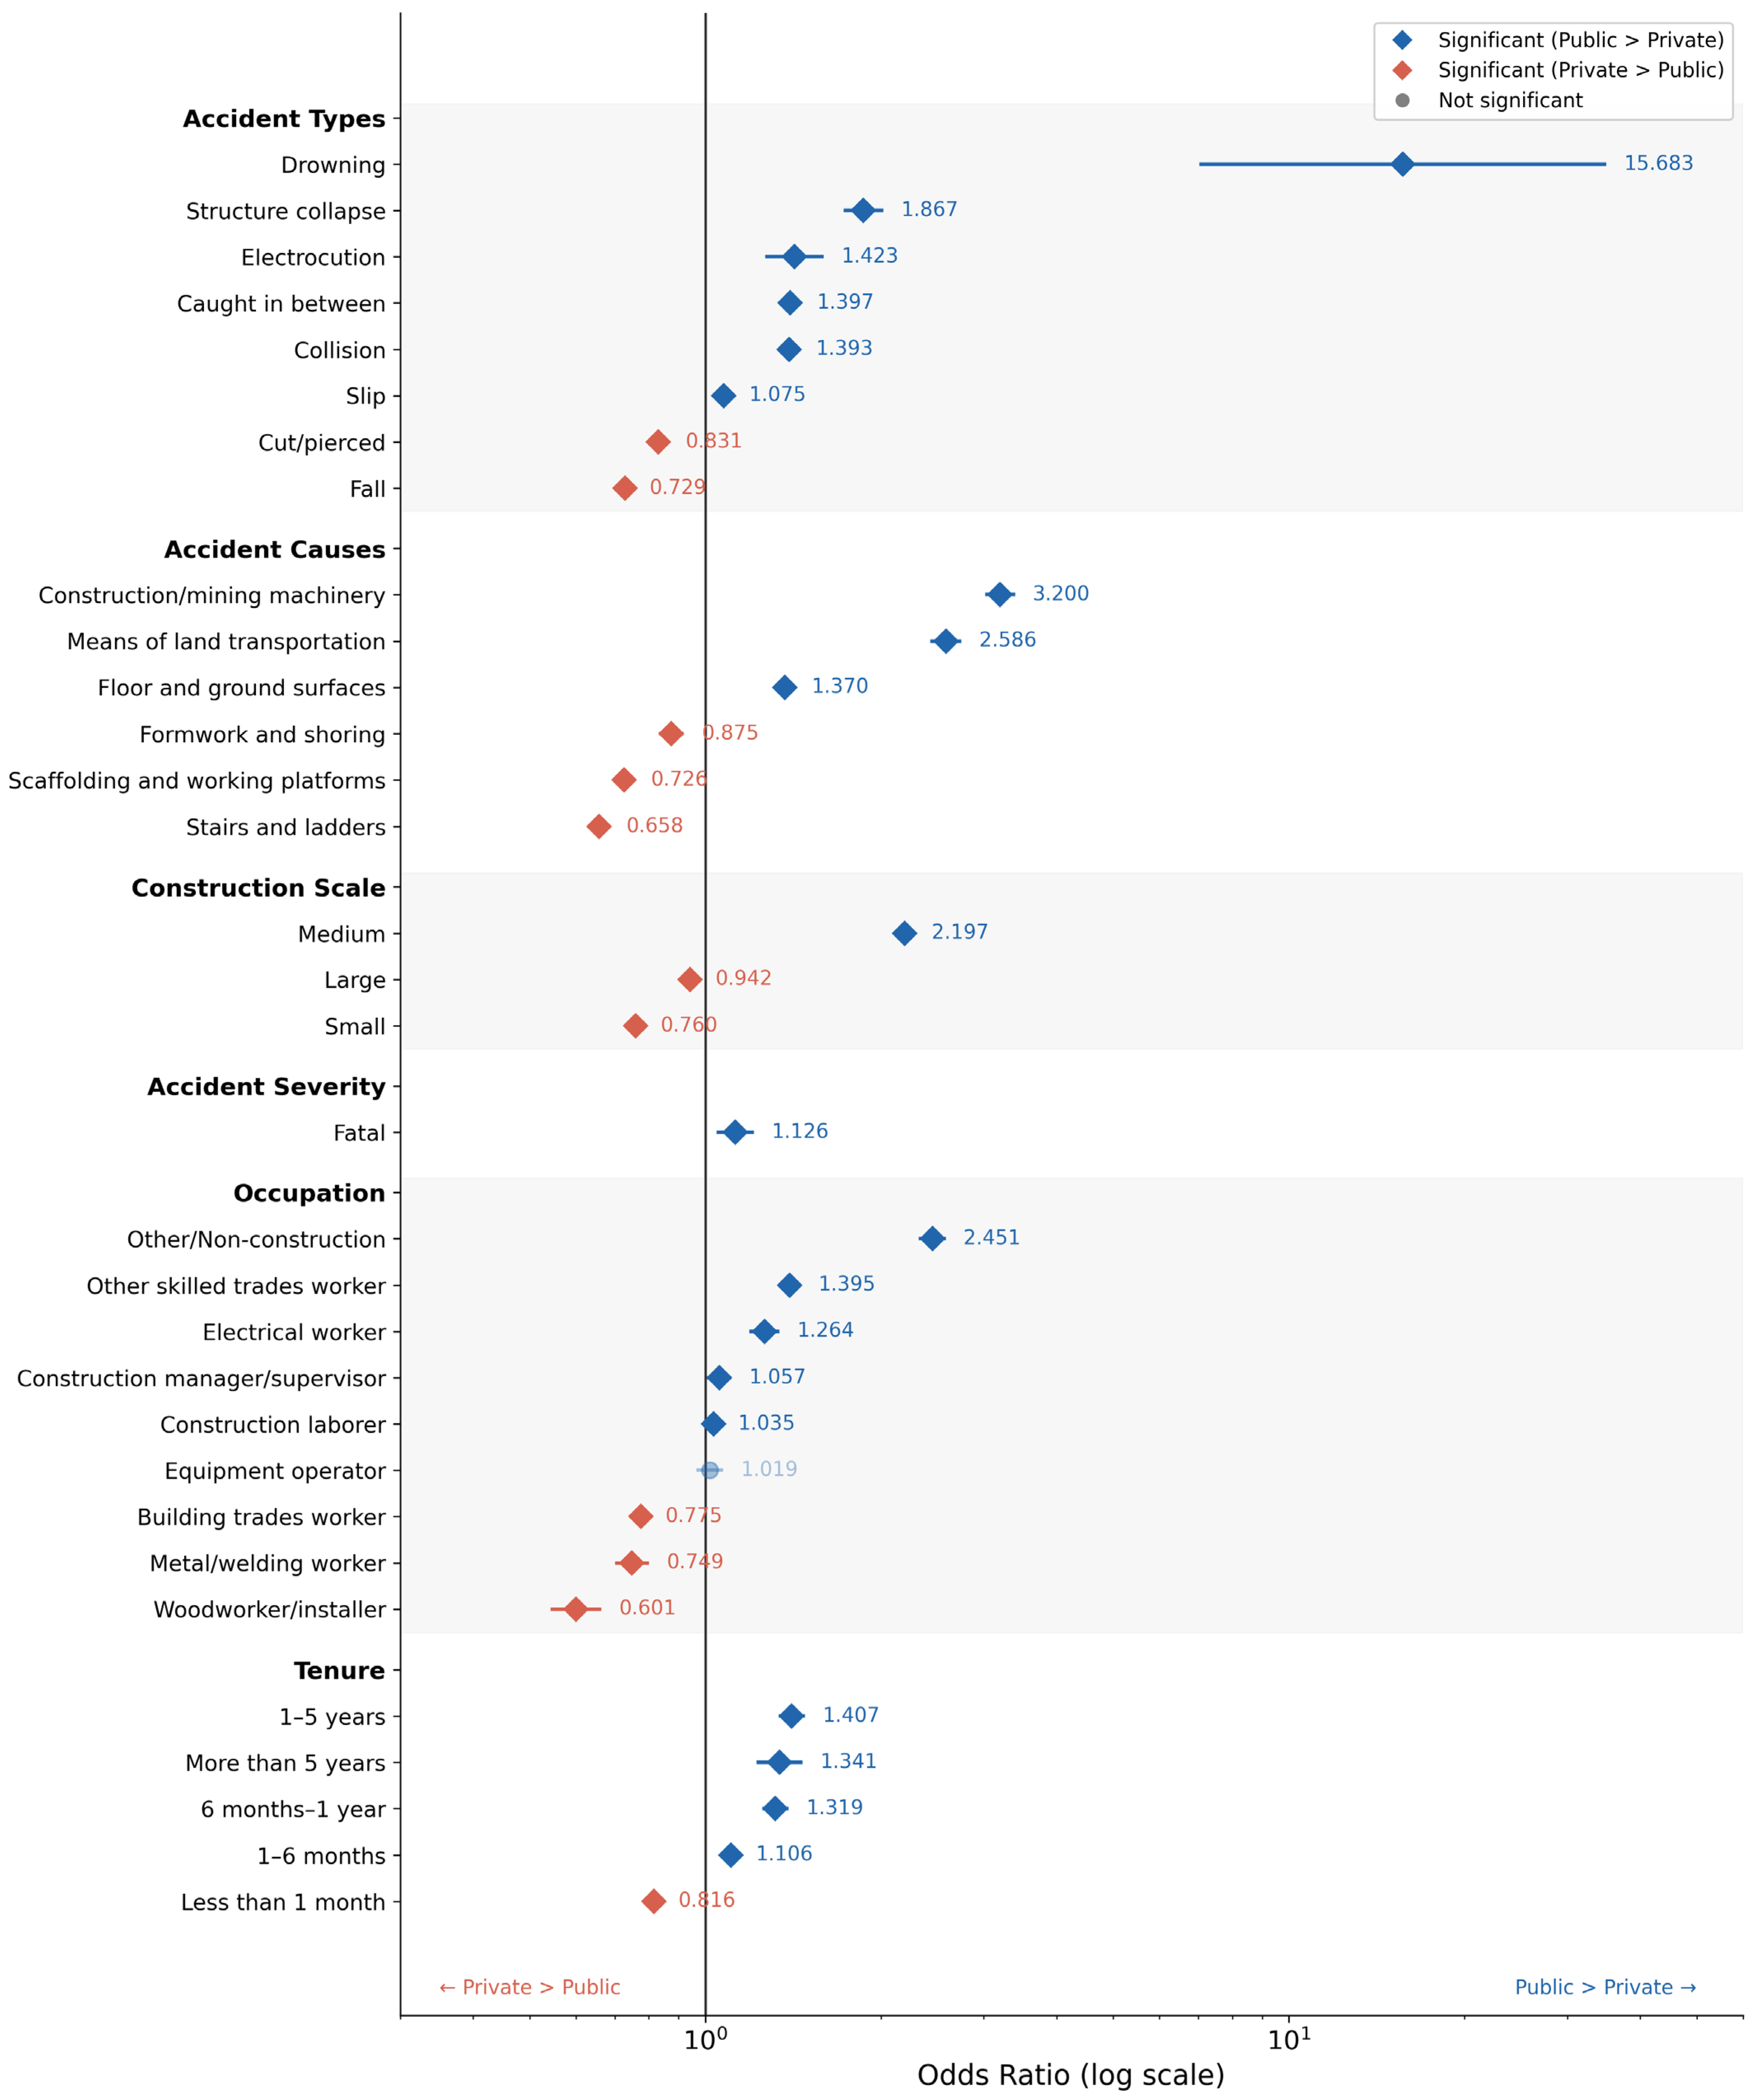
Figure 6). In contrast, collision, caught-in-between, and structural collapse accidents were significantly more prevalent in public projects. In the
OR analysis, drowning and oxygen deficiency exhibited high
ORs in public projects, and structural collapse and collision were also significantly higher in public projects (
Table 8). Falls and cut/pierced injuries were more likely to occur in private projects. The higher proportion of fall accidents in private projects is consistent with the predominance of building construction activities involving elevated work on scaffolding and temporary structures.
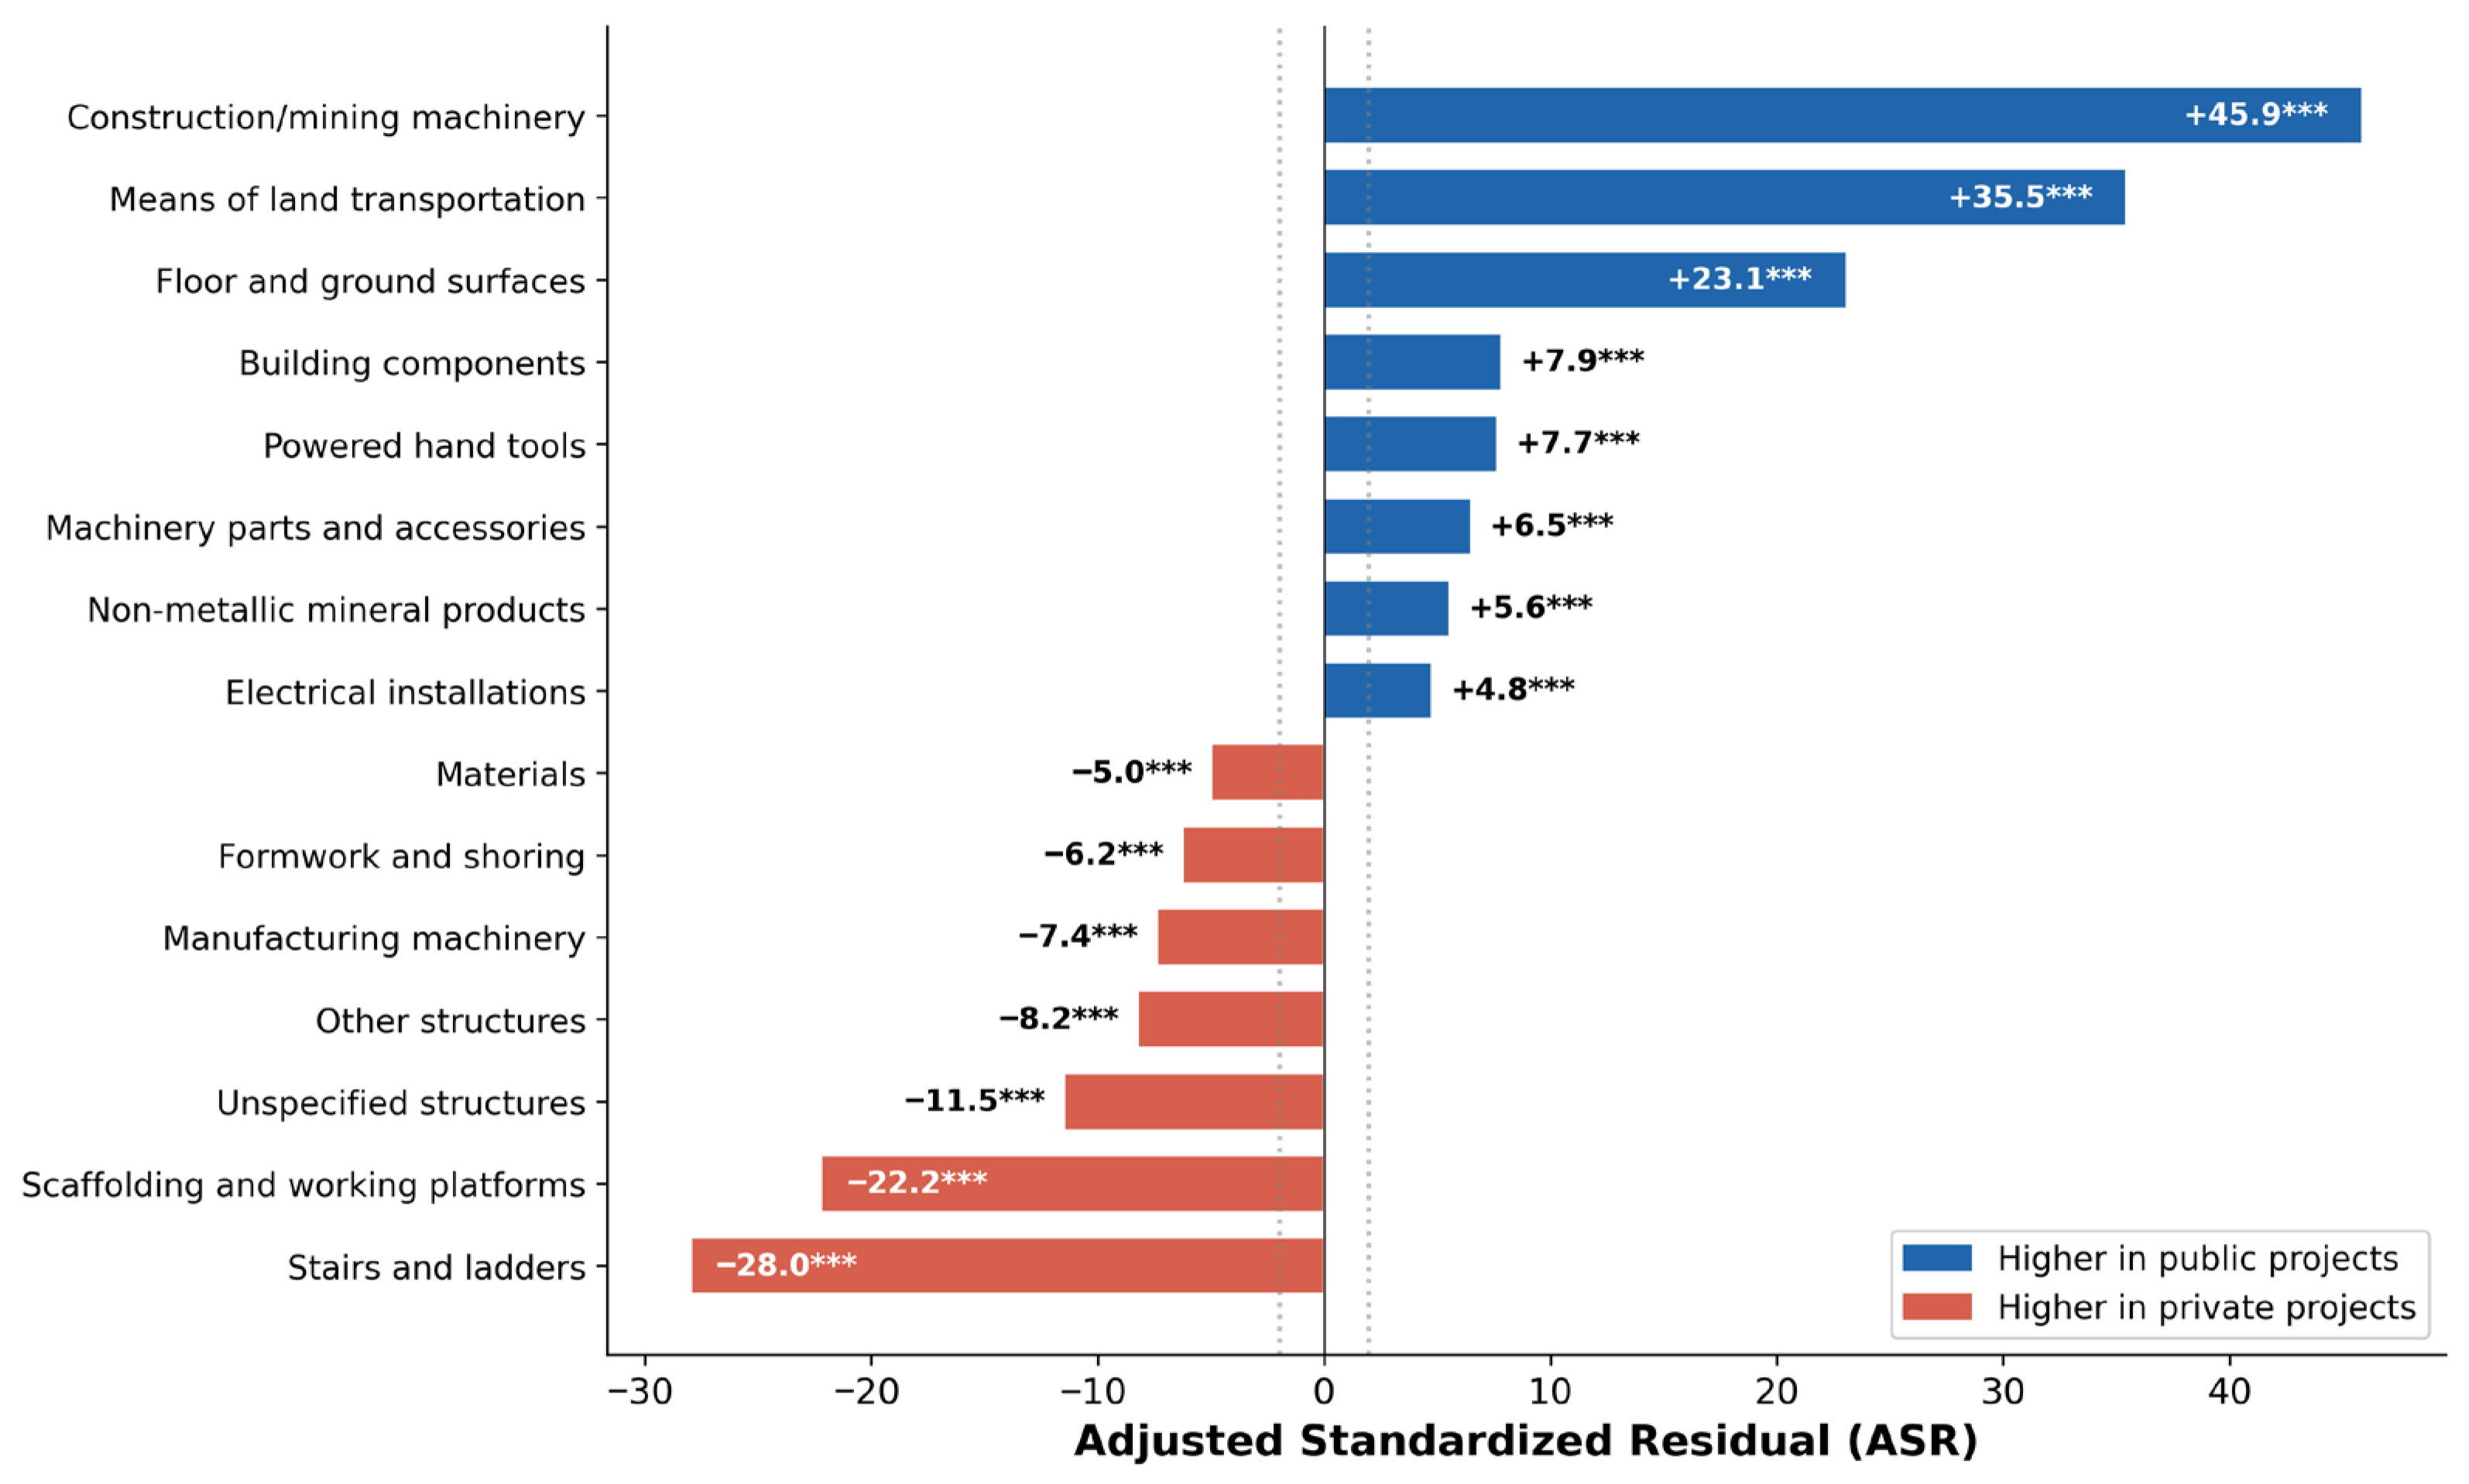
In the
ASR analysis of accident causes, construction/mining machinery and means of land transportation exhibited large positive residuals in public projects (
Table 9 and
Figure 7). In contrast, stairs and ladders and scaffolding and working platforms exhibited significantly larger residuals in private projects. In the
OR analysis, construction/mining machinery (
OR = 3.201) and means of land transportation (
OR = 2.586) exhibited the highest
ORs in public projects (
Table 10), whereas stairs and ladders (
OR = 0.658) and scaffolding and working platforms (
OR = 0.726) were more likely to occur in private projects. This elevated risk of machinery-related accidents in public projects likely reflects the higher proportion of large-scale civil engineering works (roads, bridges, dams) that require intensive use of heavy construction machinery.
In the construction scale analysis, medium-scale category (KRW 5–12 billion) exhibited the largest positive residuals in public projects, whereas the small-scale category (<KRW 5 billion) exhibited significantly larger residuals in private projects (
Table 11,
Figure 8). In the
OR analysis, the medium-scale category (
OR = 2.197) had the highest
OR in public projects, whereas the small-scale (
OR = 0.760) and large-scale (
OR = 0.942) categories accounted for a higher proportion in private projects.
Regarding accident severity, the
OR for fatal injuries was 1.126 (95%
CI, [1.05–1.20]), which was statistically significant. However, given the negligible effect size (Cramér’s
V = 0.0068), the substantive difference was minimal (
Figure 9).
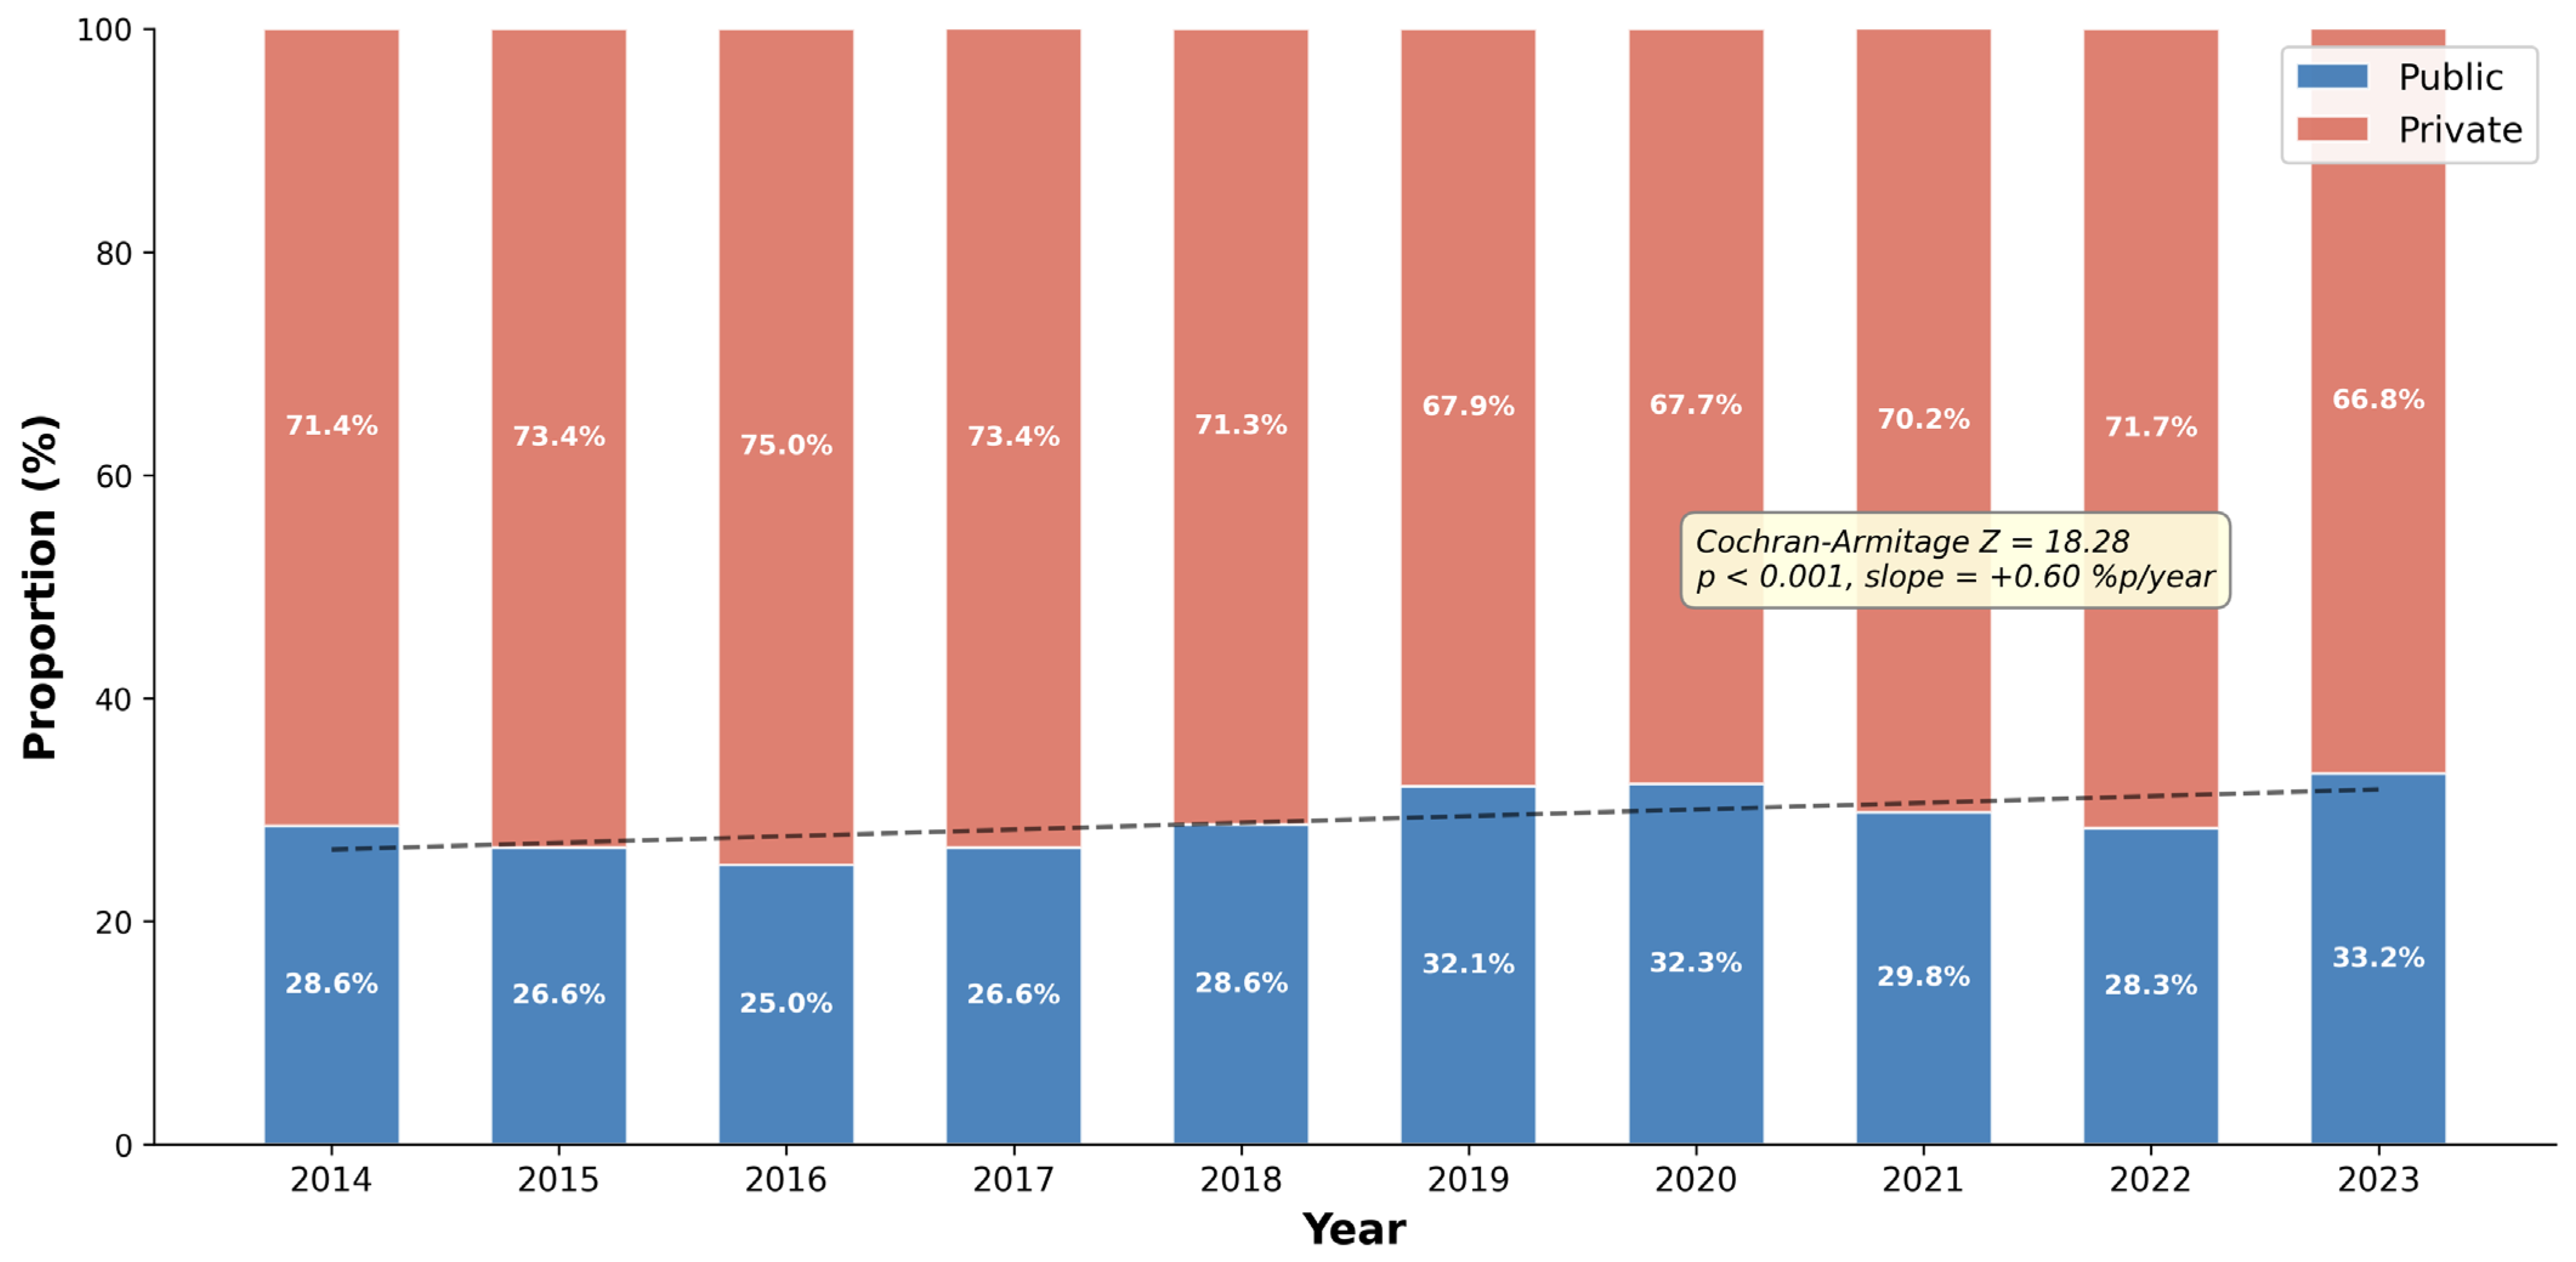
An analysis of temporal changes in the proportion of public projects from 2014 to 2023 indicated a significant increasing trend based on the Cochran–Armitage test (
Z = 18.28,
p < 0.001;
Table 12 and
Figure 10). The estimated annual increase was 0.60 percentage points per year, with the proportion rising from 28.57% in 2014 to 33.24% in 2023 (an increase of approximately 5 percentage points). The Mann–Kendall test likewise indicated a significant monotonic increasing trend (τ = 0.511,
p = 0.047). It should be noted that the observed increasing trend in the proportion of public project accidents may be influenced by macroeconomic factors such as government SOC (Social Overhead Capital) budget fluctuations, private construction market cycles, and the COVID-19 pandemic (2020–2021), which temporarily increased public infrastructure investment. The non-monotonic pattern visible in
Figure 10—particularly the decline in 2015–2016 and the peak in 2020–2021—suggests that these external factors may play a significant role.
4.4. Worker Characteristics by Project Ownership
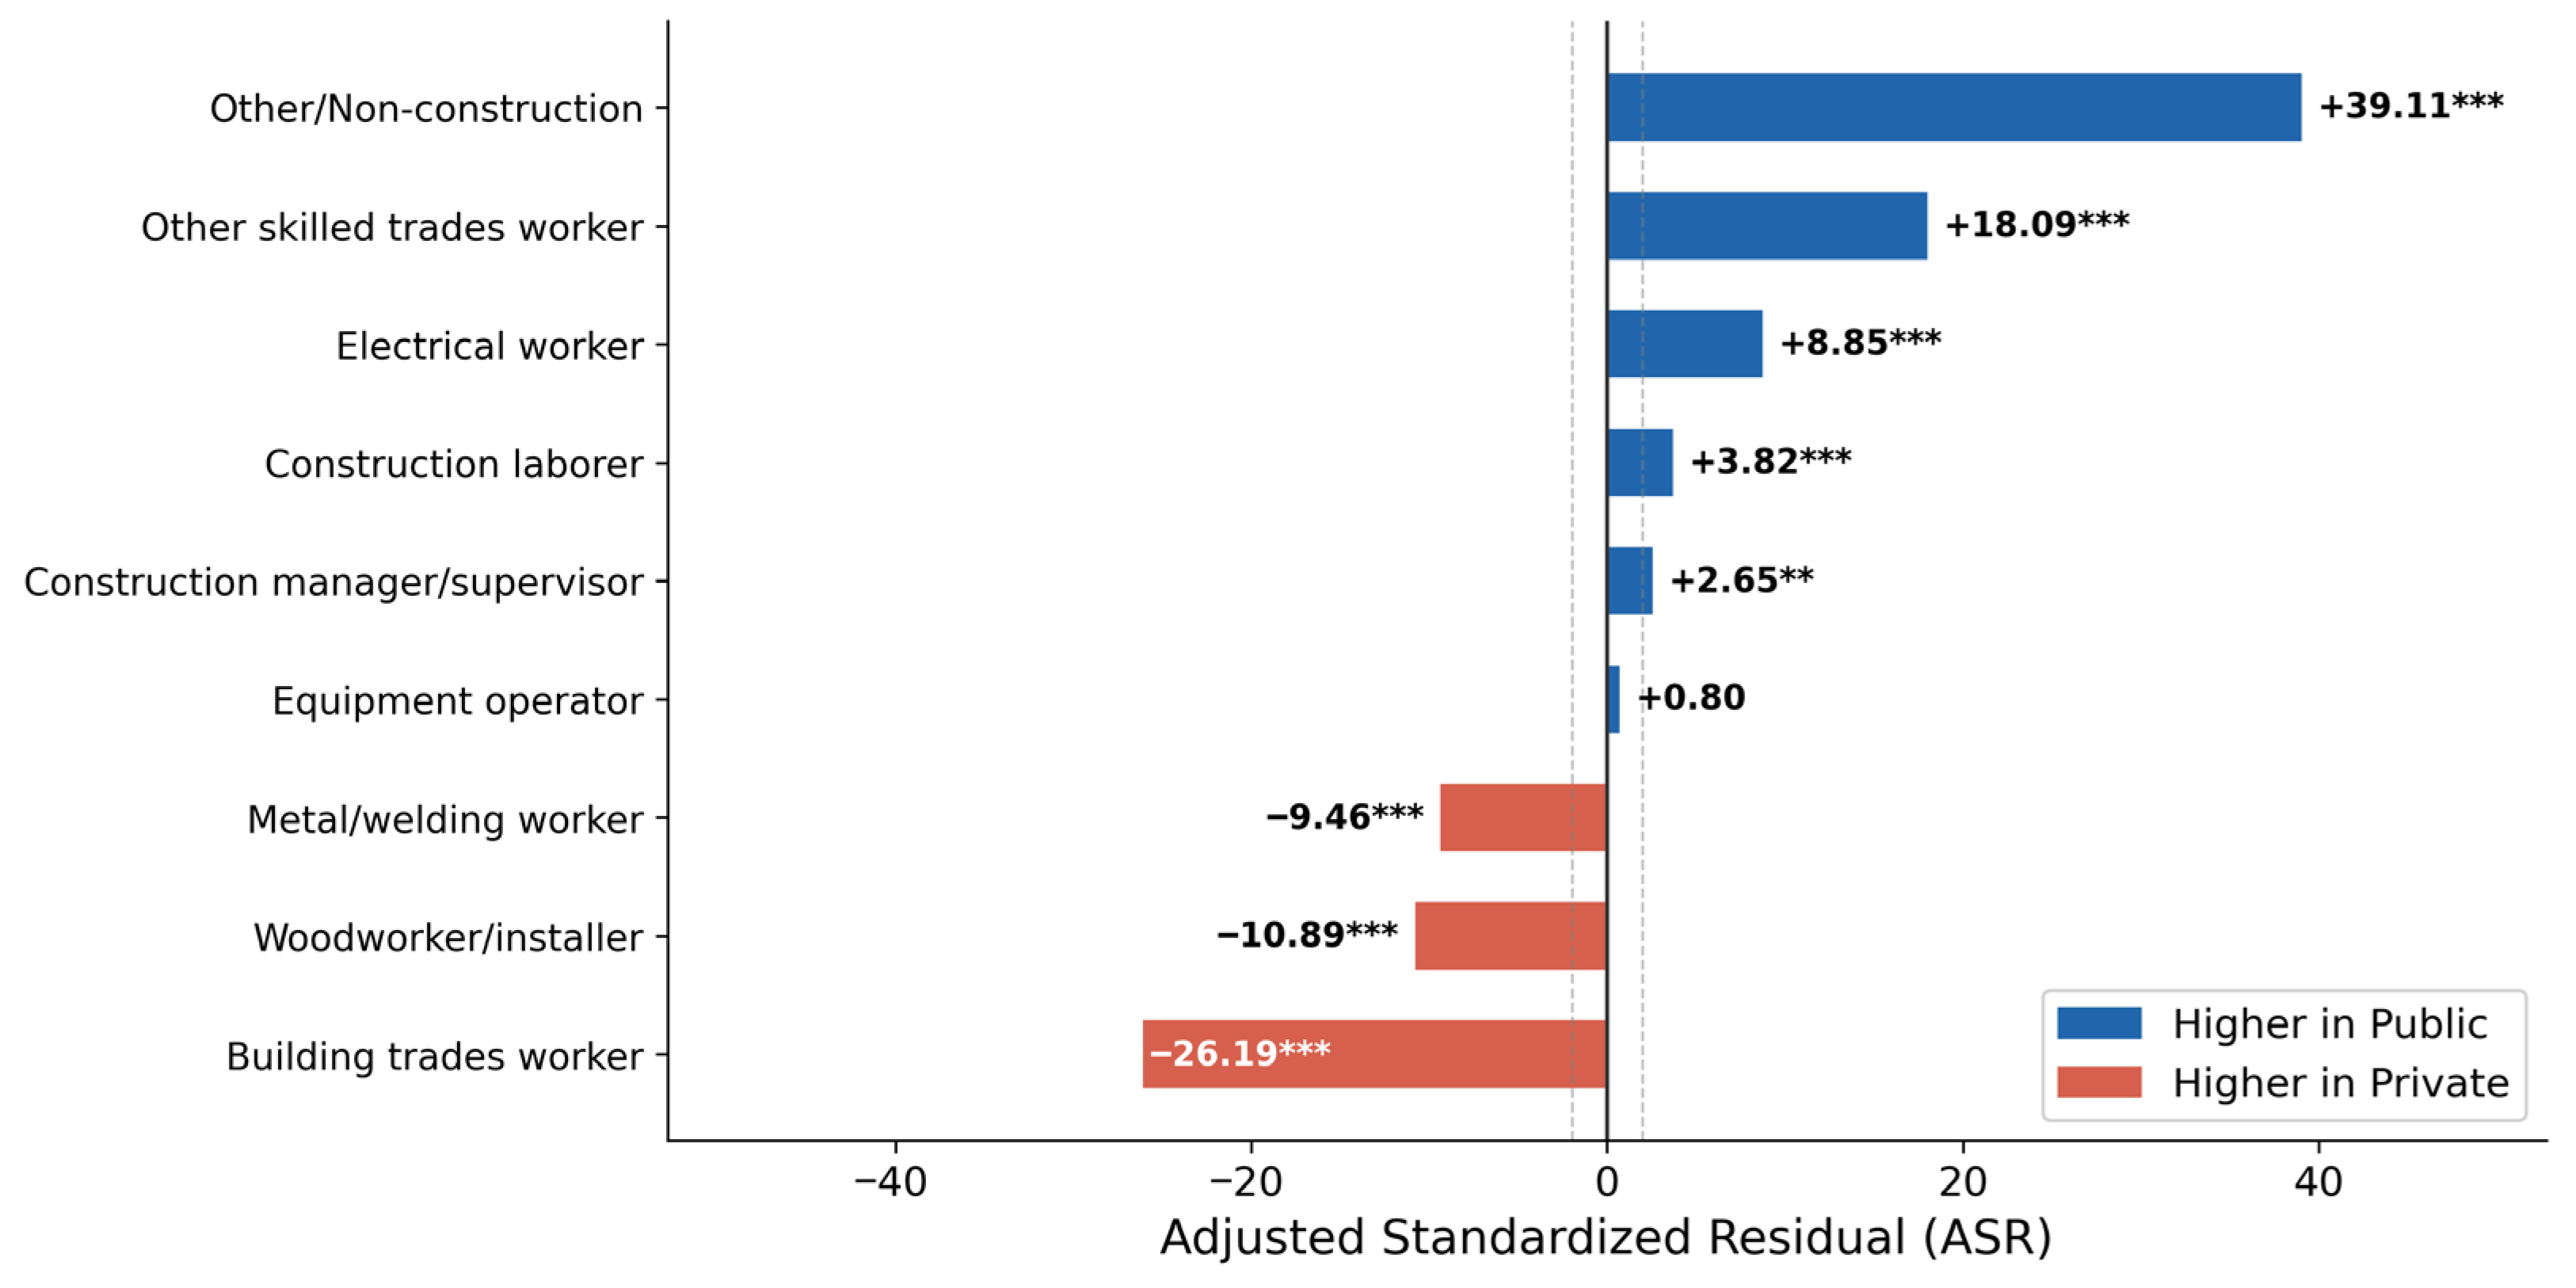
In the
ASR analysis of the nine occupation categories, other/non-construction exhibited the largest positive residual in public projects, followed by other skilled trades workers and electrical workers (
Table 13,
Figure 11). In private projects, building trades workers exhibited the largest positive residuals, reflecting the high demand for finishing work, such as masonry, plastering, waterproofing, and painting. In the
OR analysis, woodworkers/installers (
OR = 0.601) and metal/welding workers (
OR = 0.749) were significantly more prevalent in private projects. Equipment operators exhibited no significant difference between project ownership types (
OR = 1.019, 95%
CI [0.973–1.066]).
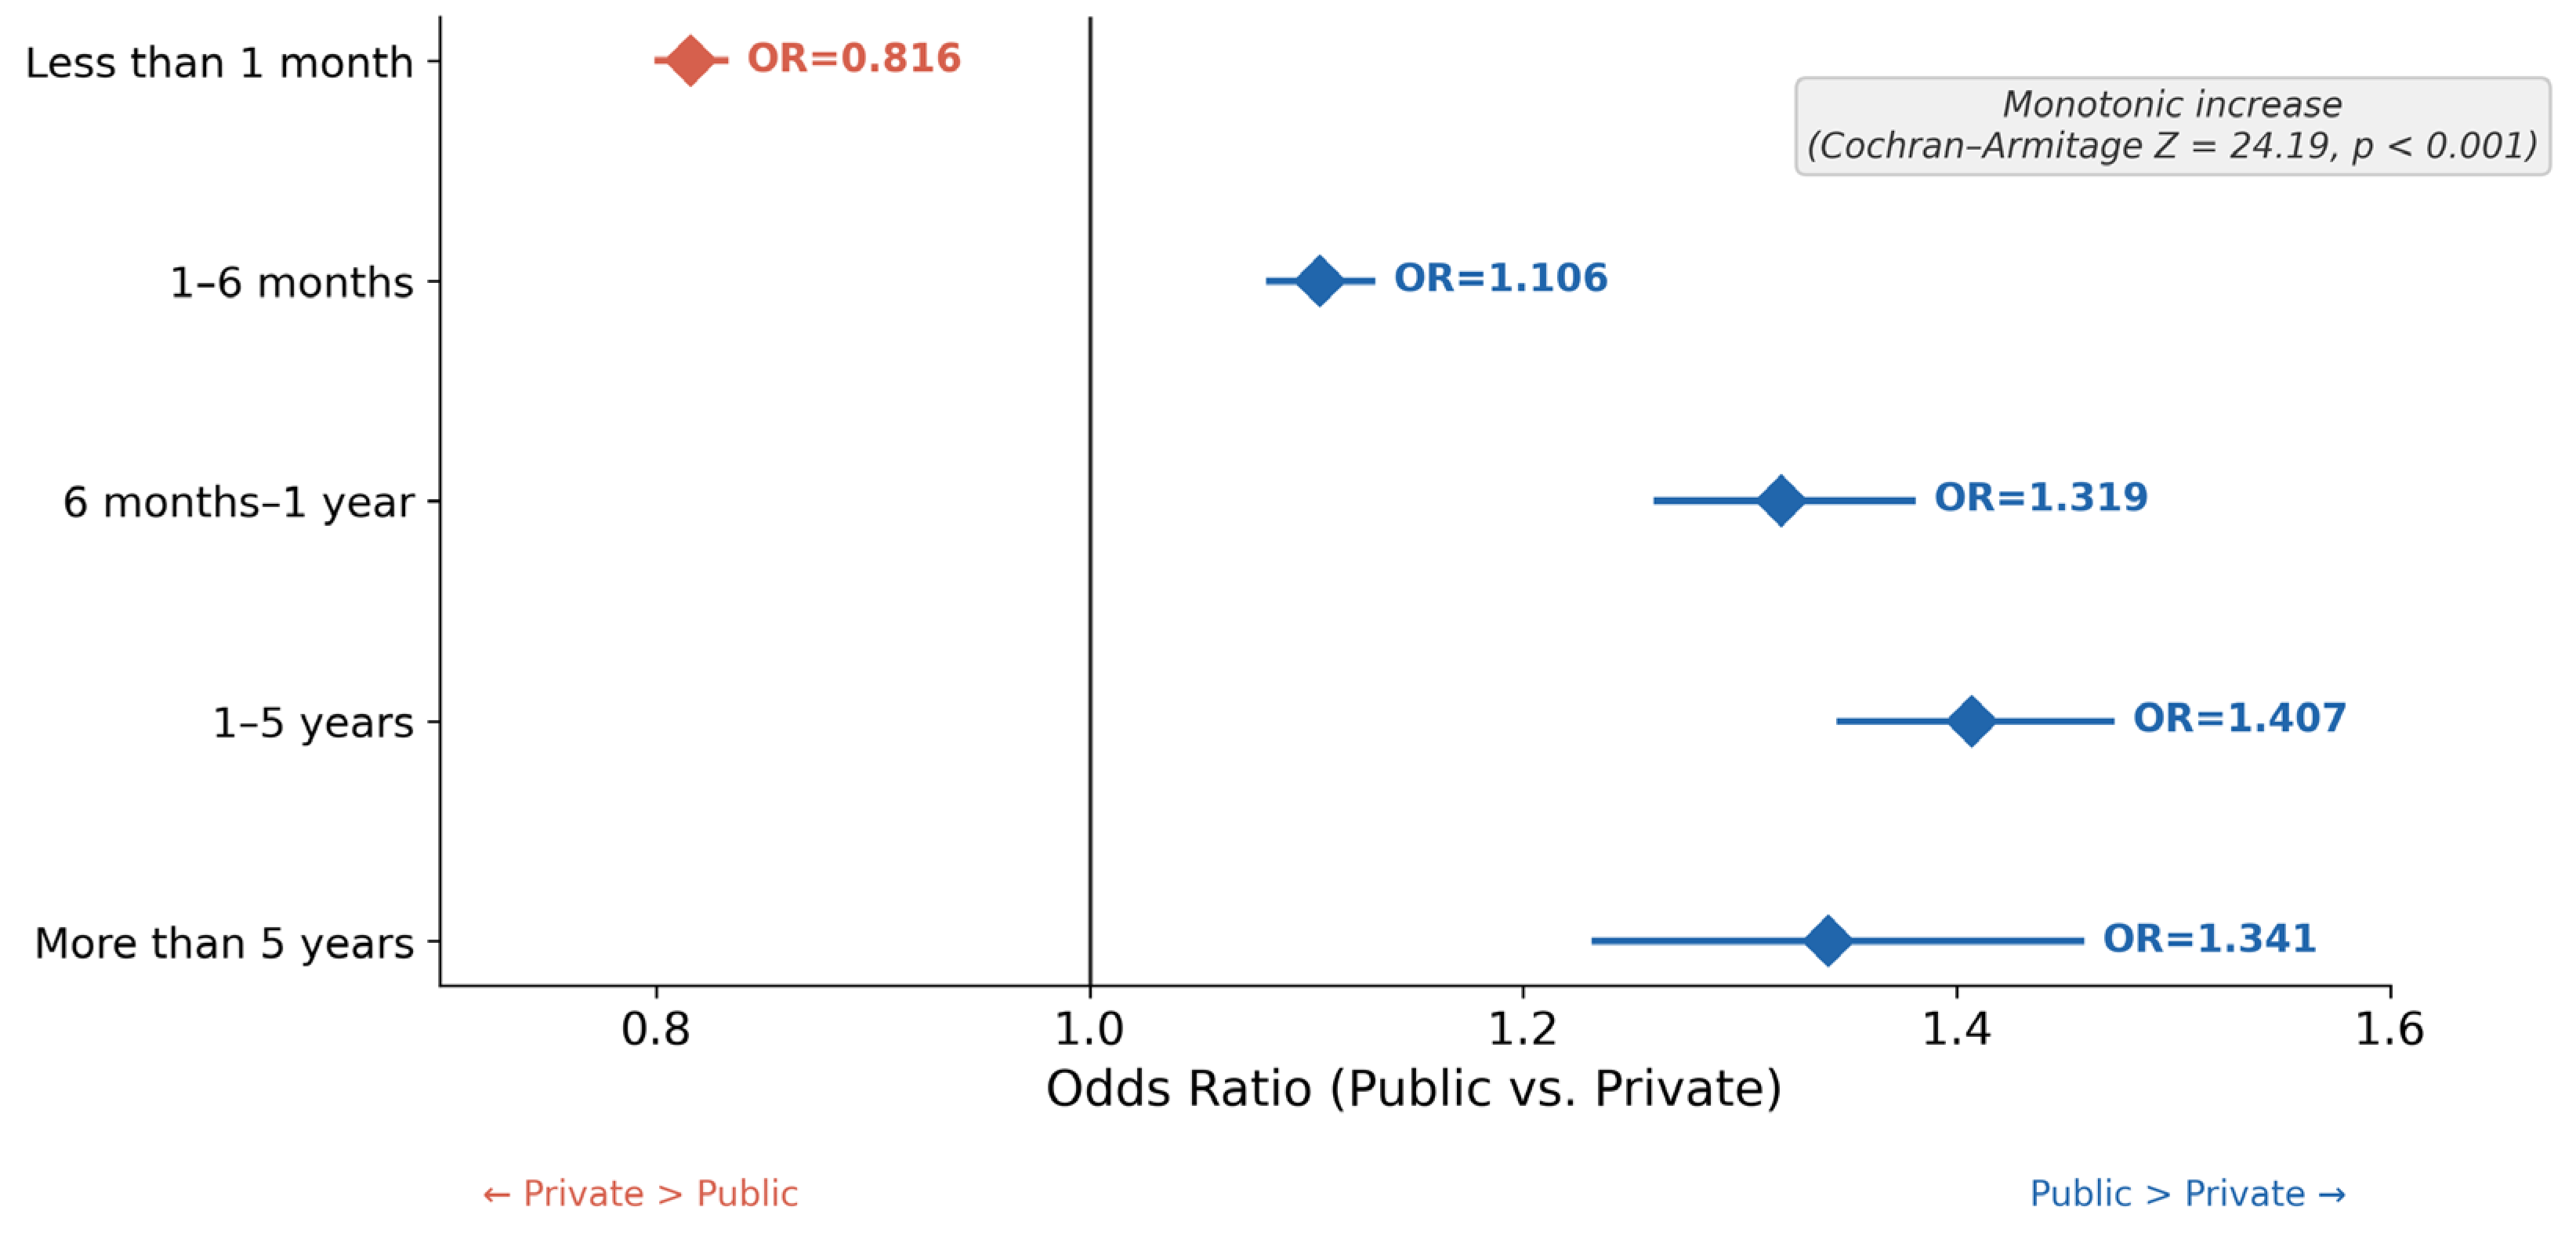
In the
ASR analysis of the five tenure categories, less than one month exhibited the strongest skew toward private projects, whereas the proportion of public projects was significantly higher in all categories of one month or more (
Table 14). The
OR exhibited a monotonic increasing trend with longer tenure, rising from 0.816 (less than one month) to 1.407 (one to five years) (
Figure 12). For more than five years, the
OR decreased slightly to 1.341 but remained significantly higher in public projects than in private projects. The Cochran–Armitage trend test indicated a statistically significant monotonic increase in the proportion of public projects with longer tenure (
Z = 24.19,
p < 0.001;
Table 15). The monotonically increasing public-project proportion with longer tenure may reflect the relatively longer employment duration typical of large-scale civil engineering projects and the higher proportion of experienced equipment operators in public works.
In the occupation × project ownership analysis stratified by construction scale, the small-scale segment (= 1423.37, V = 0.0896) exhibited the largest effect size, indicating that the differences in occupation composition by project ownership were most pronounced in small-scale projects. In the fatality rate analysis by occupation, equipment operators exhibited the highest fatality rate in both public (3.891%) and private projects (2.490%), and their public/private fatality rate ratio was also the highest (1.563). The fatality rate increased with tenure, from 1.54% (less than 1 month) to 3.37% (more than 5 years).
5. Discussion
5.1. Classification Model Performance and Methodological Significance
The marked performance improvement achieved by the fine-tuned KLUE-BERT model over the rule-based model originates from the fundamental differences between the two approaches. The rule-based model relies entirely on a predefined keyword list and therefore cannot capture public institution names not included in the list or modified institution names, resulting in frequent misclassifications due to private company names containing public keywords (e.g., names in the format of “OO Construction”). In contrast, the fine-tuned KLUE-BERT model can comprehensively evaluate the contextual meanings of the three text fields based on the Korean semantic representations learned during pretraining. This is consistent with the findings of Kumi et al. [
31], who reported that fine-tuning pretrained language models is effective for domain-specific texts.
The methodological significance of this study lies in extending the use of the NLP model beyond a simple classification tool to a framework that automatically generates analytical variables absent from the source data. While existing construction safety NLP research has focused on the automatic classification of variables already present in source data [
16,
21,
25,
29,
31], this study inferred and generated variables not recorded in the database from unstructured text and utilized them as key independent variables in large-scale statistical analysis. This approach is not limited to construction accident data and can be applied to various industrial databases in which the variables required for analysis are absent from the source data.
5.2. Structural Differences in Accident Characteristics by Project Ownership and Novel Findings
The statistical analysis results confirmed the structural differences in accident occurrence characteristics between public and private projects across all six variables and identified several novel patterns that have not been reported in previous studies.
In the accident type and accident cause analyses, construction machinery-(
OR = 3.20) and transportation-related (
OR = 2.59) accidents were concentrated in public projects, whereas fall-(
OR = 0.73) and scaffolding-related (
OR = 0.73) accidents were concentrated in private projects. This reflected differences in work types between the two project ownership categories. Cheng et al. [
12] found qualitative differences in accident patterns by project ownership through association rule mining but did not quantify the differences using
ORs. The present study is the first to precisely quantify the risk ratios between project ownership types for each accident type and accident cause from a large-scale dataset of 245,998 records. In particular, the
OR of 15.68 for drowning demonstrates that the risk of waterside work (river maintenance, dam construction, port construction, etc.) is significantly higher in public projects than in private projects, underscoring the need for specialized safety protocols for waterside infrastructure work.
A notable finding in the construction scale analysis was that the
OR of 2.197 for the medium-scale category (KRW 5–12 billion) was substantially higher than the
OR of 0.942 for the large-scale category (KRW 12 billion or more). Korea’s Occupational Safety and Health Act mandates the appointment of a safety manager for construction sites with a construction cost of KRW 5 billion or more and requires a dedicated safety manager for KRW 12 billion or more. The extreme concentration of public projects at the medium scale suggests that mandatory safety-manager appointments are implemented more strictly in public projects. Empirical evidence that the compliance level of safety management regulations varies according to project ownership has not been reported in previous studies; thus, our work provides a new perspective for evaluating regulatory effectiveness. Cheng et al. [
13], who analyzed the accident characteristics of small construction enterprises, also confirmed the interaction between construction scale and project ownership; however, no study has interpreted this from the perspective of regulatory thresholds.
In the occupation analysis, despite equipment operator being the only occupation with no significant proportional difference between project ownership types (
OR = 1.019, 95%
CI [0.973–1.066]), it exhibited the highest fatality rate in both public projects (3.89%) and private projects (2.49%). This suggests that heavy equipment work constitutes a universal risk factor transcending regulatory differences by project ownership, consistent with the findings of Dong et al. [
42] and Halabi et al. [
43]. However, the coexistence of proportional homogeneity and the highest fatality rates across ownership types was identified for the first time in the present study. The skewness of building trades workers toward private projects (
OR = 0.775) reflects the demand for finishing work in private building construction and suggests a structural association with fall accidents in private projects.
The tenure analysis revealed a pattern in which the proportion of public projects monotonically increased with longer tenure, with
ORs of 0.816 (less than one month), 1.106 (one to six months), 1.319 (six months to one year), 1.407 (one to five years), and 1.341 (more than five years) (Cochran–Armitage
Z = 24.19,
p < 0.001). This monotonic trend between project ownership and tenure is a novel finding that has not been reported in previous studies and may reflect the dual labor market structure of the construction industry, characterized by the relatively longer-term employment tendency of public projects and the concentration of short-term employment in private projects. Cheng et al. [
12] reported that workers with less than one month of tenure have the highest accident risk; accordingly, the concentration of short-term workers in private projects is interpreted as a structural risk factor combined with fall accidents.
The chi-square test result for accident severity (χ2 = 12.38, p < 0.001) was statistically significant; however, with a bias-corrected Cramér’s V of 0.0068 (negligible), the substantive difference was minimal. This represents a case in which a discrepancy between statistical significance and substantive meaning emerged in a large-scale dataset of 245,998 records, empirically demonstrating the importance of effect-size interpretation in large-scale construction accident data analysis.
The above findings across individual variables are not independent but form coherent causal chains linking project ownership to accident patterns. Two primary pathways emerge. In public projects, the higher proportion of large-scale civil engineering works (roads, bridges, dams) leads to intensive deployment of construction machinery and transportation vehicles, resulting in elevated construction machinery-related accident causes (
OR = 3.20) and transportation-related causes (
OR = 2.59), which manifest as collapse/burial and caught-in-between accident types, with a correspondingly higher proportion of experienced equipment operators and longer-tenured workers. In private projects, the higher proportion of small-to-medium scale building construction leads to a predominance of finishing works by building trades workers (
OR = 0.78), resulting in elevated risks of falls from scaffolding and temporary structures, which manifest as fall-type accidents (
OR = 0.73) and scaffolding-related causes (
OR = 0.73), with a concentration of short-term, less experienced workers. The concentration of construction machinery-related accidents in road construction projects has also been reported by Bria et al. [
47]. Kazan and Usmen [
48] reported that earthmoving equipment accidents were associated with elevated injury severity, which is consistent with the high fatality rates observed among equipment operators in the present study. These pathways suggest that the differences in accident characteristics between public and private projects are structurally embedded in the fundamental differences in work type composition, rather than being attributable solely to regulatory differences. This integrated perspective aligns with and extends the findings of Cheng et al. [
12,
13], who identified qualitative differences in accident patterns by project ownership but did not systematically trace the mechanistic pathways linking ownership type to specific accident outcomes.
To examine whether the observed bivariate associations were confounded by year and construction scale, supplementary logistic regression analyses were conducted for five key outcome variables. The adjusted odds ratios (controlling for year and construction scale) were highly consistent with the crude odds ratios in both direction and magnitude: construction machinery (crude
OR = 3.20, adjusted
OR = 3.16), fall (0.73, 0.74), transportation (2.59, 2.57), scaffolding (0.73, 0.73), and collapse/burial (1.10, 1.09). All adjusted
ORs remained statistically significant (
p < 0.001), confirming that the bivariate associations are robust to potential confounding by temporal trends and project scale. While this exploratory analysis does not constitute a comprehensive multivariate model controlling for all potential confounders (see
Section 5.4), it provides evidence that the observed structural differences are not merely artifacts of year-specific or scale-related confounding.
5.3. Practical Implications
The results of this study have implications for the formulation of construction safety policies and on-site safety management.
In public projects, emphasis should be placed on the prevention of construction machinery- and transportation-related accidents. It is necessary to enhance construction machinery operator training, introduce contact prevention systems between machinery and workers, and ensure physical separation of work zones and equipment traffic zones. Additionally, considering the high OR of drowning, the provision of water safety equipment and the strengthening of waterside work safety protocols in waterside infrastructure projects are necessary. The concentration of construction machinery-related causes in public projects (OR = 3.20, 95% CI [3.04, 3.37]) provides quantitative justification for prioritizing machinery safety interventions in public project safety management plans.
In private projects, the prevention of fall accidents and strengthening of safety management systems for small-scale projects are required. Along with the installation of safety guardrails, fall prevention nets, and strengthened management of safety harness usage at building construction sites, policy measures are needed to address safety management gaps in small-scale projects below the safety-manager appointment threshold (such as itinerant safety management services and mandatory safety checklists for small-scale projects). From a regulatory perspective, the finding that Medium-scale public projects (KRW 5–12 billion) show an OR of 2.20 suggests that the current safety manager appointment threshold under the Occupational Safety and Health Act may need to be re-evaluated. Specifically, the regulatory requirement for a full-time safety manager at KRW 12 billion or more could be extended to a lower threshold for public projects to address the concentration of accidents at the medium scale.
A safety-training design that reflects the occupational characteristics of project ownership is also required. In private projects, fall prevention training for building trades workers must be strengthened, whereas in public projects, heavy equipment safety training for equipment operators must be enhanced. Furthermore, the effectiveness of on-site orientation training for newly deployed workers should be enhanced for the safety management of short-term employment workers in private projects.
The classification framework developed in this study can be utilized in MOEL’s Occupational Accident Data Management System. By automatically adding the project ownership variable to existing data, the framework can be utilized for computing accident statistics by project ownership and formulating tailored safety policies. Its practical value is high because it can expand analytical capabilities without changing the data collection format. The classification framework can be integrated into the MOEL’s annual accident statistics compilation process. By automatically generating the project ownership variable for each new accident record, it would enable real-time monitoring of accident rate trends by project ownership without requiring changes to the data collection format.
5.4. Limitations and Future Research
This study has several limitations. The labels of the training data were constructed based on the manual classification of 25,279 records from 2023 approved statistics and expanded to 221,893 records through EDA. Although cross-referencing with CSI data and classification guidelines was conducted to ensure the consistency of the manual classification, interrater reliability was assessed on 25,279 records from the 2023 dataset, yielding an agreement rate of 99.87% (Cohen’s κ = 0.997). While this high agreement provides confidence in label quality, the reliability assessment was conducted on one year of data. Future studies should extend inter-rater reliability verification to a broader temporal sample. The EDA augmentation was performed before the train-validation-test split, which introduces a potential data leakage concern: augmented variants of the same original record may appear in both training and test sets, potentially inflating the reported classification performance (F1 = 0.9876). However, the model trained without augmentation still achieved an F1-score of 0.9712, and the sensitivity analysis confirmed that the 1.24% misclassification rate does not substantively alter the key statistical findings. Future studies should adopt an augmentation-after-split strategy to eliminate this concern entirely.
Additionally, only two approaches—the rule-based model and fine-tuned KLUE-BERT—were examined in the classification model comparison, and the statistical analysis clarified the associations between project ownership and accident variables but not causal relationships. Future studies should include comparative analysis with various pretrained models, such as KoBERT and KoELECTRA, as well as the control of confounding variables through multivariate analysis (such as logistic regression analysis). Although supplementary logistic regression analysis confirmed that key associations remained robust after controlling for year and construction scale, a comprehensive multivariate model controlling for all potential confounders was beyond the exploratory scope of this study. Future studies should conduct confirmatory analyses using hierarchical logistic regression or multilevel models.
Because this study was conducted using Korean MOEL data, its direct application to construction accident data from other countries may be difficult. However, the methodological approach of automatically generating analytical variables from unstructured text and utilizing them in statistical analysis constitutes a generalizable framework that can be extended to other countries using multilingual pretrained models.
6. Conclusions
A fine-tuned KLUE-BERT framework was developed to automatically classify project ownership information absent from MOEL construction accident data, and the accident characteristics of public and private projects were compared and analyzed across six key accident variables using 245,998 classified records. The classification model achieved an F1-score of 0.9876, and all six variables exhibited statistically significant associations with project ownership. Construction machinery- and transportation-related accidents were significantly more prevalent in public projects, whereas fall- and scaffolding-related accidents were significantly more prevalent in private projects. Structural differences by project ownership were also observed in occupation and tenure. The sensitivity analysis confirmed that the residual misclassification (1.24% error rate) does not substantively alter these findings, and the supplementary logistic regression verified robustness after controlling for year and construction scale. These findings are consistent with previous studies. Cheng et al. [
12,
13] in Taiwan and Ling et al. [
14] in Singapore reported qualitative differences in accident patterns between public and private projects; the present study extends these findings with quantitative measures based on a larger dataset. The universal high-risk nature of equipment operation, observed in both public and private projects, is consistent with Dong et al. [
42], Halabi et al. [
43], and Kazan and Usmen [
48]. The classification performance confirms the effectiveness of fine-tuning pretrained language models for domain-specific construction texts reported by Kumi et al. [
31].
The contributions of this study are twofold. First, a framework was developed to automatically generate analytical variables that were absent from the source data using an NLP model and to utilize them as key variables in large-scale statistical analysis. This approach can be extended to various industrial safety databases in which variables required for analysis are not recorded. Second, through a comprehensive statistical analysis of a large-scale dataset (n = 245,998), structural differences in accident characteristics by project ownership were systematically elucidated, providing empirical evidence for the formulation of safety management strategies tailored to public and private projects.
The limitations of this study include the potential data leakage from EDA augmentation prior to splitting, the limited scope of comparison models, and the exploratory nature of the statistical analysis. Future studies may extend the applicability of the framework by comparing additional pretrained models, controlling for confounding variables through multivariate methods, and applying the framework to multilingual construction accident datasets.