


Abstract
To investigate how the content of silica fume (SF) influences the performance of foam concrete (FC) after high-temperature exposure and the underlying mechanisms, this study prepared standard FC cube specimens with SF contents of 0%, 0.15%, 0.2%, 0.25%, and 0.3%. The working properties of the material at room temperature were systematically tested, and the mass loss, residual compressive strength, failure mode, microstructure and acoustic emission (AE) data at different temperatures (100 °C, 200 °C, 300 °C and 400 °C) were analyzed. The test results indicate that increasing the SF content reduces the fluidity of the fresh paste yet significantly enhances the compressive strength and lowers the water absorption of FC at room temperature. After high-temperature exposure, the effect of SF exhibits a dual character: at 200 °C and below, SF effectively mitigates the performance degradation of FC. However, when the temperature reaches 300–400 °C, specimens with an excessively high SF content (e.g., 0.3%) experience rapidly built-up internal steam pressure that cannot escape in time, which triggers the formation and propagation of a microcrack network and leads to a sharp drop in strength. Based on AE detection and scanning electron microscopy (SEM) image analysis, the failure process of silica fume foam concrete (SFFC) proceeds through three stages: free water evaporation at low temperatures, dehydration shrinkage of the C-S-H gel at medium temperatures, and finally, structural failure marked by the collapse of the C-S-H gel network at high temperatures. This study indicates that an SF content of 0.25% allows FC to achieve an optimal balance between mechanical properties and high-temperature stability. The findings provide a theoretical basis for optimizing FC mix proportions and enhancing fire prevention design.
1. Introduction
As an excellent building energy-saving material, foam concrete (FC) has good thermal insulation performance and is widely used in external wall insulation and reconstruction filling [1]. However, in high-temperature scenarios (such as fire), FC is prone to severe damage under steam pressure and thermal stress, which seriously affects its service life.
As one of the most commonly utilized silicon-based admixtures, silica fume (SiO2) can significantly enhance the material properties, mechanical performance, and durability of foamed concrete (FC). These improvements are primarily attributed to its physical filling effect and pozzolanic reactivity, which together promote a denser and more homogeneous microstructure [2]. The incorporation of silica fume contributes to the formation of a compact matrix, thereby improving the microstructure of FC. This refined microstructure endows FC with enhanced ductility across a range of temperatures and effectively delays its failure under thermal loading [3,4,5,6].
To date, numerous studies have investigated the high-temperature resistance of FC through experimental programs conducted at varying temperatures. These investigations have revealed the damage mechanisms induced by elevated temperatures by observing changes in apparent morphology and microstructure, using techniques such as scanning electron microscopy and optical microscopy [7,8,9,10,11]. Within the body of research concerning FC subjected to high-temperature exposure, the primary focus has been on the performance degradation of FC with varying densities. In contrast, comparatively little attention has been directed toward FC incorporating other types of admixtures [12,13]. In engineering practice, it is common to add solid waste admixtures—such as silica fume (SF), fly ash, and slag—into FC to improve its overall performance. However, current research remains limited in terms of understanding the interaction mechanisms among these multiple constituents and the extent of their respective influences under high-temperature conditions. This gap in knowledge poses a challenge to the development of a comprehensive and accurate performance evaluation system for FC after exposure to high temperatures.
As a non-destructive testing technique, acoustic emission (AE) technology has become an important tool in scientific research. It is widely employed by scholars worldwide for structural inspection and safety assessment of ordinary reinforced concrete beams, slabs, and columns, particularly in the detection of freeze–thaw damage and deep cracks [14,15]. However, its application in foamed concrete remains underexplored, especially regarding the failure modes of foamed concrete with different admixtures and the corresponding microstructural analysis. Notably, compared with ordinary concrete, foamed concrete features a unique pore structure that generates denser AE signals, thereby offering distinct advantages in data acquisition and analysis. Therefore, the application of AE technology in foamed concrete not only enriches the available research methodologies but also opens up broader research perspectives [16,17,18,19,20].
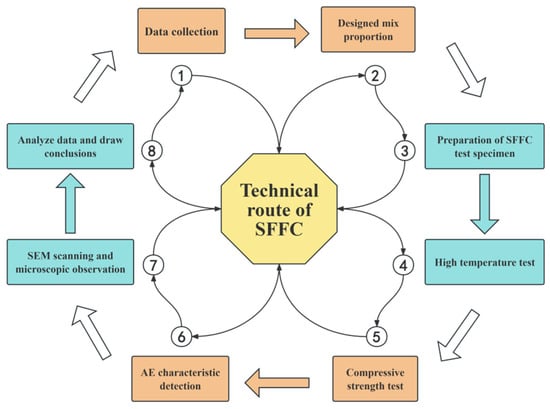
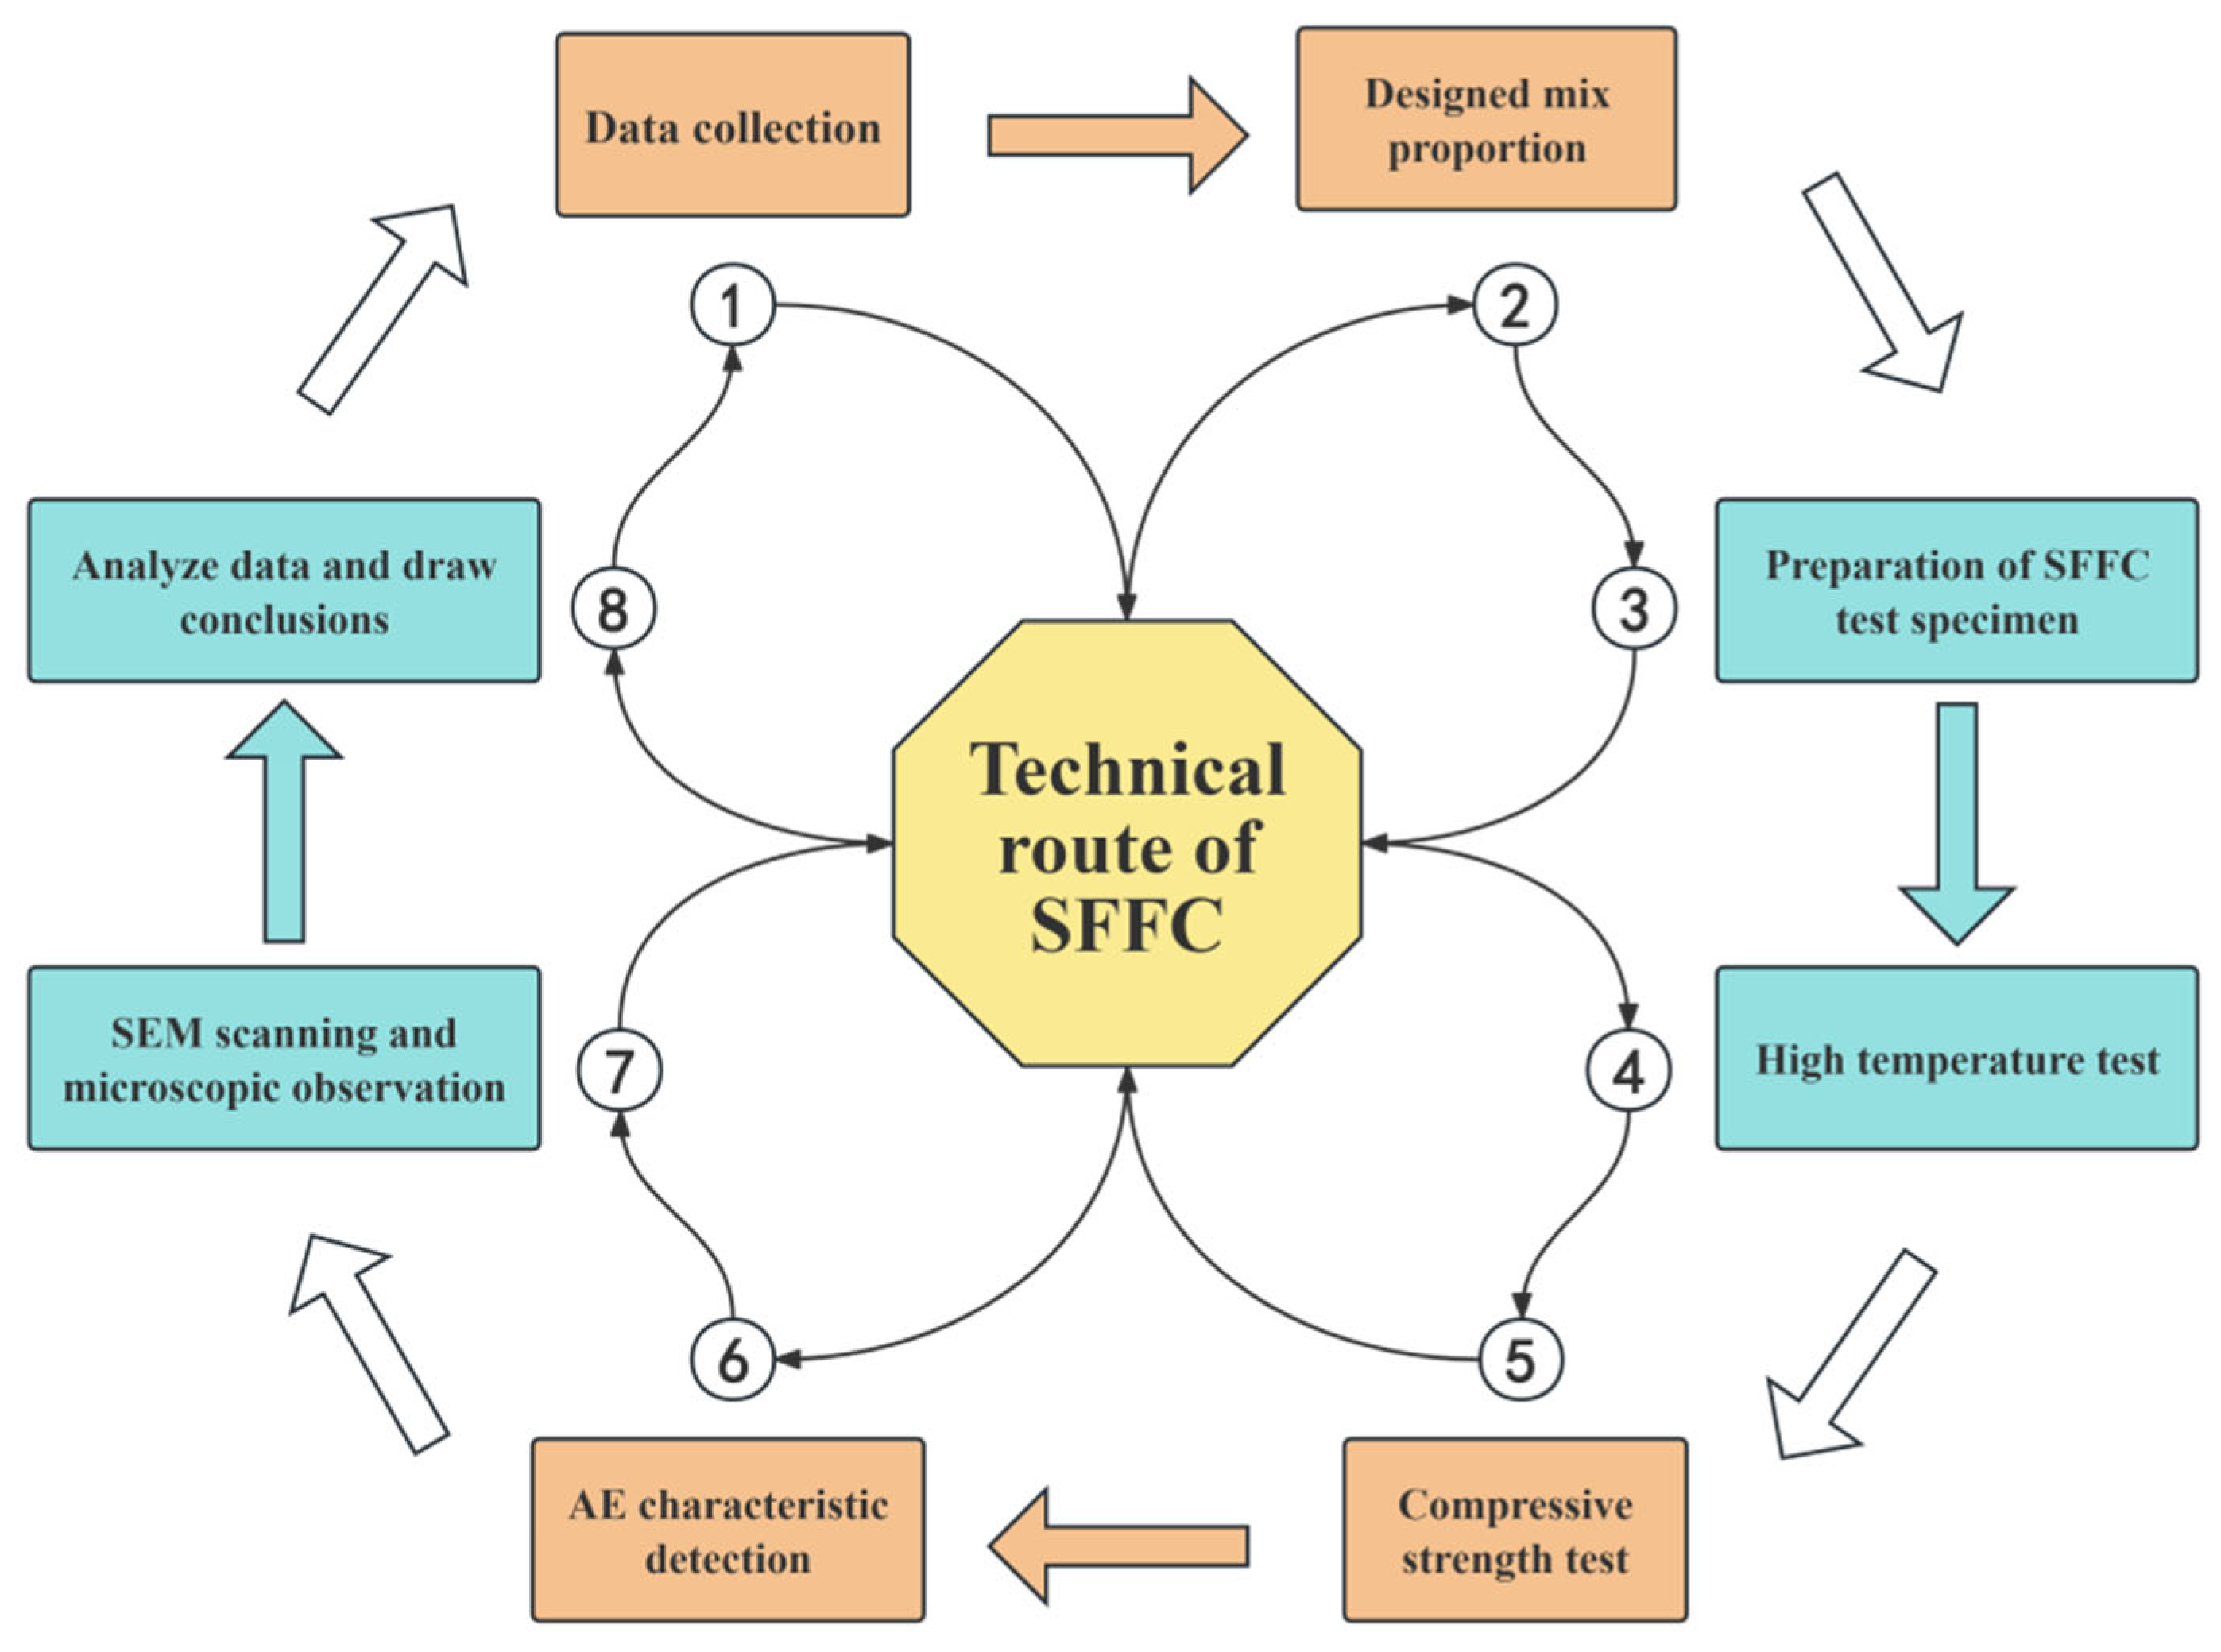
In this study, through the mechanical property test after exposure to high temperatures, combined with SEM technology and AE technology [21,22,23], the influence of SF (the main component of which is SiO2) on the mechanical properties and microstructure of FC after exposure to high temperature is analyzed from multiple angles, and the strengthening mechanism of SF on FC is clarified, as illustrated in Figure 1.
Figure 1.
Technology road map.
2. Working Performance of Materials
2.1. Test Materials
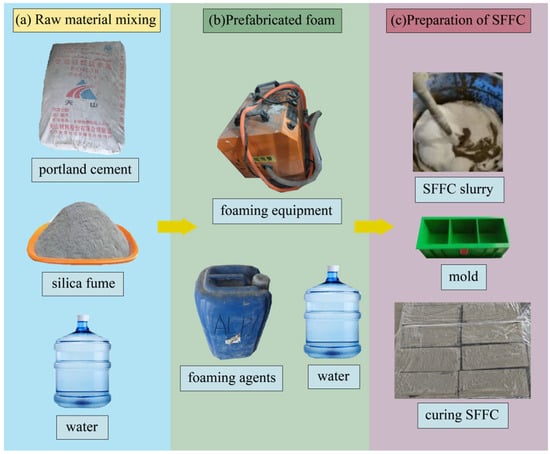
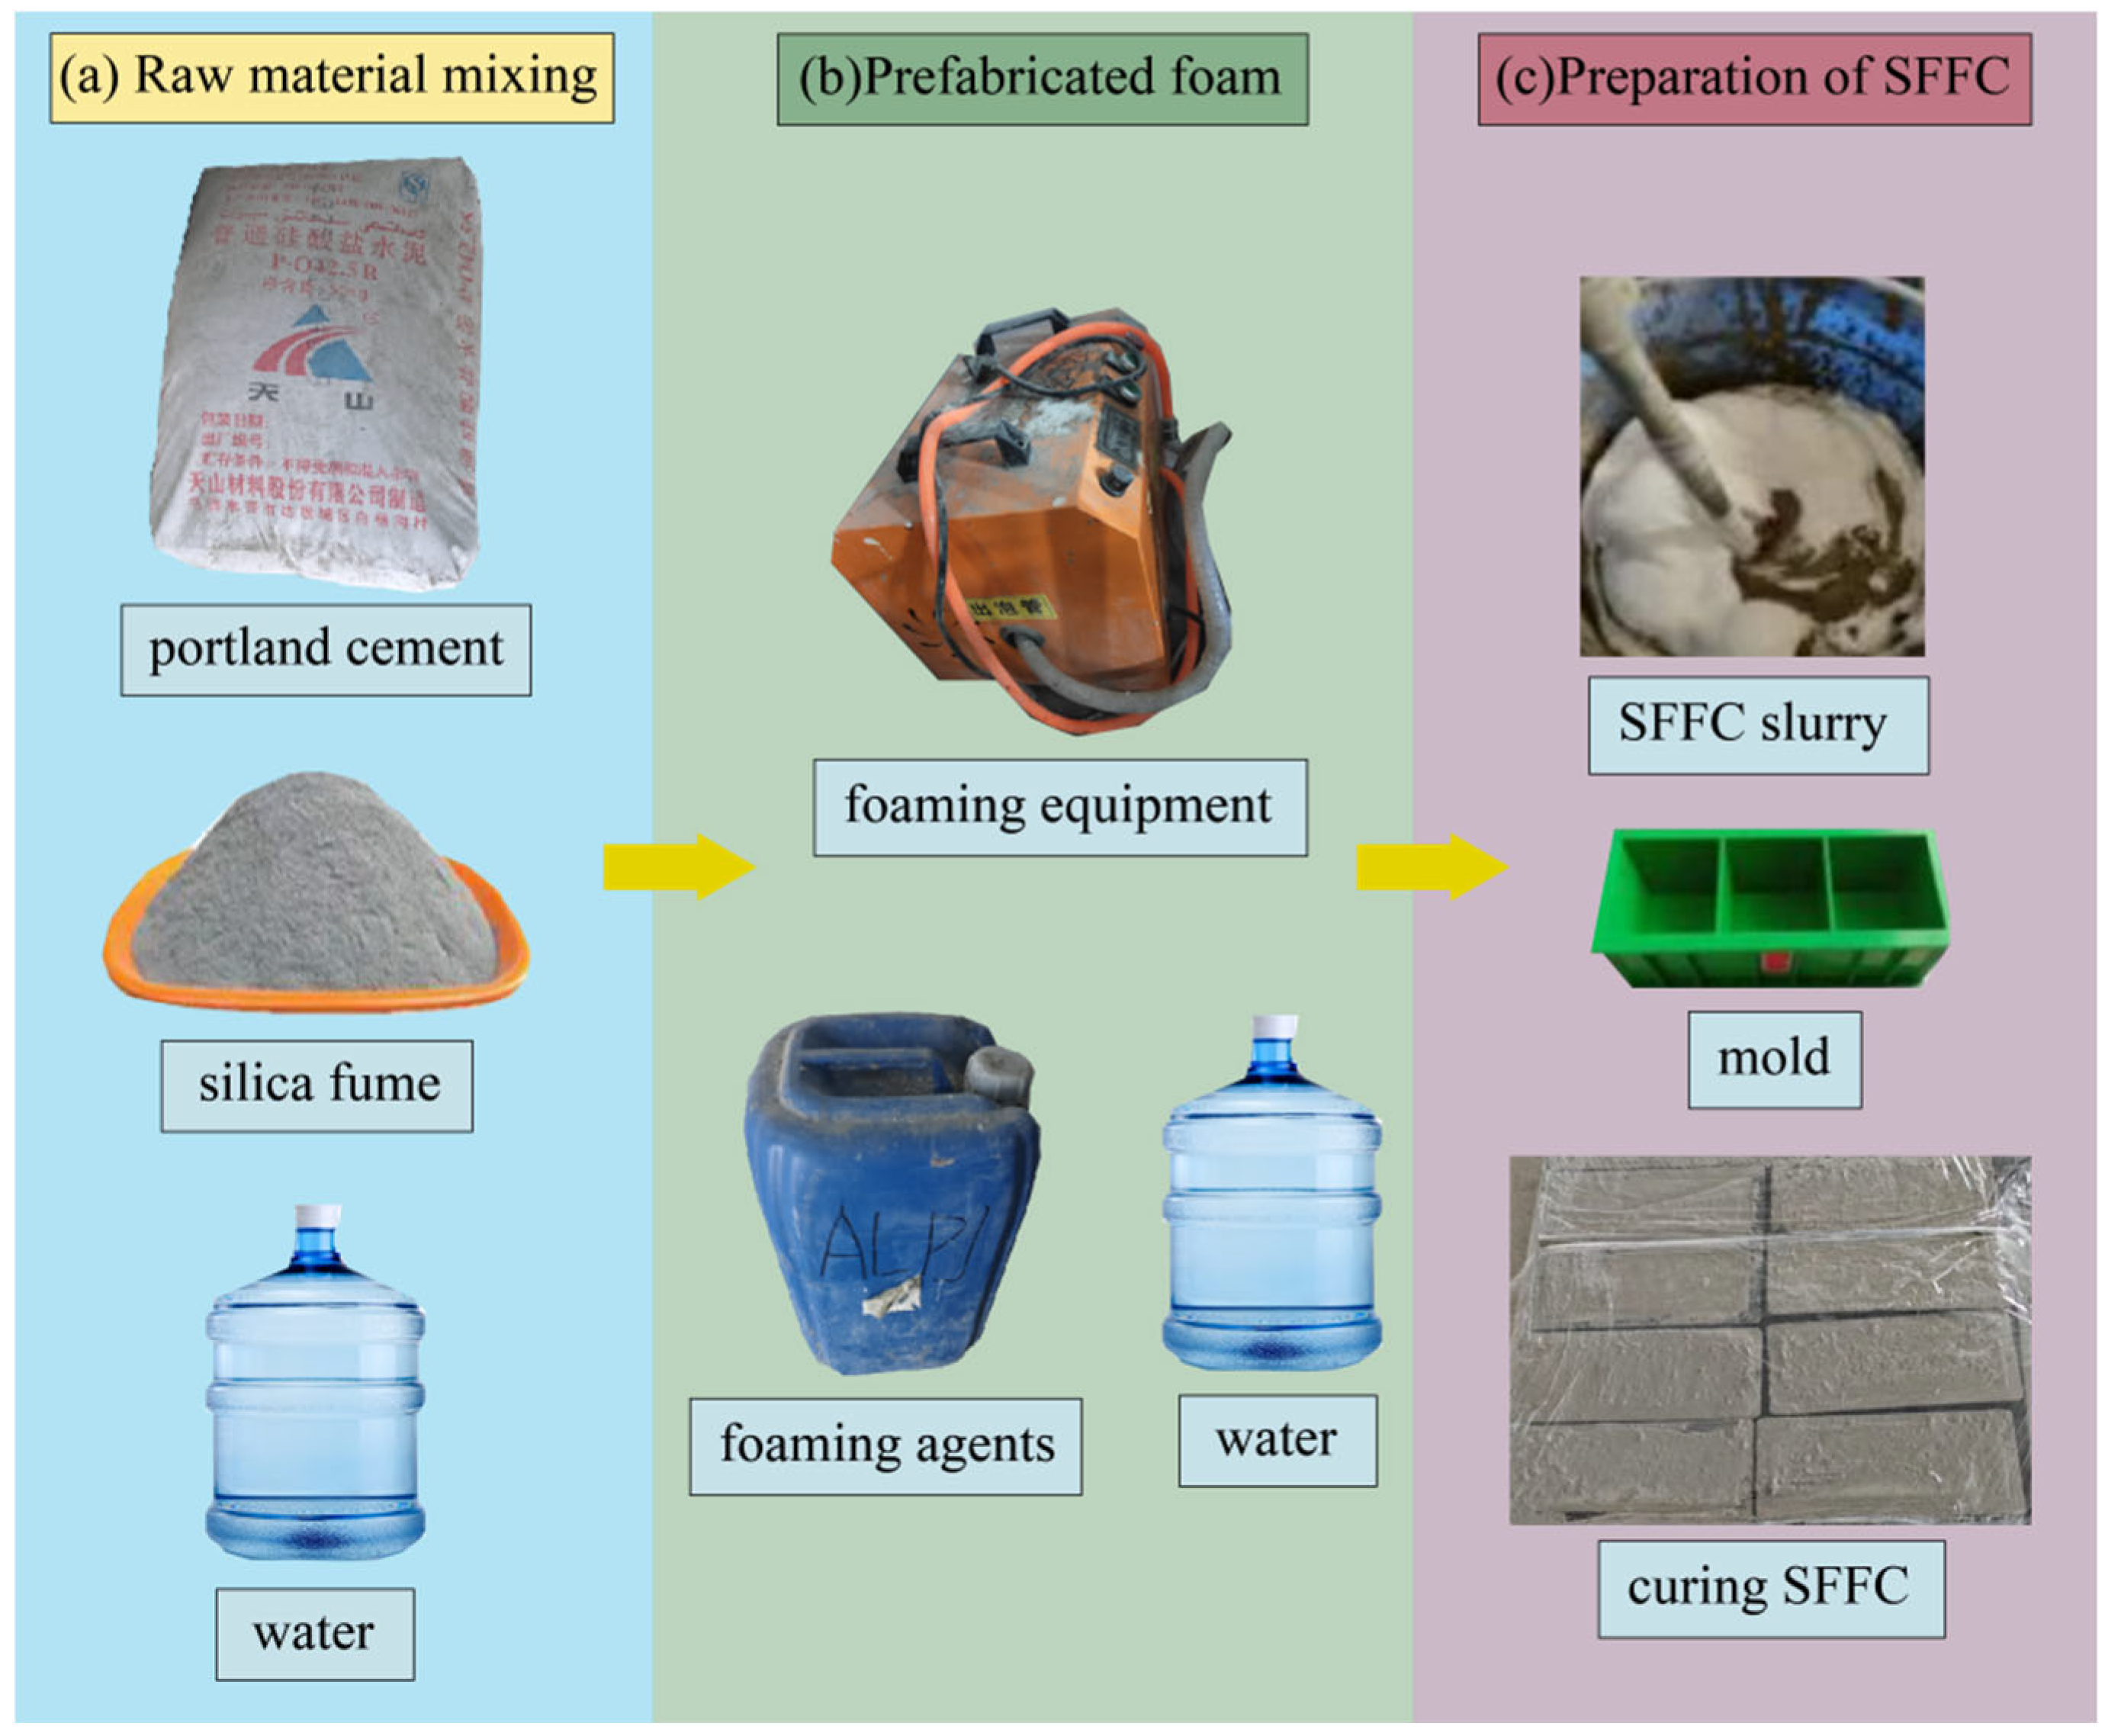
The raw materials used in this test include ordinary Portland cement, SF, vegetable protein foaming agent, etc., as illustrated in Figure 2a for specific materials. The cement is 42.5 grade ordinary Portland cement sold in the market, and its main chemical composition is shown in Table 1.
Figure 2.
SFFC preparation process.
Table 1.
Chemical composition of cement.
SF, as the key auxiliary cementitious material and micro-aggregate for the preparation of silica fume foam concrete (SFFC), can fill the voids in FC and react with cement hydration products to produce a pozzolanic reaction, which can improve the working performance and compressive strength of FC. The SiO2 content of SF used in this test was not less than 94%, and the specific chemical composition is shown in Table 2.
Table 2.
Chemical composition of SF.
Foaming agent is a kind of chemical or physical additive that is used to produce a large number of bubbles in liquid or viscous paste to form cellular porous structural materials. It is often used to prepare FC. The foaming agent used in this test is a plant protein foaming agent, which is a colorless, transparent and viscous liquid with a pungent odor. When used, it needs to be diluted with water in a certain proportion. Compared with animal protein foaming agents, its raw materials come from plants such as soybean, which is more environmentally friendly and sustainable. At the same time, it has a long shelf life and is not easy to corrupt, making it easier to store and saving costs. CJJ/T177-2012 “Technical Specification for Bubble Mixed Lightweight Soil Filling Engineering” [24], and JC/T2199-2013 (2017) “Foam Agent for Foam Concrete” [25] were referenced when preparing the foam used in the test to test the basic properties of foam. Refer to Table 3 for the specific results.
Table 3.
Foam properties [26].
2.2. Test Specimen Preparation
2.2.1. Mix Design
The strength grade of FC usually needs to be determined by the two parameters of compressive strength and density. In practical application, it is necessary to select the appropriate density and strength combination according to the engineering needs. When designing the mix proportion in this test, JG/T266-2011 “FC” was referenced, and the specific design formula is as follows [27].
In the formula:
Vt: is the wet density of the target sample;
Vc: is the unit cubic dosage of cement, kg/m3;
Vw: is the unit cube consumption of water, kg/m3;
Vf: is the unit cube consumption of foam, kg/m3;
ρc: is the density of the corresponding cement;
ρw: is the corresponding density of water;
ρf: is the density of the corresponding foam;
Mc: is the quality of the corresponding cement;
Mw: is the corresponding water quality;
Mf: is the mass of the corresponding foam.
According to the above formula, the mix proportions of SFFC with different SF contents were calculated, as shown in Table 4.
Table 4.
Mix proportions for SFFC.
2.2.2. Preparation Process
The preparation process of the test specimen was as follows: firstly, the plant protein foaming agent and water were evenly mixed according to the design mix proportion, the foam was prefabricated by the foaming machine, and the density of the prefabricated foam was controlled at 55 kg/m3; according to the design mix proportion, the weighed cement, SF and water were added into the mixing tank for mixing for 3 min to make them evenly mixed; the prefabricated plant protein foam was added into the mixing tank and mixed at low speed for 1 min (the reason for using low speed and short-time mixing is that high speed and long-time mixing damage the structure of the foam. In order to make the materials mix evenly and not damage the foam structure, it is necessary to use low speed and short-time mixing); finally, the prepared slurry was poured into a 100 × 100 × 100 mm mold and manually troweled and covered with fresh-keeping film to prevent moisture volatilization and reduce the impact of a dry environment on the mix design. The specific preparation process is shown in Figure 2.
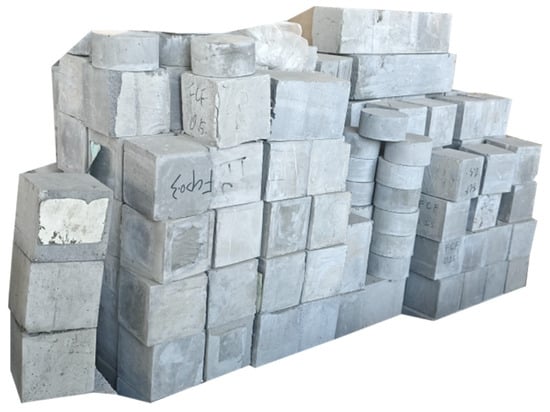
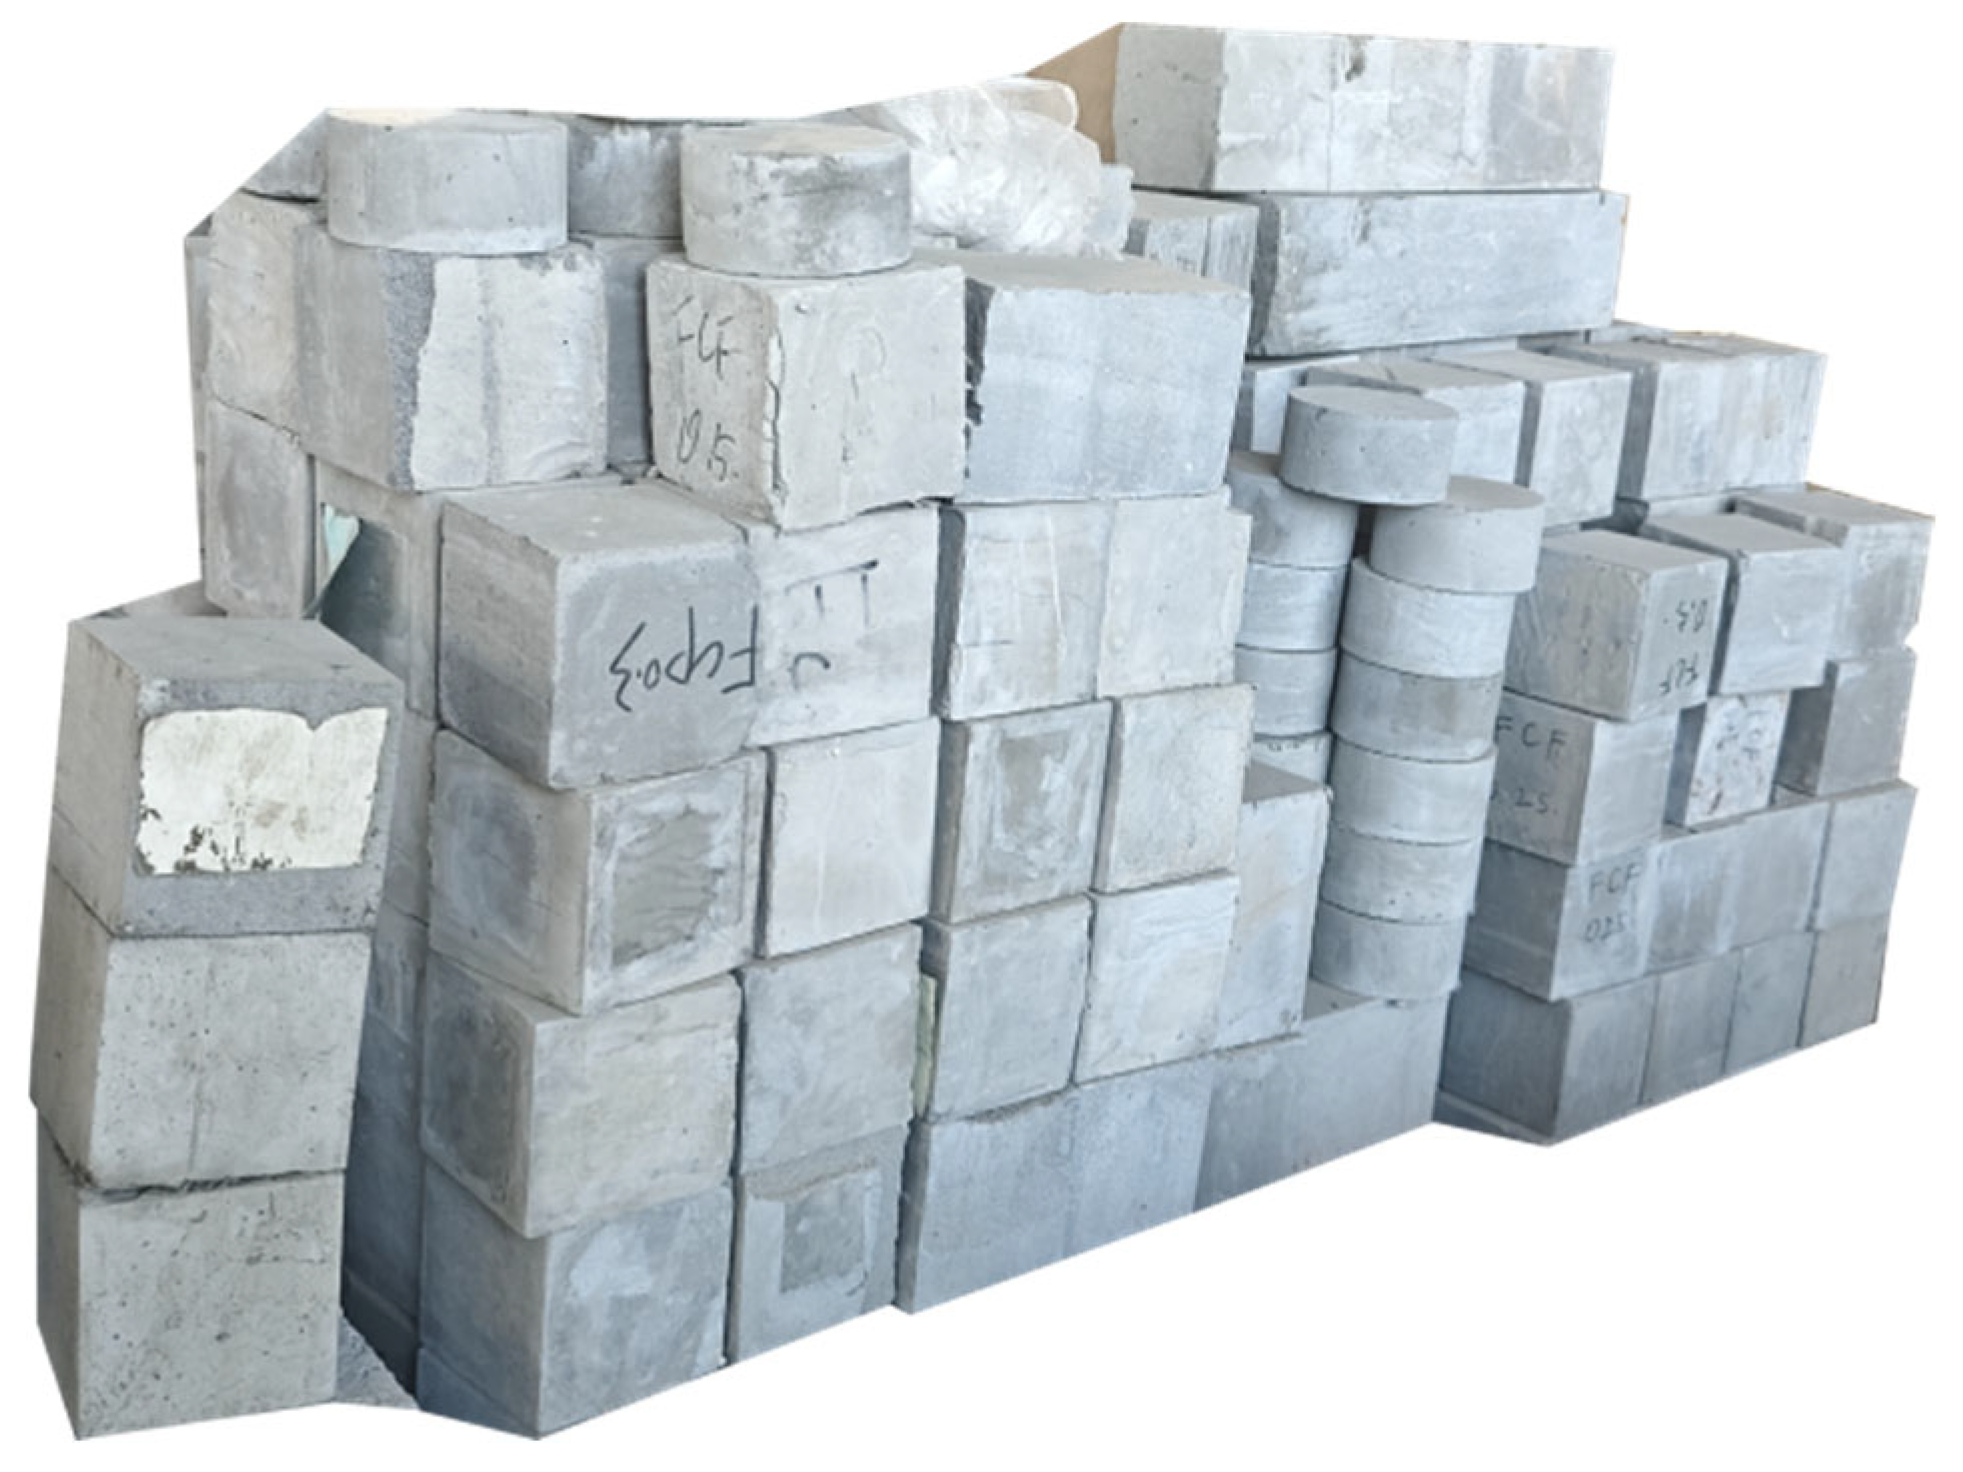
Twenty FC test specimens mixed with SF were prepared in each group, with 5 in the blank control group. These test specimens were subjected to a high-temperature test, compressive strength test and AE characteristic detection after curing for more than 28 days. Refer to Figure 3 for the test specimen after curing.
Figure 3.
Prepared SFFC test specimen.
2.3. Fluidity
2.3.1. Test Method
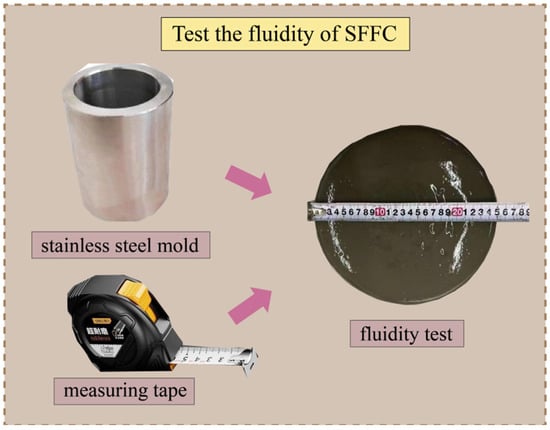
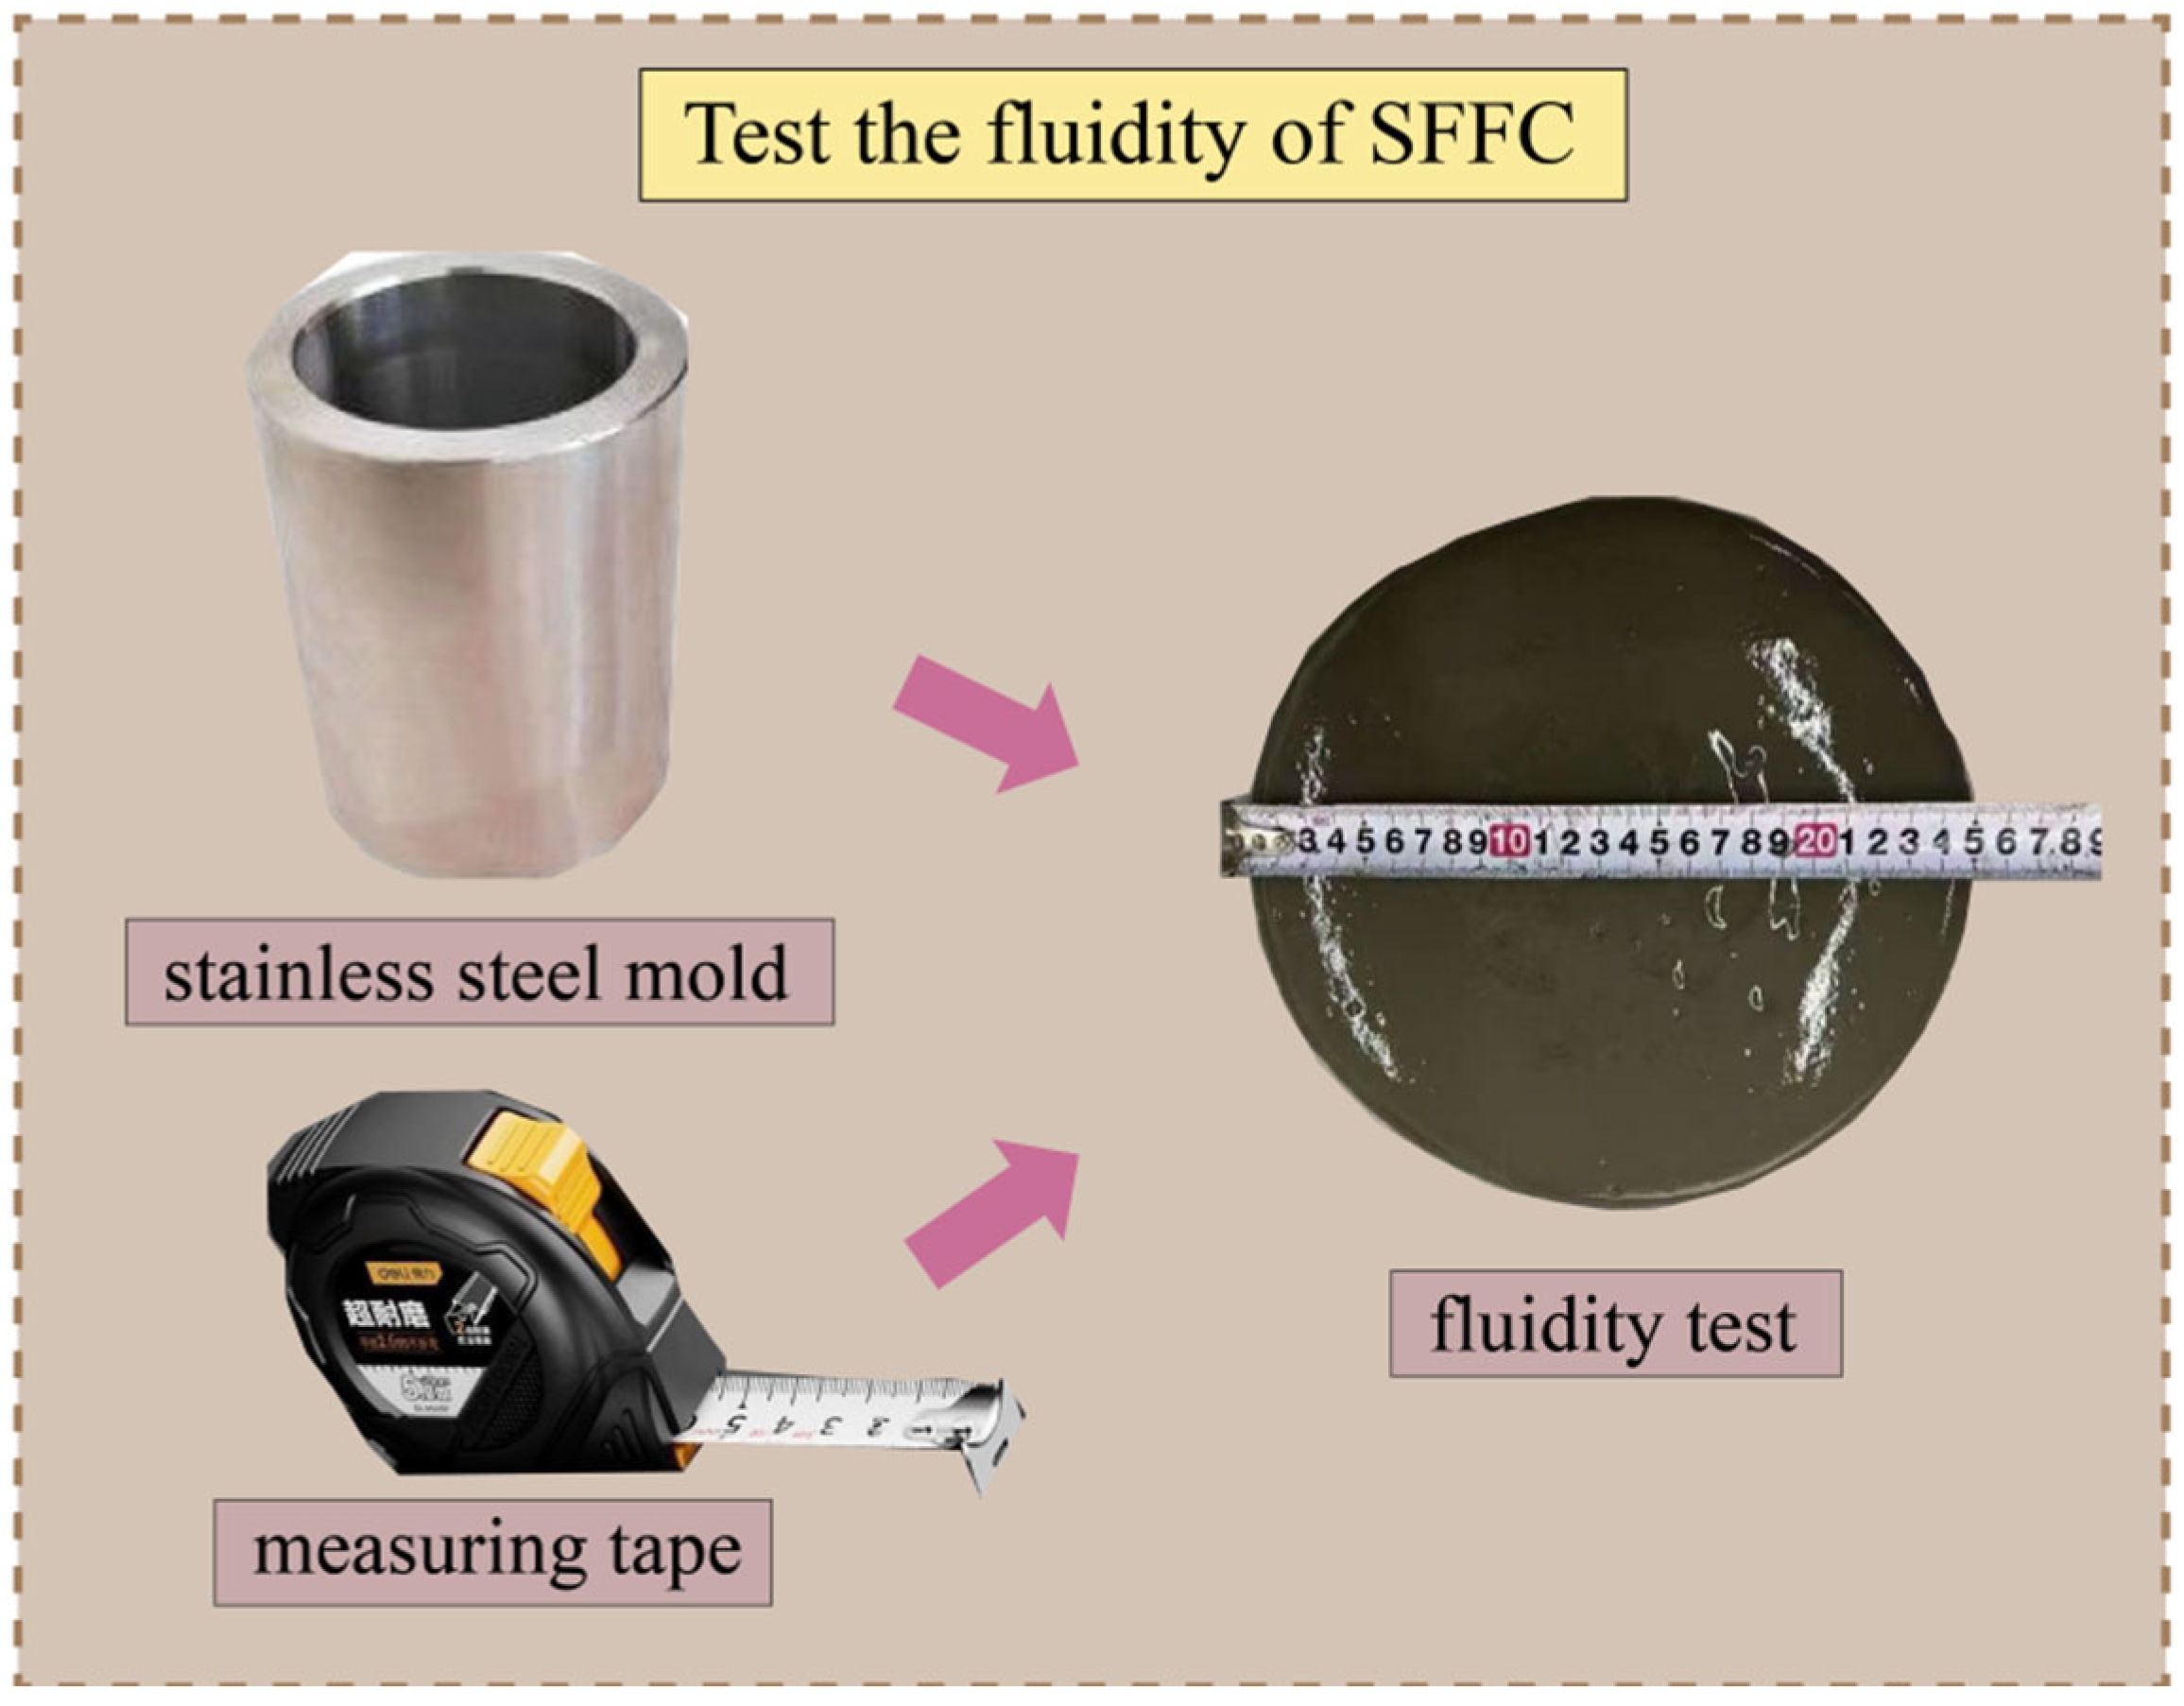
Fluidity is a key indicator for assessing the performance of FC. In this test, the fluidity of the freshly mixed SFFC slurry was evaluated in accordance with GB/T43487-2023 “Test Methods for Foam Concrete and Products” [28]. The procedure was as follows: A hollow stainless steel mold (80 mm in both diameter and height) was placed on a smooth, flat plate measuring 500 × 500 mm. The newly prepared SFFC slurry was poured into the mold and leveled with a trowel. The mold was then lifted vertically, allowing the slurry to spread freely over the smooth surface. After 60 s, the maximum spread diameter was measured to determine the fluidity of the mixture. The specific operation is illustrated in Figure 4.
Figure 4.
Fluidity test.
2.3.2. Result Analysis
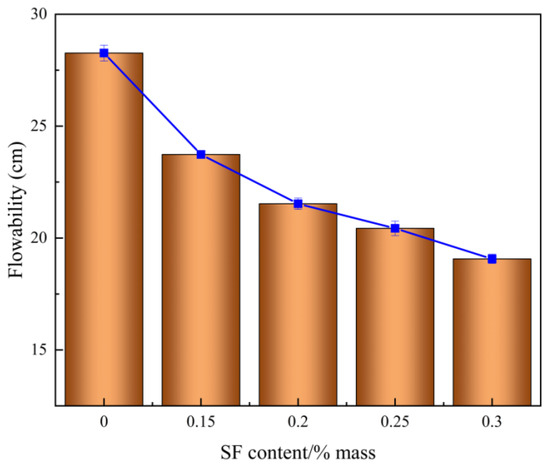
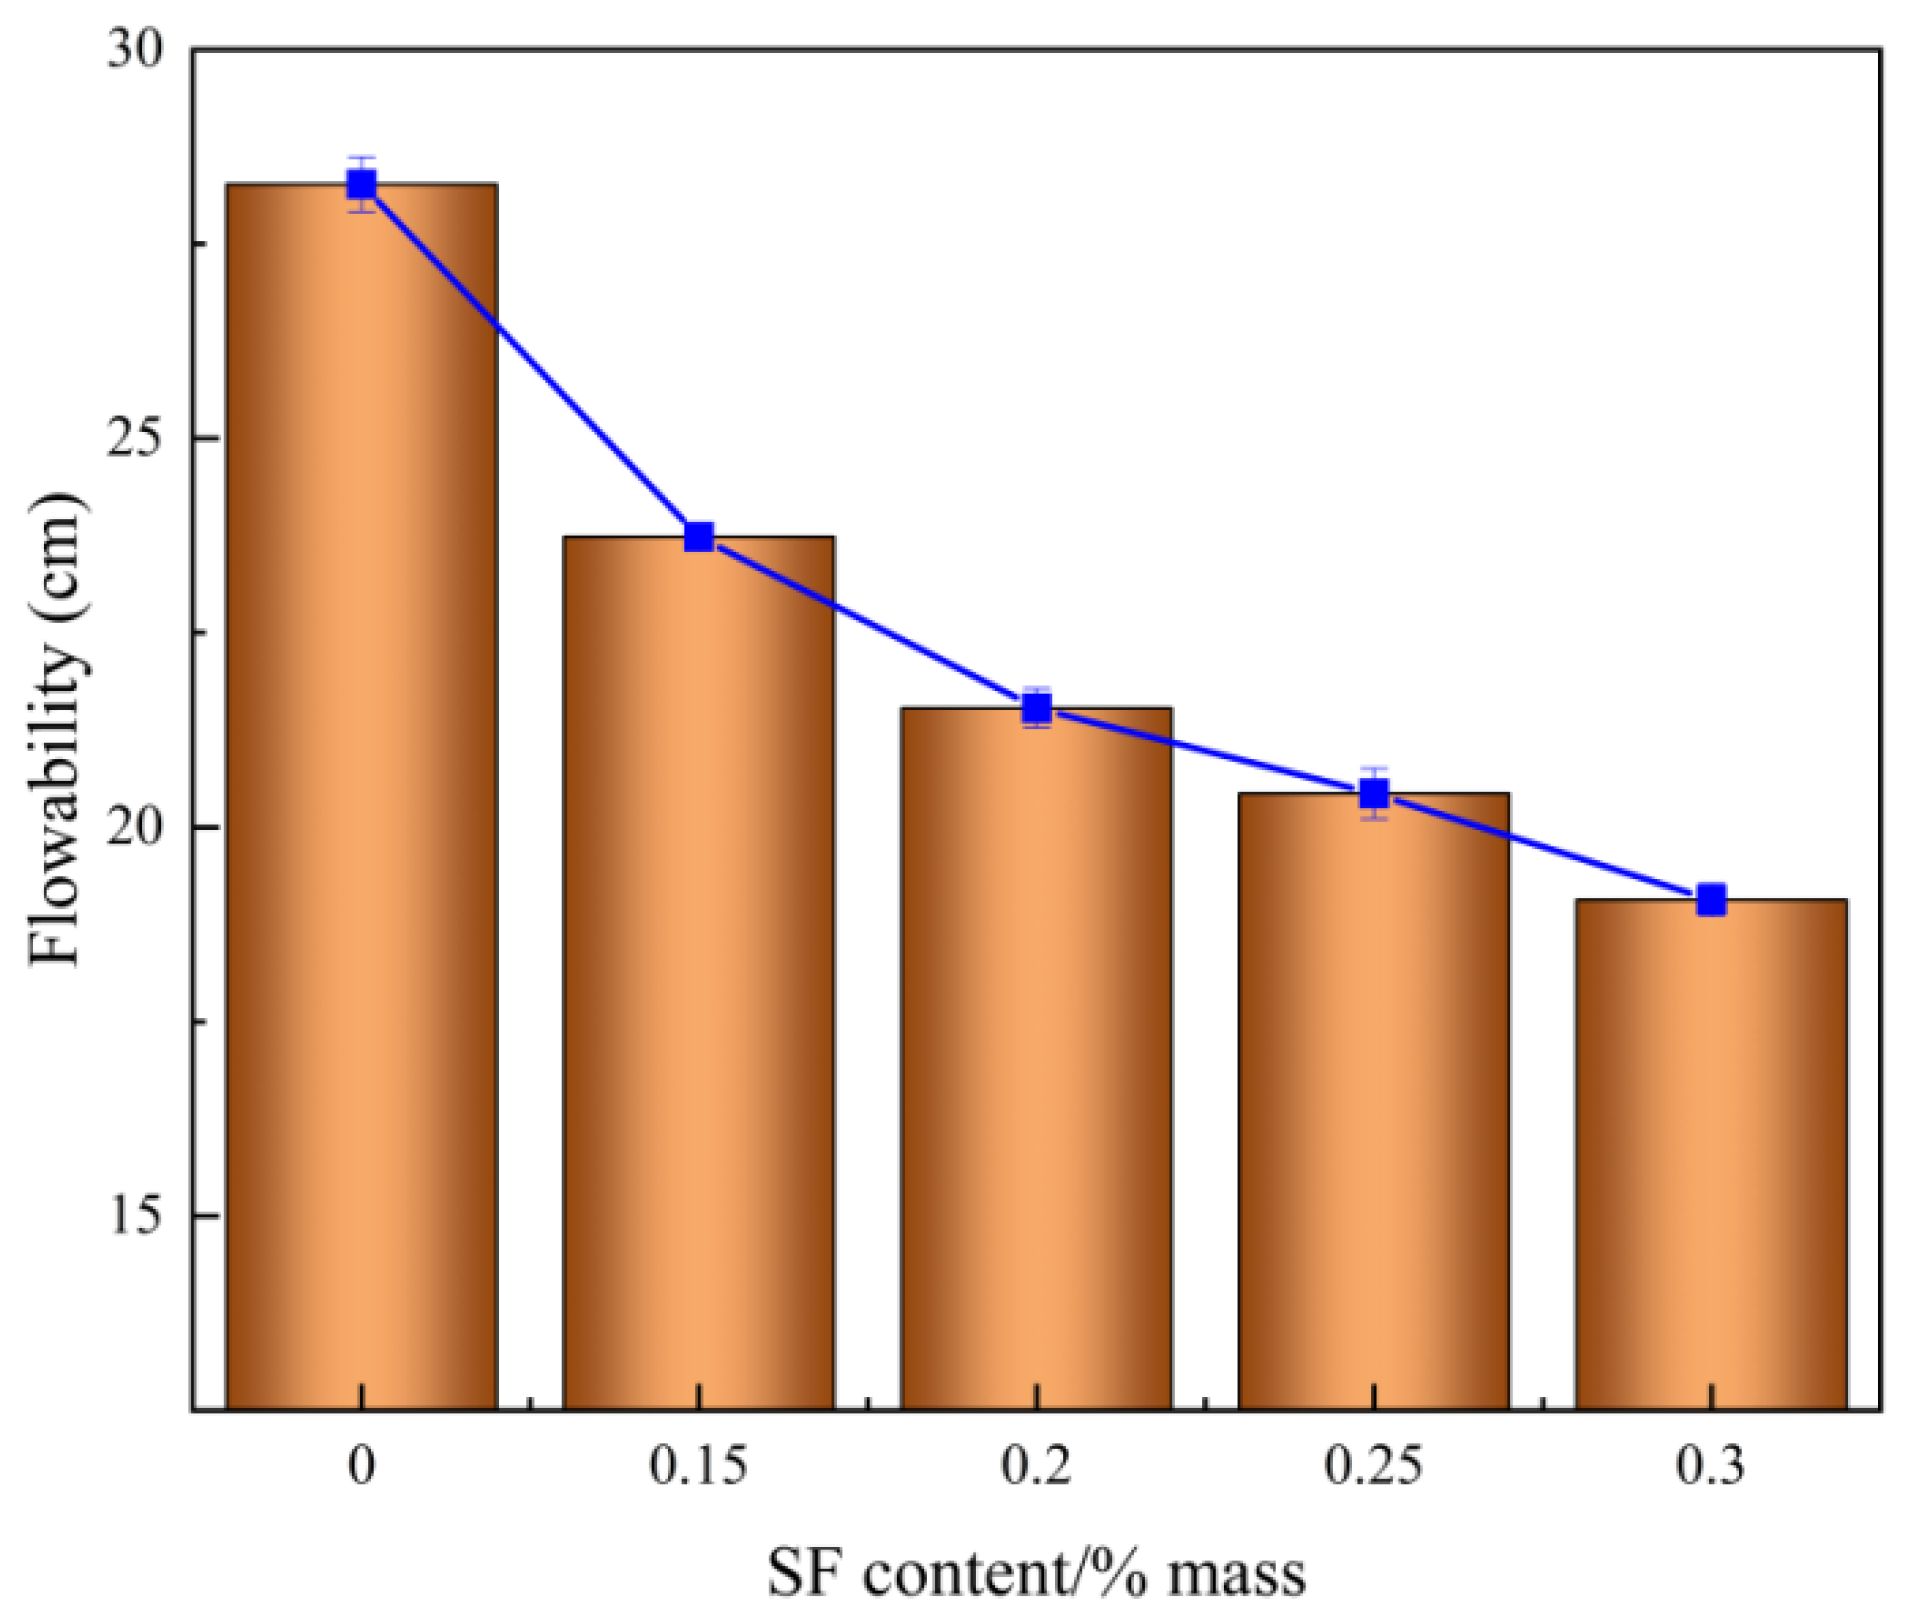
As shown in Figure 5, with the increase in SF content, the fluidity of SFFC slurry continues to decrease. This is because the SF particle size is very small and the specific surface area is huge, so a large amount of free water is adsorbed on its surface, and the free water that provides fluidity is relatively reduced. At the same time, under the physical filling effect of SF, the gap inside the slurry decreases, which together leads to the increase in viscosity and the decrease in the fluidity of SFFC slurry. Low fluidity helps to stabilize the formed bubbles and prevent them from breaking and floating up. At the same time, low fluidity is not conducive to the mechanical foaming process and uniform dispersion of bubbles. It can be seen from Figure 5 that when the SF content is 0.3%, the excessive SF particles are easy to agglomerate, resulting in low fluidity (the measured value was lower than 20 cm), which is not conducive to production control. Comprehensive analysis shows that when the SF content is 0.25%, the high SF content is maintained, the low fluidity is avoided, and the working performance of the material is the best.
Figure 5.
Effect of SF content on fluidity.
2.4. Water Absorption
2.4.1. Test Method
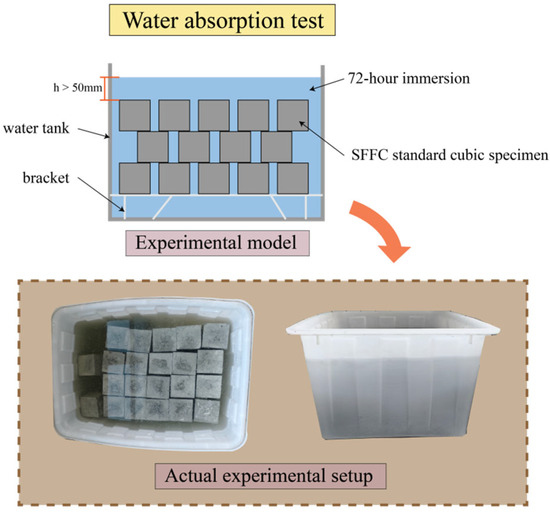
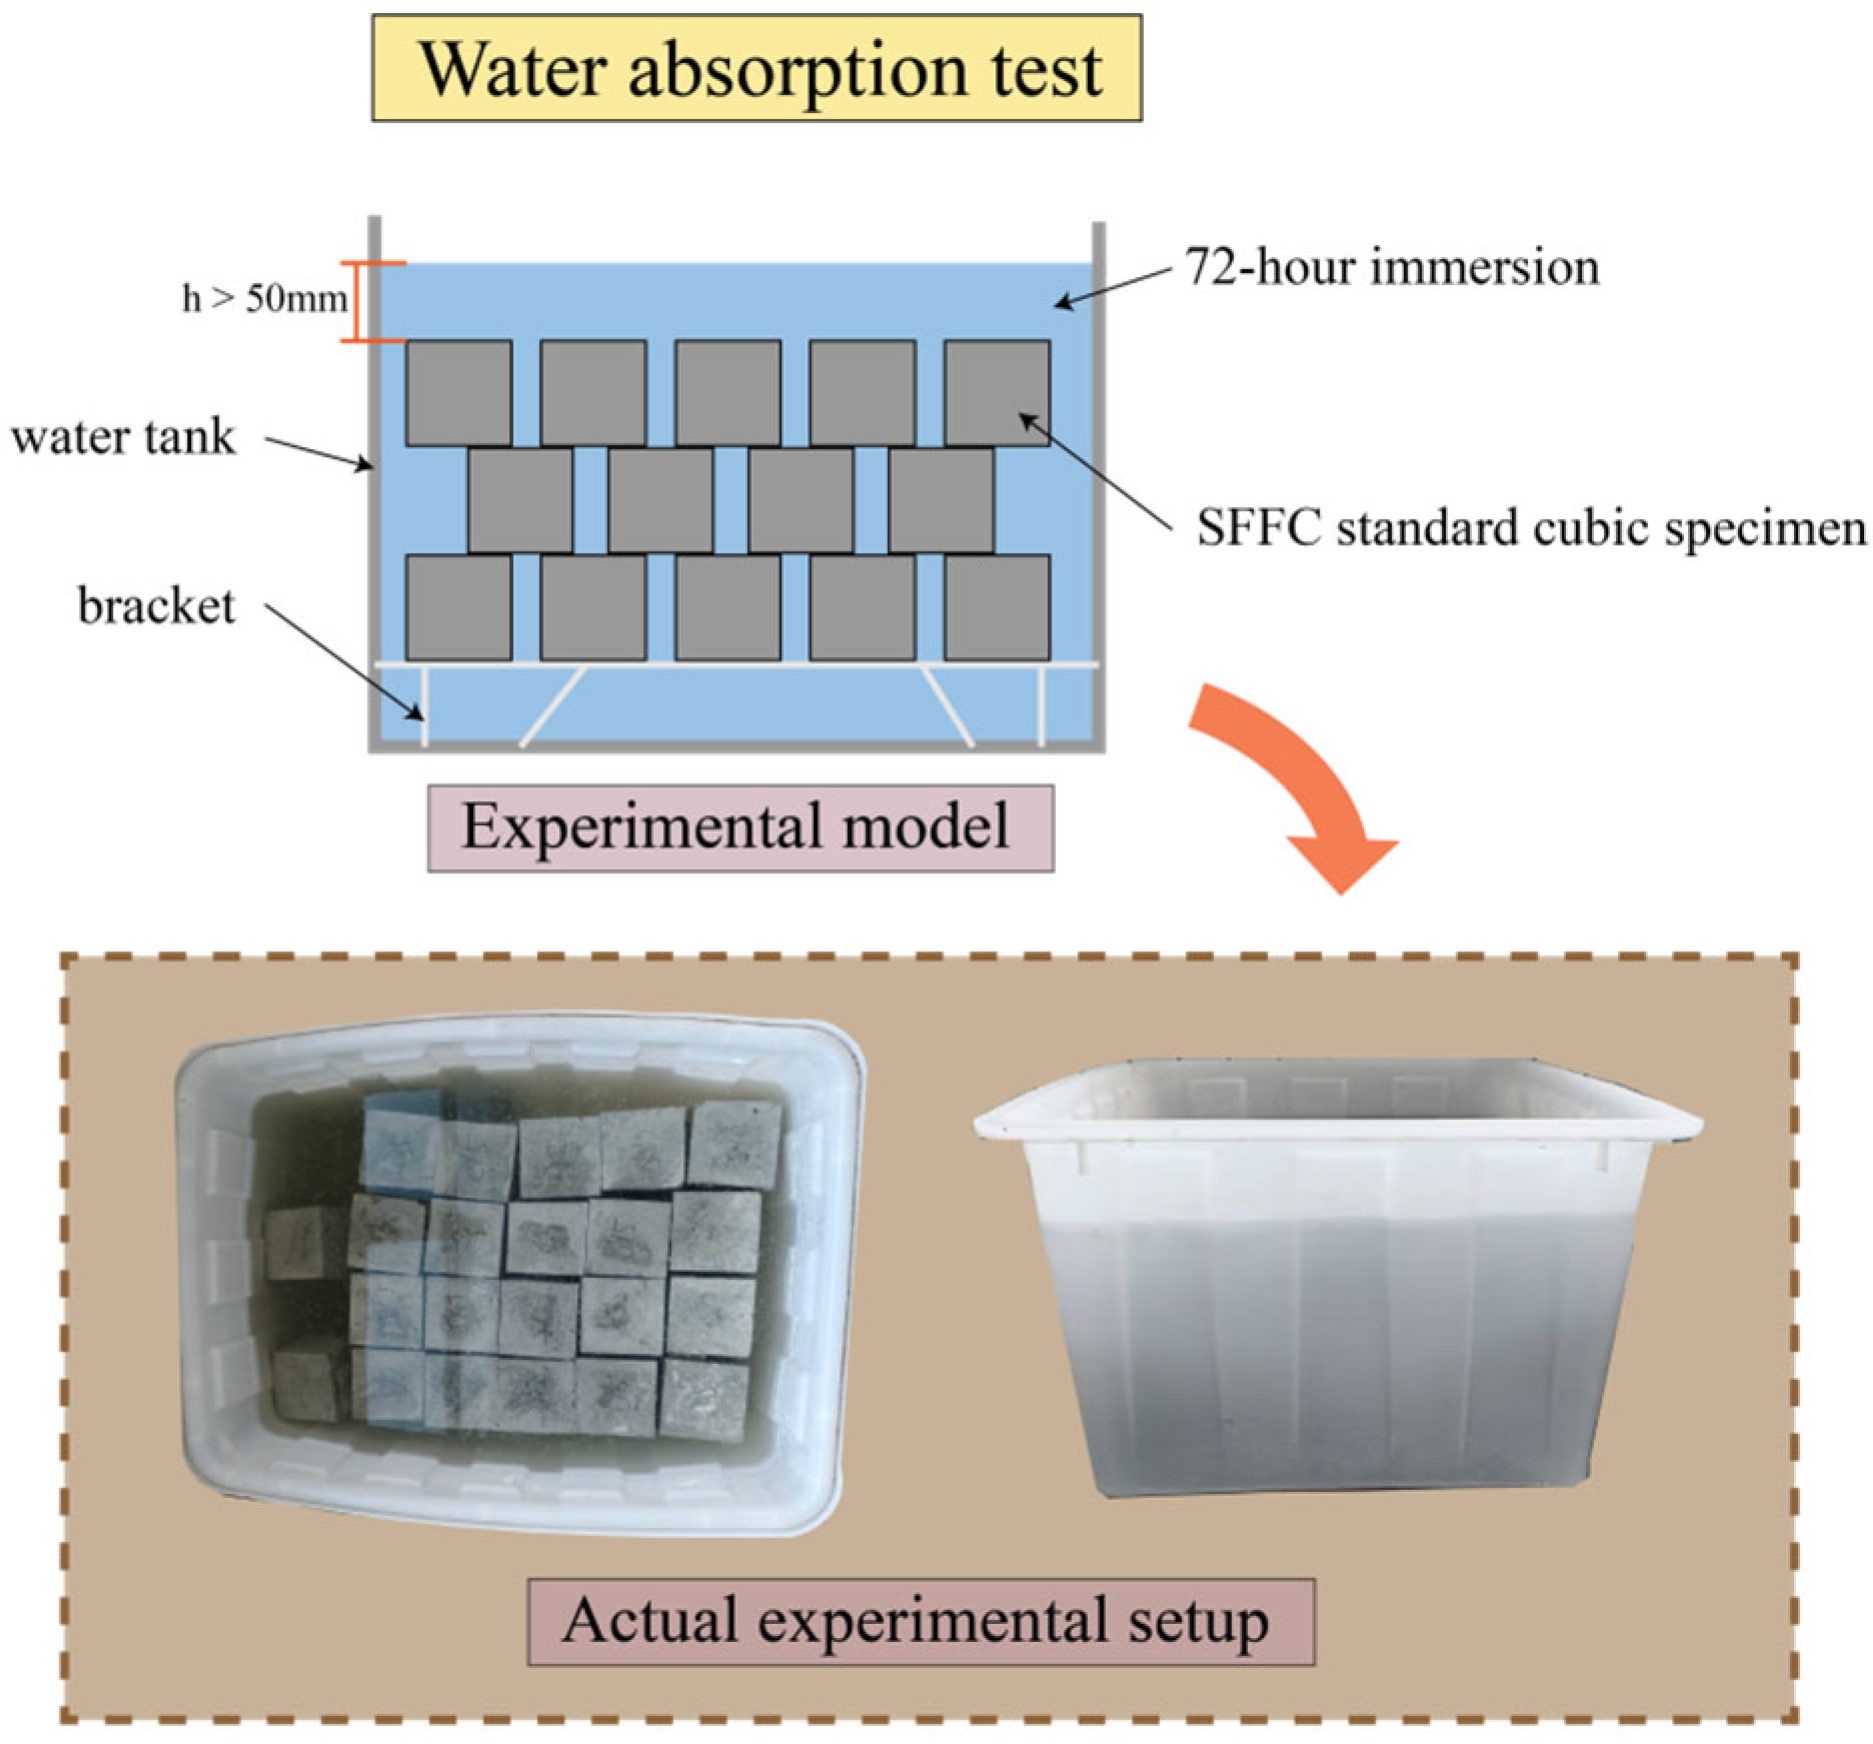
Water absorption is an important indicator for evaluating the pore structure and durability of FC. The incorporation of silica fume (SF) significantly alters the pore structure of FC, thereby influencing the water absorption performance of the product. In this test, the water absorption of SFFC specimens was measured according to the method specified in Appendix D of JG/T266-2011 Foam Concrete [27]. The specific procedure, illustrated in Figure 6, was as follows: First, the specimen was pre-dried and its mass was recorded as m0. After cooling to room temperature, it was placed on a support inside a water tank (the support ensured that the bottom of the specimen remained suspended to avoid contact with the tank bottom, which could affect the test results). Water was then added until the liquid level reached at least 50 mm above the top surface of the specimen. After 72 h of immersion, the specimen was removed, surface moisture was wiped off, and its mass was recorded as m1. Finally, the water absorption of the SFFC specimen was calculated using the standard absorption formula.
Figure 6.
Water absorption test.
Water absorption calculation formula:
2.4.2. Result Analysis
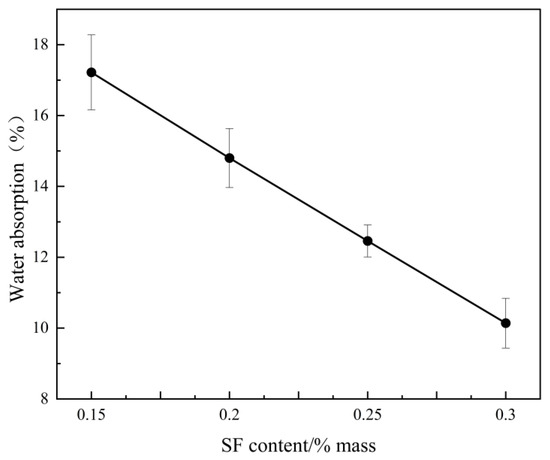
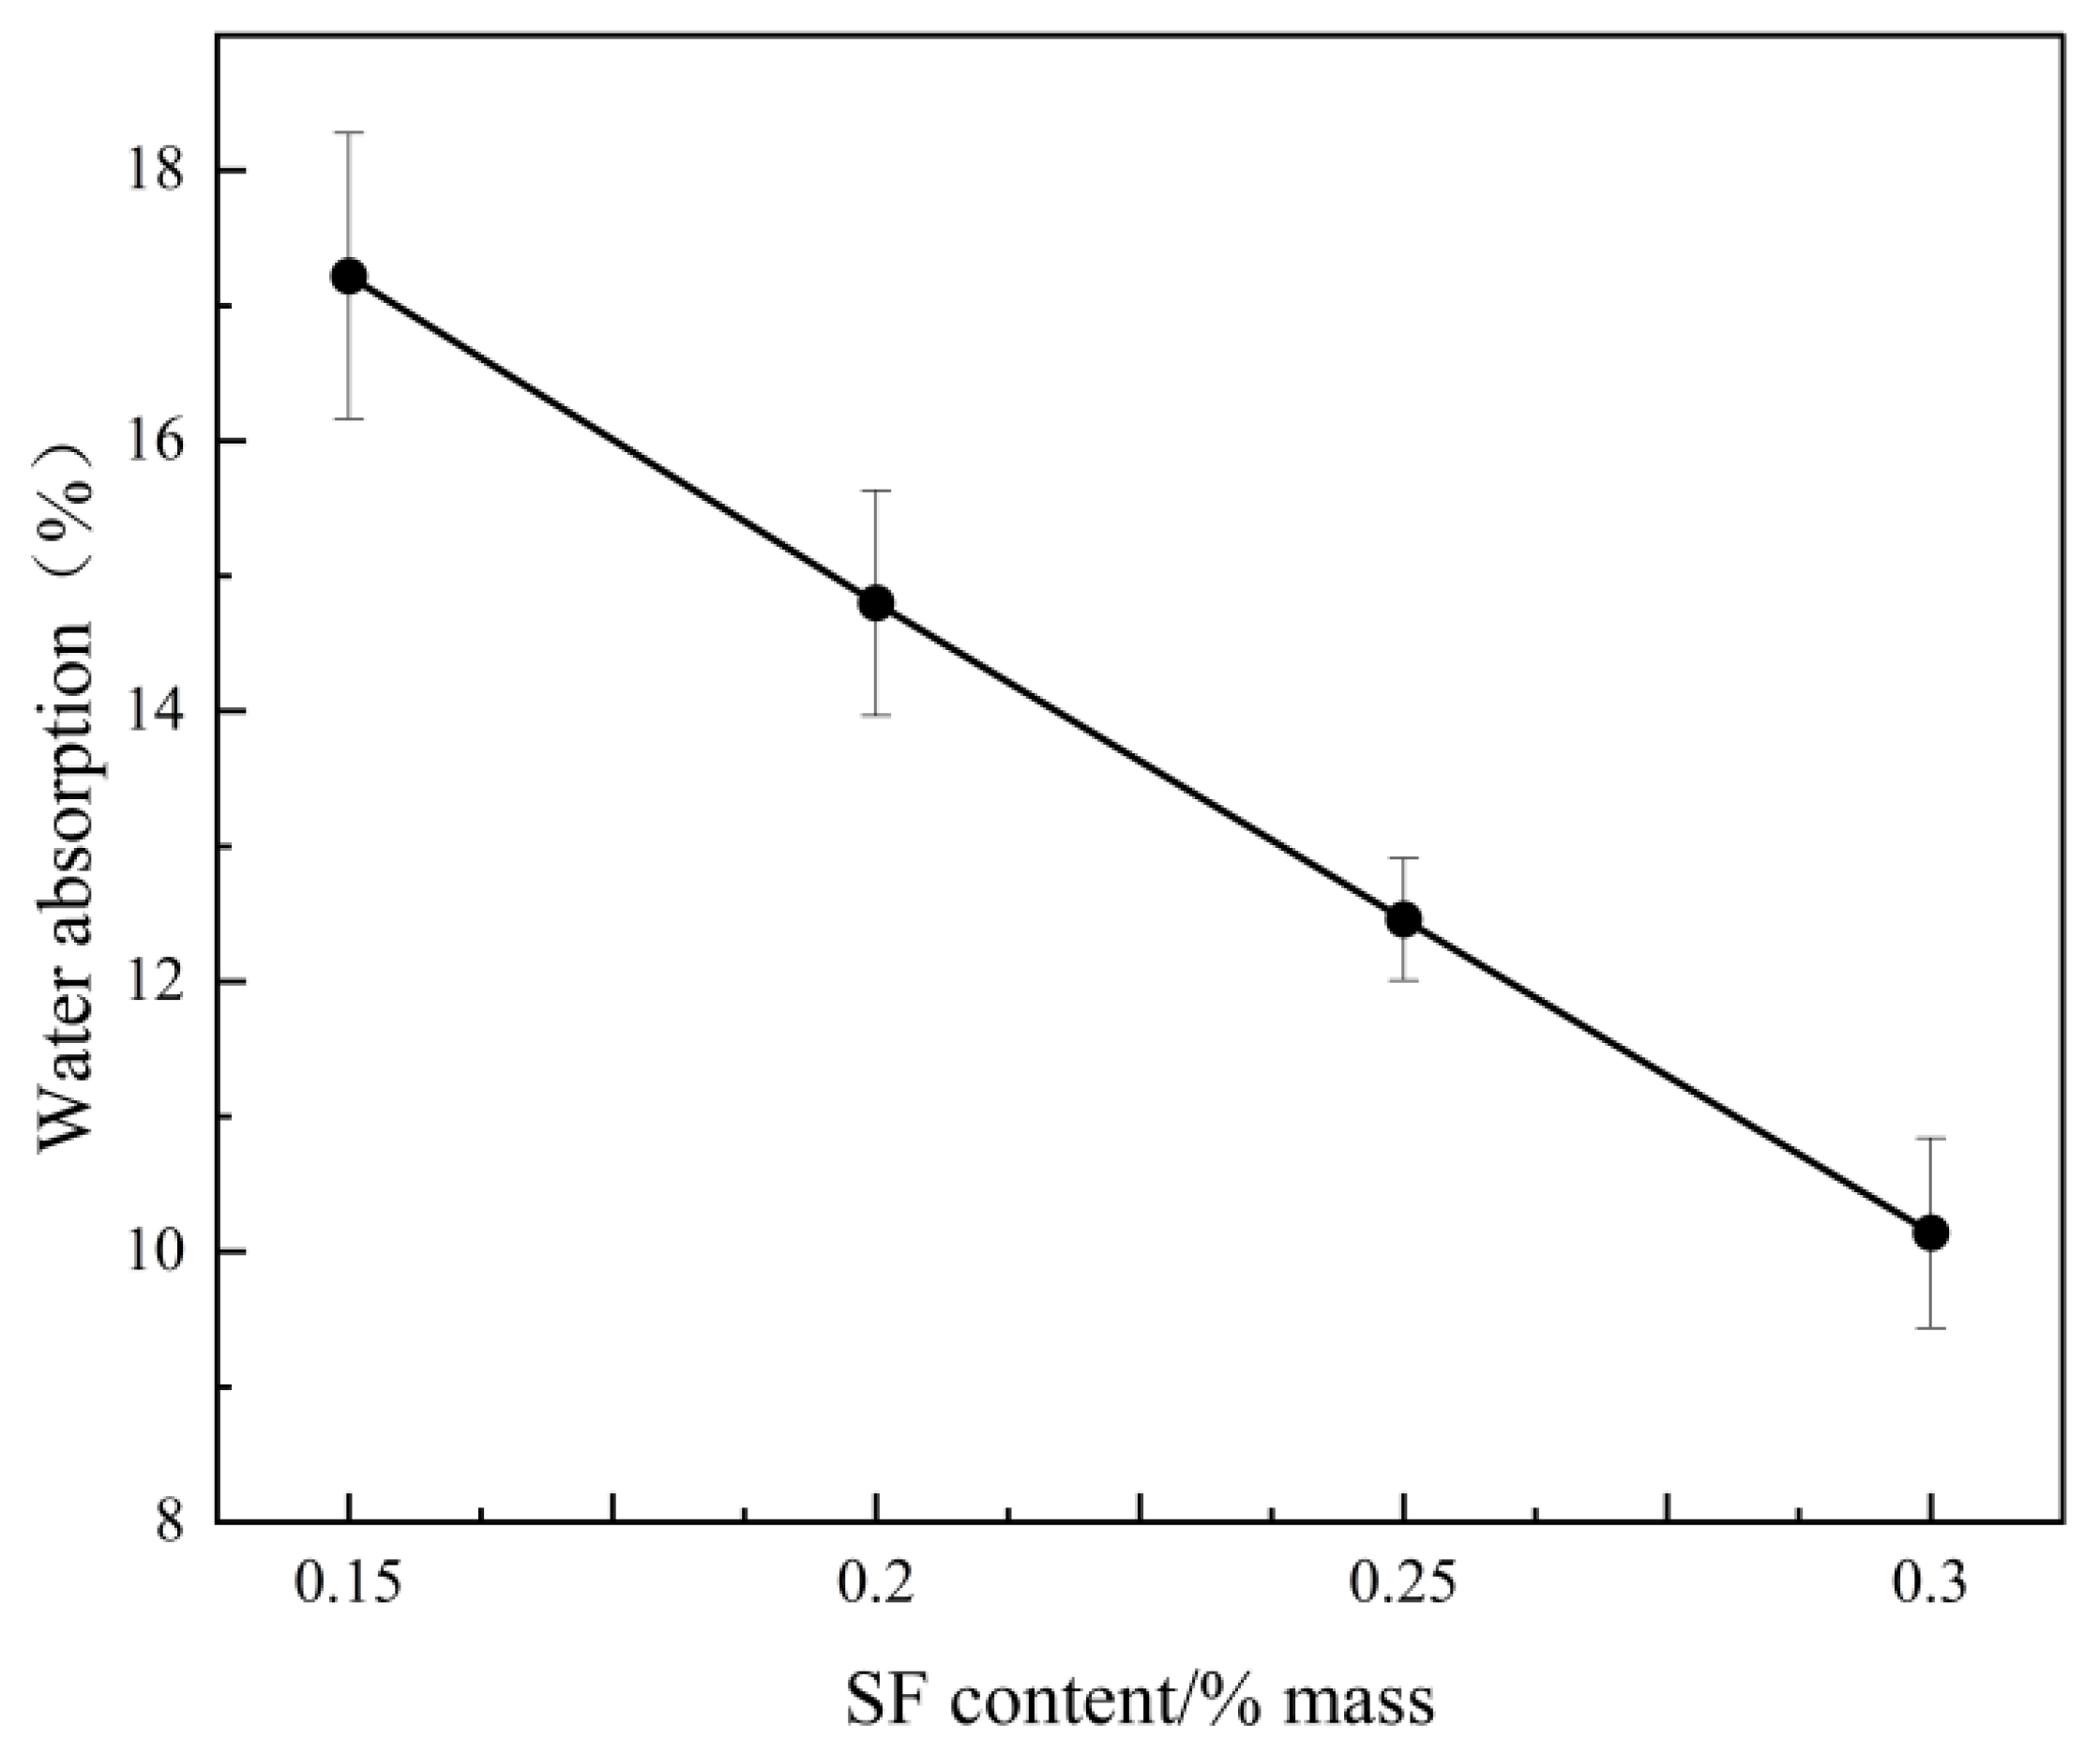
As shown in Figure 7, with the increase in SF content, the water absorption of SFFC gradually decreases, which is the result of the pozzolanic reaction between SF and cement hydration products. Because SiO2 in SF and Ca(OH)2 crystals in cement hydration products produce C-S-H gel with better cementitious properties and a denser structure, the compactness and impermeability of SFFC are significantly improved, which makes it more difficult for water to penetrate into the test specimen from the pore wall. However, when the water absorption is too low, the bonding performance between different materials inside the SFFC is significantly reduced. At the same time, in the case of high temperature, due to the lack of free water and bound water inside the SFFC, it completes rapid vaporization, resulting in severe skin peeling and even explosive cracking of the structure. According to the curve in Figure 7, when the SF content is 0.25%, it can not only maintain good impermeability but also avoid low water absorption, and its working performance is the best.
Figure 7.
Effect of SF content on water absorption.
3. Mechanical Property Test After Exposure to High Temperatures
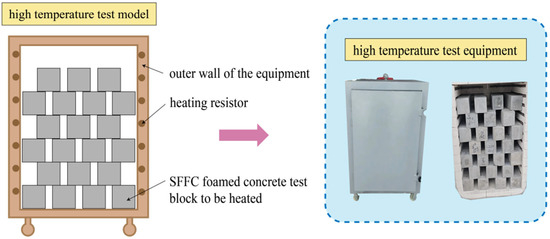
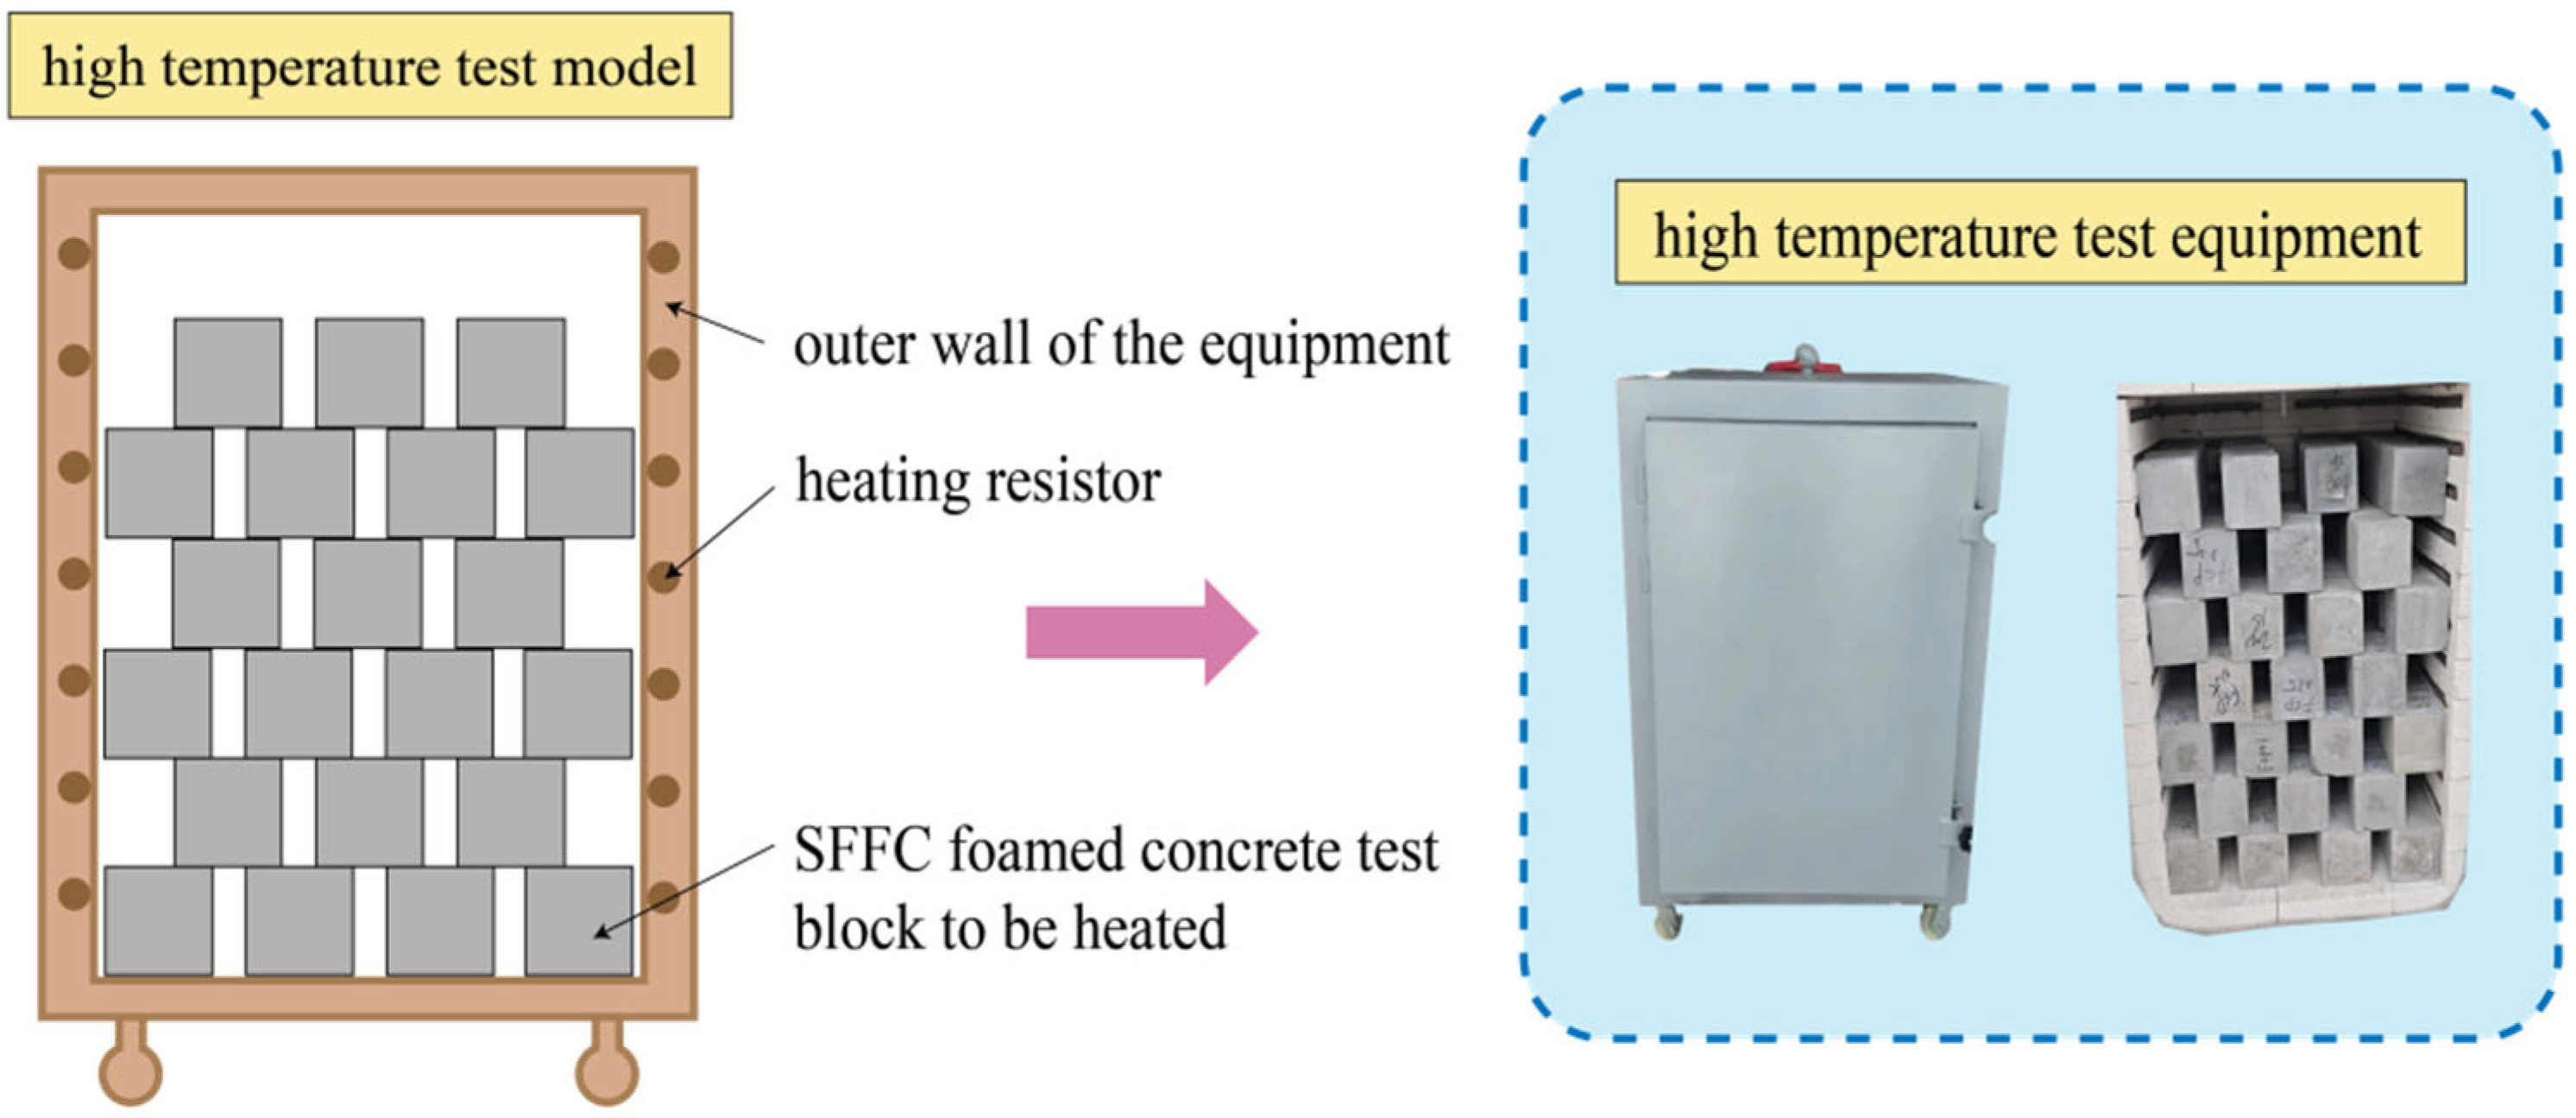
As shown in Figure 8, resistance wire high-temperature heating equipment (temperature range 20–1200 °C, fluctuation ± 0.5 °C) was used in this test. The specific test method was as follows: first, the size and initial state (such as mass, apparent morphology, etc.) of SFFC standard cubes was recorded, the test specimen was placed in a staggered manner according to the placement method shown in Figure 8, the temperature of the high-temperature test was set to 100 °C, 200 °C, 300 °C, 400 °C, and then the test specimen was heated to the target temperature at the rate of 20 °C/min for 1 h. Finally, after the test, natural cooling was used to reduce the temperature of the test specimen to room temperature and the quality and apparent morphology of the test specimen was recorded.
Figure 8.
High-temperature test.
3.1. Apparent Morphology of SFFC
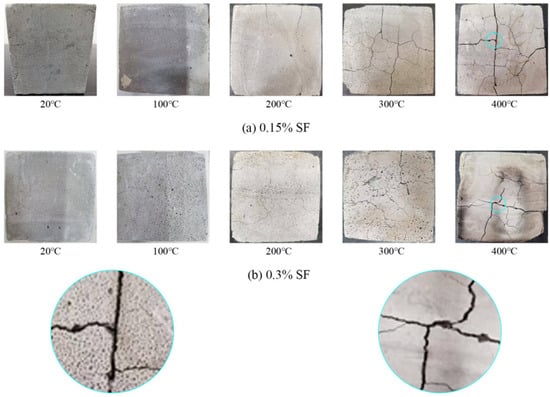
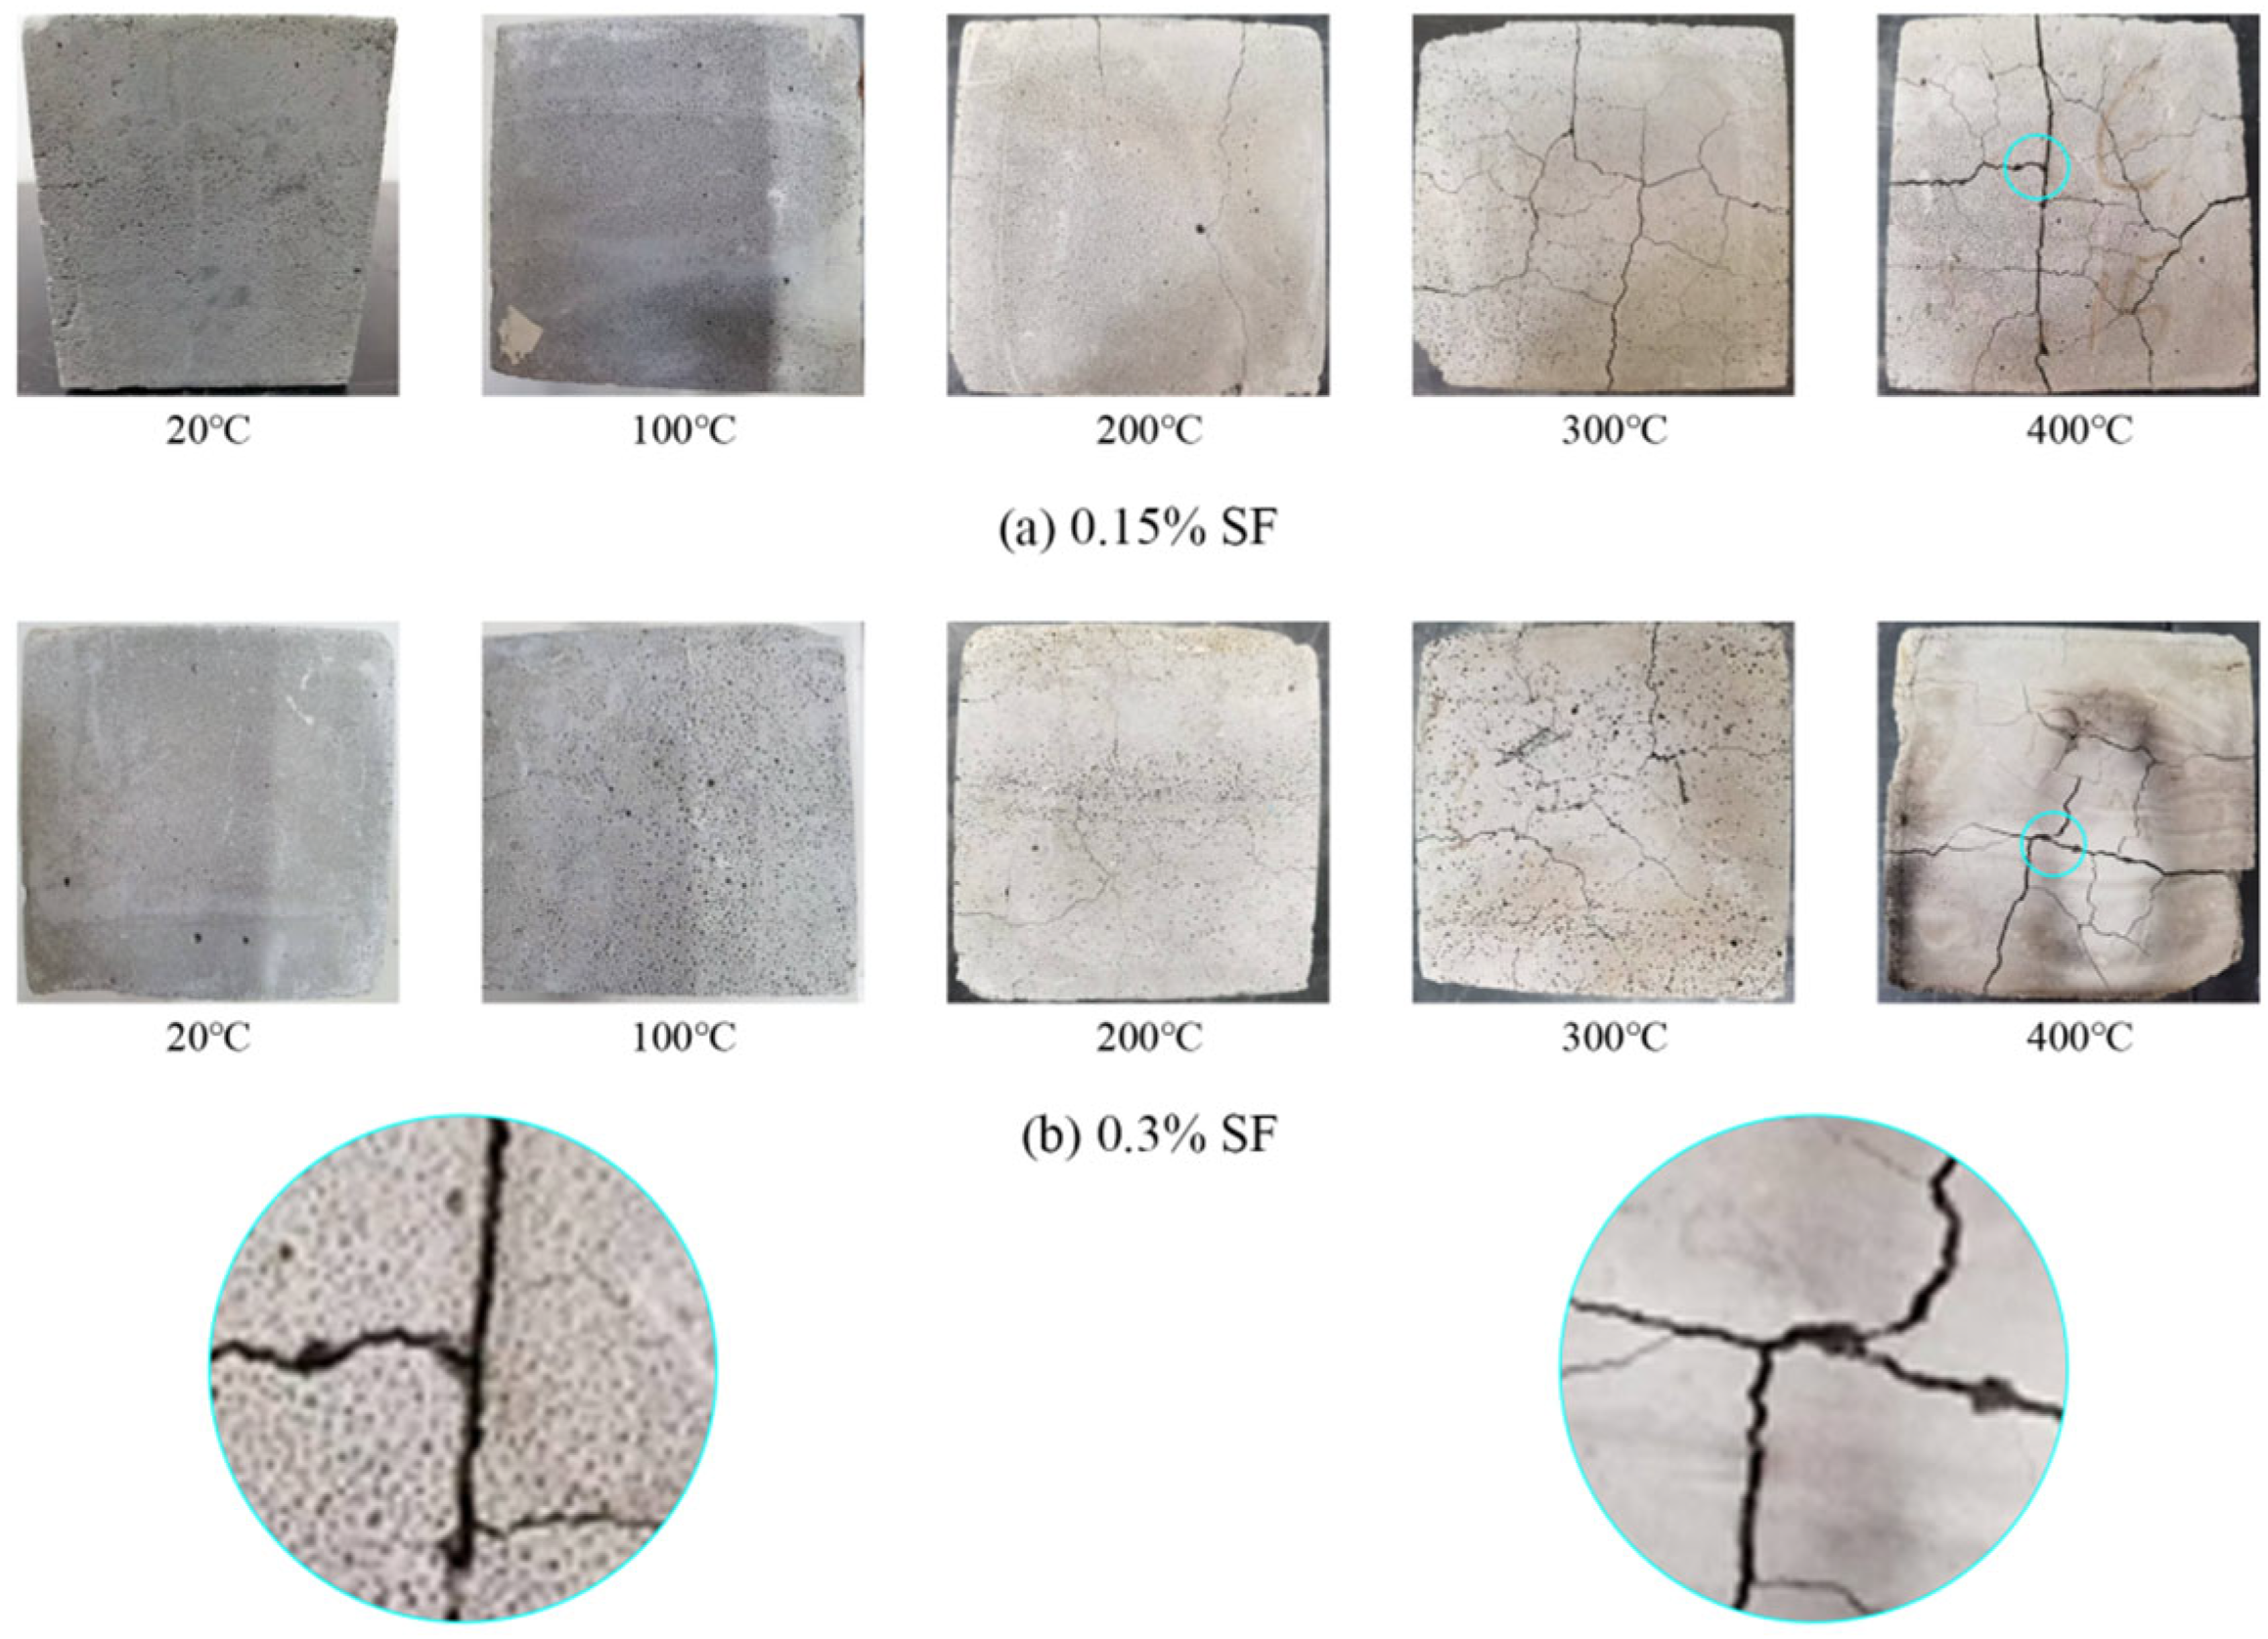
It can be seen from Figure 9 that with the continuous increase in temperature, the color of the SFFC test specimen gradually turned yellow and dark, and there was massive spalling around the test specimen and large through cracks. Comparing the two groups of photos (a) and (b), the color change and crack development of the test specimen with the SF content of 0.3% were relatively lagging behind, which is because the higher SF content made the matrix more dense and had better resistance to early thermal damage and dehydration shrinkage. When the temperature reached 400 °C, the failure mode of the test specimen with the 0.15% SF content showed coarse cracks and massive spalling. Compared with the test specimen with the 0.3% SF content, the matrix was relatively loose, the internal steam pressure was easy to release, and the failure mode was a more brittle fracture. The test specimen with the SF content of 0.3% was more severely damaged: the local darkening of the test specimen surface was more obvious, the carbonation was more sufficient, and the crack network was more dense. This was because the dense matrix with the high SF content hindered the escape of water vapor at high temperatures, resulting in higher internal pressure and making it more prone to overall pulverization. This shows that an appropriate addition of SF can improve the performance of FC at medium and low temperatures and delay the thermal damage, but too high an SF content will lead to more severe damage at high temperatures.
Figure 9.
Apparent morphology of SFFC test specimen after exposure to high temperatures: (a) 0.15% SF, (b) 0.3% SF.
3.2. Mass Loss Rate
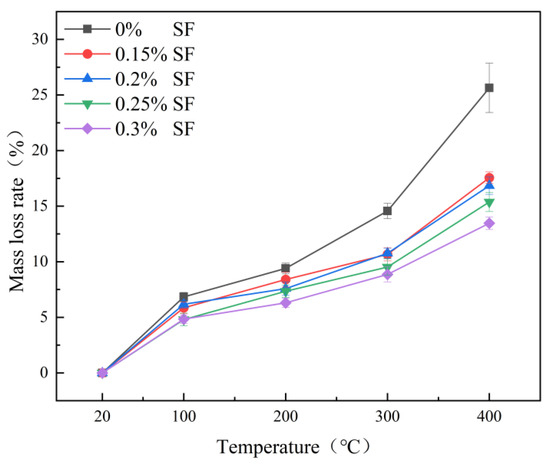
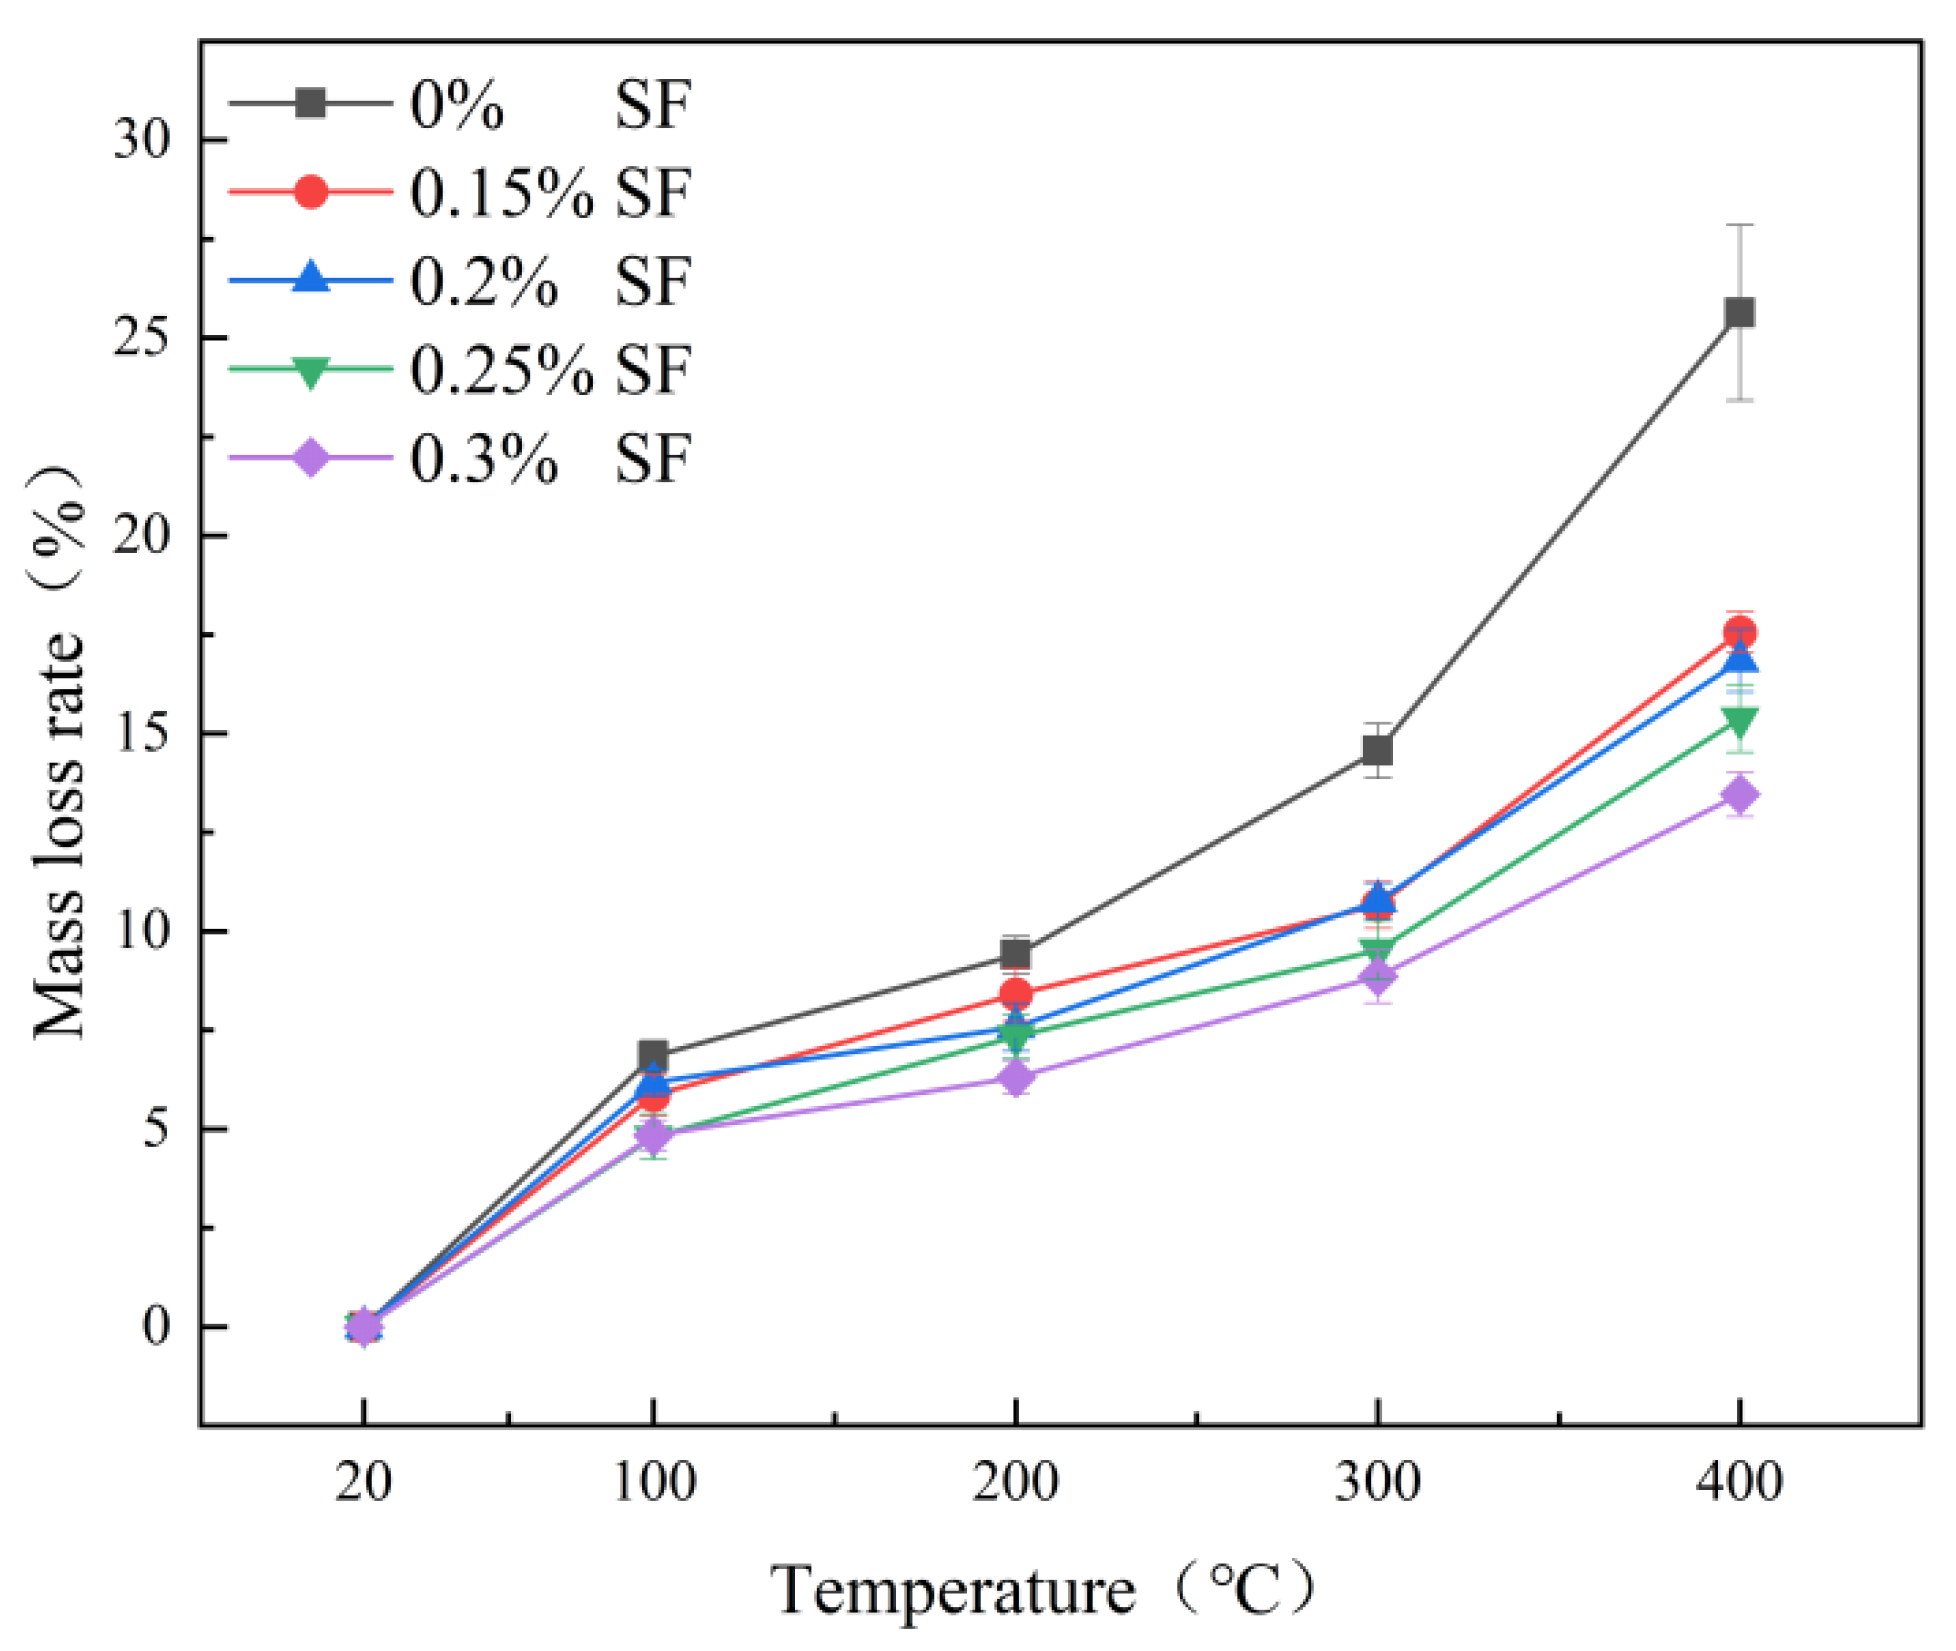
The mass loss rate is an important indicator for measuring the durability of SFFC in high-temperature environments. As can be seen from Figure 10, for all the test specimens with SF content, the mass loss rate increased with the increase in temperature. At the 100–200 °C stage, the growth rate of the mass loss rate was relatively gentle. At this time, free water evaporation was dominant in the SFFC, and the test specimen could still maintain a complete shape; at the 200–300 °C stage, the growth rate of the mass loss rate began to accelerate, which was due to the massive debris caused by thermal damage around the test specimen when the test specimen began to enter the dehydration stage of bound water and some cement hydration products. At the 300–400 °C stage, the mass loss rate and its growth rate reached the highest point, which was the result of significant decomposition of key hydration products in the test specimen and massive spalling on the surface of the test specimen. At the same time, it can be seen from Figure 10 that the mass loss rate of the test specimen with the 0.3% SF content was the lowest; that is, at the same temperature, the mass loss rate of the test specimen with higher SF content was generally lower than that of the test specimen without the SF content, and generally within the test range, the higher the SF content, the lower the mass loss rate, which is the result of the joint action of SF physical filling and pozzolanic reaction.
Figure 10.
Relationship between mass loss rate and temperature of SFFC test specimen with different SF content.
The formula for mass loss rate is as follows:
3.3. Residual Compressive Strength
3.3.1. Test Method
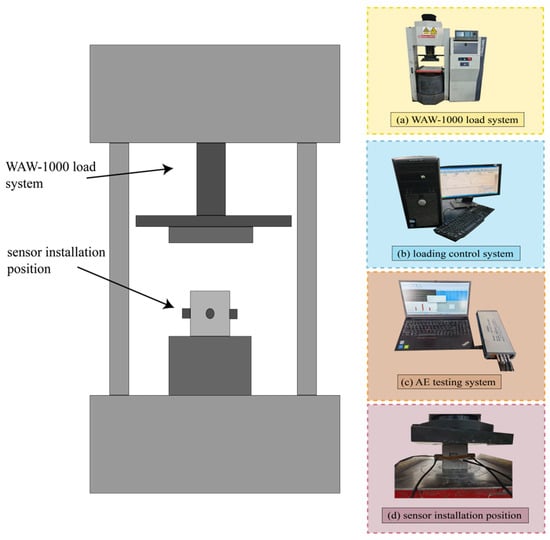
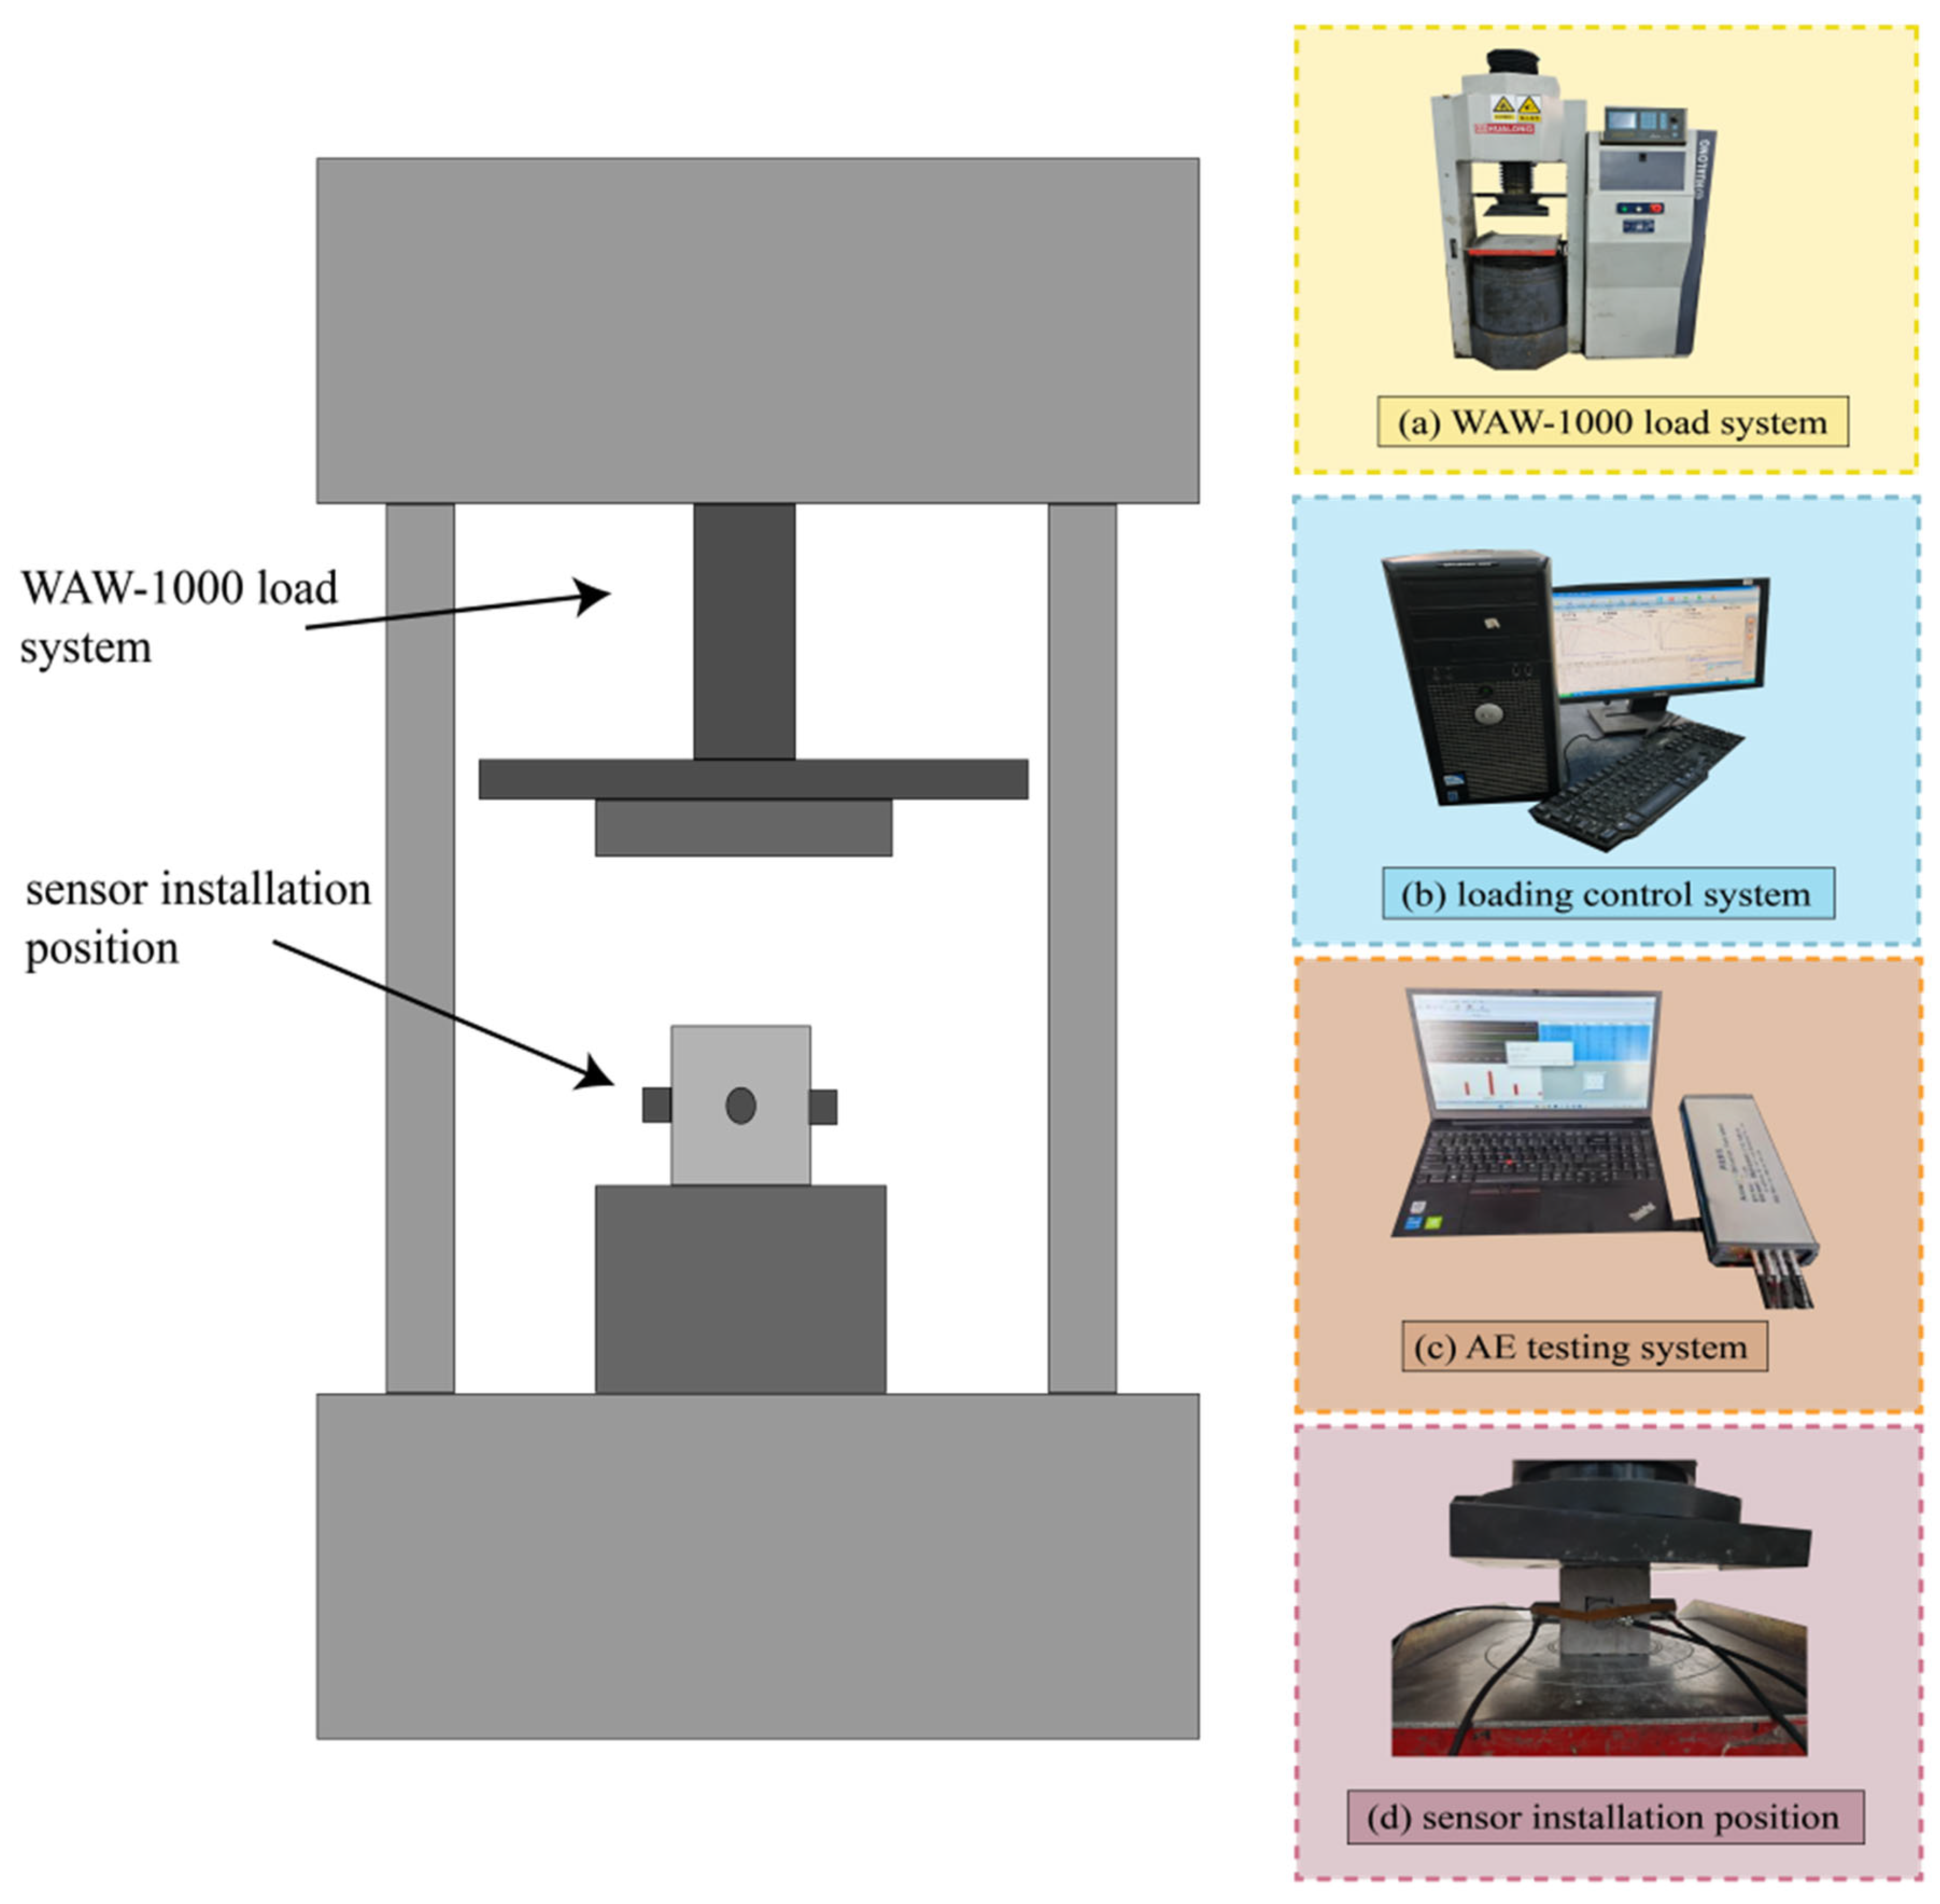
Residual compressive strength is also one of the important indicators for measuring the durability of SFFC in high-temperature environments. The strength change in SFFC before and after exposure to high temperatures was measured through a compressive strength test, and then the durability of the SFFC was evaluated. In this test, the WAW-1000 microcomputer-controlled electro-hydraulic servo universal testing machine was used to pressurize the 100 × 100 × 100 mm SFFC test specimen after exposure to high-temperature testing at a loading rate of 0.2 MPa. At the same time, the digital AE equipment (SAEU3H) was used to collect the AE signals during the failure process of the test specimen so as to further and comprehensively study the mechanical properties and damage mode of SFFC. Refer to Figure 11 for specific test equipment.
Figure 11.
Compressive strength and AE testing equipment.
3.3.2. Result Analysis
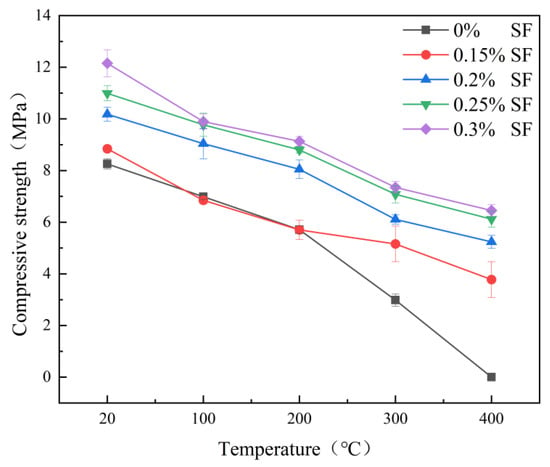
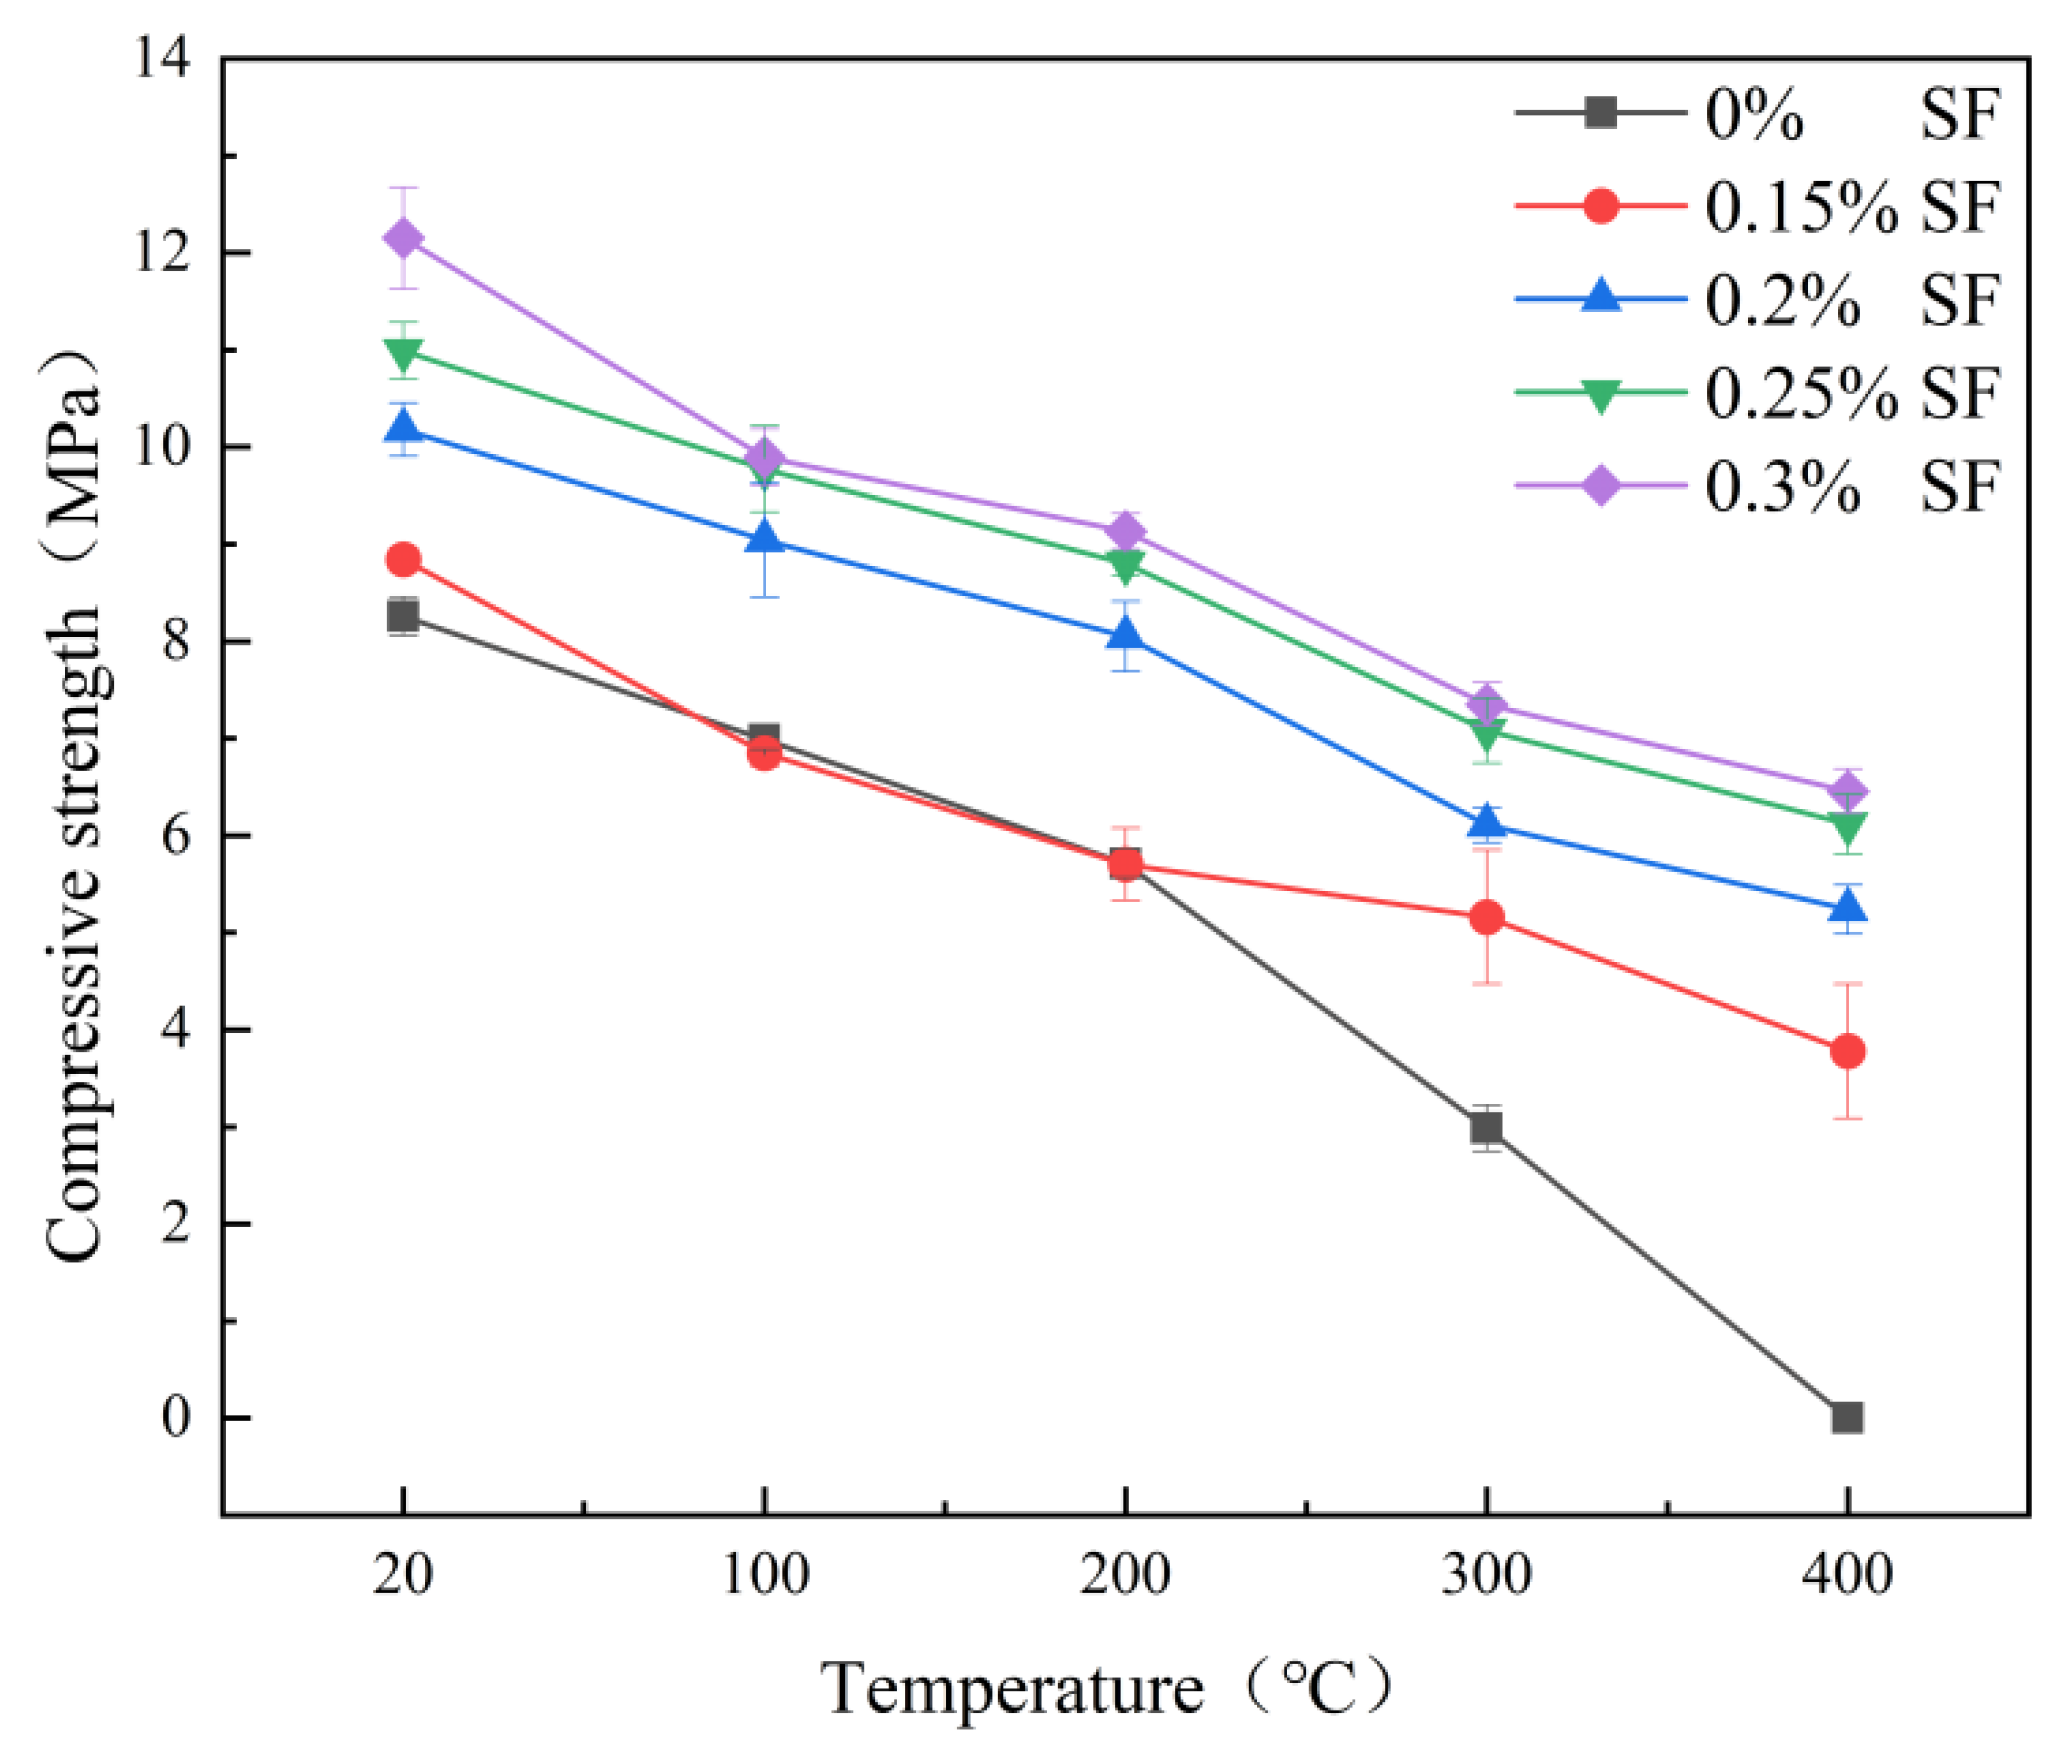
As shown in Figure 12, the compressive strength of SFFC gradually increases with the increase in SF content. Comparing the compressive strength of the test specimens with different SF contents, the compressive strength of SFFC with an SF content of 0.2% is significantly higher than that of SFFC with an SF content of 0.15%, and the compressive strength of SFFC with an SF content of 0.25% is also higher than the former two, but the improvement effect begins to weaken. The improvement effect of the compressive strength of SFFC with an SF content of 0.3% is significantly weaker than that of SFFC with an SF content of 0.25%, and the strength curve is basically coincident, indicating that the enhancement effect of SF content on the compressive strength of SFFC is not unlimited. High SF content makes redundant particles agglomerate inside the test specimen and has no obvious effect on compressive strength.
Figure 12.
Relationship between compressive strength and temperature.
From the point of view of temperature, with the continuous increase in temperature, all SFFCs with SF content show different degrees of strength deterioration. The test specimen without SF was destroyed rapidly under the action of high temperature. When the temperature reached 400 °C, the test specimen basically failed. The test specimen with SF maintained a certain residual strength. It can be seen that SF played a role in delaying the destruction of SFFC under high-temperature environments. As shown in Figure 12, the destruction rate of the SF content test specimen increased significantly at 300 °C because the dense structure formed by SF cannot effectively eliminate the internal steam pressure and thermal stress at high temperature, resulting in more severe and thorough destruction of SFFC at high temperature. To sum up, the addition of SF can improve the mechanical strength of FC at medium and low temperatures and delay thermal damage, but too high an SF content will lead to more severe damage at high temperatures, which will do more harm than good to FC.
3.4. Failure Mechanism Analysis of SFFC After Exposure to High Temperatures
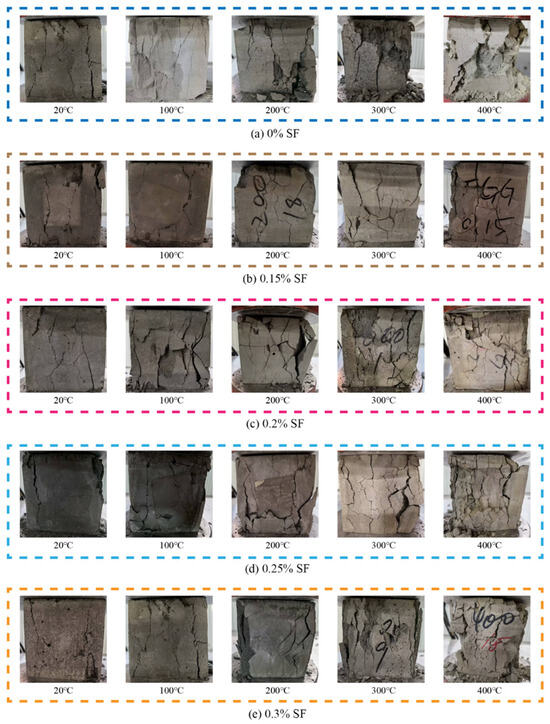
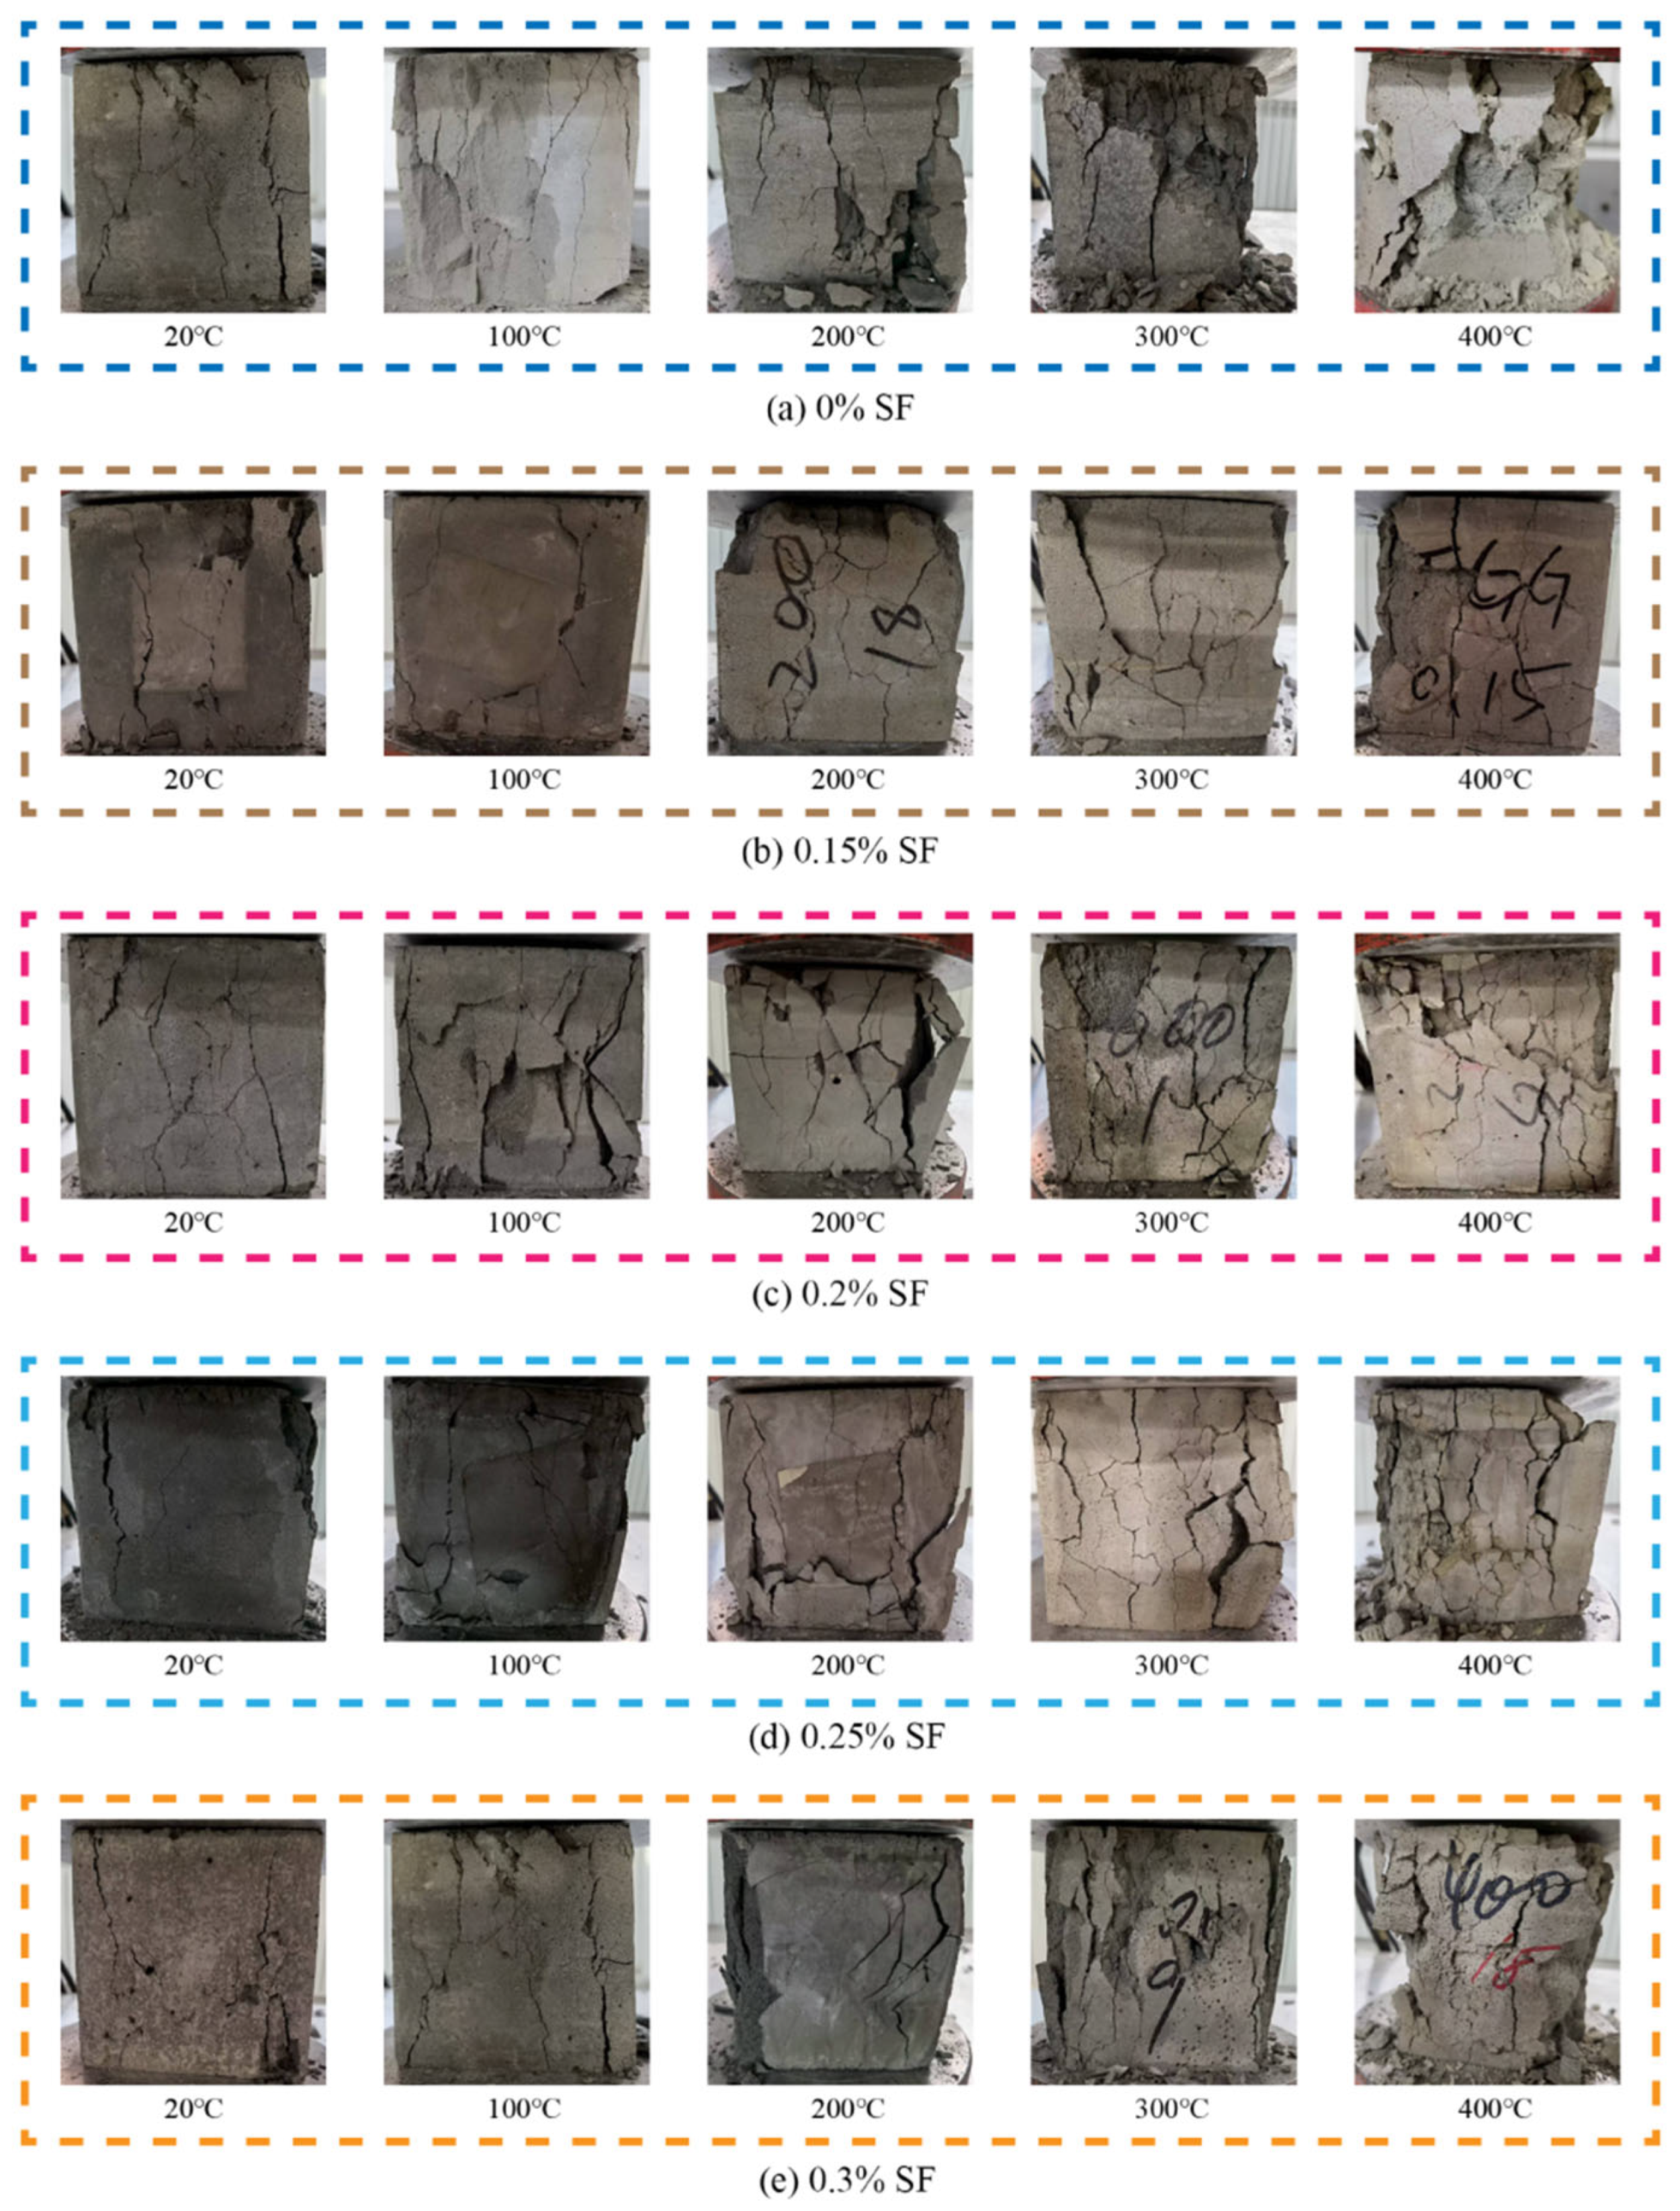
It can be seen from Figure 13 that with the increase in SF content at room temperature, the failure surface of SFFC changes from relatively rough to straight and neat, and the cracks change from wide to fine, which reflects the strengthening effect of SF on the internal structure of FC. The dense matrix formed by SF is helpful in delaying the occurrence of failure at room temperature.
Figure 13.
Failure modes of SFFC test specimens after exposure to high temperatures.
At 100 °C and 200 °C, although SFFC with a high SF content has massive spalling, it still maintains a relatively complete matrix. Compared with the test specimen without SF, the cracks are small and develop relatively regularly. At this time, SF still plays a role in delaying the damage, but the effect is slightly worse than that at normal temperature.
At 300 °C and 400 °C, with the increase in SF content, SFFC shows more severe damage, the overall pulverization occurs, the test specimens are completely scattered, and the fragments are fine. At this time, the dense matrix formed by the high silicon content hinders the discharge of internal steam pressure and thermal stress, which makes SFFC burst and disintegrate at high temperatures.
To sum up, the influence of SF on the high-temperature failure mode of FC includes both the strengthening effect on FC at medium and low temperatures and the effect of accelerating the failure of FC at high temperatures. When designing SFFC, it is necessary to accurately control the balance between low-temperature performance and high-temperature stability. At this time, it can be seen from Figure 13 that SFFC with an SF content of 0.25% can not only effectively delay the occurrence of damage at medium and low temperatures but also ensure a relatively complete skeleton structure at high temperatures, and the material has the best performance.
3.5. Microscopic Analysis of SFFC After High Temperature
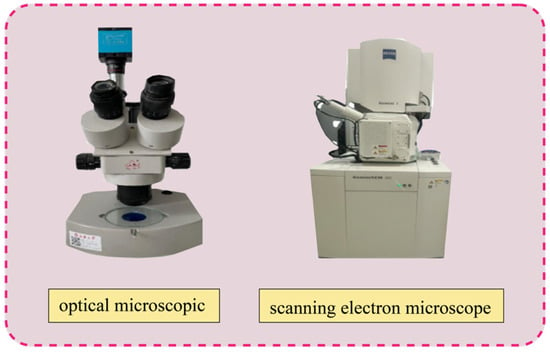
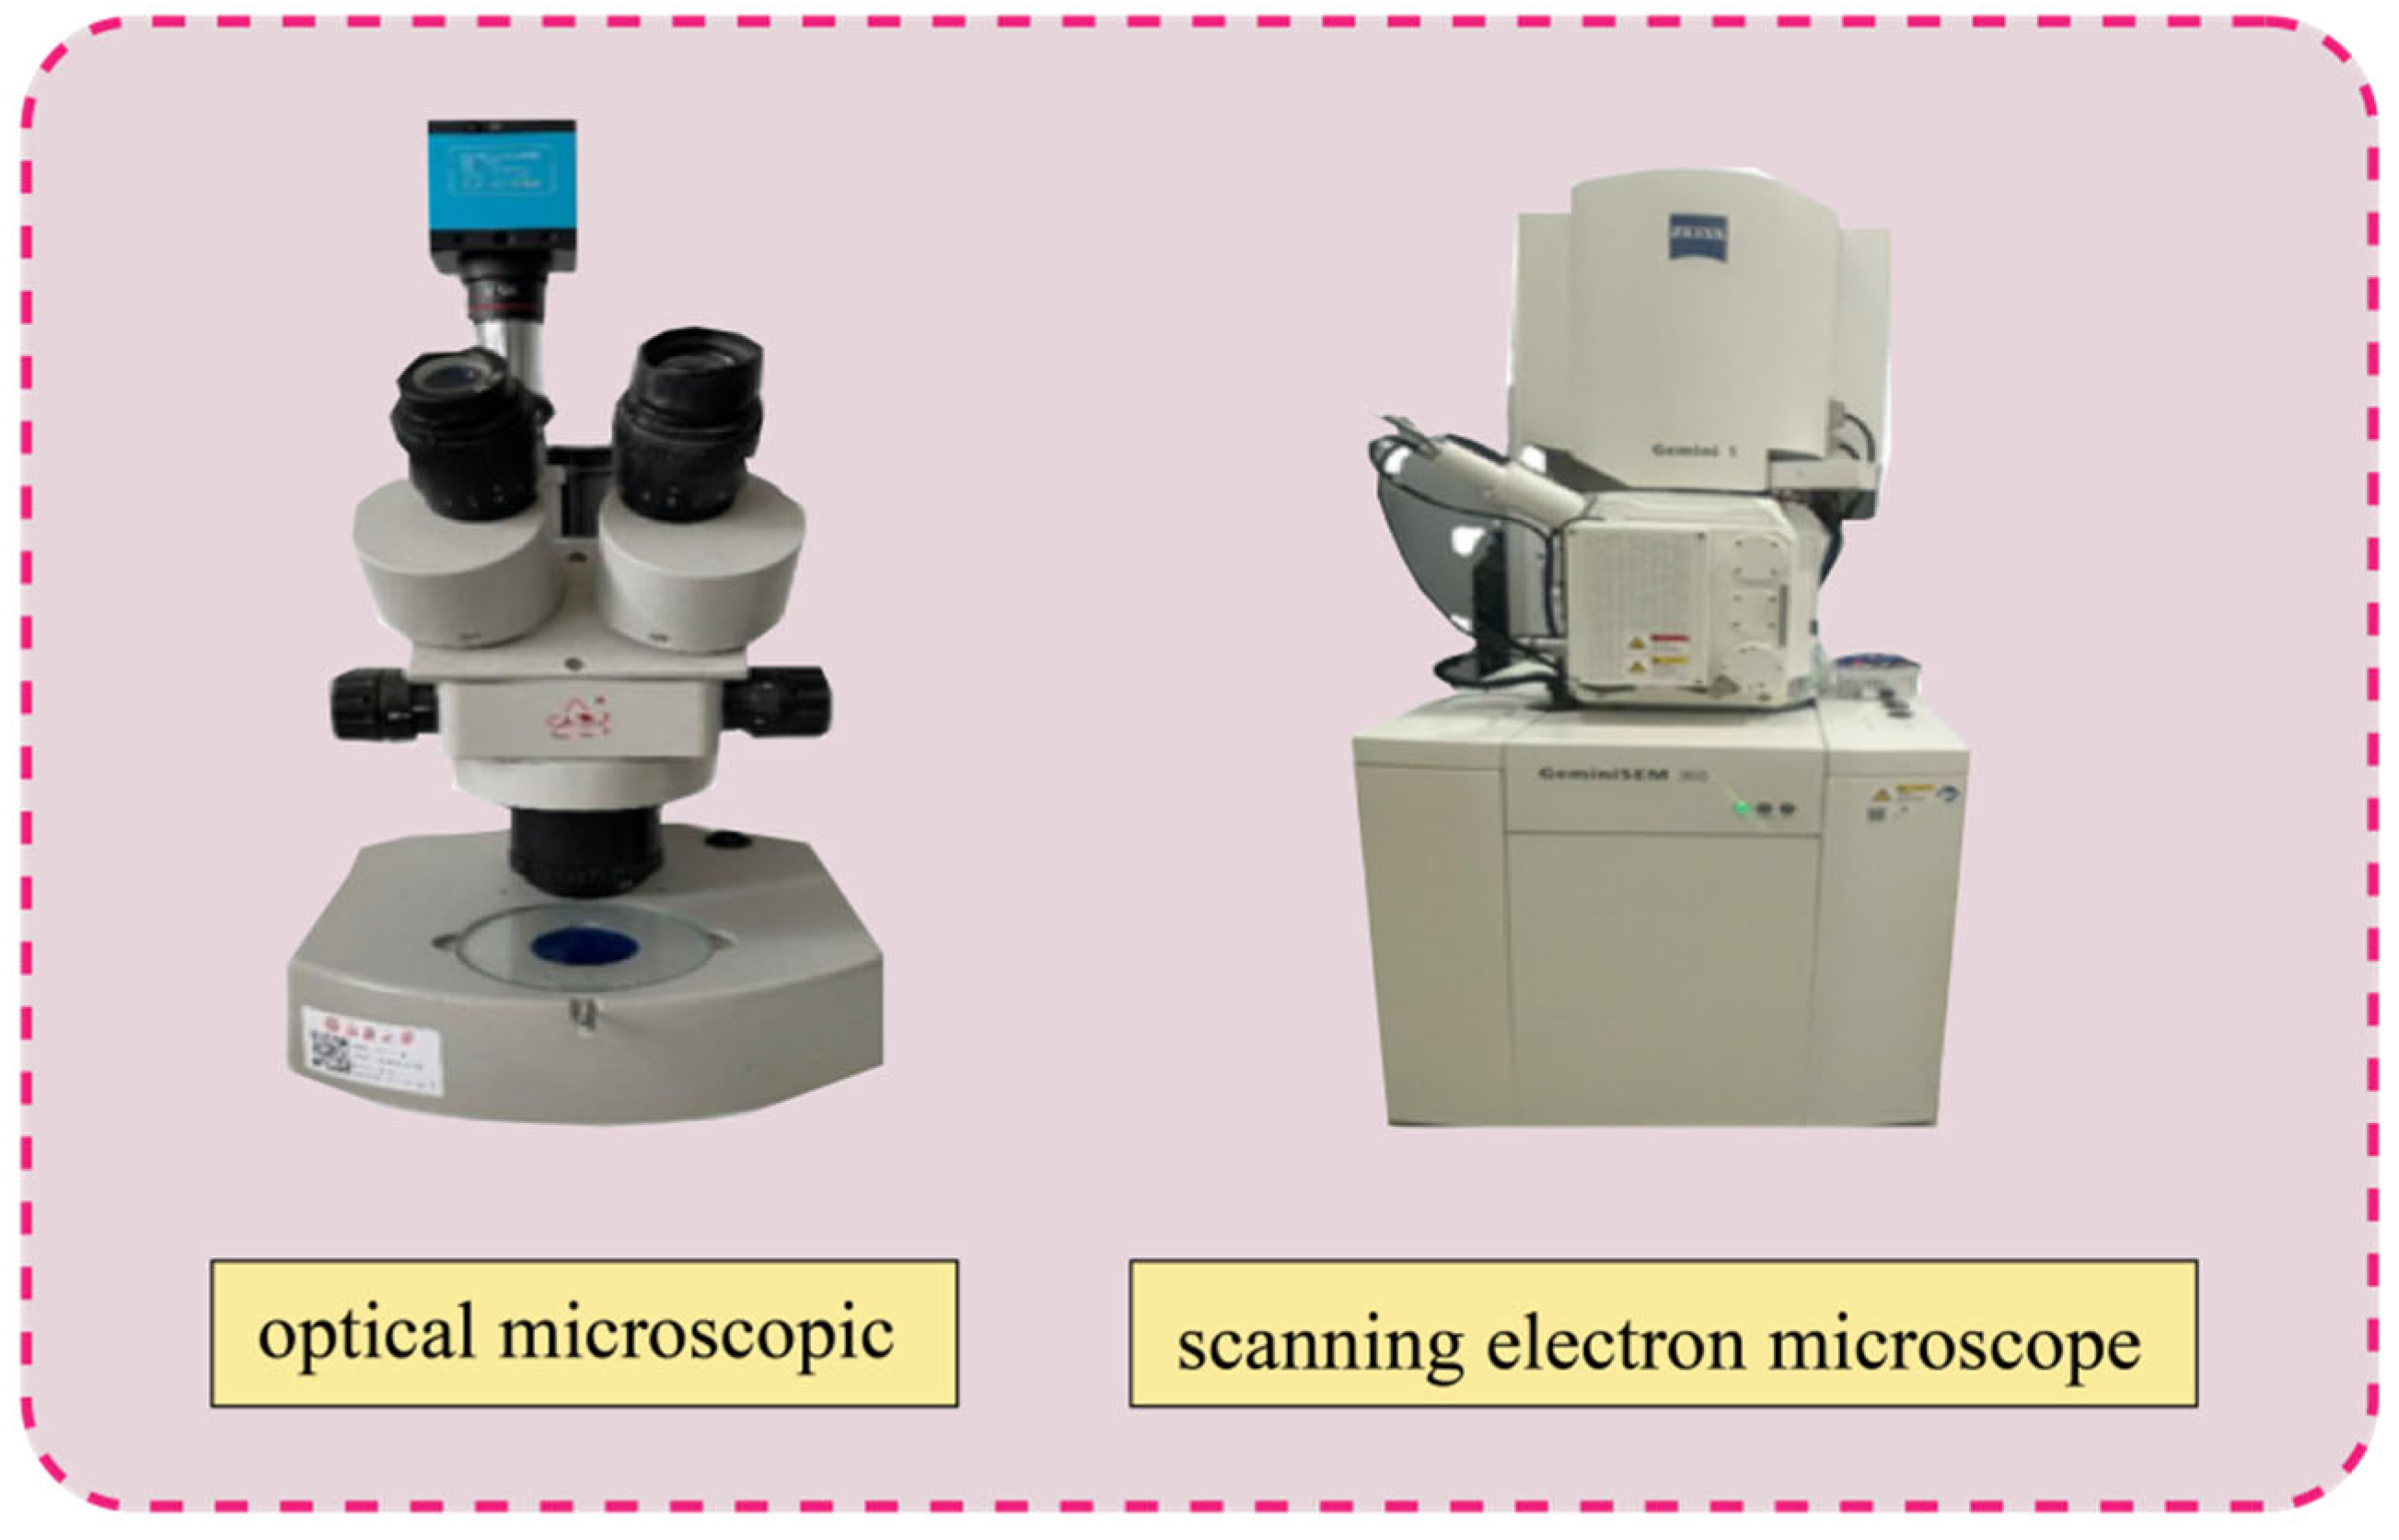
Microstructure analysis of SFFC is a key means to deeply study the internal relationship between its macro performance and micro morphology [29]. In this experiment, the macro pore structure of SFFC, including the size, shape and distribution uniformity of pores, was observed by an optical microscope; SEM technology was used to observe the microstructure of SFFC, including pore structure, hydration products after cement hydration (C-S-H gel and calcium hydroxide crystal) and the action mechanism of SF. The specific test equipment is shown in Figure 14.
Figure 14.
Microscopic analysis equipment.
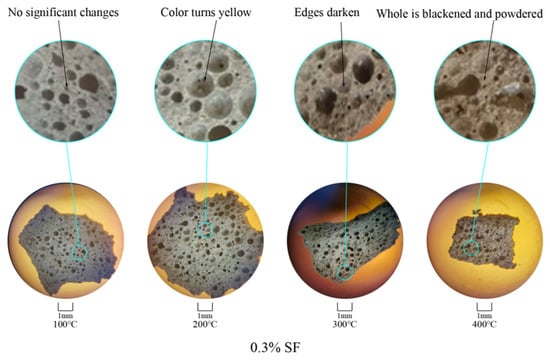
In order to study the influence of SF on the macro strength and microstructure of FC, the morphological changes in SFFC specimens with an SF content of 3% at different temperatures were observed by an optical microscope. It can be seen from Figure 15 that the structure of the SFFC test specimen is more uniform and dense than that of ordinary FC because SF is added to fill the gaps between cement particles and pores.
Figure 15.
Microscopic morphology of 0.3% SFFC test specimen at different temperatures.
At 100 °C, the color and structure of the test specimen remain basically unchanged, with the main change being physical changes. The free water existing in the pores of the test specimen evaporates when heated. However, because the bonding between free water and cement hydration products is very small, its evaporation does not damage the chemical structure of hydration products such as C-S-H gel and hydroxide. Therefore, the microstructure of the test specimen is basically unaffected, and its porous structure shows good stability at 100 °C.
At 200 °C, the test specimen can still maintain a relatively dense structure, but the surface color of the test specimen begins to turn yellow and the edges begin to darken. At this time, the test specimen starts to lose the bound water in the C-S-H gel, and the impurities in the hydroxide change in form or valence. Under the action of both, the test specimen starts to appear yellow, and its thermal damage starts to intensify due to the rise in temperature. The edge area of the test specimen undergoes slight carbonization, leading to the edge becoming black and dark. However, due to the physical filling effect of SF, the thermal damage process is delayed, and the strength degradation of the test specimen starts to accelerate; however, the overall structure change is not significant.
At 300 °C, the structural damage of the test specimen intensifies, and the pores begin to show a trend of destruction and connectivity. The darkened areas at the edges expand inward, and the overall color is darker. At this time, the main hydroxide Ca(OH)2 in the test specimen begins to decompose, which will release a large amount of water vapor and generate steam pressure inside the test specimen. The dense structure formed by SF instead starts to increase the internal pressure of the test specimen. At the same time, the C-S-H gel loses a large amount of bound water, and the gellability is greatly lost, leading to the collapse of the structural stability of the test specimen and the sharp decline of the macro strength.
At 400 °C, the test specimen begins to pulverize, with basic structural damage, completely connected pores, overall blackening, and significant carbonization. The C-S-H gel completely loses its gelling ability, and the large number of pores increase the transmission of heat and internal steam pressure, which accelerates the damage of the test specimen. At this temperature, the bonding effect between SF and the matrix is lost, and its strengthening effect on the structure also disappears. The structure and strength of the test specimen are basically lost, and the test specimen is in a failure state.
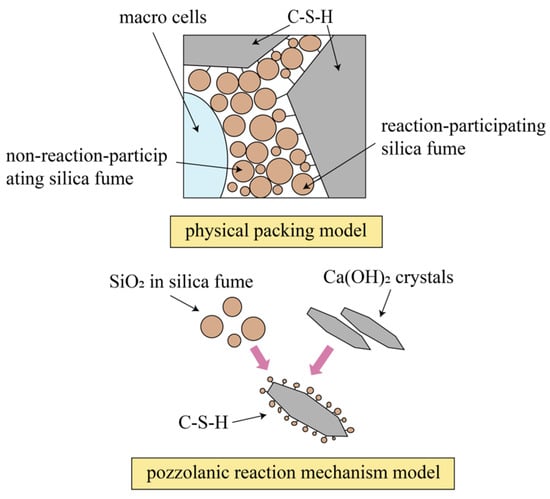
The physical filling effect of SF and the mechanism of volcanic ash reaction are shown in Figure 16.
Figure 16.
Physical filling effect of SF and volcanic ash reaction.
In order to further study the influence of SF on the macro strength and microstructure of FC, an SEM scanning electron microscope was used to observe the microstructure changes in the SFFC test specimen with an SF content of 3% at different temperatures.
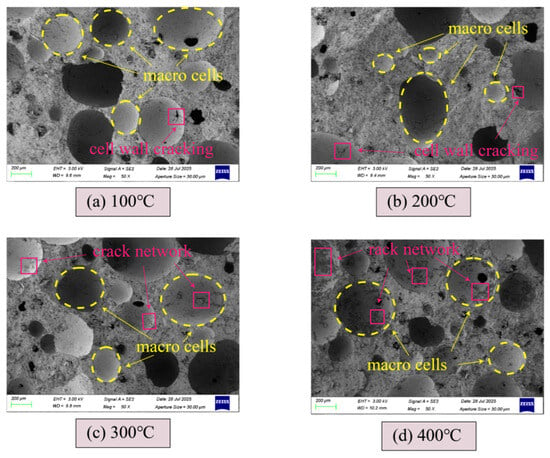
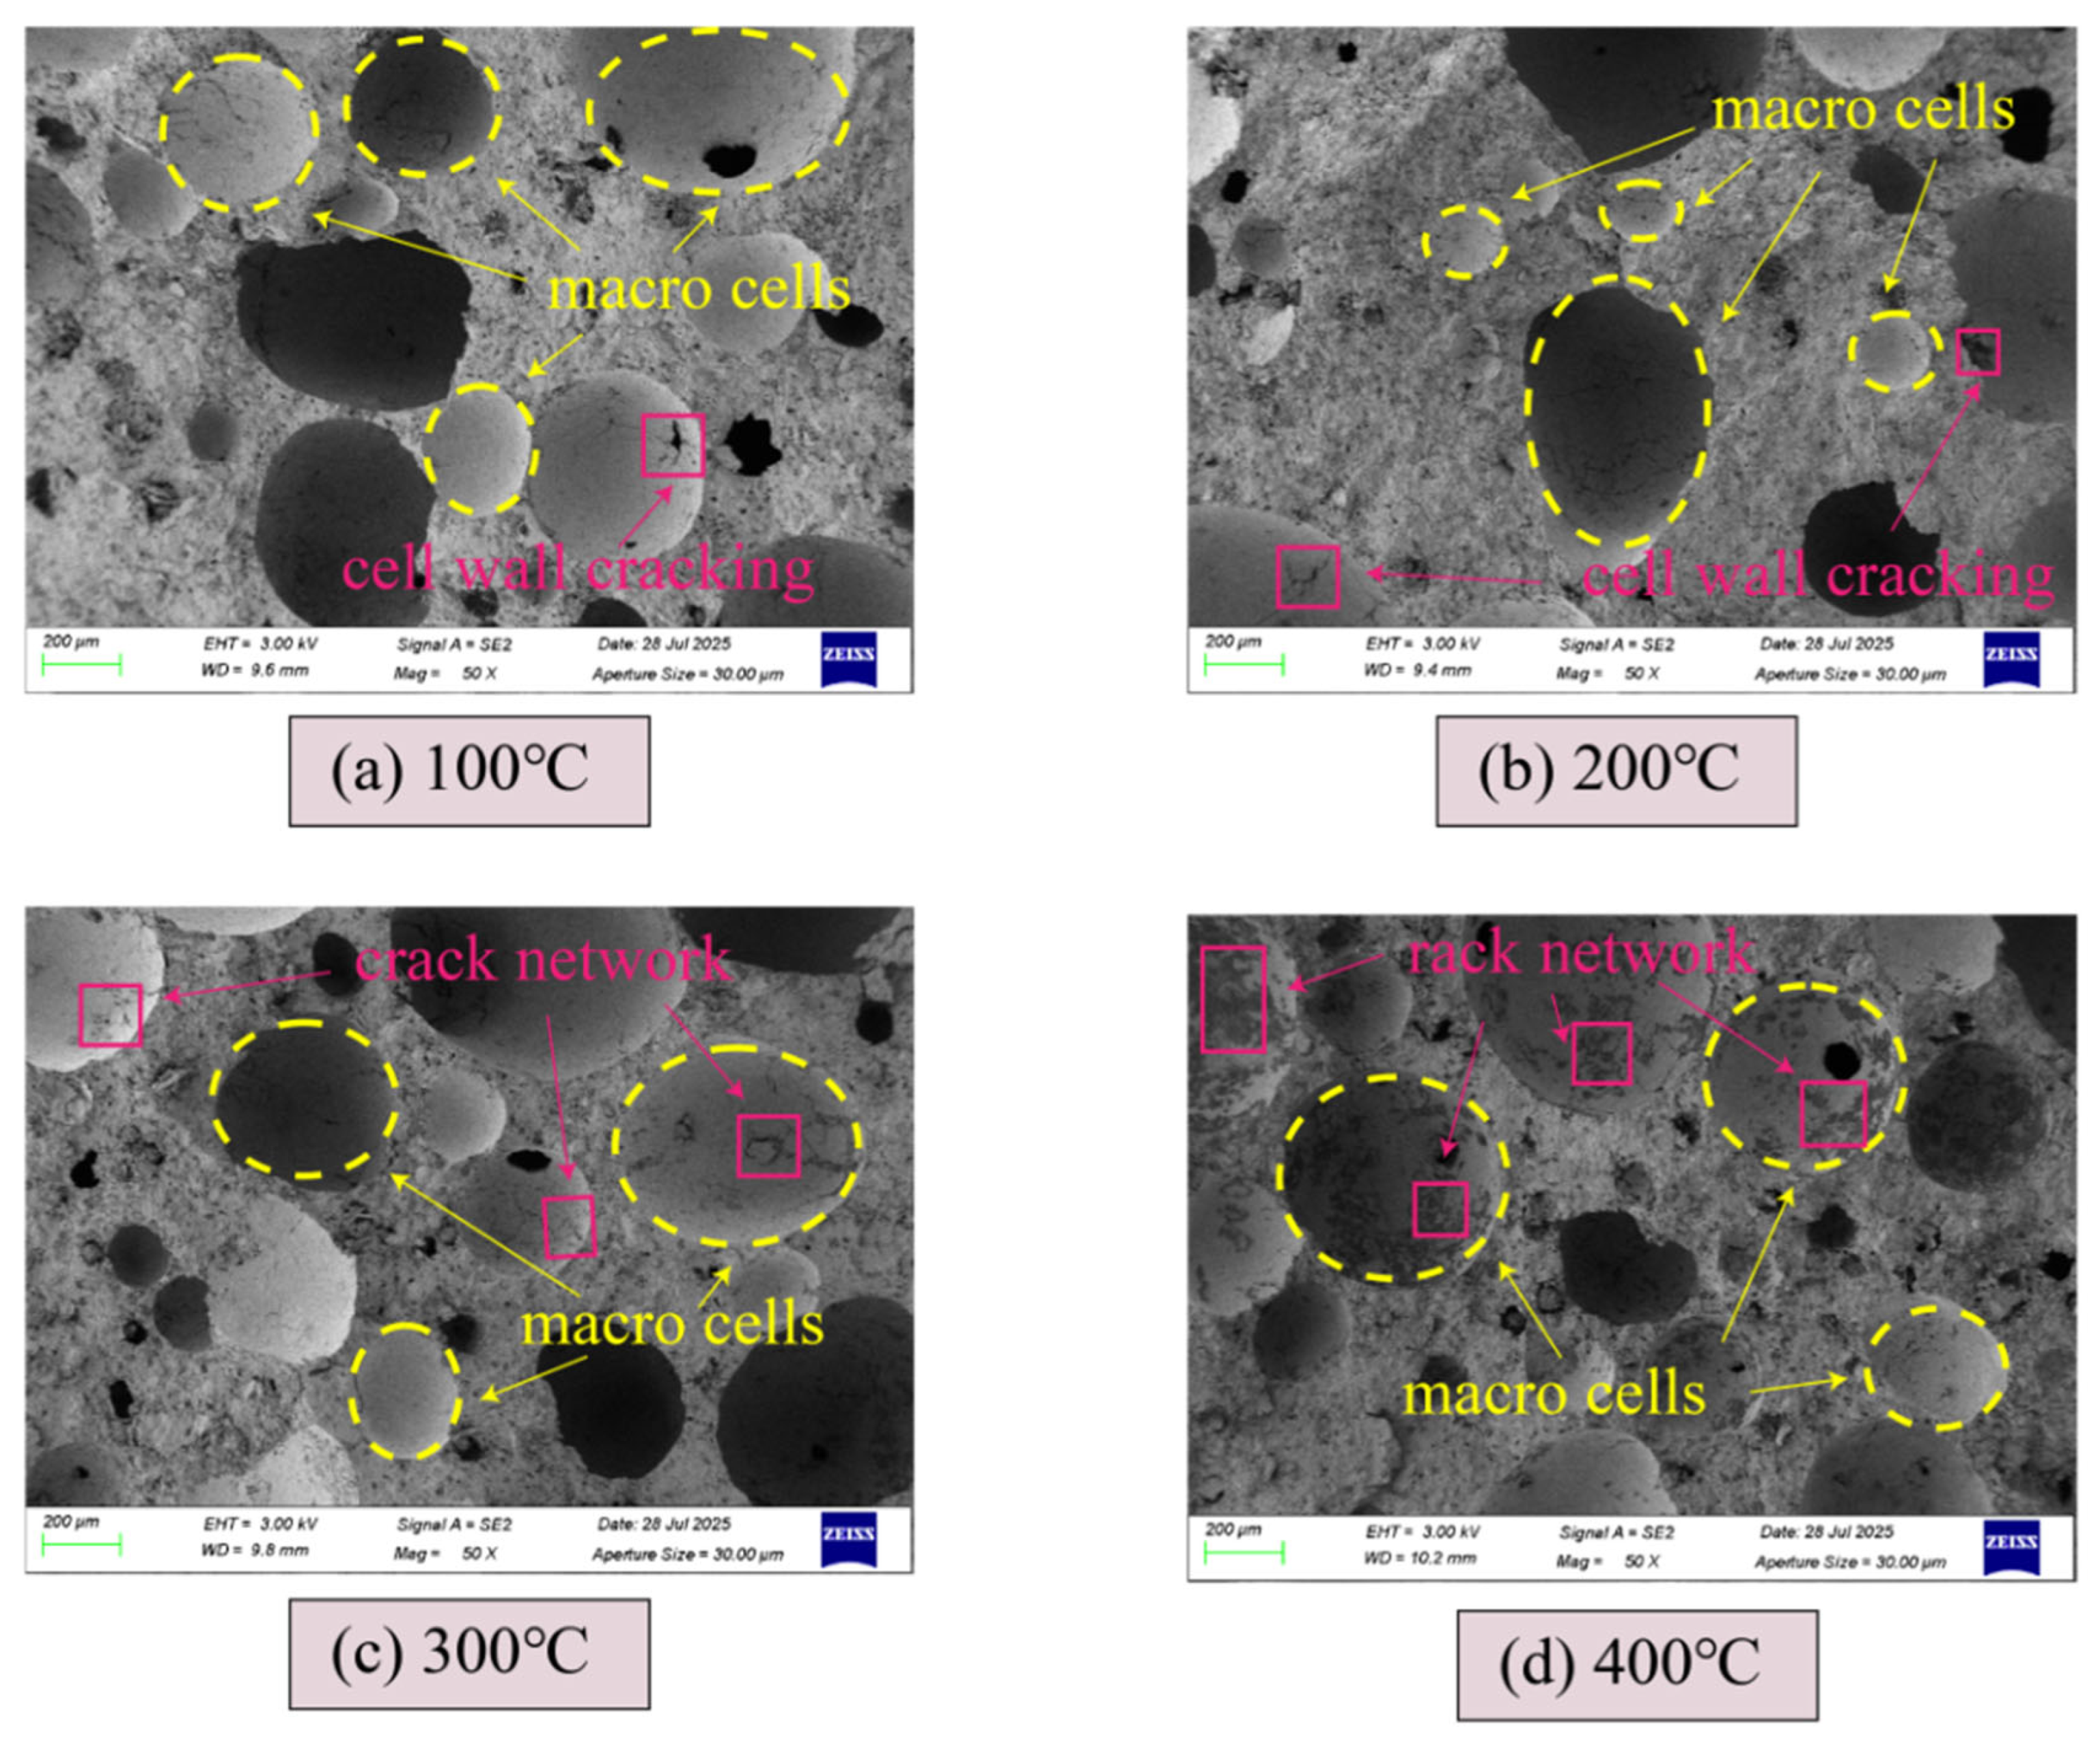
Figure 17 shows the SEM image of an SFFC specimen with a content of 3% at 200 °C. It can be observed from Figure 17 that as the temperature increases, the structure of the specimen changes from dense and compact to loose and fragile. The pores in the specimen begin to thin and rupture, and the structure gradually collapses.
Figure 17.
SEM images of 0.3% SFFC test specimen at different temperatures.
At 100 °C, the macroscopic pore structure is intact, with smooth and continuous pore walls and no obvious cracks, consistent with the conclusion of “no significant changes” observed under the microscope. The structure of the test specimen is in a stable state.
At 200 °C, cracking of the pore wall begins to occur. At the arrow-marked location in Figure 17, obvious microcracks appear on the pore wall connecting the large pores. This indicates that the internal stress caused by water vapor pressure and thermal stress has exceeded the tensile strength of the pore wall material, and although the structure is relatively intact as a whole, it has begun to deteriorate.
At 300 °C, the damage intensifies sharply, forming a network of interconnected cracks. Microcracks are no longer isolated, but connected to each other, dividing the intact pore wall and matrix into small pieces. This penetrating crack network seriously damages the integrity of the test specimen, resulting in a sharp decrease in the macroscopic strength of the test specimen, consistent with the results observed under the microscope.
At 400 °C, the crack network further develops and the structure becomes looser. Although the macroscopic pore shape still exists, the solid skeleton connecting them has been severely weakened by the cracks, which is consistent with the description of “overall pulverization” observed under a microscope, and the structure has basically failed.
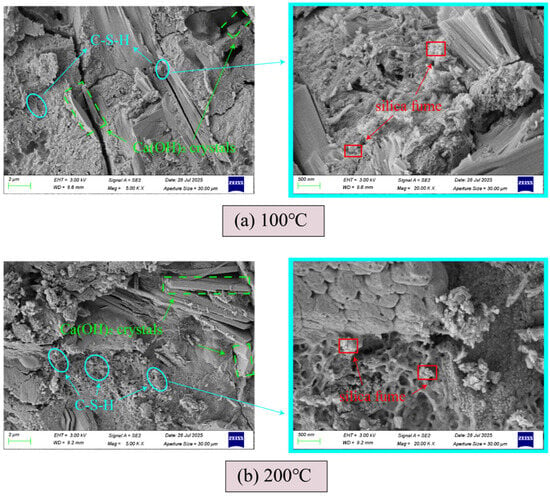
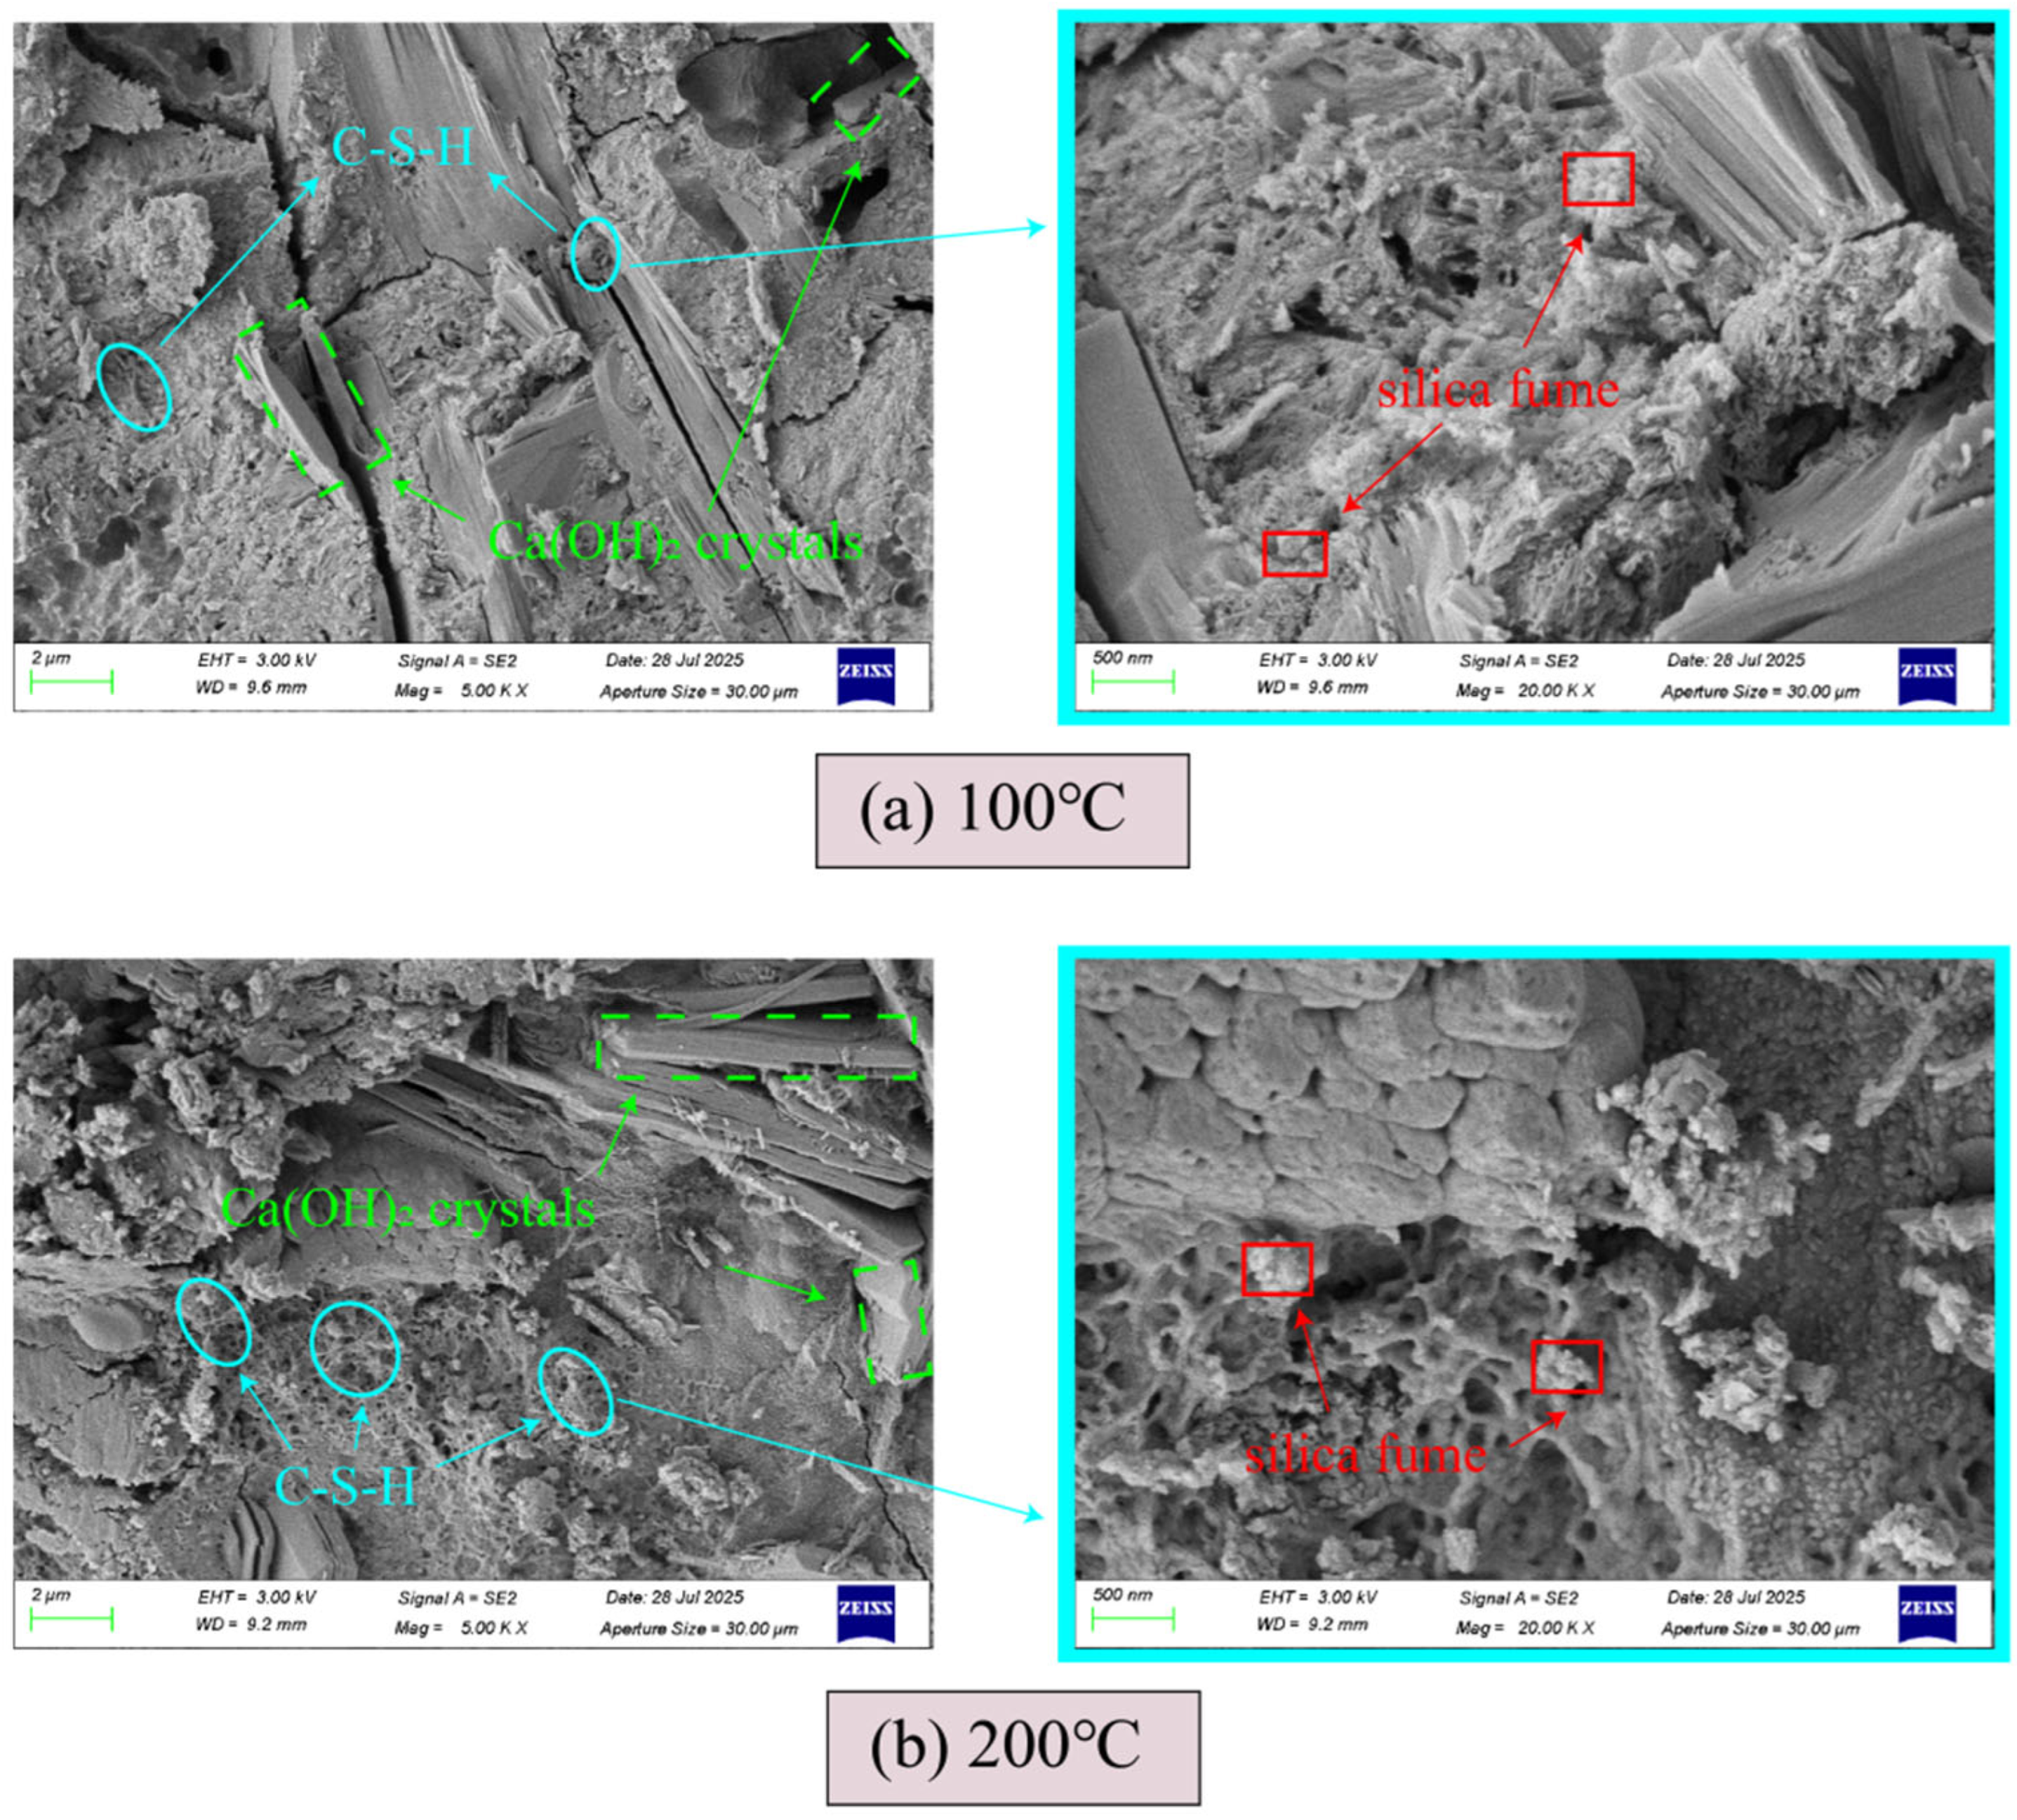
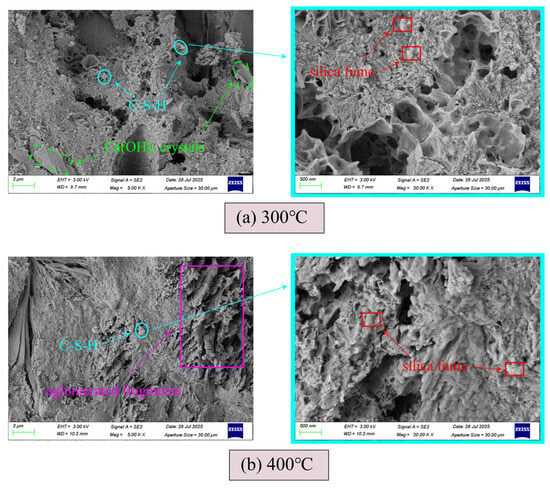
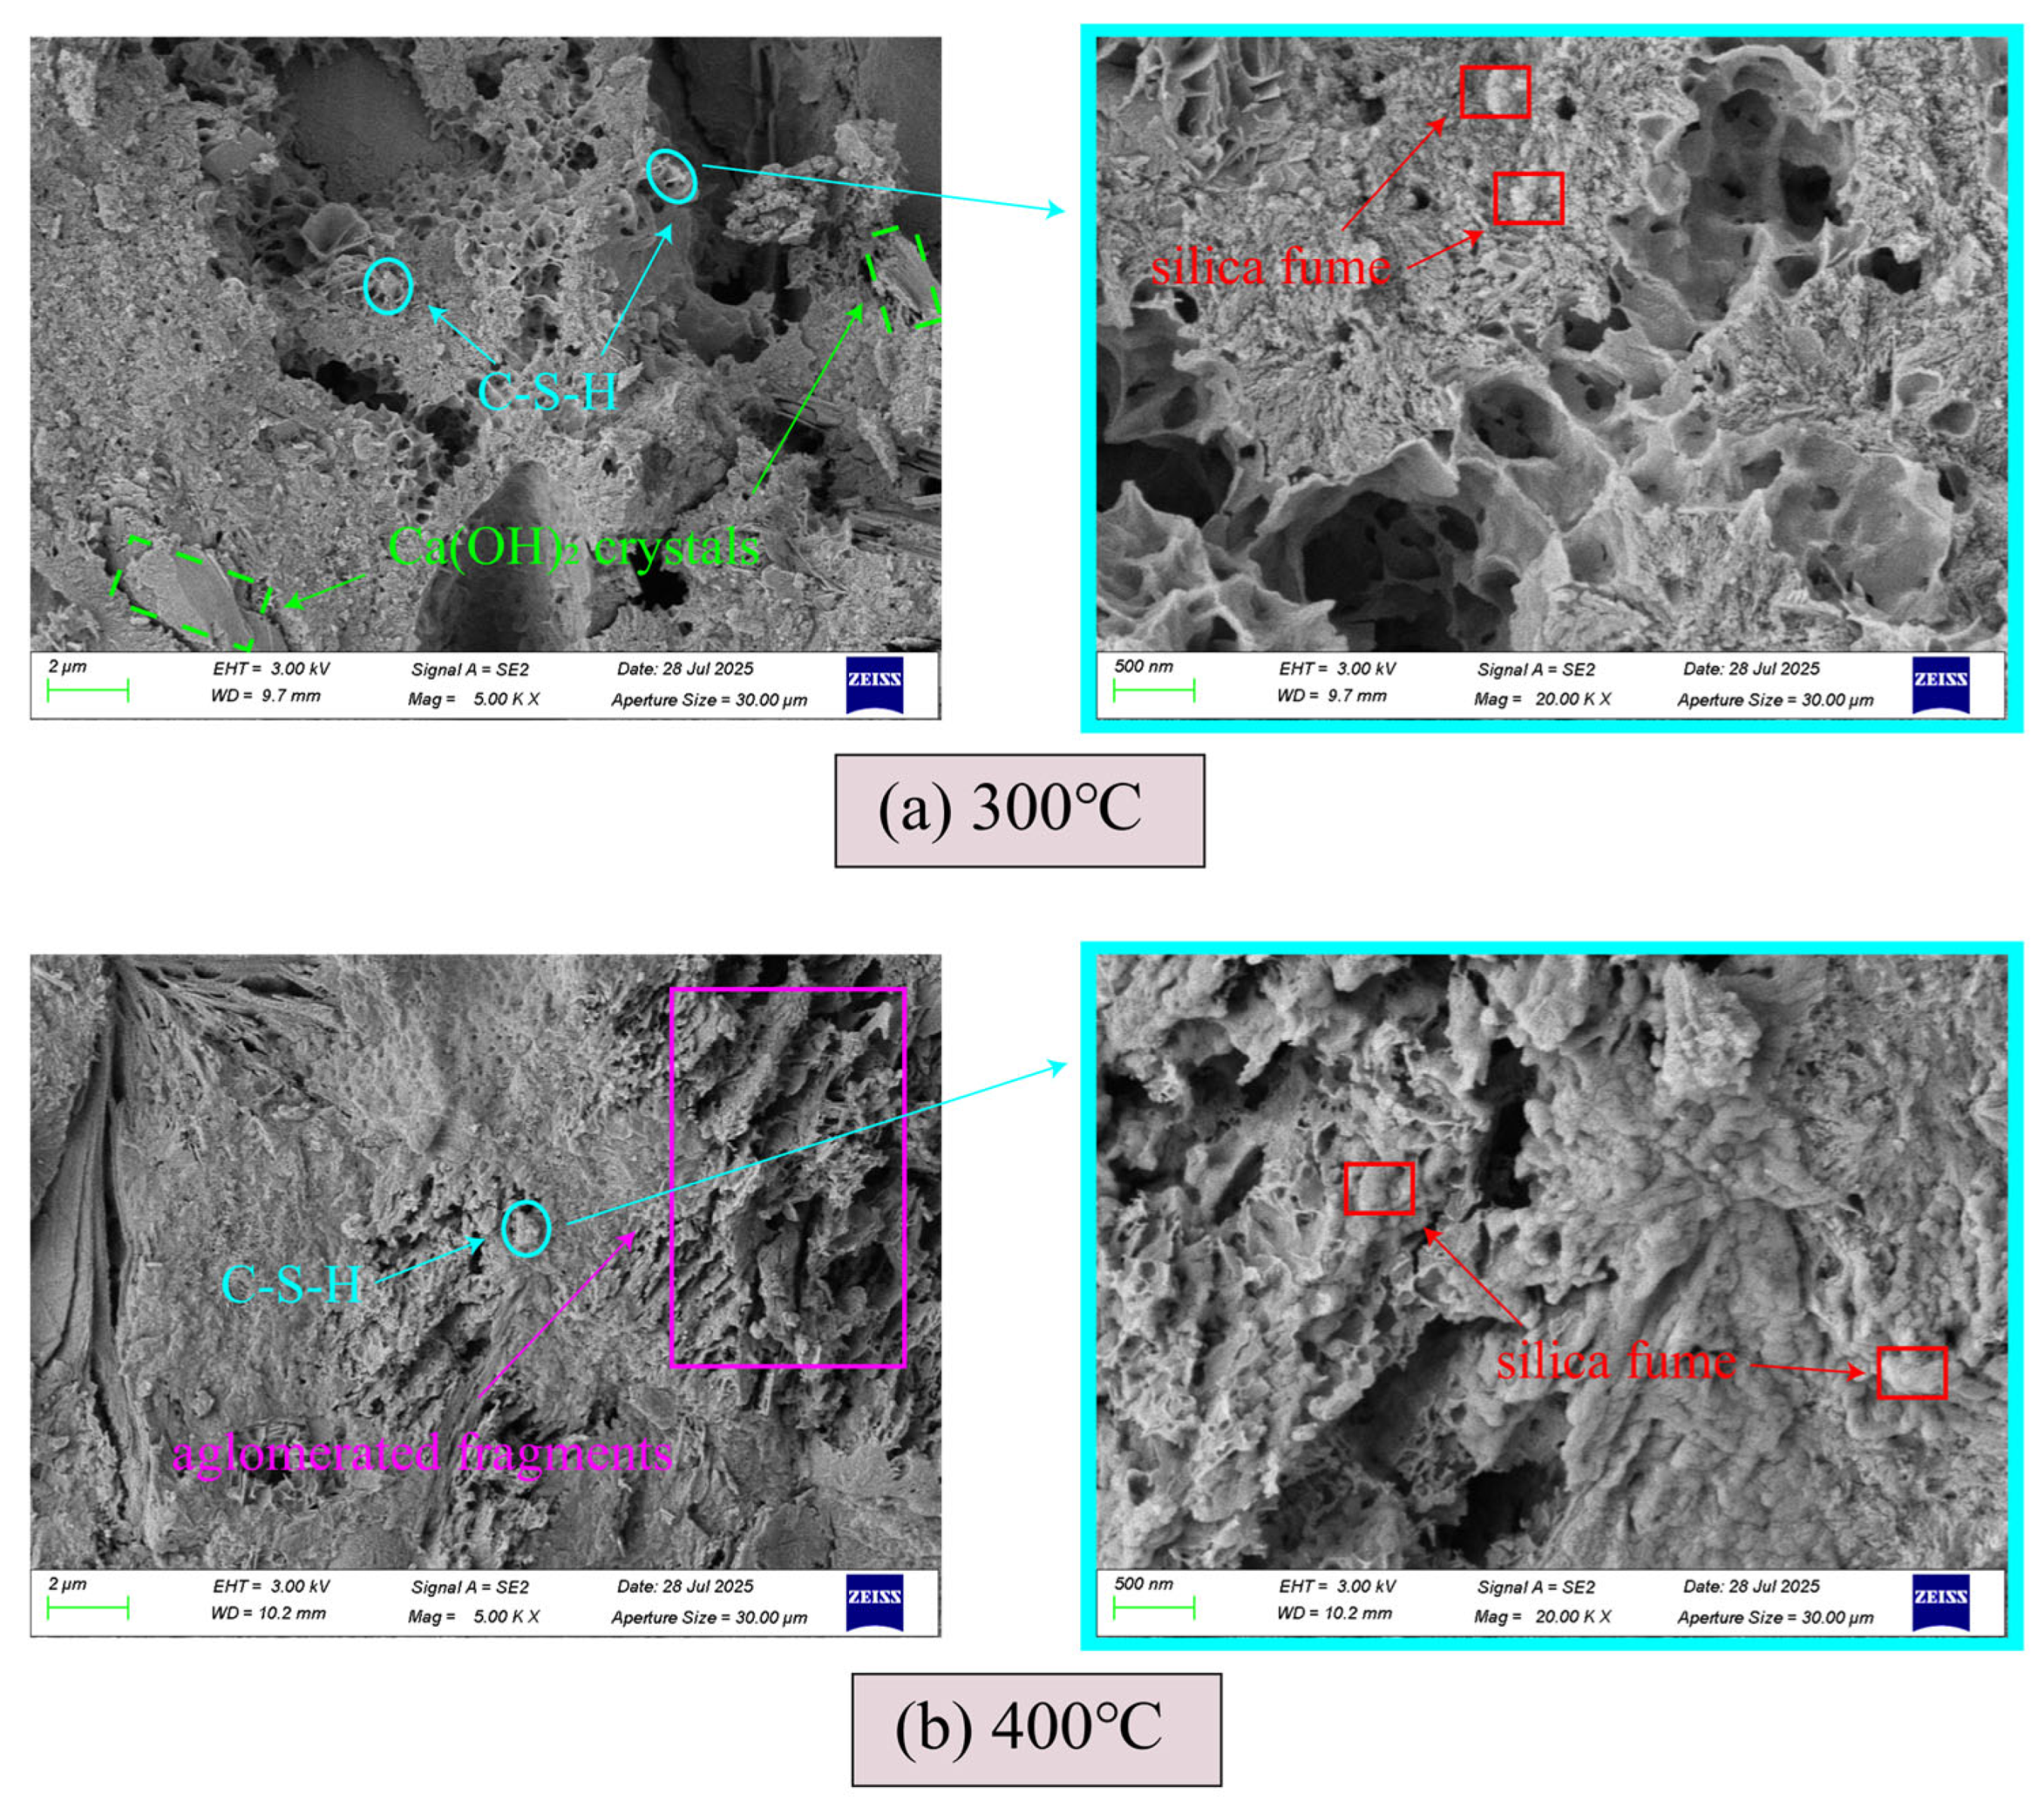
Figure 18 and Figure 19 show the SEM images of SFFC specimens with a doping level of 3% at 2 μm and 500 nm.
Figure 18.
SEM images of 0.3% SFFC test specimen at 100 °C and 200 °C.
Figure 19.
SEM images of 0.3% SFFC test specimen at 300 °C and 400 °C.
At 100 °C, it presents a relatively dense network or flat granular structure, and the hydration product Ca(OH)2 of cement is embedded in the matrix of the test specimen in the form of flakes, with a uniform and dense overall structure. Observation at high magnification showed that SF particles adhered to the surface of C-S-H gel, which confirms that the dense morphology under the microscope was the reason for the physical filling of SF.
At 200 °C, the structure of the test specimen remains uniform and dense, but tiny gaps have begun to appear. The gap between the C-S-H gel and Ca(OH)2 and the matrix gradually becomes larger. At high magnification, it is found that the structure of the C-S-H gel becomes relatively loose, the direct connection between the SF particles and the gel weakens, and more nano sized gaps appear between the gel, which confirms that the C-S-H gel gradually starts to lose bound water after heating up and that the gel particles shrink due to dehydration, weakening the connection between them.
At 300 °C, the structure of the test specimen shows severe degradation. From Figure 19a, it can be clearly observed that the C-S-H gel shrinks due to the loss of a large amount of bound water and produces obvious voids and holes. At this time, due to the structural damage caused by temperature rise and the decomposition of C-S-H gel and Ca(OH)2, the specific location and morphology of C-S-H gel and Ca(OH)2 can no longer be clearly observed. At high magnification, the looseness of the structure and the decomposition of the gel are more obvious. The increase in voids and pores facilitates the propagation of internal pressure. The structural damage intensifies and the macro strength drops sharply, which is consistent with the results obtained under the microscope.
At 400°C, the originally compact C-S-H gel of the test specimen completely collapses and turns into loose, flocculent and amorphous coral, which also marks that the structure began to pulverize and the chemical connection between the solid particles was completely lost. At high magnification, this coral-like structure is extremely evident. At this point, the SF particles begin to aggregate and completely mix with the powdered matrix, no longer possessing any bonding ability. Macroscopically, the test specimen is completely ineffective and shatters at the touch.
4. AE Analysis
4.1. AE Detection Method
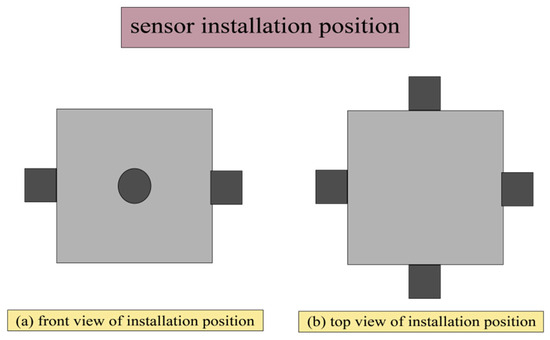
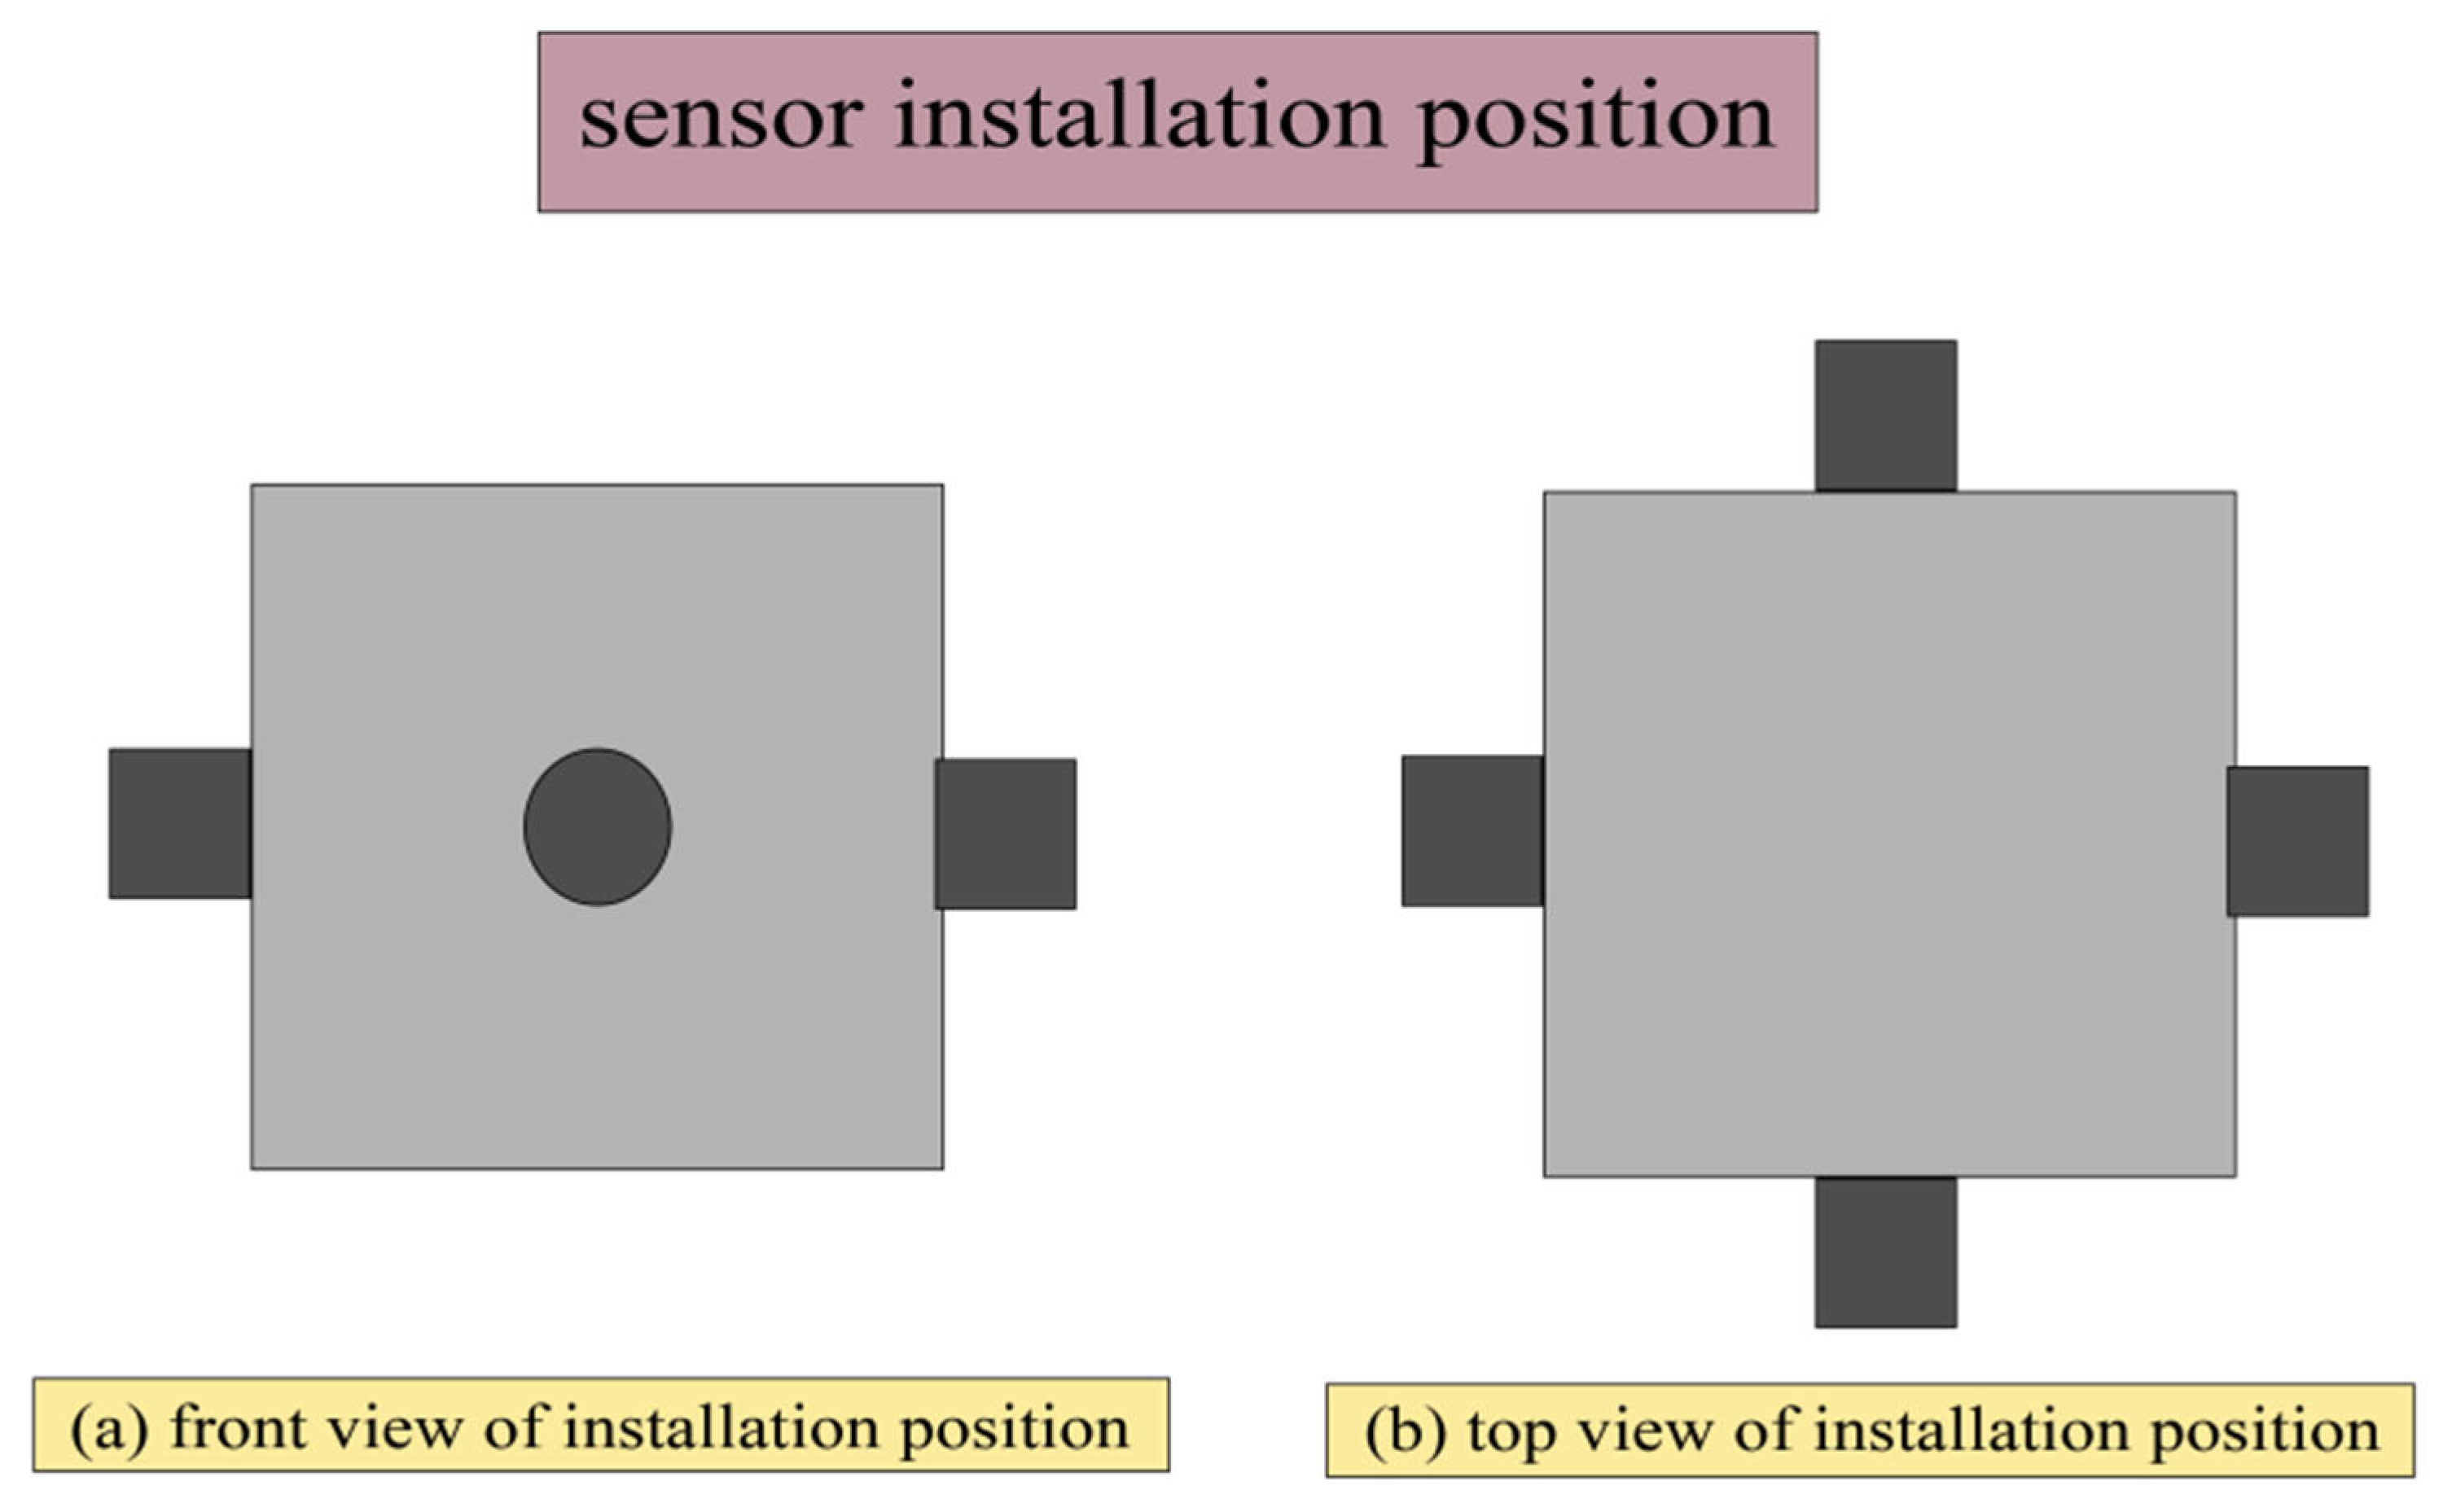
AE refers to the phenomenon of transient elastic waves generated inside a material due to rapid energy release [14,15,16,17,18]. In order to verify the conclusions of microscopic analysis and to further and comprehensively study the performance and damage modes of SFFC, a digital AE device (SAEU3H) was used to collect the AE characteristic data of the SFFC specimens while conducting compressive strength tests. During the experiment, it was necessary to install AE sensors on the surface of the test specimen and fix them with rubber bands to prevent the sensors from loosening or falling off during loading. The sensor model was RS-2A, with a frequency response range of 100–400 kHz. The AE signal was enhanced by an amplifier set to 40 dB, and a suitable coupling agent was selected to reduce the propagation loss of sound waves. The specific experimental equipment is shown in Figure 11 of Section 3.3.1, and the specific installation position of the sensor is shown in Figure 20.
Figure 20.
Specific installation location of AE sensor.
4.2. Result Analysis
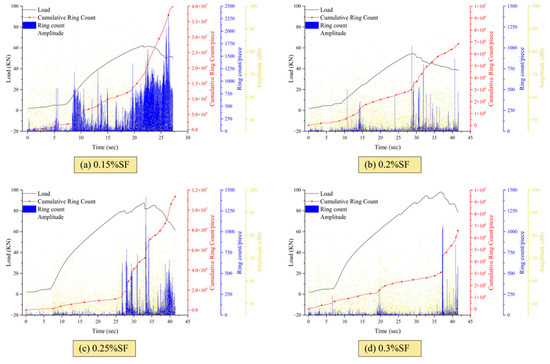
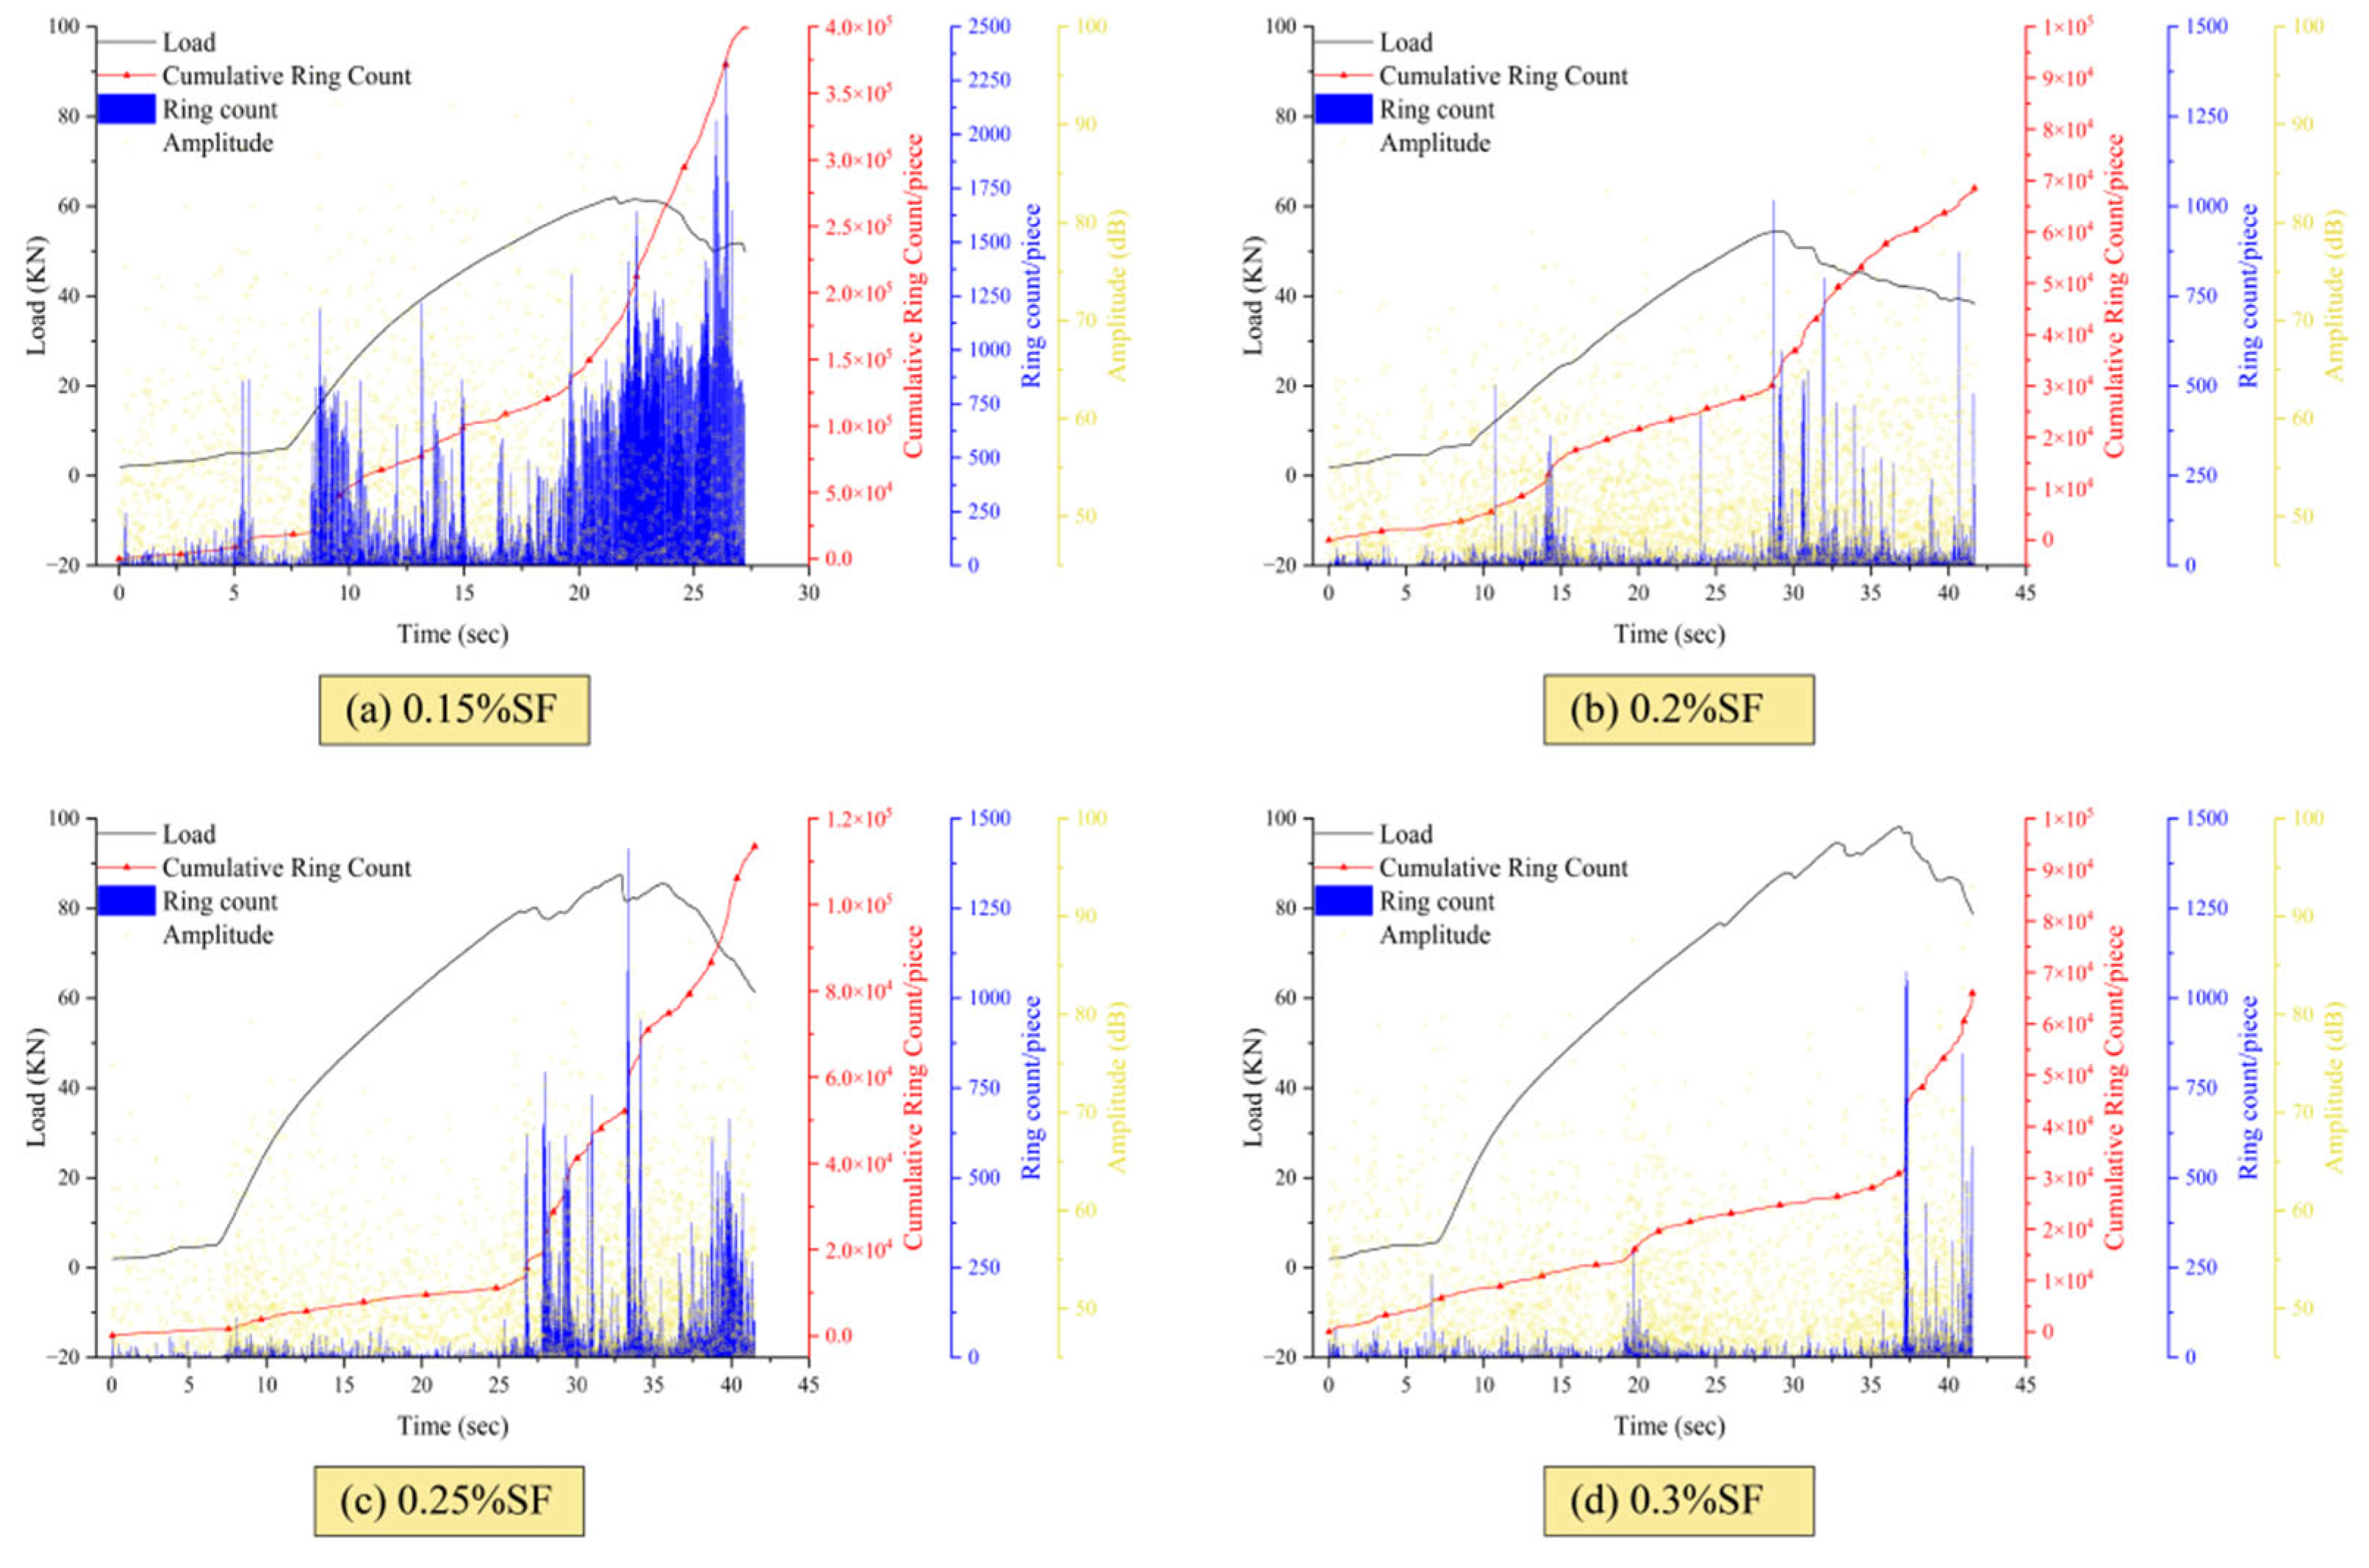
Figure 21 shows the AE characteristics of SFFC specimens with different amounts of SF at 100 °C during compressive strength testing after high-temperature heating. It can be observed from the figure that as the SF content gradually increases, the number of AE events decreases significantly, proving that the physical filling effect of SF and the reaction of volcanic ash have a significant effect on improving the compressive strength and structural thermal stability of SFFC specimens.
Figure 21.
AE characteristics of SFFC with different dosages after exposure to high temperatures of 100 °C.
The compressive strength of SFFC with 0.15% SF content reached the peak value around 23 s, and the peak value of the cumulative ringing count curve was around 4.0 × 10⁵, which caused the early damage. This is because the lower SF content has a limited filling effect on the test specimen, the matrix is relatively loose, and the porosity is high. At the same time, there is less SF involved in the fire ash reaction. The amount of C-S-H gel generated by combining cement hydration products is insufficient, and the cementation ability is poor. At 100 °C, microcracks caused by water evaporation and slight thermal expansion are more likely to appear inside the test specimen, thus generating detectable AE signals.
The compressive strength of SFFC with an SF content of 0.2% and 0.25% reached its peak values before and after 30 s and 35 s, respectively. The peak value of the cumulative ringing count curve also decreased to the range of 7.0 × 10⁴ to 1.0 × 10⁵. Compared with SFFC with an SF content of 0.15%, the time of failure was delayed. At the same time, the compressive strength of SFFC with an SF content of 0.25% increased more significantly compared with the first two groups of test specimens. This is because the increase in SF content makes the matrix more uniform and dense. This strengthening makes the test specimen have better structural thermal stability and better able to resist internal stress caused by water evaporation and thermal damage. Therefore, the number of AE events significantly decreases.
The compressive strength of SFFC with an SF content of 0.3% reached its peak before and after 37 s. At this time, the increase in SF content still has a strengthening effect on SFFC, but its ability to delay failure is only slightly improved. At the same time, the compressive strength is not significantly improved compared to SFFC with an SF content of 0.25%. This is because when the SF content is too high, most of the cement hydration products participate in the volcanic ash reaction, and excessive SF will aggregate inside the test specimen, which does not significantly help to further improve the performance of SFFC. Excessive agglomeration may even hinder the connection of pores, resulting in the inability of excess water vapor to escape, and stress concentration may occur inside the test specimen, which has adverse effects on SFFC. Therefore, the optimal SF content should be 0.25%.
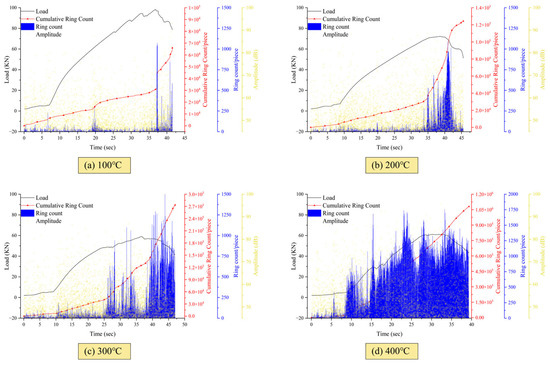
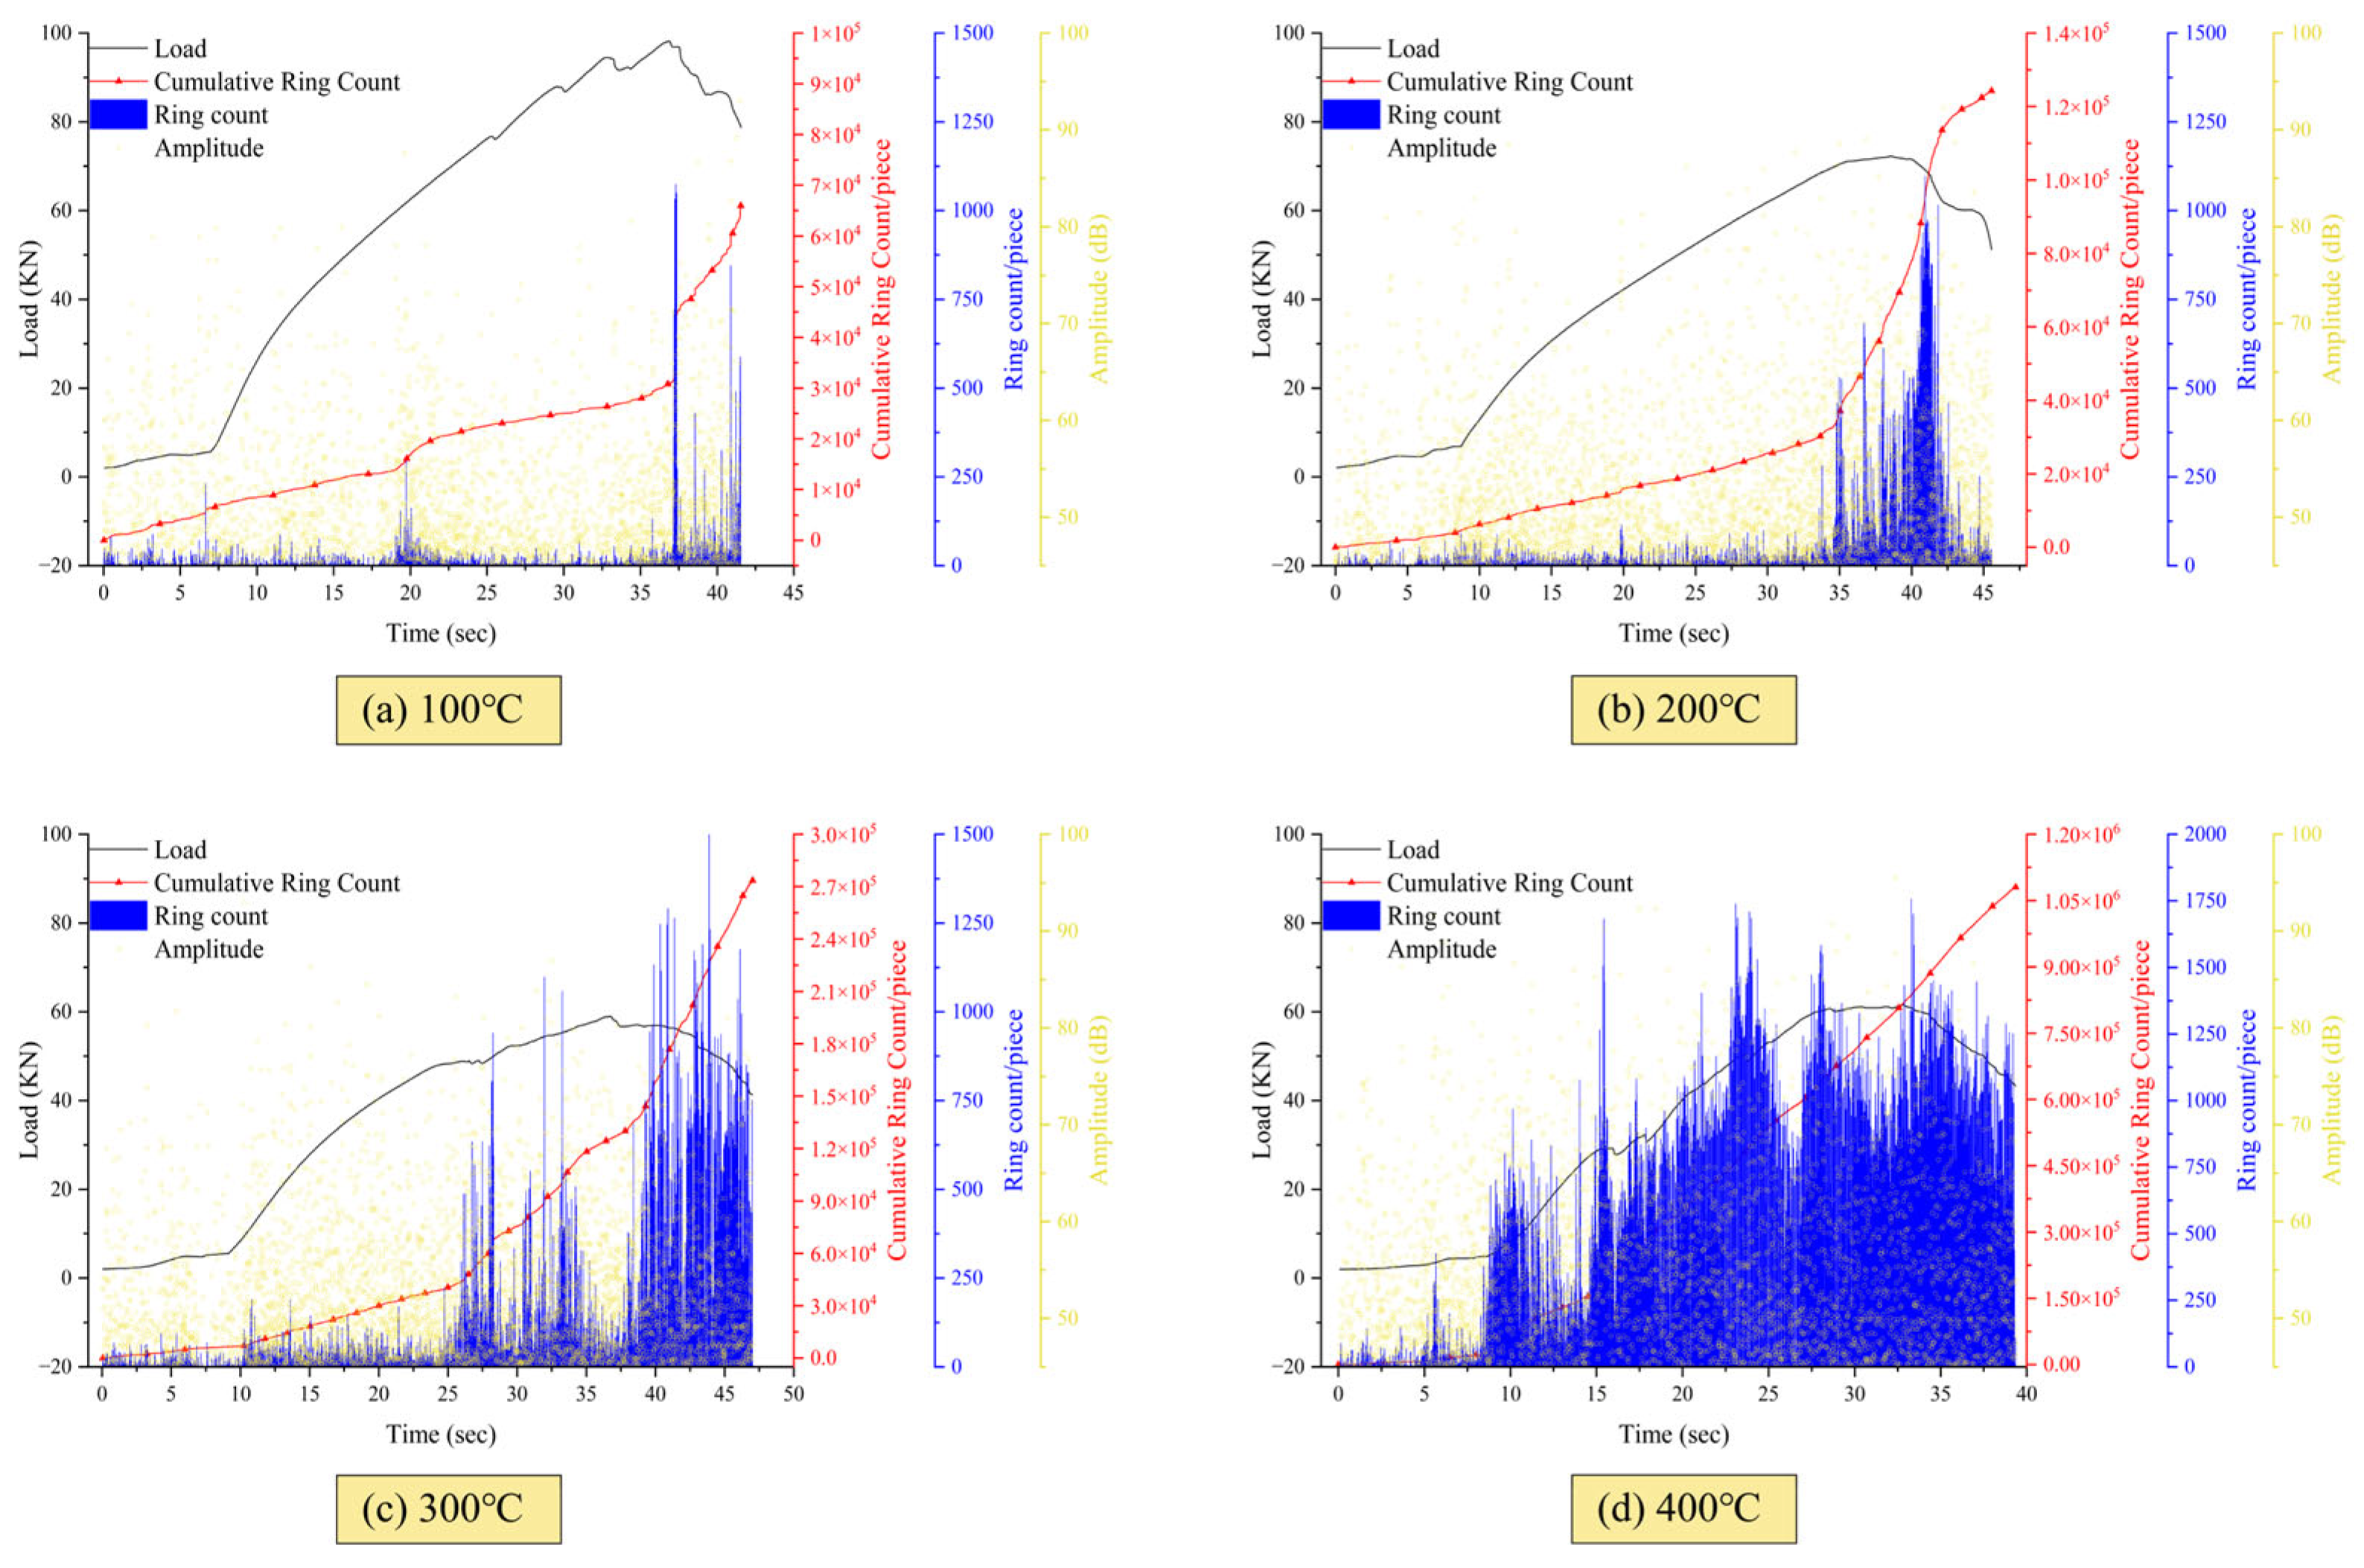
Figure 22 shows the AE characteristics of SFFC specimens with an SF content of 0.3% at different temperatures during compressive strength testing after high-temperature heating. It can be seen from the figure that at 100 °C, 200 °C, and 300 °C there are fewer AE events during the initial loading period, the peak value of the cumulative ringing count curve remains in the range of 7.0 × 10⁴ to 3.0 × 10⁵, and the ringing count remains in the range of 1000 to 1500. When the external load is about to reach the ultimate bearing capacity of the specimen, the ringing count suddenly increases significantly, the amplitude number increases, and higher amplitude points appear. This is because the specimen is completely destroyed, and the comprehensive expansion of internal cracks at this time leads to a surge in AE events. At 400 °C, there were more AE events during the initial loading stage of the test specimen, with the peak value of the cumulative ringing count curve reaching 1.2 × 10⁶. This is because at 400 °C, the test specimen is already in a state of basic failure, and under very small external forces, internal cracks will rapidly expand, resulting in more AE events during the initial loading stage. With the gradual increase in the applied load, the test block at 400 °C was destroyed rapidly, during which the number of acoustic emission events increased sharply, the number of ring count and amplitude points remained high before complete destruction, and the cumulative ring count curve increased at a very high growth rate.
Figure 22.
AE characteristics of 0.3% SFFC after testing at different temperatures.
Based on microscopic analysis, there were very few AE events and low energy levels at 100 °C. This is because the changes that occur in the test specimen at this temperature are mainly due to the evaporation of free water, which is a mild physical process. The dense matrix composed of SF is almost not destroyed. The rationality of microscopic analysis has been confirmed through AE characteristic analysis, and the good service safety of SFFC at 100 °C has been verified again.
At 200 °C, the AE events began to increase. At this time, the microscopic performance was that the C-S-H gel began to lose the bound water. The dehydration and contraction of the gel caused partial tensile stress in the matrix, resulting in the thinning of pores and cracks. Each high-energy AE event corresponds to the formation and expansion of cracks. At this time, the test specimen began to enter the irreversible damage stage.
At 300 °C, AE events proliferated, showing a continuous signal. Corresponding to the massive dehydration of C-S-H gel and the decomposition of Ca(OH)2 in the microscopic analysis, the dense structure of SF hindered the escape of water vapor. The thermal stress and steam stress inside the test specimen increased rapidly, and the test specimen began to shrink violently and became fragile. The isolated cracks in the matrix quickly developed into a crack network, and the test specimen was rapidly damaged.
At 400 °C, the AE event continued to explode, forming a dense event cloud (see Figure 22d), corresponding to the complete collapse of the C-S-H gel network in the microscopic analysis, the matrix began to pulverize, and the test specimen was completely damaged, in a failure state.
5. Conclusions
In this study, systematic tests and analysis were carried out on the performance of SFFC after exposure to high temperatures. The main conclusions can be summarized as follows:
- The effect of SF on FC exhibits a dual nature: at 200 °C and below, the dense structure formed by the physical filling and pozzolanic reaction of SF effectively delays the performance degradation; however, when the temperature rises to 300–400 °C, test specimens with excessive SF content (such as 0.3%) hinder the escape of internal water vapor due to their dense matrix, leading to the accumulation of steam pressure and thermal stress, accelerating the generation and propagation of microcrack networks, and causing more severe pulverization damage and a sharp decrease in strength.
- Analysis of the acoustic emission data reveals that with increasing silica fume content, the cumulative ring count decreases from 4.0 × 10⁵ to 1.0 × 10⁵, while the peak arrival time is prolonged from 23 s to 37 s. The incorporation of silica fume results in a more uniform and denser matrix, thereby enhancing the structural thermal stability of specimens and improving their resistance to internal stresses induced by moisture evaporation and thermal damage. However, when the silica fume content reaches 0.3%, excessive silica fume tends to agglomerate within the matrix, obstructing pore connectivity and ultimately preventing the escape of excess water vapor.
- Analysis of SEM images reveals that the failure process of SFFC can be characterized as follows: it begins with the evaporation of free water at low temperatures, transitions to the dehydration and shrinkage of C-S-H gel at moderate temperatures, and ultimately culminates in structural failure at high temperatures, marked by the collapse of the C-S-H gel network.
- Under the conditions of this study, a 0.25% silica fume content can not only effectively improve the working performance of the fresh paste and improve the mechanical properties and impermeability of the material at room temperature and medium and low temperatures but also avoid the severe damage caused by a high content at high temperatures. The results can provide a theoretical basis for the optimal design of foam concrete mix proportions and the prevention of group fire.
Limitations: This study lacks a high-temperature test above 400°C. If you want to apply it more rigorously in engineering practice, you need to conduct more in-depth tests as a supplement.
Author Contributions
Conceptualization, A.J.; methodology, A.J.; software, B.Y.; validation, S.Z.; formal analysis, S.Z. and X.L.; investigation, H.N.; resources, A.J.; data curation, S.Z. and X.L.; writing—original draft preparation, S.Z. and X.L.; writing—review and editing, A.J.; visualization, H.N. and B.Y.; supervision, A.J.; project administration, A.J.; funding acquisition, A.J. All authors have read and agreed to the published version of the manuscript.
Funding
This work was supported by the National Natural Science Foundation of China (grant No. 52368051) and the Fundamental Research Funds for Universities of Xinjiang Uygur Autonomous Region (grant No. XJEDU2023Z003). The above-mentioned funding sources and support are gratefully acknowledged.
Data Availability Statement
The original contributions presented in the study are included in the article; further inquiries can be directed to the corresponding author.
Conflicts of Interest
The authors declare no conflicts of interest.
References
- Abu-Jdayil, B.; Mourad, A.-H.; Hittini, W.; Hassan, M.; Hameedi, S. Traditional, state-of-the-art and renewable thermal building insulation materials: An overview. Constr. Build. Mater. 2019, 214, 709–735. [Google Scholar] [CrossRef] [Scilit]
- Zhang, C.; Fan, D.; Lu, J.-X.; Pang, C.; Poon, C.S. Ultra-stable foam enabled by nano silica engineering for foam concrete improvement. Cem. Concr. Compos. 2024, 150, 105575. [Google Scholar] [CrossRef] [Scilit]
- Li, Z.; Wang, G.; Deng, X.; Liu, Q.; Shulga, Y.M.; Chen, Z.; Wu, X. Preparation and characterization of silica aerogel foam concrete: Effects of particle size and content. J. Build. Eng. 2024, 82, 108243. [Google Scholar] [CrossRef] [Scilit]
- Mydin, O.A.M.; Sor, H.N.; Taqieddin, Z.N.; Jagadesh, P.; Al Bakri Abdullah, M.; Awoyera, P.O.; Isleem, H.F.; Fadugba, O.G.; Tawfik, T.A. Evaluation of Foamed Concrete Properties Containing Engineered Pozzolans and Compressive Strength Prediction Through Artificial Neural Networks. Int. J. Concr. Struct. Mater. 2026, 20, 26. [Google Scholar] [CrossRef] [Scilit]
- Khan, A.; Ali, A.; Mehboob, S.S.; Tayyab, A.; Khan, D.; Mursaleen, M.; Rezzoug, A.; Ltifi, M. Multi-objective optimization of thermal and mechanical properties of lightweight foam concrete with Binary Blend of fly ash and silica fume. J. Build. Eng. 2026, 120, 115387. [Google Scholar] [CrossRef] [Scilit]
- Pan, P.; Yang, W.; Guo, Z. Improvement of thermal properties of foam concrete by incorporating silica aerogel particles. Constr. Build. Mater. 2025, 478, 141450. [Google Scholar] [CrossRef] [Scilit]
- Bao, J.; Zheng, R.; Zhang, P.; Cui, Y.; Xue, S.; Song, Q.; Ma, Y. Thermal resistance, water absorption and microstructure of high-strength self-compacting lightweight aggregate concrete (HSSC-LWAC) after exposure to elevated temperatures. Constr. Build. Mater. 2023, 365, 130071. [Google Scholar] [CrossRef] [Scilit]
- Annerel, E.; Taerwe, L. Revealing the temperature history in concrete after fire exposure by microscopic analysis. Cem. Concr. Res. 2009, 39, 1239–1249. [Google Scholar] [CrossRef] [Scilit]
- Aditya, L.; Mahlia, T.; Rismanchi, B.; Ng, H.; Hasan, M.; Metselaar, H.; Muraza, O.; Aditiya, H. A review on insulation materials for energy conservation in buildings. Renew. Sustain. Energy Rev. 2017, 73, 1352–1365. [Google Scholar] [CrossRef] [Scilit]
- Nambiar, K.E.; Ramamurthy, K. Air-void characterisation of foam concrete. Cem. Concr. Res. 2007, 37, 221–230. [Google Scholar] [CrossRef] [Scilit]
- Fan, D.; Zhang, C.; Lu, J.-X.; Peng, L.; Yu, R.; Poon, C.S. Rheology dependent pore structure optimization of high-performance foam concrete. Cem. Concr. Res. 2025, 188, 107737. [Google Scholar] [CrossRef] [Scilit]
- Chen, J.; Chen, B.; Chen, X.; Qiang, S.; Zheng, Y. Study on pore structure of foamed cement paste by multi-approach synergetics. Constr. Build. Mater. 2023, 362, 129748. [Google Scholar] [CrossRef] [Scilit]
- Chen, X.; Shi, D.; Zhang, J.; Cheng, X. Experimental Investigation of the Residual Physical and Mechanical Properties of Foamed Concrete Exposed to High Temperatures. J. Mater. Civ. Eng. 2021, 33, 04021162. [Google Scholar] [CrossRef] [Scilit]
- Hu, Z.; Yang, Y.; Zhang, H. Durability and damage evolution of steel fiber and Nano-SiO2 reinforced concrete under freeze-thaw and salt erosion environments based on acoustic emission and Computed Tomography analysis. J. Build. Eng. 2025, 115, 114595. [Google Scholar] [CrossRef] [Scilit]
- Sun, Y.; Jiao, Y.; Yang, H.; Chen, Y.; Liu, Z. Investigation of Bond Behavior between Steel Reinforcement and Ultrahigh-Performance Glass-Sand Concrete Based on Acoustic Emission Monitoring. J. Mater. Civ. Eng. 2026, 38, 04025513. [Google Scholar] [CrossRef] [Scilit]
- Li, S.; Chen, B.; Chen, Z.; Gao, Z. Performance assessment of basalt fiber reinforced foamed concrete under freeze-thaw conditions using advanced acoustic emission parameters. Constr. Build. Mater. 2024, 440, 137444. [Google Scholar] [CrossRef] [Scilit]
- Rasheed, M.A.; Prakash, S.S.; Raju, G.; Kawasaki, Y. Fracture studies on synthetic fiber reinforced cellular concrete using acoustic emission technique. Constr. Build. Mater. 2018, 169, 100–112. [Google Scholar] [CrossRef] [Scilit]
- Holsamudrkar, N.; Banerjee, S. Acoustic Emission (AE) based health monitoring of RC beams strengthened with mechanically anchored hybrid Fiber Reinforced Cementitious Matrix (FRCM) system. Case Stud. Constr. Mater. 2024, 21, e03773. [Google Scholar] [CrossRef] [Scilit]
- Ren, H.; Li, T.; Ning, J.; Song, S. Analysis of damage characteristics of steel fiber-reinforced concrete based on acoustic emission. Eng. Fail. Anal. 2023, 148, 107166. [Google Scholar] [CrossRef] [Scilit]
- Zhou, S.; Jiang, Z.; Ou, Q.; Liu, J.; Wang, C. Analysis on flexural toughness of steel fiber reinforced concrete based on acoustic emission and digital image correlation techniques. Constr. Build. Mater. 2025, 492, 143039. [Google Scholar] [CrossRef] [Scilit]
- Mydin, M.A.O.; Sor, N.H.; Abdullah, M.M.A.B.; Isleem, H.F.; Awoyera, P.O.; Fadugba, O.G.; Tawfik, T.A. Comprehensive evaluation of mechanical, durability, and microstructural properties of foamed concrete with zinc peroxide nanoparticles. Sci. Rep. 2025, 15, 41777. [Google Scholar] [CrossRef] [Scilit] [PubMed]
- Luo, B.; Dong, X.; Li, R.; Su, D.; Qiao, Y.; Meng, L.; Zhang, C. Optimized Mix Proportion and Microstructural Mechanism of Foamed Concrete for Internal Molds in Hollow Concrete Components. Coatings 2025, 15, 976. [Google Scholar] [CrossRef] [Scilit]
- Junyan, D.; Shiping, Y. Mechanical properties of hybrid fiber reinforced coral aggregate seawater concrete based on scanning electron microscopy (SEM). J. Build. Eng. 2025, 111, 113194. [Google Scholar] [CrossRef] [Scilit]
- CJJ/T 177-2012; Technical Specification for Bubble Mixed Lightweight Soil Filling Engineering. China Standards Press: Beijing, China, 2012. Available online: https://ebook.chinabuilding.com.cn/zbooklib/bookpdf/probation?SiteID=1&bookID=58377 (accessed on 27 March 2026).
- JC/T 2199-2013; Foam Agent for Foam Concrete. China Standards Press: Beijing, China, 2013. Available online: https://www.doc88.com/p-48543864836023.html (accessed on 27 March 2026).
- Wu, C.; Jierula, A.; Fu, Z.; Chen, Y.; Kuang, Y.; Xia, J. Study on the mechanism of anti sulfate freeze-thaw, dry wet cycle of polypropylene fiber foam concrete. Constr. Build. Mater. 2025, 463, 140144. [Google Scholar] [CrossRef] [Scilit]
- JG/T 266-2011; Ministry of Housing and Urban-Rural Development, Building Engineering Standardization Technical Department. Foam Concrete. China Standards Press: Beijing, China, 2011. Available online: https://ebook.chinabuilding.com.cn/zbooklib/bookpdf/probation?SiteID=1&bookID=56940 (accessed on 27 March 2026).
- GB/T 43487-2023; National Technical Committee for Standardization of Cement Products (SAC/TC 197). Test Methods for Foam Concrete and Products. China Standards Press: Beijing, China, 2023. Available online: https://openstd.samr.gov.cn/bzgk/gb/newGbInfo?hcno=F039CBD10D962DF4189A8A03D9623C9B&refer=outter (accessed on 27 March 2026).
- Cascardi, A.; Verre, S.; Micelli, F.; Aiello, M.A. Durability-aimed performance of glass FRCM-confined concrete cylinders: Experimental insights into alkali environmental effects. Mater. Struct. 2025, 58, 329. [Google Scholar] [CrossRef] [Scilit]

Disclaimer/Publisher’s Note: The statements, opinions and data contained in all publications are solely those of the individual author(s) and contributor(s) and not of MDPI and/or the editor(s). MDPI and/or the editor(s) disclaim responsibility for any injury to people or property resulting from any ideas, methods, instructions or products referred to in the content. |
© 2026 by the authors. Licensee MDPI, Basel, Switzerland. This article is an open access article distributed under the terms and conditions of the Creative Commons Attribution (CC BY) license.