Article

Nonlinear Seismic Reassessment of an Existing Reinforced Concrete Frame Building: Influence of Masonry Infills Under Intermediate-Depth and Shallow Crustal Earthquake Records


Department of Structural Mechanics, Faculty of Civil Engineering and Building Services, “Gheorghe Asachi” Technical University of Iasi, 700050 Iasi, Romania
Buildings 2026, 16(7), 1392; https://doi.org/10.3390/buildings16071392
Submission received: 21 February 2026 / Revised: 28 March 2026 / Accepted: 30 March 2026 / Published: 1 April 2026
(This article belongs to the Special Issue Analysis of Structural and Seismic Performance of Building Structures)

Abstract

This paper presents a nonlinear time-history reassessment of an existing reinforced concrete frame building originally designed in 2007 according to the Romanian seismic code P100-1/2006 and re-evaluated under current seismic demand. Two three-dimensional solid finite-element models were developed in ANSYS Workbench 2025 R2: a bare reinforced concrete frame and an infilled frame with masonry panels. A distinctive feature of the modelling strategy is the explicit representation of longitudinal and transverse reinforcement embedded in the concrete solids, which allows direct tracking of steel stress demand and post-cracking load transfer. The models were subjected to bidirectional ground motions from the Vrancea 1977 and 1990 earthquakes and the Türkiye 2023 earthquake, scaled to the P100-1/2013 target spectrum for the investigated site. The results show that masonry infills markedly increase global stiffness and reduce displacement-related demand, with substantially lower roof displacements and interstorey drift measures in the infilled configuration. The bidirectional response remains predominantly translational, while the local stress and inelasticity fields indicate qualitative concentration zones in the frame, masonry panels, and staircase region. Overall, the study shows that masonry infills can strongly modify the actual seismic response of existing reinforced concrete frame buildings and should be considered explicitly in performance assessment.

1. Introduction

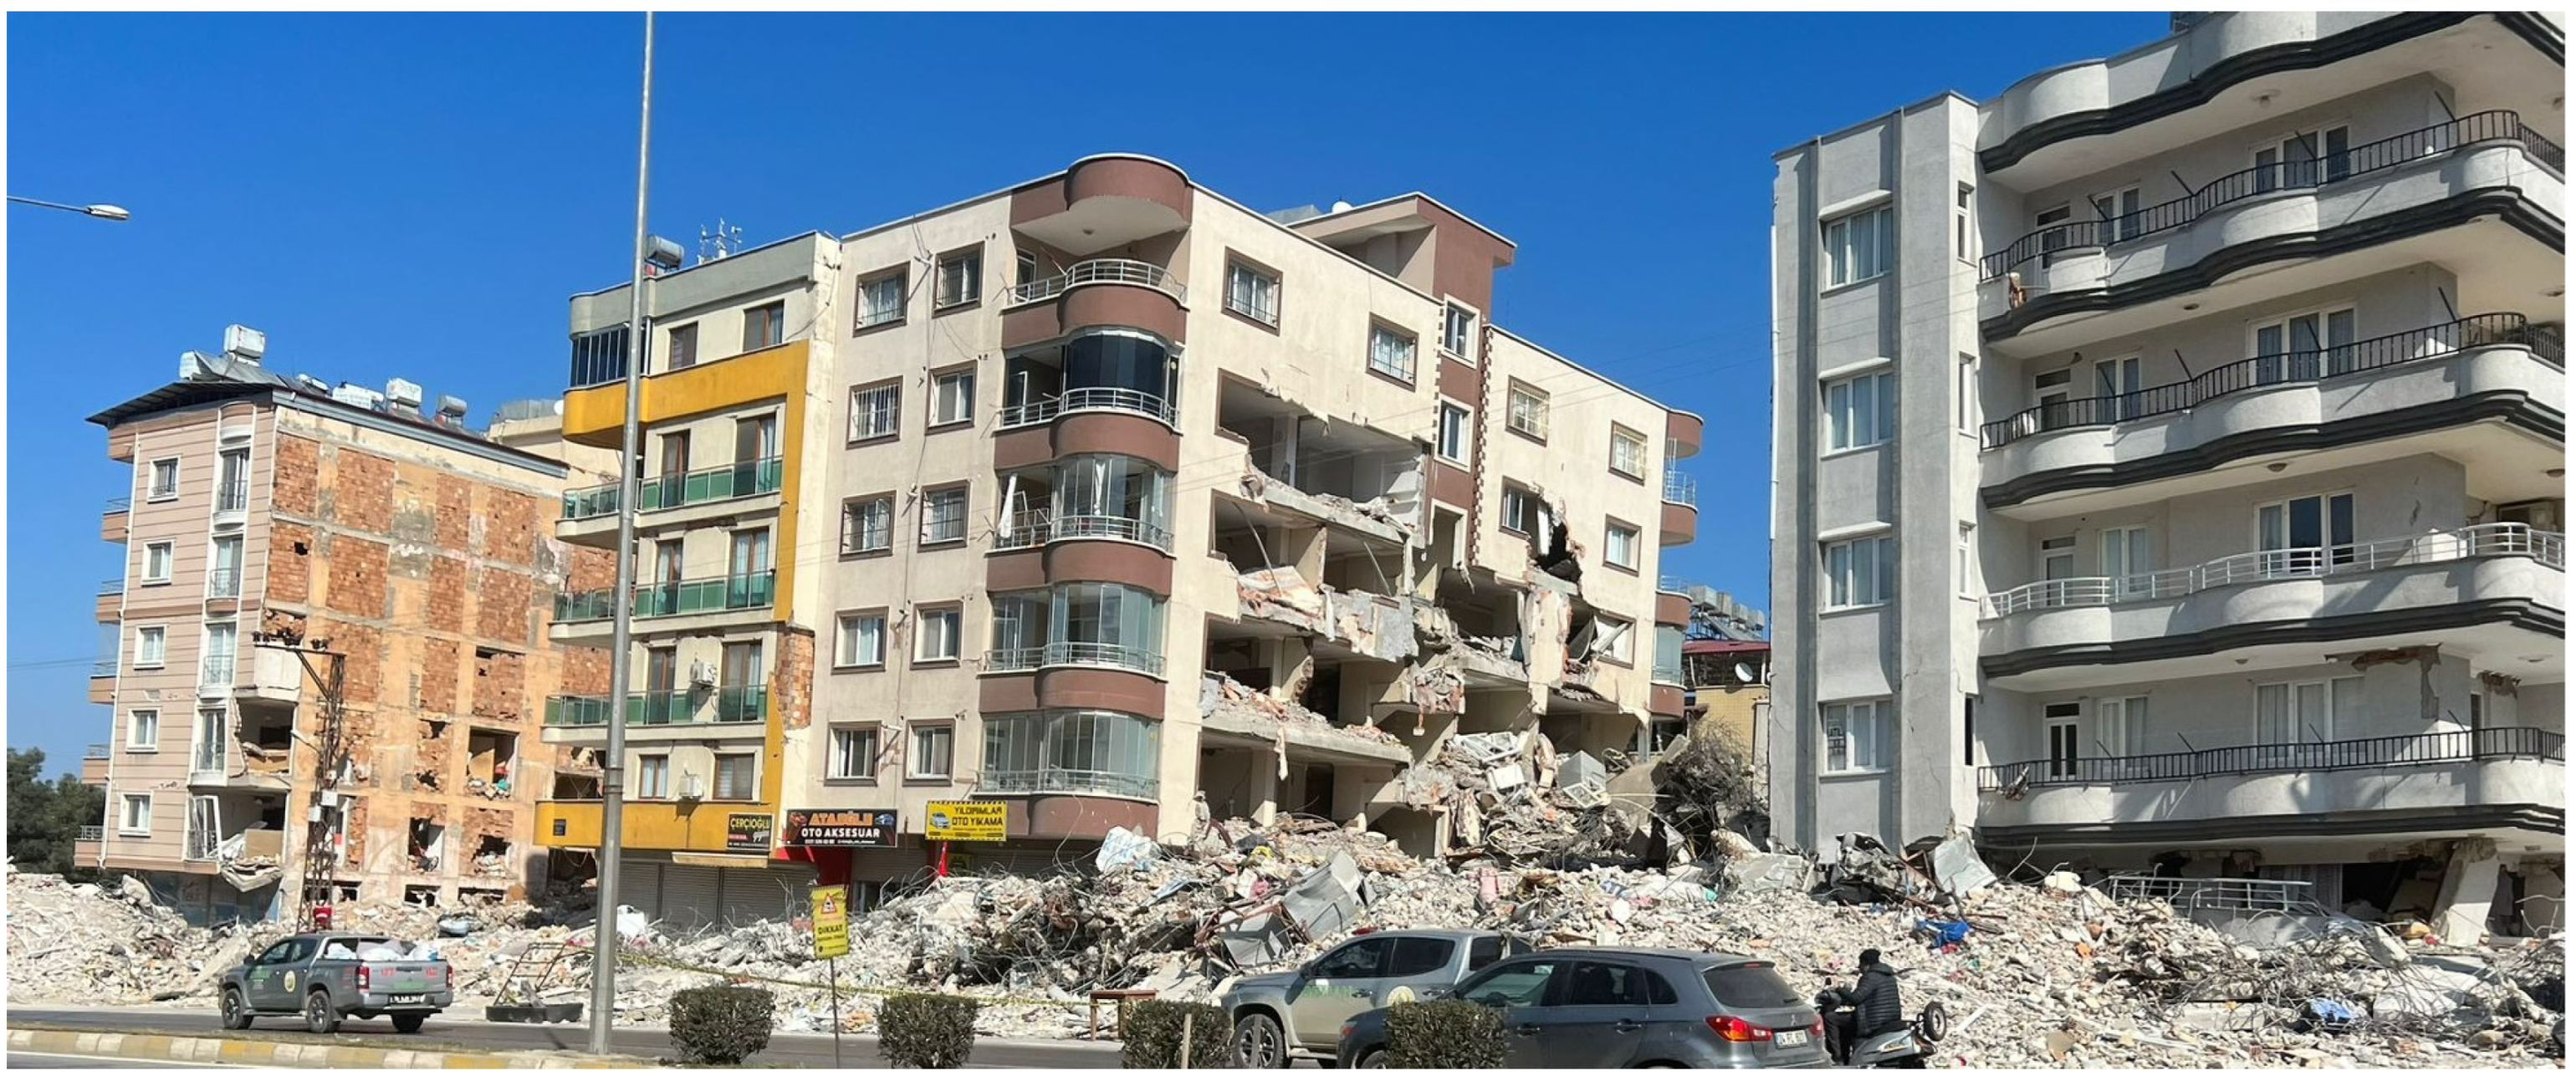
The seismic performance of reinforced concrete (RC) frame buildings with masonry infill walls remains a critical issue in regions exposed to strong ground motions, including Romania and Türkiye. The 4 March 1977 Vrancea earthquake caused widespread damage and collapse of RC buildings in Romania, highlighting the vulnerability of mid-rise frame structures with infill walls and limited ductile detailing [1,2]. More recently, the 6 February 2023 Kahramanmaraş earthquake sequence in Türkiye produced severe damage and collapse in many RC frame buildings with masonry infills (Figure 1), showing that this structural typology continues to dominate seismic risk in the current building stock [3,4,5]. Post-earthquake reconnaissance in Türkiye has repeatedly pointed to brittle infill failure, soft-story mechanisms, and inadequate confinement and detailing in RC members as frequent contributors to damage and collapse [3,4,5]. These observed damage mechanisms provide important background for the present study, although the current numerical model is focused primarily on global response and does not explicitly simulate brittle out-of-plane infill collapse mechanisms.
RC frames with masonry infills exhibit complex in-plane and out-of-plane seismic behaviour. Their response depends on infill strength and stiffness, opening layout, RC detailing quality, and the frame–infill interaction. In many design-oriented studies, infills were ignored in structural modelling and treated as non-structural components, although they can significantly modify global dynamic response and damage distribution [6,7,8,9]. Research indicates that infills can increase lateral stiffness and strength and reduce global drifts. At the same time, they may induce short-column effects, torsional irregularities, and abrupt stiffness degradation after cracking and crushing [7,8,9,10]. Reviews and experimental–numerical studies therefore stress the need for reliable modelling strategies to capture these competing effects in performance-based assessment [6,7,8,9].
Over the last two decades, modelling approaches for masonry-infilled RC frames have ranged from equivalent diagonal strut models to detailed finite-element formulations [7,8,10,11]. Simplified macro-models support efficient nonlinear static or dynamic analyses in practice. More refined approaches aim to reproduce cracking, interface sliding, and possible out-of-plane failure modes [7,8,10,11]. Nonlinear static procedures and nonlinear time-history analyses have been used to study ductility capacity, strength degradation, and collapse mechanisms in prototype and existing infilled frames [10,11,12,13,14]. These studies show that including infills can lead to markedly different estimates of seismic demand than bare-frame models, especially for interstorey drifts and the development of plastic mechanisms [10,11,12,13,14].
The influence of infill distribution and mechanical properties on global performance has also been widely investigated. Parametric and case-study analyses indicate that vertical or plan irregularities in infill layout can trigger soft-story or torsional mechanisms. Different masonry types and opening ratios can also modify capacity curves and fragility functions [15,16,17,18,19]. Large-scale experimental campaigns provide key evidence for calibration and validation, and they highlight the coupling between in-plane and out-of-plane actions and the tendency for damage concentration in specific stories [18,20]. These findings are particularly relevant for existing buildings not detailed according to modern capacity-design and confinement rules.
Despite the extensive literature, gaps remain for the seismic reassessment of existing RC frame buildings in Eastern Europe. Many studies address generic prototypes, low-rise buildings, or structures designed either without seismic provisions or according to international standards such as Eurocode 8 [21]. Fewer works focus on buildings designed according to older Romanian provisions such as P100-1/2006 [22], which still represent a substantial share of the current building stock [15,23,24,25]. Moreover, only a limited number of studies combine three-dimensional nonlinear time-history analysis of an actual multi-story building with explicit modelling of masonry infills, using recorded motions from both the 1977 Vrancea event and the 2023 Türkiye earthquakes for direct comparison [3,4,20,26]. The influence of infills on drift profiles and on the distribution of local demands in RC members under these two distinct seismotectonic scenarios is therefore not yet well quantified.
The present study addresses these issues through a nonlinear reassessment of an existing multi-story RC frame building designed in 2007 according to P100-1/2006 and located in a high-seismicity region of Romania. The building is analysed using detailed three-dimensional nonlinear finite-element models with and without masonry infills, subjected to recorded ground motions from the 1977 Vrancea earthquake and the 2023 Türkiye earthquake sequence. The time-history inputs are scaled to the current Romanian seismic hazard level ( a g   =   0.40  g, P100-1/2013 [27]), whereas the original 2007 design used a g = 0.32 g with a reduced design spectrum using a behaviour factor q = 4.5. By comparing two structural configurations—bare and infilled RC frames—under three recorded earthquakes (Vrancea 1977, Vrancea 1990, and Türkiye 2023), the study evaluates six nonlinear response-history cases and examines how masonry infills modify the global and local response, including fundamental periods, base shear demand, interstorey drifts, and the development of plastic mechanisms. The results are discussed in relation to observed damage in Romania and Türkiye and to recent research on infilled RC frames [3,4,5,6,10,11,12,13,14,15,16,17,18,19,20,21,26], with the aim of supporting seismic re-evaluation and retrofit decisions for buildings designed to earlier code generations.
The general historical discussion and fatality statistics are not repeated here, since the manuscript focuses on a mechanics-based comparison between code-era design assumptions and present-day nonlinear reassessment under updated hazard levels.
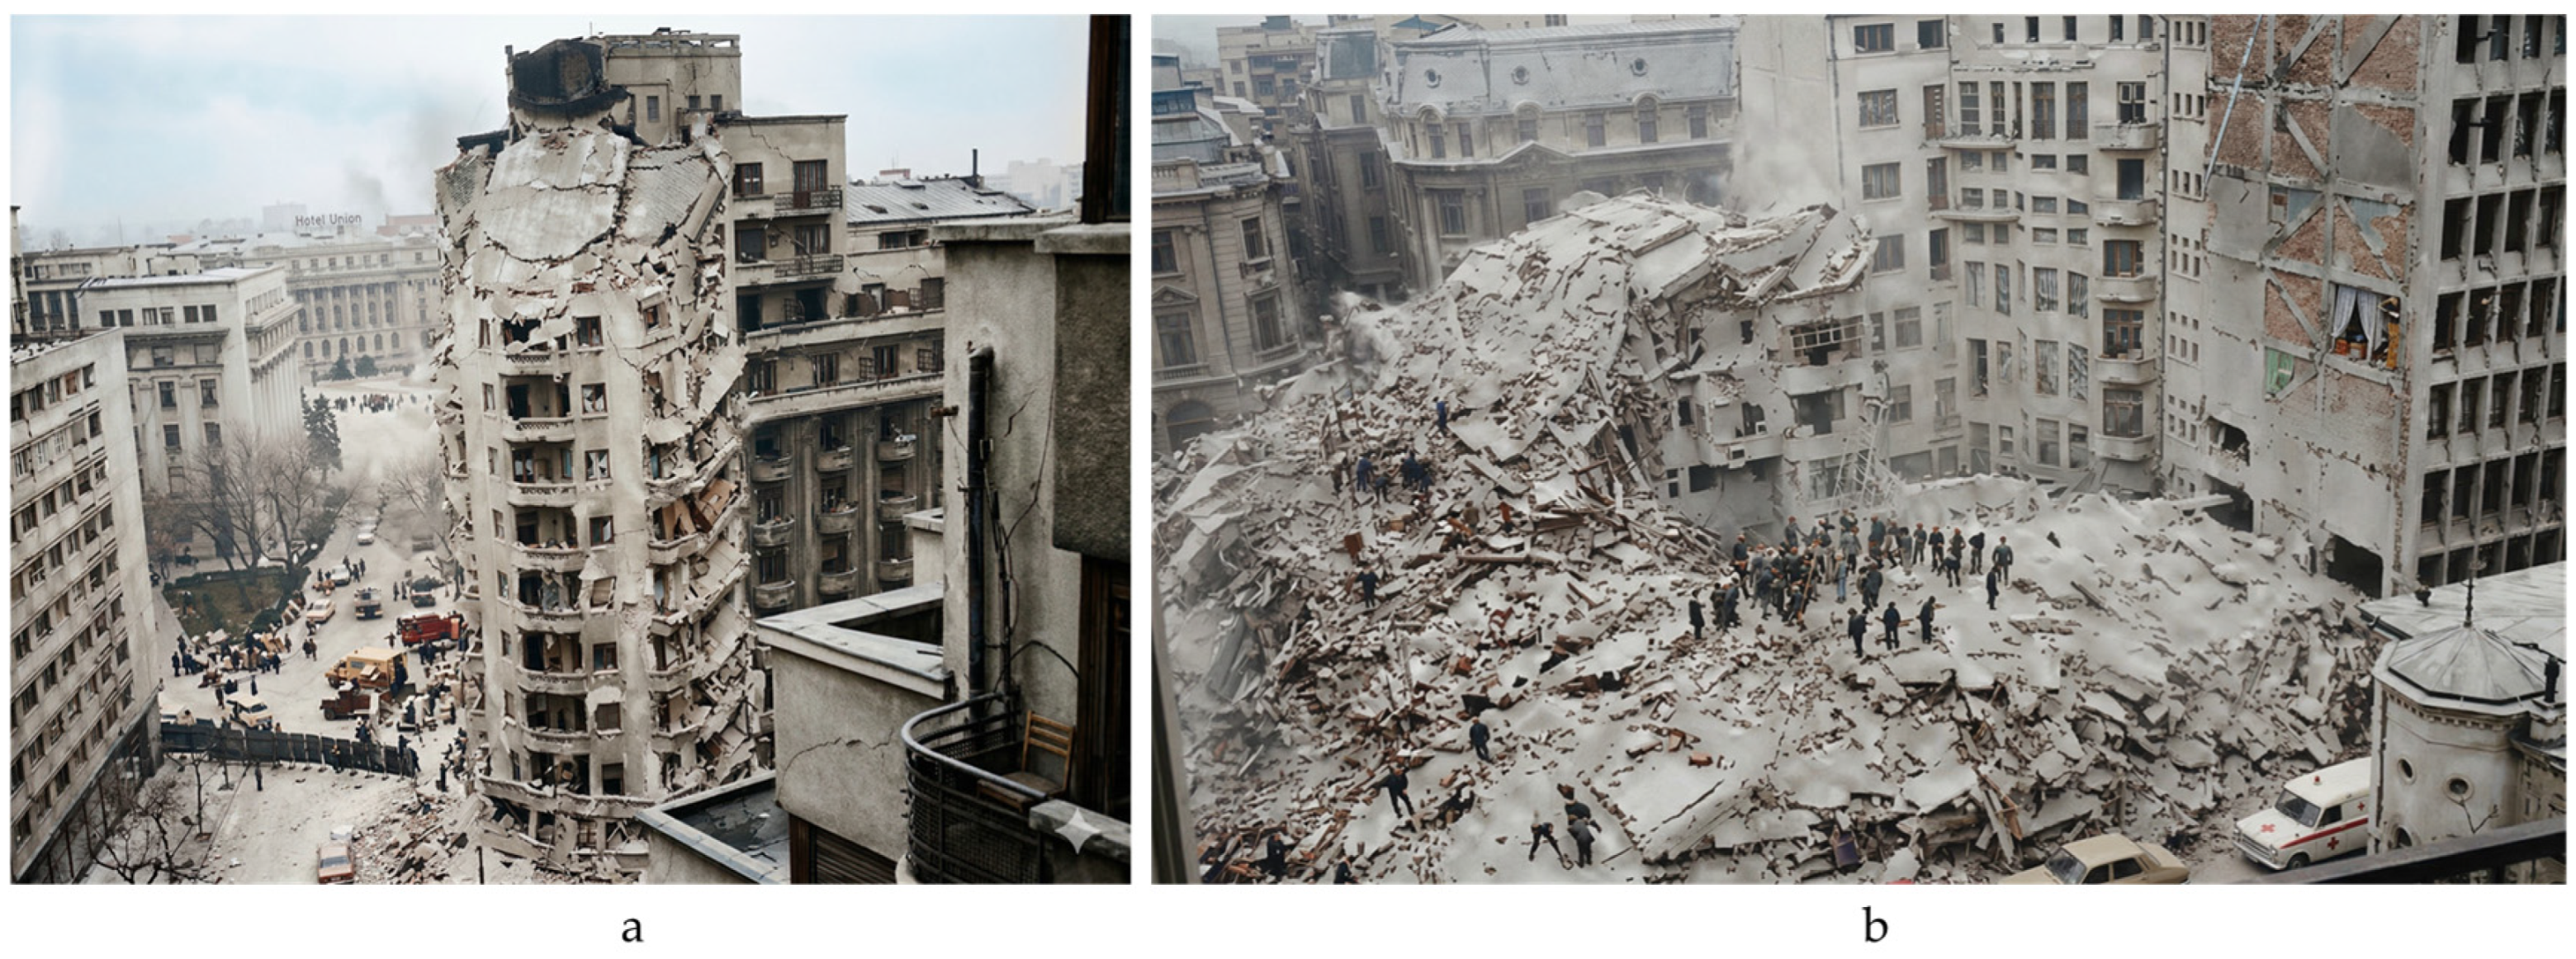
In Romania, seismic activity is largely controlled by the Vrancea intermediate-depth source. During the last century, several large Vrancea earthquakes with moment magnitude above 7 have affected the country. The 1940 event (Mw 7.6, focal depth about 150 km) caused 593 deaths, while the 1977 Vrancea earthquake (Mw 7.5) resulted in 1578 fatalities [28,29,30]. Figure 2 illustrates representative examples of severe structural damage and partial collapse in Bucharest during the 1977 event [31,32]. The observed differences in casualties between earthquakes and across regions reflect a combination of factors, including magnitude and source characteristics, site effects, urban density, and the prevailing structural typology. Low-rise, horizontally spread building stocks generally imply lower occupant concentration per unit footprint than mid-rise apartment blocks. They can also lead to different damage patterns, because the dominant periods and failure mechanisms differ from those of multi-story RC frames with infills.

2. Case-Study Building and Original Seismic Design

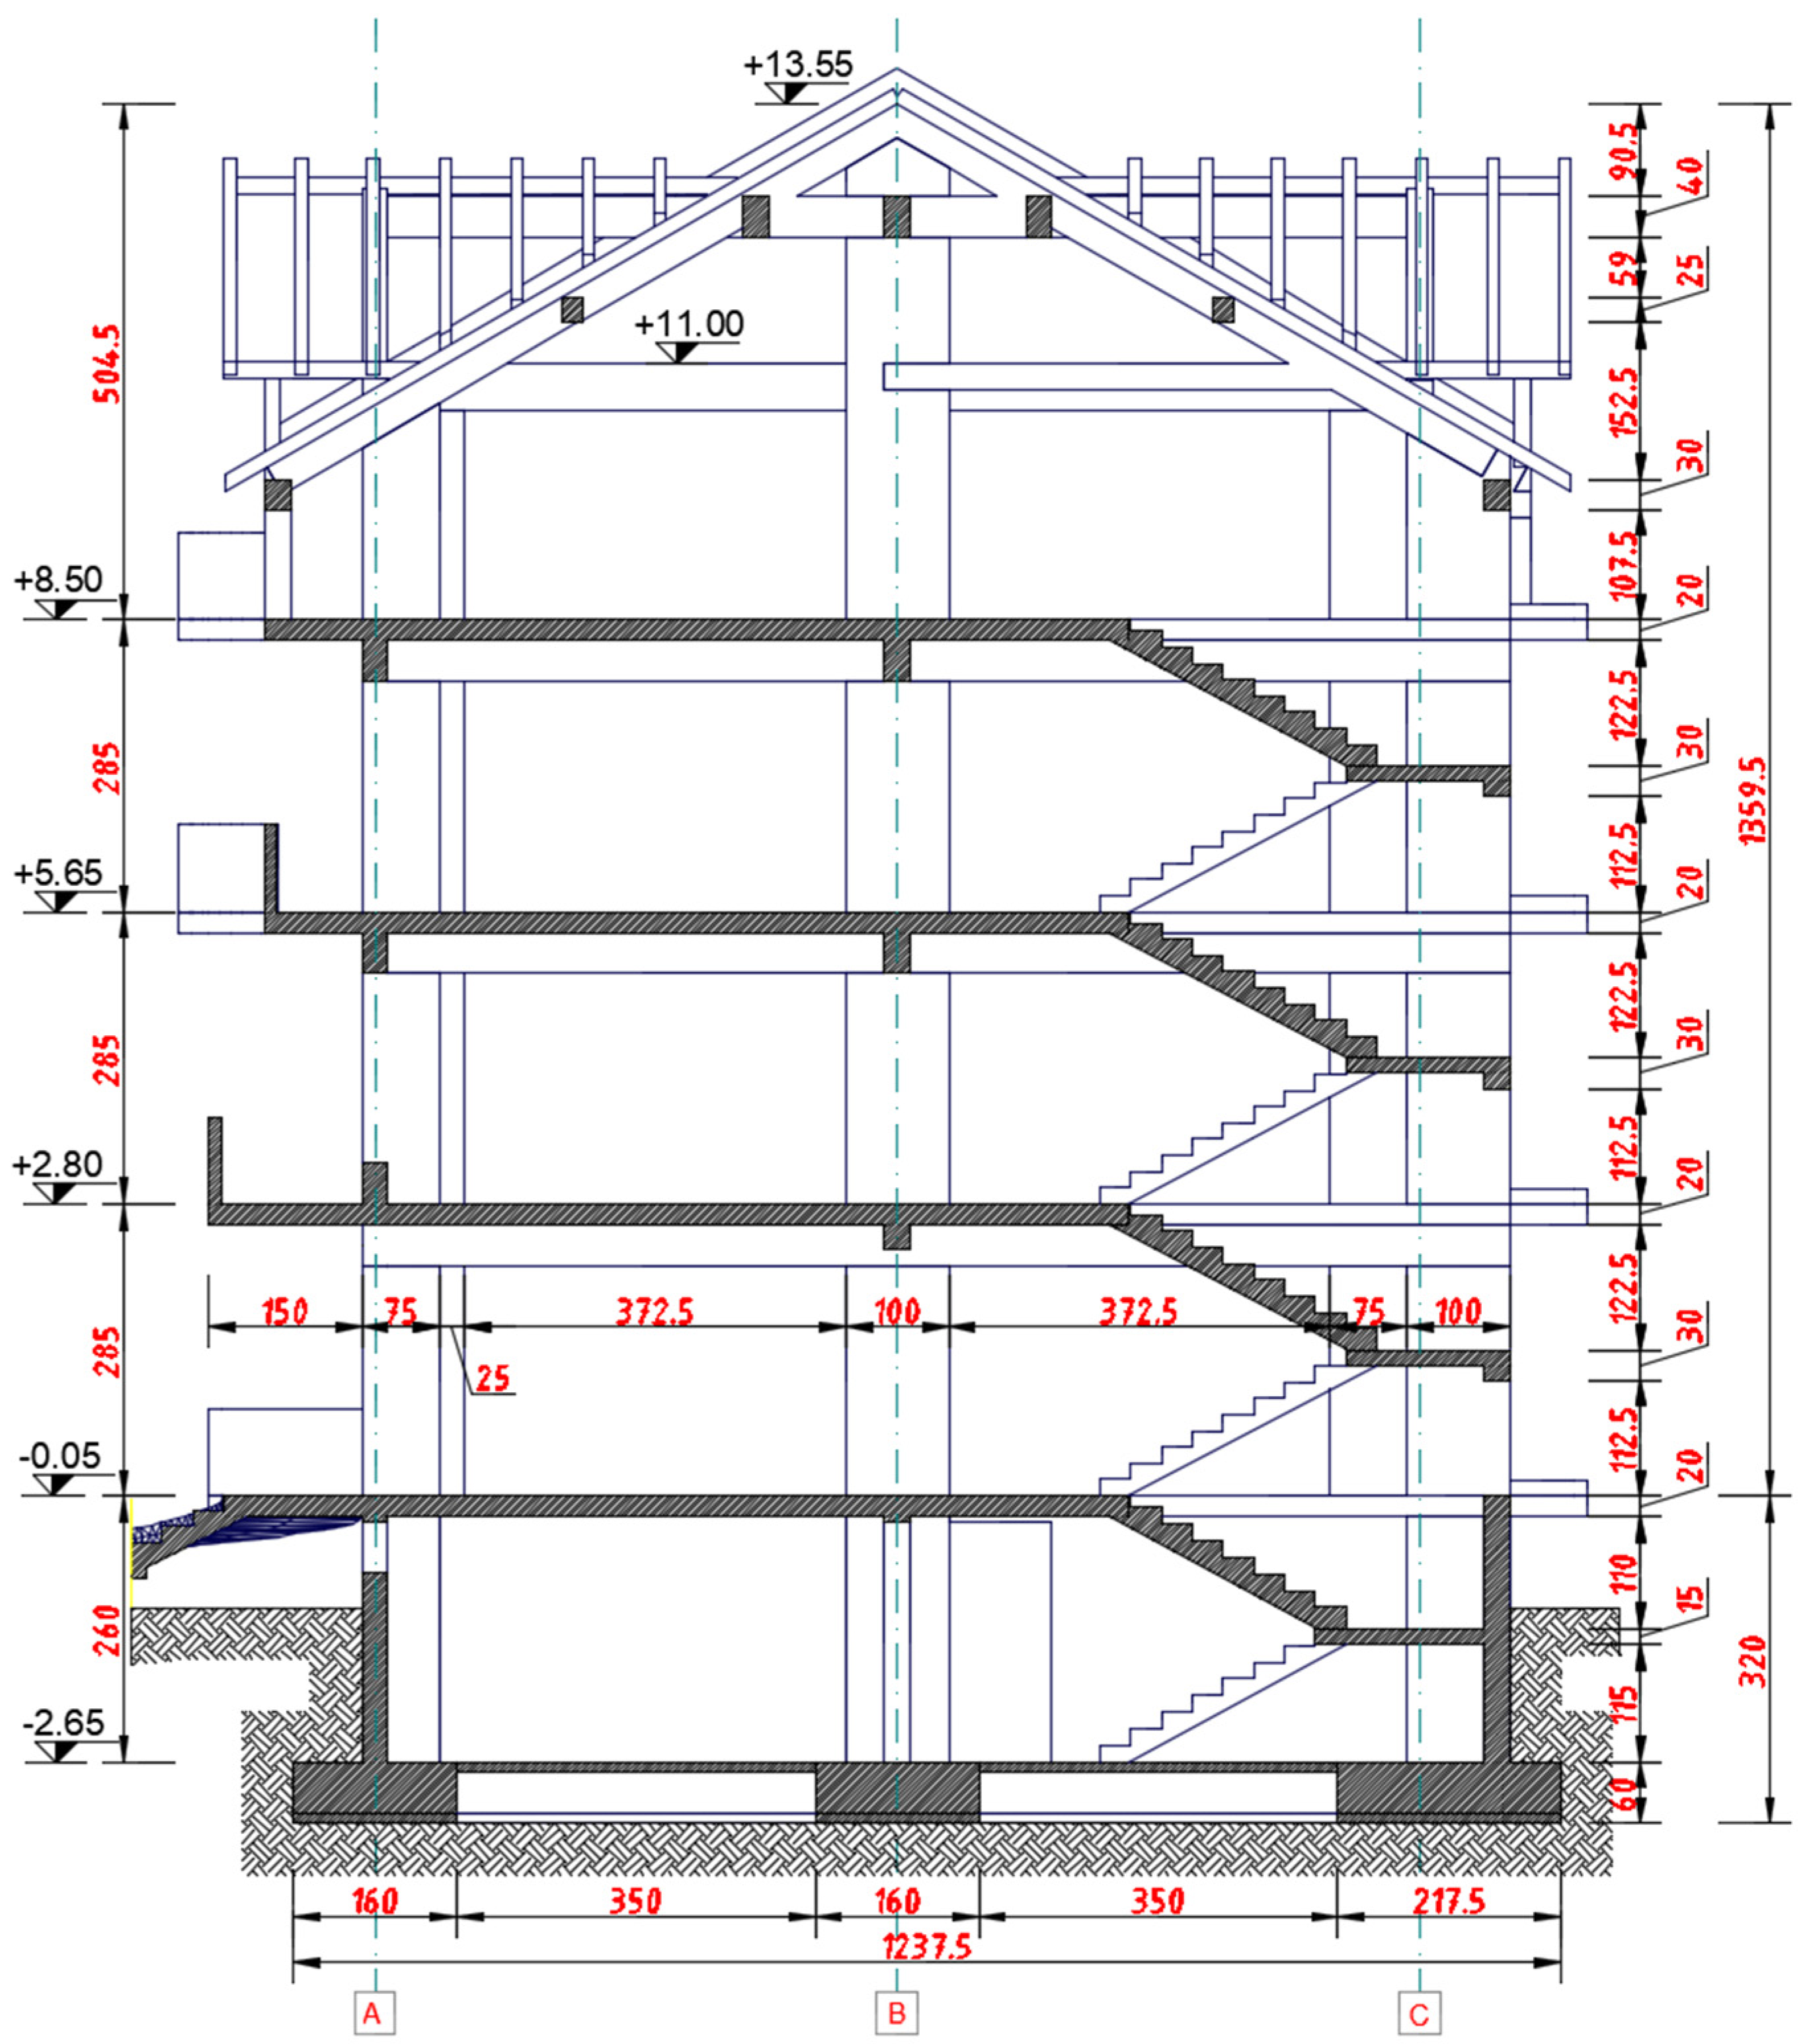
The case-study structure is a social housing block with one basement, ground floor, two typical stories and a habitable attic (D + P + 2E + M), located in Panciu (Vrancea County), in one of the highest seismic hazard zones of Romania. In the original design, the site parameters were taken as a g   =   0.32   g and T c = 1.0 s according to P100-1/2006. The building belongs to importance class C and importance–exposure class III (γI = 1.0) and was designed as a cast-in-place reinforced concrete (RC) frame system with medium ductility and behaviour factor q = 4.5 [22].
The load-bearing system consists of lamellar RC frames in both principal directions. Beams have a 25 × 60 cm cross-section, while columns include L-, T- and rectangular shapes, typically 25 cm in the minor dimension and 60–100 cm in the major one. Floors are solid RC slabs 20 cm thick, cast monolithically with the beams. The basement slab at −2.65 m is 10 cm thick, while stair flights are 13 cm thick and landings 15 cm thick. The roof is a timber pitched structure supported by RC ring beams at attic level. Foundations are continuous strip footings with RC pedestals at about −3.15 m. Footing widths are 1.60 m (reinforced concrete) and 2.20 m (plain concrete blocks), designed for a conventional bearing pressure of 150 kPa, with subgrade modulus ks ≈ 20,000 kN/m3.
The architectural layout is typical for Romanian social housing. The basement contains storage rooms, technical spaces, and circulation areas. The ground floor, upper stories, and attic contain apartments. In plan, the building comprises two 5.10 m bays and seven 3.30 m bays in the longitudinal direction, with a constant storey height of 2.85 m above the basement. The exterior enclosure walls are made of hollow ceramic masonry blocks with 5 cm external thermal insulation. The original calculation notes indicate a masonry thickness of 25 cm for the exterior walls. Interior partitions consist of 25 cm thick masonry walls (the same hollow ceramic block type as the exterior enclosure) and plasterboard walls (1 cm gypsum board on each side of cold-formed steel studs with mineral wool infill). The roof is a pitched timber structure composed of rafters, purlins, posts, and wall plates supported by RC ring beams at attic level. In the original 2007 structural design model developed in Robot Structural Analysis Professional 2006 according to P100-1/2006, the exterior masonry walls were considered only through their gravity load contribution acting on the slabs and were not included as structural members in the seismic analysis. Accordingly, the original seismic model was a bare-frame idealisation and no frame–infill interaction was considered.
Concrete class C16/20 (Bc20) and reinforcing steel grades PC52 and OB37 were specified in the original design documentation. The documented reinforcement diameters include Ø22 and Ø16 bars for PC52 and Ø8 and Ø10 bars for OB37. In general, the larger-diameter PC52 bars were used for the main longitudinal reinforcement of RC members, while the smaller-diameter OB37 bars were used exclusively for transverse reinforcement (stirrups and ties in beams and columns) and were not employed as main longitudinal reinforcement in any structural member. The design followed NP 007-97 [33] for RC frames, STAS 10107/0-90 [34] for concrete members, CR0 and CR1-1-3 for actions, and the seismic code P100-1/2006. In this original modelling approach, the masonry enclosure and partition walls were treated as non-structural components and were not assigned any in-plane lateral stiffness contribution. Modal response spectrum analysis was conducted using the P100-1/2006 design spectrum for the Vrancea region ( a g   =   0.32   g , T c   =   1.0   s ). In this original design context, the seismic demand was reduced through the behaviour factor q = 4.5, in line with code-based force design. For this value, the plateau spectral acceleration is of the order of S d ( T )     0.18   g in the period range relevant to the fundamental mode, leading to a design base shear of the order of 0.18 times the seismic weight in each principal direction. These values are reported to document the original force-based design assumptions and should not be interpreted as direct predictors of nonlinear time-history demand.
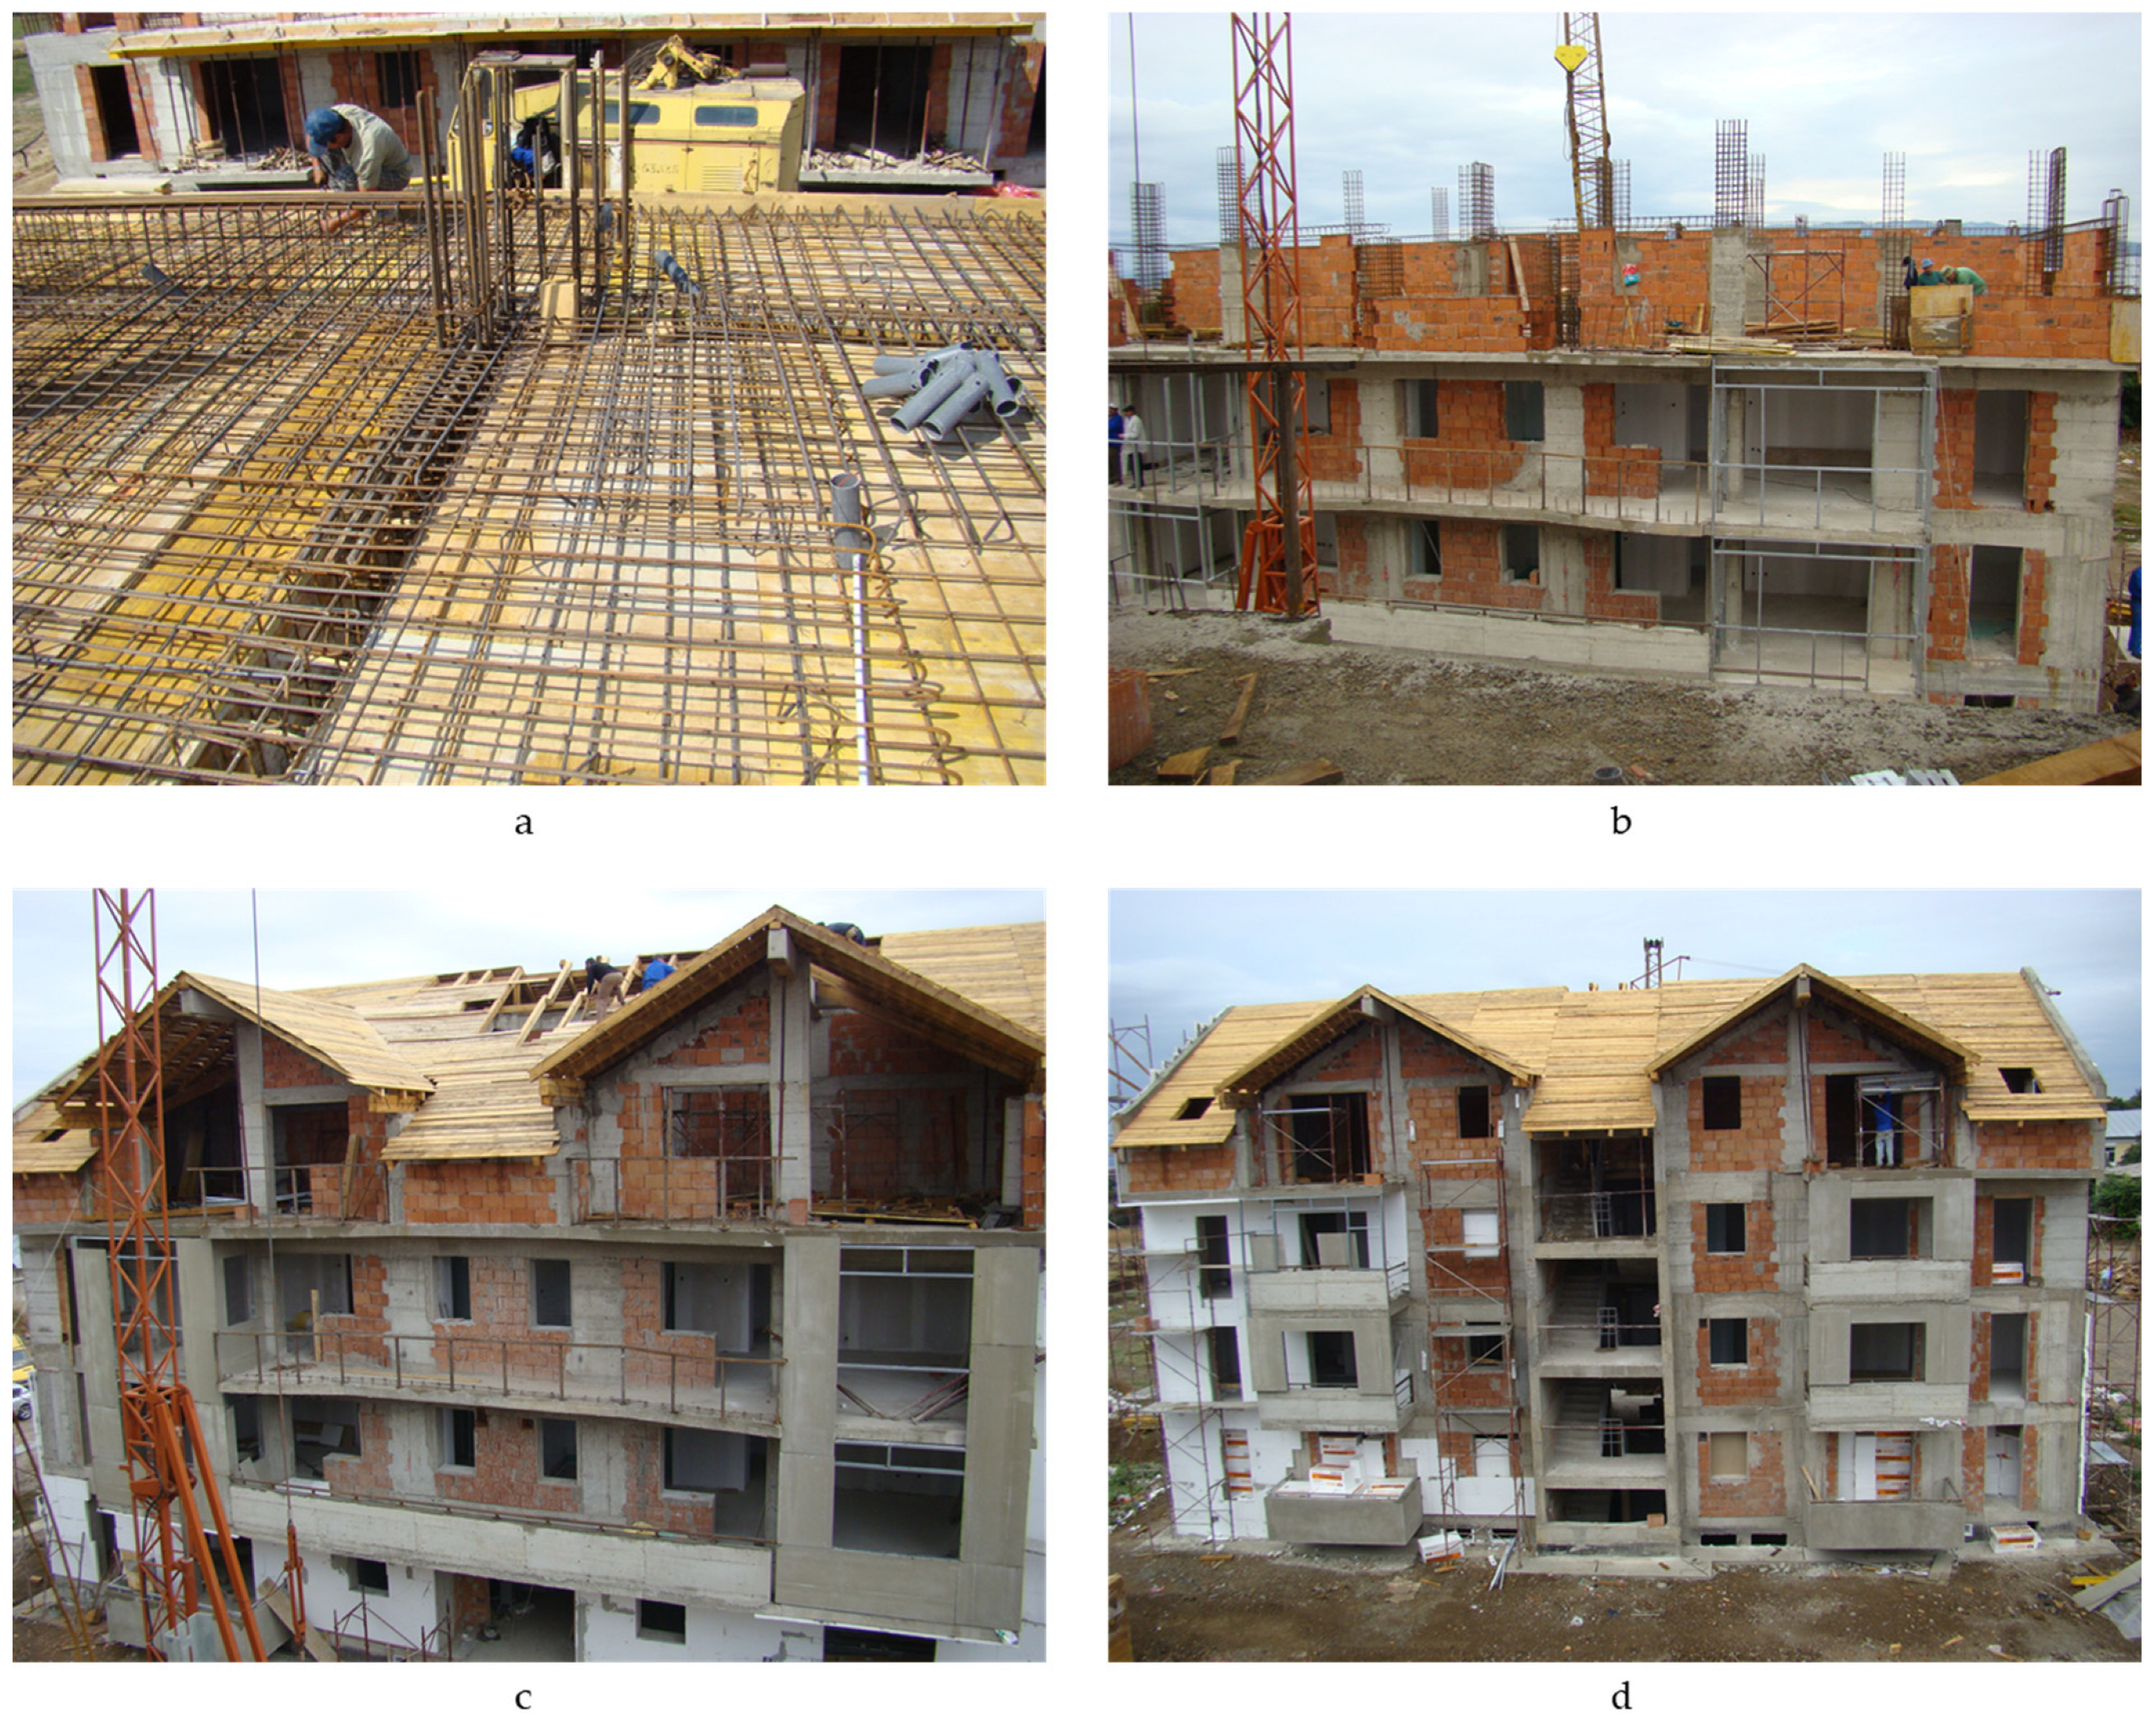
Figure 3 documents key construction stages and provides visual confirmation of the executed configuration and materials. The images show the slab and beam reinforcement prior to concreting, the erection of RC frames, and the progressive construction of hollow clay masonry infill walls between columns and beams. The final images illustrate completed infills with openings, balcony and stair-core detailing, and the installation of the timber roof structure. These photographs are used primarily as qualitative evidence of the presence, extent, and construction sequence of the infills, which later motivates their explicit inclusion in the nonlinear finite-element models.
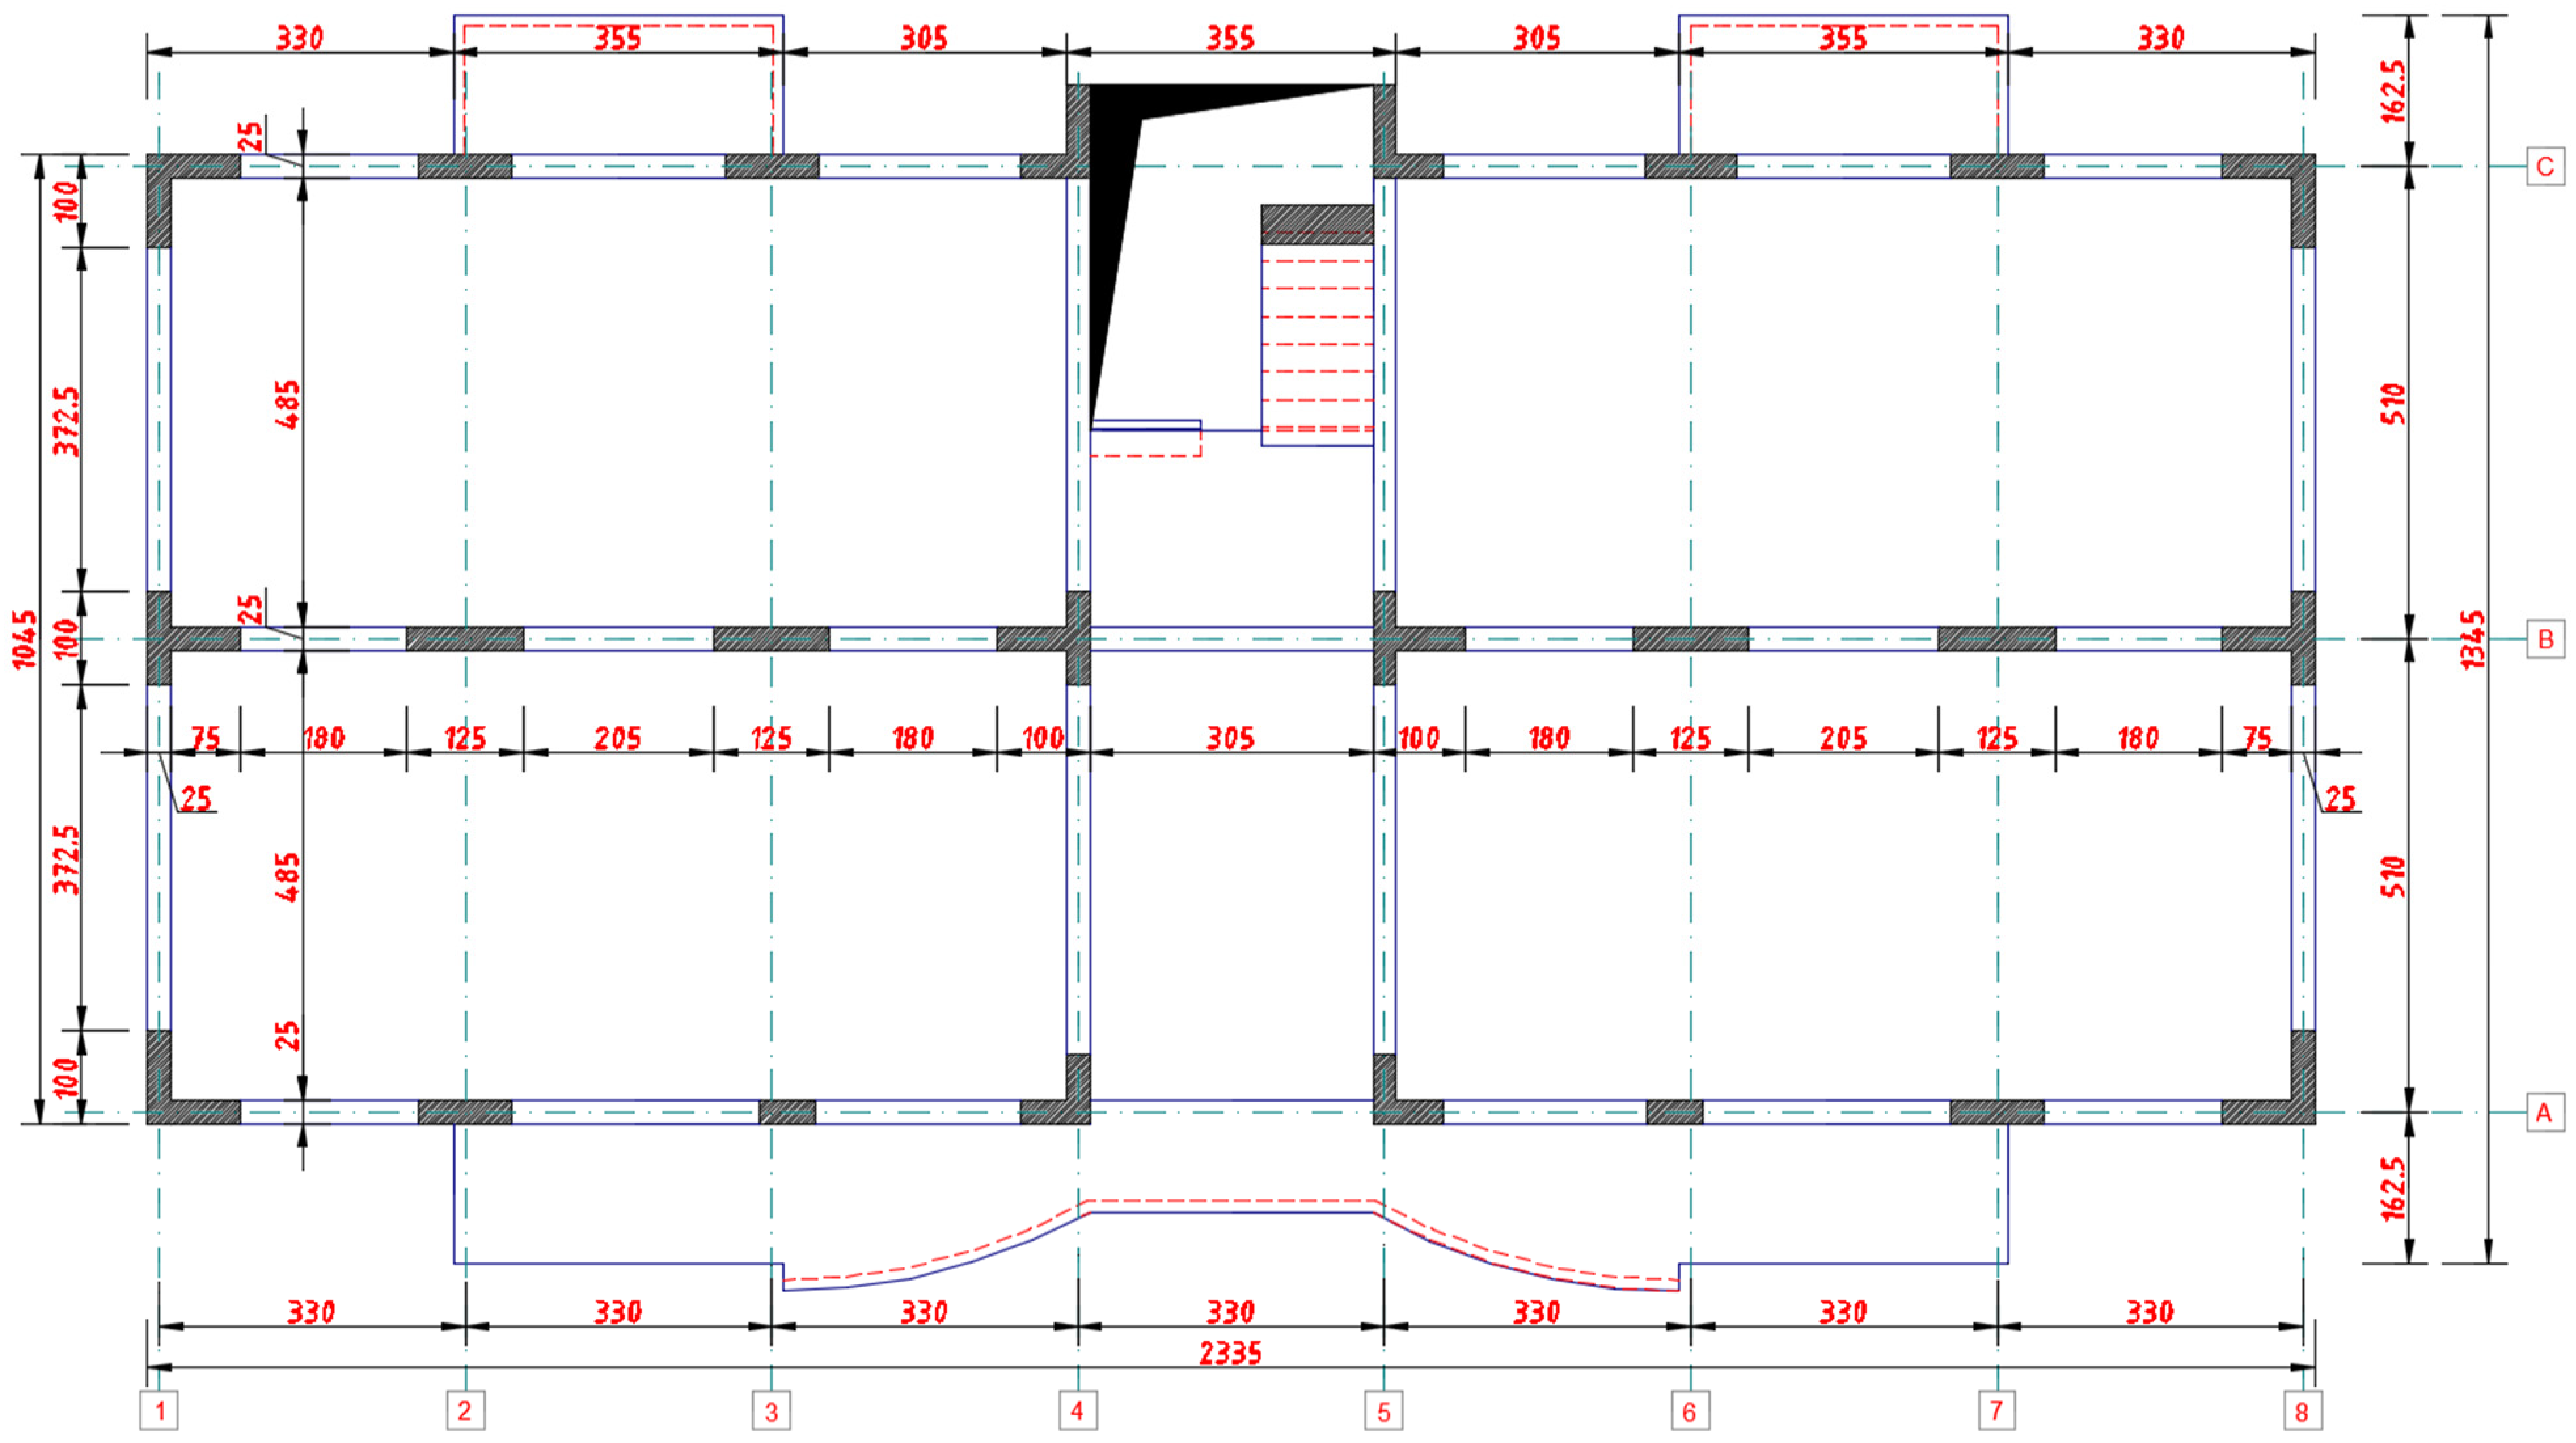
The foundations consist of continuous strip footings and pedestals under the main columns, as detailed in the foundation plan in Figure 4. Footing widths range between 1.60 m and 2.20 m, depending on column loads and soil bearing capacity. The typical floor formwork plan in Figure 5 shows the arrangement of beams and solid slabs, including stair-core and balcony openings, and was used to verify consistency between architectural and structural layouts and to define tributary areas for gravity loads.
Table 1 summarises the main subsystems and materials as specified in the original design and clarifies their role in the original analytical model. For the later nonlinear reassessment, the same material classes are retained as a starting point, while nonlinear constitutive laws are introduced for concrete and explicit reinforcement representations are adopted, consistent with the objectives of time-history simulation.

3. Seismic Actions and Ground Motion Selection

The case-study building is located in the Vrancea seismic region, which controls the hazard for most of Romania. Intermediate-depth events, with focal depths typically between 70 and 150 km, generate long-period motions that can strongly affect mid-rise reinforced concrete frame buildings over large areas, including Bucharest and eastern Romania. The current Romanian seismic code P100-1/2013 specifies the design ground acceleration and elastic response spectrum for this source. For the investigated site, the code parameters are a g = 0.40   g and corner period T c = 1.0 s . These parameters define the target elastic spectrum used to scale the selected ground-motion records for the nonlinear time-history analyses.

3.1. Overview of the Selected Earthquakes

Three recorded earthquakes were selected to represent two distinct seismotectonic scenarios relevant to the present study: intermediate-depth Vrancea motions, which govern seismic hazard in Romania, and a shallow-crustal Turkish motion used as a contrasting scenario. The set includes the 4 March 1977 Vrancea earthquake, the 1990 Vrancea earthquake sequence, and the 6 February 2023 Kahramanmaraş, Türkiye, earthquake sequence. Their main characteristics and the rationale for their inclusion are summarised in Table 2.
The final compatibility of the selected records with the Romanian seismic demand was imposed subsequently through scaling to the P100-1/2013 target spectrum, as described in Section 3.3.

3.2. Strong-Motion Records

For each earthquake, one accelerogram was selected from the Engineering Strong-Motion (ESM) database, which provides uniformly processed waveforms and metadata for the Euro-Mediterranean region. The selected records were chosen to limit variability due to local site effects and to ensure seismotectonic relevance for the comparative study [35].
  • Vrancea 1977: station A39 (Romania), event RO-1977-0001, two horizontal components (HN-N and HN-E).
  • Vrancea 1990: station A1856 (Romania), event RO-1990-0003, two horizontal components (HN2 and HN3).
  • Türkiye 2023: station 3138 (network TK), event INT-20230206_0000008, two horizontal components (HNN and HNE).
The raw peak ground accelerations at the recording sites are approximately 0.17–0.20 g for Vrancea 1977, 0.011–0.019 g for Vrancea 1990, and 0.75–0.90 g for the 2023 Türkiye record in the horizontal directions (values from the processed ESM records used in this study). Only the two horizontal components were considered in the structural analyses, in agreement with common code practice for ordinary buildings, where the vertical component is typically assessed separately. In the nonlinear analyses, the two horizontal components were applied simultaneously along the global X and Y axes of the numerical model; no SRSS combination was used for the input motion.
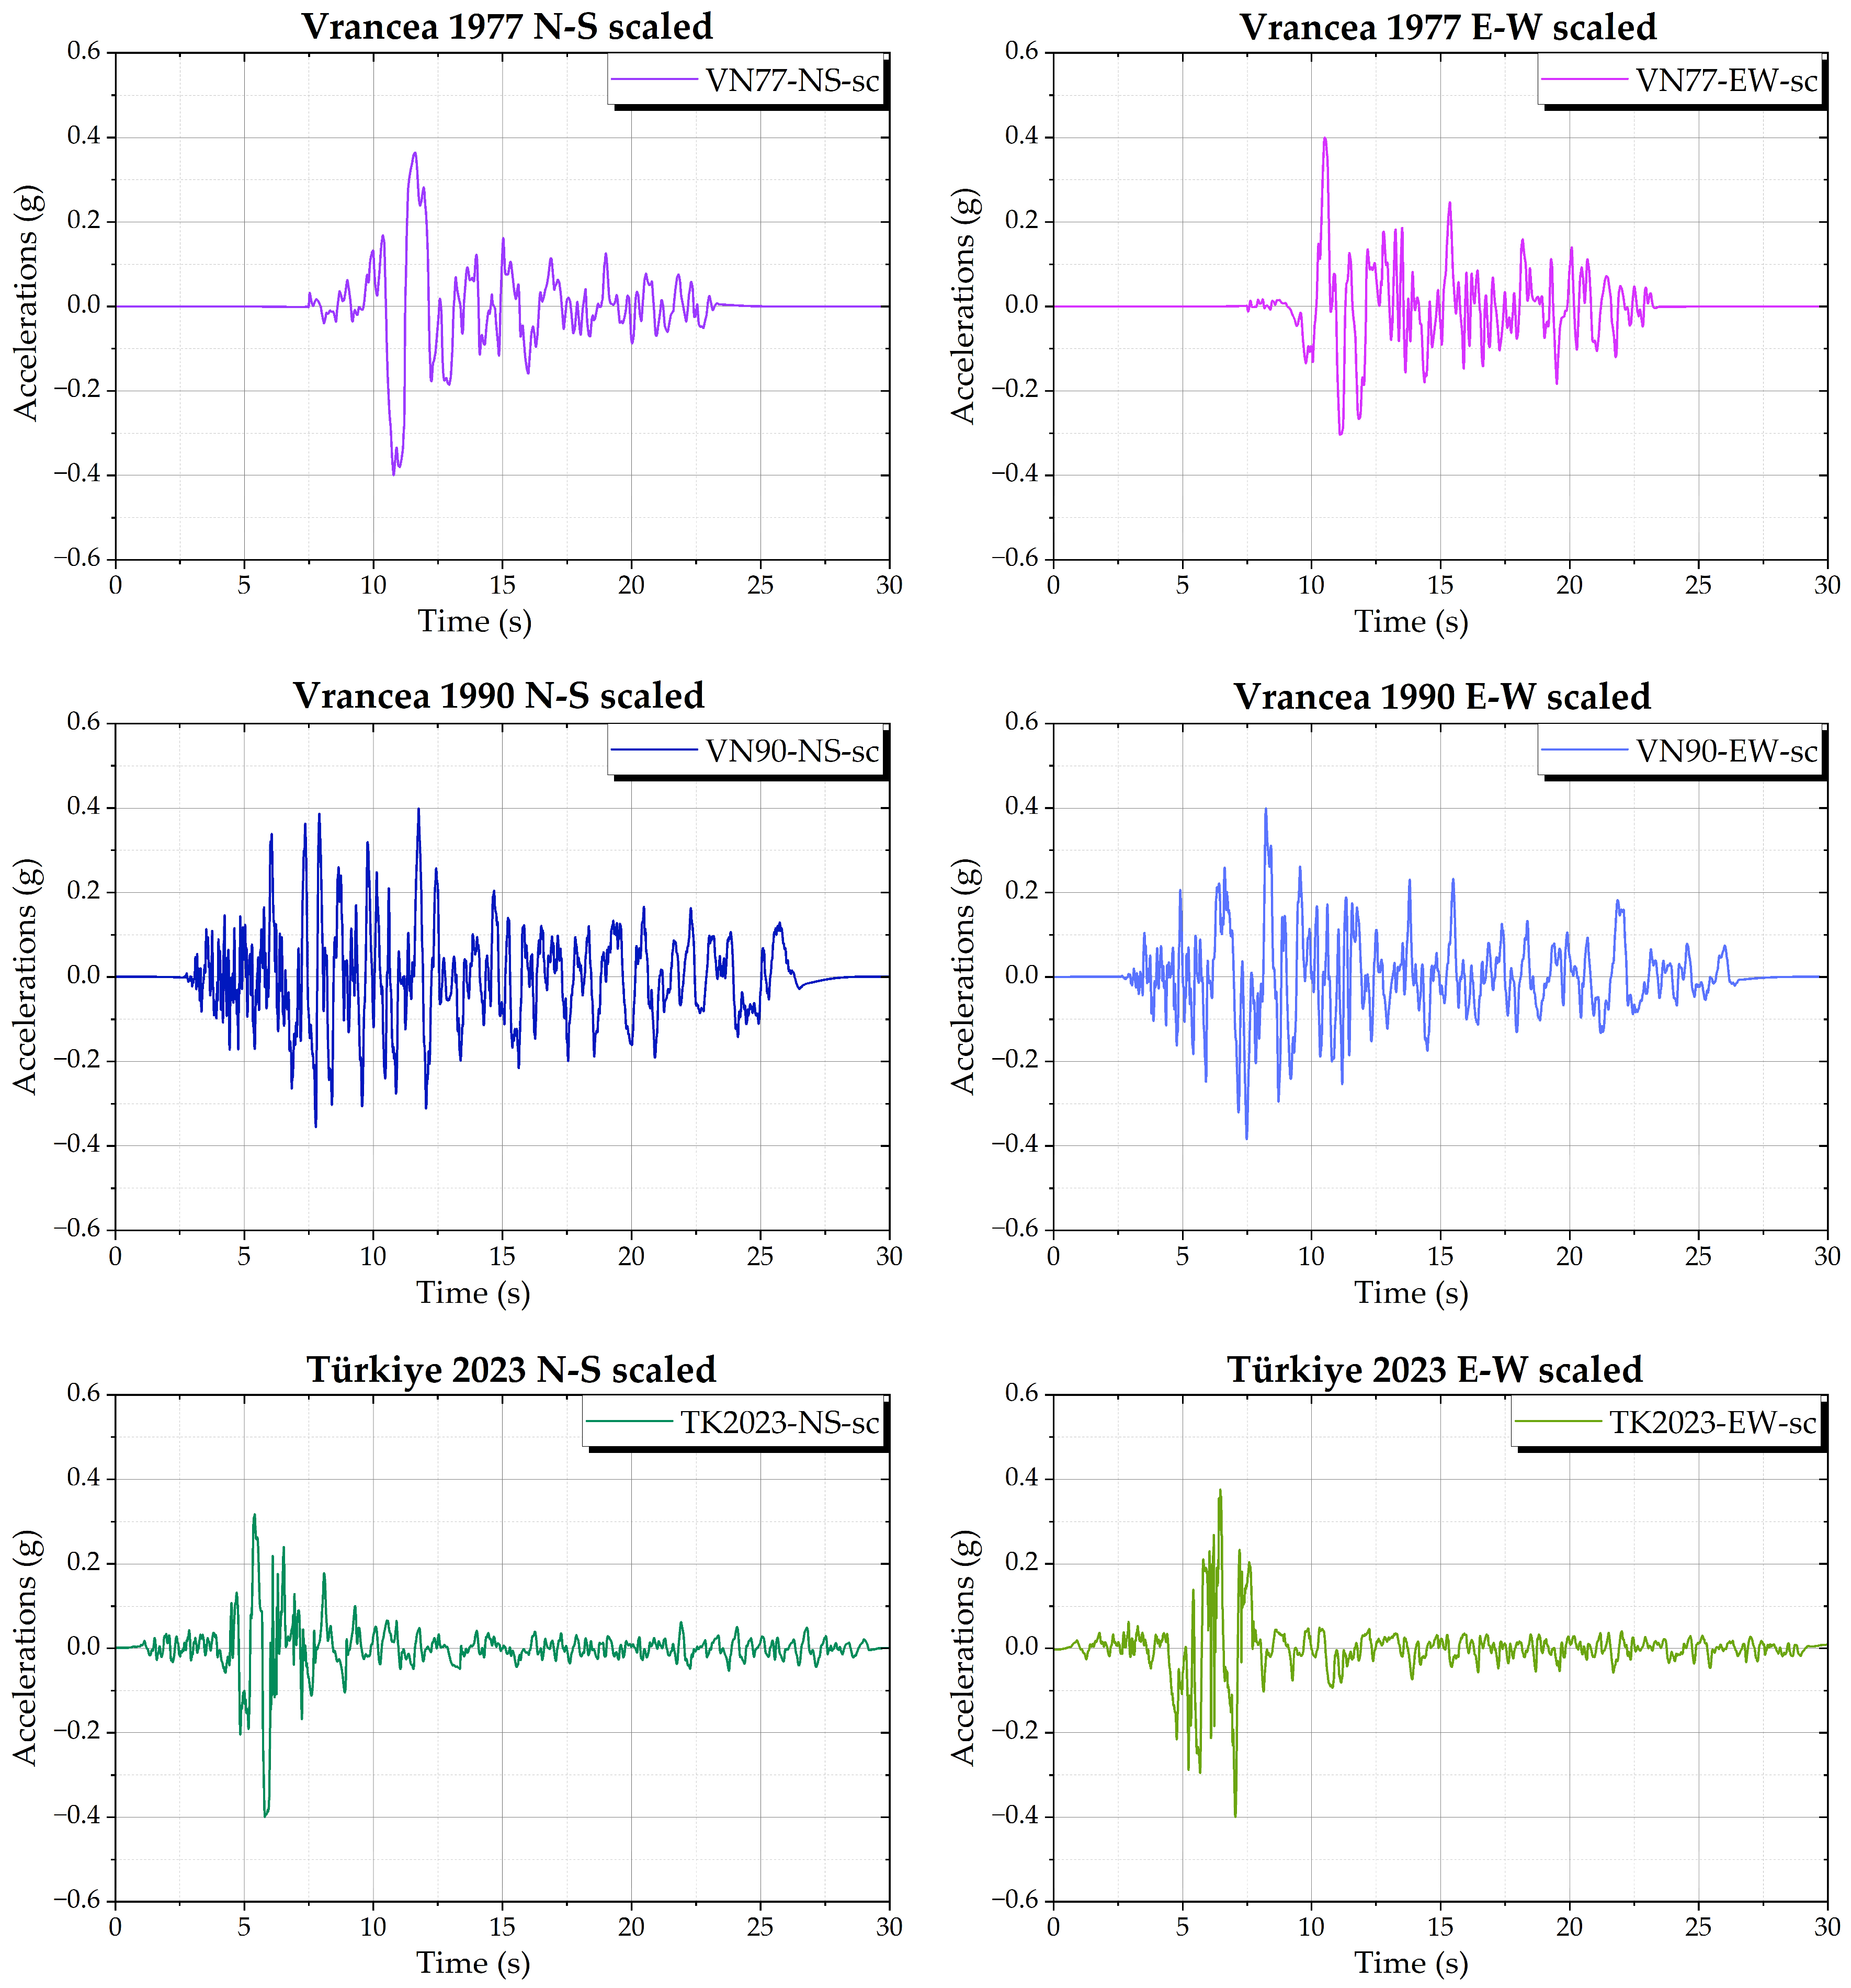
Each pair of horizontal components was scaled using a single factor so that the resulting response spectrum matches the P100-1/2013 target elastic spectrum defined by a g = 0.40 g and T c = 1.0 s over the selected period range. This scaling ensures a consistent intensity level for comparing the response under different records and structural configurations. Figure 6 shows the scaled acceleration time histories of the selected records, for both horizontal components (N–S and E–W). The plots highlight the different duration and pulse content of the Vrancea and Türkiye motions, while maintaining a consistent intensity level after scaling.

3.3. Record Processing and Spectral Scaling

All accelerograms were downloaded in processed form from ESM database and then re-processed using the online ITACA (ITalian ACcelerometric Archive v4.0)/ESM (the Engineering Strong-Motion Database) tools to ensure a uniform treatment of all records. A causal band-pass filter with cut-off frequencies 0.2–25 Hz was adopted for all components, following common practice for building-scale analyses in the Euro-Mediterranean region. The raw ESM records had an initial sampling interval of 0.005 s. For the nonlinear time-history analyses, the records were trimmed to the time windows of interest and resampled to a constant time step of Δt = 0.05 s in order to reduce computational effort while preserving the response quantities relevant to the investigated structure. The main details of the raw ESM records and of the final scaled inputs used in the numerical model are summarised in Table 3.
Table 3 reports the individual scale factors applied to each record pair and documents the final scaled inputs used in the nonlinear analyses. The adopted three-record suite should not be interpreted as a statistically representative record ensemble, but as a limited comparative set defined to explore the sensitivity of the structural response to different input characteristics under a common reference intensity level.
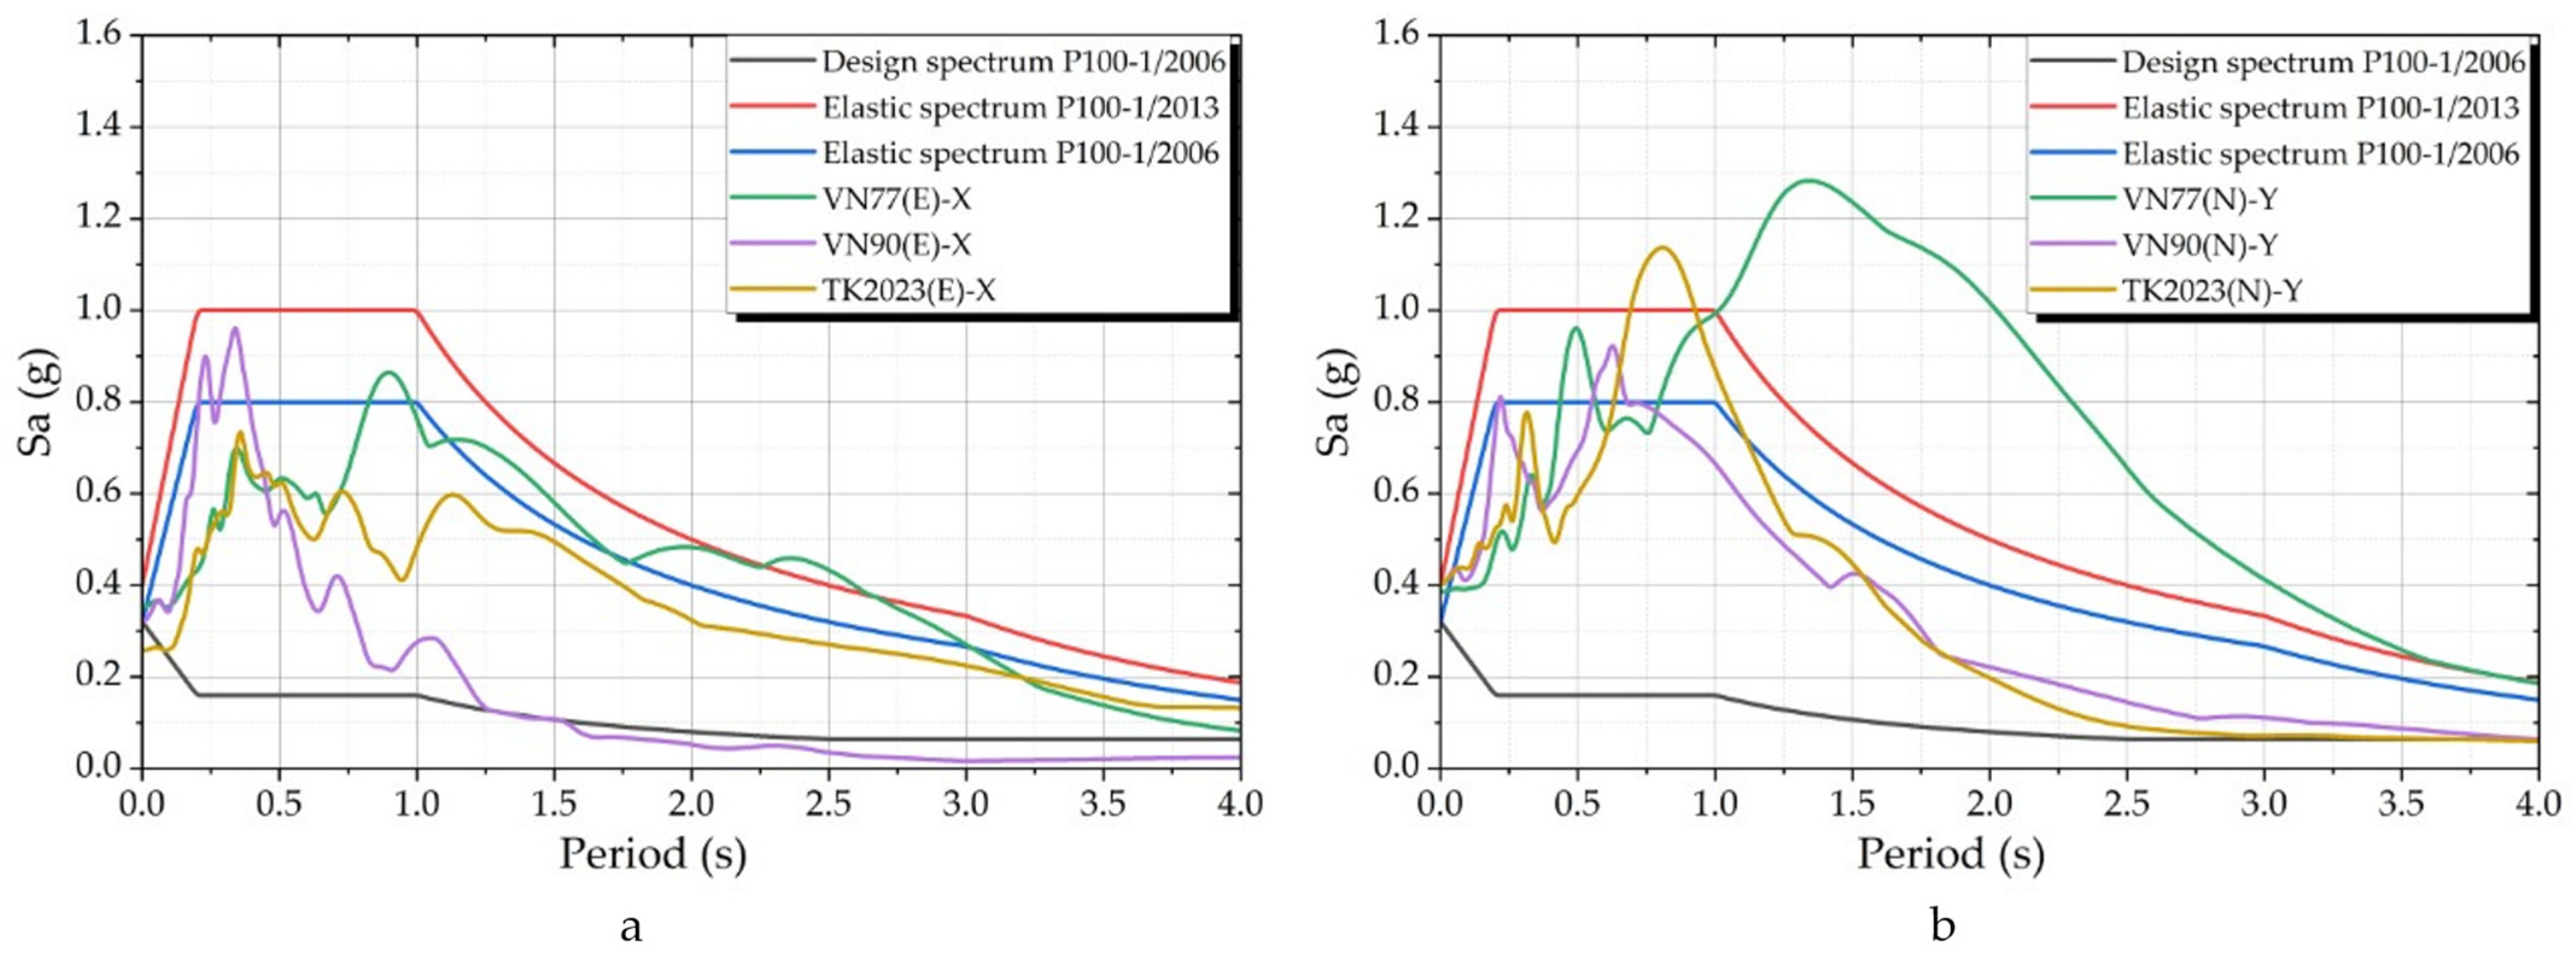
Each pair of horizontal components was scaled by a single factor so that the geometric-mean, 5%-damped elastic response spectrum matches, in an average least-squares sense, the P100-1/2013 elastic target spectrum for the considered site over the period range 0.1–2.0 s. This fixed period band was adopted directly, rather than a relative interval of the form 0.2 T1–1.5 T1, in order to cover the full response range relevant to the investigated structure. The target spectrum corresponds to the local site conditions and the building importance category, with a g = 0.40 g and T c = 1.0 s, while the remaining spectral parameters follow the code definitions. Figure 7 compares the resulting record spectra with the P100-1/2013 elastic target and, for reference, with the P100-1/2006 design and elastic spectra.
Table 3 reports the applied scale factors, component mapping, EC8 site class, raw and scaled PGA values, retained record durations, and the average and maximum spectral misfit values obtained after matching over 0.1–2.0 s. After scaling, the spectral ordinates of the selected records over the period range of interest become comparable and consistent with the reference design level adopted in this study. The selected suite remains limited and does not support broad statistical inference. However, within this three-record comparative set, the main directional trend is stable: the infilled configuration consistently shows lower displacement-related demand than the bare-frame configuration. At the same time, the magnitude of the response reduction and the local inelastic indicators remain record-dependent. The final retained input durations were 18 s for the Vrancea 1977 record, 15 s for the Vrancea 1990 record, and 18 s for the Türkiye 2023 record.

3.4. Justification of the Selected Suite

The selected suite of three records was defined primarily for comparative, scenario-based assessment, on the basis of source type and structural relevance rather than spectral-shape similarity alone. Two records (Vrancea 1977 and Vrancea 1990) represent the intermediate-depth Vrancea source, which governs the seismic hazard for the Romanian case-study site, while the 2023 Türkiye record was included as a contrasting shallow-crustal strike-slip motion in order to examine the effect of a different waveform character on the same RC frame building. To limit variability associated with local site effects, records with documented relatively firm site conditions were preferred. The final spectral compatibility with the Romanian code demand was then imposed through scaling to the P100-1/2013 target spectrum. Accordingly, the adopted suite should be interpreted as a limited comparative set, not as a statistically representative hazard-consistent record ensemble.
The Vrancea 1977 record represents the reference major event that strongly influenced the evolution of Romanian seismic regulations and produced severe damage in building typologies comparable to the case-study structure. The Vrancea 1990 record corresponds to the strongest Vrancea event after 1977 and provides an additional sample from the same source, representative of a lower-magnitude but more frequent scenario that can still generate significant shaking in Bucharest and other urban areas. The VN90 record required the largest scale factor because its recorded intensity was much lower than the adopted reference level. This should not be interpreted directly as the poorest spectral-shape compatibility, which was evaluated separately through the post-scaling misfit indicators reported in Table 3. Within the present limited comparative suite, VN90 produced the most demanding response in several global measures after scaling. This governing character should therefore be understood in the context of the adopted common target intensity and the scaled waveform characteristics, rather than as a direct intrinsic ranking of the original unscaled source record.
The 2023 Türkiye record introduces a different tectonic context, with shallow strike-slip faulting and waveform features often associated with near-fault effects, including pronounced velocity pulses and relatively shorter effective durations. This event is considered because it caused extensive collapse of reinforced concrete frame buildings with unreinforced masonry infills, which share key vulnerability drivers with many residential buildings in Romania. By scaling all records to the same P100-1/2013 elastic target spectrum, the influence of record-to-record differences in frequency content, duration, and cumulative hysteretic demand on the nonlinear seismic response of the building can be assessed in a consistent framework.

4. Numerical Modelling and Analysis Procedure

The seismic response of the case-study building was analysed in ANSYS Workbench 2025 R2 using detailed three-dimensional finite-element models. The model was developed to capture stiffness degradation, force redistribution, and reinforcement activation after concrete cracking. The load-bearing RC members (beams, columns, slabs, and stair flights) were modelled with 3D solid elements. Two structural configurations were investigated: a bare RC frame and an infilled RC frame, in which masonry panels were introduced in the corresponding bays.
Two analysis levels were used. The first level was intended as a verification step for global dynamic characteristics. The second level provided the final nonlinear time-history response.
  • Approach 1 (verification). A modal-based transient workflow was used to check fundamental periods, mode shapes, and global mass participation. This step served as a consistency check of the 3D FE idealisation and as a benchmark against the linear-elastic reference model. Because the response is obtained through modal superposition, the dynamic response remains essentially linear, even if nonlinear constitutive laws are assigned at material level.
  • Approach 2 (final). Nonlinear transient time-history analyses were performed by direct time integration. In this approach, nonlinear constitutive laws were activated and reinforcement was introduced explicitly using ANSYS reinforcement capabilities, so that the post-cracking load transfer to steel is represented in a physically consistent manner.

4.1. Linear-Elastic Reference Model in Robot

The original design model prepared in 2007 was developed in Robot Structural Analysis Profesional 2006. Beams and columns were represented by frame elements, while floor slabs were assumed to act as rigid diaphragms. The model was used for code-based checks according to P100-1/2006.
In the present study, the same geometry of the Robot model was recomputed using the elastic response spectrum of P100-1/2013 while keeping the original member cross-sections. The resulting fundamental periods and principal mode shapes served as reference values for the ANSYS models. Linear response-spectrum indicators, such as base-shear and interstorey drift demand, are used later only as a baseline for interpreting the nonlinear time-history results. To document the consistency of the 3D ANSYS idealisation at the linear-elastic level, Table 4 compares the main modal characteristics of the bare-frame model obtained in Robot and in ANSYS. The comparison is limited to global dynamic properties, since nonlinear time-history analyses were not performed in Robot and the objective of the present study was not an inter-software comparison of nonlinear seismic response.
The Robot model was used only as the original linear-elastic design/reference model of the bare RC frame. No nonlinear time-history analyses were carried out in Robot. Therefore, the comparison is limited to the main global modal characteristics of the bare structural system. The dominant Y translational mode corresponds to Mode 1, while the dominant X translational mode corresponds to Mode 3 in the compared models.

4.2. Nonlinear 3D Model in ANSYS

The three-dimensional ANSYS model reproduces the geometry of the building above the basement slab. Only the superstructure was modelled. The real building includes a basement level with reinforced concrete perimeter walls, which was not represented explicitly. Instead, the slab above the basement was adopted as the support plane. All nodes at this level were fully restrained, corresponding to a fixed-base condition provided by a stiff basement box. This idealisation neglects soil–structure interaction and potential basement wall flexibility.
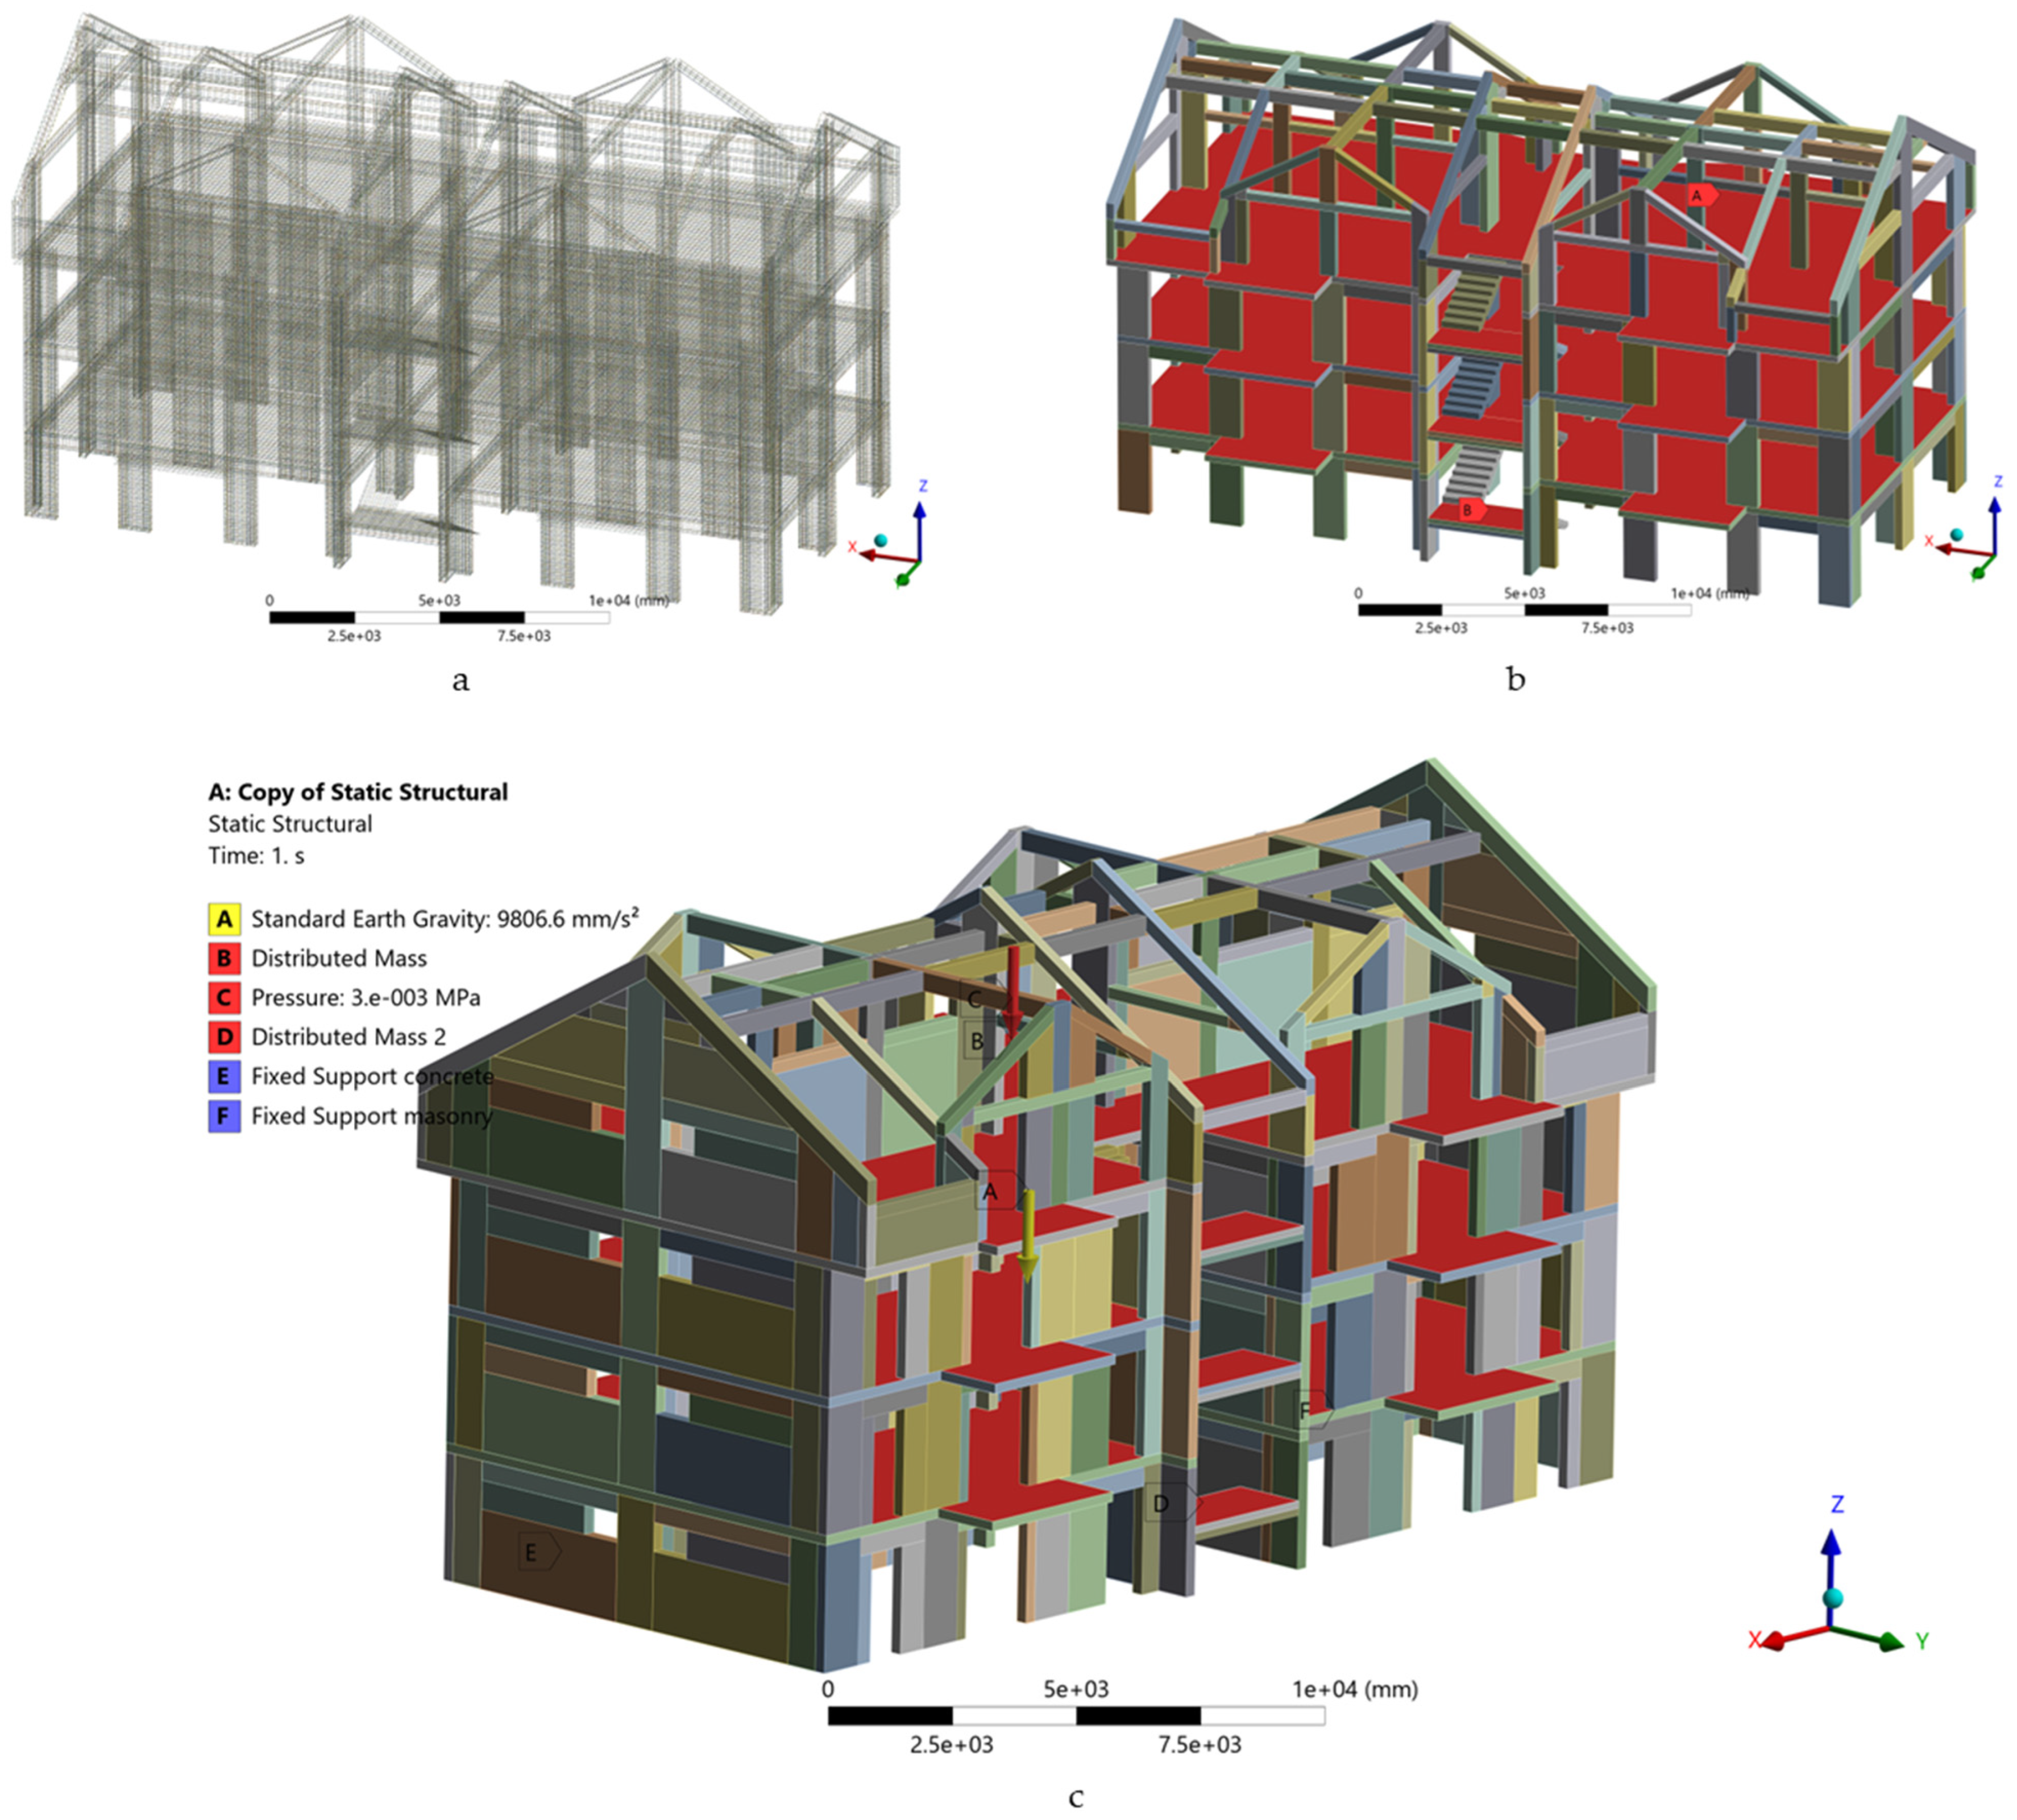
Figure 8 illustrates the numerical geometry used in the analyses. Figure 8a shows the discrete reinforcement layout for the RC members, represented through embedded bar reinforcement. Figure 8b shows the concrete solids for beams, columns, slabs, and stairs in the bare-frame configuration. Figure 8c presents the complete infilled-frame model, where masonry panels are included in the corresponding bays. In the final nonlinear analyses, the RC members were represented with explicit embedded reinforcement, including both longitudinal and transverse bars, as illustrated in Figure 8a. The reinforcement steels PC52 and OB37 were modelled with multilinear isotropic hardening laws, and their main material properties are reported in Table 5.
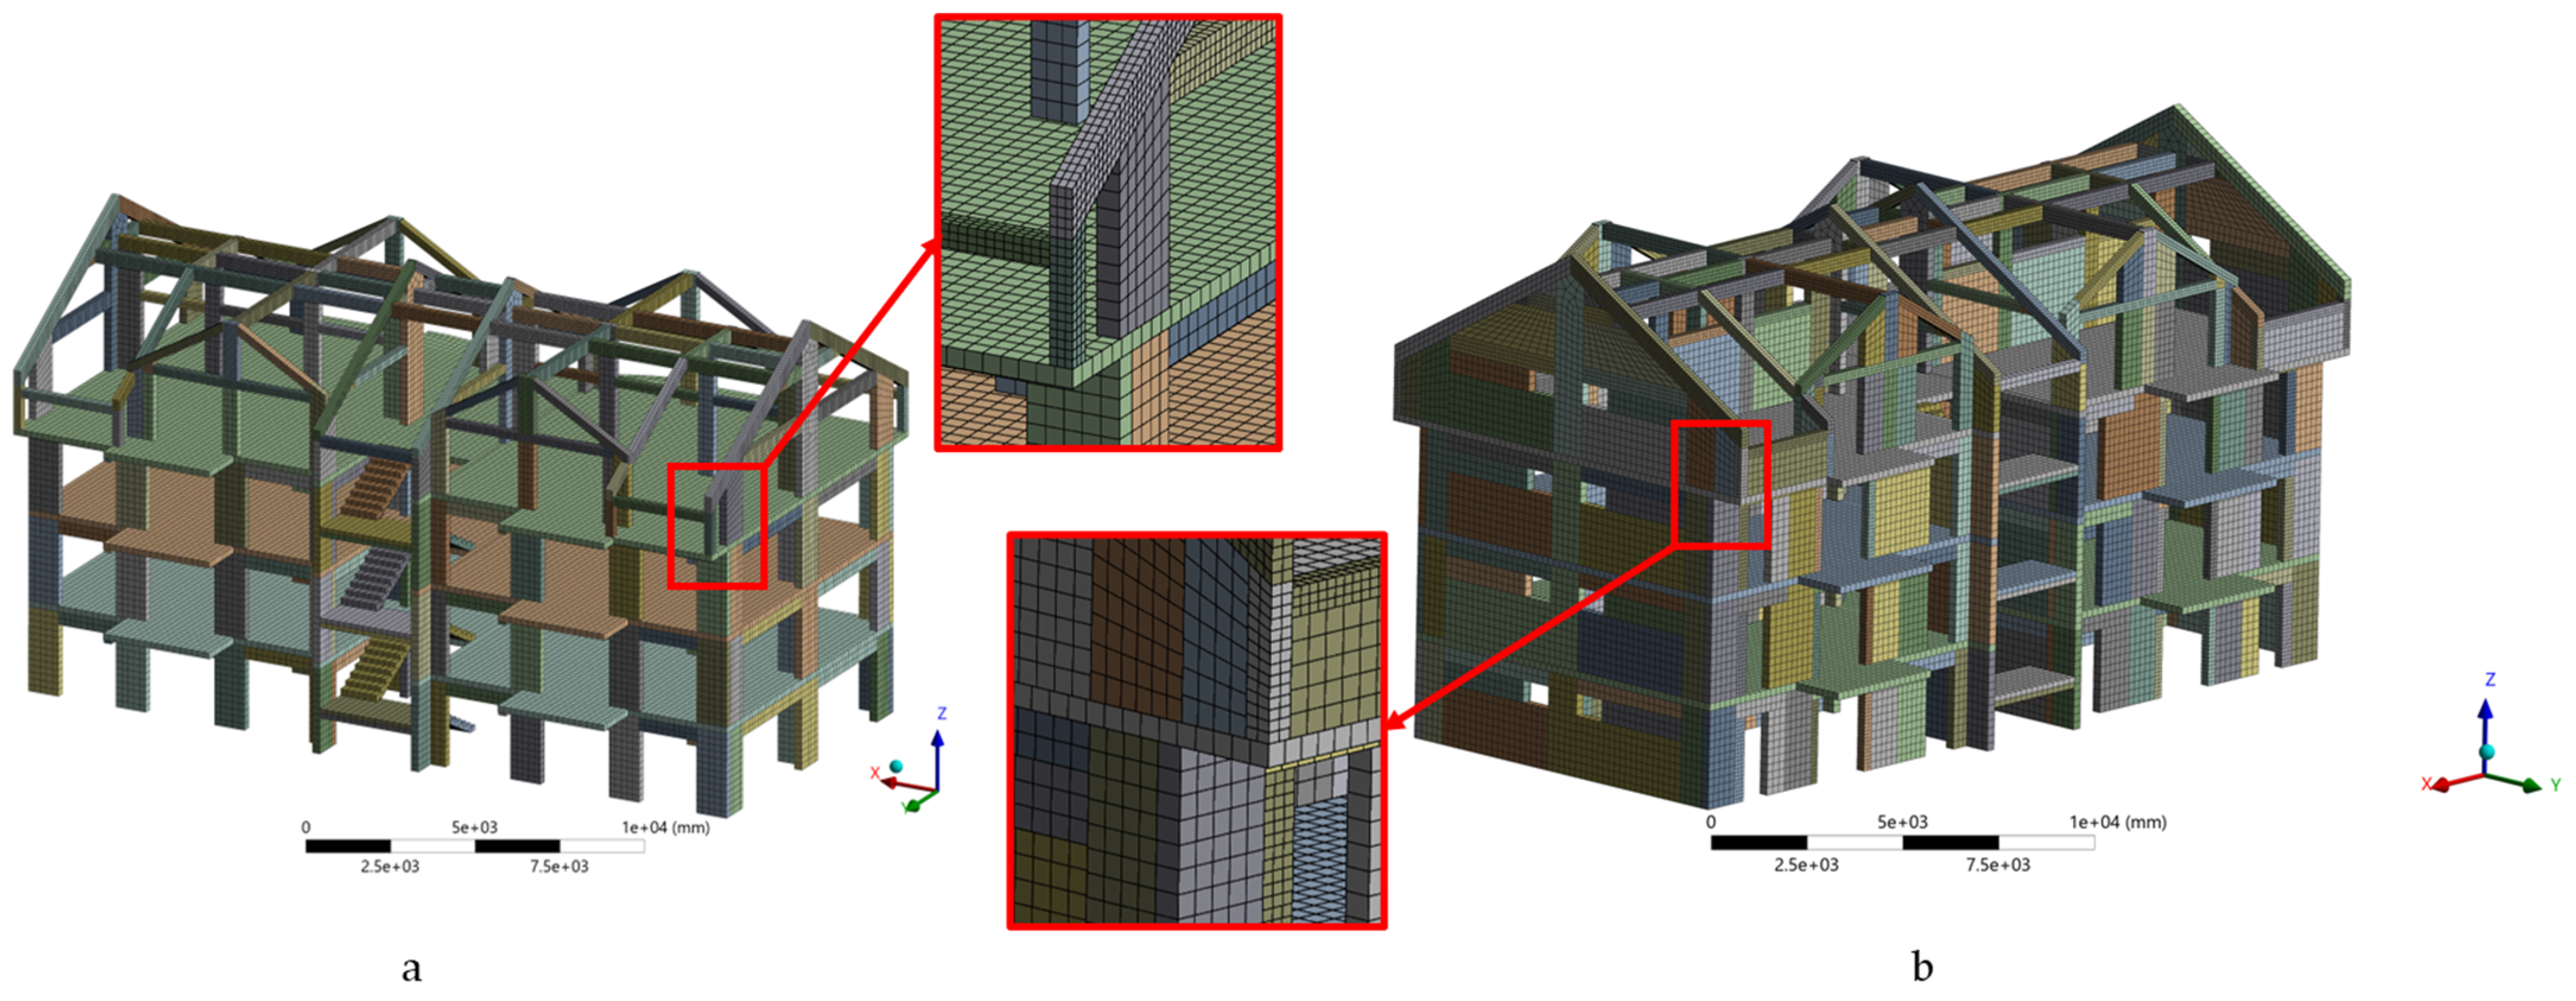
Concrete beams, columns, slabs, and stair flights were discretised (Figure 9) with three-dimensional solid finite elements (ANSYS SOLID186). A mesh-sensitivity check was carried out for the bare RC frame model in order to verify the adequacy of the adopted discretisation for the main global response quantities. The reference mesh used in the nonlinear analyses employed a nominal global element size of 200 × 200 mm, with local refinement to 100 × 100 mm in selected regions with smaller structural dimensions or higher expected stress gradients. Additional trial analyses with finer elements below 100 × 100 mm led to a major increase in computational effort, with about 300% more elements and nodes, nearly twelve times longer runtimes, and up to about three times larger disc-space demand, even for the bare-frame model. In contrast, the differences in the main global response indicators remained small, of the order of about 2%. Therefore, the adopted mesh was considered a reasonable compromise for full-building nonlinear time-history analyses.
Local mesh refinement was introduced only in selected beams, columns, and masonry wall regions whose characteristic dimensions were smaller than 200 mm, in order to improve the representation of local stress gradients while keeping the full-building nonlinear response-history analyses computationally tractable. In addition, the refined 100 × 100 mm mesh yielded first-mode frequencies of 4.4089, 5.4851, and 6.6406 Hz, compared with 4.4669, 5.5851, and 6.7955 Hz for the adopted mesh, corresponding to differences of only about 1.3–2.3%. This confirms that the main global dynamic characteristics are only weakly affected by further mesh refinement. For the bare RC frame model, the global mesh was generated with a nominal element size of 200 mm, resulting in 581,913 nodes and 261,341 solid elements. For the infilled configuration (RC + M), the discretisation was extended to the masonry panels; the executed model contains 295,765 solid elements and 1,017,386 nodes, reflecting the increased computational demand associated with the frame–infill interfaces. A coarser discretisation was retained in regions with smoother stress fields to maintain feasible runtimes for nonlinear time-history analyses. Self-weight was included through material density. Additional permanent loads from finishes and partitions were applied as surface loads on slab elements.
In the nonlinear ANSYS model, the masonry infills were represented as homogenised continuum solids with equivalent properties representative of hollow ceramic masonry (ρ = 1600 kg/m3, E = 2 GPa, ν = 0.15, f c u = 3 MPa, f t u = 0.3 MPa, f b c = 5 MPa). Mortar joints were not modelled as a separate material phase; their influence was included implicitly within the equivalent masonry properties. Both exterior enclosure walls and interior masonry partition walls (all 25 cm thick hollow ceramic blocks) were discretised as three-dimensional solid finite elements in the RC + M model and therefore contributed their own stiffness, mass, and inertial effects directly. In the bare RC model, these walls were not represented geometrically; instead, their gravity contribution was included through the equivalent slab-level permanent action of 500 kg/m2. The plasterboard partition walls and the timber roof structure were not discretised explicitly in either model. Their contribution was accounted for through the permanent-load definition, with the plasterboard-related load included in the adopted slab-level permanent action (300 kg/m2 for RC + M, 500 kg/m2 for RC).
Material models and key parameters adopted in ANSYS for concrete, masonry infills, and reinforcement are summarised in Table 5. Concrete nonlinear behaviour was represented using a Drucker–Prager plasticity model with a tension cut-off based on the uniaxial tensile strength. Thus, the adopted concrete formulation was not a Concrete Damage Plasticity, smeared-cracking, or Willam–Warnke model. The concrete parameters were assigned from the specified material class of the existing building, namely C16/20 (Bc20), using engineering values suitable for full-building nonlinear solid modelling. No dedicated inverse calibration against material-level cyclic tests was performed for the concrete constitutive law. This modelling choice was adopted to obtain stable nonlinear response under cyclic loading with a limited parameter set, consistent with the scale and objective of the present building-level analyses.
Two reinforcement representations were used, in line with the two analysis levels. In the verification step, reinforcement was not introduced explicitly and the model was used primarily to check global dynamic characteristics. In the final nonlinear analyses, longitudinal and transverse reinforcement was introduced explicitly using the embedded reinforcement capability in ANSYS. In this formulation, the reinforcement bars are embedded within the host concrete solid elements through a kinematic constraint, so that their deformation follows the displacement field of the surrounding concrete. This corresponds to an idealised perfect-bond assumption between steel and concrete. Therefore, no explicit bond–slip interface law was introduced, and local slip transfer was not modelled separately. Reinforcing steels (PC52 and OB37) were modelled using a multilinear isotropic hardening law, and steel demand was assessed through the von Mises equivalent stress. This explicit reinforcement representation was adopted to capture the contribution of steel after concrete cracking and crushing initiate, to track reinforcement stress demand directly, and to avoid an excessively brittle numerical response at the structural level.

4.3. Nonlinear Infilled-Frame Model

The infill-to-frame interaction was modelled using bonded surface-to-surface contact. This assumption was adopted to reflect the execution sequence of the case-study building, in which the masonry panels were erected first and the reinforced-concrete columns and beams were subsequently cast in the dedicated gaps defined by the masonry layout. Compared with conventional infill walls constructed after completion of the RC frame, this sequence is expected to produce a stronger interface engagement and more efficient force transfer between frame and masonry. In the numerical model, this behaviour was idealised as fully bonded contact, with no separation or sliding allowed at the interface and with both compression and shear transferred across the contact surfaces. This choice should therefore be interpreted as a strongly engaged infill scenario for the analysed building, not as a general interface model for all RC frame–masonry systems. Accordingly, the RC + M results represent an upper-bound estimate of infill stiffness to the global response and a lower-bound estimate of drift demand under the adopted interface idealisation. Masonry infill panels were modelled as continuum solids governed by the same Drucker–Prager framework, using reduced stiffness and strength parameters representative of hollow ceramic masonry. The uniaxial compressive strength, tensile strength, and biaxial compressive strength were taken as f c = 3 M P a , f t = 0.3 M P a , and f b c = 5 M P a , respectively, with linear-elastic properties E = 2 G P a and ν = 0.15 . The nonlinear direct-integration analyses performed for the bare-frame model were then repeated for the infilled configuration under the same set of scaled ground motions, in order to isolate the influence of the masonry panels on both global response and local demand in RC members and reinforcement.

4.4. Damping, Numerical Integration and Loading Protocol

Rayleigh damping was adopted for all transient analyses. The Rayleigh coefficients were calibrated from the eigenvalue analyses of each structural configuration, because the modal properties differ between the bare RC frame and the infilled frame. For the infilled model, the first six eigenfrequencies range from 5.868 to 16.169 Hz, while for the bare RC-frame model (with discrete reinforcement) they range from 4.467 to 14.25 Hz. In both cases, the low-order modes capture a substantial fraction of the effective translational mass (cumulative fractions ≈0.81–0.84 in X and Y).
Rayleigh damping was adopted using mass and stiffness-proportional terms. The modal damping ratio is given by
ζ ( ω ) = α 2 ω + β ω 2
where α is the mass-proportional coefficient s 1 , β is the stiffness-proportional coefficient s , and ω = 2 π f is the circular frequency. In the executed ANSYS model, the coefficients were introduced as α = 2.705 and β = 7.22 × 10 4 for the RC + M model and α = 1.595 and β = 1.504 × 10 3 for the RC model, calibrated to provide approximately 5% damping in the low-mode range governing the global response. The coefficients α and β were obtained by imposing ζ ( ω 1 ) = ζ ( ω 2 ) = 0.05 for two selected modal frequencies.
Nonlinear time-history analyses were performed using implicit direct time integration. For the bare RC frame model, a constant time step Δ t = 0.05 s was adopted over an analysis step end time of 15/18/20 s. For the infilled configuration (RC + M), automatic time stepping was enabled, with an initial time step Δ t 0 = 0.005 s , a minimum time step of 0.001 s, and a maximum time step of 0.05 s, to improve robustness when stiffness changes occur due to the frame–infill interaction. A direct solver was used. Geometric nonlinearity was activated in the nonlinear transient analyses (large deflection: On). Nonlinear equilibrium iterations were performed using a Full Newton–Raphson scheme with line search enabled, while stabilisation was kept off. Force convergence was activated with a tolerance of 5% and a minimum reference force of 1 N, whereas the remaining convergence checks (moment, displacement, rotation, and energy) were left program-controlled.
Permanent actions were applied prior to the seismic excitation. Self-weight was introduced through standard earth gravity g 9806.6 m m / s 2 using the material densities defined for concrete, reinforcement, and masonry. Non-structural permanent actions (finishes and partitions) were introduced at slab level in two consistent forms: as additional distributed mass and as uniformly distributed permanent pressure loads. Table 6 presents the permanent-action budget adopted for the two structural configurations and the corresponding modelling strategy. In both models, the self-weight of concrete and reinforcement was introduced explicitly through density and gravity. In the bare RC model, the equivalent slab-level permanent action of 500 kg/m2 includes floor finishes, screed, plaster, and the contribution of masonry walls not represented explicitly. In the RC + M model, the slab-level value of 300 kg/m2 includes only floor finishes, screed, and plaster, because the masonry panels were modelled explicitly as solid elements and therefore contributed their own weight and inertial mass directly. Accordingly, the different slab-level values reflect two different representations of masonry mass, not a major difference in total structural weight.
The seismic input was imposed as base acceleration at the restrained support plane (the slab above the basement), with the two horizontal components applied simultaneously along the global X and Y axes. Thus, the final analyses were performed as bidirectional nonlinear time-history analyses, rather than by SRSS combination of separate unidirectional responses. For each structural configuration (bare and infilled), three ground-motion cases were analysed (Vrancea 1977, Vrancea 1990, and Türkiye 2023), and each record was scaled to the target intensity level a g = 0.40 g as described in Section 3.

4.5. Response Quantities and Post-Processing

The response assessment was performed consistently for both structural configurations (bare RC frame and RC frame with masonry infill) and for all three input motions (Vrancea 1977, Vrancea 1990, and Türkiye 2023), scaled to a g = 0.40   g . The global coordinate system follows the numerical model convention. The X axis is the longitudinal building direction and the Y axis is the transversal direction. The two horizontal acceleration components were applied simultaneously along X and Y.
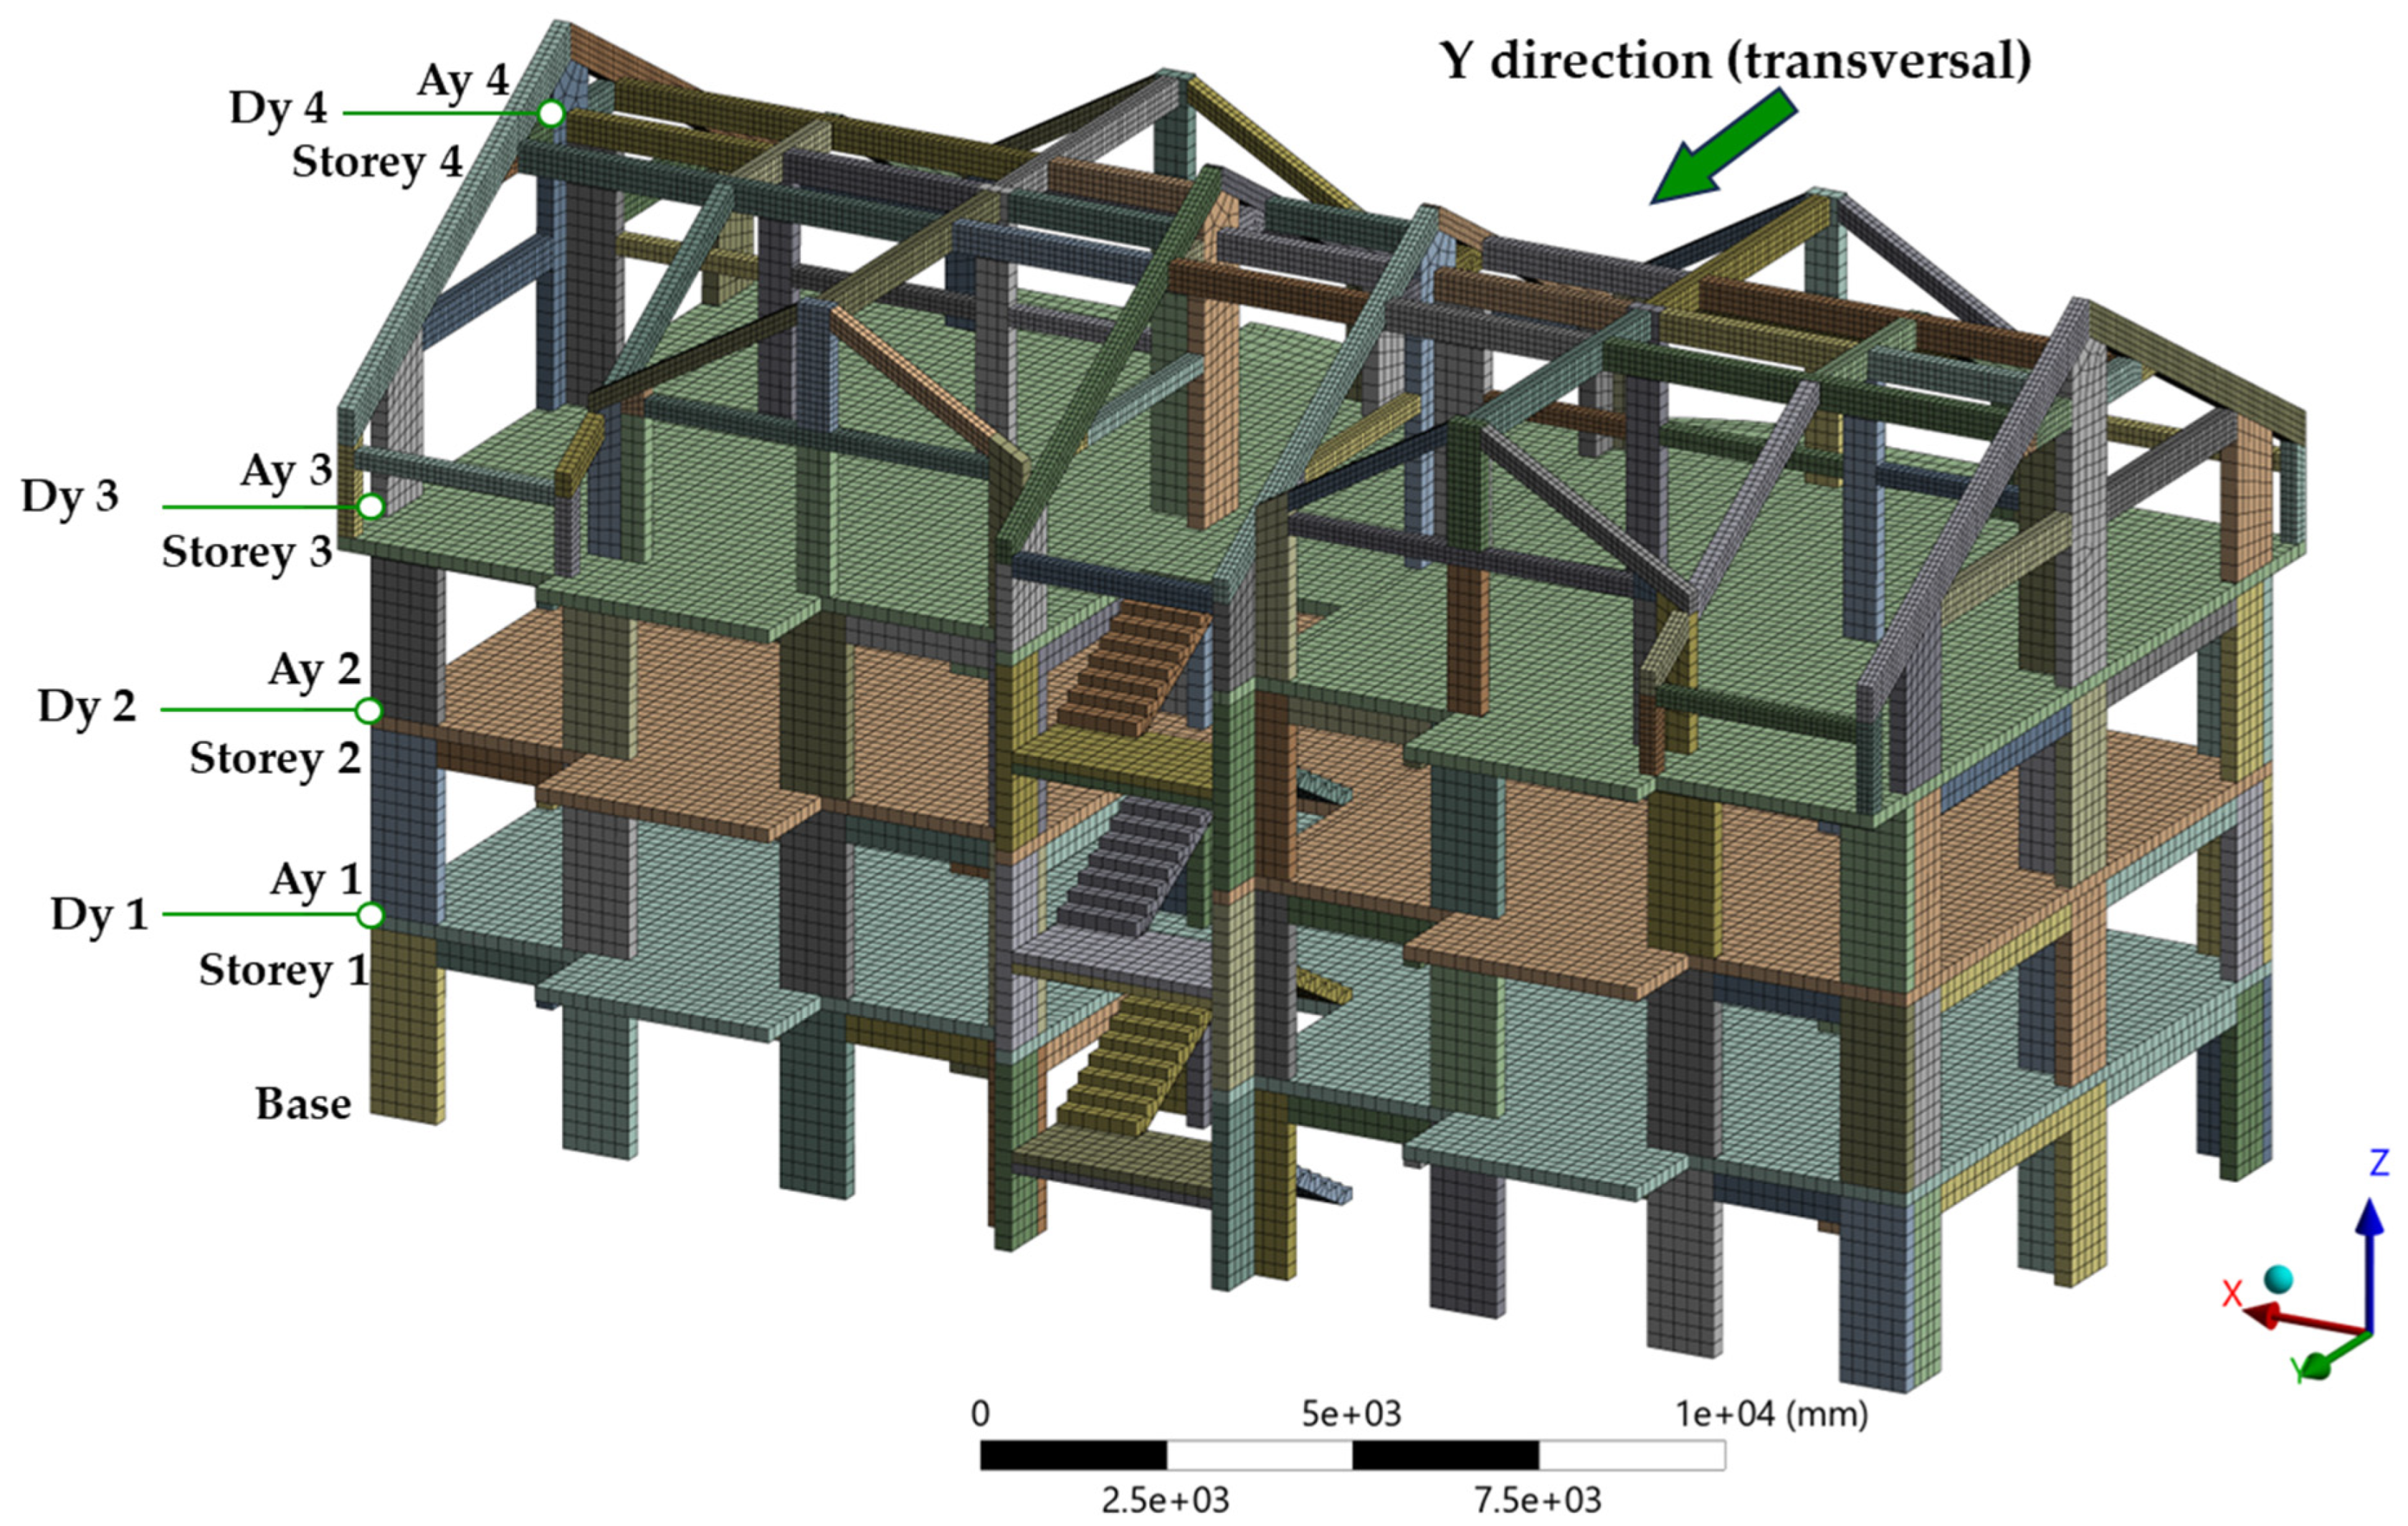
The primary kinematic outputs were storey displacements and interstorey drifts along the transversal direction, because the lateral response discussed in this section refers to Y. Absolute nodal displacements u i ( t ) were extracted at representative points for the basement and each storey. The reporting levels are denoted as B ,   S 1 ,   S 2 ,   S 3 , and roof R (level 4). Interstorey drift histories were computed from displacement differences between consecutive levels as follows:
Δ i t = u i t u i 1 t
The corresponding drift ratios were obtained as follows:
θ i ( t ) = Δ i ( t ) H i
where H i = 2.85   m for all storeys except the top level. For the fourth level, the storey height was 4.00 m.
Global force–deformation behaviour was quantified through base shear–roof displacement hysteresis loops. The base shear in the transversal direction, V b ( t ) , was taken from the reaction force at the fixed support plane, consistent with the global axes shown in the model. The roof displacement u R ( t ) was the total displacement at level 4 along Y. The hysteresis curves V b u R were plotted for each analysis case to compare stiffness, strength, and energy dissipation between the bare and infilled frames.
Peak demand measures were reported using absolute maxima over the full record. For each response history x ( t ) , the peak was defined as m a x x ( t ) . The reported peaks were
u m a x = m a x u ( t ) , Δ m a x = m a x Δ ( t ) , V b , m a x = m a x V b ( t ) , M b , m a x = m a x M b ( t )
where M b ( t ) is the base moment component taken from the support reactions, in the global system, in agreement with the transversal action effects. Alongside these peak values, the raw time histories were retained for traceability and for identifying the time instants associated with peak responses.
To characterise the nonlinear response mechanisms, field outputs were extracted at the time instants associated with critical peaks and were reported as contour plots. The adopted fields included maximum and minimum principal stresses in the continuum materials, equivalent plastic strain as an indicator of inelastic demand, and reinforcement stress measures for the steel bars. Reinforcement demand was reported through peak stresses in the steel domains, to highlight the most stressed zones under each ground motion and to enable direct comparisons between the bare and infilled configurations. These plots were complemented by the displacement fields along X and Y to confirm the deformation patterns and the directional consistency of the response.
All outputs were extracted in a consistent manner across cases, using the same level definitions, sign conventions, and peak metrics. This ensured that differences between RC and RC + M models reflect physical effects of stiffness, mass, and interaction mechanisms, rather than changes in post-processing rules.
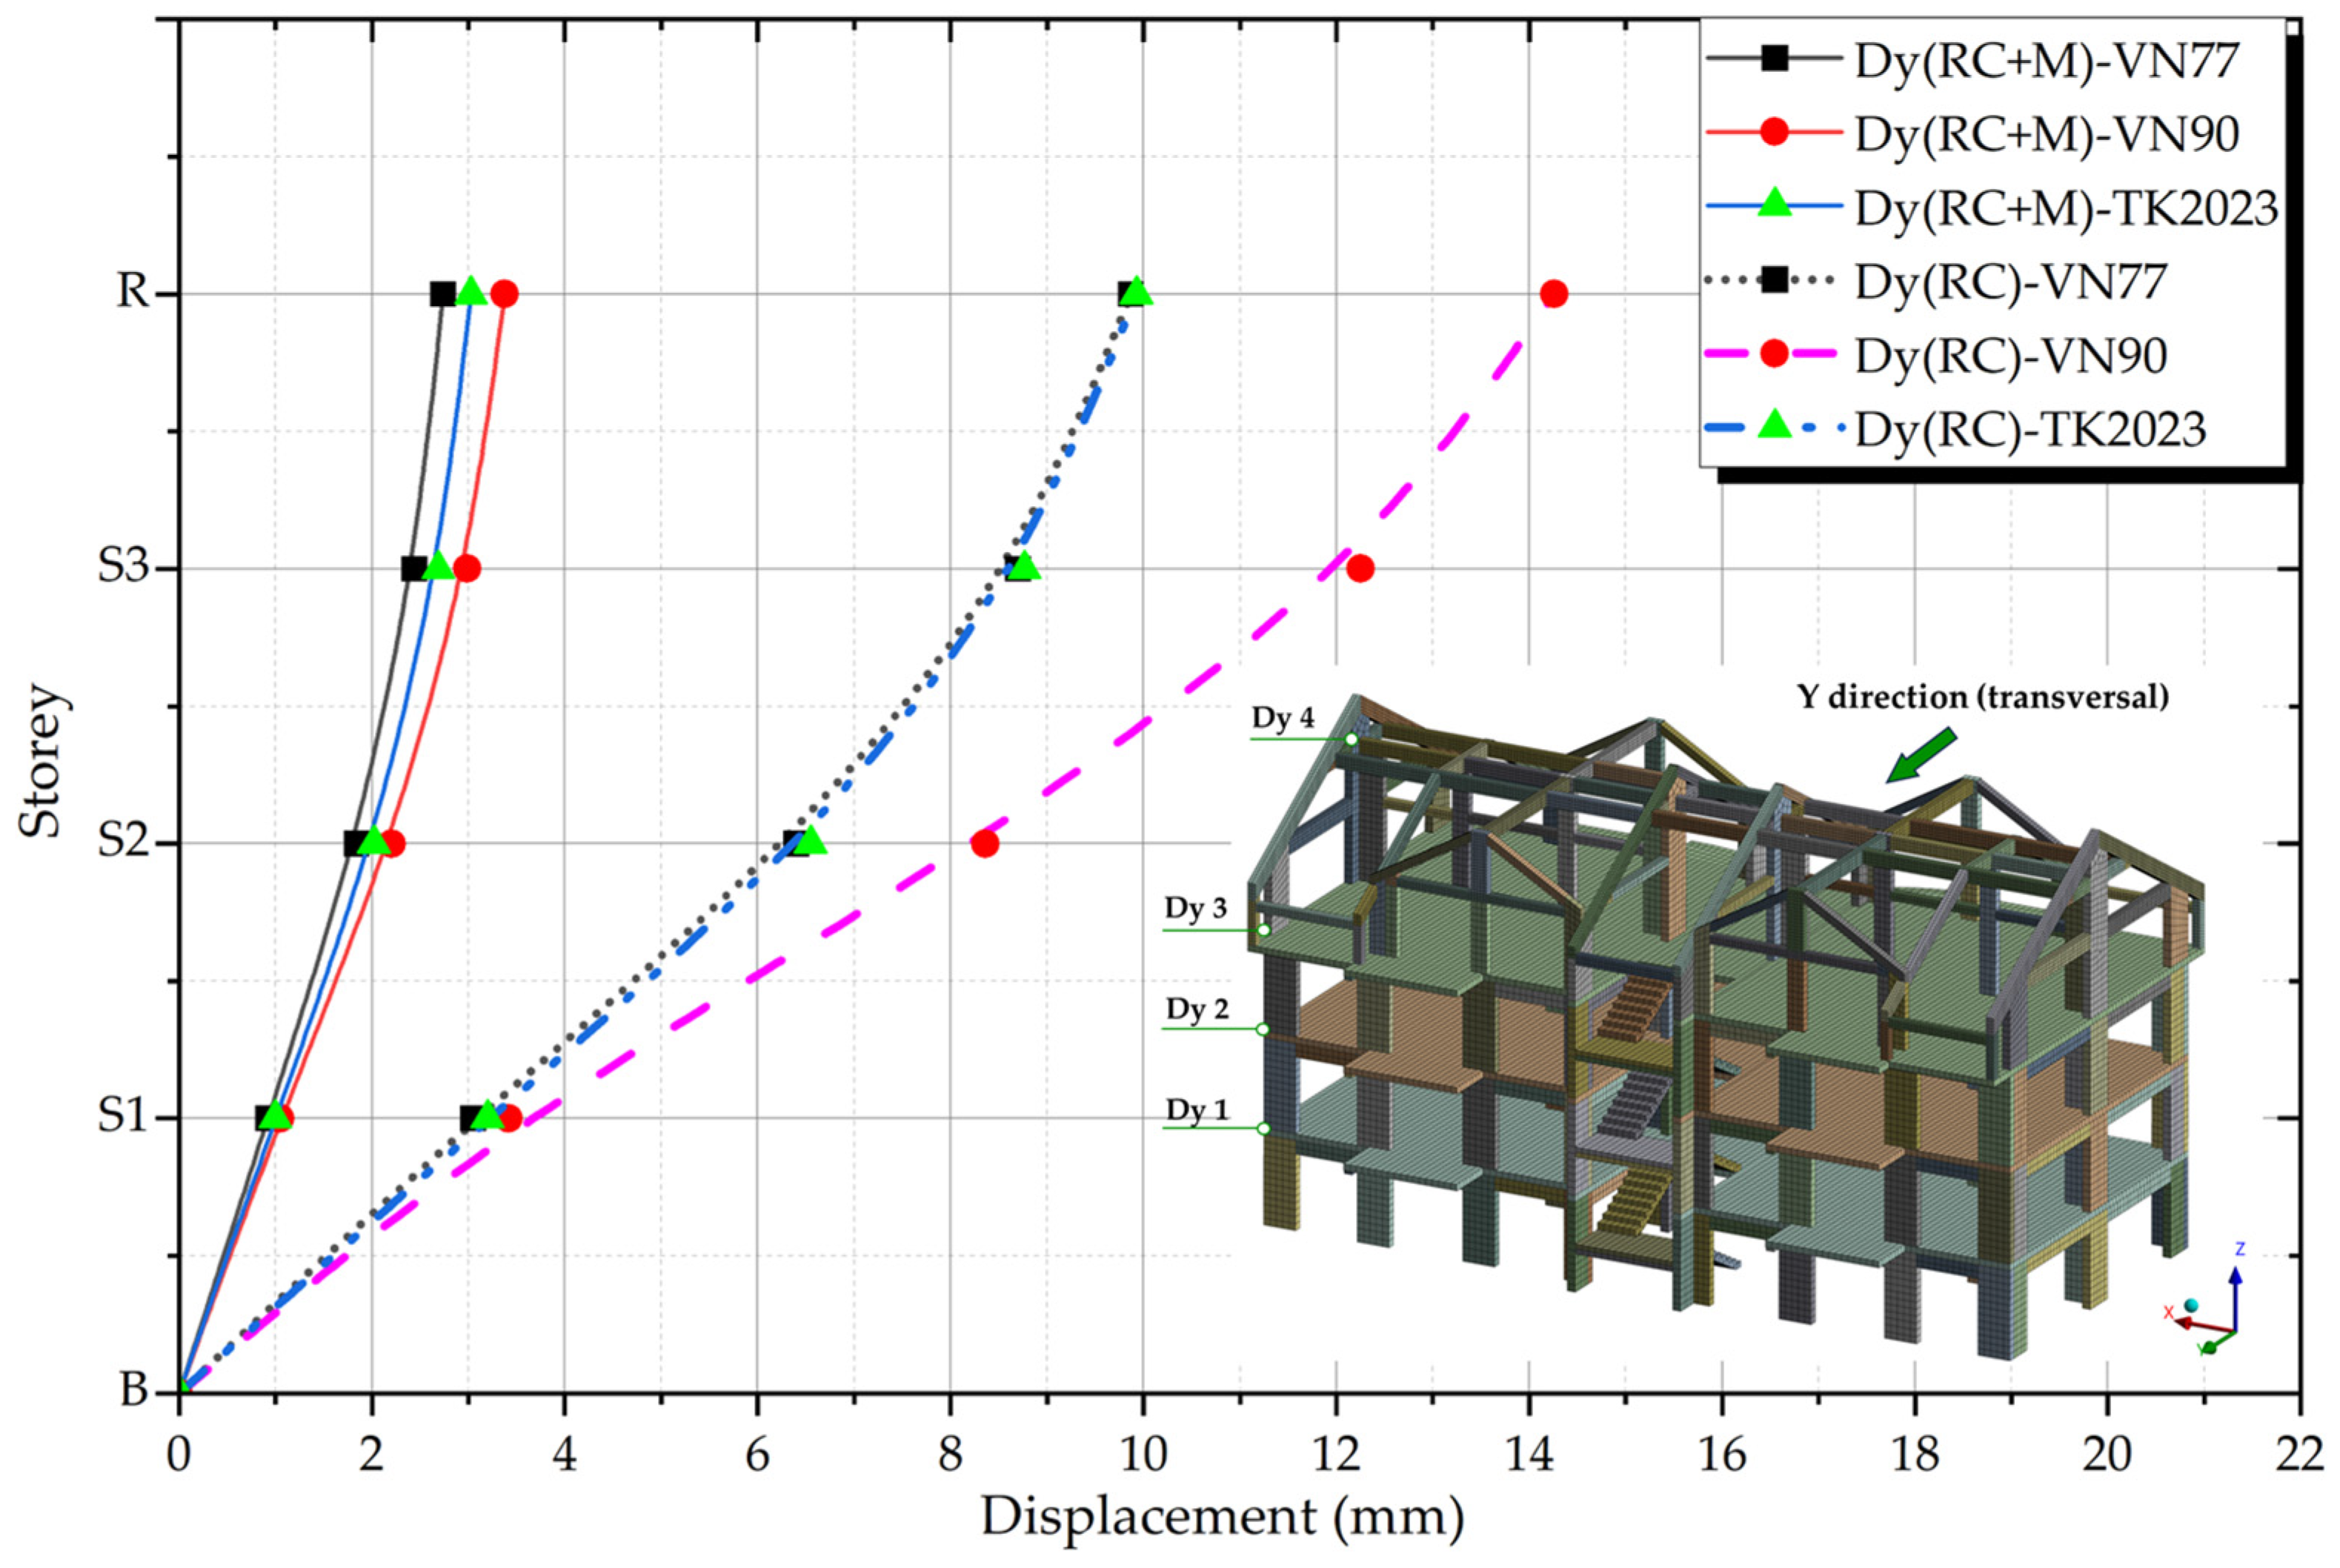
As illustrated in Figure 10, response quantities were extracted at predefined points along the building height in the global coordinate system (X longitudinal, Y transversal). The results reported in Section 5 refer to the transversal response (Y) at these locations.

5. Results and Discussion

All response quantities were extracted consistently with the global axes used in the FE model, with X = longitudinal and Y = transversal. The two horizontal components were applied simultaneously. The results below focus on the transversal (Y) response because it governs the reported base shear–roof displacement hysteresis and the interstorey drift checks.

5.1. Modal Analysis Results

A linear eigenvalue (modal) analysis was first performed for both structural configurations to characterise the dynamic properties that govern the subsequent nonlinear time-history response. The same global coordinate system was used as in the transient analyses, with X taken as the longitudinal direction and Y as the transversal direction. Modal properties are reported in terms of natural frequency, period, and translational mass participation in X and Y.
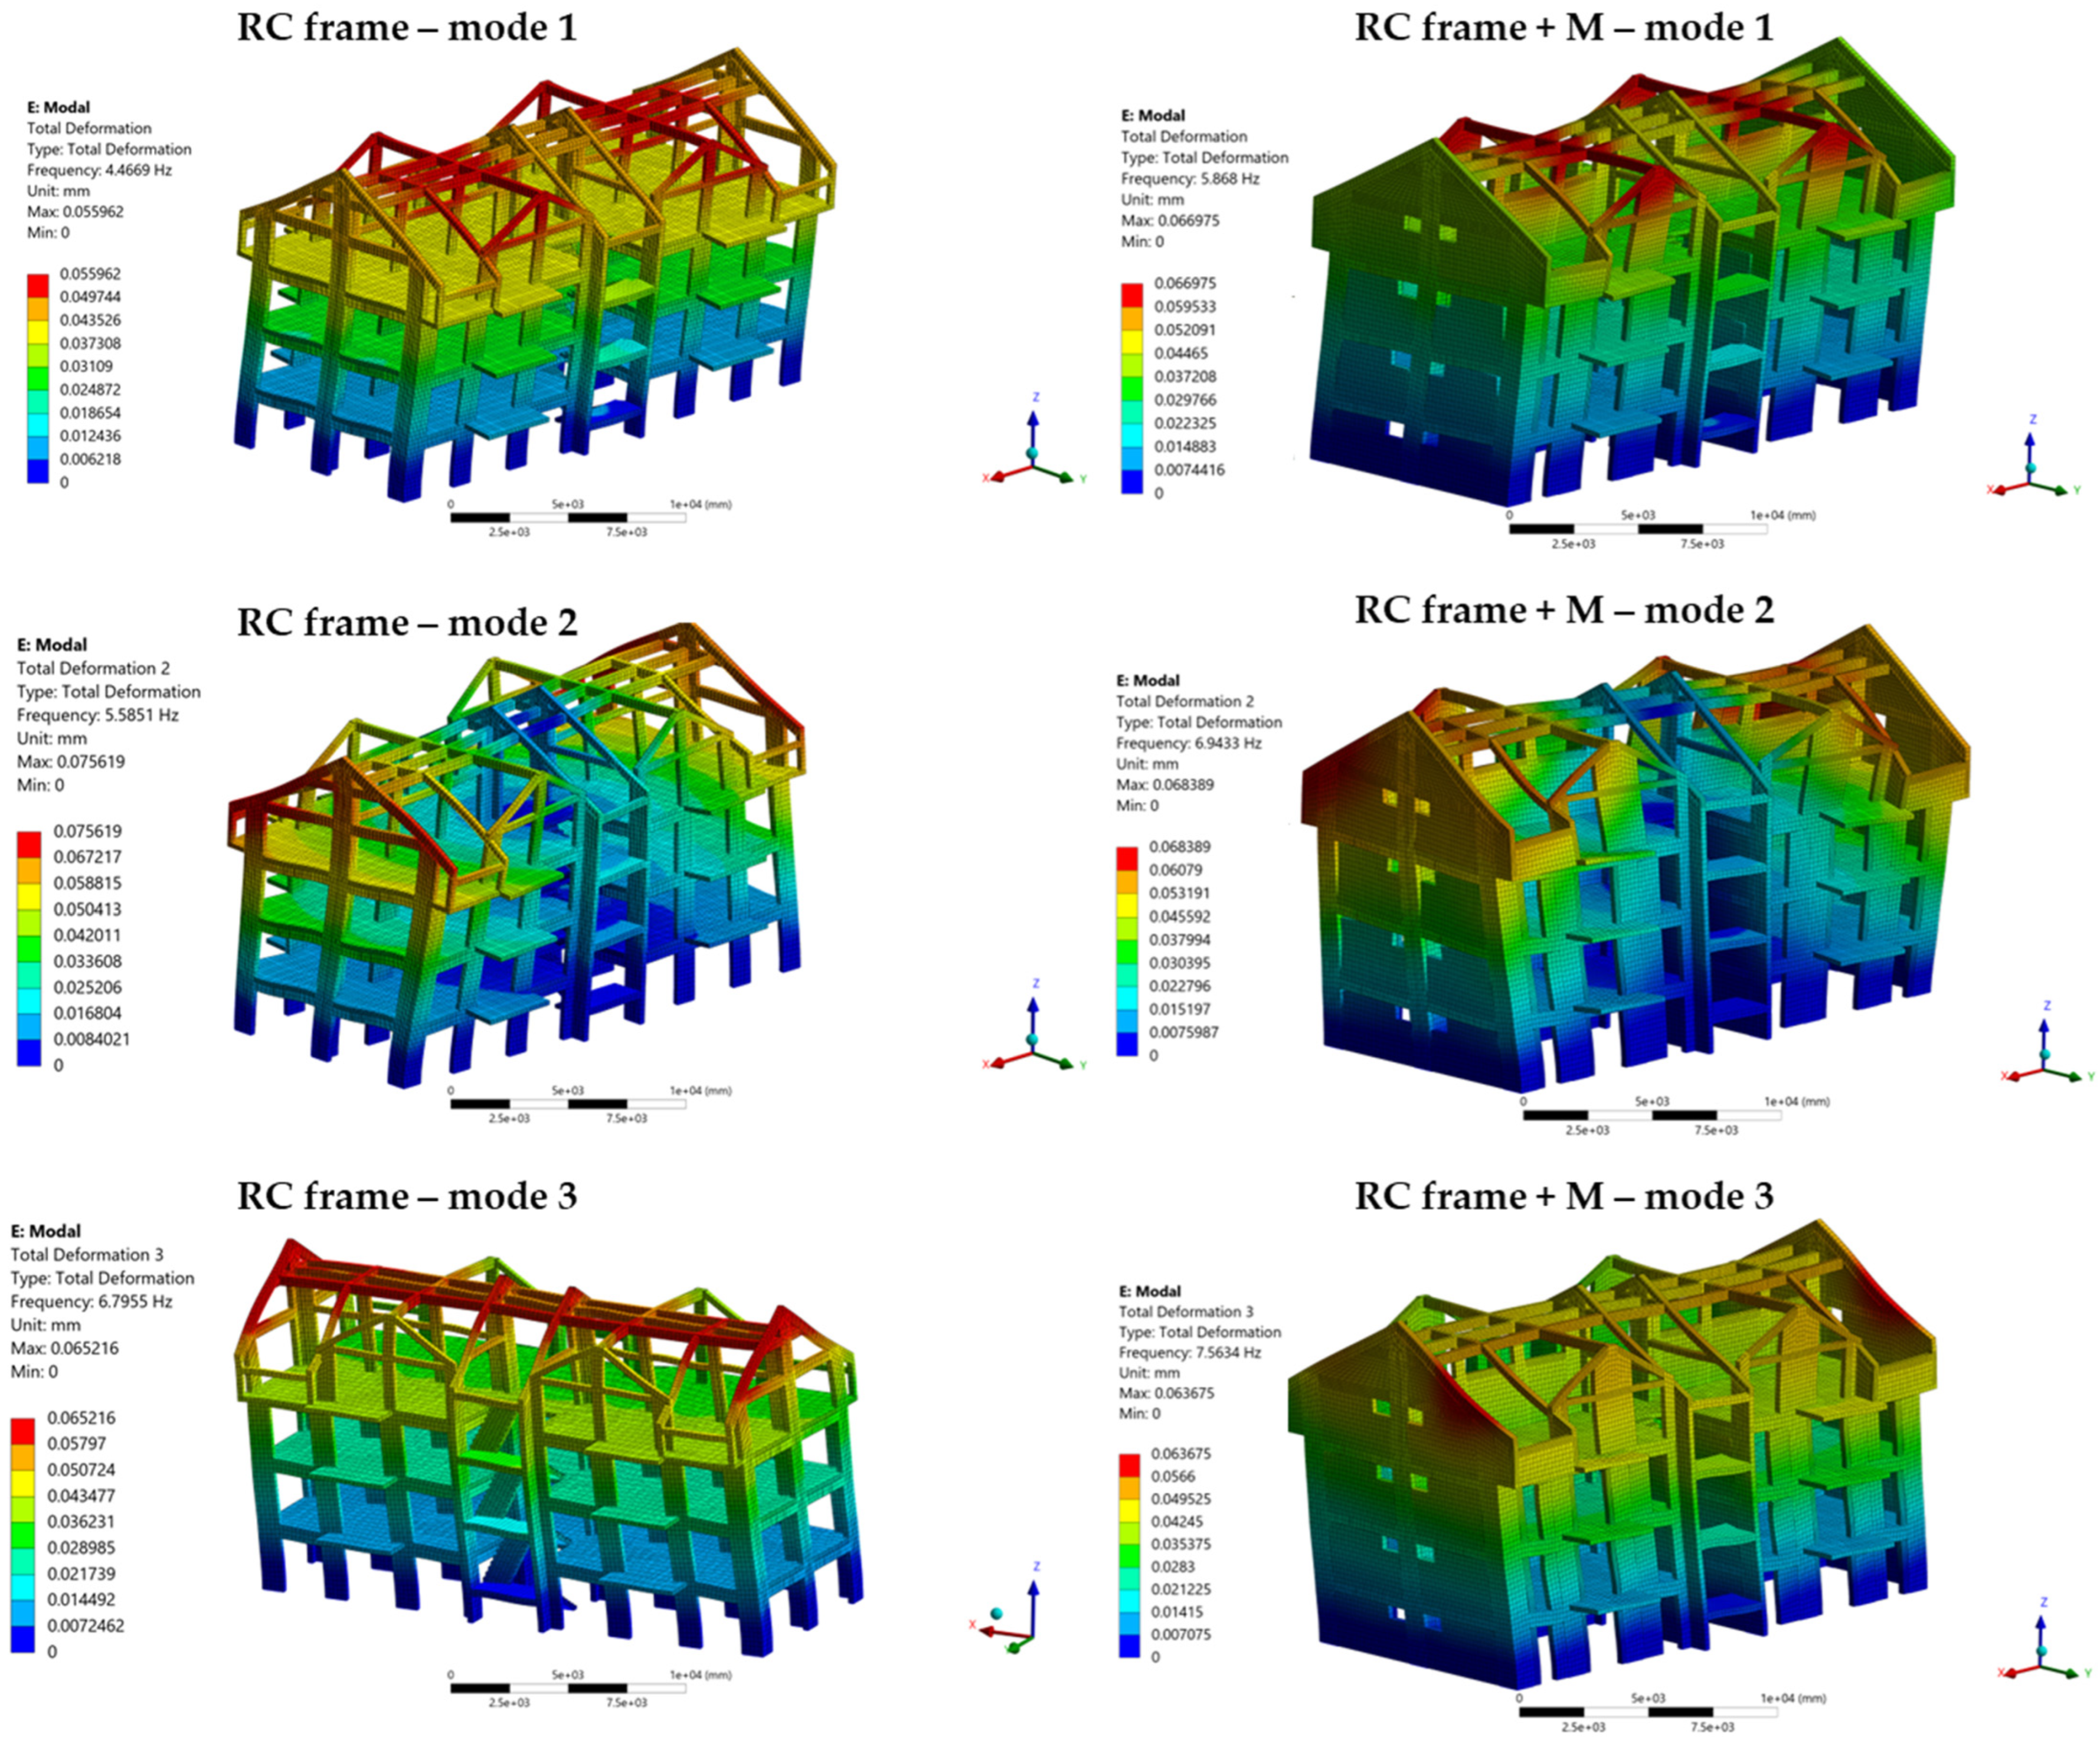
Table 7 summarises the first three modes for the bare RC frame and the infilled configuration (RC + M). The periods were computed as T = 1 / f . For the bare RC frame, the first three natural frequencies were 4.4669 Hz, 5.5851 Hz, and 6.7955 Hz, corresponding to periods of 0.2239 s, 0.1790 s, and 0.1472 s. For RC + M, the corresponding frequencies increased to 5.8680 Hz, 6.9433 Hz, and 7.5634 Hz, with periods of 0.1704 s, 0.1440 s, and 0.1322 s. This systematic increase indicates a higher global stiffness when masonry infill panels are included, as expected from the added in-plane stiffness and the interaction between infills and the RC frame.
The effective modal mass confirms that the response is dominated by global translations in the low modes. Mode 1 is primarily a transversal (Y) translation for both models, with effective mass of about 939.35 t (RC) and 945.16 t (RC + M), and corresponding Y mass ratios of 0.784 and 0.776. Mode 3 is primarily a longitudinal (X) translation, with effective mass of about 914.91 t (RC) and 918.73 t (RC + M), and X mass ratios of 0.764 and 0.754. Mode 2 is torsional, which is reflected by its comparatively small translational mass ratios in both directions. Therefore, the dominant lateral translational behaviour is captured by modes 1 and 3, while mode 2 mainly describes twisting of the structural system.
Figure 11 shows the first three mode shapes (total deformation) for both models. The deformed shapes are in line with the mass-participation results, with a predominantly translational fundamental mode, a torsional second mode, and a higher translational mode in the orthogonal direction. These modal characteristics provide the baseline for interpreting the differences observed later in roof displacement, interstorey drift, and base reaction demands under the bidirectional seismic input.

5.2. Peak Roof Displacements and Relative Interstorey Displacements

The peak lateral response was evaluated along the transversal direction (Y) using floor displacements relative to the base, u i ( t ) , extracted at the reporting levels B , S 1 , S 2 , S 3 , and roof R . Interstorey drift increments Δ i ( t ) and drift ratios θ i ( t ) were computed as defined in Section 4.5. The discussion below focuses on the governing storeys B S 1 and S 1 S 2 , for which the storey height is H = 2.85 m = 2850 m m .
Table 8 summarises the peak roof displacement u r , the maximum drift increment Δ m a x , the governing storey where Δ m a x occurs, and the resulting peak drift ratio θ m a x . The infilled configuration (RC + M) exhibits a marked reduction in both u r and Δ m a x for all three input motions. The largest demand occurs for VN90, where the bare RC frame reaches u r = 14.26 m m and θ m a x = 0.1733 % , while RC + M remains limited to u r = 3.38 m m and θ m a x = 0.0407 % . Using the admissible drift limits typically adopted from P100-1/2013 (SLS θ a d m = 0.5 % and ULS θ a d m = 2.5 % , reported here as conservative reference values), all computed drifts remain well below both thresholds.
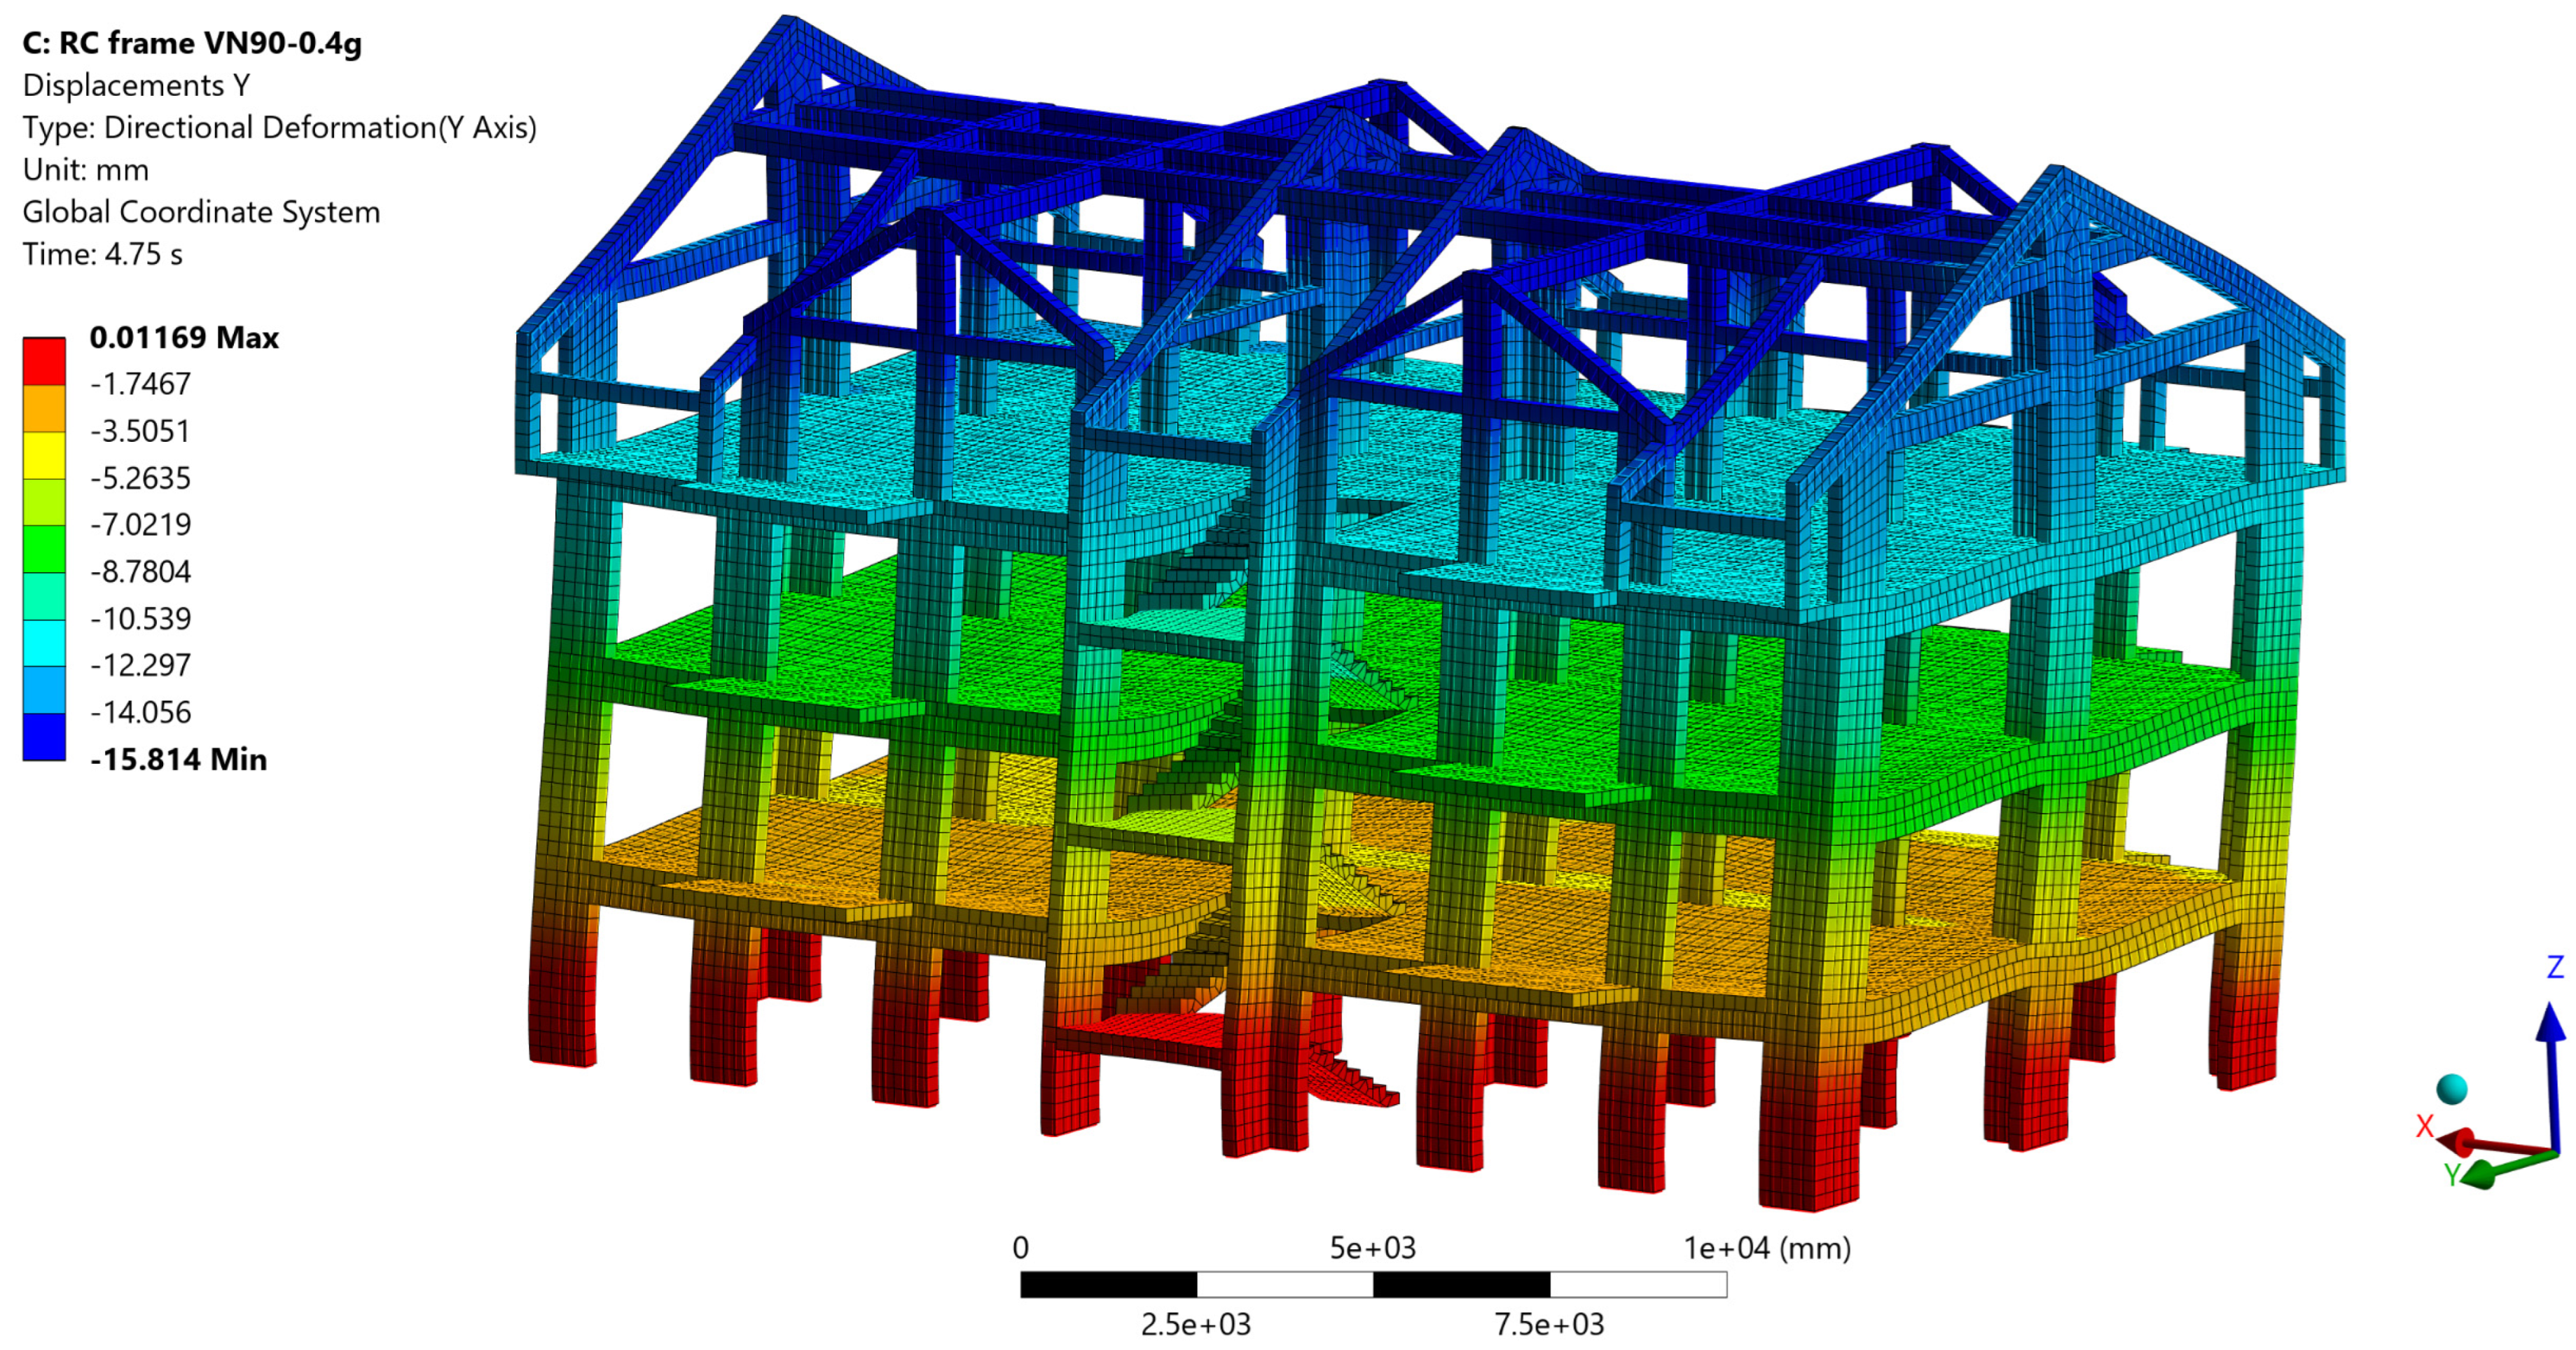
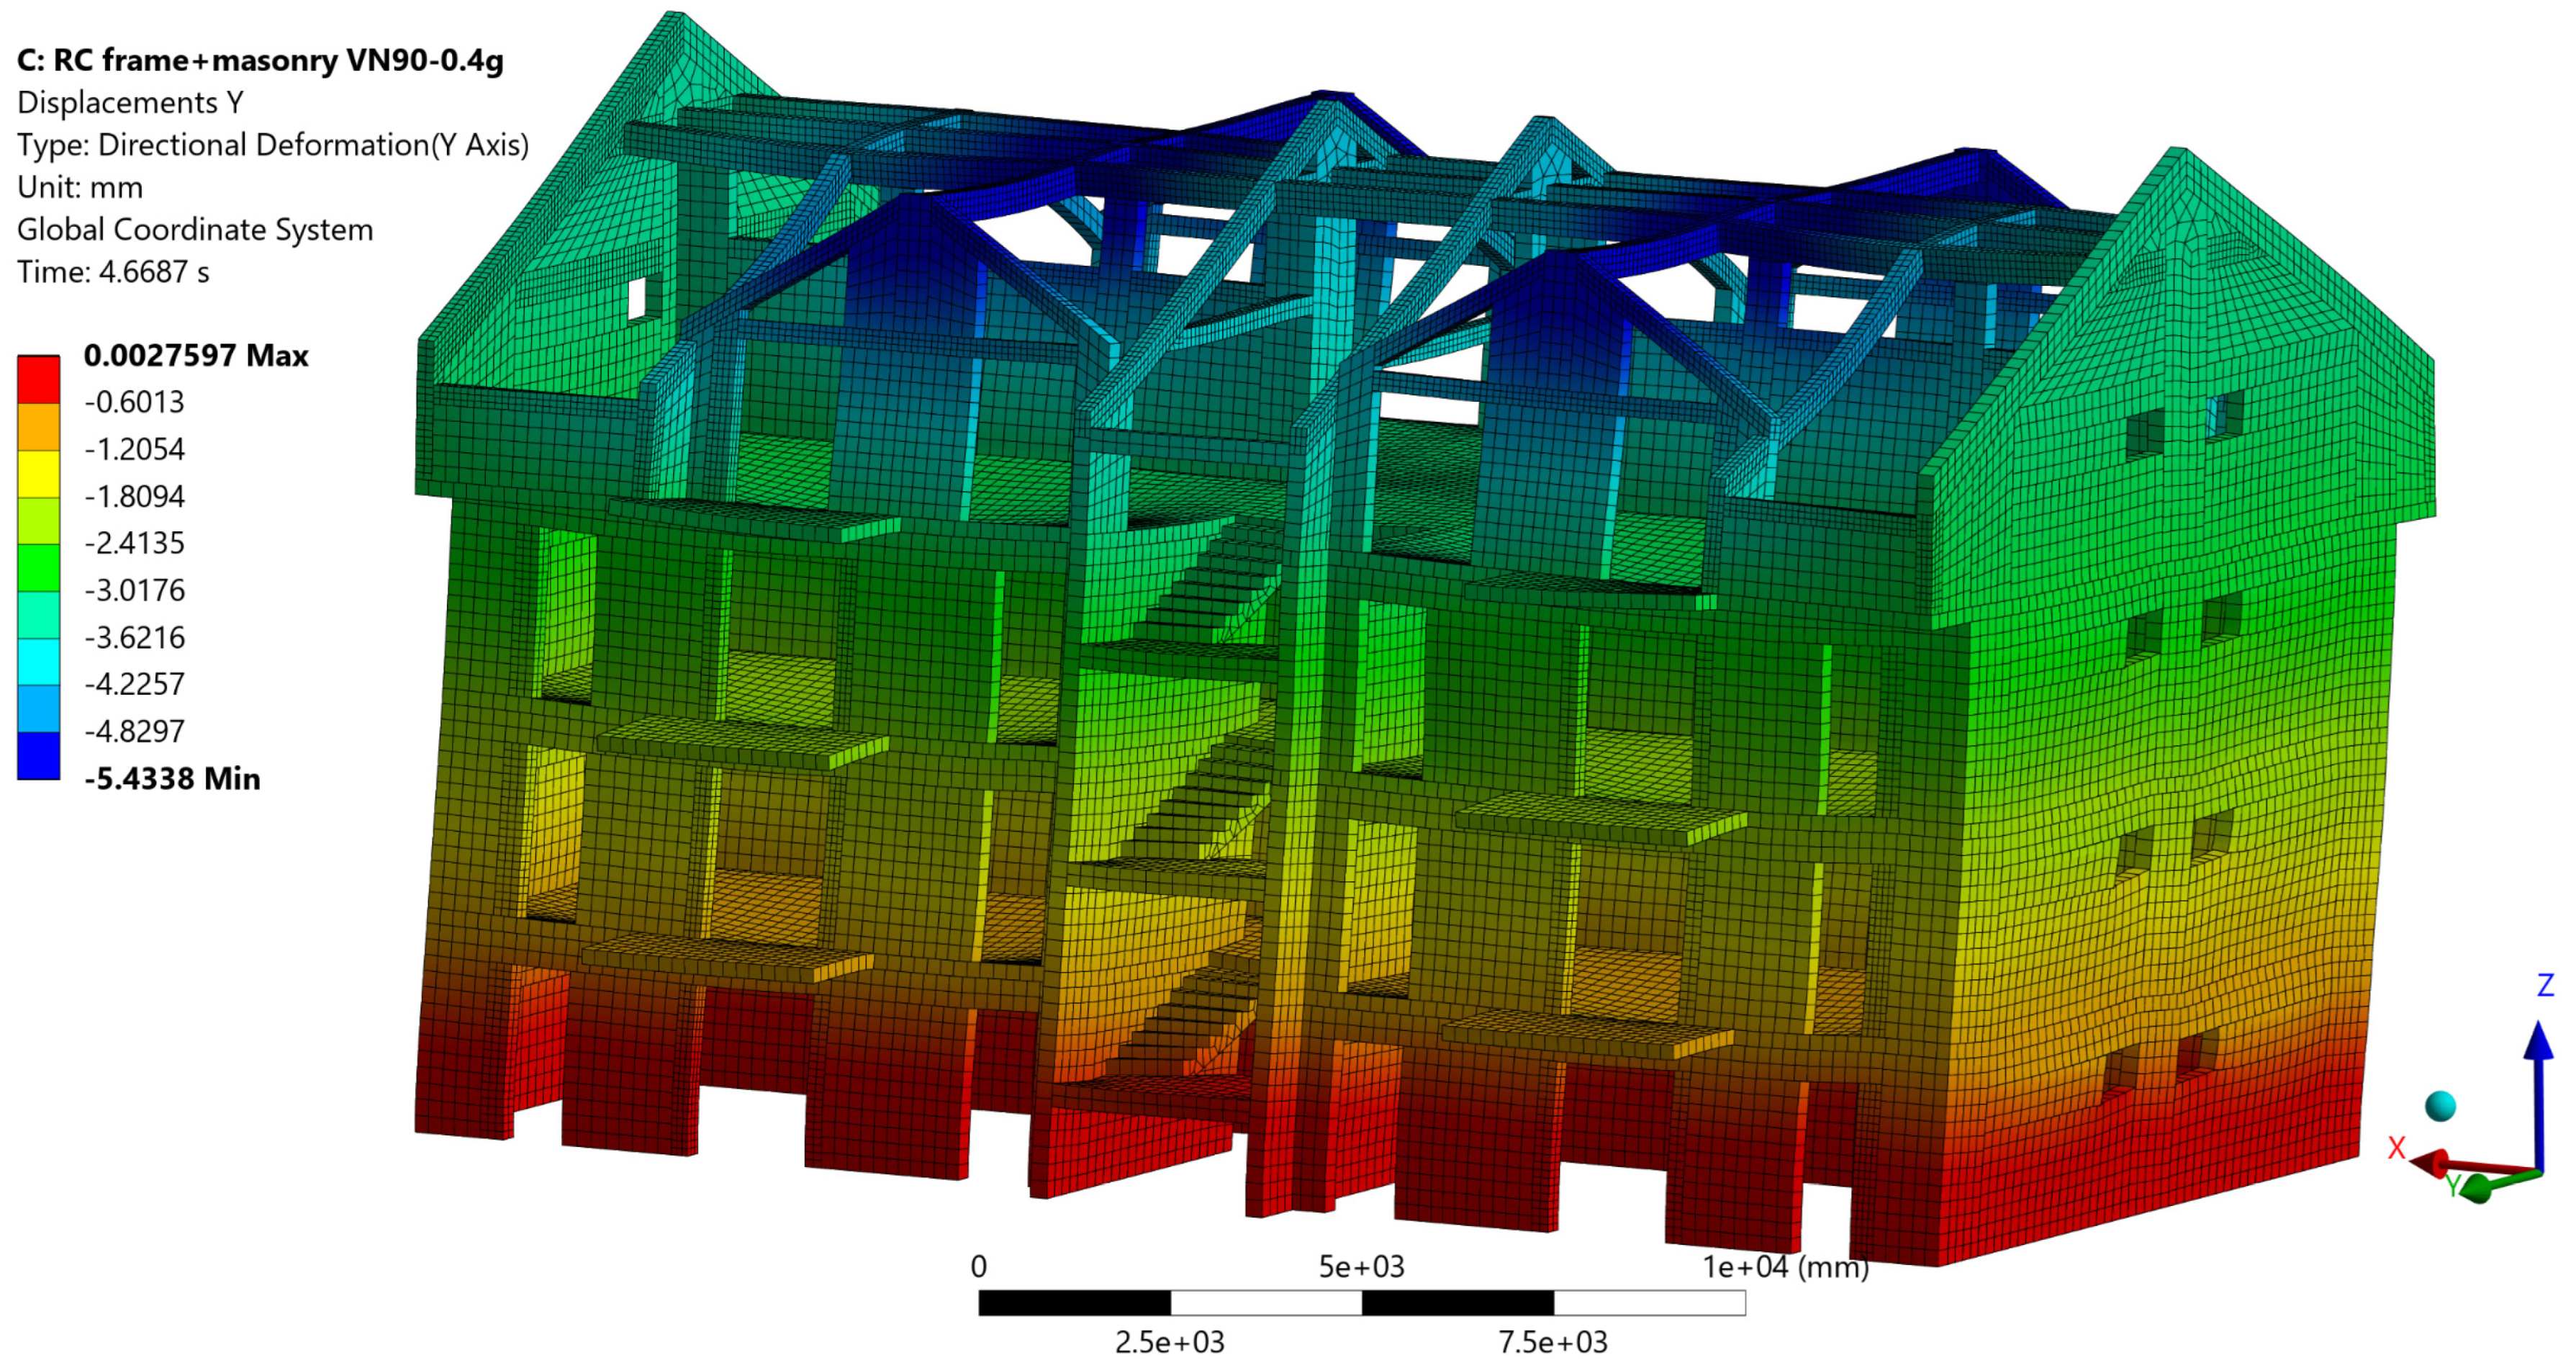
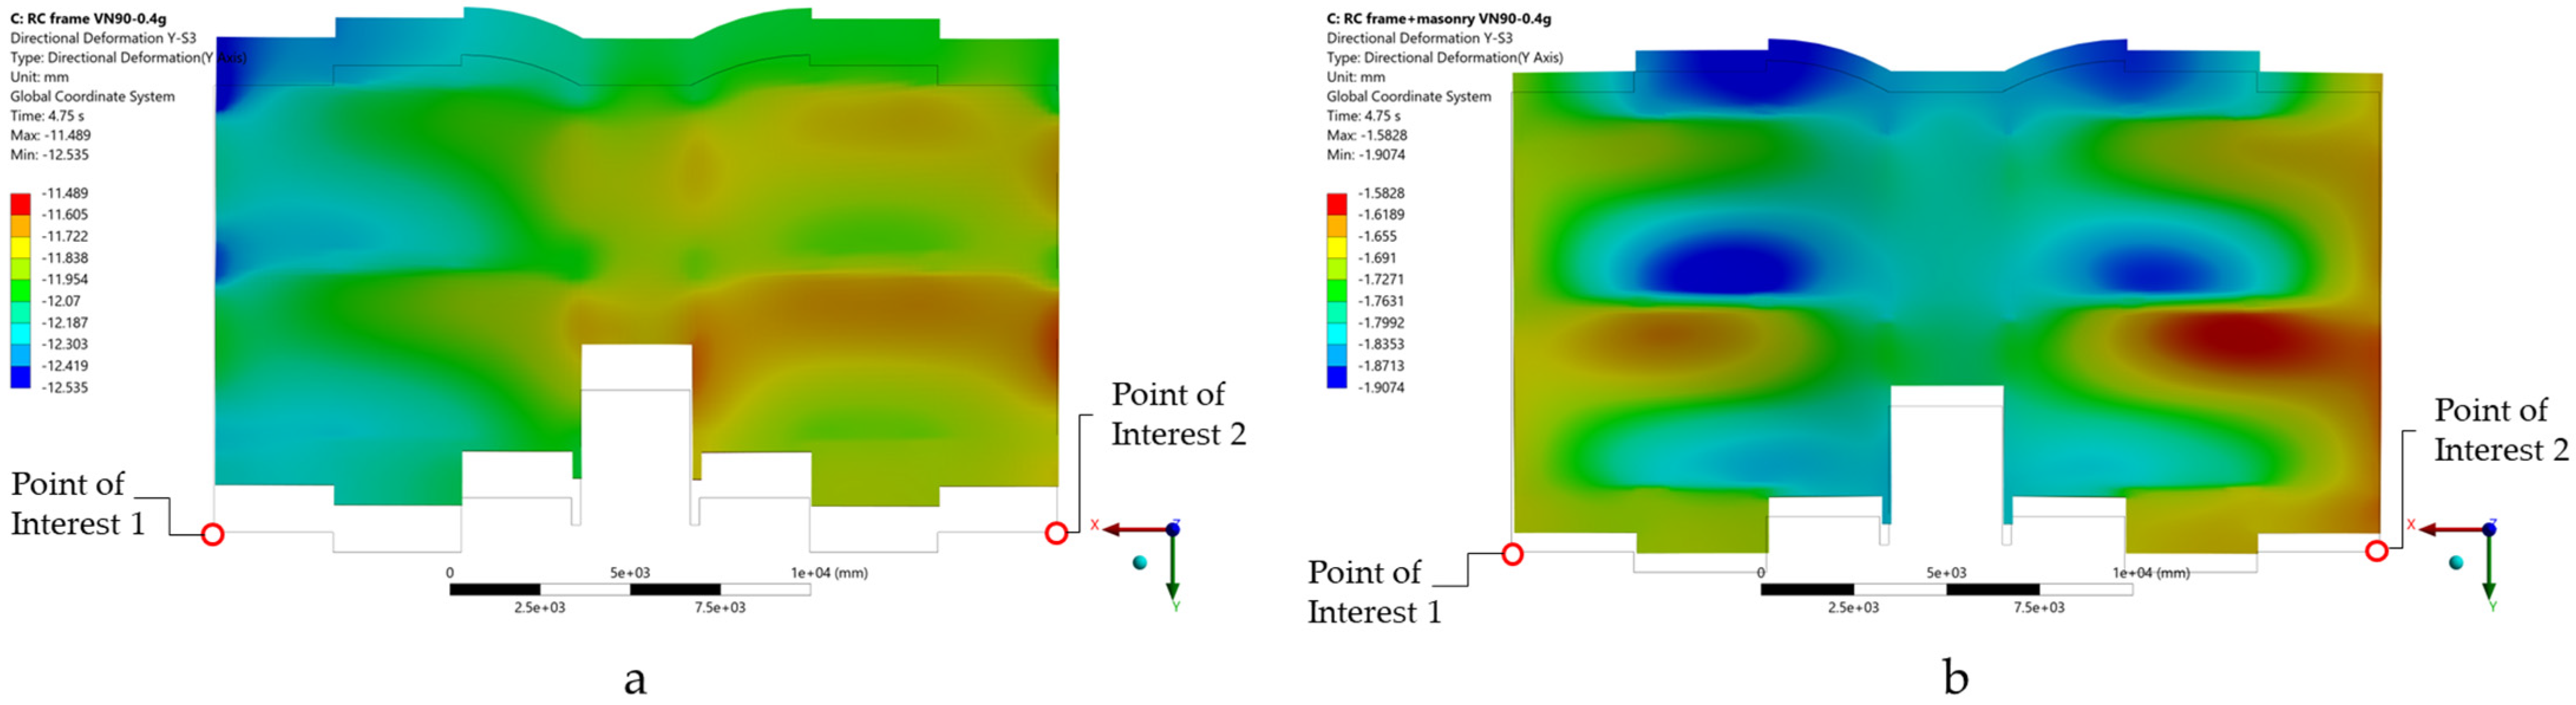
Deformation patterns at peak roof response confirm global sway in the Y direction. For the bare RC frame, the displacement contours show a more flexible response with larger storey translations and a clearer drift concentration in the lower storeys, reflecting the governing S1–S2 drift increments reported in Table 8 (Figure 12). In contrast, the RC + M configuration develops a stiffer global response, with reduced displacement amplitudes and a more restrained deformation field due to the in-plane contribution of the masonry infills (Figure 13).
The peak displacement profiles along height provide a compact comparison across all records (Figure 14). For each motion, the peak transversal displacement increases monotonically from B to R , which indicates sway-dominated response. The RC + M curves remain clustered in a narrow band, with roof peaks limited to about 2.7–3.4 mm, while the bare RC frame reaches about 9.9–14.3 mm. The separation between the RC and RC + M profiles at every level quantifies the stiffness increase introduced by the infills and explains the reduction in drift demand reported in Table 8.
To complement the detailed discussion of the transversal response, Table 9 summarises the peak bidirectional displacement response under simultaneous X–Y excitation. The results show that the peak roof displacement is larger in the Y direction for all analysed cases (Figure 15), both for the bare RC frame and for the RC + M model, confirming that the transversal direction governs the global translational roof response. In contrast, the maximum relative interstorey displacement is more direction-dependent: for the bare RC frame, the largest values remain associated with the Y direction, whereas in the RC + M configuration the maximum relative displacement becomes slightly larger in the X direction. The torsional-response indicator is evaluated as
ϕ z , m a x = Y 2 Y 1 L X
and the relative torsional indicator was defined as
η t = Y 2 Y 1 u Y ,   m a x × 100
where Y 1 and Y 2 are the transversal displacements of the two opposite roof-edge points, POI 1 and POI 2, L X = 23.35 m is their plan distance, and u Y , m a x is the peak global roof displacement in the transversal direction. Thus, ϕ z , m a x estimates the roof rotation about the vertical axis, while η t expresses the torsional component relative to the dominant translational roof response. Both indicators remain small in all six cases, indicating a predominantly translational roof response. However, the bare RC model consistently develops larger torsional response than the RC + M configuration, which suggests that the masonry infills not only reduce the global displacement demand but also limit the torsional component of the roof motion.
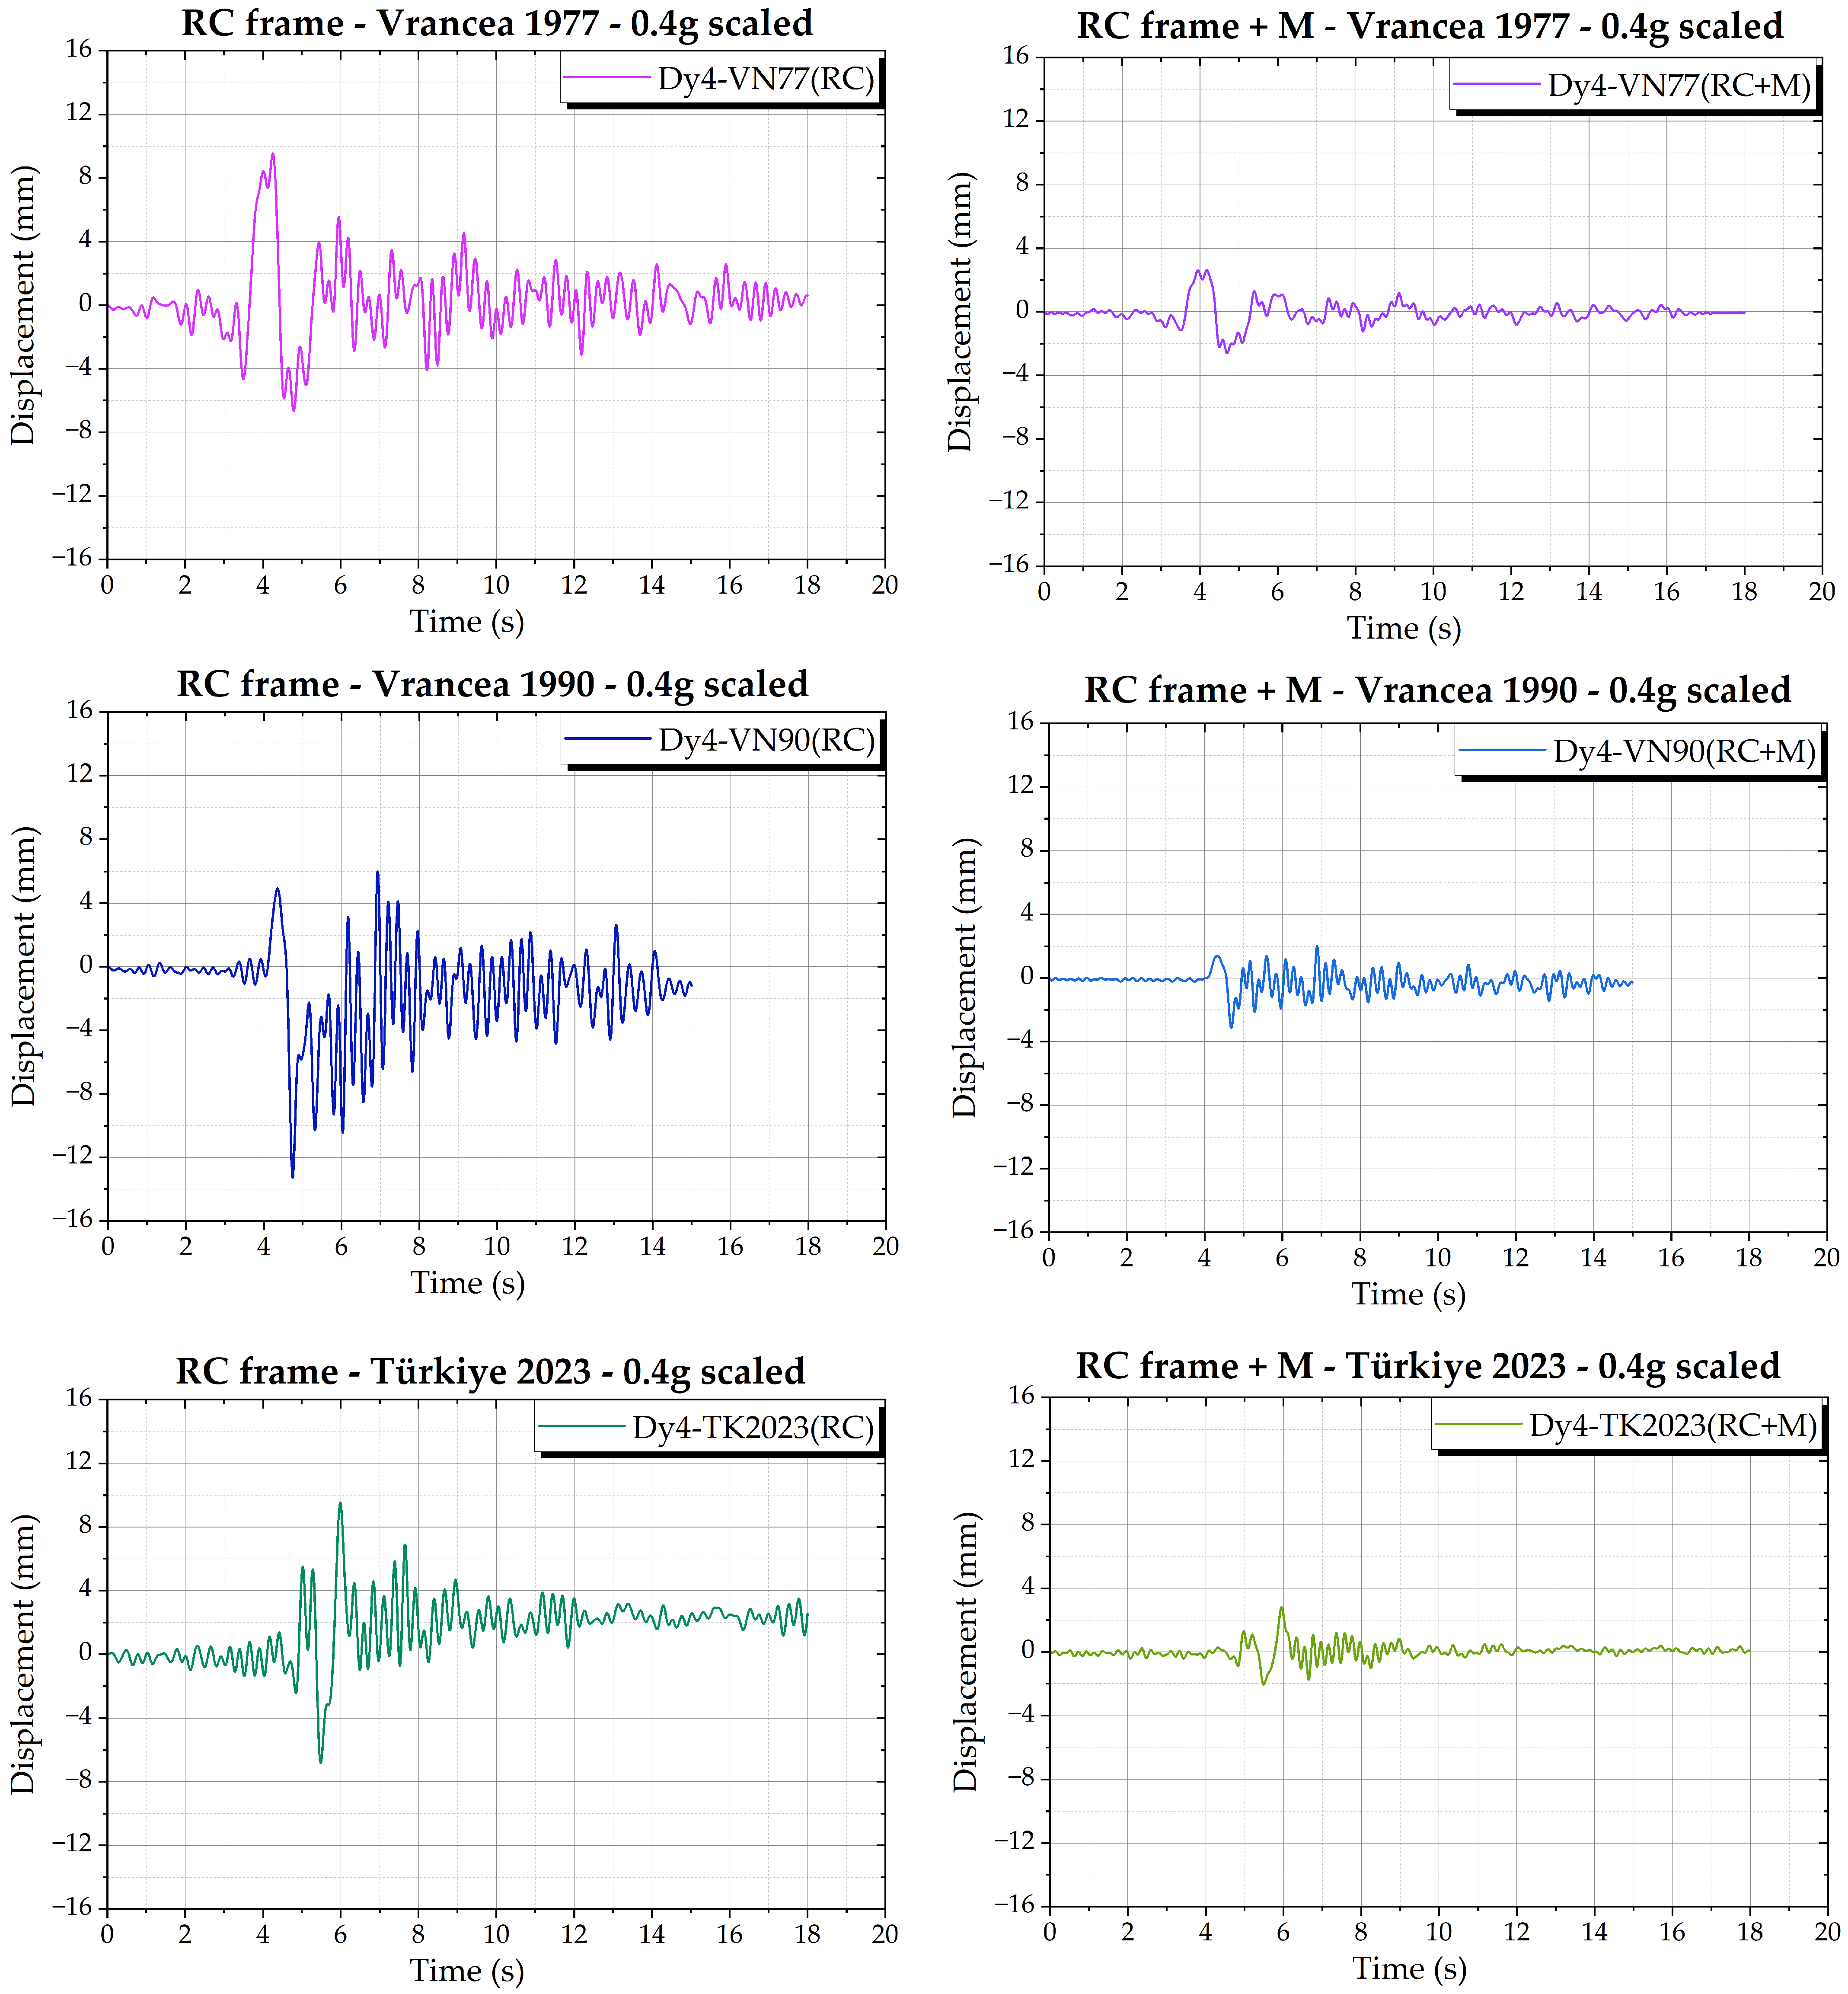
For completeness, Figure 16 compares the roof displacement time histories u R ( t ) (Dy4, Y) for both configurations and all three records, illustrating the consistent amplitude reduction produced by the infills, most pronounced for VN90.

5.3. Peak Floor Accelerations

Peak absolute accelerations in the transversal direction were extracted at the same reporting levels used for displacements, namely Base (B), S1, S2, S3, and roof R. For each record and level, the reported value is the absolute maximum of the acceleration time history, A Y , m a x = m a x t a y ( t ) , evaluated over the full record duration.
Table 10 summarises the results in both mm/s2 and g . A consistent height amplification is observed for both structural configurations, with the roof governing the peak accelerations in all cases. For the infilled configuration (RC + M), the roof peaks range from 710 to 2068 mm/ s 2 (0.072–0.211 g), depending on the input record. For the bare frame (RC), the roof demand is substantially higher, reaching 4801 mm/s2 (0.490 g) under VN90. This trend supports the displacement results, where the bare frame shows a more flexible global response and therefore develops larger vibration amplitudes under the same bidirectional excitation, while the masonry infills increase lateral stiffness and reduce global sway and associated acceleration amplification.
The bidirectional roof acceleration response also confirms that the seismic demand is not governed exclusively by the transversal direction. The peak roof acceleration along X reaches 0.072 g, 0.211 g, and 0.141 g for the RC + M model under VN77, VN90, and TK2023, respectively, and 0.205 g, 0.490 g, and 0.296 g for the bare RC model. For comparison, the corresponding peak values along Y are 0.071 g, 0.233 g, and 0.116 g for RC + M, and 0.200 g, 0.425 g, and 0.202 g for RC. These results show that, unlike the peak roof displacements, the acceleration response remains more balanced between the two horizontal directions.
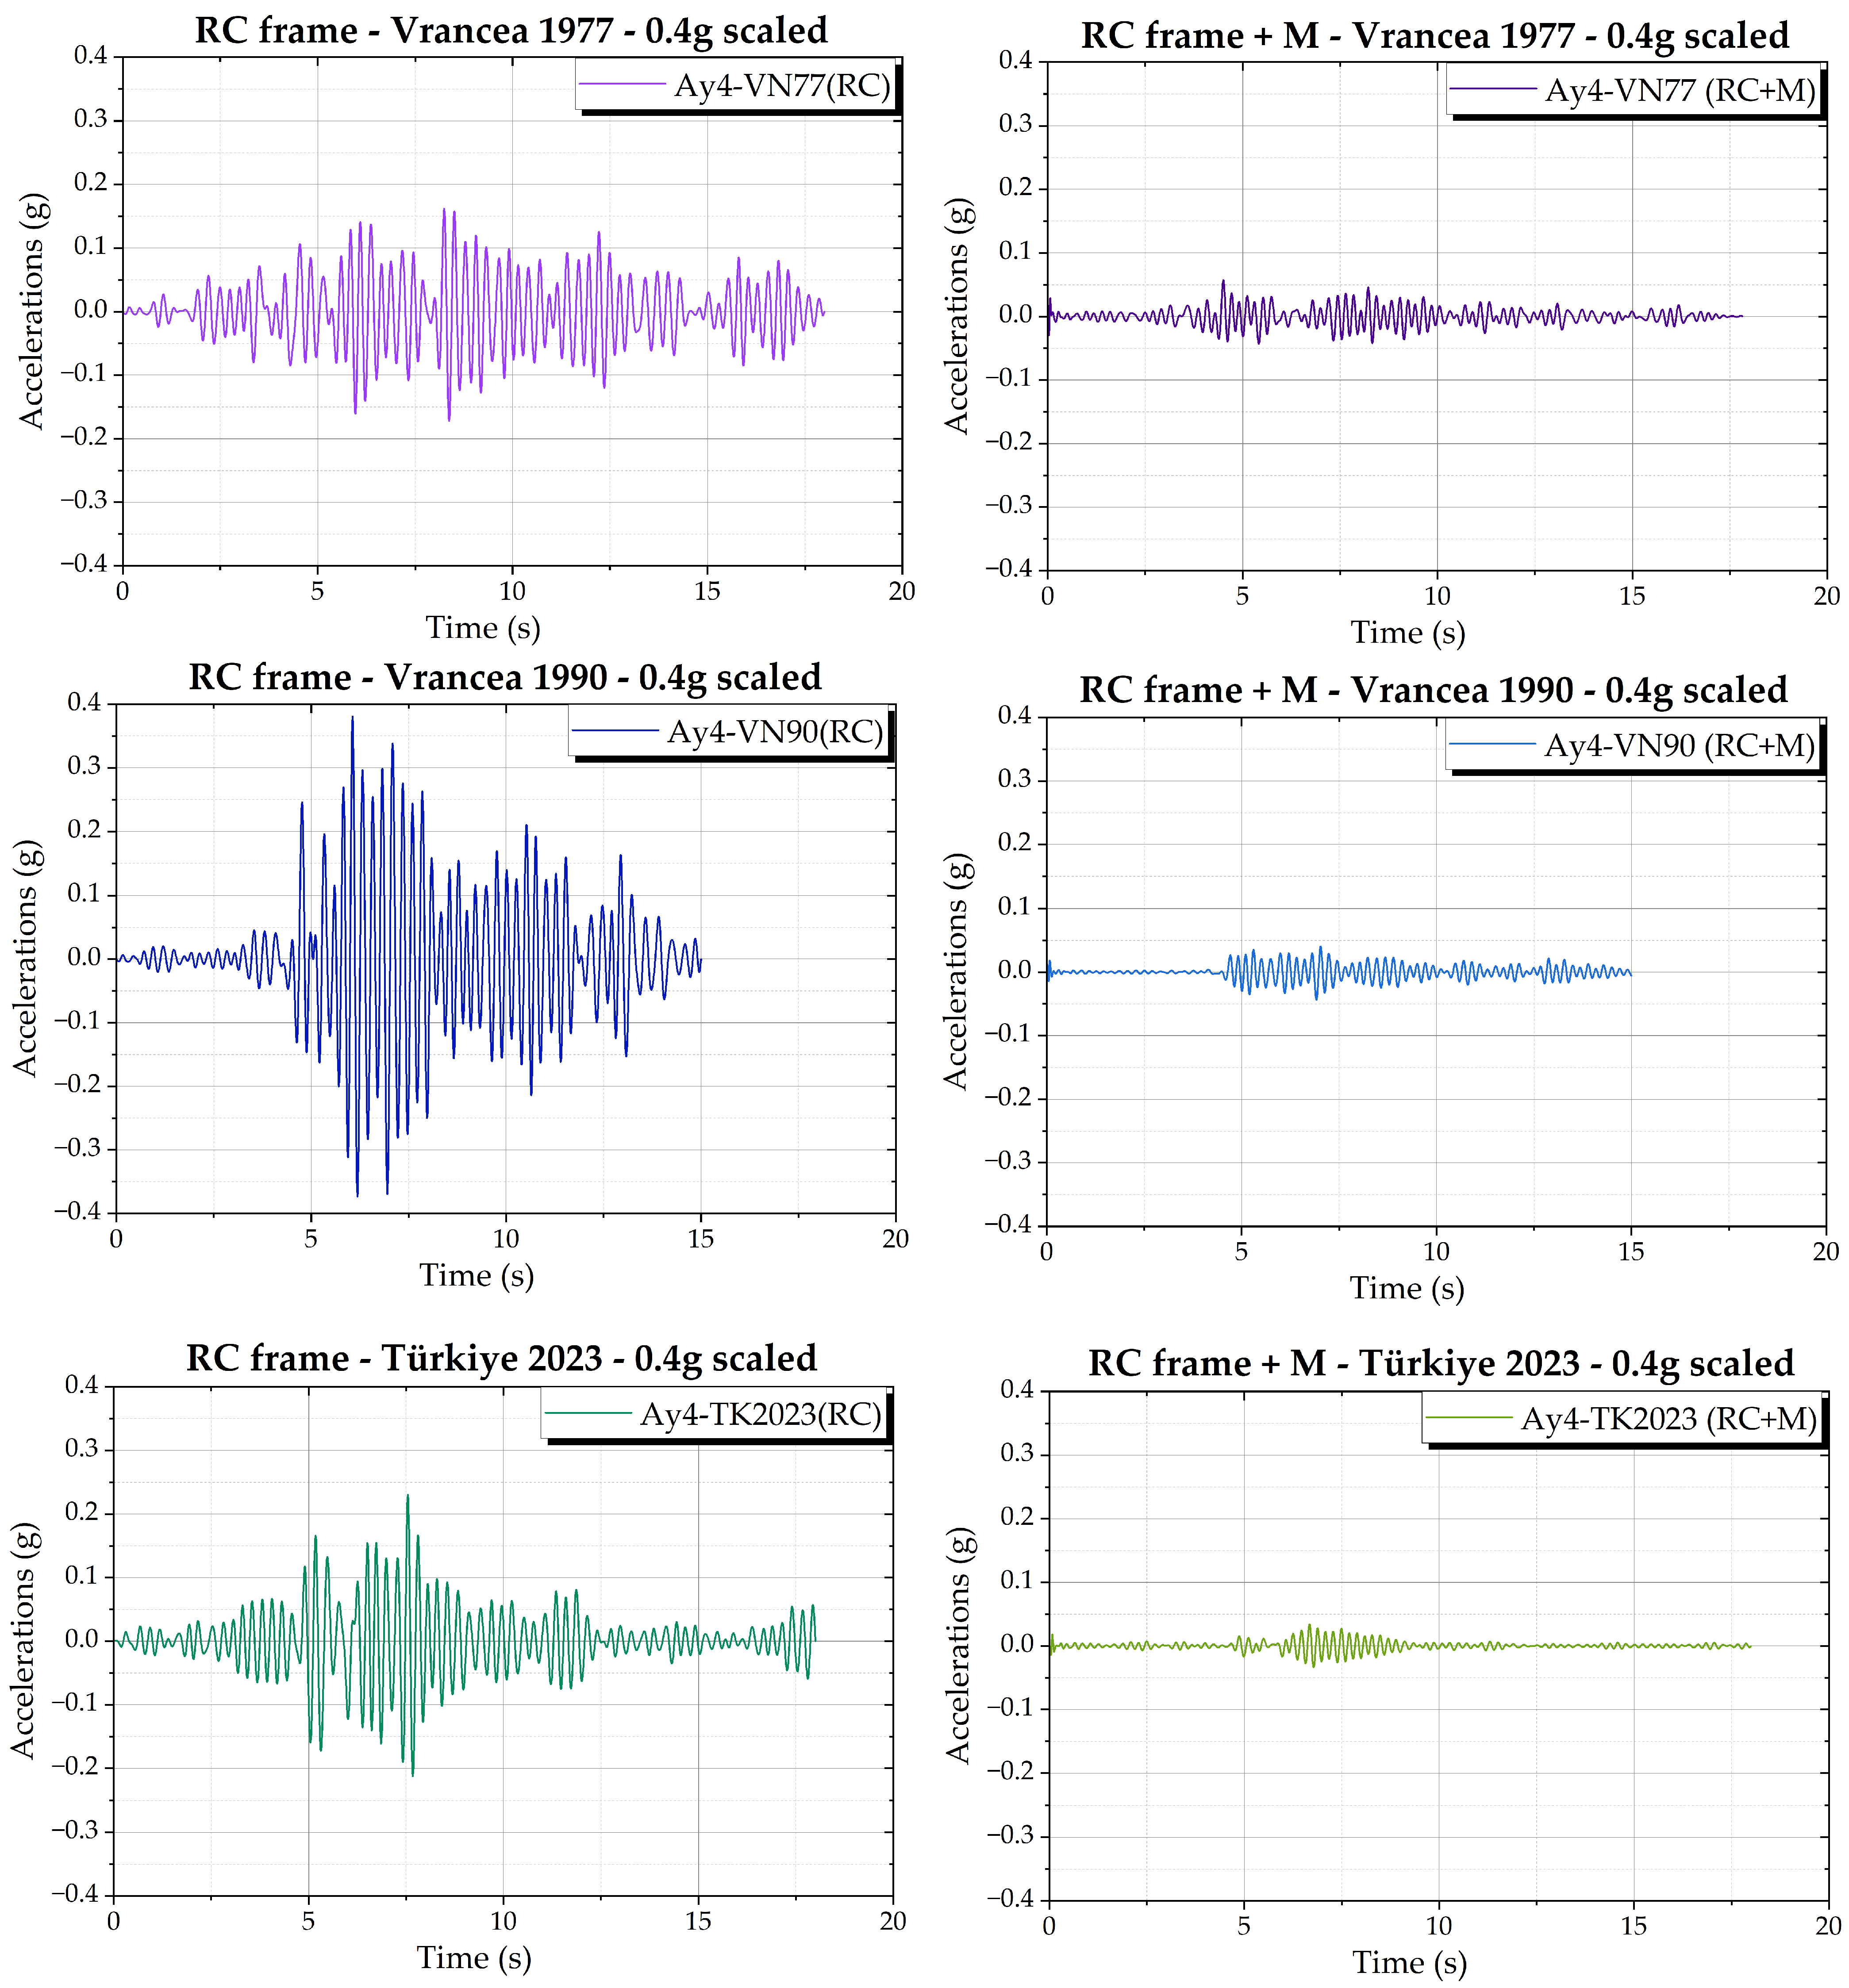
Figure 17 compares the roof acceleration histories (Ay 4) for RC and RC + M under VN77, VN90, and TK2023 (0.4 g scaled). The VN90 input produces the largest roof accelerations, and the reduction provided by infills is visible as a clear drop in peak amplitudes and a narrower response envelope for RC + M across all three records.

5.4. Base Reactions and Global Force–Deformation Response

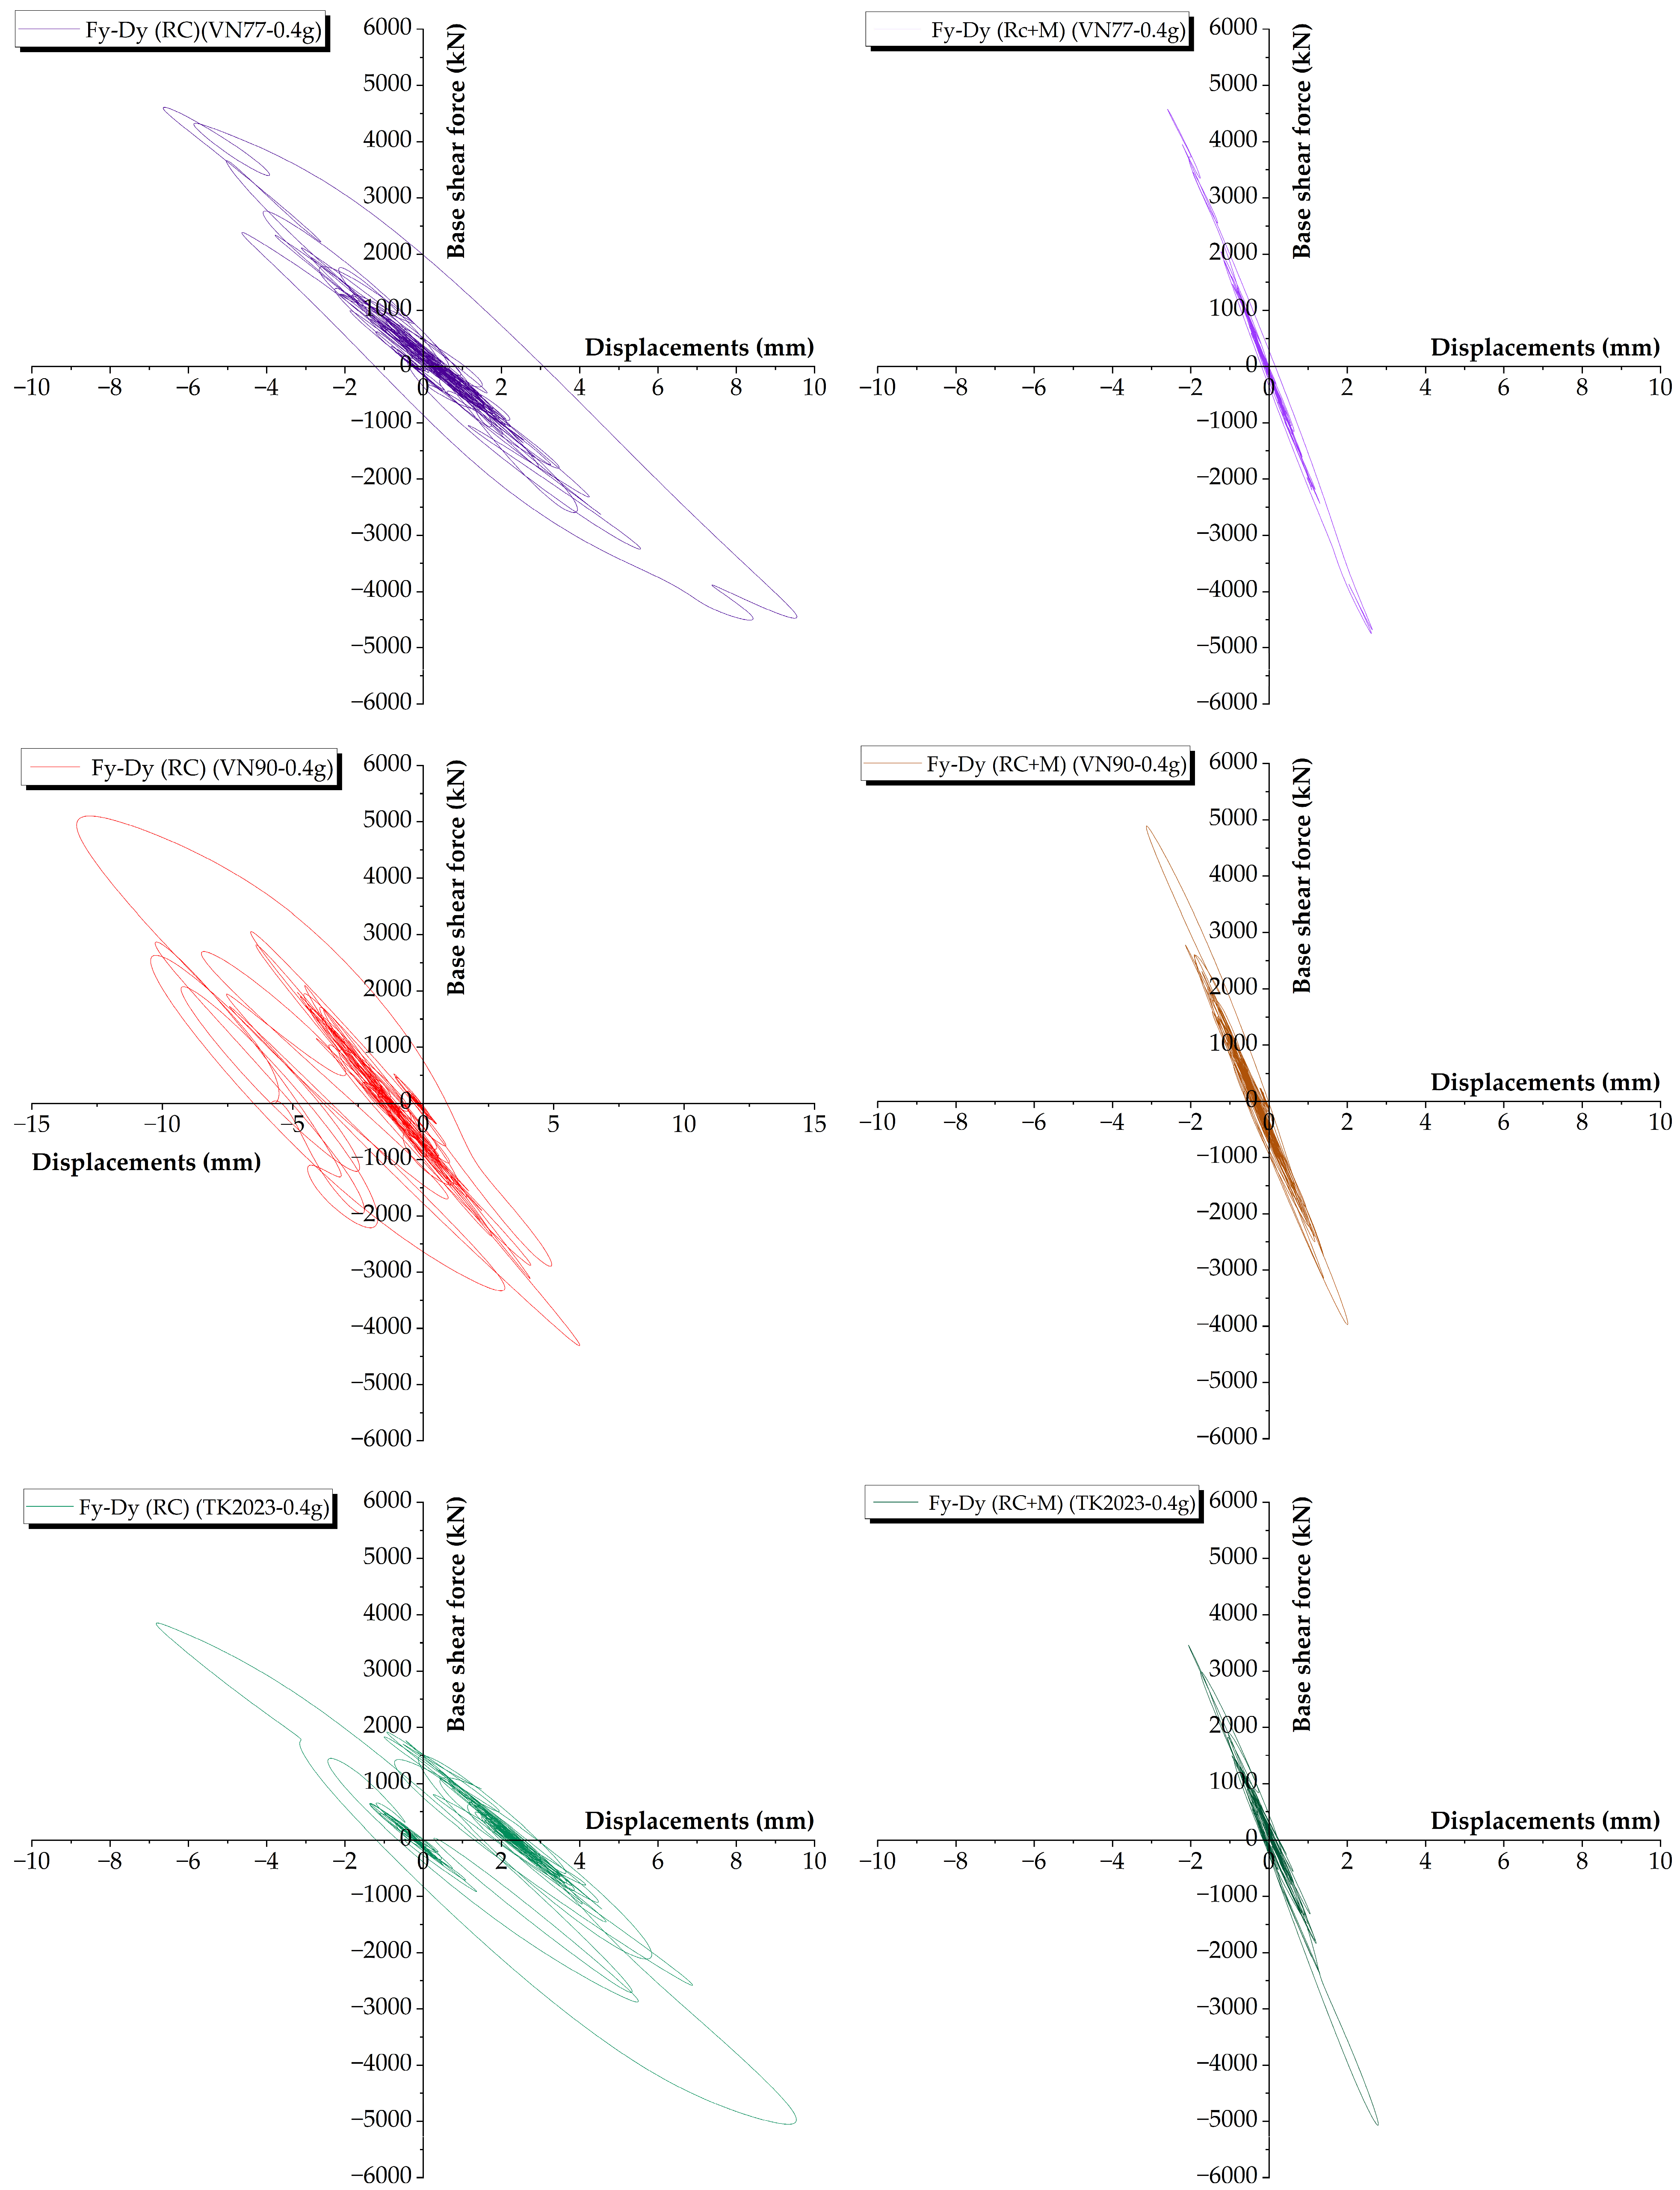
The global lateral behaviour was further assessed using (i) the support reactions at the fixed base and (ii) base shear–roof displacement hysteresis loops in the transversal direction. The base shear, F Y , was taken from the reaction resultants at the constrained support component, consistent with the global axes. The roof displacement was taken as the Y - direction displacement at level R (Dy4). The F Y —Dy4 loops (Figure 18) provide a compact measure of global stiffness, strength demand, and energy dissipation under the bidirectional input.
Figure 18 shows that the bare RC frame develops substantially larger lateral excursions, with wider loops and a lower initial slope, indicating a more flexible global response. The infilled configuration (RC + M) exhibits a much steeper response with markedly reduced displacement demand, and the loops remain narrow, in agreement with the increased in-plane stiffness contribution of the masonry infills. However, this beneficial effect does not apply uniformly to all response measures. As shown in Table 11, the peak absolute transversal base shear F Y is slightly higher in the RC + M model than in the bare RC model for all three records. This indicates that the infills reduce global translations and drift demand but may also attract comparable or somewhat larger base shear because of the increased lateral stiffness of the system.
Table 11 reports the extreme (signed) reaction components extracted from the transient analyses. The vertical reaction F Z remains practically constant across records for each model, reflecting the dominant gravity contribution and the constraint conditions at the base. The transversal base shear component F Y reaches the largest absolute values among the horizontal reactions and is compatible with the relative severity of the records observed in the displacement and acceleration results. The bending moments M X and M Y also increase in magnitude for the cases that generate higher lateral demand, providing an additional indicator of global overturning effects at the base.

5.5. Stress Demand and Inelastic Indicators

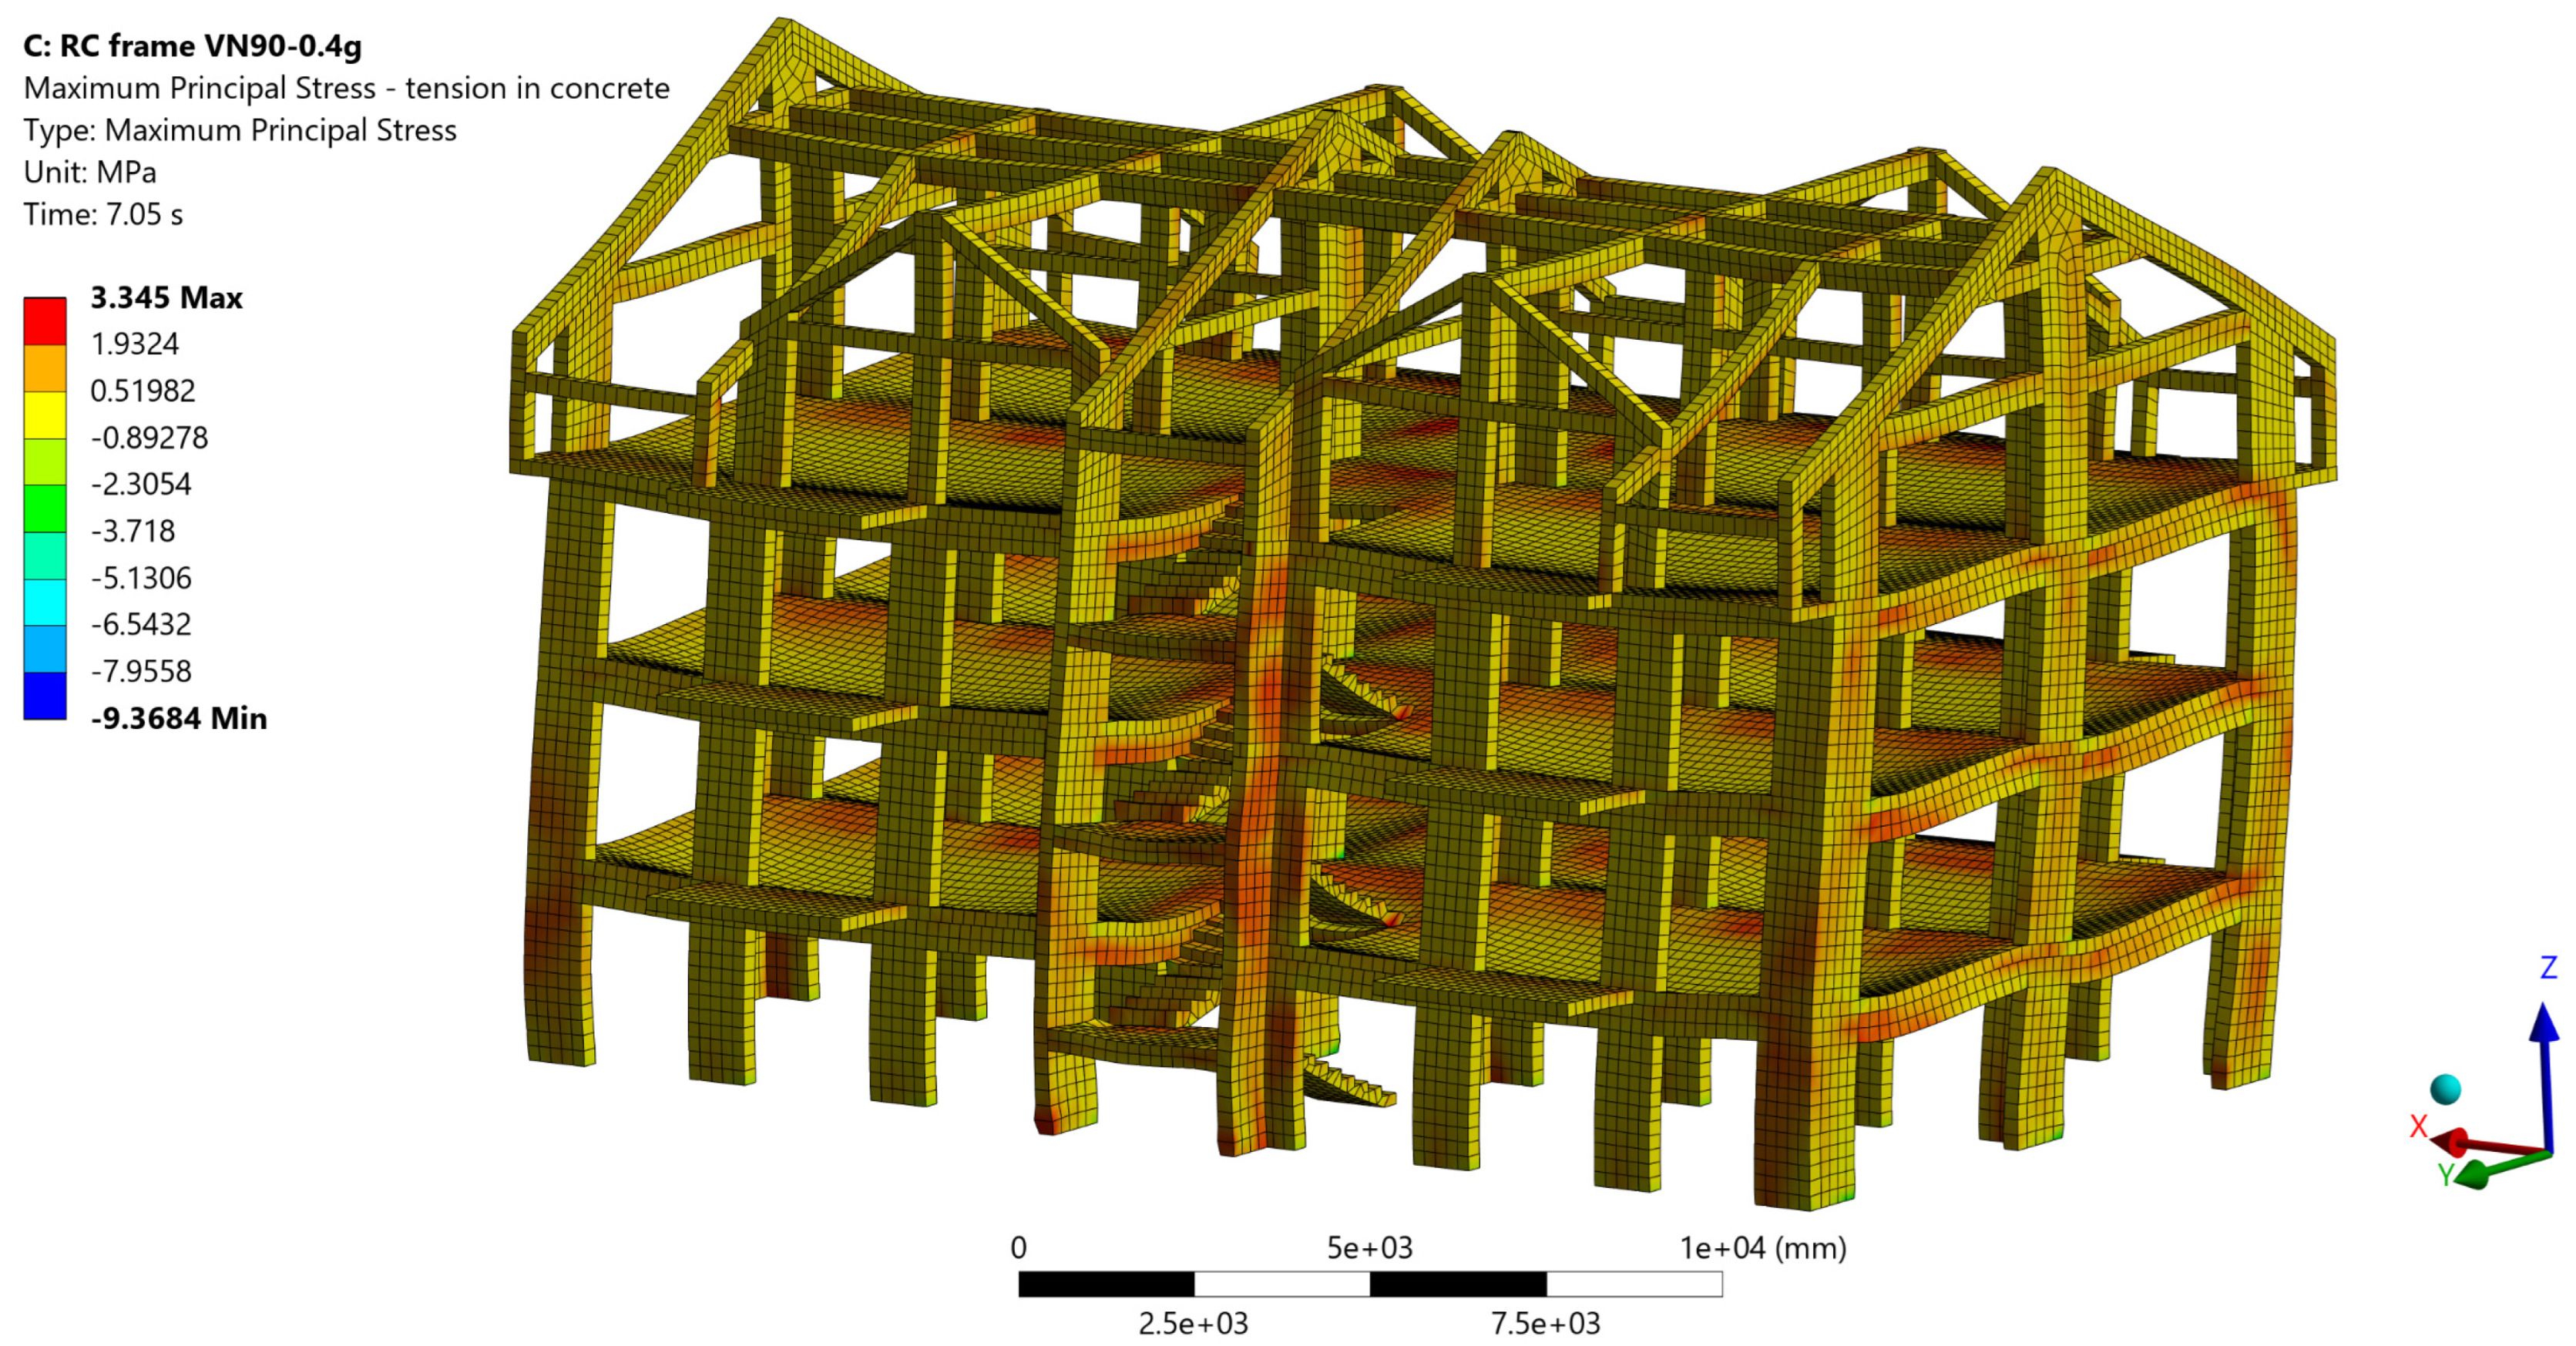
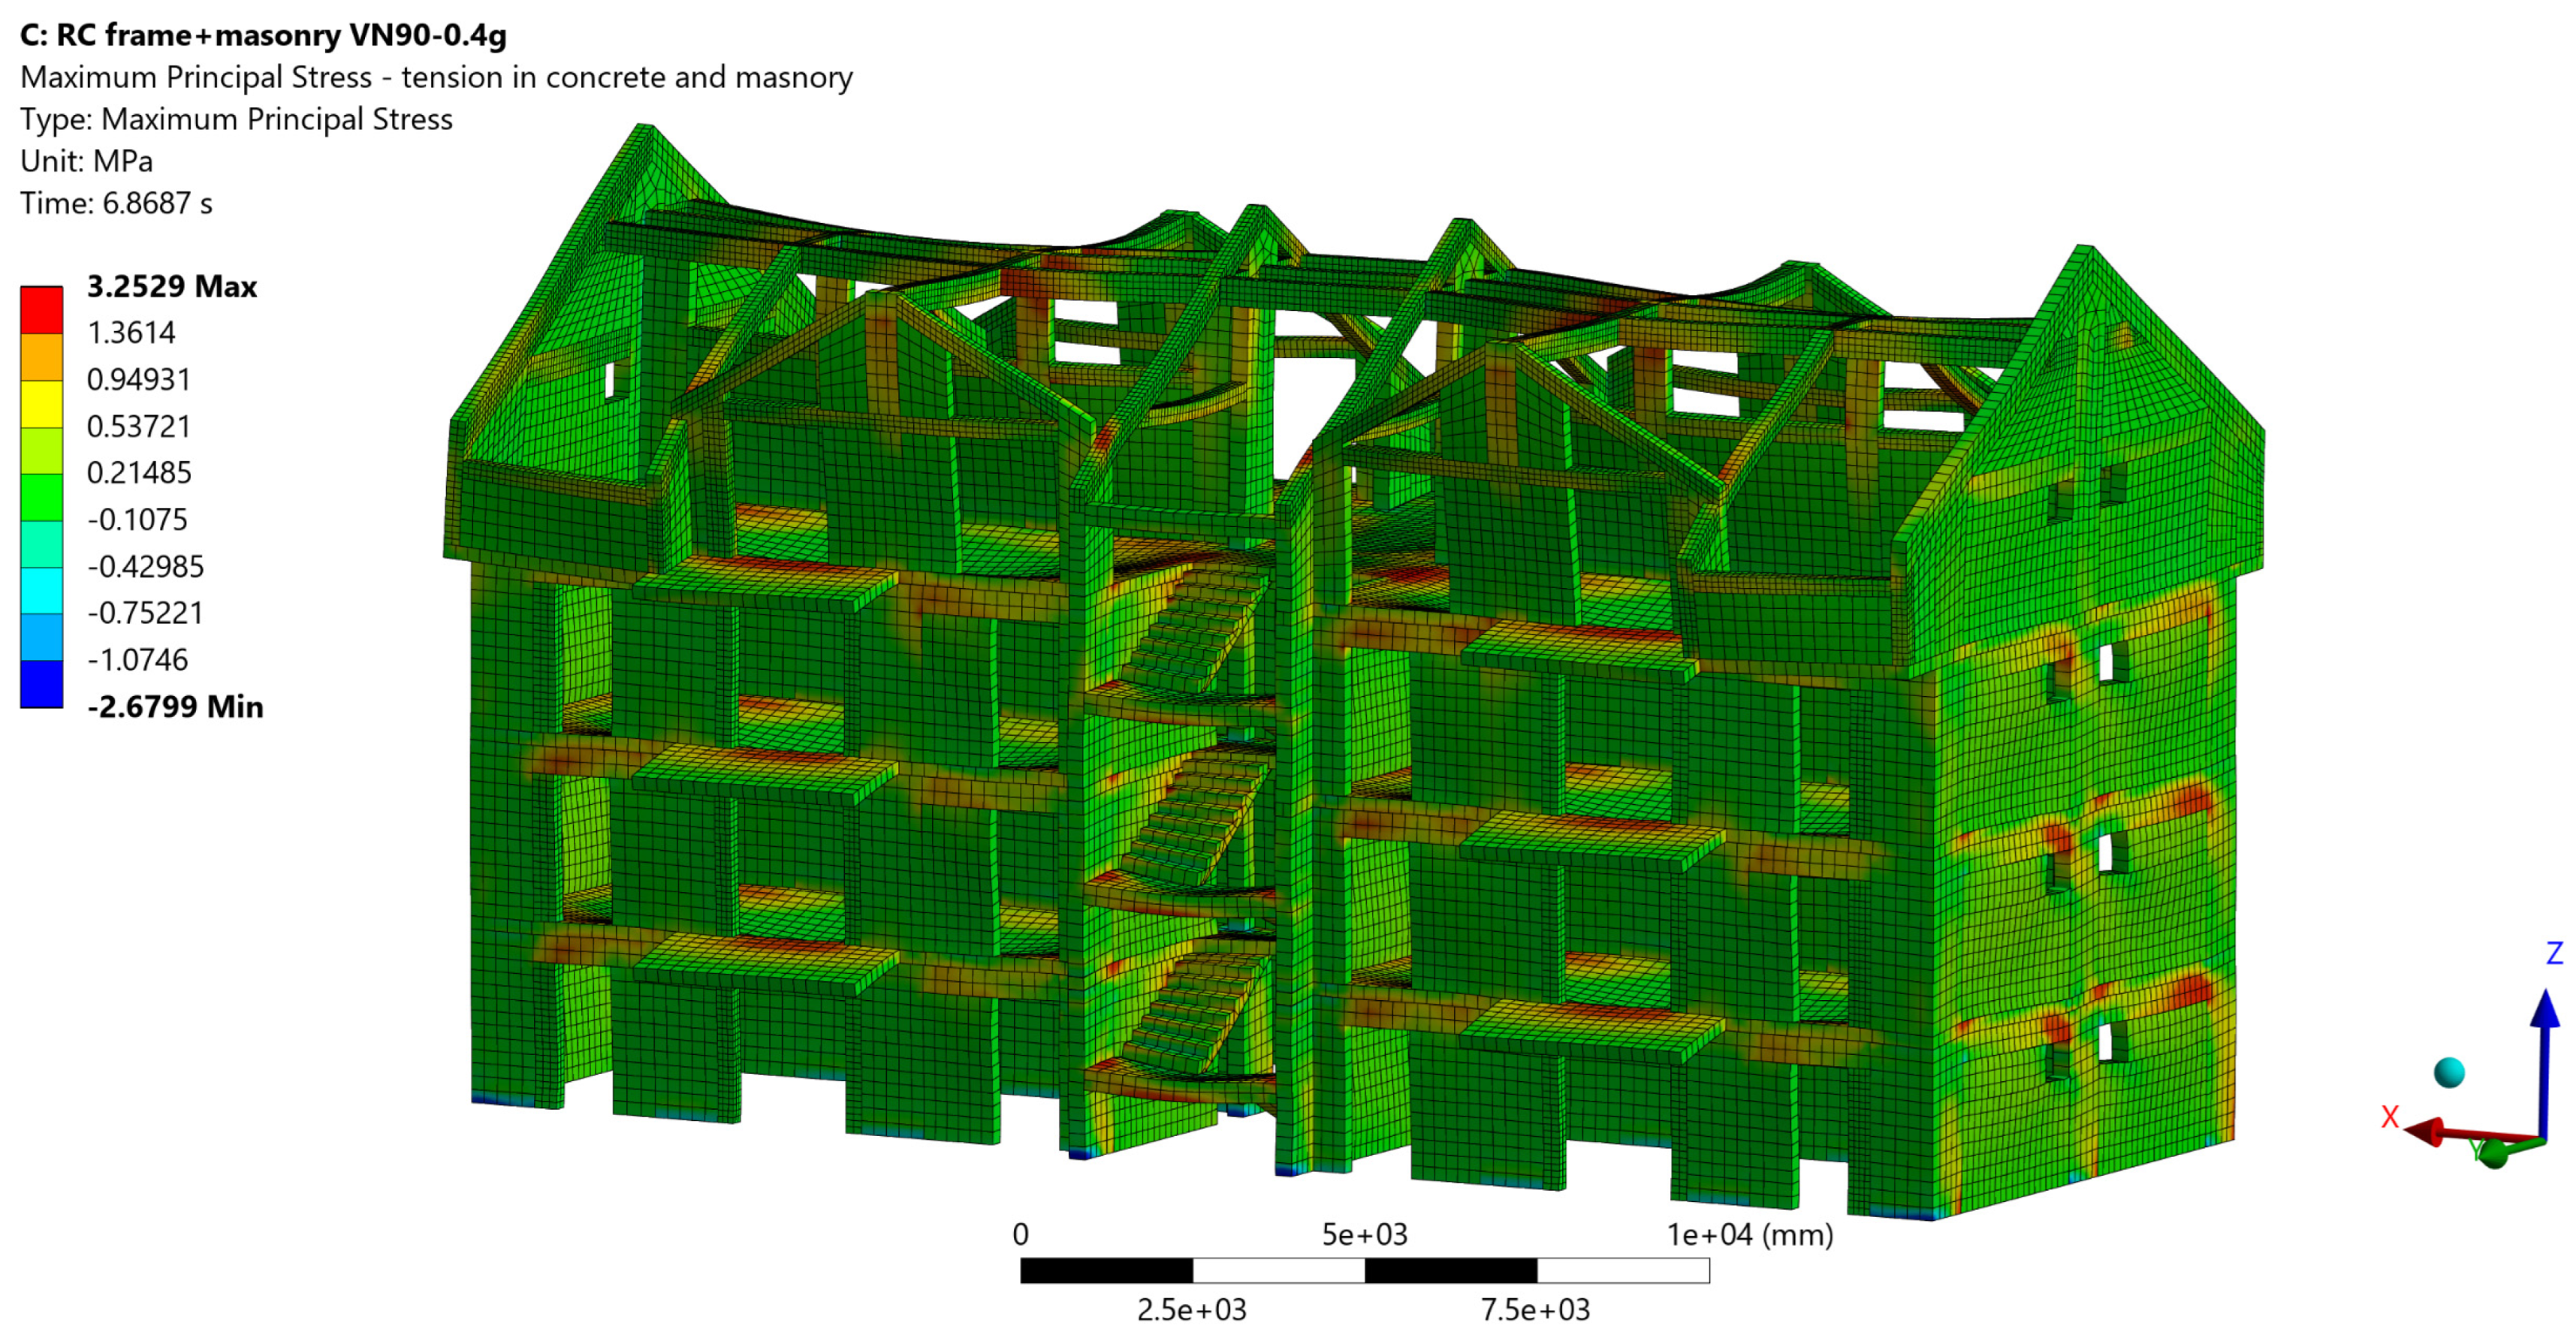
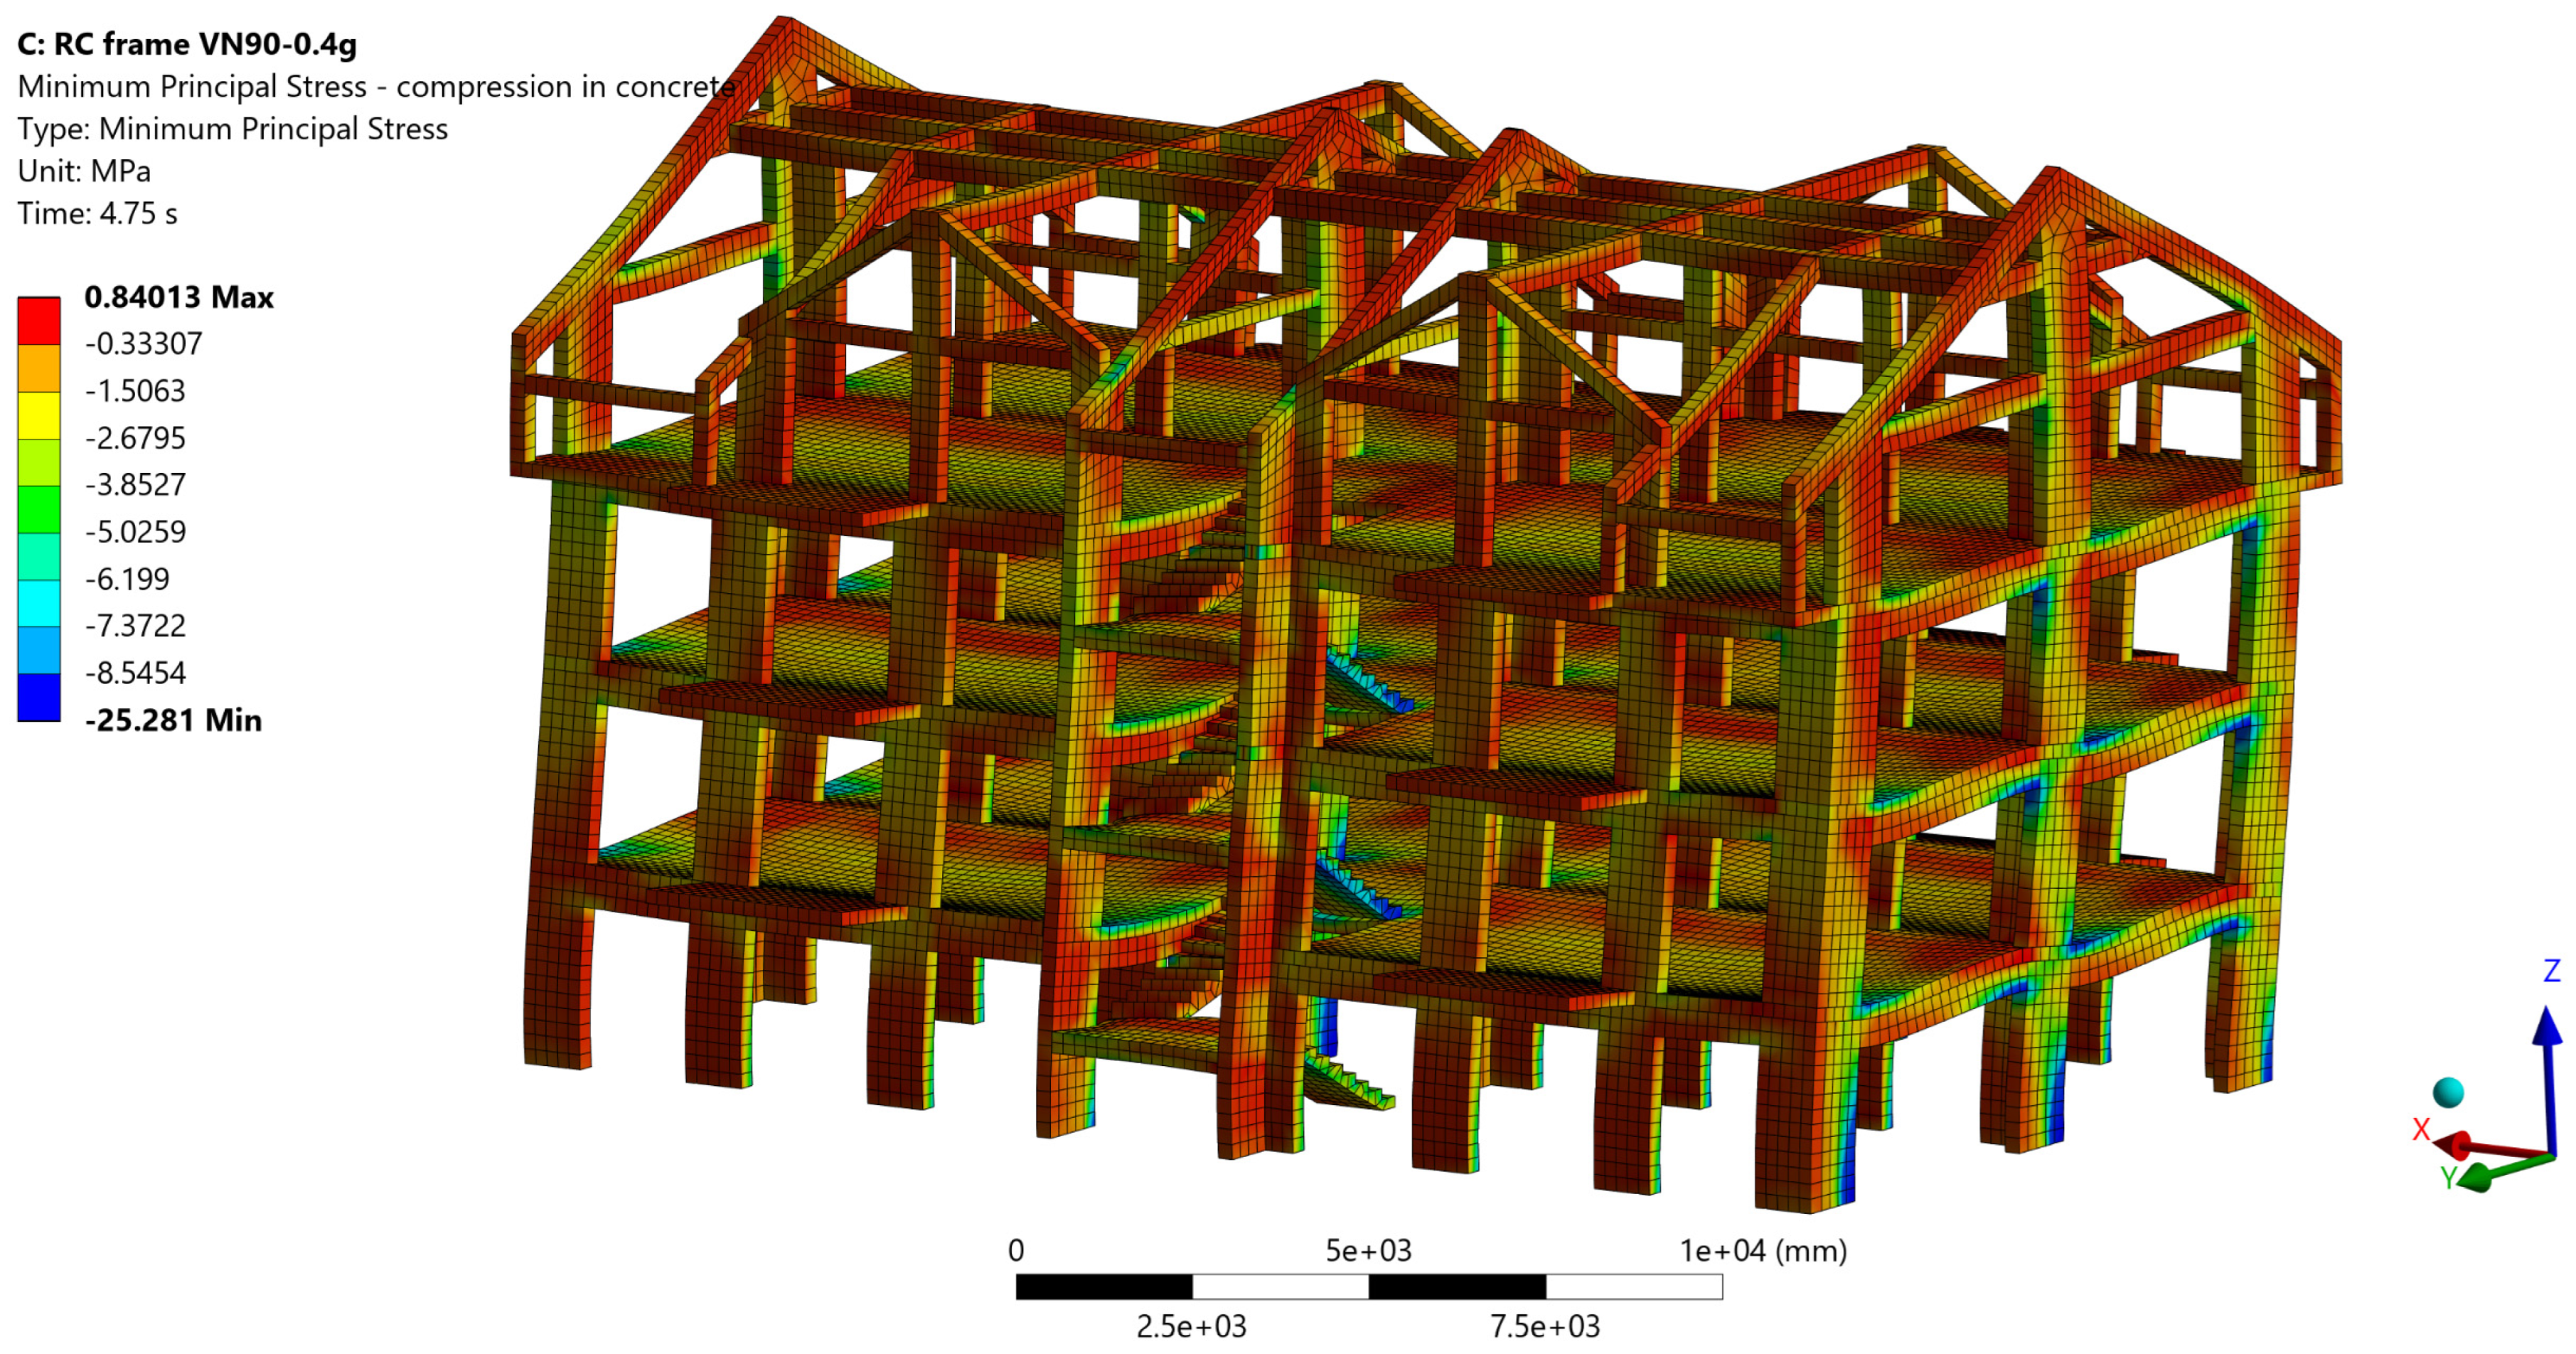
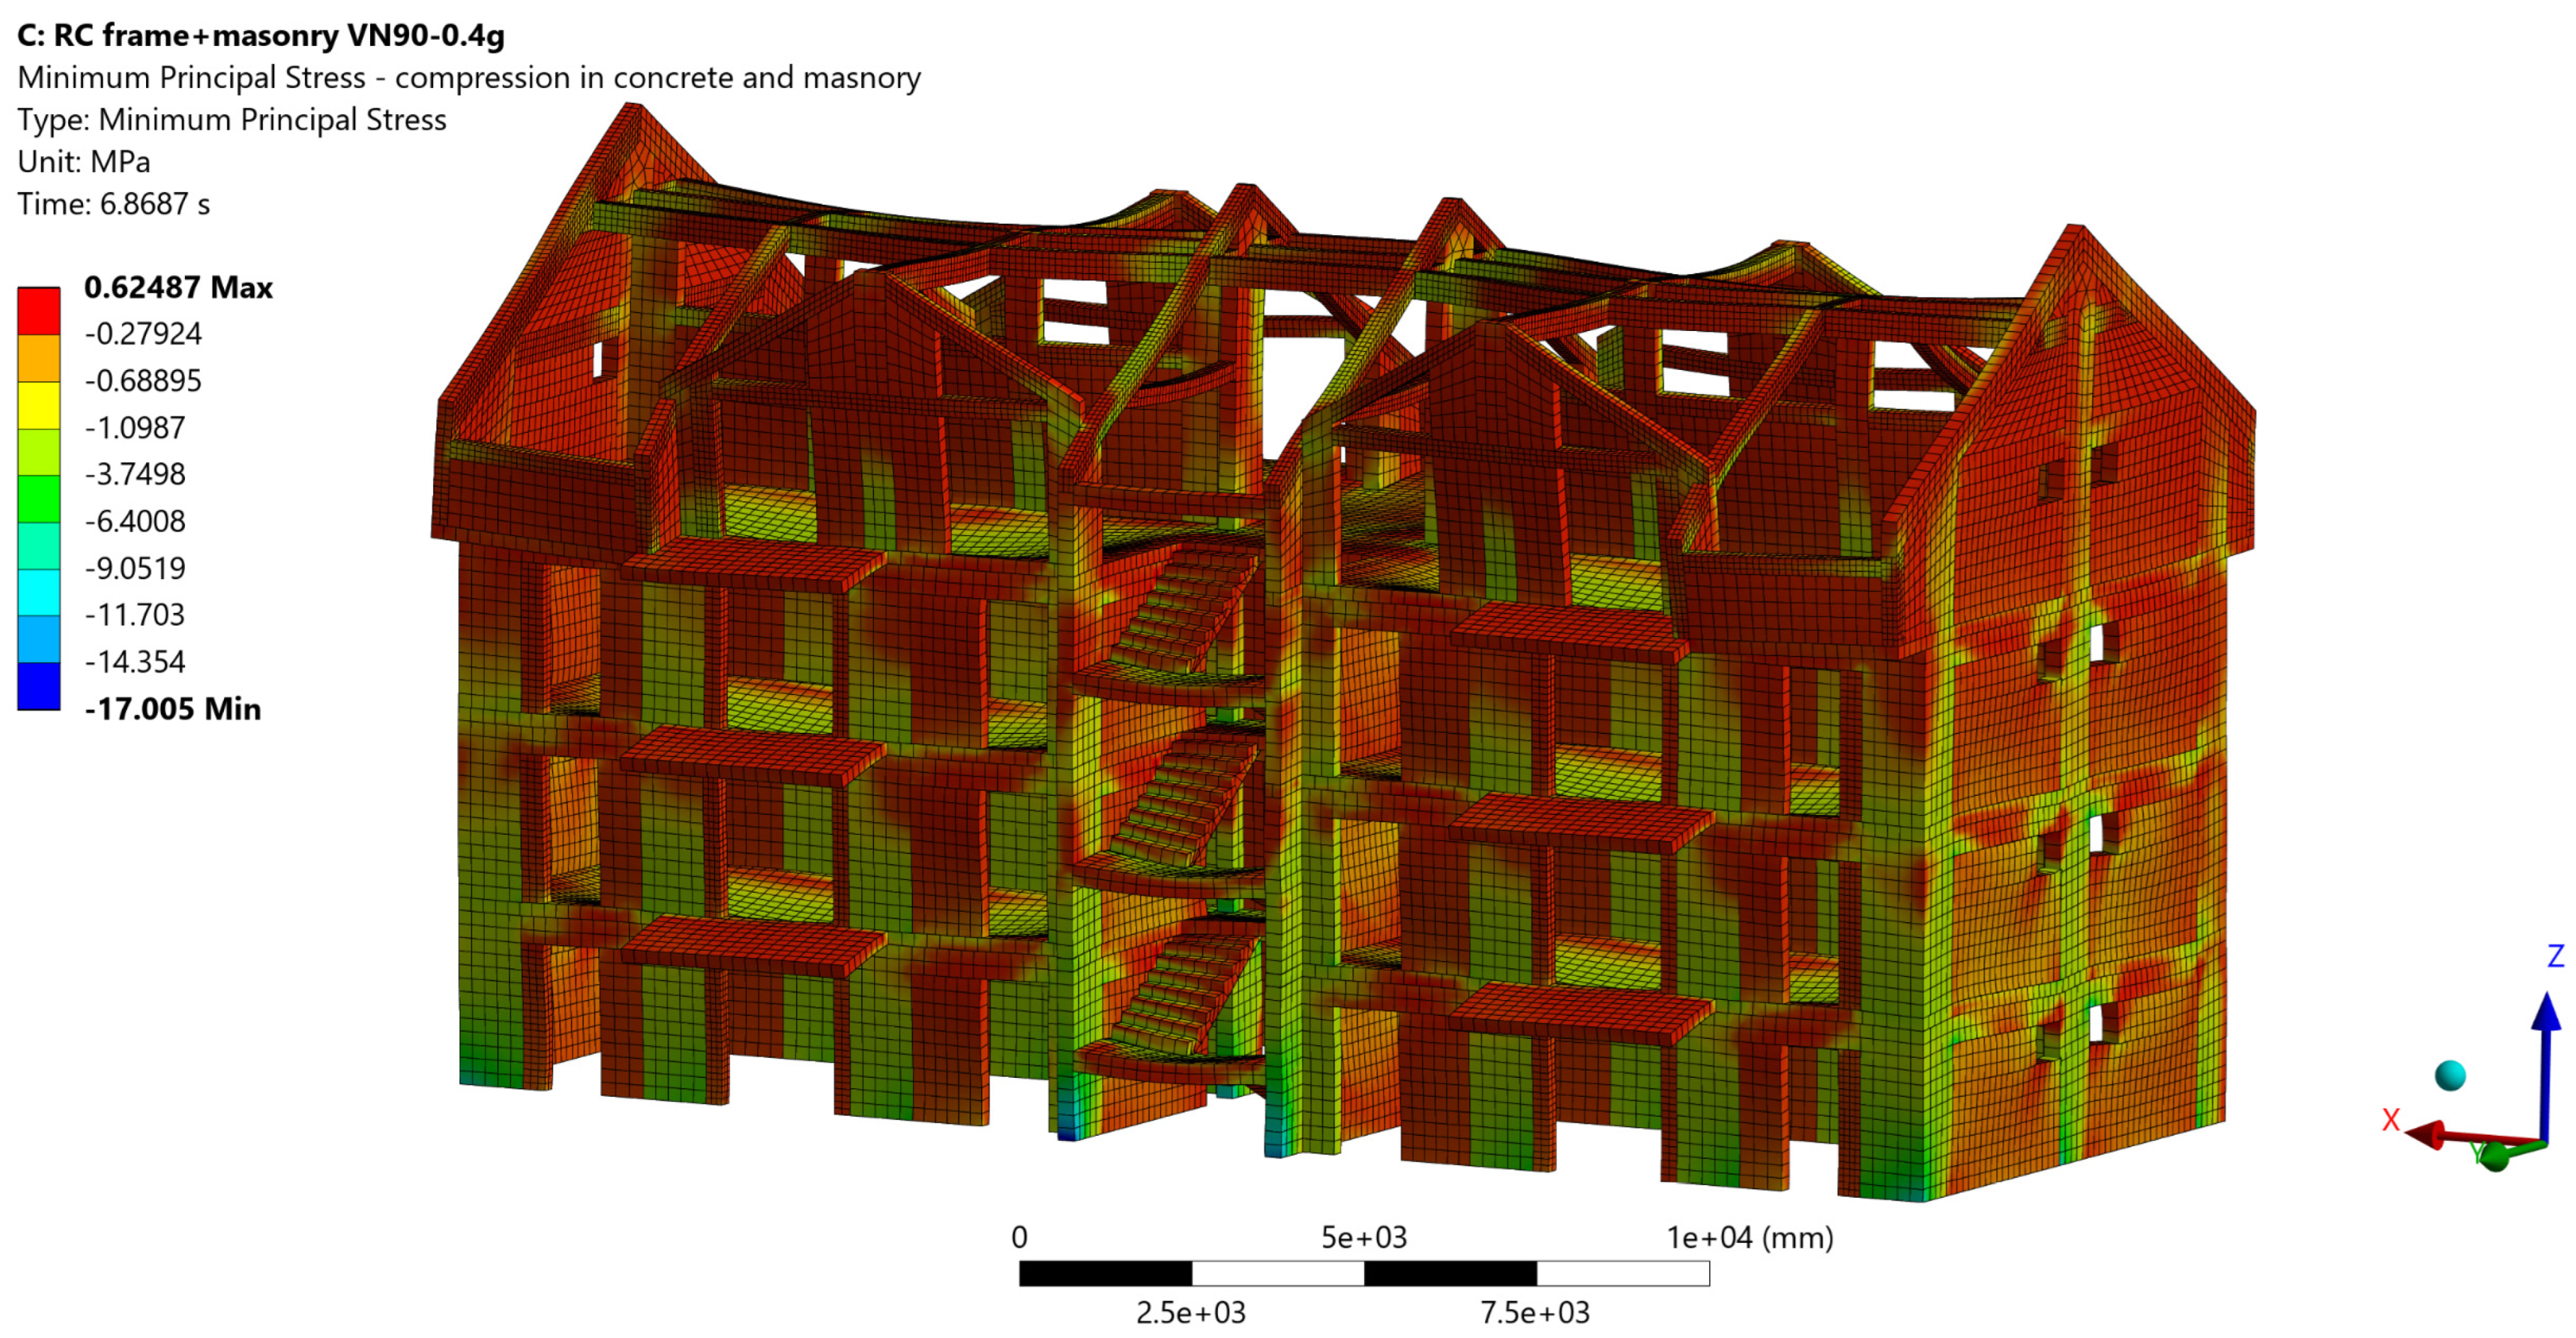
Local response was assessed using stress and strain-type field outputs extracted from the 3D solid FE models. For concrete and masonry, the principal-stress fields were used to separate tension- and compression-dominated regions. Here, the maximum principal stress σ 1 is used as a practical indicator for regions where tensile cracking may develop when σ 1 > 0 , while the minimum principal stress σ 3 is used as an indicator for compression-dominated regions when σ 3 < 0 . Note that σ 1 is the largest principal value and may remain negative in fully compressive stress states; therefore, tensile regions are identified only where σ 1 becomes positive.
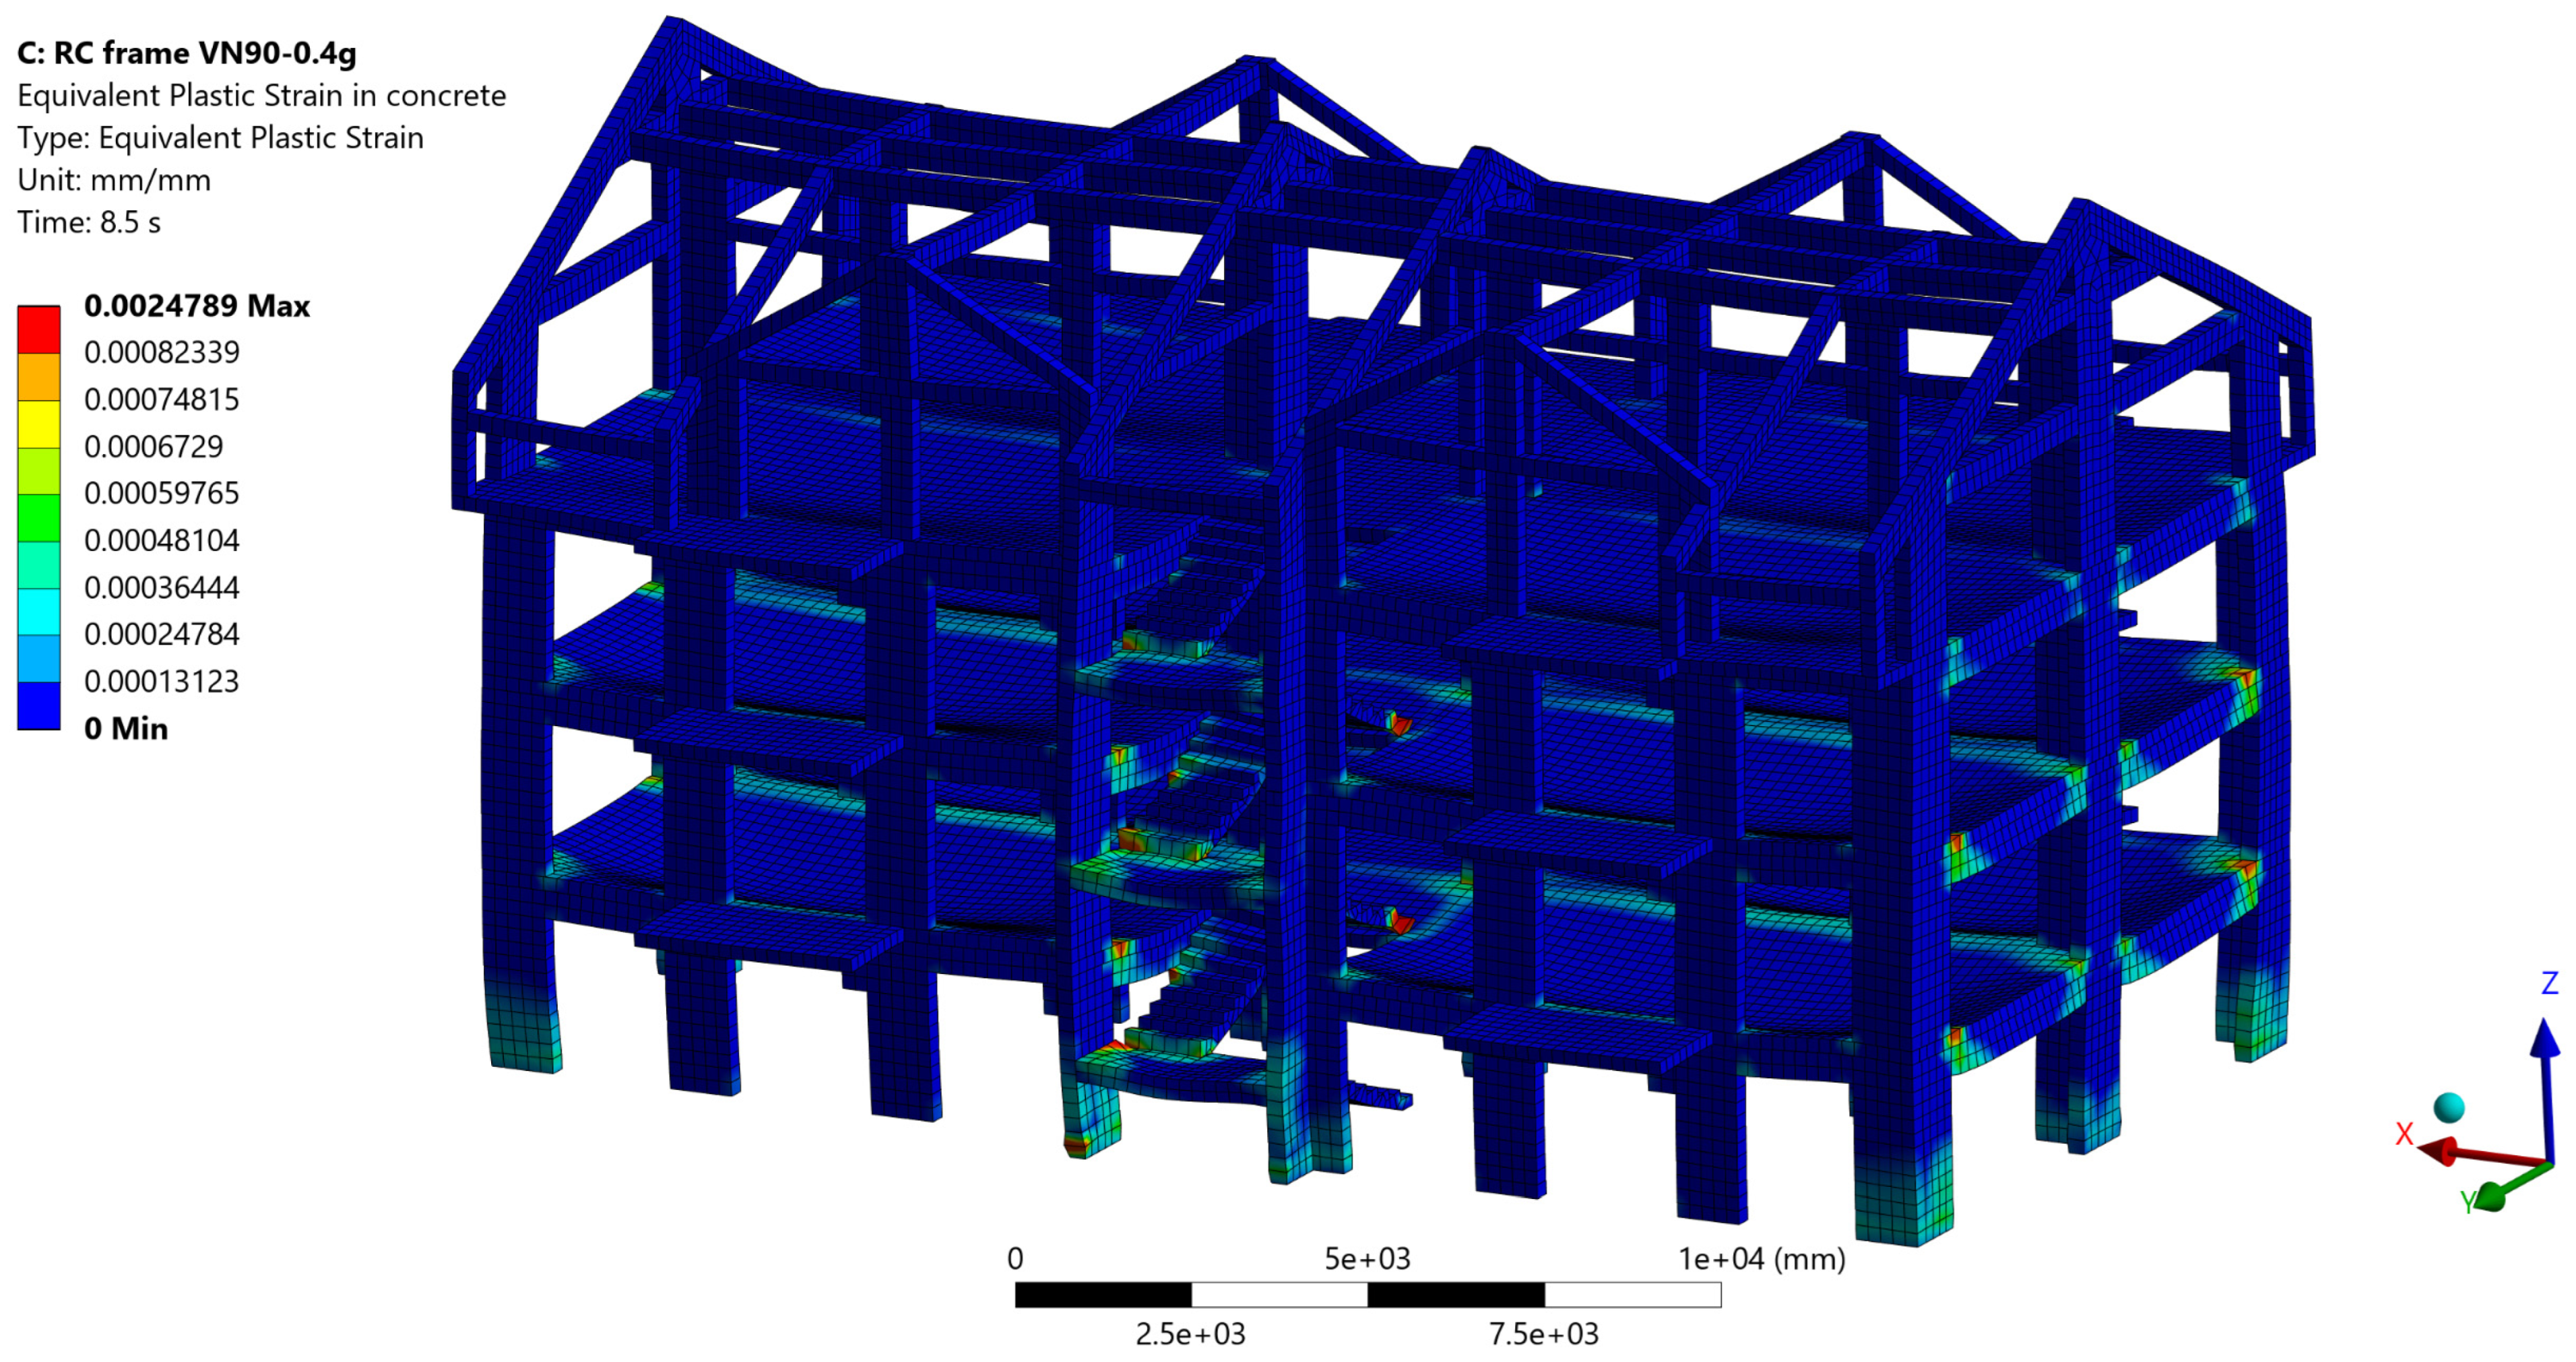
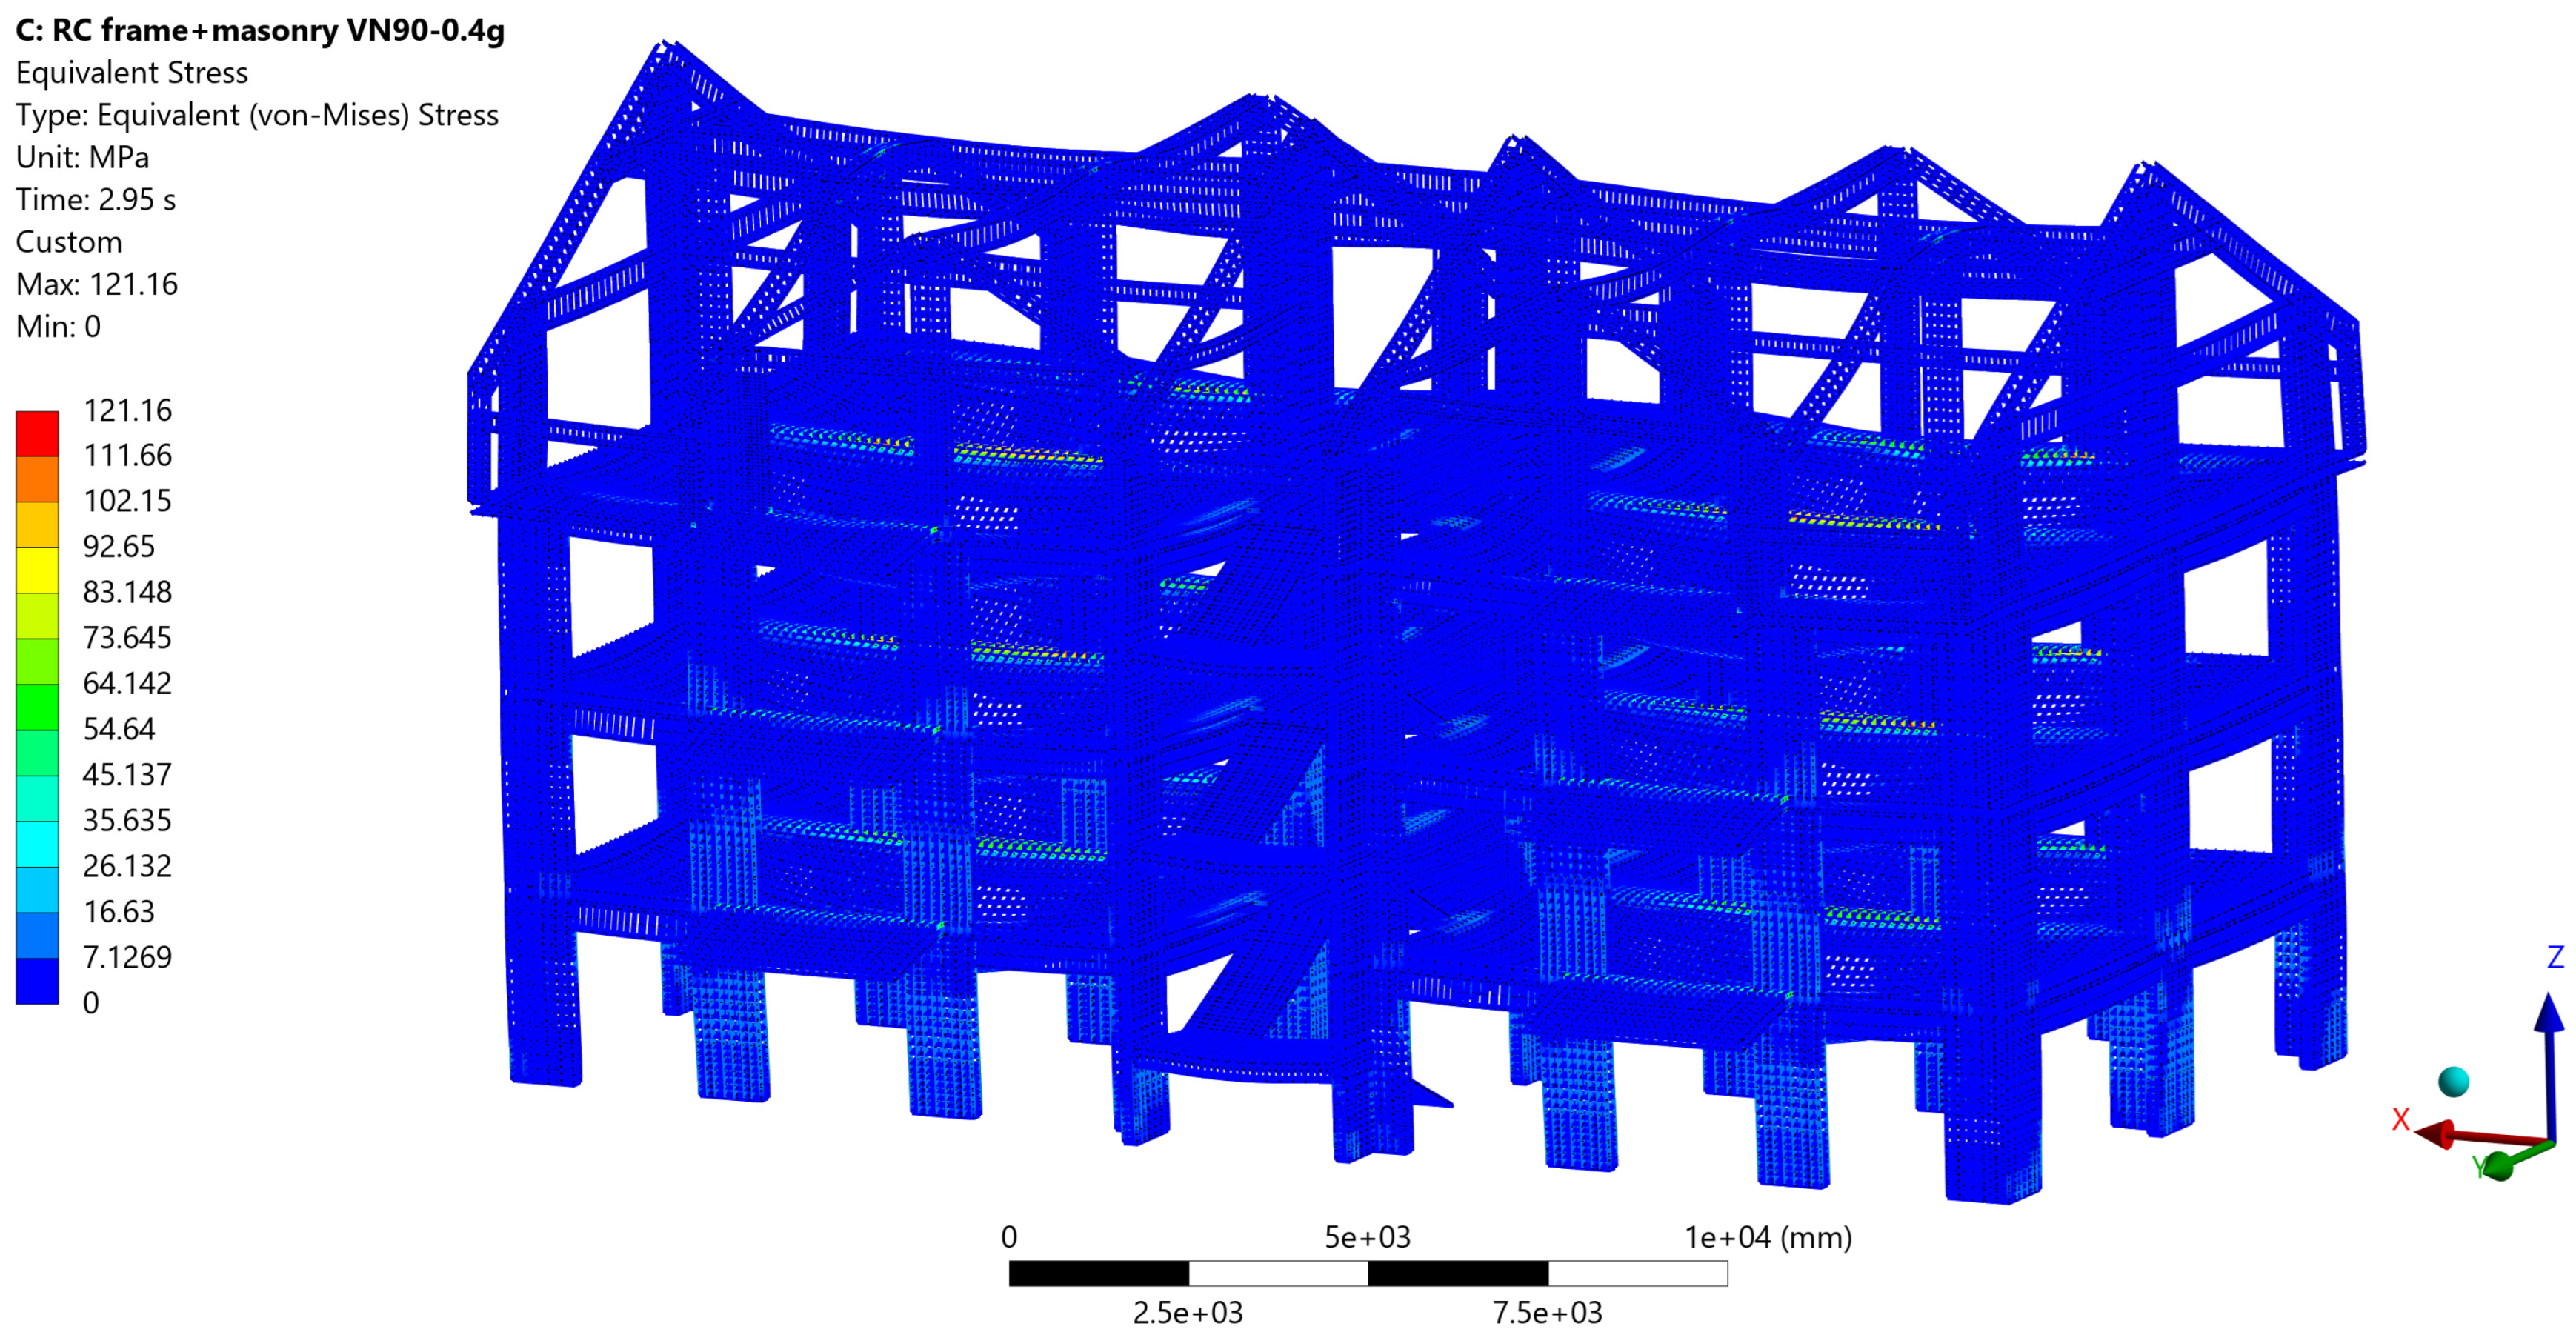
For reinforced concrete members, inelastic demand was tracked using the ‘Equivalent Plastic Strain’ field in the concrete solids. For reinforcement, steel demand was evaluated using the ‘Equivalent (von Mises) Stress’ in the rebar domains, in line with J2 plasticity, and directly comparable to the steel yield strength f y . Accordingly, the contour plots are used here to identify qualitative demand patterns and relative concentration zones, rather than to infer validated crack paths or discrete local failure mechanisms.
For clarity, the contour plots are shown for the VN90 case, which produced the largest global response measures within the analysed scaled suite at a g = 0.40   g . The figures should therefore be interpreted as illustrative worst-case results for the adopted comparative framework, while the other records remain represented through the peak summaries reported in Table 9. In this way, VN90 is used to illustrate spatial patterns, while VN77 and TK2023 remain covered through global extremes.
For each field quantity, the contour snapshot was taken at the time instant when that specific quantity reaches its peak. Therefore, the ‘Maximum Principal Stress’ contour is extracted at the time when the maximum tensile principal stress peaks, while the ‘Minimum Principal Stress’ contour is extracted at the time when the most negative compressive principal stress occurs. The same approach is used for equivalent plastic strain and for rebar von Mises stress. This avoids mixing non-synchronous maxima and keeps each map physically consistent.
Figure 19, Figure 20, Figure 21 and Figure 22 show that positive σ 1 values (tension) are limited and localised, with peak values (up to about 3 MPa), whereas σ 3 reaches markedly higher magnitudes in compression (up to about 25 MPa in the bare RC frame). In many zones, σ 1 remains negative, indicating a fully compressive stress state.
In the RC + M configuration, the compressive principal stress field suggests engagement of the masonry panels in the transversal direction, with compression trajectories qualitatively consistent with a strut-like in-plane response. Tensile stress indicators in masonry are concentrated mainly around openings and near panel corners, where the stress field changes more abruptly (Figure 19, Figure 20, Figure 21 and Figure 22).
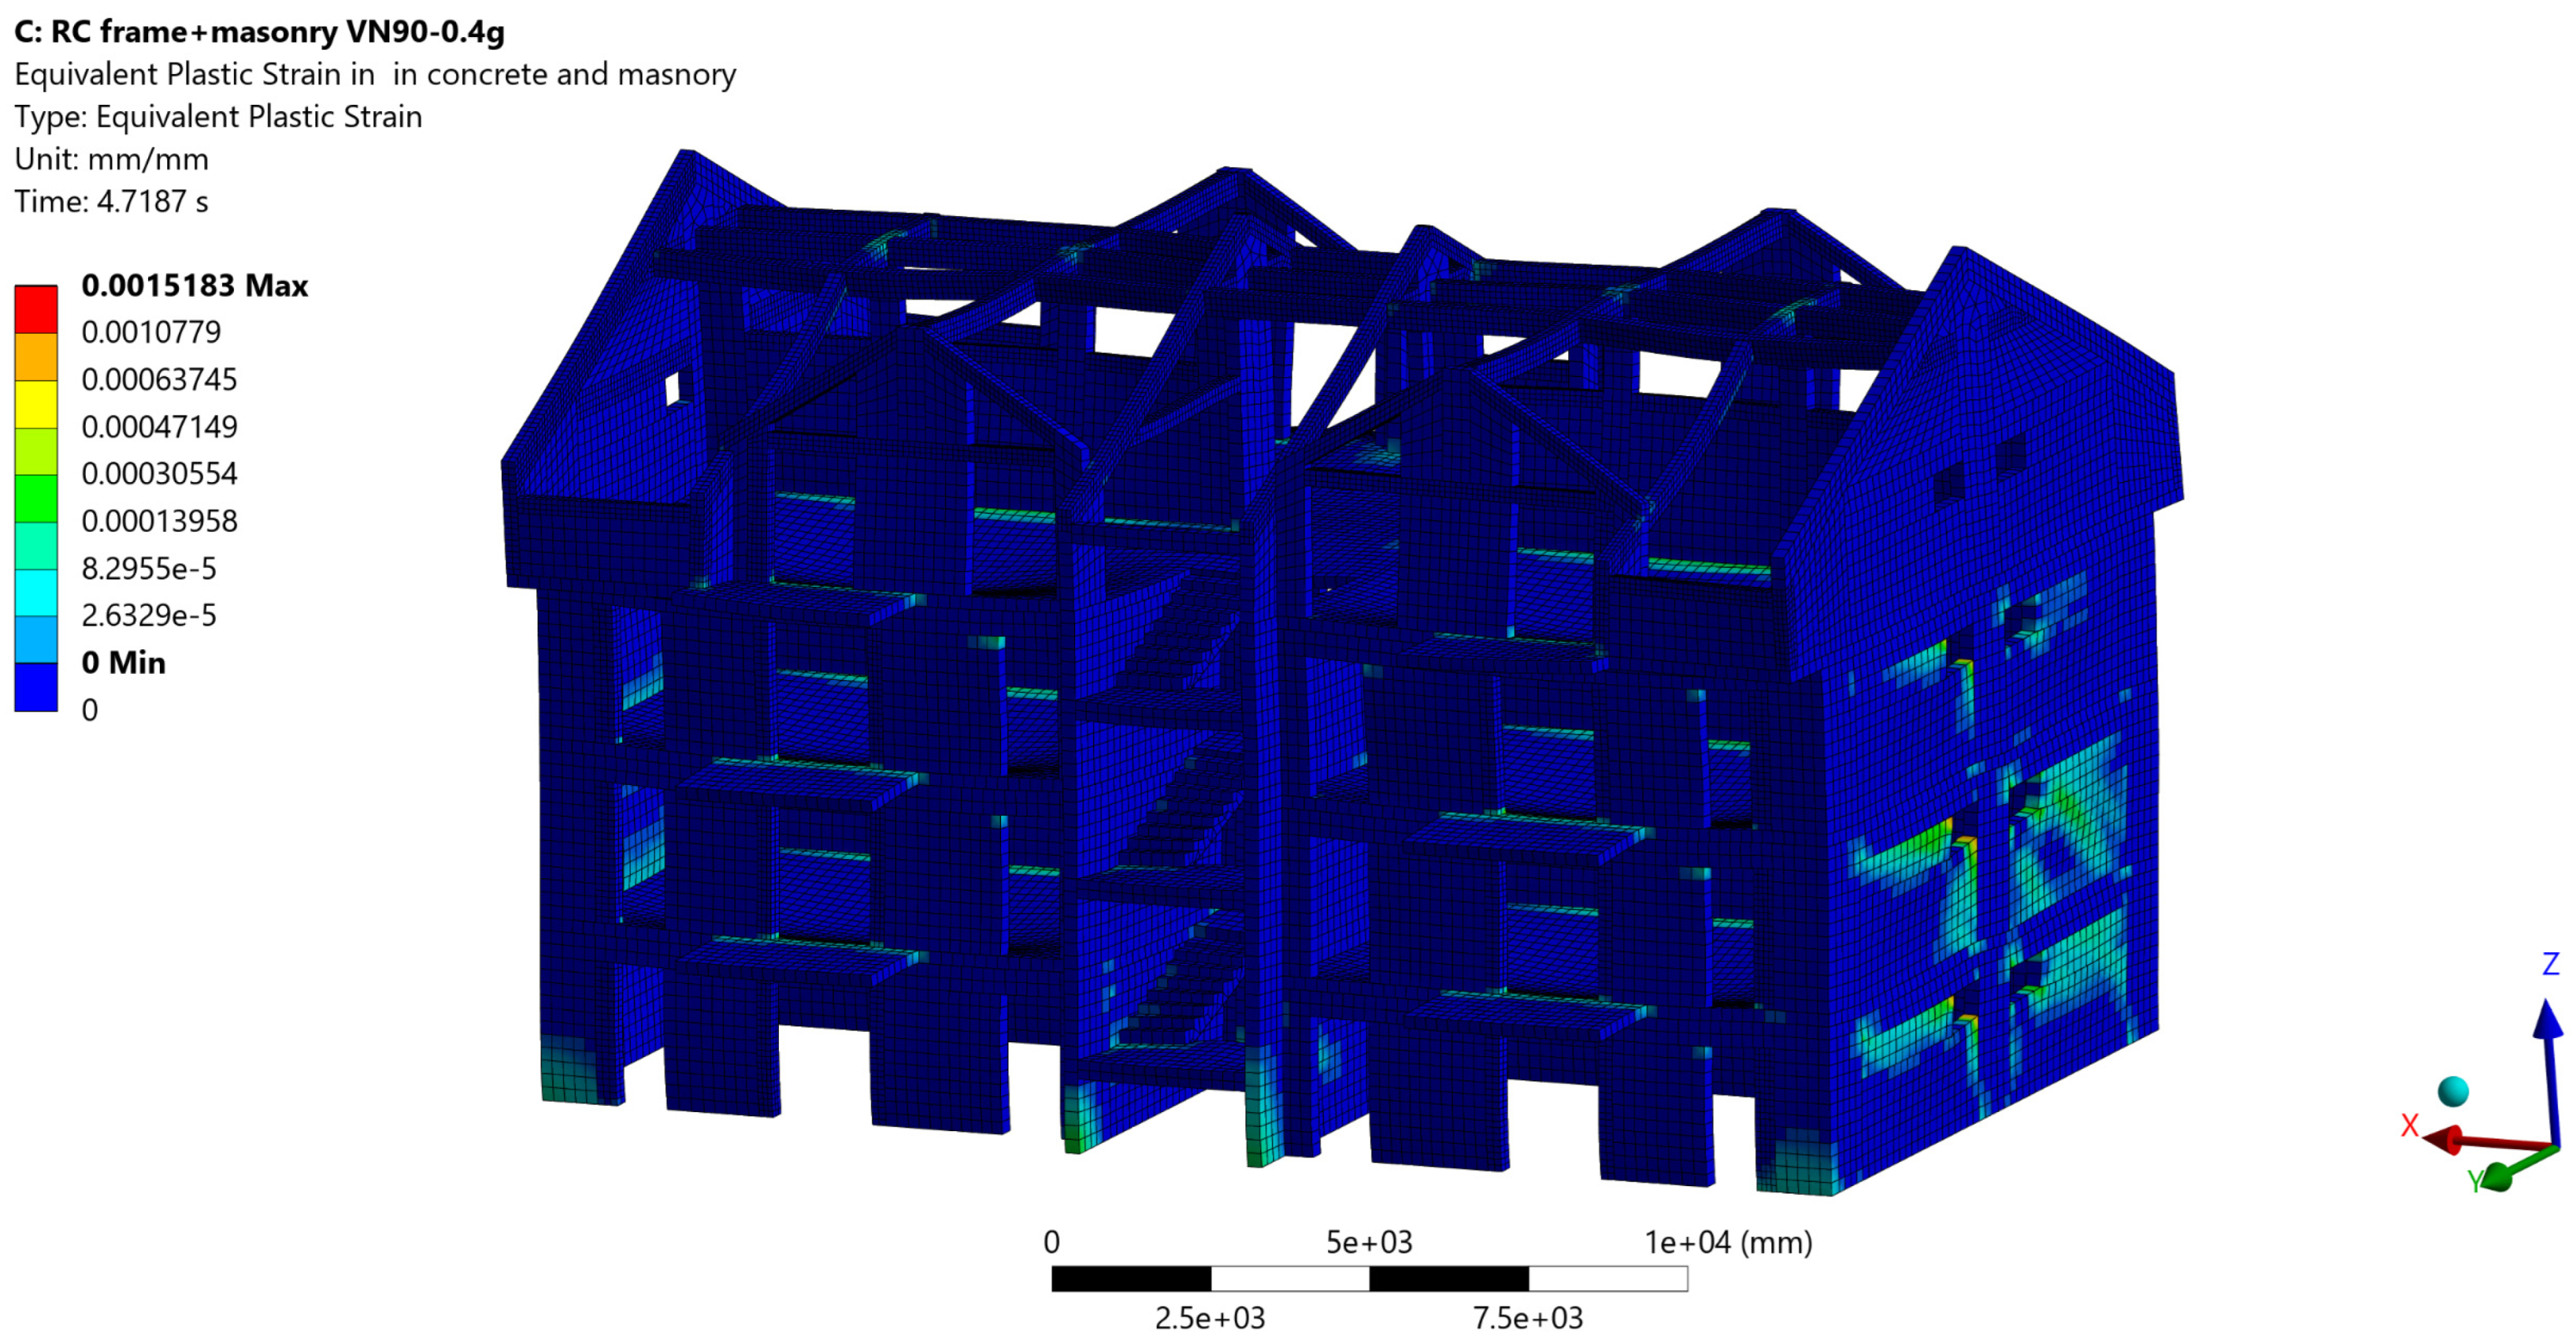
Figure 23 and Figure 24 show that equivalent plastic strain concentrations are more pronounced in the bare RC frame than in the infilled model, which suggests the larger drift demand of the bare RC configuration. In the RC frame, equivalent plastic-strain indicators are concentrated mainly at the base of columns, especially for perimeter columns, and near beam ends adjacent to beam–column joints. Localised concentrations also appear in the staircase zone, at the connections between landings and adjacent RC members, where stiffness discontinuities and force transfer details amplify local demand (Figure 23 and Figure 24).
In the RC + M model, plastic strain in concrete is generally reduced, while inelastic indicators in masonry concentrate around openings and their corners, along infill-to-frame boundary regions in the transversal direction, and near the base storey. These zones are qualitatively compatible with increased local demand near geometric discontinuities and interface transfer regions. (Figure 23 and Figure 24).
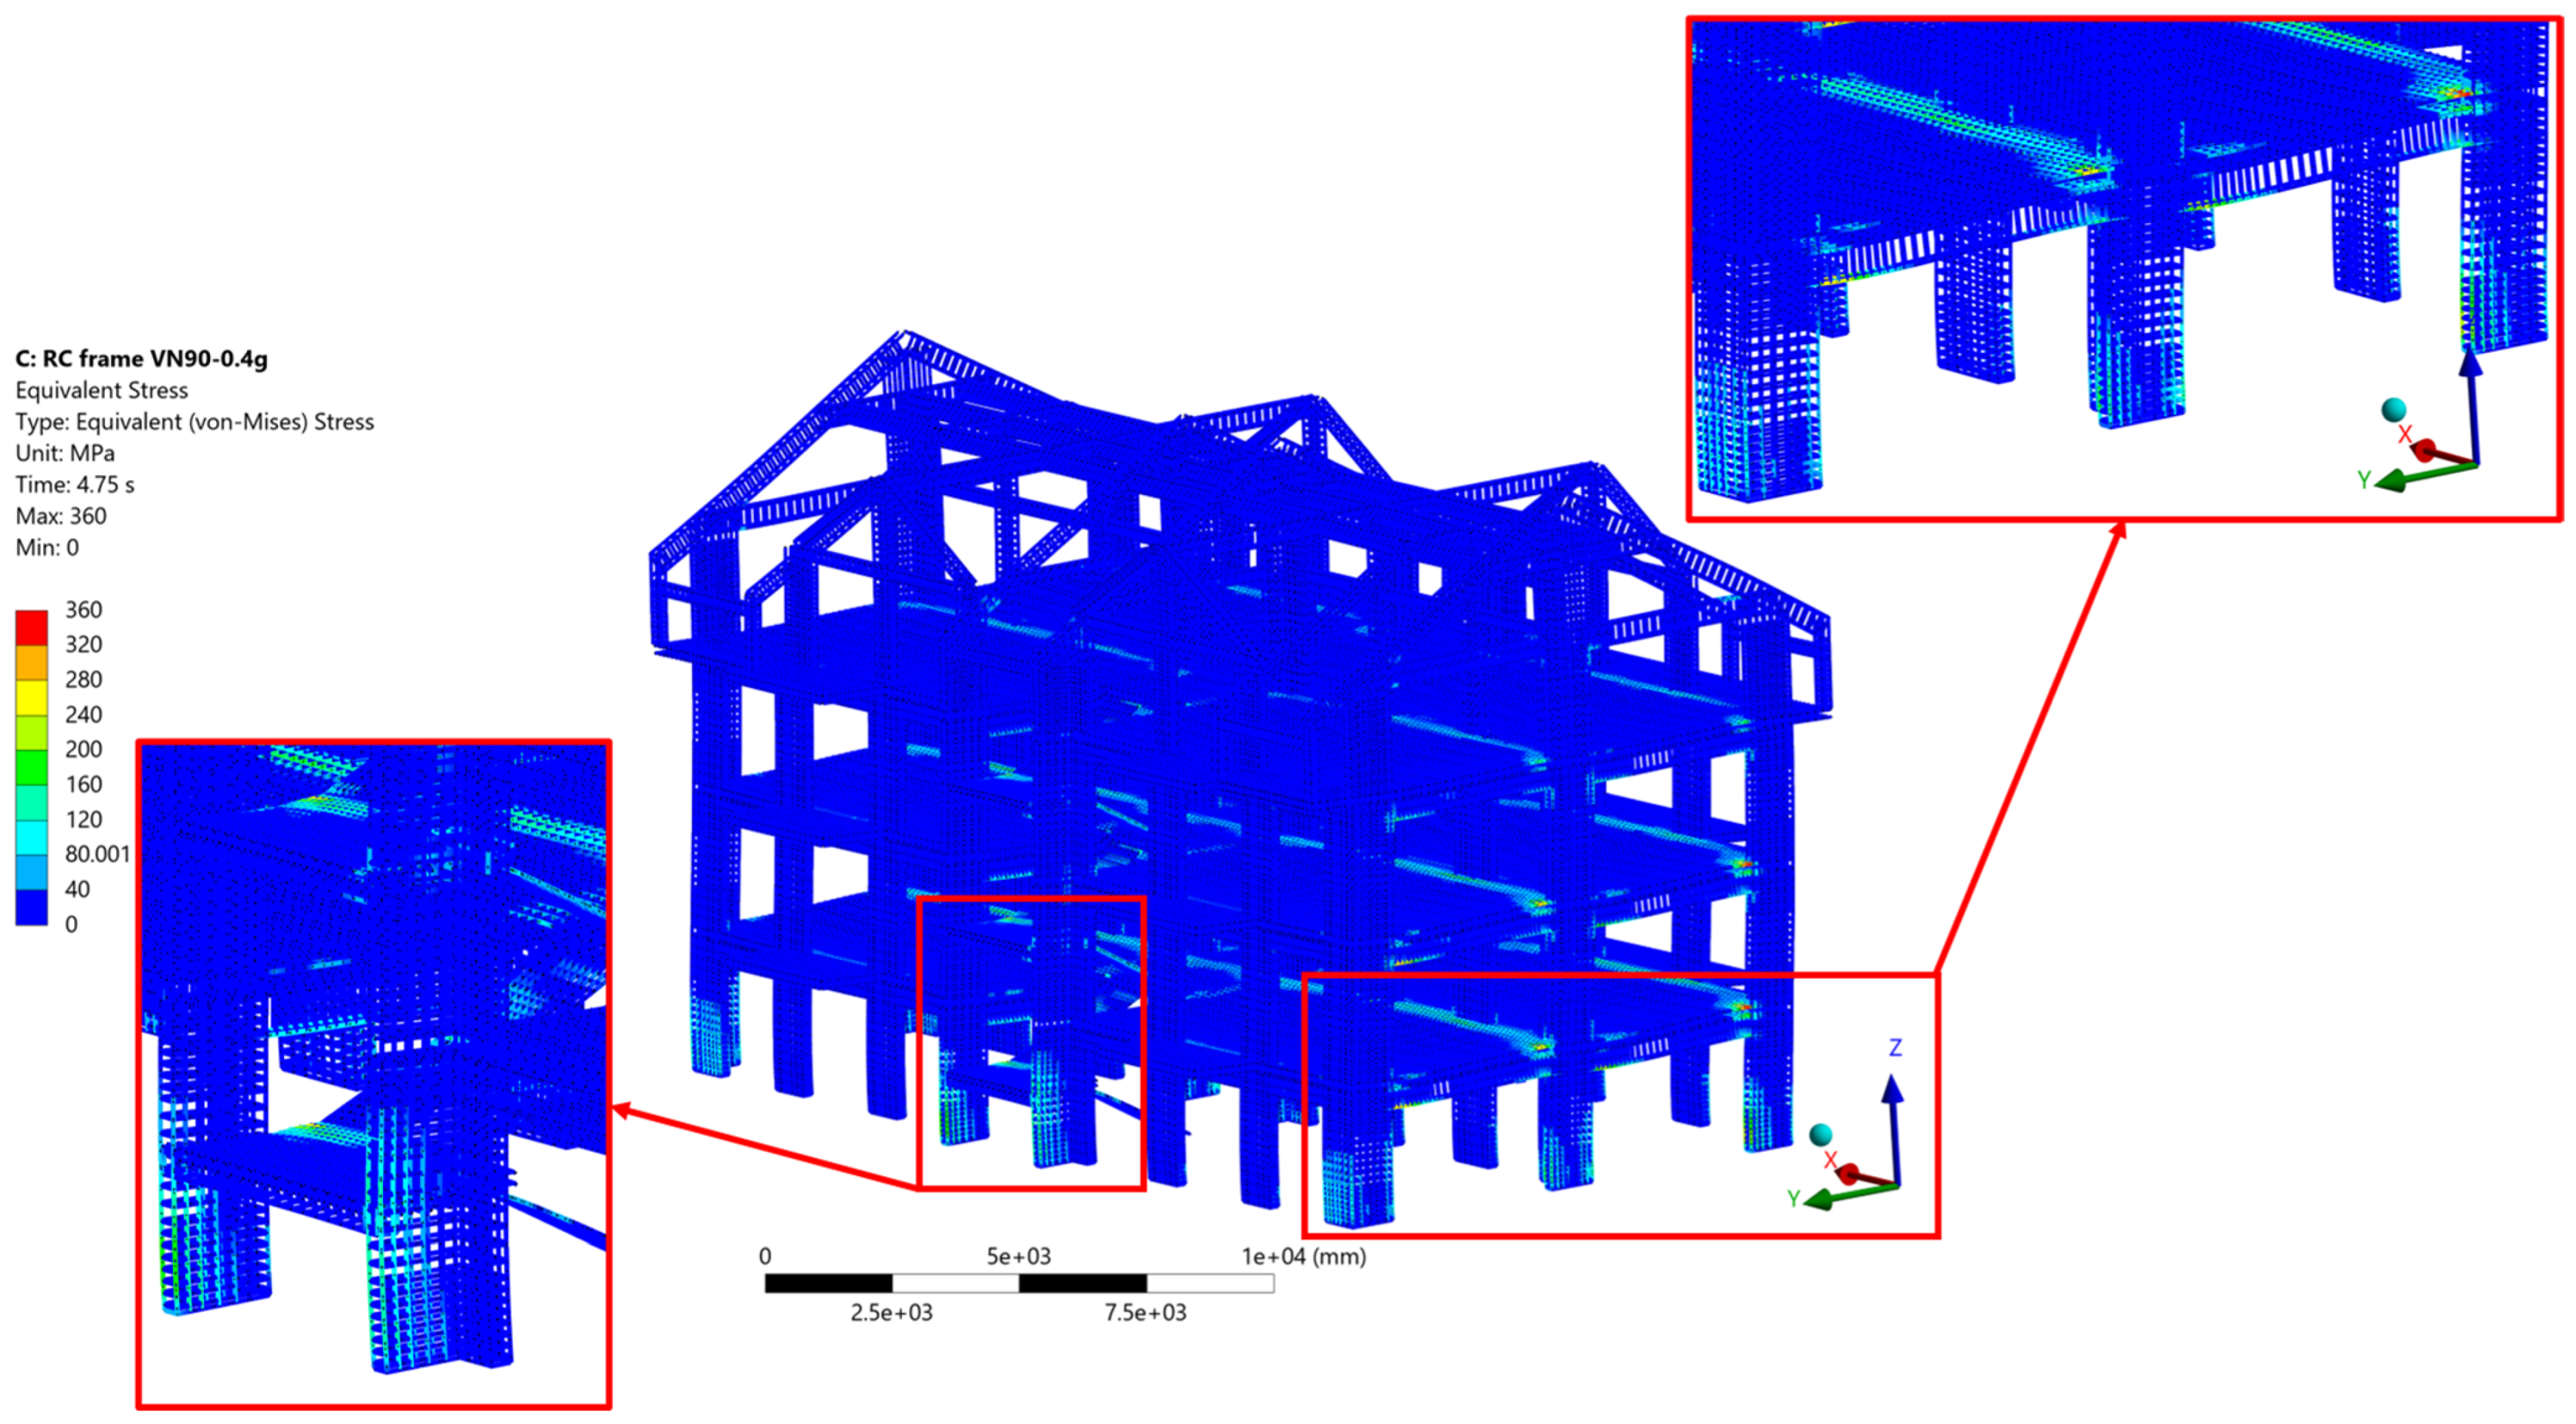
Figure 25 and Figure 26 show that the reinforcement von Mises stress in the bare RC frame reaches about 360 MPa, close to the yielding range of the PC52 steel.
The highest steel-stress indicators are observed in (i) the longitudinal reinforcement at beam ends adjacent to columns, (ii) the extreme bars at the base of columns, and (iii) the staircase region, where landings connect into the surrounding frame and local force transfer is intensified (Figure 25 and Figure 26). This spatial pattern may be influenced by the torsional contribution identified in Mode 2, although the present model does not support a fully validated local damage interpretation. For the RC + M model, peak rebar stresses remain much lower (about 121 MPa), which is consistent with the reduced drift and reduced curvature demand in beams and columns under the same scaled intensity (Figure 25 and Figure 26).
Table 12 consolidates the extreme values across all three records. For the bare RC frame, peak tensile principal stress is about 2.8–3.345 MPa, peak compressive principal stress magnitude is about 20.55–25.28 MPa, peak equivalent plastic strain is about 0.0021–0.0025, and peak rebar von Mises stress is about 338–360 MPa. For RC + M, peak tensile principal stress is about 3.25–3.32 MPa, peak compressive principal stress magnitude is about 13.46–17.01 MPa, peak equivalent plastic strain is about 0.0011–0.0015, and peak rebar von Mises stress is about 121–127 MPa. These results are compatible with the global response metrics. Masonry infills reduce lateral deformation demand and, consequently, limit both concrete inelastic demand and reinforcement stress demand at the considered design-level intensity.

6. Discussion and Implications

The adopted intensity level a g = 0.40 g corresponds to the current design level for the investigated site to P100-1/2013. At this level, the analysed building satisfies the drift-based checks used in this study, with peak drift ratios remaining below the reference serviceability threshold θ a d m = 0.5 % . Under the present modelling assumptions, the results therefore indicate an acceptable global response of the analysed structure at the investigated intensity level. However, this should not be interpreted as a general statement that the building possesses a performance margin above the minimum requirements of the original code, because the present reassessment is based on a single intensity level, a limited comparative record set, fixed-base conditions, a bonded frame–infill interface, simplified constitutive laws, and no explicit treatment of soil–structure interaction or interface uncertainty. The results also indicate that the infills strongly influence stiffness and deformation demand at a g = 0.40 g . With infills included (RC + M), global drifts and reinforcement stresses remain comparatively low, whereas the bare-frame configuration (RC) becomes more clearly drift-governed, with localised inelastic demand at column bases and beam ends and higher steel stress demand in critical regions. Extrapolation to substantially higher intensity levels (e.g., 0.6 g and above) should be treated as qualitative in the present work, since such analyses were not performed. Even so, the observed demand concentration trends indicate likely zones of increased response at higher intensities, especially around openings, panel corners, RC end regions, and the staircase vicinity.
In the present study, the most restrictive requirement remains the global stiffness (drift) condition, which is also the response measure most sensitive to the presence of infills. At the same time, this beneficial contribution should be interpreted with appropriate caution in engineering practice, because the properties, continuity, and degradation mechanisms of masonry infills may vary substantially from one building to another. Therefore, for code-type verification of new RC frames, it remains prudent not to rely on infills as guaranteed primary lateral-resisting components. For the assessment of existing buildings, however, the present results show that infills can strongly modify the actual structural response and should be represented explicitly whenever their contribution is expected to be significant.

7. Limitations

The reported results should be interpreted within the adopted modelling assumptions. The base was idealised as fully fixed at the slab above the basement; soil–structure interaction and potential basement flexibility were not modelled. The frame–infill interface was idealised as bonded contact, reflecting the observed construction sequence of the case-study building. Even so, this assumption may overestimate the initial stiffness and modify local damage localization when compared with more compliant frictional, separating, or bond-degrading interfaces. Therefore, the RC + M results should be interpreted as a strongly engaged infill scenario, not as a general prediction for all masonry-infilled RC frames.
Concrete and masonry were represented using Drucker–Prager-type constitutive laws, while reinforcement was modelled with a multilinear isotropic hardening law. The concrete and masonry parameters were assigned from specified material classes and engineering assumptions suitable for building-scale nonlinear modelling; dedicated calibration from material or interface tests was not performed. In addition, the concrete–reinforcement interaction was idealised through embedded reinforcement with perfect bond, and no explicit bond–slip law was introduced. Accordingly, local bar slip, anchorage deterioration, and interface degradation effects were not represented explicitly. For these reasons, the reported local stress and plastic-strain fields should be interpreted as qualitative demand patterns rather than as validated predictions of explicit crack paths or discrete local failure modes. Rayleigh damping was kept constant during each nonlinear analysis, with one value assigned to the bare RC model and a different value assigned to the RC + M model. Although this distinction reflects the different global dynamic characteristics of the two configurations, the adopted damping formulation remains simplified and may not fully represent amplitude-dependent energy dissipation at larger damage levels. In addition, local stress and plastic-strain maps remain mesh-dependent to some extent; a more refined discretisation would be more appropriate for dedicated local sub-models, but this was outside the scope of the present full-building analysis.
The selected seismic input suite remains limited to three bidirectional record pairs, and one motion required a relatively large amplification factor to reach the adopted reference intensity. Therefore, the record-specific nonlinear results should be interpreted comparatively and scenario-wise, rather than as statistically robust estimates of structural demand. Within this limited suite, the main comparative trend remains stable, namely the systematic reduction in displacement-related demand in the infilled configuration, whereas the absolute response amplitudes and local inelasticity indicators remain record-dependent. No dedicated time-step sensitivity study or convergence-sensitivity study for local stress/plastic-strain peaks was carried out in the present revision, because such checks would require rerunning the full 3D nonlinear time-history analyses and were beyond the computational scope of this study. Finally, although the present 3D solid modelling framework can represent global three-dimensional response and qualitative stress redistribution within the masonry panels under bidirectional excitation, it was not calibrated or configured to predict brittle out-of-plane infill failure mechanisms explicitly, such as separation from the RC frame, local loss of support, rocking instability, or panel expulsion.

8. Conclusions

This study re-assessed an existing RC frame building designed according to P100-1/2006 by means of nonlinear three-dimensional solid finite-element models with explicit reinforcement. Two structural configurations were analysed: a bare frame (RC) and an infilled frame (RC + M), subjected to bidirectional time-history input from the Vrancea 1977, Vrancea 1990, and Türkiye 2023 earthquakes, scaled to the P100-1/2013 target spectrum for the investigated site.
The results show that masonry infills markedly increase the global stiffness of the building. The fundamental frequency increases from 4.4669 Hz for the bare frame to 5.8680 Hz for the infilled configuration, while the fundamental period decreases from 0.2239 s to 0.1704 s. For both models, the first mode is dominated by translation in the Y direction, the second mode is torsional, and the third mode is dominated by translation in the X direction. In the analysed case study, the presence of infills therefore has a major influence on the global dynamic properties of the structure.
Under the adopted bonded frame–infill interface idealisation, the infilled configuration shows substantially lower displacement-related demand than the bare-frame configuration. Peak roof displacements in the transversal direction decrease from 9.87 to 14.26 mm to 2.74–3.38 mm, while peak relative interstorey displacements decrease from 3.35 to 4.94 mm to 0.92–1.16 mm. The governing storey is typically located between S1 and S2, and the maximum drift ratio remains low, reaching about 0.173% in the most demanding bare-frame case. These results indicate that, for the analysed building, masonry infills can strongly improve stiffness and drift-sensitive global response.
The beneficial influence of infills is not uniform for all demand measures. Although the infilled model shows lower displacement demand and lower roof acceleration in the governing VN90 case, the peak base shear F y is slightly higher in the RC + M model for all three analysed records. This indicates that the increased stiffness provided by the infills reduces deformations but may also attract comparable or somewhat larger force demand. The bidirectional response remains predominantly translational, while the torsional component stays secondary and is consistently smaller in the infilled configuration.
The local response fields indicate different concentration patterns in the two models. In the bare frame, plastic-strain indicators are concentrated mainly at perimeter column bases and beam ends. In the infilled model, the highest local demand shifts towards masonry discontinuities around openings and panel corners, as well as towards the base storey and staircase region. These local fields should be interpreted as qualitative response indicators rather than as validated predictions of explicit crack paths or discrete local failure modes.
These conclusions apply in the current analysis framework, including fixed-base conditions, bonded frame–infill interface, Drucker–Prager-type constitutive laws for concrete and masonry, multilinear isotropic hardening for reinforcement, and constant Rayleigh damping with different values assigned to the RC and RC + M models. Accordingly, the RC + M results should be interpreted as a strongly engaged infill scenario for the investigated case study, not as a general prediction for all reinforced concrete frame buildings with masonry infills. For the assessment of existing buildings, however, the results show that masonry infills can significantly modify the actual seismic response and should therefore be considered explicitly whenever their contribution is expected to be relevant.

Supplementary Materials

The following supporting information can be downloaded at https://www.mdpi.com/article/10.3390/buildings16071392/s1, TK2023.xlsx—Time History acceleration Turkey 2023; VN1990.xlsx—Time History acceleration; VN1977.xlsx—Time History acceleration; Spectre.xlsx—Comparative Spectrum; TH-displacements.xlsx—Time History displacements response; TH-acceleration.xlsx—Time History acceleration response; Reaction.xlsx—Base reaction; Acceleration peak.xlsx—Peak Accelerations; stresses.xlsx—Maximum Principal Stresses; Displacements peak.xlsx—Maximum displacements.

Funding

This research received no external funding.

Data Availability Statement

Data is contained within the article or Supplementary Material.

Conflicts of Interest

The author declares no conflicts of interest.

References

  1. Fattal, G.; Simiu, E.; Culver, C. Observations on the Behavior of Buildings in the Romania Earthquake of March 4, 1977; National Bureau of Standards: Washington, DC, USA, 1977. [CrossRef]
  2. Mihail Ifrim Earthquake of March 4, 1977 in Romania-Damage and Strengthening of Structures. In Proceedings of the 3rd Canadian Conference on Earthquake Engineering, Montréal, QC, Canada, 4–6 June 1979; Canadian National Committee for Earthquake Engineering: Vancouver, BC, Canada, 1979; pp. 825–836.
  3. Sonmez, E.; Eryilmaz Yildirim, M.; Aydin, M.F.; Koroglu, F.B. Seismic Performance Assessment of Structural Systems in the Aftermath of the 2023 Kahramanmaraş Earthquakes: Observations and Fragility Analyses. Earthq. Spectra 2025, 41, 198–218. [Google Scholar] [CrossRef]
  4. Cilsalar, H.; Anil, O. Investigation of Seismic Collapse Performance of RC Frames with Strengthened Masonry Infill Walls under February 6, 2023 Earthquakes in Türkiye. Bull. Earthq. Eng. 2025, 23, 4499–4524. [Google Scholar] [CrossRef]
  5. Marinković, M.; Butenweg, C. Behaviour and Damage of Masonry Infill Walls during the Earthquake Sequence in Turkey 2023: What Can Be Done to Prevent Extensive Damage of Infilled RC Structures? In Proceedings of the 16th International Scientific Conference “Planning, Design, Construction and Building Renewal”, Novi Sad, Serbia, 16–17 November 2023; Departman za građevinarstvo i geodeziju, Fakulteta tehničkih nauka, Univerziteta u Novom Sadu: Novi Sad, Serbia, 2023. [Google Scholar]
  6. Kaushik, H.B.; Rai, D.C.; Jain, S.K. Code Approaches to Seismic Design of Masonry-Infilled Reinforced Concrete Frames: A State-of-the-Art Review. Earthq. Spectra 2006, 22, 961–983. [Google Scholar] [CrossRef]
  7. Dias-Oliveira, J.; Rodrigues, H.; Asteris, P.G.; Varum, H. On the Seismic Behavior of Masonry Infilled Frame Structures. Buildings 2022, 12, 1146. [Google Scholar] [CrossRef]
  8. Asteris, P.G.; Cotsovos, D.M.; Chrysostomou, C.Z.; Mohebkhah, A.; Al-Chaar, G.K. Mathematical Micromodeling of Infilled Frames: State of the Art. Eng. Struct. 2013, 56, 1905–1921. [Google Scholar] [CrossRef]
  9. Wang, B.; Guo, X.; Xuan, Y.; Fan, X.-Q.; Chen, B. The Effects of Infilled Walls on Seismic Performance of RC Frame Structures with Eccentrically Placed Open Corridor. Sustainability 2022, 14, 5299. [Google Scholar] [CrossRef]
  10. Pohoryles, D.A.; Bournas, D.A. A Unified Macro-Modelling Approach for Masonry-Infilled RC Frames Strengthened with Composite Materials. Eng. Struct. 2020, 223, 111161. [Google Scholar] [CrossRef]
  11. Angelucci, G.; De Luca, F.; De Risi, R.; Mollaioli, F.; Spacone, E. Simplified Model for the Seismic Performance of Masonry Infilled RC Buildings. Eng. Struct. 2025, 342, 120903. [Google Scholar] [CrossRef]
  12. Martinelli, E.; Lima, C.; De Stefano, G. A Simplified Procedure for Nonlinear Static Analysis of Masonry Infilled RC Frames. Eng. Struct. 2015, 101, 591–608. [Google Scholar] [CrossRef]
  13. Gentile, R.; Pampanin, S.; Raffaele, D.; Uva, G. Non-Linear Analysis of RC Masonry-Infilled Frames Using the SLaMA Method: Part 1—Mechanical Interpretation of the Infill/Frame Interaction and Formulation of the Procedure. Bull. Earthq. Eng. 2019, 17, 3283–3304. [Google Scholar] [CrossRef]
  14. Vahed, M.; Habibi, A. Seismic Evaluation of Set-Back RC Frames with and without Masonry Infill Walls. Earthq. Struct. 2025, 28, 173. [Google Scholar] [CrossRef]
  15. Falcão Moreira, R.; Varum, H.; Castro, J.M. Influence of Masonry Infill Walls on the Seismic Assessment of Non-Seismically Designed RC Framed Structures. Buildings 2023, 13, 1148. [Google Scholar] [CrossRef]
  16. Kong, J.; Su, Y.; Zheng, Z.; Wang, X.; Zhang, Y. The Influence of Vertical Arrangement and Masonry Material of Infill Walls on the Seismic Performance of RC Frames. Buildings 2022, 12, 825. [Google Scholar] [CrossRef]
  17. Messaoudi, A.; Chebili, R.; Mohamed, H.; Rodrigues, H. Influence of Masonry Infill Wall Position and Openings in the Seismic Response of Reinforced Concrete Frames. Appl. Sci. 2022, 12, 9477. [Google Scholar] [CrossRef]
  18. Lubrano Lobianco, A.; Del Zoppo, M.; Rainieri, C.; Fabbrocino, G.; Di Ludovico, M. Damage Estimation of Full-Scale Infilled RC Frames under Pseudo-Dynamic Excitation by Means of Output-Only Modal Identification. Buildings 2023, 13, 948. [Google Scholar] [CrossRef]
  19. Venghiac, V.-M.; Neagu, C.-P.; Taranu, G.; Rotaru, A. Time History Analyses of a Masonry Structure for a Sustainable Technical Assessment According to Romanian Design Codes. Sustainability 2023, 15, 2932. [Google Scholar] [CrossRef]
  20. Kallioras, S.; Pohoryles, D.A.; Bournas, D.; Molina, F.J.; Pegon, P. Seismic Performance of a Full-Scale Five-Story Masonry-Infilled RC Building Subjected to Substructured Pseudodynamic Tests. Earthq. Eng. Struct. Dyn. 2023, 52, 3649–3678. [Google Scholar] [CrossRef]
  21. EN 1998-1; Eurocode 8; Design of Structures for Earthquake Resistance—Part 1: General Rules, Seismic Actions and Rules for Buildings. European Committee for Standardization: Brussels, Belgium, 2004.
  22. P100-1/2006; Seismic Design Code—Part I: Design Provisions for Buildings. Ministry of Public Works and Territory Planning: Bucharest, Romania, 2006.
  23. Pavel, F. An Updated Perspective of the Impact of the 1940 Vrancea Earthquake on Design and Construction Practices in Romania. Buildings 2024, 14, 1152. [Google Scholar] [CrossRef]
  24. Sococol, I.; Mihai, P.; Toma, I.-O.; Olteanu-Donţov, I.; Venghiac, V.-M. Stress-Strain Relation Laws for Concrete and Steel Reinforcement Used in Non-Linear Static Analytical Studies of the Moment Resisting Reinforced Concrete (RC) Frame Models. Bull. Polytech. Inst. Iași Constr. Archit. Sect. 2021, 67, 17–29. [Google Scholar] [CrossRef]
  25. Olteanu, I.; Canarache, R.M.; Budescu, M. Case Study on Vulnerability Increase for a Reinforced Concrete Frame Structure. Math. Model. Civ. Eng. 2015, 11, 38–45. [Google Scholar] [CrossRef][Green Version]
  26. Ibrahim, A.R.; Makhloof, D.A.; Ren, X. Seismic Performance and Collapse Analysis of RC Framed-Wall Structure Excited with Turkey/Syria Destructive Earthquake. Structures 2024, 59, 105774. [Google Scholar] [CrossRef]
  27. P100-1/2013; Seismic Design Code-Part I-Design Provisions for Buildings. Ministry of Public Works and Territory Planning: Bucharest, Romania, 2013.
  28. Georgescu, E.-S.; Pomonis, A. Building Damage vs. Territorial Casualty Patterns during the Vrancea (Romania) Earthquakes of 1940 and 1977. In Proceedings of the 15th World Conference on Earthquake Engineering, Sociedade Portuguesa de Engenharia Sismica (SPES), Lisbon, Portugal, 24–28 September 2012. [Google Scholar]
  29. Bala, A.; Toma-Danila, D. The Strong Romanian Earthquakes of 10.11.1940 and 4.03.1977. Lessons Learned and Forgotten? In Proceedings of the Symposium Commemorating 75 Years from November 10, 1940 Vrancea Earthquake. The 1940 Vrancea Earthquake. Issues, Insights and Lessons Learnt; Radu, V., Constantin, I., Eds.; Springer: Cham, Switzerland; Bucharest, Romania, 2016; pp. 19–35. Available online: https://link.springer.com/book/10.1007/978-3-319-29844-3 (accessed on 26 December 2025).
  30. INFP. Bridging the Gap Between Seismology and Earthquake Engineering: From the Seismicity of Romania Towards a Refined Implementation of Seismic Action EN 1998-1 (2004) in Earthquake Resistant Design of Buildings (BIGSEES Project). Available online: http://bigsees.infp.ro/ (accessed on 26 December 2025).
  31. Bunea, G.; Atanasiu, G.M. Structural response analysis for RC frame structures under seismic action. Bull. Polytech. Inst. Jassy Constr. Archit. Sect. 2023, 68. [Google Scholar] [CrossRef]
  32. Georgescu, E.-S.; Steinbrueck, K. New Archival Evidence on the 1977 Vrancea, Romania Earthquake and Its Impact on Disaster Management and Seismic Risk. In Seismic Hazard and Risk Assessment; Springer: Cham, Switzerland, 2018. [Google Scholar]
  33. NP 007-97; Design Code for Reinforced Concrete Frame Structures. Ministry of Public Works and Territory Planning: Bucharest, Romania, 1997.
  34. STAS 10107/0-90; Civil and Industrial Buildings—Design and Detailing of Concrete, Reinforced Concrete and Prestressed Concrete Structural Elements. Ministry of Public Works and Territory Planning: Bucharest, Romania, 1990.
  35. Engineering Strong Motion Database ESM. Available online: https://esm-db.eu/processing/select (accessed on 11 March 2026).
  36. Hussaini, S.S.; Karimzadeh, S.; Rezaeian, S.; Lourenço, P.B. Broadband Stochastic Simulation of Earthquake Ground Motions with Multiple Strong Phases with an Application to the 2023 Kahramanmaraş, Turkey (Türkiye), Earthquake. Earthq. Spectra 2025, 41, 2399–2435. [Google Scholar] [CrossRef]
Figure 1. Partially collapsed reinforced concrete apartment buildings with masonry infill walls, Gaziantep, Türkiye, February 2023.
Buildings 16 01392 g001
Figure 2. Partial collapse of reinforced concrete buildings in Bucharest during the 1977 Vrancea earthquake (a)—general view of failure of Wilson apartment building, (b)—general view of the collapse of the multi-story Continental building before removal of the wreckage [1].
Buildings 16 01392 g002
Figure 3. Construction stages of the RC frame building (a)—slab and beam reinforcement; (b,c)—erection of RC frames and masonry infills; (d)—installation of the timber roof structure.
Buildings 16 01392 g003
Figure 4. Typical floor formwork plan with beam and slab layout.
Buildings 16 01392 g004
Figure 5. Transversal section.
Buildings 16 01392 g005
Figure 6. Scaled horizontal acceleration time histories of the selected records: Vrancea 1977 (top), Vrancea 1990 (middle), and 2023 Türkiye (bottom). For each event, the N–S component is shown on the left and the E–W component on the right, after scaling to the P100-1/2013 target elastic spectrum ( a g = 0.40 g, T c = 1.0 s).
Buildings 16 01392 g006
Figure 7. 5%-damped elastic response spectra of the selected and scaled records compared with Romanian code spectra: (a) E–W component applied along the global X axis (longitudinal direction of the model); (b) N–S component applied along the global Y axis (transversal direction of the model).
Buildings 16 01392 g007
Figure 8. Geometry of the three-dimensional FE models used in ANSYS: (a) discrete reinforcement layout for RC members, modelled as embedded bar reinforcement; (b) concrete solids for beams, columns, slabs, and stairs (bare-frame configuration); (c) complete infilled-frame model, including the RC frame and masonry infill panels.
Buildings 16 01392 g008
Figure 9. Three-dimensional FE models used in ANSYS and corresponding mesh discretization: (a) bare RC frame; (b) RC frame with masonry infill panels.
Buildings 16 01392 g009
Figure 10. FE model showing the global coordinate system and the marked points used to extract transversal (Y) displacements and accelerations.
Buildings 16 01392 g010
Figure 11. First three vibration mode shapes (total deformation) from the modal analysis: bare RC frame and RC frame with masonry infills, RC + M.
Buildings 16 01392 g011
Figure 12. Transversal (Y) displacement contours (Directional Deformation, u Y ) at the time of peak roof response for the bare RC frame–VN90 scenario.
Buildings 16 01392 g012
Figure 13. Transversal (Y) displacement contours (Directional Deformation, u Y ) at the time of peak roof response for the RC frame with masonry infills, RC + M–VN90 scenario.
Buildings 16 01392 g013
Figure 14. Peak floor displacements along the transversal direction (Y) for RC and RC + M under VN77, VN90, and TK2023, reported at levels B, S1, S2, S3, and roof R; inset shows the monitoring points and the global coordinate system.
Buildings 16 01392 g014
Figure 15. Directional displacement in Y direction: (a) RC frame VN90; (b) RC frame + masonry (VN90).
Buildings 16 01392 g015
Figure 16. Roof displacement time histories along Y (Dy4) for the bare RC frame (left column) and RC + M (right column) under VN77, VN90, and TK2023 (0.4 g scaled).
Buildings 16 01392 g016
Figure 17. Roof acceleration time histories along the transversal direction (Ay4, Y) for the bare RC frame and the RC frame with masonry infills (RC + M) under VN77, VN90, and TK2023 (0.4 g scaled).
Buildings 16 01392 g017
Figure 18. Base shear–roof displacement hysteresis loops in the transversal direction: F y (base reaction) versus Dy4 (roof displacement along Y).
Buildings 16 01392 g018
Figure 19. Maximum principal stress in concrete elements RC frame model, VN90-0.4 g scenario.
Buildings 16 01392 g019
Figure 20. Maximum principal stress in concrete and masonry elements RC frame + masonry model, VN90-0.4 g scenario.
Buildings 16 01392 g020
Figure 21. Minimum principal stress in concrete elements RC frame model, VN90-0.4 g scenario.
Buildings 16 01392 g021
Figure 22. Minimum principal stress in concrete and masonry elements RC frame + masonry model, VN90-0.4 g scenario.
Buildings 16 01392 g022
Figure 23. Equivalent plastic strain in concrete elements RC frame model, VN90-0.4 g scenario.
Buildings 16 01392 g023
Figure 24. Equivalent plastic strain in concrete and masonry elements RC frame + masonry model, VN90-0.4 g scenario.
Buildings 16 01392 g024
Figure 25. Equivalent von Mises stress in reinforcement (steel rebars) RC frame model, VN90-0.4 g scenario.
Buildings 16 01392 g025
Figure 26. Equivalent von Mises stress in reinforcement (steel rebars) RC frame + masonry model, VN90-0.4 g scenario.
Buildings 16 01392 g026
Table 1. Materials and components in the original building (as designed).
Subsystem/ComponentMaterial (As Specified)Structural Role in Original Design Model
Beams, columns, slabs, stairsReinforced concrete, class C16/20Primary lateral and gravity system
ReinforcementSteel types PC52-Ø22, Ø16
and OB37–Ø8, Ø10
Reinforcement of RC members
Foundations Reinforced concreteGravity and seismic load transfer to soil
Exterior infill/envelope walls25 cm thick hollow ceramic masonry blocks + 5 cm external thermal insulationNon-structural in original seismic model (gravity load only)
Interior partitionsMasonry partitions and gypsum-board walls (1 cm) on cold-formed steel studs with mineral wool infillNon-structural in original seismic model (gravity load only)
RoofTimber pitched roof (rafters, purlins, boarding) supported by RC ring beamsGravity system; limited in-plane diaphragm action
Table 2. Summary of the earthquake scenarios considered in the study.
Earthquake ScenarioDateMagnitudeSeismotectonic TypeSelected Role in the AnalysisMain Relevance to the Study
Vrancea 1977 [35]4 March 1977 Mw 7.4Intermediate-depth Vrancea source Romanian reference motionBenchmark event for the governing seismic source of the case-study building
Vrancea 1990 [35]30 May 1990 Mw 6.9Intermediate-depth Vrancea source Additional Vrancea motionSource-consistent comparison within the same Romanian hazard environment
Türkiye 2023 [35,36]6 February 2023Mw 7.8Shallow-crustal strike-slip source Contrasting comparative motionExamination of response sensitivity to a different tectonic setting and waveform character
Table 3. Details of the raw ESM records and the final scaled inputs used in nonlinear time-history analysis.
RecordESM Event ID/
Station
Components Used in ModelEC8 Site ClassEpicentral Distance (km)Raw Δt (s)Final Δt in Analysis (s)Final Input Duration (s)Raw PGA X (g)Raw PGA Y (g)Final Scaled PGA X (g)Final Scaled PGA Y (g)Scale FactorAverage Misfit of Pair
[%]
Maximum Misfit of Pair
[%]
Vrancea, Romania 1977RO-1977-0001/A39–Bucharest-Building Research InstituteHNE → X, HNN → YC164.40.0050.0518.00.16970.19790.35320.38581.995.224.4
Vrancea, Romania 1990RO-1990-0003 A1856–IstritaHN2 → X, HN3 → YA78.80.0050.0515.00.01100.01920.31910.400320.656.326.9
Türkiye 2023INT-20230206_0000008/3138–Hassa HatayHNE → X, HNN → YB65.00.0050.0518.00.75950.90670.25820.40060.4423.321.0
Table 4. Comparison of the main linear-elastic modal characteristics of the bare RC frame in Robot and ANSYS.
QuantityRobotANSYS, 200 × 200 mm MeshDifference vs. RobotANSYS, 100 × 100 mm MeshDifference vs. Robot
f1 [Hz]4.17004.4669+7.1%4.4089+5.7%
T1 [s]0.2400.224−6.6%0.227−5.4%
f2 [Hz]4.97005.5851+12.4%5.4851+10.4%
T2 [s]0.2010.179−11.0%0.182−9.4%
f3 [Hz]5.70006.7955+19.2%6.6406+16.5%
T3 [s]0.1750.147−16.1%0.151−14.2%
Dominant Y modal mass contribution [%]75.6178.42+3.7%77.79+2.9%
Dominant X modal mass contribution [%]72.7276.38+5.0%73.15+0.6%
Table 5. Materials properties used in ANSYS.
PropertyConcrete (Drucker–Prager)Masonry Infill (Drucker–Prager)Reinforcement PC52 (MISO)Reinforcement OB37 (MISO)
Density ρ [kg/m3]2500160078507850
Young’s modulus E [GPa]282200200
Poisson s   ratio   ν [–]0.200.150.300.30
Bulk   modulus   K [GPa]15.5560.95238166.67166.67
Shear modulus G [GPa]11.6670.8695776.92376.923
Uniaxial compressive strength f c u [MPa]163
Uniaxial tensile strength f t u [MPa]1.80.3
Biaxial compressive strength f b c [MPa]205
Tensile yield strength f y , t [MPa]355255
Tensile   ultimate   strength   f u , t [MPa]510320
Plasticity modelDrucker–PragerDrucker–PragerMultilinear isotropic hardening Multilinear isotropic hardening
Table 6. Mass budget and modelling representation of permanent actions in the two numerical models.
Load ComponentBare RC ModelBare RC ModelRC + M ModelRC + M ModelHow It Was Defined in the Model
kg/m2kN/m2kg/m2kN/m2
Floor finishes600.60600.60Added at slab level as equivalent distributed mass and as uniform permanent pressure
Screed and levelling layers1801.801801.80Added at slab level as equivalent distributed mass and as uniform permanent pressure
Plaster/ceiling finishing600.60600.60Added at slab level as equivalent distributed mass and as uniform permanent pressure
Exterior and interior masonry walls not modelled explicitly2002.0000Included only in the bare RC model as equivalent slab-level mass and pressure, because walls were not represented explicitly
Masonry infill walls modelled explicitly as solids00explicitexplicitIn the RC + M model, wall self-weight and inertial mass were introduced directly through masonry solid elements, density ρ = 1600 kg/m3
Total slab-level equivalent permanent action5005.003003.00Same values applied both as distributed mass and as uniform permanent pressure in the gravity pre-step
Note: For the RC + M model, the masonry walls were not added again as slab-level equivalent mass, because they were represented explicitly by solid elements. For a 25 cm-thick masonry wall with density 1600 kg/m3 and storey height 2.85 m, the corresponding self-weight is approximately 1140 kg/m, i.e., 11.18 kN/m.
Table 7. Modal properties and translational mass participation (X and Y) for the bare RC frame and the RC frame with masonry infills (RC + M).
ModelModeFrequency, f
(Hz)
Period, T
(s)
Effective Mass X
(t)
Ratio XEffective Mass Y
(t)
Ratio Y
RC14.46690.22390.021.607 × 10−5939.350.784
RC25.58510.179029.060.0243.9574 × 10−33.3016 × 10⁻⁶
RC36.79550.1472914.910.7640.032.2394 × 10−5
RC + M15.86800.17040.021.9853 × 10−5945.160.776
RC + M26.94330.144063.410.0520.151.2567 × 10−4
RC + M37.56340.1322918.730.7542.9724 × 10−32.4390 × 10⁻⁶
Table 8. Peak displacements and interstorey drift increments along Y.
ModelRecord u r
(mm)
Δ m a x
(mm)
Governing Storey ( For   Δ m a x ) θ m a x = m a x 2850 θ m a x
(%)
θ a d m SLS
(%)
θ a d m ULS
(%)
RC + MVN772.740.92B–S1 or S1–S20.0003230.03230.52.5
RC + MVN903.381.16S1–S20.0004070.0407
RC + MTK20233.031.02S1–S20.0003580.0358
RCVN779.873.35S1–S20.0011750.1175
RCVN9014.264.94S1–S20.0017330.1733
RCTK20239.933.35S1–S20.0011750.1175
Note: θ a d m depends on the type of non-structural components; the conservative value θ a d m = 0.5 % is reported here.
Table 9. Compact summary of the peak bidirectional displacement response under simultaneous X–Y excitation, including maximum roof displacements, maximum relative interstorey displacements, edge-point transversal displacements at roof level ( Y 1 and Y 2 ), and roof torsional-response indicators.
RecordModel u X , m a x
[mm]
u Y , m a x
[mm]
Δ X , m a x
[mm]
Δ Y , m a x
[mm]
Y 1
[mm]
Y 2
[mm]
ϕ Z , m a x
[mrad]
η t
[%]
VN77RC + M1.972.741.490.922.432.350.0032.92
VN77RC4.179.870.573.358.678.140.0235.37
VN90RC + M1.703.382.091.162.982.90.0032.37
VN90RC5.3614.260.444.9412.2211.770.0193.16
TK2023RC + M1.633.031.621.022.682.840.0075.28
TK2023RC4.549.930.493.358.759.480.0317.35
Table 10. Peak floor accelerations along Y , A Y , m a x .
LevelRC + M–VN77RC + M–VN90RC + M–TK2023RC–VN77RC–VN90RC–TK2023
(mm/s2)(g)(mm/s2)(g)(mm/s2)(g)(mm/s2)(g)(mm/s2)(g)(mm/s2)(g)
Base0 00 00 000000 0
S1225 0.023600 0.0614110.0424650.04714580.1496330.065
S2445 0.0451300 0.1338780.09011540.11828840.29416160.165
S3620 0.0631803 0.18412060.12317050.17440720.41524500.250
R710 0.0722068 0.21113790.14120120.20548010.49029070.296
Table 11. Extreme base reaction resultants (support reactions) for each record (global system).
ComponentUnitsRC + M–VN77RC + M–VN90RC + M–TK2023RC–VN77RC–VN90RC–TK2023
M X kNm−34,143−39,318−30,861−36,287−42,265−32,540
M Y kNm23,054−21,085−19,46226,49336,99027,643
M Z kNm1205.31281.21425.6−3755.476432899.4
F X kN3725.7−3091.7−2942.24423.55393.44315.6
F Y kN−4825.95311.9−5397.74700.95197.6−5129.7
F Z kN18,13018,13018,13018,15518,15518,155
Table 12. Extreme values of maximum and minimum principal stress in concrete elements, equivalent von Mises stress in steel rebar reinforcements and equivalent plastic strain.
ModelScenarioMaximum Principal Stress
(Tension in Concrete)
Minimum Principal Stress
(Compression in Concrete)
Equivalent Plastic DeformationEquivalent von Mises Stress
(Steel Rebar Reinforcement)
(MPa)(MPa)(mm/mm)(MPa)
RC frameVN772.824.140.0025 − c357.88
VN903.34525.280.0025 − c360
TK20232.8120.550.0021 − c338
RC frame + masonryVN773.3213.460.0011 − m123.03
VN903.2517.0050.0015 − m121.16
TK20233.316.070.0014 − m127.25
Disclaimer/Publisher’s Note: The statements, opinions and data contained in all publications are solely those of the individual author(s) and contributor(s) and not of MDPI and/or the editor(s). MDPI and/or the editor(s) disclaim responsibility for any injury to people or property resulting from any ideas, methods, instructions or products referred to in the content.