Article

From Behavioral Characteristics to Spatiotemporal Structures: Identifying Urban Active-Healthy Walking Support Types and Their Environmental Determinants


1
School of Architecture and Urban Planning, Huazhong University of Science and Technology, Wuhan 430074, China
2
College of Horticulture & Forestry Sciences, Huazhong Agricultural University, Wuhan 430070, China
*
Author to whom correspondence should be addressed.
Buildings 2026, 16(6), 1182; https://doi.org/10.3390/buildings16061182
Submission received: 28 January 2026 / Revised: 21 February 2026 / Accepted: 22 February 2026 / Published: 17 March 2026

Abstract

From an active-health perspective, regular walking is a key pathway for mitigating chronic disease risks and promoting sustained health benefits. Existing studies have primarily assessed urban walkability using static or aggregated measures of walking intensity, which insufficiently capture the capacity of urban spaces to continuously support walking behavior over time. This study aims to identify urban walking support types by incorporating the temporal structure of walking behavior beyond intensity alone. Crowdsourced walking trajectory data are used to construct a multidimensional behavioral indicator system integrating walking intensity, temporal stability, and rhythmic characteristics over an annual period. An unsupervised clustering framework combining nonlinear dimensionality reduction and density-based clustering is applied to identify distinct walking support types, while interpretable machine-learning models are employed to examine the relative roles of built-environment factors in differentiating these types. The results indicate that urban walking support does not vary continuously along a single intensity dimension but instead forms discrete spatial types shaped by multiple behavioral temporal characteristics. These types exhibit clear differences in temporal walking structures and associated environmental constraints. By emphasizing behavioral temporal stability and rhythm, this study provides a process-oriented understanding of urban walking support and supports typology-based spatial identification beyond intensity-based assessments.

1. Introduction

Against the backdrop of global efforts to address the growing burden of chronic diseases and the risks associated with climate change, walking has been widely recognized as a central pathway for promoting active health due to its accessibility and equity [1,2,3,4]. A substantial body of evidence demonstrates that regular walking is associated with reduced risks of cardiovascular disease, metabolic disorders, and mental health problems [5,6,7,8,9], while also contributing to the alleviation of traffic congestion and the improvement of urban environmental quality [10,11]. Consequently, enhancing the capacity of urban spaces to support walking through spatial planning and environmental interventions has become a focal concern across the fields of public health, transportation planning, and urban design.
In existing research and planning practice, the degree to which urban spaces “support” walking has typically been assessed through indicators of walking intensity or scale, such as pedestrian volumes, activity density, or modal share [12,13,14,15]. Within this evaluative framework, central areas characterized by high density, mixed land use, and concentrated activities are commonly regarded as prototypical walkable environments and have thus become primary targets of policy and planning interventions [16,17,18,19]. However, a growing body of empirical evidence suggests that spaces with high levels of walking activity do not necessarily sustain walking behavior over longer temporal horizons [20,21,22]. Under the influence of seasonal variation, daily life rhythms, or environmental disturbances, some ostensibly “active” spaces exhibit pronounced fluctuations or even episodic declines in walking activity, indicating that activity intensity does not correspond straightforwardly to long-term support capacity. Previous studies have further shown that a range of temporal and environmental factors can suppress or reshape outdoor walking behavior, leading to marked temporal variability in the dependence of walking on spatial conditions [23]. This implies that evaluating spatial value solely based on whether walking occurs, or how much walking occurs, may fail to capture the actual capacity of urban spaces to support walking behavior. The critical question that follows is therefore: which urban spaces are able to stably sustain the continued occurrence of walking behavior under environmental pressures and temporal disturbances?
From an active-health perspective, the health benefits of walking depend not only on the intensity of individual activity episodes, but are more closely linked to their regularity and persistence over time [24]. On the one hand, regular walking is more conducive to the development of stable patterns of energy expenditure and metabolic regulation; on the other hand, its relatively low physical burden and high accessibility increase the likelihood that individuals will sustain physical activity in the long term. Accordingly, within an active-health framework, whether walking behavior can be maintained over extended temporal horizons is often more decisive for its overall health value than the intensity of single activity events. However, existing studies on urban walking have largely focused on static or single-period analyses, with limited attention paid to systematically incorporating the temporal structure of walking behavior at an annual scale into spatial typology frameworks [25]. Methodologically, this tendency may lead to the overestimation of spaces characterized by short-term high pedestrian volumes, while overlooking spatial units that exhibit modest activity levels but demonstrate temporal stability and long-term health significance.
Meanwhile, although a substantial body of research has examined the influence of the built environment on walking behavior, the reported findings vary considerably across cities and contextual settings [26,27,28]. Factors such as density, land-use mix, and public transport accessibility have been shown to exert positive effects in some studies, while appearing limited or even producing opposite outcomes in others. An increasing number of studies suggest that such inconsistencies cannot be attributed solely to differences in samples, but are closely related to the nonlinear nature and threshold effects of built-environment influences [29,30,31,32,33]. However, in most analyses, environmental variables are still treated as linear and additive factors, and their differentiated roles and combinatory relationships across different levels of walking support remain insufficiently characterized.
From a methodological perspective, existing studies on urban walkability primarily rely on three analytical approaches. The first approach involves cross-sectional or single-period regression analyses [34], which examine linear associations between aggregated walking intensity and built environment indicators. Although these methods are useful for estimating average effects, they are limited in capturing behavioral regularity and long-term persistence. The second approach employs composite indices or scoring systems [35], integrating multiple environmental attributes into a single metric for spatial comparison; however, such methods often rely on predetermined weights and may obscure heterogeneity at the behavioral level. The third approach utilizes clustering or classification techniques [36] to identify spatial types, but many studies rely on linear partitioning methods or preset numbers of categories, which constrain the identification of latent types, transitional states, or non-stable spatial units. Overall, these approaches exhibit notable limitations in representing temporal structures, nonlinear dynamics, and typological diversity. In addressing common challenges in built environment studies—such as nonlinearity, interaction effects, and multicollinearity among variables—traditional parametric models are constrained by linear assumptions and main-effect frameworks, making it difficult to effectively characterize threshold effects and combined influences of environmental factors. Conventional “black-box” predictive models, while capable of high predictive accuracy, cannot directly provide interpretable insights into environmental mechanisms. Against this backdrop, analytical approaches that rely on linear partitioning or pre-specified numbers of categories often struggle to identify latent spatial types corresponding to differences in behavioral structure, and are particularly limited in capturing spatial units in transitional or non-stable states.
In light of these considerations, this study takes the central urban districts of Wuhan as an empirical case and draws on year-long, real-world walking trajectory data to characterize walking support at the spatial-unit level across three dimensions: behavioral intensity, temporal stability, and rhythm. To capture high-dimensional nonlinear structures, a dimensionality reduction method (UMAP) and a density-sensitive clustering algorithm (HDBSCAN) were employed to identify distinct types of walking support spaces without imposing any a priori assumptions regarding the number or nature of clusters. Building on this typology, interpretable machine-learning models are introduced to examine the relative contributions of built-environment factors to the differentiation of walking support types, as well as their nonlinear influence patterns. This study seeks to address the following questions: (1) What types of differences in walking support capacity emerge across urban spaces when behavioral temporal structures are considered? (2) What roles do different built-environment factors play across walking support types, and do their effects exhibit distinct threshold or combinatorial characteristics? (3) What implications do these findings have for the identification and optimization of urban walking spaces from an active-health perspective?
The core objective of this study is to develop a temporally informed typology of walking support spaces by integrating behavioral intensity, temporal stability, and rhythmic characteristics, and to reveal the differentiated mechanisms through which built-environment factors operate across types using nonlinear and interpretable analytical methods. By incorporating the temporal structure of behavior into the analytical framework of walking support spaces, this study seeks to advance a new perspective for understanding how urban spaces sustain active-healthy walking and to provide empirical evidence for identifying key walking spaces with long-term health value under complex environmental constraints.
The remainder of this paper is organized as follows. Section 2 introduces the study area and data sources. Section 3 presents the analytical framework and modeling methods. Section 4 reports the identification results of walking support spatial types and analyzes differences in built-environment characteristics. Section 5 discusses the implications of the findings for active health-oriented planning. Section 6 concludes the study.

2. Study Area and Data

This section aims to systematically describe the spatial context, data sources, and processing procedures underpinning the study, thereby establishing a foundation for subsequent methodological construction and model analysis. First, at the urban scale, the study area’s spatial extent, population structure, climatic characteristics, and blue–green space patterns are presented to illustrate its typicality and representativeness as research setting for active and healthy walking under high-density and high-climatic-stress conditions. Second, the acquisition methods, ethical boundaries, and sample characteristics of the walking behavior data and multi-source built environment data are detailed, with explanations provided regarding their reliability and applicability. Building on this, the preprocessing workflow and spatialization methods for trajectory data are further elaborated, including data cleaning, outlier removal, spatial clipping, and grid cell construction. Through this structured presentation, a coherent logical chain is established—from defining the research context and detailing data sources to forming spatial analysis units—providing a standardized data foundation for the subsequent extraction of spatiotemporal behavioral features and the identification of environmental support types.

2.1. Study Area and Data Sources

The study area encompasses the central urban districts of Wuhan, including Jiang’an, Jianghan, Qiaokou, Hanyang, Wuchang, Qingshan, and Hongshan. As the core urban space of a mega-city in central China, this area exemplifies the deep coupling between high-density residential environments and a complex natural base [37]. According to the 2024 Wuhan Statistical Bulletin on National Economic and Social Development, by the end of 2024, the city’s permanent population reached 13.8091 million, with an urbanization rate of 85.0% and an urban population of 11.7377 million. The central urban districts accommodate the majority of the city’s population and employment concentrations, ranking among the highest in population density and functional aggregation in central China [38]. In core districts such as Jianghan, Qiaokou, Jiang’an, and Wuchang, population densities exceed 15,000 persons/km2. Specifically, as of early 2025, Jianghan District had a registered population of 523,729 and a floating population of 197,129, totaling 720,858 residents across an area of 28.29 km2, yielding a population density of 25,481 persons/km2, the highest in the city. Measures of functional mix based on points-of-interest (POI) data indicate that land use in Wuhan’s central districts exhibits a pronounced polycentric pattern, with high levels of functional mix along key corridors such as Jianghan Road–Zhongshan Avenue and Zhongnan Road–Zhongbei Road. This highly compact and functionally integrated spatial form provides strong spatial incentives for frequent walking behavior.
Meanwhile, the area faces significant climatic stress [39]. Wuhan is characterized by a typical “hot summer, cold winter” climate. According to monitoring data from the Hubei Meteorological Bureau, the number of days with temperatures ≥35 °C reached 58 in the summer of 2025, breaking the record for the highest number of hot days since 1961 and extending the latest high-temperature day to October 9 (35.7 °C). The coldest month in winter (January) has a long-term average temperature of 3.2 °C, with winter mean temperatures ranging from 3 to 5 °C [40]. Under the combined influence of extreme summer heat and high humidity, urban heat island intensity reaches 2–5 °C, with the densest built-up areas, such as Jianghan and Qiaokou, forming heat exposure cores, while lakeside areas including East Lake, Sha Lake, and Moshui Lake create pronounced cool islands, with diurnal temperature differences reaching 6–8 °C [41]. This highly heterogeneous thermal environment makes the area an ideal observational field for examining environmental responses of walking behavior under seasonal climate stress.
Additionally, the central urban districts of Wuhan exhibit a distinctive “interwoven blue–green” spatial substrate. Known as the “City of a Hundred Lakes”, Wuhan contains 166 lakes of various sizes, with major lakes in the central districts including East Lake, Sha Lake, South Lake, Moshui Lake, and Longyang Lake, covering approximately 9.8% of the city’s total land area. As of September 2025, the total number of parks reached 1024, officially marking Wuhan as a “City of a Thousand Parks”, with per capita park green space of 15.03 m2 and a total greenway length exceeding 2426 km, including a fully connected 105 km East Lake Greenway. Concurrently, the coverage of tree-lined streets in built-up areas increased to 88%, with a total length of 3727 km. The integration of blue–green spaces with the urban built environment, as indicated by remote sensing analysis and landscape pattern indices, demonstrates that corridors such as East Lake–Sha Lake–South Lake, Longyang Lake–Moshui Lake, and Qingshan Park–East Lake Greenway–Ma’anshan Forest Park contain highly prominent blue–green patches with strong pedestrian connectivity. These conditions provide quantifiable and comparable natural experimental settings for assessing how blue–green infrastructure modulates thermal environments and supports active healthy walking.
Overall, Wuhan’s central urban districts exhibit extremity and representativeness across four dimensions: high population density, high functional complexity, significant climatic stress, and intensive blue–green integration. The relevant foundational data are clear, publicly accessible, and well-documented, providing a rich basis for research. This makes the area an irreplaceable empirical field for systematically investigating the differential support and spatial heterogeneity of active healthy walking under multiple environmental pressures.
Walking behavior data were obtained from the Liangbulu outdoor activity platform, consisting of historical walking trajectories voluntarily recorded and actively shared by users in 2025. The platform is a crowdsourced exercise tracking and community-sharing application designed for outdoor enthusiasts, allowing users to autonomously activate GPS on their mobile devices to record and save walking, running, cycling, and other exercise trajectories. The generation of trajectory data is entirely based on user-initiated actions, including the decision to record, upload, and set trajectories as publicly visible.
In this study, only trajectories labeled as “publicly shared” on the platform were collected. No non-public content, personal user information, or account privileges were accessed, and no form of data scraping or system interference was conducted. The data collection process did not involve targeted selection based on specific users, spatial locations, or walking behaviors; instead, the analytical sample was constructed from the naturally occurring trajectories on the platform. All data were anonymized prior to analysis and aggregated at the spatial unit level, without including any personally identifiable information.
During the data filtering process, only trajectories explicitly labeled as “walking” were included for subsequent analysis. Compared with walking data obtained through passive positioning technologies, such as mobile phone signaling, trajectories voluntarily recorded and publicly shared by users exhibit greater clarity in terms of behavioral intent. While passive positioning technologies offer the advantage of covering large populations, their low spatial resolution, sparse temporal sampling, and lack of behavioral semantic information make it difficult to distinguish passive movements—such as transfers or commuting—from active walking conducted for exercise or recreational purposes. In contrast, platform trajectory data are typically generated by user-initiated input or via dedicated applications, making the behavioral intent more discernible and closely aligned with the concept of “active healthy walking” emphasized in this study. These data primarily originate from activities such as hiking, daily physical exercise, or urban roaming, with minimal inclusion of passive or ancillary walking associated with transportation, thereby providing strong correspondence with the core research focus. Previous studies have shown that GPS-based actively collected data outperform passive mobile signaling data in identifying different activity types (e.g., study, work, shopping, leisure) [42]. Research from other disciplines also indicates that actively collected trajectory data provide higher-dimensional behavioral features and finer-grained activity pattern recognition capabilities [43]. These findings provide solid empirical support for the selection of actively recorded platform data as the basis for walking behavior analysis in this study [44].
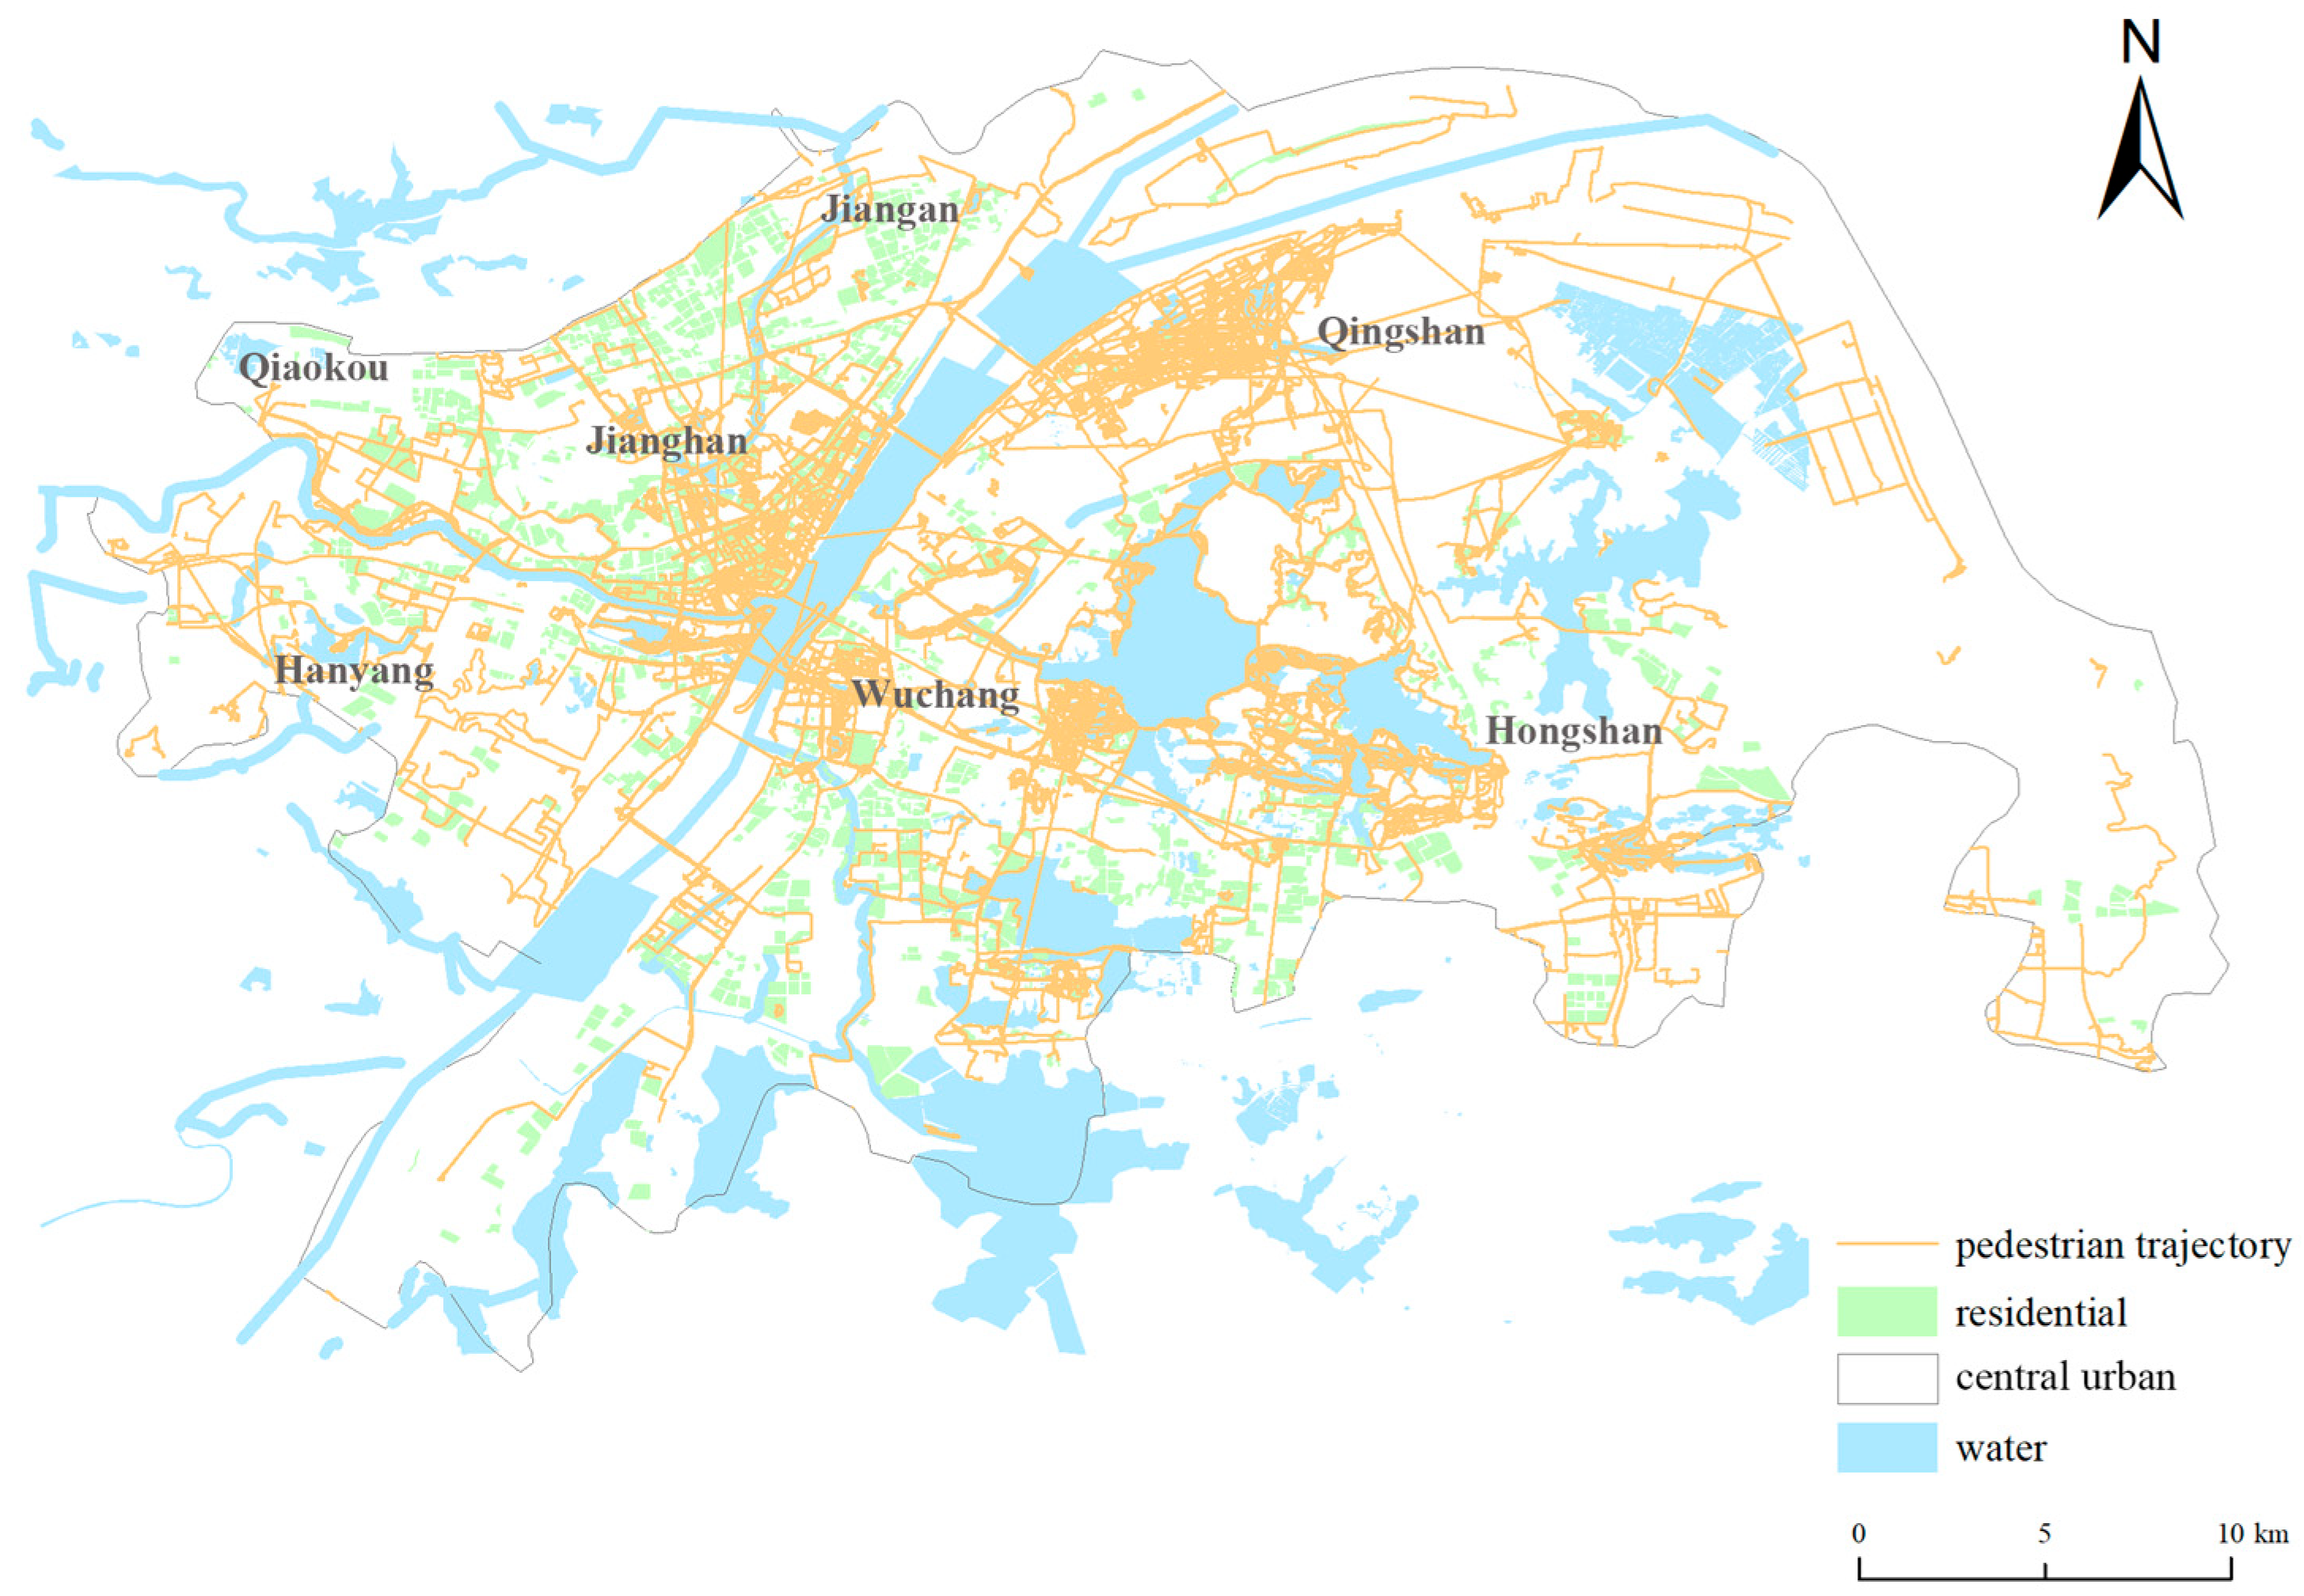
The data acquisition and processing procedures described above comply with established ethical standards for crowdsourced geographic information in urban space and mobility research. The study area and the overall spatial distribution of walking trajectories are shown in Figure 1.
It should be noted that crowdsourced walking trajectories obtained from outdoor activity platforms inevitably exhibit a degree of user-selection bias, as they primarily represent individuals who are accustomed to using smart devices, have a stronger inclination toward walking, and are willing to actively record their activities. From the perspective of overall population representativeness, such data do not constitute a random sample of all walking activities of urban residents. Nevertheless, the focus of this study is not to infer the probability of walking across different population groups or the overall level of urban walking, but rather to identify, conditional on actual walking behavior, the differences in the temporal capacity of various urban spaces to sustain walking activities. Under this research objective, the primary value of the data lies in their ability to provide a continuous representation of real-world walking processes and their annual temporal structure. The trajectory sample covers all 12 months of the year, with observations recorded in every month. Although the number of trajectories varies across months, no pronounced discontinuities or concentration within a single period are observed, allowing for robust analysis of the annual temporal structure and persistence of walking behavior. Corresponding descriptive statistics of walking trajectory behavioral features are reported in Table 1.
In addition to walking behavior data, multi-source built environment data were incorporated to characterize the objective environmental attributes of urban space. These data were obtained from publicly available geographic information databases and include road networks, public transport facilities, points of interest (POIs), land use, and population distribution. The built environment datasets were temporally aligned with the annual period covered by the walking trajectory data and spatially matched to the study area. As data sources independent of walking behavior, they were used to examine how urban spatial conditions support walking activities.

2.2. Data Preprocessing and Spatialization

The raw walking trajectories were stored in KML format and consisted of sequential spatial points with corresponding timestamps. To support subsequent spatial analysis and modeling, the raw trajectory data were systematically cleaned and structured. This process included parsing point sequences to construct continuous polyline features, unifying the spatial reference system to ensure consistency in spatial calculations, extracting key behavioral attributes at the trajectory-line level, and identifying the month of occurrence based on timestamp information.
Spatially, the analysis was confined to the central urban districts of Wuhan. Walking trajectories were spatially clipped to the study area, and anomalous records with missing key information or suspected non-walking behaviors were identified and removed. Specifically, trajectories with average speeds substantially exceeding typical walking levels (greater than 6 km/h) were excluded to prevent misclassified running, cycling, or motorized travel from being included. In addition, records with very short durations (less than 5 min), substantial timestamp gaps or discontinuities, or an insufficient number of points to form valid polylines were removed to reduce potential noise inherent in crowdsourced data.
To transform individual walking trajectories into comparable spatial analytical units, the study area was further divided into a regular grid of 500 m × 500 m cells (hereafter referred to as spatial units). At this scale, behavioral indicators such as the number of walking trajectories and cumulative walking distance were aggregated on a monthly basis, thereby converting individual-level walking behaviors into spatial unit-level representations. This grid resolution has been widely adopted in studies of urban walking and the built environment, as it balances the representation of walking accessibility and spatial heterogeneity while avoiding data sparsity associated with finer spatial scales, and it approximates the spatial coverage of typical 5–10 min walking activities.
Built environment data were georeferenced under a unified coordinate system and mapped to spatial units through spatial overlay analysis. Through this process, environmental attributes from multiple sources and with different data structures were integrated into a grid-based dataset with a consistent spatial reference, providing the data foundation for constructing multidimensional built environment indicators and subsequent modeling analyses.

3. Methods

In this study, walking support is defined as a state characteristic of spatial units that reflects their capacity to continuously accommodate and repeatedly host walking behavior over time. This conceptualization is consistent with planning perspectives that emphasize the long-term persistence and regularity of vitality in public spaces [45]. Based on this definition, walking behavior at the spatial-unit level is no longer characterized by a single intensity indicator. Instead, a three-dimensional behavioral framework is constructed, comprising activity intensity, temporal stability, and behavioral rhythm. Activity intensity reflects the overall magnitude and frequency of walking activity in space, addressing whether walking occurs at a large scale. Temporal stability captures the persistence of walking activity over an annual time span, distinguishing episodic use from routine occurrence. Behavioral rhythm focuses on the distributional structure of walking activity within the annual time series, indicating whether activity is concentrated in specific months or seasons. In this framework, temporal stability emphasizes whether walking activity persists over time, whereas behavioral rhythm addresses how such activity is distributed temporally. These two dimensions are complementary in the temporal domain and help to avoid misclassifying short-term high-frequency activity as long-term spatial support.
Moreover, the walking support types identified in this study do not represent classifications of individual preferences or population groups. Rather, they describe stable states of the temporal structure of walking behavior exhibited by spatial units at an annual scale. Differences among support types therefore reflect variations in the capacity of spaces to sustain walking behavior under temporal disturbances and environmental pressures, rather than differences in one-off activity choices.
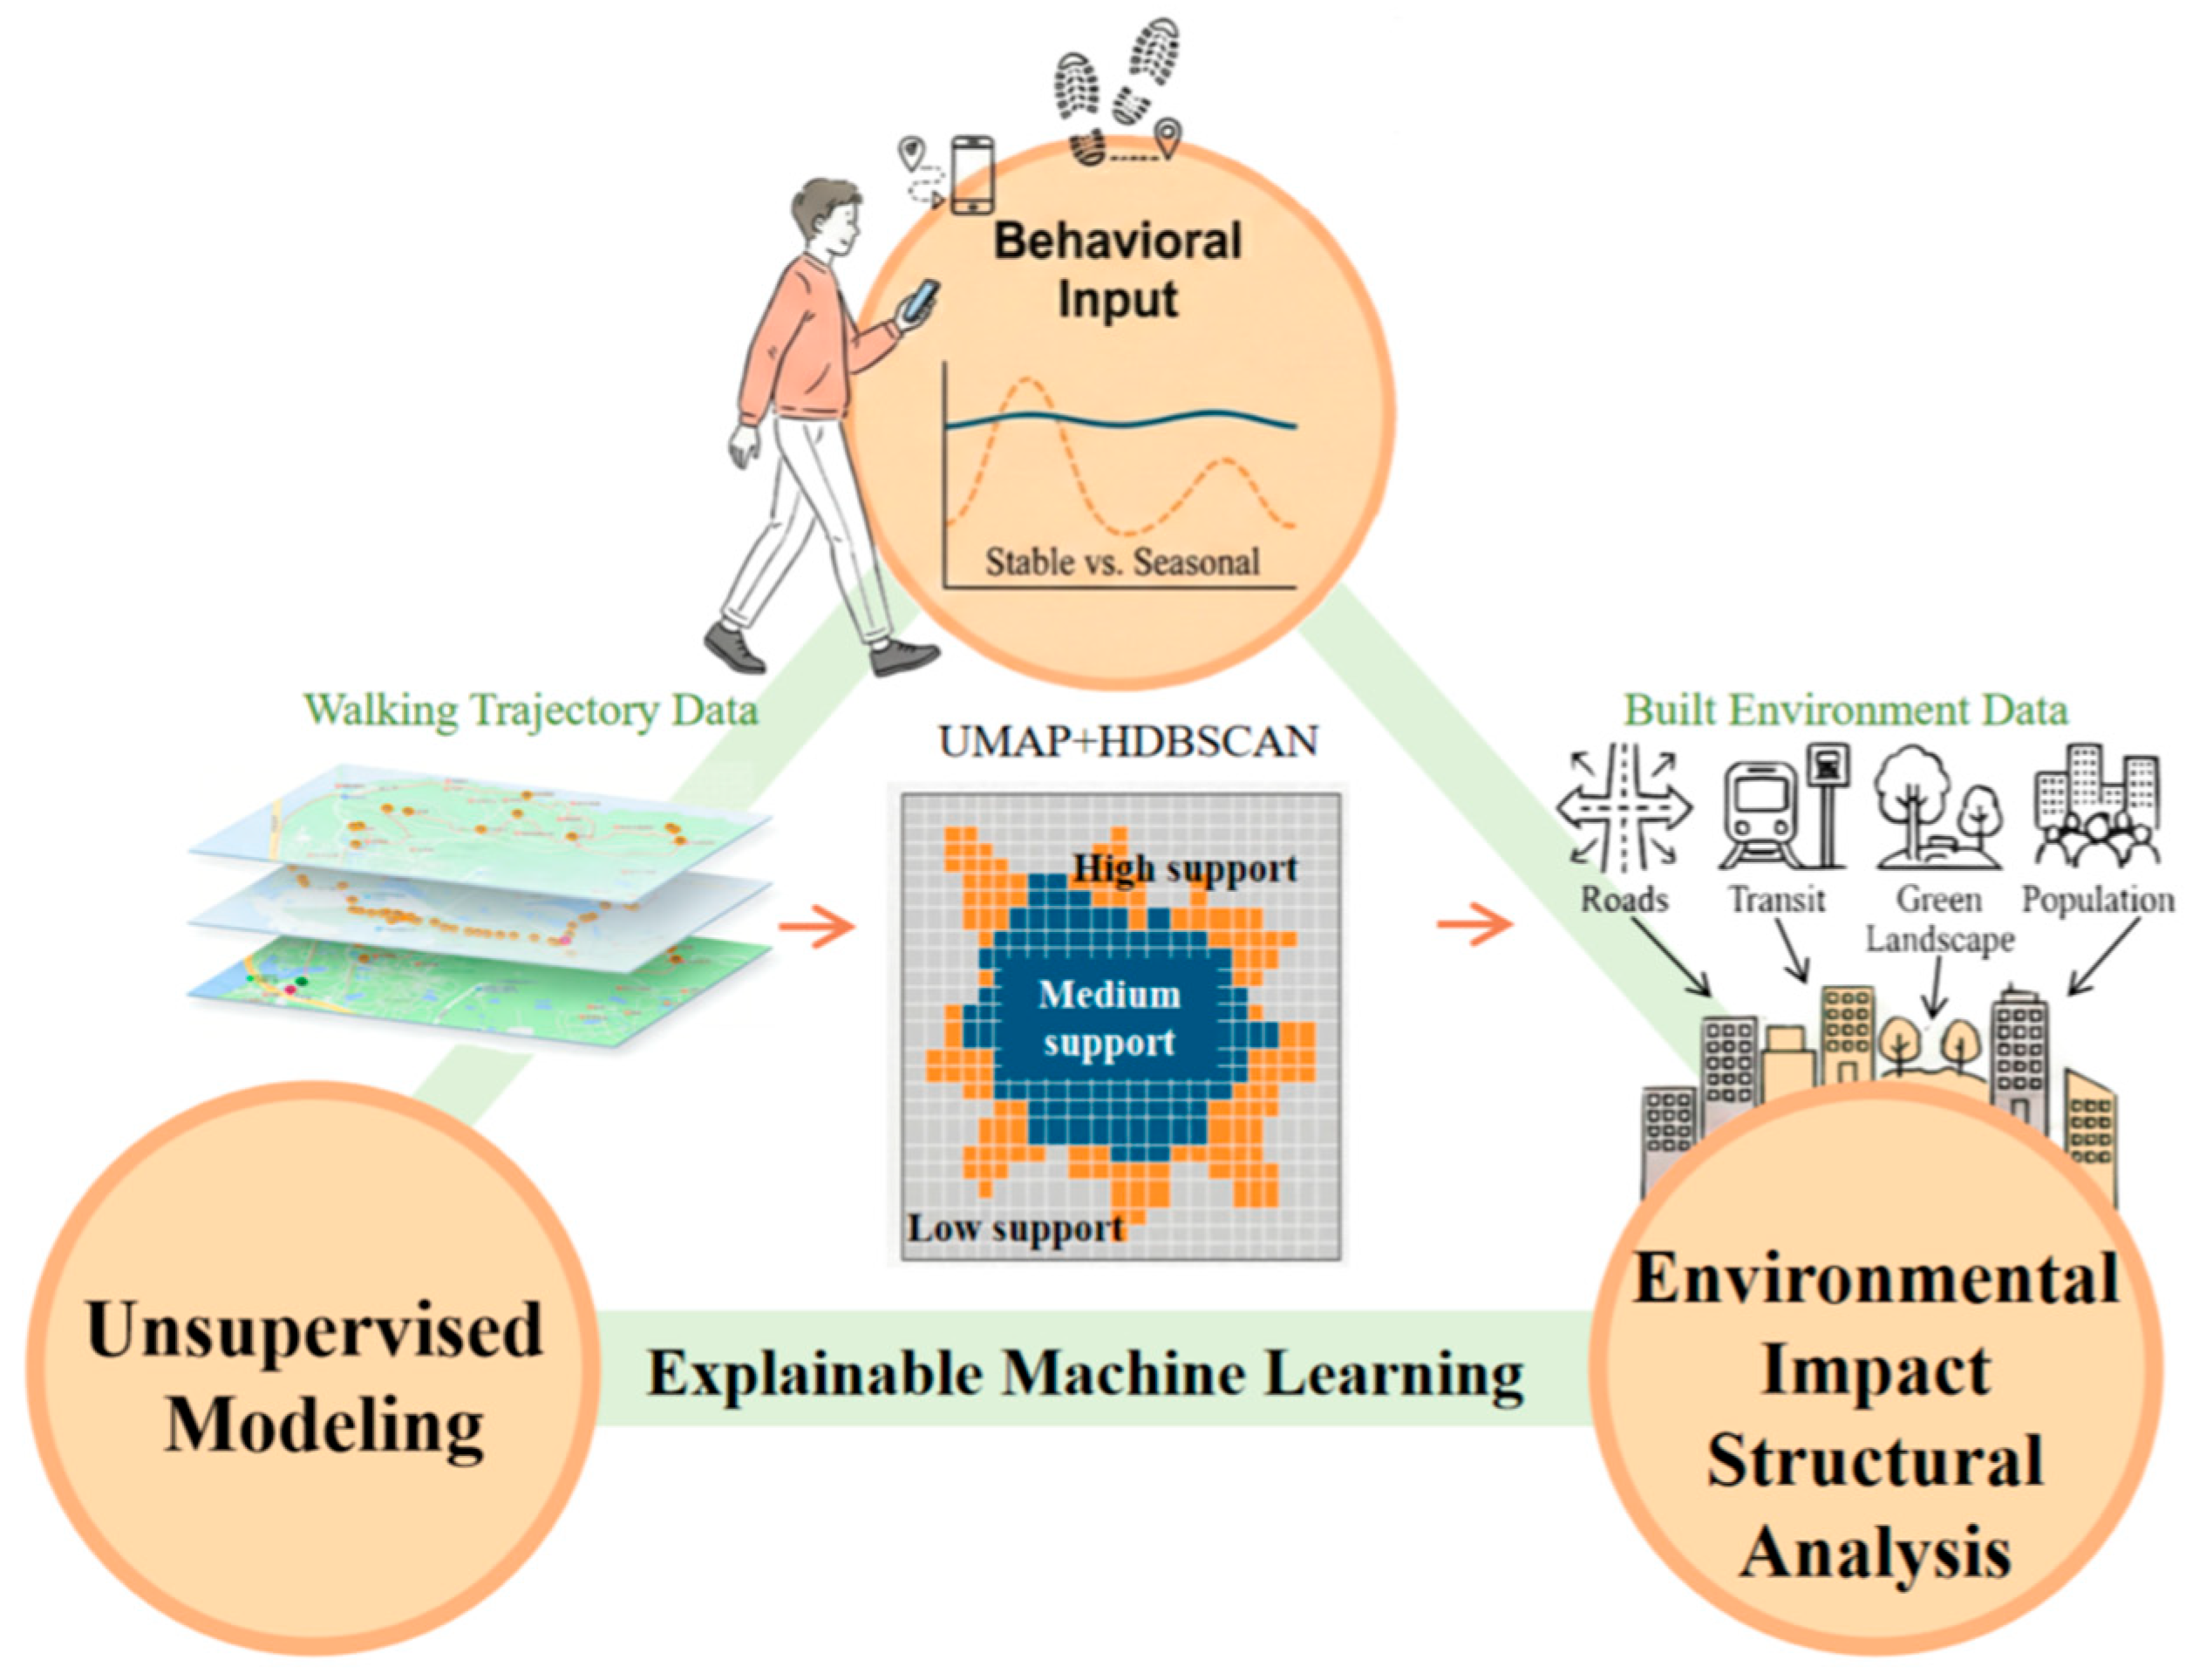
As illustrated in Figure 2, the identification of walking support types is conducted at the spatial-unit level based on behavioral temporal characteristics. Built-environment indicators are subsequently integrated to systematically analyze the spatial conditions associated with different walking support types.

3.1. Construction of the Walking Behavioral Indicator System

Based on the above framework, each spatial unit was assigned a set of multidimensional behavioral indicators to form a behavioral profile representing its walking support state. In constructing the indicator system, the selection of behavioral intensity, frequency, and temporal-structure indicators was based on existing frameworks for measuring walking behavior in the fields of urban health and behavioral science, and was integrated within a spatial unit scale and annual analytical framework [46,47].
Walking intensity (e.g., total walking distance or step count) and walking frequency are core quantitative dimensions for characterizing daily physical activity levels in urban health research. They have been widely used to evaluate the relationship between the built environment and walking behavior and have demonstrated strong interpretability and policy relevance [48]. Beyond aggregate measures, the temporal continuity and regularity of activity have increasingly been incorporated into analytical frameworks. Studies have shown that physical activity exhibits significant fluctuations at annual and seasonal scales, with the temporal distribution itself constituting a key component of behavioral patterns [49]. Accordingly, the inclusion of the number of active months and the monthly fluctuation coefficient helps distinguish continuously used walking spaces from those used seasonally, providing temporal dimension information to complement behavioral characterization. Operationally, “behavioral stability” is defined along two complementary dimensions: first, “existence stability”, indicating whether walking activity occurs consistently along the annual timeline, corresponding to the number of active months; second, “intensity stability”, reflecting the dispersion of activity magnitude across months, corresponding to the monthly fluctuation coefficient. The former identifies whether a space has a basis for normalized use, while the latter characterizes the temporal balance of activity magnitude. Together, these two indicators provide an operationalized expression of temporal stability.
Furthermore, recent studies leveraging trajectory data and machine learning have highlighted that walking behavior exhibits significant temporal response differences to climatic and built environment conditions. Seasonal concentration and stage-specific peak patterns can reveal the capacity of spaces to adapt to different environmental contexts [50]. Building on this, the present study constructs the indicators of peak concentration and summer proportion to assess the extent to which walking behavior is maintained under adverse climatic conditions such as high temperatures. Conceptually, “behavioral rhythm” is understood as the structural characteristics of walking activity across the annual temporal distribution, including the degree of reliance on a single period and relative performance under specific climatic conditions. Peak concentration characterizes whether the temporal distribution exhibits a unimodal dependency structure, while summer proportion serves as a contextualized indicator to identify the relative maintenance of walking activity under high-temperature constraints. Together, these indicators reflect the morphological features of temporal distribution and the behavioral response to environmental conditions.
All behavioral indicators were calculated based on monthly aggregated walking trajectory data. Walking distance was derived from the geometric intersection length between walking trajectories and analysis units and was cumulatively summarized at both monthly and annual scales. Walking frequency was measured using unique trajectory identifiers as counting units and was deduplicated by month within each spatial unit to avoid repeated counting of the same trajectory. These procedures enabled the simultaneous characterization of the overall magnitude of walking behavior, its repeated occurrence, and its temporal distribution structure across the entire year. Detailed definitions and calculation methods of the behavioral indicators are provided in Table 2.
Within the behavioral rhythm dimension, a summer walking proportion indicator was introduced to characterize the relative persistence of walking activity under adverse climatic conditions such as high temperatures. Wuhan is located in the middle–lower reaches of the Yangtze River basin, where prolonged periods of high temperature and humidity during summer impose substantial constraints on outdoor walking. Under this climatic context, spatial units that are able to maintain a relatively high proportion of walking activity during summer reflect, at the behavioral outcome level, a certain capacity to support and attract walking despite unfavorable environmental conditions. Accordingly, this indicator helps to reveal seasonal differences in the adaptability of walking support capacity.
To ensure the comparability of different indicators in similarity measurement and clustering analysis, all behavioral features were subjected to Z-score standardization prior to subsequent analyses. Pearson correlation tests indicated that the maximum correlation coefficient among the selected indicators was 0.42 (|r| < 0.8), suggesting that the indicator dimensions retained relatively independent informational contributions from a statistical perspective.

3.2. Spatial Typology Identification Based on Nonlinear Dimensionality Reduction and Density-Based Clustering

In the process of identifying walking support space types, an initial data validity screening was conducted at the spatial-unit level. Spatial units with no recorded walking activity throughout the year ( N i   = 0) lacked a basis for walking support assessment and were therefore classified as a non-support state and excluded from subsequent typology identification. The remaining spatial units with valid walking records were represented by behavioral feature vectors derived from the constructed multidimensional walking behavioral indicator system and were retained for type identification.
Compared with commonly used approaches in previous studies, such as “PCA-based dimensionality reduction followed by K-means clustering” or linear clustering methods based directly on Euclidean distance, the behavioral features constructed in this study exhibit significant nonlinear coupling among intensity, stability, and rhythm dimensions. Under the assumption of linear distance, the interaction structure across these dimensions may be compressed into simple distance differences, making it difficult to reveal the continuous gradients and transitional states of latent behavioral structures. Therefore, it is necessary to employ nonlinear methods capable of capturing manifold structures for feature representation.
Therefore, this study employed the Uniform Manifold Approximation and Projection (UMAP) algorithm to reduce the dimensionality of high-dimensional features. UMAP preserves local neighborhood topological relationships while simultaneously maintaining global structural representation. Compared to linear projection methods, it is more effective in identifying structural differentiation and continuous transitions among complex behavioral patterns, aligning methodologically with the study’s objective of identifying “structurally stable states”. UMAP parameter settings were determined based on sample size and neighborhood stability principles. Given the large sample size in this study, a neighborhood parameter that is too small can result in fragmented embedding structures, whereas an excessively large neighborhood may weaken local structural differences. Through multiple comparative experiments with n n e i g h b o r s [ 30 , 80 ] , it was found that n n e i g h b o r s = 50 achieves a favorable balance between local structure preservation and overall continuity, with stable main cluster structures. The minimum distance parameter, m i n _ d i s t = 0.10 , helps prevent over-compression of the embedded point cloud and improves separability between different types. This parameter combination balances local structure retention and overall distribution representation, avoiding fragmentation caused by small neighborhood ranges or the masking of walking behavior structural differences due to excessive smoothing. The dimensionality reduction process can be expressed as:
y i = f U M A P ( x i ) , y i R 2
Here, x i denotes the standardized walking behavioral feature vector of spatial unit i , and f U M A P represents the nonlinear mapping function learned by UMAP.
Within the low-dimensional embedding space generated by UMAP, a density-based hierarchical clustering algorithm, HDBSCAN, was further applied to identify walking-supportive spatial types. This algorithm does not require a pre-specified number of clusters; instead, it identifies cluster structures based on density stability and labels structurally unstable units as noise points. This mechanism avoids forcibly classifying transitional or weakly supportive spaces, allowing “non-stable states” to be explicitly represented within the typology, thereby enhancing the interpretability of cluster assignments. The minimum sample parameters of HDBSCAN were set in accordance with sample size and research objectives. This study focuses on spatial types with structural stability, setting the minimum cluster size parameter, m i n _ c l u s t e r _ s i z e = 120 , to exclude unstable clusters composed of a small number of spatial units. The minimum samples parameter, m i n _ s a m p l e s = 1 , was chosen to reduce excessive penalization of locally sparse regions, enabling the algorithm to more accurately identify spatial units with unclear behavioral structure as noise points. The clustering outcome can be expressed as follows:
C i = { k ,   i f   s p a t i a l   u n i t   i   b e l o n g s   t o   t h e   k t h   s t a b l e   c l u s t e r   1 ,   i f   s p a t i a l   u n i t   i   i s   i d e n t i f i e d   a s   a   n o i s e   p o i n t
Notably, noise points identified by HDBSCAN do not merely represent algorithmic “unclassified samples”, but instead indicate spatial units whose walking behavioral features fail to form stable structures across dimensions of intensity, stability, and rhythm. Such units are typically characterized by low levels of walking activity, fragmented temporal distributions, or strong influences from episodic factors. From a planning perspective, these spaces can be interpreted as having weak walking support capacity or being in transitional states, and are therefore not interpreted as stable walking support types.
Given the sensitivity of nonlinear dimensionality reduction and density-based clustering methods to parameter settings, comparative tests were conducted for key parameters of UMAP and HDBSCAN within reasonable ranges. The results showed that the overall spatial patterns and behavioral feature structures of the major walking support types remained stable across different parameter combinations, with differences observed only in the type assignment of a small number of boundary spatial units. Based on these comparisons, the parameter configuration described in this study was ultimately adopted for the identification of walking support space types, and the resulting classification outputs were used as the basis for subsequent analyses of walking support typologies.

3.3. Quantification of Built-Environment Characteristics and Variable Selection

Spatial analysis and raster statistical tools, implemented in Python (version 3.13.9), were employed to quantify built-environment characteristics. Drawing on commonly used environmental dimensions in previous studies of walking and the built environment [51,52,53,54], built-environment indicators were calculated across four dimensions: road network structure, facility accessibility, functional mix, and population activity intensity. An initial pool of built-environment indicators was thus constructed, comprising both absolute and relative measures.
In the street network dimension, the total road length, network density, number of intersections, and intersection density within each spatial unit were calculated based on road centerlines, and the average segment length was extracted to characterize the supply level, connectivity, and block-scale microstructure of the network. Empirical studies have shown that street network density and intersection density significantly influence residents’ walking frequency and route choice diversity [55]. In the facility accessibility dimension, POI data were used to count the number of subway stations and recreational resources, while the Euclidean distance from the grid center to the nearest facility was calculated to characterize the supply intensity and spatial accessibility of public transport and leisure resources. Multiple studies indicate that accessibility to transport facilities and recreational resources is closely associated with walking behavior and serves as a key driver for residents’ walking activities [56]. In the land-use structure dimension, the area proportion of different land-use types was calculated, and land-use mix was quantified using Shannon entropy to measure functional complexity. Increased land-use mix enhances destination diversity, thereby promoting walking trips and daily active mobility [57]. In the population activity dimension, high-resolution WorldPop raster data were used to aggregate population size and calculate population density, representing potential walking activity sources and travel demand intensity. Population density has been shown in multiple studies to be statistically associated with walking behavior [58].
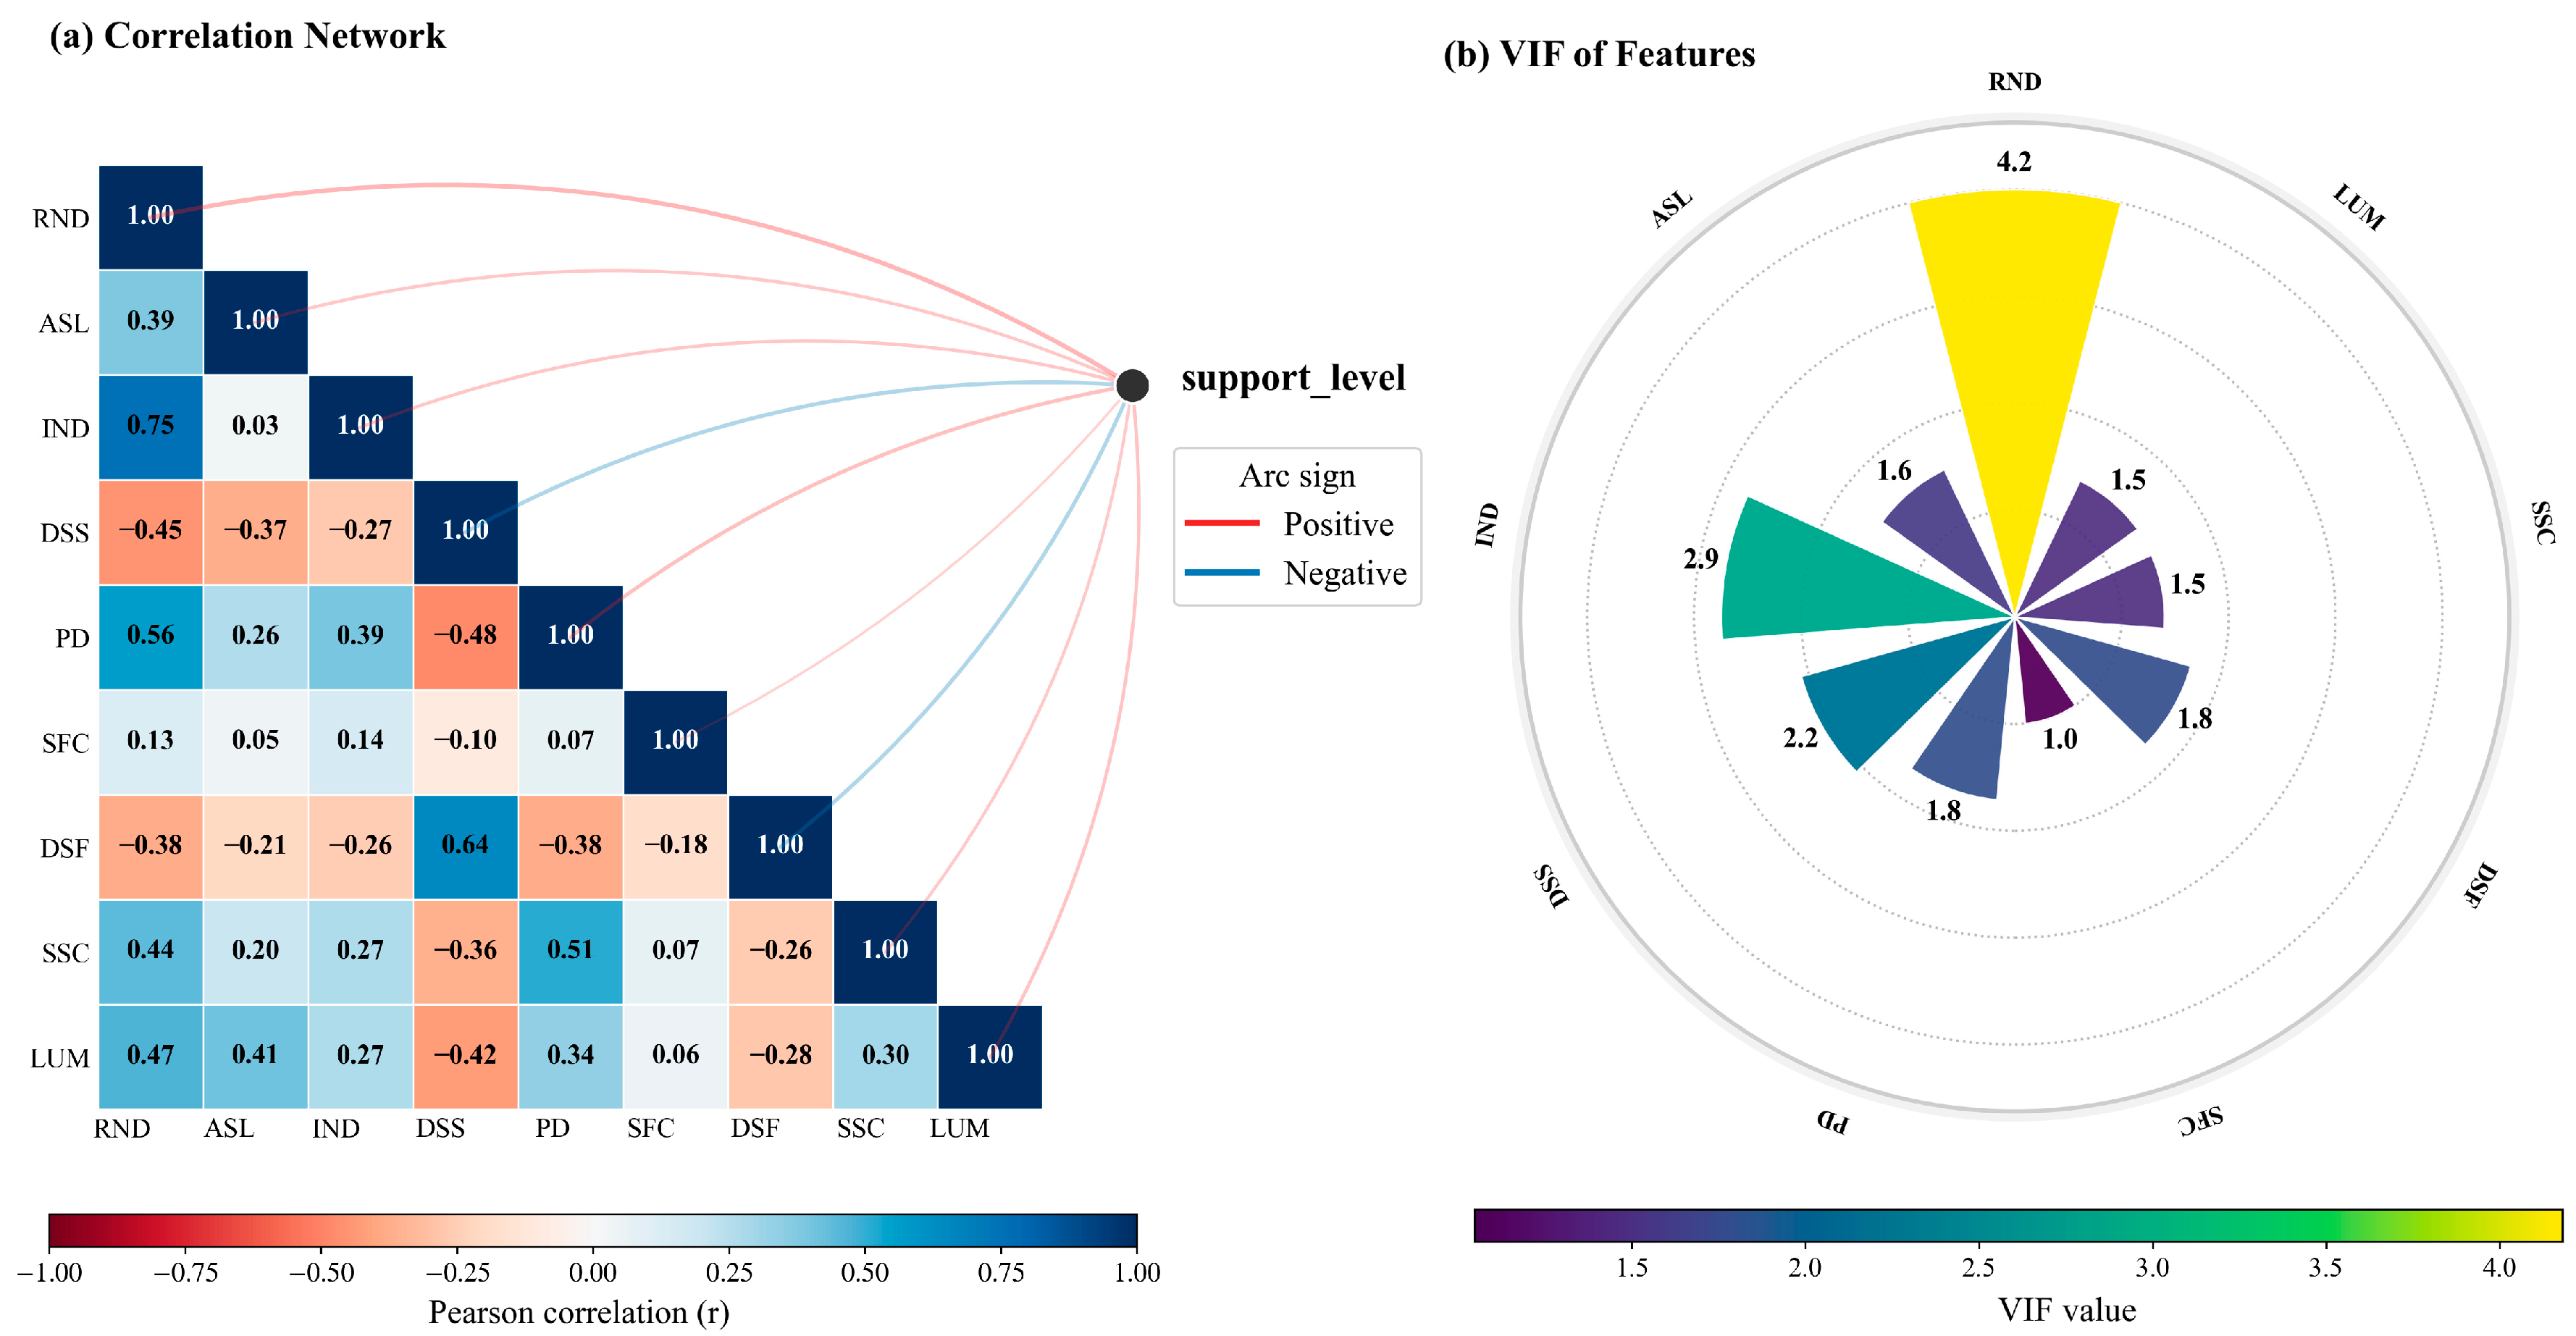
The procedures described above resulted in an initial indicator set covering multiple dimensions. To prevent information redundancy among variables from compromising model stability and interpretability, a rigorous and systematic screening process was implemented prior to model construction. First, Pearson correlation analysis was conducted, and highly correlated variable pairs were identified using an absolute correlation coefficient threshold of |r| ≥ 0.8. On this basis, relative indicators with clearer physical interpretation and stronger scale comparability were preferentially retained, while absolute or derived indicators were removed. This procedure effectively mitigated endogeneity-related redundancy arising from “total–density” relationships. Subsequently, variance inflation factor (VIF) analysis was applied to assess multicollinearity, using a threshold of VIF > 10. Variables exhibiting pronounced multicollinearity were iteratively removed. The screening results indicated that correlations among the retained variables remained within acceptable ranges, and overall VIF values were low, suggesting the absence of significant multicollinearity issues (Figure 3).
Following the above construction and screening procedures, a total of nine built-environment indicators were retained, covering five dimensions: road network structure, public transport, landscape resources, population activity, and land-use structure (Table 3).

3.4. Interpretable Machine Learning Modeling and Model Selection

This study aims to reveal the nonlinear effects and interaction mechanisms of multidimensional built environment features on walking-supportive spatial types, representing a typical explanatory modeling problem under high-dimensional, complex association data. Traditional statistical models, such as multivariate logistic regression, provide parameter interpretability but are constrained by a linear main-effect framework, limiting their ability to capture nonlinear relationships and higher-order interactions among variables. Conventional ensemble learning models, such as Random Forest and XGBoost, offer superior predictive performance but their “black-box” nature hinders direct interpretation of internal decision logic, restricting the extraction and generalization of environmental effect patterns.
To overcome these dual limitations, this study introduces an Explainable Artificial Intelligence (XAI) modeling framework. The core advantage of this framework is that it preserves the high fitting capacity of complex models while systematically decomposing model decision logic through global and local explanation methods, enabling the quantification of marginal effects, effect directions, and interaction strengths of built environment factors. This approach is particularly suitable for the dataset constructed in this study, which comprises nine built environment indicators with widespread multicollinearity and nonlinear response characteristics. Traditional parametric models are prone to bias arising from the specification of functional forms under such data structures, whereas the XAI framework does not require predefined distributional assumptions or functional forms and can identify statistically robust patterns of environmental influence in high-dimensional feature space.
Regarding algorithm selection, no single model was predetermined as the analytical tool; instead, a multi-model comparison was conducted to balance predictive performance, generalization stability, and interpretative consistency, thereby maximizing the reproducibility and scientific rigor of subsequent environmental effect analysis.

3.4.1. Comparison of Machine Learning Models

After the selection and standardization of built-environment variables, multiclass predictive models were constructed, with walking support space types at the spatial-unit level serving as the dependent variable and built-environment indicators as independent variables. Considering the potential correlations and nonlinear interactions among built-environment variables, four representative tree-based algorithms were selected to form the candidate model pool: a single Decision Tree, Random Forest, Extra Trees, and Gradient Boosting Decision Trees (XGBoost). Tree-based models are robust to multicollinearity and do not require linear assumptions regarding variable relationships, making them well suited for modeling complex urban environmental data. During model training, the dataset was split into training and testing sets using stratified sampling with an 80:20 ratio. Repeated stratified five-fold cross-validation was then applied to reduce the randomness associated with a single data split. For each algorithm, key hyperparameters were optimized using a random search strategy to ensure that model performance fell within a reasonable range.
Conducting a multi-model comparison rather than relying on a single predetermined algorithm helps mitigate model-dependent bias and enhances the reproducibility of research findings as well as methodological transparency. Detailed comparisons of predictive performance and generalization behavior across models are reported in the Supplementary Materials S1. The results indicated that while overall predictive accuracy differed only modestly among candidate models, pronounced differences were observed in terms of generalization stability and result consistency. Taking into account predictive performance, training–testing consistency, and the requirements of subsequent mechanism-oriented interpretability analyses, the Random Forest model was ultimately selected as the base model for modeling and explaining walking support space types.

3.4.2. Construction of the Random Forest Model

Random Forest (RF) is an ensemble learning method based on decision trees. Its core principle is to construct multiple mutually independent decision trees through random sampling of both the observation set and the feature space, and to aggregate the predictions of individual trees to obtain a more robust overall prediction. Compared with a single decision tree, Random Forest effectively reduces sensitivity to noise and local structures, thereby mitigating the risk of overfitting. Formally, a Random Forest model can be represented as an ensemble composed of T decision trees. For a given feature vector of spatial unit i , x i = ( x i 1 , x i 2 , x i p ) , the prediction of the t -th decision tree is denoted as h t ( x i ) . In multiclass classification tasks, the final prediction of the Random Forest is determined by an aggregated voting scheme across individual trees, which can be expressed as follows:
y ^ i = arg max c t = 1 T R ( h t ( X i ) = c )
where c denotes the walking support space type, and R is an indicator function.
Random Forest enhances model diversity through two layers of randomness: bootstrap sampling of the training observations and random selection of a subset of features at each node split for optimal partitioning. This mechanism introduces structural and decision-boundary heterogeneity among trees, thereby improving generalization performance at the ensemble level.
In this study, the Random Forest model was used to learn the mapping between built-environment characteristics and walking support space types. Given the complexity of built-environment variables in terms of spatial scale, functional attributes, and underlying mechanisms, this model is capable of capturing nonlinear relationships and potential interaction effects among multiple variables without relying on linear assumptions. More importantly, compared with gradient boosting-based models, Random Forest exhibits more stable feature-importance rankings across different data splits, which is beneficial for ensuring the structural reliability of subsequent interpretability analyses. Accordingly, the Random Forest model was regarded as an appropriate choice that balances predictive performance with interpretability consistency in this study.

3.4.3. SHAP-Based Model Interpretability Analysis

To elucidate the mechanisms through which built-environment variables contribute to Random Forest model predictions, the SHapley Additive exPlanations (SHAP) framework was employed for model interpretability analysis. The SHAP method enables consistent decomposition of variable marginal contributions under nonlinear and interactive conditions, reducing interpretive bias arising from functional form assumptions and enhancing the transparency of identifying environmental effect influences.
For the multiclass classification task, SHAP values were calculated separately for each walking support space type to characterize the differentiated roles of built-environment variables in type-specific discrimination. In the interpretability analysis, overall variable importance was assessed using mean absolute SHAP values. SHAP distribution plots and feature dependence analyses were further examined to identify effect directions, nonlinear response patterns, and potential threshold ranges of key variables, thereby revealing the structural mechanisms through which multiple built-environment factors jointly shape the formation of walking support spaces.

4. Results

4.1. Walking Support Space Types for Active Healthy Walking and Differences in Behavioral Characteristics

Based on the combined characteristics of walking behavior across intensity, stability, and temporal rhythm dimensions, together with the results of unsupervised clustering, spatial units in the study area were classified into three types. According to the relative differences in key behavioral indicators among these groups (Table 4), three walking support space types were identified: high-support, medium-support, and low-support spaces.
Table 4 shows that high-support spaces exhibit the highest values among the three types in terms of annual walking intensity and frequency, with a relatively high number of active months and the lowest monthly fluctuation coefficient. Their proportion of summer walking activity is markedly higher than that of the other two types. Medium-support spaces show lower annual intensity and frequency than high-support spaces but maintain a relatively balanced number of active months and seasonal distribution, with a certain proportion of walking activity occurring in summer. Low-support spaces record the lowest annual intensity, frequency, and number of active months, the highest temporal fluctuation coefficient, and a near-zero proportion of summer walking activity. These data indicate that the three space types differ significantly in both behavioral magnitude and temporal structure: high-support spaces are characterized by high intensity combined with greater temporal stability, medium-support spaces occupy an intermediate range, and low-support spaces exhibit low intensity with high temporal variability.
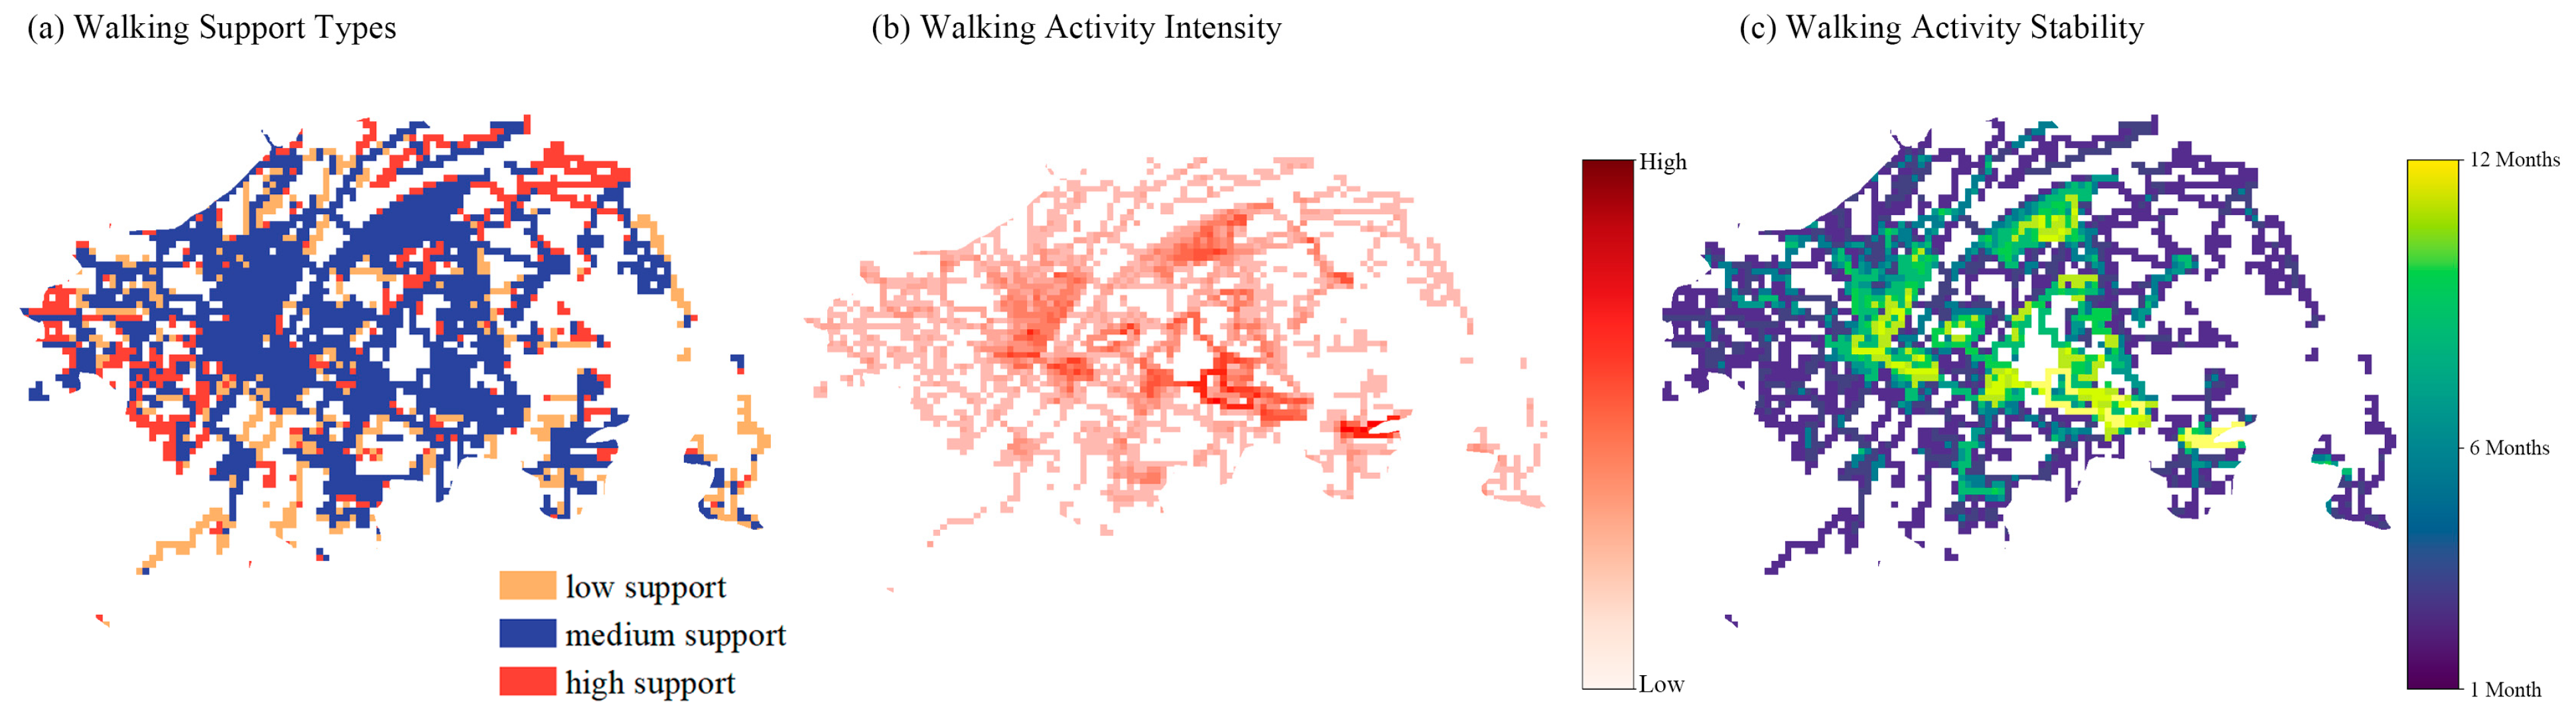
In terms of spatial distribution (Figure 4a), medium-support spaces cover the central urban area and major residential–employment mixed zones. Low-support spaces are primarily located along the urban development boundary and expressway corridors, exhibiting a fragmented pattern. High-support spaces are distributed in a multi-nodal and corridor-like configuration, forming continuous linear structures along waterfront public spaces and extending into large green and open areas. The spatial clustering pattern of walking activity intensity (Figure 4b) indicates that high-intensity walking is concentrated in the central urban area, with its spatial extent largely overlapping the main distribution of medium-support spaces. The temporal stability pattern, represented by the number of active months (Figure 4c), shows that areas with high stability are mainly distributed along continuous public open spaces, predominantly corresponding to medium-support and some high-support spaces. Observing the spatial clustering of walking intensity (Figure 4b) reveals that areas of high walking activity do not necessarily coincide with the highest support level, despite their central concentration and overlap with medium-support spaces. The temporal stability pattern (Figure 4c) further illustrates this misalignment: regions of high stability are often aligned along rivers, lakes, or continuous public space corridors, and in terms of typology, they are more frequently associated with medium-support and some high-support spaces.
Under Wuhan’s high-temperature and high-humidity summer conditions, high-support spaces still maintain a relatively high proportion of walking activity, indicating that these spaces can sustain relatively stable walking patterns throughout the year. The distribution of high-support spaces along waterfronts and green corridors is closely associated with the city’s blue–green space layout and accessibility to public open spaces. Medium-support spaces form the main context for routine, non-purposeful walking, whereas low-support spaces are characterized by sporadic use and temporal instability.

4.2. Overall Importance of Built-Environment Variables for Walking Support Space Types

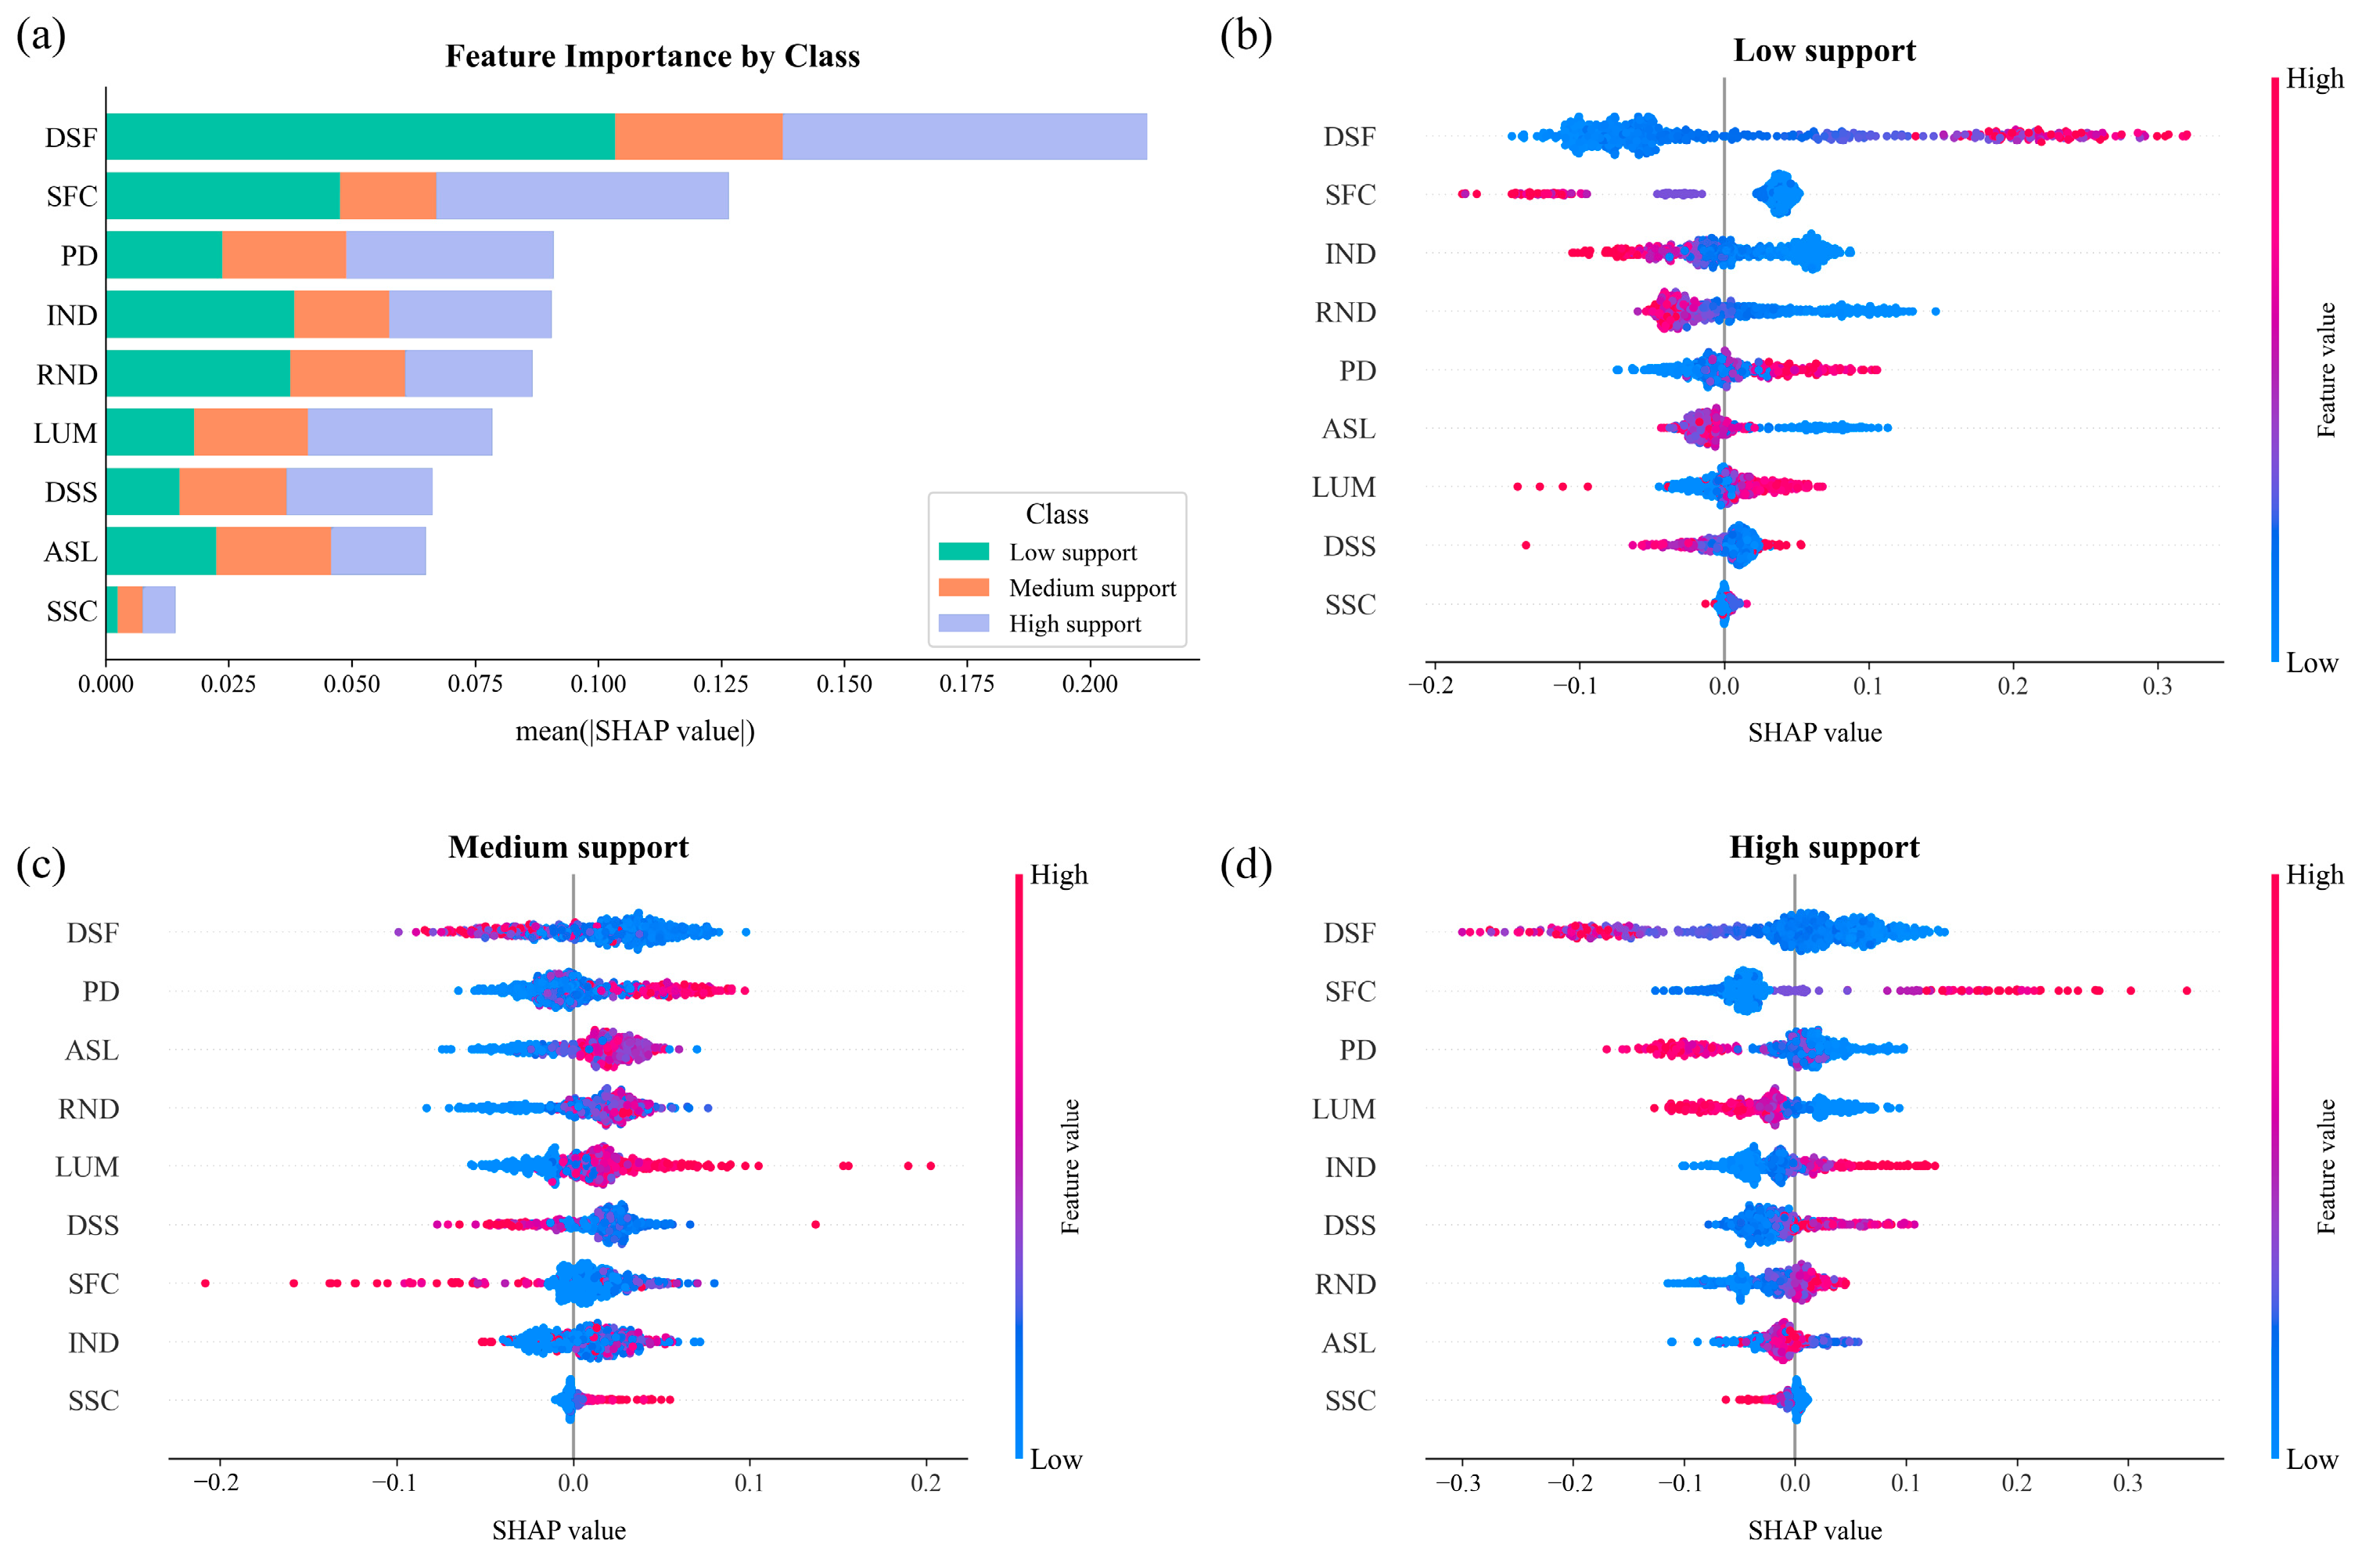
Based on SHAP interpretation results from the multiclass model, the relative importance and directional contributions of built-environment variables in identifying walking support space types were examined from two perspectives: the global importance structure and type-specific discriminative patterns (Figure 5). Figure 5a presents the mean absolute SHAP values of variables across different support types, which were used to quantify the overall magnitude of each variable’s contribution to model outputs. Figure 5b–d display the relationships between variable values and SHAP values for low-, medium-, and high-support spaces, respectively, with color gradients indicating the magnitude of variable values.
As shown in Figure 5a, built-environment variables exhibited marked differences in their contributions to the discrimination of walking support space types. Distance to the nearest scenic feature (DSF) exhibited the highest level of importance across all three walking support types, substantially exceeding that of other variables and serving as the primary basis for model discrimination. This result suggests that, at the scale of the study area, spatial differentiation in walking support capacity was primarily shaped by distance-related constraints—specifically, whether attractive scenic and open-space resources could be accessed within a reasonable walking range. In addition, scenic feature count (SFC) showed relatively high importance in both low-support and high-support spaces, forming a second tier of key variables. This pattern indicates that, once basic accessibility was ensured, differences in the provision of environmental amenities further differentiated support levels across space.
By comparison, road network density (RND), intersection density (IND), and population density (PD) exhibited moderate overall contributions, reflecting their roles as fundamental spatial conditions for the occurrence of walking activity. In contrast, distance to the nearest subway station (DSS), average street segment length (ASL), and subway station count (SSC) showed relatively limited marginal contributions, suggesting that no single facility-related or morphological attribute alone dominated the formation of walking support space types.
By examining the SHAP distribution results in Figure 5b–d, directional differences in the contributions of variables to the discrimination of different support types can be further observed. In low-support spaces (Figure 5b), high values of distance to the nearest scenic feature (DSF) were strongly concentrated in the positive SHAP range, indicating that poor accessibility to scenic resources constituted the most stable and distinctive discriminative feature of this type. When the walking environment persistently exhibited conditions characterized by long distances to scenic features and limited landscape provision, spatial units were more likely to be identified by the model as types with limited capacity to support sustained walking activity. Meanwhile, lower values of road network density (RND) and intersection density (IND) also tended to reinforce classification as low-support spaces, suggesting a compounding effect of weak basic spatial structure and accessibility constraints within this type. By contrast, scenic feature count (SFC) and the land-use mix index (LUM) exhibited relatively limited contributions in low-support spaces, with effects insufficient to offset deficiencies in accessibility and underlying spatial structure.
In medium-support spaces (Figure 5c), the SHAP distributions of multiple variables exhibited a relatively balanced pattern. The contribution directions of distance to the nearest scenic feature (DSF) and population density (PD) were not extreme in this type, whereas the land-use mix index (LUM) displayed a more stable positive discriminative pattern. This suggests that functional mix plays a meaningful role in sustaining routinized, everyday walking activity, but its standalone effect was insufficient to promote a transition toward the high-support category.
In high-support spaces (Figure 5d), the discriminative logic exhibited a distinctly different pattern. High values of scenic feature count (SFC) exerted a pronounced positive discriminative effect for high-support spaces in the model, while lower values of distance to the nearest scenic feature (DSF)—indicating higher scenic accessibility—further reinforced this classification. Together, these patterns indicate that high-support spaces typically exhibit environmental characteristics of both proximity to scenic features and abundant landscape provision. By contrast, population density (PD) did not demonstrate a consistently positive contribution in high-support spaces. Higher PD values were more frequently associated with negative SHAP ranges, indicating that, from a model discrimination perspective, excessively high population density did not further strengthen the identification of high-support spaces. This result suggests that population density functioned more as a background contextual condition in the model rather than as a decisive advantage for high-support spaces.
Taken together, the effects of built-environment variables on the discrimination of walking support space types were not linearly additive, but instead exhibited a clear hierarchical and functional structure. Scenic accessibility defined the basic threshold of walking support, the level of scenic resource provision further differentiated support levels across space, whereas population density and road network structure functioned primarily as background and synergistic conditions. This structural pattern appeared particularly plausible within the urban context of central Wuhan, characterized by high density and pronounced summer heat. On the one hand, high-temperature and high-humidity conditions amplified the sensitivity of walking activity to accessibility to shaded areas, green spaces, and waterfront environments, placing distance-related factors in a central position within the model discrimination. On the other hand, increases in population concentration or road network density alone were insufficient to offset the negative effects of adverse climatic conditions on the temporal stability of walking activity, and therefore were unlikely to independently support the formation of high-support spaces. These results indicate that under complex environmental conditions such as those in Wuhan, walking support capacity depended more on the combined configuration of accessibility and environmental resources than on the intensification of any single factor.

4.3. Nonlinear and Threshold Characteristics of Built-Environment Variables

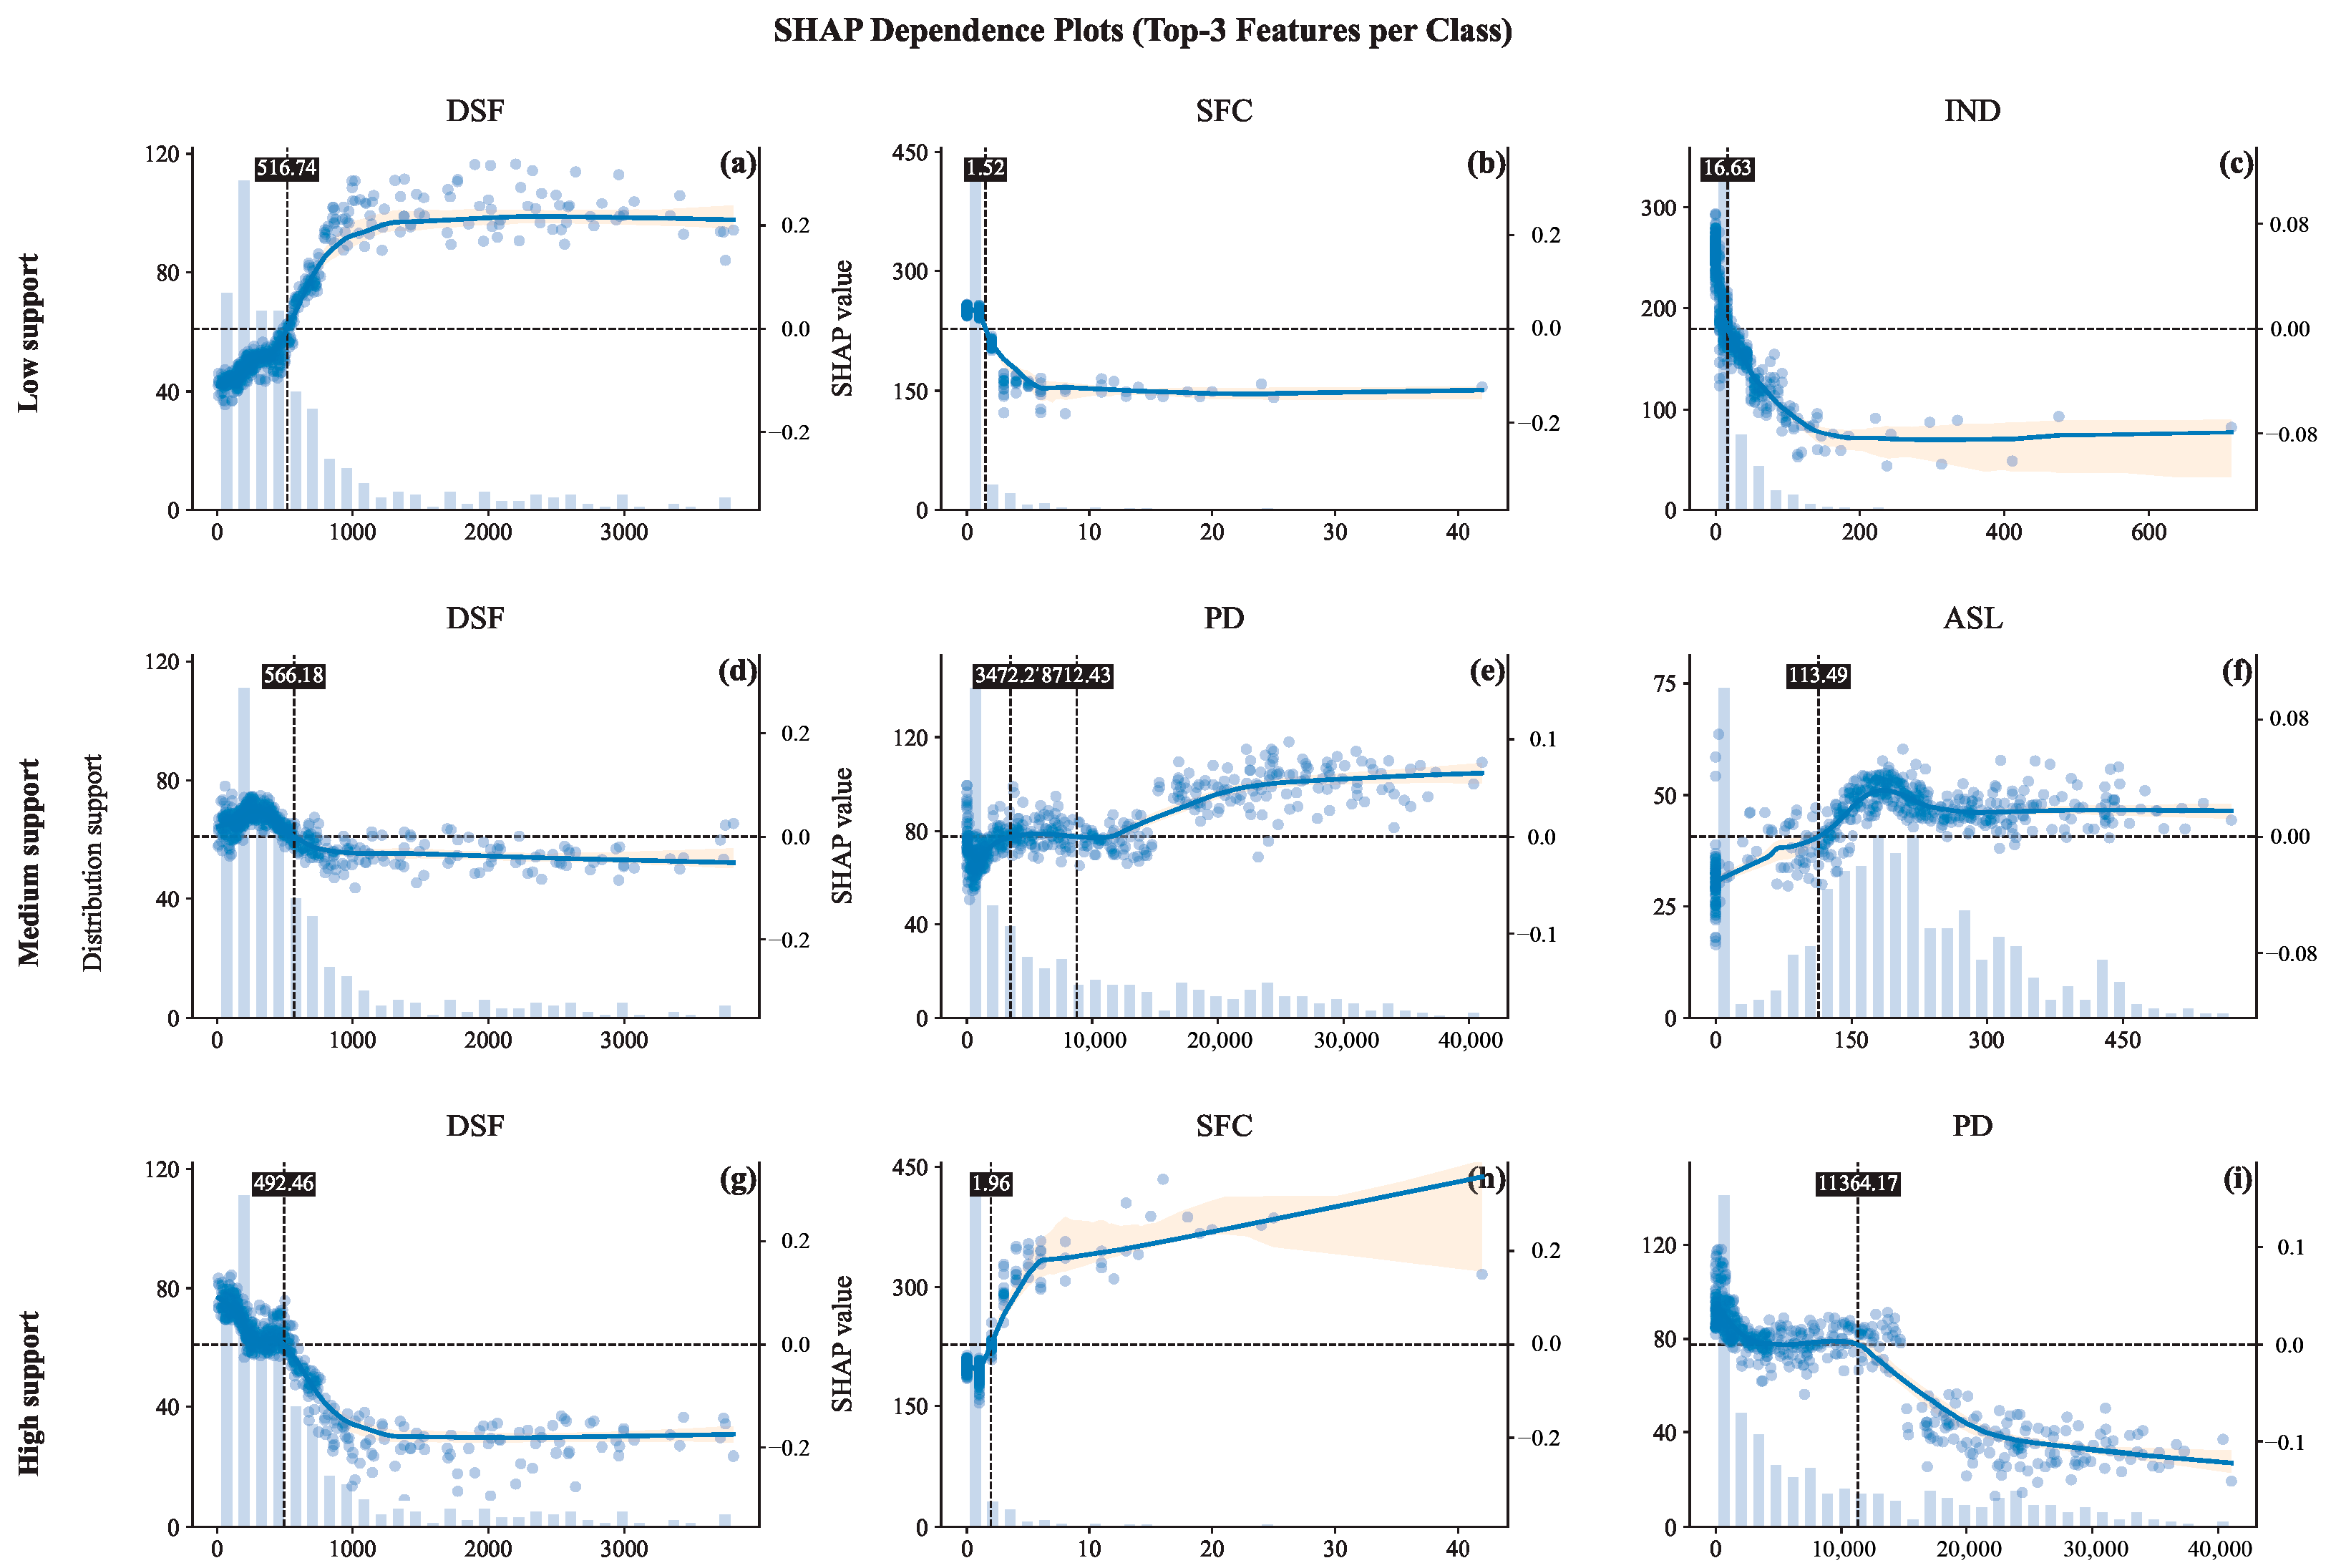
After establishing the overall importance of built-environment variables and their type-specific discriminative roles, SHAP dependence and interaction results revealed nonlinear response patterns and sensitive value ranges of key variables in model discrimination. Figure 5 and Figure 6 present only the top three built-environment variables with the highest discriminative contributions for each walking support level and their key interaction effects. The complete SHAP dependence and interaction results are provided in Supplementary Materials S2 and S3. It should be noted that the thresholds discussed in this study represent approximate value ranges at the level of model discrimination, intended to characterize intervals within which changes in variable values exert the greatest influence on support-type classification. These thresholds serve to identify sensitive response windows and to aid interpretation of threshold-like environmental constraints. Their credibility primarily derived from the consistency of overall patterns across multiple reasonable parameter settings and from the interpretability of cross-type comparisons, rather than from treating any single model fit as a rigid control standard for planning or policy-making.

4.3.1. Nonlinear Thresholds and Sensitive Ranges in Univariate Responses

Figure 6 shows that key built-environment variables generally exhibited nonlinear relationships with walking support space types, with their discriminative contributions concentrated within specific value ranges rather than varying linearly across the full range of values. Given that the analysis was conducted at a 500 m × 500 m grid scale, the following results are reported using approximate ranges that are interpretable at the planning scale.
(1) Low-support spaces: Dominance of distance thresholds and baseline deficiencies. In low-support spaces, distance to the nearest scenic feature (DSF) exhibited the most pronounced nonlinear pattern. When DSF exceeded approximately 500 m, the model’s discrimination of low-support spaces was markedly strengthened; by contrast, within the 500 m range, variations in distance exerted relatively limited influence on classification outcomes. This pattern indicates that a DSF value of around 500 m can be regarded as a critical distance threshold for low-support spaces, beyond which spatial units were more consistently identified as belonging to this category. By comparison, scenic feature count (SFC) and intersection density (IND) primarily exerted influence within very low value ranges. When SFC was below approximately one to two features, or when IND remained at low levels, discrimination toward low-support spaces was substantially strengthened; once this baseline level was exceeded, further increases produced rapidly diminishing marginal effects on classification. Low-support spaces exhibited clear baseline requirements with respect to the built environment: when facilities or structural conditions fell below minimum levels, spaces were readily classified as low-support, whereas improvements beyond this baseline were insufficient on their own to alter type assignment.
(2) Medium-support spaces: Composite patterns of suitable value ranges. Medium-support spaces exhibited a distinctive pattern characterized by the combination of suitable value ranges, with their formation not relying on extreme values of any single indicator but instead on a balanced configuration of multiple built-environment variables at moderate levels. Along the distance dimension, the key transition range for distance to the nearest scenic feature (DSF) was approximately 500–600 m. Medium-support classification occurred more frequently when distances approached or slightly exceeded this range, whereas discriminative contributions gradually weakened as distances increased further. In the population dimension, population density (PD) exhibited a clear interval effect: medium-support spaces were more likely to correspond to spatial units with moderate to moderately high population densities, rather than areas characterized by extremely low or extremely high density. From a morphological perspective, average street segment length (ASL) within the range of approximately 100–150 m was more favorable for medium-support classification, whereas both excessively short and excessively long segments were unfavorable for the formation of this type. The discriminative characteristics of medium-support spaces reflected a composite state in which multiple environmental indicators fell within suitable ranges, rather than the dominance of any single factor.
(3) High-support spaces: Coexistence of proximity advantages and density constraints. High-support spaces exhibited the most pronounced nonlinear characteristics. Along the distance dimension, distance to the nearest scenic feature (DSF) was most sensitive for high-support classification within an approximate range of 400–500 m. When scenic resources were located at close distances, even small variations exerted substantial influence on classification outcomes; once distances exceeded this range, discrimination toward high-support spaces declined rapidly, indicating a stronger requirement for proximity. In terms of resource provision, scenic feature count (SFC) exhibited a clear initiation range in high-support spaces. When SFC reached approximately two features or more, discrimination toward high-support spaces increased markedly; beyond this point, however, the marginal contribution of further increases gradually diminished. With respect to population characteristics, the discriminative role of population density (PD) was primarily evident within the moderate-to-high range of the sample distribution. When PD reached relatively high levels within the sample, its contribution to high-support classification no longer increased, indicating that population size alone was insufficient to distinguish high-support spaces.

4.3.2. Discriminative Patterns of Multivariable Interactions

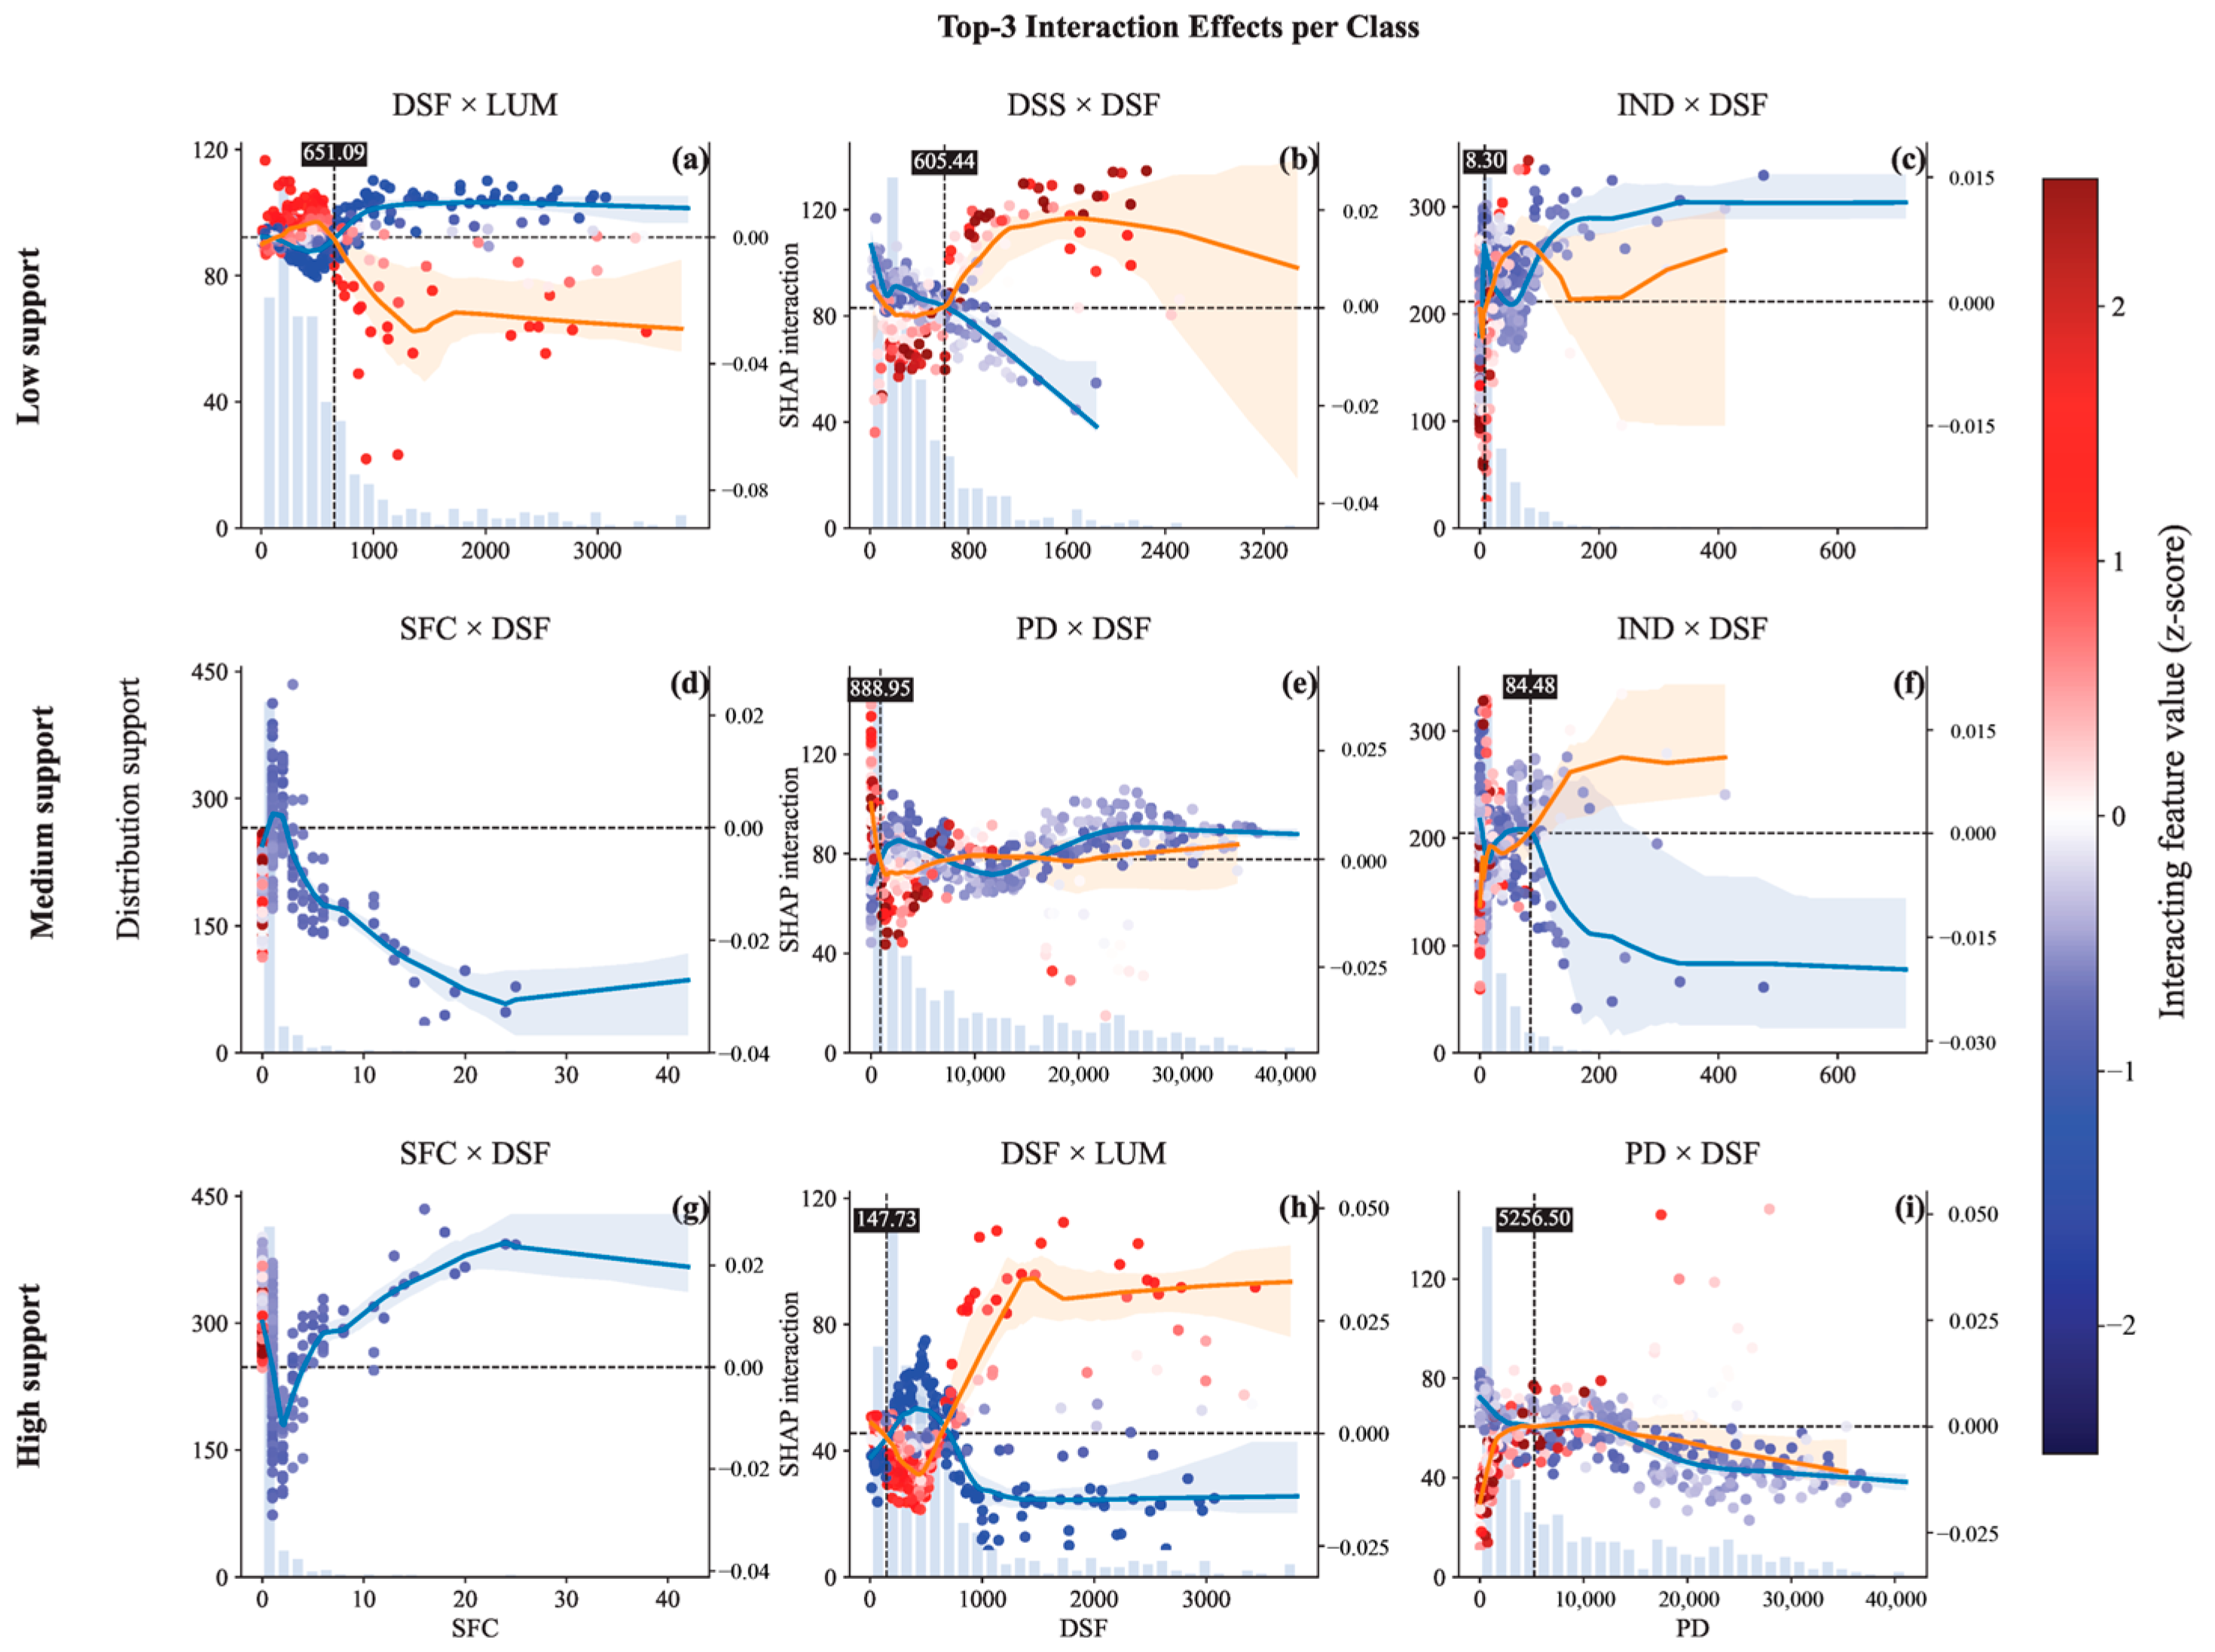
Beyond univariate nonlinear effects, the SHAP interaction results shown in Figure 7 further revealed that, under specific combinations, different built-environment factors could amplify, attenuate, or reconfigure both the direction and magnitude of their contributions to walking support type discrimination. These interaction effects were not uniformly present across support types, but instead exhibited clear type-specific differentiation.
In high-support spaces, scenic feature count (SFC) and distance to the nearest scenic feature (DSF) exhibited a stable synergistic relationship. When DSF fell within a relatively short range (approximately within 400 m), increases in SFC substantially raised the likelihood that samples were classified as high-support; as DSF increased, this synergistic effect gradually weakened, indicating that advantages in resource quantity were effectively translated into sustained walking support only under conditions of good accessibility. This pattern reflects a complementary mechanism between accessibility and the scale of resource provision in high-support spaces.
In medium-support spaces, interaction effects were overall weaker than those observed in high-support spaces, yet exhibited more pronounced conditional sensitivity and threshold characteristics. Taking the SFC × DSF and PD × DSF interactions as examples, when distance to the nearest scenic feature (DSF) remained within low to moderate ranges, variations in the associated factors exerted only limited influence on model discrimination. Once DSF exceeded a certain threshold, however, the corresponding SHAP interaction values rapidly shifted to negative, indicating that accessibility constraints began to dominate the discrimination process and increased the likelihood that these spaces were identified as non-high-support types. By contrast, increases in resource quantity or population density alone were insufficient to substantially improve support classification under conditions of poor accessibility. These patterns suggest that medium-support spaces did not rely on the synergistic amplification of multiple factors, but were instead more susceptible to a “lock-in effect” imposed by a single critical constraint, reflecting an intermediate state that is structurally unstable and highly sensitive to changes in environmental conditions.
In low-support spaces, multivariable interactions exhibited a clear coexistence of compensatory and additive patterns. On the one hand, distance to the nearest scenic feature (DSF) and the land-use mix index (LUM) demonstrated a compensatory effect. When DSF entered an unfavorable range (approximately beyond 600 m), higher levels of LUM partially attenuated the strength of low-support classification, indicating that functional mix could provide a limited buffer against poor accessibility. However, as DSF increased further (beyond roughly 1 km), distance-related constraints again became dominant, and the compensatory effect weakened markedly. On the other hand, distance to the nearest subway station (DSS) and DSF displayed a pronounced “additive deficit” relationship in low-support spaces. When both accessibility-related indicators simultaneously fell within unfavorable ranges, SHAP interaction values were distinctly positive and discrimination toward low-support spaces was substantially strengthened, indicating that multiple accessibility deficits were recognized by the model as cumulative adverse conditions.

5. Discussion

Based on walking trajectory data from Wuhan’s central urban area, this study identified different types of active healthy walking-supportive features in urban spaces and analyzed the relationship between behavioral temporal structures and built environment factors. The following discussion focuses on the core logic of walking-support capacity, pathways for implementing differentiated intervention strategies, and the applicability of the research framework under varying regional and technological conditions, aiming to provide theoretical support and practical guidance for targeted urban renewal.

5.1. Spatiotemporal Resilience of Walking Support Capacity and Its Spatial Differentiation

From the integrated perspective of behavioral characteristics, the “support capacity” of active healthy walking spaces should be understood as a composite state reflecting spatiotemporal resilience. The results indicate that although high-support spaces exhibit advantages in terms of walking intensity, their more critical feature lies in the temporal persistence and balance of walking activity—namely, the ability to maintain relatively stable activity levels across different months and even under adverse climatic conditions. By contrast, while medium- and low-support spaces show some overlap in total activity volume, they display pronounced divergence in terms of monthly variability and seasonal sensitivity, indicating a weaker capacity to adapt to temporal disturbances. This finding suggests that walking support should not be interpreted as a “snapshot” of momentary high-frequency activity, but rather as a behavioral carrying capacity that operates across time scales, with its value residing more in long-term stability than in short-term peaks. Previous studies have also highlighted that the temporal regularity and persistence of walking behavior carry significant implications for health outcomes, independent of single-event intensity [79]. In this context, “spatiotemporal resilience” can be regarded as a core characteristic dimension for differentiating between varying levels of walking-support capacity.
These behavioral differences exhibit a clear corresponding logic at the level of the built environment. Overall, the formation of walking support spaces is first constrained by accessibility-related thresholds, and only subsequently shaped by differences in resource provision and spatial quality. The results indicate that distance-related indicators consistently occupy a central role in the discrimination of low-support spaces, with accessibility to scenic resources exerting particularly uniform and robust influences on type identification. This implies that, in the absence of reasonable walking accessibility, improvements in other environmental attributes are unlikely to translate into sustained walking support at the behavioral level. This “accessibility-first, configuration-later” nonlinear response pattern corroborates the “spatial threshold effect” proposed by some scholars [80,81], indicating that before surpassing specific physical distance barriers, marginal increases in greening ratio or functional mix contribute very little to behavioral outcomes. Recent studies on active travel similarly demonstrate that distance decay and nonlinear responses are critical features shaping walking behavior, and that improvement pathways do not follow a simple pattern of continuous incremental gains [82,83].
On this basis, high-support spaces further manifest as the synergistic accumulation of multiple high-quality attributes, such as higher levels of scenic resource provision and more favorable land-use mix conditions. The combination of these spatial quality elements at appropriate scales enables high-support spaces to maintain relatively stable walking activity structures even under adverse environmental conditions such as high temperatures. By contrast, although medium-support spaces have crossed the basic accessibility threshold, the absence of concentrated high-quality resources means that walking activity remains largely at a routinized and foundational level of support.
Population density does not emerge as a decisive advantage in the formation of walking support spaces. Although population size provides a potential demand base for walking activity, the results show that, at higher support levels, the marginal contribution of population density does not continue to increase with rising density, but instead levels off or even declines in high-density ranges. Within an active healthy walking framework, population density therefore appears to function more as a background condition than as a core supporting factor. Under certain circumstances, high-density environments may also be associated with adverse experiences—such as crowding, heat exposure, or spatial compression—that weaken their positive contribution to walking resilience. This finding challenges the conventional urban planning assumption that “high density necessarily generates high vitality” [84] and aligns with recent research indicating that heat exposure and perceived crowding in high-density environments can suppress the willingness to walk [85,86,87]. This pattern also helps explain the decentralized and corridor-oriented distribution of high-support spaces in the overall spatial structure. Although urban cores typically exhibit the highest population densities and walking intensities, imbalances in the temporal structure of walking activity make them more likely to remain at a medium-support level. By contrast, certain non-central nodes or linear public spaces, when characterized by good accessibility and high-quality blue–green resource provision, are more likely to develop walking support spaces with strong spatiotemporal resilience. This spatial mismatch between “activity flow centers” and “support capacity hotspots” highlights the dual dependence of active healthy walking on environmental quality and temporal stability.
Collectively, spatial differentiation in walking support capacity should not be interpreted as the direct outcome of any single environmental attribute or differences in activity volume, but rather as a spatial manifestation of the correspondence between behavioral temporal structure and built-environment conditions across multiple levels. In this sense, high-support spaces represent not “more walking”, but “more stable walking”. Their spatial patterns reflect a structural relationship between long-term behavioral stability and environmental conditions, rather than a simple projection of short-term activity intensity.

5.2. Targeted Spatial Intervention Strategies for Active Health

Based on the spatial differentiation of walking support space types and their correspondence with built-environment conditions, spatial interventions oriented toward active health should not adopt uniform scales or homogenized configurations. Instead, tiered and differentiated intervention strategies are required, tailored to the behavioral temporal structures and spatial constraints associated with different support levels.
As a typical high-density city characterized by prolonged periods of high temperature and humidity in summer, central Wuhan exemplifies spatial differentiation patterns of walking support that largely reflect the common challenges faced by cities in the middle and lower reaches of the Yangtze River, as well as other large cities under hot–humid climatic conditions. Accordingly, the following strategies are not limited to Wuhan, but may also serve as a reference framework for cities with similar climatic exposure and spatial structural characteristics.
(1) Low-support spaces: Foundational interventions oriented toward accessibility compensation.
Low-support spaces are commonly characterized by limited walking activity, highly unstable temporal distributions, and a marked decline in attractiveness for walking during hot seasons. Empirical results from Wuhan show that such spaces are frequently associated with pronounced barriers to pedestrian access. When walking distances to the nearest scenic or public open spaces remain persistently large, conditions conducive to sustained walking activity are difficult to establish. Therefore, intervention strategies should focus on “accessibility compensation”, prioritizing the mitigation of deficiencies in basic walking conditions. Compared with indiscriminately adding high-quality landscape nodes, a more pragmatic and effective approach involves systematically reducing physical barriers and enhancing the fundamental connectivity and convenience of the walking system. Compressing residents’ walking distance to essential public services or open spaces within more accessible threshold ranges provides the foundational guarantee for improving walking-support capacity in such spaces. These interventions are essentially “baseline” measures, aiming not to significantly increase walking intensity in the short term, but to establish the necessary conditions for regular walking activity, thereby preventing spaces from remaining in a low-vitality state due to reliance on sporadic trips over time.
At the design strategy level, a “targeted acupuncture” approach should be prioritized, wherein small-scale interventions achieve systemic efficiency improvements. For example, densifying the pedestrian network within superblocks, adding embedded pocket parks, or opening blocked street segments can ensure that residents’ walking distances to the nearest landscape resources remain within an acceptable threshold of 300–500 m. The core logic of such interventions lies in eliminating physical barriers to provide basic conditions for routine walking, thereby establishing an accessibility foundation for the sustained enhancement of spatial vitality.
(2) Medium-support spaces: Fine-grained optimization centered on stability enhancement.
Medium-support spaces accommodate the largest share of everyday walking activity in cities; however, their key vulnerability lies in sensitivity to seasonal variation—while routinized flows are present, walking activity declines markedly during periods of high summer heat. Accordingly, intervention priorities should shift from simply expanding facility provision toward enhancing the capacity of walking environments to adapt to adverse climatic conditions. In practice, emphasis should be placed on developing an environment optimization system oriented toward “microclimate regulation”. Specific measures include creating continuous shading systems such as tree-lined avenues and corridor-style walking spaces, optimizing street cross-section design to prioritize pedestrian experience, and introducing permeable pavements or localized cooling-island elements that provide cooling and humidifying functions. This micro-scale environment-focused renewal approach demonstrates strong adaptability and replicability in hot and humid urban climates. Its primary goal is to mitigate seasonal fluctuations in walking behavior and enhance the space’s capacity to support walking under all climatic conditions, rather than seeking rapid short-term increases in pedestrian flows.
(3) High-support spaces: Protective interventions focused on quality maintenance and overload prevention.
High-support spaces generally exhibit large-scale walking activity and significant temporal stability, serving as important spatial carriers for active healthy behaviors in urban environments. In these spaces, intervention goals should shift from further stimulating activity to ensuring long-term quality maintenance and systematically managing potential overuse risks. The core principle is to apply an “asset management” perspective to balance space usage intensity with environmental carrying capacity, preventing the overexploitation of spatial health value due to frequent use.
At the planning and regulatory level, boundary control should be strengthened for ecologically sensitive public spaces such as riverside and lakeside areas, strictly limiting the uncontrolled encroachment of commercial facilities to protect ecological foundations and landscape synergies. At the operational management level, dynamic monitoring and response mechanisms should be established, such as crowd density warning systems and diversion guidance frameworks, effectively controlling peak-period pedestrian flows and avoiding declines in space quality or user conflicts caused by overconcentration. Furthermore, attention should be paid to the composite configuration of spatial functions and scene integration, for example by embedding informal exercise facilities (e.g., outdoor fitness equipment, stretching nodes) within landscape corridors, transforming visually oriented spaces into interactive health behavior-support systems. Through these intervention pathways, the health value of high-support spaces can be maximized under conditions of sustained use.
Improvements in walking support capacity should not rely solely on the continued intensification of central urban areas or high-activity zones. A more broadly applicable strategic pathway lies in enabling low-support areas to cross basic viability thresholds through “gap-filling”, enhancing resilience in medium-support areas to enable adaptation to all-weather conditions, and preventing overload in high-support areas to sustain long-term quality—thereby constructing an active healthy walking network that is more extensive in coverage and more adaptable to climatic conditions.

5.3. Limitations and Future Research

Although this study provides a systematic analysis of walking support characteristics from an integrated perspective combining behavioral temporal structure and built-environment attributes, several aspects remain open for further refinement.
With respect to study scope and spatial scale, the analysis is conducted within the central urban area of Wuhan using a 500 m grid framework. This spatial resolution facilitates the identification of large-scale spatial differentiation in walking support across the city, but it inevitably smooths out finer-grained variations at the street-segment level. Certain spatial characteristics closely related to walking experience—such as variations in street cross-sections, continuity of shading, or localized microclimatic conditions—may therefore not be fully captured at the adopted scale. Future research may extend the current framework by incorporating multi-scale analytical approaches to compare the stability and variability of walking support characteristics across different spatial resolutions. At the technical implementation level, the multimodal large-model analytical framework developed in this study imposes high requirements on data accuracy (e.g., trajectory data) and computational resources. Future research should explore how low-cost data sources, such as open-source POIs or volunteer geographic information, can be leveraged to “lightweight” the framework, thereby enhancing its applicability in regions with limited technical capacity.
At the level of walking behavior data, the trajectories used in this study are derived from real-world individual walking records and are therefore well suited to capturing the actual spatial and temporal distribution of walking activities. Nevertheless, such data may still be influenced by sample composition, with relatively greater representation of individuals who exhibit stronger mobility motivation or higher levels of participation in digital activity recording. Under high-temperature or other adverse environmental conditions, this sample composition may give rise to a form of “survivor bias”, whereby walking activities that continue to be recorded are more likely to originate from individuals who remain willing and able to sustain walking under such conditions. This bias does not constitute random noise, but may exert a directional influence on the classification of walking support types. Specifically, some everyday walking spaces characterized by short distances, high frequency, and low intensity—despite their health or functional relevance in particular life contexts—may be more likely to be classified as low-support spaces in this study, as they exert limited attraction for sustained and intentional walking behavior. Accordingly, classification as low-support does not imply an absence of health value, but rather indicates a relatively limited capacity to support long-term and stable walking activity within the behavioral framework defined by the current sample. Furthermore, due to the anonymized design of the platform’s public interface, this study cannot determine whether the same user contributed multiple trajectories, nor can it control for the potential influence of individual user heterogeneity on spatial preferences. Future research may enhance the robustness of these findings across different population structures by incorporating behavioral data from multiple sources to cross-validate walking support characteristics.
From the perspective of built-environment representation, this study primarily focuses on structural indicators such as accessibility, resource provision, road network configuration, and population activity, while the characterization of environmental quality and perceptual dimensions remains relatively limited. Several factors closely related to the temporal stability of walking behavior—such as shading quality, thermal comfort, and spatial continuity—are not yet fully incorporated into the analytical framework. Future studies may integrate street-view imagery, multimodal environmental sensing data, or in situ observations to achieve a more detailed and nuanced characterization of walking environment features.
From a global generalizability perspective, this study is grounded in the high-density, hot–humid climate context of Wuhan. Although the “spatiotemporal resilience” evaluation framework is broadly applicable, its environmental sensitivity thresholds may shift across different regions and cultural settings. For example, in cold climates, the key to walking support may lie in wind protection and connectivity of indoor systems, whereas in low-density, car-dependent cities, interventions may need to focus on land-use compactness. Additionally, cultural preferences for social walking can influence the definition of “support capacity”. Future research could validate and refine this typology within a broader global context to enhance the inclusivity and applicability of the findings.
In summary, this study offers a new perspective on understanding the support characteristics of active healthy walking spaces through its methodological framework and empirical analysis; however, its findings should be interpreted within the defined study scope and data conditions. Further extensions focusing on behavioral temporal structure, spatial scale, and modes of environmental representation would help deepen understanding of walking support characteristics and promote future research toward more refined and integrative approaches.

6. Conclusions

From the perspective of behavioral temporal structure, this study provides a systematic analysis of how urban spaces support active healthy walking, demonstrating that walking support is not a simple projection of activity volume but is more fundamentally reflected in the persistence and seasonal adaptability of walking behavior over time. Empirical evidence from the central urban area of Wuhan indicates that reliance solely on walking intensity or population concentration is insufficient for accurately identifying spatial units with long-term relevance for active health outcomes.
Methodologically, this study develops a multidimensional representation framework of walking support that integrates behavioral intensity, temporal stability, and behavioral rhythm, and employs a data-driven, unsupervised analytical strategy to identify distinct types of walking support spaces. This approach helps mitigate the structural biases that may arise from reliance on single intensity indicators or linear threshold-based classifications in complex urban contexts. Building on this framework, interpretable machine learning techniques are further applied to examine the relative contribution structures and nonlinear effects of built-environment factors in distinguishing different walking support types, thereby providing an operational analytical pathway for understanding the context-dependent importance of environmental conditions.
The empirical findings indicate that the formation of walking support capacity is initially constrained by accessibility conditions, upon which differences in environmental resource provision and spatial quality further shape the differentiation among support types. This suggests that walking support does not increase through a linear accumulation of built-environment attributes, but instead follows a hierarchical generative process, in which the effects of environmental quality and resource provision become more pronounced only after basic accessibility requirements are met. In high-density urban contexts with pronounced summer environmental constraints, concentrations of walking activity do not necessarily correspond to more stable temporal structures; instead, some non-central spaces with good accessibility and high-quality public space conditions are more likely to exhibit sustained capacity for supporting walking behavior over time.
From the perspective of urban planning and active health practice, the findings suggest that, in comparable urban contexts, walking system optimization should not focus solely on increasing activity intensity, but should place greater emphasis on the temporal stability of walking behavior and its capacity to adapt to environmental conditions. Implementing differentiated interventions across walking support levels—addressing basic accessibility deficits in low-support spaces, enhancing environmental continuity and comfort in medium-support spaces, and prioritizing quality maintenance in high-support spaces—can contribute to the development of an urban walking network with broader coverage and stronger seasonal adaptability.
In general, this study proposes an integrated analytical framework for identifying and interpreting urban spaces that support active healthy walking. Its contribution lies not in prescribing universal standards for facility provision, but in articulating a logic of assessment grounded in behavioral temporal structure and the nonlinear effects of environmental conditions. This framework offers a new perspective for understanding the spatial differentiation of walking support characteristics in complex urban contexts and provides a methodological foundation for future studies employing multi-scale analyses and diverse data sources.

Supplementary Materials

The following supporting information can be downloaded at: https://www.mdpi.com/article/10.3390/buildings16061182/s1, Supplementary Material S1: Model selection and performance evaluation results; Supplementary Material S2: SHAP dependence plots for built-environment variables; Supplementary Material S3: SHAP interaction plots illustrating variable interaction effects.

Author Contributions

Conceptualization, H.H. and Y.L.; methodology, Y.L.; software, Y.L.; validation, H.H. and Y.L.; formal analysis, Y.L. and L.G.; investigation, Y.L. and W.-P.L.; resources, H.H.; data curation, Y.L. and Q.-H.Z.; writing—original draft preparation, Y.L.; writing—review and editing, H.H. and Y.L.; visualization, Y.L.; supervision, H.H.; project administration, Y.L.; funding acquisition, H.H. All authors have read and agreed to the published version of the manuscript.

Funding

This research was funded by the National Natural Science Foundation of China (Grant No. 52578073), the Key Program of the Hubei Provincial Social Science Fund (Grant No. HBSKJJ20250228), and the Fundamental Research Funds for the Central Universities (Grant No. 2021WKZDJC014).

Institutional Review Board Statement

Ethical review and approval were waived for this study because the data used were obtained from anonymized location-based services and public urban datasets. All behavioral data were aggregated and de-identified prior to analysis, ensuring that no individual’s privacy was compromised.

Informed Consent Statement

Informed consent was obtained from all subjects involved in the study.

Data Availability Statement

The data presented in this study are available on request from the corresponding author.

Acknowledgments

The authors would like to thank the members of the research team for their contributions to data preparation, methodological discussion, and internal review during the course of this study. Any remaining errors are the sole responsibility of the authors.

Conflicts of Interest

The authors declare no conflicts of interest.

References

  1. Brand, C.; Götschi, T.; Dons, E.; Gerike, R.; Anaya-Boig, E.; Avila-Palencia, I.; de Nazelle, A.; Gascon, M.; Gaupp-Berghausen, M.; Iacorossi, F.; et al. The climate change mitigation impacts of active travel: Evidence from a longitudinal panel study in seven European cities. Glob. Environ. Chang.-Hum. Policy Dimens. 2021, 67, 102224. [Google Scholar] [CrossRef]
  2. Ding, D.; Nguyen, B.; Nau, T.; Luo, M.Y.; Cruz, B.D.; Dempsey, P.C.; Munn, Z.; Jefferis, B.J.; Sherrington, C.; Calleja, E.A.; et al. Daily steps and health outcomes in adults: A systematic review and dose-response meta-analysis. Lancet Public Health 2025, 10, e668–e681. [Google Scholar] [CrossRef]
  3. Veitch, J.; Ball, K.; Rivera, E.; Loh, V.; Deforche, B.; Best, K.; Timperio, A. What entices older adults to parks? Identification of park features that encourage park visitation, physical activity, and social interaction. Landsc. Urban Plan. 2022, 217, 104254. [Google Scholar] [CrossRef]
  4. Yin, G.M.; Huang, Z.; Fu, C.; Ren, S.L.; Bao, Y.; Ma, X.L. Examining active travel behavior through explainable machine learning: Insights from Beijing, China. Transp. Res. Part D-Transp. Environ. 2024, 127, 104038. [Google Scholar] [CrossRef]
  5. Albini, A.; La Vecchia, C.; Magnoni, F.; Garrone, O.; Morelli, D.; Janssens, J.P.; Maskens, A.; Rennert, G.; Galimberti, V.; Corso, G. Physical activity and exercise health benefits: Cancer prevention, interception, and survival. Eur. J. Cancer Prev. 2025, 34, 24–39. [Google Scholar] [CrossRef]
  6. Dempsey, P.C.; Rowlands, A.; Strain, T.; Zaccardi, F.; Dawkins, N.; Razieh, C.; Davies, M.J.; Khunti, K.K.; Edwardson, C.L.; Wijndaele, K.; et al. Physical activity volume, intensity, and incident cardiovascular disease. Eur. Heart J. 2022, 43, 4789–4800. [Google Scholar] [CrossRef] [PubMed]
  7. Hall, K.S.; Hyde, E.T.; Bassett, D.R.; Carlson, S.A.; Carnethon, M.R.; Ekelund, U.; Evenson, K.R.; Galuska, D.A.; Kraus, W.E.; Lee, I.M.; et al. Systematic review of the prospective association of daily step counts with risk of mortality, cardiovascular disease, and dysglycemia. Int. J. Behav. Nutr. Phys. Act. 2020, 17, 78. [Google Scholar] [CrossRef] [PubMed]
  8. Stens, N.A.; Bakker, E.A.; Mañas, A.; Buffart, L.M.; Ortega, F.B.; Lee, D.C.; Thompson, P.D.; Thijssen, D.H.J.; Eijsvogels, T.M.H. Relationship of Daily Step Counts to All-Cause Mortality and Cardiovascular Events. J. Am. Coll. Cardiol. 2023, 82, 1483–1494. [Google Scholar] [CrossRef]
  9. Ungvari, Z.; Fazekas-Pongor, V.; Csiszar, A.; Kunutsor, S.K. The multifaceted benefits of walking for healthy aging: From Blue Zones to molecular mechanisms. Geroscience 2023, 45, 3211–3239. [Google Scholar] [CrossRef] [PubMed]
  10. Hillnhütter, H. Walking environments for transit access: Travelers’ perspectives. J. Transp. Geogr. 2025, 129, 104414. [Google Scholar] [CrossRef]
  11. Shilton, T.; Bauman, A.; Beger, B.; Chalkley, A.; Champagne, B.; Elings-Pers, M.; Giles-Corti, B.; Goenka, S.; Miller, M.; Milton, K.; et al. More People, More Active, More Often for Heart Health—Taking Action on Physical Activity. Global Heart 2024, 19, 42. [Google Scholar] [CrossRef]
  12. Baeza, J.L.; Carpio-Pinedo, J.; Sievert, J.; Landwehr, A.; Preuner, P.; Borgmann, K.; Avakumovic, M.; Weissbach, A.; Bruns-Berentelg, J.; Noennig, J.R. Modeling Pedestrian Flows: Agent-Based Simulations of Pedestrian Activity for Land Use Distributions in Urban Developments. Sustainability 2021, 13, 9268. [Google Scholar] [CrossRef]
  13. Jiang, F.F.; Ma, J. Predicting Urban Vitality at Regional Scales: A Deep Learning Approach to Modelling Population Density and Pedestrian Flows. Smart Cities 2025, 8, 58. [Google Scholar] [CrossRef]
  14. Ma, H.; Wang, M.H.; Li, J.Q.; Liu, H. Public Space Optimization Strategy Through Social Network Analysis in Shenzhen’s Gongming Ancient Fair. Land 2025, 14, 1267. [Google Scholar] [CrossRef]
  15. Zhou, Y.T.; Zhao, Q. Simulation Study on Age-Friendly Design of Community Park Activity Spaces Based on AnyLogic: A Case Study of Qiaokou Park in Wuhan. Buildings 2025, 15, 3419. [Google Scholar] [CrossRef]
  16. Bin Sulaiman, F. Striding towards sustainable urban livability: Evaluating walkability efficiency vis-a-vis population dynamics in Saudi Arabia cities. Cogent Soc. Sci. 2024, 10, 2340428. [Google Scholar] [CrossRef]
  17. Fan, P.Y.; Chun, K.P.; Mijic, A.; Tan, M.L.; Liu, M.S.; Yetemen, O. A framework to evaluate the accessibility, visibility, and intelligibility of green-blue spaces (GBSs) related to pedestrian movement. Urban For. Urban Green. 2022, 69, 127494. [Google Scholar] [CrossRef]
  18. Lee, S.H.; Kim, H.; Han, H. Transforming urban neighborhoods from ‘bed towns’ to eco-friendly smart cities in Korea. Cities 2025, 166, 106258. [Google Scholar] [CrossRef]
  19. Yoshida, N.; Nakai, T. Impact analysis of street space quality on pedestrian behavior using mobile probe data. Iatss Res. 2024, 48, 477–486. [Google Scholar] [CrossRef]
  20. Cerin, E.; Sallis, J.F.; Salvo, D.; Hinckson, E.; Conway, T.L.; Owen, N.; van Dyck, D.; Lowe, M.; Higgs, C.; Moudon, A.V.; et al. Determining thresholds for spatial urban design and transport features that support walking to create healthy and sustainable cities: Findings from the IPEN Adult study. Lancet Glob. Health 2022, 10, E895–E906. [Google Scholar] [CrossRef]
  21. He, X.; He, S.Y. Decoding the spatial effects of walkability on walking behavior among older adults by integrating big data and small data. Cities 2025, 156, 105537. [Google Scholar] [CrossRef]
  22. Zeng, Q.; Wu, H.; Wei, Y.Y.; Wang, J.J.; Zhang, C.Y.; Fei, N.Y.; Dewancker, B.J. Association between built environment factors and collective walking behavior in peri-urban area: Evidence from Chengdu. Appl. Geogr. 2024, 167, 103274. [Google Scholar] [CrossRef]
  23. Li, B.; Zhang, H.L.; Yang, Y.W. Mapping environmental influences on walking behavior across urban morphologies: A local climate zone-based study. Urban Clim. 2025, 62, 102503. [Google Scholar] [CrossRef]
  24. Cruz, B.D.; Ahmadi, M.; Sabag, A.; Saint Maurice, P.F.; Lee, I.M.; Stamatakis, E. Step Accumulation Patterns and Risk for Cardiovascular Events and Mortality Among Suboptimally Active Adults. Ann. Intern. Med. 2025, 178, 1718–1727. [Google Scholar] [CrossRef] [PubMed]
  25. Wang, M.H.; Haworth, J.; Chen, H.F.; Liu, Y.Z.; Shi, Z.X. Investigating the potential of crowdsourced street-level imagery in understanding the spatiotemporal dynamics of cities: A case study of walkability in Inner London. Cities 2024, 153, 105243. [Google Scholar] [CrossRef]
  26. Fang, C.Y.; Homma, R.; Liu, Q.; Liu, H.; Ridwan, A.S.S. Research on the Factors of Pedestrian Volume in Different Functional Areas of Kumamoto City. Sustainability 2022, 14, 1636. [Google Scholar] [CrossRef]
  27. Ge, J.Y.; Wen, Y.H.; Lee, J.; Li, X.W. Assessing Spatial Associations Between Crime Exposure and Neighborhood Walkability: A Cross-Sectional Analysis of Socio-Environmental Moderators in Detroit. Land 2025, 14, 2366. [Google Scholar] [CrossRef]
  28. Jiang, H.X.; Zhang, Q.R.; Guo, K.F.; Helbich, M.; Yang, H.R. How the built environment shapes our daily journeys: A nonlinear exploration of home and work environments’ relationship with active travel in Shanghai, China. Transp. Res. Part A-Policy Pract. 2025, 192, 104377. [Google Scholar] [CrossRef]
  29. Ding, Y.; He, H.; Li, Y.; Zhao, X.-Y.; Zhang, H.; Zhang, T. Investigating the Influence Patterns of the Built Environment on Residents’ Self-Rated Health: An Interpretable Machine Learning Approach. Buildings 2026, 16, 66. [Google Scholar]
  30. Han, Y.; Qin, C.P.; Xiao, L.Z.; Ye, Y. The nonlinear relationships between built environment features and urban street vitality: A data-driven exploration. Environ. Plan. B-Urban Anal. City Sci. 2024, 51, 195–215. [Google Scholar] [CrossRef]
  31. Tao, T.; Cao, J. Exploring nonlinear and collective influences of regional and local built environment characteristics on travel distances by mode. J. Transp. Geogr. 2023, 109, 103599. [Google Scholar] [CrossRef]
  32. Tao, T.; Wu, X.Y.; Cao, J.; Fan, Y.L.; Das, K.; Ramaswami, A. Exploring the Nonlinear Relationship between the Built Environment and Active Travel in the Twin Cities. J. Plan. Educ. Res. 2023, 43, 637–652. [Google Scholar] [CrossRef]
  33. Xu, Y.; Wang, Y.K.; Liu, H.L.; Huang, J.L.; Huang, Y.L.; Luo, M. Examining the Nonlinear Relationship Between Built Environment and Residents’ Leisure Travel Distance: A Case Study of Guangzhou, China. Land 2025, 14, 2392. [Google Scholar] [CrossRef]
  34. Wu, J.; Li, C.; Zhu, L.; Liu, X.; Peng, B.; Wang, T.; Yuan, S.; Zhang, Y. Nonlinear and threshold effects of built environment on older adults’ walking duration: Do age and retirement status matter? Front. Public Health 2024, 12, 1418733. [Google Scholar] [CrossRef]
  35. Venerandi, A.; Mellen, H.; Romice, O.; Porta, S. Walkability Indices-The State of the Art and Future Directions: A Systematic Review. Sustainability 2024, 16, 6730. [Google Scholar] [CrossRef]
  36. Carmes, A.; Catteau, L.; Sonta, A.; Tavakoli, A. Urban forms across continents: A data-driven comparison of Lausanne Philadelphia. Transp. Res. Interdiscip. Perspect. 2026, 36, 101823. [Google Scholar] [CrossRef]
  37. Peng, W.; Dai, D.; Liu, F.; Wang, X. Spatiotemporal Heterogeneity and Socioeconomic Drivers of Landscape Patterns in High-Density Communities of Wuhan. Sustainability 2025, 17, 8093. [Google Scholar] [CrossRef]
  38. 2024 Statistical Bulletin on National Economic and Social Development of Wuhan; National Bureau of Statistics of China: Beijing, China, 2025.
  39. Shi, J.; Xu, A.; Feng, H.; Wang, Z.; Shi, M. Dynamic ventilation network optimization to mitigate urban thermal risk. Sustain. Cities Soc. 2025, 131, 106785. [Google Scholar] [CrossRef]
  40. Xia, T.; Zhang, L.; Zou, Y. Mismatch Between Heat Exposure Risk and Blue-Green Exposure in Wuhan: A Coupled Spatial Analysis. Sustainability 2025, 17, 8440. [Google Scholar] [CrossRef]
  41. Yin, C.; Yan, J.; Wen, Q.; Zhang, Y.; An, Z.; Wang, Y. Planar vs. Vertical Dominance? A Nonlinear Analysis of the Urban Landscape-Land Surface Temperature Nexus. Appl. Spat. Anal. Policy 2025, 18, 82. [Google Scholar] [CrossRef]
  42. Mueller, S.A.; Paltra, S.; Rehmann, J.; Ewert, R.; Nagel, K. Comparing GPS and cell-based mobile phone data to identify activity participation during the COVID-19 pandemic. EPJ Data Sci. 2024, 13, 71. [Google Scholar] [CrossRef]
  43. Molina-Campoverde, J.J.; Rivera-Campoverde, N.; Campoverde, P.A.M.; Naula, A.K.B. Urban Mobility Pattern Detection: Development of a Classification Algorithm Based on Machine Learning and GPS. Sensors 2024, 24, 3884. [Google Scholar] [CrossRef] [PubMed]
  44. Macnish, K.; Henschke, A. The Ethics of Surveillance in Times of Emergency; Oxford University Press: Oxford, UK, 2023. [Google Scholar]
  45. Nathvani, R.; Cavanaugh, A.; Suel, E.; Bixby, H.; Clark, S.N.; Metzler, A.B.; Nimo, J.; Moses, J.B.; Baah, S.; Arku, R.E.; et al. Measurement of urban vitality with time-lapsed street-view images and object-detection for scalable assessment of pedestrian-sidewalk dynamics. Isprs J. Photogramm. Remote Sens. 2025, 221, 251–264. [Google Scholar] [CrossRef]
  46. Huang, X.R.; Zeng, L.; Liang, H.X.; Li, D.Y.; Yang, X.; Zhang, B. Comprehensive walkability assessment of urban pedestrian environments using big data and deep learning techniques. Sci. Rep. 2024, 14, 26993. [Google Scholar] [CrossRef]
  47. Paba-Larios, M.F.; Gutiérrez, M.; Ramos, R.; Cantillo, V. Modeling the influence of built environment on pedestrian perceptions in colombian cities. Transp. Policy 2025, 163, 358–369. [Google Scholar] [CrossRef]
  48. Althoff, T.; Ivanovic, B.; King, A.C.; Hicks, J.L.; Delp, S.L.; Leskovec, J. Countrywide natural experiment links built environment to physical activity. Nature 2025, 645, 407–413. [Google Scholar] [CrossRef]
  49. Dou, L.; Chen, H.W.; Xia, Y.M.; Lu, E.J. Seasonal variations in moderate-to-vigorous physical activity among children and adolescents with visual impairment during different segments of the school day. Front. Public Health 2025, 13, 1566561. [Google Scholar] [CrossRef]
  50. Lu, B.; Long, T.; Li, B.; Chen, Y.; Zhu, L. Unraveling nonlinear impacts of seasonal climate and built environments on exercise walking in high-density cities via a modified machine learning approach. Int. J. Health Geogr. 2026. [Google Scholar] [CrossRef]
  51. Wei, Z.; Cao, K.; Kwan, M.P.; Jiang, Y.H.; Feng, Q.S. Measuring the age-friendliness of streets’ walking environment using multi-source big data: A case study in Shanghai, China. Cities 2024, 148, 104829. [Google Scholar] [CrossRef]
  52. Gómez-Varo, I.; Delclòs-Alió, X.; Miralles-Guasch, C. Jane Jacobs reloaded: A contemporary operationalization of urban vitality in a district in Barcelona. Cities 2022, 123, 103565. [Google Scholar] [CrossRef]
  53. Doan, Q.C.; Ma, J.; Chen, S.T.; Zhang, X.H. Nonlinear and threshold effects of the built environment, road vehicles and air pollution on urban vitality. Landsc. Urban Plan. 2025, 253, 105204. [Google Scholar] [CrossRef]
  54. De Vos, J.; Lättman, K.; van der Vlugt, A.L.; Welsch, J.; Otsuka, N. Determinants and effects of perceived walkability: A literature review, conceptual model and research agenda. Transp. Rev. 2023, 43, 303–324. [Google Scholar] [CrossRef]
  55. He, S.; Yu, S.; Ai, L.; Dai, J.; Chung, C.K.L. The built environment, purpose-specific walking behaviour and overweight: Evidence from Wuhan metropolis in central China. Int. J. Health Geogr. 2024, 23, 2. [Google Scholar] [CrossRef] [PubMed]
  56. Yu, C.M.; Wang, X.Y.; Zheng, Z.; Lau, S.S.Y. How Do Urban Environments Impact Walkability? An Analysis Using Multi-Source Data of Beijing. Land 2024, 13, 2101. [Google Scholar] [CrossRef]
  57. Li, X.; Xie, D.; Zhou, Z.Y.; Zhang, X.; Li, R.; Li, J.Y.; Chen, Z.Y.; Zhang, J.Y. Visualization analysis of research progress for walkability. Sci. Rep. 2024, 14, 1989. [Google Scholar] [CrossRef] [PubMed]
  58. Yin, C.; Cao, J.; Sun, B.D.; Liu, J.H. Exploring built environment correlates of walking for different purposes: Evidence for substitution. J. Transp. Geogr. 2023, 106, 103505. [Google Scholar] [CrossRef]
  59. Zhu, M.; Sze, N.N.; Newnam, S.; Zhu, D. Do footbridge and underpass improve pedestrian safety? A Hong Kong case study using three-dimensional digital map of pedestrian network. Accid. Anal. Prev. 2023, 186, 107064. [Google Scholar] [CrossRef]
  60. Liu, S.; Zhao, H.; Huang, Y.; Wei, W.; Xiong, R.; Yun, Y. Study on the Influence of Built Environment in Mountain Cities on the Walking Times of the Elderly: A Case Study of the Central Urban Area of Guiyang. J. Hum. Settl. West China 2023, 38, 60–67. [Google Scholar]
  61. Rundle, A.G.; Chen, Y.; Quinn, J.W.; Rahai, N.; Bartley, K.; Mooney, S.J.; Bader, M.D.; Zeleniuch-Jacquotte, A.; Lovasi, G.S.; Neckerman, K.M. Development of a Neighborhood Walkability Index for Studying Neighborhood Physical Activity Contexts in Communities across the US over the Past Three Decades. J. Urban Health-Bull. N. Y. Acad. Med. 2019, 96, 583–590. [Google Scholar] [CrossRef]
  62. Keskinen, K.E.; Gao, Y.; Rantakokko, M.; Rantanen, T.; Portegijs, E. Associations of Environmental Features With Outdoor Physical Activity on Weekdays and Weekend Days: A Cross-Sectional Study Among Older People. Front. Public Health 2020, 8, 578275. [Google Scholar] [CrossRef]
  63. Brakenridge, C.J.; Winkler, E.A.H.; Sallis, J.F.; Dunstan, D.W.; Owen, N.; Sugiyama, T.; Chandrabose, M. Associations of neighbourhood walkability with patterns of device-measured stepping, standing and sitting. Int. J. Behav. Nutr. Phys. Act. 2025, 22, 41. [Google Scholar] [CrossRef]
  64. Wang, S.; Yu, D.; Kwan, M.-P.; Zheng, L.; Miao, H.; Li, Y. The impacts of road network density on motor vehicle travel: An empirical study of Chinese cities based on network theory. Transp. Res. Part A-Policy Pract. 2020, 132, 144–156. [Google Scholar] [CrossRef]
  65. Liu, Y.; Yang, D.; Timmermans, H.J.P.; de Vries, B. Analysis of the impact of street-scale built environment design near metro stations on pedestrian and cyclist road segment choice: A stated choice experiment. J. Transp. Geogr. 2020, 82, 102570. [Google Scholar] [CrossRef]
  66. Kim, H.; Park, S.H.; So, J. Identifying walkability factors for urban metro station areas toward transit-oriented development. Int. J. Urban Sci. 2025, 29, 804–824. [Google Scholar] [CrossRef]
  67. Mariotti, I.; Giavarini, V.; Rossi, F.; Akhavan, M. Exploring the “15-Minute City” and near working in Milan using mobile phone data. Tema-J. Land Use Mobil. Environ. 2022, 39–56. [Google Scholar] [CrossRef]
  68. Liu, M.; Jiang, Y.; He, J. Quantitative Evaluation on Street Vitality: A Case Study of Zhoujiadu Community in Shanghai. Sustainability 2021, 13, 3027. [Google Scholar] [CrossRef]
  69. Lee, S.; Son, S.-o.; Park, J.; Park, J. Ensemble-Based Methodology to Identify Optimal Personal Mobility Service Areas Using Public Data. Ksce J. Civ. Eng. 2022, 26, 3150–3159. [Google Scholar] [CrossRef]
  70. Chen, D.; Kun, Y.; Chun, G. The Relationship between Built Environment Characteristics and Metro Stations Pedestrian Catchment Areas. J. Adv. Transp. 2024, 2024, 2196799. [Google Scholar] [CrossRef]
  71. Zou, J.; Jiang, H.; Ying, W.; Qiu, B. Scenic Influences on Walking Preferences in Urban Forest Parks from Top-View and Eye-Level Perspectives. Forests 2024, 15, 2020. [Google Scholar] [CrossRef]
  72. Li, C.; Seymour, M. Children’s perceptions of neighbourhood environments for walking and outdoor play. Landsc. Res. 2019, 44, 430–443. [Google Scholar] [CrossRef]
  73. Zhang, T.; Deng, S.; Ma, Q.; Sasaki, K. Evaluations of Landscape Locations along Trails Based on Walking Experiences and Distances Traveled in the Akasawa Forest Therapy Base, Central Japan. Forests 2015, 6, 2853–2878. [Google Scholar] [CrossRef]
  74. Lu, Y.; Sun, G.; Gou, Z.; Liu, Y.; Zhang, X. A dose-response effect between built environment characteristics and transport walking for youths. J. Transp. Health 2019, 14, 100616. [Google Scholar] [CrossRef]
  75. Cerin, E.; Barnett, A.; Zhang, C.J.P.; Lai, P.-C.; Sit, C.H.P.; Lee, R.S.Y. How urban densification shapes walking behaviours in older community dwellers: A cross-sectional analysis of potential pathways of influence. Int. J. Health Geogr. 2020, 19, 14. [Google Scholar] [CrossRef]
  76. de Saboya, R.T.; D’Orsi, E.; Keivani, R. Promoting active aging in Brazil: A longitudinal study of land use mix and utilitarian walking in older adults. Cities 2024, 154, 105318. [Google Scholar] [CrossRef]
  77. da Fontoura, L.C.; Kanashiroal, M.; Urbanoa, M.R. Comparing land use mix measures for different urban areas: An application in a Brazilian city. Urbe-Rev. Bras. Gest. Urbana 2025, 17, e20230301. [Google Scholar] [CrossRef]
  78. Boakye, K.; Bovbjerg, M.; Schuna, J., Jr.; Branscum, A.; Mat-Nasir, N.; Bahonar, A.; Barbarash, O.; Yusuf, R.; Lopez-Jaramillo, P.; Seron, P.; et al. Perceived built environment characteristics associated with walking and cycling across 355 communities in 21 countries. Cities 2023, 132, 104102. [Google Scholar] [CrossRef]
  79. Chevance, G.; Baretta, D.; Heino, M.; Perski, O.; Olthof, M.; Klasnja, P.; Hekler, E.; Godino, J. Characterizing and predicting person-specific, day-to-day, fluctuations in walking behavior. PLoS ONE 2021, 16, e0251659. [Google Scholar] [CrossRef]
  80. Wu, J.; Zhao, C.; Li, C.; Wang, T.; Wang, L.; Zhang, Y. Non-linear Relationships Between the Built Environment and Walking Frequency Among Older Adults in Zhongshan, China. Front. Public Health 2021, 9, 686144. [Google Scholar] [CrossRef]
  81. Shen, J.; Fan, J.; Peng, Y.; Lu, W.; Li, Y.; Xu, X.; Fei, Y. Systematic review of nonlinear associations between the built environment and walking in older adults. BMC Public Health 2025, 25, 4240. [Google Scholar] [CrossRef]
  82. Su, C.X.; Chen, Z.Y.; Cheng, Y.X.; Chen, S.F.; Li, W.T.; Ding, Z. Decoding Multi-Scale Environmental Configurations for Older Adults’ Walkability with Explainable Machine Learning. Sustainability 2025, 17, 8499. [Google Scholar] [CrossRef]
  83. Ma, X.T.; Zeng, T.C.; de Dear, R.; Xie, Y.X.; Yuan, C.; Lu, S. Active route choice to minimize pedestrian thermal discomfort in a high-density subtropical city. Sustain. Cities Soc. 2025, 131, 106697. [Google Scholar] [CrossRef]
  84. Zeng, Q.; Wu, H.; Zhou, L.; Huang, G.; Li, Y.; Dewancker, B.J. Toward pedestrian-friendly cities: Nonlinear and interaction effects of building density on pedestrian volume. J. Transp. Geogr. 2024, 119, 103954. [Google Scholar] [CrossRef]
  85. Melnikov, V.R.; Christopoulos, G.I.; Krzhizhanovskaya, V.V.; Lees, M.H.; Sloot, P.M.A. Behavioural thermal regulation explains pedestrian path choices in hot urban environments. Sci. Rep. 2022, 12, 2441. [Google Scholar] [CrossRef] [PubMed]
  86. Cheng, L.; De Vos, J.; Zhao, P.; Yang, M.; Witlox, F. Examining non-linear built environment effects on elderly’s walking: A random forest approach. Transp. Res. Part D-Transp. Environ. 2020, 88, 102552. [Google Scholar] [CrossRef]
  87. Basu, R.; Colaninno, N.; Alhassan, A.; Sevtsuk, A. Hot and bothered: Exploring the effect of heat on pedestrian route choice behavior and accessibility. Cities 2024, 155, 105435. [Google Scholar] [CrossRef]
Figure 1. Study area and spatial distribution of walking trajectories. (Author’s own creation).
Buildings 16 01182 g001
Figure 2. Quantification and typological identification of walking support spaces based on behavioral temporal characteristics. (Author’s own creation).
Buildings 16 01182 g002
Figure 3. Correlation analysis and multicollinearity diagnostics of built-environment variables. (a) Pearson correlation coefficient matrix among variables and the correlation network with walking support levels; (b) distribution of variance inflation factors (VIFs) for the final set of selected variables. (Author’s own creation).
Buildings 16 01182 g003
Figure 4. Three-dimensional atlas of walking support spaces in central Wuhan: (a) typological differentiation based on spatiotemporal clustering; (b) intensity agglomeration based on total walking activity; and (c) stability assessment based on the number of active months. (Author’s own creation).
Buildings 16 01182 g004
Figure 5. SHAP-based feature importance and summary analysis. (a) Global feature importance; (b) SHAP summary plot for the “Low support” class; (c) SHAP summary plot for the “Medium support” class; (d) SHAP summary plot for the “High support” class. (Author’s own creation).
Buildings 16 01182 g005
Figure 6. SHAP dependence plots for the top three features per class. (ac) Top features for the “Low support” class; (df) Top features for the “Medium support” class; (gi) Top features for the “High support” class. (Author’s own creation). The horizontal axis represents observed values of the environmental variables, while the right vertical axis shows SHAP values, reflecting the marginal contribution of each variable to the predicted probability of a specific support type. Blue scatter points indicate individual spatial sample units; the blue solid line represents the LOESS-fitted trend, and the shaded area denotes the 95% confidence interval. Vertical black dashed lines mark critical thresholds where the effect direction changes significantly, representing the value ranges to which the classification outcomes are most sensitive. Distance and length variables are measured in meters (m), and density- or index-based indicators have been standardized.
Buildings 16 01182 g006
Figure 7. SHAP interaction effect plots for the top three interacting pairs per class. (ac) Interaction pairs for the “Low support” class; (df) Interaction pairs for the “Medium support” class; (gi) Interaction pairs for the “High support” class. (Author’s own creation). Note: The figure illustrates the joint effects of the main and interacting variables on model classification. The right vertical axis represents SHAP interaction values, indicating the additional explanatory contribution arising from the nonlinear synergy of the two variables after excluding their individual effects. The color of the scatter points reflects the Z-score standardized level of the interacting variable (red for high values, blue for low values). Different fitted curves in the figure reveal the heterogeneity in the influence of the main variable under varying levels of the interacting variable. Vertical dashed lines indicate critical regions where interaction patterns shift.
Buildings 16 01182 g007
Table 1. Descriptive statistics of walking trajectory data. (Calculated by the author).
MetricValue
Total number of walking trajectories2485
Total walking distance (km)20,527.11
Per-trajectory distance: P25–P75 (km)2.69–11.01
Mean per-trajectory distance (km)8.26
Minimum per-trajectory distance (km)0.21
Maximum per-trajectory distance (km)56.99
Per-trajectory duration: P25–P75 (h)1.02–4.50
Per-trajectory speed: P25–P75 (km/h)1.73–3.62
P25–P75 denotes the interquartile range (the central 50% of typical trajectories), which is used to characterize representative walking scales while reducing the influence of extreme values on mean estimates. Walking duration is consistently reported in hours to enhance the interpretability of behavioral scale.
Table 2. Walking behavioral indicator system at the spatial-unit level. (Compiled by the author).
DimensionIndicatorSymbolCalculationImplication
Activity IntensityAnnual walking intensity D i D i = j = 1 12 m i j , where m i j denotes the walking distance (km) recorded in spatial unit i during month j .Reflects the cumulative annual volume of walking activity within a spatial unit, indicating overall walking intensity.
Walking frequency N i N i = j = 1 12 t i j , where t i j represents the number of walking trajectories observed in spatial unit i
during month j .
Indicates how frequently a spatial unit is repeatedly used, reflecting the degree of routinization in walking activity.
Temporal StabilityNumber of active months M i M i = j = 1 12 I ( m i j > 0 ) ,
where I is an indicator function equal to 1 when walking activity occurs in month j, and 0 otherwise.
Measures the persistence of walking activity over the annual time scale, distinguishing episodic from routine use.
Monthly coefficient of variation C V i C V i = σ ( m i 1 , . . . , m i 12 ) μ ( m i 1 , . . . , m i 12 ) , where σ and μ denote the standard deviation and mean of monthly walking distance, respectively. When the mean equals zero, a small constant is used as a substitute to avoid division by zero.Describes the temporal variability of walking activity across the year, with lower values indicating greater stability.
Behavioral RhythmPeak concentration index R i p e a k R i p e a k = m a x ( m i 1 , . . . , m i 12 ) D i
When D i = 0 , the value is set to 0.
Indicates the extent to which walking activity is concentrated in a single month, capturing episodic dependence.
Summer proportion R i s u m m e r R i s u m m e r = m i 6 + m i 7 + m i 8 D i
When D i = 0 , the value is set to 0.
A context-specific indicator capturing the proportion of walking activity sustained during summer months (June–August) under high-temperature conditions.
Table 3. Built-environment indicators and their definitions. (Compiled by the author).
DimensionIndicatorAbbreviationDefinitionReferences
Road network structureRoad network densityRNDRatio of total road length to unit area, reflecting road network coverage and basic accessibility.[59,60]
Intersection densityINDNumber of intersections per unit area, representing road network connectivity and diversity of route choices.[61,62,63]
Average street segment lengthASLAverage street segment length (m), reflecting block scale and walkability.[64,65]
Public transportSubway station countSSCNumber of metro stations within a grid cell, reflecting the intensity of public transport service provision.[66]
Distance to nearest subway stationDSSDistance to the nearest metro station (m), used to measure public transport accessibility.[67,68,69,70]
Landscape resourcesScenic feature countSFCNumber of parks and landscape resources within a grid cell, reflecting the supply of recreational and environmental amenities.[71,72]
Distance to nearest scenic featureDSFDistance to the nearest park or landscape resource (m), characterizing accessibility to landscape amenities.[73]
Population activityPopulation densityPDPopulation size per unit area, reflecting potential walking activity and travel demand intensity.[74,75]
Land-Use structureLand-use mix indexLUMLand-use mix calculated using Shannon entropy, used to measure functional diversity.[76,77,78]
Table 4. Mean behavioral characteristics of different walking support types. (Calculated by the author).
Support TypeAnnual Walking Intensity
( D i )
Walking Frequency
( N i )
Number of Active Months
( M i )
Monthly Coefficient of Variation
( C V i )
Peak Concentration Index ( R i p e a k )Summer Proportion ( R i s u m m e r )
High-support 4.5258.0093.7742.1280.5890.283
Medium-support0.6291.3031.1742.2940.9930.153
Low-support0.2341.1781.0823.2900.9920.011
All mean values were calculated based on grid units after clustering. Differences among support types were statistically significant according to ANOVA tests (p < 0.001). Indicators in the intensity dimension were reported using original (non-standardized) values to preserve their real-world scale, whereas stability and rhythm indicators were dimensionless, facilitating comparison across types.
Disclaimer/Publisher’s Note: The statements, opinions and data contained in all publications are solely those of the individual author(s) and contributor(s) and not of MDPI and/or the editor(s). MDPI and/or the editor(s) disclaim responsibility for any injury to people or property resulting from any ideas, methods, instructions or products referred to in the content.