Road Performance and Applicability of Asphalt Mixtures with Neutral Rock Manufactured Sand


 and
and 
Abstract
1. Introduction
2. Raw Materials and Test Methods
2.1. Raw Materials
2.1.1. Coarse Aggregates
2.1.2. Fine Aggregates
2.1.3. Asphalt Binder
2.1.4. Mineral Powder
2.1.5. Cement
2.2. Test Methods
2.2.1. Marshall Test
2.2.2. Water Stability Test
- (1)
- Immersed Marshall test:
- (2)
- Freeze–thaw splitting test:
2.2.3. High-Temperature Stability Test
2.2.4. Low-Temperature Stability Test
- (1)
- Beam Bending Test
- (2)
- Low-Temperature Shrinkage Coefficient Test
- (3)
- Fracture Energy Test
3. Results and Discussion
3.1. Influence of Manufactured Sand Lithology on Mixture Volumetric Indicators
3.1.1. Gradation Design
3.1.2. Determination of Volumetric Indicators
3.2. Influence of Manufactured Sand Lithology on the Road Performance of Asphalt Mixtures
3.2.1. Influence on Water Stability
- (1)
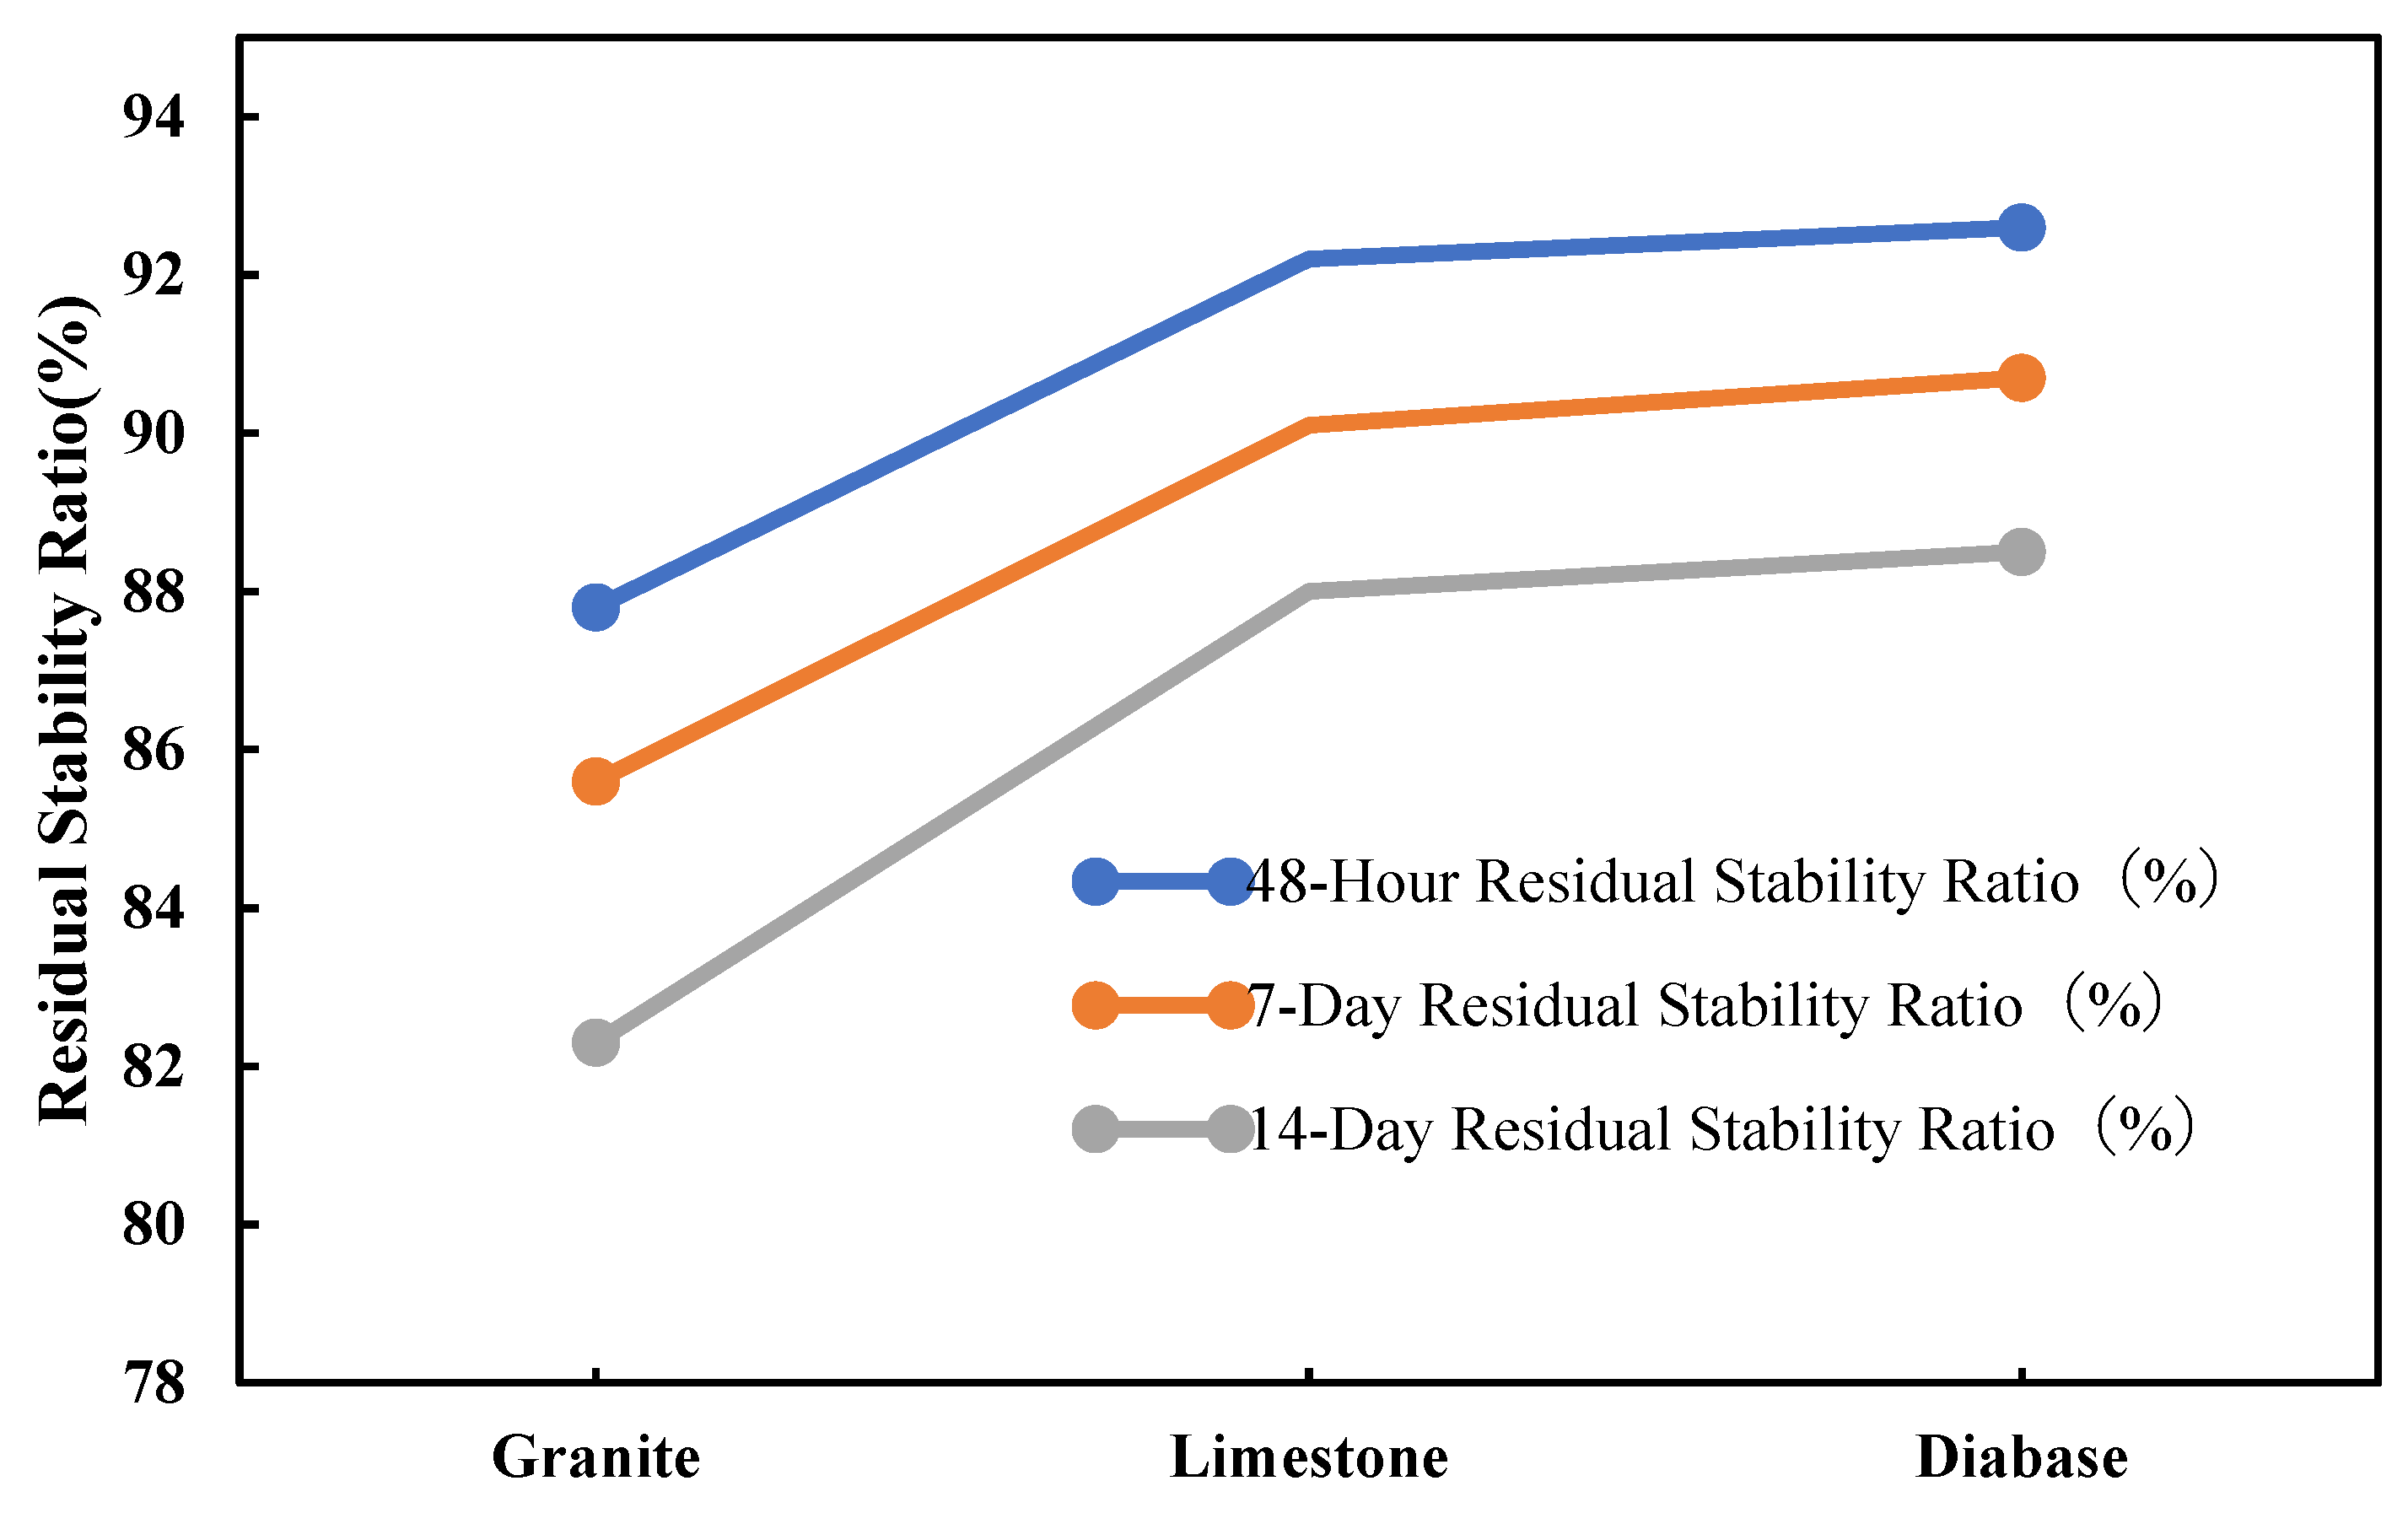
- Immersed Marshall Test
- (2)
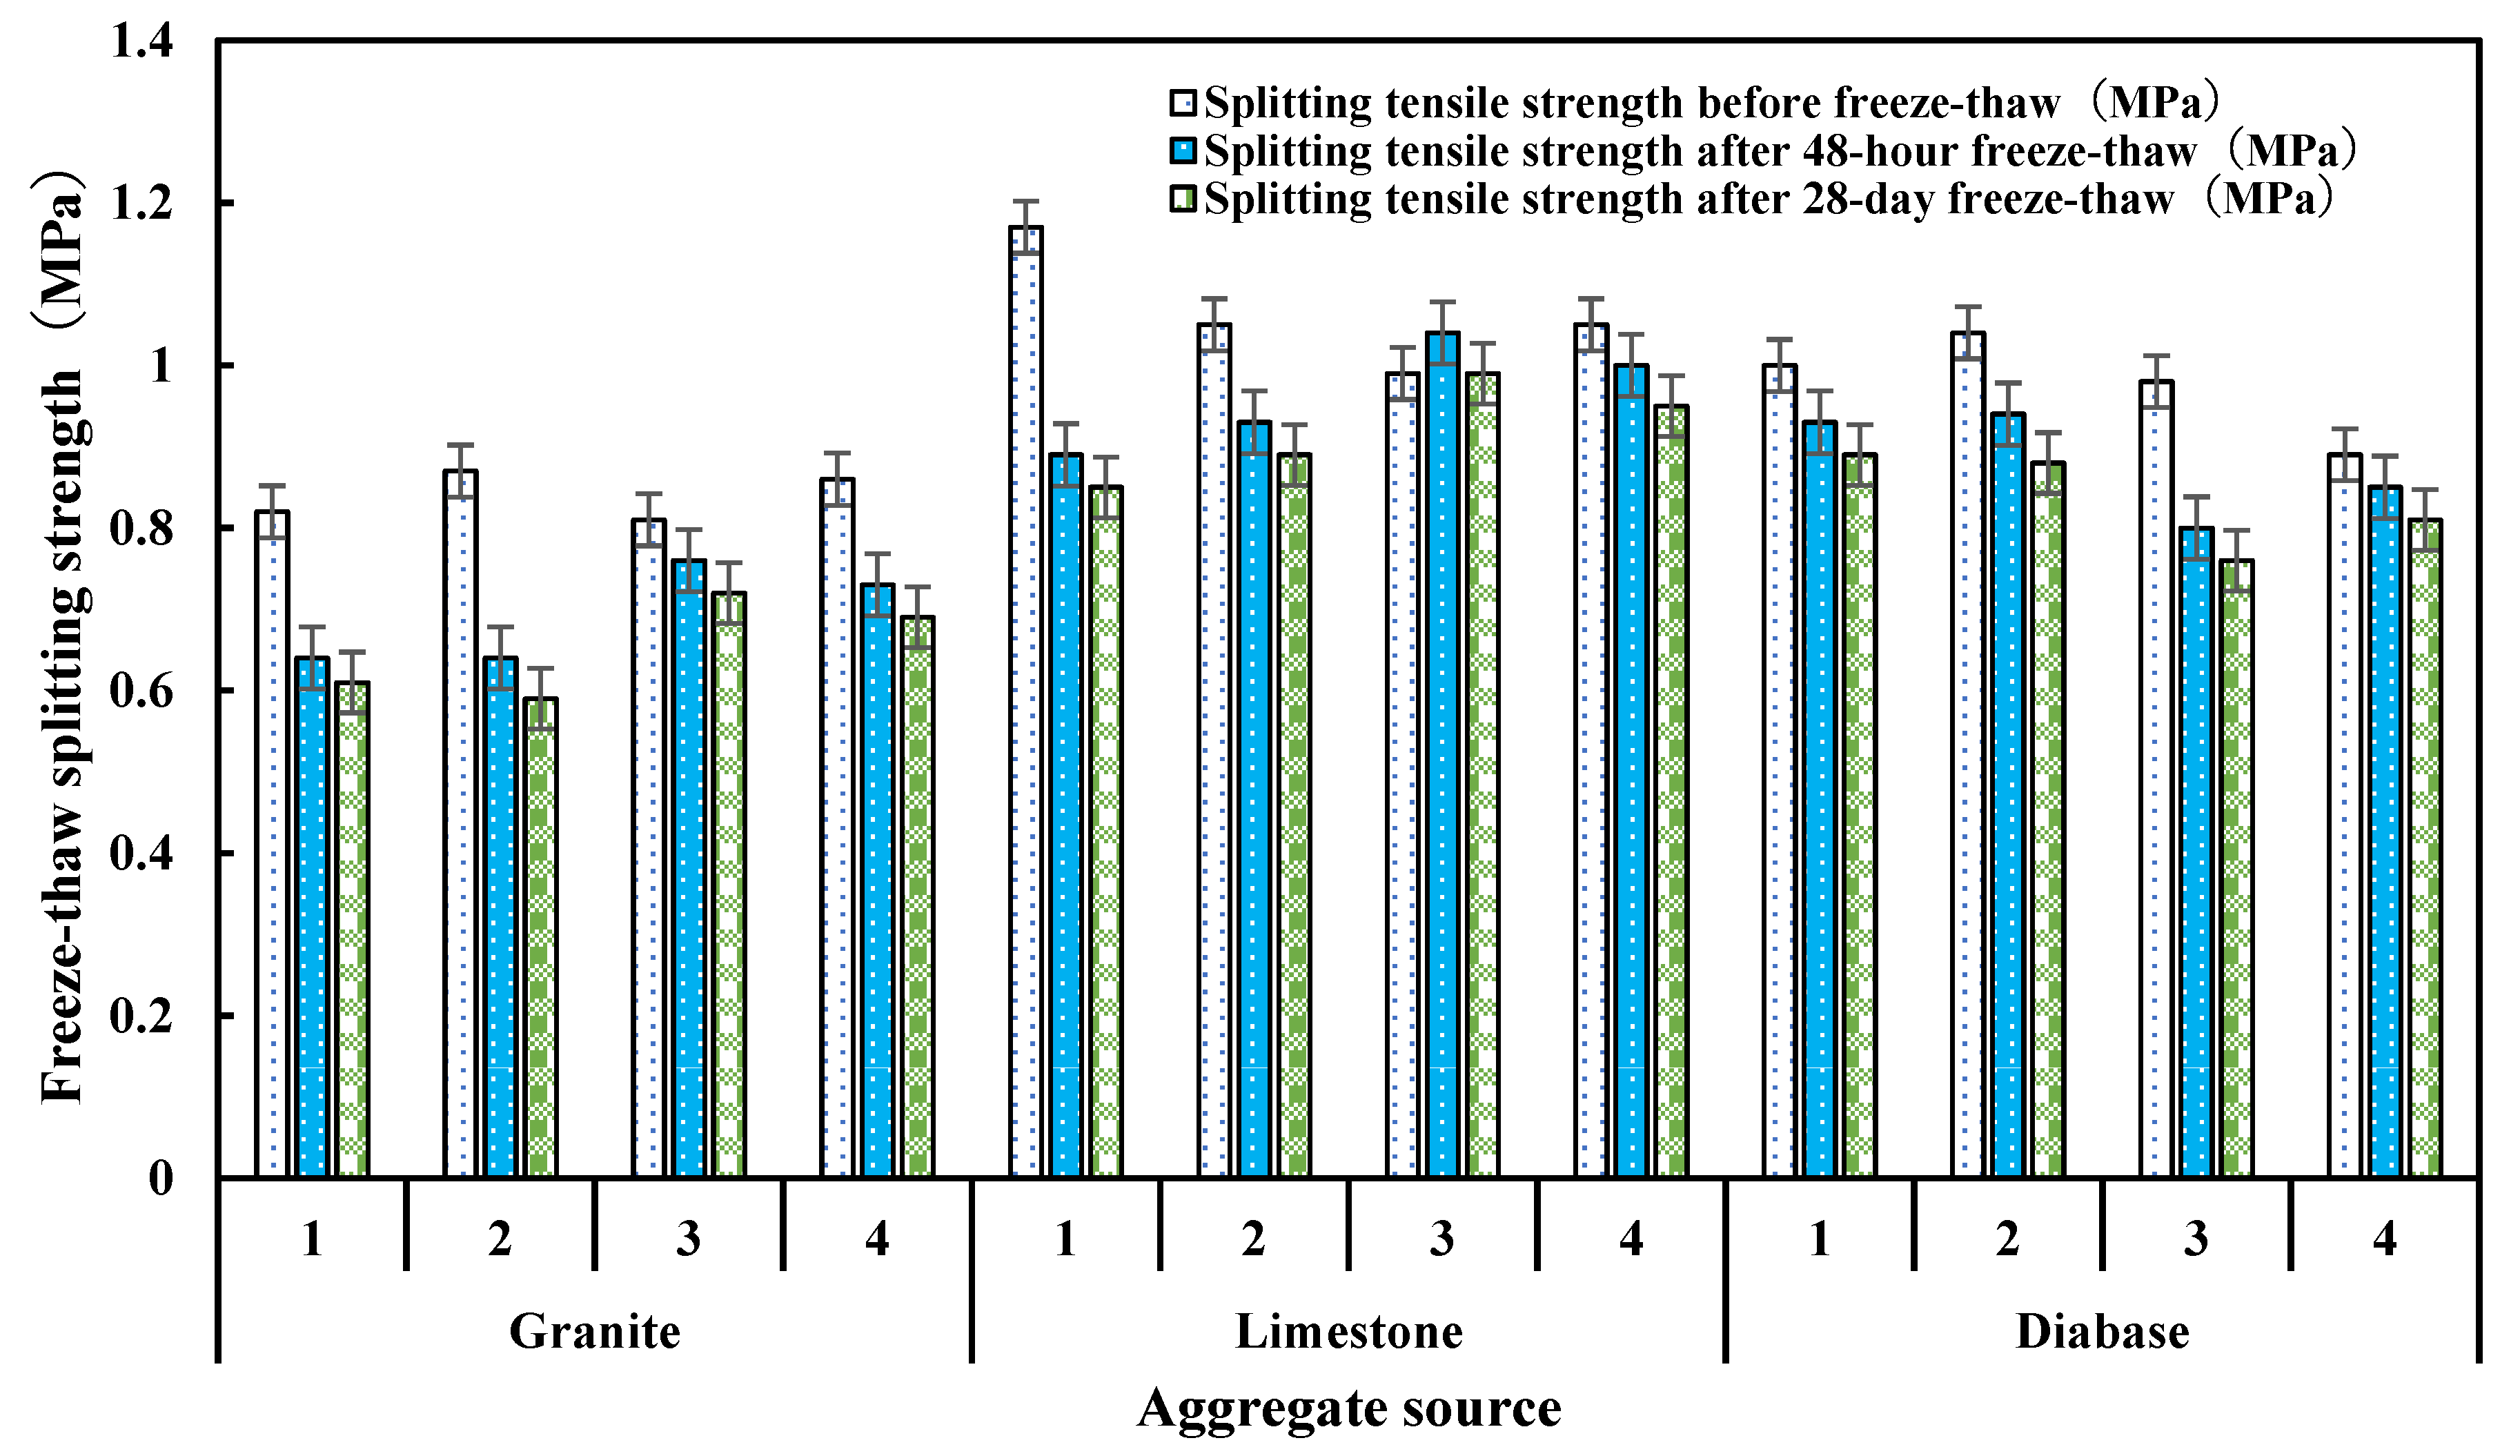
- Freeze–Thaw Splitting Test
- (3)
- Micro-Mechanism of Surface Free Energy
- (4)
- Analysis of Variance Results
3.2.2. Influence on High-Temperature Stability
- (1)
- Dynamic Stability (DS)
- (2)
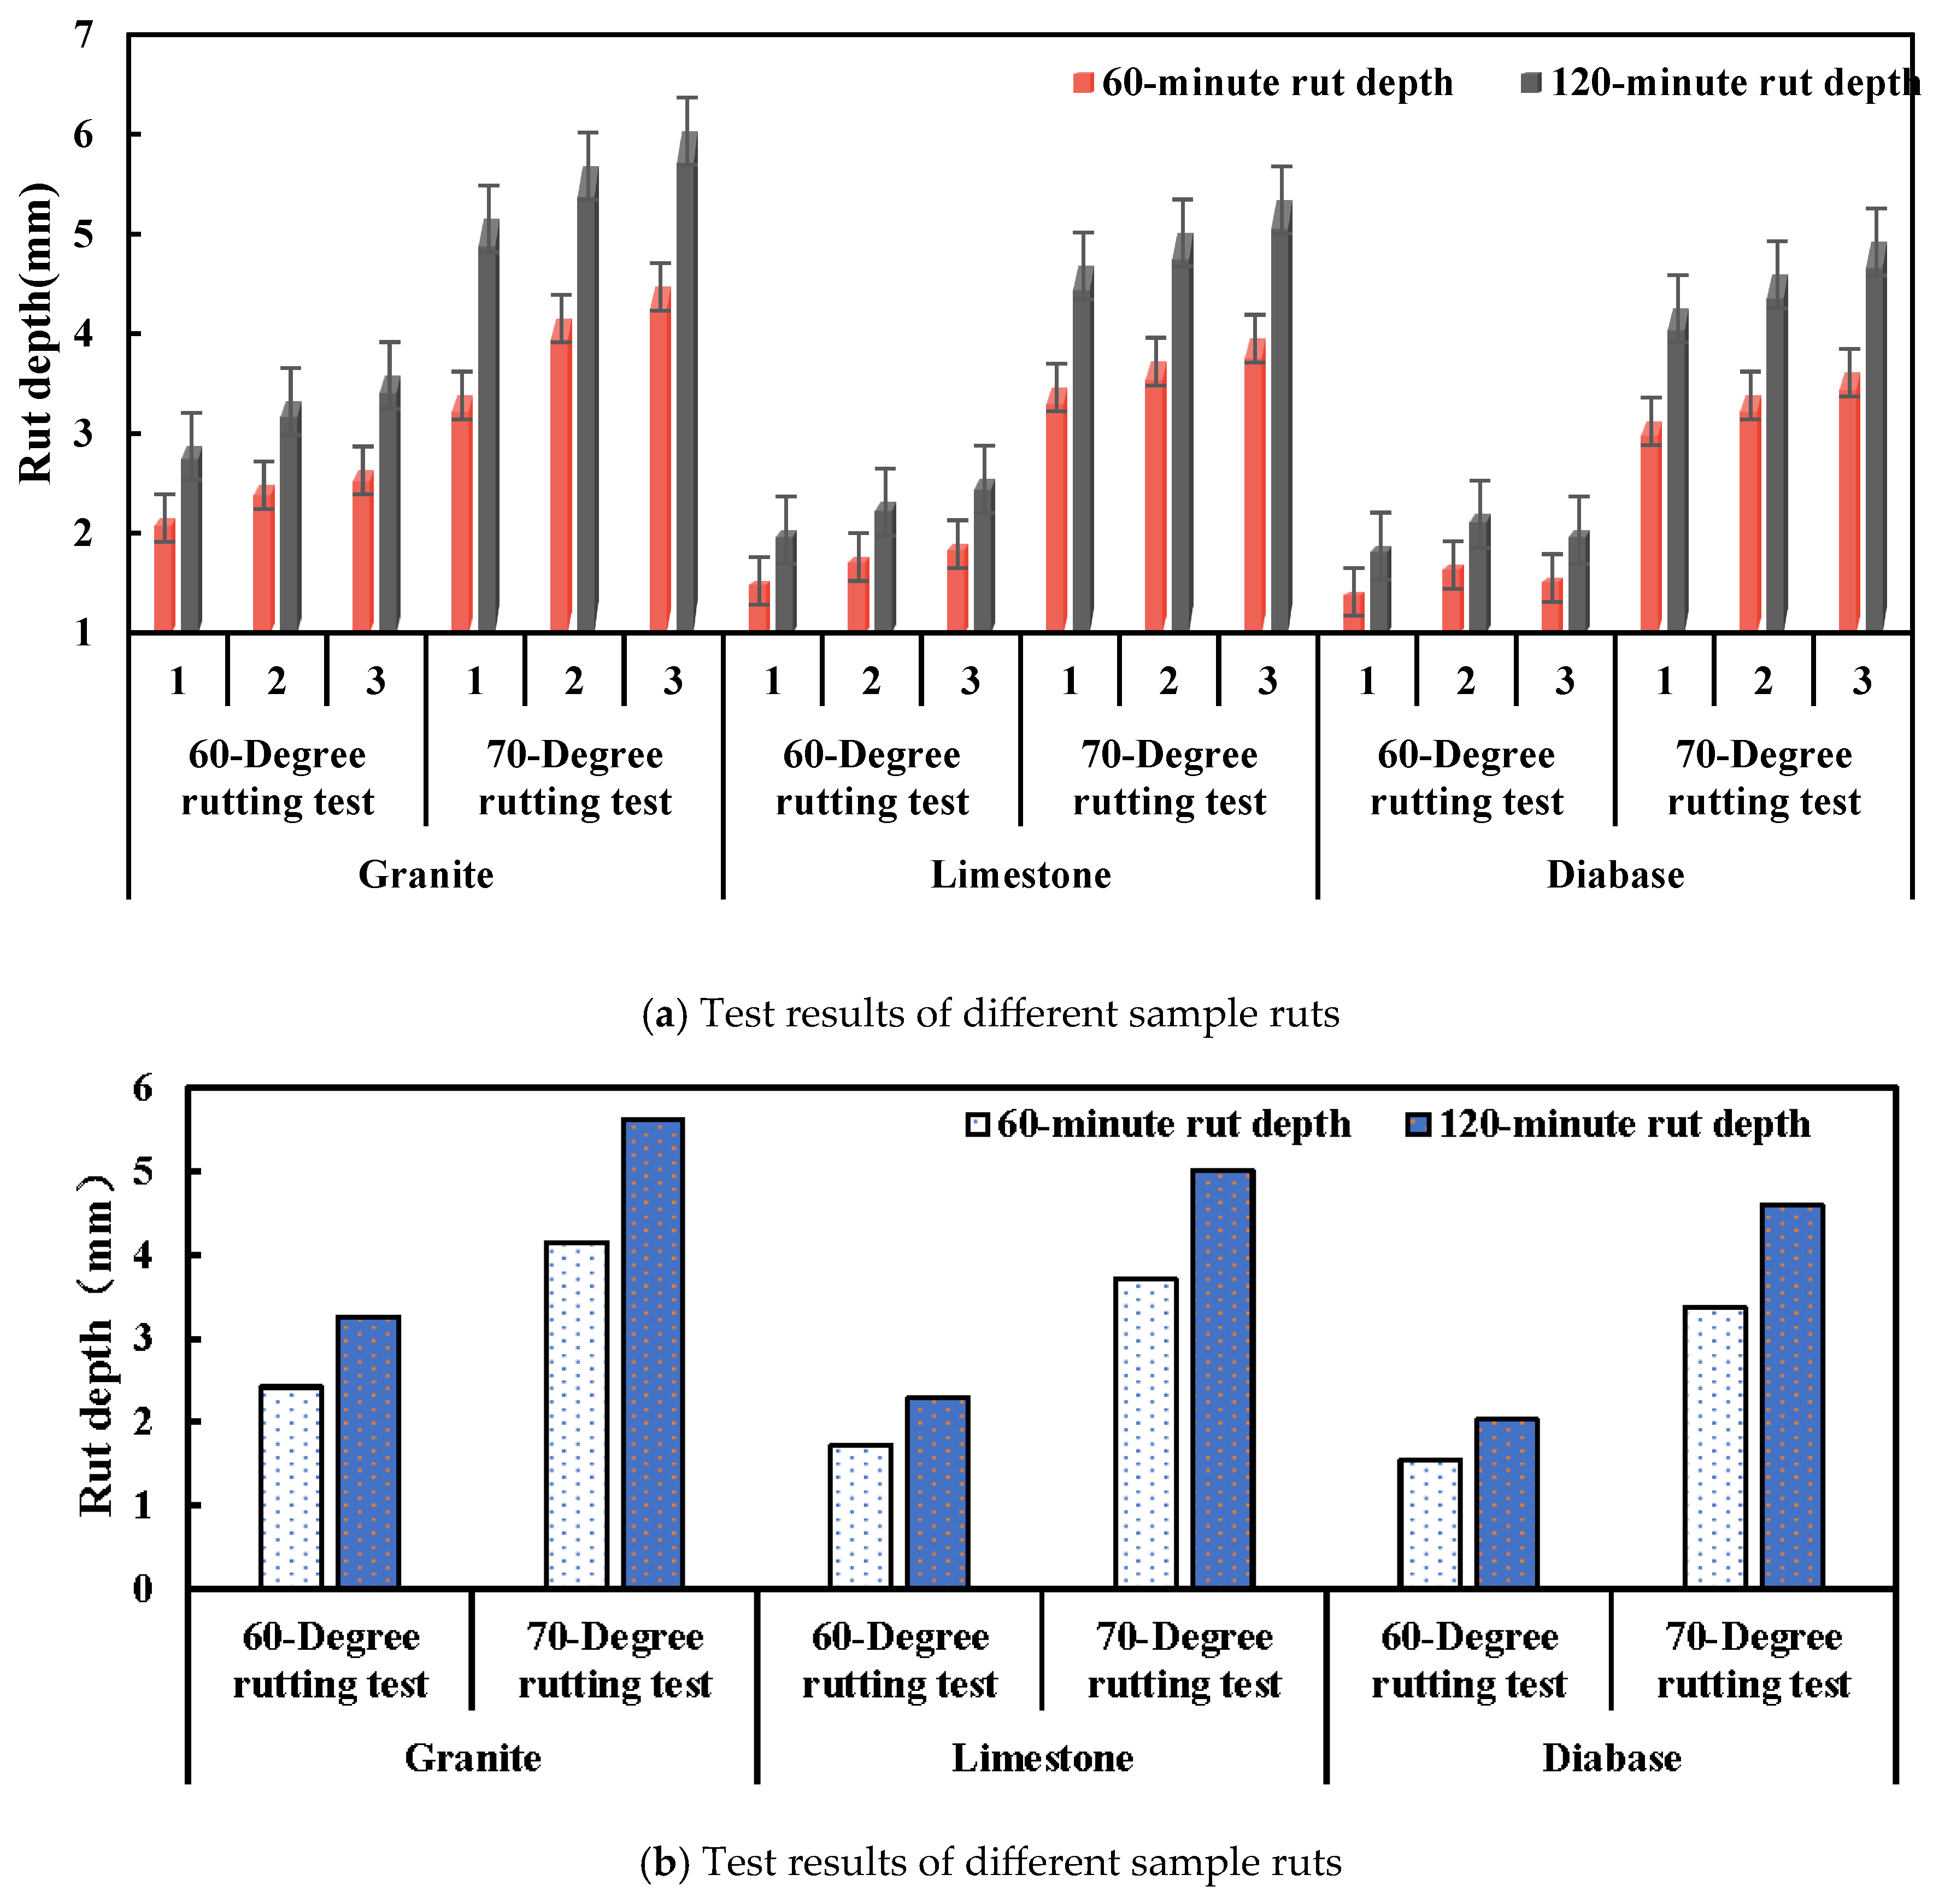
- Rutting Depth (RD)
3.2.3. Influence on Low-Temperature Stability
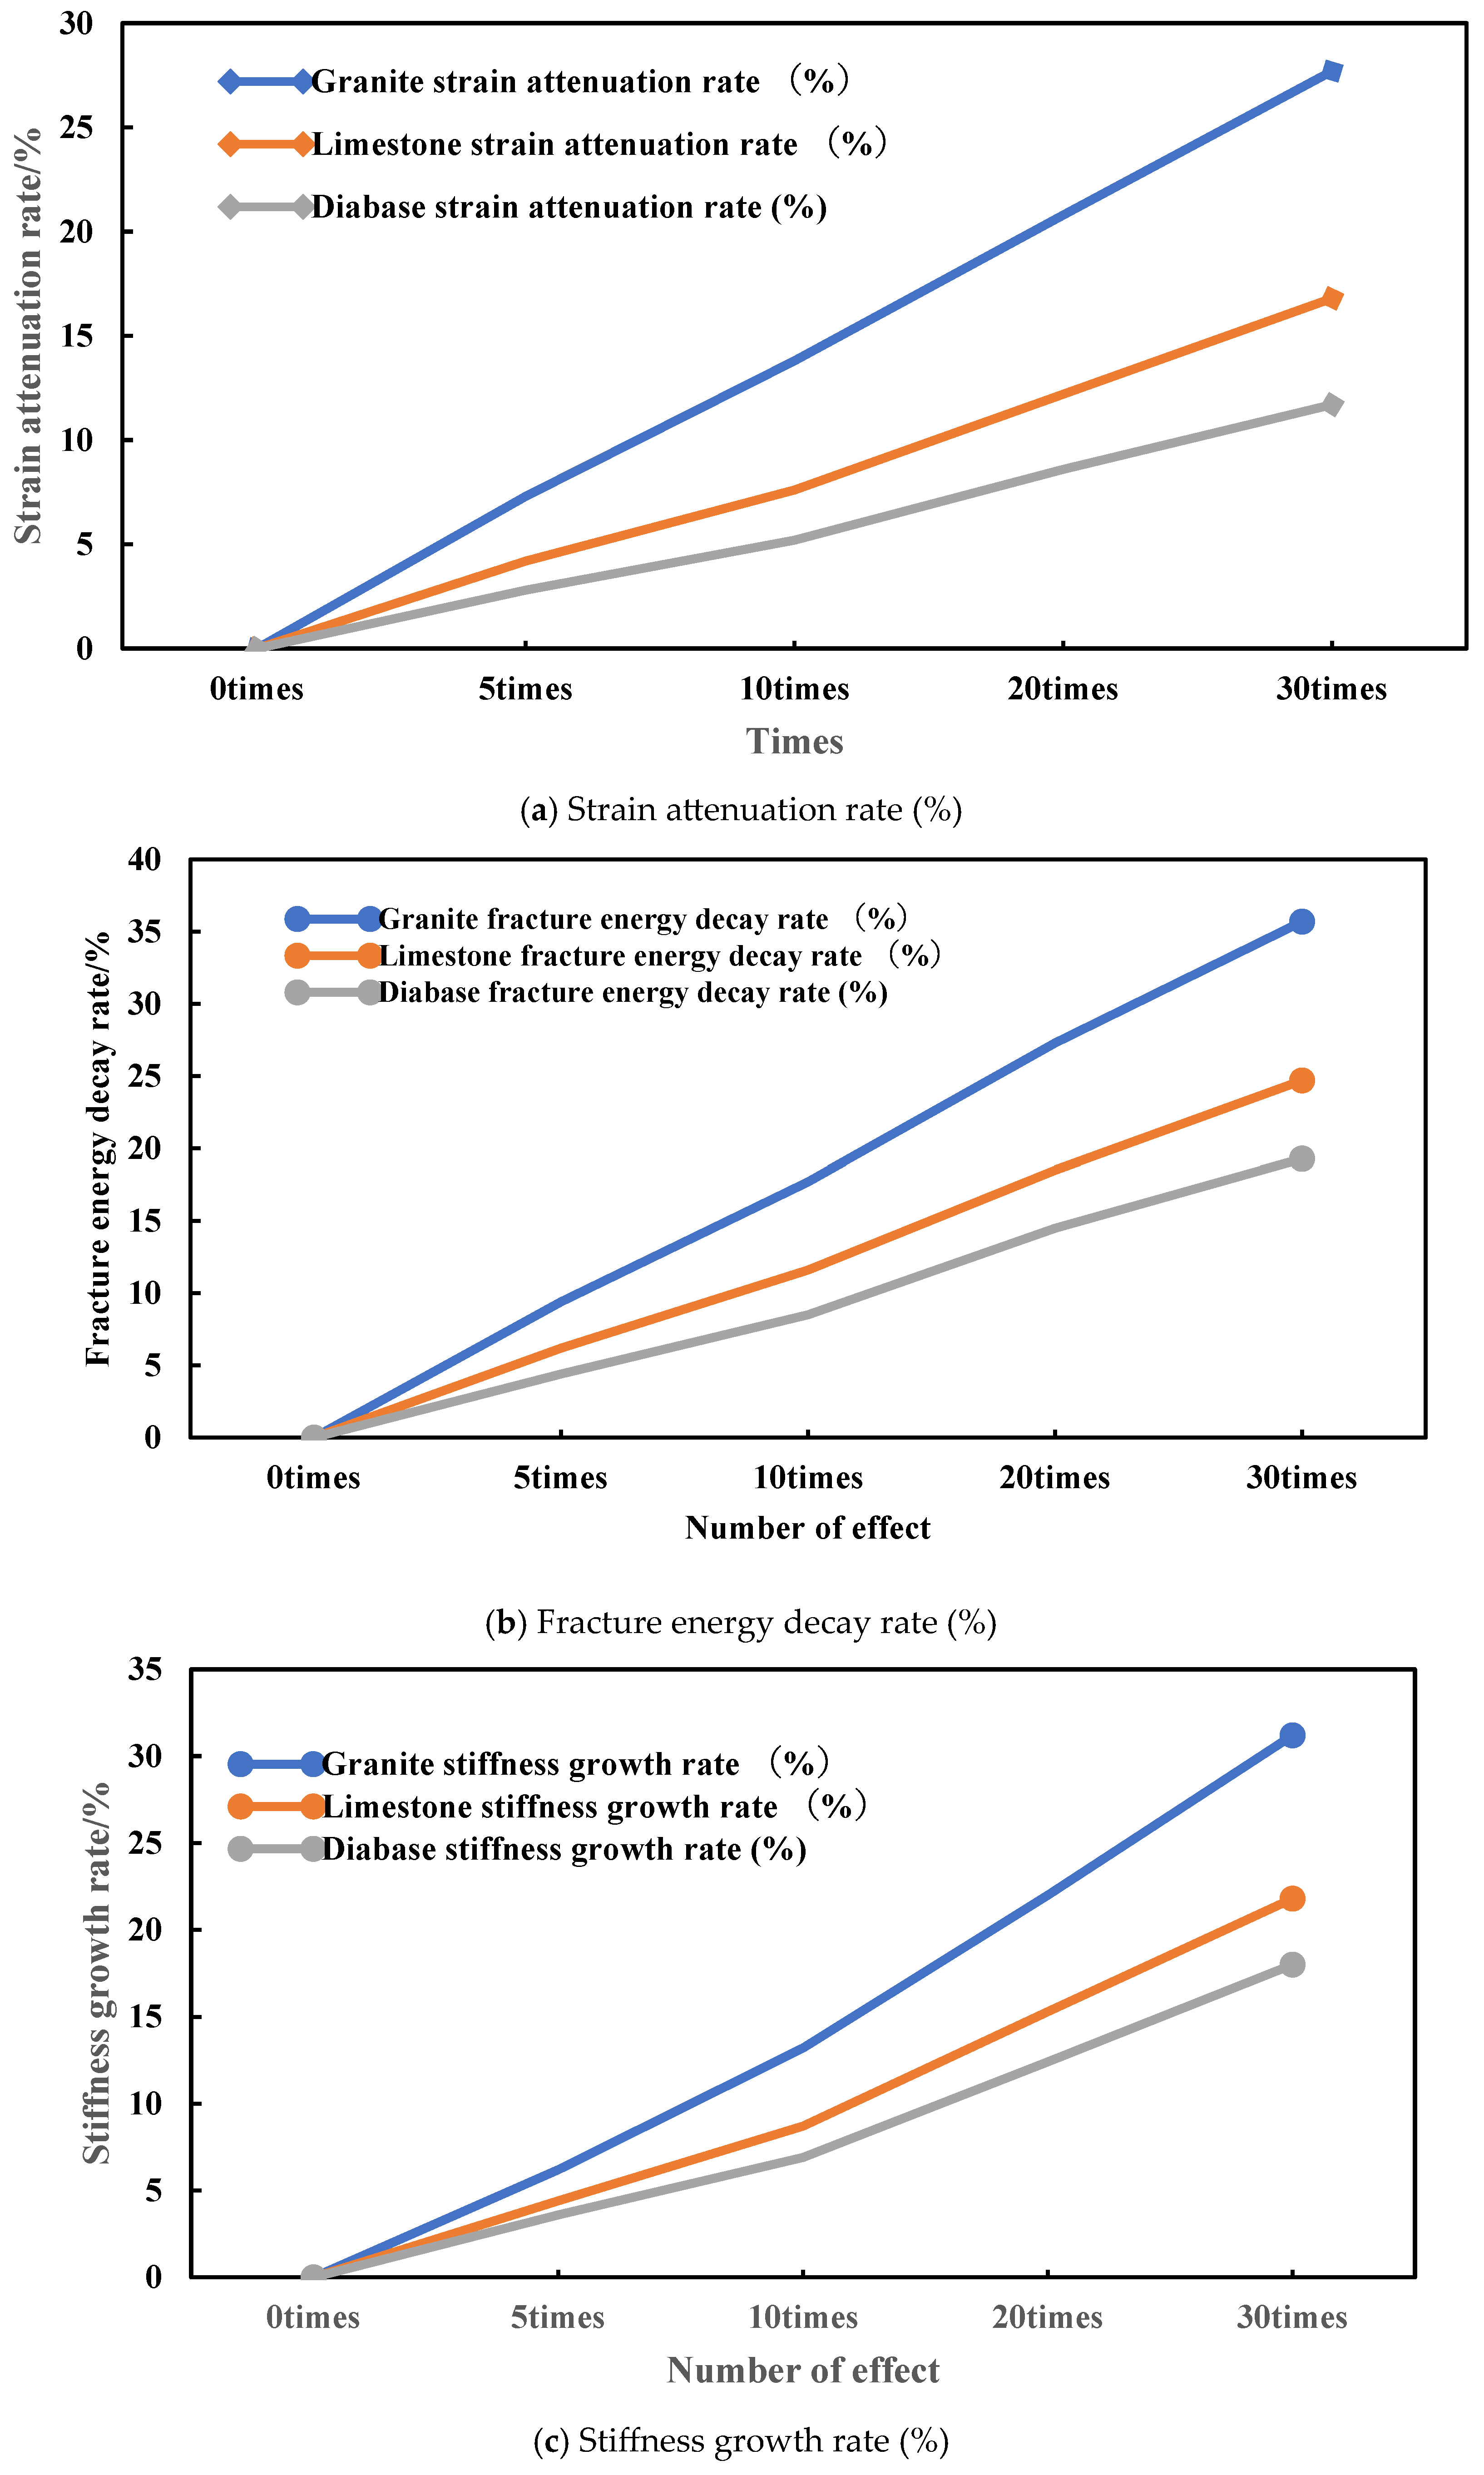
3.2.4. Long-Term Low-Temperature Cyclic Aging Test
3.3. Analysis of Adhesion Effect Between Neutral Rock Manufactured Sand and Asphalt
- (1)
- Immersed Marshall Test
- (2)
- Freeze–Thaw Splitting Test
4. Conclusions
- (1)
- The lithology of manufactured sand significantly affects the volumetric indicators of the mixture. The limestone manufactured sand mixture has the smallest void ratio (3.81%), and the diabase has the largest (5.81%). The mixing ratio of diabase needs to be appropriately increased to optimize the compaction effect.
- (2)
- In terms of water stability, the order of short-term performance is diabase ≈ limestone > granite, and that of long-term durability is limestone > diabase > granite. The polar component of aggregate surface free energy is the key evaluation index (R2 = 0.92).
- (3)
- The order of high-temperature stability is diabase > limestone > granite. Thanks to its low crushing value and strong angularity, the diabase manufactured sand has a dynamic stability of 12,629 times/mm at 60 °C, showing the best rutting resistance.
- (4)
- In terms of low-temperature performance, the diabase mixture has the best initial crack resistance (maximum flexural strain of 2757 με) and long-term durability (strain attenuation rate of 11.7% after 30 cycles), while granite fails to meet the design requirements.
- (5)
- Adding 1.5%~2.0% cement can significantly improve the adhesion between manufactured sand and asphalt, with more obvious enhancement effects on granite and diabase, and can optimize water stability and high-temperature stability.
- (6)
- Based on the core indicators of aggregate lithology, surface free energy and mixture road performance, combined with the characteristics of asphalt pavement service environments in different regions of China, the quantitative indicator thresholds are formulated. For high-temperature and rainy areas, diabase/limestone manufactured sand with a polar component ≥4.0 mJ/m2 and dynamic stability at 60 °C ≥10,000 times/mm is prioritized; for cold regions, diabase manufactured sand with a maximum flexural strain ≥2500 με and strain attenuation rate ≤15% after 30 low-temperature cycles is prioritized; and for frequent freeze–thaw areas, limestone manufactured sand with a 28 d freeze–thaw residual strength ratio ≥85% and interface adhesion work ≥60 mJ/m2 is prioritized. For conventional areas, the requirements for indicator thresholds are relaxed, and limestone, diabase and granite are all applicable.
- (7)
- Establishment of a comprehensive performance evaluation function for manufactured sand: aggregate surface polar component, dynamic stability at 60 °C, maximum flexural strain at −10 °C, 28 d freeze–thaw residual strength ratio, and void ratio are selected as the core evaluation indicators.
- (8)
- It should be noted that the findings of this study are primarily based on controlled laboratory experiments. Although the results systematically reveal the influence of aggregate lithology on volumetric characteristics, water stability, high-temperature rutting resistance, and low-temperature crack resistance from both macroscopic performance and surface free energy perspectives, field-scale validation is still necessary before broad engineering implementation. Future research should incorporate full-scale test sections and long-term performance monitoring under actual traffic loading and environmental coupling conditions (e.g., rainfall, freeze–thaw cycles, and high-temperature exposure) to further verify the durability, structural adaptability, and economic feasibility of neutral rock manufactured sand in practical pavement systems.
Author Contributions
Funding
Data Availability Statement
Conflicts of Interest
References
- Arulmoly, B.; Konthesingha, C.; Nanayakkara, A. Performance evaluation of cement mortar produced with manufactured sand and offshore sand as alternatives for river sand. Constr. Build. Mater. 2021, 297, 123784. [Google Scholar] [CrossRef]
- Zhang, L.; Song, Y.; Shi, T.; Zhao, Z.; Zhang, X.; Liu, Y.; Li, Q.; Wang, P.; Zhang, F.; Qian, X. A correlation study between the properties of manufactured sand and tunnel muck. Case Stud. Constr. Mater. 2024, 21, e03684. [Google Scholar] [CrossRef]
- Wang, H.; Wang, P.; Zhang, X.; Chen, W.-Q.; Tzachor, A.; Fishman, T.; Schandl, H.; Acuto, M.; Yang, Y.; Lu, Y. Substantial increase in China’s manufactured sand supply since 2010. Nat. Geosci. 2024, 17, 833–836. [Google Scholar] [CrossRef]
- Mu, J.; Li, Y.; Lin, H.; Liu, Y.; Luo, X. Research on the effect of lithological characteristics of manufactured sand on the strength of mortar. J. Build. Eng. 2023, 77, 107495. [Google Scholar] [CrossRef]
- Rathore, Y.; Raheem, J. The evolution, characteristics, and potential of manufactured sand in concrete: A short review. Natl. Acad. Sci. Lett. 2025, 1–7. [Google Scholar] [CrossRef]
- Wang, X.; Zhang, W.; Zhang, Y.; Qiao, H.; Xue, C.; Mundia, M.M.; An, B. Research on the green preparation of manufactured sand by tuff produced in Gansu China and its influence on the properties of concrete. Constr. Build. Mater. 2023, 409, 133794. [Google Scholar] [CrossRef]
- Li, B.; Ke, G.; Zhou, M. Influence of manufactured sand characteristics on strength and abrasion resistance of pavement cement concrete. Constr. Build. Mater. 2011, 25, 3849–3853. [Google Scholar] [CrossRef]
- Shen, W.; Wu, J.; Du, X.; Li, Z.; Wu, D.; Sun, J.; Wang, Z.; Huo, X.; Zhao, D. Cleaner production of high-quality manufactured sand and ecological utilization of recycled stone powder in concrete. J. Clean. Prod. 2022, 375, 134146. [Google Scholar] [CrossRef]
- Pilegis, M.; Gardner, D.; Lark, R. An investigation into the use of manufactured sand as a 100% replacement for fine aggregate in concrete. Materials 2016, 9, 440. [Google Scholar] [CrossRef]
- Mishra, A.; Das, S.K.; Reddy, K.R. Life cycle assessment of processing alternate sands for sustainable construction: Coal mine overburden sand versus manufactured sand. J. Build. Eng. 2023, 75, 107042. [Google Scholar] [CrossRef]
- Chaparro, M.A.; Gnanasaravanan, S.; Rajkumar, P. Trace and major minerals of (natural and manufactured) sand: The importance of manufactured sand for construction purposes and the preservation of rivers. Innov. Infrastruct. Solut. 2021, 6, 52. [Google Scholar] [CrossRef]
- Li, H.; Shu, B.; Du, C.; Zhuo, Y.; Chen, Z.; Zhang, W.; Yang, X.; Chen, Y.; Pan, M. Evaluation of Long-Term Skid Resistance in Granite Manufactured Sand Concrete. Lubricants 2025, 13, 375. [Google Scholar] [CrossRef]
- Gao, J.; Zhou, P.; Zhao, S.; Yang, Q.; Gu, K.; Song, Q.; Jiang, Z. Optimizing the Mixture Design of Manufactured Sand Concrete for Highway Guardrails in Mountainous Terrain. Buildings 2025, 15, 1436. [Google Scholar] [CrossRef]
- Zhang, P.; Su, J.; Gao, Z.; Zhang, T.; Zhang, P. Effect of sand–precursor ratio on mechanical properties and durability of geopolymer mortar with manufactured sand. Rev. Adv. Mater. Sci. 2024, 63, 20230170. [Google Scholar] [CrossRef]
- Li, X.; Zhu, L.; Liu, J.; Cao, Z.; Xue, Y.; Dang, F. Fracture evolution and mechanical deterioration of granite under cyclic thermal and liquid nitrogen cryogenic impact. Phys. Fluids 2025, 37, 086652. [Google Scholar] [CrossRef]
- Wang, L.; Xue, Y.; Zhu, L.; Cao, X.; Li, X.; Ranjith, P. Fracture evolution of granite under cyclic thermal shocks: Effects of liquid nitrogen cooling on strength, toughness, and acoustic emission characteristics. Therm. Sci. Eng. Prog. 2026, 70, 104507. [Google Scholar] [CrossRef]
- Wang, L.; Xue, Y.; Cao, Z.; Kong, H.; Han, J.; Zhang, Z. Experimental study on mode I fracture characteristics of granite after low temperature cooling with liquid nitrogen. Water 2023, 15, 3442. [Google Scholar] [CrossRef]
- Yuan, H.; Sun, Q.; Geng, J.; Tang, L.; Lv, C.; Zhang, Y. Thermal acoustic emission characteristics and damage evolution of granite under cyclic thermal shock. Environ. Earth Sci. 2023, 82, 388. [Google Scholar] [CrossRef]
- Chen, Z.; Sha, S.; Xu, L.; Quan, J.; Rong, G.; Jiang, M. Damage evaluation and statistic constitutive model of high-temperature granites subjected to liquid nitrogen cold shock. Rock Mech. Rock Eng. 2022, 55, 2299–2321. [Google Scholar] [CrossRef]
- Xu, J.; Zhang, Y.; Rutqvist, J.; Hu, M.; Wang, Z.; Tang, X. Thermally induced microcracks in granite and their effect on the macroscale mechanical behavior. J. Geophys. Res. Solid Earth 2023, 128, e2022JB024920. [Google Scholar] [CrossRef]
- Nanayakkara, A.; Premasiri, R.; Arulmoly, B.; Konthesingha, C. Metamorphic rocks for manufactured sand and coarse aggregate for concrete and mortar. Mag. Civ. Eng. 2022, 113, 11308. [Google Scholar]
- Ren, Q.; Tao, Y.; Jiang, Z.; De Schutter, G. Adhesive and rheological properties of fresh mortar with manufactured sand as replacement of river sand. Constr. Build. Mater. 2024, 411, 134303. [Google Scholar] [CrossRef]
- Prasanna, B.B.; Kumar, G.S.; Subramani, T.; Bellum, R.R. Utilization of charnockite rock as manufactured-aggregate for construction industry: A case study from Thiruvakkarai quarry and M-sand plant in Tamil Nadu, India. Environ. Geochem. Health 2025, 47, 243. [Google Scholar] [CrossRef]
- Bahadur, S.; Nayak, N. Manufactured sand as fine aggregate. In Handbook on Advanced Concrete Technology; Alpha Science International Ltd.: Oxford, UK, 2013; pp. 58–61. [Google Scholar]
- Pakkiyachandran, M.; Sathiparan, N. Comparative study on quarry waste, manufactured sand, quarry dust as river sand replacement in cement mortar: Mechanical characteristics, durability, and eco-benefit. Materialia 2025, 40, 102395. [Google Scholar] [CrossRef]
- Zhu, X.; Zhang, Y.; Liu, Z.; Qiao, H.; Ye, F.; Lei, Z. Research on carbon emission reduction of manufactured sand concrete based on compressive strength. Constr. Build. Mater. 2023, 403, 133101. [Google Scholar] [CrossRef]
- Javilla, B.; Fang, H.; Mo, L.; Shu, B.; Wu, S. Test evaluation of rutting performance indicators of asphalt mixtures. Constr. Build. Mater. 2017, 155, 1215–1223. [Google Scholar] [CrossRef]
- Chen, W.; Wei, K.; Wei, J.; Han, W.; Zhang, X.; Hu, G.; Wei, S.; Niu, L.; Chen, K.; Fu, Z. Research on the road performance of asphalt mixtures based on infrared thermography. Materials 2022, 15, 4309. [Google Scholar] [CrossRef] [PubMed]
- Castillo, D.; Caro, S.; Darabi, M.; Masad, E. Influence of aggregate morphology on the mechanical performance of asphalt mixtures. Road Mater. Pavement Des. 2018, 19, 972–991. [Google Scholar] [CrossRef]
- Mohammad, H.K.; Albayati, A.H.; Al-Kheetan, M.J. Influence of Coarse Aggregate Geometry and Mineral Composition on the Durability of Asphalt Concrete. Infrastructures 2025, 10, 263. [Google Scholar] [CrossRef]
- Bhasin, A.; Masad, E.; Little, D.; Lytton, R. Limits on adhesive bond energy for improved resistance of hot-mix asphalt to moisture damage. Transp. Res. Rec. 2006, 1970, 2–13. [Google Scholar] [CrossRef]
- Ji, J.; Yao, H.; Liu, L.; Suo, Z.; Zhai, P.; Yang, X.; You, Z. Adhesion evaluation of asphalt-aggregate interface using surface free energy method. Appl. Sci. 2017, 7, 156. [Google Scholar] [CrossRef]





| Test Indicator | Unit | Design Requirement | Test Result | Individual Evaluation |
|---|---|---|---|---|
| Stone crushing value | % | ≤20 | 10.7 | Qualified |
| Los Angeles abrasion loss | % | ≤22 | 12.2 | Qualified |
| Apparent relative density | — | ≥2.60 | 2.951 | Qualified |
| Water absorption | % | ≤1.5 | 0.66 | Qualified |
| Soundness | % | ≤12 | 1.4 | Qualified |
| Content of needle-like and flaky particles (mixture) | % | ≤12 | — | — |
| Among them, particle size > 9.5 mm | % | ≤10 | 5.9 | Qualified |
| Among them, particle size < 9.5 mm | % | ≤15 | — | — |
| Content of particles < 0.075 mm by water washing method | % | ≤0.8 | 0.6 | Qualified |
| Soft stone content | % | ≤3 | 0.7 | Qualified |
| Adhesion with modified asphalt | Grade | 5 | 5 | Qualified |
| Polished stone value | — | ≥42 | 44 | Qualified |
| Test Indicator | Unit | Design Requirement (Expressway/First-Class Highway) | Granite Manufactured Sand | Limestone Manufactured Sand | Diabase Manufactured Sand | Individual Evaluation |
|---|---|---|---|---|---|---|
| Apparent relative density | g/cm3 | ≥2.50 | 2.637 | 2.662 | 2.698 | Qualified |
| Soundness (>0.3 mm part) | % | ≤12 | 8.5 | 7.2 | 6.8 | Qualified |
| Sand equivalent | % | ≥65 | 78 | 82 | 85 | Qualified |
| Angularity (flow time) | s | ≥30 | 38.5 | 35.2 | 41.8 | Qualified |
| Test Item | Technical Requirement | Test Result | Individual Evaluation |
|---|---|---|---|
| Penetration (25 °C, 100 g, 5 s), 0.1 mm | 40~60 | 53 | Qualified |
| Penetration index PI, min | 0 | 0.21 | Qualified |
| Ductility (5 °C, 5 cm/min), cm, min | 20 | 45 | Qualified |
| Softening point TR&B (°C), min | 75 | 88 | Qualified |
| Flash point (°C), min | 230 | 339 | Qualified |
| Solubility (%), min | 99 | 99.8 | Qualified |
| Storage stability: softening point difference (163 °C, 48 h), °C, max | 2 | 0.7 | Qualified |
| Elastic recovery (25 °C), %, min | 85 | 96 | Qualified |
| Kinematic viscosity (Pa·s) at 135 °C, max | 3 | 2.58 | Qualified |
| Kinematic viscosity (Pa·s) at 165 °C | No Requirement | 0.65 | — |
| Rotational thin film oven test (RTFOT) residue (163 °C, 85 min) | Mass Change (%) | ±1.0 | 0.062 |
| Ductility (5 °C, 5 cm/min), cm, min | 15 | 27 | Qualified |
| Penetration ratio (%), min | 65 | 82.7 | Qualified |
| Test Indicator | Unit | Design Requirement | Test Result | Individual Evaluation |
|---|---|---|---|---|
| Apparent relative density | — | ≥2.50 | 2.712 | Qualified |
| Moisture content | % | ≤1 | 0.3 | Qualified |
| Appearance | — | No Agglomeration | No Agglomeration | Qualified |
| Hydrophilic coefficient | — | <1 | 0.7 | Qualified |
| Particle gradation: passing rate (%) through 0.6 mm sieve | — | 90~100 | 99.5 | Qualified |
| Particle gradation: passing rate (%) through 0.15 mm sieve | — | 75~100 | 88.7 | Qualified |
| Particle gradation: passing rate (%) through 0.075 mm sieve | — | 50~75 | 65.3 | Qualified |
| Test Indicator | Unit | Design Requirement | Test Result | Individual Evaluation |
|---|---|---|---|---|
| Apparent relative density | — | ≥2.50 | 3.04 | Qualified |
| Particle gradation: passing rate (%) through 0.6 mm sieve | — | 90~100 | 99.9 | Qualified |
| Particle gradation: passing rate (%) through 0.15 mm sieve | — | 75~100 | 91.4 | Qualified |
| Particle gradation: passing rate (%) through 0.075 mm sieve | — | 50~75 | 68.2 | Qualified |
| Gradation Range | Mass Percentage (%) Passing Through the Following Sieves (Square Hole Sieve mm) | ||||||||||||
|---|---|---|---|---|---|---|---|---|---|---|---|---|---|
| 31.5 | 26.5 | 19 | 16 | 13.2 | 9.5 | 4.75 | 2.36 | 1.18 | 0.6 | 0.3 | 0.15 | 0.075 | |
| Upper Limit | 100 | 100 | 100 | 100 | 90 | 70 | 44 | 35 | 29 | 23 | 18 | 13 | 8 |
| Lower Limit | 100 | 100 | 100 | 95 | 70 | 50 | 26 | 18 | 15 | 12 | 8 | 6 | 4 |
| Blended | 100 | 100 | 100 | 96.9 | 81.7 | 60.2 | 33.7 | 24.4 | 17.4 | 13.4 | 9.6 | 7.5 | 5.3 |
| Type | No. | Height (mm) | Weight in Air (g) | Weight in Water (g) | Saturated Surface-Dry Weight (g) | Bulk Density by Saturated Surface-Dry Method (g/cm3) | Maximum Theoretical Density (g/cm3) | Void Ratio (%) |
|---|---|---|---|---|---|---|---|---|
| Granite | 1 | 64 | 1219.8 | 738.2 | 1222.4 | 2.519 | 2.637 | 4.5 |
| 2 | 63 | 1219.3 | 738 | 1222.6 | 2.516 | 2.637 | 4.6 | |
| 3 | 62.5 | 1215.9 | 732.6 | 1218.4 | 2.503 | 2.637 | 5.1 | |
| 4 | 64.5 | 1224.2 | 737.4 | 1227.1 | 2.5 | 2.637 | 5.2 | |
| Average | - | - | - | - | 2.51 | 2.637 | 4.83 | |
| Limestone | 1 | 63.3 | 1247.2 | 764.5 | 1249 | 2.574 | 2.662 | 3.3 |
| 2 | 62.9 | 1243.9 | 759.2 | 1246 | 2.555 | 2.662 | 4 | |
| 3 | 64 | 1248.2 | 762.1 | 1250.7 | 2.555 | 2.662 | 4 | |
| 4 | 63.5 | 1245.8 | 762.2 | 1249.2 | 2.558 | 2.662 | 3.9 | |
| Average | - | - | - | - | 2.561 | 2.662 | 3.81 | |
| Diabase | 1 | 62.2 | 1211.6 | 739.8 | 1214.8 | 2.551 | 2.698 | 5.5 |
| 2 | 62.4 | 1213.4 | 741.3 | 1218.3 | 2.544 | 2.698 | 5.7 | |
| 3 | 62.3 | 1216.5 | 739.1 | 1219.9 | 2.53 | 2.698 | 6.2 | |
| 4 | 63.5 | 1217 | 743.4 | 1222.4 | 2.541 | 2.698 | 5.8 | |
| Average | - | - | - | - | 2.541 | 2.698 | 5.81 |
| Manufactured Sand Lithology | Specimen No. | Dry Stability (kN) | Stability After 48 h Immersion (kN) | 48 h Residual Stability Ratio (%) | Stability After 7 d Immersion (kN) | 7 d Residual Stability Ratio (%) | Stability After 14 d Immersion (kN) | 14 d Residual Stability Ratio (%) |
|---|---|---|---|---|---|---|---|---|
| Granite | 1 | 11.35 | 10.1 | 87.9 | 9.85 | 86.8 | 9.52 | 83.9 |
| 2 | 12 | 10.03 | 83.6 | 9.72 | 81 | 9.31 | 77.6 | |
| 3 | 11.98 | 10.18 | 85 | 9.91 | 82.7 | 9.45 | 78.8 | |
| 4 | 11.06 | 10.46 | 94.6 | 10.15 | 91.7 | 9.83 | 88.9 | |
| Mean ± Standard Deviation | 11.60 ± 0.41 | 10.19 ± 0.18 | 87.8 ± 4.2 | 9.91 ± 0.17 | 85.6 ± 4.3 | 9.53 ± 0.21 | 82.3 ± 4.6 | |
| Limestone | 1 | 13.55 | 11.81 | 87.2 | 11.52 | 85 | 11.23 | 82.9 |
| 2 | 12.13 | 11.56 | 95.3 | 11.3 | 93.2 | 11.05 | 91.1 | |
| 3 | 11.87 | 11.35 | 95.6 | 11.12 | 93.7 | 10.88 | 91.7 | |
| 4 | 12.93 | 11.7 | 90.5 | 11.45 | 88.6 | 11.17 | 86.4 | |
| Mean ± Standard Deviation | 12.62 ± 0.72 | 11.61 ± 0.20 | 92.2 ± 3.6 | 11.34 ± 0.16 | 90.1 ± 3.8 | 11.08 ± 0.15 | 88.0 ± 3.9 | |
| Diabase | 1 | 12.95 | 11.41 | 88.1 | 11.18 | 86.4 | 10.92 | 84.3 |
| 2 | 13.98 | 11.01 | 78.7 | 10.75 | 76.9 | 10.48 | 75 | |
| 3 | 10.17 | 10.9 | 107.2 | 10.68 | 105 | 10.42 | 102.5 | |
| 4 | 11.32 | 10.92 | 96.5 | 10.7 | 94.5 | 10.45 | 92.3 | |
| Mean ± Standard Deviation | 12.11 ± 1.52 | 11.06 ± 0.23 | 92.6 ± 10.1 | 10.83 ± 0.21 | 90.7 ± 10.3 | 10.57 ± 0.22 | 88.5 ± 10.5 | |
| Analysis of Variance (p-value) | - | 0.032 | 0.001 | 0.008 | 0.002 | 0.009 | 0.001 | 0.01 |
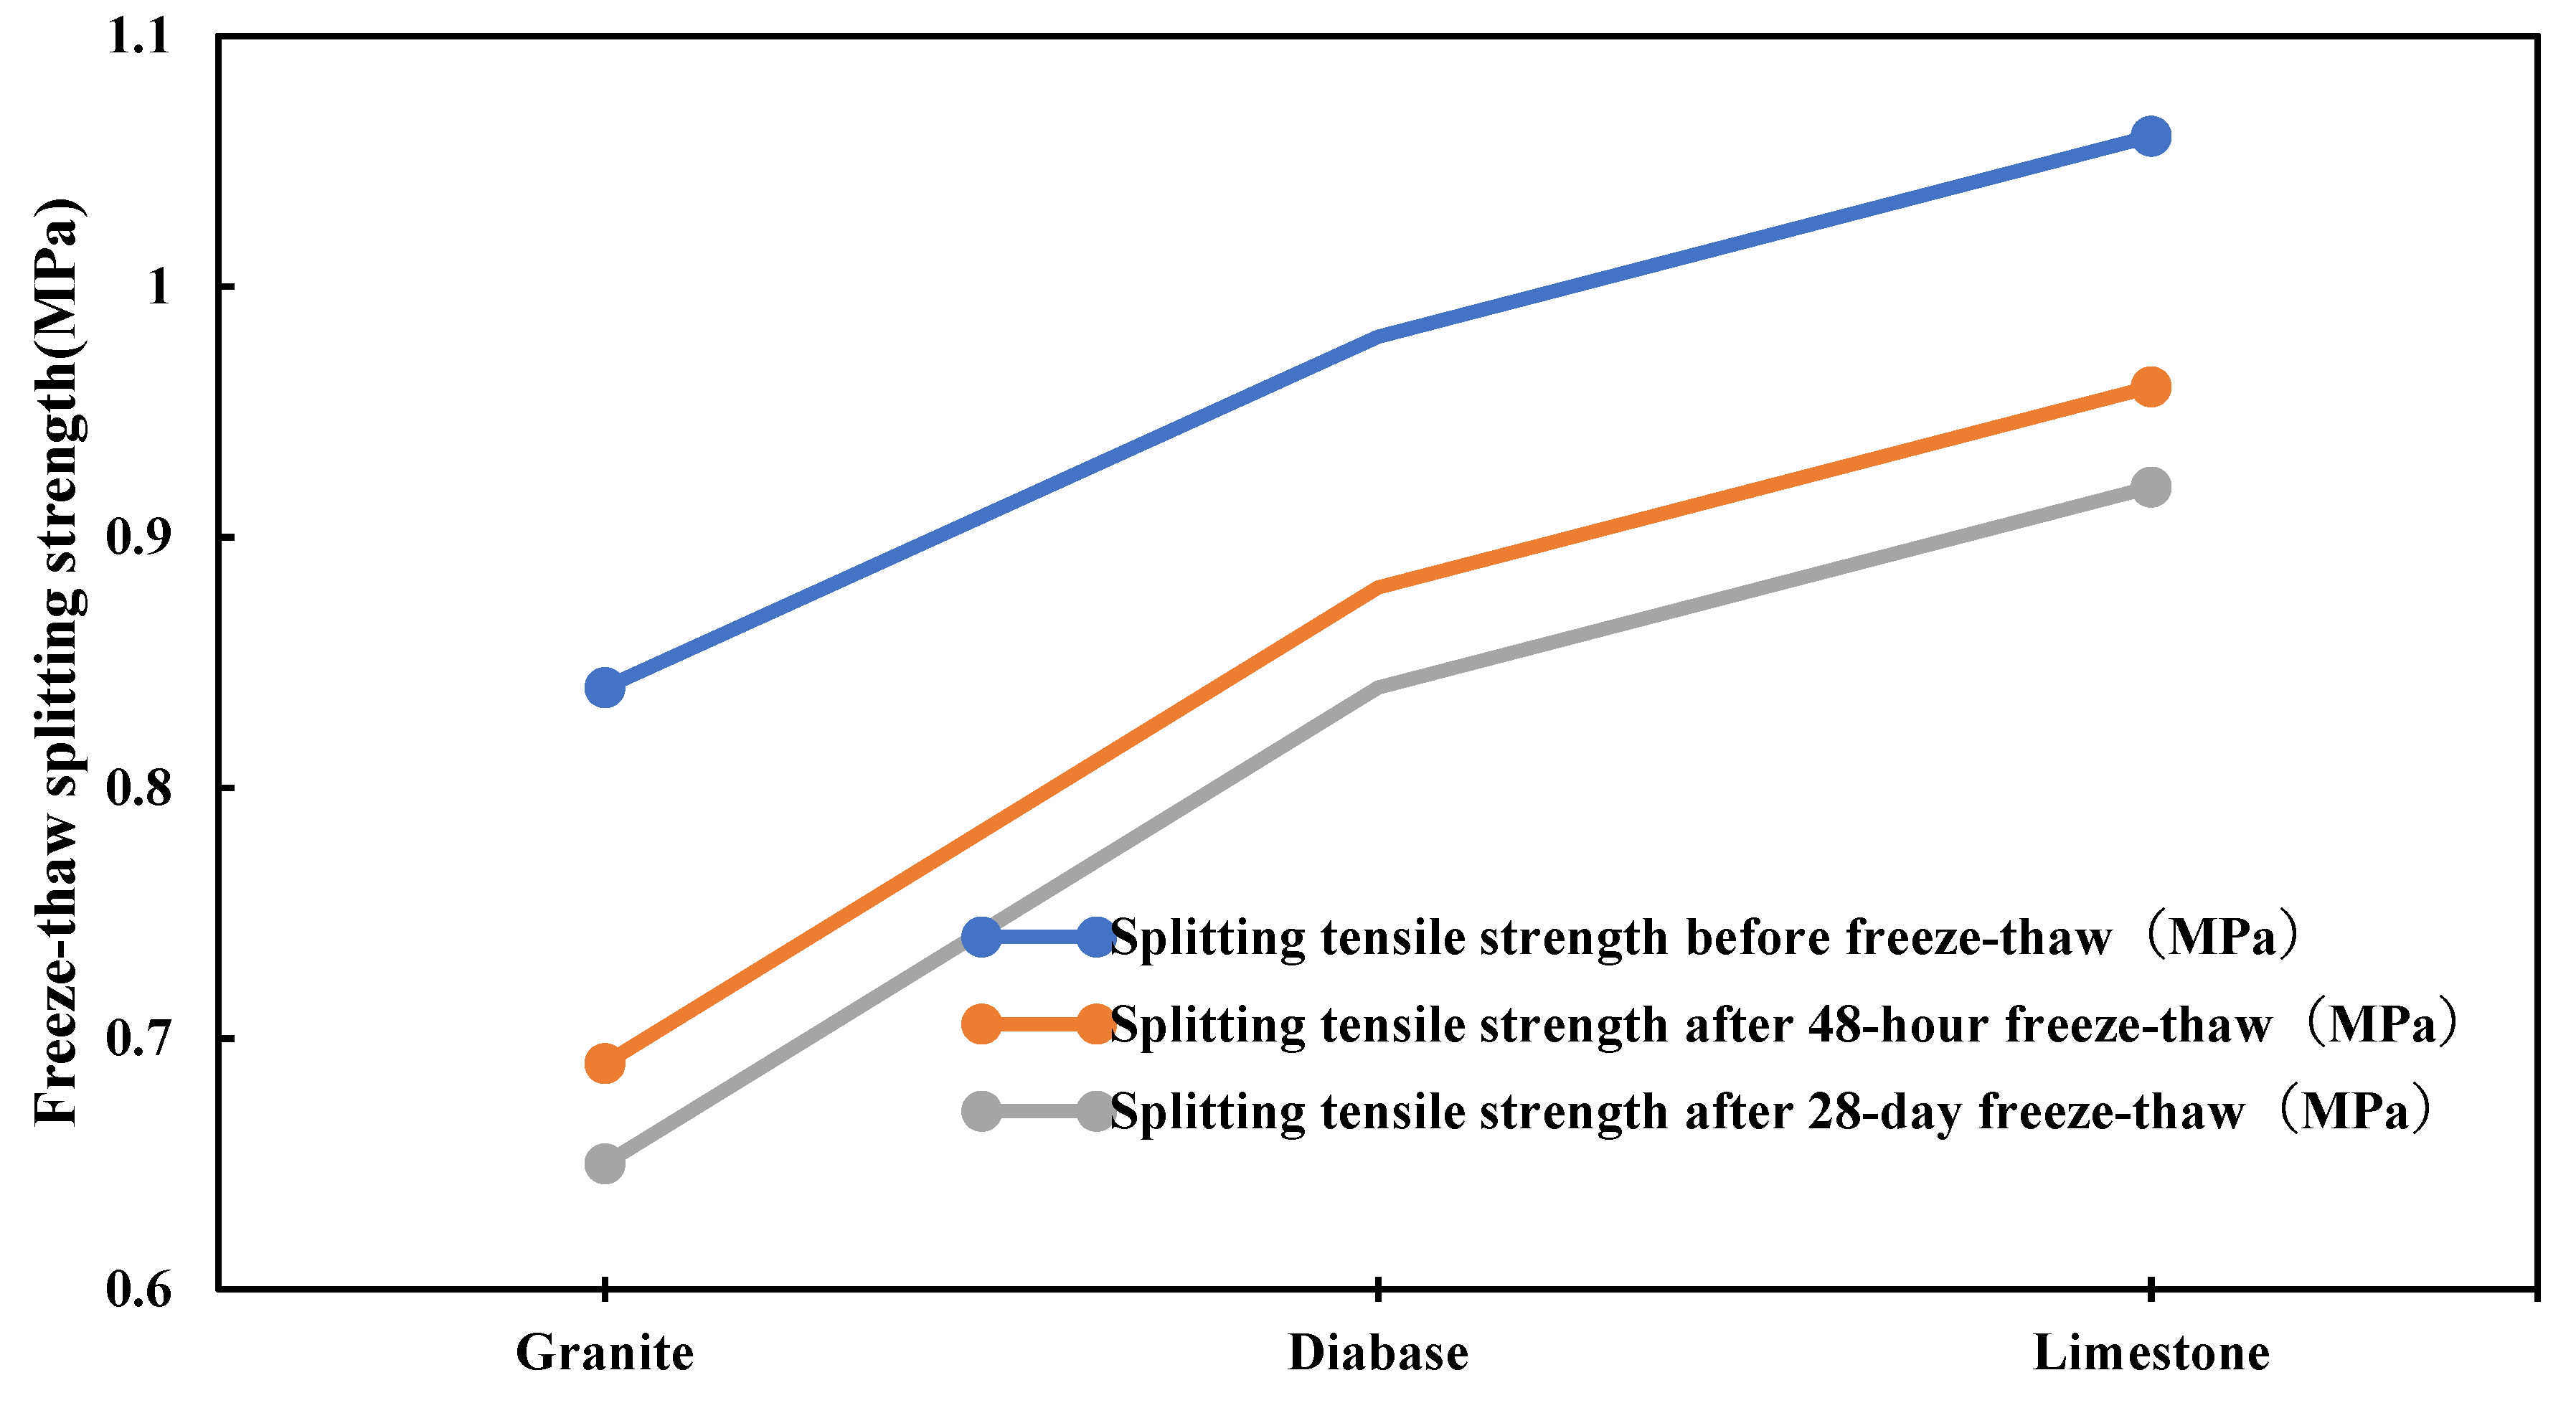
| Manufactured Sand Lithology | Specimen No. | Splitting Strength Before Freeze-Thaw (MPa) | Splitting Strength After 48 h Freeze-Thaw (MPa) | 48 h Residual Strength Ratio (%) | Splitting Strength After 28 d Freeze-Thaw (MPa) | 28 d Residual Strength Ratio (%) |
|---|---|---|---|---|---|---|
| Granite | 1 | 0.82 | 0.64 | 78 | 0.61 | 74.4 |
| 2 | 0.87 | 0.64 | 73.6 | 0.59 | 67.8 | |
| 3 | 0.81 | 0.76 | 93.8 | 0.72 | 88.9 | |
| 4 | 0.86 | 0.73 | 84.9 | 0.69 | 80.2 | |
| Mean ± Standard Deviation | 0.84 ± 0.03 | 0.69 ± 0.06 | 82.6 ± 7.9 | 0.65 ± 0.05 | 77.8 ± 8.5 | |
| Limestone | 1 | 1.17 | 0.89 | 76.1 | 0.85 | 72.6 |
| 2 | 1.05 | 0.93 | 88.6 | 0.89 | 84.8 | |
| 3 | 0.99 | 1.04 | 105.1 | 0.99 | 99 | |
| 4 | 1.05 | 1 | 95.2 | 0.95 | 90.5 | |
| Mean ± Standard Deviation | 1.06 ± 0.08 | 0.96 ± 0.07 | 91.2 ± 11.5 | 0.92 ± 0.06 | 86.7 ± 10.9 | |
| Diabase | 1 | 1 | 0.93 | 93 | 0.89 | 89 |
| 2 | 1.04 | 0.94 | 90.4 | 0.88 | 84.6 | |
| 3 | 0.98 | 0.8 | 81.6 | 0.76 | 77.6 | |
| 4 | 0.89 | 0.85 | 95.5 | 0.81 | 91 | |
| Mean ± Standard Deviation | 0.98 ± 0.06 | 0.88 ± 0.06 | 90.1 ± 5.4 | 0.84 ± 0.05 | 85.6 ± 5.8 | |
| Analysis of Variance (p-value) | - | 0.001 | 0.003 | 0.015 | 0.004 | 0.021 |
| Manufactured Sand Lithology | Dispersive Component (mJ/m2) | Polar Component (mJ/m2) | Total Surface Free Energy (mJ/m2) | Adhesion Work with Asphalt (mJ/m2) | Cohesion Work of Asphalt (mJ/m2) | Adhesion Work Ratio |
|---|---|---|---|---|---|---|
| Granite | 38.2 ± 1.2 | 2.1 ± 0.3 | 40.3 ± 1.4 | 52.6 ± 2.1 | 48.3 ± 1.8 | 1.09 ± 0.03 |
| Limestone | 42.5 ± 1.5 | 8.3 ± 0.5 | 50.8 ± 1.8 | 68.4 ± 2.5 | 48.3 ± 1.8 | 1.42 ± 0.04 |
| Diabase | 40.7 ± 1.3 | 5.6 ± 0.4 | 46.3 ± 1.6 | 61.8 ± 2.3 | 48.3 ± 1.8 | 1.28 ± 0.03 |
| Test Indicators | Degree of Freedom | F Value | p Value | Significant Conclusion | |
|---|---|---|---|---|---|
| Immersion Marshall test | 48 h residual stability ratio | 2, 9 | 8.76 | 0.008 | Extremely significant differences between groups |
| 7 d residual stability ratio | 2, 9 | 7.92 | 0.009 | Extremely significant differences between groups | |
| 14 d residual stability ratio | 2, 9 | 9.35 | 0.001 | Extremely significant differences between groups | |
| Freeze–thaw splitting test | 48 h residual strength ratio | 2, 9 | 6.43 | 0.015 | Significant differences between groups |
| 28 d residual strength ratio | 2, 9 | 5.87 | 0.021 | Significant differences between groups | |
| Manufactured Sand Lithology | Specimen No. | 60 °C Rutting Test | 70 °C Rutting Test | ||||
|---|---|---|---|---|---|---|---|
| Dynamic Stability (times/mm) | 60-min Rutting Depth (mm) | 120-min Rutting Depth (mm) | Dynamic Stability (times/mm) | 60-min Rutting Depth (mm) | 120-min Rutting Depth (mm) | ||
| Granite | 1 | 9624 | 2.15 | 2.87 | 4235 | 3.82 | 5.15 |
| 2 | 7961 | 2.48 | 3.32 | 3852 | 4.15 | 5.68 | |
| 3 | 7249 | 2.63 | 3.58 | 3518 | 4.47 | 6.03 | |
| Mean ± Standard Deviation | 8278 ± 1187 | 2.42 ± 0.24 | 3.26 ± 0.36 | 3868 ± 359 | 4.15 ± 0.33 | 5.62 ± 0.44 | |
| Limestone | 1 | 13,245 | 1.52 | 2.03 | 4581 | 3.46 | 4.68 |
| 2 | 11,759 | 1.76 | 2.31 | 4326 | 3.72 | 5.01 | |
| 3 | 11,061 | 1.89 | 2.54 | 4098 | 3.95 | 5.34 | |
| Mean ± Standard Deviation | 12,022 ± 1092 | 1.72 ± 0.19 | 2.29 ± 0.26 | 4335 ± 242 | 3.71 ± 0.25 | 5.01 ± 0.33 | |
| Diabase | 1 | 14,035 | 1.41 | 1.87 | 5038 | 3.12 | 4.25 |
| 2 | 11,357 | 1.68 | 2.19 | 4762 | 3.38 | 4.59 | |
| 3 | 12,496 | 1.55 | 2.03 | 4589 | 3.61 | 4.92 | |
| Mean ± Standard Deviation | 12,629 ± 1340 | 1.55 ± 0.14 | 2.03 ± 0.16 | 4796 ± 225 | 3.37 ± 0.25 | 4.59 ± 0.33 | |
| Analysis of Variance (p-value) | - | <0.001 | <0.001 | <0.001 | <0.001 | <0.001 | <0.001 |
| Manufactured Sand Lithology | Specimen No. | Beam Bending Test (−10 °C) | Maximum Flexural Strain εB (με) | Bending Stiffness Modulus SB (GPa) | Low-Temperature Shrinkage Coefficient (−20~20 °C) | Fracture Energy Test | Total Shrinkage (mm/m) |
|---|---|---|---|---|---|---|---|
| Flexural Tensile Strength RB (MPa) | Linear Shrinkage Coefficient α (×10−6/°C) | Fracture Energy GF (J/m2) | |||||
| Granite | 1 | 9.2 | 2315 | 3.97 | 12.8 | 896 | 0.512 |
| 2 | 9.5 | 2280 | 4.12 | 13.1 | 872 | 0.524 | |
| 3 | 9.8 | 2560 | 3.83 | 12.5 | 948 | 0.5 | |
| Mean ± Standard Deviation | 9.5 ± 0.3 | 2385 ± 142 | 4.00 ± 0.15 | 12.8 ± 0.2 | 905 ± 38 | 0.512 ± 0.012 | |
| Limestone | 1 | 11.3 | 2750 | 4.11 | 10.2 | 1245 | 0.408 |
| 2 | 10.8 | 2680 | 4.03 | 10.5 | 1218 | 0.42 | |
| 3 | 11.5 | 2725 | 4.22 | 10.1 | 1262 | 0.404 | |
| Mean ± Standard Deviation | 11.2 ± 0.3 | 2718 ± 35 | 4.12 ± 0.10 | 10.3 ± 0.2 | 1242 ± 22 | 0.411 ± 0.008 | |
| Diabase | 1 | 10.6 | 2805 | 3.78 | 9.8 | 1308 | 0.392 |
| 2 | 10.9 | 2730 | 3.99 | 10 | 1275 | 0.4 | |
| 3 | 11.1 | 2736 | 4.06 | 9.7 | 1292 | 0.388 | |
| Mean ± Standard Deviation | 10.8 ± 0.2 | 2757 ± 38 | 3.94 ± 0.14 | 9.8 ± 0.1 | 1292 ± 17 | 0.393 ± 0.006 | |
| Analysis of Variance (p-value) | - | <0.001 | <0.001 | 0.012 | <0.001 | <0.001 | <0.001 |
| Indicator | Maximum Flexural Strain (με) | Flexural Tensile Strength (MPa) | Bending Stiffness Modulus (GPa) | Linear Shrinkage Coefficient (×10−6/°C) | Fracture Energy (J/m2) |
|---|---|---|---|---|---|
| Maximum flexural strain (με) | 1 | 0.65 * | −0.72 * | −0.91 ** | 0.93 ** |
| Flexural tensile strength (MPa) | 0.65 * | 1 | 0.28 | −0.68 * | 0.78 ** |
| Bending stiffness modulus (GPa) | −0.72 * | 0.28 | 1 | 0.75 ** | −0.81 ** |
| Linear shrinkage coefficient (×10−6/°C) | −0.91 ** | −0.68 * | 0.75 ** | 1 | −0.94 ** |
| Fracture energy (J/m2) | 0.93 ** | 0.78 ** | −0.81 ** | −0.94 ** | 1 |
| Manufactured Sand Lithology | Number of Cycles | Maximum Flexural Strain εB (με) | Strain Attenuation Rate (%) | Fracture Energy GF (J/m2) | Fracture Energy Attenuation Rate (%) | Bending Stiffness Modulus SB (GPa) | Stiffness Growth Rate (%) |
|---|---|---|---|---|---|---|---|
| Granite | 0 times | 2385 ± 142 | - | 905 ± 38 | - | 4.00 ± 0.15 | - |
| 5 times | 2210 ± 125 | 7.3 | 820 ± 35 | 9.4 | 4.25 ± 0.12 | 6.2 | |
| 10 times | 2055 ± 110 | 13.8 | 745 ± 30 | 17.7 | 4.53 ± 0.10 | 13.2 | |
| 20 times | 1890 ± 95 | 20.8 | 658 ± 25 | 27.3 | 4.88 ± 0.08 | 22 | |
| 30 times | 1725 ± 80 | 27.7 | 582 ± 20 | 35.7 | 5.25 ± 0.06 | 31.2 | |
| Limestone | 0 times | 2718 ± 35 | - | 1242 ± 22 | - | 4.12 ± 0.10 | - |
| 5 times | 2605 ± 30 | 4.2 | 1165 ± 18 | 6.2 | 4.30 ± 0.09 | 4.4 | |
| 10 times | 2510 ± 25 | 7.6 | 1098 ± 15 | 11.6 | 4.48 ± 0.07 | 8.7 | |
| 20 times | 2385 ± 20 | 12.2 | 1012 ± 12 | 18.5 | 4.75 ± 0.05 | 15.3 | |
| 30 times | 2260 ± 18 | 16.8 | 935 ± 10 | 24.7 | 5.02 ± 0.04 | 21.8 | |
| Diabase | 0 times | 2757 ± 38 | - | 1292 ± 17 | - | 3.94 ± 0.14 | - |
| 5 times | 2680 ± 32 | 2.8 | 1235 ± 14 | 4.4 | 4.08 ± 0.11 | 3.6 | |
| 10 times | 2615 ± 28 | 5.2 | 1182 ± 12 | 8.5 | 4.21 ± 0.09 | 6.9 | |
| 20 times | 2520 ± 22 | 8.6 | 1105 ± 10 | 14.5 | 4.43 ± 0.07 | 12.4 | |
| 30 times | 2435 ± 18 | 11.7 | 1042 ± 8 | 19.3 | 4.65 ± 0.05 | 18 |
| Evaluation Dimension | Weight | Evaluation Indicator | Diabase Score | Limestone Score | Granite Score |
|---|---|---|---|---|---|
| Initial crack resistance | 0.4 | Maximum Flexural Strain (≥2500 με) | 100 | 98 | 75 |
| 0.2 | Fracture Energy (J/m2) | 100 | 96 | 70 | |
| Shrinkage characteristics | 0.15 | Linear Shrinkage Coefficient (×10−6/°C) | 95 | 90 | 65 |
| Long-term durability | 0.25 | Strain Retention Rate after 30 Cycles (%) | 98 | 92 | 72 |
| Comprehensive score | 1 | - | 97.8 | 93.5 | 70.3 |
| Evaluation grade | - | - | Excellent | Good | Poor |
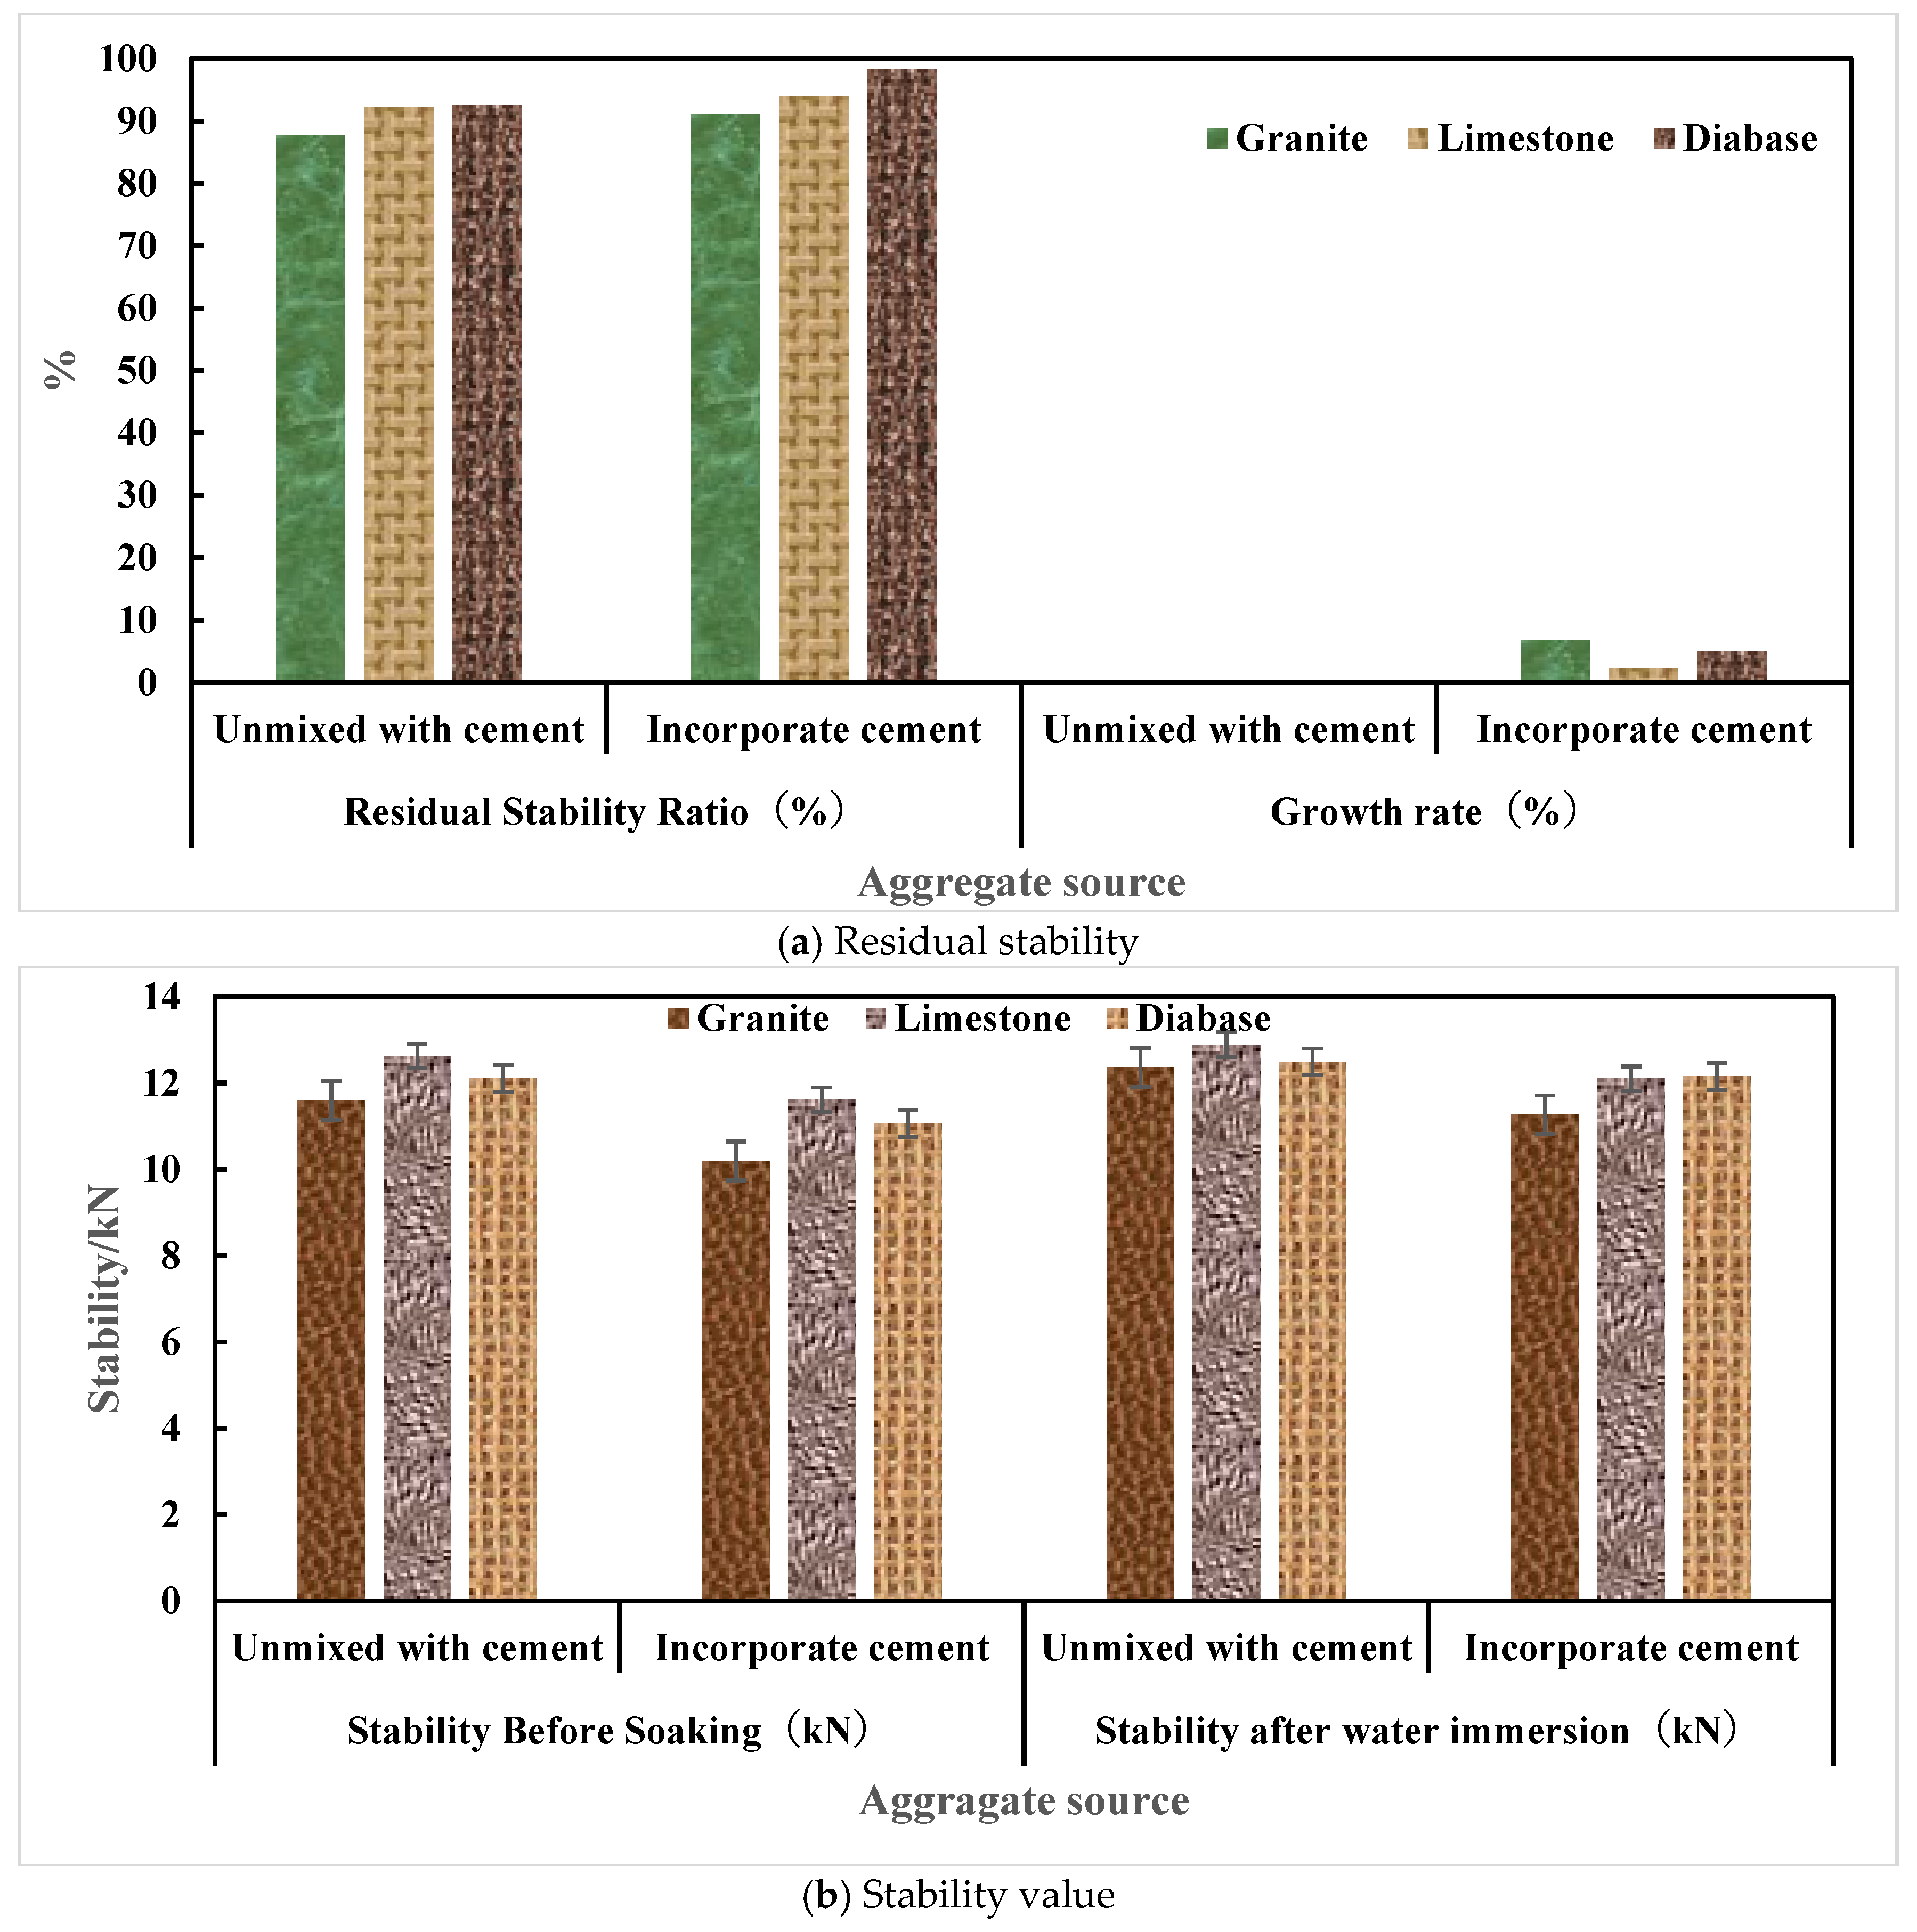
| Manufactured Sand Lithology | Cement Addition | Specimen No. | Stability Before Immersion (kN) | Stability After Immersion (kN) | Residual Stability Ratio (%) | Growth Rate (%) |
|---|---|---|---|---|---|---|
| Granite | Not added | 1 | 11.35 | 10.1 | 87.9 | — |
| 2 | 12 | 10.03 | 83.6 | — | ||
| 3 | 11.98 | 10.18 | 85 | — | ||
| 4 | 11.06 | 10.46 | 94.6 | — | ||
| Mean ± Standard Deviation | 11.60 ± 0.41 | 10.19 ± 0.18 | 87.8 ± 4.2 | — | ||
| Added | 1 | 12.15 | 11.02 | 90.7 | 3.3 | |
| 2 | 12.8 | 11.56 | 89.9 | 7.5 | ||
| 3 | 12.65 | 11.38 | 89.9 | 5.8 | ||
| 4 | 11.85 | 11.1 | 93.7 | 10.2 | ||
| Mean ± Standard Deviation | 12.36 ± 0.42 | 11.26 ± 0.21 | 91.1 ± 1.8 | 6.8 | ||
| Limestone | Not added | 1 | 13.55 | 11.81 | 87.2 | — |
| 2 | 12.13 | 11.56 | 95.3 | — | ||
| 3 | 11.87 | 11.35 | 95.6 | — | ||
| 4 | 12.93 | 11.7 | 90.5 | — | ||
| Mean ± Standard Deviation | 12.62 ± 0.72 | 11.61 ± 0.20 | 92.2 ± 3.6 | — | ||
| Added | 1 | 13.8 | 12.58 | 91.2 | 4.3 | |
| 2 | 12.45 | 11.89 | 95.5 | 0.2 | ||
| 3 | 12.1 | 11.68 | 96.6 | 1 | ||
| 4 | 13.2 | 12.25 | 92.8 | 2.5 | ||
| Mean ± Standard Deviation | 12.89 ± 0.68 | 12.10 ± 0.37 | 94.0 ± 2.3 | 2.3 | ||
| Diabase | Not added | 1 | 12.95 | 11.41 | 88.1 | — |
| 2 | 13.98 | 11.01 | 78.7 | — | ||
| 3 | 10.17 | 10.9 | 107.2 | — | ||
| 4 | 11.32 | 10.92 | 96.5 | — | ||
| Mean ± Standard Deviation | 12.11 ± 1.52 | 11.06 ± 0.23 | 92.6 ± 10.1 | — | ||
| Added | 1 | 13.3 | 12.25 | 92.1 | 4.5 | |
| 2 | 14.35 | 12.8 | 89.2 | 13.3 | ||
| 3 | 10.55 | 11.65 | 110.4 | 3 | ||
| 4 | 11.75 | 11.9 | 101.3 | 5 | ||
| Mean ± Standard Deviation | 12.49 ± 1.63 | 12.15 ± 0.42 | 98.3 ± 8.7 | 5 |
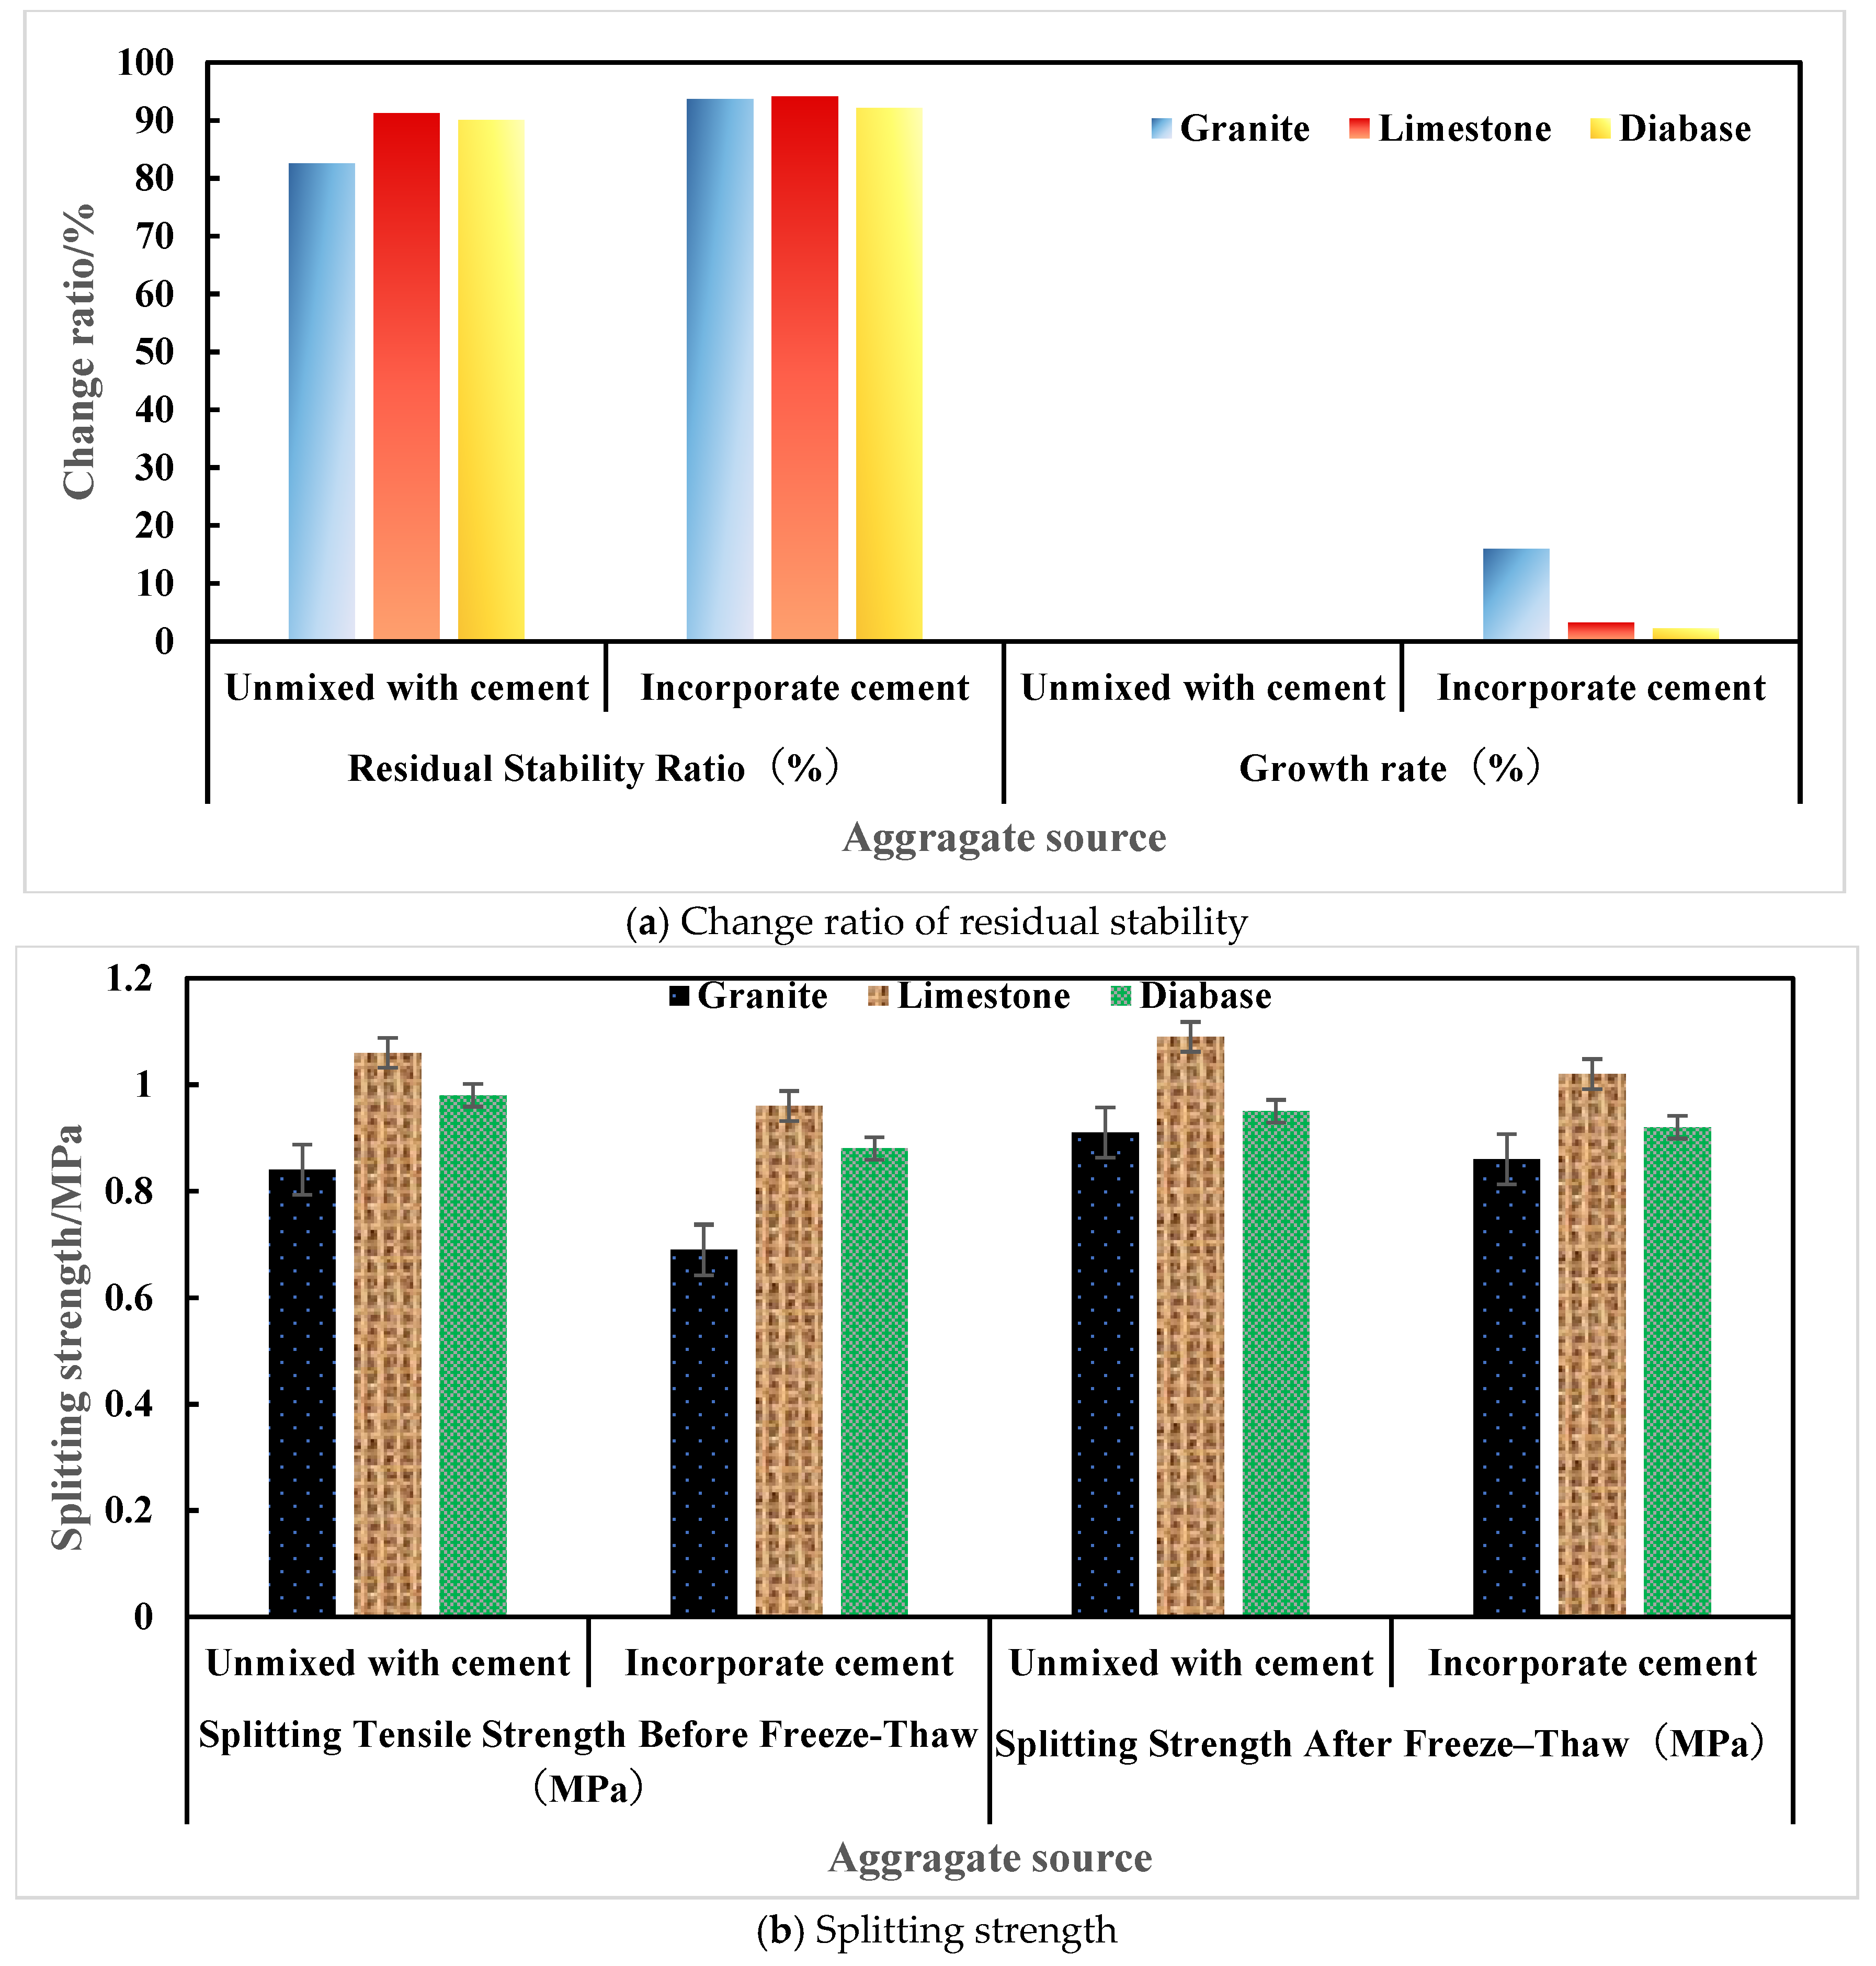
| Manufactured Sand Lithology | Cement Addition | Specimen No. | Splitting Strength Before Freeze-Thaw (MPa) | Splitting Strength After Freeze-Thaw (MPa) | Residual Strength Ratio (%) | Growth Rate (%) |
|---|---|---|---|---|---|---|
| Granite | Not added | 1 | 0.82 | 0.64 | 78 | — |
| 2 | 0.87 | 0.64 | 73.6 | — | ||
| 3 | 0.81 | 0.76 | 93.8 | — | ||
| 4 | 0.86 | 0.73 | 84.9 | — | ||
| Mean ± Standard Deviation | 0.84 ± 0.03 | 0.69 ± 0.06 | 82.6 ± 7.9 | — | ||
| Added | 1 | 0.9 | 0.85 | 94.4 | 21 | |
| 2 | 0.95 | 0.88 | 92.6 | 25.8 | ||
| 3 | 0.88 | 0.83 | 94.3 | 0.5 | ||
| 4 | 0.92 | 0.86 | 93.5 | 10.1 | ||
| Mean ± Standard Deviation | 0.91 ± 0.03 | 0.86 ± 0.02 | 93.7 ± 0.8 | 16 | ||
| Limestone | Not added | 1 | 1.17 | 0.89 | 76.1 | — |
| 2 | 1.05 | 0.93 | 88.6 | — | ||
| 3 | 0.99 | 1.04 | 105.1 | — | ||
| 4 | 1.05 | 1 | 95.2 | — | ||
| Mean ± Standard Deviation | 1.06 ± 0.08 | 0.96 ± 0.07 | 91.2 ± 11.5 | — | ||
| Added | 1 | 1.2 | 0.98 | 81.7 | 7.4 | |
| 2 | 1.08 | 0.99 | 91.7 | 3.5 | ||
| 3 | 1.02 | 1.08 | 105.9 | 0.8 | ||
| 4 | 1.08 | 1.05 | 97.2 | 2.1 | ||
| Mean ± Standard Deviation | 1.09 ± 0.07 | 1.02 ± 0.04 | 94.1 ± 9.8 | 3.2 | ||
| Diabase | Not added | 1 | 1 | 0.93 | 93 | — |
| 2 | 1.04 | 0.94 | 90.4 | — | ||
| 3 | 0.98 | 0.8 | 81.6 | — | ||
| 4 | 0.89 | 0.85 | 95.5 | — | ||
| Mean ± Standard Deviation | 0.98 ± 0.06 | 0.88 ± 0.06 | 90.1 ± 5.4 | — | ||
| Added | 1 | 1.05 | 0.99 | 94.3 | 1.4 | |
| 2 | 1.08 | 0.97 | 90 | −0.4 | ||
| 3 | 1.02 | 0.89 | 87.3 | 7 | ||
| 4 | 0.95 | 0.92 | 96.8 | 1.4 | ||
| Mean ± Standard Deviation | 1.03 ± 0.05 | 0.94 ± 0.04 | 92.1 ± 4.1 | 2.2 |
| Manufactured Sand Lithology | Cement Addition | Dynamic Stability (times/mm) | Growth Rate (%) | Surface Free Energy (mJ/m2) | Polar Component | Total Energy | Asphalt-Aggregate Adhesion Work (mJ/m2) |
|---|---|---|---|---|---|---|---|
| Dispersive Component | Mean ± Standard Deviation | ||||||
| Granite | Not added | 8278 ± 1187 | — | 38.2 | 2.1 | 40.3 | 52.6 ± 2.1 |
| Added | 12,850 ± 1320 | 55.2 | 39.5 | 4.8 | 44.3 | 68.4 ± 2.5 | |
| Limestone | Not added | 12,022 ± 1092 | — | 42.5 | 8.3 | 50.8 | 68.4 ± 2.5 |
| Added | 18,250 ± 1450 | 51.8 | 43.2 | 9.5 | 52.7 | 72.6 ± 2.3 | |
| Diabase | Not added | 12,629 ± 1340 | — | 40.7 | 5.6 | 46.3 | 61.8 ± 2.3 |
| Added | 19,880 ± 1560 | 57.4 | 41.8 | 7.9 | 49.7 | 75.2 ± 2.8 |
Disclaimer/Publisher’s Note: The statements, opinions and data contained in all publications are solely those of the individual author(s) and contributor(s) and not of MDPI and/or the editor(s). MDPI and/or the editor(s) disclaim responsibility for any injury to people or property resulting from any ideas, methods, instructions or products referred to in the content. |
© 2026 by the authors. Licensee MDPI, Basel, Switzerland. This article is an open access article distributed under the terms and conditions of the Creative Commons Attribution (CC BY) license.
Share and Cite
Hao, W.; Zhang, E.; Wang, X.; Yan, D.; Yu, G.; Zhang, S.; Wang, T.; Yu, H. Road Performance and Applicability of Asphalt Mixtures with Neutral Rock Manufactured Sand. Buildings 2026, 16, 1170. https://doi.org/10.3390/buildings16061170
Hao W, Zhang E, Wang X, Yan D, Yu G, Zhang S, Wang T, Yu H. Road Performance and Applicability of Asphalt Mixtures with Neutral Rock Manufactured Sand. Buildings. 2026; 16(6):1170. https://doi.org/10.3390/buildings16061170
Chicago/Turabian StyleHao, Wenyi, Erjie Zhang, Xiaodong Wang, Dengcai Yan, Guo Yu, Shugen Zhang, Tao Wang, and Huayang Yu. 2026. "Road Performance and Applicability of Asphalt Mixtures with Neutral Rock Manufactured Sand" Buildings 16, no. 6: 1170. https://doi.org/10.3390/buildings16061170
APA StyleHao, W., Zhang, E., Wang, X., Yan, D., Yu, G., Zhang, S., Wang, T., & Yu, H. (2026). Road Performance and Applicability of Asphalt Mixtures with Neutral Rock Manufactured Sand. Buildings, 16(6), 1170. https://doi.org/10.3390/buildings16061170