


Abstract
Conventional reinforced concrete exhibits weaknesses such as poor ductility, limited load-bearing capacity, and complex reinforcement detailing in beam-column joints. To expand its application scope, this study proposes two novel types of L-shaped and T-shaped concrete-filled special-shaped steel columns, with steel skeletons fabricated from either square steel tubes or H-shaped steel sections, based on built-up steel welding construction. A total of eight column compression tests were conducted under both axial and eccentric loading conditions. The main conclusions are as follows: All specimens exhibited failure modes characterized by external concrete cracking or spalling; axial compression specimens primarily developed vertical cracks, whereas eccentric compression specimens exhibited diagonal cracks. The use of normalized loads enabled comparison across columns with different numbers of limbs. The square steel tube columns demonstrated superior compressive performance compared to the H-shaped steel columns, with an average increase of 17.6%. Eccentric loading resulted in significant performance degradation across all four column types, with the T-shaped columns being particularly affected, exhibiting a 40.9% reduction in normalized load, while the L-shaped columns showed a relatively smaller reduction of 22.1%. Furthermore, a quadratic function fitting method was employed to analyze the stiffness degradation curves of all specimens, effectively capturing the stiffness degradation patterns with minimal dispersion and satisfactory fitting accuracy. Systematic parametric analysis revealed that the curve parameters are primarily governed by the initial stiffness and the displacement corresponding to complete stiffness degradation.
1. Introduction
Special-shaped steel refers to a category of steel components characterized by non-standardized cross-sectional geometries. Compared to conventional round and square steel tubes, special-shaped steel typically exhibits superior torsional resistance and enhanced mechanical performance. These structural advantages enable significant weight reduction in engineering applications, thereby promoting material efficiency and cost-effectiveness [1]. By filling concrete either internally or peripherally within special-shaped steel columns, this type of structural member integrates the advantageous properties of steel and concrete, thereby achieving enhanced mechanical performance. It not only improves the efficiency of load-bearing capacity but also exhibits excellent fire resistance, durability, and sound insulation. The unique cross-sectional geometry allows for optimized residential space planning and increased space utilization efficiency. Therefore, owing to their unique advantages, special-shaped steel-concrete columns have been widely applied across various engineering fields and have attracted increasing scholarly attention.
Liu [2] developed a specially designed cold-formed steel column with a special cross-sectional shape, capable of integrating multi-directional wall panels. Axial compression experiments and numerical simulations were performed on 18 specimens of this column type. The column demonstrated superior torsional resistance and ductility, and its adaptable configuration facilitated efficient modular assembly. The computational results indicated that with every 10% increase in the web plate width-to-thickness ratio, the local buckling load decreased by 22.37%, and the ultimate load capacity decreased by 14.79%. To improve the axial compressive performance of special-shaped steel-concrete specimens, Yang [3] incorporated pile-shaped reinforcing bars and tensile reinforcement ribs within the column. The experimental results indicated that these reinforcements effectively suppressed out-of-plane deformation at the weld zones. Moreover, both the pile-shaped reinforcing bars and tensile reinforcement ribs postponed the buckling of the steel tube, thereby enhancing concrete restriction and improving the ductility of the specimens. In addition, Yang [4] developed special-shaped steel-concrete columns with vertically welded ribs and integrated them with H-shaped steel beams to form a structural frame. The findings revealed that the composite frame exhibited superior seismic performance, characterized by enhanced energy dissipation capacity and increased lateral stiffness.
Jiang [5] proposed a special-shaped steel column with corrugated section plates and established a design method for axial compression stability. The comprehensive stability coefficient derived from this method has been verified to be both accurate and conservative, ensuring structural safety. Liu [6] introduced external diaphragms and vertical ribs as effective reinforcement strategies for special-shaped columns and further proposed a shear resistance design formula for joints based on internal force transmission mechanisms, which is applicable in practical engineering. Additionally, a finite element model was developed to simulate the connection between special-shaped steel-concrete columns and steel beams, enabling in-depth analysis of the load transfer behavior. Experimental results confirmed that the external diaphragm efficiently transfers load to the nodal plate region, enhancing structural performance.
Wang [7] proposed a novel, special-shaped steel-concrete column composed of multiple square steel tubes connected by steel hoops, forming L-shaped, T-shaped, or cross-sectional configurations, which facilitates its integration into walls. Experimental results demonstrated that the hooped-type specimens exhibited higher load-bearing capacity compared to the welded-type. The constitutive model presented in the study accurately predicts the mechanical behavior of the special-shaped steel-hoop-reinforced concrete columns under axial compression. Furthermore, the axial compression performance of 10 novel designed L-shaped and T-shaped special-shaped steel-concrete columns was systematically investigated [8]. The finite element simulation results showed good agreement with experimental data, indicating that the proposed design formula can serve as a reliable reference for practical engineering applications. Chen [9] carried out low-cycle reversed cyclic loading experiments on 17 reinforced concrete special-shaped columns, which exhibited excellent deformation capacity. The equivalent viscous damping coefficients of all specimens exceeded 0.2. Liu [10] conducted axial compression experiments on 6 L-shaped steel and 12 T-shaped special-shaped steel-concrete short columns. The L-shaped columns were reinforced with vertically welded stiffening ribs, while the T-shaped columns were strengthened using steel plate stiffeners. The experimental results demonstrated that these stiffening measures effectively delayed local buckling of the steel tube, enhanced the buckling resistance of the steel section, and improved the restraint effect on the concrete core. Zhang [11] investigated the seismic performance of wide-flange L-shaped special-shaped steel-concrete columns through quasi-static cyclic loading experiments. The findings revealed that vertical steel plates significantly influenced the seismic behavior and energy dissipation of the structural members.
Liu [12] investigated the axial mechanical behavior of composite special-shaped short columns fabricated from rolled steel. All specimens exhibited global compressive failure modes accompanied by localized buckling. Hu [13] proposed a bearing capacity calculation method for multi-chamber steel-concrete L-shaped columns under various loading conditions, including unidirectional bending, bidirectional bending, unidirectional compression-bending, and bidirectional compression-bending, demonstrating its broad applicability. Li [14] introduced a prefabricated and assembled cold-formed thin-walled steel-concrete partially encased cross-shaped column, with the coarse aggregate replacement rate as a variable parameter. The study revealed that this parameter had minimal influence on seismic performance indicators such as load-bearing capacity, ductility, and energy dissipation. Luo [15] examined the mechanical properties of L-shaped, T-shaped, and cross-shaped steel-concrete tubular short columns under axial compression. The finite element model showed good agreement with experimental results. The load–displacement curves of all three column types exhibited similar trends, and increasing the steel tube wall thickness was found to significantly enhance both the ultimate bearing capacity and ductility of the columns.
Liu [16] developed a machine learning-based framework to predict impact damage in concrete-filled steel tubular (CFST) columns. The artificial neural network (ANN) showed high accuracy, identifying tube diameter, impact velocity, and mass as key features. They further proposed an inverse design model for cost-effective impact resistance. Fang [17] experimentally investigated the seismic behavior of coal gangue concrete-filled steel tubular (CGCFST) columns. Results showed acceptable seismic performance, with 100% replacement ratios reducing peak load, stiffness, and energy dissipation by 13%, 13%, and 7%, respectively. A validated finite element model was developed, and existing design models were assessed for CGCFST. Zhao [18] conducted push-out tests on 18 SRCFST specimens to examine the bond behavior between inner steel and concrete. Results showed that inner steel tubes exhibited better bond performance than I-section steel. Cross-sectional dimensions, bond length, and concrete strength were key influencing factors. Two theoretical formulas for ultimate bond strength were proposed and validated.
Zhang [19] tested CGCFST columns under freeze–thaw cycles. Results showed reduced capacity, ductility, and stiffness, with high-strength concrete more affected. A constitutive model and ML predictor were proposed. Hay [20] conducted axial compression tests on 22 circular compound concrete-filled steel tube (CCFST) stub columns containing demolished concrete lumps. Results showed that failure loads were strongly correlated with compound concrete strength. Existing design methods (EC4, AISC 360, Han’s method) were evaluated against test data. Xu [21] conducted axial compression tests on 34 square concrete-filled steel tube (SCFST) slender columns with concrete defects. Results showed that capacity reductions ranged from 0% to 38.5%, with uniform defects more detrimental than separate distribution defects. Slender columns exhibited 7.11% lower capacity than short columns due to second-order effects. A defect-modified design model was proposed and validated.
Lin [22] developed a semi-analytical model to predict the axial capacity of circular CFST columns with defects, considering local buckling. The model incorporated weakly confined concrete areas and defect influence factors. Validation against 116 specimens showed accurate predictions, outperforming existing models. Tang [23] conducted eccentric compression tests on nine novel preplaced aggregate concrete-filled steel tube (PACFST) short columns. Results showed that failure involved mid-height bending and local bulging. Increasing eccentricity, tube thickness, and inner-to-external diameter ratio mitigated post-peak degradation. A capacity prediction formula was proposed and validated. The author conducted eccentric compression tests on PACFST short columns. Axial failure showed circumferential bulging, while eccentric failure involved local bulging and concrete tension cracking. Proposed capacity formulas for both axial and eccentric loading agreed well with test results, with errors within 10% [24].
Zhang [25] proposed a novel longitudinal-plate shear connector for CFST columns. Push-out tests on eight specimens showed that the connectors increased shear capacity by up to 725% compared to the benchmark. A validated FE model was developed, and predictive formulas for shear capacity were proposed. Xie [26] used acoustic emission (AE) to monitor damage in defective CFST columns under axial compression. Tests on 42 specimens identified three damage stages, with defect type affecting damage initiation. An LSTM-based early-warning system provided 38.5 s advance notice before failure. Benedetto [27] experimentally investigated the bond behavior between CFST columns and reinforced concrete plinths without shear connectors. A pull-out test was conducted and modeled in OpenSees using a bond-slip approach based on Model Code 1990 for smooth bars. The model accurately predicted test results, and a parametric study led to a bond resistance equation. Zhong [28] numerically compared CFST and RC columns in subway stations. CFST columns reduced seismic damage probability by 44% under strong earthquakes. Results support performance-based design of underground structures.
Chen [29] developed a finite element model to analyze the post-creep buckling behavior of recycled aggregate concrete-filled steel tubes (RACFST). Results showed that creep history reduces short-term load resistance. Two reduction factors were proposed—based on Perry’s formula and regression analysis—both accurate to within ±5% of FEM results. Shen [30] tested CFRP-strengthened CFST composite columns after high-temperature exposure. Axial capacity decreased by up to 41.5% at 800 °C, but CFRP wrapping effectively restored and enhanced capacity. An FE model was validated, and a predictive formula was proposed. Liu [31] tested locally corroded circular CFST stubs under local compression. Capacity decreased by up to 41.4%, with local compression area ratio and corrosion depth being key factors. An FE model was validated, and simplified capacity formulas were proposed with errors within ±10%. Liu [32] tested CFST-confined stone columns under axial compression. Confinement changed failure from brittle to quasi-brittle shear, increasing peak stress by up to 323.7% and ductility by 59.8% (circular) and 30.6% (square). A constitutive model for peak stress and strain was proposed based on equivalent lateral confining stress. Feng [33] tested post-fire assembled exterior joints between H-steel precast concrete beams and concrete-encased CFST columns. Fire exposure reduced load capacity and stiffness. RBF beams worsened post-fire ductility, while untreated and OBW beams showed enhanced ductility. A recovery force model was proposed for seismic analysis. Yu [34] conducted quasi-static tests on multi-cavity rectangular concrete-filled steel tube (M-RCFST) columns. Increasing cavity number enhanced strength, stiffness, ductility, and energy dissipation, while a higher axial compression ratio reduced ductility. A validated FE model was developed, and a restoring force model was proposed for seismic design.
As summarized in the aforementioned literature, researchers have developed diverse configurations of special-shaped columns with varying geometric and structural parameters. At present, there is a lack of standardized design codes specifically addressing special-shaped columns. Compared to conventional columns with simple geometries, their application in seismic-resistant and high-rise structures remains limited. Therefore, further research is essential to comprehensively investigate and characterize the mechanical behavior of special-shaped columns.
Current research on complex composite concrete-filled steel tubular (CFST) structures remains insufficient. Moreover, exposed steel plates are vulnerable to corrosion and high-temperature degradation, compromising long-term durability and fire resistance. Therefore, encasing such composite structures with an additional outer layer of concrete may offer a more robust solution. This approach not only protects the steel from environmental attacks but also enhances structural integrity through combined confinement. Further investigation is needed to develop design methodologies that integrate mechanical performance with improved lifecycle durability under extreme conditions.
This paper proposes a novel composite steel tube–concrete composite structure, in which a compositely welded steel tube skeleton is embedded within the column. The skeleton is internally filled with concrete and externally encased by an additional concrete layer, thereby providing protection to the inner steel components. Openings are arranged in the steel plates to ensure collaborative behavior between the inner and outer concrete. Furthermore, the combination of increased steel content and composite action between the concrete and internal steel structure leads to structural capacities far exceeding those of traditional reinforced concrete. In this research, four novel types of special-shaped steel-concrete columns were designed and fabricated. The steel in the core area was divided into square steel tubes and H-shaped steel. Each type of steel contained L-shaped columns and T-shaped columns. These four special-shaped steel-concrete columns were respectively subjected to axial compression experiments and eccentric compression experiments, with a total of eight columns. The damage conditions of the columns during the experiments were presented in the paper, and the load–displacement curves and related data obtained were analyzed. Based on the steel usage and whether the steel was exposed, design suggestions for the special-shaped steel-concrete columns were given.
2. Experiment Design
2.1. Specimen Design and Fabrication
2.1.1. Specimen Design
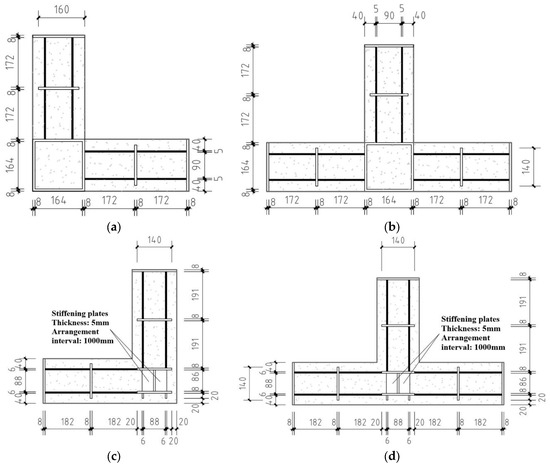
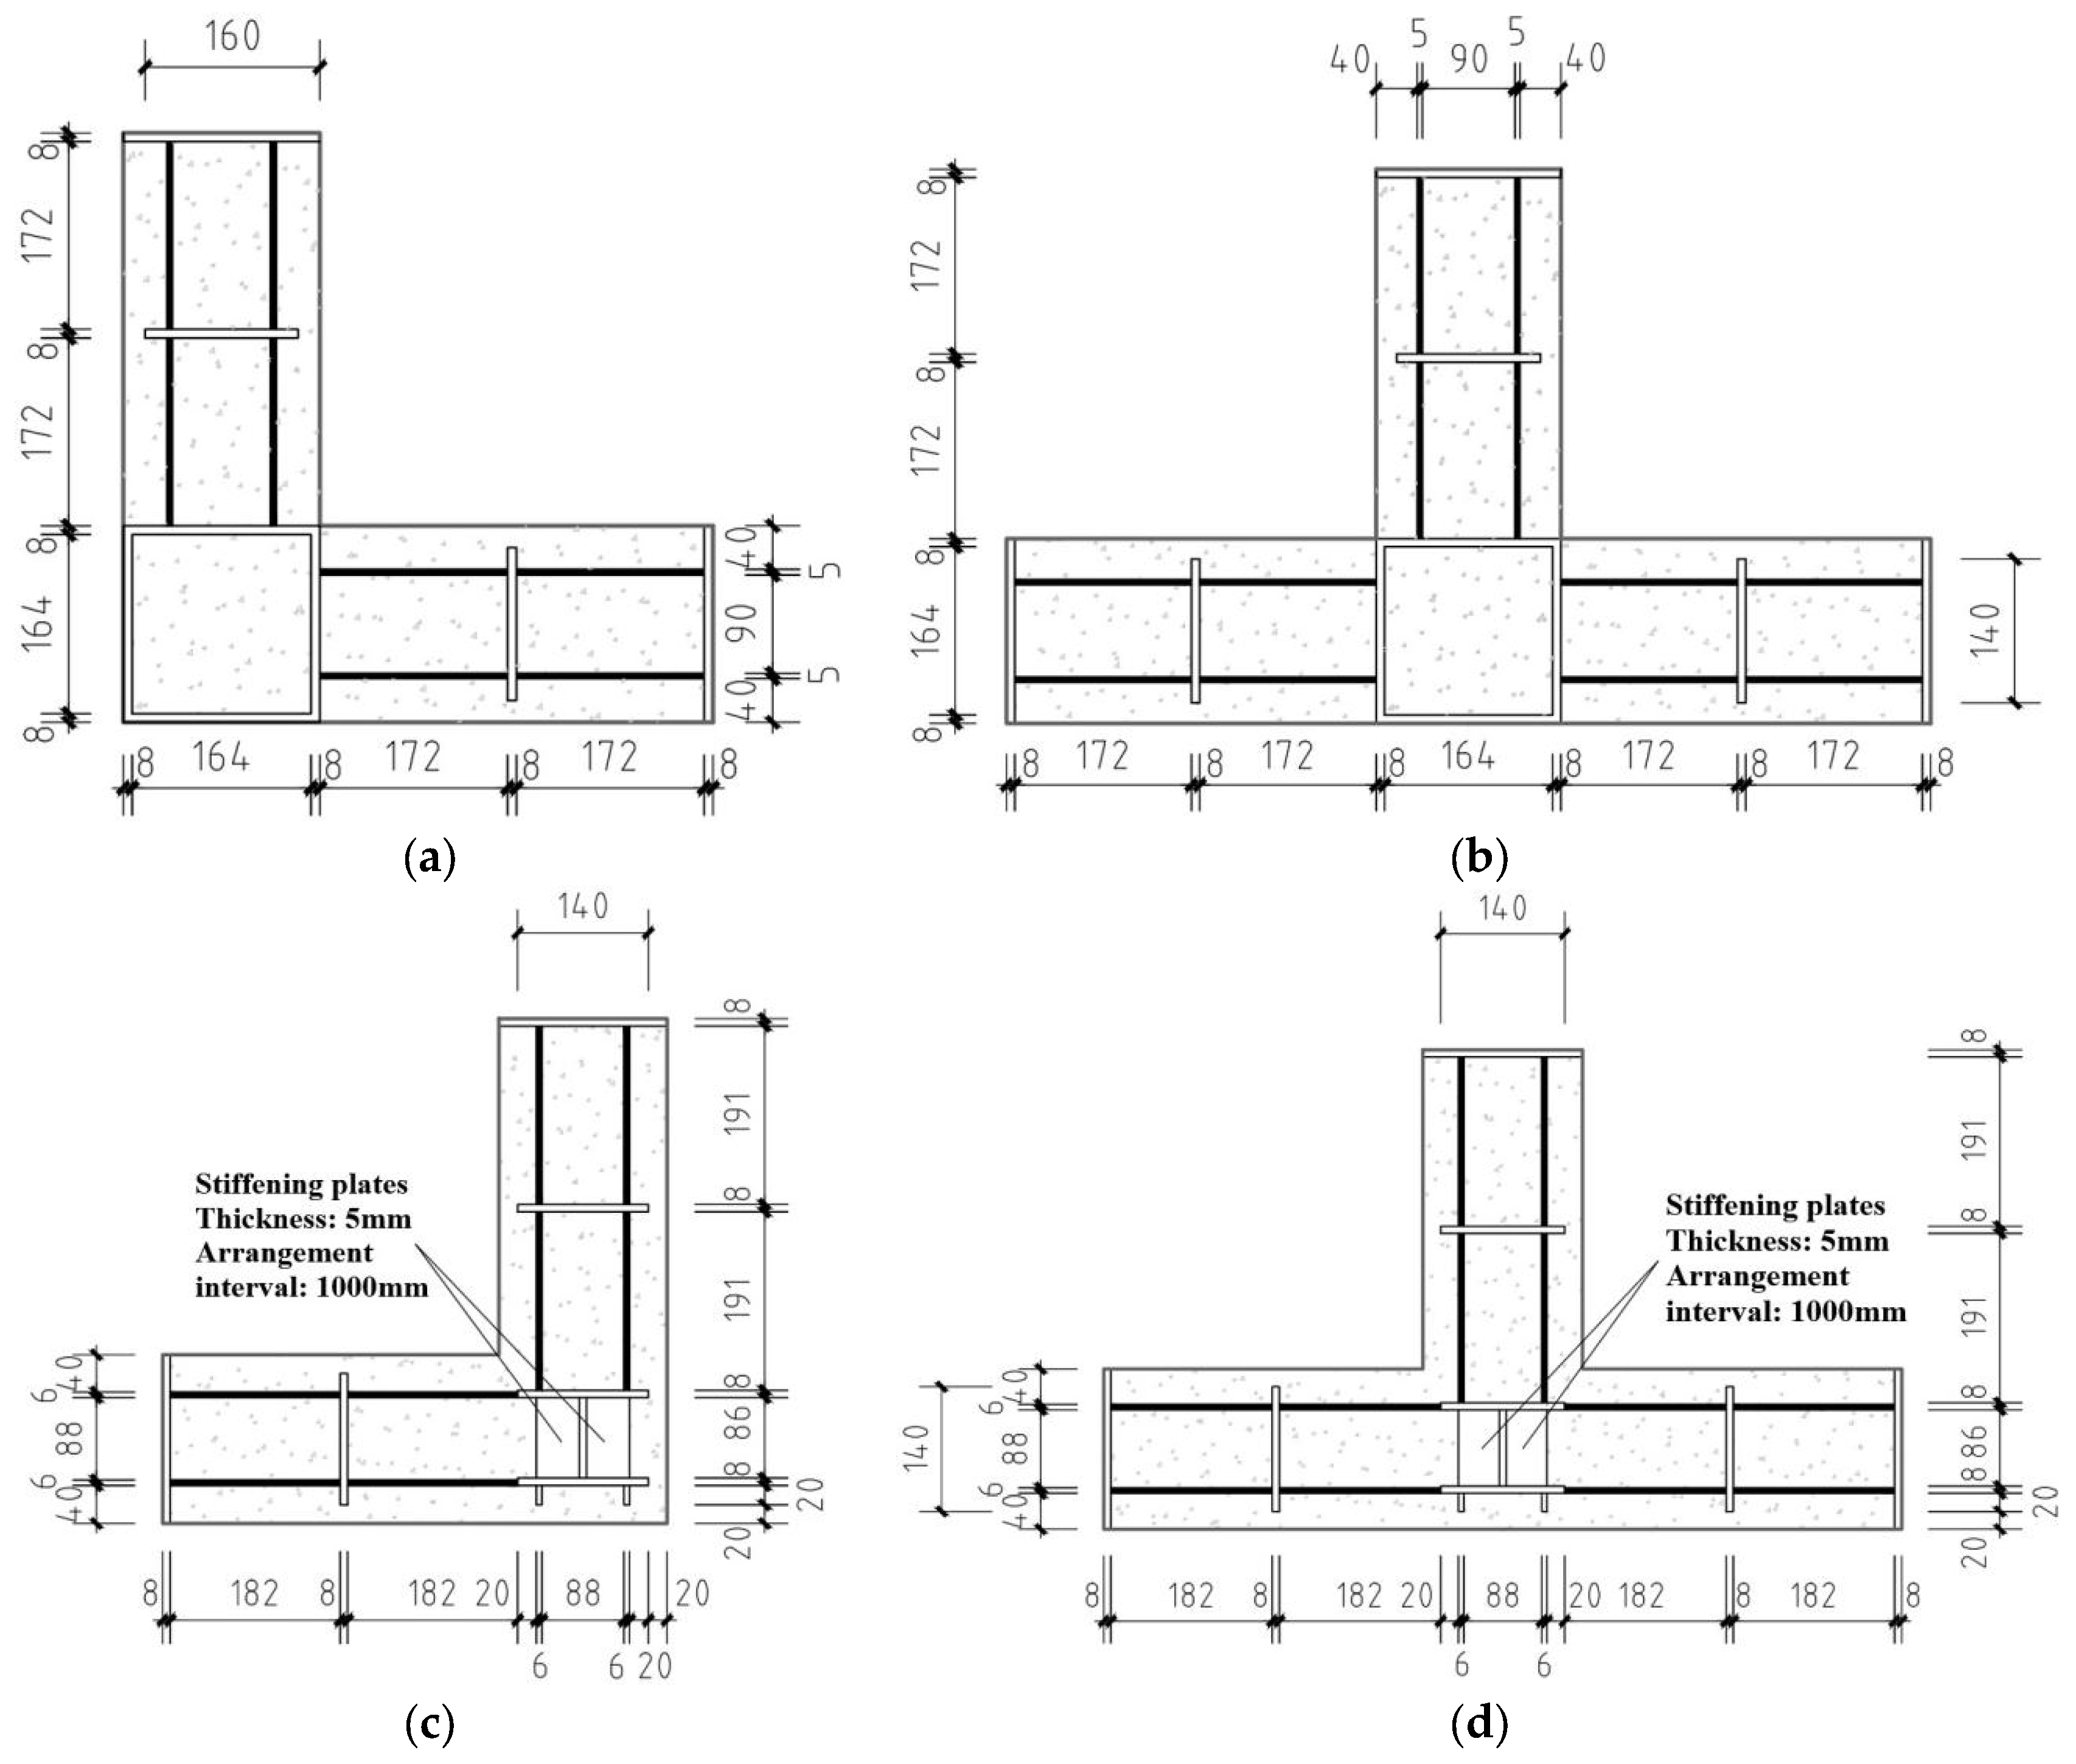
In this research, the special-shaped column specimens were categorized into 2 types according to their core steel components: square steel tubes and H-shaped steel sections. These steel components were further classified into L-shaped and T-shaped columns, featuring 2 and 3 projecting arms, respectively. Each specimen type underwent both axial and eccentric compression loading. The specimens were constructed by casting concrete around the steel components, with specimen information provided in Table 1. Cross-sectional details of the specimens are illustrated in Figure 1.
Table 1.
Specimens list.
Figure 1.
Specimen cross-sectional dimensions (mm): (a) RL column; (b) RT column; (c) HL column; (d) HT column.
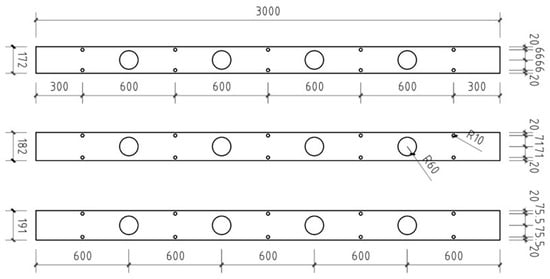
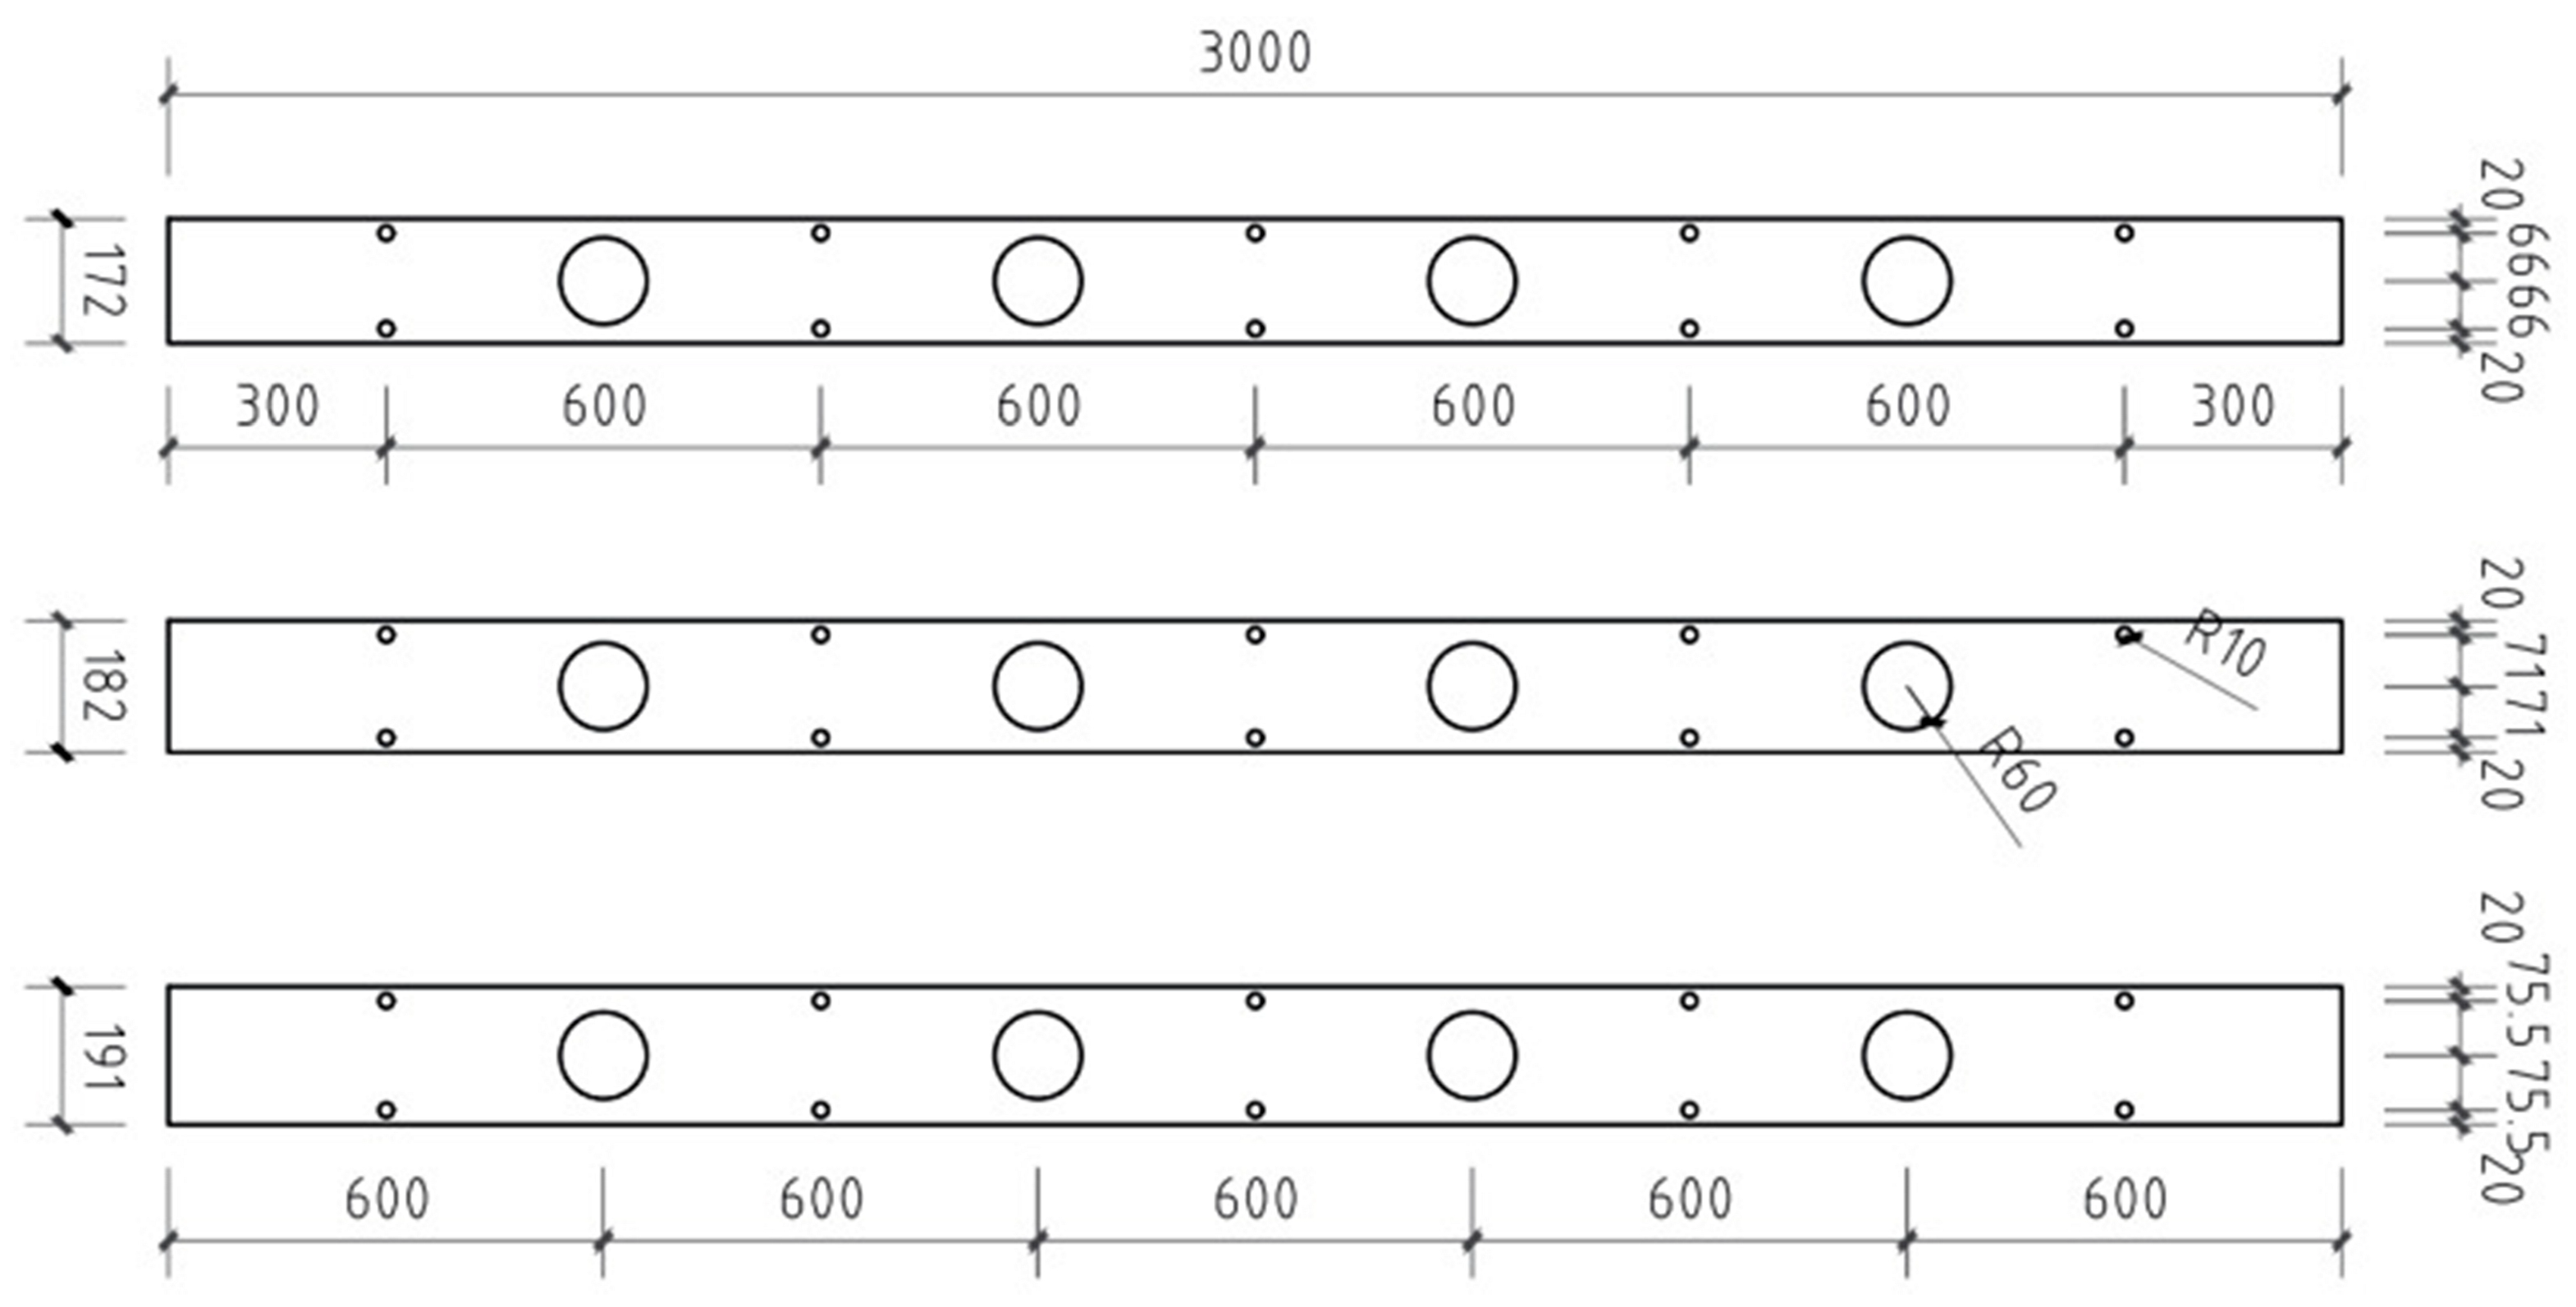
To ensure effective concrete filling within the column during casting, openings must be provided on the web plates. The black-filled steel plates shown in Figure 1 represent the perforated webs. All perforated webs have a uniform height of 3000 mm and are categorized into 3 width types: 172 mm, 182 mm, and 191 mm. The openings are classified into 2 types: large and small. Large holes have a radius of 60 mm and are spaced 600 mm apart along the central axis of the web. Small holes have a radius of 10 mm, are spaced 600 mm apart, and are arranged in 2 staggered rows, with their centers located 20 mm inward from the edges. These are illustrated in Figure 2.
Figure 2.
Perforated web plate dimensions (mm).
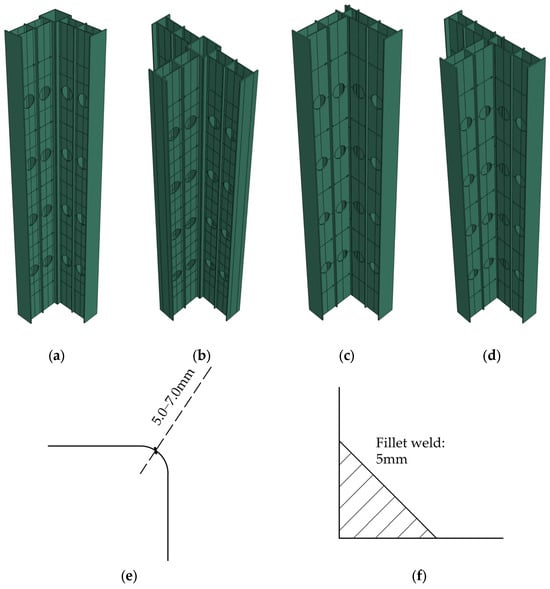
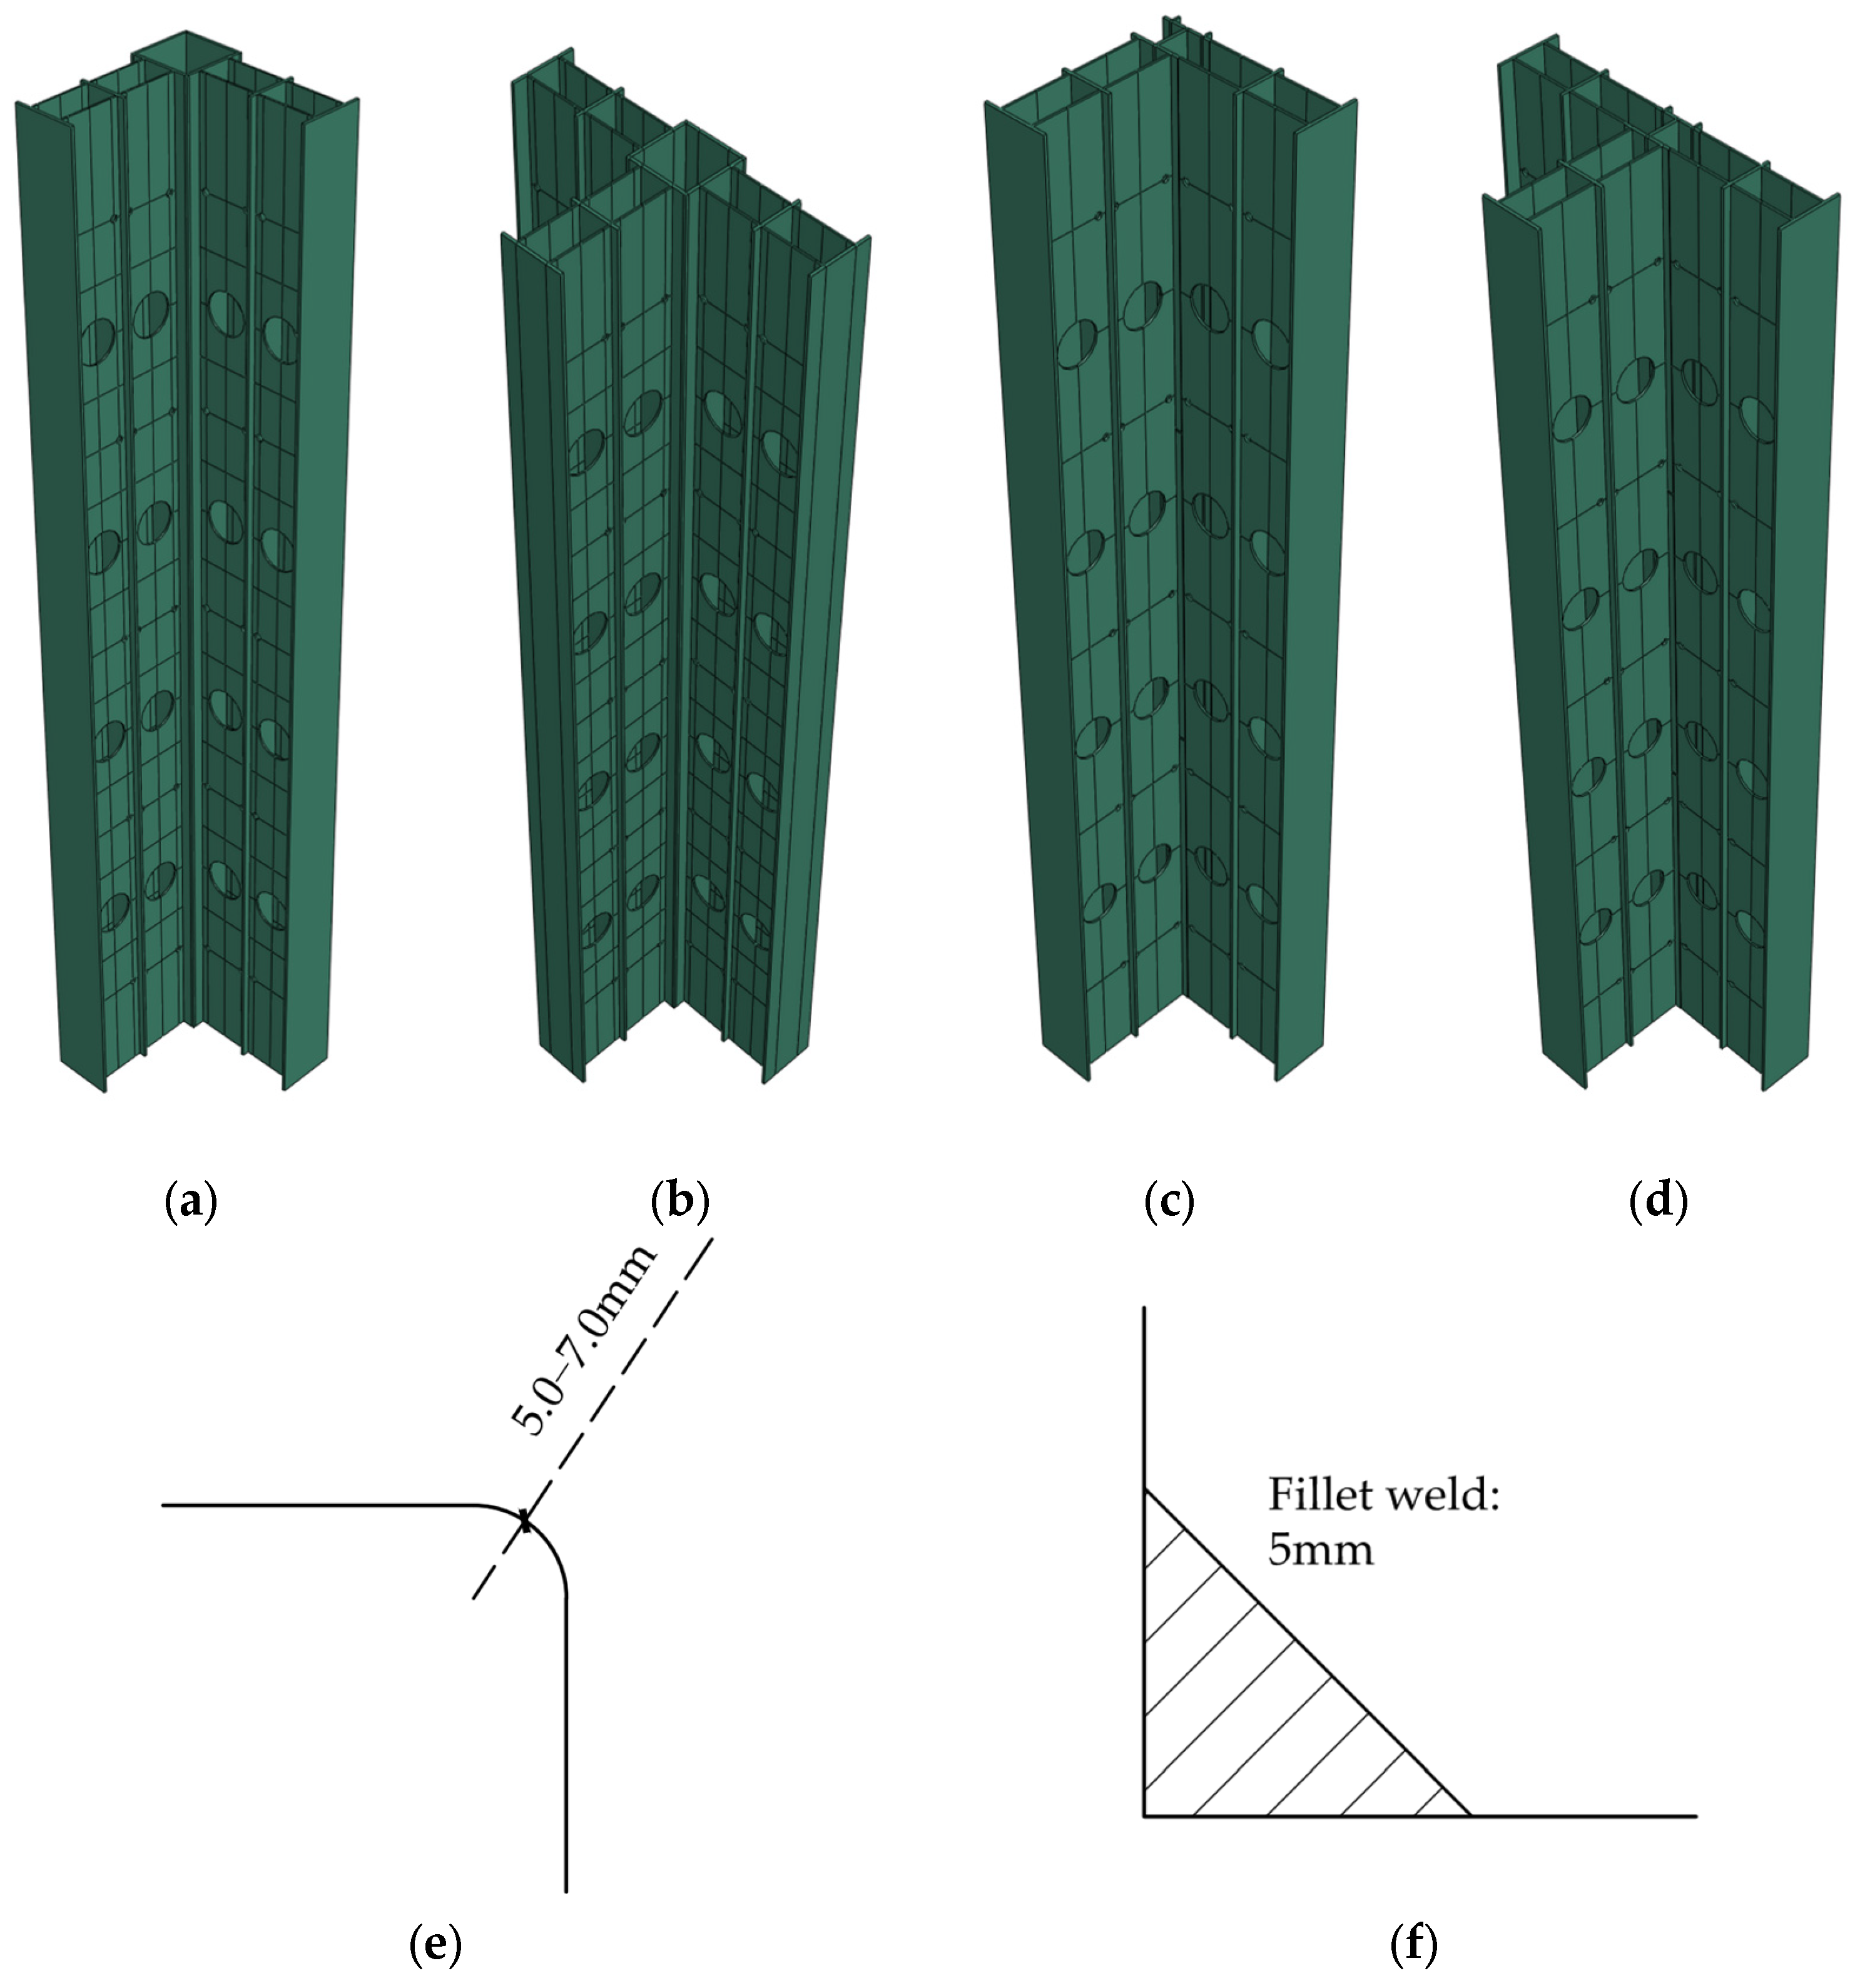
Figure 3 shows a schematic diagram of the finished steel skeleton of the specimen after welding, along with the welding details. Table 2 presents the material consumption for the four types of specimens.
Figure 3.
3D Schematic diagram of the test specimen and welding details: (a) RL column; (b) RT column; (c) HL column; (d) HT column; (e) filet radius; (f) filet weld.
Table 2.
Material volume.
2.1.2. Material Properties
Specimens were constructed using Q345 low-carbon steel and C30 commercial-grade concrete; all eight specimens were cast using the same batch of concrete. A total of 6 samples, divided into 2 groups, were collected from 8 mm and 6 mm steel plates for mechanical property tests. The results of these material tests are summarized in Table 3.
Table 3.
Material property test results.
In the material tests of Q345 steel, the yield strength (fy) was found to be close to the nominal steel grade, with an average value of 338 MPa. The average ultimate tensile strength was measured at 511.83 MPa, and the average elastic modulus was 188.5 GPa. Regarding elongation, one specimen exhibited a significantly higher elongation of 35.6%, while the remaining values showed minimal variation, with an average of 22.98%. The material property tests indicated that the mechanical properties of the two plate thicknesses were highly consistent, suggesting that the influence of cutting processing on the material behavior can be considered negligible in this experimental context.
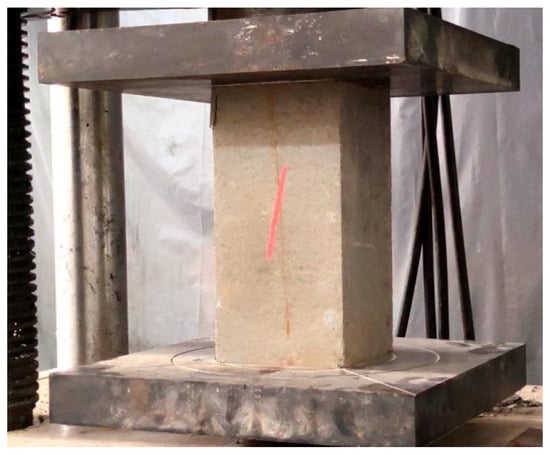
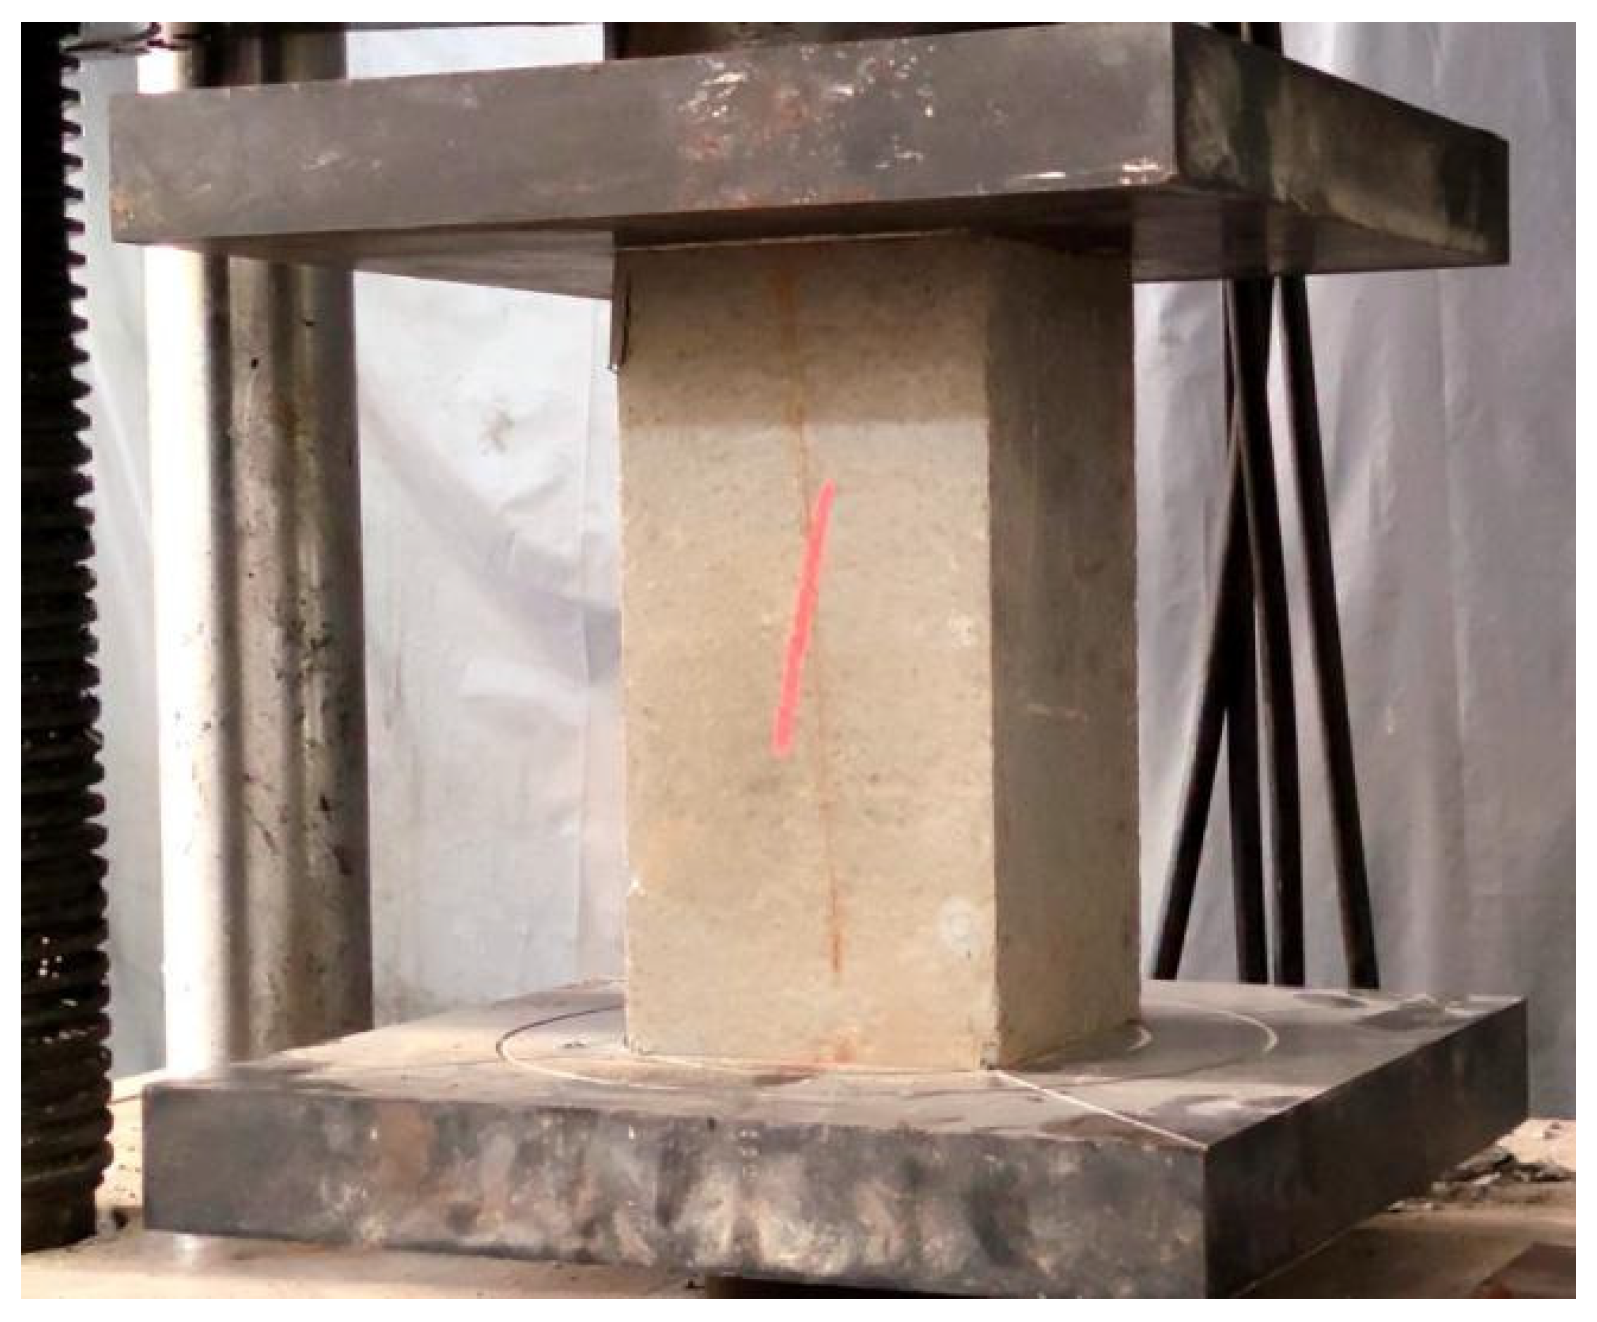
According to the standard GB/T 50107 [35], C30 grade concrete was tested. A total of 3 cubic specimens (150 mm × 150 mm × 150 mm) and 2 prismatic specimens (150 mm × 150 mm× 300 mm) were prepared. The prismatic specimens are illustrated in Figure 4.
Figure 4.
Strength test of C30 concrete (The red line is the specimen number).
The compressive strengths of the 3 cubic specimens were 59.26 MPa, 47.11 MPa, and 59.09 MPa, respectively, while those of the 2 prismatic specimens were 51.85 MPa and 46.32 MPa. According to GB50010-2010 [36], the test results satisfy the strength requirements for C30 concrete and exhibit a significant safety redundancy. The specimens were tested at ages significantly beyond 28 days. Concrete strength continues to increase with age, particularly for mixtures containing mineral admixtures such as fly ash or slag, which exhibit substantial late-age strength gain.
2.1.3. Specimen Processing
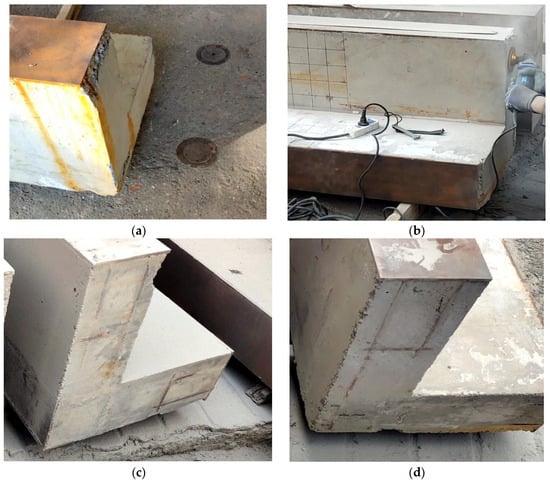
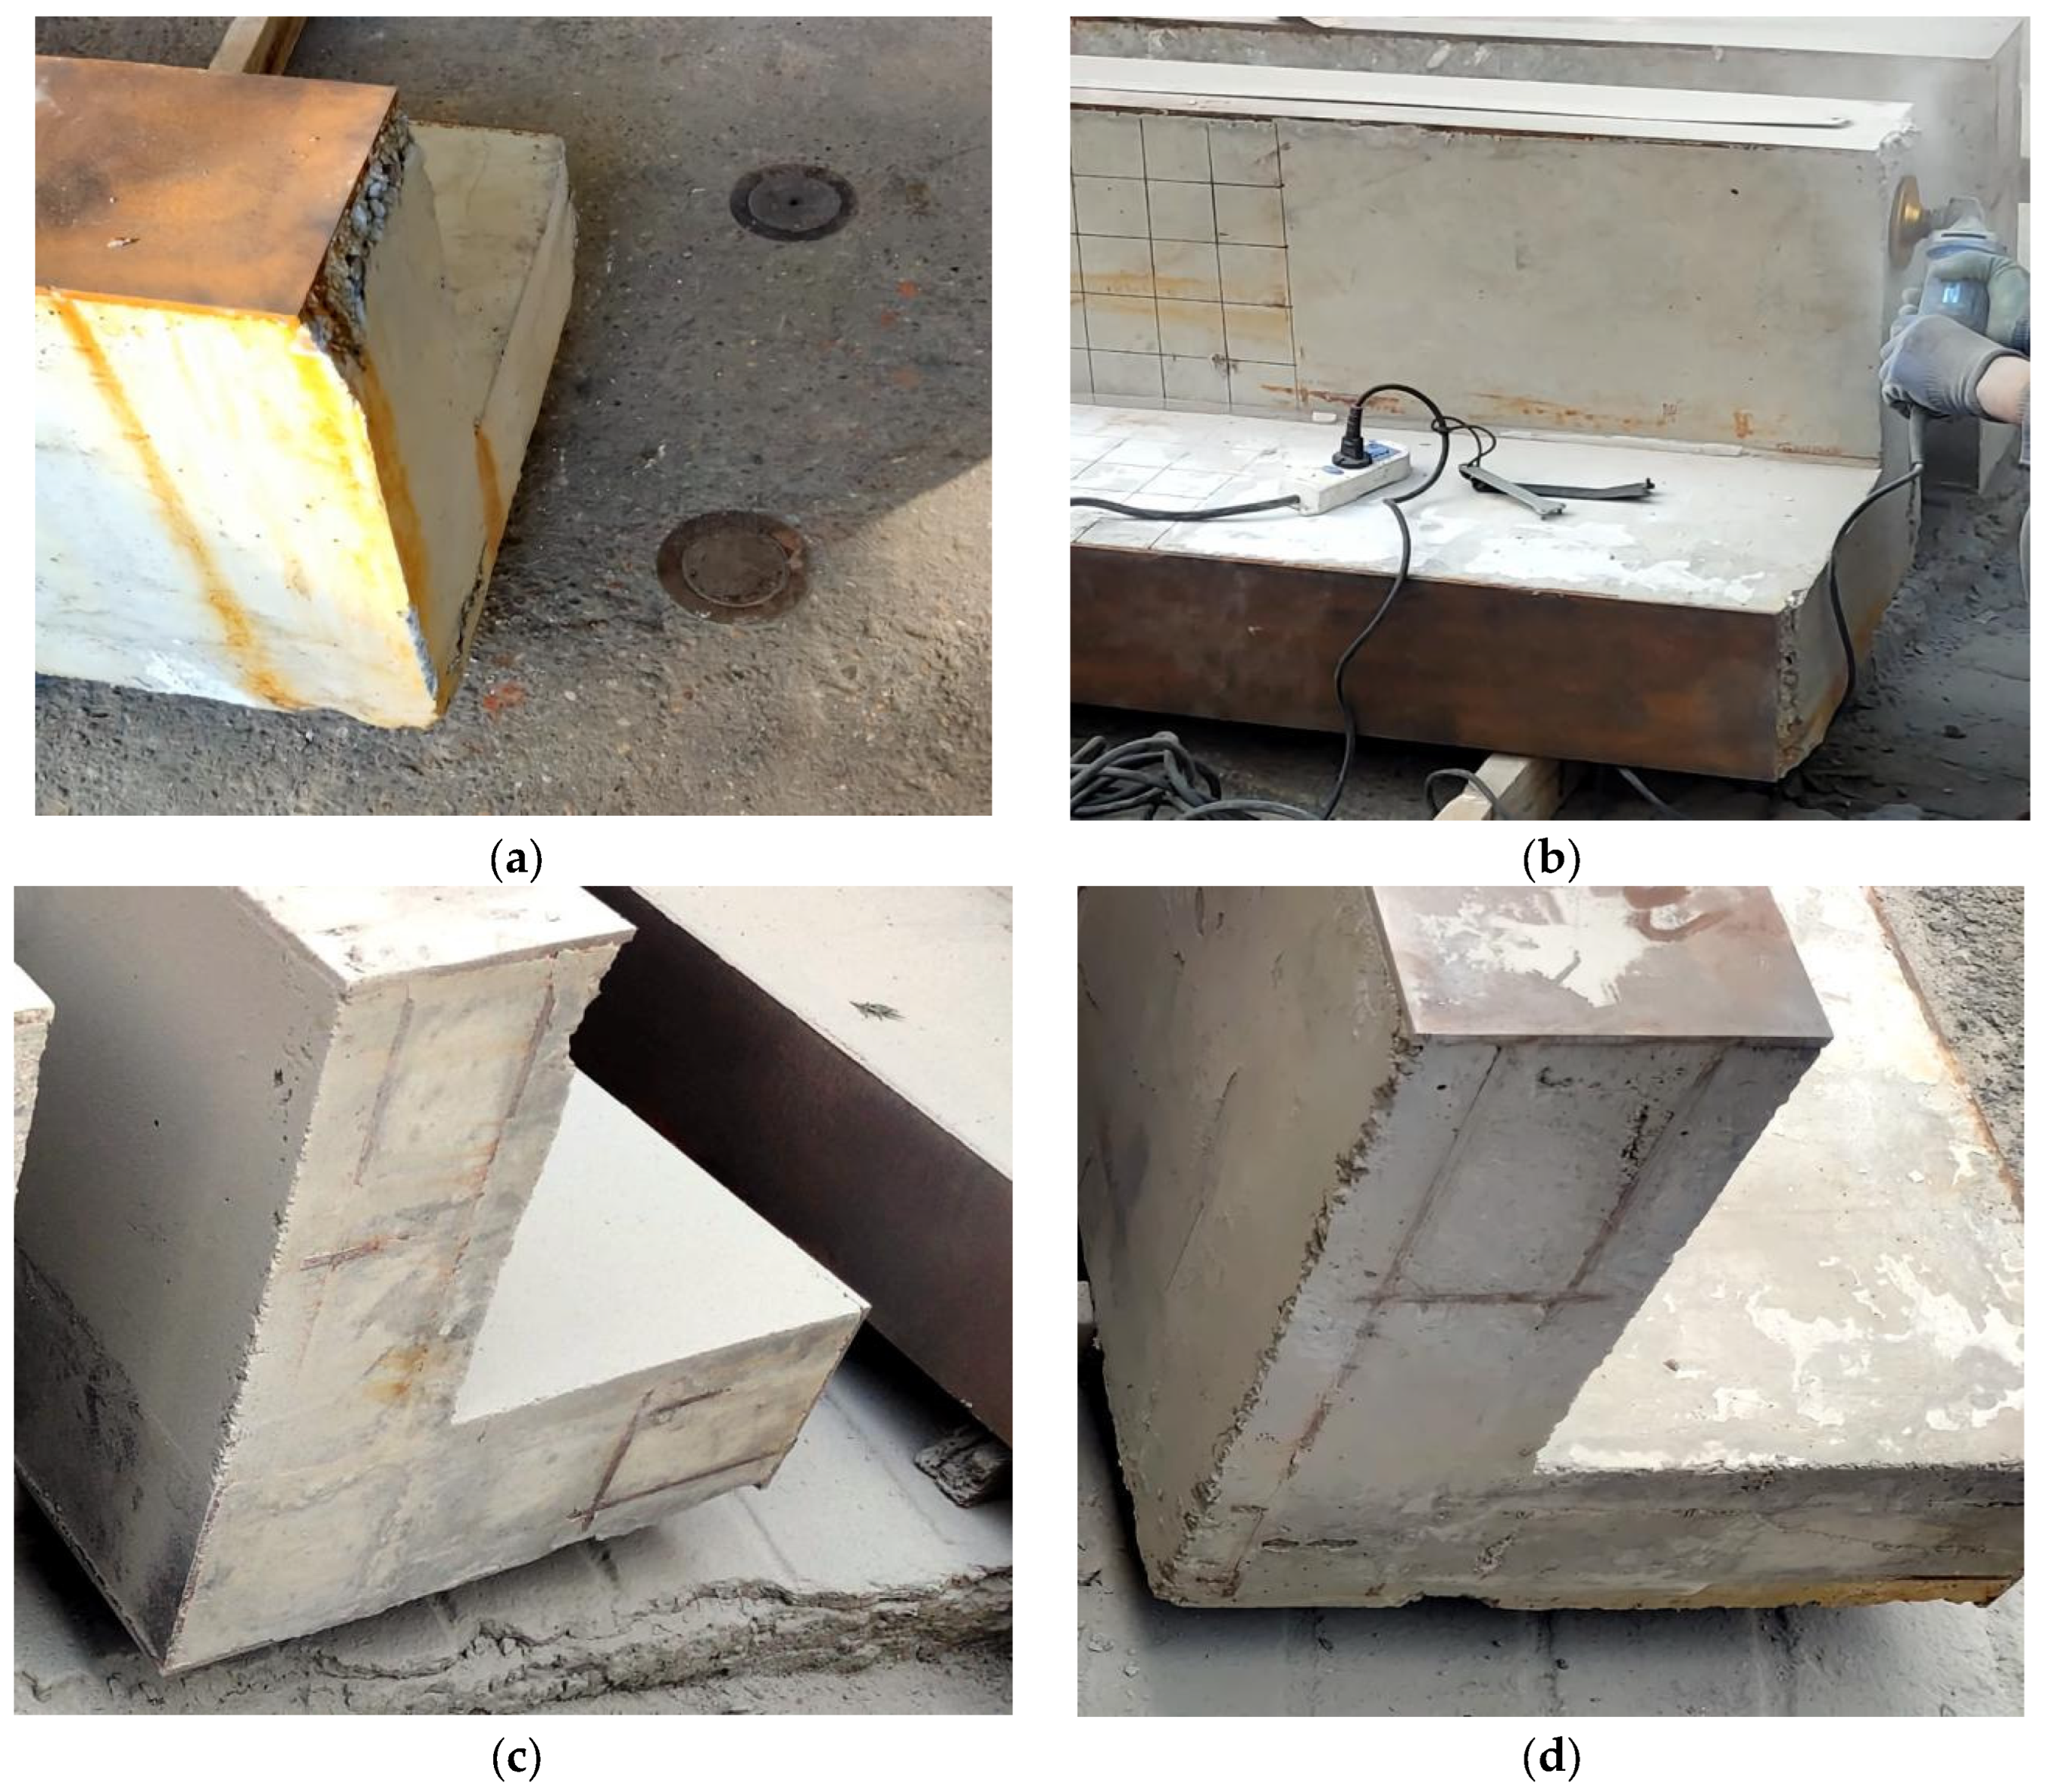
During the pouring process of the specimen, overfilling occurs at the top. To address this, an angle grinder is employed to remove the excess concrete, ensuring that the surface of the concrete is level with the steel profile. As illustrated in Figure 5, Figure 5c,d present the cross-sectional views of the RL column and HL column after grinding.
Figure 5.
Overfilling and polishing: (a) overfilling the concrete at the top of the column; (b) polishing with an angle grinder; (c) polished pattern of RL column; (d) polished pattern of HL column.
2.2. Experiment Apparatus and Loading Regime
2.2.1. Experiment Apparatus
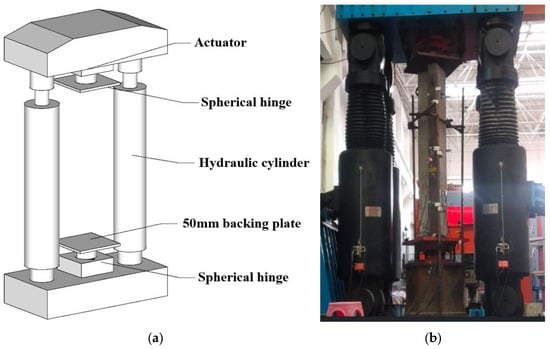
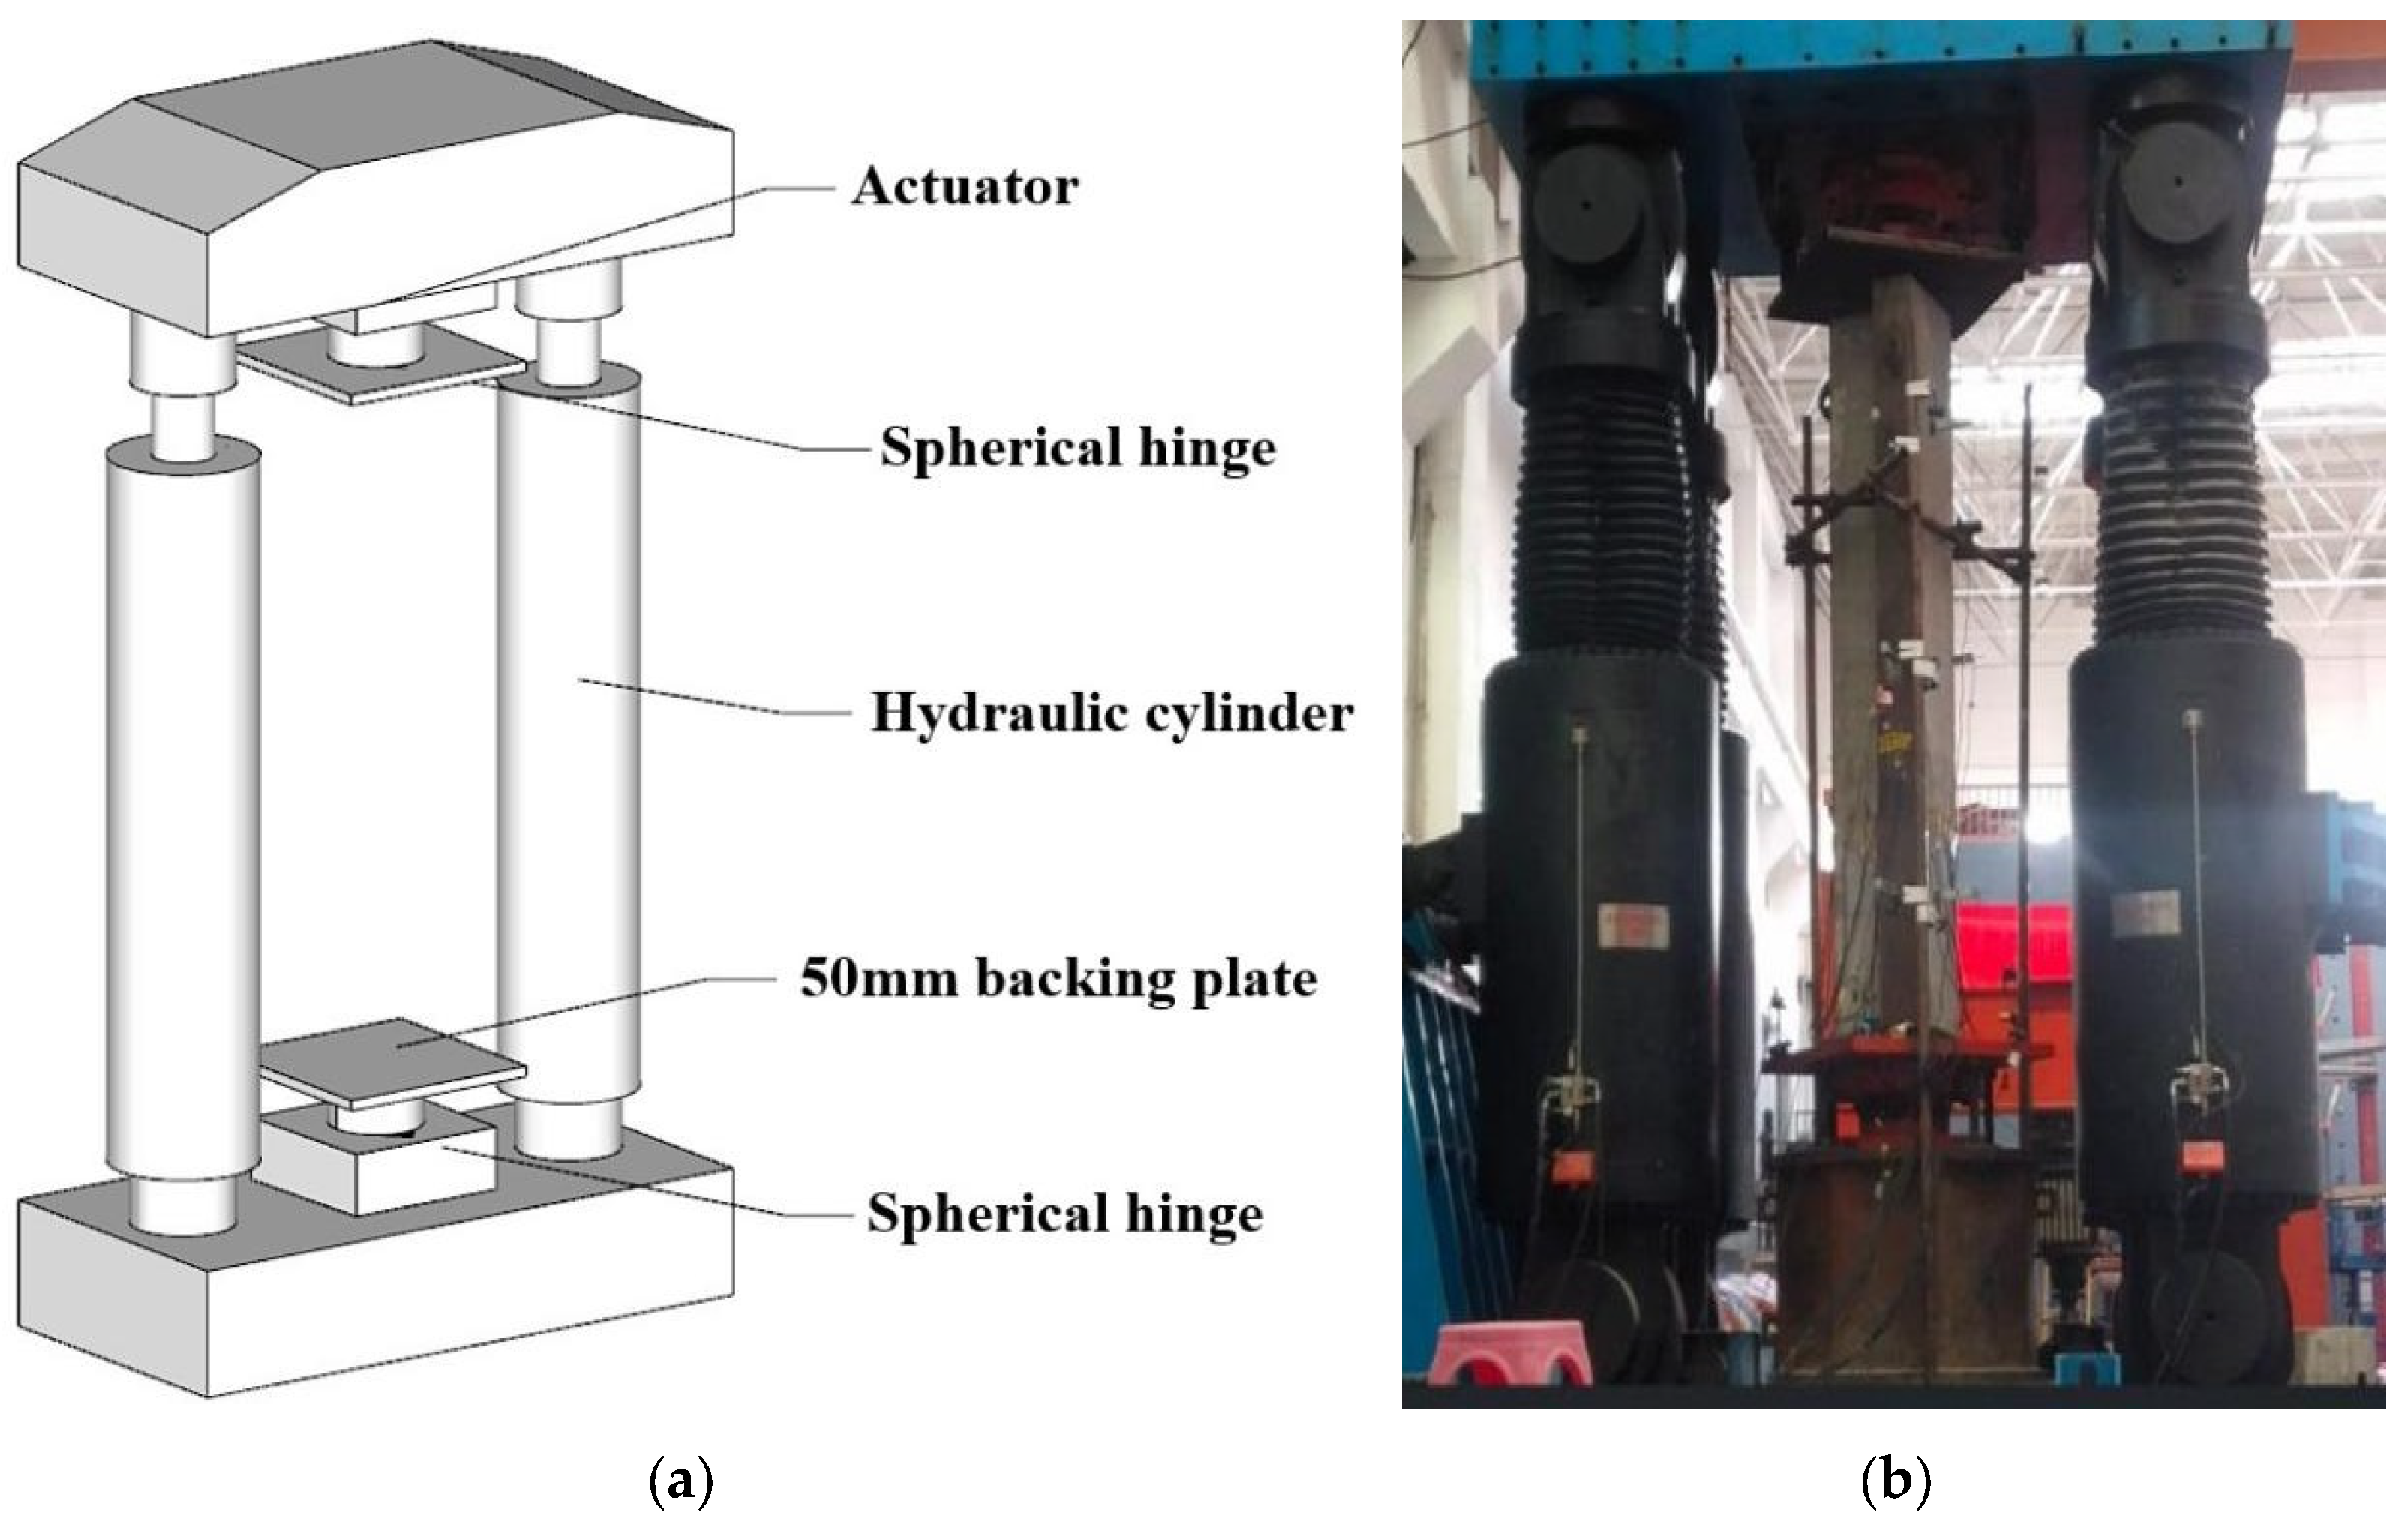
The experiment was conducted using a 112,000 kN-level multi-functional integrated servo-controlled structural testing system. The loading setup and its schematic diagram are presented in Figure 6. Both ends of the testing machine were equipped with knife-edge supports. The ends of the specimens were ground flat and fitted with shims to minimize end friction and ensure uniform load transfer.
Figure 6.
Loading device: (a) schematic diagram; (b) on-site display.
2.2.2. Loading Regime
The loading regime of this experiment was conducted in accordance with the provisions of the standard GB/T 50152-2012 [37] and employed displacement-controlled loading. The loading process was divided into 2 stages. Prior to reaching 80% of the estimated ultimate load, each load increment was set at 1/10 of the estimated ultimate load. Once the load reached 80% of the estimated ultimate load, the increment was reduced to 1/20 of the estimated ultimate load. Each load level was held constant for 5 min. The experiment was terminated, and the column was deemed to have failed when significant deformation occurred or the load dropped to 80% of the estimated ultimate load. In this context, when the load value recorded by the data acquisition system exhibits a distinct and prolonged decrease rather than fluctuations, this turning point is identified as the ultimate load.
Before the experiment commenced, the actuator and strain gauges were connected to the data acquisition system. The stability of the support, as well as the functionality of the instruments and loading equipment, was inspected. A pre-loading procedure was then conducted, gradually increasing the load to 50 t, holding for 10 min, and then unloading gradually.
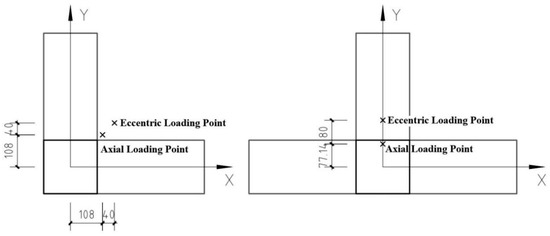
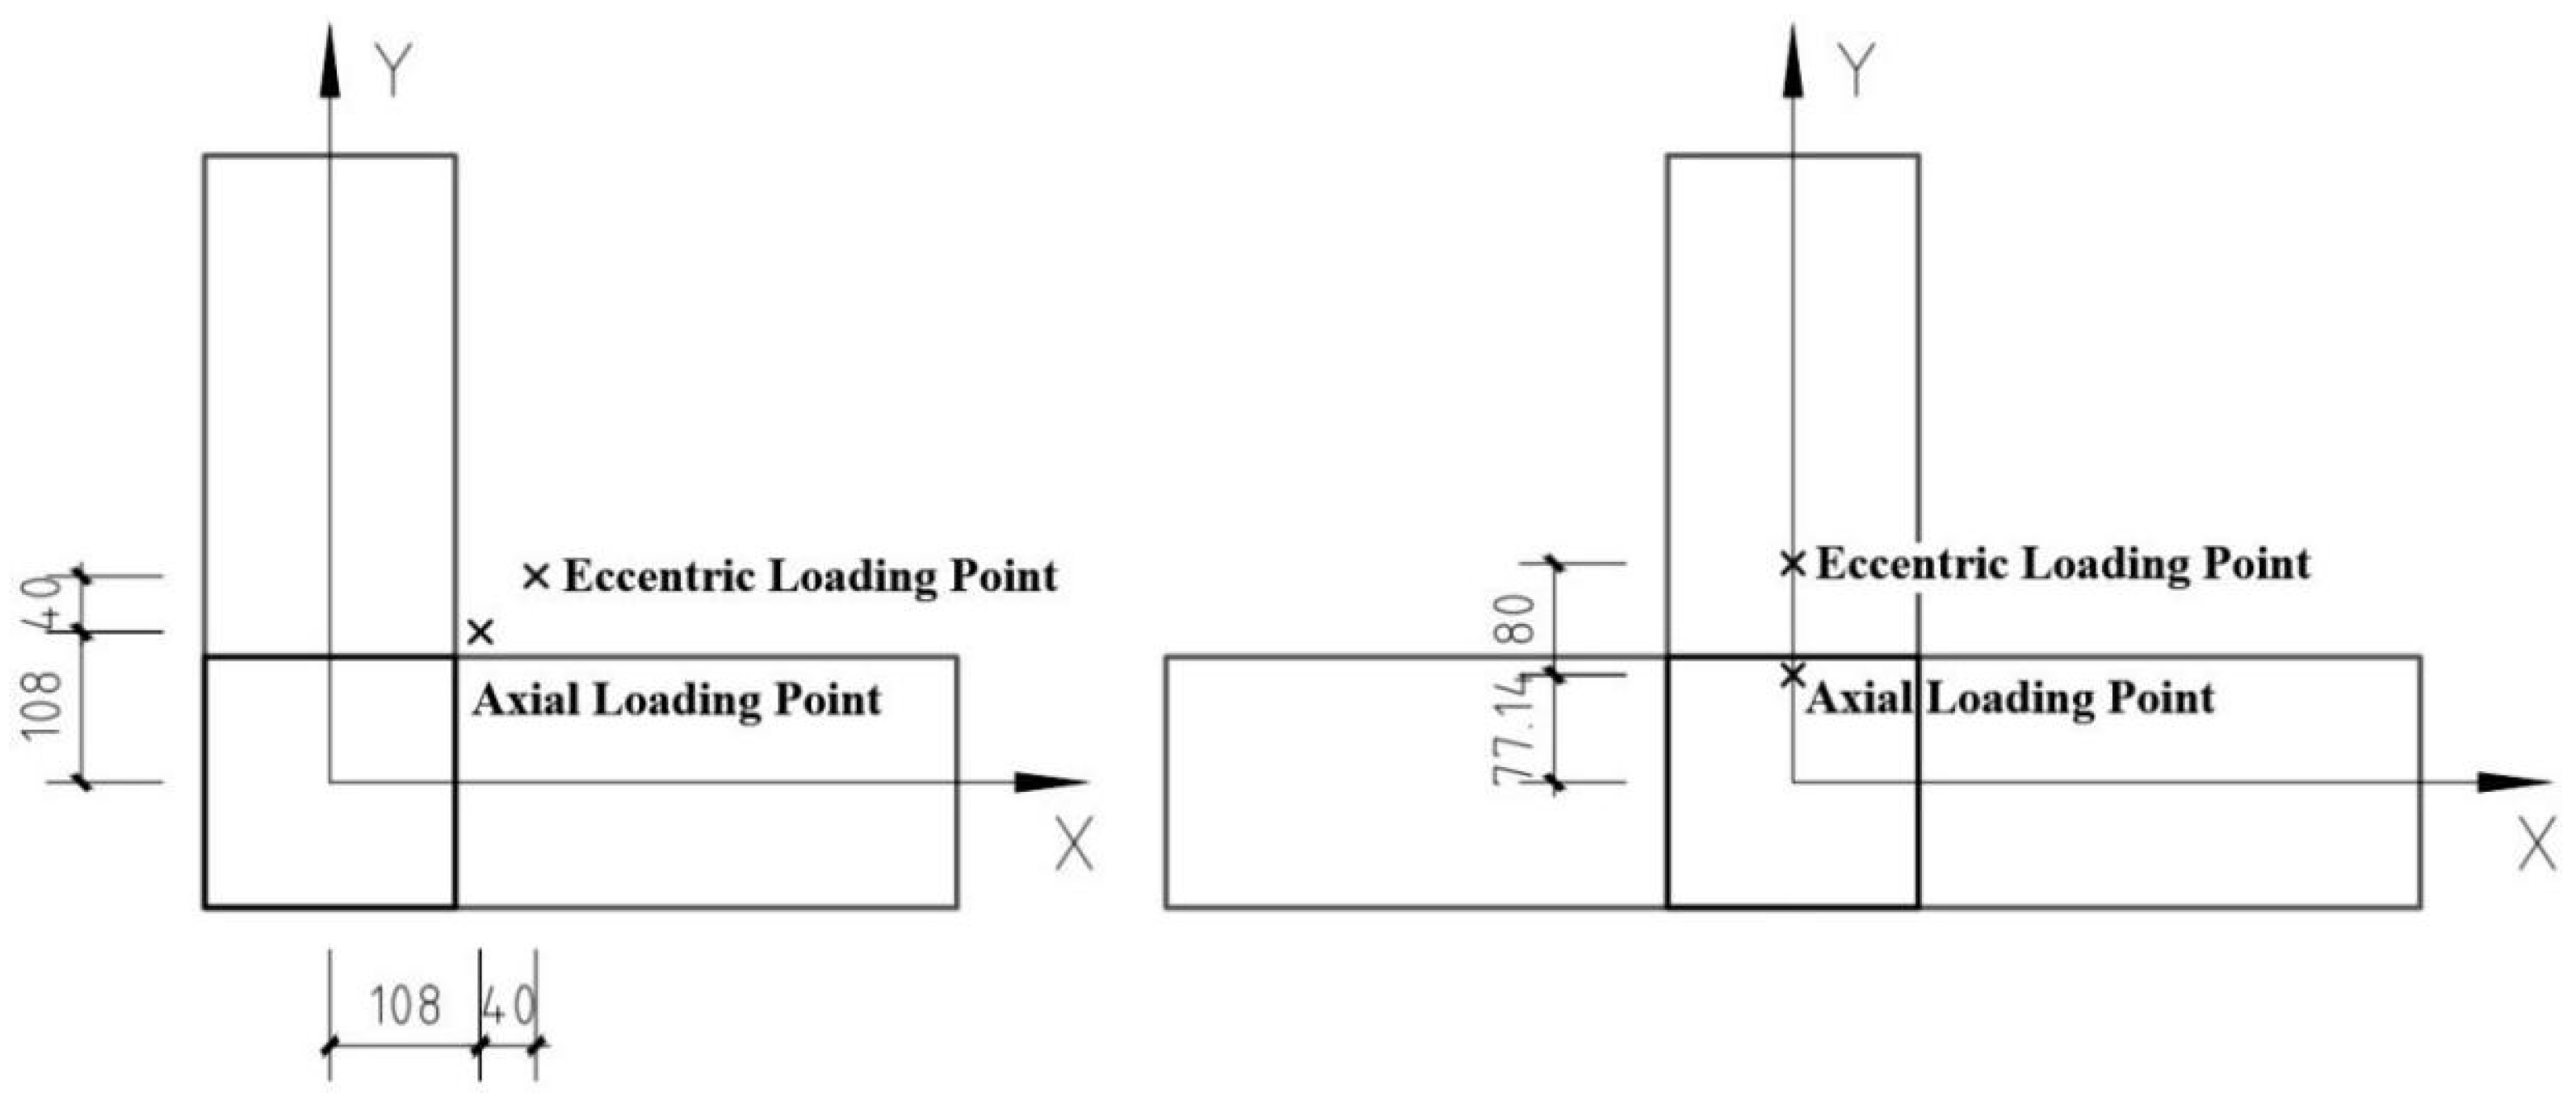
In the axial loading experiment, the loading point of the actuator aligns with the centroid of the column. In the eccentric loading experiment, the loading point of the L-shaped column is offset by 40 mm from the centroid in the direction of the two outstretched arms, while the loading point of the T-shaped column is offset by 80 mm from the centroid in the direction of the central outstretched arm. As illustrated in Figure 7, based on the coordinate system shown, the centroid coordinates of the L-shaped column are ex = 108 mm and ey = 108 mm, and those of the T-shaped column are ex = 0 mm and ey = 77.14 mm [38]. The loading point for the axial loading test was located at the axial loading point, while the loading point for the eccentric loading test was located at the eccentric loading point. The loading point for the axial loading test was located at the axial loading point (X = 108 mm, Y = 108 mm for L; X = 0, Y = 77.14 mm for T), while the loading point for the eccentric loading test was located at the eccentric loading point (X = 148 mm, Y = 148 mm for L; X = 0, Y = 157.14 mm for T). During the tests, the axial and eccentric loading were controlled by aligning with the rotation center of the knife-edge supports.
Figure 7.
Axial and eccentric loading positions (mm).
2.3. Measurement Arrangement
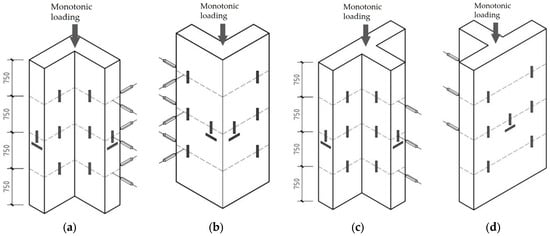
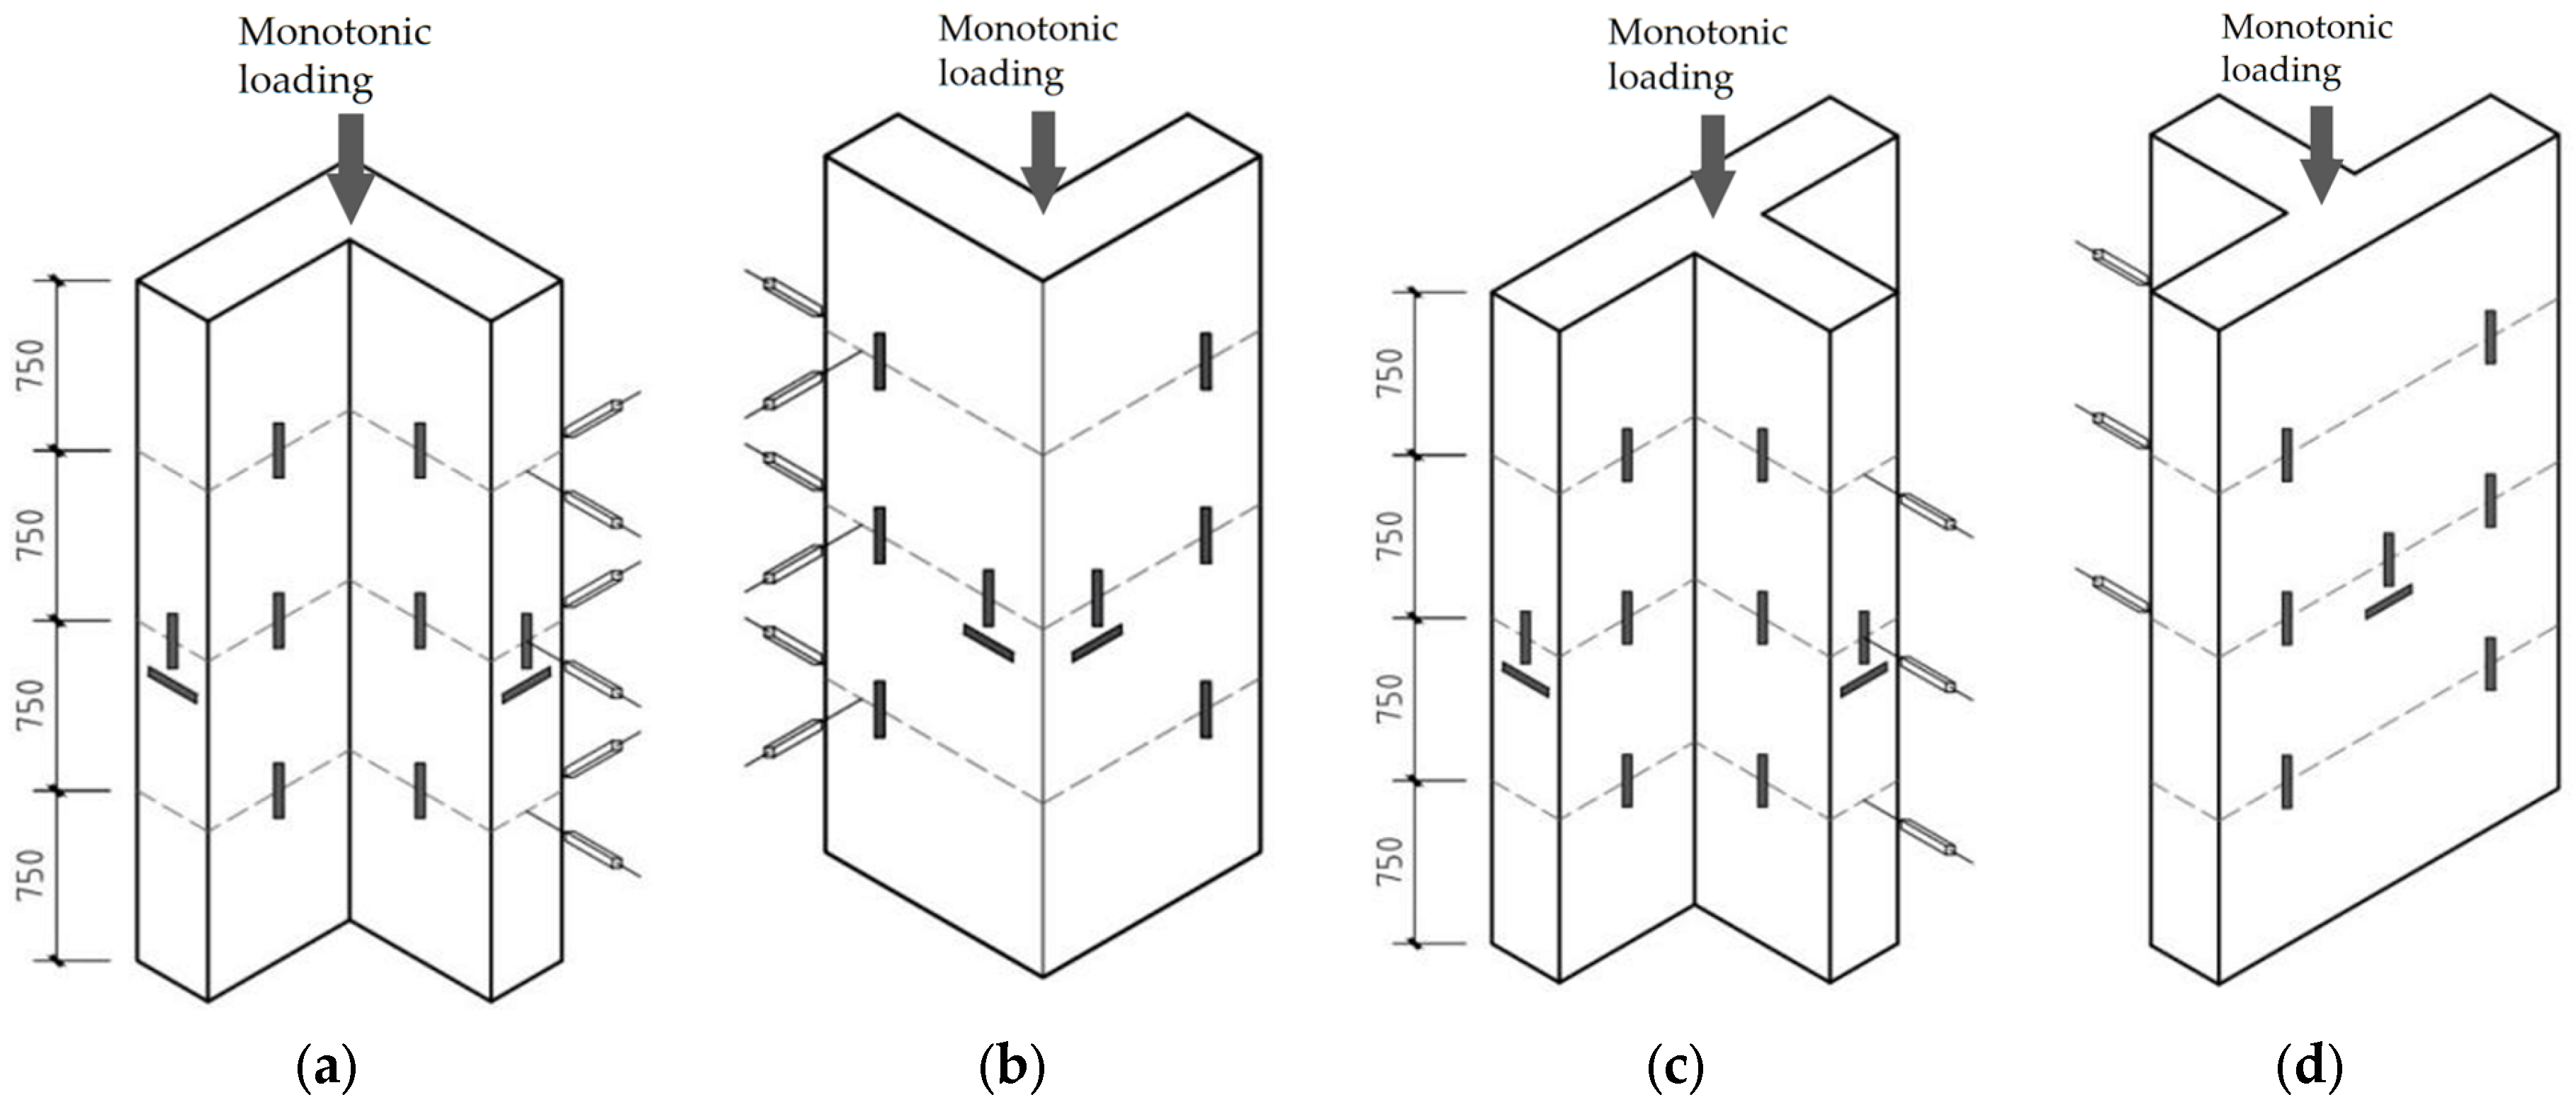
In the experiment, strain gauges were utilized to capture strain variations at specific locations on the specimen, while displacement meters were used to measure lateral deformations. Both types of data were transmitted to the computer via a data acquisition system. Figure 8 illustrates the arrangement of strain gauges and displacement meters for the L-shaped and T-shaped columns. The strain gauge layouts for both column types are similar; 3 strain gauges were installed along the height on the side of the flange at intervals of 750 mm. Additionally, longitudinal and transverse strain gauges were placed at the end of the flange and around the central region, with their positions located at the mid-height of the column. The displacement meter is used to measure the lateral deformation of the column, which includes both the expansion of the steel plate during compression and the bending deformation of the column itself. Therefore, the displacement meters are positioned at the ends of the flanges where bending-induced protrusion is likely to occur. For the T-shaped column, the displacement meter is placed at the end of the second flange; for the L-shaped column, it is installed on any one flange. Additionally, the displacement meter is mounted on the outer side of the flange to capture potential displacement in another direction.
Figure 8.
Layout of measuring points for L-shaped and T-shaped columns (mm): (a) internal corner of L-shaped column; (b) external corner of L-shaped column; (c) internal corner of T-shaped column; (d) external corner of T-shaped column.
Strain gauges of type 120-5AA with a gauge factor of 2.0 were used. The LVDTs were selected to ensure sufficient displacement allowance, with a measuring range as close to 100 mm as possible and a sensitivity of 200 με/mm. According to the coordinate system defined in Figure 7, the strain gauges were positioned at X = 0, ±90, 270, 450 mm and Y = 0, 90, 270, 450 mm. The LVDTs were arranged vertically at heights of Z = 750, 1500, and 2250 mm.” Data were recorded at a sampling frequency of 10 Hz. In post-processing, spurious readings resulting from measurement errors of the DAQ system were discarded.
Due to the exploratory nature of this study and the high cost of large-scale testing, only one specimen per configuration was fabricated and tested. While this limits statistical generalization, the consistent trends observed across configurations provide valuable insights into the behavioral differences.
3. Experiment Results Analysis
3.1. Experiment Phenomenon and Failure Modes
3.1.1. Axial Loading Results
In the axial compression experiment, the loading point of the actuator aligns with the centroid of the column. Four specimens were tested, and they are designated as RLZ, RTZ, HLZ, and HTZ.
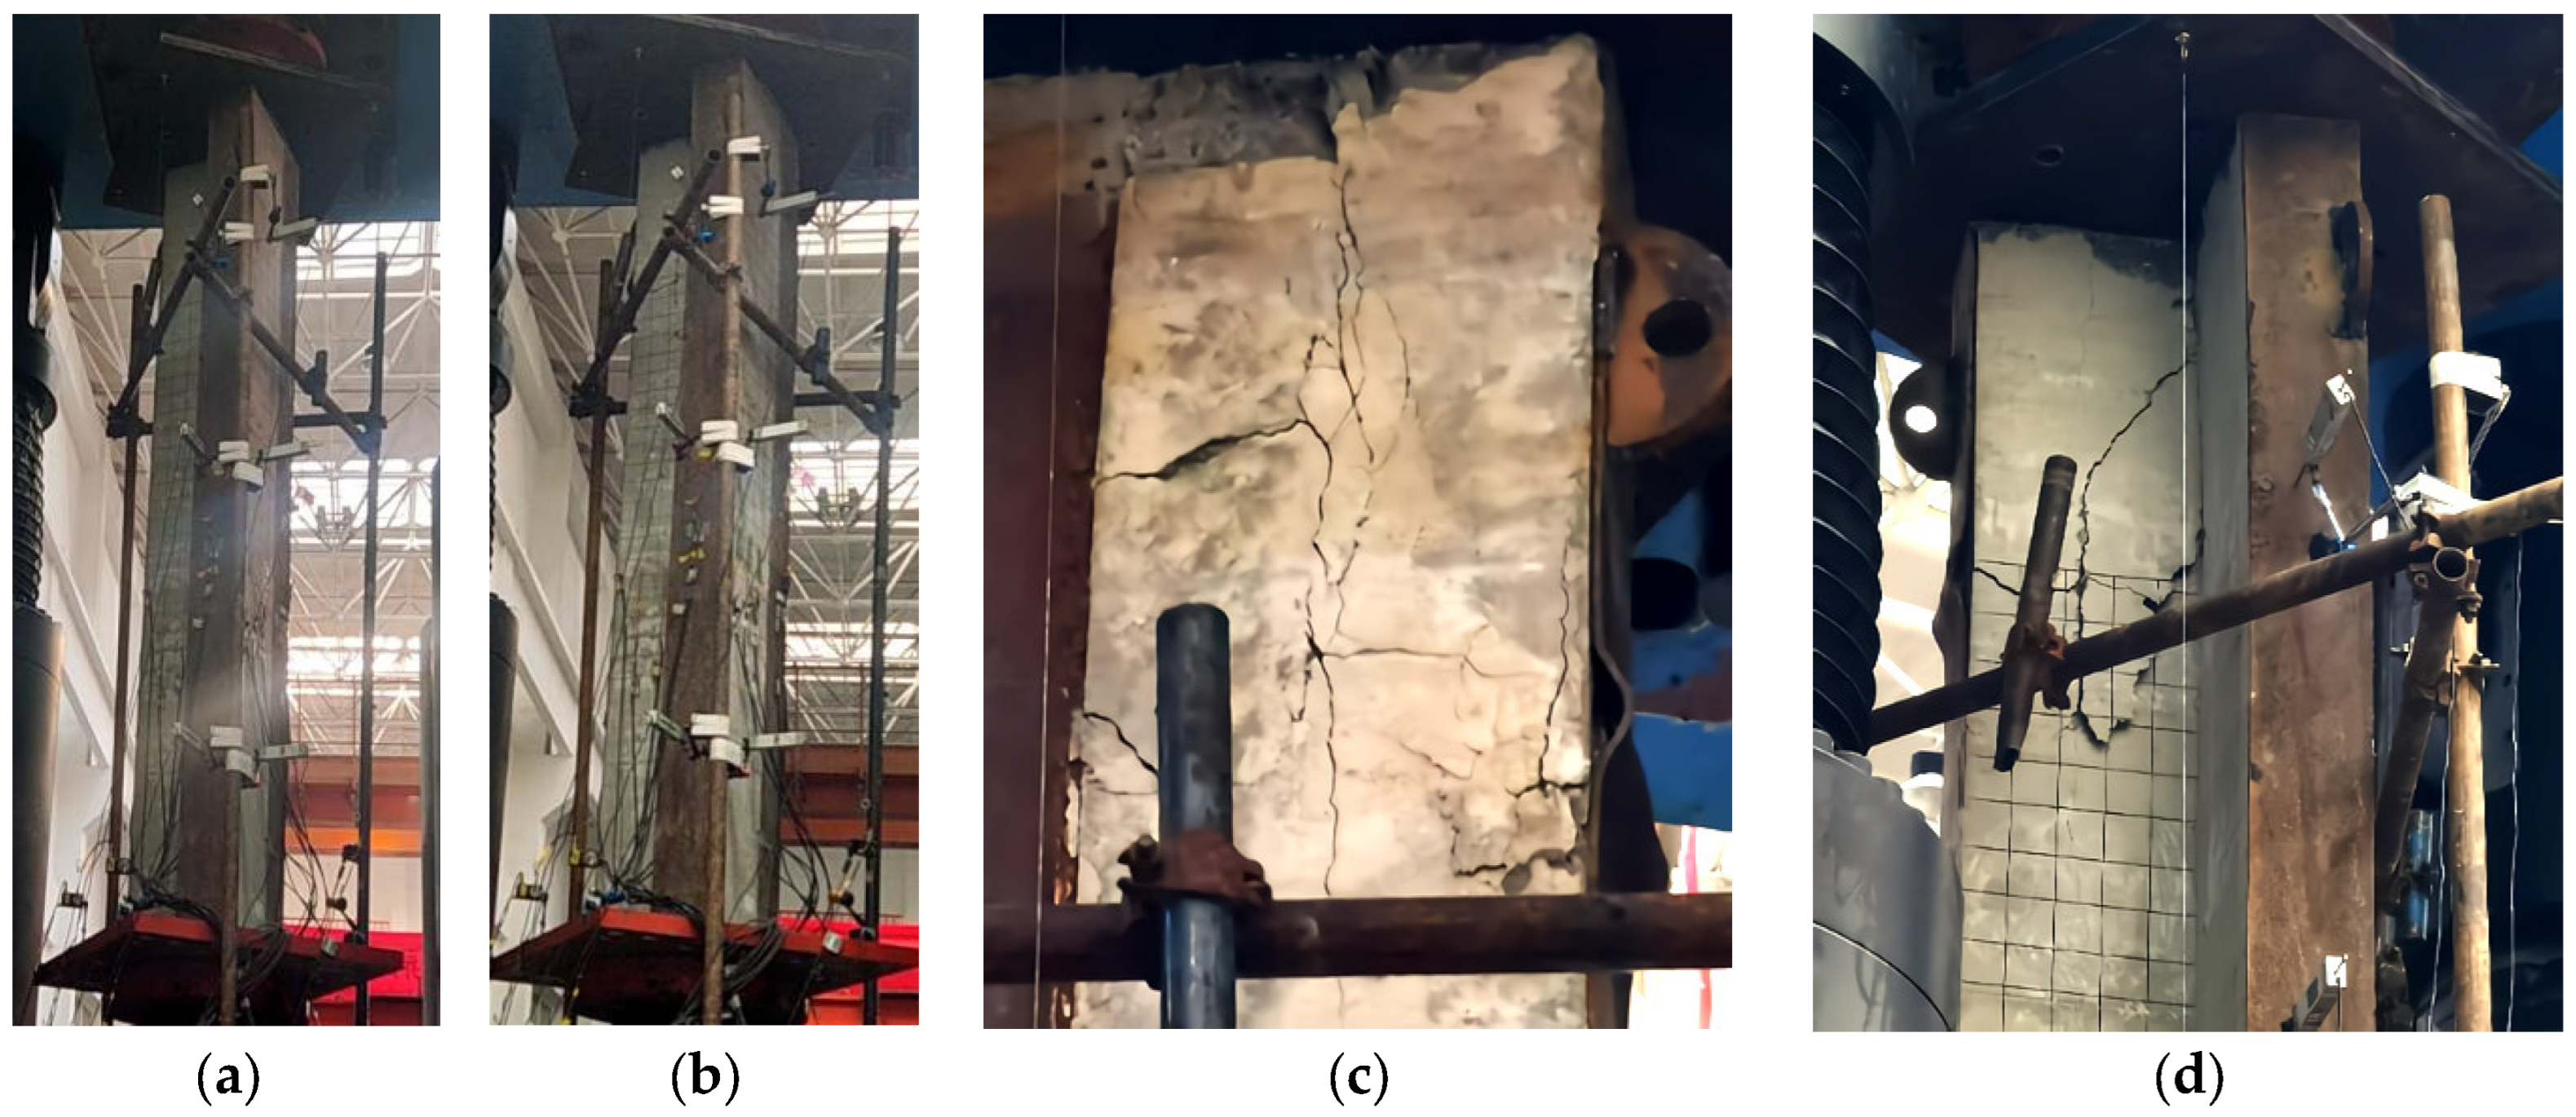
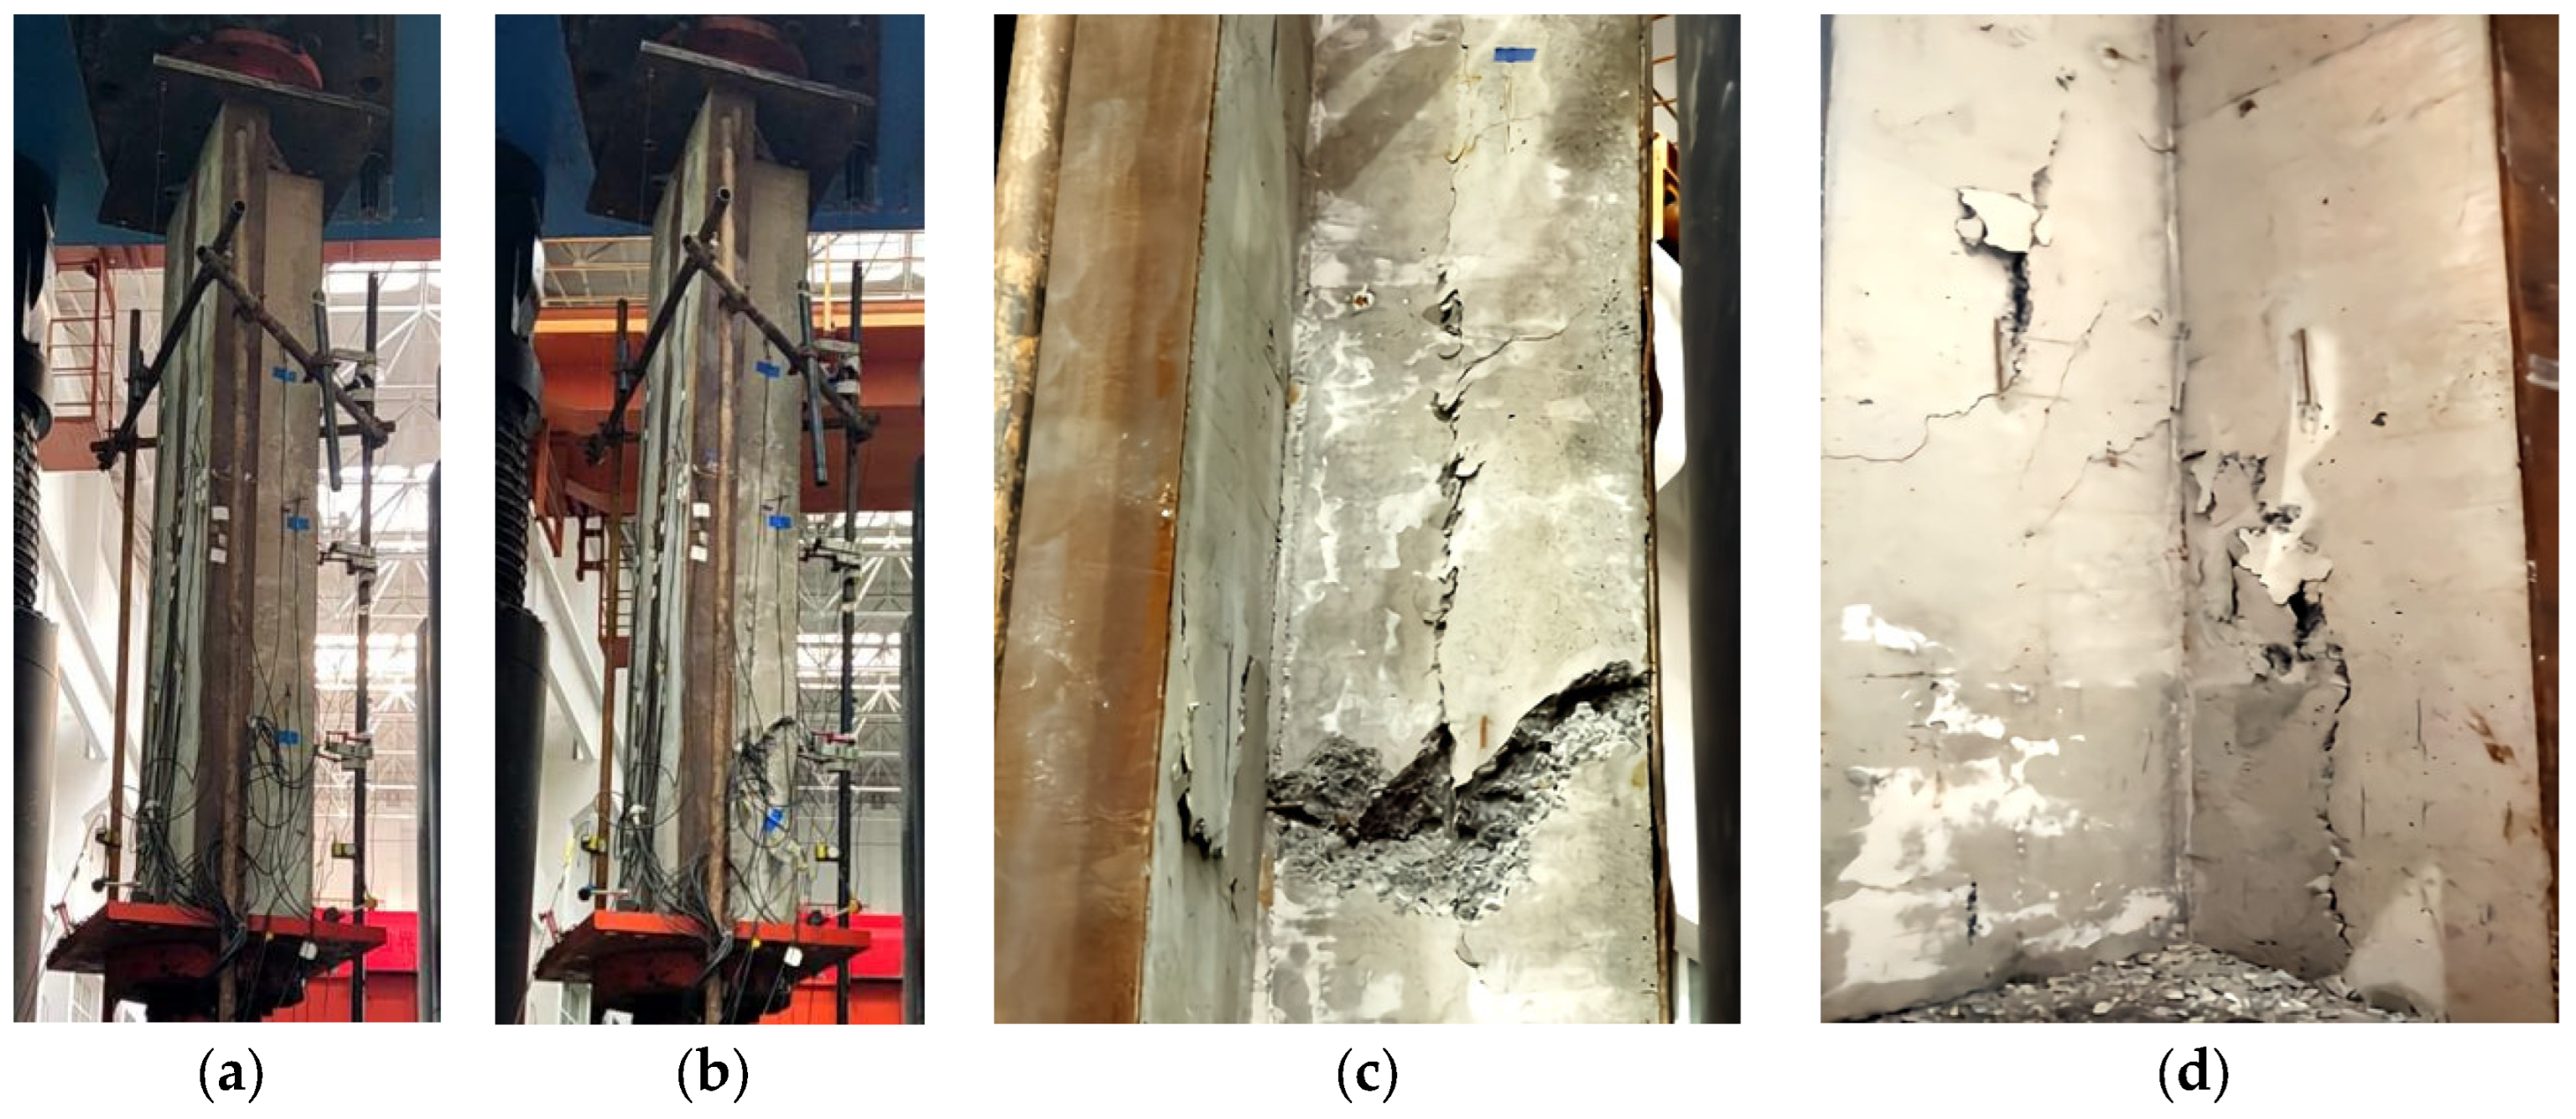
During the loading of the RLZ column, no significant deformation was observed during the ascending loading phase. The maximum compressive load reached 8813 kN, at which the corresponding compressive deformation was 6.20 mm. From the initial loading stage to the peak load, fine vertical cracks initiated on the outer surface at the top of the column and also appeared at the column base, where the concrete exhibited signs of spalling. Upon reaching a deformation of 6.20 mm, the specimen entered the second loading stage, characterized by a gradual decrease in load with continued displacement increase. During this stage, cracks on the outer surface expanded significantly, and major vertical cracks developed on both the inner and outer surfaces of the column, extending toward the steel plate, as shown in Figure 9c,d. Furthermore, all photographs of the failed specimens are presented at a scale of roughly 1:18. These cracks led to extensive spalling of the outer concrete, and crushed concrete was observed at the column base. Local buckling occurred in the steel plate within the top 600 mm of the column. The smooth descending phase lasted until a displacement of 11.32 mm was reached, at which point the load was 7704 kN. Thereafter, the load declined more rapidly, accompanied by further cracking and spalling of the outer concrete. The concrete inside the steel plate was nearly completely crushed. The loading was terminated when the load dropped to 7018 kN.
Figure 9.
Experiment phenomenon of RLZ: (a) before loading; (b) after loading; (c) vertical through cracks; (d) cracks extend to the steel plate.
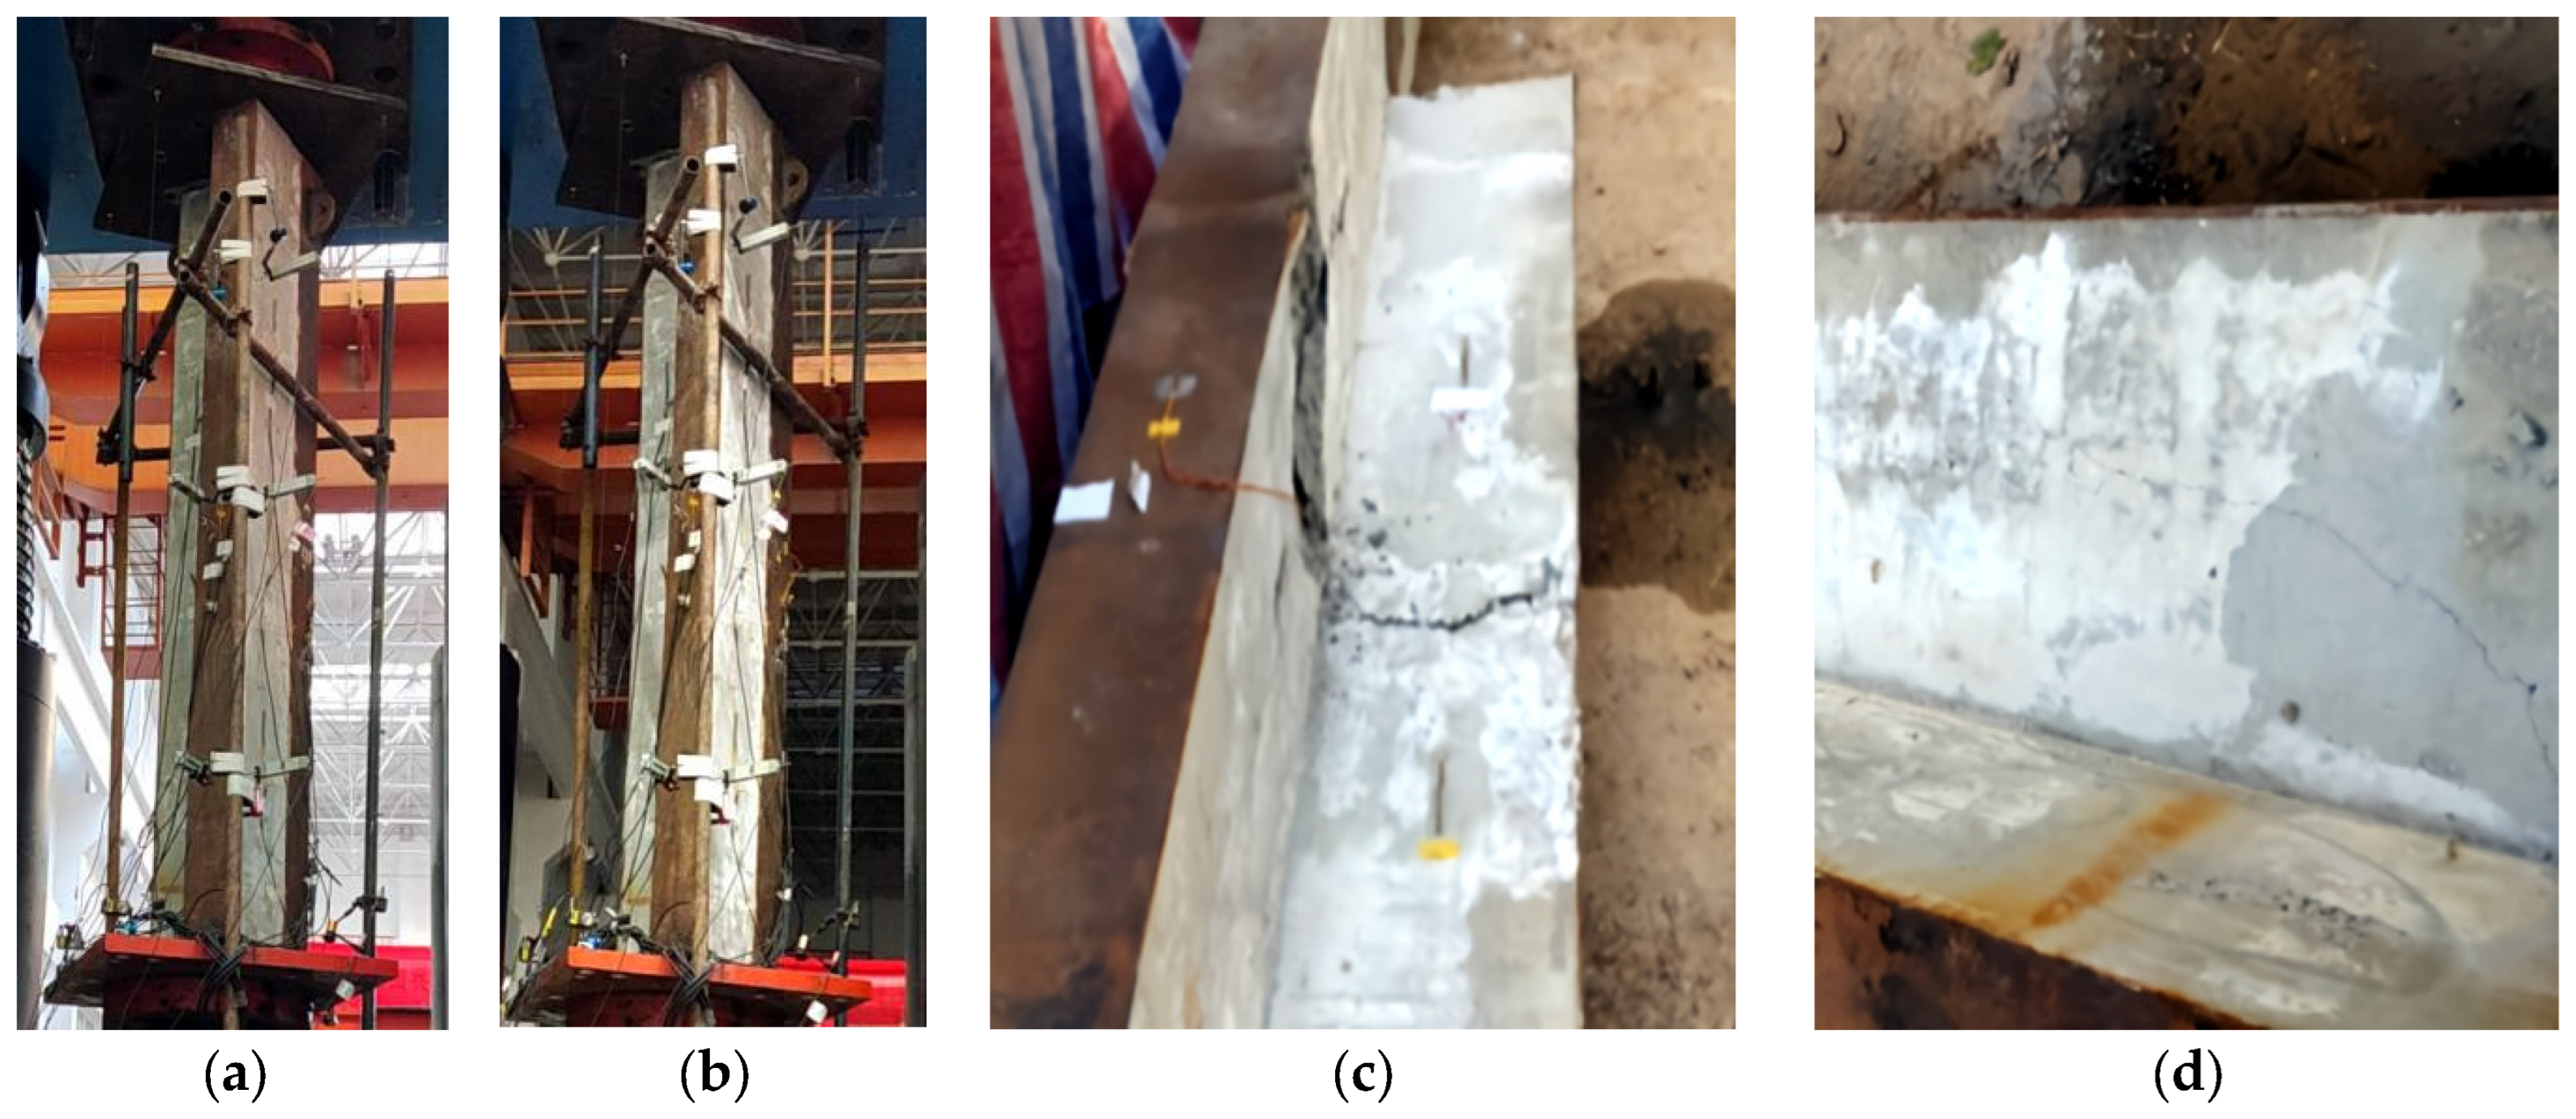
During the loading of the RTZ column, the loading-up phase exhibited phenomena similar to those observed in the RLZ specimen. The RTZ column achieved the highest ultimate load among all eight specimens, reaching 12,780 kN, with a corresponding displacement of 6.27 mm. Prior to reaching the ultimate load, a slight deceleration was observed in the loading process, indicating minor stiffness degradation, although the column was still capable of sustaining load increases. Immediately after reaching the ultimate load, the specimen did not exhibit a gradual descending branch but instead showed a stepwise load drop. At this stage, a major transverse crack developed at a height of 600 mm from the column base, as illustrated in Figure 10c, leading to premature failure of the column. Similar to the RLZ specimen, RTZ also developed through vertical cracks, as shown in Figure 10d. The load was terminated at a displacement of 8.64 mm, representing an increase of only 2.37 mm from the ultimate load stage, with the load decreasing to 9881 kN. As illustrated in these figures, vertical cracking is attributed to elevated tensile stresses in the cross-section. Therefore, it is recommended that the authors examine the stress–strain state and implement transverse reinforcement.
Figure 10.
Experiment phenomenon of RTZ: (a) before loading; (b) after loading; (c) transverse cracks at the base of the column; (d) vertical through cracks.
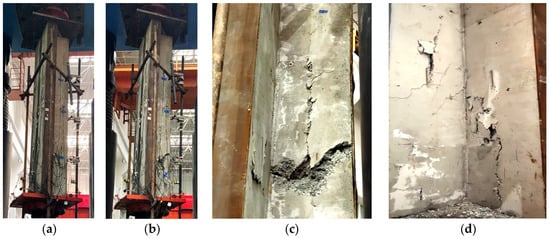
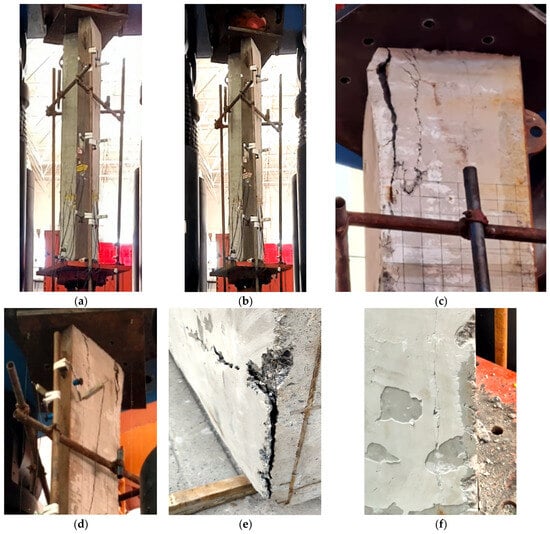
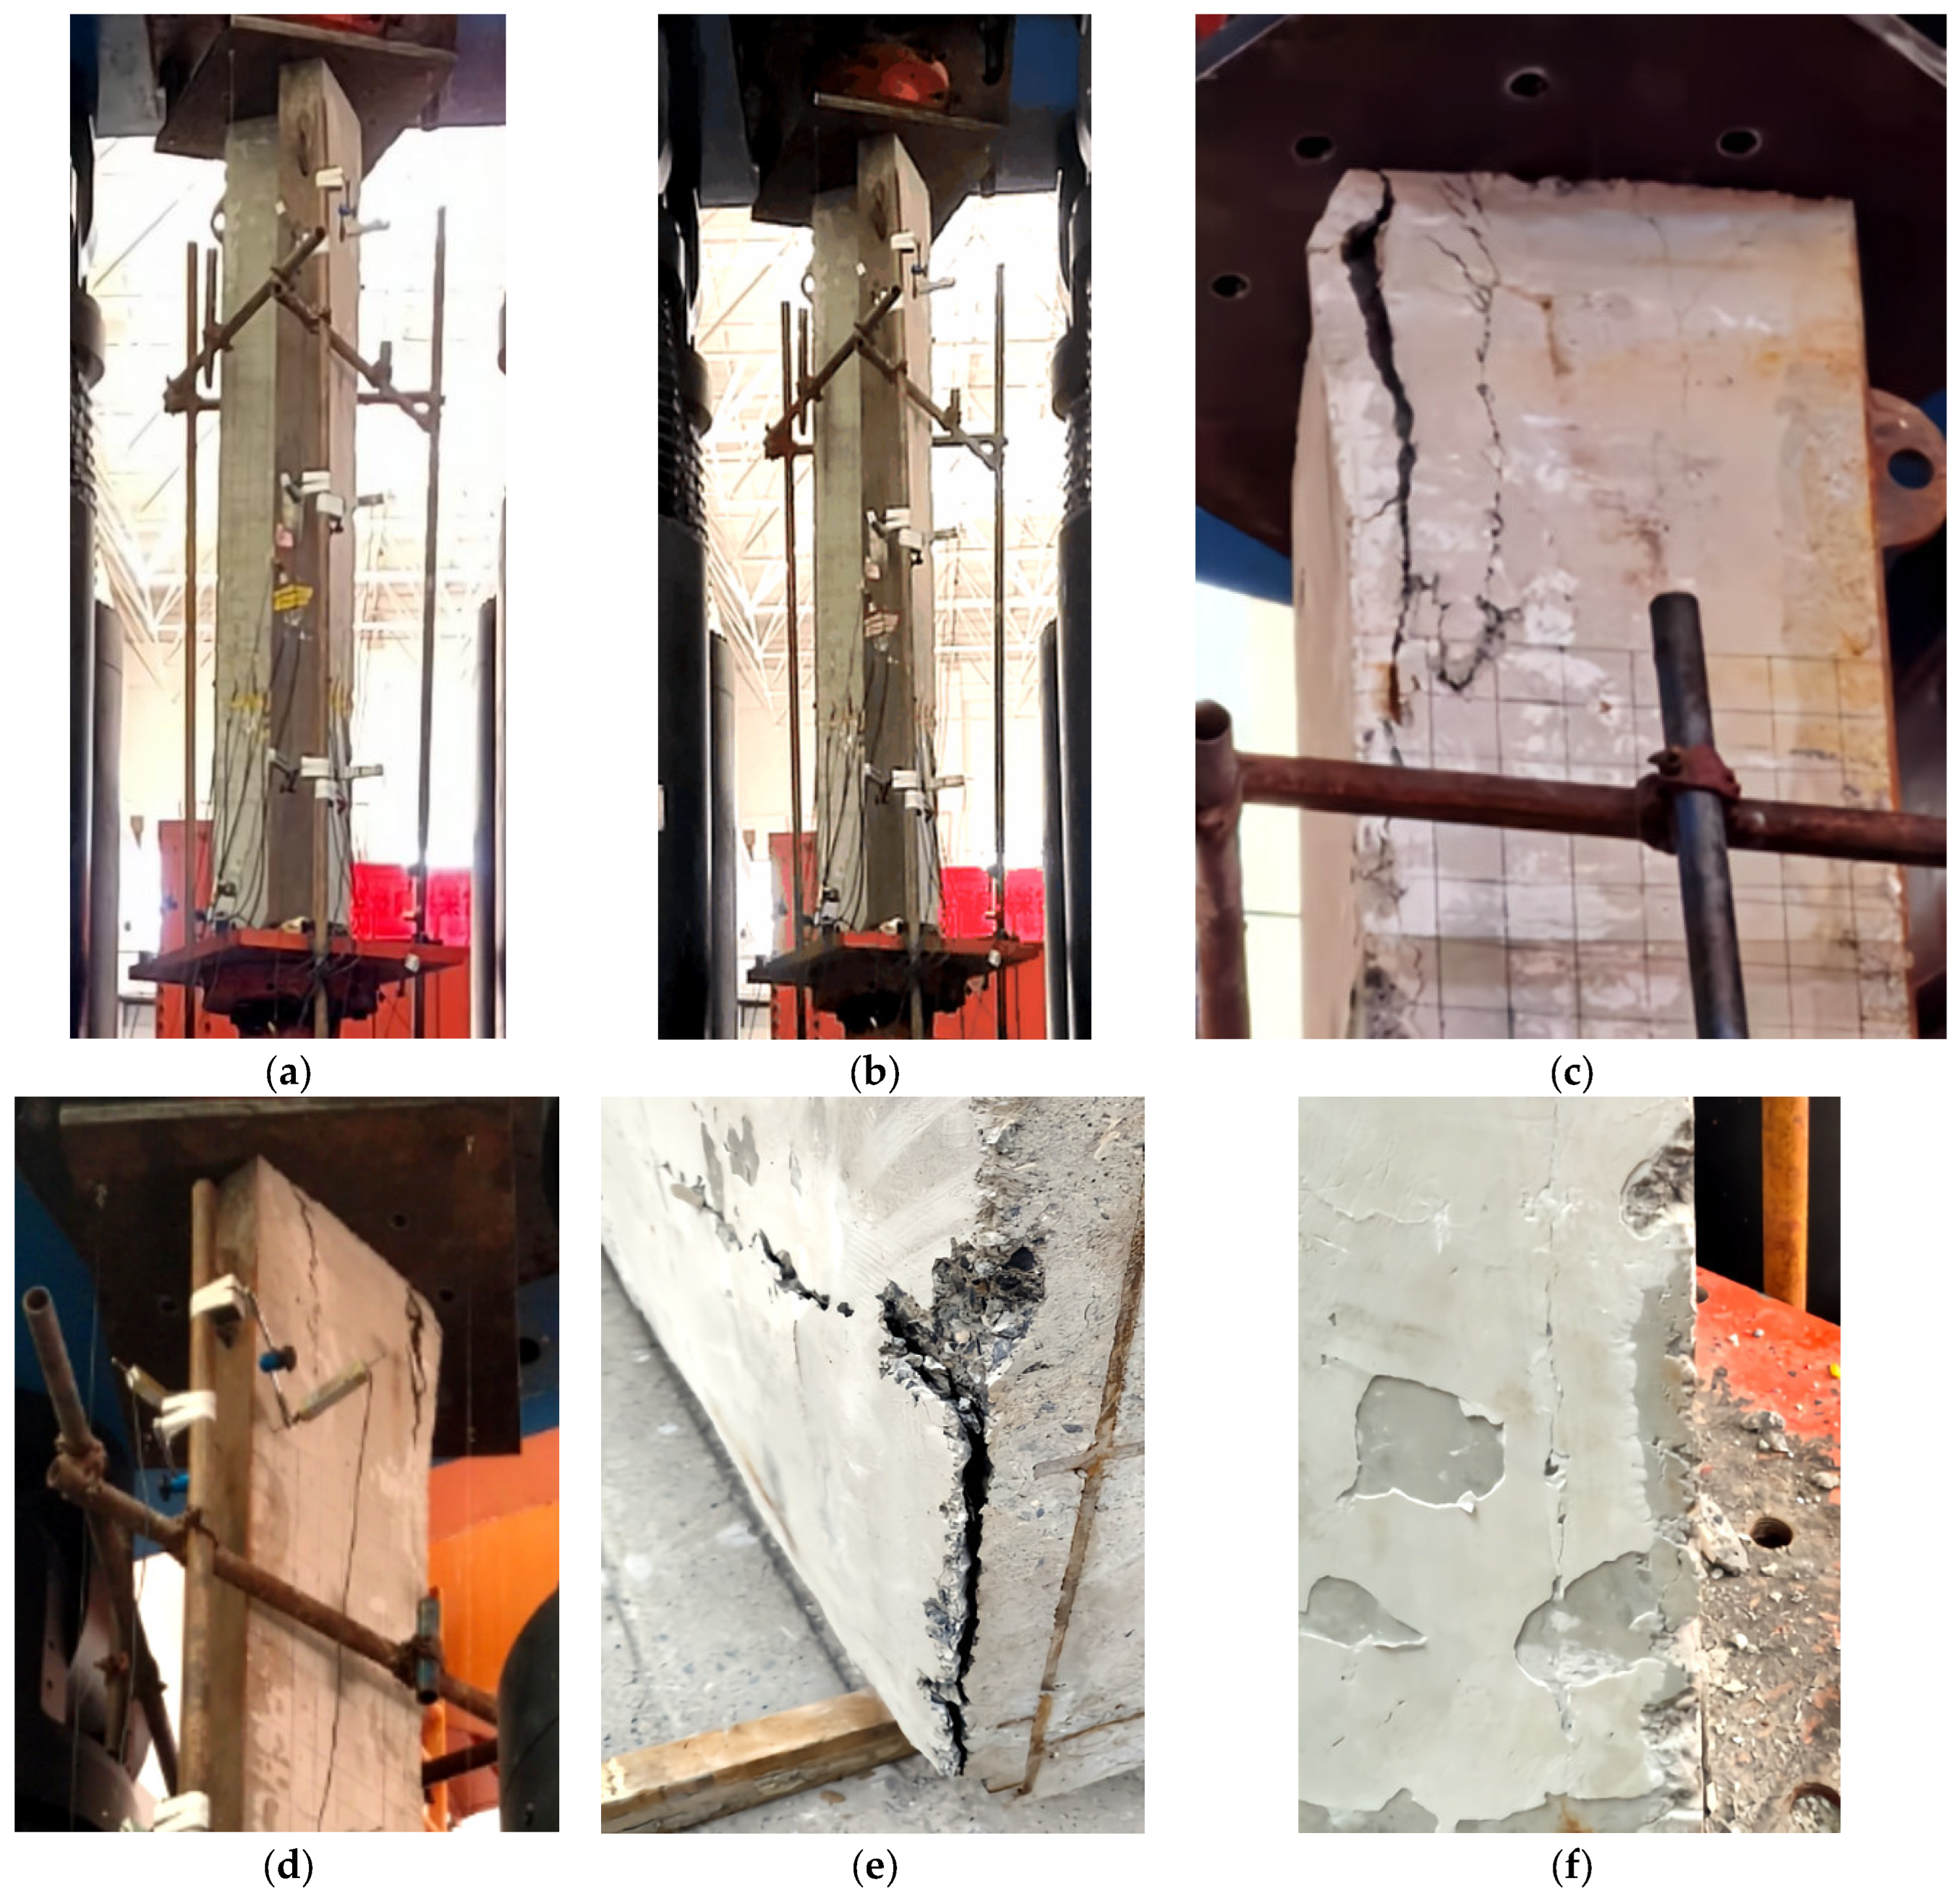
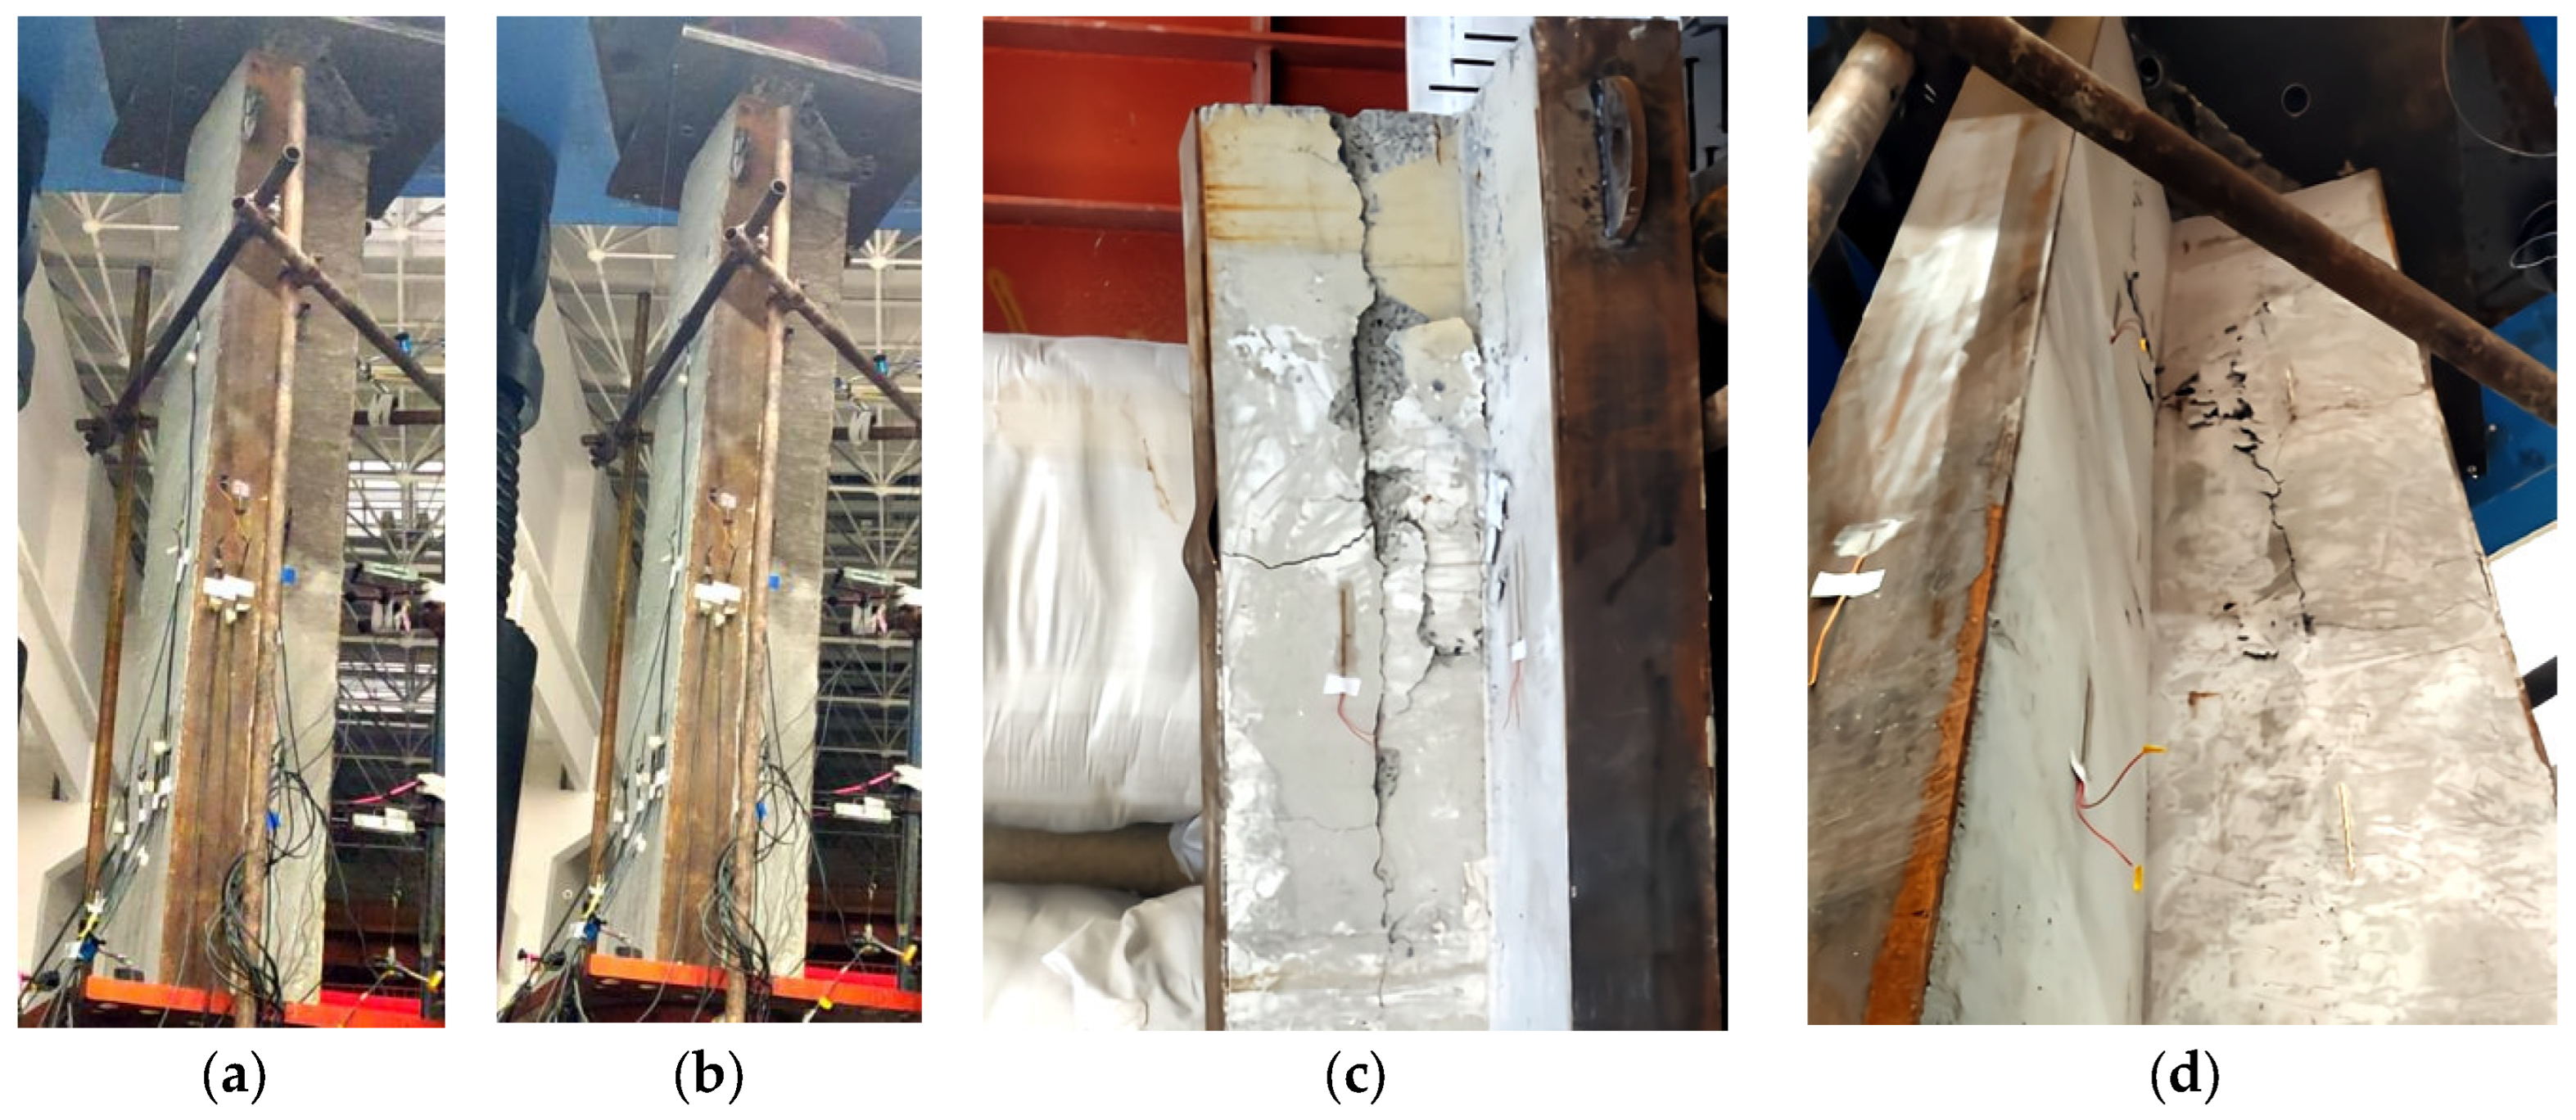
In the HLZ experiment, the ultimate load reached 8009 kN, corresponding to a displacement of 5.13 mm. Unlike the core area concrete in square steel tube columns, which is laterally confined by the steel tube, the core area concrete in the H-shaped, special-shaped column is exposed and lacks steel restriction. Consequently, during the loading phase, cracks initiated on the outer surface of the core area concrete and progressively extended as the load increased. After reaching the ultimate load, the specimen entered the descending branch of the load–displacement curve, which was relatively short in duration. The compressive load began to decrease rapidly after dropping below 7550 kN, at which point the displacement was 6.87 mm—only 1.74 mm greater than at the ultimate load. At this stage, significant spalling of concrete occurred at the top corner of the column flange, as shown in Figure 11c. Due to the absence of steel restriction, the corners of the core area concrete also spalled, as illustrated in Figure 11d. Similarly, cracks developed at the corners of the core area at the column base (Figure 11e), and through-going cracks formed along the column height, as depicted in Figure 11f.
Figure 11.
Experiment phenomenon of HLZ: (a) before loading; (b) after loading; (c) corner cracks of the flange at the top of the column; (d) corner cracks in the flange of the core area; (e) cracks in the core area at the base of the column; (f) through-cracks in columns.
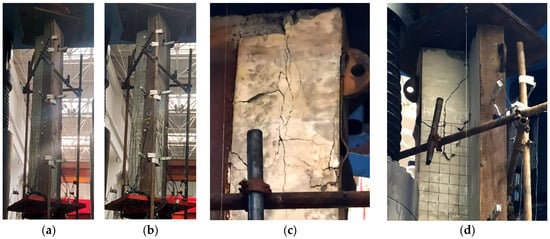
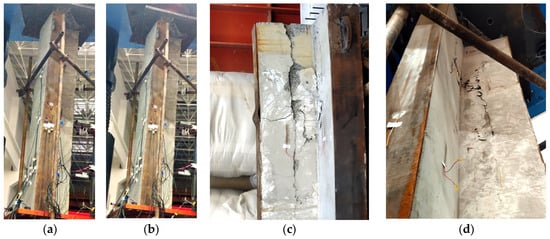
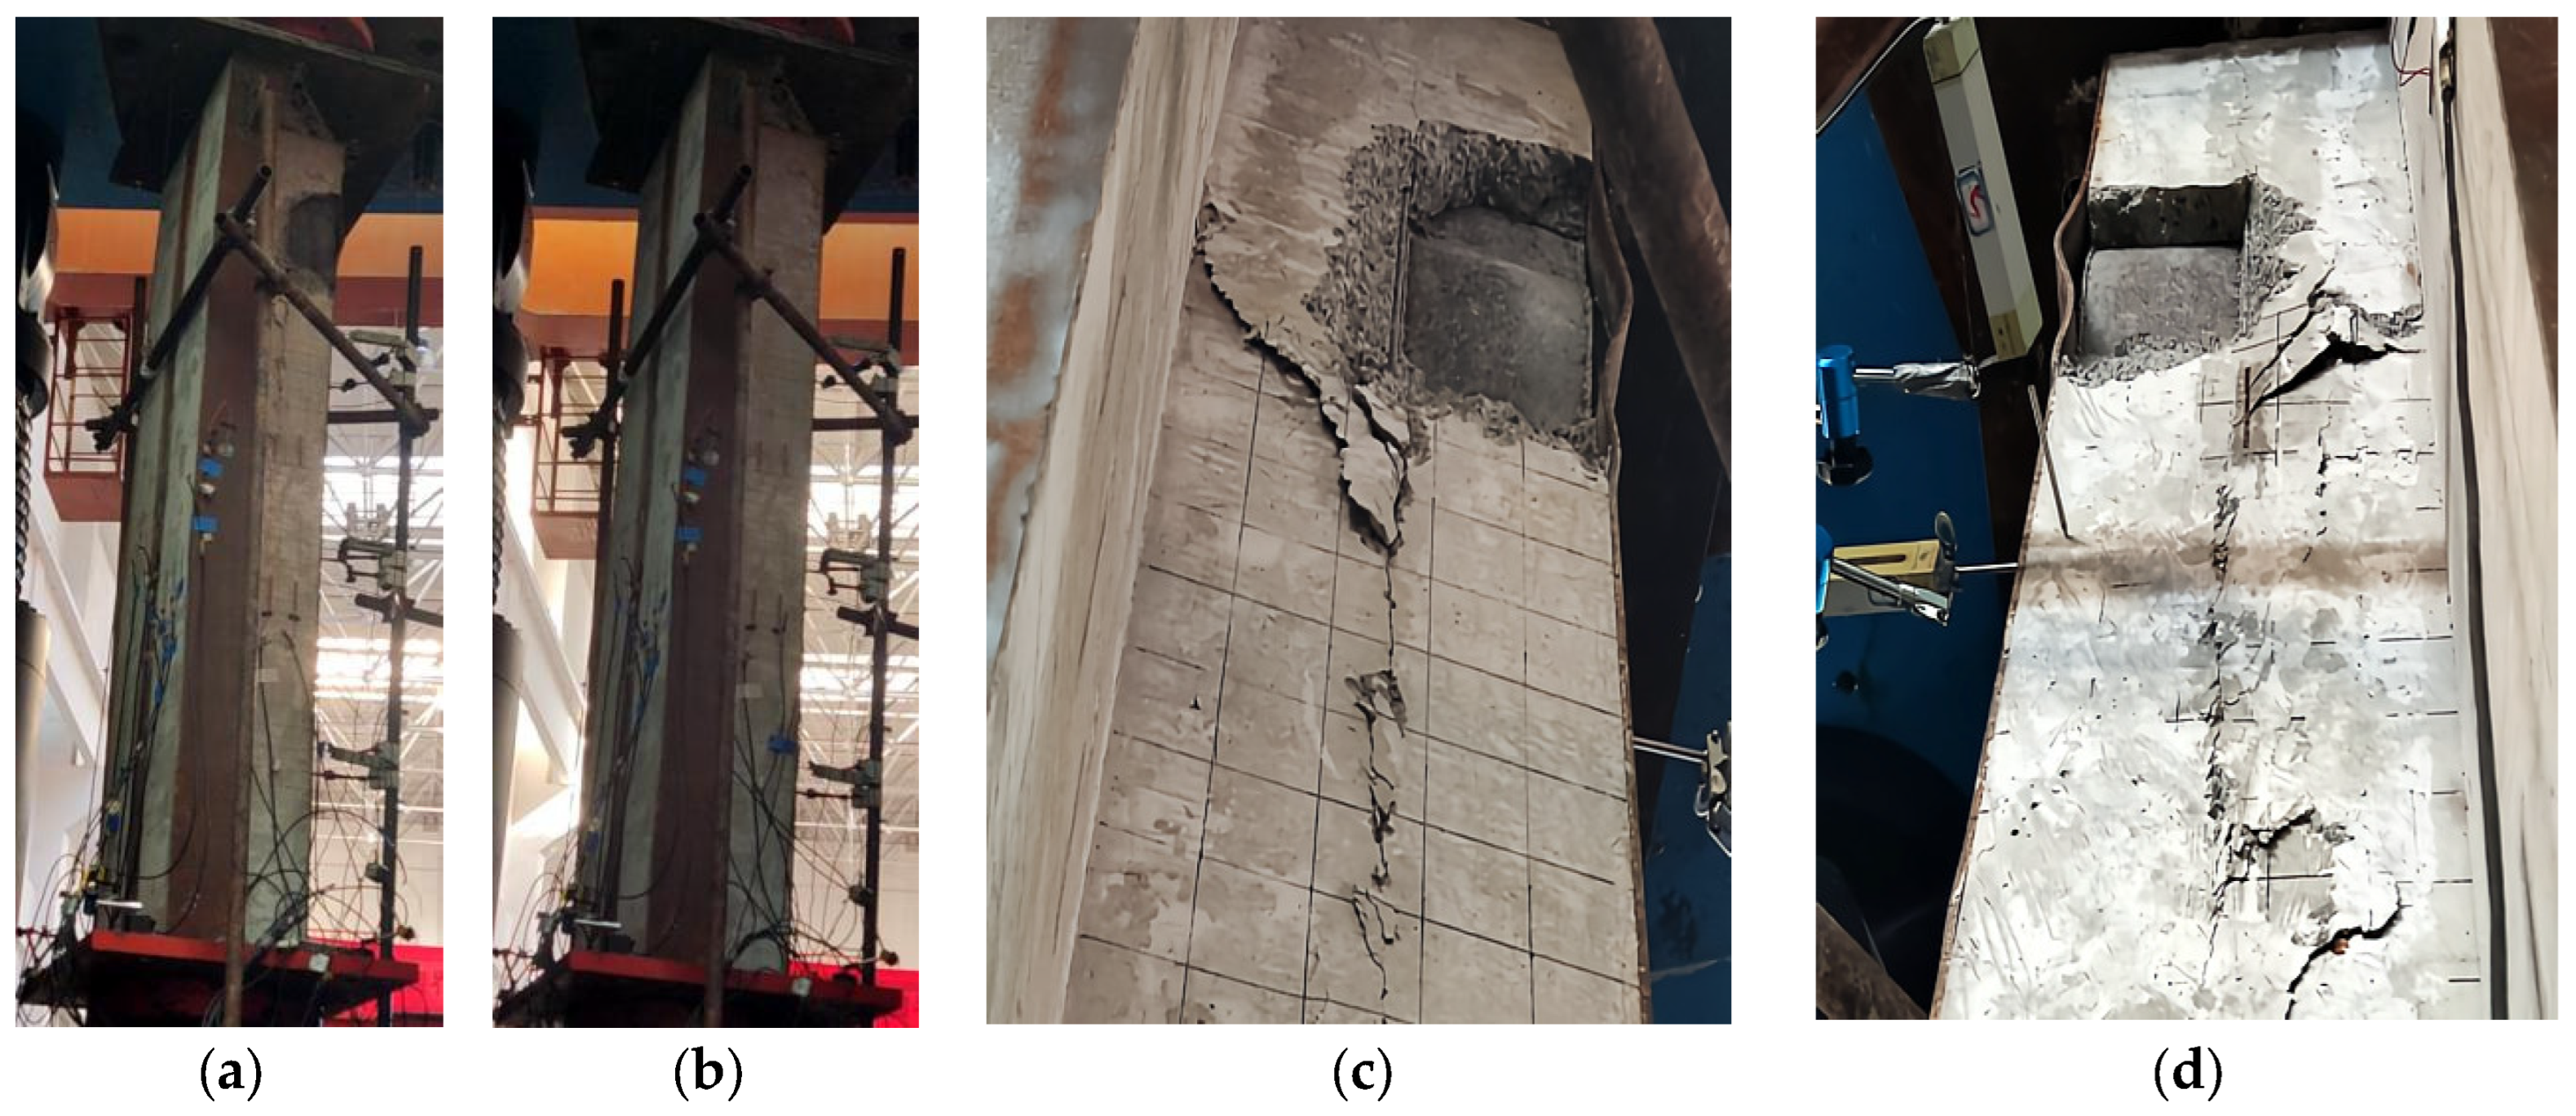
In the HTZ experiment, the ultimate load reached 10,201 kN, corresponding to a displacement of 5.16 mm. As the load approached the ultimate value, the rate of increase slightly decreased, indicating a minor stiffness degradation. Following the ultimate load, the specimen entered the load reduction phase, which lasted relatively longer compared to other specimens. At a displacement of 10.71 mm—5.55 mm greater than the displacement at ultimate load—the experiment could no longer maintain the gradual descending branch, and the load began to drop sharply. Although the loading point was designed to coincide with the centroid of the cross-section, slight eccentricity occurred due to manufacturing imperfections and environmental factors during loading. This eccentricity caused one of the flanges of HTZ to bear a higher compressive load, leading to large-scale spalling in its upper region, with cracks extending to the top of the column. The outer steel plate of this flange exhibited significant compressive-bending buckling at approximately 600 mm from the top, as shown in Figure 12c. Similar to other specimens, through-going cracks developed in the other flanges, as illustrated in Figure 12d.
Figure 12.
Experiment phenomenon of HTZ: (a) before loading; (b) after loading; (c) large-scale spalling of the flange; (d) vertical through cracks.
3.1.2. Eccentric Loading Experiments
In the eccentric compression experiments, the loading point of the actuator deviates from the centroid of the column. Four specimens were tested, and they are designated as RLP, RTP, HLP, and HTP.
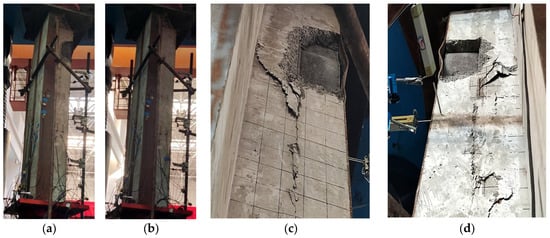
In the RLP experiment, the ultimate load reached 6336 kN, corresponding to a displacement of 6.94 mm. Following this point, the load began to decrease gradually, and this phase continued until a displacement of 12.12 mm was reached, at which stage the load had dropped to 5372 kN. Subsequently, a significant load reduction occurred. The loading was accompanied by noticeable bending deformation, an inevitable consequence of eccentric loading. Under eccentric compression, the load distribution becomes asymmetrical, with one side of the cross-section experiencing higher stress. Buckling of the flange steel plate was therefore expected, similar to what was observed in the RLZ specimen. The difference in RLP, however, was that the buckling occurred at a location 1200 mm from the top of the column. In contrast to the axial compression experiments, RLP exhibited prominent transverse cracks that extended through the entire column section and aligned with the region of steel plate buckling, as shown in Figure 13c. Additionally, cracks developed at the internal corner of the column, as illustrated in Figure 13d—a phenomenon that was not evident in the axial compression experiments.
Figure 13.
Experiment phenomenon of RLP: (a) before loading; (b) after loading; (c) transverse crack failure; (d) diagonal cracks.
In the RTP experiment, the ultimate load reached 6741 kN, corresponding to a displacement of 5.02 mm. Following this point, the load slightly decreased to 6344 kN while the displacement increased to 5.27 mm. Thereafter, the load remained relatively stable around 6400 kN until the displacement reached 9.02 mm, after which a significant load drop occurred. Due to the eccentric loading point being positioned near the center flange, all observed failure phenomena were concentrated in this region. The concrete on both sides of the flange was damaged, and the steel plate at the flange end, located 600 mm from the top of the column, experienced bending and buckling. The concrete in this area began to crack and spall extensively, with the spalling occurring as a single block of concrete between the two flange plates. Multiple diagonal cracks initiated from the spalled region and extended toward the steel plate, ultimately leading to specimen failure. The entire column exhibited a clear bending failure mode, as illustrated in Figure 14c,d.
Figure 14.
Experiment phenomenon of RTP: (a) before loading; (b) after loading; (c) middle flange right side failure; (d) middle flange left side failure.
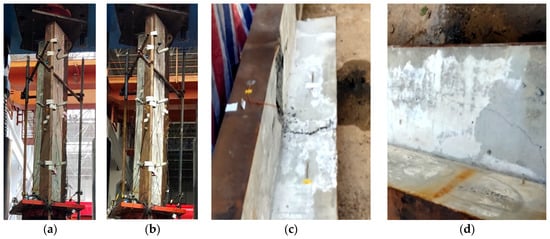
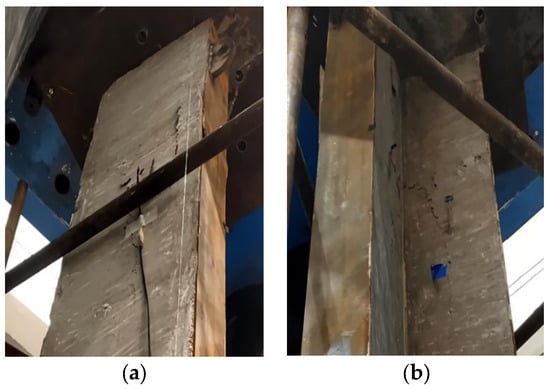
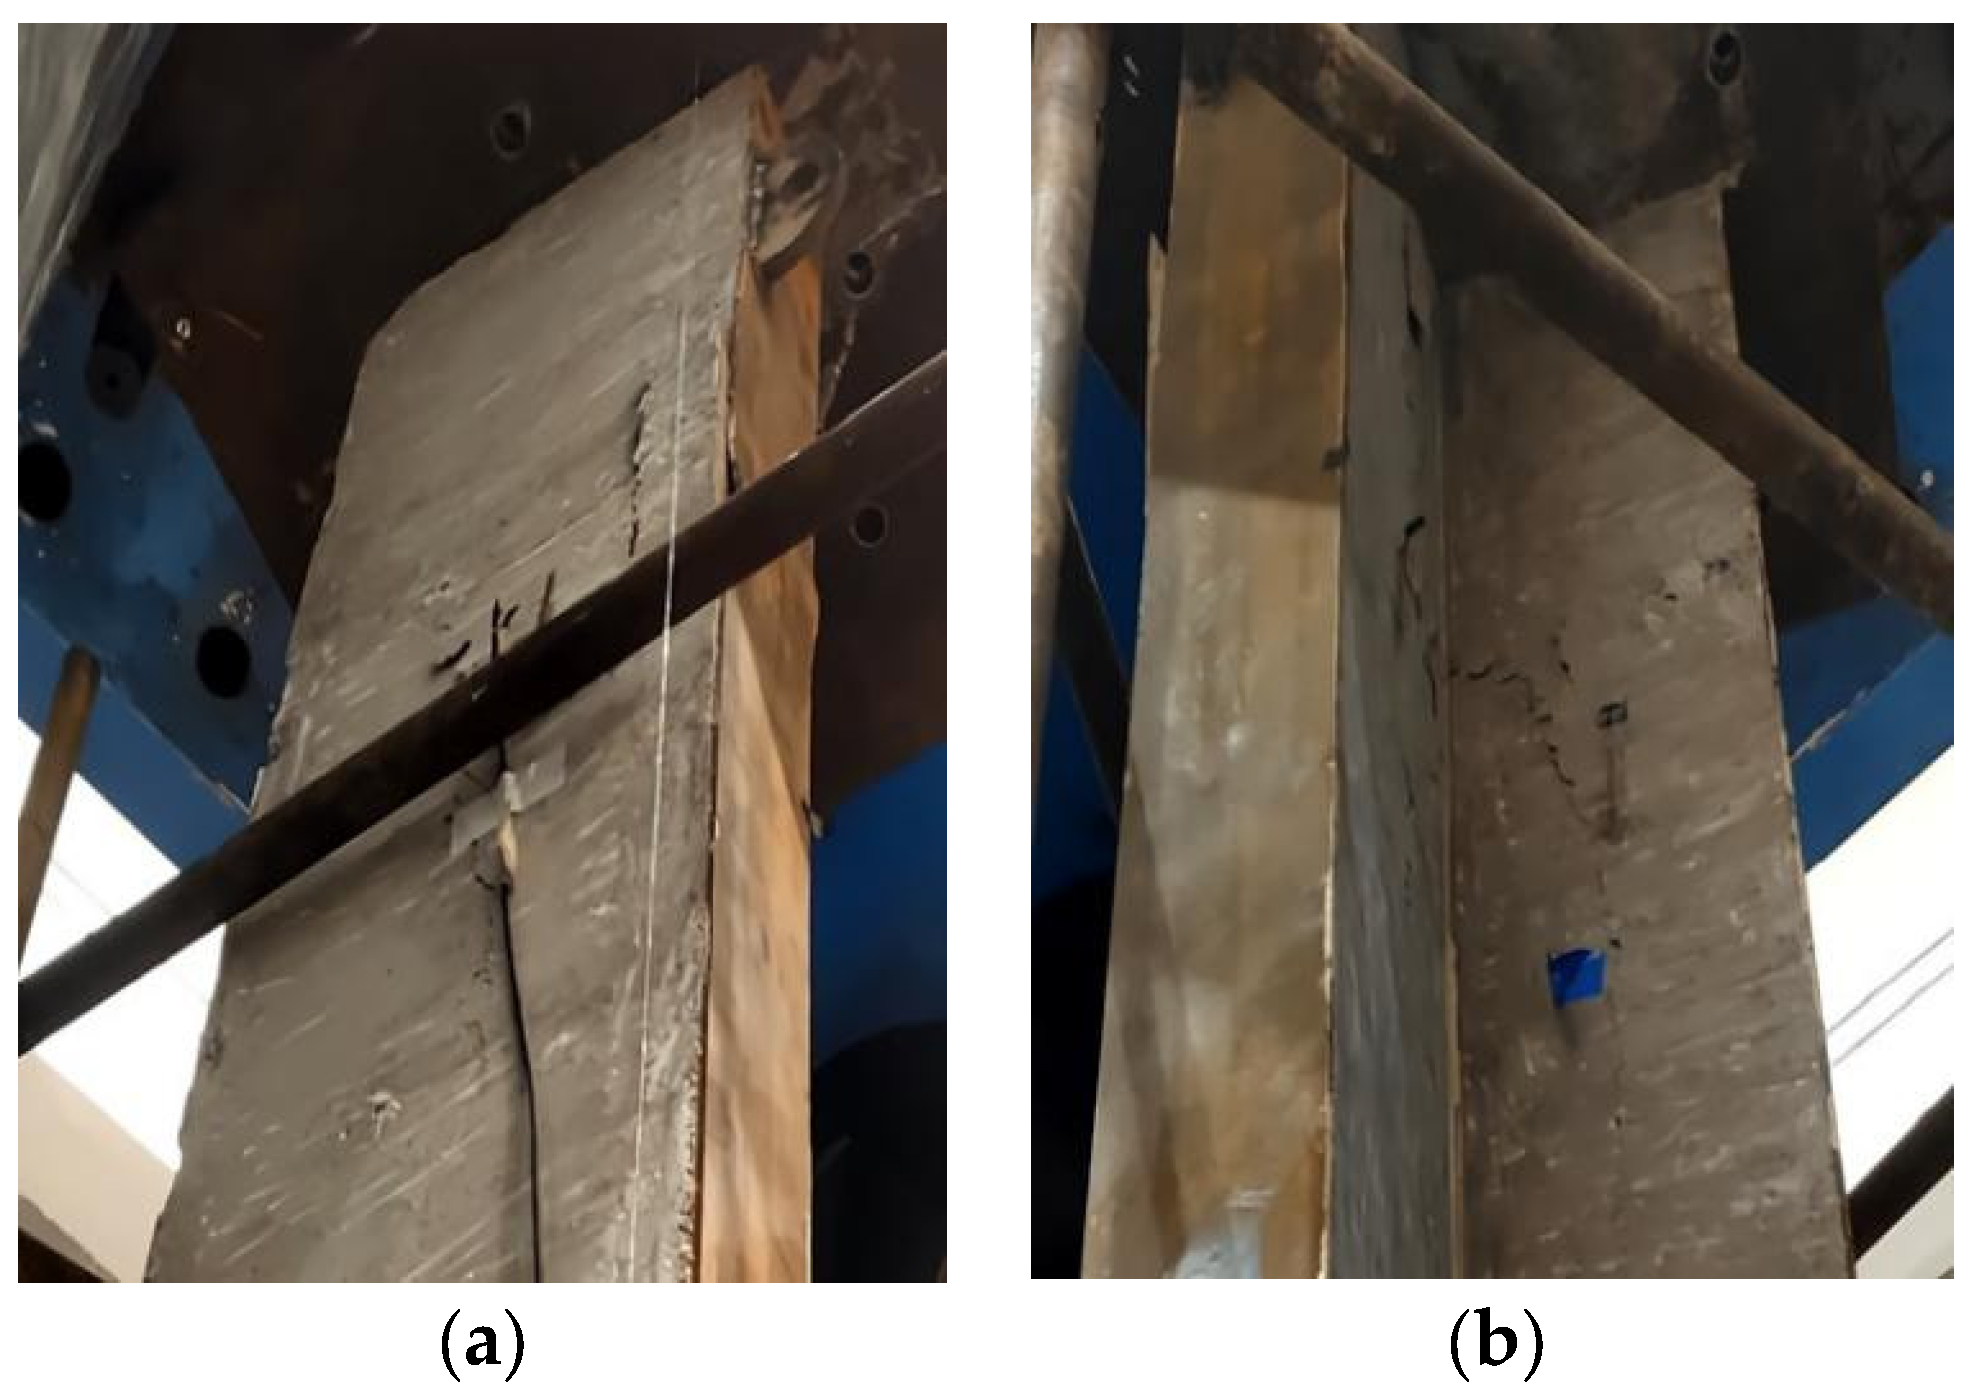
In the HLP experiment, the ultimate load reached 6726 kN, corresponding to a displacement of 5.36 mm. Following this point, the experiment entered the load reduction phase, which continued until the displacement reached 8.98 mm, at which stage the load had decreased to 5570 kN and the stiffness of the specimen had nearly fully deteriorated. Compressive-bending buckling occurred in the steel plate at the flange end of the column, located 600 mm from the top, as shown in Figure 15a. Additionally, cracks developed at the internal corner of the column, a phenomenon consistent with those observed in the RLP and RTP experiments, as illustrated in Figure 15b.
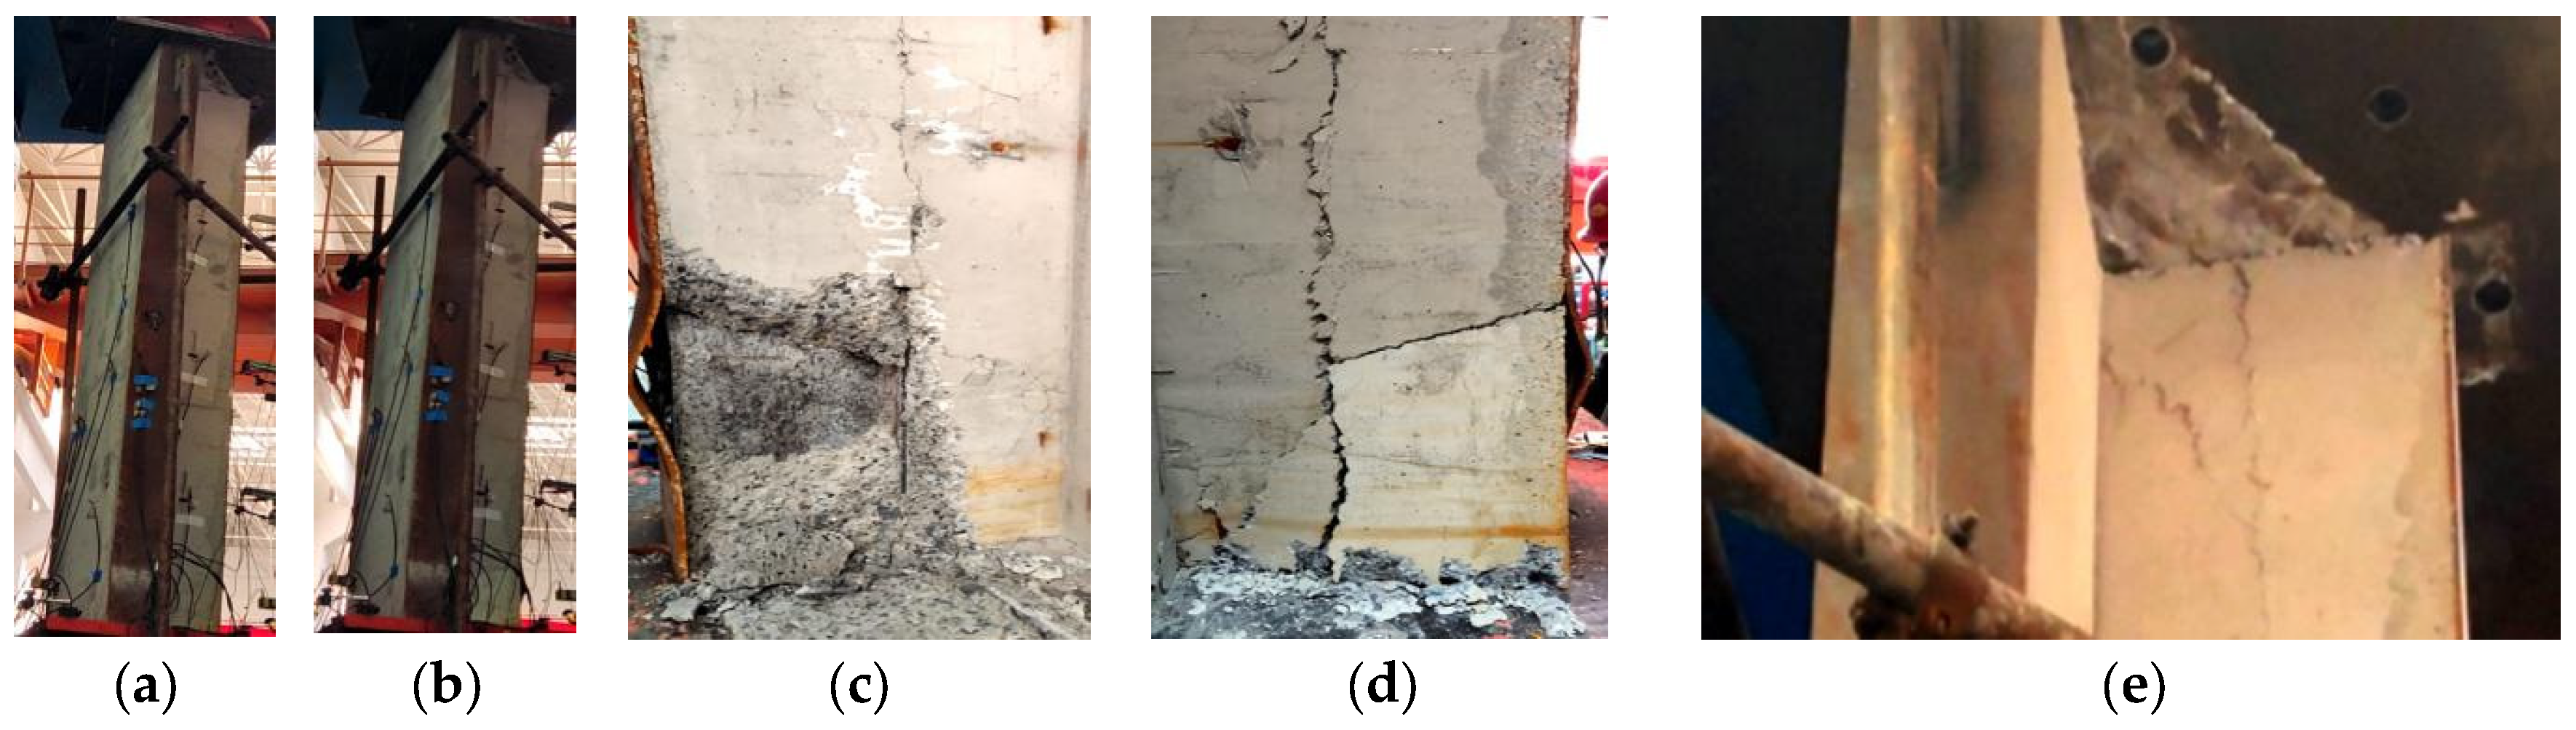
Figure 15.
Experiment phenomenon of HLP: (a) bending buckling of steel plates; (b) diagonal crack failure.
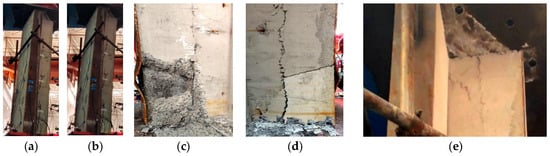
In the HTP experiment, the ultimate load reached 6667 kN, corresponding to a displacement of 5.33 mm. The HTP specimen did not exhibit a clear descending branch in the load–displacement curve. When the load decreased to 6366 kN, the column stiffness significantly deteriorated, with the displacement increasing to 7.28 mm at that stage. The primary failure region of the HTP specimen was located 300 mm from the bottom of the column, where the steel plate underwent compressive-bending buckling. Below this location, a considerable portion of concrete on one flange spalled off, as illustrated in Figure 16c. On the opposite side, a vertical through crack developed and extended to the end steel plate, accompanied by a transverse crack, as shown in Figure 16d. Additionally, diagonal and vertical cracks were observed at the top of the HTP column, as depicted in Figure 16e.
Figure 16.
Experiment phenomenon of HTP: (a) before loading; (b) after loading; (c) large-scale spalling at the bottom; (d) cracking at the bottom; (e) inclined and vertical cracks at the top.
In summary, eccentrically loaded specimens exhibited more pronounced flexural failure compared to axially loaded specimens, and the outer concrete primarily displayed diagonal cracking patterns, which differ from the vertical cracks typically observed in axial compression experiments. Furthermore, due to the offset of the loading point, one flange of the special-shaped column experienced a higher compressive stress, leading to frequent occurrences of extensive concrete spalling and significant transverse cracks on that flange in eccentrically loaded specimens. This phenomenon was observed on the central flange in specimens such as RTP and HTP, which can be directly attributed to the intentional eccentric loading setup. In contrast, similar phenomena were also observed in specimens like RTZ and HTZ; however, these were caused by experimental errors, and the flange experiencing more severe damage was not the central flange. In conclusion, even columns 3 m in height subjected to axial loading may exhibit some degree of bending deformation, although the extent of bending is considerably less than that under eccentric loading.
Based on the experimental observations, vertical cracking is attributed to elevated tensile stresses within the cross-section. Therefore, strengthening the transverse direction of the column may represent a key focus for future structural improvements and research.
3.2. Load-Displacement Curves
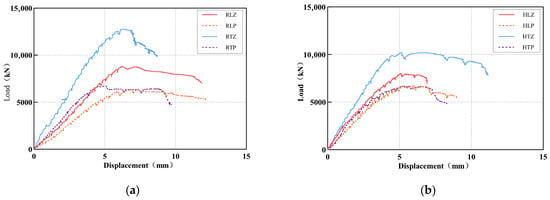
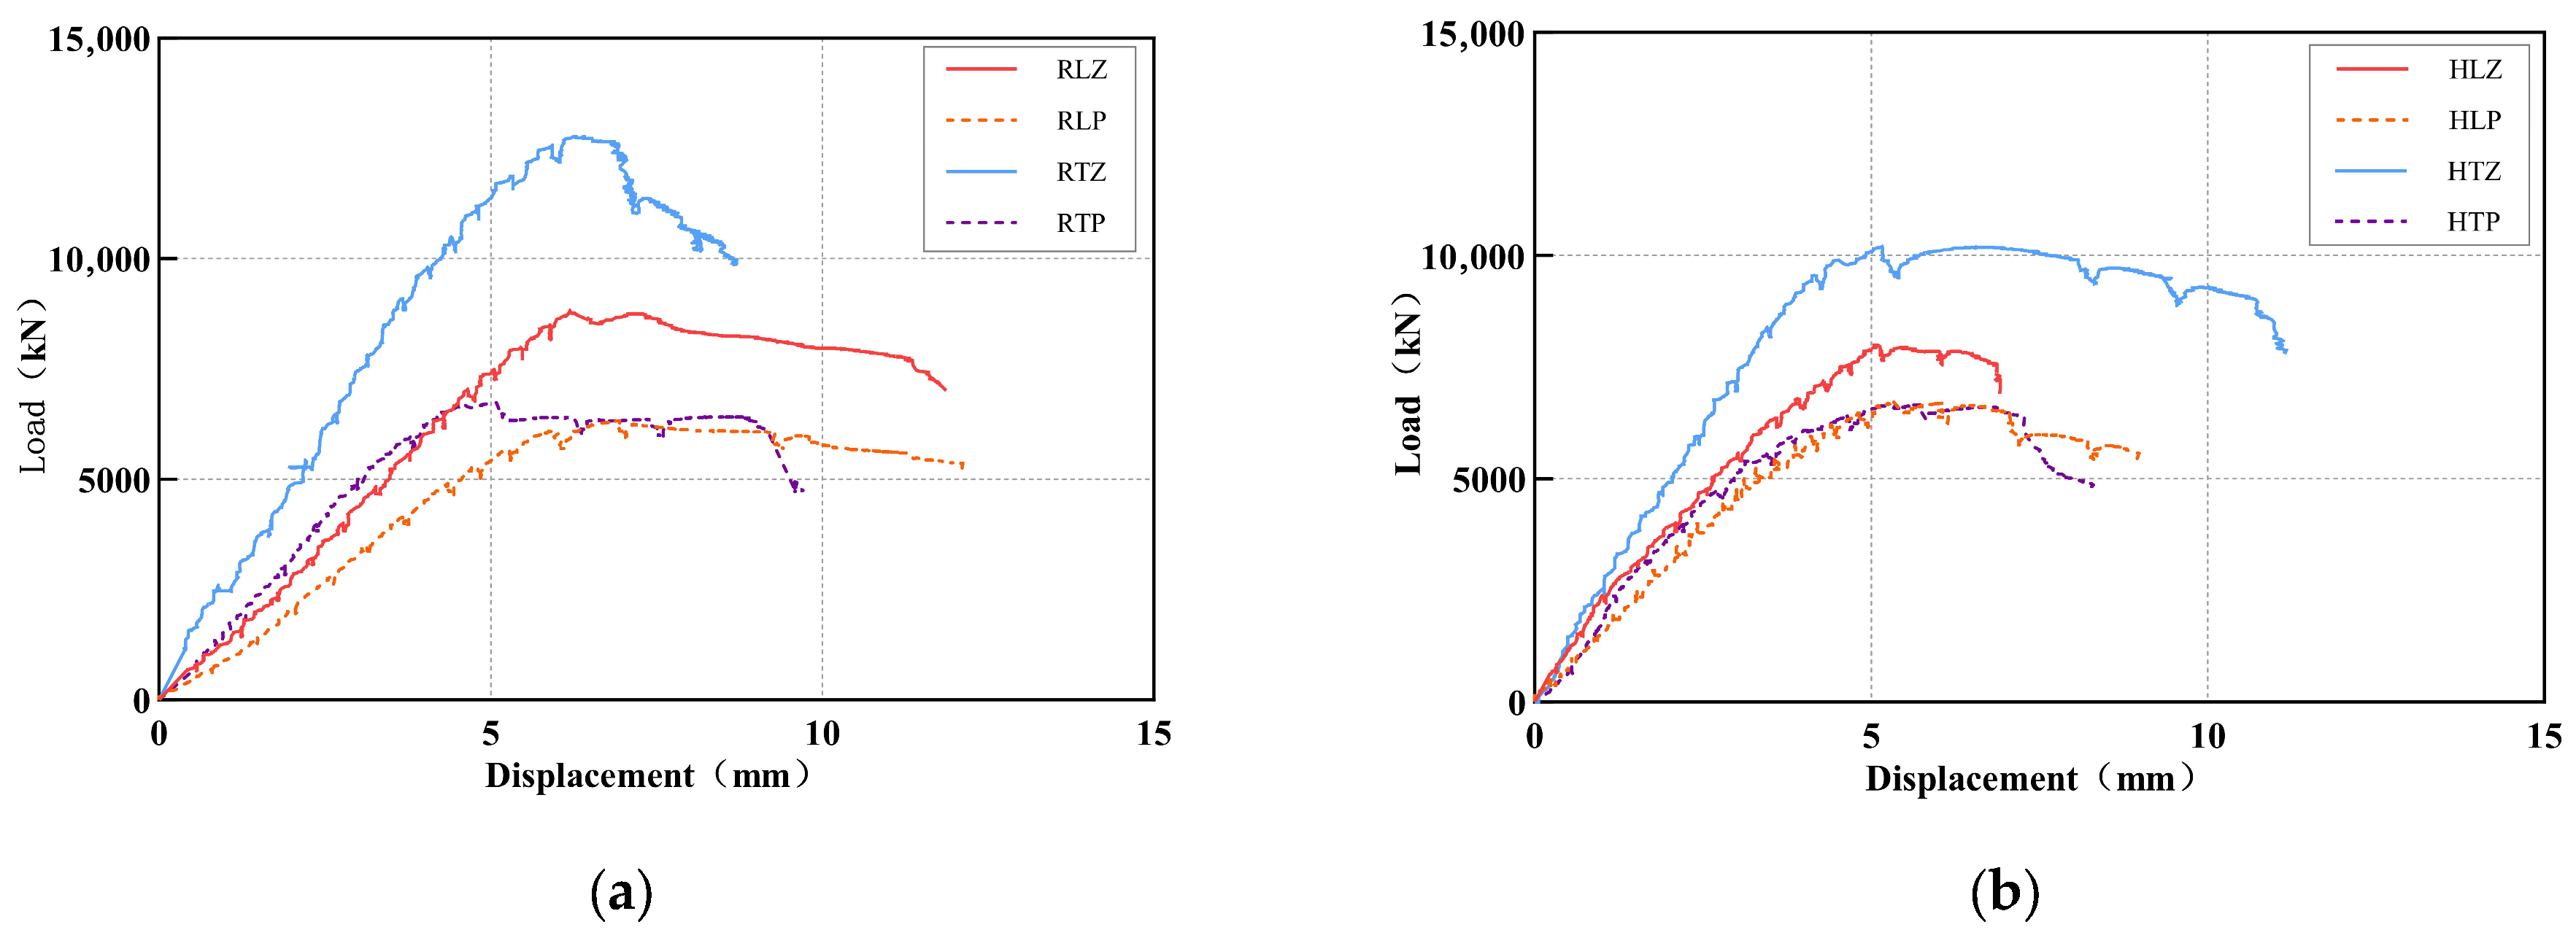
The load–displacement curves are used as a key criterion for evaluating the structural performance of the specimens. These curves are summarized in Figure 17. Figure 17a presents the load–displacement behavior of the concrete-filled special-shaped square steel tube columns (R columns), including RLZ, RLP, RTZ, and RTP. Figure 17b illustrates the load–displacement behavior of the concrete-filled special-shaped H-shaped steel columns (H columns), comprising HLZ, HLP, HTZ, and HTP.
Figure 17.
Load–displacement curves: (a) R columns; (b) H columns.
The relevant parameters of the ultimate load from the load–displacement curves are summarized in Table 4. By analyzing the curves, the following three trends can be observed: (1) The ultimate load of specimens subjected to eccentric loading is lower than that of specimens under axial loading; (2) the ultimate load of T-shaped columns is generally higher than that of L-shaped columns; (3) the ultimate load of square steel tube columns (R columns) is generally higher than that of H-shaped steel tube columns.
Table 4.
Ultimate load of the load–displacement curve.
Regarding point 1, the ultimate load of RLP decreased by 2477 kN compared to RLZ, representing a reduction rate of 27.1%; the ultimate load of RTP decreased by 6039 kN compared to RTZ, with a reduction rate of 47.3%; the ultimate load of HLP decreased by 1283 kN compared to HLZ, showing a reduction rate of 16.0%; the ultimate load of HTP decreased by 3534 kN compared to HTZ, resulting in a decrease rate of 34.6%. Eccentric loading generally reduces the structural performance of the specimens, which is an expected outcome. However, the relatively high reduction rates observed in the two T-shaped column groups indicate that the eccentric loading setup employed in this research did not fully exploit the structural capacity of these columns. In conjunction with the observed experiment phenomenon, the shift in the loading point caused the central flange of the T-shaped columns to bear a disproportionately high compressive load, while the sections on either side of the loading point exhibited poor load-sharing behavior, ultimately leading to premature failure of the eccentrically loaded T-shaped columns.
Regarding point 2, the ultimate load of RTZ is 3967 kN higher than that of RLZ, representing an increase of 45.0%; RTP is 405 kN higher than RLP, indicating an increase of 6.4%; HTZ is 2192 kN higher than HLZ, showing an increase of 27.4%; whereas HTP is 59 kN lower than HLP, reflecting a decrease of 0.9%. In summary, T-shaped columns utilize more material compared to L-shaped columns, and therefore, their compressive performance is expected to be superior. This is further supported by the two sets of axial compression experiments. In contrast, the eccentric compression experiments reveal minimal differences between T-shaped and L-shaped columns, as the structural performance of T-shaped columns deteriorates significantly under eccentric loading. This highlights the greater sensitivity of T-shaped columns to eccentric compression, suggesting that special attention should be given to their application in practical engineering scenarios.
Regarding point 3, the ultimate load of RLZ increased by 804 kN (10.0%) compared to HLZ; RTZ increased by 2579 kN (25.3%) compared to HTZ; RTP increased by 59 kN (0.9%) compared to HTP; whereas RLP decreased by 390 kN (5.8%) compared to HLP. Under axial loading conditions, the ultimate load of R columns was consistently higher than that of H columns across both experiment groups. However, the difference in performance between R and H columns under eccentric loading was significantly smaller than that observed under axial loading.
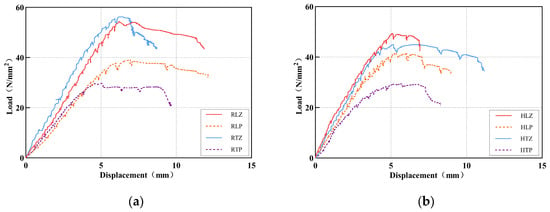
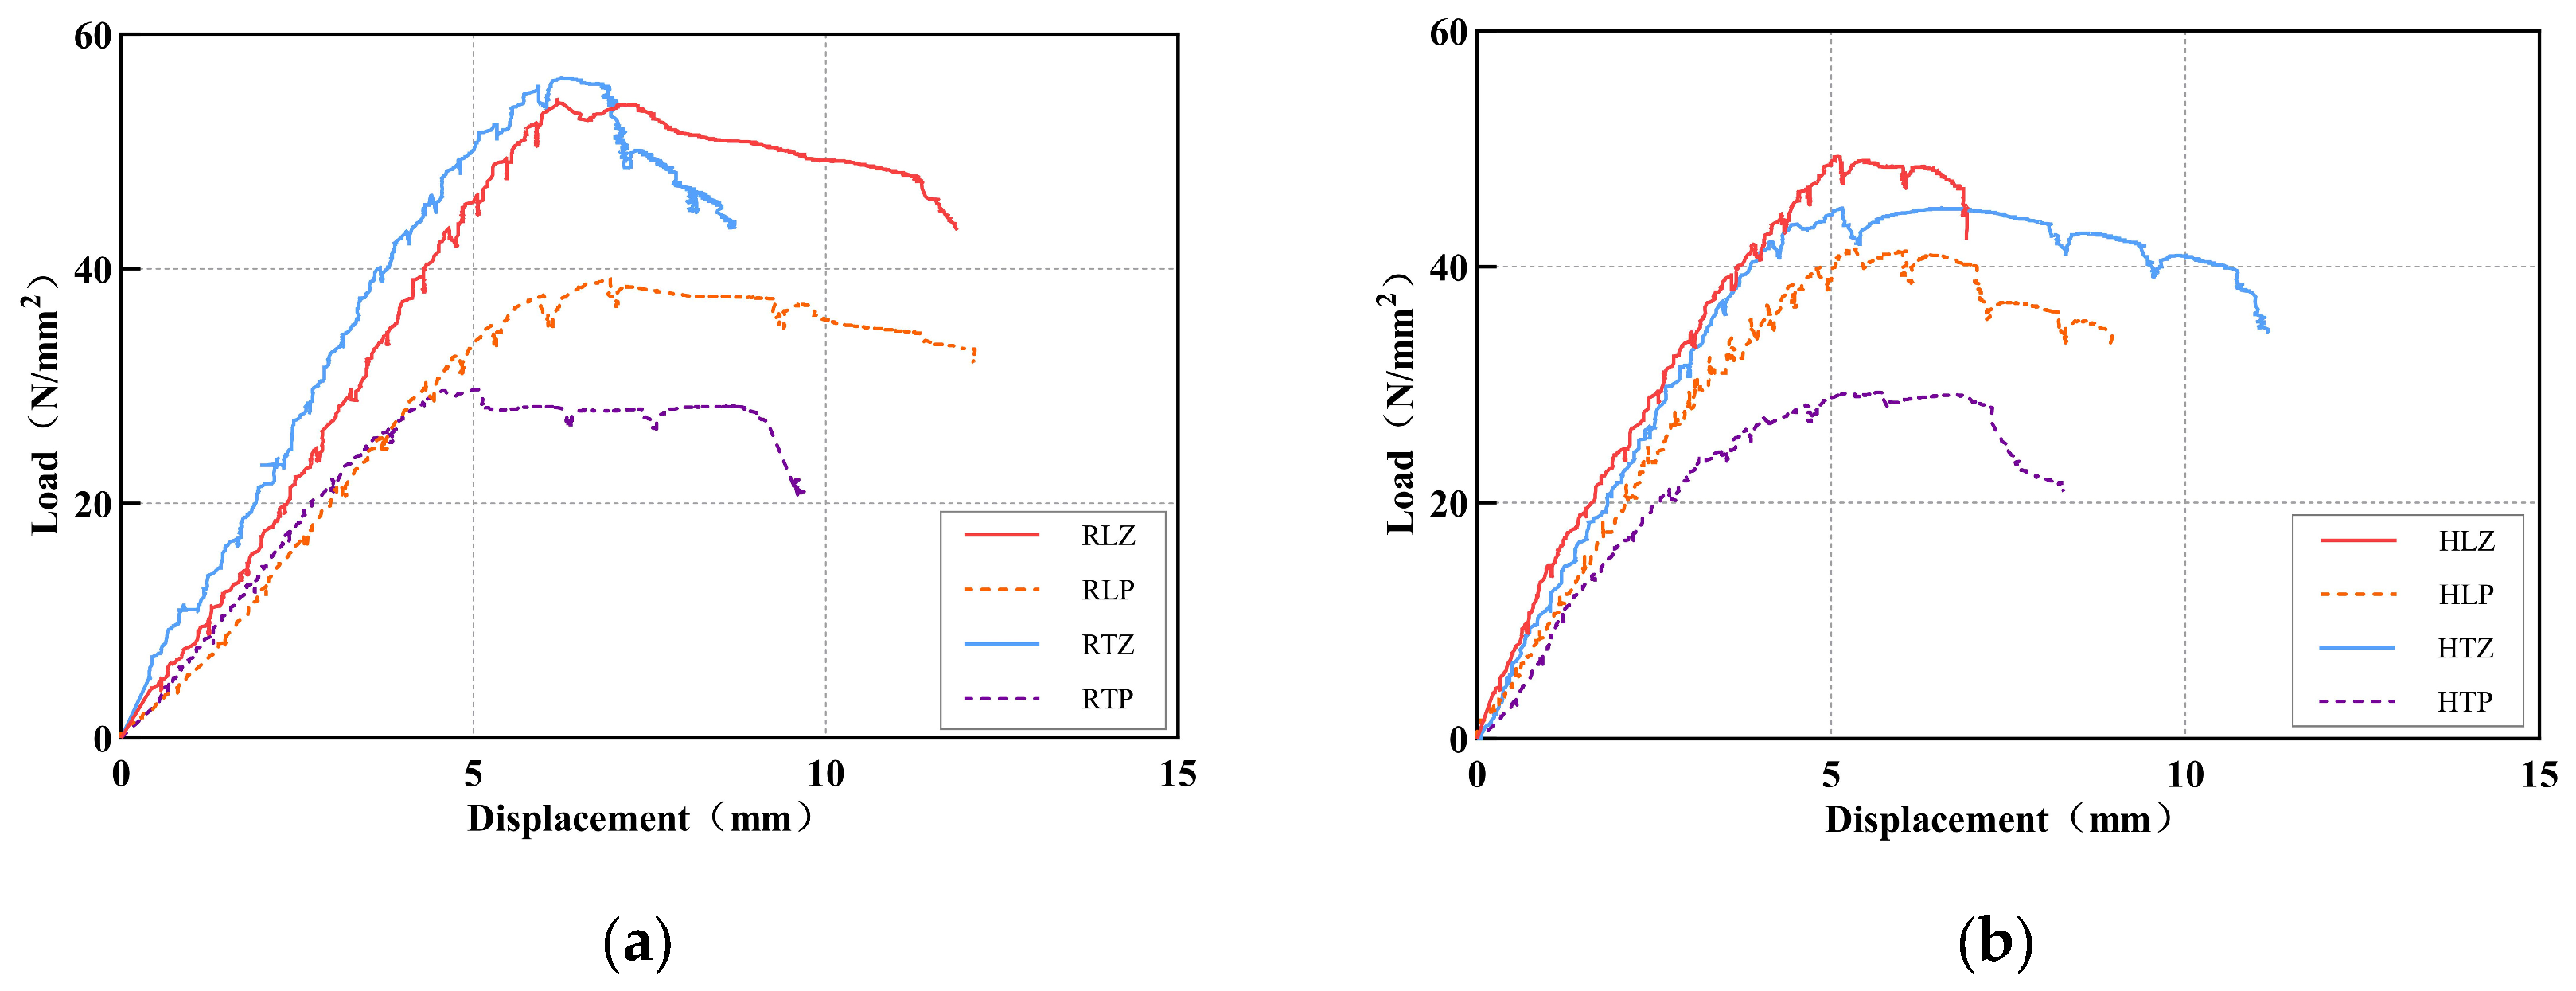
Figure 18 presents the load–displacement curves per unit area for the columns. The normalized ultimate load per unit area, denoted as RLZ, RLP, RTZ, RTP, HLZ, HLP, HTZ, and HTP, is 54.4 N/mm2, 39.1 N/mm2, 56.3 N/mm2, 29.7 N/mm2, 49.4 N/mm2, 41.5 N/mm2, 45.0 N/mm2, and 29.4 N/mm2, respectively. The use of normalized ultimate load facilitates a more intuitive comparison among the eight columns. For both the R-series and H-series columns, the maximum normalized load was achieved under axial compression. Furthermore, the normalized load of the R-series columns was slightly higher than that of the H-series columns, with the L-shaped and T-shaped columns exhibiting increases of 10.1% and 25.1%, respectively, and an average increase of 17.6%. This indicates that, compared to the H-shaped columns, the R-shaped columns are more effective in mobilizing the capacity of the special-shaped columns investigated in this paper. In contrast, the performance of these special-shaped columns diminished significantly when subjected to eccentric loading. Specifically, the normalized load for RLP was 28.1% lower than that for RLZ; for RTP, it was 47.2% lower than for RTZ; for HLP, it was 16.0% lower than for HLZ; and for HTP, it was 34.6% lower than for HTZ. Based on these values, the average strength reduction due to eccentric loading, compared to axial loading, was 31.5%. Moreover, the T-shaped columns were more susceptible to the effects of eccentricity than the L-shaped columns. Under eccentric loading, the strength of the T-shaped columns decreased by 40.9%, whereas the L-shaped columns were less affected, with a reduction of 22.1%.
Figure 18.
Normalized load–displacement curves: (a) R columns; (b) H columns.
Under axial compression, T-shaped columns carry more load primarily due to stress dispersion enabled by the confinement effect provided by the steel skeleton. However, under eccentric loading, they fail prematurely because of uneven flange stiffness and shear lag effects, which cause non-uniform stress distribution. Square steel tubes offer continuous confinement to the concrete, whereas H-shaped sections provide only partial restraint, explaining the superior performance of the R-series columns. Web openings enhance composite action by allowing concrete to flow through, creating mechanical interlock and dowel action that transfers shear forces between steel and concrete, ensuring strain compatibility and integrated behavior. The 3 m column height may introduce second-order (P−Δ) effects under eccentric loading, potentially accelerating stiffness degradation. Additionally, any unintended eccentricity during axial tests would induce bending moments that could reduce capacity and alter failure patterns compared to perfectly concentric conditions.
According to Clause 5.1.2 of GB 50936-2014 [39], the axial compressive load of concrete-filled steel tubular columns is specified and expressed by the following Equations (1)–(3).
where fsc is the load per unit area of the concrete-filled steel tubular column (MPa); fc is the design value of the compressive strength of concrete (MPa); f is the design value of the strength of steel (MPa); αsc is the steel ratio of the concrete-filled steel tubular section; As is the cross-sectional area of the steel tube; Ac is the cross-sectional area of the concrete; θ is the confinement coefficient; and B and C are influence coefficients.
Table 5 lists the design values for the four axially loaded columns—RLZ, RTZ, HLZ, and HTZ—calculated using Equations (1)–(3). In the table, fT denotes the experimental ultimate load per unit area derived from the measured results presented in Figure 18.
Table 5.
Calculated design values of load per unit area for axially loaded columns.
According to the design values calculated using the code, the design values of the R-shaped square steel tube columns are lower than the experimental values, indicating a conservative prediction. In contrast, the experimental values of the H-shaped columns are all slightly lower than their design values. The design values provided by the code further validate that the R-shaped columns outperform the H-shaped columns. This also demonstrates that when square steel tubes are applied to the core region of concrete-filled steel tubes, the code’s calculations tend to be conservative. However, for sections similar to H-shaped columns, where the core region cannot fully encase the concrete, the design values specified by the code should be appropriately reduced to ensure the structural safety of such members.
3.3. Stiffness Analysis
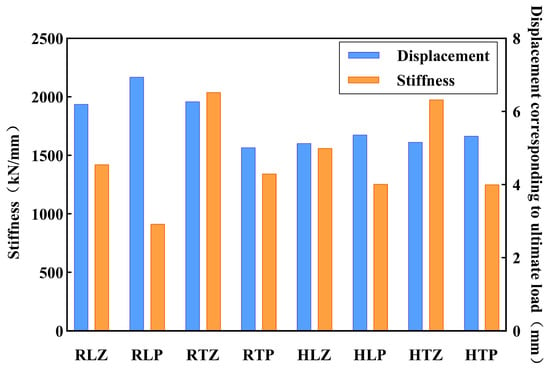
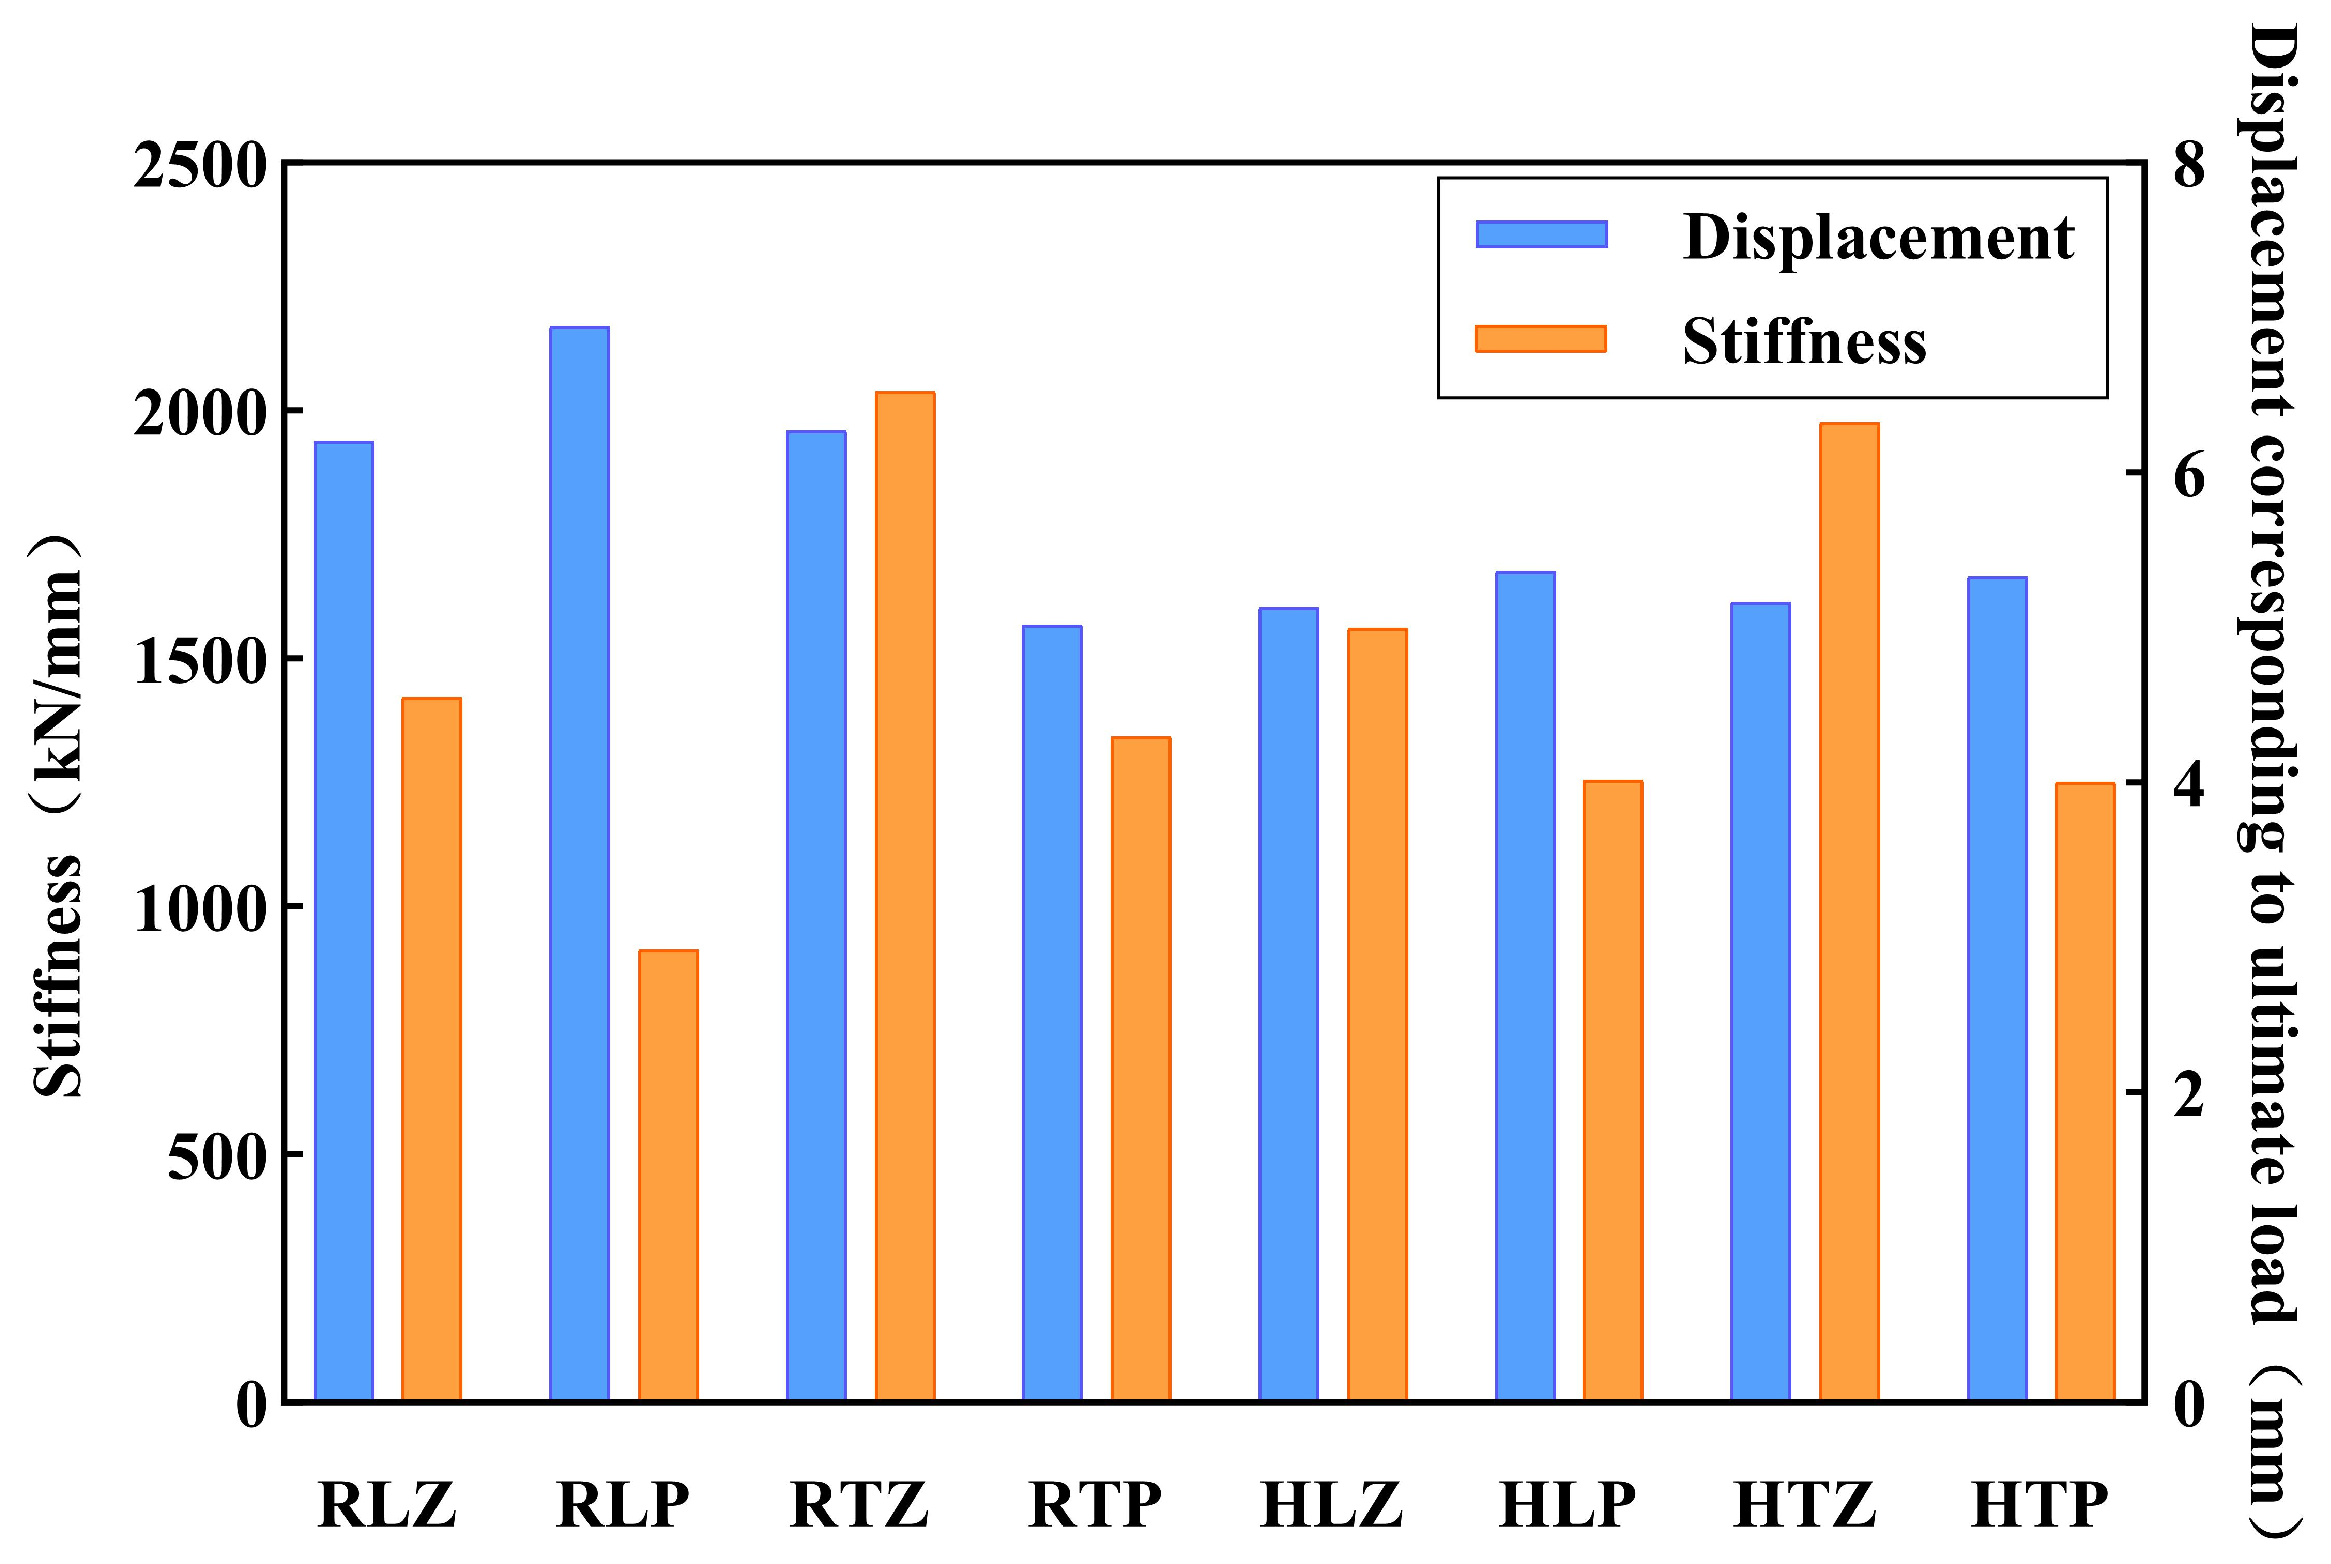
Table 4 also lists the displacements corresponding to the ultimate loads of the eight specimens, and the stiffness at those points relative to the initial state is calculated. The bar chart illustrating displacement and stiffness is presented in Figure 19.
Figure 19.
Stiffness and displacement of ultimate load point.
It can be observed from the figure that the displacement corresponding to the ultimate load has little correlation with the magnitude of the ultimate load itself. However, the displacement of R columns is consistently greater than that of H columns, and the displacement under eccentric loading is generally higher than that under axial loading, with the exception of RTP, which exhibits the smallest displacement among all specimens. In contrast, stiffness shows a strong correlation with the ultimate load, approximately exhibiting a directly proportional relationship. Furthermore, the stiffness of specimens under axial loading is consistently higher than that under eccentric loading, which aligns with point 1.
Further analysis was performed on the stiffness characteristics of the load–displacement curves. The curves were smoothed using the data processing software GraphPad Prism 8.0. The smoothed curves showed good agreement with the experimental data and effectively eliminated the noise present in the original curves. Subsequently, the first derivative of each curve was calculated to obtain the tangent stiffness degradation trend of the specimens as displacement increased, as illustrated in Figure 20. The tangent stiffness degradation curves were then fitted using a quadratic function, as defined in Equation (4). The fitted curves are represented by solid lines in the figure.
Here, k denotes the stiffness of the specimen, δ represents the compressive displacement, and A and C are empirical parameters of the formula. The fuller shape of the quadratic curve near its peak makes it more suitable for fitting specimens with a gradual reduction in initial stiffness, a characteristic in which it surpasses power-law and rational functions.
Figure 20.
Stiffness–displacement curve (Solid line: Experimental; Dashed line: Fitted): (a) R columns; (b) H columns.
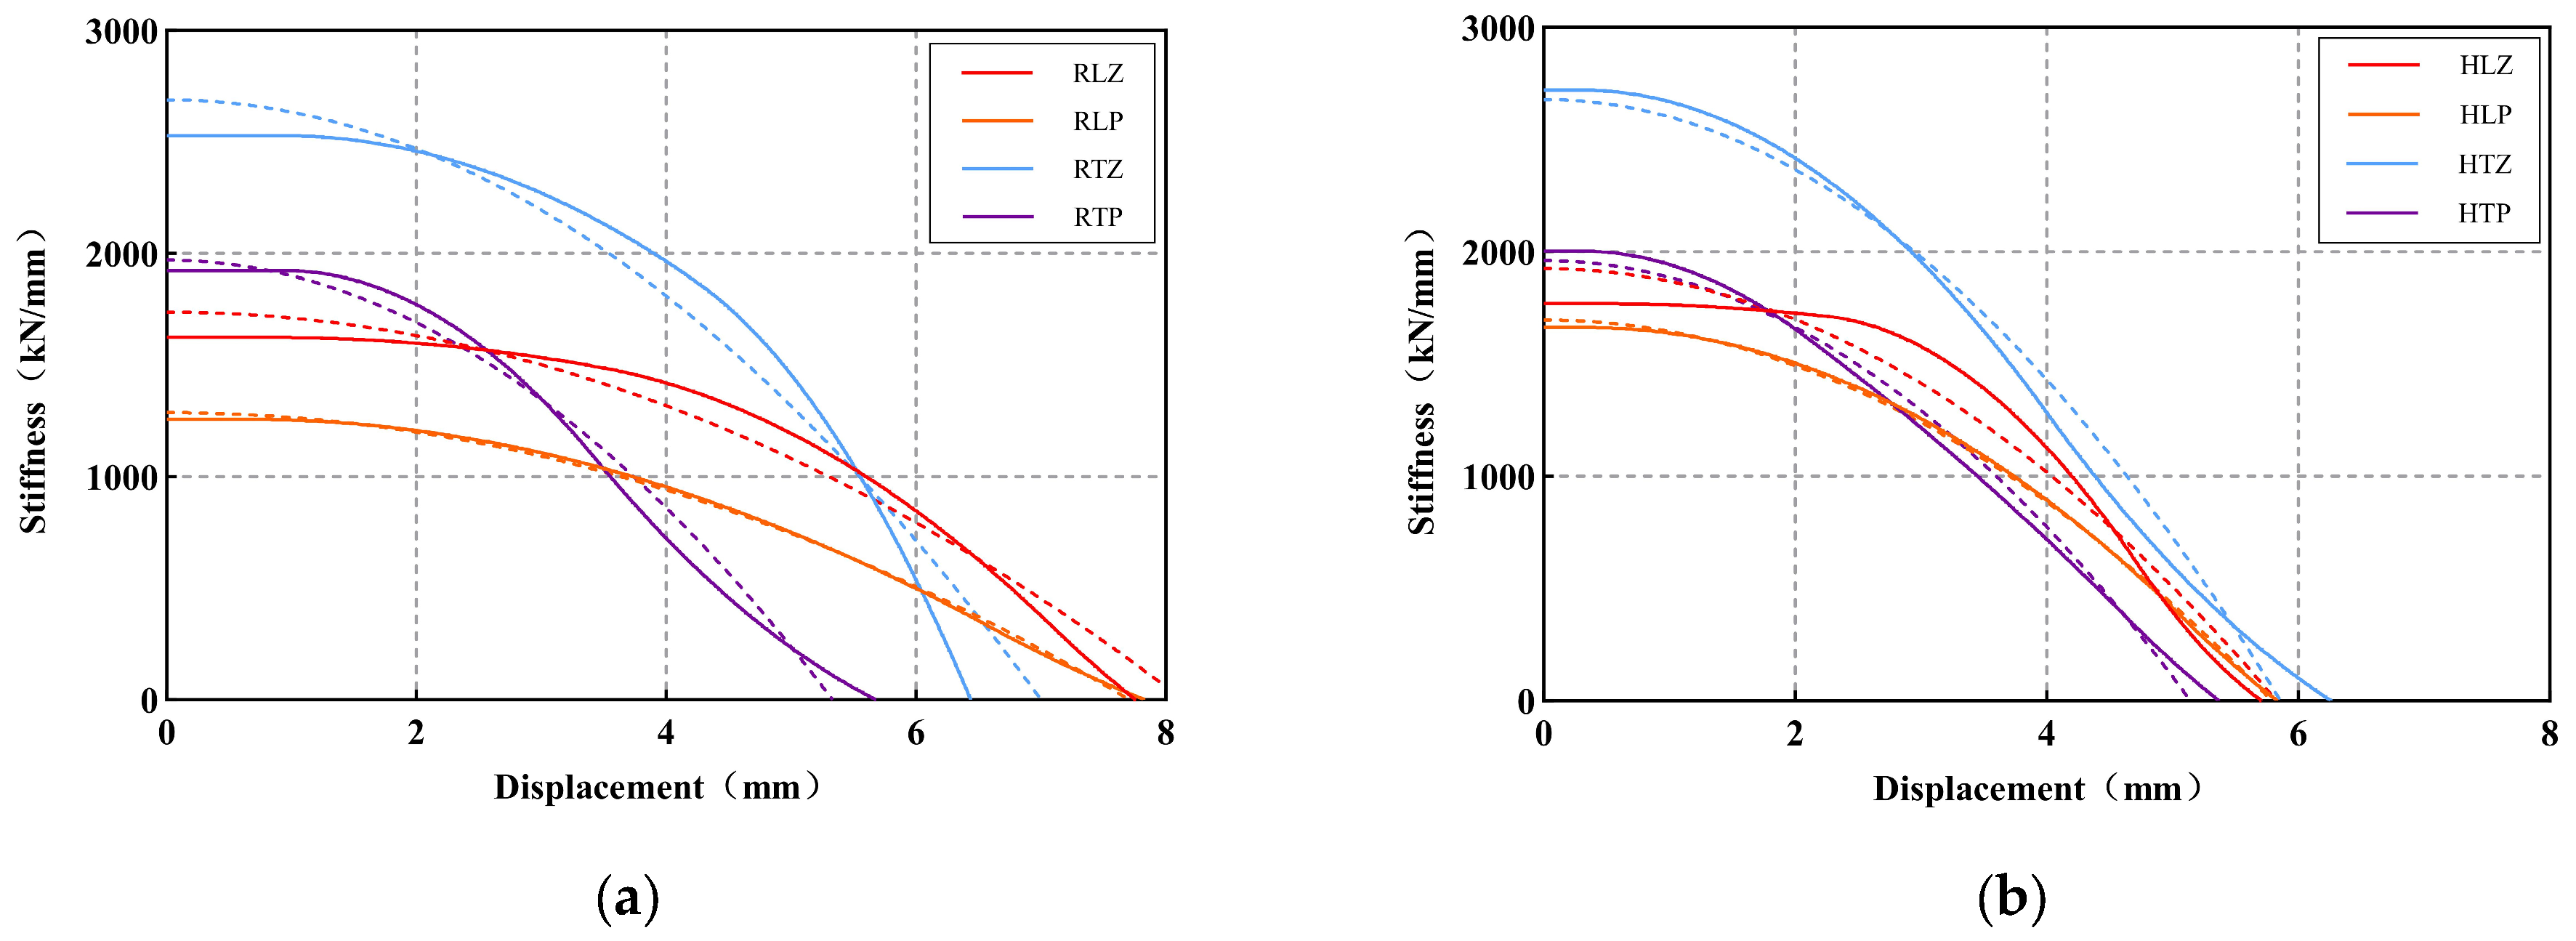
It can be observed from the figure that the stiffness of all eight specimens exhibits a general downward trend. However, some specimens are able to maintain their initial stiffness for a longer duration during compression, such as all R columns and the HLZ column. The initial stiffness values of RLZ, RLP, RTZ, RTP, HLZ, HLP, HTZ, and HTP are 1625.45, 1258.87, 2529.16, 1923.88, 1770.51, 1662.73, 2721.09, and 2004.19 kN/mm, respectively. After the application of compressive load, the stiffness of the columns begins to degrade, although the onset of degradation and the rate of decline vary among specimens. For R columns, the initial stiffness of T-shaped columns is higher than that of L-shaped columns; however, their degradation rate is faster, resulting in a smaller displacement at the point where the stiffness of T-shaped columns reaches 0 compared to L-shaped columns. A similar phenomenon is observed in H columns, although the displacements at which the stiffness of T-shaped and L-shaped columns degrades to 0 are relatively close. Figure 20 contains a total of eight fitted curves, and Table 6 summarizes the corresponding fitting parameters based on Equation (4). The initial stiffness values of the fitted curves for RLZ, RLP, RTZ, RTP, HLZ, HLP, HTZ, and HTP are 1739.11, 1288.18, 2689.59, 1970.22, 1925.73, 1696.07, 2679.81, and 1960.87 kN/mm, respectively.
Table 6.
Parameters of the fitted curves.
3.4. Data Analysis of Strain Gauges and Displacement Meters
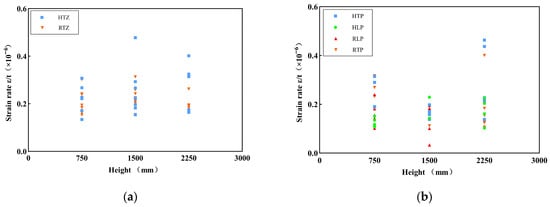
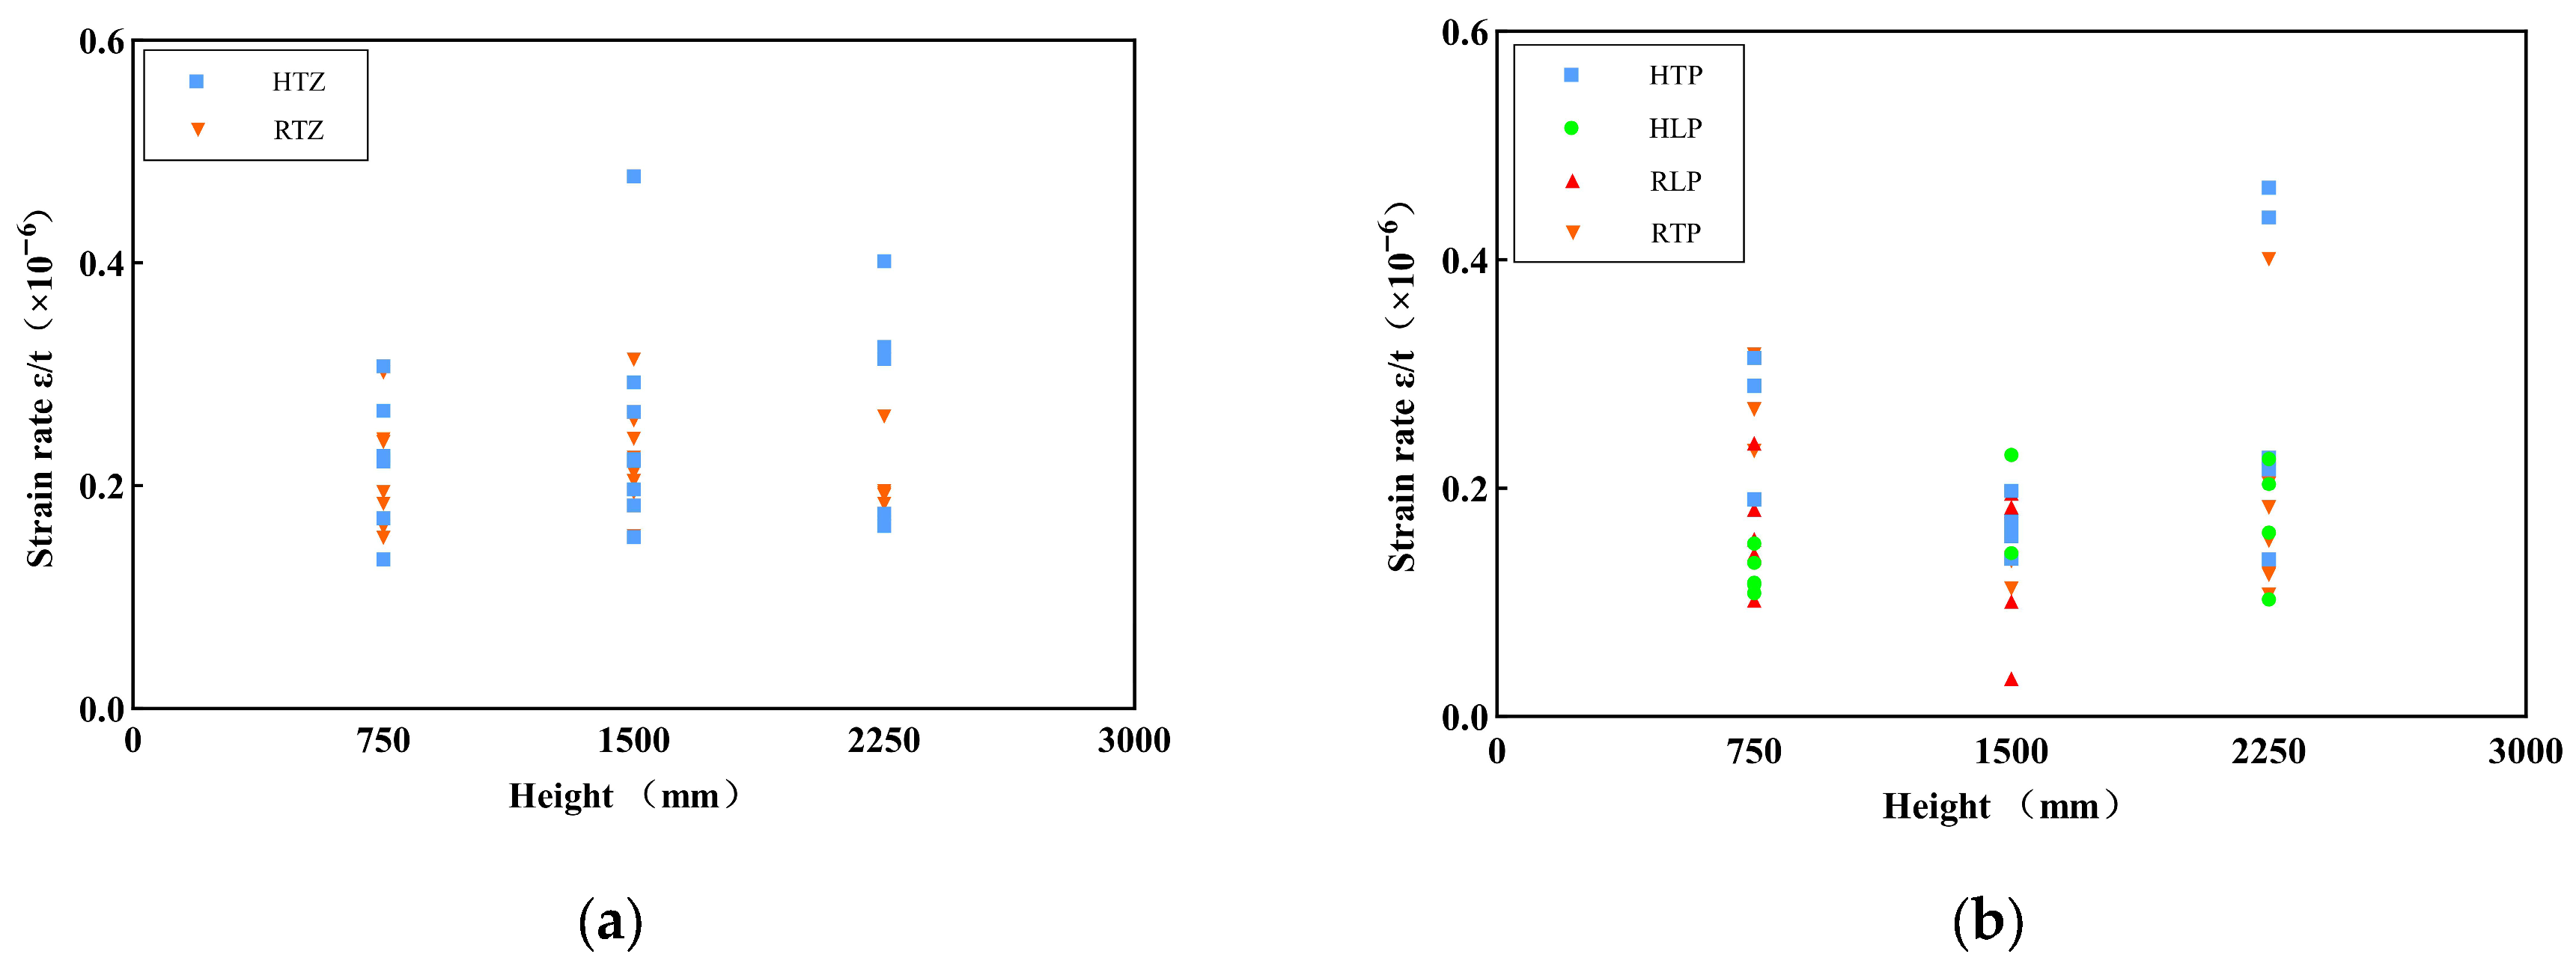
In this experiment, strain gauges were attached to the surface of the columns to measure surface strain during loading. However, due to the tendency of strain gauges to malfunction or detach when subjected to large surface deformations, it is challenging to accurately capture the maximum strain, and irregular strain fluctuations may occur in the later stages of the experiment. To address this issue, this research employs the strain growth rate as an indicator of the degree of strain change. The strain growth rate is calculated by dividing the measured strain by the corresponding time duration. Since the duration of all eight experiments was approximately 2 h, the strain during the first hour generally increased in an almost linear manner. By taking the strain value at the end of the first hour and dividing it by 3600 s, the average strain growth rate per second can be obtained.
Figure 21a,b present the scatter plots of the strain growth rates obtained from the axial compression experiments and eccentric compression experiments. Due to measurement inaccuracies encountered during the HLZ and RLZ experiments, the corresponding strain data were excluded from the figures.
Figure 21.
Strain growth rate of strain gauge measuring points: (a) axial loading; (b) eccentric loading.
The strain growth rate reflects the rate at which strain develops during the initial stage of the experiment. Compared to later stages, the strain gauge measurements exhibit a more stable growth trend during this initial period, making the data collected during this phase more reliable. A higher strain growth rate indicates that the corresponding measurement location has a greater potential to achieve a higher ultimate strain.
It can be observed from Figure 21 that the strain growth rates measured by the strain gauges are all below 0.5 × 10⁻⁶. Within this range, there is no significant variation in strain across the different tests. This suggests that the surface strain behavior of the columns is consistent, regardless of whether they are R columns or L columns, and whether the loading is axial or eccentric. Additionally, this indicates that the external concrete contributes mechanically during the compression process, with strain gradually increasing as the load is applied.
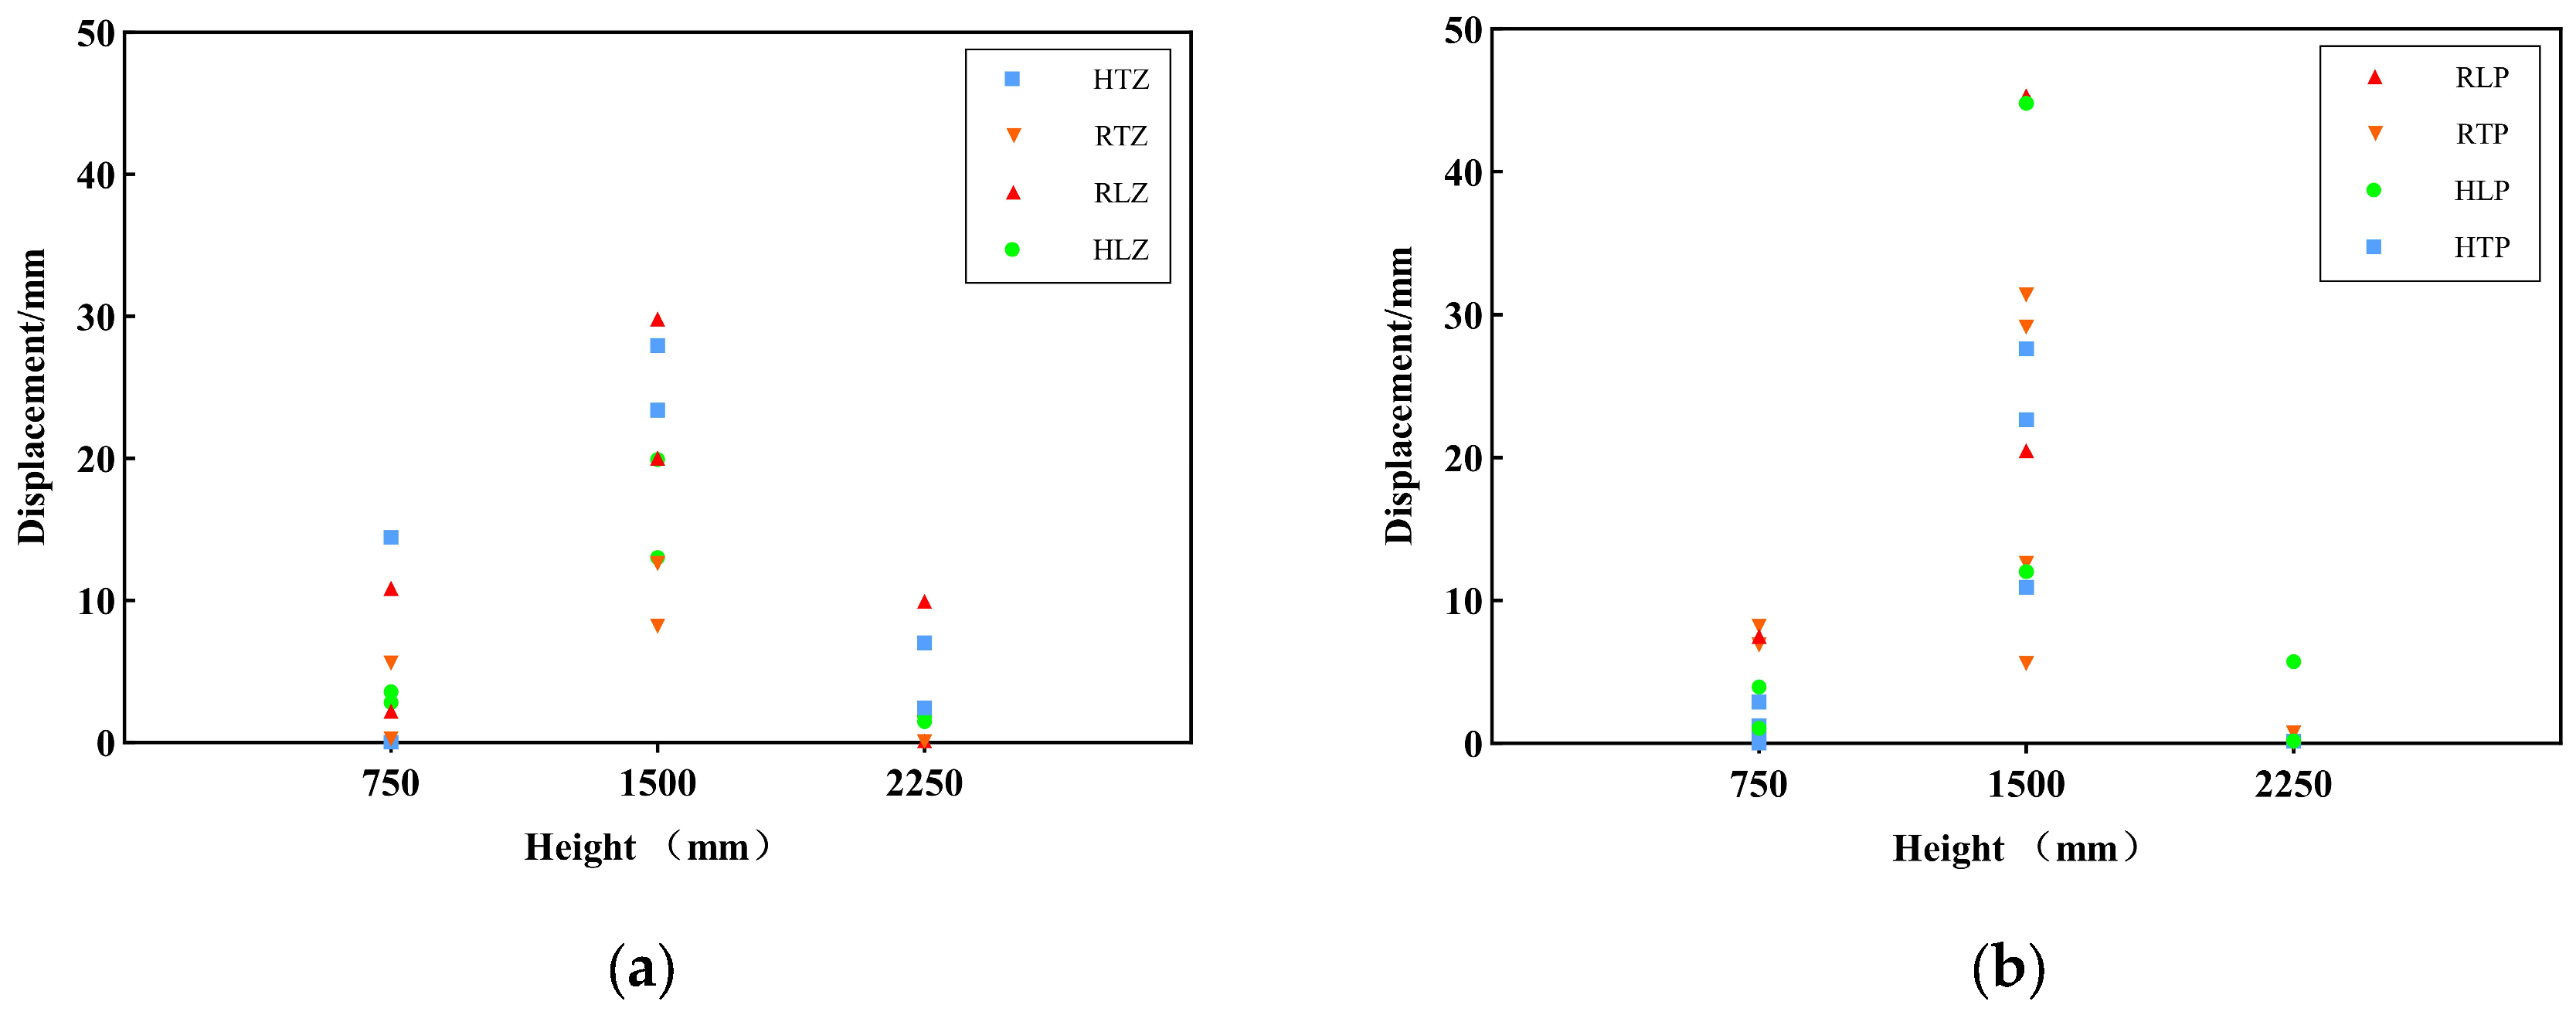
The displacement meter data were statistically analyzed and categorized into three groups—upper, middle, and lower—based on the installation positions of the displacement meters. Subsequently, line graphs were plotted, as illustrated in Figure 22, where Figure 22a corresponds to the axial compression test and Figure 22b corresponds to the eccentric compression test.
Figure 22.
Data from displacement meters: (a) axial loading; (b) eccentric loading.
4. Conclusions
This research conducted compression experiments on eight special-shaped steel-concrete composite columns under various loading conditions. The entire experimental process, including load application, displacement response, observed test phenomenon, and sensor data acquisition, was systematically recorded and analyzed. The load–displacement relationships were examined in detail. Stiffness degradation curves were derived, and the segments of these curves prior to stiffness reaching 0 were fitted using a quadratic polynomial function, yielding satisfactory fitting results. The main conclusions of this research are summarized as follows:
(1) All experimental observations indicate that cracks appeared on the outer surface of the concrete during compression. Axial compression tests primarily exhibited vertical cracks, whereas eccentric compression tests mainly showed diagonal cracks. Failure was predominantly characterized by concrete crushing.
(2) After normalized load processing, eccentricity significantly reduced the load capacity of the columns, with a more pronounced effect on T-shaped columns, which exhibited a 40.9% decrease in performance, compared to a 22.1% decrease for L-shaped columns. The R-shaped columns outperformed the H-shaped columns by 17.6%. These parameters reveal the performance differences among the special-shaped columns proposed in this paper.
(3) A quadratic function was employed to fit the stiffness degradation curves. In this model, parameter A corresponds to the initial stiffness, while parameter C, which governs the opening direction of the curve, is controlled by both the displacement at which stiffness degrades to zero and the initial stiffness. The application of this quadratic function for fitting the stiffness degradation curves resulted in minimal data dispersion and satisfactory fitting accuracy, with R2 values all approaching 1.0.
(4) A comparison with the design values calculated according to GB 50936 revealed that the code’s methodology is conservative for the R-shaped columns but unsafe for the H-shaped columns. This indicates a need for shape-specific modifications to the design codes, which represents a viable direction for future research.
Author Contributions
Conceptualization, supervision, resources, methodology, Z.W. and L.Z.; software, formal analysis, investigation, data curation, writing—original draft preparation, M.L.; validation, writing—review and editing, W.Y. All authors have read and agreed to the published version of the manuscript.
Funding
This research received no external funding.
Data Availability Statement
Data is contained within the article.
Conflicts of Interest
Author Weitong Yi was employed by the company China Institute of Building Standard Design & Research Co, Ltd. The remaining authors declare that the research was conducted in the absence of any commercial or financial relationships that could be construed as a potential conflict of interest.
References
- Hassam, M.; Guo, L.; Tahir, M. Strengthening schemes of special-shaped concrete-filled steel tubes: A review. Structures 2024, 63, 106417. [Google Scholar] [CrossRef] [Scilit]
- Liu, R.; Jiang, L.; Ye, J.; Yang, H.; Hu, Y.; Han, H. Buckling behavior and failure mechanism of cold-formed steel built-up special shape cross-section columns. Eng. Fail. Anal. 2024, 165, 108716. [Google Scholar] [CrossRef] [Scilit]
- Yang, Y.; Yang, H.; Zhang, S. Compressive behavior of T-shaped concrete filled steel tubular columns. Int. J. Steel Struct. 2010, 10, 419–430. [Google Scholar] [CrossRef] [Scilit]
- Yang, Y.; Yang, W.; Tang, X.; Cheng, Y. Seismic behavior of plane frame with special-shaped CFST columns, H-shaped steel beams and vertical rib connections. Structures 2021, 31, 721–739. [Google Scholar] [CrossRef] [Scilit]
- Jiang, Z.; Niu, Z.; Zhang, A.L.; Liu, X.C. Design method of axial compression stability for cross-section corrugated plate steel special-shaped column. Thin-Walled Struct. 2024, 194, 111243. [Google Scholar] [CrossRef] [Scilit]
- Liu, J.; Yang, Y.; Liu, J.; Zhou, X. Experimental investigation of special-shaped concrete-filled steel tubular column to steel beam connections under cyclic loading. Eng. Struct. 2017, 151, 68–84. [Google Scholar] [CrossRef] [Scilit]
- Wang, Z.; Liu, Z.; Zhou, X. Experimental investigation of special-shaped concrete-filled square steel tube composite columns with steel hoops under axial loads. Materials 2022, 15, 4179. [Google Scholar] [CrossRef] [Scilit]
- Wang, Z.; Zhou, X.; Wei, F.; Li, M. Performance of Special-Shaped Concrete-Filled Square Steel Tube Column under Axial Compression. Adv. Civ. Eng. 2020, 2020, 1763142. [Google Scholar] [CrossRef] [Scilit]
- Chen, Z.; Xu, J.; Xue, J. Hysteretic behavior of special shaped columns composed of steel and reinforced concrete (SRC). Earthq. Eng. Eng. Vib. 2015, 14, 329–345. [Google Scholar] [CrossRef] [Scilit]
- Liu, X.; Xu, C.; Liu, J.; Yang, Y. Research on special-shaped concrete-filled steel tubular columns under axial compression. J. Constr. Steel Res. 2018, 147, 203–223. [Google Scholar] [CrossRef] [Scilit]
- Zhang, W.; Li, G.; Xiong, Q.; Gui, H. Seismic behavior of wide-limb special-shaped columns composed of concrete-filled steel tubes. J. Constr. Steel Res. 2023, 205, 107887. [Google Scholar] [CrossRef] [Scilit]
- Liu, J.; Zhang, Z.Y.; Wang, Y.D.; Chen, Z.; Wang, X. Mechanical Properties of Rolled-Steel special-shaped Short Composite Columns with Different Structural Forms Under Axial Compression. Ind. Constr. 2024, 54, 87–95. (In Chinese) [Google Scholar] [CrossRef] [Scilit]
- Hu, C.; Chen, R.; Luo, Y.; Yang, P. Bearing Capacity of Multi-cell L-shaped CFST Column under Compression and Bending. Ind. Constr. 2024, 55, 155–162. (In Chinese) [Google Scholar] [CrossRef] [Scilit]
- Li, B.S.; Zhang, K.; Zhou, W.; Liang, Y.; Chen, M.; Zhao, G. Research on seismic performance of the cold-formed thin-walled steel partially encased composite with lightweight concrete cross-shaped columns. J. Southwest Jiaotong Univ. 2024, 61, 136–146. (In Chinese) [Google Scholar] [CrossRef]
- Luo, L.; Yan, Y.X.; Lv, H.; Zhang, C. Mechanical behavior of special-shaped CFT stub column under axial compression. J. Shandong Univ. (Eng. Sci.) 2024, 54, 103–114. (In Chinese) [Google Scholar] [CrossRef]
- Liu, K.; Wang, J.; Gao, S.; Xu, M. Mechanical–data-driven performance interpretation and design of concrete-filled steel tubes under lateral impact. J. Constr. Steel Res. 2026, 238, 110204. [Google Scholar] [CrossRef] [Scilit]
- Fang, Y.; Wei, C.; Geng, Y.; Shi, X.; Zhang, H.; Wang, Y. Seismic behaviour and three-dimensional modeling of coal gangue concrete-filled steel tubes under cyclic lateral loads. J. Build. Eng. 2026, 119, 115168. [Google Scholar] [CrossRef] [Scilit]
- Zhao, W.; Chen, M.; Ni, M.; Wang, M.; Wang, Y. Experimental study on bond behavior between inner steel member and concrete in steel reinforced concrete-filled steel tubes. Constr. Build. Mater. 2026, 515, 145608. [Google Scholar] [CrossRef] [Scilit]
- Zhang, T.; Zhu, R.; Gao, S. Compressive behavior of coal gangue concrete-filled steel tube in cold region towards to sustainability design. Constr. Build. Mater. 2026, 506, 145002. [Google Scholar] [CrossRef] [Scilit]
- Hay, J.; Wang, F.; Tang, J.P.; Hernández-Figueirido, D.; Pandey, M. Compressive testing of circular concrete-filled steel tubes containing demolished concrete lumps. J. Constr. Steel Res. 2026, 236, 109944. [Google Scholar] [CrossRef] [Scilit]
- Xu, J.; Zhou, T.; Chen, Z.; Zhang, Y. Axial compression behavior of square concrete-filled steel tube slender columns with concrete defects. Thin-Walled Struct. 2026, 224, 114667. [Google Scholar] [CrossRef] [Scilit]
- Lin, S.; Li, J.; Yang, D.; Zhao, Y. Semi-analytical model of axial load-bearing capacity of circular defective concrete-filled steel tube columns considering local buckling. Eng. Struct. 2026, 346, 121693. [Google Scholar] [CrossRef] [Scilit]
- Tang, H.; Huang, Y.; Liu, J.; Huang, J.; Wei, Y. Eccentric compression performance of a novel preplaced aggregate concrete-filled steel tube. Structures 2026, 86, 111290. [Google Scholar] [CrossRef] [Scilit]
- Tang, H.; Huang, Y.; Huang, J.; Hong, D.; Wei, Y. Study on the mechanical behavior of preplaced aggregate concrete-filled steel tube columns. J. Constr. Steel Res. 2026, 237, 110122. [Google Scholar] [CrossRef] [Scilit]
- Zhang, Y.; Gan, D.; Jiao, J.; Tang, Z.; Liu, Y. Investigation on Shear Behavior of Longitudinal-plate Shear Connector in Concrete-filled Steel Tube. Thin-Walled Struct. 2026, 224, 114672. [Google Scholar] [CrossRef] [Scilit]
- Xie, K.; Huang, K.; Liang, D.; Huang, L.; Wang, Q. Axial compressive damage and failure early warning method of concrete-filled steel tube with defects based on acoustic emission. Structures 2026, 86, 111411. [Google Scholar] [CrossRef] [Scilit]
- Di Benedetto, S.; Rizzano, M.; Avagliano, C.; Arcione, F.; Rizzano, G. Bond behaviour between concrete-filled steel tubes and reinforced concrete plinths. Procedia Struct. Integr. 2026, 78, 1697–1704. [Google Scholar] [CrossRef] [Scilit]
- Zhong, Z.; Guo, Q.; Shen, J.; Zhao, M.; Du, X. Seismic performance evaluation of subway station structures with concrete-filled-steel-tube columns. Bull. Earthq. Eng. 2026, 24, 1–27. [Google Scholar] [CrossRef] [Scilit]
- Chen, X.; Zhao, M.; Geng, Y.; Yang, H. Post-creep buckling load resistance of recycled aggregate concrete-filled steel tubes: Numerical modelling and calculation method. Structures 2026, 85, 111187. [Google Scholar] [CrossRef] [Scilit]
- Shen, J.; Yu, T.; Wang, Y.; Yu, D.; Long, Y. Experimental study on axial compression performance of CFRP-strengthened concrete-filled steel tube composite columns after high-temperature exposure. Structures 2026, 86, 111468. [Google Scholar] [CrossRef] [Scilit]
- Liu, M.; Yuan, Z.Q.; Gao, S.; Wang, J.-L.; Liu, S. Mechanical behavior of locally corroded circular concrete-filled steel tubular stubs under local compression. Structures 2026, 84, 111043. [Google Scholar] [CrossRef] [Scilit]
- Liu, J.; Liu, Y.; Liu, X.; Zhang, C.; Ye, Y.; Shaban, W.M. Axial compressive behavior and constitutive model of stone under dual-composite confinement by concrete-filled steel tube. Structures 2026, 84, 111067. [Google Scholar] [CrossRef] [Scilit]
- Feng, S.; Pan, J.; Guan, D.; Guo, Z.; Wang, Z. Seismic performance of post-fire assembled exterior joints formed between H-steel precast concrete beams and concrete-encased concrete-filled steel tube columns. Eng. Struct. 2026, 350, 121942. [Google Scholar] [CrossRef] [Scilit]
- Yu, W.; Liu, J.; Wang, W.; Cao, G.; Yang, Y.; Pan, Z. Seismic performance and prediction resilience of multi-cavity rectangular concrete-filled steel tube columns. J. Constr. Steel Res. 2026, 239, 110227. [Google Scholar] [CrossRef] [Scilit]
- GB/T 50107-2010; Standard for Evaluation of Concrete Compressive Strength. China Architecture & Building Press: Beijing, China, 2010. (In Chinese)
- GB 50010-2010; Code for Design of Concrete Structures. China Architecture & Building Press: Beijing, China, 2010. (In Chinese)
- GB/T 50152-2012; Standard for Experiment Method of Concrete Structures. China Architecture & Building Press: Beijing, China, 2012. (In Chinese)
- Chen, H.; Zhao, Y.; Zhang, H.; Zhao, Z.; Zhou, Z. Study on bidirectional eccentric compression performance of L-shaped built-in concrete-filled steel tubular special-shaped columns after fire. J. Build. Struct. 2025, 46, 124–132. [Google Scholar] [CrossRef]
- GB 50936-2014; Technical Code for Concrete Filled Steel Tubular Structures. China Architecture & Building Press: Beijing, China, 2014. (In Chinese)

Disclaimer/Publisher’s Note: The statements, opinions and data contained in all publications are solely those of the individual author(s) and contributor(s) and not of MDPI and/or the editor(s). MDPI and/or the editor(s) disclaim responsibility for any injury to people or property resulting from any ideas, methods, instructions or products referred to in the content. |
© 2026 by the authors. Licensee MDPI, Basel, Switzerland. This article is an open access article distributed under the terms and conditions of the Creative Commons Attribution (CC BY) license.