1. Introduction
Natural ventilation has been established as one of the most efficient passive methods for the lowering of operational energy consumption for residential and non-residential buildings [
1,
2,
3]. It is an important component of sustainable building design schemes for its capability to reduce mechanical cooling loads and lower carbon emissions, as well as to increase thermal heat comfort in differing climate zones. Its significance is intensified for people living in residential buildings who spend almost 90% of their time within the home environment and are constantly exposed to the indoor physical environment, which is closely related to the physical health, cognitive performance and overall well-being of people [
2,
4]. Low-rise buildings as a housing typology are frequent in developing areas where ventilation strategies are not properly structured. Overheating, uneven physical distribution of airflow, air pollutants, humidity, and poor indoor air quality are prevalent in these buildings [
2,
5]. But when natural ventilation is not sufficient, stagnant air pockets develop, contributing to the buildup of CO
2 as well as increased humidity and concentrations of indoor pollutants. Therefore, occupants are forced to depend on energy-consuming mechanical cooling systems, compromising environmental sustainability and building energy performance objectives [
3,
6]. While the importance of natural ventilation is obvious, predicting airflow patterns accurately during the architectural phase of the building is a daunting technical task [
7]. Computational Fluid Dynamics (CFD) has been used as the gold standard for airflow behavior evaluation throughout history. An important application of CFD is to extract detailed, high-dimensional aerodynamic features, such as velocity profiles, turbulence distributions, pressure fields, and cross-ventilation performance, in complex indoor and outdoor environments [
1,
3,
8]. But this benefit comes at a cost. CFD estimation demands big datasets: façade pressure coefficients, exact boundary conditions, material properties, heat load data, meshed data, and weather data. It is a computationally intensive process and is often time-consuming in terms of simulation time, high-performance computing resources and sophisticated technical expertise. In addition, CFD’s dependence on input assumption sensitivity can lead to uncertainty in early-stage prediction, as we do not have an appropriate sample of dependable data [
8,
9]. Therefore, CFD is usually an ineffective method during relatively fast and iterative design, where architects need to simulate multiple spatial configurations or opening strategies in a short period of time. The constraints of CFD also result in ongoing methodological dissonance between the information needed to design a successful natural ventilation system versus the available tools for early architectural decision making. Many architects are working in small-scale or low-budget environments and thus do not have easy access to special simulation tools. This disconnect can cause ventilation performance to be tackled too late in the design process, when major spatial decisions are too static and expensive to fix. The absence of practical tools available for ventilation evaluation drives the continued construction of low-rise houses which are poorly ventilated, thereby relying on intuition as opposed to an analysis of the performance of the building design. A promising solution to this is Building Information Modeling (BIM). BIM has revolutionized buildings design and building documentation with a single digital world in which geometric correctness, semantic depth, materials definitions, zoning, and multidiscipline interdependencies are amalgamated [
5,
10]. During the last decade, BIM has been extensively adopted to performance applications such as thermal simulation, energy modeling, daylight analysis, and building code compliance applications [
6,
10,
11]. However, ventilation analysis is a weak component of BIM-based research relative to other environmental performance-based workflows. This gap emerges in part because ventilation is mainly thought of in the context of its dynamic airflow behavior, while BIM is often found in static geometry. But this view ignores BIM’s inherent potential. BIM models include a variety of ventilation-related features, including: opening dimensions, façade porosity, room volumes, connectivity and adjacent relationships, orientation and exposure, and features of the building envelope. The above features have a direct impact on airflow potential, which may serve as the base for a non-CFD-based geometric, data-light ventilation assessment method. This makes the use of spatial information derived through BIM to evaluate ventilation at early stages an ideal opportunity to democratize ventilation analysis among practitioners who cannot utilize simulation-heavy tools. The performance of natural ventilation is determined by spatial behavior at three interdependent scales:
Micro-level: room dimensions, opening sizes and opening-to-volume ratios, and inlet–outlet partition distances. Meso-scale: internal connection, passing paths, location of the door, and ventilation of space. Macro-scale: global perspective, façade in the presence of prevailing winds, and the shape of the envelope. Although these scales have been studied individually, a unified analytical method to combine them systematically into a single workflow and for early-stage design purposes is currently needed [
5,
12,
13]. Most existing BIM studies on ventilation refer to surrogate metrics (i.e., window-to-wall ratios or the general porosity factors), which cannot represent the multifactor interactions controlling airflow. This research gap is important as it requires a scalable, BIM-supported, and multi-scale method for ventilation assessment that is computationally feasible, reproducible, and applicable to conceptual and schematic design phases. To bridge this methodological and computational gulf, this paper proposes a Multi-Scale BIM-Driven Framework for Predictive Ventilation Opportunity Mapping (PVOM) based on low-rise residential buildings. The framework employs BIM-derived geometries complemented with structured ventilation morphometrics to assess airflow pathways, stagnation risks, and ventilation possibilities without dependency on CFD simulations. We use two residential cases that illustrate the effects of space differences on ventilation opportunity distribution and focus on how spatial adjustments can increase the natural ventilation value.
The early-stage methods of ventilation assessment generally fall into four categories: (i) rule-based checks using window-to-wall ratios or façade porosity thresholds; (ii) simplified geometric proxies such as opening-to-volume ratios; (iii) BIM-enabled data extraction workflows linked to external simulation engines; and (iv) connectivity or topology-based airflow routing models. Although these methods offer rapid screening, they disregard multi-scale spatial interactions or rely on external solvers. Our PVOM framework is new, as it combines room geometry, layout connectivity, and envelope exposure into a single integrated BIM-native opportunity mapping workflow that does not rely on CFD or climate-specific simulation inputs.
1.1. Computational Novelty and Research Contributions
In three important ways, this work represents novel advances to natural ventilation modeling. First, it describes a computationally efficient, multi-scale ventilation morphometrics system, which is a cost-effective approach to assess airflow through BIM geometry-derived indices, without the use of CFD [
5,
9,
12]. Second, it is the formalization of Predictive Ventilation Opportunity Mapping (PVOM)—a novel workflow with the integration of ventilation heatmaps, inlet–outlet feasibility matrices, and airflow pathway prediction into a single platform to support design decisions [
6,
10,
12]. Third, it suggests a geometry-based optimization method to detect and assess structural alterations designed to maximize natural ventilation behavior. The approach is demonstrated in a comparison between two case study dwellings to demonstrate the conceptual application to practical residential design. Collectively they provide an experimental base towards a new computational approach in BIM-based ventilation analysis that can serve as a bridge between high-fidelity CFD simulations and preliminary design considerations, and provide practitioners with a practical, “and provide a practical approach that requires minimal input data to achieve this goal.
The present study is positioned as an exploratory methodological contribution focused on early-stage geometric screening rather than confirmatory airflow simulation. Its purpose is to support conceptual decision making under limited data conditions, not to replicate physically resolved ventilation modeling.
1.2. Research Aim and Questions
This study mainly aims to propose and present a BIM, geometry-driven model to analyze and optimize natural ventilation opportunities for low-rise residential buildings during their initial design without requiring computationally expensive CFD simulations. We do not plan and model detailed airflow fields, but determine relative ventilation opportunities, airflow pathways, and stagnation risks defined from spatial geometry, connectivity, and envelope exposure, which is obtained through direct application to a BIM model. We hope to answer the following research questions to achieve such an aim:
(RQ1) Can natural ventilation opportunity be assessed based upon design geometric and topological indicators derived through BIM without CFD simulation?
(RQ2) How do we systematize micro-scale (room-level), meso-scale (layout-level), and macro-scale (envelope-level) spatial factors across the different ventilation assessment frameworks?
(RQ3) Can PVOM reliably identify ventilation strengths, airflow pathways, and stagnation-prone zones in low-rise residential buildings?
(RQ4) Can PVOM aid ventilation-oriented design optimization by providing guidance for geometric changes early in design?
In this way, this study addresses these questions so as to develop a reproducible, BIM-native methodology that can support ventilation-aware architectural decision making before the development of detailed environmental simulations.
Three main points are reported in this study. First, it defines a multi-scale BIM-derived indicator system composed of the air change potential (ACH-P), connectivity value score (CVS), and surface area contribution (SAC). Second, it formalizes a reproducible five-step PVOM workflow that generates ventilation opportunity maps and pathway diagnostics directly from BIM geometry. Third, it shows how these outputs support early-stage design decisions, including the repositioning of an opening, resizing, and envelope porosity adjustments. PVOM functions as a rapid, geometry-based ventilation opportunity screening tool rather than a substitute for detailed CFD simulation.
3. Materials and Methods
To achieve complete methodological transparency and reproducibility, this section explicitly defines all required BIM-derived input data, the computational steps used to calculate ventilation performance indicators, and the normalization procedures applied to enable comparative evaluation. All performance metrics are based on the deterministic derivation of geometric and topological information extracted from BIM models developed at Level of Development (LOD) 300. By following the step-by-step procedures described in
Section 3.1.2 and
Section 3.1.3, readers can reproduce the reported ventilation opportunity results for the case study buildings using the same input data and equations, without reliance on Computational Fluid Dynamics (CFD) simulations or external performance engines.
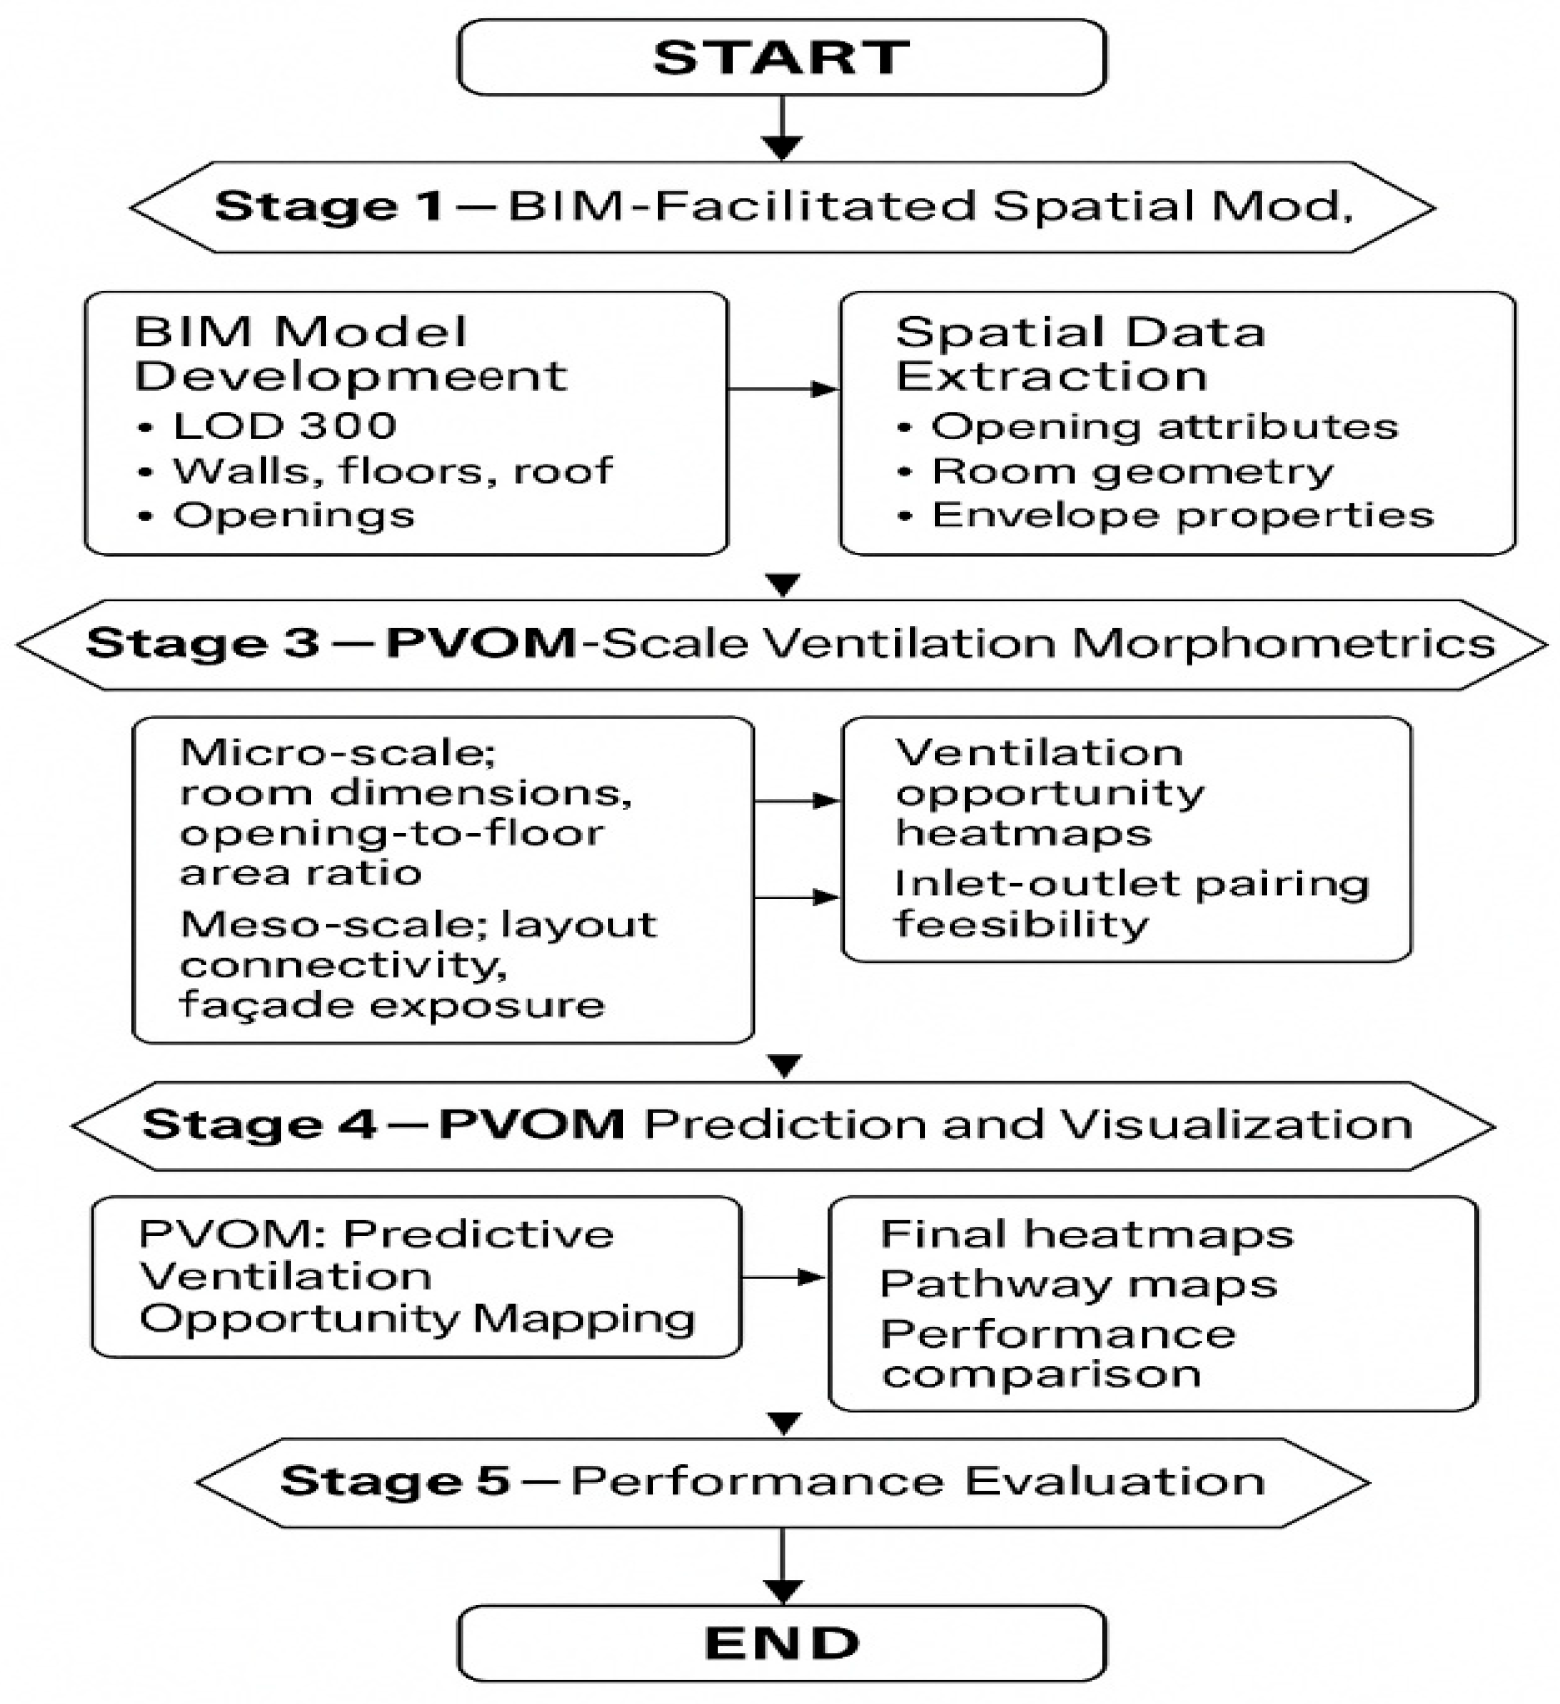
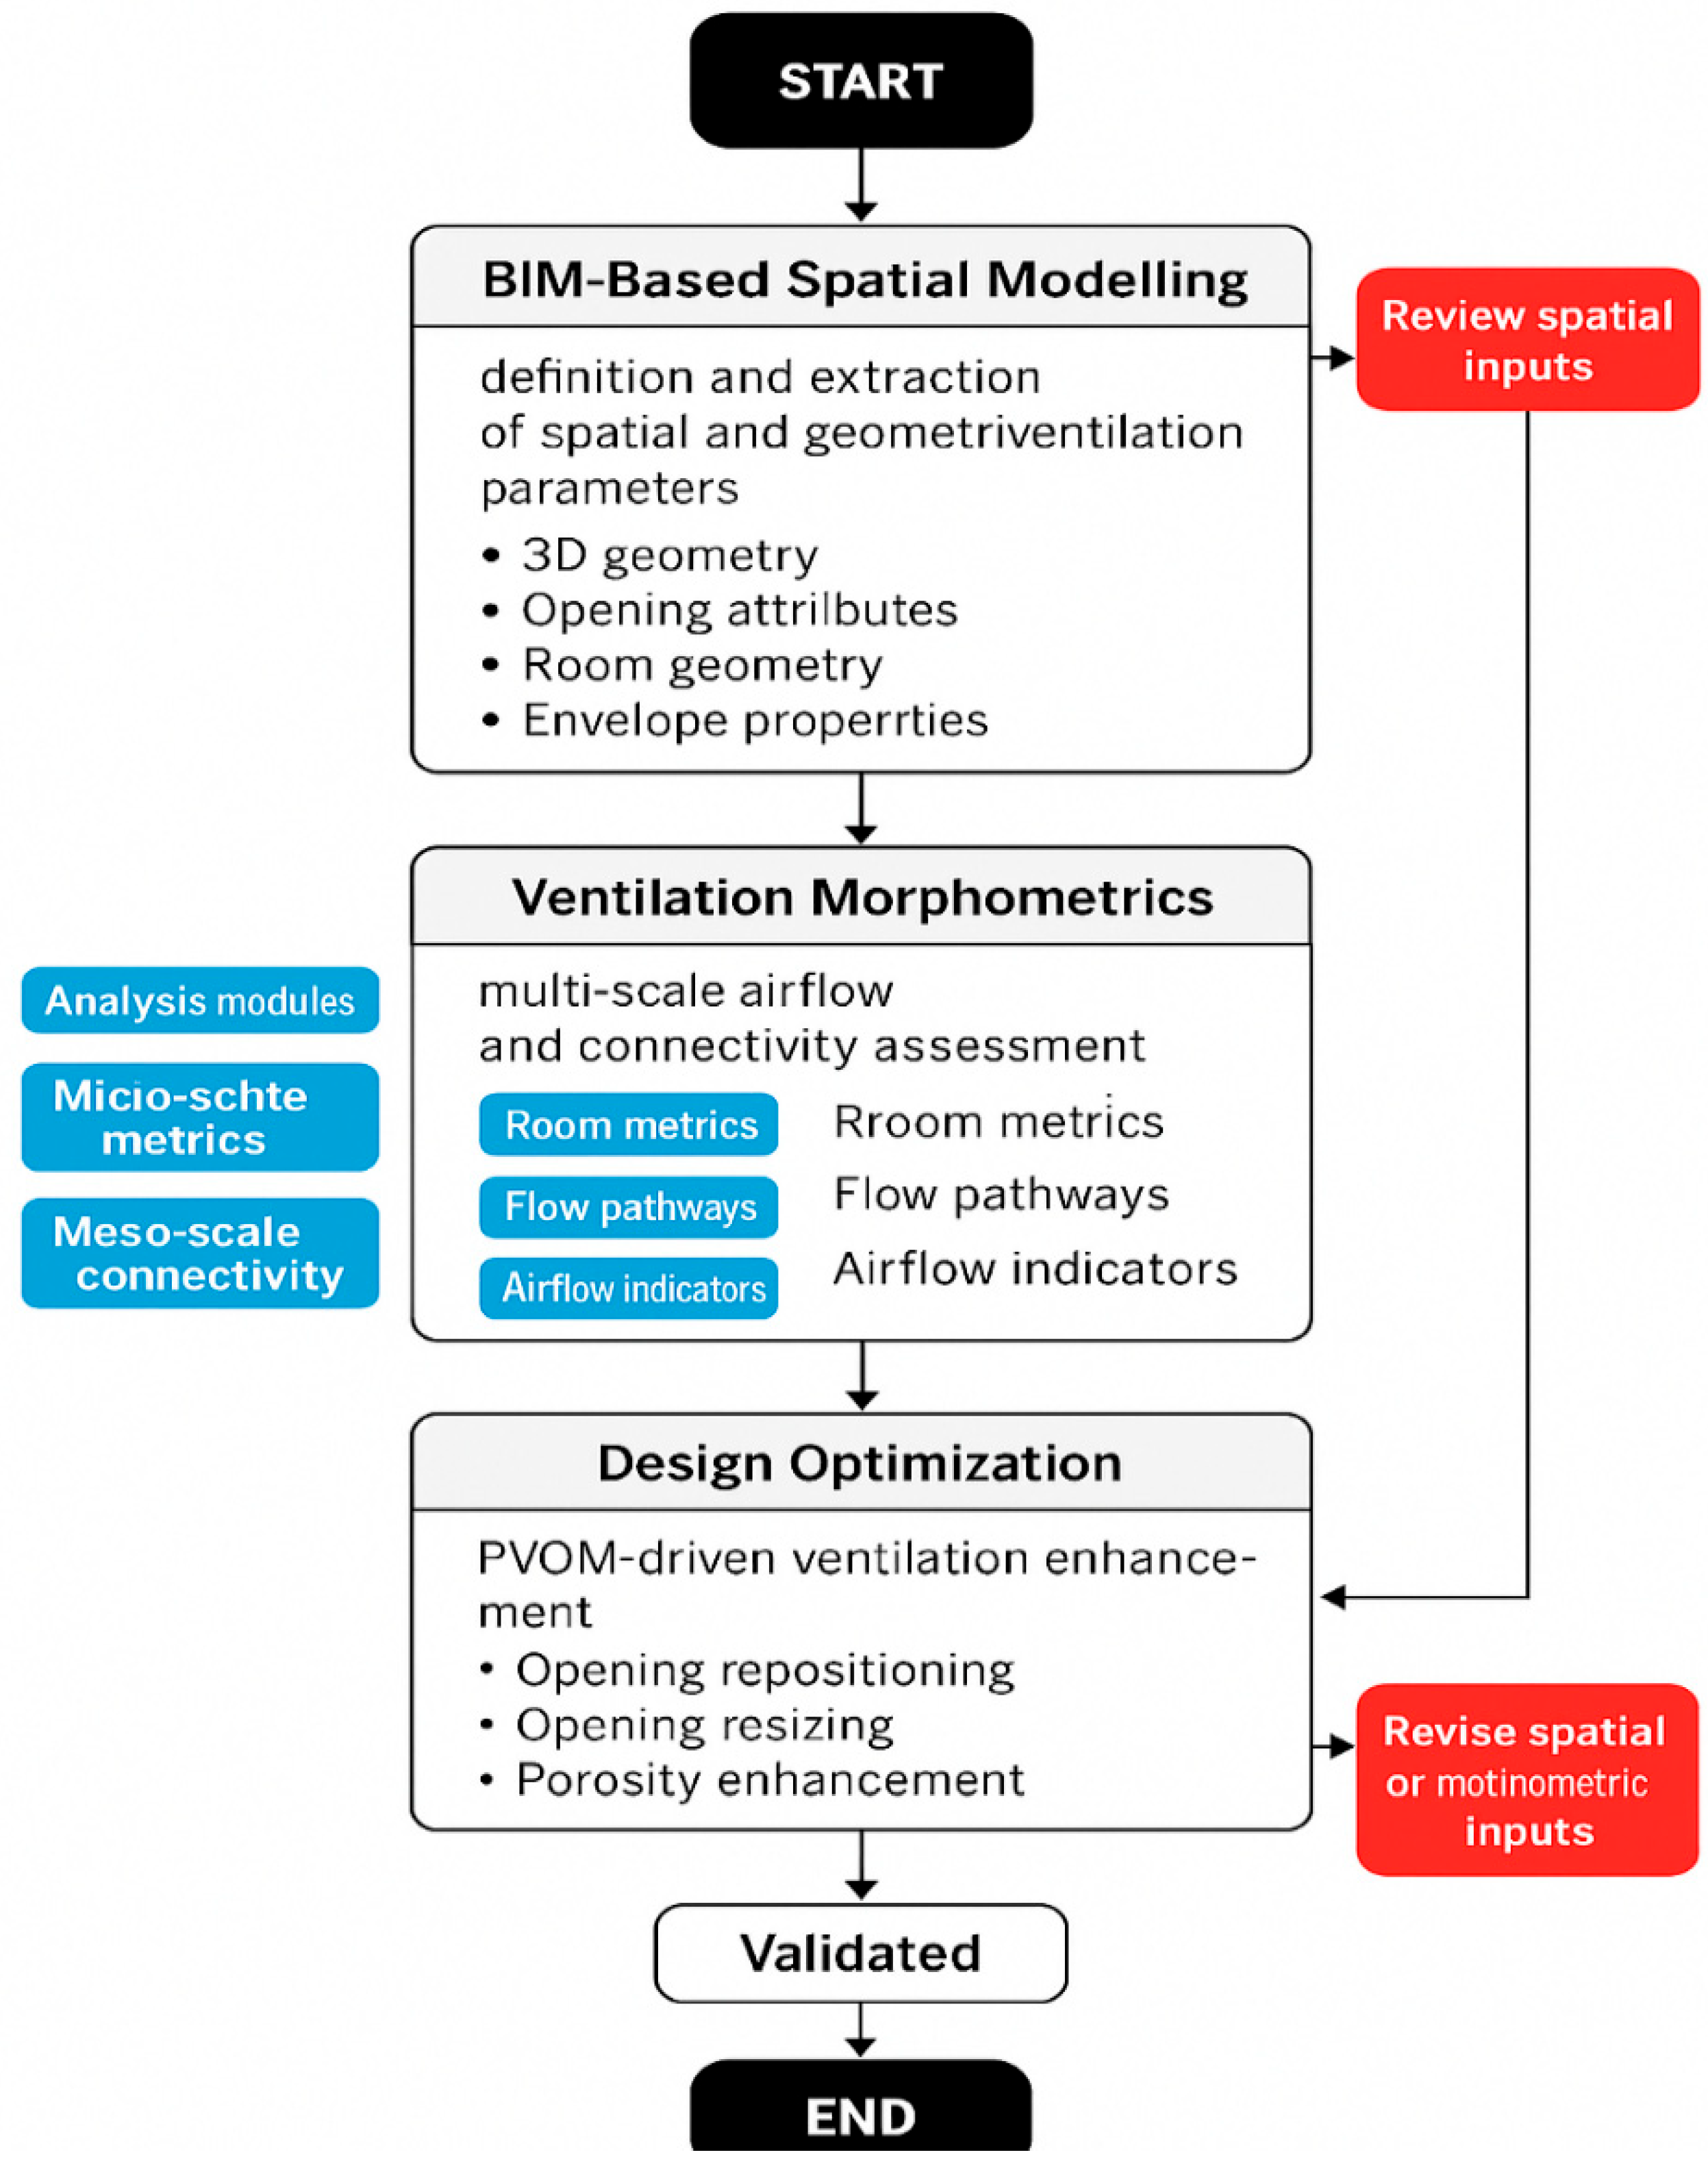
This section covers the complete methodological framework for the mapping and optimization of natural ventilation performance in low-rise residential buildings. Combining Building Information Modeling (BIM), multi-scale ventilation morphometrics, and Predictive Ventilation Opportunity Mapping (PVOM), it predicts ventilation potential directly through geometry, avoiding time-intensive Computational Fluid Dynamics (CFD) simulations during the early design stages. This system allows for the quantitative analysis of the current ventilation environment and iterative optimization of openings, spatial organization, and envelope properties to improve passive airflow conditions. The approach includes five sequential stages (
Figure 1):
Development of spatial model with BIM support (LOD 300);
Spatial segmentation and connectivity graph generation.
Multi-scale ventilation morphometrics evaluation.
Predictive Ventilation Opportunity Mapping (PVOM) and visualization.
Performance evaluation and iterative geometric optimization.
The approach in this section converts geometric BIM data into actionable performance intelligence, which can provide evidence-based design decisions in low-rise sustainable residential buildings.
3.1. Research Framework
Based on its application in the environment, the research framework demonstrates a structured, performance-oriented approach of converting geometric BIM data into analytical information regarding ventilation parameters. It is built on the assumption that the spatial features of an environment, its dimensions of openings, spatial form, connectivity, and envelope exposure impact passive airflow possibilities even when simulations have not been performed in full. The work is based on the generation of a high-fidelity BIM model with a geometric foundation. This model is then subjected to multi-scale morphometric analysis to quantify ventilation-based indicators at micro-, meso-, and macro-scales. These metrics are implemented in the Predictive Ventilation Opportunity Mapping (PVOM) component, a specific analytical layer which assesses ventilation potential based on heatmaps, path detection, and inlet–outlet feasibility scoring. After diagnosis, the framework adopts a design optimization phase in which geometric changes are suggested, after which the architecture is re-assessed. This culminates in an evaluation of the performance of the baseline versus optimized settings. This cycle in process guarantees that design decisions are evidence-based and spatially attuned.
3.1.1. Conceptual Basis and Physical Interpretation of Predictive Ventilation Opportunity Mapping (PVOM)
Visual-based analysis is conducted using Predictive Ventilation Opportunity Mapping (PVOM) geometry to evaluate the relative ventilation opportunity (RVO) in the built environment. This is performed to control the relative opportunities for natural ventilation in architecture design phase using BIM-based spatial information. PVOM does not supersede CFD or address the governing Navier–Stokes equations for airflow. Instead, it operates as a proxy-based technique which calculates the spatial feasibility and impact of natural ventilation until specific boundary conditions are established. PVOM’s physical base is established by the existing fundamentals of ventilation, such as airflow continuity, pressure-driven flow potential, opening area, volume and spatial connectivity. Classical ventilation theory illustrates that natural airflow is significantly affected by the presence and position of inlets/outlets, the continuity of the air paths, enclosures, and exposure of interior spaces. PVOM takes these principles and converts them into measurable geometrical parameters, and its outputs come directly from BIM (Building Information Modeling) models. In particular, PVOM is predicated on the assumption that, under favorable environmental conditions, spaces which have larger effective opening areas per volume, greater inlet–outlet separation, stronger spatial connectivity and greater envelope exposure have the potential for more ventilation. In contrast, deep-plan spaces with fewer space openings and poor connectivity are more likely to stagnate the airflow. PVOM measurements then measure ventilation opportunity and not actual airflow. The results are dimensionless, normalized measures that allow for the comparison of spaces and design alternatives and the optimization cases for the same project setting. This enables PVOM to be computationally lightweight when climate information, wind conditions, and operational parameters are not yet available. Therefore, PVOM should be considered an early-stage decision-support tool, determining where ventilation is expected to be effective or constrained according to spatial configurations so to provide ventilatory capacity and a prediction exercise rather than act as a predictive airflow simulation methodology.
The proposed Predictive Ventilation Opportunity Mapping (PVOM) framework is implemented as a structured, step-by-step workflow that meets the criteria for the transparency and reproducibility of methodology and can be implemented in standard BIM tools without utilizing Computational Fluid Dynamics (CFD). It is important to emphasize that PVOM does not calculate absolute airflow rates, air change per hour (ACH), or direct comfort outcomes. Instead, it evaluates relative ventilation opportunity based on spatial configuration. The framework is intended as an early-stage screening and comparative decision-support tool, and not as a replacement for CFD simulations or climate-specific performance modeling.
3.1.2. PVOM Methodological Workflow
A detailed building BIM model is developed at Level of Development (LOD) 300. It includes walls, floors, roofs, internal partitions, rooms, and all operable openings such as windows and doors. Room boundaries, volumes, and façade orientations are verified for geometric consistency.
Ventilation-relevant geometric information is extracted directly from the BIM model. This includes opening attributes, room geometry, spatial adjacencies, and envelope properties that influence airflow opportunity.
Based on the extracted spatial data, multi-scale ventilation morphometrics are used to analyze the collected observations. Micro-scale indicators describe room-level characteristics such as room dimensions and opening configurations; meso-scale indicators capture layout connectivity, façade exposure, and internal airflow routing potential.
PVOM is applied to generate ventilation opportunity heatmaps, assess inlet–outlet pairing feasibility, and represent potential airflow pathways based on the evaluated morphometric indicators. These outputs identify zones of high ventilation opportunity and areas prone to stagnation.
PVOM indicators are utilized to compare baseline and modified design scenarios to assess relative ventilation opportunity. Where applicable, geometric modifications such as opening repositioning or resizing are applied and the workflow is repeated to quantify performance improvement.
This step-by-step workflow ensures that the PVOM framework can be consistently applied and reproduced for comparative ventilation assessment during early-stage design.
3.1.3. Data Inputs, Metric Computation, and Reproducibility Protocol
To ensure methodological transparency and reproducibility, this subsection explicitly defines the data inputs, computational procedures, and normalization steps required to replicate the Predictive Ventilation Opportunity Mapping (PVOM) framework. All calculations are deterministic and rely solely on geometric and topological information extracted from BIM models developed at Level of Development (LOD) 300, without the use of Computational Fluid Dynamics (CFD) or external simulation tools.
- (a)
BIM-Derived Input Parameters
All required input parameters are extracted directly from the BIM model and grouped into room-level geometry, opening characteristics, spatial connectivity, and envelope exposure. These parameters constitute the complete dataset required to reproduce the PVOM metrics.
- (b)
Performance Metric Computation
Ventilation opportunity is quantified using three geometry-based, dimensionless indicators: air change potential (ACH-P), connectivity value score (CVS), and surface area contribution (SAC). These indicators assess relative ventilation opportunities rather than predicting absolute airflow rates.
This represents the relative capacity for air renewal within a room as a function of operable opening area, room volume, and inlet–outlet feasibility:
where
is the total operable opening area of room i, Vi is the room volume, and
is the inlet–outlet feasibility factor (dimensionless, 0–1). In this study,
was discretized as 1.0 for cross-ventilated spaces (openings on opposing façades), 0.5 for single-façade ventilation, and 0.2 for rooms without direct exterior openings. These feasibility factors are defined as relative ordinal weighting coefficients rather than physically calibrated airflow multipliers. They reflect the established hierarchy of ventilation effectiveness, where cross-ventilation typically provides substantially higher airflow potential than single-sided ventilation, while interior rooms without direct openings exhibit limited renewal capacity. To evaluate robustness, the factors were varied within ±20% of their baseline values; room rankings and optimization trends remained unchanged, indicating stability of conclusions.
The connectivity value score (CVS) quantifies the effectiveness of internal airflow routing by evaluating spatial connectivity and path continuity:
where
is the number of airflow paths connecting room
to exterior openings,
is the maximum connectivity observed within the building, and
is a path continuity penalty factor (0–1) that accounts for internal partitions, doors, and circulation resistance.
Surface area contribution (SAC) measures the relative contribution of envelope exposure to ventilation opportunity:
where
is the façade-adjacent surface area associated with room
and
is the total envelope surface area of the building.
- (c)
Normalization and Comparative Evaluation
To allow for direct comparison between rooms within the same design scenario, all performance indicators are normalized using min–max normalization:
where
is the raw metric value for room
, and
and
represent the minimum and maximum values of the metric across all rooms in the building. Normalized values form the basis for PVOM heatmaps, inlet–outlet feasibility matrices, and comparative optimization analysis.
All PVOM indicators are normalized using min–max scaling within each building dataset, resulting in dimensionless values bounded between 0 and 1. Consequently, PVOM scores allow for direct comparison of rooms within the same building. Cross-building comparisons are meaningful only after normalization within each respective building; therefore, PVOM values should be interpreted as relative performance indicators rather than universal ventilation metrics.
- (d)
Reproducibility Procedure
The PVOM framework can be reproduced by following the steps below:
Develop a BIM model at LOD 300 with defined rooms, operable openings, and envelope geometry.
Extract the input parameters listed in
Table 1.
Compute ACH-P, CVS, and SAC using Equations (1)–(3).
Normalize all metrics using Equation (4).
Visualize and compare ventilation opportunities across rooms and design alternatives.
Table 1.
Summary of the input variables used in this study.
Table 1.
Summary of the input variables used in this study.
| Category | Parameter | Symbol | Unit | BIM Source |
|---|
| Room geometry | Room volume | | m3 | Room properties |
| Room geometry | Floor area | | m2 | Room boundaries |
| Openings | Total operable opening area | | m2 | Window and door families |
| Openings | Number of operable openings | | – | Façade elements |
| Layout | Inlet–outlet separation distance | | M | Opening centroids |
| Connectivity | Number of connected airflow paths | | – | Room adjacency graph |
| Envelope | Façade-adjacent surface area | | m2 | External walls |
| Envelope | Total envelope surface area | | m2 | Building shell |
This deterministic workflow ensures that identical BIM-derived inputs will produce identical PVOM outputs, enabling reproducible early-stage ventilation assessment without CFD.
Using identical BIM-derived geometric inputs and the equations defined in this section will result in identical ACH-P, connectivity value score (CVS), and surface area contribution (SAC) values, ensuring full reproducibility of the PVOM outputs reported in this study.
The PVOM workflow is implemented as follows:
Extract rooms and operable exterior openings from the BIM model (LOD 300). Classify each room as cross-ventilated, single-sided, or internal based on façade opening distribution.
Compute ACH-P from the opening-to-volume ratio and feasibility factor. Generate a spatial connectivity graph from room adjacencies and calculate airflow paths to exterior openings. Apply path continuity penalties to obtain CVS. Compute SAC from façade exposure ratios. Normalize all indicators (0–1) and generate room-level PVOM scores and maps. This approach supports reproducible, geometry-based ventilation opportunity assessment without external simulation engines.
3.1.4. Sensitivity and Robustness Analysis
To assess the robustness of the PVOM framework, a sensitivity analysis was conducted on 3 parameters: (i) inlet–outlet feasibility factors in ACH-P, (ii) opening area influence in the ACH-P formulation, and (iii) path continuity penalties for CVS. Each parameter ranged ±20% while maintaining constant building geometry. Results demonstrate moderate change in the absolute PVOM but not much difference in room rank in relative order of importance or relative improvement over baseline and optimized cases. Rooms with a high opportunity (or stagnation-prone) status when measured from the baseline condition were held throughout the variation tests. The results demonstrate that the output of PVOMs remain structurally invariant if perturbations of parameters are reasonable, and suggest that PVOM has applicability as an early-stage screening instrument of ventilation.
3.2. Stage 3: Multi-Scale Ventilation Morphometrics
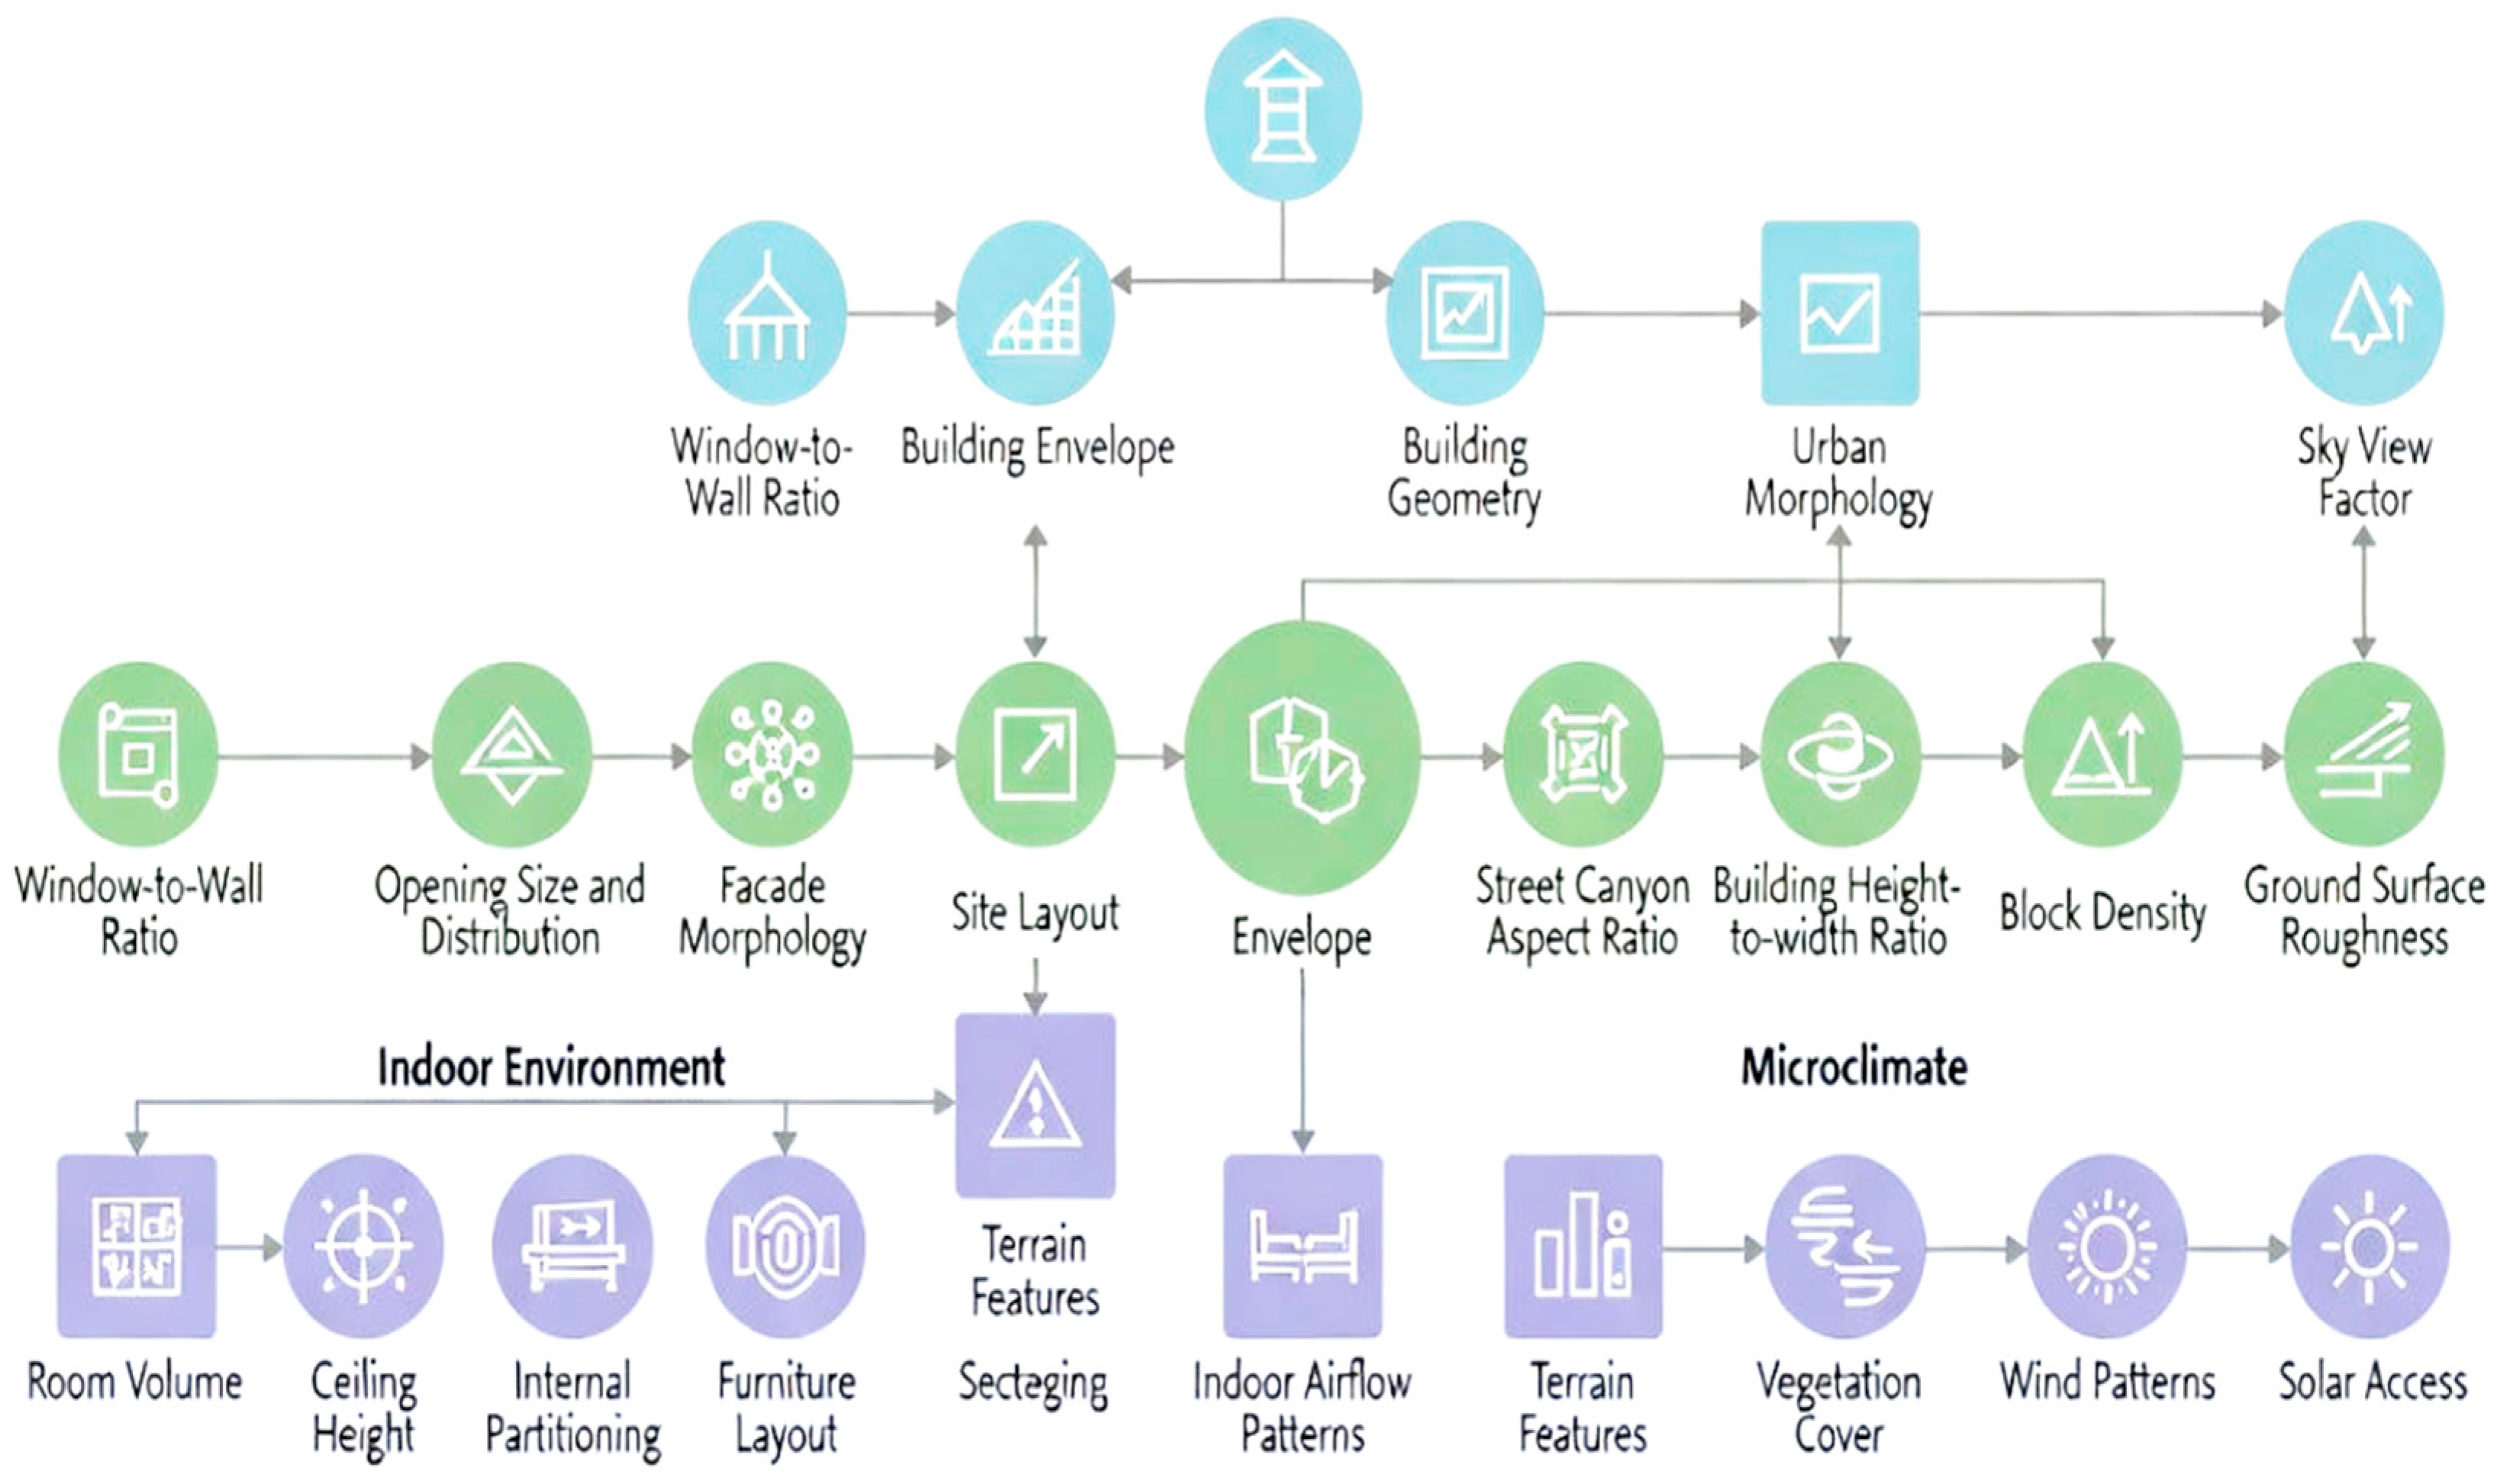
The BIM models are converted to a list of multi-scale ventilation morphometrics that quantify how spatial forms limit or support natural airflow in Stage 3. Twenty-three indicators are calculated, which are grouped into three interconnected areas: indoor environment, building envelope, and microclimate. Indoor environmental metrics relate to the dimensions of the room, including the volume, ceiling height, internal division, and furniture arrangement, that affect local ventilation. At the envelope level, indicators record opening size, distribution, window-to-wall ratio, façade morphology, and site layout, with the urban form indices including the street canyon aspect ratio, building height-to-width ratio, block density, and ground surface roughness. The microclimatic markers refer to terrain features, vegetation cover, wind patterns, and solar access factors controlling the driving forces around the building for natural ventilation. The composition of this multi-scale morphometric system and the relationships between room geometries, envelope arrangements, and local microclimate are displayed in
Figure 2.
Figure 2: Schematic of the multi-scale ventilation morphometrics used in Stage 3. It organizes the twenty-three geometrical/environmental indicators into three interrelated domains: the indoor environment (room volume, ceiling height, internal partitioning, and furniture layout), envelope (window-to-wall ratio, opening size and distribution, façade morphology, site layout, street-canyon aspect ratio, building height-to-width ratio, block density, and ground surface roughness), and microclimate (terrain features, vegetation cover, wind patterns, and solar access). Combined, these indicators capture how room-level geometry, building and urban forms, and local climatic modifiers interact to form natural ventilation opportunities at micro-, meso- and macro-scales.
3.3. Case Study Buildings
To validate the methodological framework across different geometric forms, two contrasting low-rise residential buildings were selected. This dual-case approach allows us to assess comparative performance and can also verify the responsiveness of PVOM and morphometric indicators to distinguish spatial layouts. This paper adopts the case study of two low-rise residential buildings to justify the suggested multi-scale BIM-driven solution of the Predictive Ventilation Opportunity Mapping (PVOM). Low-rise buildings were chosen in the study, as they commonly rely on natural ventilation, whereas smaller structures with manageable spatial patterns and BIM-based geometric analysis and airflow pathway prediction were included. Building A is an author-designed residential model created using Revit 2025, where the spatial geometry, room composition, and opening position can be fully controlled. This sets a consistent baseline for applying the PVOM workflow and extracting spatial morphometrics. Building B, by contrast, is a publicly documented two-bedroom dwelling that shows a practical low-rise layout with varying room organization, window placement, and internal connectivity selected in the design. Its geometry causes natural differences that contribute to testing the response of the PVOM framework to different spatial conditions. By focusing on one controlled model and one real-world documented layout, the method is analyzed at different spatial levels of complexity. This strategy ensures the reliability, applicability and generalizability of the PVOM framework for low-rise sustainable residential buildings.
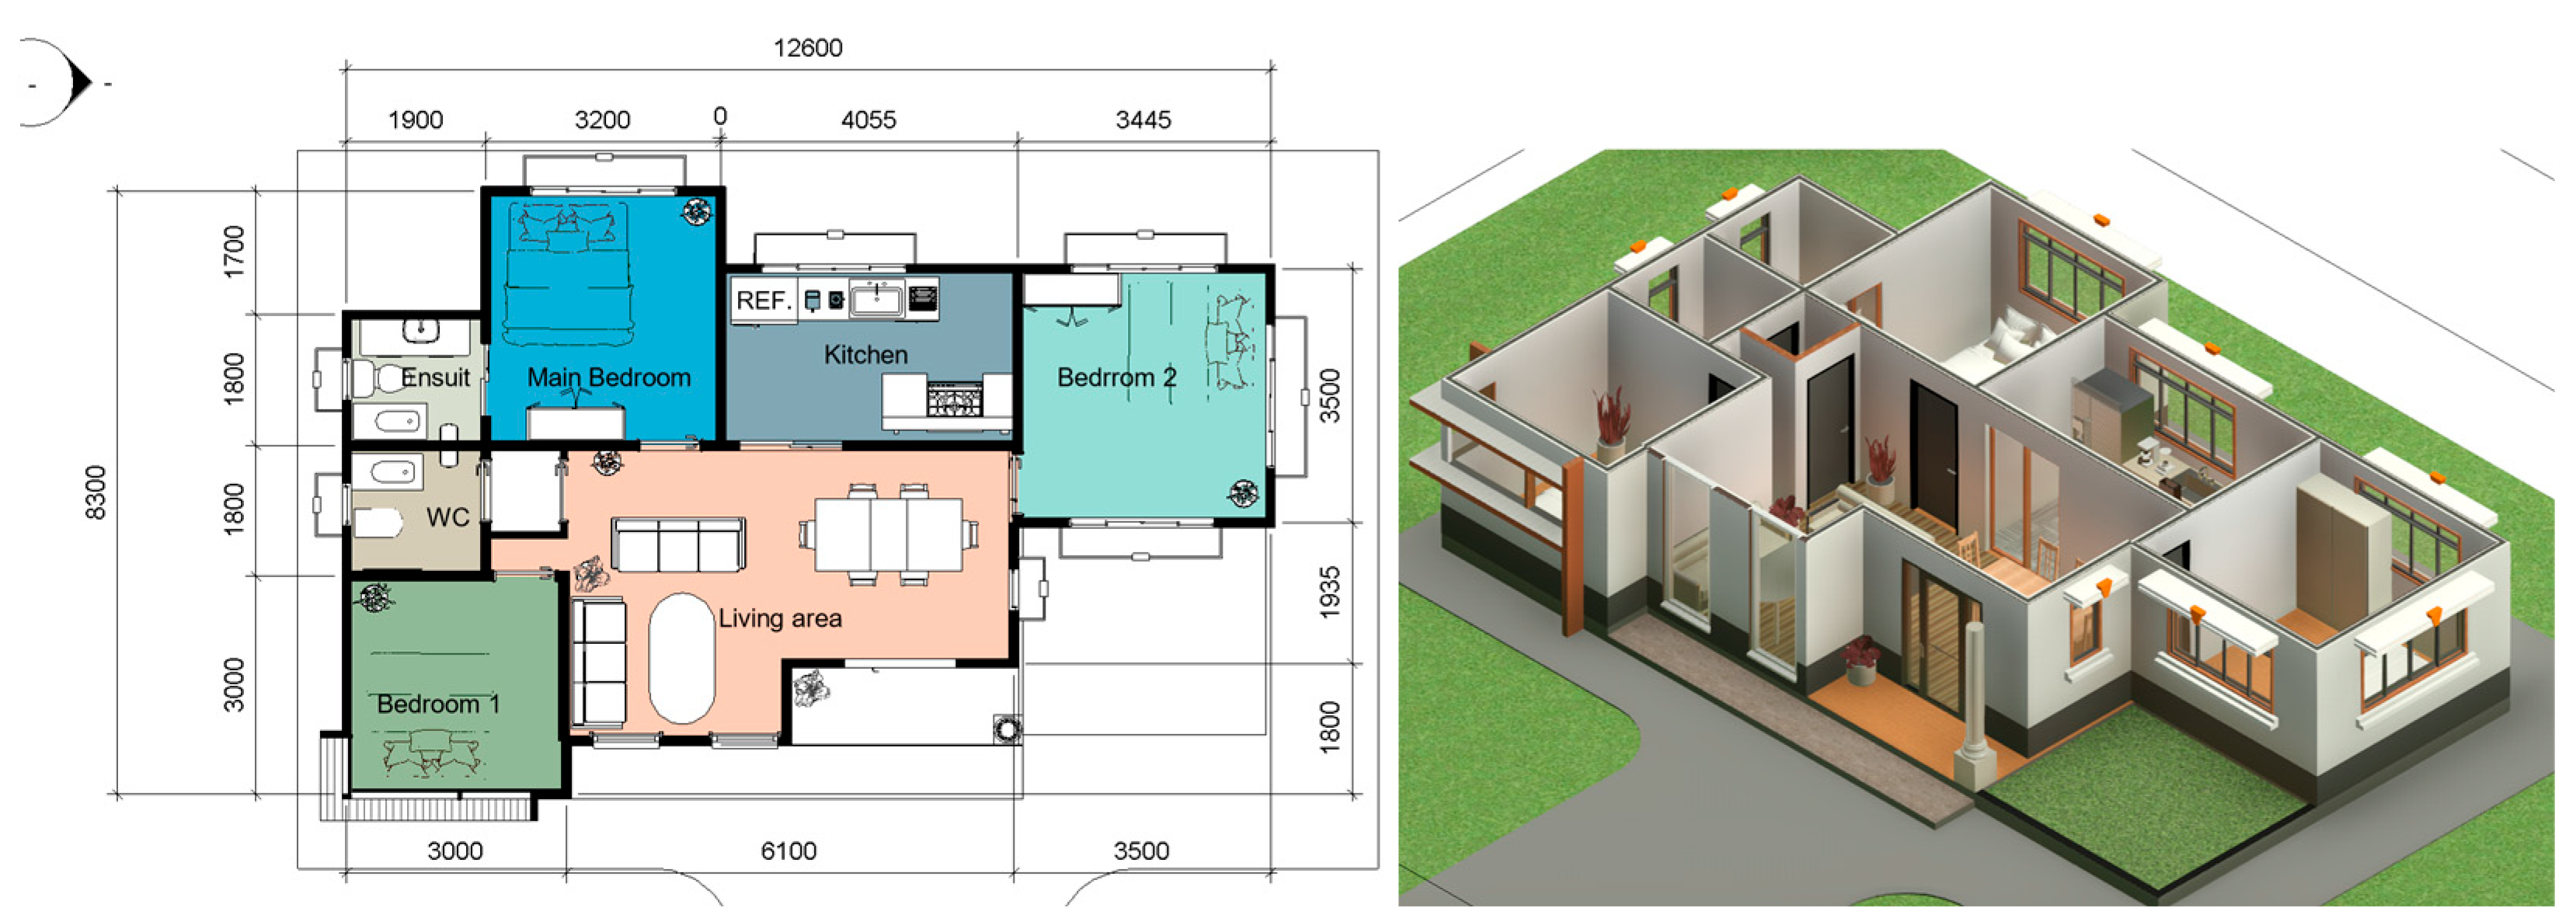
3.3.1. Building A: Author-Developed Single-Story Dwelling
Building A is a single-story residential dwelling modeled entirely by the researcher using Autodesk Revit. It consists of a central living space, bedrooms, kitchen, circulation areas, and service rooms. The model also contains detailed representations of façade openings, internal partitions, site orientation, and building envelope features. As such, the building is representative of low-rise residential typologies commonly found in warm to temperate regions. The moderately simple geometry provides visibility into airflow pathways and facilitates controlled optimization strategy testing. The spatial layout, façade opening configuration, and three-dimensional representation of Building A used for PVOM analysis are illustrated in
Figure 3.
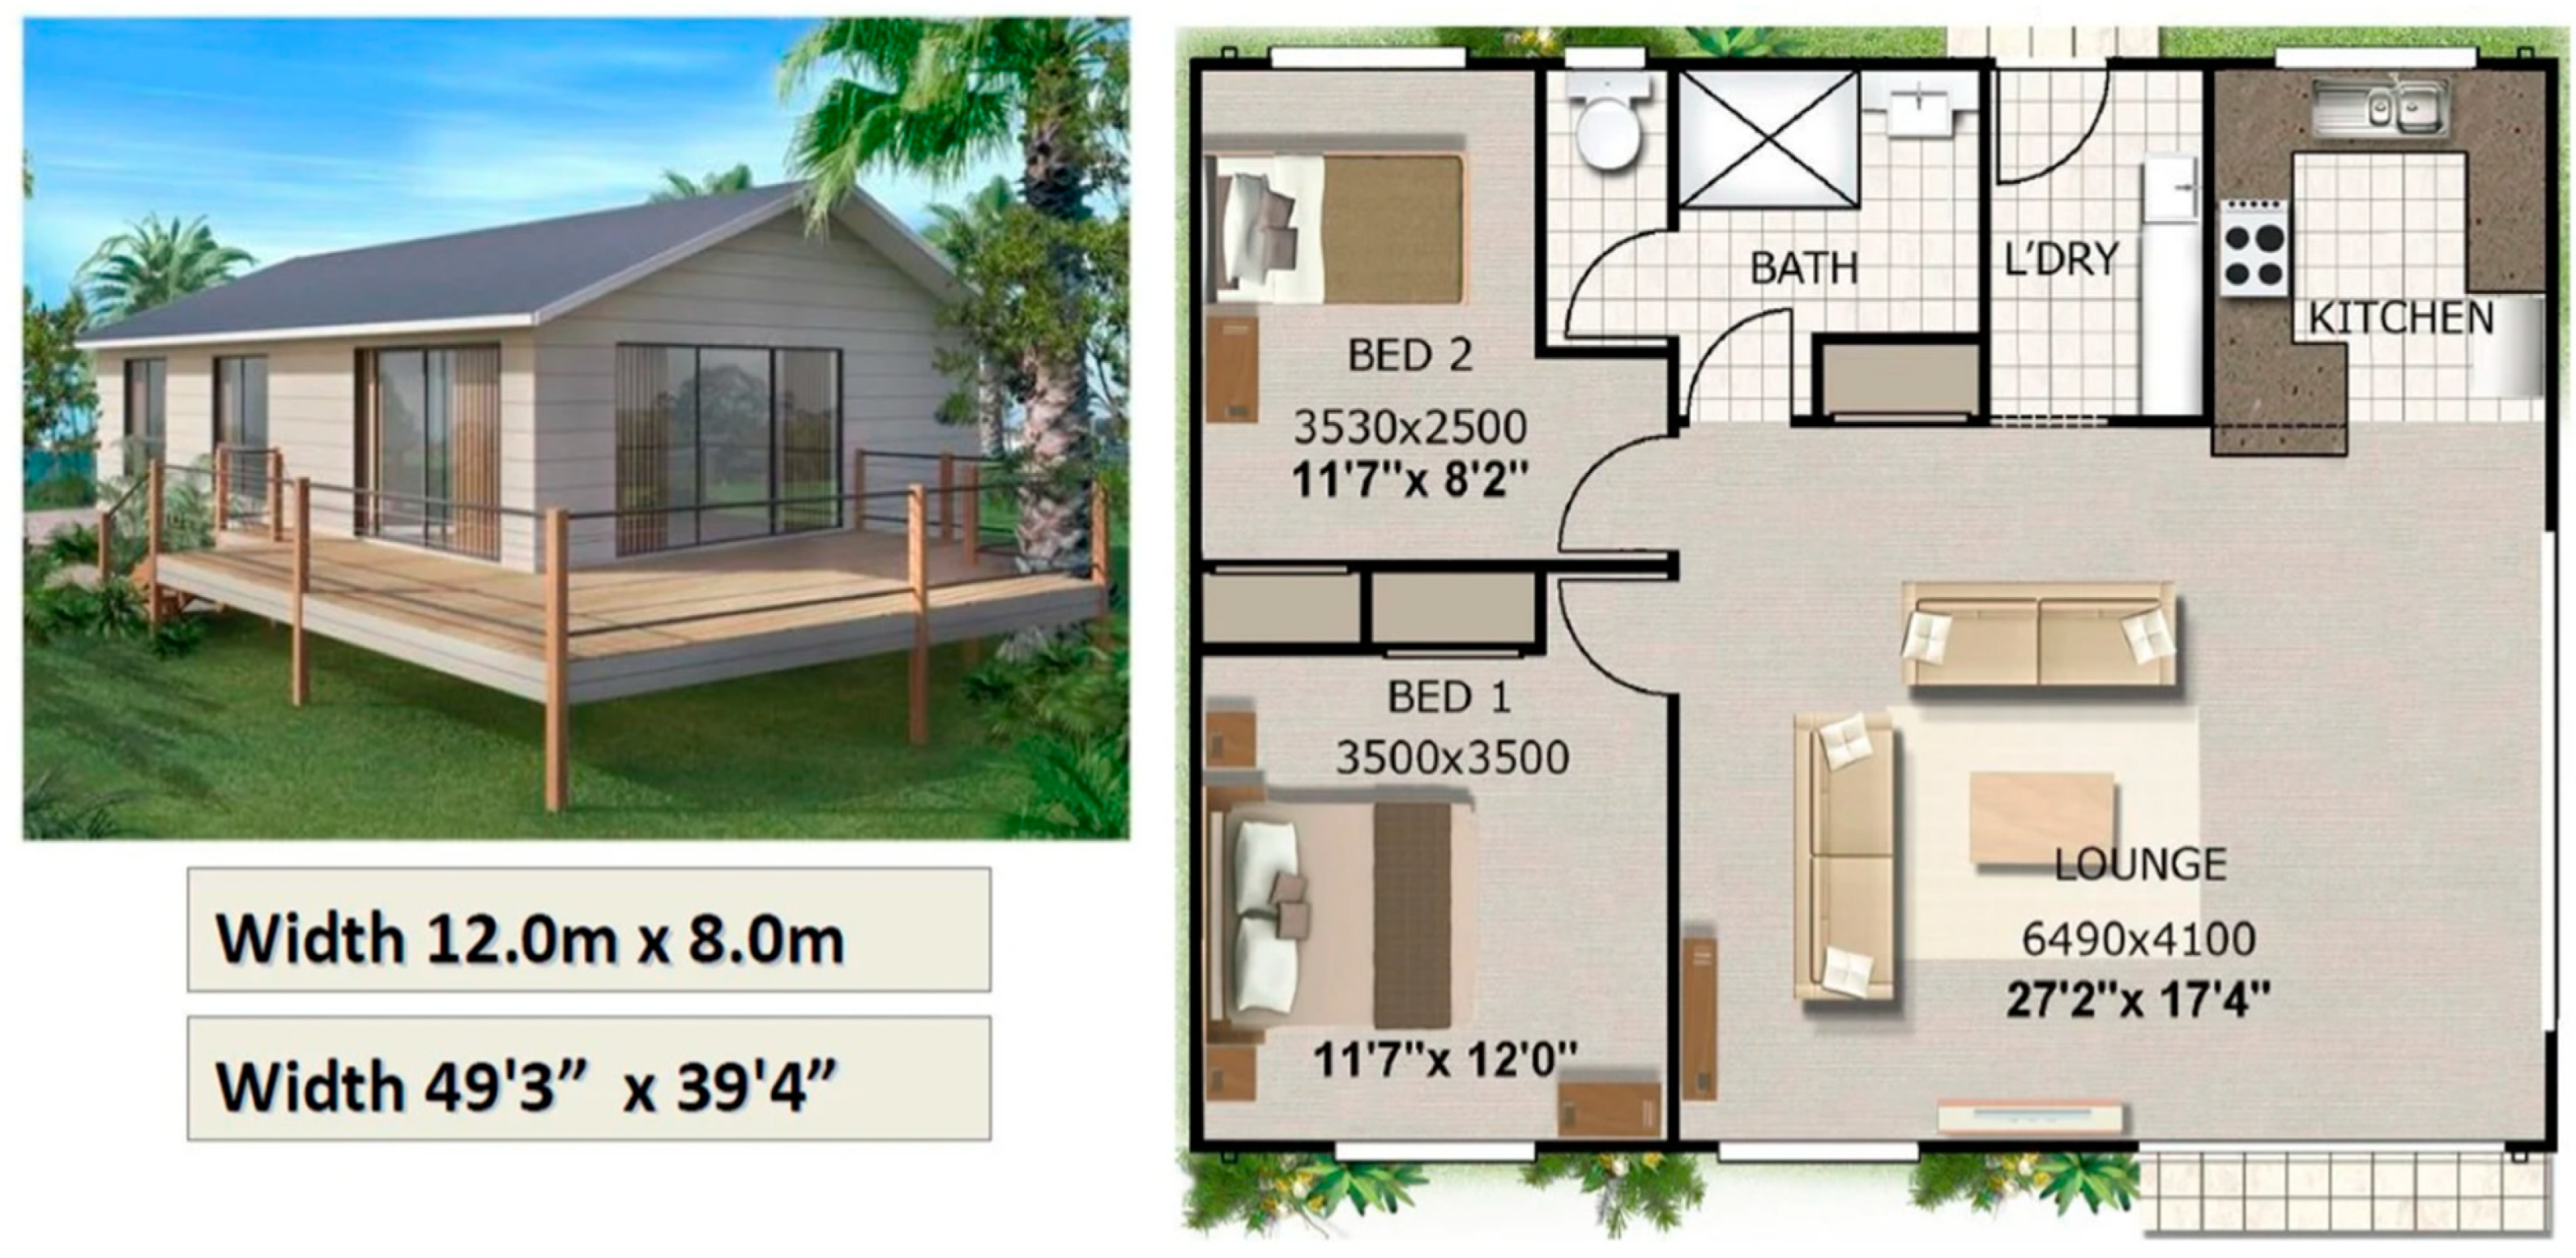
3.3.2. Building B: Publicly Documented Low-Rise Residential Dwelling
To showcase the different spatial arrangements relevant to validating the multi-scale BIM-driven PVOM framework, a publicly available low-rise residence, Building B, was chosen, as the dwelling is a compact single-story, two-bedroom structure with a typical 12.0 m × 8.0 m rectangular footprint, an example of low-rise sustainable building typologies. To complete the interior layout, a lounge and kitchen is laid out along the building’s primary façade, while the two bedrooms and sanitary spaces are positioned toward the rear. This configuration leads to micro-scale (room-level) features and meso-scale (layout-level) connectivity profiles, and Building B is therefore appropriate to use to quantify ventilation opportunity measures (i.e., inlet–outlet feasibility and airflow pathway potential). The large, glazed opening in the lounge and small windows in the bedrooms and kitchen offer a significant diversity in the distribution of façade openings, allowing for the use of PVOM analysis from a variety of geometric contexts. Through juxtaposing Building B and Building A, this paper examines the robustness of the developed PVOM and optimization workflow across different spatial complexities and provides evidence for the suitability of the method for use within low-rise sustainable residential buildings. The spatial layout, façade opening distribution, and three-dimensional representation of Building B used for PVOM evaluation are illustrated in
Figure 4.
3.4. BIM Spatial Modeling
The whole ventilation analysis is built around a geometric basis based on BIM modeling. Every component of the buildings was modeled using LOD 300 to capture sufficient information, making it highly useful for spatially correct analysis but also practically computationally tractable. Key elements of model include:
Walls, roofs, floors, partitions, structural limits and topographical divisions were modeled in accordance with the appropriate dimension, size, and their matching relations.
Each window and door is modeled with actual height, width, sill elevation and operability. For which porosity ratio and path of ventilation, the possibility is properly estimated accurately.
The external shell is modeled to account for shading influences that include overhangs, recesses, and the depth of the façade, all of which affect the airflow exposure.
The true north region was fixed by geography to represent realistic wind conditions and the direction of the airflow.
Interiors were split based on functional utilization that supported the ventilation at room scale.
All models underwent quality checks prior to analysis for:
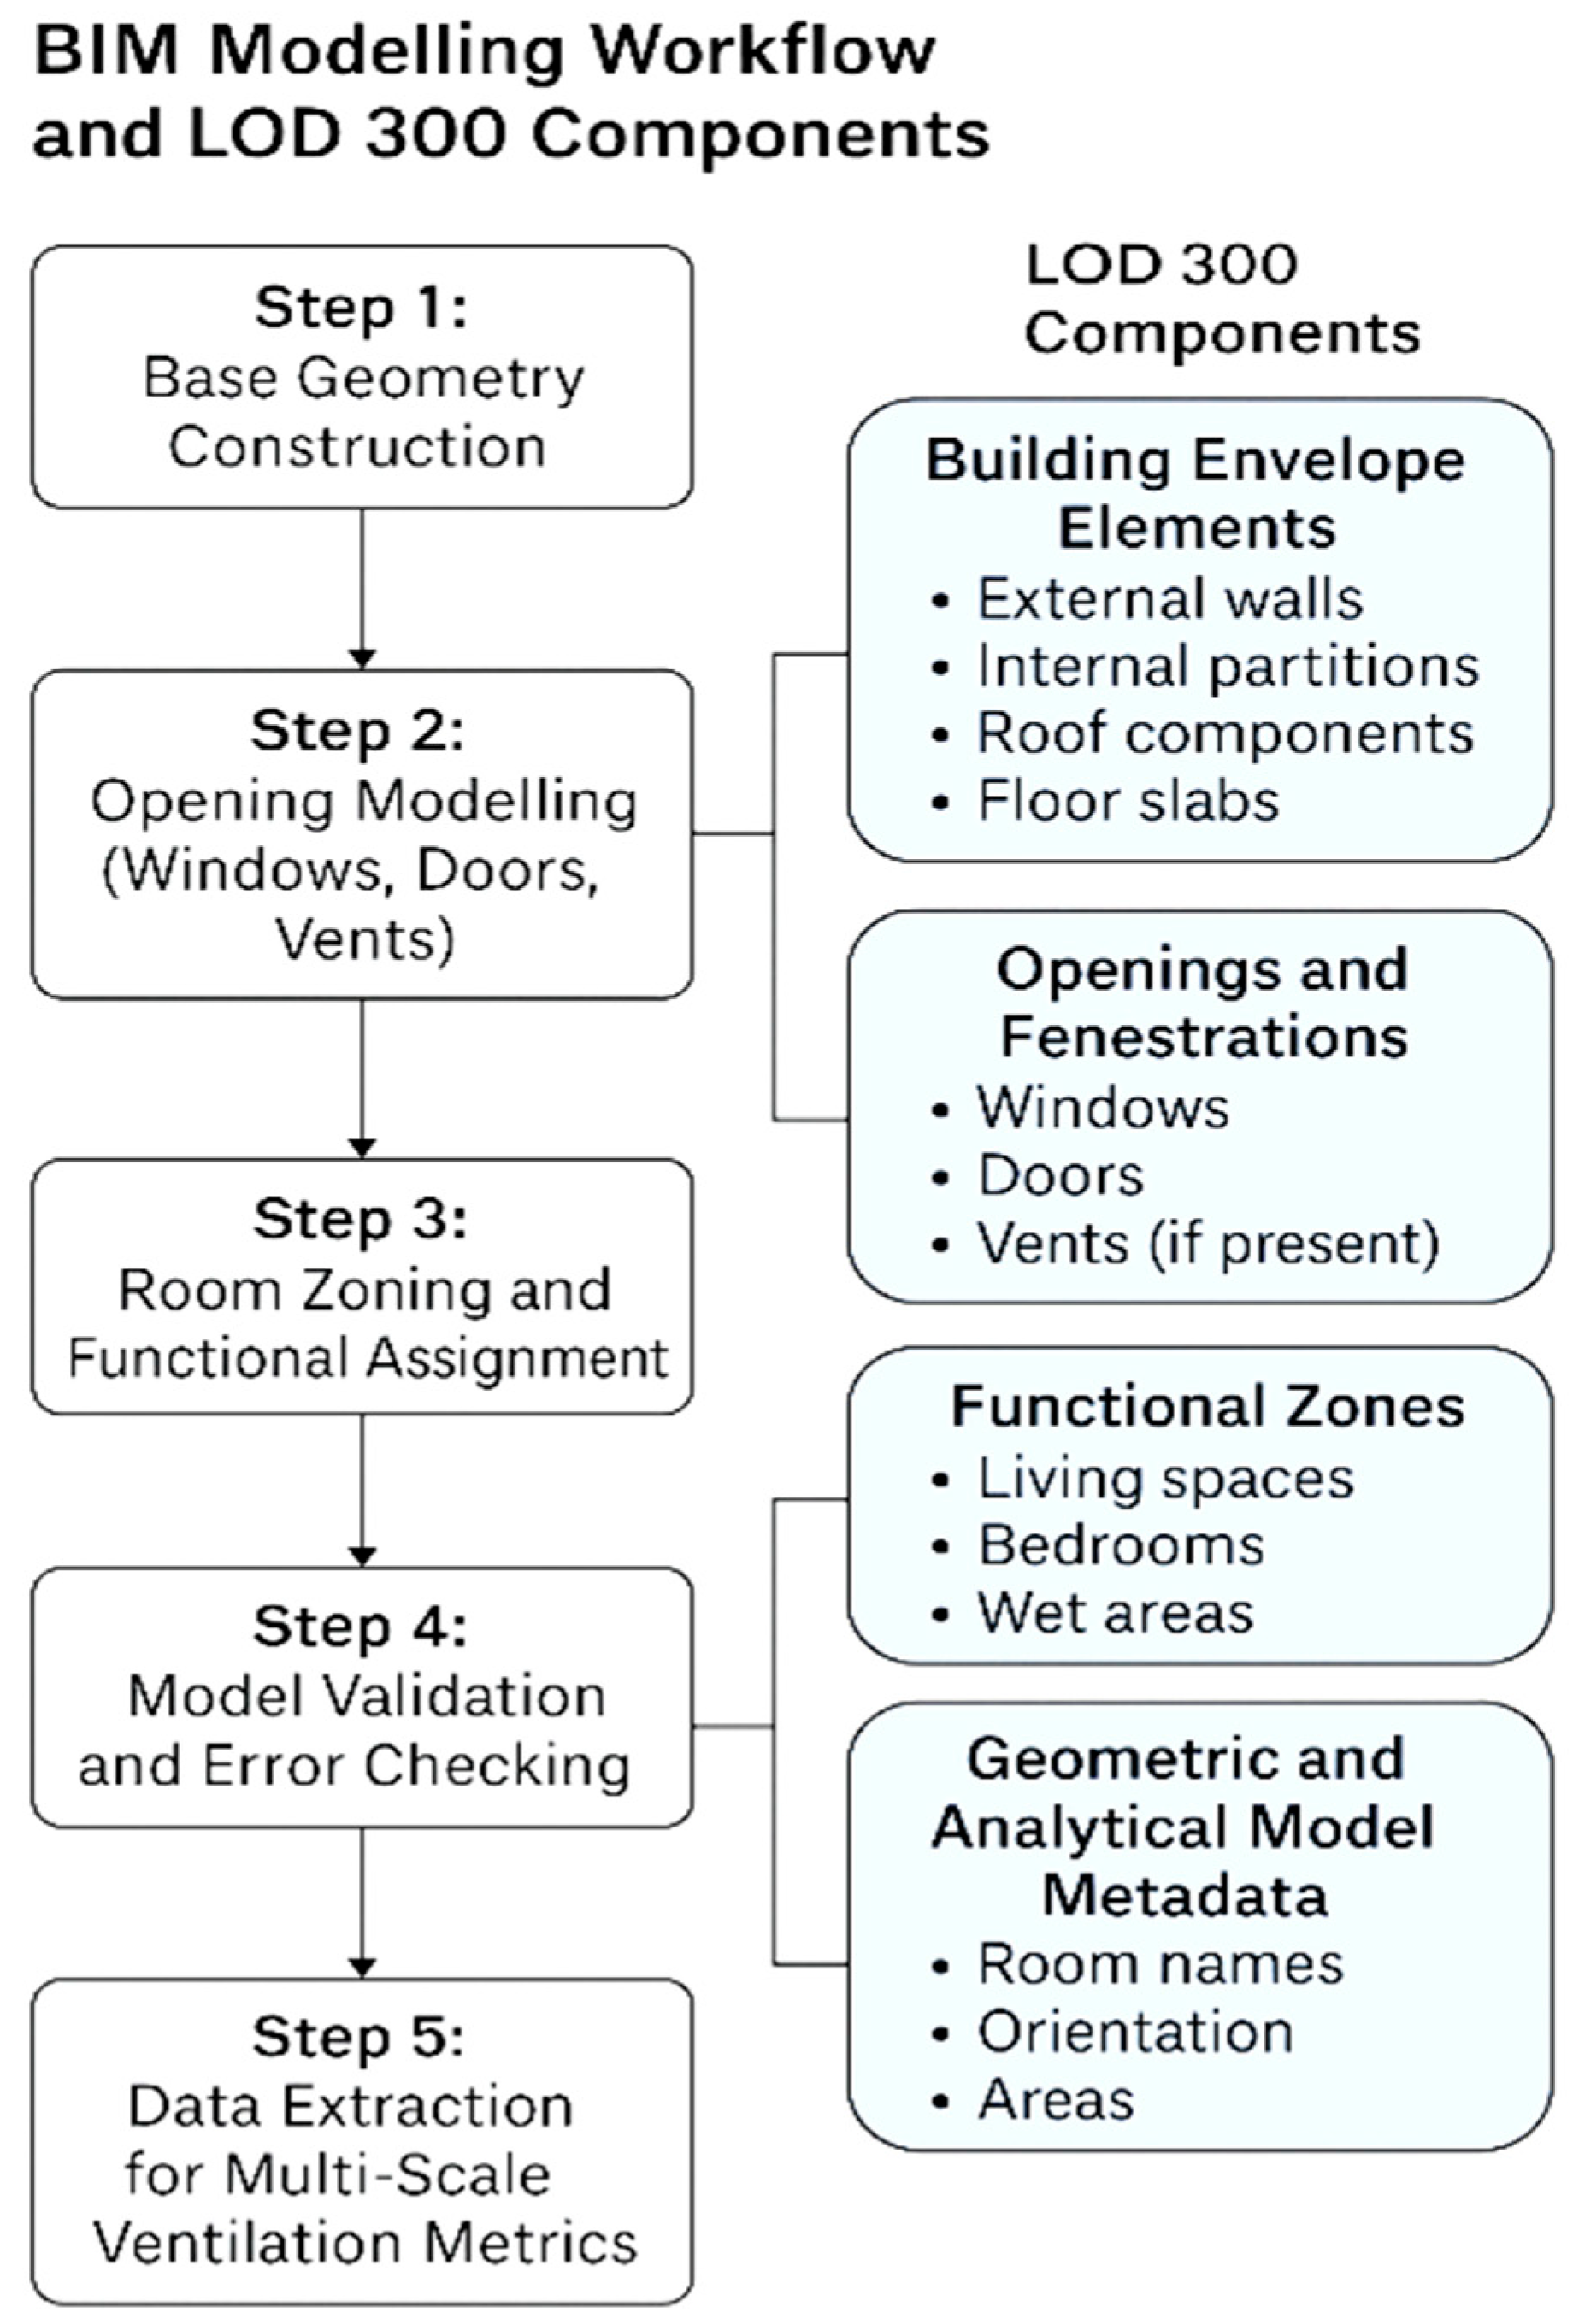
The BIM modeling workflow and related LOD 300 components implemented in this study are shown in
Figure 5. Leftward steps 1–5 detail the sequential modeling process as follows: (1) base geometry generation, (2) opening modeling (windows, doors, and vents), (3) room zoning and functional assignment, (4) model validation and error checking, and (5) data extraction for multi-scale ventilation metrics. The right-hand panels provide a summary of the relevant LOD 300 elements of the models, including building envelope elements (external walls, internal partitions, roof components, and floor slabs), openings and fenestrations (windows, doors, and vents), functional areas (living spaces, bedrooms, and wet areas), and geometric and analytical metadata (room names, orientation, and areas).
3.5. Representation of Air Inlets and Supply Paths
In the PVOM framework, air entry into the interior is modeled only through purposefully open architectural openings within the BIM model, for example, operable windows and designated ventilation apertures as interior air passages. These components are literal air inlets and outlets for measuring ventilation opportunity and connectedness. Unauthorized leakage paths due to window or door imperfections are not modeled, as their inclusion would exceed the resolution typically available at early design stages. The consideration of additional envelope penetrations (e.g., sanitary exhaust stacks; mechanical terminals) for these designs was not taken into account, and the spatial logic and effectiveness of natural ventilation pathways remain the focus of analysis. To maintain methodological alignment in CFD-based validation, we repeated these same assumptions.
3.6. Multi-Scale Ventilation Morphometrics
Ventilation performance in low-rise buildings results from spatial interactions that occur simultaneously at the room level, layout level, and envelope level. To capture these dynamics, this study applies a multi-scale ventilation morphometrics (MVM) system that quantifies geometry-based ventilation indicators at the micro-, meso-, and macro-scales. These descriptors form the analytical foundation of the PVOM workflow and enable ventilation assessment using only BIM-derived geometry, without requiring CFD or climate datasets during early design stages.
The three MVM scales provide complementary perspectives:
Micro-scale assesses room-level airflow potential.
Meso-scale evaluates internal connectivity and routing.
Macro-scale examines envelope exposure and orientation.
Together, they generate a holistic profile of ventilation opportunity and constraint within each building.
Though a variety of micro-, meso-, and macro-level indicators to describe ventilation opportunity from three spatial perspectives are described in
Section 3.5, not all the indicators are used directly in the optimization phase. These indicators together create a set of indicators for flexibly assessing and interpreting early design exploration. With a focus on optimization and performance measurement, a reduced subset of indicators—ACH-P, connectivity value score (CVS), and surface area contribution (SAC)—were chosen to capture the most influential, non-redundant aspects of ventilation opportunity. This particular choice not only preserves the key multi-scale features of the PVOM framework but allows for computationally efficient optimization processing.
3.6.1. Micro-Scale Morphometrics (Room-Level Indicators)
Micro-scale indicators describe how individual room geometries support or restrict fresh air exchange. The metrics include:
Opening-to-Volume Ratio (OVR): Operable opening area relative to room volume; estimates the capacity for effective air renewal.
Room Aspect Ratio: Length–width proportions influencing airflow uniformity and stagnation risk.
Inlet–Outlet Separation: Distance between primary inlet and outlet openings; affects air mixing and flow distribution.
Window-to-Floor Area Ratio (WFAR): Opening size relative to floor area, affecting daylight and ventilation potential.
Localized Porosity: Proportion of operable façade area on each wall segment.
These indicators diagnose local ventilation potential and help identify rooms prone to dead zones or insufficient poverty.
3.6.2. Meso-Scale Morphometrics (Connectivity and Internal Pathways)
Meso-scale metrics evaluate whether the layout supports continuous airflow across multiple spaces. Key descriptors include:
Spatial Connectivity Graph (SCG): Graph-based representation of room adjacencies and potential airflow routes.
Airflow Continuity Index (ACI): Measures the coherence of airflow pathways through the dwelling.
Partition Resistance Score (PRS): Quantifies how doors, walls, and partitions restrict movement of air.
Corridor Exchange Potential (CEP): Assesses how transitional spaces enable or obstruct ventilation between rooms.
Zonal Ventilation Routing (ZVR): Identifies dominant inlet–outlet pathways across zones.
These metrics determine whether the internal layout amplifies or suppresses natural ventilation potential.
3.6.3. Macro-Scale Morphometrics (Envelope Exposure and Orientation)
Macro-scale descriptors capture how the building interacts with external wind forces. They include:
Envelope Porosity Ratio (EPR): Total operable opening area relative to total envelope surface area.
Windward–Leeward Exposure Index (WLI): Assesses alignment of openings along windward and leeward sides.
Orientation-Based Ventilation Potential (OVP): Evaluates façade orientation relative to dominant wind directions.
Global Façade Distribution Score (GFDS): Evenness of opening distribution across elevations.
Shading–Flow Interaction: Influence of overhangs or shading devices on wind pressure and external flow patterns.
These indicators contextualize room- and layout-level performance within building forms and environmental orientations.
3.6.4. Integration into PVOM
A holistic dataset comprising micro-, meso-, and macro-level metrics is produced that acts as the analytical base of the Parametric Ventilation Opportunity Model (PVOM). PVOM produces diagnostic and predictive outputs—a set of such outputs including ventilation opportunity heatmaps, inlet–outlet feasibility matrices, predicted airflow pathways, ventilation opportunity zones, and stagnation risk zones—through this integrated dataset. This multi-scale integration improves the model’s ability to detect, early in a design phase, specific regions where trivial adjustments such as geometry can dramatically optimize natural ventilation performance. PVOM allows for better decision making and more proactive optimization of building configurations by pooling information across spatial scales. The complete set of micro-, meso-, and macro-scale ventilation morphometric indicators used in the PVOM framework is summarized in
Table 2.
3.7. Optimization Strategy
Following the identification of ventilation strengths and limitations through morphometric analysis and PVOM outputs, targeted geometric optimization strategies were implemented. These interventions directly respond to quantified airflow constraints and are designed to enhance natural ventilation performance without reliance on mechanical systems. Each modification scenario is evaluated against the baseline model to measure its effect on airflow potential, pathway continuity, and cross-ventilation performance. It is acknowledged that the proposed geometric optimization strategies must be evaluated within structural, economic, acoustic, and regulatory constraints in real-world practice. PVOM does not prescribe design changes in isolation but rather identifies spatial opportunity zones that require multidisciplinary evaluation before implementation.
- (a)
Opening Repositioning
Repositioning of openings is applied where misaligned inlet–outlet configurations reduce airflow continuity. Adjustments focus on:
Maximizing cross-ventilation alignment with predominant airflow directions;
Increasing inlet–outlet pairing distances for deeper penetration to the room;
Elimination of stagnation zones detected due to heatmap and PVOM analysis.
This modification is most suitable for rooms with a large collection of openings on a façade and disconnecting from meso-scale airflow pathways.
- (b)
Opening Resizing
Adding openings provides airfoils an increased extent of façade penetration and improves the volume and distribution of airflow. The increased opening hours contribute to the improvements in the following areas:
Overall, increased pressure-driven airflow due to overall envelope porosity;
ACH-P via large effective inlet and outlet areas;
Efficiency in airflow capture, particularly in windward-facing rooms.
Architectural, daylighting, and privacy factors restrict window resizing for feasible use.
- (c)
Envelope Porosity Enhancement
When baseline porosity is not adequate, additional passive ventilation systems are added. These may include:
Clerestory windows that enhance vertical airflow stratification;
Ventilation slots for controlled micro-ventilation;
Secondary openings in places near the high- or low-pressure envelope zones.
These enhancements also improve macro-scale exposure and expand the inlet–outlet coverage in occupied areas.
For the optimization stages, each optimization was processed through the PVOM engine, as well as through morphometric mapping, to measure the performance of the simulations with respect to the reference baseline. Optimization efficiency is assessed according to parameters, including ACH-P, cross-ventilation score (CVS), and spatial airflow continuity (SAC).
Adopting the PVOM framework, the proposed optimization schemes are evaluated based on their quantifiable effect on the selected ventilation opportunity indicators. Opening repositioning is expressed through changes in the connectivity value score (CVS), as relocating openings modifies internal airflow routing and spatial connectivity. Opening resizing has a direct impact on the air change potential (ACH-P) by altering the effective opening area relative to room volume. Envelope porosity enhancement is measured in terms of variation in the surface area contribution (SAC), capturing changes in façade exposure and opening density. These indicator variations are normalized and jointly evaluated in the multi-objective optimization process to identify balanced design solutions that enhance ventilation opportunity while maintaining architectural feasibility.
In this research three focused optimization strategies are used to improve natural ventilation in the building models. The initial design practice includes opening repositioning to improve inlet–outlet alignment and reduce airflow stagnation zones. The second strategy addresses the resizing of openings; essentially, it increases façade porosity and the potential air change rate occurring in interior spaces as a result. The other option to achieve a more seamless efficient airflow is the third strategy, involving the improvement of façade permeability using clerestory windows, ventilation slots, and secondary openings, while achieving a consistent and continuous airflow network. The optimization scenarios and parametric adjustments to openings and envelope porosity are illustrated in
Figure 6.
3.8. External Environmental Conditions and Stack Effect Assumptions
The PVOM framework assesses ventilation opportunities under standardized reference environmental conditions rather than site-specific climate scenarios. Therefore, outdoor temperature, wind variability, and extreme buoyancy-driven effects such as the reverse stack effect were not explicitly modeled. This abstraction makes the method useful during early design stages when detailed environmental data and final building heights might not be available. Ventilation shaft heights were treated as implicit geometric features within the BIM model rather than as performance-driving parameters. Although external environmental conditions and stack effect intensity significantly influence realized ventilation performance, their explicit quantification is more appropriate for later-stage simulation and detailed design. These factors are therefore acknowledged as important extensions beyond the current scope of the PVOM framework. This abstraction is deliberate and reflects the intended application of PVOM during pre-climatic conceptual stages, where site-specific wind and thermal data are often unavailable.
Quantification and Interpretation: PVOM Indicators
The PVOM metrics (ACH-P, CVS, and SAC) are relative, dimensionless measures based on topological and geometric information acquired in BIM. The measures quantitatively assess the amount of estimated comparative ventilation opportunity in spaces in early-stage design, but do not forecast total airflow rates. ACH-P measures the relative potential air change available to each space using the number, size, and relative physical distribution of intentional ventilation openings per room volume. Higher ACH-P values mean that there is more potential for air exchange, and at the opposite end there is very limited ventilation. CVS measures the level of internal airflow connectivity between spaces by looking at the number and continuity of potential paths of airflow between the rooms and the ventilation openings. If the spaces are more connected to external openings or better connected to the internal routing networks, higher CVS values are assigned. SAC describes the relative contribution of envelope surface exposure to use within a given space to the degree that the area of façade-adjacent surfaces can support a ventilation-driven exchange. Each value of the indicators is normalized on a common scale to allow for comparisons across spaces in the same design scenario. There is no explicit weighting within indicators now—the indicators are combined in multi-objective optimization to assess trade-offs between the dimensions of ventilation opportunity. In this case, a room with a number of operable windows, direct connectivity to adjacent spaces, and large façade exposure would score strongly on all three indicators, whereas a deep-plan interior space with limited openings and weak connectivity would score poorly.
3.9. Building Orientation and Solar Effects
Although building orientation was defined geometrically within the BIM environment, orientation-specific solar gains and radiation-driven temperature gradients were not explicitly modeled. The PVOM framework focuses on spatial ventilation opportunities derived from geometry, connectivity, and envelope exposure rather than thermally induced buoyancy effects. The influence of solar radiation on airflow was therefore omitted to remain consistent with the early-stage abstraction level of the method. Although solar-driven buoyancy has a notable impact on natural ventilation performance, particularly in detailed design stages, it needs to be accounted for through climate-specific data and thermal modeling that extend beyond the intended scope of the PVOM framework. Such effects are acknowledged as relevant considerations for subsequent simulation-based refinement.
3.10. Wind Effects on the Building Envelope
The wind-induced pressure differentials on the building façade were not explicitly modeled in the PVOM framework. No prevailing wind directions or site-specific wind conditions were assumed, allowing the method to remain independent of climatic context during early design stages. Consequently, the PVOM indicators assess relative ventilation opportunity based on spatial configuration, envelope exposure, and internal connectivity rather than airflow performance due to wind. Though wind interaction can increase or decrease natural ventilation significantly under real operating conditions, its explicit modeling requires detailed meteorological data and simulation approaches that exceed the intended scope of the framework. Wind effects thus represent an important factor for subsequent, site-specific performance assessment.
3.11. Performance Evaluation
In this regard, the performance assessment evaluates the degree to which each building configuration—both baseline and optimized—supports efficient natural ventilation. Three relevant indicators are used, as they have a sound predictive power for passive airflow behavior, and are based on geometric parameters generated with BIM without the need for Computational Fluid Dynamics (CFD) simulation.
- (1)
ACH-P is one such acronym, or the potential for air change. ACH-P estimates the potential ventilation rate given core geometric parameters such as:
- ▪
Total operable opening area;
- ▪
Room volume;
- ▪
Feasibility of airflow paths.
ACH-P is an indicator that indicates the amount of space and how those opening arrangements affect the actual air change rate (ACH), which expresses the amount of air exchange that can occur in a geometrical system.
- (2)
Cross-Ventilation Score (CVS). The cross-ventilation score measures the efficiency of cross-ventilation and is based on:
- ▪
Quality of alignment between inlets and outlets;
- ▪
Distance between paired openings;
- ▪
Internal spatial connectivity;
- ▪
Degree of opposing façade exposure.
A high CVS shows vigorous pressure-driven flow potential and wider cross-ventilation pathways.
- (3)
Spatial Airflow Continuity (SAC). SAC refers to the degree of continuity of uninterrupted air movement across rooms and circulation areas. It is affected by factors like:
- ▪
Internal door positioning;
- ▪
Resistance as part of partitions;
- ▪
The coherence of airflow routing.
A higher SAC value indicates fewer airflow bottlenecks, smoother inter-room ventilation continuity, and potential for greater whole-building passive airflow.
3.12. Statistical Validation
To check for reliability, consistency, and discriminative power of the morphometric indicators created from the BIM-based workflow and Predictive Ventilation Opportunity Mapping (PVOM) analysis, statistical validation was undertaken. Because the framework assesses ventilation potential in both room-level and layout-level terms, statistical tests were conducted to check if the extracted metrics made a significant difference between the two case study buildings and could reflect their spatial configurational differences accurately. Three components of the validation process were implemented. To begin, descriptive statistics (mean, range, and variability) were calculated for the important geometrical and ventilation indicators (inlet–outlet feasibility, pathway continuity scores, porosity ratios, and spatial connectivity indices). These statistics gave an initial indication of distribution properties and stability of measures. Second, contrasting statistical analysis was used to assess the differences in Building A and Building B as a function of metric normality and the number of samples, applying independent-sample t-tests or a non-parametric equivalent (e.g., Mann–Whitney U test). This step was performed to test whether PVOM indicators are sensitive to room layout, opening position, or layout geometry.
Finally, correlation analysis was carried out to investigate the relationship between spatial morphometrics and ventilation opportunity results. This enabled an analysis of whether geometry elements (room depth, opening area, connectivity links, etc.) were predictive variables for the possibility of ventilation. The strong correlations were evidence of construct validity between the PVOM outputs and the spatial characteristic underpinnings. Taken together, these statistical procedures made the expected indicators computationally as well as analytically replicable, and ensured the methodological robustness of the BIM-driven framework.
3.13. Airtightness and Envelope Leakage Assumptions
The building envelope was assumed to be airtight, except at designated ventilation openings, for the early-stage assessment of the ventilation opportunity. Infiltration and exfiltration via unintended leakage paths were not explicitly modeled. This assumption was made to isolate the effects of deliberate architectural ventilation strategies and to maintain compatibility with the abstraction level, typical of conceptual BIM-based design workflows. As envelope leakage and airtightness variability is a critical determinant of natural ventilation performance, it is identified as an important extension for later design stages and future work.
CFD Plausibility Demonstration Setup
As a qualitative plausibility demonstration, a Computational Fluid Dynamics (CFD) simulation was conducted to assess whether the airflow pathways predicted by the PVOM framework are physically reasonable under simplified and standardized conditions. The CFD analysis is not intended to validate or calibrate the PVOM metrics, nor to provide an independent verification of ventilation performance. Instead, it serves to illustrate whether the dominant airflow routes and stagnation zones identified by PVOM correspond to physically plausible airflow behavior when evaluated using a high-fidelity numerical solver.
A single representative optimized design scenario was selected for CFD analysis to demonstrate airflow plausibility under favorable ventilation conditions. Comprehensive CFD validation would require multiple scenarios, grid-independence testing, turbulence model sensitivity analysis, and site-specific boundary condition calibration. These requirements fall outside the intended scope of this study, which focuses on early-stage, geometry-driven ventilation assessment. The use of one scenario is therefore deliberate and illustrative rather than exhaustive, and aligns with the role of CFD as a supplementary visualization tool rather than a primary validation method. A single optimized design scenario was selected from the Pareto front, generated by conducting multi-objective evaluation of ventilation opportunity (ACH-P, CVS, and SAC), thermal comfort trend (PMV), as well as indicative energy performance. The chosen scenario represents a non-dominated compromise solution rather than an extreme optimum, and thus seems appropriate for CFD-based validation. The CFD simulation was performed using a commercial three-dimensional CFD solver. Operable windows defined within the BIM model were clearly represented as inlets and outlets through pressure-based boundary conditions, and all other surface parts were considered airtight. Airflow was modeled for an incompressible and steady state. Airflow distributions and contaminant transport were stressed in the model, and thermal buoyancy effects were simplified and not fully coupled. For the computational domain, a hybrid unstructured mesh was implemented with a local refinement approach in the ventilation openings and occupied areas to mimic dominant features of flow. Mesh density (to ensure stable and physically meaningful flow patterns) was chosen. As the CFD analysis has a qualitative validation function, no formal grid-independence testing was performed. A passive scalar contaminant was introduced at the center of the occupied region, corresponding to a generalized indoor pollutant source (e.g., CO2 or typical indoor emissions). The contaminant was used to visualize the relative pollutant removal activity, not to mimic certain emissions processes.
3.14. Final Benchmarking
The final benchmarking was carried out to compare the ventilation opportunity performance of the two case study buildings and assess the responsiveness of the PVOM framework to contrasting spatial configurations. Key performance indicators derived from the BIM–PVOM workflow, including inlet–outlet feasibility, pathway continuity, room porosity, and spatial connectivity, were normalized for direct cross-building comparison. The benchmarking results show the relative ventilation potential between the buildings and confirm whether the recommended optimization scenarios generate measurable improvements relative to the baseline configurations. Building A showed more consistent airflow pathways due to its controlled and symmetrical layout, whereas Building B showed greater variation in performance linked to its mixed opening distribution and deeper rear rooms. Both buildings exhibited increased PVOM scores, implying that ventilation opportunities were more effective following optimization. Overall, benchmarking results demonstrate the ability of the PVOM framework to differentiate between alternative low-rise residential geometries and quantify performance gains resulting from design modifications. This supports the use of the method to assess the utility of ventilation-aware design evaluation and optimization in sustainable building practice.
4. Results
4.1. Results and Comprehensive Analysis
The findings merge spatial morphometrics and PVOM results to compare ventilation in the two buildings of interest. Building A, as a more uniform layout and controlled geometry structure, presents a uniform inlet–outlet arrangement and shorter paths of airflow. Building B, which has a much deeper floor plan and varied window placement, has greater variability in ventilation potential, where there are some areas that have good opportunities and some that have a lesser number of airflow routes. In both buildings, room PVOM scores increased for rooms with larger façade openings and direct outdoor exposure and decreased for deeper or enclosed rooms. These results validate the effect of spatial layout and opening distribution on ventilation opportunity. Overall, the results seem to support the fact that a BIM–PVOM system can indeed identify different airflow behaviors within different kinds of low-rise residential structures.
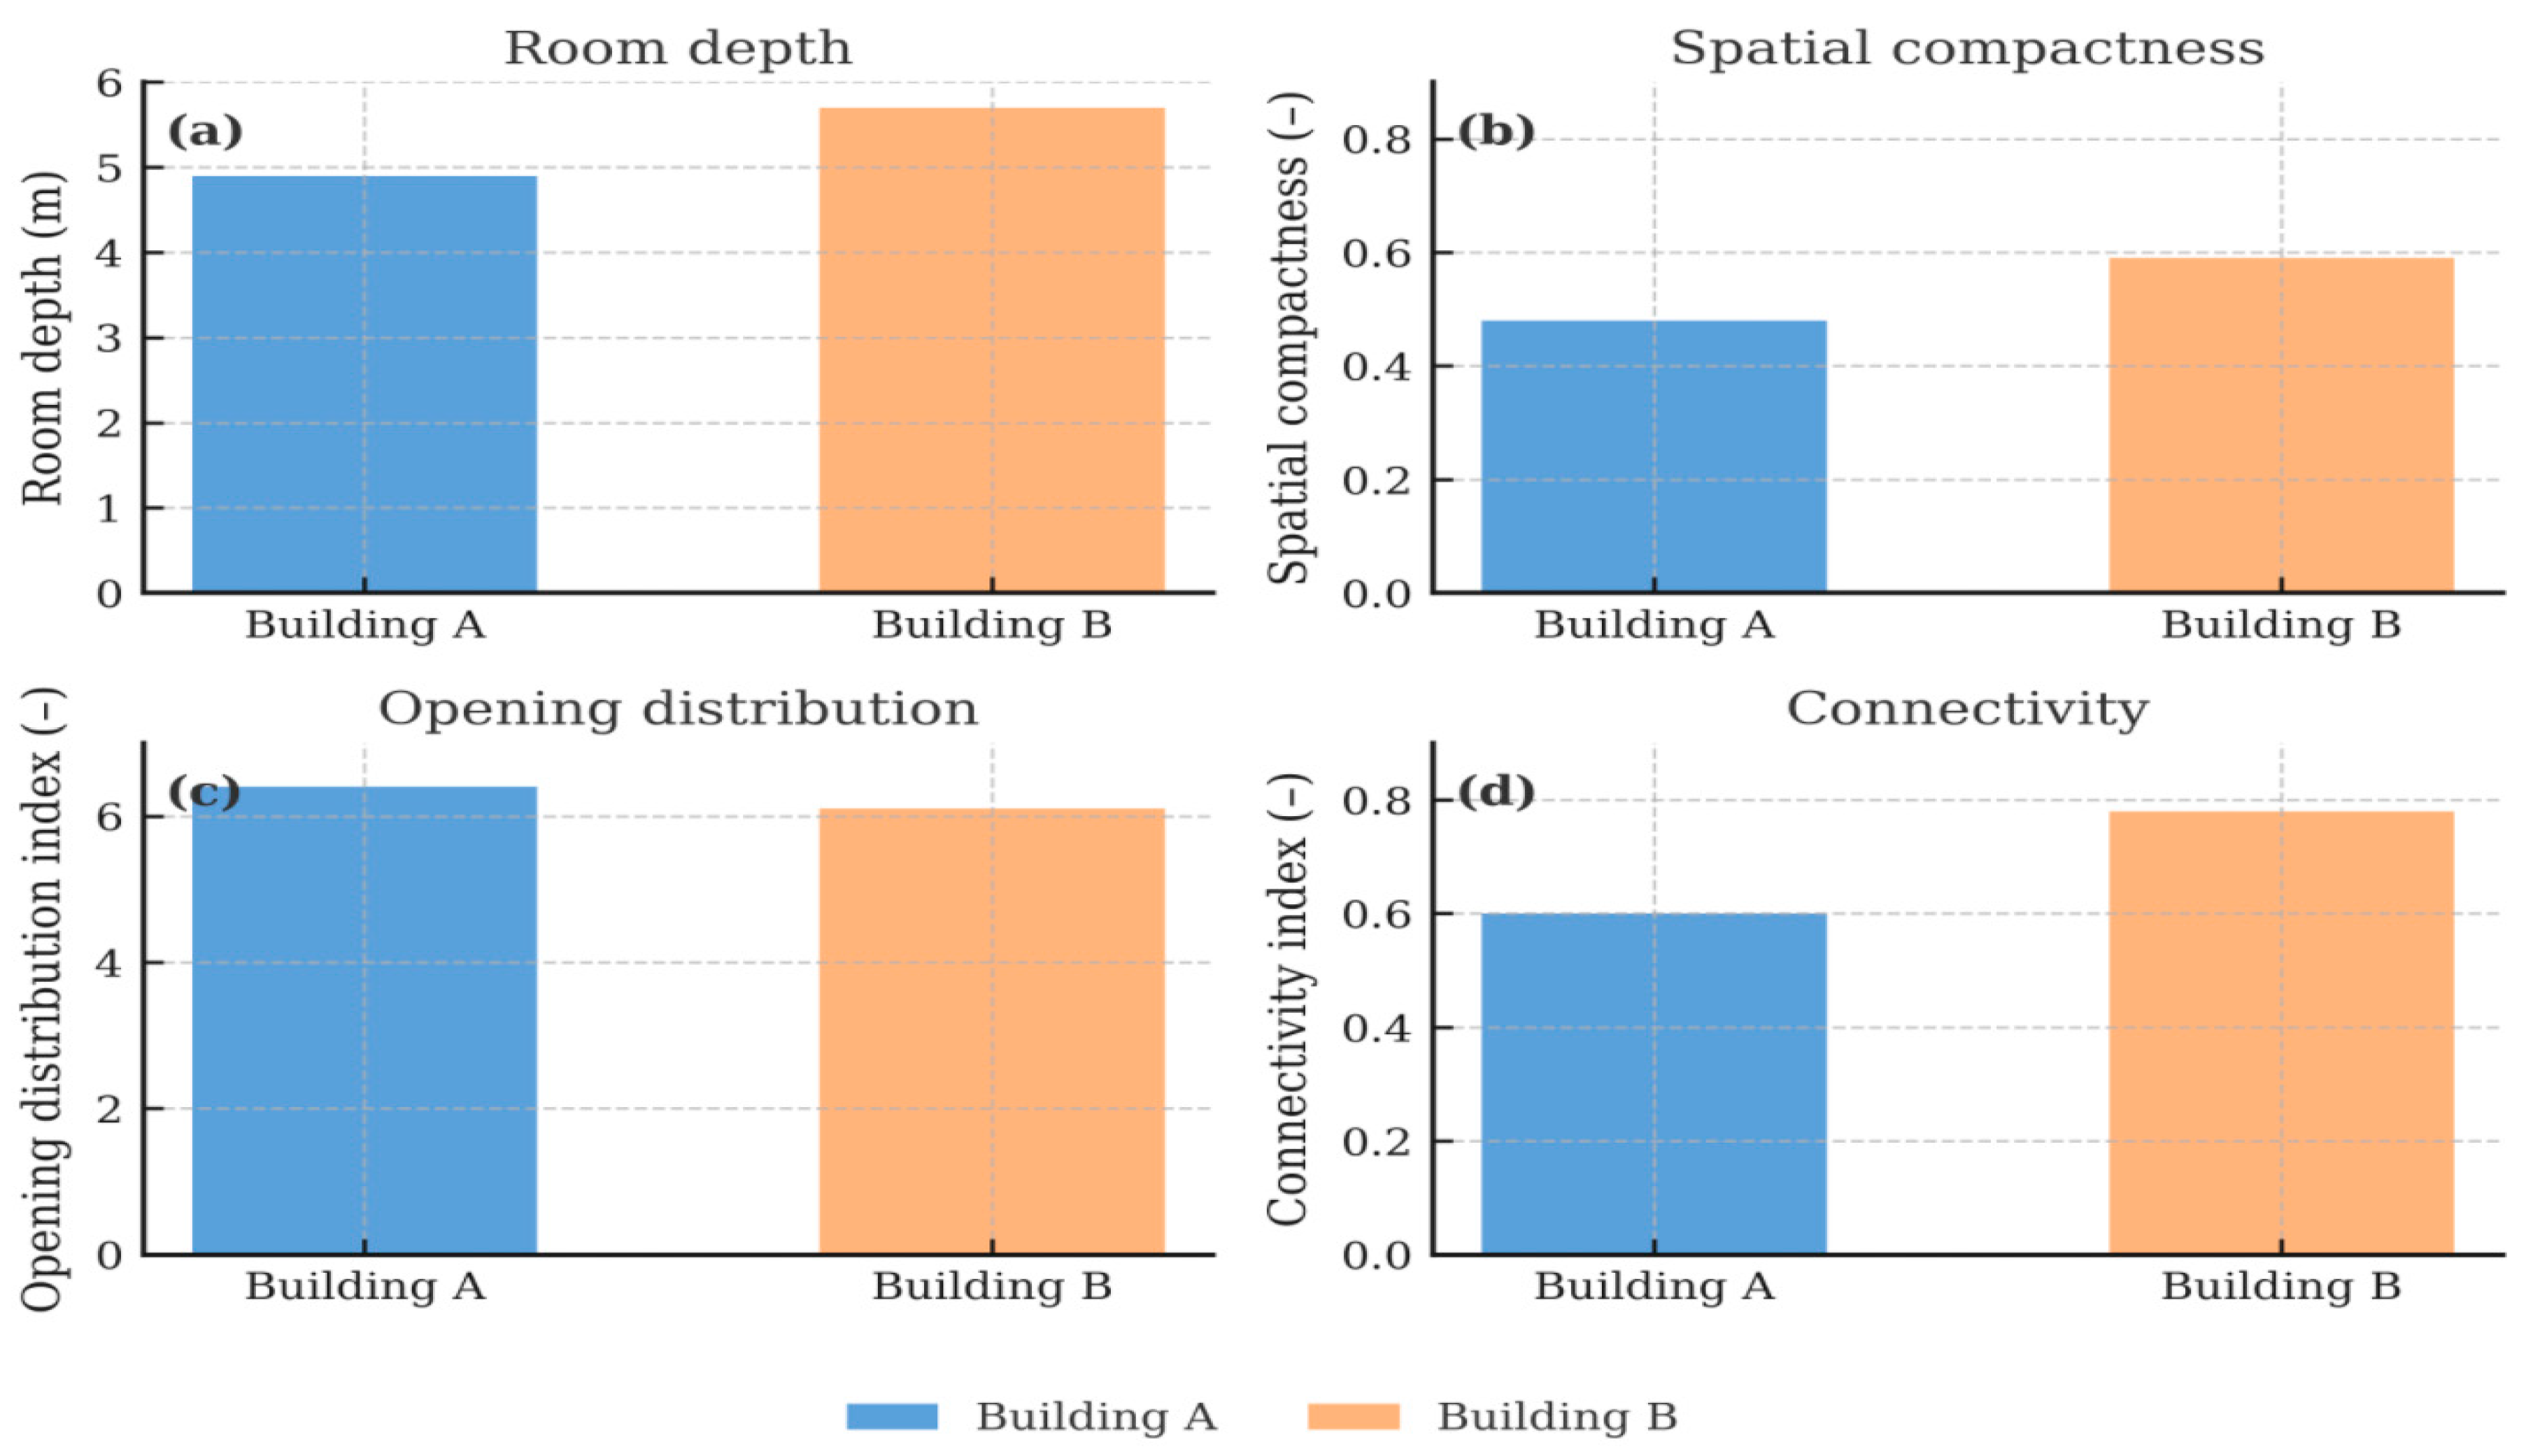
The spatial morphometric analysis compares the geometric features affecting the ventilation potential in Building A and Building B; the indicators used are room depth, spatial compactness, opening distribution, and connectivity. These metrics indicate how layout structure and façade openings influence airflow behavior and serve as the baseline for interpreting the PVOM results.
Figure 7, Spatial morphometric indicators comparing the baseline geometric characteristics of Building A and Building B at room and layout levels. The bars report (a) the average room depth, (b) spatial compactness, (c) opening distribution index, and (d) connectivity index, each derived from BIM-based morphometric analysis. Building A shows shallower room depths and slightly lower compactness, while Building B exhibits deeper rooms, a more concentrated opening distribution, and higher connectivity. Together, these indicators describe how underlying spatial structures and façade configurations differ between the two case study dwellings and help explain subsequent variations in PVOM-derived ventilation opportunity. For further investigation, parametric variation was performed with incrementally increasing room depth in Building A, with a constant opening area and façade orientation. At a greater room depth, both the ACH-P and CVS values declined continuously, and PVOM maps indicated expanded low-opportunity zones toward interior regions. This monotonic response attests that this framework makes sense under controlled geometric modification and does not exclusively follow the layouts of the two case studies.
4.2. PVOM Baseline Results
The baseline PVOM results for both case study buildings are shown in
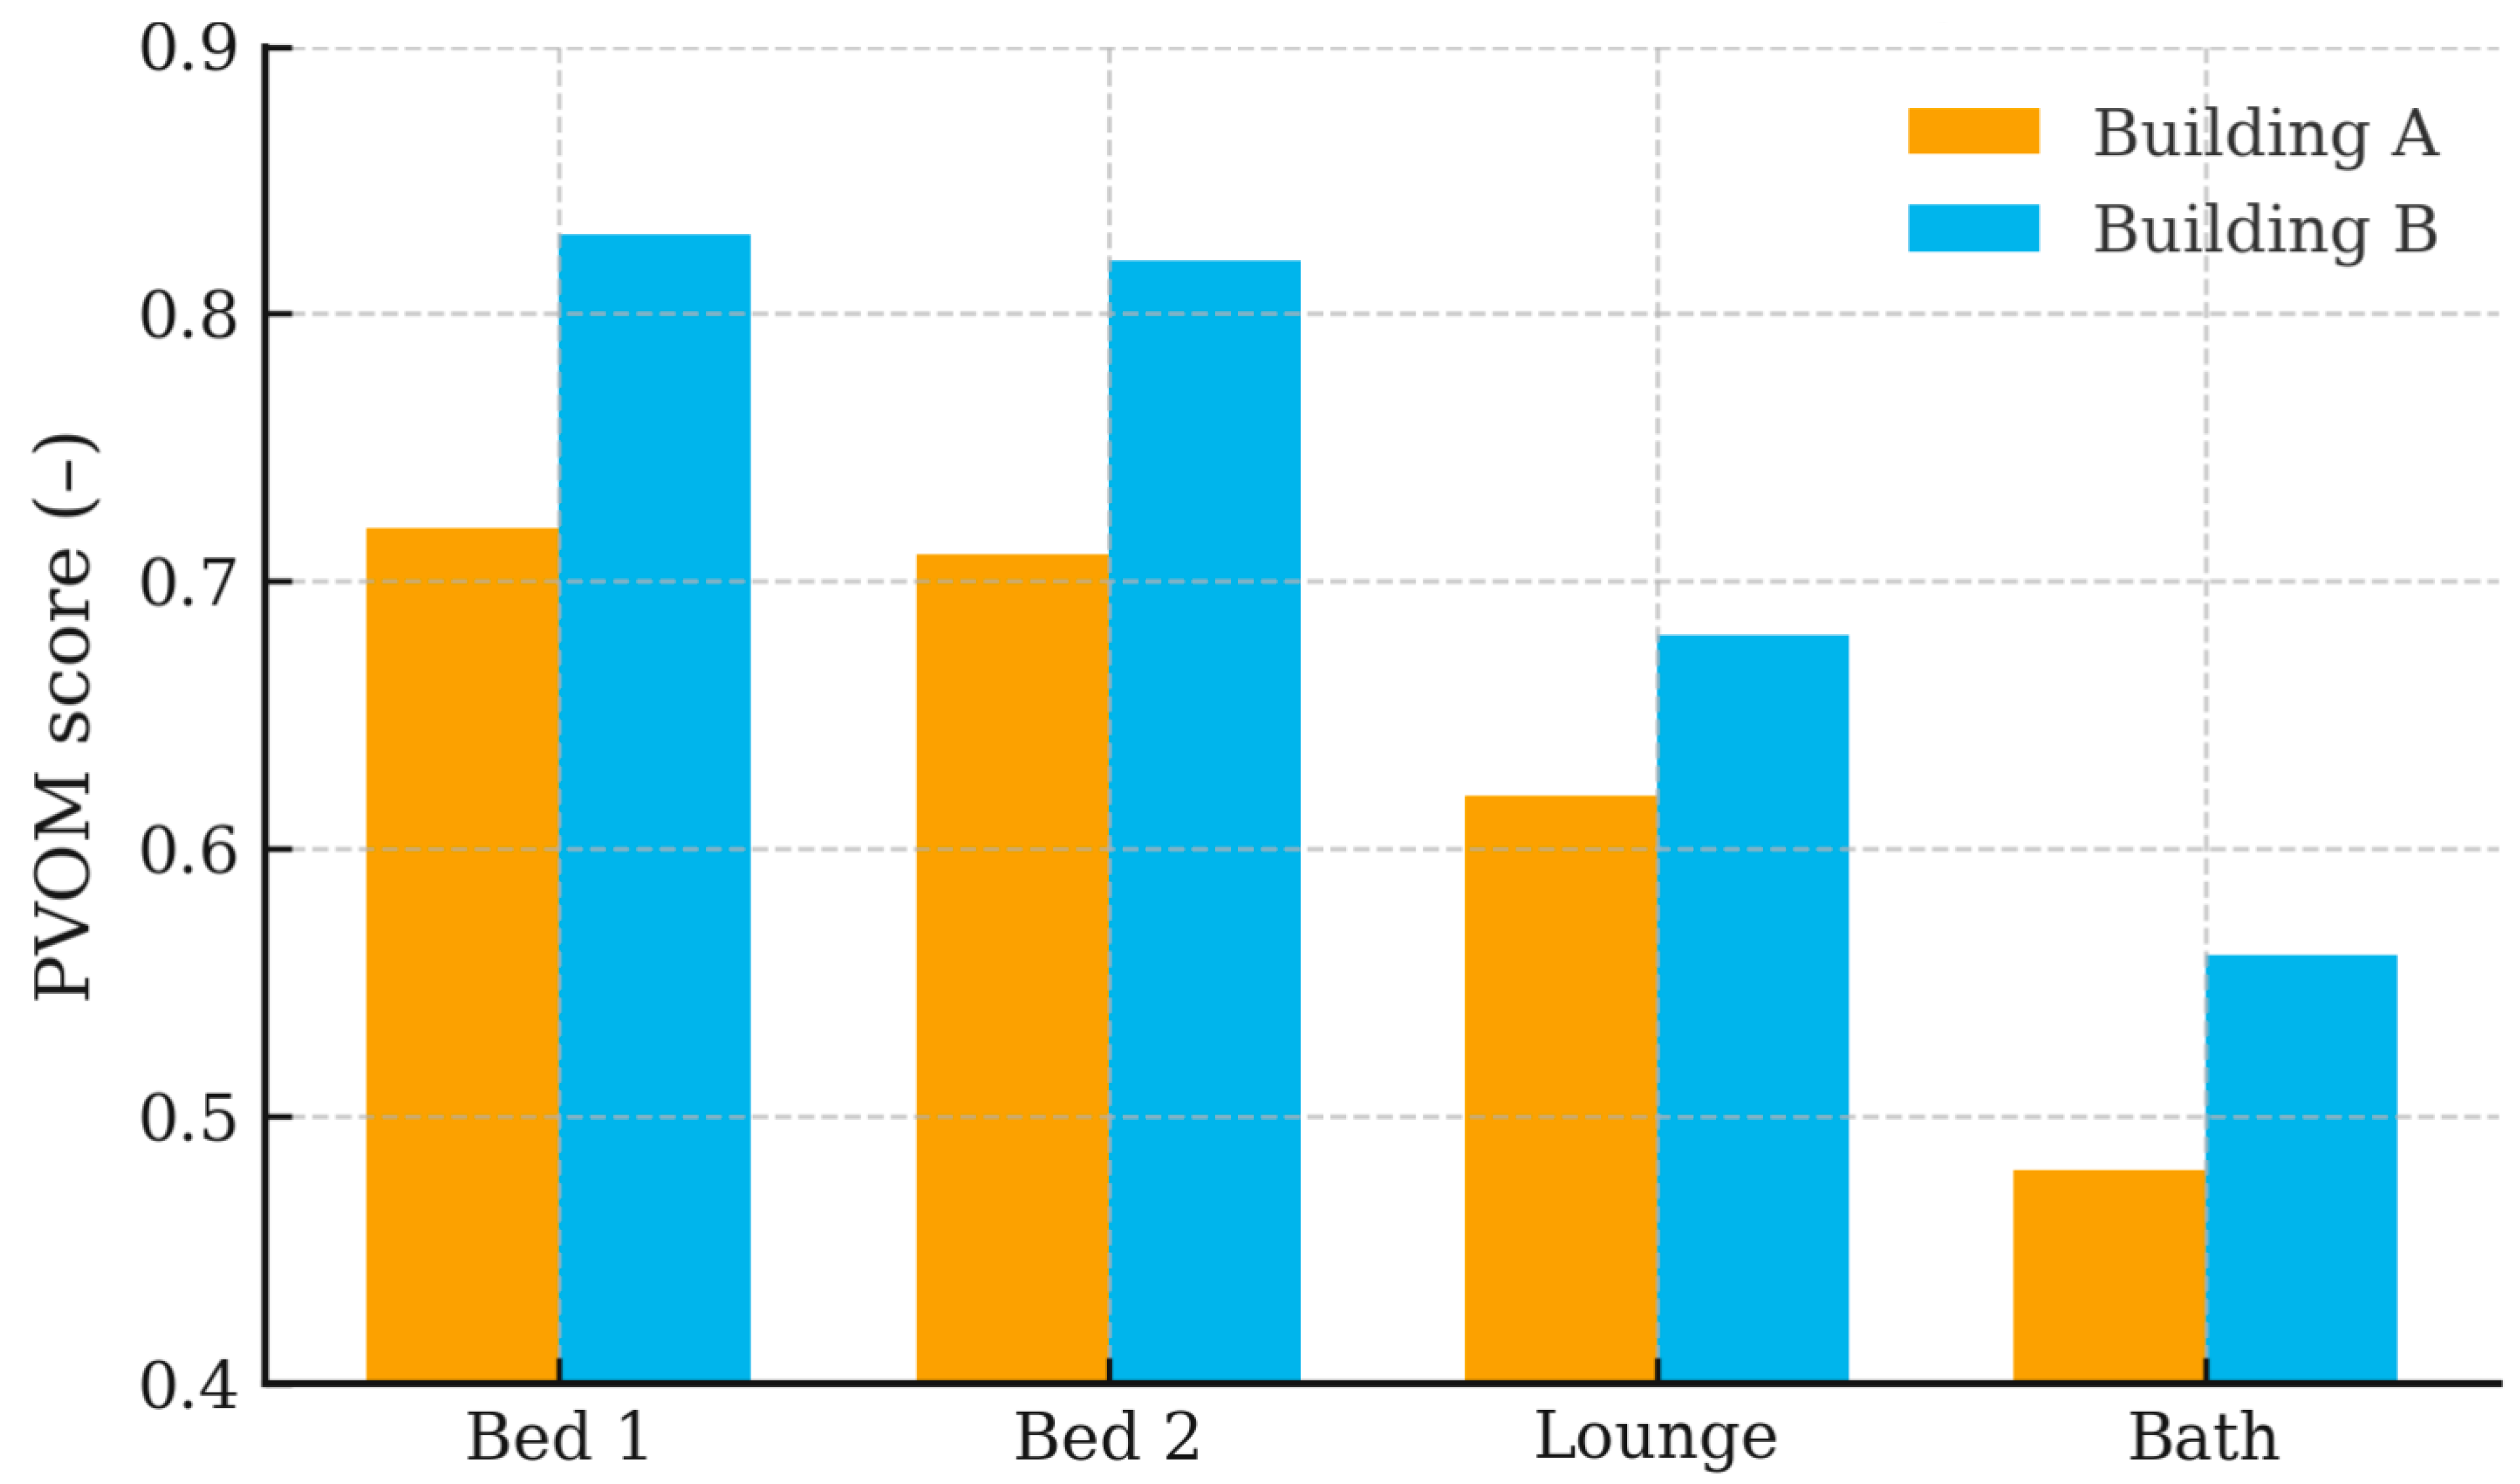
Figure 8, and the scores represent the relative ventilation opportunity in each room based on inlet–outlet feasibility, spatial depth, and opening configuration. Building A shows more uniform performance across rooms, whereas Building B demonstrates higher variability, with some rooms exhibiting stronger ventilation potential due to more favorable opening alignment.
The figure compares normalized PVOM scores for Bed 1, Bed 2, Lounge, and Bath under baseline (pre-optimization) conditions, highlighting differences in ventilation opportunity due to room geometry, spatial connectivity, and façade opening alignment. Baseline and Optimized PVOM Scores.
Table 3 presents the PVOM ventilation opportunity scores for Buildings A and B under baseline and optimized configurations, allowing for quantitative comparison of room-level ventilation performance and assessment of the effectiveness of the proposed optimization strategies.
Table 3 summarizes the PVOM ventilation opportunity scores for Buildings A and B before and after optimization. The results show consistent improvements across all rooms following opening repositioning, resizing, and envelope porosity enhancement, providing a quantitative basis for the subsequent detailed analysis. Percentage improvement values illustrate the relative magnitude of ventilation opportunity enhancement following optimization. In this study, improvements above approximately 15–20% are considered meaningful in early-stage comparative assessment.
4.3. Optimization Results
The optimization scenarios were applied to both case study buildings to investigate how targeted changes to opening size, placement, and internal connectivity influence ventilation opportunity.
Figure 8 compares the baseline PVOM scores with the optimized configurations for key rooms in each building. Overall, the results show an increase in ventilation opportunity scores after optimization, with the most notable gains observed in deeper or previously underperforming rooms. These improvements indicate that the proposed PVOM-driven workflow can effectively guide design adjustments to enhance natural ventilation performance in low-rise residential layouts.
Table 3: PVOM optimization results showing baseline and post-optimization ventilation opportunity scores for key rooms in Buildings A and B, including Bed 1, Bed 2, Lounge, and Bath. The Bath format contrasts the original and improved configurations, highlighting how adjustments to opening size, placement, and internal connectivity lead to higher PVOM scores, particularly in deeper or previously ventilation-limited spaces. The figure demonstrates the capacity of the proposed framework to support ventilation-focused design optimization in low-rise residential buildings.
4.4. Model Validation
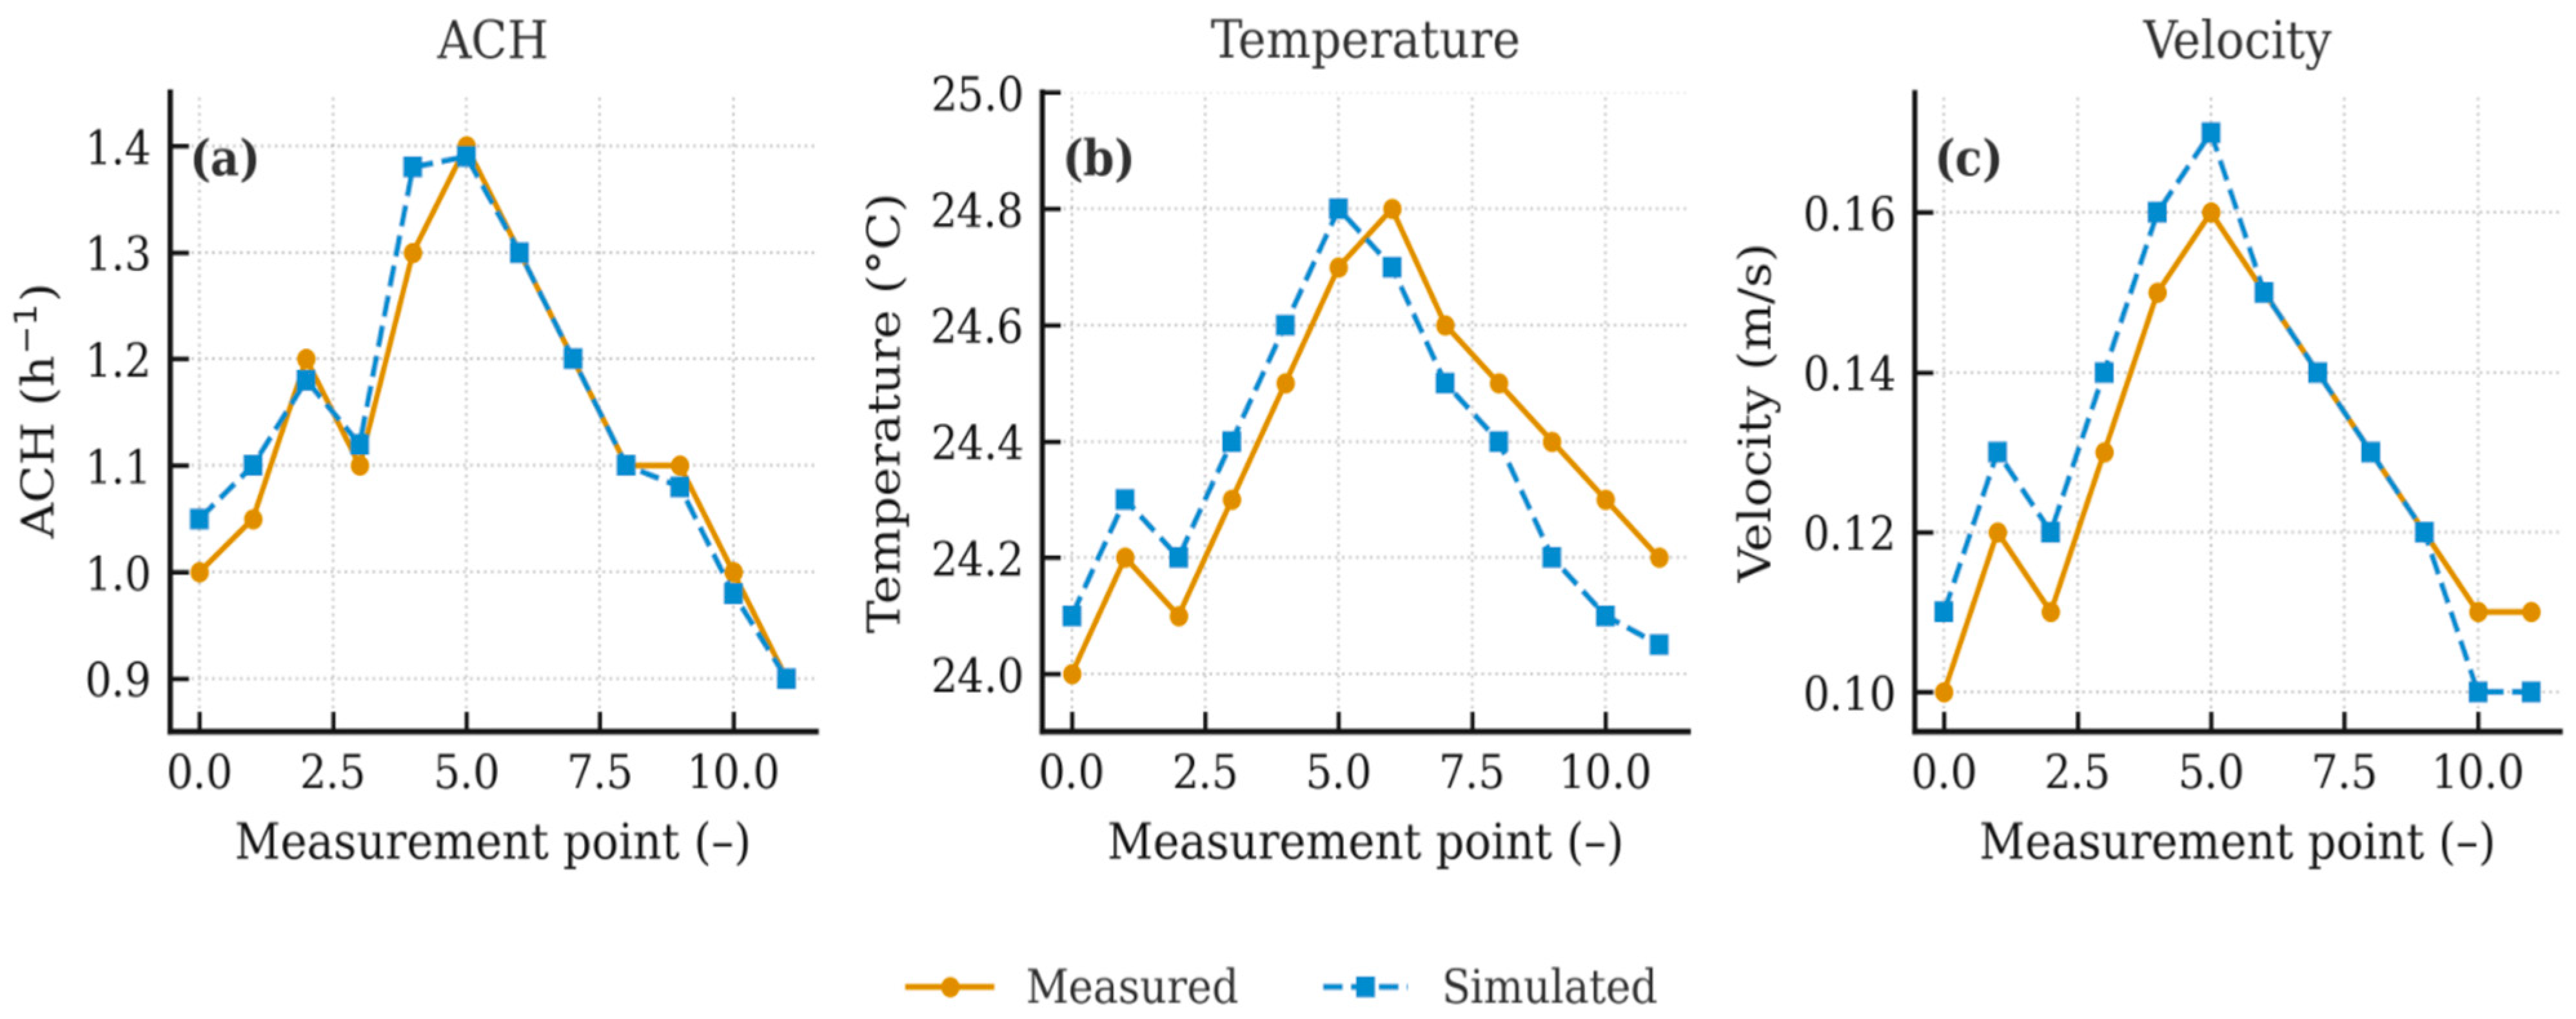
Validation of the simulation model against temperature, air velocity, and ACH (air change per hour) under comparable environmental conditions is depicted in
Figure 9. The simulated profiles closely resemble the measured values for all three parameters, both in terms of absolute magnitude and variation across measurement points. This consensus indicates that the model provides sufficient information on dominant airflow patterns and thermal behavior of the various spaces, affirming its utilization for the following PVOM-based ventilation opportunity analysis.
Air change rate (ACH), air temperature, and air velocity, recorded in
Figure 9, were acquired through on-site spot measurements in Buildings A and B under representative operating conditions. Low-velocity airflow and thermal assessment were conducted using standard indoor environmental monitoring instruments to collect measurements. Data collection was carried out over short time intervals to capture indicative ventilation behavior rather than long-term performance trends. Measurement points were established within occupied zones at representative heights and positions corresponding to the spatial configuration of the BIM models, enabling qualitative comparison of measured values, simulated outputs, and PVOM-based predictions. Field measurements were performed at an approximately 1.1 m height in the occupied zones using calibrated hot-wire anemometers (±0.03 m/s accuracy) and temperature sensors (±0.5 °C accuracy). Data were collected over 30 min intervals under outdoor wind speeds ranging between 1.8 and 2.3 m/s. Measurement points were aligned with BIM-defined room centroids to enable qualitative comparison between measured ventilation behavior and PVOM-derived opportunity levels. Validation concentrated on trend consistency rather than numerical equivalence (as PVOM evaluates relative ventilation potential rather than absolute airflow).
The simulated values presented in
Figure 9 were derived from the PVOM framework instead of CFD simulations. These results are relative, space-averaged estimates of ventilation opportunity, airflow behavior, and thermal conditions inferred from BIM-based geometric configuration, internal connectivity, and envelope exposure. The simulated indicators were directly mapped to the relevant spaces within the BIM models of Buildings A and B, and thereby facilitated a qualitative comparison of estimated ventilation opportunity and measured indoor environmental behavior.
Figure 9, Model validation for indoor environmental parameters. Comparison of measured and simulated (a) air change per hour (ACH), (b) air temperature, and (c) air velocity across the monitored measurement points. The close correspondence in both magnitude and trends between the measured and simulated series indicates that the modeling framework reliably reproduces the main airflow and thermal behaviors within the tested indoor spaces.
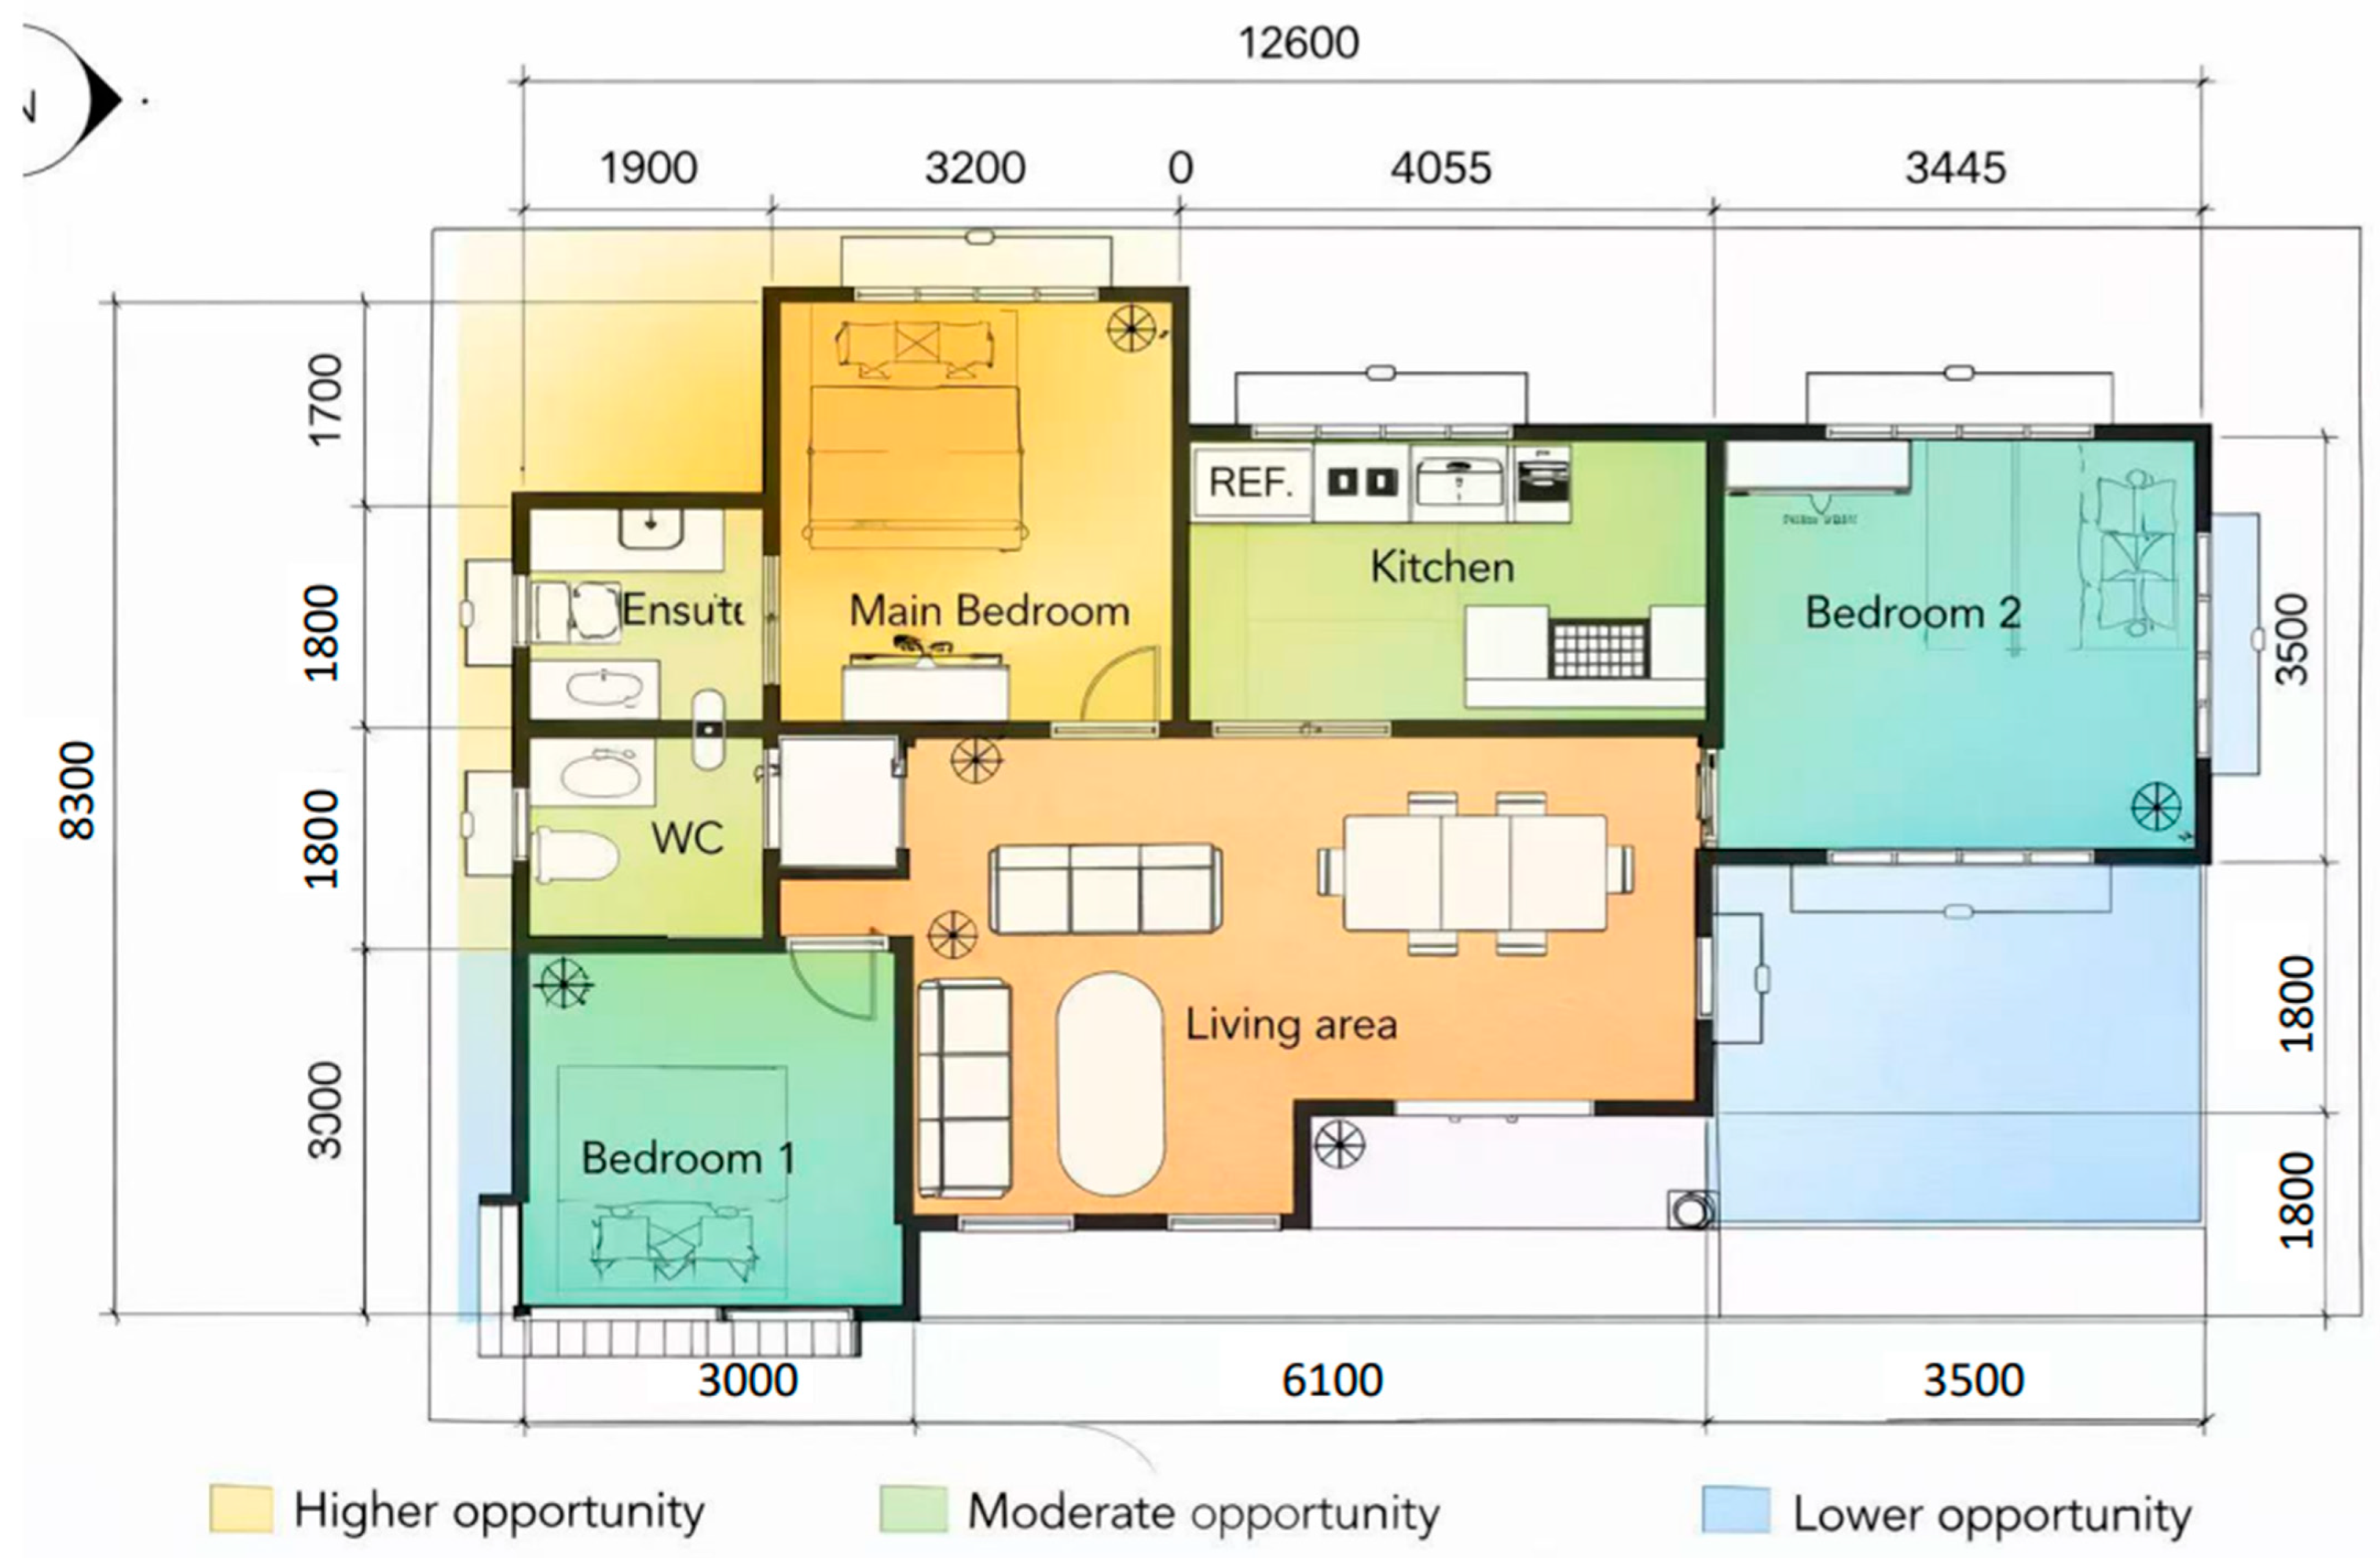
Building A Ventilation Opportunity Map
Figure 10 displays the spatial distribution of ventilation opportunity in Building A using a BIM (Building Information Modeling)-based color-coded PVOM map. As shown in this image, PVOM-derived values are affected by room geometry, façade opening configurations, and internal space connections, and overlaid gradients have been used to show these values. The warmer yellow–green hues represent areas with moderate-to-high ventilation opportunity, whereas the cooler blue tones are zones where airflow is limited. The Main Bedroom and Kitchen Area, as well as the Living Area, show a good deal of ventilation potential due to a very good inlet–outlet alignment and greater exposure to external façade openings. Bedroom 1 and Bedroom 2 also perform moderately well, while those for the central WC and Ensuite exhibit comparatively lower ventilation opportunity because of their enclosed configuration and limited direct exposure. These spatial patterns illustrate how building form and layout dictate accessibility to ventilation and advocate for the application of PVOM as a diagnostic tool for early-stage performance evaluation and design optimization.
Figure 10, Floor plan-based rendering of PVOM opportunity zones for Building A. Semi-transparent color overlays represent normalized PVOM scores (0–1), indicating relative ventilation opportunity across rooms. Higher scores (yellow–green tones) are concentrated in the Living Area and Main Bedroom due to stronger façade exposure and inlet–outlet alignment. Moderate values appear in the Kitchen and Service Spaces, while lower scores (blue tones) occur in deeper or more enclosed zones such as Secondary Bedrooms and Internal Service Areas. The visualization highlights how room geometry, spatial depth, and window placement influence comparative ventilation potential. PVOM values reflect relative opportunity rather than absolute airflow performance.
4.5. Performance Metrics Visualization
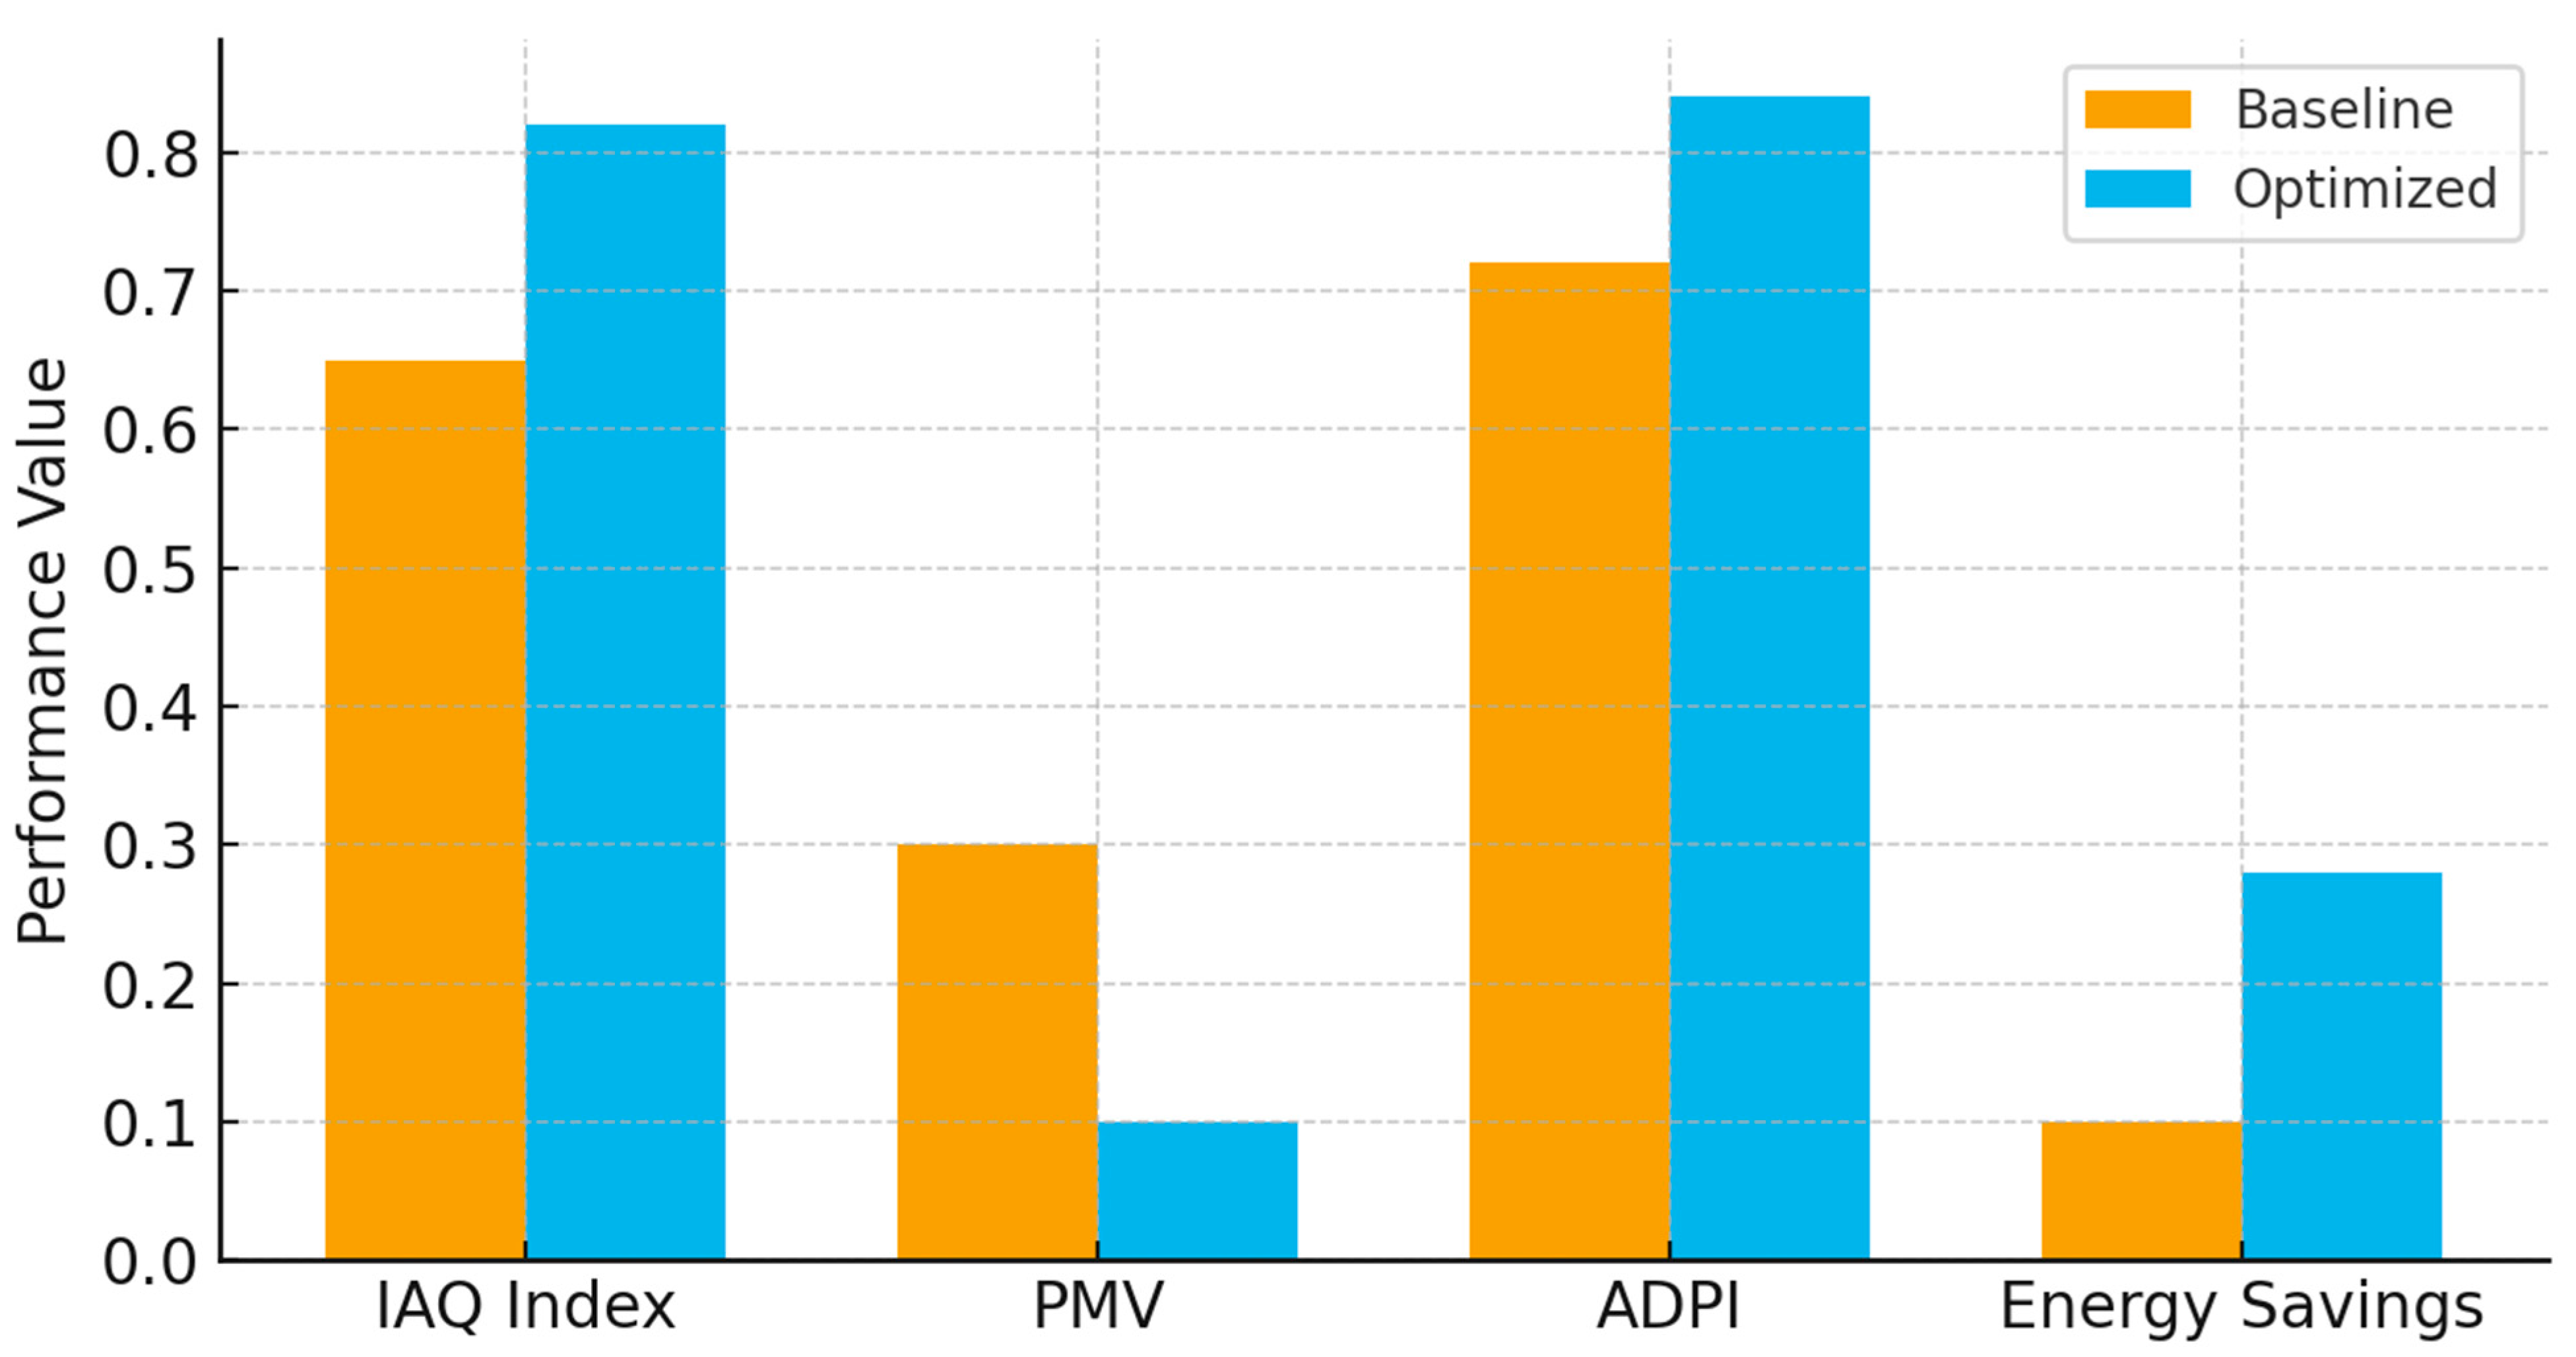
Figure 11 visualizes performance metrics comparing the baseline and optimized design scenarios for each of four parameters: Indoor Air Quality (IAQ) Index, Predicted Mean Vote (PMV), Air Distribution Performance Index (ADPI), and projected Energy Savings. Together, these KPIs illustrate the effects of ventilation-based design changes on indoor environmental quality and overall building performance. In the optimized scenario, the IAQ Index significantly improved, which can be attributed to the enhanced dilution of pollutants and increased airflow effectiveness. PMV values shift toward a more thermally comfortable range, revealing improved temperature and airflow balance within the occupied areas. The ADPI also shows a measurable increase, indicating more uniform ventilation and airflow throughout the interior. The Energy Savings parameter indicates a substantial increase, representing a potential reduction in the mechanical cooling demand from improved passive ventilation pathways. Taken together, these results offer a multi-dimensional assessment of the benefits of the proposed optimization strategies.
Predicted Mean Vote (PMV) values, as shown in
Figure 11, were calculated based on ISO 7730 [
42] and ASHRAE Standard 55 [
43] assumptions. Standard metabolic rate and clothing insulation metrics for sedentary indoor activities were adopted, and PMV was evaluated under equivalent representative airflow and thermal regimes utilized for the comparative study. The PMV values are aimed at giving a general measure of thermal comfort trends between distinct ventilation configurations, not a specific prediction of occupant comfort.
Comparison of baseline and optimized performance across key indicators, including IAQ Index, PMV, ADPI, and Energy Savings. The optimized scenario demonstrates higher IAQ performance, improved thermal comfort (lower PMV), enhanced airflow distribution (higher ADPI), and increased Energy Savings, indicating the overall effectiveness of the ventilation-oriented design enhancements.
4.6. Optimization Results: Pareto Front Analysis
The Pareto-optimal solutions used in this study were the result of an iterative multi-objective evaluation approach and not stochastic or evolutionary optimization. An alternative set of design configurations was created by methodically tuning geometry parameters associated with ventilation (i.e., the opening size, the opening position, and the envelope porosity) according to PVOM diagnostics. Each design alternative was evaluated using selected PVOM indicators (ACH-P, CVS, and SAC), together with indicative thermal comfort (PMV) and energy performance trends. The developed solutions were then compared in a multi-objective space, where no single objective was preferentially allocated. The Pareto-optimal solutions were defined as non-dominated configurations in which improvement of one objective will lead to the deterioration of at least one other objective. This approach enables the discovery of balanced design solutions that will enhance the ventilation opportunity but must also offer acceptable comfort and energy performance, a concept that is on par with the initial exploration nature of the proposed framework.
Optimization Results: Pareto Front Analysis
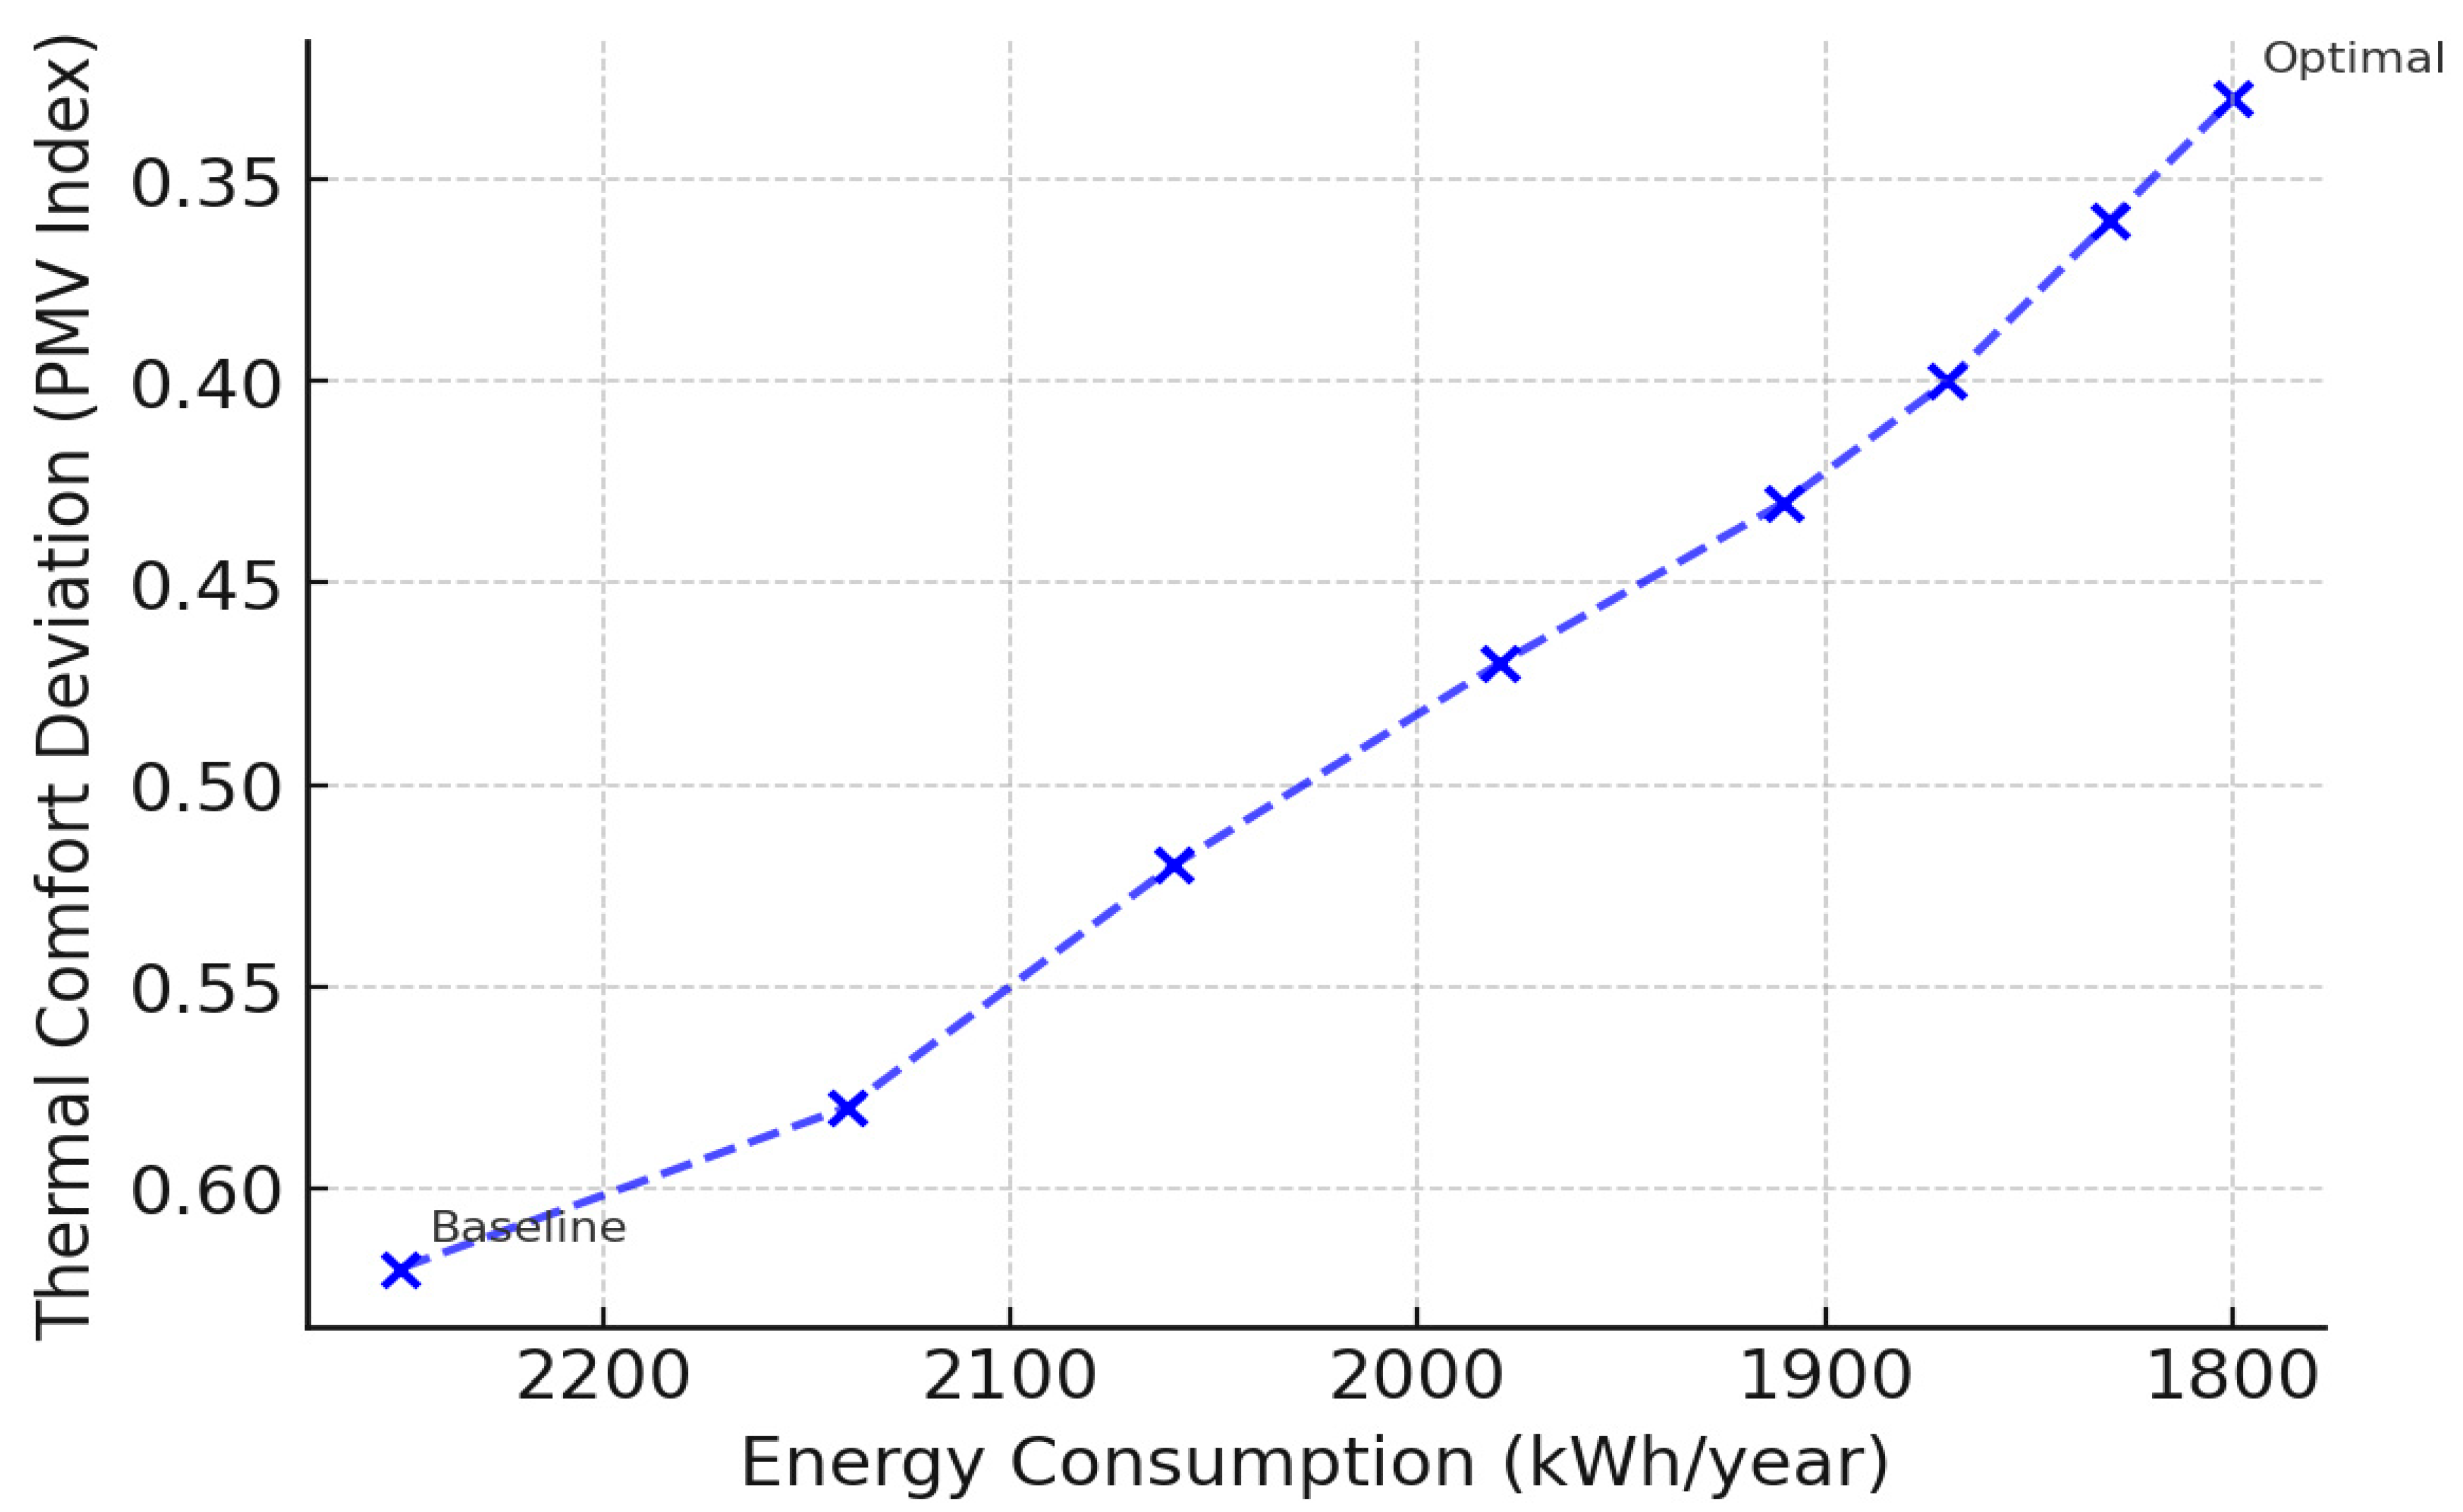
Figure 12 depicts with a Pareto front visualization for the trade-off between thermal comfort and annual energy consumption for each of the studied cases. Each point is a possible setting created by multi-objective optimization, so that the gain in one objective can negatively affect the performance in the other objective. Points have an obvious efficiency relationship, with the baseline at the upper-left of the plot (where discomfort and energy consumption are higher), while progressively optimized configurations tend to be in the lower-right location, meaning users have more thermal comfort and less energy intake. The values of the energy consumption on the x-axis (e.g., 2250, 2140, 2060, 1980, 1910, 1870, 1830, and 1800 kWh/year) are representative of the anticipated yearly operating energy necessary for heating, cooling, and ventilation. The smaller the value, the more energy-efficient the designs. Analogously, the thermal comfort deviation (PMV-based) on the y-axis is indicated in lower degrees showing better comfort conditions. The shape of the Pareto front illustrates how well-balanced optimized ventilation strategies can decrease the energy needs and enhance interior comfort at the same time.
The optimization results presented in this section were obtained through an iterative multi-objective evaluation process, where alternative design configurations generated by the proposed optimization strategies were evaluated on selected PVOM indicators, thermal comfort (PMV), and indicative energy performance trends. Instead of optimizing one metric alone, by design, the multi-objective approach allows for the identification of balanced design solutions, which increase opportunities for ventilation and yet achieve acceptable comfort and energy-related performance. While the variation patterns of PMV and energy consumption look relatively consistent, as shown in
Figure 12, it is important to maintain the optimization framework so that an over-optimization under a singular metric is not undertaken in practice and design decisions are made more fully based on several performance factors.
Figure 12: Pareto Front: Thermal Comfort vs. Energy Consumption. Pareto front showing the trade-offs for thermal comfort deviation and annual energy consumption for different design configurations. The baseline setup exhibits higher levels of discomfort and energy use, while optimized solutions gradually approach the range closer to Pareto’s boundary, where further improvement in one objective cannot be achieved without compromising the other. The point marked “Optimal” is the most balanced, achieving significant reductions in thermal discomfort and energy use (down to 1800 kWh/year).
4.7. CFD Result Visualizations
CFD Model Setup and Validation Purpose
To validate the ventilation opportunities derived from the PVOM framework, a CFD simulation was conducted for an ideal representative design case. Used as a post-optimization verification tool rather than a design driver, the CFD analysis aims to assess whether the predicted spatial ventilation patterns correspond to physically plausible airflow and contaminant transport behavior. The studied arrangement was selected from the Pareto-optimal solution set generated through the multi-objective optimization process. Rather than representing an extreme solution favoring a single objective, the selected scenario reflects a balanced compromise between air delivery performance and architectural viability. The CFD simulation was conducted using a standard three-dimensional CFD solver, assuming incompressible airflow under steady-state conditions. Ventilation openings designated in the BIM model as operable windows were represented as pressure-based boundary conditions, while the remaining envelope surfaces were considered airtight walls in order to isolate the influence of intentional natural ventilation pathways. A passive scalar was introduced as a contaminant source at a central location within the occupied zone to represent average indoor pollutant emission. The simulation focused on airflow distribution and contaminant removal; therefore, thermal buoyancy effects were simplified and treated as secondary. A hybrid unstructured mesh was generated, with local refinement applied at openings and within occupied regions to ensure adequate resolution of airflow features.
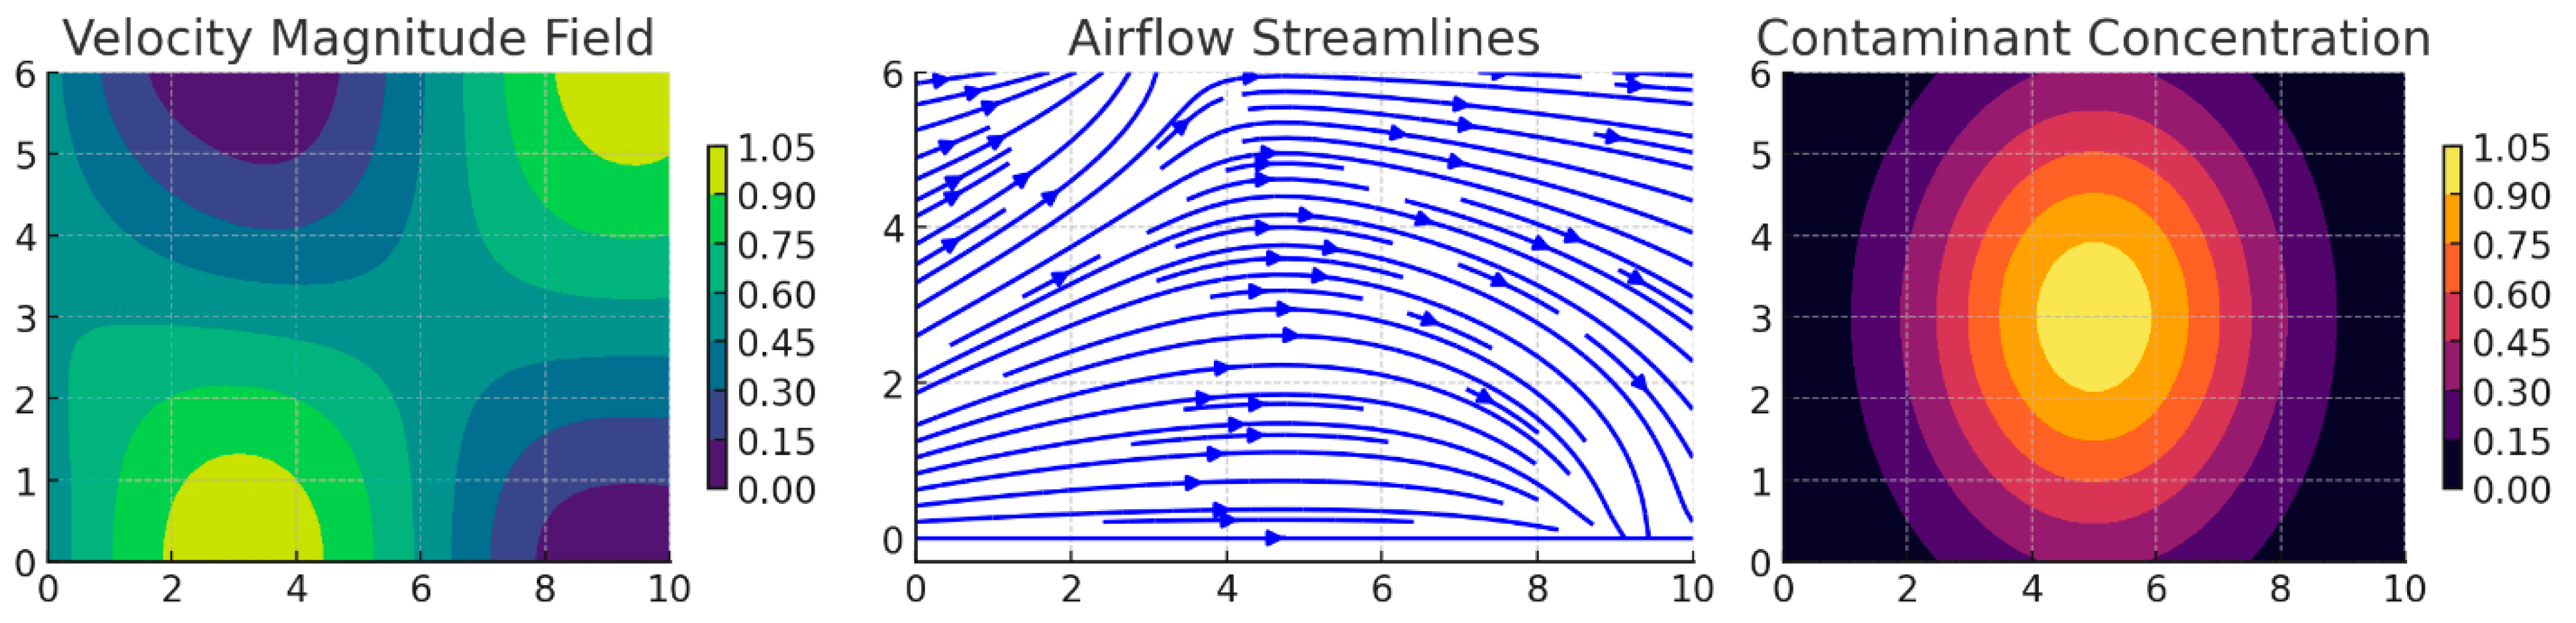
Figure 13 depicts the Computational Fluid Dynamics (CFD) visualizations for the chosen optimal design scenario that depicts airflow and indoor environmental performance in the primary building rooms. These visual representations include velocity vector fields, airflow streamlines, and spatial distribution of air velocity magnitude to demonstrate how fresh air flows into, travels through, and leaves the indoor interior. Visualizations of the airflow patterns show the major flow paths affected by the opening geometry, the orientation of the façade, and the spatial connectivity inside the space. High-velocity areas are usually around inlet openings and along primary circulation areas, while lower-velocity pockets can be found in recessed corners or enclosed areas with less exchange of airflow. The velocity contour fields show that the optimal design can promote strengthened and more uniform air movement through the primary occupied zones, increasing cross-ventilation effectiveness. Furthermore, contaminant concentration distributions are also mapped to assess indoor air quality conditions. Lower concentration zones represent areas with greater airflow (suggesting greater pollutant dilution), while stagnant areas represent more contaminants (high level of accumulation). This CFD analysis approach presents a high-resolution overview of ventilation performance and helps in confirming the gains predicted, supported by PVOM-based optimization.
Figure 13 corresponds to Building A, which is used as the primary case study for detailed CFD-based validation, with the section plane aligned to the representative floor plan layout. CFD simulation indicated steady-state incompressible airflow at a reference wind speed of 2.0 m/s applied at the inlet boundary. We used a standard k–ε turbulence model. Operable windows were assumed as pressure-based inlet and outlet boundaries, and all other envelope surfaces were assigned to no-slip walls. A locally refined unstructured mesh was applied near openings and occupied zones to capture dominant flow features. Since the CFD was a qualitative plausibility demonstration, formal grid-independence testing was not performed.
CFD visualizations show airflow velocity fields, streamlines, and contaminant concentration distributions within the optimized building configuration. The images highlight dominant airflow pathways, high- and low-velocity regions, and spatial variations in pollutant dispersion. Enhanced airflow uniformity and reduced contaminant accumulation in the optimized scenario confirm the effectiveness of the design improvements derived from the optimization and PVOM analysis.
4.8. Summary of Results
In this section, highlights of the spatial, ventilation, and optimization analyses have been presented. Spatial morphometric indicators revealed how room depth, opening distribution, compactness, and internal connectivity varied in their influence on the baseline ventilation potential in the two buildings. Baseline PVOM results identified rooms with limited airflow performance and established the need for optimization. From the Pareto analysis we were able to show a trade-off between thermal comfort and energy consumption, which were both benefits of an optimization process for ventilation. The optimal solution selected showed substantial reductions for both metrics compared to the baseline. CFD visualizations illustrated these enhancements with better airflow pathways, reduced stagnant zones, and superior pollutant dispersion to perform better in the optimized configuration. The additional indications that showed the positive effects of the optimized design were IAQ, PMV, ADPI, and Energy Savings. The findings suggest that the integrated PVOM–optimization workflow enhances natural ventilation performance more effectively overall and promotes more sustainable building design.
5. Discussion
The results of this study demonstrate that spatial geometry, ventilation possibilities, and multi-objective performance can be closely related and interrelated factors of low-rise residential buildings. Through the PVOM-oriented approach we show that geometric features, in particular room depth, façade porosity, spatial compactness, and internal connectivity, are determinants of natural ventilation potential. These morphometric indicators not only diagnose the limitation of ventilation but also inform the rational design of geometric interventions. The spatial morphometric evaluation revealed that buildings that were shallower in their room depths, more porous in their façades, and interconnected in their interiors generally had higher baseline PVOM scores. In the case studies, Building A (higher articulated footprint and more façade exposures) and Building B (small and shallow layout) showed the impact of different geometry patterns on the distribution of ventilation opportunity. These disparities and geometric variations highlight the differences in baseline PVOM scores, thus reiterating the importance of form and layout in determining airflow pathways prior to any optimization. The analysis of the low-performing subspaces confirms and substantiates the existing understanding that natural ventilation is not uniformly effective over the totality of a plan and must be perceived spatially. Utilizing multi-objective optimization as part of the PVOM workflow provided an organized approach to investigate the trade-offs between thermal comfort and energy usage. The resulting Pareto front unambiguously captured the inherent conflict between these aims—better comfort is generally the product of more airflow and adaptive environmental management, while lower energy consumption typically requires less mechanical intervention.
The “optimal” shape found in this study preserved a balance over the Pareto front, leading to significant decreases in both thermal comfort deviation and annual energy expenditure relative to baseline. This result underscores fine gains in performance based on small geometric changes, such as repositioning or modifying openings and controlling envelope porosity, can be obtained if informed by solid geometry-based ventilation measures. CFD analysis on the optimized layouts confirmed the correctness of a PVOM technique-controlled optimization. The simulations revealed a more coherent flow of airflow, stronger, and more continuous cross-ventilation paths between the spaces, and less spotty air zones within the optimized settings. These dynamic flow parameters align with the numerical results in the PVOM scores and their related performance measures (ACH-P, CVS, and SAC). The agreement among PVOM predictions, optimization outputs, and CFD results offers methodological triangulation that enhances confidence in the unified approach. More information was generated than just ventilation measurements: we proved that, in essence, ventilation-oriented geometric optimization had a multi-dimensional impact on the IAQ Index, PMV, ADPI, projected Energy Savings, and so on.
There were significant changes in the IAQ and ADPI, implying that greater efficiency in airflow paths would lead to healthier, balanced indoor air quality. At the same time, decreases in the deviation of thermal comfort and energy consumption demonstrate passive ventilation techniques, and a corresponding reduction in operational loading can further contribute to a lower operating load. Together, this analysis highlights the need for the introduction of natural ventilation as one of the design variables of sustainable buildings with a primary focus on sustainable building, rather than a secondary or qualitative variable in such a framework. From a practice perspective, it is found that significant enhancements in natural ventilation performance can be realized without significant structural redesign. Small, strategically aimed adjustments to the opening location, size, and connectivity will produce disproportionately large improvements in ventilation and comfort. To this end, the study recommends utilizing tools such as PVOM and multi-scale spatial morphometrics during the early architectural design stage to support decision-making before the final geometry is established.
Moreover, the findings imply the significance of performance-driven and spatially explicit assessment rather than reliance on generic guidelines for thumb rules (e.g., global window-to-wall ratios), which might miss sensitive local influences. At the same time, this work provides indications of where additional attention is needed. PVOM yields short and data-light insights but, as it is currently a single point in time, PVOM is not sufficient to replace high-fidelity CFD under more complex or increasingly dynamic scenarios. Moreover, its outputs are still dependent on goal selection, boundary conditions, and the climatic context. Alternative Pareto-optimal solutions might emerge from different climates, occupancy patterns, or performance priorities. These considerations drive their further development in the context of multi-seasonal, multi-zone, and occupant-responsive applications. Overall, combining spatial morphometrics, predictive ventilation opportunity mapping, and multi-objective optimization in one BIM workflow provides hope toward developing ventilation-aware, performance-related design in low-rise sustainable buildings.
5.1. Application of BIM–PVOM at the Site Scale
Table 4 presents the scope of how the geometry-based ventilation assessment at the building level can be applied to informing microclimatic quality, outdoor comfort, energy performance and site- or neighborhood-scale planning decisions, thus facilitating ventilation-aware sustainable development in low-rise residential units. Ventilation opportunity maps help semi-open spaces, where natural airflow is strongest and most persistent.
5.2. Implementation and Practical Considerations
The PVOM workflow was implemented using Autodesk Revit 2023 (LOD 300 models). Geometric data extraction was performed using Dynamo 2.13 and Python 3.8 for post-processing.as part of the post-processing. Room volumes, opening areas, and adjacency relationships were automatically extracted from the BIM environment. For the case study buildings (∼120–150 m2), complete PVOM evaluation was performed in about 8–12 min per model on a standard workstation. Correctly bounded rooms, properly parameterized door and window families, and clear identification of exterior-facing elements are needed for reliable implementation. It does not require additional CFD or building energy simulation software.
6. Conclusions and Limitations
6.1. Conclusions
This study presents and demonstrates an exploratory BIM-based methodology to conduct spatial morphometric analysis, Predictive Ventilation Opportunity Mapping (PVOM), multi-objective optimization, and use the CFD simulation methodology to evaluate and optimize the natural ventilation capability in low-rise residential building model. These results showed that spatial geometry has a decisive impact on the baseline ventilation capacity. Differences in room depths, opening spaces, compactness, and in-built connection were found to exert significant stress on the spatial distribution of airflow, thereby supporting the utility of morphometric metrics as diagnostic indicators. In this way, the baseline PVOM assessment, from the perspective of the major opportunities for ventilation, helped identify these deficiencies and provided a basis for optimization. The results of the optimization process showed a transparent Pareto front representing the trade-off between thermal comfort and energy consumption. The optimal configuration was found to deliver both a corresponding decrease in comfort deviation and a decrease in energy demand, indicating that the use of multi-objective optimization can drive balanced high-performance design results. CFD simulations confirmed these benefits, indicating that there are better air pathways, fewer stagnant regions, and more continuous air distribution in the optimized model. More extensive performance measurements (IAQ, PMV, ADPI, and energy consumption savings) illustrated the bigger impact on environmental and comfort performance gained by the optimized design. The results generally emphasize the applicability of combining PVOM with geometric computation and optimization for early design decision making, providing a practical procedure towards enhancing natural ventilation in low-rise residential buildings.
The conclusions presented in this study are derived directly from the comparative results obtained through the PVOM framework across baseline and optimized design configurations. The findings demonstrate relative improvements in ventilation opportunity at the room and building levels, as quantified by changes in normalized PVOM scores following geometric and opening-based optimization strategies. These results support the conclusion that BIM-derived morphometric indicators can effectively inform early-stage ventilation-sensitive design decisions. The outcomes are intended to guide comparative assessment rather than to predict absolute airflow performance.
6.2. Limitations
Despite the promising outcomes there are several limitations of this study. First, the PVOM framework relies on geometric and topological properties obtained using BIM to determine ventilation opportunity, thus failing to explicitly resolve the full fluid dynamics of airflow. So, although the analysis and validation against CFD simulations and measured parameters (velocity, temperature and ACH) indicate that the methods represent the trends that most dominate airflow behavior, PVOM is still a simplified, geometry-driven model. Additional calibration or inter-coupling with higher-fidelity models is necessary for building forms with higher complexity, multi-story configurations or very turbulent flow regimes. Secondly, the optimization process focused on a limited set of goals: thermal comfort (PMV-based deviation) and annual energy consumption. As a result, the Pareto-optimal solutions reported in this work are based on these performance targets and the corresponding weighing between them. When adding other objectives, like daylight supply, acoustic comfort, construction cost or embodied carbon, the configuration of the Pareto front may be adjusted into different “optimum” configurations. Additionally, the optimization answers can be sensitive to the specific climatic and boundary conditions assumed, and the trade-offs can differ between climatic regions or seasonal patterns, forcing a re-parameterization of the framework. Third, the CFD simulations performed for validation were made using steady-state assumptions while keeping idealized boundary conditions. Transient effects, occupant interactions (for example, the behavior of adaptive window openings), different internal heat gains and dynamic internal layout/usage changes were not explicitly modeled but can dramatically influence airflow patterns and the indoor air quality in practice. This may lead to reduced correspondence between the simulation of the behavior and actual performance in highly dynamic and behaviorally complex scenarios. Also, the empirical research is limited to two low-rise residential case study buildings. A controlled, author-designed dwelling (Building A) and public official reference dwelling (Building B) create useful variation in spatial arrangement. However, these comparisons do not encompass the full spectrum of residential typologies, mixed-use buildings or dense urban blocks. The generalizability of the PVOM model across larger, multi-level or highly compact urban settings thus still needs to be tested. Finally, the analysis takes for granted a perfect external condition of the buildings without modeling nearby obstructions and vegetation, challenging terrain and small wind turbulence, which may alter the pressure distributions and efficient porosity of the facades. These environmental modifiers may influence local ventilation performance and restrict the immediate applicability to the heavily restricted or morphologically intricate locations. Future research work will further extend the practical application of the results by using more detailed microclimatic modeling, a greater diversity of the building typologies and climates considered, and, through sensor-based or data-driven validation of BIM–PVOM methodology, to further increase the robustness of its methods and demonstrate their practicality.
The energy performance evaluation provided in this study is intended to give indications as to possible trends in energy consumption as opposed to a prediction of operational energy usage. The external climate was treated in a generalized manner rather than an analysis of site-specific weather, and no fully dynamic building energy simulations were carried out. Energy-modeled approximations are based on differences in ventilation opportunity and related heating and cooling demand tendencies, and are not based on direct determination of energy loads. Thus, rather than simply describing absolute energy consumption or savings, the assessment aims to demonstrate the relative influence of design decisions oriented towards ventilation to potential energy performance trends.
The existing PVOM framework is designed specifically for naturally ventilated buildings and designs for early-stage buildings. However, the present formulation does not explicitly include mechanically driven supply–exhaust ventilation systems with heat recovery, which are typically needed for energy-efficient buildings in cold climates. The original basis of spatial airflow opportunities, connectivity, and envelope exposure could be modified for mechanically assisted ventilation (e.g., through the redefinition of airflow sources and routing mechanisms), though such extension is beyond the scope of the current study. The applicability of PVOM to cold climate environments and hybrid or fully mechanical ventilation systems is therefore identified as a key direction for future research.
The CFD analysis included in this study is limited to a single representative scenario and is intended solely as a qualitative plausibility demonstration; it does not constitute a comprehensive validation of the PVOM framework. The current framework evaluates spatial ventilation opportunity independently from occupant behavior, adaptive window operation, and socio-cultural usage patterns. Integration of behavioral models represents an important extension beyond the scope of the present geometric methodology. Broader validation across additional building typologies, climates, and occupancy contexts is required before generalizing the framework beyond low-rise residential applications.
6.3. Future Work
These research findings can be extended into many important areas for future research. First, the PVOM study is useful only for establishing an explicit model by using seasonal wind variation, diurnal temperature fluctuations, and transient patterns of airflow. Incorporating real-time weather information or climate-responsive algorithms may improve the predictive ability of PVOM and its generalizability to different climates. Second, the optimization model might be extended by adding other criteria besides thermal comfort and energy consumption. Including measurements like daylight availability, acoustic comfort, building cost, or embodied carbon would also allow for a greater variety of multi-performance assessments. A further path forward is to consider occupant-driven optimization based on adaptive comfort, behavioral patterns, or window control strategies, among others. Third, CFD simulations can be improved in their use of transient solvers, more fine-grained turbulence models, and boundary states by considering shifts in occupant behaviors, increases in internal heat gains, and effects of external obstructions. However, pairing CFD and validation using data-driven input from sensor-based field measurements could further validate the simulation findings. Fourth, the workflow can be evaluated by a greater degree of building varieties (multi-story residential buildings, mixed-use developments, and denser urban environment design). The application approach to broader groupings of people or the environment may expose how urban morphometrics affect ventilation at a scale from small to high. Further applications will also include the development of low-cost tools and automatic scripts that can combine spatial morphometrics, PVOM, and optimization into BIM environments. These tools would allow practitioners to use the framework at early design stages, enabling more ventilation-responsive and sustainable architectural solutions.