Article

Experimental Study of the Effects of Grout Filling Completeness on the Performance of Grouted Sleeve Connections

1
China Construction Industrial & Energy Engineering Group Co., Ltd., Nanjing 210046, China
2
Laboratory of Building Structure of Anhui Higher Education Institutes, Anhui Xinhua University, Hefei 230088, China
3
School of Urban Construction, Anhui Xinhua University, Hefei 230088, China
4
School of Civil Engineering, Anhui Jianzhu University, Hefei 230601, China
*
Author to whom correspondence should be addressed.
Buildings 2026, 16(5), 998; https://doi.org/10.3390/buildings16050998
Submission received: 4 January 2026 / Revised: 2 February 2026 / Accepted: 18 February 2026 / Published: 4 March 2026
(This article belongs to the Section Building Structures)

Abstract

Grout filling completeness (GFC) is the primary factor affecting the mechanical properties of grouted sleeve connections. To investigate the influences of vertical top void defects on semigrouted sleeve connections, two groups of samples with different rebar diameters (14/16 mm) were designed, incorporating five levels of grouting fullness gradients (GFGs): 60%, 70%, 80%, 90%, and 100%. A total of 60 semigrouted sleeve connection samples were prepared and subjected to uniaxial tensile tests and high-stress cyclic loading tests. The changes in the failure modes and mechanical responses under varying loads were systematically analyzed. The results indicated the following: (1) GFC Threshold Effect: When the GFC was less than 90%, both groups of connections failed to maintain reliable performance, with failure modes transitioning from rebar tensile fracture to interfacial bond-slip failure. Under cyclic loading, interfacial bond-slip failure occurred six times more frequently in the 16 mm-diameter samples than in the 14 mm-diameter samples, indicating significantly reduced reliability for larger diameters. (2) Uniaxial Tensile Behavior: The strength metrics of both joint groups exhibited consistent correlations with the GFC. The yield limits were weakly correlated, whereas the ultimate tensile strengths were significantly strongly correlated. The residual deformation and grout damage depth were not uniformly correlated with the GFC. As the GFC decreased, the yield phase elongation and elongation in the experimental curves generally increased. (3) High-Stress Cyclic Loading Behavior: The mechanical parameters of the 14 mm-diameter samples were not significantly correlated with the GFC. Conversely, the 16 mm-diameter samples exhibited dual dependencies on strength and deformation, with the ultimate tensile strength and grout damage depth showing strong correlations. Under cyclic loading, yield phase elongation and overall elongation decreased inversely with decreasing GFC—a trend opposite to that under uniaxial tensile loading. This phenomenon provided critical theoretical support for the ductility design of prefabricated structural joints under seismic conditions.

1. Introduction

Grout sleeve splicing for rebar is a connection method that uses nonshrinkage cement-based grouting materials to bond rebar pieces under the confinement effect of sleeves [1]. As the predominant components of rebar connections in prefabricated concrete structures, grouted sleeve connections (GSCs) are critical for load transfer. The mechanical performance of GSCs fundamentally influences the integrity and seismic safety of vertical precast lateral load-bearing members.
During the service phases of structures, GSCs are subjected predominantly to either tensile or compressive uniaxial stress states. Therefore, uniaxial tensile tests featuring monotonic loading to failure are adopted to characterize their fundamental mechanical properties, aligning with the experimental protocols validated in existing studies of GSC behavior under axial loading [2]. To date, scholars have conducted extensive experimental and numerical simulations of GSCs and their applications [3,4,5,6,7]. These scholars have identified three primary failure modes of GSCs: (1) tensile fracture of the rebar joint, (2) slip-shear failure of the grout material, and (3) structural fracture of the sleeve body. Among these failure modes, interfacial bond-slip failure between the rebar and grout material has been recognized as the most critical failure mode [8], particularly when aggravated by grouting defects arising from construction practices. These defects include improperly sealed mortar layers, obstructed grouting channels, and foreign object blockages within the sleeve, all of which significantly compromise the structural integrity of GSCs. To improve the connection performance of joints, Alias, A. et al. [9] embedded spiral hoops and shear keys inside grouted sleeves that increased the bond strength between the sleeve and grout material and altered the failure modes of sleeve grouted joints. Henin, E. et al. [2] conducted experimental studies of two types of sleeve grouted joints, analyzed the failure patterns of each joint, and derived an average bond coefficient of 1.6 between the grout and sleeve based on frictional bond theory. Ren, G. et al. [7] and Chen, H. et al. [10] conducted numerical simulations of SGJs using finite element software ABAQUS 6.14. Their studies focused on the interactions among grouting sleeves, grouting materials, and reinforcing bars, with comparative analyses of the strength values, deformation capacities of the joints, and mechanical properties of the sleeves. The simulation results demonstrated close agreement with the experimental data, particularly in predicting the bond-slip behaviors and ultimate tensile strength thresholds under varying GFC conditions. Gao, R. D. et al. [11] demonstrated that grouting defects in the middle of the sleeve more significantly impact the mechanical properties of GSCs than edge defects. Furthermore, the experimental results of Li, X. M. et al. [12] demonstrated that when the grouting defect length at the sleeve end does not exceed 30% of the standard anchorage length (8d), the uniaxial tensile strengths of GSCs can still fulfill the specified requirements, aligning with their previous findings on grouting completeness thresholds. A comparative analysis by Liu, Q. Z. et al. [13] on clustered versus dispersed defects indicated that concentrated defects significantly increase the probability of rebar pull-out failure. Sun B et al. [14] investigated the influence of GFC on the mechanical properties of semigrouted sleeve connections (SGSCs). The results demonstrated that when the GFC level exceeds 87.5%, the residual deformation of the connections stops increasing.
In existing studies, uniaxial tensile tests were predominantly employed to evaluate the fundamental performance characteristics of GSCs. It has been demonstrated that grout-filled GSCs with good integrity exhibit excellent load transfer capabilities under normal service conditions. However, construction practices may induce grouting defects, such as inadequate sealing of the bedding mortar layer, obstruction of grout flow channels, and entrapment of foreign objects within sleeves. These imperfections lead to suboptimal GFC within the sleeves, thereby reducing the effective anchorage length of the embedded rebar. Notably, insufficient grout-filled GSCs within structural components may exhibit more complex stress states under seismic loading, potentially altering the steel–grout–sleeve interaction mechanisms. This phenomenon may trigger interfacial bond failure and lead to a sudden reduction in the bearing capacity. Although scholars have previously investigated the effects of grout material mix proportions and sleeve geometric parameters [5,15,16,17,18], the threshold effect of the GFC and its size dependency under cyclic loading still lack systematic investigation. Therefore, this study is focused on SGSCs in prefabricated shear wall structures. By designing multilevel GFGs (60–100%) and implementing dual-loading scenarios (uniaxial tension/cyclic tension–compression), vertical top void defects are investigated to reveal the evolution mechanisms of failure modes and mechanical responses in SGSCs. The findings establish a theoretical foundation for the optimization of the seismic design of prefabricated structural joints.

2. Experimental Program

2.1. Specimen Design

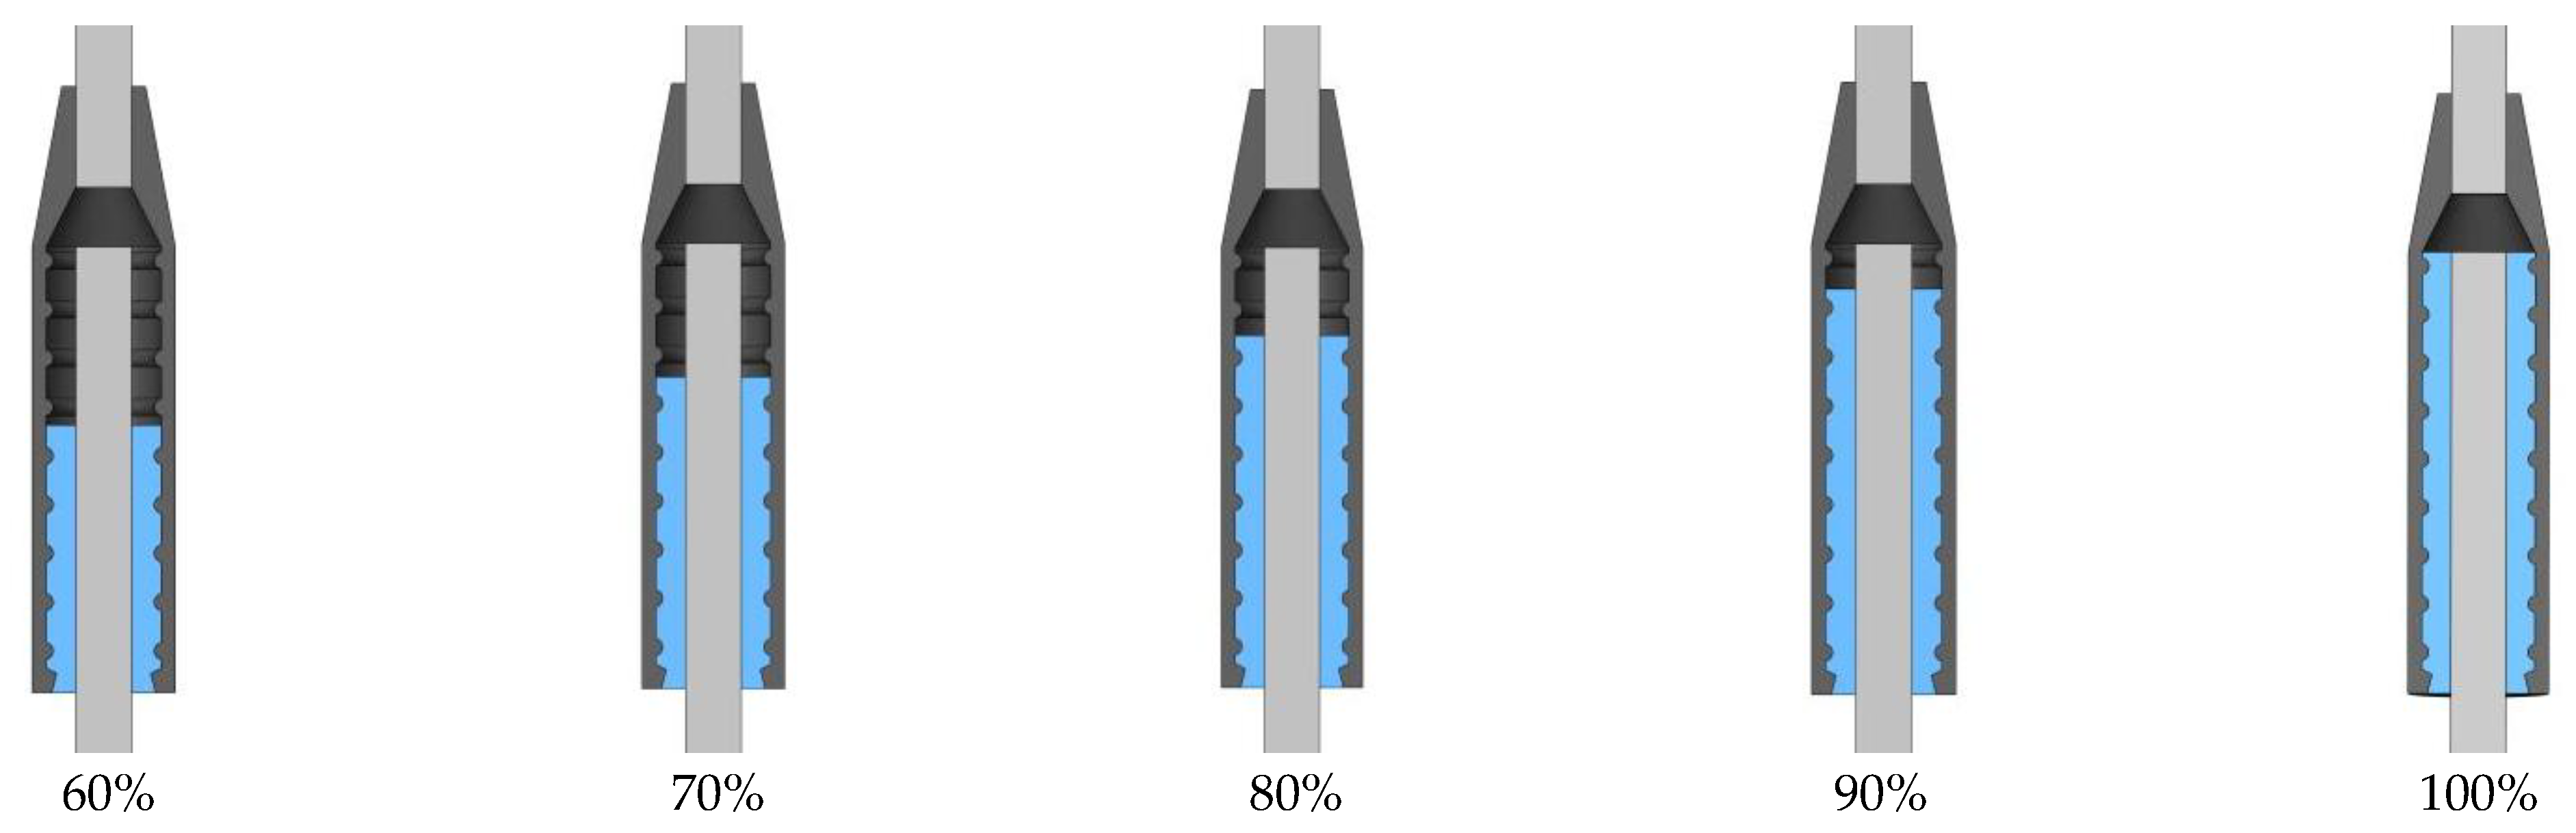
In this study, SGSC samples with five levels of GFC (as shown in Figure 1) and two rebar diameters (14 mm and 16 mm) were prepared. Each sample group was subjected to uniaxial tensile tests and high-stress cyclic loading tests. To minimize random experimental errors, three replicates per GFC level were tested under identical conditions.
The detailed parameters of the samples are provided in Table 1. A total of 60 samples were designed and categorized into groups on the basis of rebar diameter and GFC. Each group consisted of 6 samples with identical parameters, with 3 samples subjected to uniaxial tension loading and 3 samples subjected to cyclic tensile–compressive loading. In the table, d denotes the rebar diameter, x indicates the loading scenario (1: uniaxial tension; 2: cyclic tension–compression), and y represents the serial number of the sample under the same loading conditions (values: 1, 2, 3).
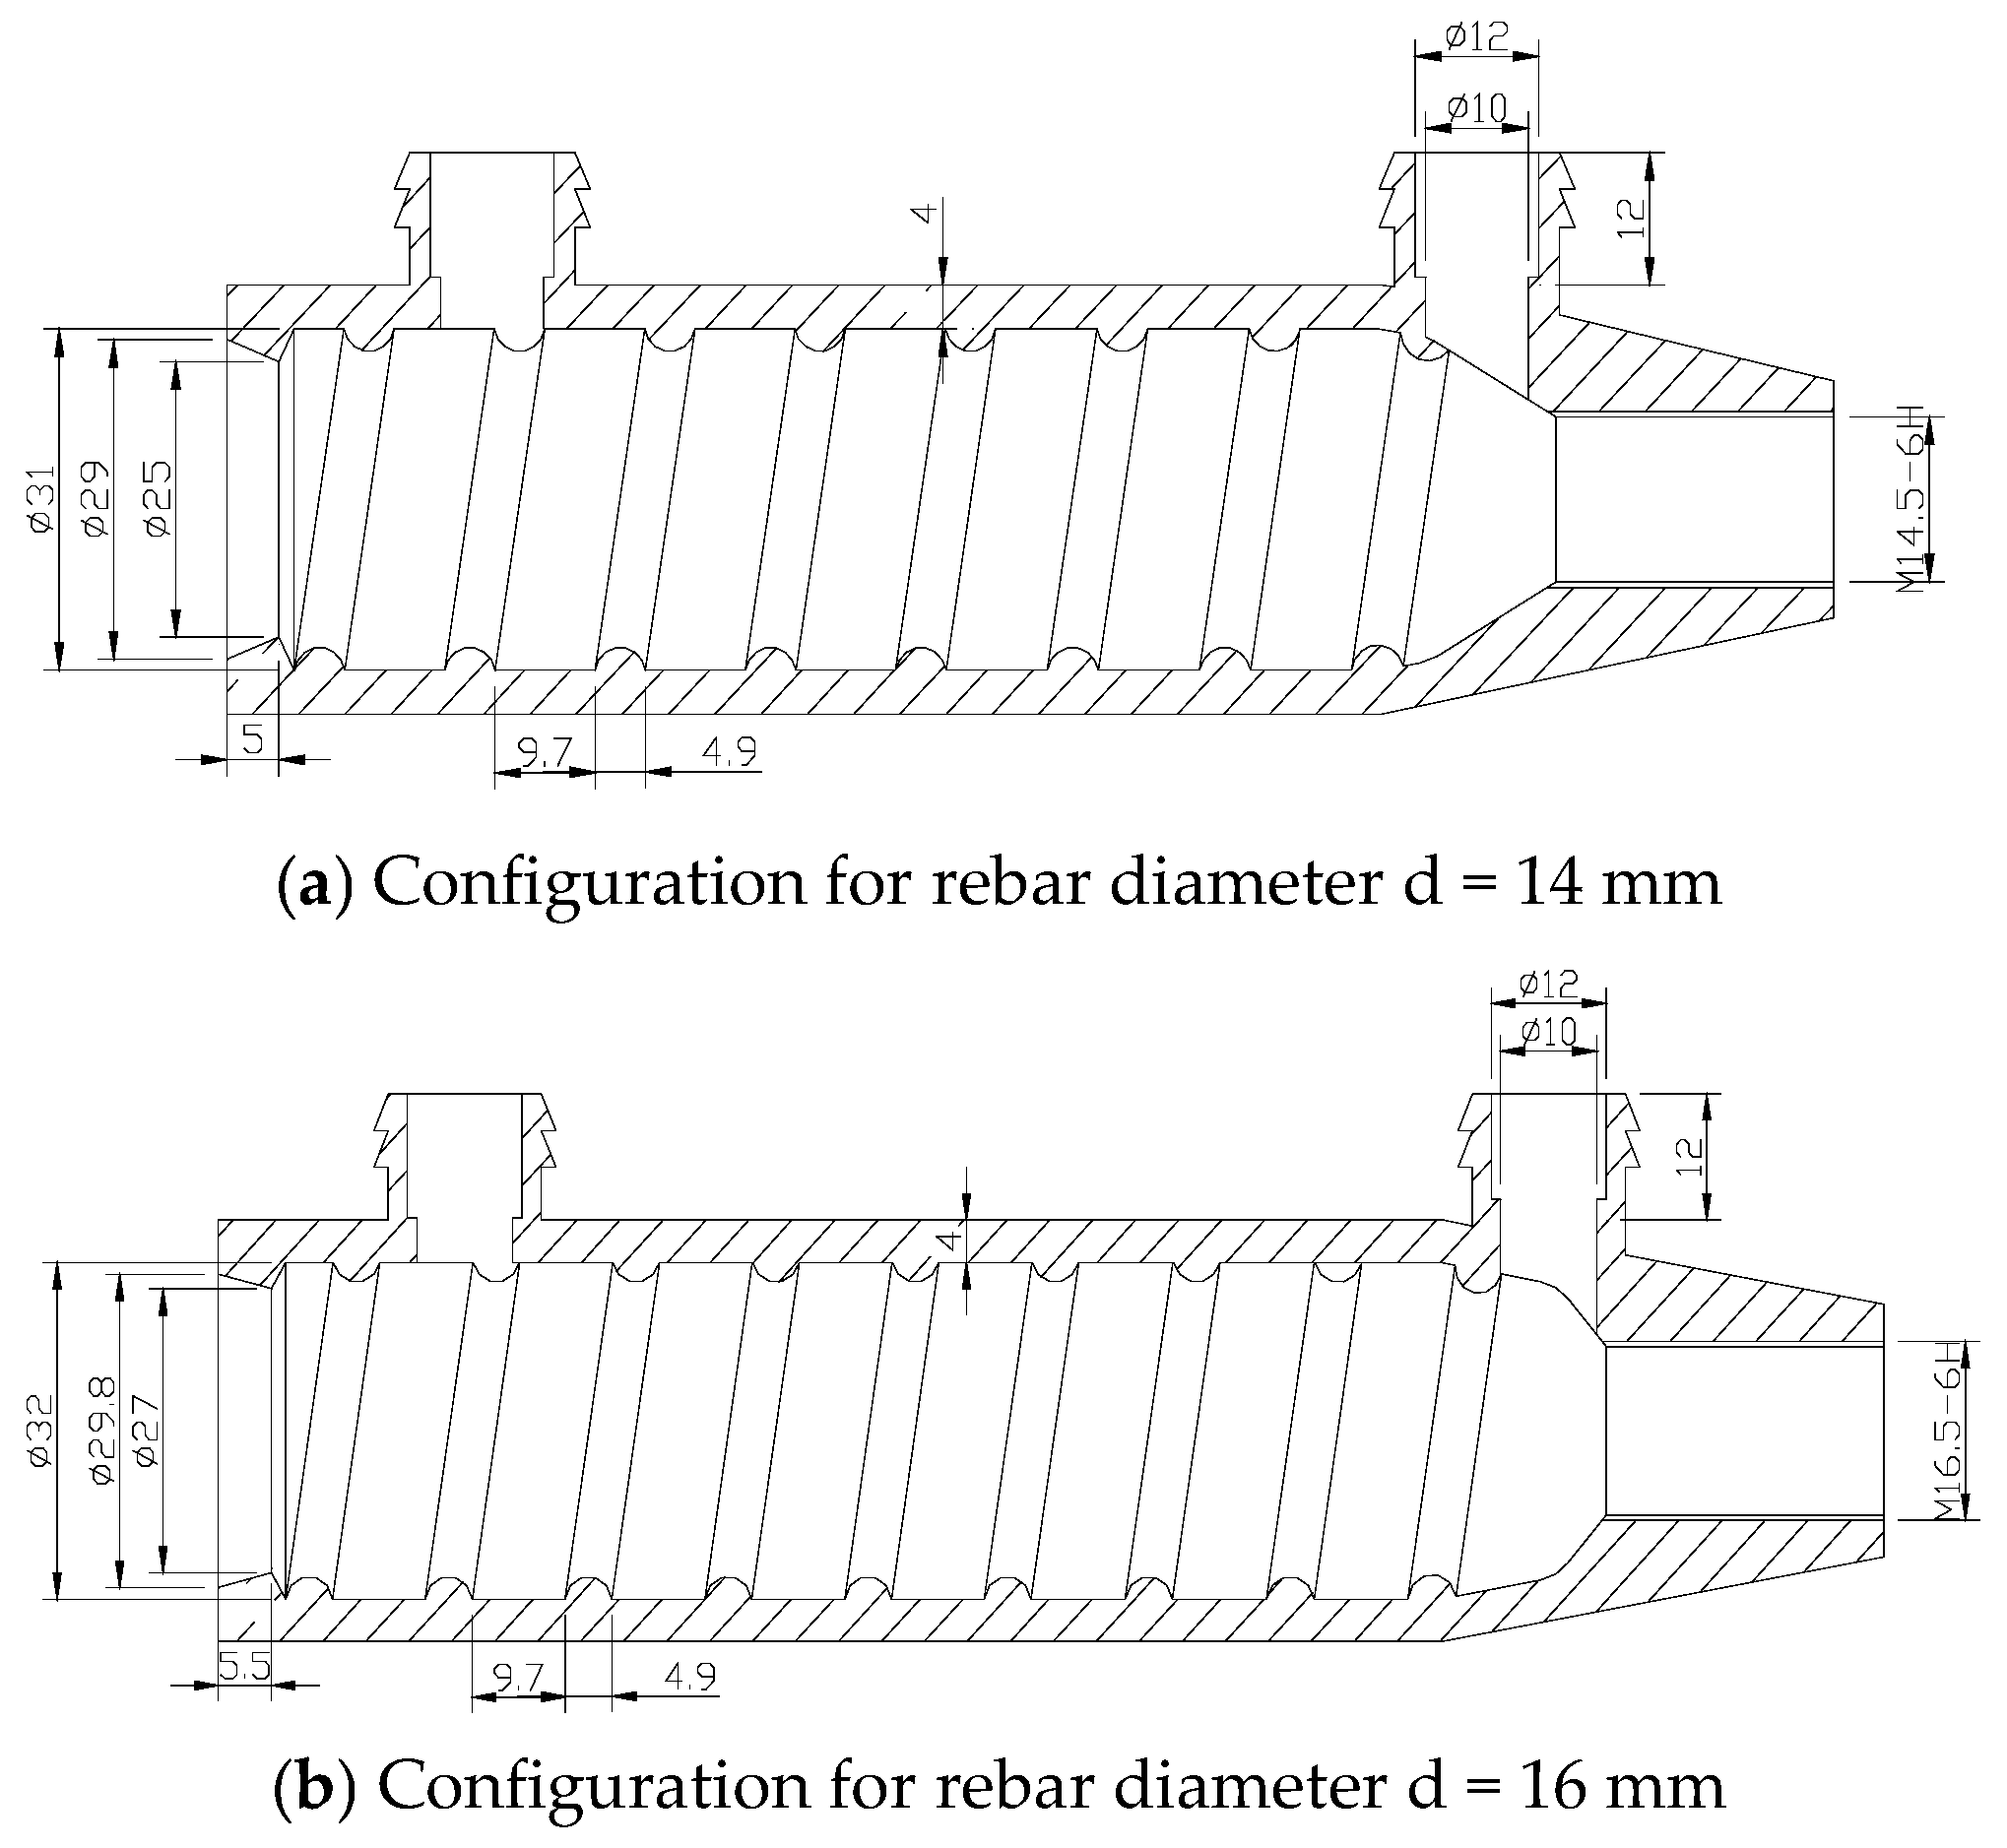
The representative experimentally determined mechanical properties of the rebar used in the SGSC samples, which were tested in accordance with Metallic Materials-Tensile Testing-Part 1: Method of testing at room temperature (GB/T 228.1-2021) [19], are summarized in Table 2. The adopted semigrouted sleeve connectors were fabricated from nodular cast iron, with the material properties complying with the requirements specified in the Chinese standard Grouting Sleeves for Rebar Splicing (JG/T 398-2019) [20]. The sleeve configuration is illustrated in Figure 2. Grouting material compatible with the sleeves was designed with a water-to-material ratio of 0.13 and an initial fluidity of 315 mm. The compressive strengths at 1, 3, and 28 d were 46.3, 67.2, and 97.9 MPa, respectively, satisfying the design criteria outlined in Grouting Materials for Sleeve of Rebar Connection (JG/T 408-2019) [21].

2.2. Defect Simulation

In this experiment, the grouting defect patterns of SGSCs were designed to simulate vertical top cavity defects caused by insufficient grouting or grout subsidence during construction. The defect simulation and control methods were implemented as follows:
(1)
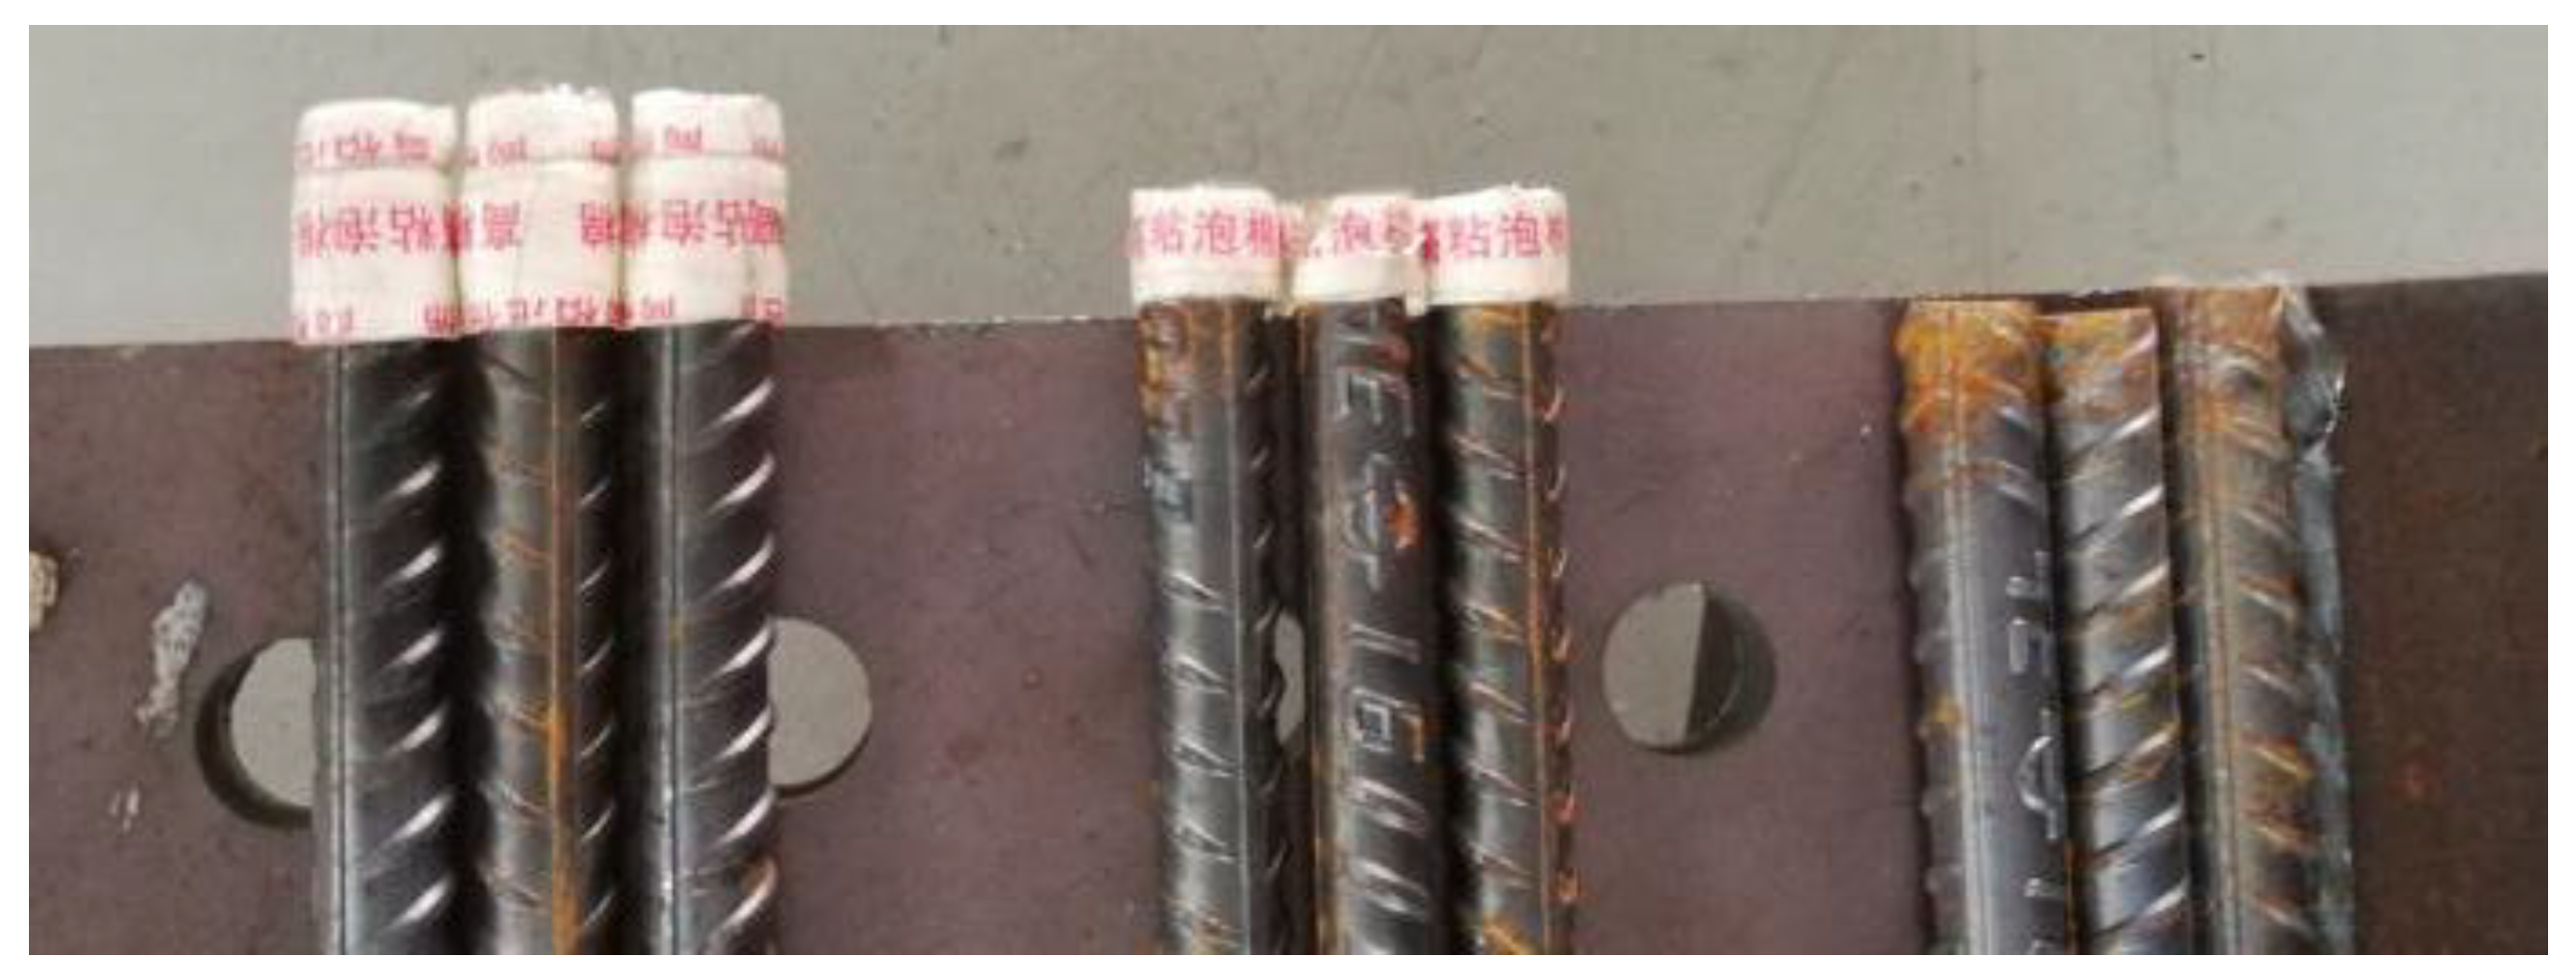
Fabrication of the bond isolation layer: To simulate grouting defects, a specified segment of the lower rebar was tightly wrapped with foam tape, which was then secured with transparent tape to ensure a completely isolated interface between the rebar and the subsequent grouting material (Figure 3). This foam tape method was designed to replicate a simplified and idealized vertical top void defect. It should be noted that grouting defects occurring in actual practice may exhibit more irregular geometries and spatial distributions.
(2)
GFC-controlled parameterization. The length of the foam adhesive tape was precisely controlled according to the predefined GFC index, whereas the samples without foam adhesive wrapping served as the control group (GFC = 100%). The foam simulation of controlled “defect length” corresponds to the reduction in effective anchorage length.
(3)
Grouting process monitoring. The grouting process was terminated immediately when grout outflow was observed at the grout overflow vent, ensuring consistent defect formation across all the samples.
Figure 3. Schematic diagram of the grouting defect simulation.
Buildings 16 00998 g003

2.3. Specimen Fabrication

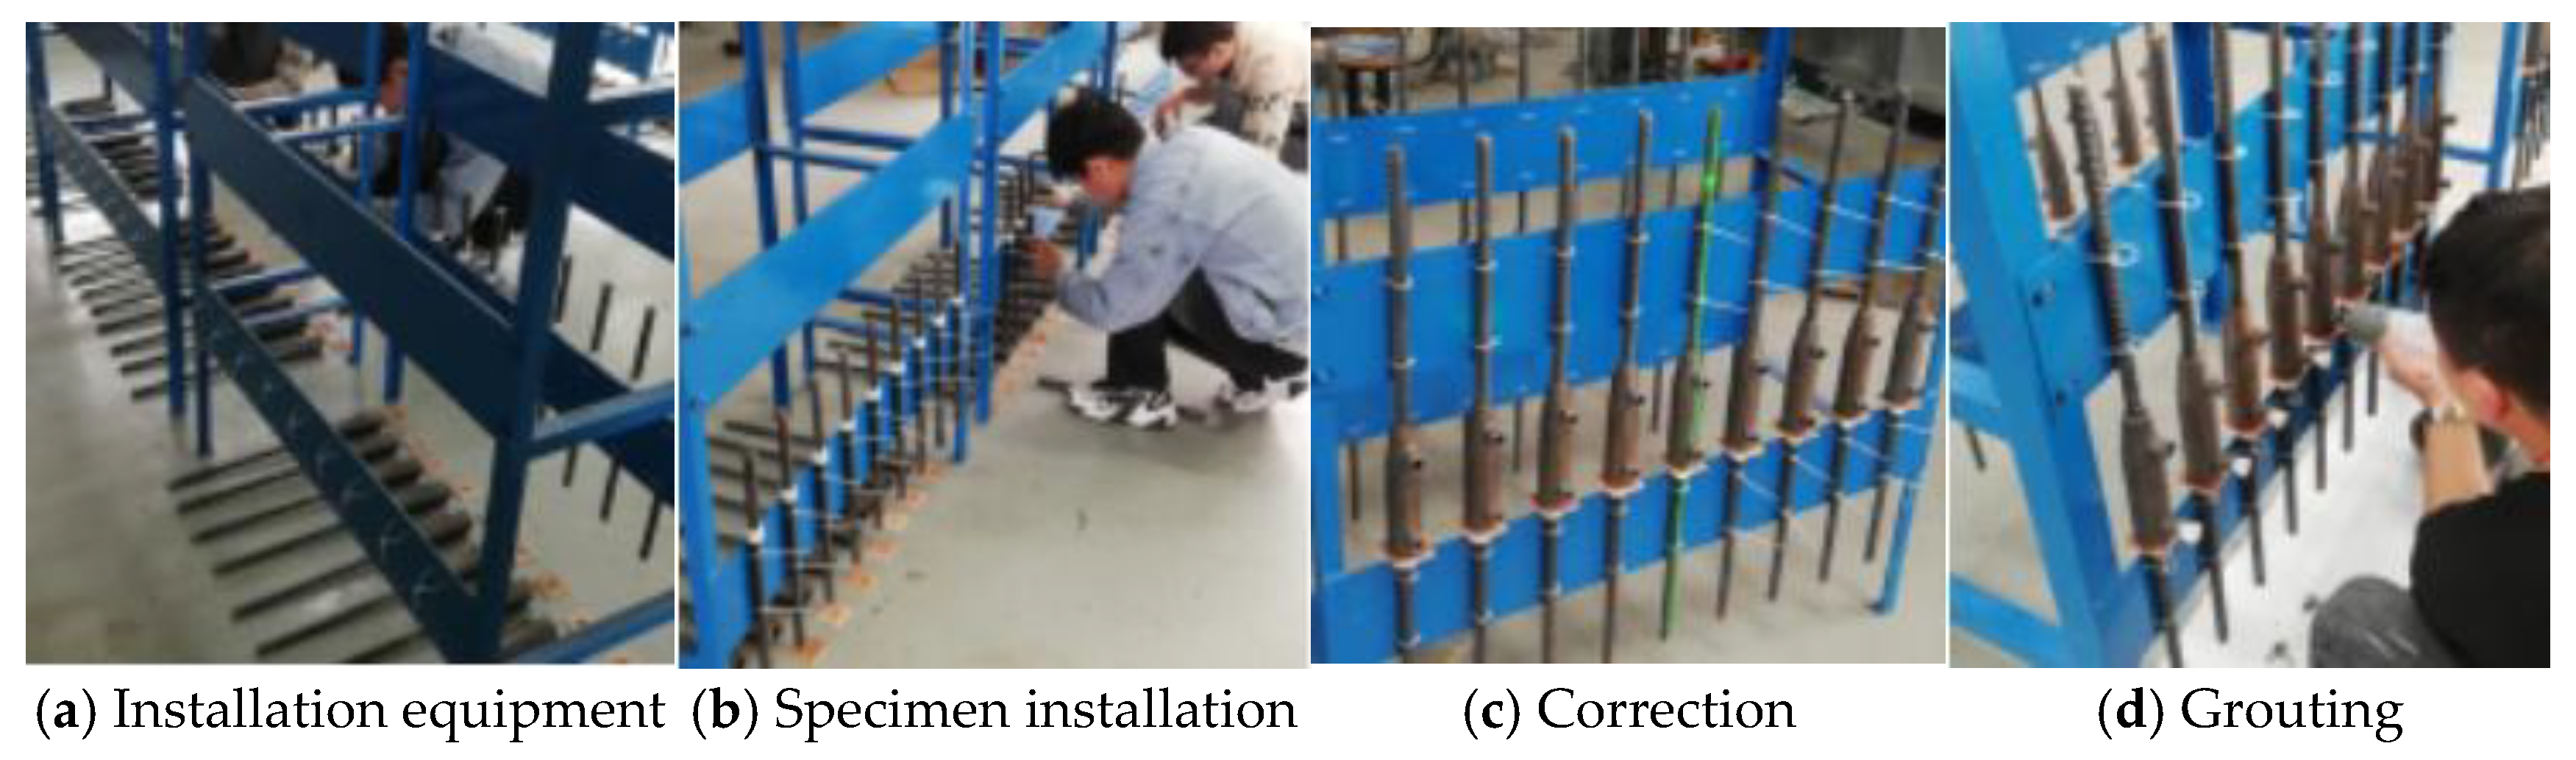
(1)
Bracket design
The modular frame structure was constructed from welding angle steel. Upper and lower steel plates were installed on the vertical surfaces of the bracket to position the upper and lower rebar of the sample, with both rebar fixed through predrilled holes in the plates using high-strength binding straps.
(2)
Rebar connection and positioning
A.
Preparation of the lower rebar. A sealing plate was installed at the bottom of the sleeve (positioned beneath the sleeve). Foam adhesive tape and transparent tape were applied to seal the gaps between the rebar and sealing plate.
B.
Positioning of the lower rebar. Thread binding straps through predrilled holes in the positioning steel plate. The lower rebar pieces were secured by binding straps to maintain vertical alignment.
C.
Positioning of the upper rebar. The sleeve ends of the upper rebar pieces were inserted into the lower rebar. The upper rebar pieces were fixed by threading binding straps through predrilled holes in the positioning plate. Sealant was injected at the contact interface between the sleeve bottom and the lower rebar sealing plate.
D.
Alignment verification. A laser alignment instrument was used to calibrate the concentricity accuracy of the upper and lower rebar pieces (deviation ≤2 mm).
(3)
Grouting operation
A handheld grouting gun was employed to perform pressure-free grouting on each sample sequentially. The grouting process commenced from the bottom injection port of each sample and was terminated immediately upon observing grout overflow from the upper vent hole, followed by immediate sealing of the injection port.
Photographs of the fabrication process of the support and joint samples are shown in Figure 4.

2.4. Loading Protocol

The experimental loading protocol was formulated according to the specifications in the Technical Specification for Mechanical Connections of Steel Bars (JGJ 107-2016) [22], comprising two distinct phases: (1) Monotonic Loading: Unidirectional tensile loading was applied to simulate static structural behavior. (2) Cyclic Loading: High-stress repeated tension–compression cycles were designed to evaluate the dynamic performance under extreme stress states. The detailed parameters of the loading regime are systematically presented in Table 3. Notably, the protocol integrated both peak stress control for elastic-plastic transition analysis and displacement control for post-yield behavior characterization, aligning with the dual requirements for macroscopic stress–strain curve acquisition and for cyclic loading validation.

3. Experimental Results

3.1. Failure Mode

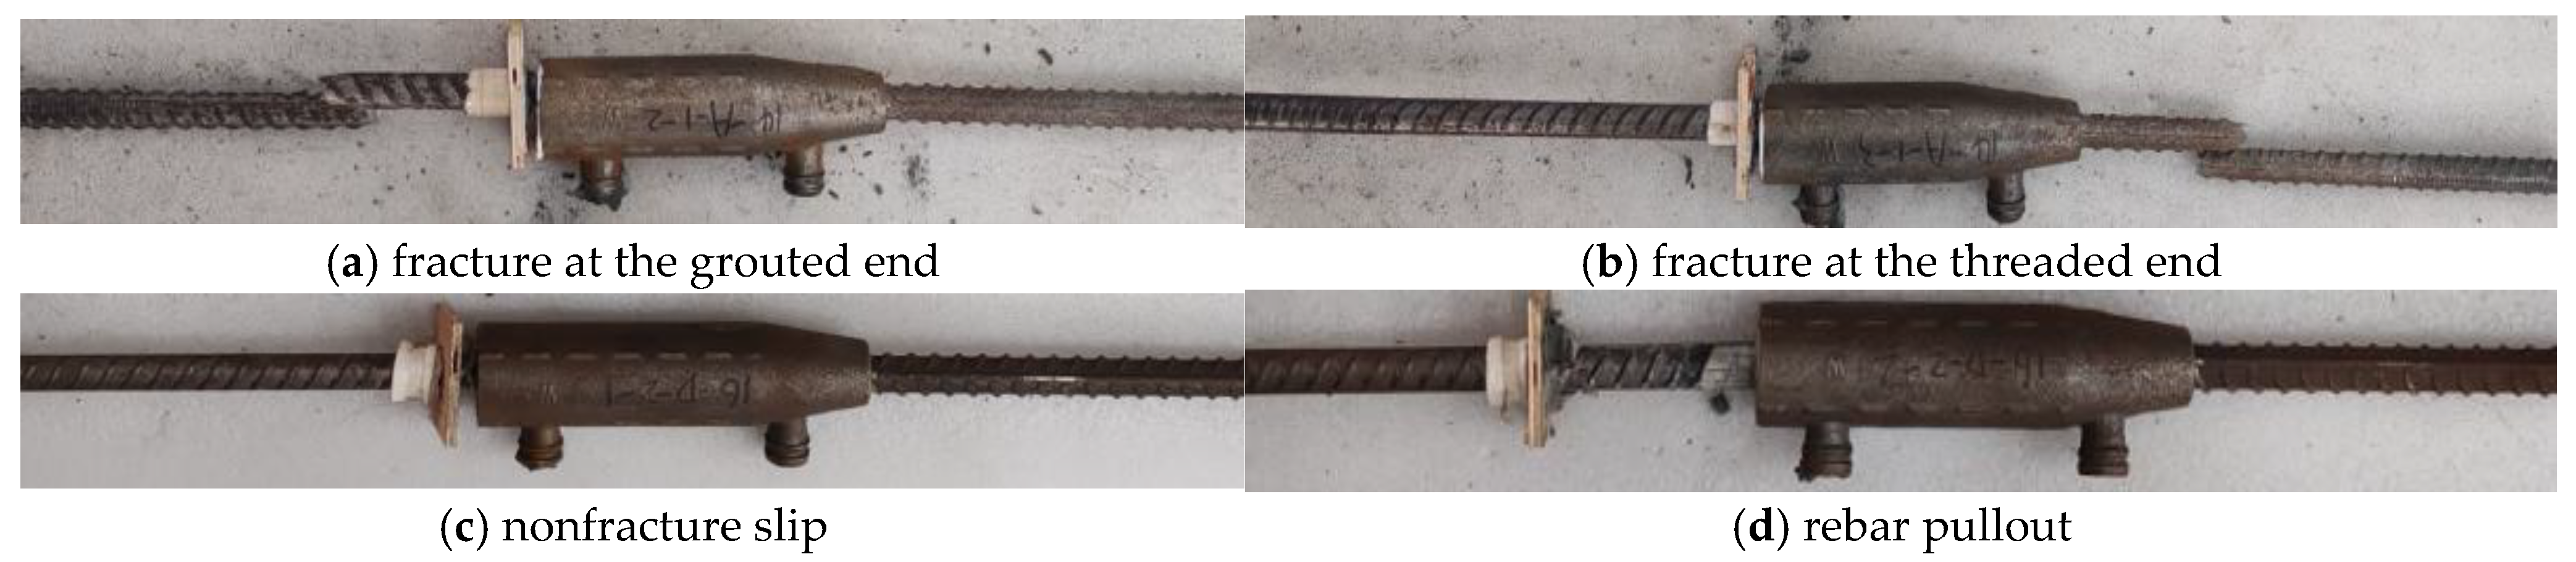
During the two loading condition tests, the samples exhibited four typical failure modes (as illustrated in Figure 5): (1) fracture at the grouted end; (2) fracture at the threaded end; (3) nonfracture slip; and (4) rebar pullout. This observation may be attributed to interfacial adhesion and size effect, which is consistent with the macroscopic failure mode concept reported in [14]. According to the Technical Specification for Grout Sleeve Splicing of Rebar (JGJ 355-2015) [23], the following reliability criteria were applicable: (1) Reliable joint failure criteria: When the specimens exhibited the aforementioned two rebar fracture scenarios (modes 1 and 2), the ultimate tensile force of the joint exceeded the standard tensile load value of the connected rebar. (2) Alternative reliability verification: For specimens with intact rebar (mode 3) or pull-out failure (mode 4), the ultimate tensile force had to be 1.15 times greater than the standard tensile load value.
All the samples with 14 mm-diameter rebar in SGSCs exhibited consistent fracture at the steel reinforcement under monotonic tensile loading when the GFC exceeded 60% (i.e., for all the samples), with negligible interfacial slip. In contrast, for the 16 mm-diameter rebar, a pronounced size effect emerged at GFC ≤ 80%: one sample each in the 60% and 80% GFC groups experienced bond-slip failure, whereas the remaining samples maintained the steel fracture mode. This divergence highlighted the lower sensitivity of smaller-diameter rebar to grouting defects than their larger counterparts. During loading, the grouted end exhibited multidirectional wedge-shaped crack propagation patterns, indicating that the internal grout was subjected to three-dimensional stress coupling effects and served as the primary load transfer medium. With increasing applied load, progressive damage accumulation occurred in the end zone, which manifested as surface spalling of grout and aggregate fracture. This failure mechanism could be attributed to three critical factors: (1) significant weakening of three-dimensional confinement effects at the sleeve end due to geometric discontinuities; (2) stiffness gradient mismatch across rebar (Es = 200 GPa), sleeve (Ec = 210 GPa), and grout (Eg = 40 GPa), resulting in excessive interfacial slip; and (3) the strain compatibility between the rebar, grout, and sleeve among the three components being below the critical threshold, ultimately leading to a shear-splitting composite failure mode in the grout material.
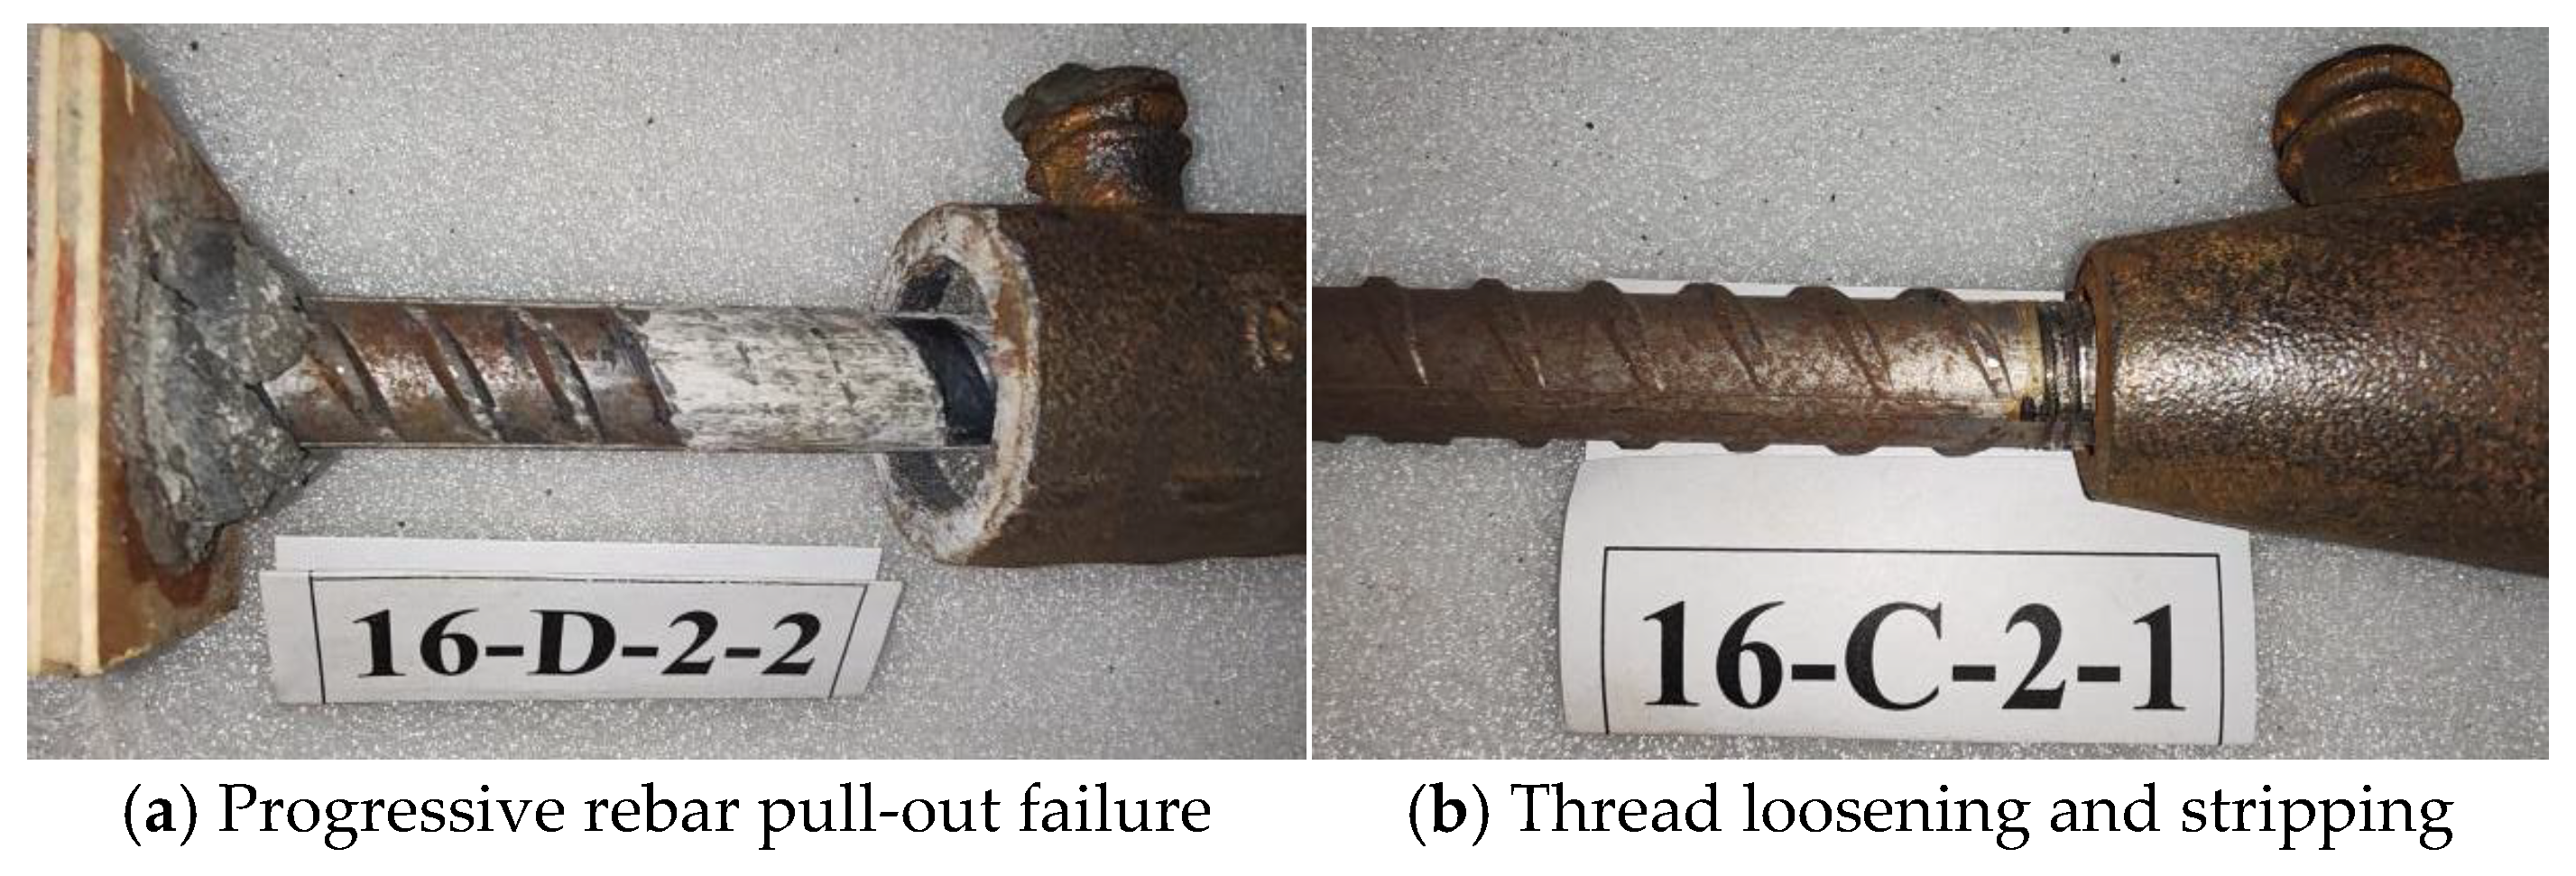
Under high-stress cyclic tensile–compressive loading, the failure modes of SGSCs significantly depended on the GFC. For the test group with 14 mm-diameter rebar, when the GFC ranged from 70% to 100%, all the samples experienced tensile fracture of the rebar base material, with fracture locations being concentrated in the extension segment outside the sleeve, which was consistent with the qualified joint criteria in [18]. However, under the GFC = 60% condition, 1 out of 3 samples (33.3%) exhibited bond-slip failure at the steel–grout interface. For the Φ16 mm rebar specimen group, high-GFC samples (GFC = 90–100%) maintained a full-section fracture mode, whereas low-GFC samples (GFC = 60–80%) exhibited six instances of nonfracture failure characteristics. Notably, one case at GFC = 70% demonstrated progressive rebar pull-out failure. Multidirectional radial splitting characteristics were observed at the grout end, with cracks propagating in a wedge-shaped pattern along the grout–sleeve interface. Over half of the samples exhibited thread loosening and stripping during the failure phase. This failure mechanism could be attributed to cumulative plastic deformation in the threaded engagement zone induced by low-cycle reversed tensile–compressive loads, resulting in a reduction in the interfacial friction coefficient. This frictional degradation triggered stress redistribution, ultimately leading to the thread stripping failure mode. Typical failures are shown in Figure 6.

3.2. Analysis of Uniaxial Tensile Test Data

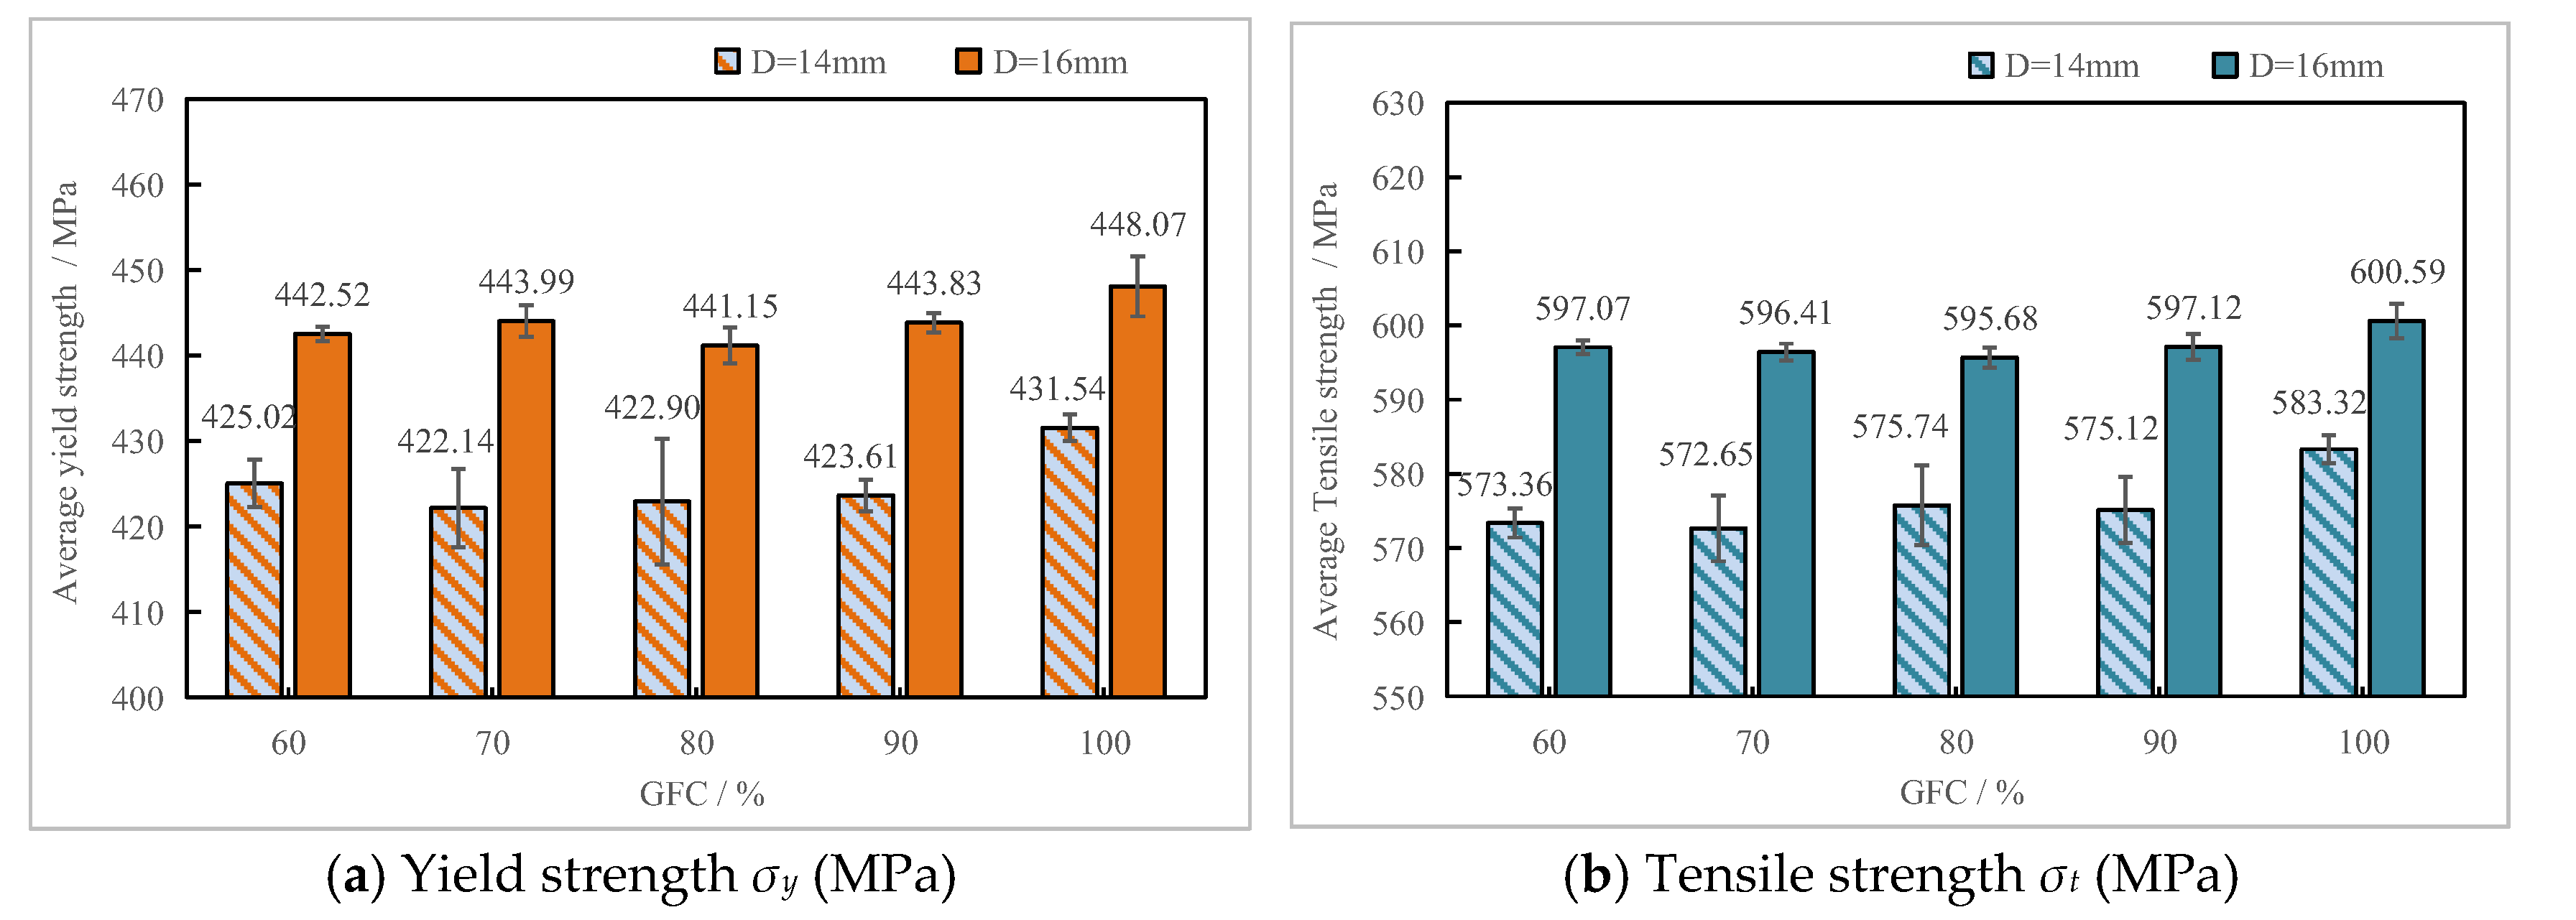
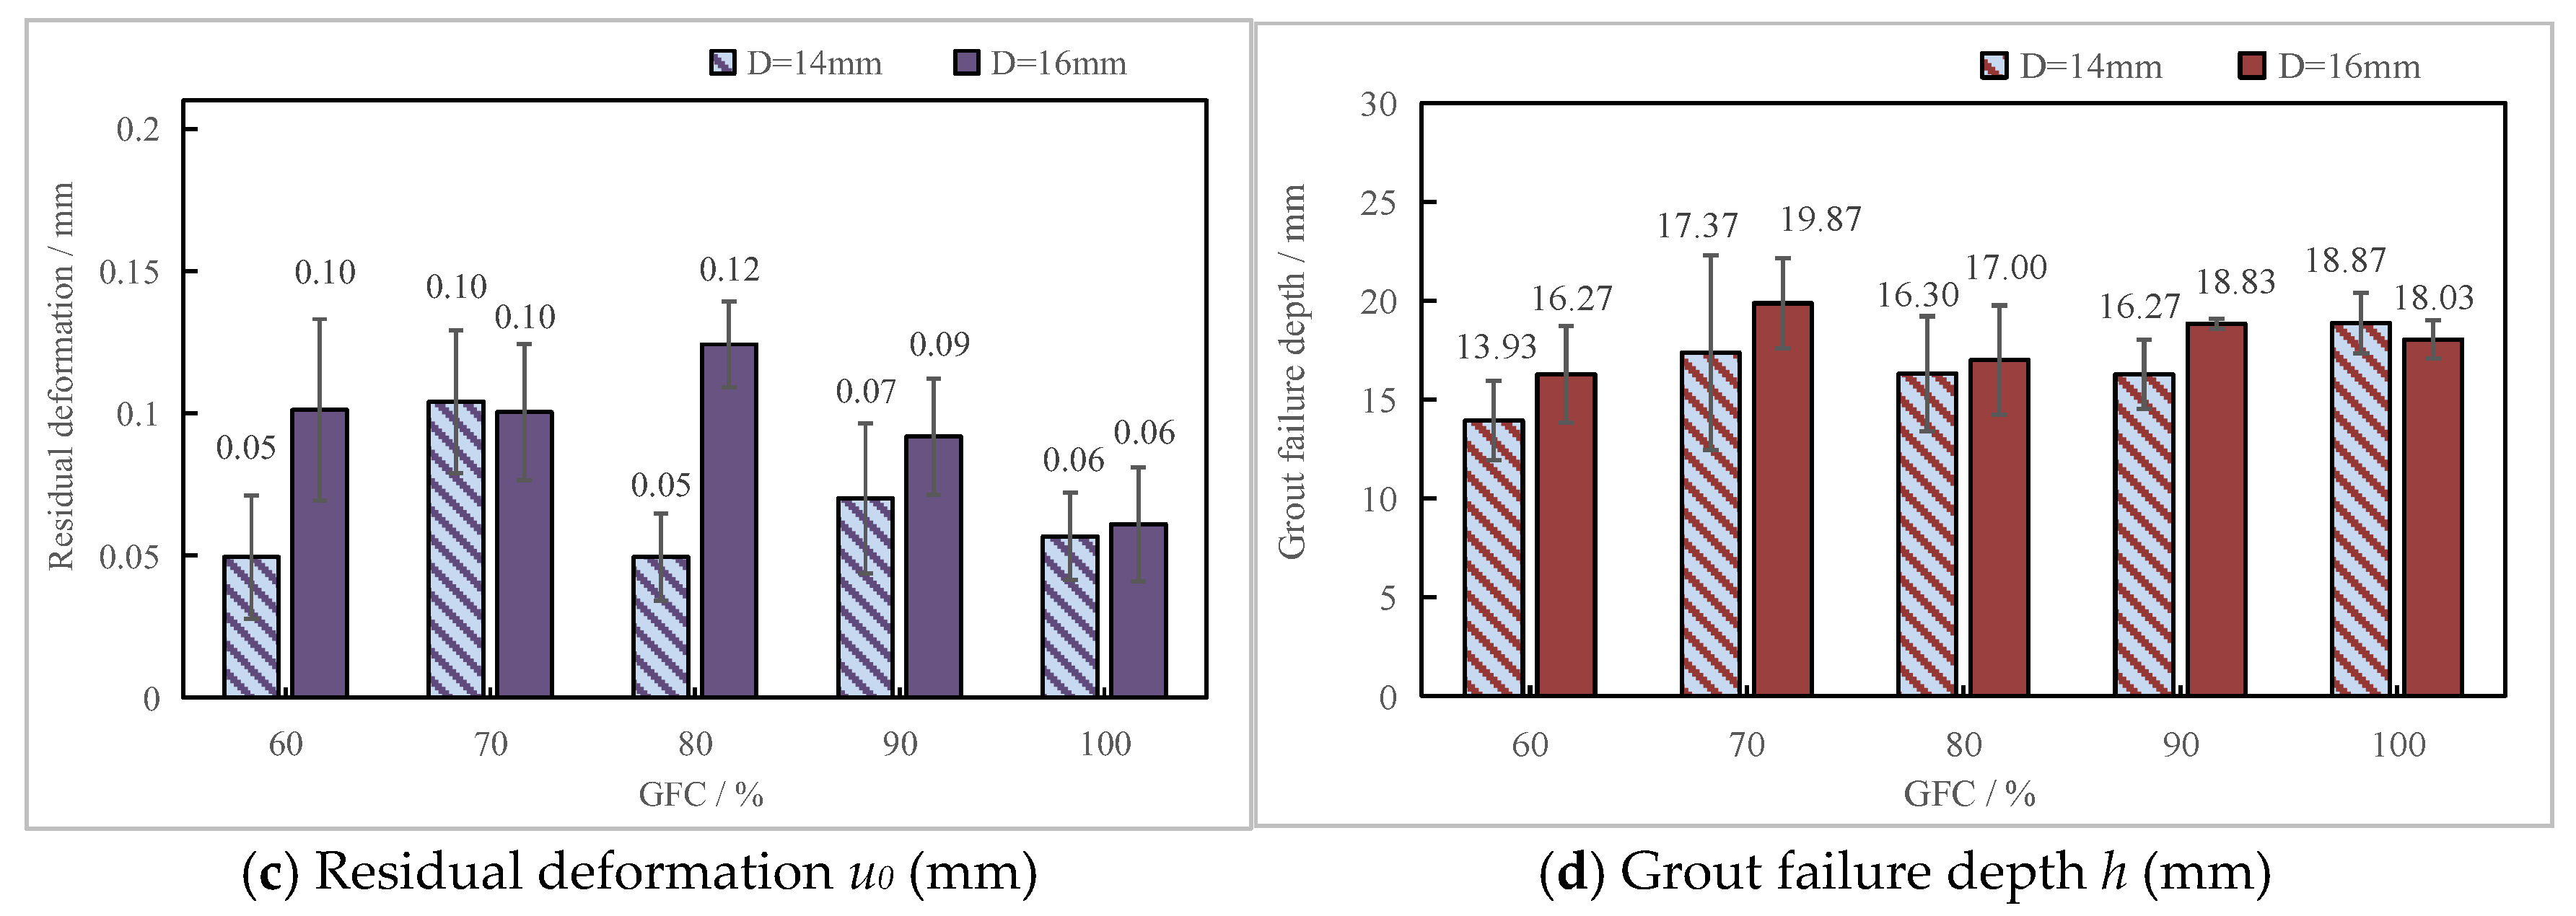
Figure 7 summarizes the uniaxial tensile test results of specimens with GFC ranging from 60% to 100%. Owing to the relatively small sample size (n = 3 per group), the statistical power of the analysis may be limited; thus, the correlation analyses should be interpreted as indicative of potential trends rather than definitive statistical evidence. The variability in each parameter curve is represented by error bars. The key mechanical properties of all specimens are as follows: (1) The mean values of yield strength and tensile strength demonstrated a statistically significant positive correlation with increasing GFC. This phenomenon could be attributed to the increased stress transfer efficiency resulting from the increased interfacial contact area between the grouting material and reinforcement bars. (2) However, under unloading conditions at the 0.6 fyk load level, the average residual deformation (u0) of the samples with two diameters and varying GFGs showed no statistically significant linear relationship with the GFC. This discrepancy potentially originated from the variability in the bond-slip behavior at the grout-rebar interface. (3) The near-linear decrease in grout fracture depth with lower GFC indicates reduced ductility in the grout. This is consistent with the presence of stress-concentrating micro-defects (e.g., air voids), which can prematurely limit plastic deformation capacity. This phenomenon validated the theoretical hypothesis proposed in the GB/T 51,231 standard [24] regarding the interfacial bond strength degradation caused by grouting defects. (4) Significant dimensional differences were observed in the deformation characteristics of the SGSC samples. Compared with their 14 mm-diameter counterparts (0.07 mm), the 16 mm-diameter samples exhibited a 29.79% greater average residual deformation (0.09 mm), which was accompanied by an 8.07% greater grout failure depth (18.00 mm vs. 16.55 mm). This phenomenon was attributed to the intensified nonuniformity of the stress distribution in larger-diameter reinforcing bars.
To systematically investigate the correlation mechanism between the mechanical properties of SGSCs and the GFG, key mechanical parameter datasets obtained from uniaxial tensile tests of two groups of samples were analyzed. Pearson correlation coefficient analysis and small-sample t tests were employed to evaluate the statistical correlations between each parameter and the GFG, with a significance threshold set to α = 0.05 (Table 4). It should be reiterated that, due to the small sample size (n = 3 per group), statistical results approaching the significance threshold require cautious interpretation. Specifically: a p-value below 0.05 can be regarded as indicating a statistically suggestive trend toward a strong correlation; a p-value slightly above 0.05 (e.g., p = 0.05–0.10) should be interpreted as approaching, yet not reaching, the conventional level of significance, or as suggesting a potential association between the variables. The statistical analyses presented hereafter are interpreted in accordance with this framework. The findings revealed the following: (1) Consistency in strength performance. Yield strength (σy) exhibited weak negative correlations with the GFG (Φ14 group: r = −0.21, p = 0.72; Φ16 group: r = −0.25, p = 0.68), which failed to reach statistical significance. The tensile strength (σt) demonstrated significant strong negative correlations (Φ14 group: r = −0.85, p = 0.03; Φ16 group: r = −0.83, p = 0.08), indicating GFG-dominated degradation in the ultimate load-bearing capacity. (2) Heterogeneity in deformation parameters. Residual deformation (u0) showed diametrically opposed trends: no statistical association in the Φ14 group (r = 0.09, p = 0.87) versus a strong positive correlation in the Φ16 group (r = 0.89, p = 0.04). The grout failure depth (h) displayed extreme group divergence; specifically, an intense positive correlation in the Φ14 group (r = 0.92, p = 0.01) contrasted with a weak negative correlation in the Φ16 group (r = −0.39, p = 0.52). It is worth noting that the opposite trends in residual deformation (u0) and grout failure depth (h) between Φ14 mm and Φ16 mm samples are attributed to size-dependent constraint effects and bond-slip mechanisms. Larger diameters are more sensitive to grouting defects due to reduced confinement and increased interfacial slip.
Table 4. Correlation analysis between uniaxial tensile test indicators and GFC.
ParameterPearson’s rCorrelation Typep ValueSignificance (α = 0.05)
σyΦ14−0.21Weak negative correlation0.72Non significant
Φ16−0.25Weak negative correlation0.68Non significant
σtΦ14−0.85Strong negative correlation0.03Significant
Φ16−0.83Strong negative correlation0.08Marginally significant
u0Φ140.09Near-zero correlation0.87Non significant
Φ160.89Strong positive correlation0.04Significant
hΦ140.92Strong positive correlation0.01Significant
Φ16−0.39Weak negative correlation0.52Non significant
Note: (1) Observed positive/negative correlations may originate from localized data fluctuations rather than reflecting global linear relationships. (2) The correlation strength classification follows the American Statistical Association’s 2025 guidelines [25]:
Strong :   r 0.7 , 1.0 Moderate :   r 0.4 , 0.7 Weak :   r 0.2 , 0.4 None / Negligible :   r 0 , 0.2
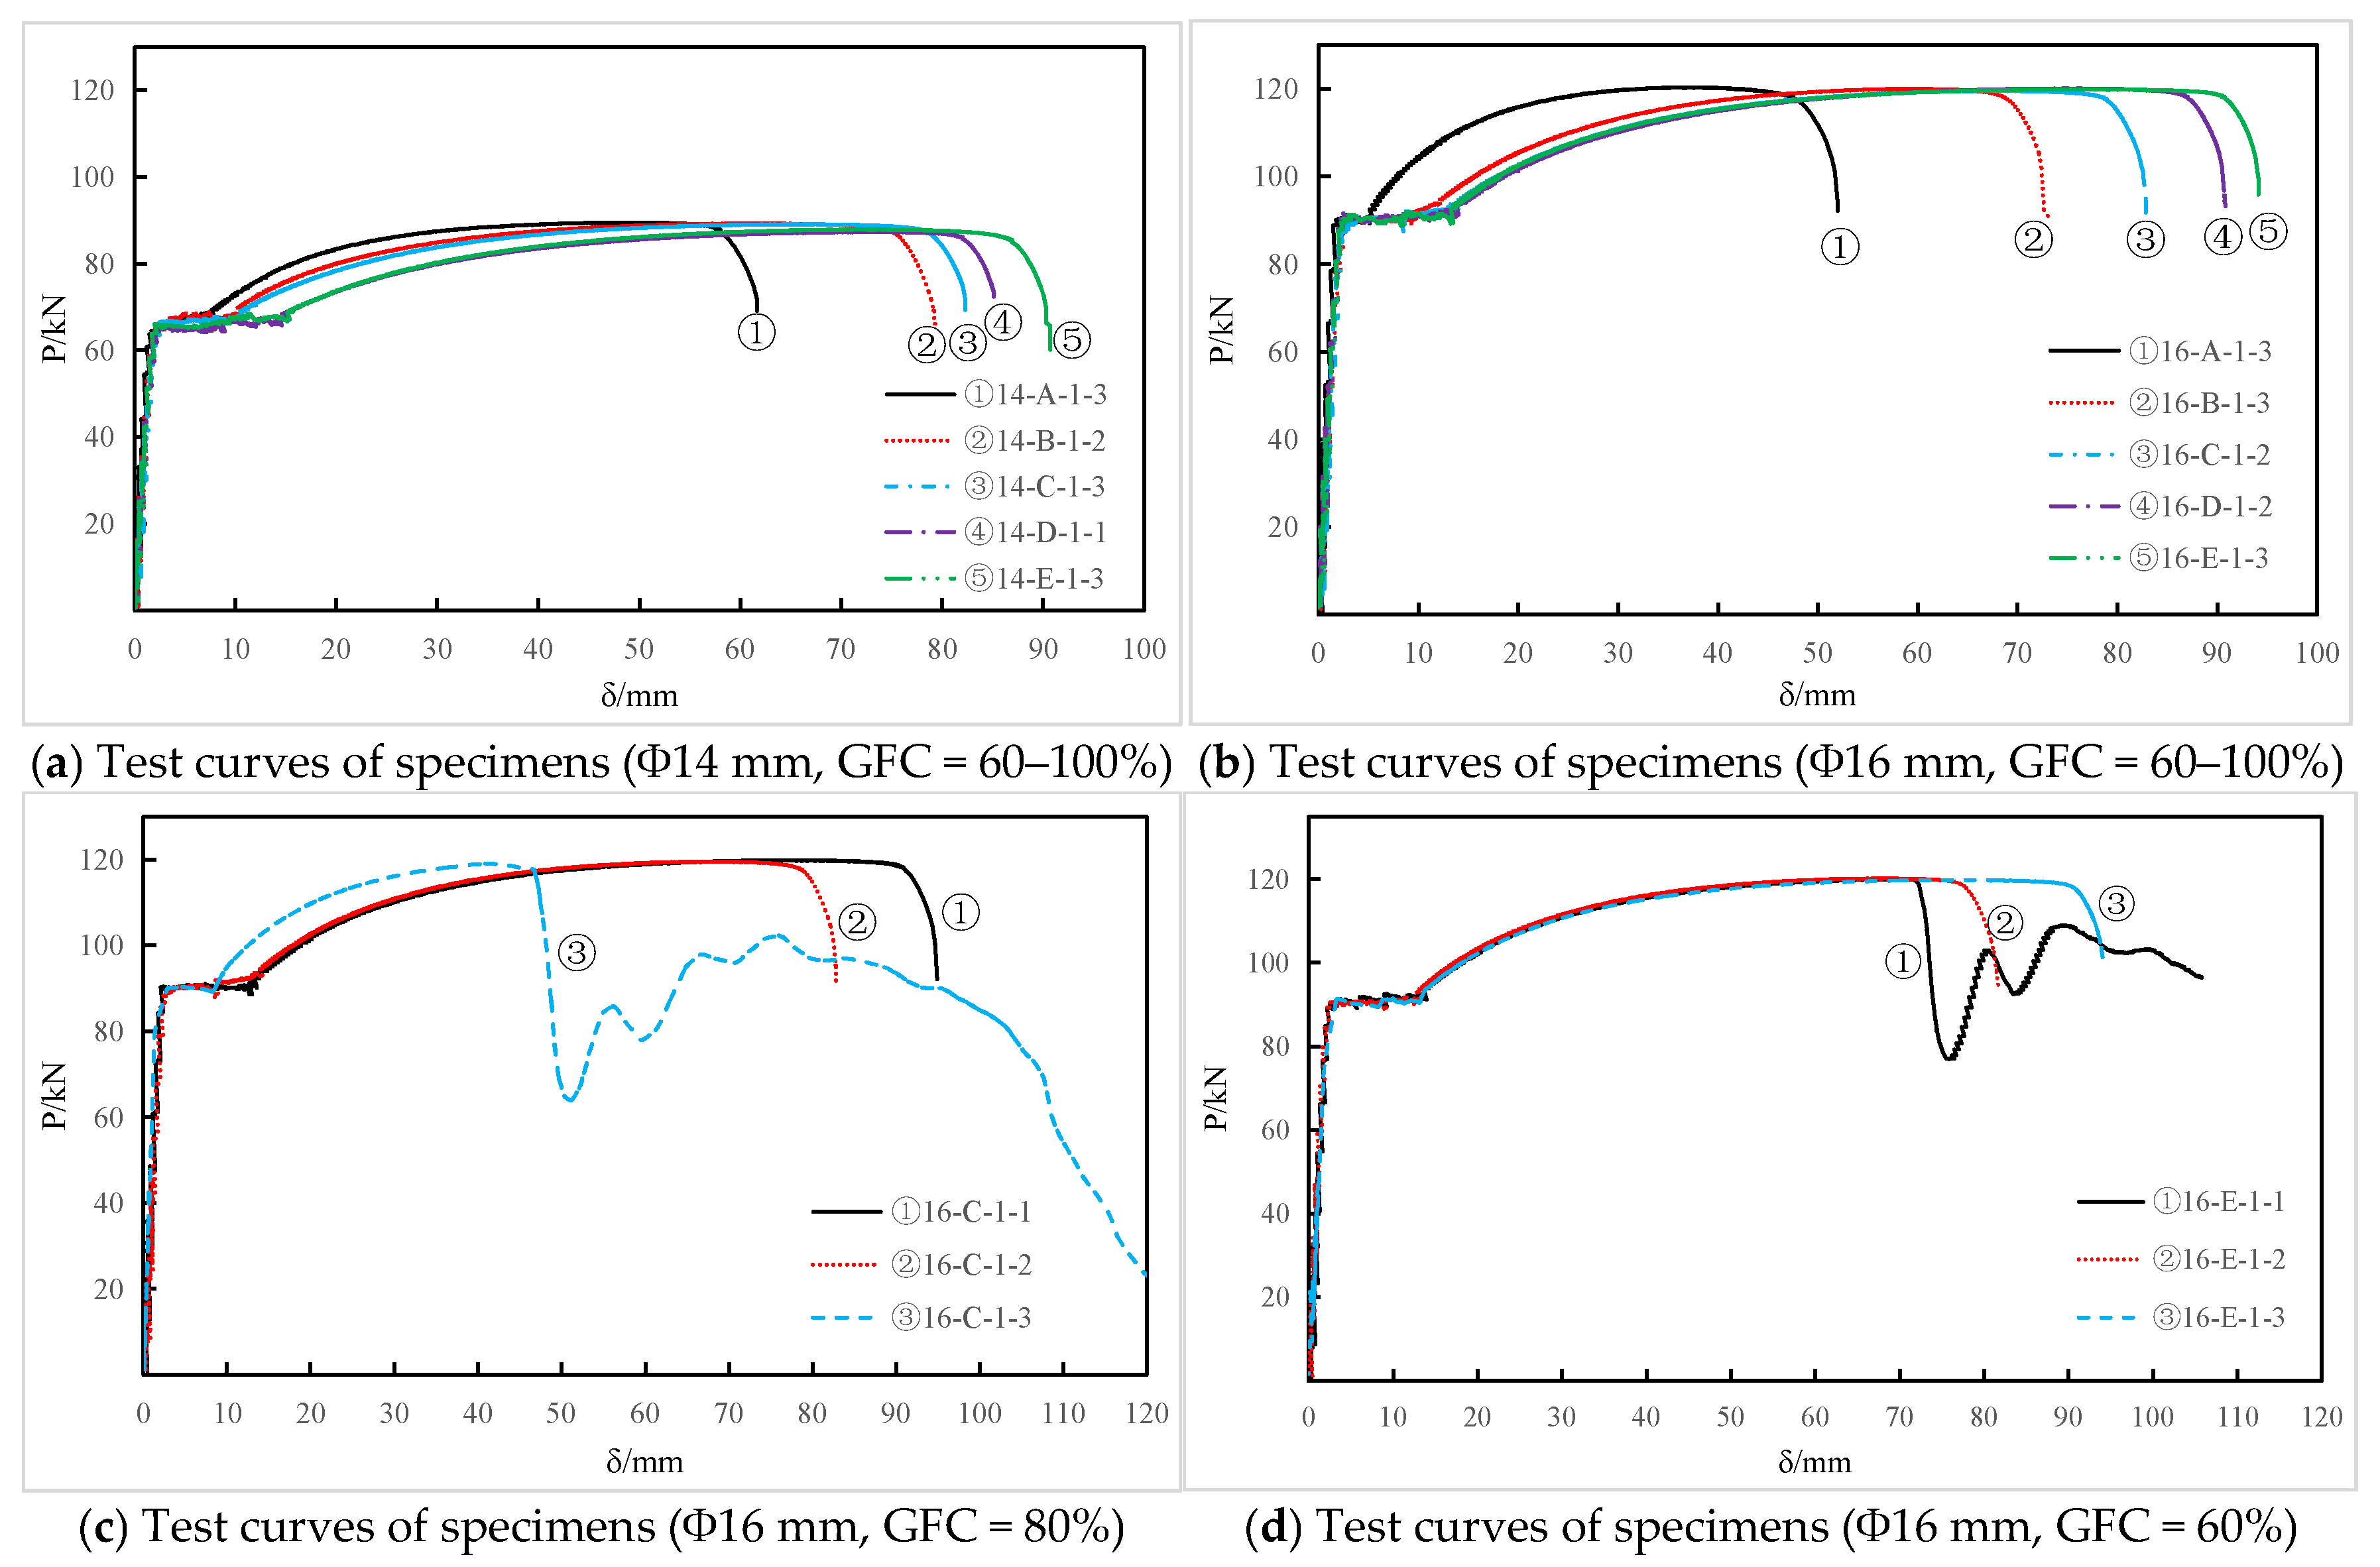
Figure 8 shows the load–displacement curves of typical samples, where Figure 8a,b reveal the significant impact of the grout fullness gradient on the ductility performance characteristics of SGSCs. The following findings can be derived from Figure 8a,b. When the GFC varied within the 60–100% range, both the yield strength (σy) and tensile strength (σt) exhibited degradation magnitudes below 5% (Φ14 group: Δσy = 3.76%, Δσt = 2.35%; Φ16 group: Δσy = 0.77%, Δσt = 0.62%), which complied with the grouting defect tolerance criteria specified in JGJ 355 [23], confirming the robust resistance of strength parameters to localized imperfections. Furthermore, decreasing the GFC induced progressive increases in the yield plateau duration and total elongation. Considering the peak displacement at GFC = 100% (Lmax−0) as the baseline, the Φ14 samples exhibited peak displacements of 1.25 ×, 1.38 ×, 1.49 ×, and 1.45 × Lmax−0 at GFC = 90%, 80%, 70% and 60%, respectively, presenting a rise-to-stabilization trend. In contrast, the Φ16 samples displayed exponential growth in displacement amplification, reaching values of 1.63 ×, 1.82 ×, 2.05 ×, and 2.12 × Lmax−0 under equivalent GFC conditions. This behavioral divergence stemmed from uniaxial tensile loading mechanisms. Grouting defects reduce the effective bond area at the rebar-grout interface, impairing the confinement effect in the anchorage zone and consequently leading to bond degradation. This degradation process triggers the progressive accumulation of nonlinear interfacial slip, which manifests macroscopically as an extended yield stage and an increase in the total elongation of the specimen through a strain energy redistribution mechanism. It should be noted that the direct quantitative relationship between GFC and anchorage efficiency requires further investigation and validation. Based on the analysis of bond stress development along the anchorage length and consistent with the strength attenuation and failure mode transition observed in this study, it can be concluded that GFC is a key governing parameter, but not the sole determinant, of anchorage efficiency.
Figure 8c,d show the distinct failure modes of the Φ16 mm samples when GFC = 80% and GFC = 60%, where one sample in each group exhibited complete pullout failure. Although the strength indices (σy, σt) between the two groups showed minimal differences of <2%, their load–displacement curves exhibited significant divergence. When GFC = 80%, the pullout specimen displayed marked deviations from the other two samples with rebar fractures: the yield plateau length was drastically reduced to 62.46% of the fracture samples’ average (11.25 mm/11.39 mm → 7.07 mm), and the tensile strength peaked prematurely (77.27 mm/66.59 mm vs. 44.22 mm). Postpeak load degradation occurred at a steep rate of 12.75 kN/mm due to bond deterioration at the rebar-grout interface, followed by a secondary anchoring phase characterized by strain hardening (secant hardening slope: 1.56 kN/mm). Conversely, when GFC = 60%, the predegradation curves of the pullout samples strongly aligned with those of the fracture samples, with <3% variation in yield plateau length (10.76 mm vs. 9.96 mm/10.07 mm) and intermediate peak displacement (68.75 mm vs. 67.55 mm/77.58 mm). This divergence stemmed from distinct interfacial mechanisms. At GFC = 80%, the rigid anchoring zone formed by grout restricted interfacial slip during yielding, leading to insufficient coordinated deformation across the sleeve-grout-rebar system, reflecting a constraint-dominated failure mode. Conversely, GFC = 60% allowed progressive slip through discrete anchoring points, enabling self-adaptive energy dissipation via optimized damage pathways, thereby maintaining system compatibility despite the presence of localized defects.

3.3. Analysis of High-Stress Cyclic Tension–Compression Test Data

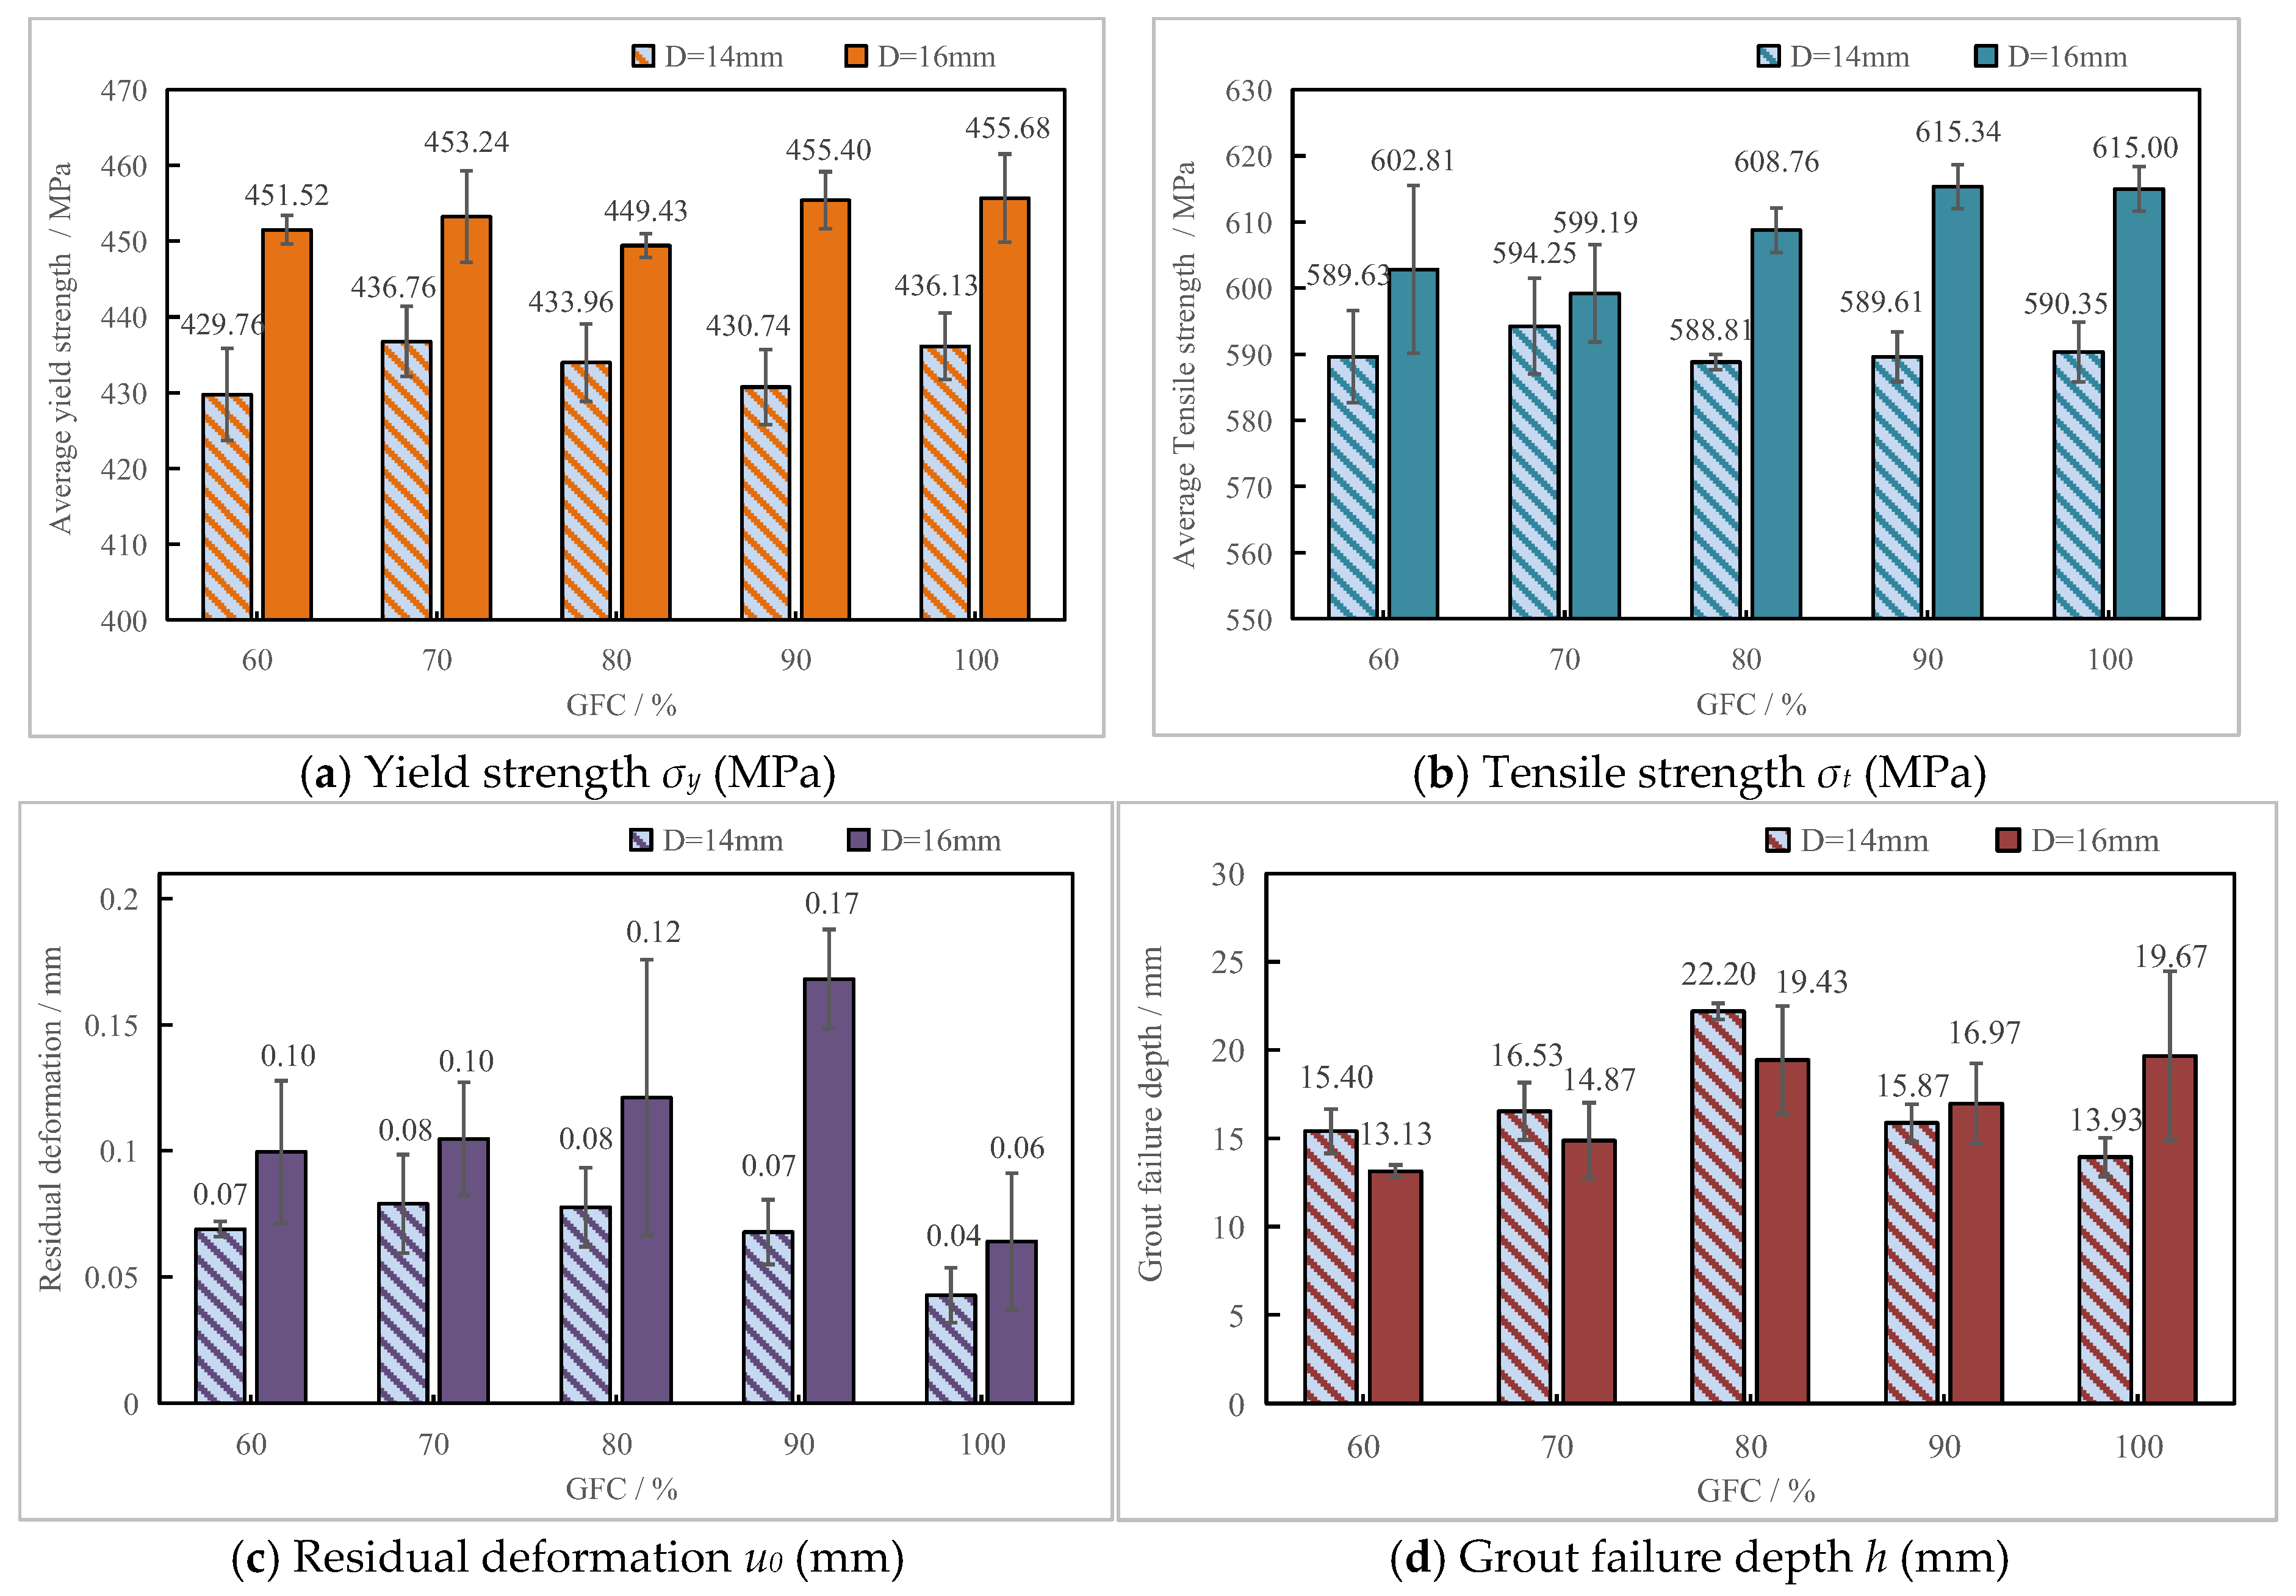
Figure 9 summarizes the high-stress cyclic tension–compression test results of specimens with GFC ranging from 60% to 100%. Owing to the relatively small sample size (n = 3 per group), the statistical power of the analysis may be limited; thus, the correlation analyses should be interpreted as indicative of potential trends rather than definitive statistical evidence. The variability in each parameter curve is represented by error bars. The key mechanical properties of all specimens are as follows: (1) The size effect on the strength parameters was correlated with the GFG. Compared with the Φ14 mm group, the Φ16 mm group consistently presented greater yield strength. For example, the average value of specimen group 16-A-2-y (455.68 MPa) showed a 4.5% increase compared to its corresponding specimen group 14-A-2-y (436.13 MPa) under identical GFC conditions. For specimens of the same diameter, the regulation of yield strength by GFG displayed nonmonotonic behavior. For example, the yield strength of Φ14 mm samples (GFC = 60% to GFC = 100%) exhibited fluctuations with a limited range of 7.0 MPa, suggesting that the intrinsic yield plateau characteristics of steel could mask interfacial bond heterogeneity. The tensile strength of the Φ16 mm samples exhibited pronounced sensitivity to GFG variations, as evidenced by a range of 16.15 MPa from GFC = 60% to GFC = 100%. Conversely, the Φ14 mm samples presented minimal tensile strength variation (5.44 MPa) within the same GFC span, indicating the heightened sensitivity of the larger-diameter samples to grouting defects. (2) Multiscale characterization of the cyclic hysteresis and damage evolution revealed distinct mechanisms. The u20 values (0.06–0.17 mm) of the Φ16 mm samples universally exceeded those of their Φ14 mm counterparts (0.04–0.08 mm), with specimen group 16-B-2-y (u20 = 0.17 mm) being 2.1 times greater than the maximum value observed in the Φ14 mm group. This finding reflected the greater accumulation of irreversible slip deformation in larger-diameter samples under cyclic loading, which was perhaps attributable to the increased frictional energy dissipation resulting from the increased interfacial contact area. High-GFC samples (e.g., 14-A-2-y group, u20 = 0.04 mm) demonstrated superior deformation recovery capacity, implying that intact grouting systems suppressed interfacial relative displacement through micromechanical interlocking. The destruction depth of grout exhibited no clear monotonic trend: specimen 14-C-2-y group (GFC = 80%) displayed anomalously deep penetration (22.20 mm), far exceeding the range of the other samples in its group (13.93–16.53 mm), whereas 16-E-2-y group exhibited minimal damage depth (13.13 mm). This phenomenon conclusively demonstrated that the topological distribution of grouting defects (rather than their volumetric quantity) governed the selection of failure propagation paths.
To systematically investigate the correlation mechanisms between the mechanical properties of SGSCs and GFGs, a statistical correlation analysis was conducted between key parameters and GFGs on the basis of high-stress cyclic tension–compression test results, and the analytical outcomes were summarized in Table 5. The data analysis revealed the following patterns. For the 14 mm-diameter samples, none of the mechanical performance indices exhibited statistically significant correlations with grouting fullness. The maximum correlation coefficient was observed for residual deformation (u20), which showed a moderate negative correlation that lacked statistical significance with the GFG (r = −0.62, p = 0.26). In contrast, the 16 mm-diameter samples demonstrated dual-parameter dependencies on the strength and deformation metrics. The tensile strength parameter exhibited a statistically significant strong positive correlation (r = −0.89, p = 0.04), whereas the grout destruction depth, as a deformation-related metric, displayed a near-significant strong correlation (r = 0.84, p = 0.07).
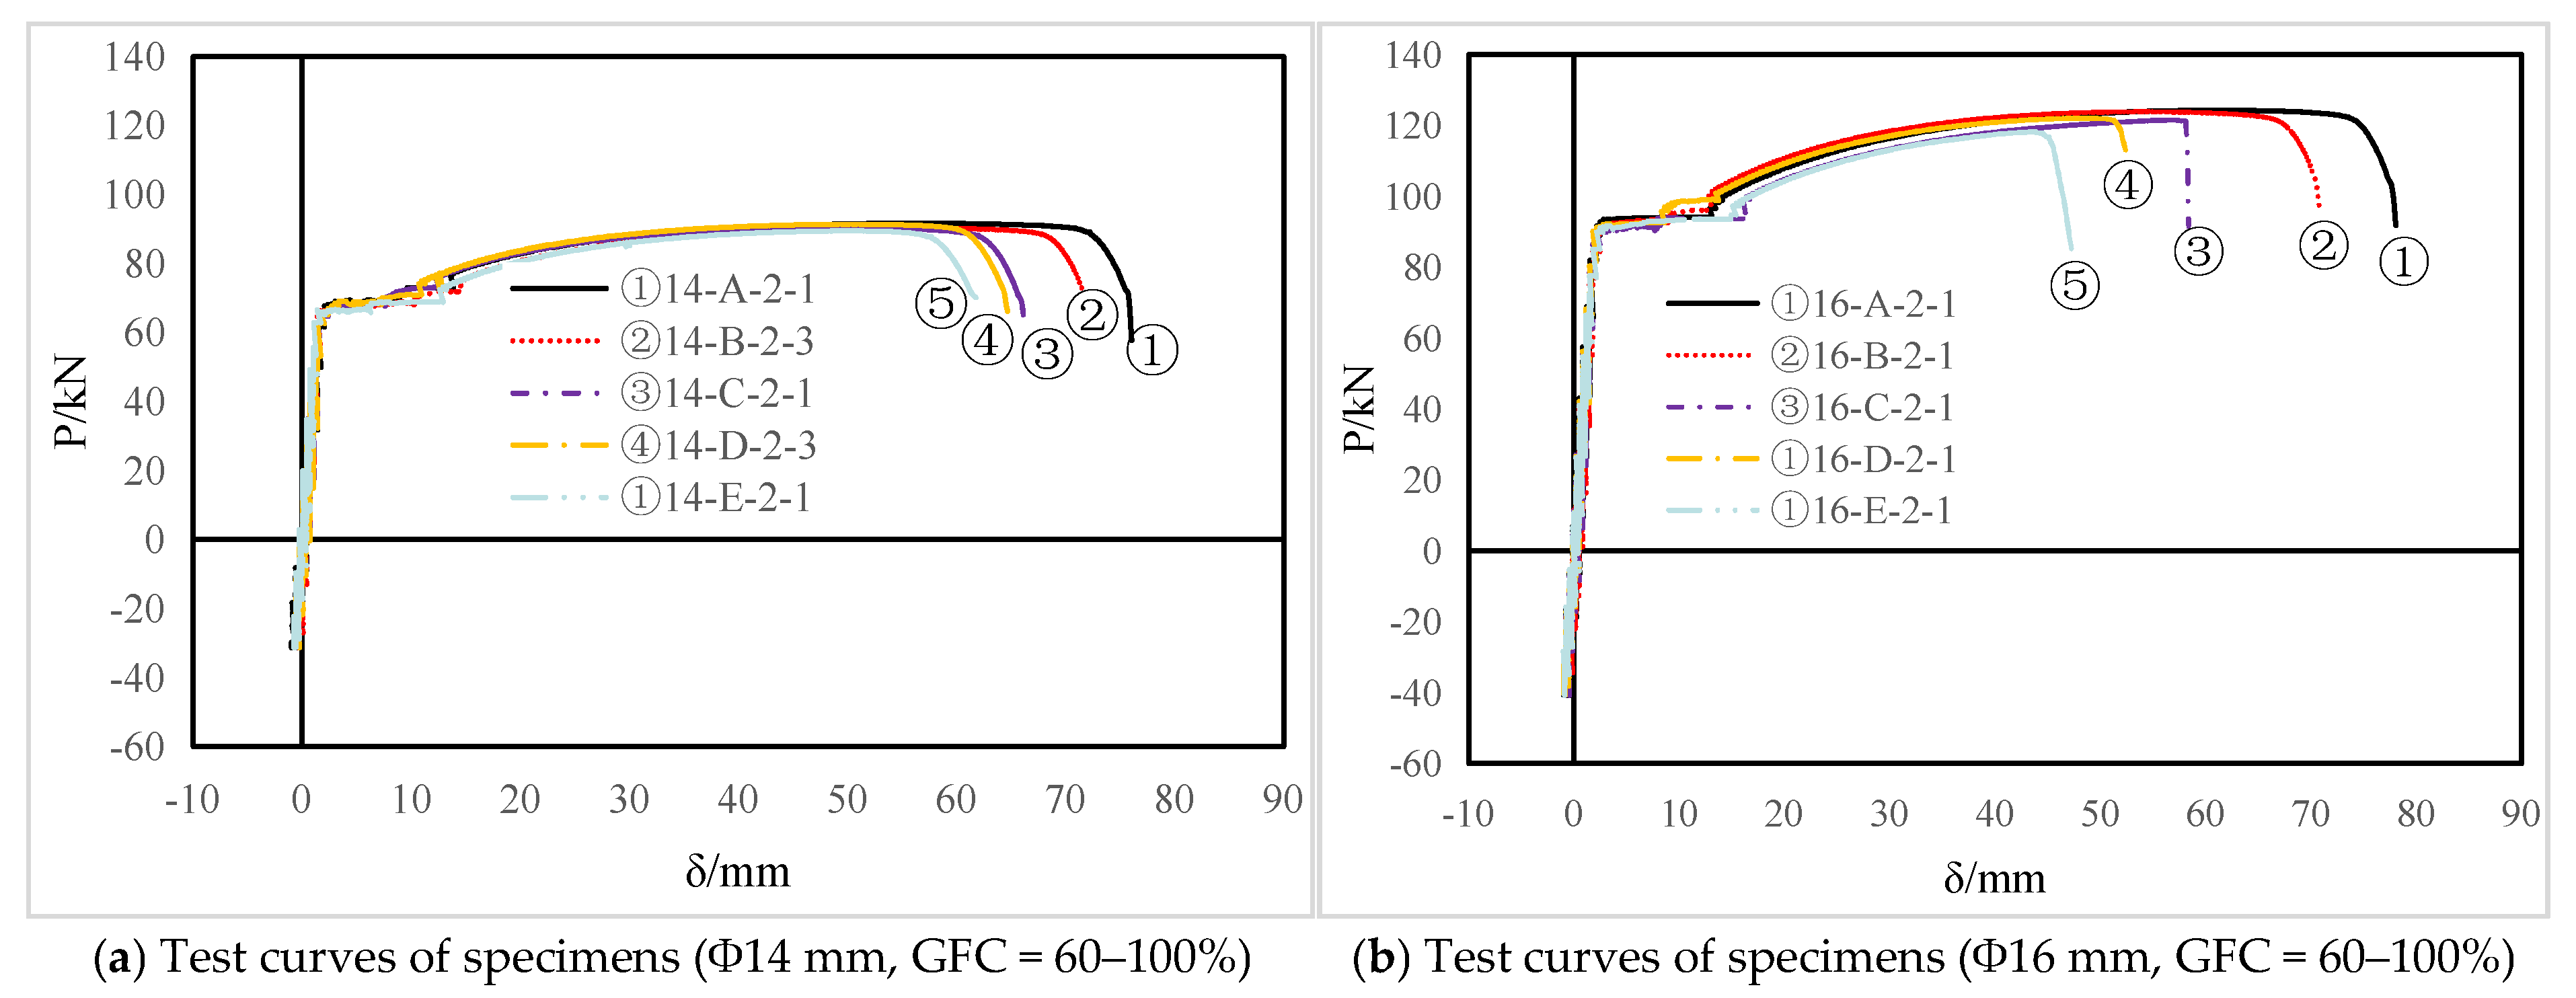
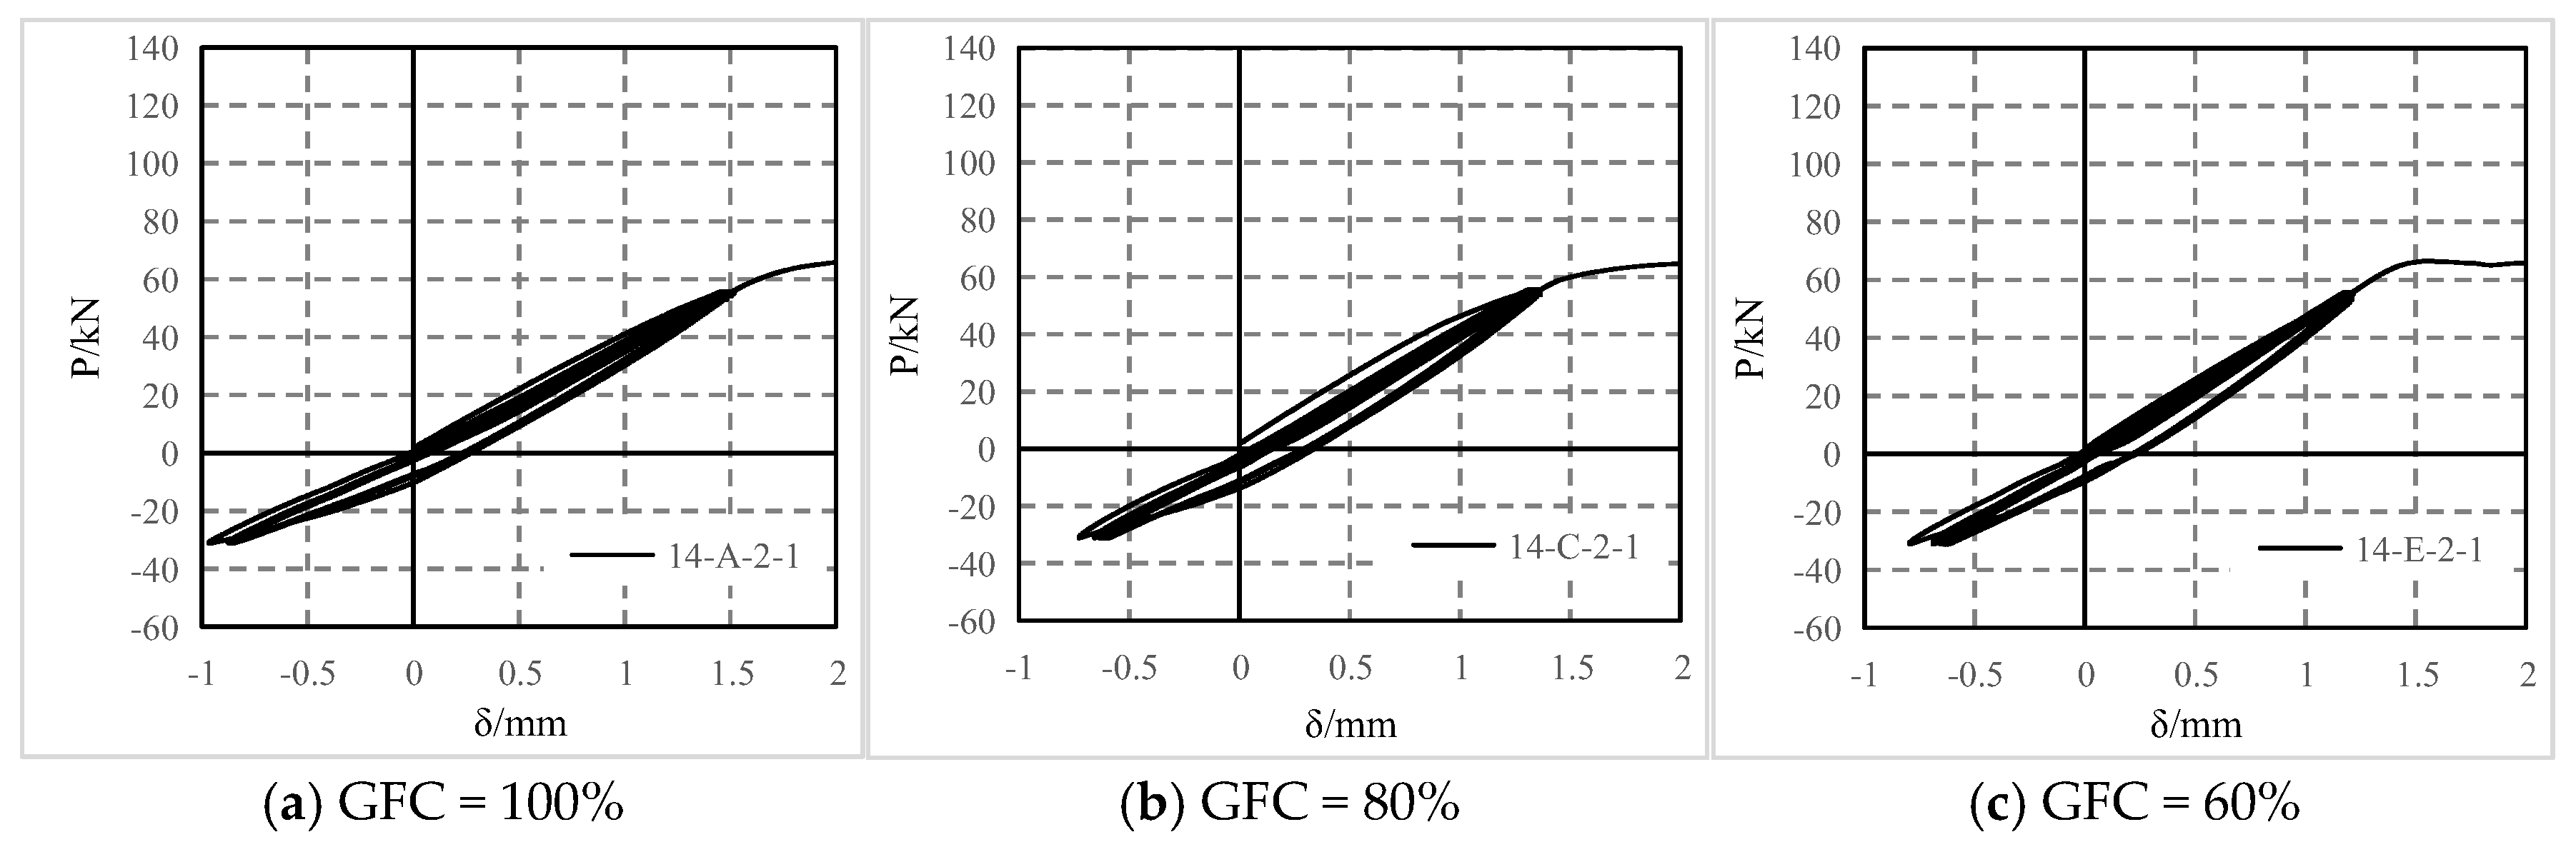
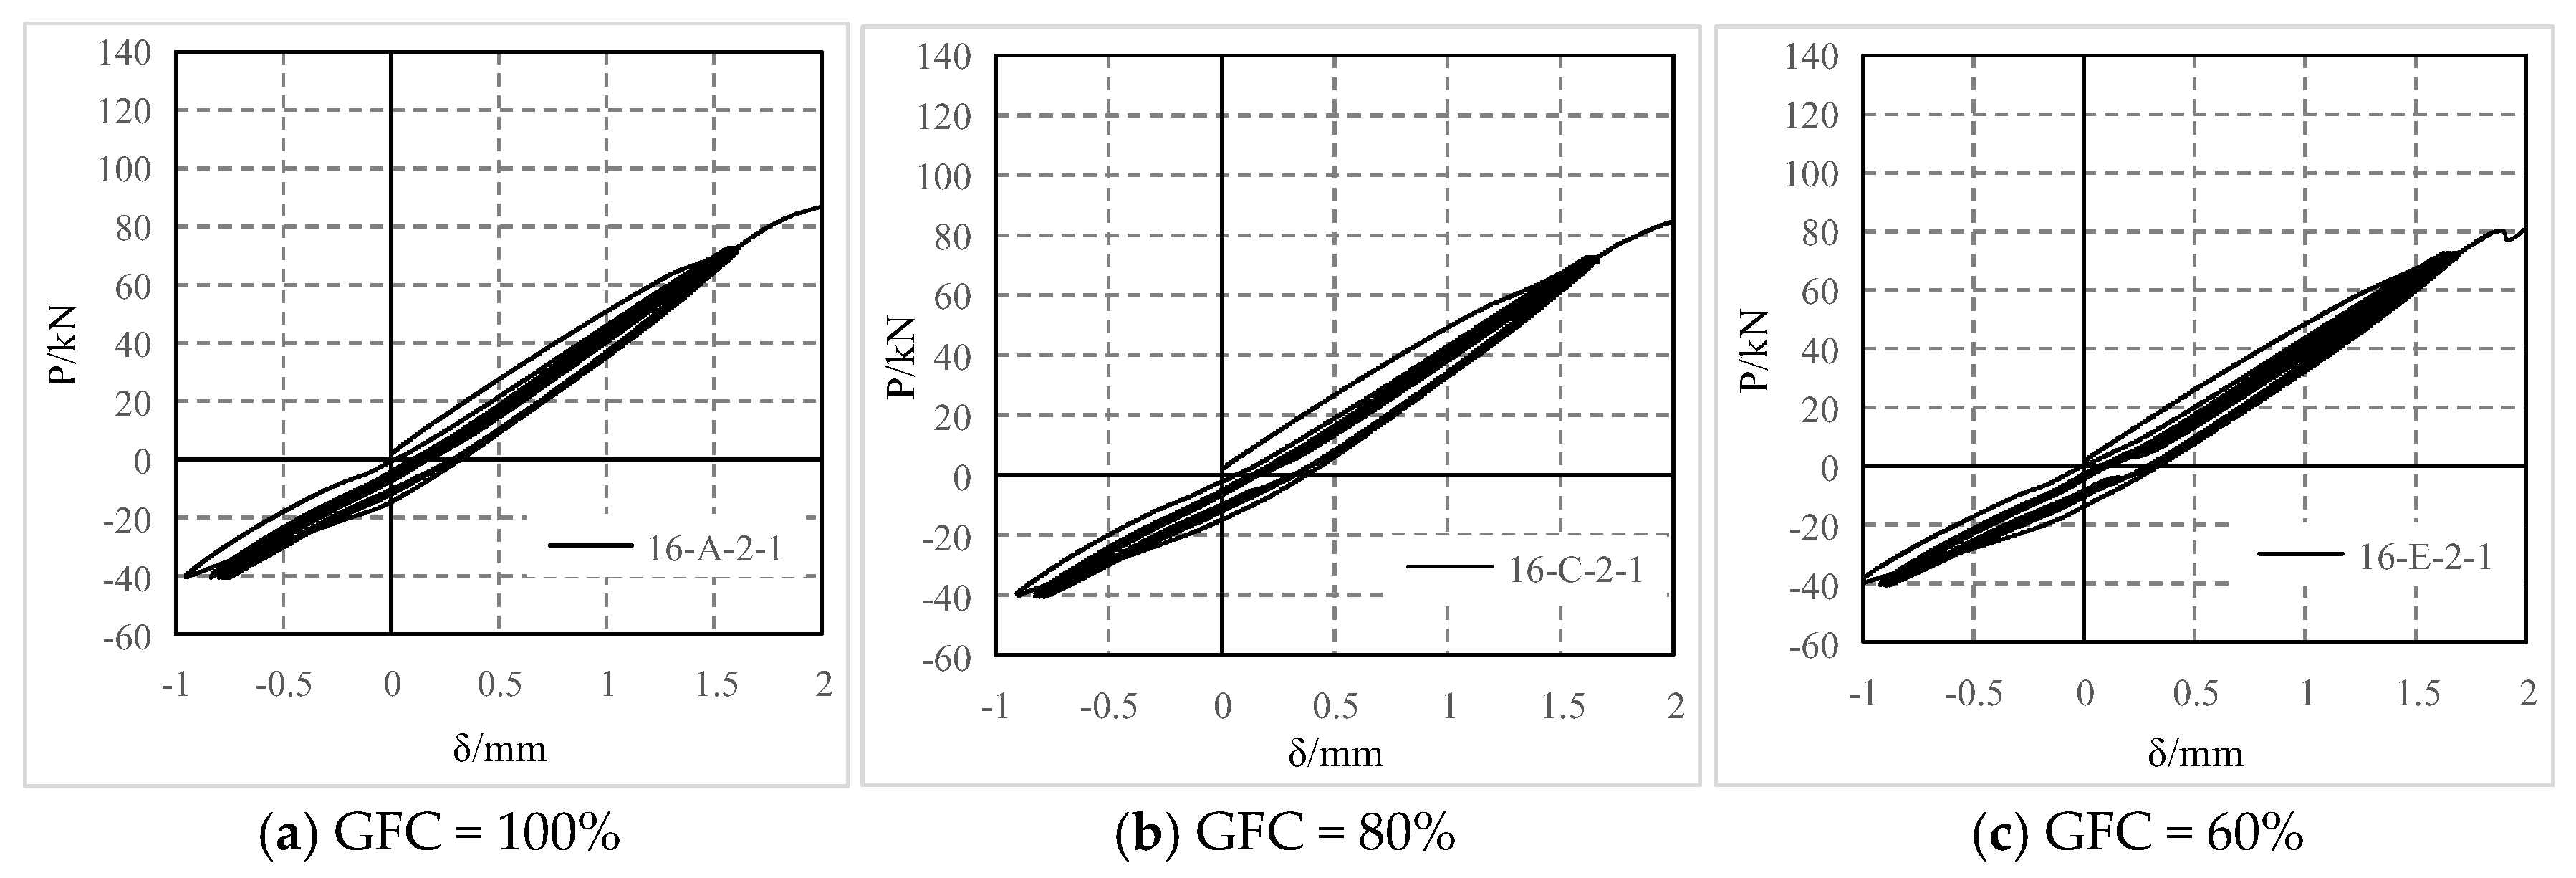
Figure 10 shows the load–displacement curves of typical samples with GFC ranging from 60% to 100%. Figure 11 and Figure 12 show the localized mechanical response evolution of selected samples from Figure 10 (GFC = 100%, 80%, and 60%) under cyclic tensile–compressive loading. The experimental curves demonstrated that as the GFC decreased, the force-displacement hysteresis loops exhibited a progressive pinching effect, with this phenomenon being markedly more pronounced in the Φ16 mm samples. The intrinsic nature of this mechanical behavior lied in the nonlinear interaction mechanisms among the sleeve, grout, and reinforcement during elastic-phase tension–compression cycles. As the GFC decreased, the anchoring restraint effect of grout on the reinforcement weakened, intensifying the nonlinearity of interfacial interactions. This amplified nonlinearity subsequently drove concentrated grout deformation, thereby exacerbating the localization of mechanical degradation in the composite system.
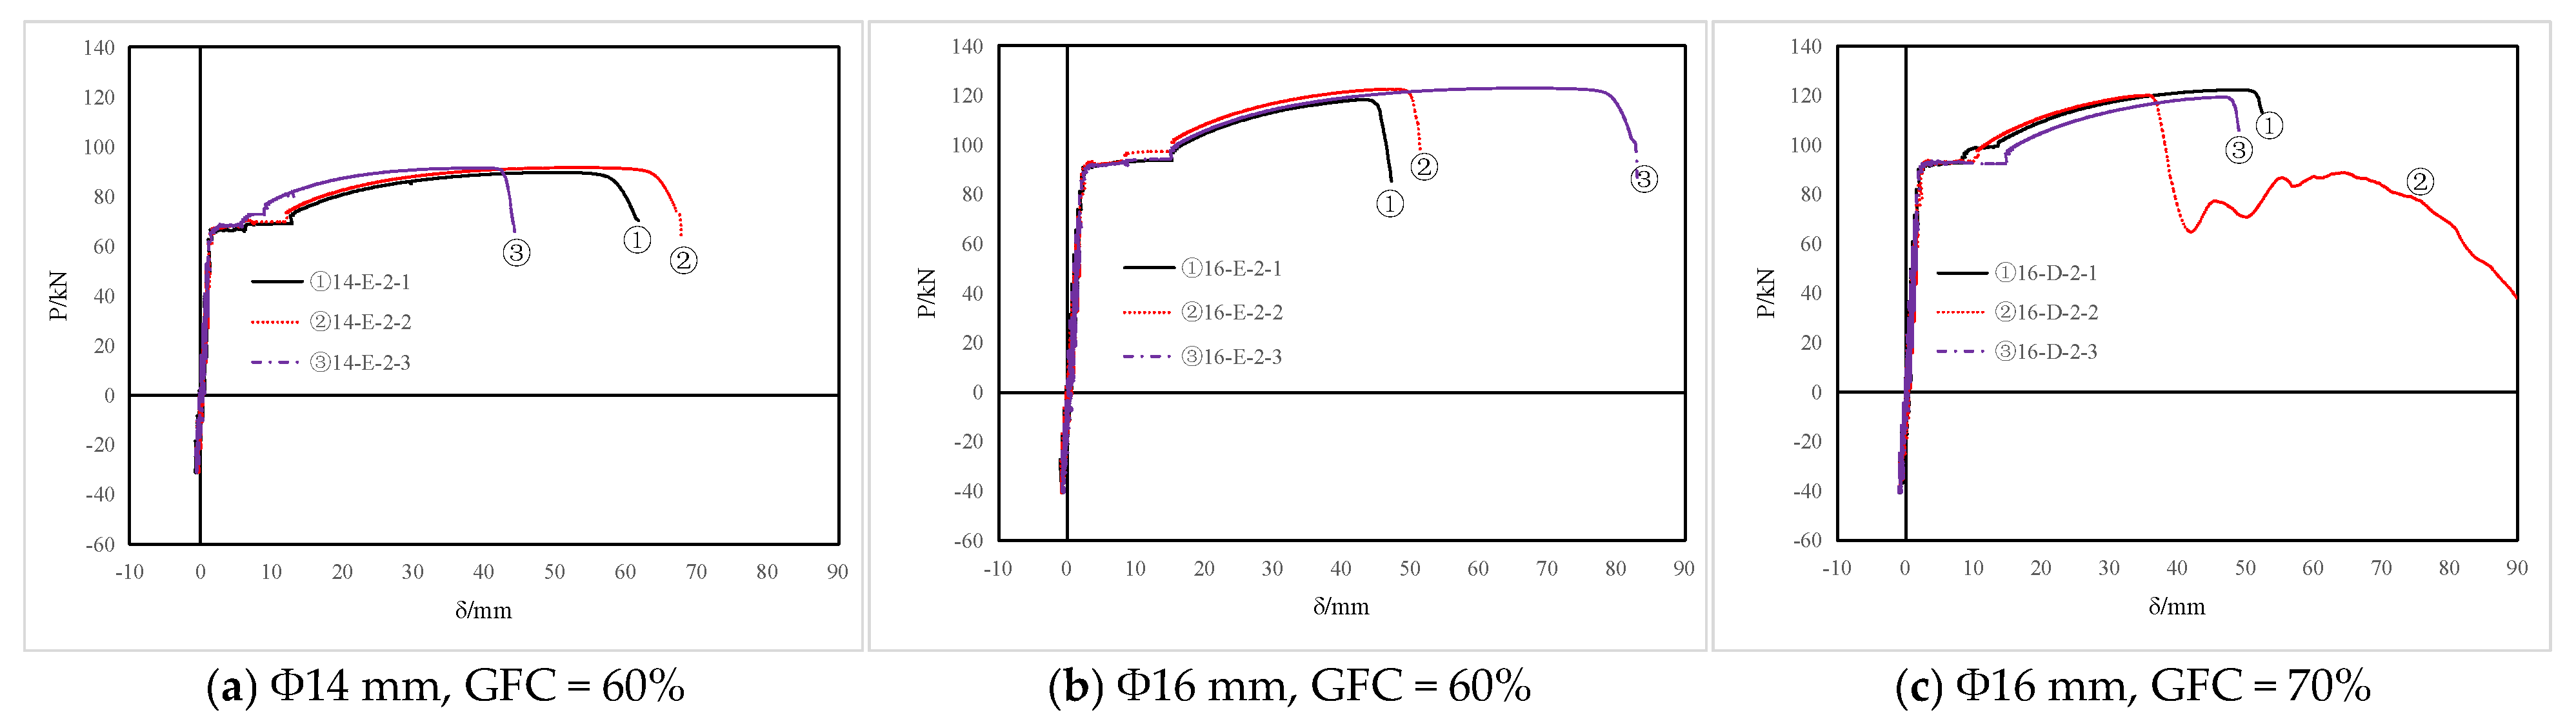
Figure 13 presents comparative test curves of samples with identical GFC levels under two distinct failure modes: nonfracture slip or reinforcement pullout. As shown in Figure 11a, for the Φ14 mm samples at GFC = 60%, the total deformation of the nonfractured samples (14-E-2-3) was significantly lower than that of the fractured samples (14-E-2-1 and 14-E-2-2). Considering the displacement at the peak load (Lmax−1) of the nonfractured sample 14-E-2-3 as the reference, the displacements of 14-E-2-1 and 14-E-2-2 corresponded to 1.30 and 1.39 times Lmax−1, respectively. A similar trend was observed in Figure 11b for the Φ16 mm samples at GFC = 60%: the total deformation of the nonfractured samples (16-E-2-1 and 16-E-2-2) was markedly lower than that of the fractured samples (16-E-2-3). Relative to the peak load displacement (Lmax−2) of fractured specimen 16-E-2-3, the displacements of 16-E-2-1 and 16-E-2-2 reached 0.65 and 0.71 times Lmax−2, respectively. In Figure 11c, three samples exhibited two nonfractured failure modes and one pull-out failure mode. The effective deformation of the pull-out sample (16-D-2-2) was smaller than that of the nonfractured samples (16-D-2-1 and 16-D-2-3). Considering the peak load displacement (Lmax−3) of the pull-out sample 16-D-2-2 as the baseline, the displacements of 16-D-2-1 and 16-D-2-3 were 1.37 and 1.32 times Lmax−3, respectively. Additionally, the pull-out samples displayed a notable secondary anchorage phenomenon after reaching the ultimate tensile limit. The high-stress cyclic tension–compression tests reveal the low-cycle fatigue characteristics and deformation capacity of the joints under severe seismic-type reversed loading. The GFC threshold established in this study serves as a key indicator for ensuring connection integrity under such loading conditions; based on performance reliability, the GFC should not fall below 90%. The test results further demonstrate that specimens failing by rebar fracture exhibit the most favorable and stable deformation performance, whereas those failing by pullout or non-fracture (bond-slip) modes show noticeably inferior deformability. Therefore, in accordance with the JGJ355 standard [23], if a non-fracture failure mode occurs during testing, a stricter criterion must be applied to evaluate joint reliability: the ultimate tensile capacity of the joint shall not be less than 1.15 times the specified tensile strength of the connected rebar.

4. Conclusions

On the basis of uniaxial tensile tests and high-stress cyclic tensile–compressive tests of Φ14 mm and Φ16 mm SGSCs with GFCs ranging from 60% to 100%, the coupled effects between the GFC levels and loading modes on the mechanical responses of connections are highlighted. The core findings can be summarized as follows:
(1)
Critical thresholds of failure modes and performance grading
Four distinct failure modes are identified: fracture at the grouted end, fracture at the threaded end, nonfracture interfacial slip, and rebar pullout. A definitive GFC threshold that governs performance reliability was observed. When the GFC is ≥ 90%, both the strength and deformation indices satisfy the requirements of the JGJ 355-2015 specification [23]. When the GFC ≤ 80%, strength or ductility degradation occurs, indicating that GFC = 90% should be adopted as the minimum design threshold. The failure mode evolution validates the bond-slip competition mechanism: reinforcement fracture dominates at high-GFC, whereas interfacial debonding becomes the controlling factor at low-GFC.
(2)
Size-dependent sensitivity under uniaxial tension
The Φ14 mm connections exhibit reinforcement fracture across all the GFC conditions, demonstrating high defect tolerance in small-diameter systems. In contrast, Φ16 mm joints experienced strength failure at GFC ≤ 80%, demonstrating higher sensitivity to grouting defects. This can likely be attributed to the fact that the bond performance of larger-diameter rebars relies more heavily on the complete encapsulation provided by the grout. A reduction in GFC leads to a decrease in the effective confinement area, thereby degrading the interfacial bond capacity. This loss of confinement manifests in the tests as an apparent increase in ductility: as GFC decreases, the nonlinear accumulation of rebar slip becomes more pronounced, resulting in an extended yield plateau and greater total displacement.
(3)
Interfacial cumulative damage under cyclic loading
A significant size-defect interaction is observed: Φ16 mm connections exhibit systematic strength degradation (without fracture or pullout) at GFC ≤ 80%, whereas Φ16 mm systems display isolated pullout failure only at GFC = 60%, confirming the relatively weak robustness of larger-diameter systems against cyclic damage. Hysteretic behavior displays asymmetric evolution. Decreasing the GFC reduces the yield plateau length and peak load displacement, resulting in a polarity reversal compared with uniaxial responses. This phenomenon stems from the dynamic interplay between interfacial interlocking enhancement and matrix damage accumulation under cyclic loading. The grout damage depth distributions exhibit strong stochasticity, suggesting that microscopic defect topology rather than macroscopic GFC dominates fatigue crack path formation.
(4)
Limitations of the Study and suggested future work
The limited sample size (n = 3 per group) may affect the robustness of statistical inferences, which could be addressed in subsequent research by increasing the number of specimens or employing non-parametric tests; the “foam-tape method” adopted herein simulates an idealized top-void defect, whereas actual grouting defects exhibit more complex morphology and distribution—micro-CT and other non-destructive techniques could be incorporated to quantify the relationship between defect characteristics and mechanical performance; the interpretations of mechanisms such as “constraint relaxation” and “slip accumulation” are primarily based on macroscopic test phenomena, and further validation via micro-scale techniques such as scanning electron microscopy (SEM) and digital image correlation (DIC) is warranted; while this study focused on top defects, the influence of mid-length defects and other defect types was not systematically investigated, making comparative studies on defect location and morphology an important direction for deepening the understanding in this field; implementing the 90% GFC threshold in practice requires supporting on-site construction processes and quality-monitoring measures, such as grout fluidity control, real-time pressure monitoring, and ultrasonic inspection, to develop actionable quality-control guidelines for field applications.

Author Contributions

Conceptualization, T.W., X.S., Y.J. (Yang Jiang) and Y.H.; methodology, T.W. and X.S.; software, Y.J. (Yang Jiang) and Y.H.; formal analysis, T.W., Y.J. (Yang Jiang), Z.W. and M.Y.; writing—original draft preparation, Y.J. (Yalong Jiang), M.Y. and Y.L.; writing—review and editing, T.W. and Y.H. All authors have read and agreed to the published version of the manuscript.

Funding

The research is partially funded by the key project of Natural Science Research in Universities of Anhui Province (2023AH051817, 2022AH051860, 2022AH051869, and 2024AH050604), Anhui Provincial Universities’ Excellent Scientific Research and Innovation Team (2023AH010059), the Science and Technology Program Project of Anhui Provincial Department of Housing and Urban-Rural Development (2023-YF089 and 2021-YF41), and the Key Laboratory Project of Anhui Xinhua University (KLBSZD202208, KLBSZD202403, and KLBSZD202302), Key Disciplines of Anhui Xinhua University (zdxk202101).

Institutional Review Board Statement

Not applicable.

Informed Consent Statement

Not applicable.

Data Availability Statement

The data presented in this study are available on request from the corresponding author.

Conflicts of Interest

Author Y.J., Z.W. and Y.L. was employed by the China Construction Industrial & Energy Engineering Group Co., Ltd. The remaining authors declare that the research was conducted in the absence of any commercial or financial relationships that could be construed as a potential conflict of interest.

References

  1. JGJ 1-2014; Technical Specification for Precast Concrete Structures. China Architecture & Building Press: Beijing, China, 2014.
  2. Henin, E.; Morcous, G. Non-proprietary bar splice sleeve for precast concrete construction. Eng. Struct. 2015, 83, 154–162. [Google Scholar] [CrossRef] [Scilit]
  3. Wu, T.; Liu, Q.W.; Cheng, R.; Liu, X. Experimental study and stress analysis of mechanical performance of grouted sleeve splice. Eng. Mech. 2017, 34, 68–75. [Google Scholar] [CrossRef]
  4. Zheng, Y.F.; Guo, Z.X.; Guan, D.Z.; Zhang, X. Parametric study on a novel grouted rolling pipe splice for precast concrete construction. Constr. Build. Mater. 2018, 166, 452–463. [Google Scholar] [CrossRef] [Scilit]
  5. Liu, L.L.; Xiao, J.Z.; Ding, T.; Zhang, K. Test and simulation on bond behavior between sleeve grout and high strength steel rebar. J. Tongji Univ. 2021, 49, 1273–1283. [Google Scholar] [CrossRef]
  6. Xie, L.L.; Zhong, B.J.; Mao, Q.S.; Chen, X.; Sun, H.L.; Yang, C.T.; Feng, X. Experimental investigation on performance of defect detectable and repairable half grouted sleeve connection under high stress cyclic tension-compression load. Eng. Mech. 2022, 39, 96–104. [Google Scholar] [CrossRef]
  7. Ren, G.; Wang, Q.; Zhang, Z.J.; Wang, C.J.; Tang, Y.G.; Lu, L.L. Research on the mechanical properties of semi-grouted sleeves based on grouting defects. Constr. Technol. 2022, 51, 70–73. [Google Scholar]
  8. Xu, C.S.; Liu, H.T.; Du, X.L. Experimental study on connection performance of grouted sleeve splicing for rebars under high stress repeated tension-compression loading. J. Build. Struct. 2018, 39, 178–184+193. [Google Scholar] [CrossRef]
  9. Alias, A.; Zubir, M.A.; Shahid, K.A.; Abd RAhman, A.B. Structural performance of grouted sleeve connectors with and without transverse reinforcement for precast concrete structure. Procedia Eng. 2013, 53, 116–123. [Google Scholar] [CrossRef] [Scilit]
  10. Chen, H.; Zhang, Z.F. Finite element analysis of the grout sleeve splicing for steel bars. J. Jiamusi Univ. 2014, 32, 341–344. [Google Scholar]
  11. Gao, R.D.; Li, X.M.; Zhang, F.W. Study on influences of grouting defects in different positions on joint strength of steel sleeve grouting. Constr. Technol. 2019, 48, 116–119+124. [Google Scholar]
  12. Li, X.M.; Gao, R.D.; Xu, Q.F.; Wang, Z.; Zhang, F. Experimental study on influence of grouting defect on joint strength of grout sleeve splicing of rebars. Build. Struct. 2018, 48, 52–56. [Google Scholar] [CrossRef]
  13. Liu, Q.Z.; Lin, Y.H.; Yang, H. Influence of defects on the degradation law of grouted sleeve connection performance. J. Guilin Univ. Technol. 2025, 45, 66–74. [Google Scholar] [CrossRef]
  14. Sun, B.; Mao, S.Y.; Ouyang, Z.P.; Wang, N. Experimental study on effect of grouting fullness on connection performance of grout sleeve with mechanical splicing end. Build. Struct. 2020, 50, 1–6. [Google Scholar] [CrossRef]
  15. Ma, G.; Zhang, Y.Z.; Hwang, H.J.; Kim, D.J. Mechanical properties of half grouted sleeve connections with insufficient grouting and bar eccentricity defects. Structures 2025, 75, 108852. [Google Scholar] [CrossRef] [Scilit]
  16. Guo, T.; Yang, J.; Wang, W.; Li, C. Experimental investigation on connection performance of fully-grouted sleeve connectors with various grouting defects. Constr. Build. Mater. 2022, 327, 126981. [Google Scholar] [CrossRef] [Scilit]
  17. Wang, T.; Zhou, Z.J.; Yuan, K.; Jiang, R.; Ma, X.; Li, L. Evaluation of common defects of grouted sleeve connectors. Case Stud. Constr. Mater. 2022, 17, 1605. [Google Scholar] [CrossRef] [Scilit]
  18. Zheng, G.Y.; Kuang, Z.P.; Xiao, J.Z.; Pan, Z. Mechanical performance for defective and repaired grouted sleeve connections under uniaxial and cyclic loadings. Constr. Build. Mater. 2020, 233, 117233. [Google Scholar] [CrossRef] [Scilit]
  19. GB/T228.1-2021; Metallic Materials—Tensile Testing—Part 1: Method of Test at Room Temperature. Standards Press of China: Beijing, China, 2021.
  20. JG/T 398-2019; The Grouting Sleeve for Rebars Splicing. Standards Press of China: Beijing, China, 2021.
  21. JG/T 408-2019; Cementitious Grout for Sleeve of Rebar Splicing. Standards Press of China: Beijing, China, 2019.
  22. JGJ 107-2016; General Technical Specification for Mechanical Splicing of Bars. China Architecture & Building Press: Beijing, China, 2016.
  23. JGJ 355-2015; Technical Specification for Grout Sleeve Splicing of Rebars. China Architecture & Building Press: Beijing, China, 2015.
  24. GB/T 51231-2016; Technical Standard for Assembled Buildings with Concrete Structures. China Architecture & Building Press: Beijing, China, 2017.
  25. American Statistical Association. ASA Guidelines for Statistical Practice; American Statistical Association: Washington, DC, USA, 2025. [Google Scholar]
Figure 1. Grouting fullness gradients.
Buildings 16 00998 g001
Figure 2. Structural details of SGSC specimens (unit: mm).
Buildings 16 00998 g002
Figure 4. Preparation of grouting joint specimens.
Buildings 16 00998 g004
Figure 5. Typical failure modes of the samples.
Buildings 16 00998 g005
Figure 6. Typical failures under high-stress cyclic loading.
Buildings 16 00998 g006
Figure 7. Uniaxial tensile test results (note: in this study, the number at the top of the bar chart is the mean value of each group of specimens, and the error bar represents the standard deviation).
Buildings 16 00998 g007aBuildings 16 00998 g007b
Figure 8. Test curves of representative specimens under uniaxial tensile loading.
Buildings 16 00998 g008
Figure 9. High-stress cyclic tension–compression test results (note: in this study, the number at the top of the bar chart is the mean value of each group of specimens, and the error bar represents the standard deviation).
Buildings 16 00998 g009
Figure 10. Test curves of representative specimens under high-stress cyclic tensile–compressive loading.
Buildings 16 00998 g010
Figure 11. Test curves of representative specimens during cyclic loading (Φ14 mm).
Buildings 16 00998 g011
Figure 12. Test curves of representative specimens during cyclic loading (Φ16 mm).
Buildings 16 00998 g012
Figure 13. Test curves of specimens with the same GFC level under high-stress cyclic tensile–compressive loading.
Buildings 16 00998 g013
Table 1. Specimen design of SGSCs.
Specimen NumberGFC (%)Anchorage Length (mm)Number of Specimens
14-A-x-y1008 d6
14-B-x-y907.2 d6
14-C-x-y806.4 d6
14-D-x-y705.6 d6
14-E-x-y604.8 d6
16-A-x-y1008 d6
16-B-x-y907.2 d6
16-C-x-y806.4 d6
16-D-x-y705.6 d6
16-E-x-y604.8 d6
Table 2. Results of the mechanical property tests of the rebar.
Diameter (mm)Yield Strength (MPa)Ultimate Strength (MPa)Elastic Modulus (GPa)Actual Yield-to-Tensile Ratio
144556001921.319
164606151951.337
Table 3. Test loading scheme.
Loading ConditionsLoading Protocol
Uniaxial Loading0 → 0.6 fyk 1 (applied load) → 0 (unloading, record residual deformation) → maximum tension (record tensile strength) → failure
Cyclic Loading0 → cyclic loading between 0.9 fyk (tension) and −0.5 fyk (compression) for 20 cycles → failure
1 fyk represents the standard value of the yield strength of the steel reinforcement.
Table 5. Correlation analysis between high-stress cyclic tension–compression test indicators and the GFC.
ParameterPearson’s rCorrelation Typep ValueSignificance (α = 0.05)
Φ14σy0.02Weak positive correlation0.97Nonsignificant
σt−0.28Weak negative correlation0.65Nonsignificant
u0−0.62Moderate negative correlation0.26Nonsignificant
h0.45Moderate positive correlation0.45Nonsignificant
Φ16σy0.63Moderate positive correlation0.25Nonsignificant
σt0.89Strong positive correlation0.04Significant
u0−0.04Weak negative correlation0.95Nonsignificant
h0.84Strong positive correlation0.07Marginally significant
Disclaimer/Publisher’s Note: The statements, opinions and data contained in all publications are solely those of the individual author(s) and contributor(s) and not of MDPI and/or the editor(s). MDPI and/or the editor(s) disclaim responsibility for any injury to people or property resulting from any ideas, methods, instructions or products referred to in the content.