Article

Numerical Simulation Investigating the Creep Behavior of Jointed Rock Masses Incorporating Variable Shear Stiffness

1
Ocean College, Zhejiang University, Zhoushan 316021, China
2
Zhejiang Communications Investment Group Expressway Construction and Management Co., Ltd., Hangzhou 310051, China
3
China First Highway Engineering Co., Ltd., Beijing 101102, China
4
School of Management Science and Engineering, Anhui University of Finance and Economics, Bengbu 233030, China
5
School of Civil Engineering, Southwest Jiaotong University, Chengdu 610031, China
6
College of Civil Engineering, Tongji University, Shanghai 200092, China
*
Author to whom correspondence should be addressed.
Buildings 2026, 16(5), 977; https://doi.org/10.3390/buildings16050977
Submission received: 25 January 2026 / Revised: 18 February 2026 / Accepted: 27 February 2026 / Published: 2 March 2026

Abstract

This study investigates the mechanical behavior of jointed rock mass tunnels through numerical simulations using UDEC software. Focusing on the time-dependent variation in joint shear stiffness, a theoretical model is proposed to characterize the evolution of shear stiffness over time. Based on this model, numerical simulations are conducted to analyze tunnel stability and associated deformation patterns. A variable shear stiffness model is first established in UDEC, which effectively captures the evolution of shear creep displacement along rock joints. Incorporating this model, an adaptive support scheme involving locally extended rock bolts is introduced to improve long-term tunnel stability. The proposed approach is further validated through a comparative analysis with field monitoring data obtained from a tunnel in Yunnan Province. The results indicate that creep effects significantly influence tunnel behavior, leading to rapid increases in crown settlement and expansion of the surrounding rock disturbance zone during the early stages following excavation. Optimizing the bolt layout is shown to effectively reduce the extent of the disturbed zone and enhance the tunnel’s load-bearing capacity. Finally, a novel reinforcement optimization method for jointed rock mass tunnels is proposed, along with a key threshold value for assessing tunnel stability, thereby providing theoretical support for practical engineering applications.

1. Introduction

The presence of joints compromises the continuity and integrity of rock masses, leading to a substantial reduction in their overall strength and stiffness. Given their inherent weakness, the mechanical behavior and deformation characteristics of joints have long been a central concern in rock mechanics [1,2,3]. The presence of such discontinuities frequently governs the long-term, time-dependent behavior of rock masses, as exemplified by tensile cracking in long-serving tunnels, the progressive failure of dam foundations, and creep-induced sliding along weak geological layers [4,5,6,7].
To investigate the creep behavior of rock, numerous scholars have conducted laboratory experiments, theoretical analyses, and numerical simulations, yielding valuable insights [8,9,10]. Shen et al. systematically examined the shear creep characteristics of regular saw-tooth structural planes, providing a comprehensive analysis of the time-dependent behavior of both shear and normal creep deformations in relation to normal stress, shear stress, and asperity angle [11]. Wang Zhen conducted rock-like tests incorporating the joint roughness coefficient (JRC) and observed that the shear rate of structural planes varies continuously during shearing. His findings indicate that a higher JRC enhances the rate dependence of both strength and deformation, thereby increasing the creep potential of the structural plane [12]. To further elucidate the intrinsic mechanisms governing shear creep, component models have been widely adopted to characterize the creep behavior of rock specimens. Xu et al. introduced a nonlinear displacement element (NRC) and integrated it in series with the Nishihara model, thereby developing a shear creep model capable of simulating accelerated creep [13]. Similarly, Zhang et al. identified brittle failure characteristics in the shear creep of weak structural planes in green schist and attributed this behavior to the progressive propagation and accumulation of internal shear cracks [14]. Liu et al. proposed a nonlinear rheological model that accounts for the degradation of the rock’s elastic modulus and analyzed the mathematical relationship between the accelerating creep index and its rate of occurrence [15]. In a related approach, Lin et al. incorporated a time-dependent damage variable into the Mohr–Coulomb residual strength framework, establishing a nonlinear viscoplastic element that captures the degradation of shear strength over time [16]. More recently, Wang et al. employed a computational intelligence algorithm to identify the parameters of the Burgers model. The resulting engineering calculations demonstrated strong agreement with field monitoring data, further validating the applicability of such parameter identification techniques in practical engineering contexts [17].
Given the complexity of rheological phenomena and the critical role of creep in long-term rock behavior, numerical modeling has become an indispensable tool for investigating the time-dependent mechanical response of structural planes in rock engineering [18,19]. Kenney employed UDEC 3.1 to analyze the progressive deformation and failure mechanisms of surrounding rock, demonstrating that creep along discontinuities is a fundamental factor contributing to rock mass instability [20]. Yang et al. utilized PFC3D 3.0 to investigate the triaxial creep behavior of red shale, revealing an inverse correlation between rheological characteristics and key material parameters [21]. Guo et al. derived the three-dimensional differential formulation of a structural plane creep model and implemented it in FLAC3D 3.0 via interface elements; their simulations indicated that the tunnel haunch region is particularly susceptible to failure under sustained loading [22]. Yang and Pathirage developed a discrete element model that incorporates the time-dependent degradation of both elastic modulus and strength, effectively capturing the long-term strength evolution of concrete materials [23]. Sun et al. demonstrated that optimizing bolt support configurations can significantly mitigate long-term settlement displacements by implementing a customized Burgers model in UDEC 7.0 [24]. While extensive research has advanced the understanding of jointed rock mass behavior, the time-dependent variation in shear stiffness remains rarely addressed in numerical analyses—a critical gap that warrants further exploration.
This study incorporates an experimentally derived variable stiffness model into the UDEC 5.0 software to establish a novel equivalent creep model. Through this approach, the variable shear stiffness can be dynamically assigned to joints, thereby enabling targeted and more representative parameterization of joint behavior. Importantly, this framework establishes a design methodology aimed at ensuring the long-term stability of jointed rock masses and offers a robust theoretical foundation for optimizing support strategies in underground engineering applications.

2. Construction of the Creep Model

UDEC offers significant advantages in joint analysis and includes corresponding joint models. Therefore, UDEC was selected as the numerical calculation tool. Existing joint models include the Mohr–Coulomb model, a continuous yielding model accounting for joint damage, and the Barton–Bandis model, which incorporates scale effects. To focus on the influence of joint shear stiffness, the Mohr–Coulomb model is retained for subsequent analysis. In direct shear simulations, joints are generalized as contact relationships, incorporating the effects of shear stiffness and the internal friction angle of the structural plane. Analysis of constant normal load (CNL) direct shear tests [25,26] indicates that shear stress remains constant during creep, while shear displacement increases continuously with time.
In CNL shear creep tests, normal stress is held constant while shear stress is incrementally increased, leading to a continuous rise in shear displacement. The test primarily monitors the development of shear displacement. Since the applied normal stress is typically small relative to the uniaxial compressive strength of the rock, associated normal displacements are negligible. Consequently, subsequent analysis focuses on shear displacement.
Based on the Nishihara model, the shear creep model for jointed rock is expressed by Equation (1).
u = τ G 0 + τ G 1 1 e x p ( G 1 η 1 t )                                                               τ < τ s τ G 0 + τ G 1 1 e x p ( G 1 η 1 t ) + τ τ s η 2 t                 τ τ s
Shear stiffness is defined by Equation (2).
k s = Δ τ / Δ u
Transforming Equation (1) yields:
k s   ( t ) = 1 G 0 + 1 G 1 ( 1 e x p ( G 1 η 1 t ) ) 1                                                             τ < τ s 1 G 0 + 1 G 1 ( 1 e x p ( G 1 η 1 t ) ) + τ τ s τ η 2 t   1             τ τ s
G0 and G1 are the shear stiffness, η1 and η2 are the viscosity coefficients, τ is the shear stress, u is the shear displacement, ks is the shear stiffness, τs is the long-term strength, t is the time. Based on the fitting formula, in which these parameters are stress-dependent [27], a parameter-quantified version of the Nishihara model is derived.
k s   ( t ) = 1 1.576 σ + 1.64 + 1 ( 19.02 l n σ + 26.88 ) σ / τ ( 1 e x p ( 19.02 l n σ + 26.8 220 38.12 σ t ) ) 1                                                                                                                                                                                           τ < τ s 1 ( 1.576 σ + 1.64 ) [ ( 1 1.4 ) σ 0.94 ( τ τ s ) ] + 1 ( 19.02 l n σ + 26.88 ) σ / τ ( 1 e x p ( 19.02 l n σ + 26.8 55 9.53 σ t ) ) + τ τ s τ ( 175.47 ln σ 46 ) t 1       τ τ s
The shear stiffness and viscosity coefficients were input into UDEC to obtain the equivalent shear stiffness under different shear stress levels. When time-dependent effects were considered, the corresponding time parameters were also incorporated. Based on this approach, shear creep simulation curves under various shear stresses were generated.
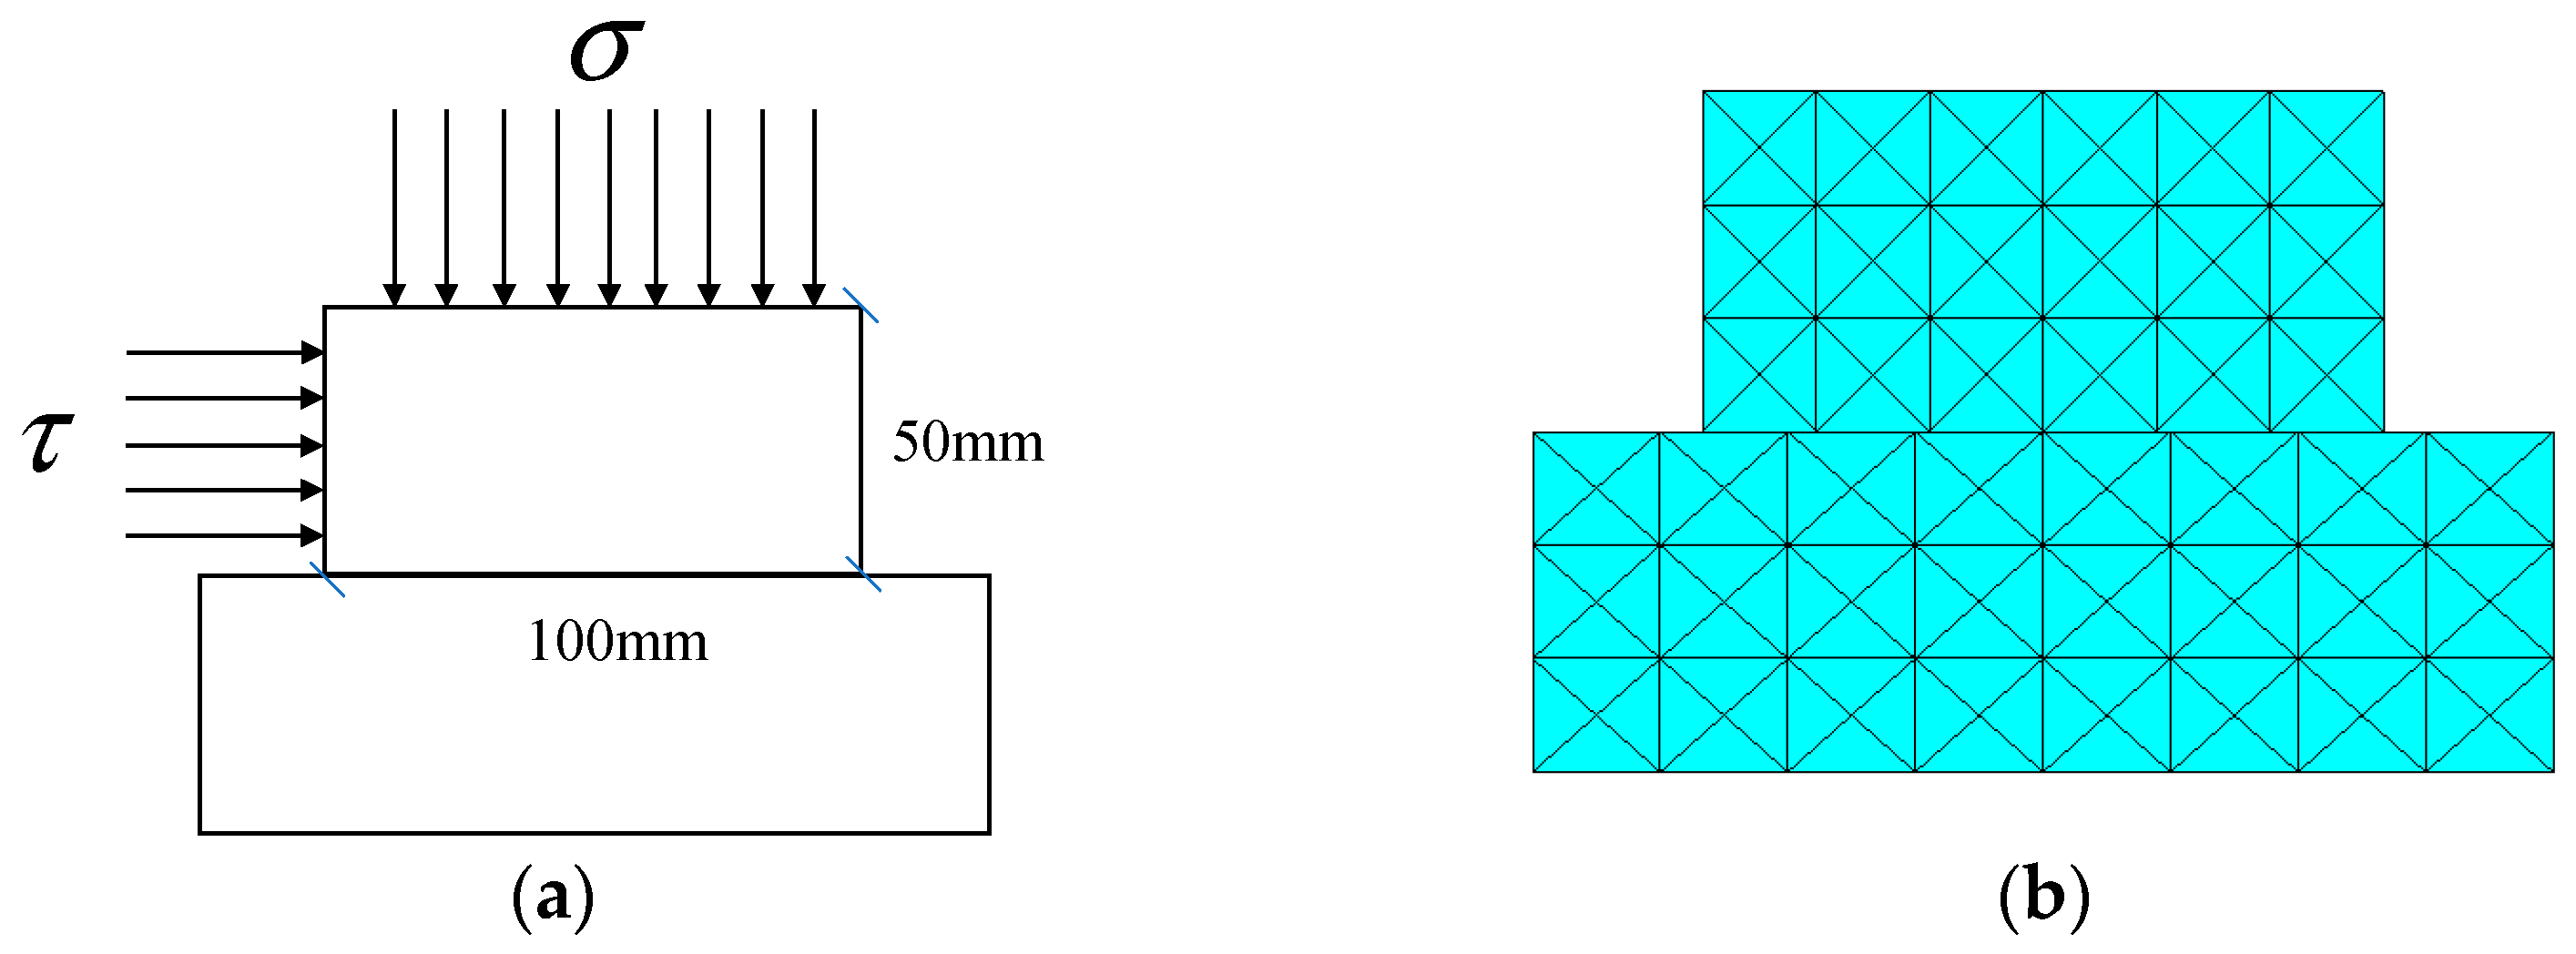
A generalized jointed rock model was first established in UDEC for numerical simulation of the shear tests. The specimen measured 50 mm × 100 mm, with a grid element edge length of 16.67 mm. The joint was simulated using joint elements. Both the intact material and the joint elements conformed to the Mohr–Coulomb tensile-shear failure criterion. The loading configuration and the computational model are illustrated in Figure 1.
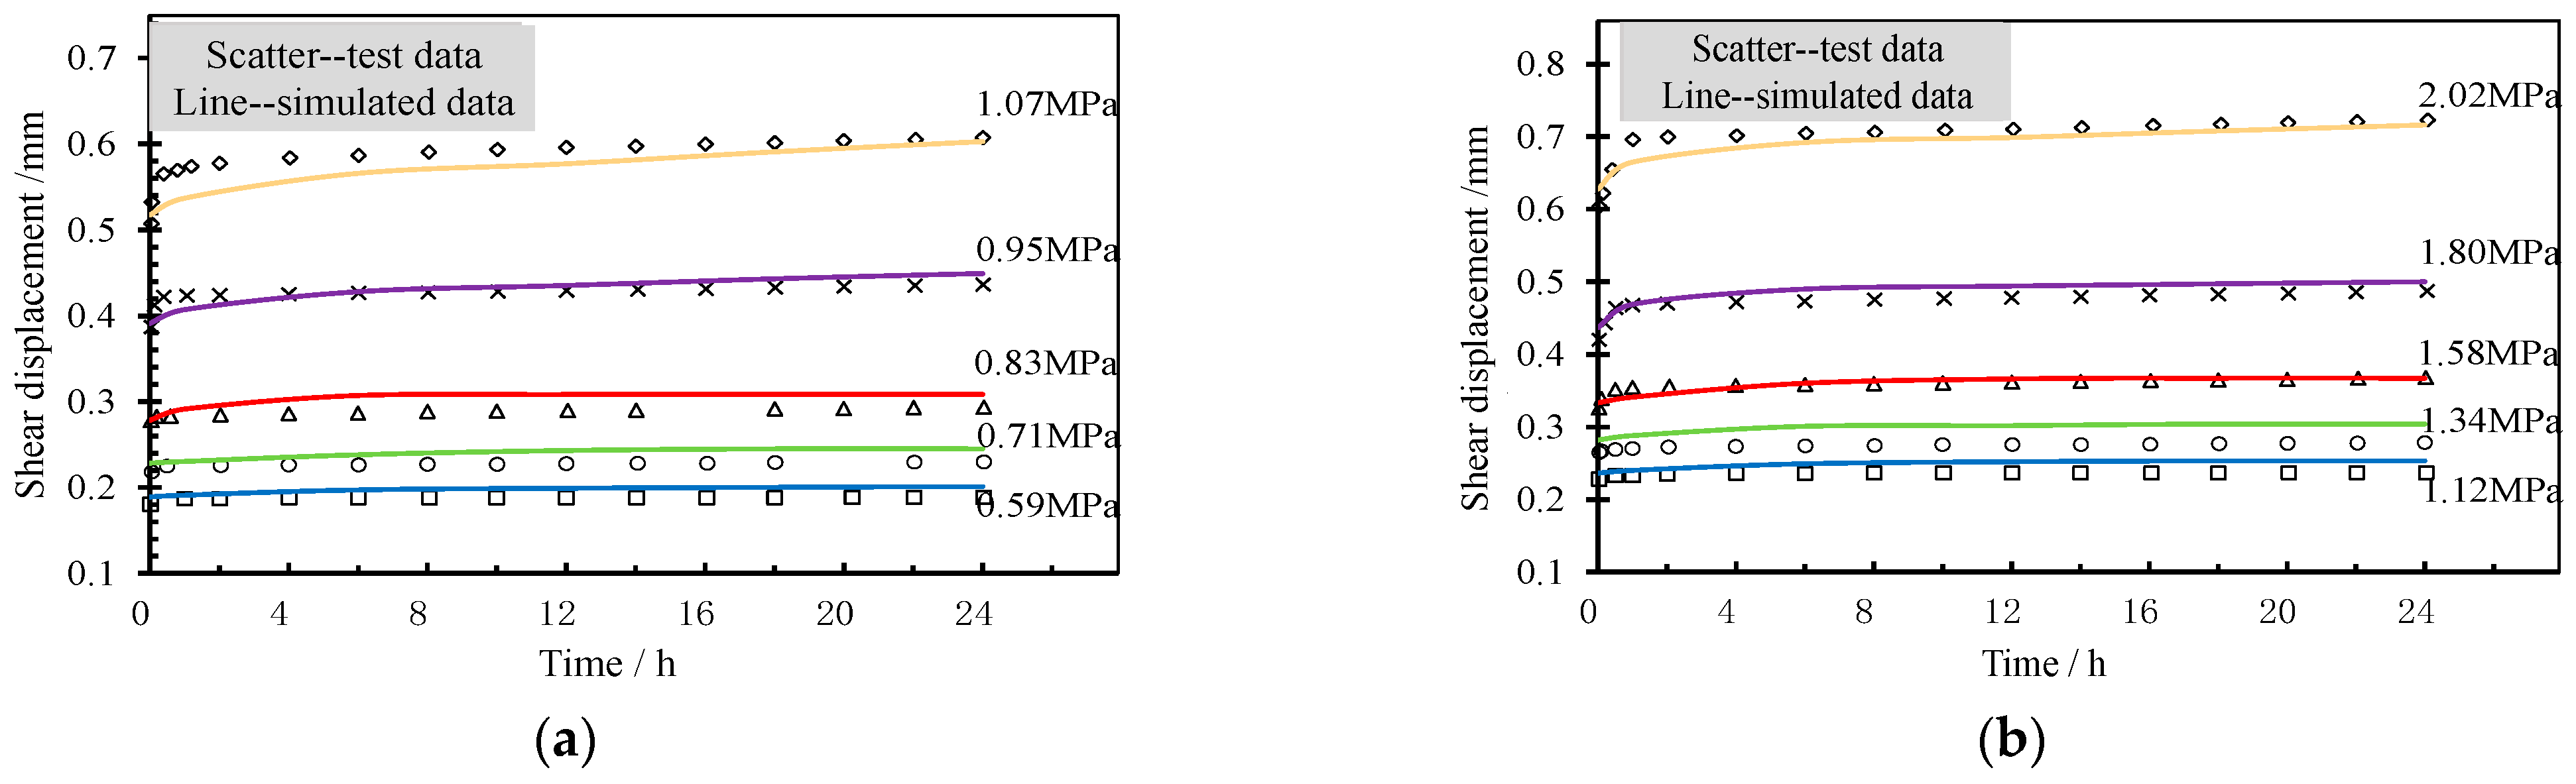
The in situ stress level for medium-depth underground engineering projects typically ranges from 0.5 MPa to 2.0 MPa; therefore, the stress levels selected for this test fall within this range. Based on the results of laboratory shear tests on joints under various normal stress conditions [27], the calculation parameters are summarized in Table 1. These parameters were subsequently substituted into Equation (4) to compute the shear stiffness, from which the shear displacement values corresponding to different loading stresses were obtained. A comparison between the numerical simulations and experimental results [27] is presented in Figure 2.
As shown in Figure 2a, the numerical simulation results agree well with the experimental data at relatively low shear stress. At a shear stress of 0.83 MPa, the simulation yields slightly higher values than the experiment while maintaining an identical growth trend. At 0.95 MPa, the simulated displacement increases more rapidly, matching the experimental measurement at 8 h, after which its growth rate slows, closely tracking the experimental data. When the stress reaches 1.07 MPa, the simulation initially underestimates the displacement but eventually aligns with the experimental result. Under higher normal stress conditions (Figure 2b), the numerical simulations are generally similar to those observed in Figure 2a. At a shear stress of 1.34 MPa, the simulated values exceed the experimental measurements, while both curves maintain the same variation trend. Excellent agreement between simulation and experiment is achieved at 1.58 and 1.80 MPa. When the shear stress reaches 2.02 MPa, the simulated displacement initially lags behind the experimental data; however, it subsequently accelerates, progressively converging toward the measured values while preserving the identical trend.
The correlation coefficients for each loading stress level are presented in Table 1. The R2 are predominantly greater than 0.9, indicating a strong correlation between the numerical simulations and experimental results. The slightly lower correlation for SY-1 (1.07 MPa) is primarily attributed to greater discrepancies observed during the decelerated creep phase. Nevertheless, the overall evolutionary trends of the two datasets are similar, and their final outcomes are consistent. The experimental parameters, obtained through fitting, introduce a degree of uncertainty that influences the numerical simulation results.
By employing the parameter-quantified model to compute joint shear stiffness, all relevant parameters can be specified in a single step, thereby avoiding the repetitive input of equivalent stiffness values for each shear stress level. This significantly streamlines the shear creep calculation process. Moreover, the creep displacement obtained with this method exhibits similar trends that closely align with the laboratory results.

3. Results and Discussions

3.1. Effect of Variable Shear Stiffness

Current research typically models the surrounding rock as an equivalent continuous medium, with limited consideration given to the influence of structural planes on tunnel excavation—and even less attention to their time-dependent behavior. To assess the impact of different conditions on stress distribution around the tunnel, a systematic evaluation of excavation-induced disturbance is therefore essential. The presence of structural planes affects the formation of the pressure arch above the tunnel, whereas the plastic zone is conventionally defined as the region where the stress exceeds the failure threshold. To holistically characterize the disturbance induced by both joints and the surrounding rock, the radial tensile strain is adopted as the criterion. Accordingly, the allowable tensile strain of the rock is determined to be 3.19 × 10⁻⁴ [28].
According to the design parameters of two-lane highways specified in the Specifications for Design of Highway Tunnels, a standard tunnel with a span of 11 m is established. The surrounding rock grade of the tunnel is Grade IV. The parameters were mainly derived from the studies of Wu and Zhang [29,30], with the surrounding rock and joint parameters obtained through back-analysis. The material parameters are summarized in Table 2.
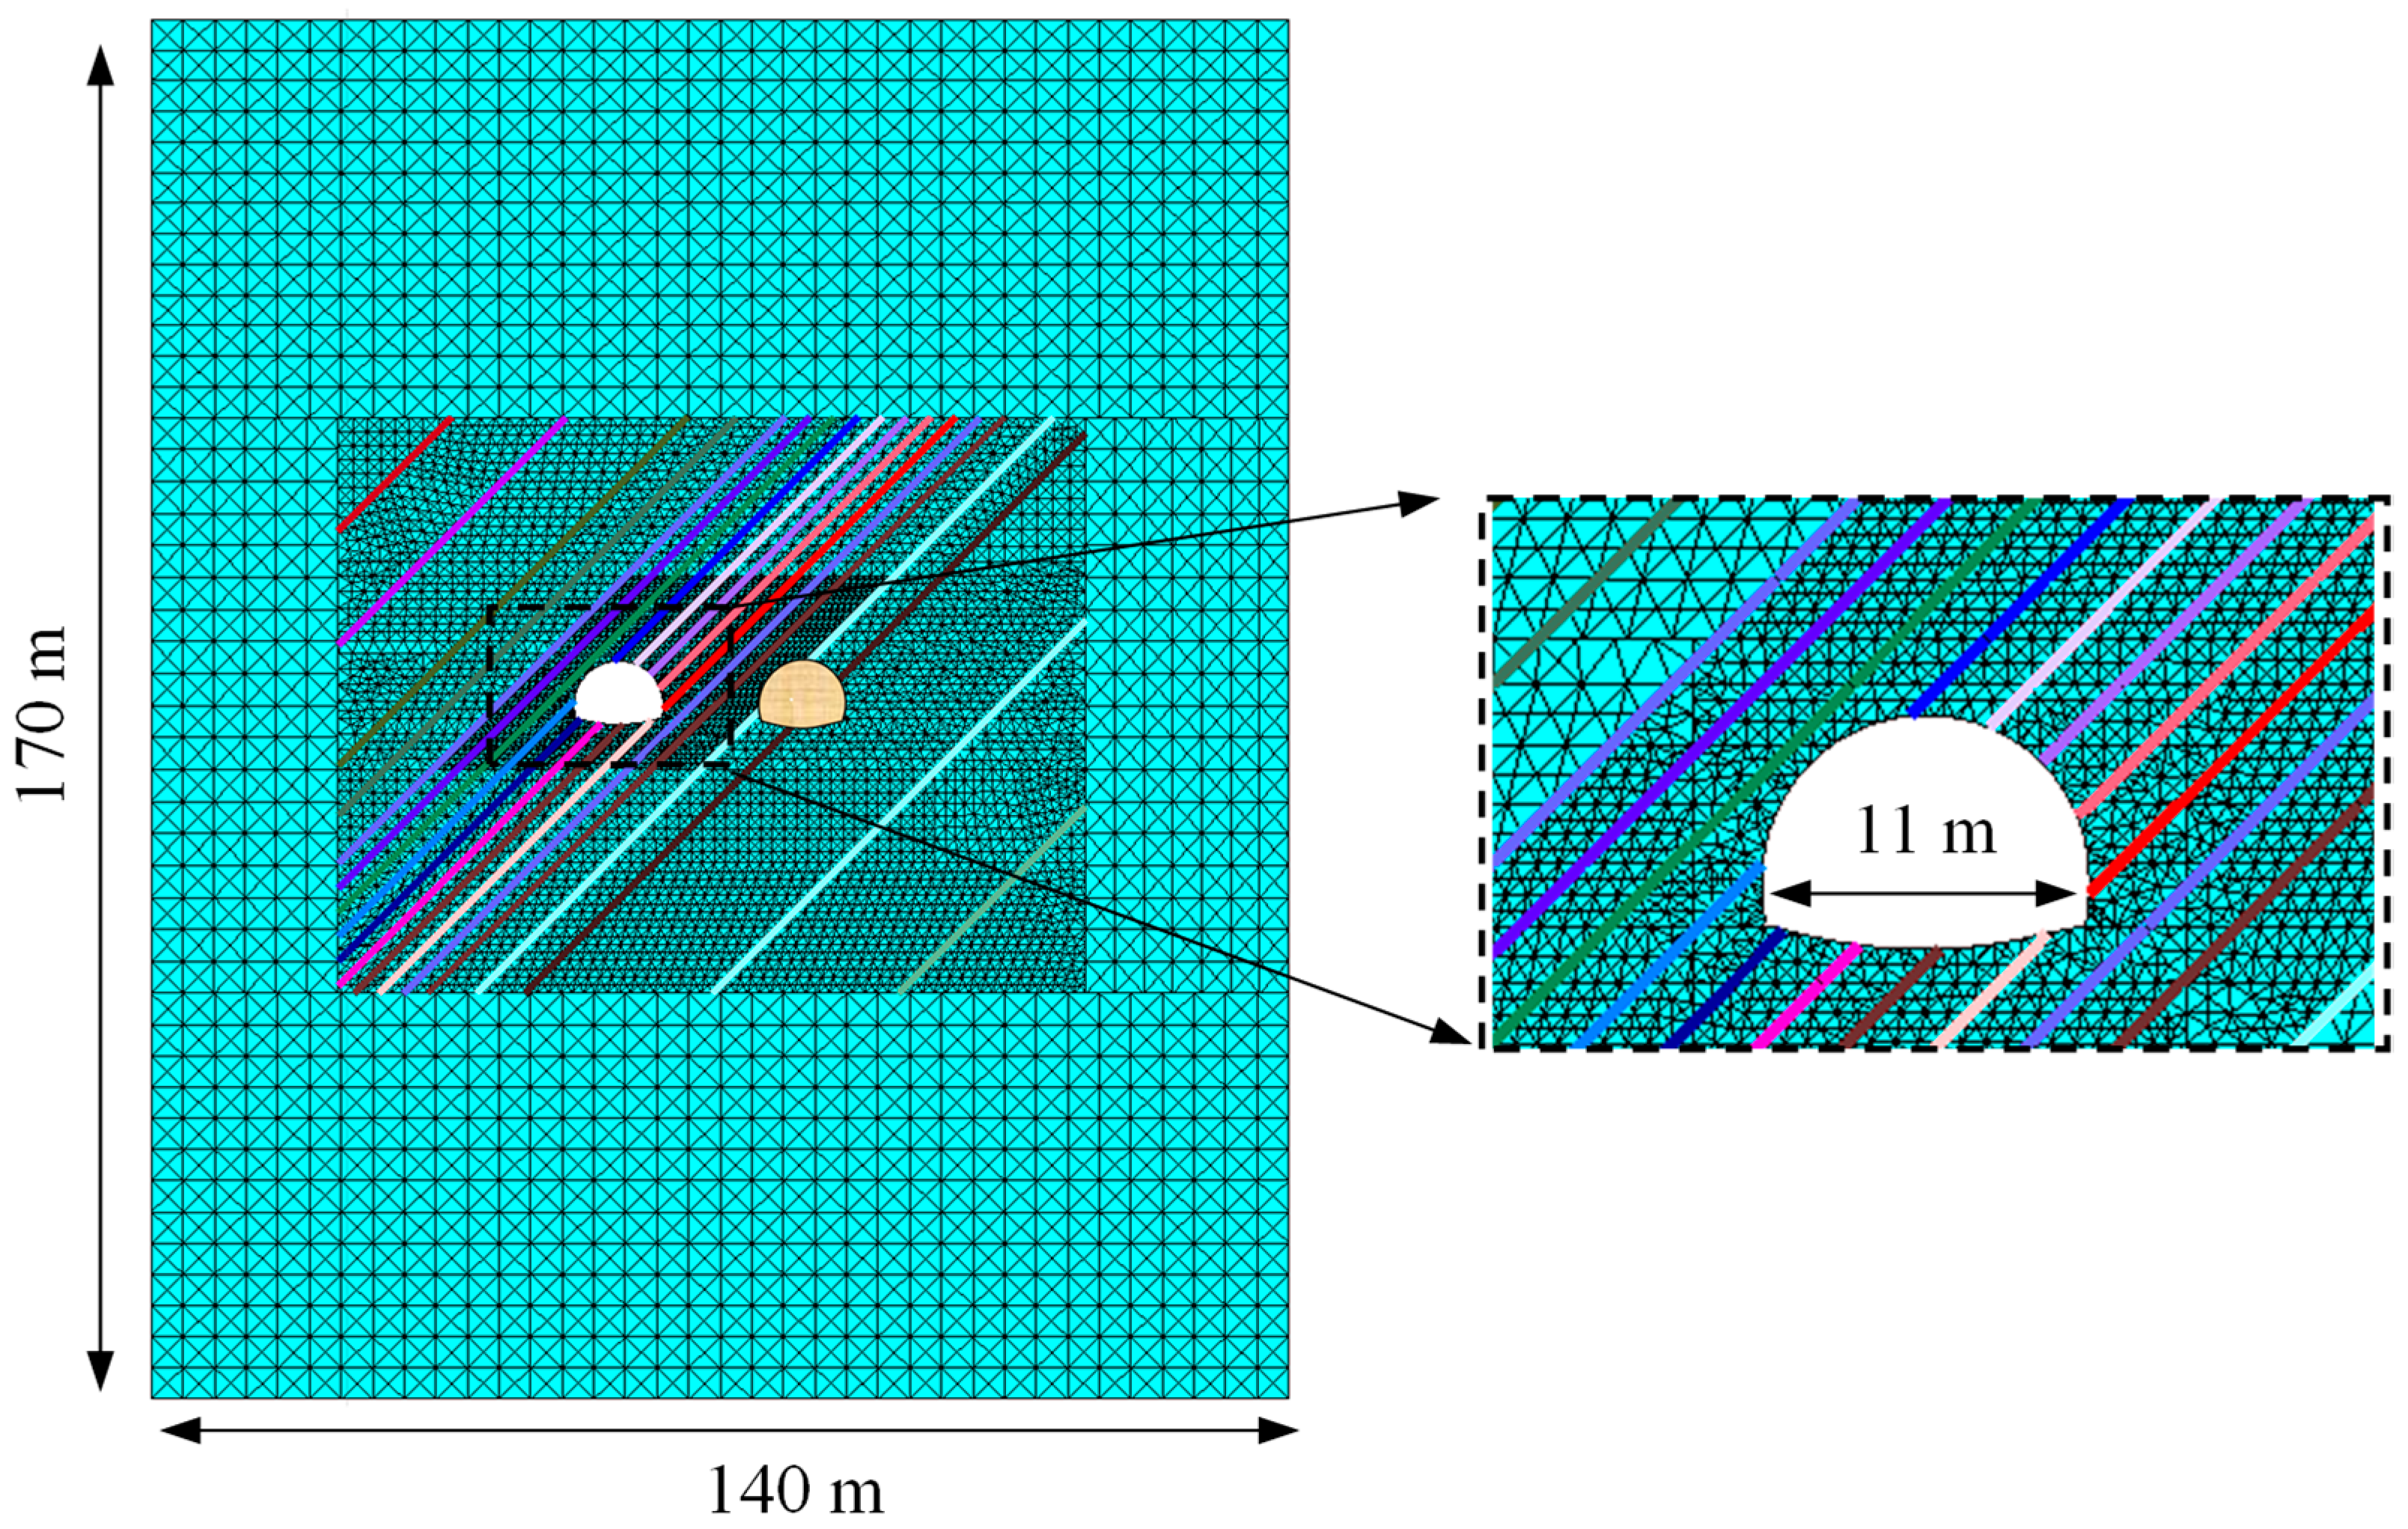
According to Saint-Venant’s principle, the distance between the tunnel and the model boundary is set to 5.0 times the tunnel span. The model dimensions are 170 m in height and 140 m in width. The model has a fixed lower boundary, with horizontal displacements constrained on the left and right boundaries, and a free upper boundary. The numerical model of the jointed surrounding rock tunnel is shown in Figure 3. Although tunnel projects often involve twin tunnels, this study focuses on analyzing the stress and displacement behavior of the left tunnel only.
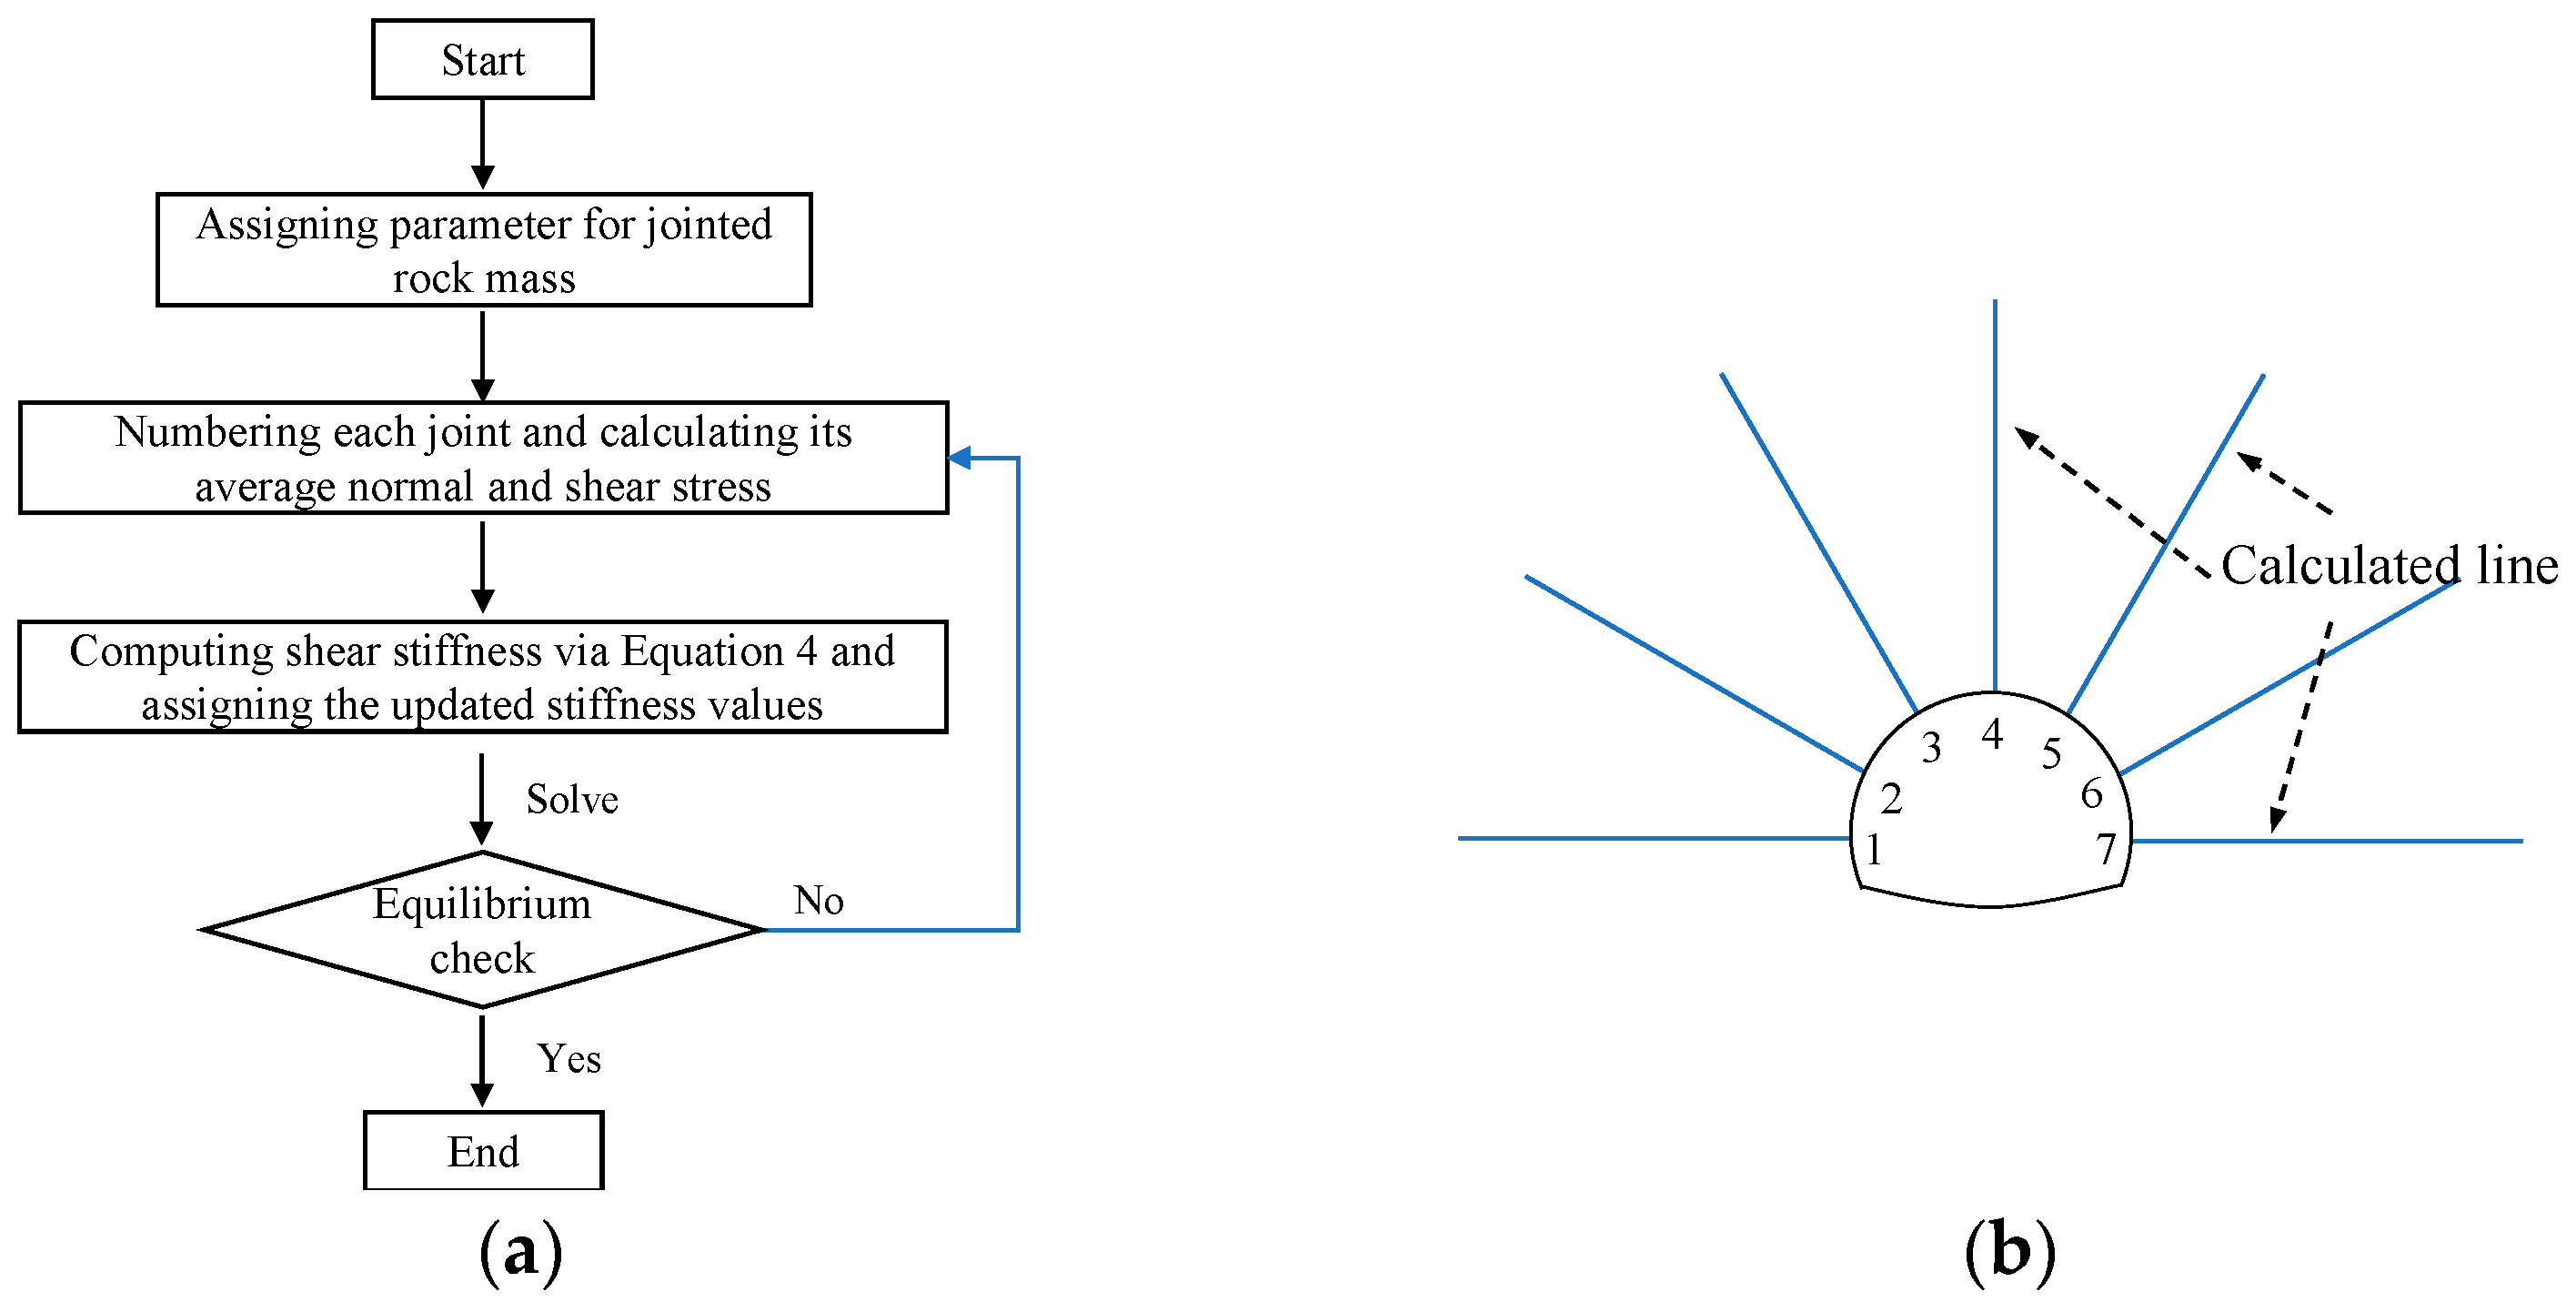
In conventional engineering analysis of jointed tunnels, the joint shear stiffness is commonly treated as a constant. Throughout the excavation-to-stabilization process, the variation in shear stiffness with stress is not considered. To further investigate the effects of shear stiffness, a more detailed characterization of the joints is necessary. The calculation flowchart is presented in Figure 4a. The shear strength τ s is assumed to be 75% of the peak strength [11]. By comparing the shear strength with the long-term strength, calculations are performed according to Equation (4). When the shear strength reaches the peak strength, shear failure occurs along the joint. To delineate the extent of the disturbed zone, measuring lines are arranged at 30° intervals, as illustrated in Figure 4b. To analyze the range of the surrounding rock disturbed zone, the FISH language embedded in UDEC 5.0 was used to record the horizontal and vertical displacement values of the surrounding rock.
After tunnel excavation, the horizontal and vertical strains were extracted sequentially along measurement lines 1 to 7 and transformed into radial strains. The strongly disturbed zone was then delineated based on the rock’s allowable tensile strain, with its length along each measurement line recorded. The area of this zone was measured in AutoCAD 2024 to quantify the tensile strain distribution under different working conditions.
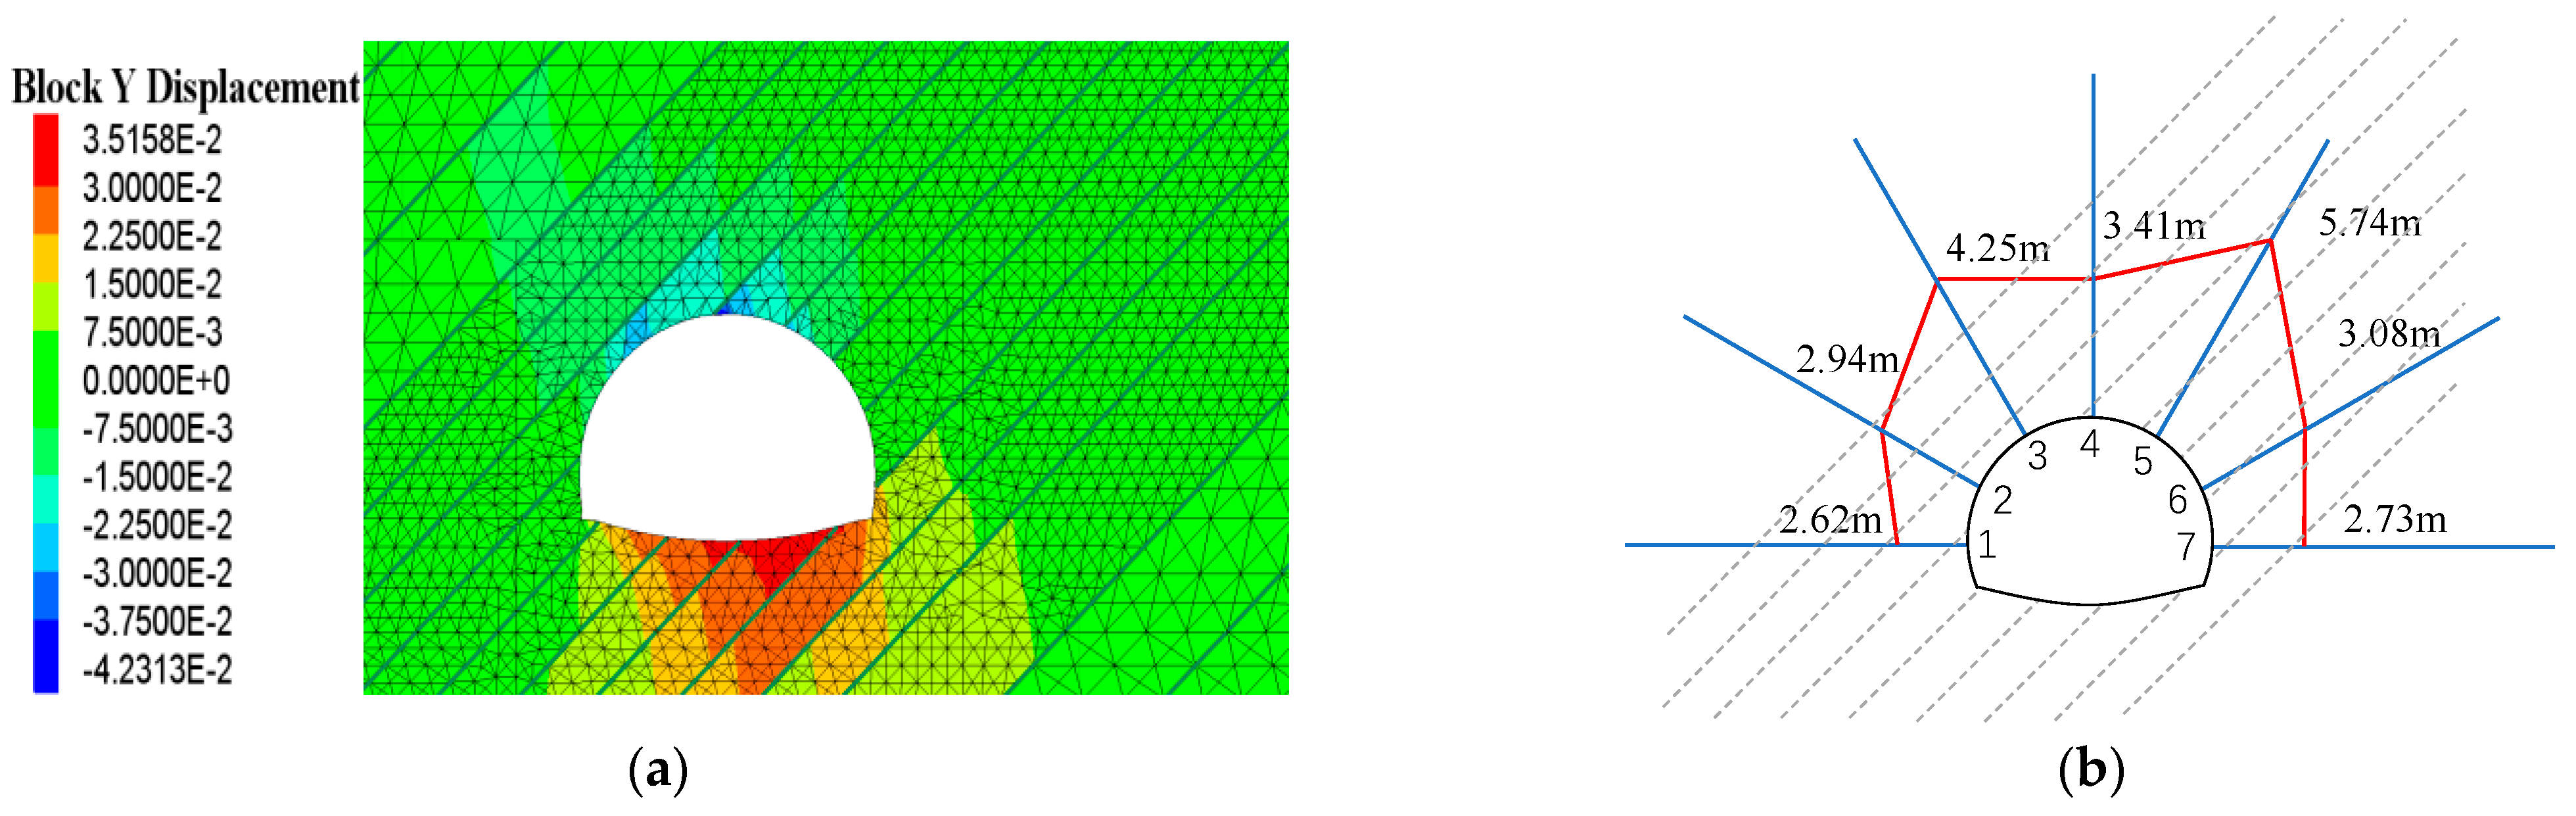
Once the parameters were assigned to the numerical model, the geostatic stress equilibrium was first established, followed by the simulation of tunnel excavation. The case with constant shear stiffness was initially computed with an equilibrium check performed until the system reached a stable state. The corresponding results are presented in Figure 5.
As can be seen from Figure 5a, the maximum settlement displacement at the crown reaches 42.31 mm, a value significantly greater than in surrounding areas. Figure 5b shows that the disturbance zone is more extensive on the right side of the tunnel axis. The maximum length, corresponding to calculation line 5, is 5.74 m, followed by 4.25 m for line 3. The total area of the disturbance zone is 79.36 m2.
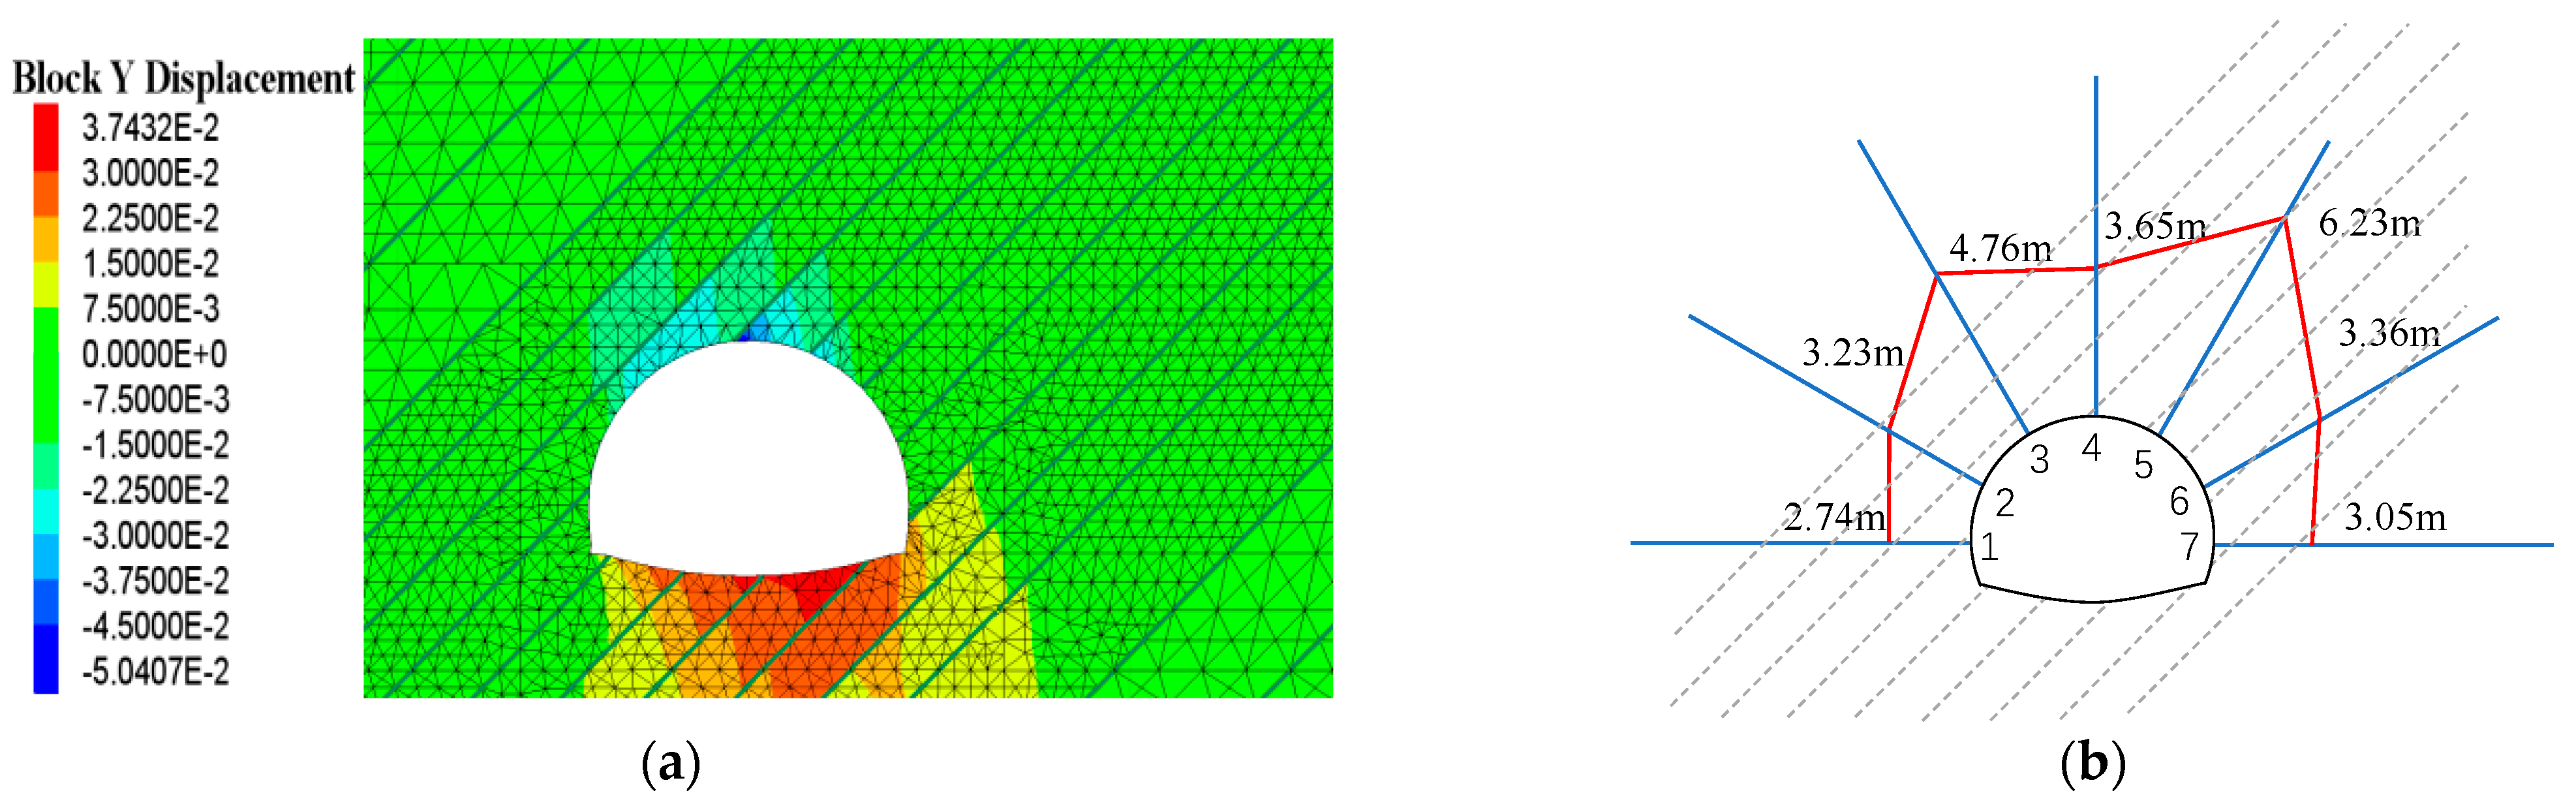
Subsequently, the case with variable shear stiffness was analyzed. The FISH language was employed to compute the average normal and shear stresses acting on each joint. Based on these stresses, the corresponding shear stiffness at the initial time was derived from Equation (4), and the normal stiffness was specified as 10.0 times the shear stiffness. These updated parameters were then assigned to the joints, and a finite-difference calculation was executed. An equilibrium check was subsequently performed; if the system had not yet converged, the stress state was updated and the joint parameters were recalculated and reassigned. This iterative loop continued until a stable state was achieved. The resulting data are presented in Figure 6.
In Figure 6, the maximum settlement displacement at the tunnel crown increases to 50.41 mm. Figure 6b indicates that the length of the strongly disturbed zone along calculation line 5 is 6.23 m. The corresponding disturbance zone area is 89.09 m2.
Compared to the constant stiffness case, results considering variable shear stiffness exhibit significant changes. Tunnel crown settlement increases by 19.1%, and the disturbance zone area increases by 10.9%. These quantitative differences highlight the importance of considering shear stiffness evolution in numerical analyses to avoid potentially non-conservative estimates of tunnel deformation and instability risk.

3.2. Effect of Rock Bolts

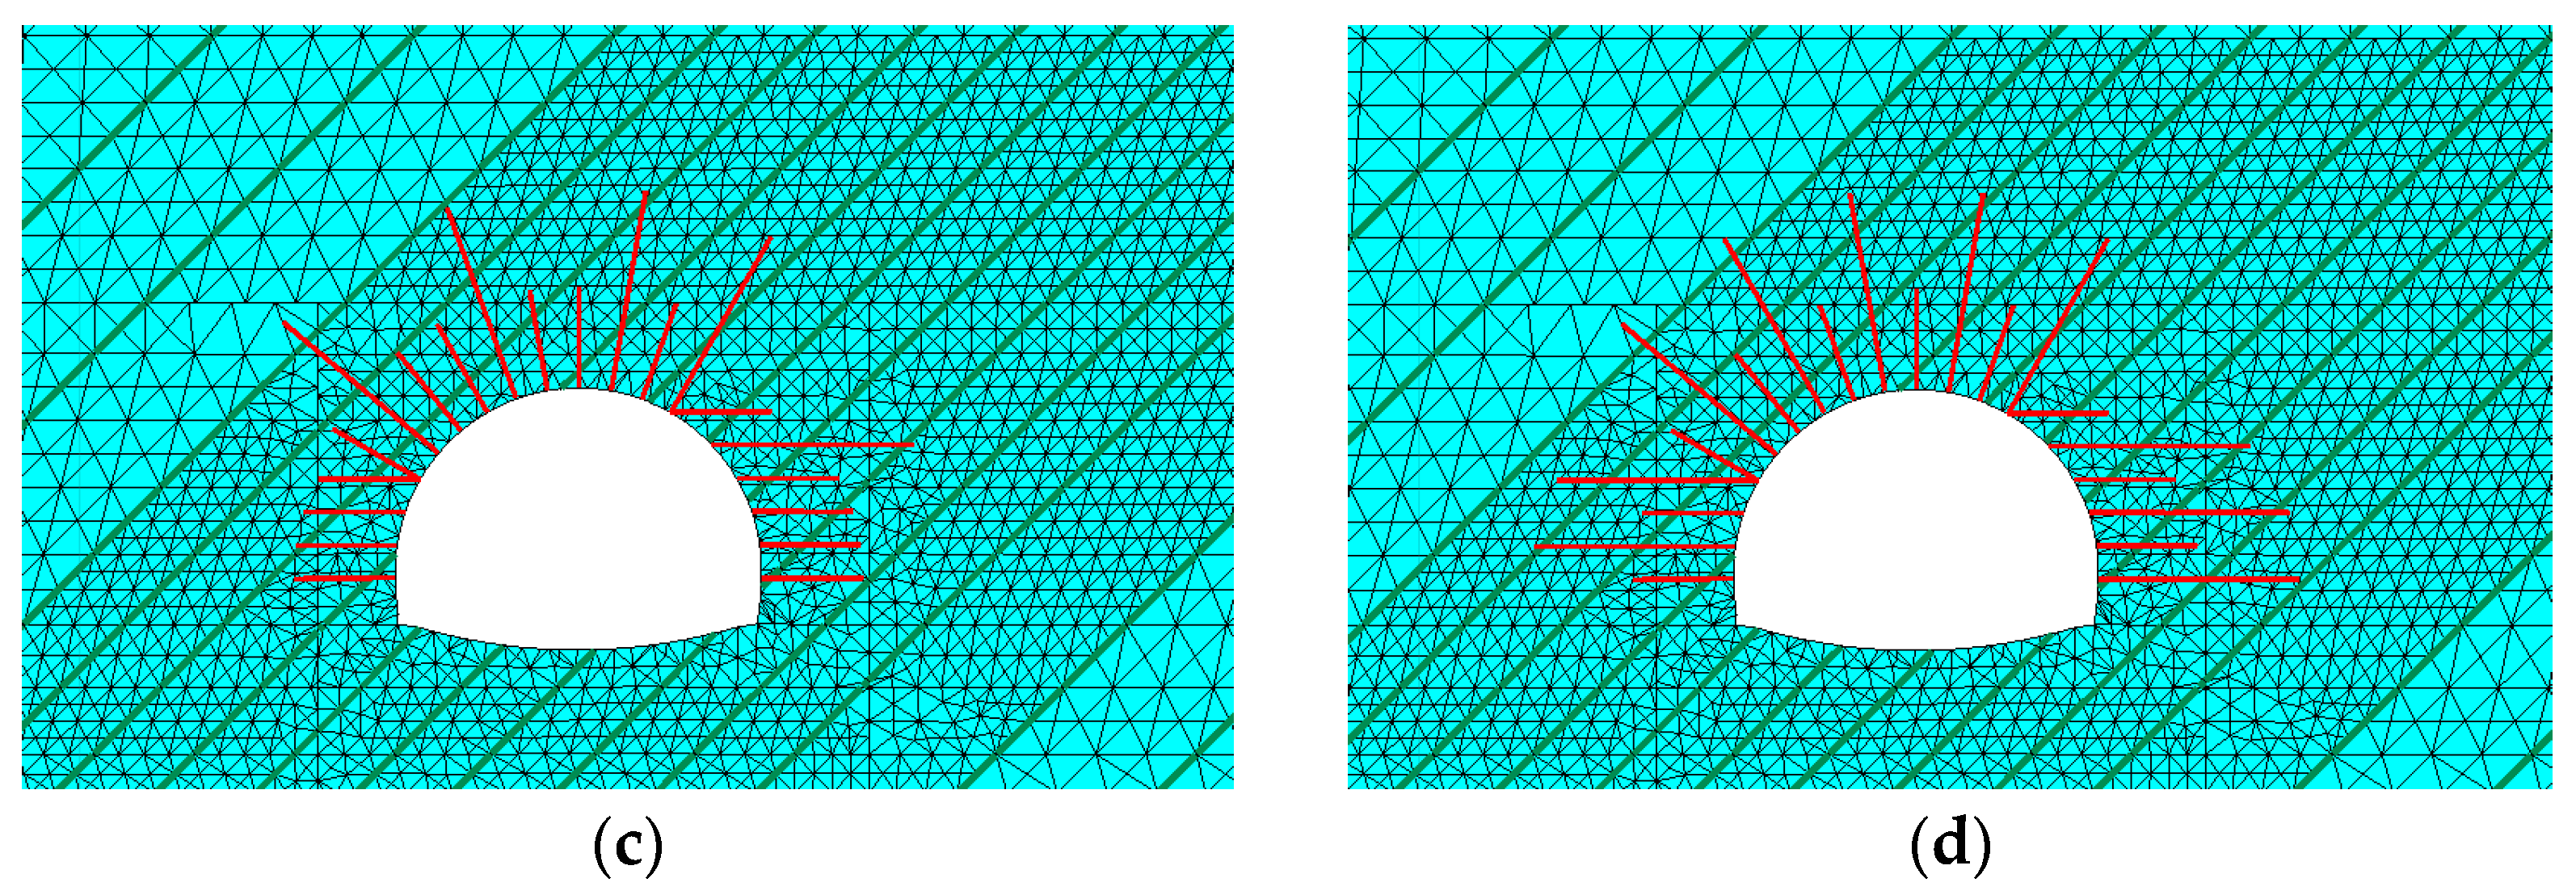
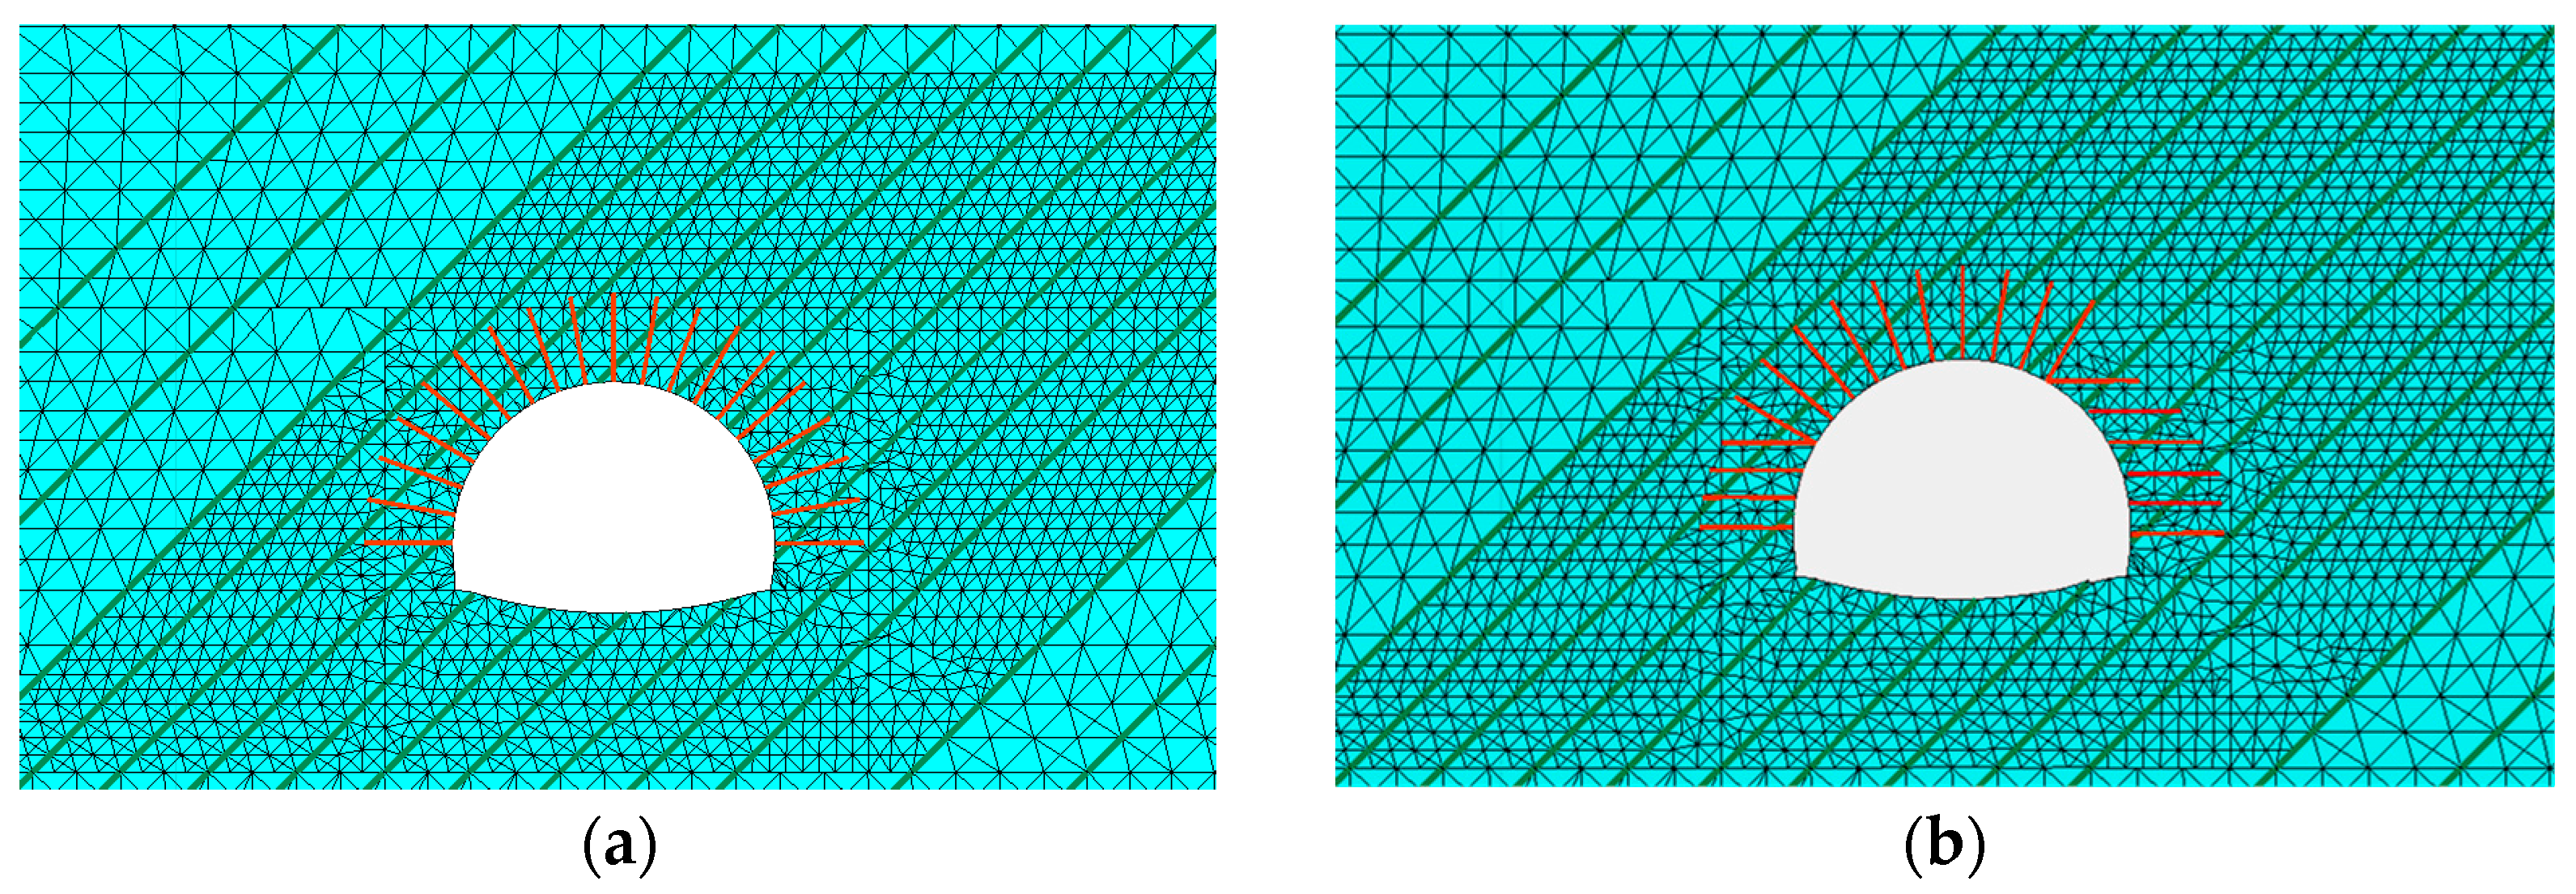
Rock bolts are typically installed radially around the tunnel, with their primary function being to provide additional normal stress confinement. Four bolt arrangement patterns are illustrated in Figure 7. In the standard bolt arrangement (M-1), bolts are installed radially, each with a length of 3.0 m. Due to the presence of structural planes, the bolt layout at the left and right arch haunches is optimized. Bolts on the right side of the tunnel axis beyond 30° are oriented horizontally to maximize the angle between the bolts and the joints (M-2). Locally extended 6.0 m bolts are used in specific areas (M-3). A staggered arrangement of long and short bolts is implemented around the surrounding rock (M-4).
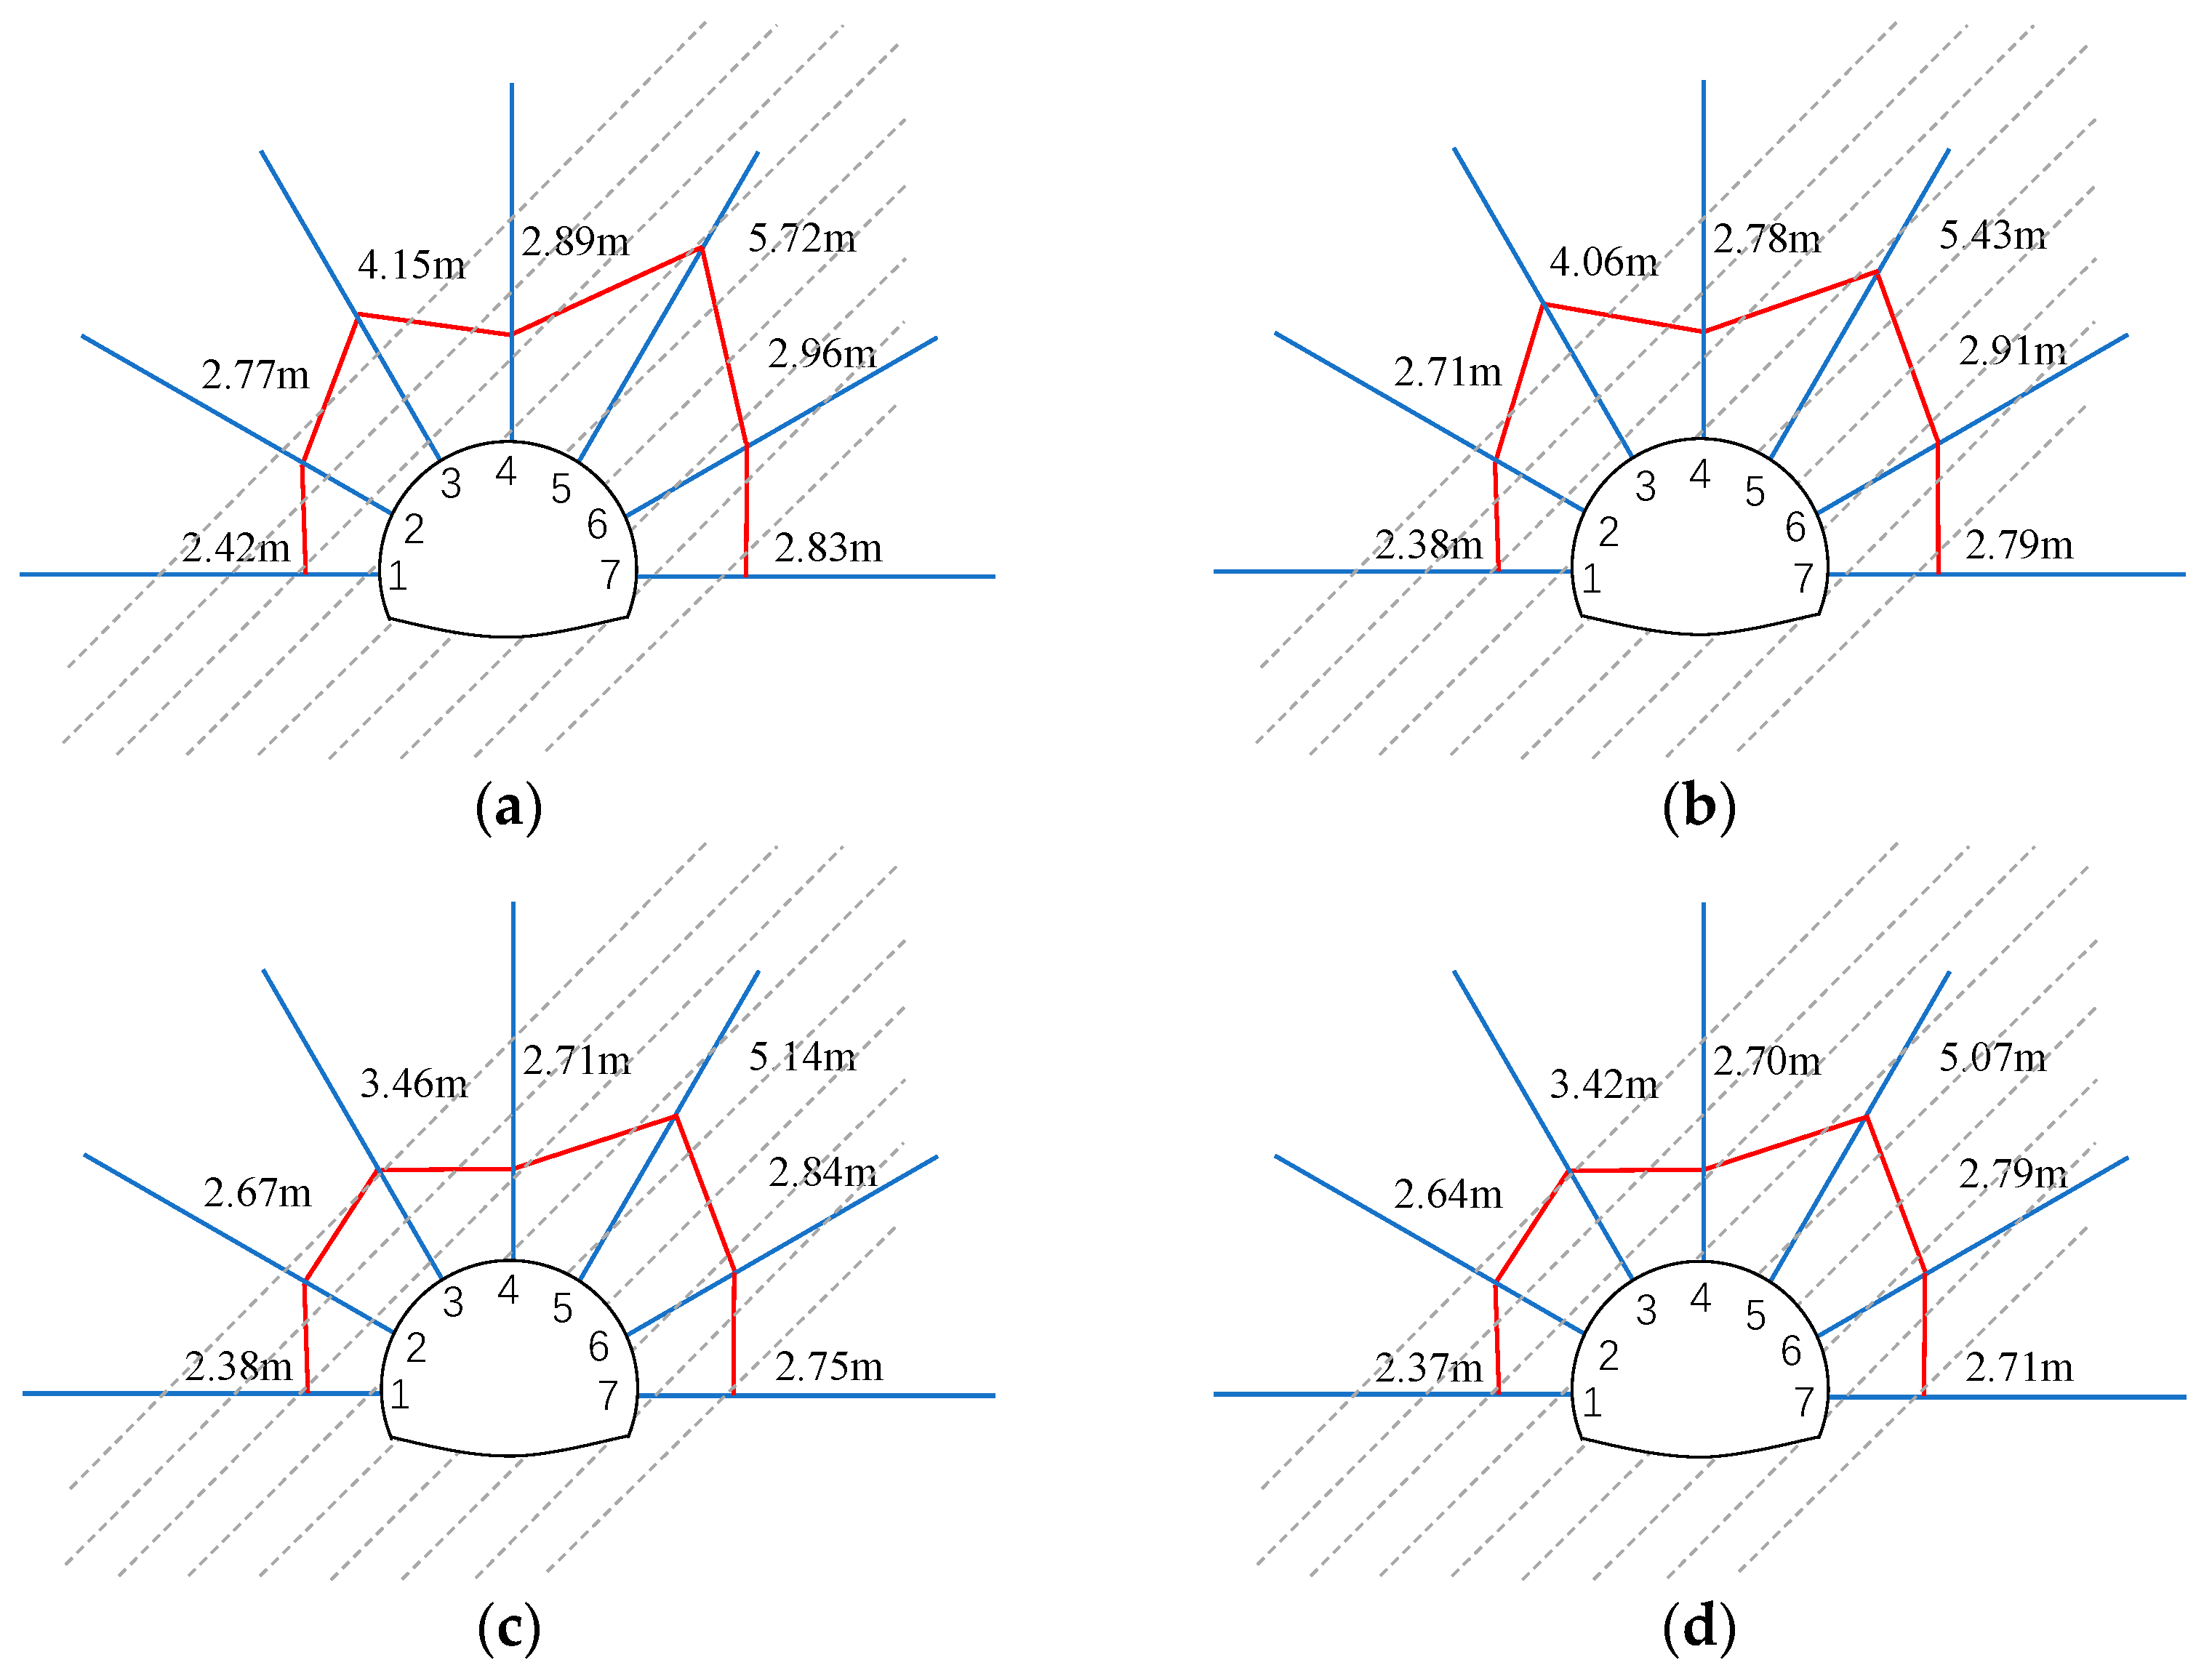
The distribution of the disturbed zone after reinforcement with four bolt patterns is shown in Figure 8. In Figure 8a, the maximum length, corresponding to calculation line 5, reaches 5.72 m, and the disturbed zone area is 72.87 m2. In Figure 8b, the longest disturbed zone length (line 5) is 5.43 m, with a corresponding area of 71.14 m2, representing a 3.7% reduction compared to M-1. Figure 8c shows that after local bolt extension, the disturbed zone range is reduced, particularly at calculation line 3 (by 14.8%), and the overall area decreases to 66.57 m2, a 6.4% reduction from M-2. In Figure 8d, the longest disturbed zone length (line 5) is 5.07 m, with an area of 65.56 m2, a 1.5% reduction from M-3.

3.3. Effect of Time

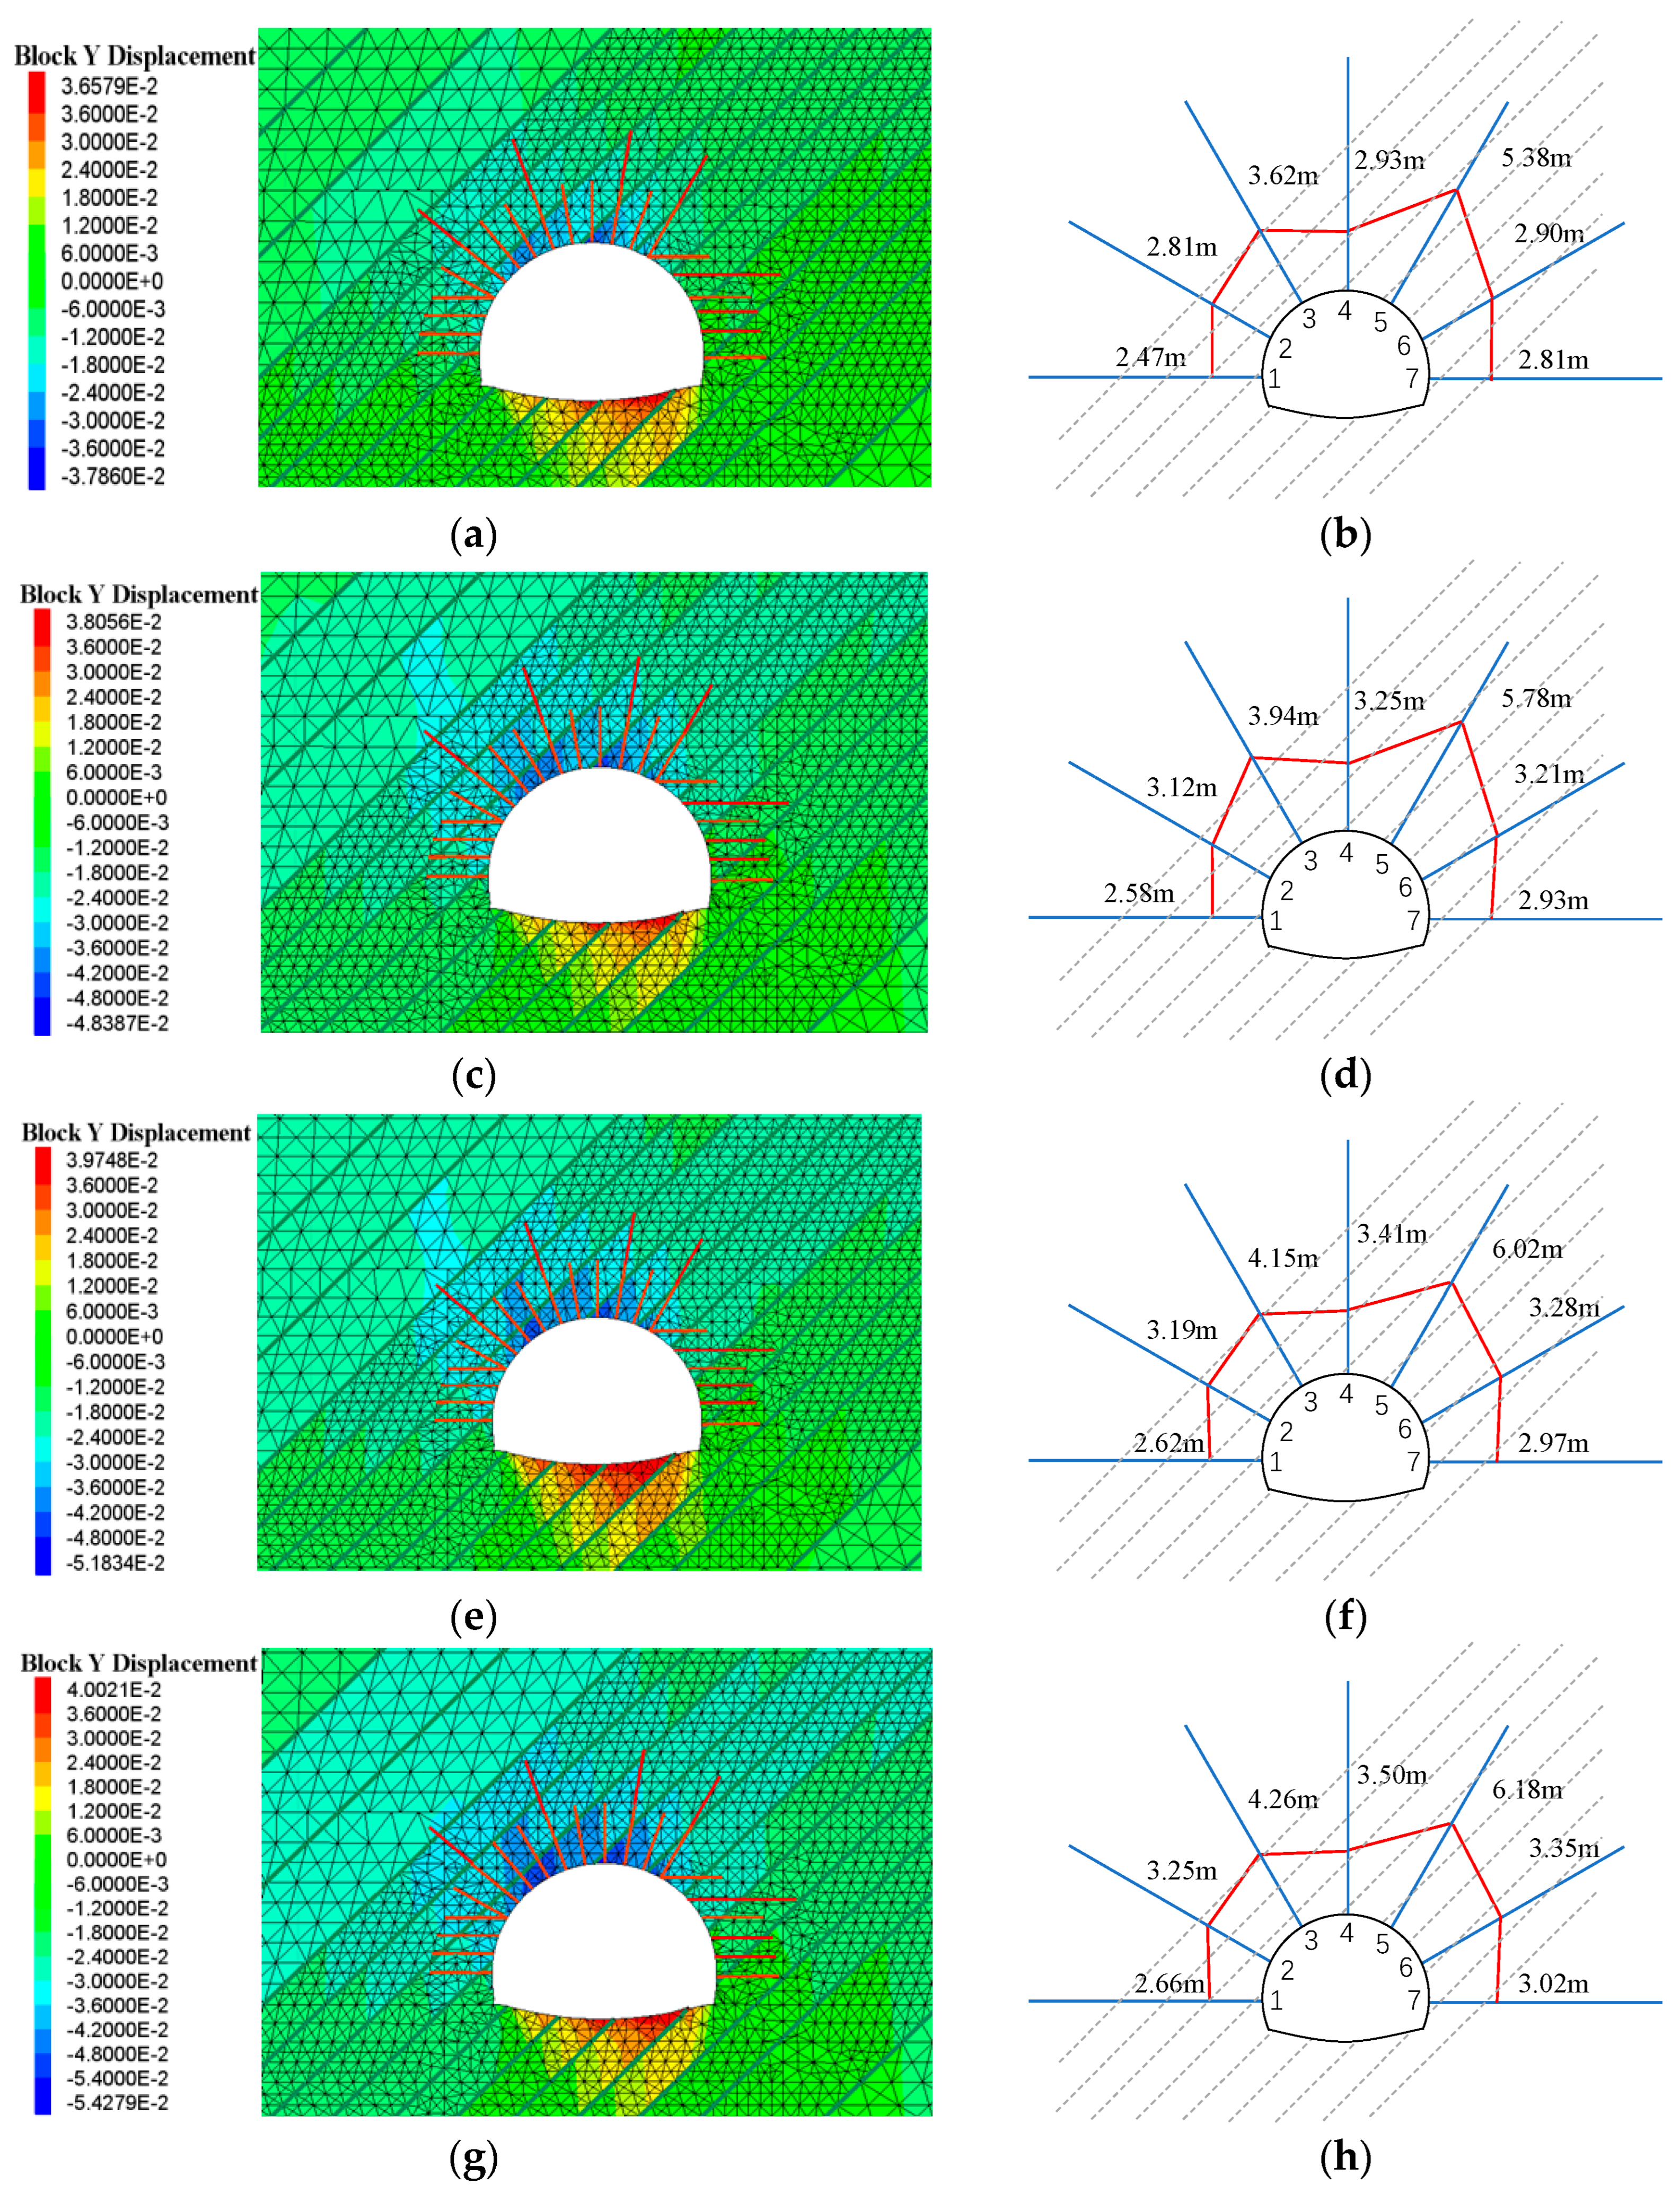
To examine the post-excavation evolution of jointed tunnels, a time-dependent numerical model was established. The time-dependent behavior of joints was governed by Equation (4), which was derived from laboratory test data. Following the calculation flowchart in Figure 4a, the stress state of each joint was first determined. Creep effects were only activated when the joint stress level reached between 0.5 and 1.0 times the peak strength; below this threshold, creep was neglected, and upon reaching the peak strength, the joint was considered to have failed. Since the time unit in Equation (4) is hours—reflecting the 24 h duration of each laboratory loading stage—it was converted to days for the engineering-scale analysis. The computed ruselts at 3, 15, 30, and 60 days post-excavation are presented in Figure 9.
Figure 9a shows that on the third day after excavation, the maximum settlement displacement of the tunnel vault reaches 37.86 mm. Correspondingly, the distribution of the strongly disturbed zone in the surrounding rock is presented in Figure 9b, with an overall area of 70.63 m2—representing an increase of 6.1% compared to the state immediately after excavation. By the time shown in Figure 9c, the vault settlement continues to grow, reaching a maximum of 48.39 mm. The associated disturbed zone area, illustrated in Figure 9d, expands to 78.44 m2, corresponding to an 11.1% increase. As observed in Figure 9e, the local settlement at the vault further rises to 51.83 mm by the 30th day, with the disturbed zone area reaching 82.08 m2 (Figure 9f). Finally, Figure 9g indicates that the vault settlement attains 54.28 mm at the 60th day, which is 4.7% higher than that at the 30th day, while the strongly disturbed zone covers an area of 84.57 m2 (Figure 9h).

3.4. Engineering Application

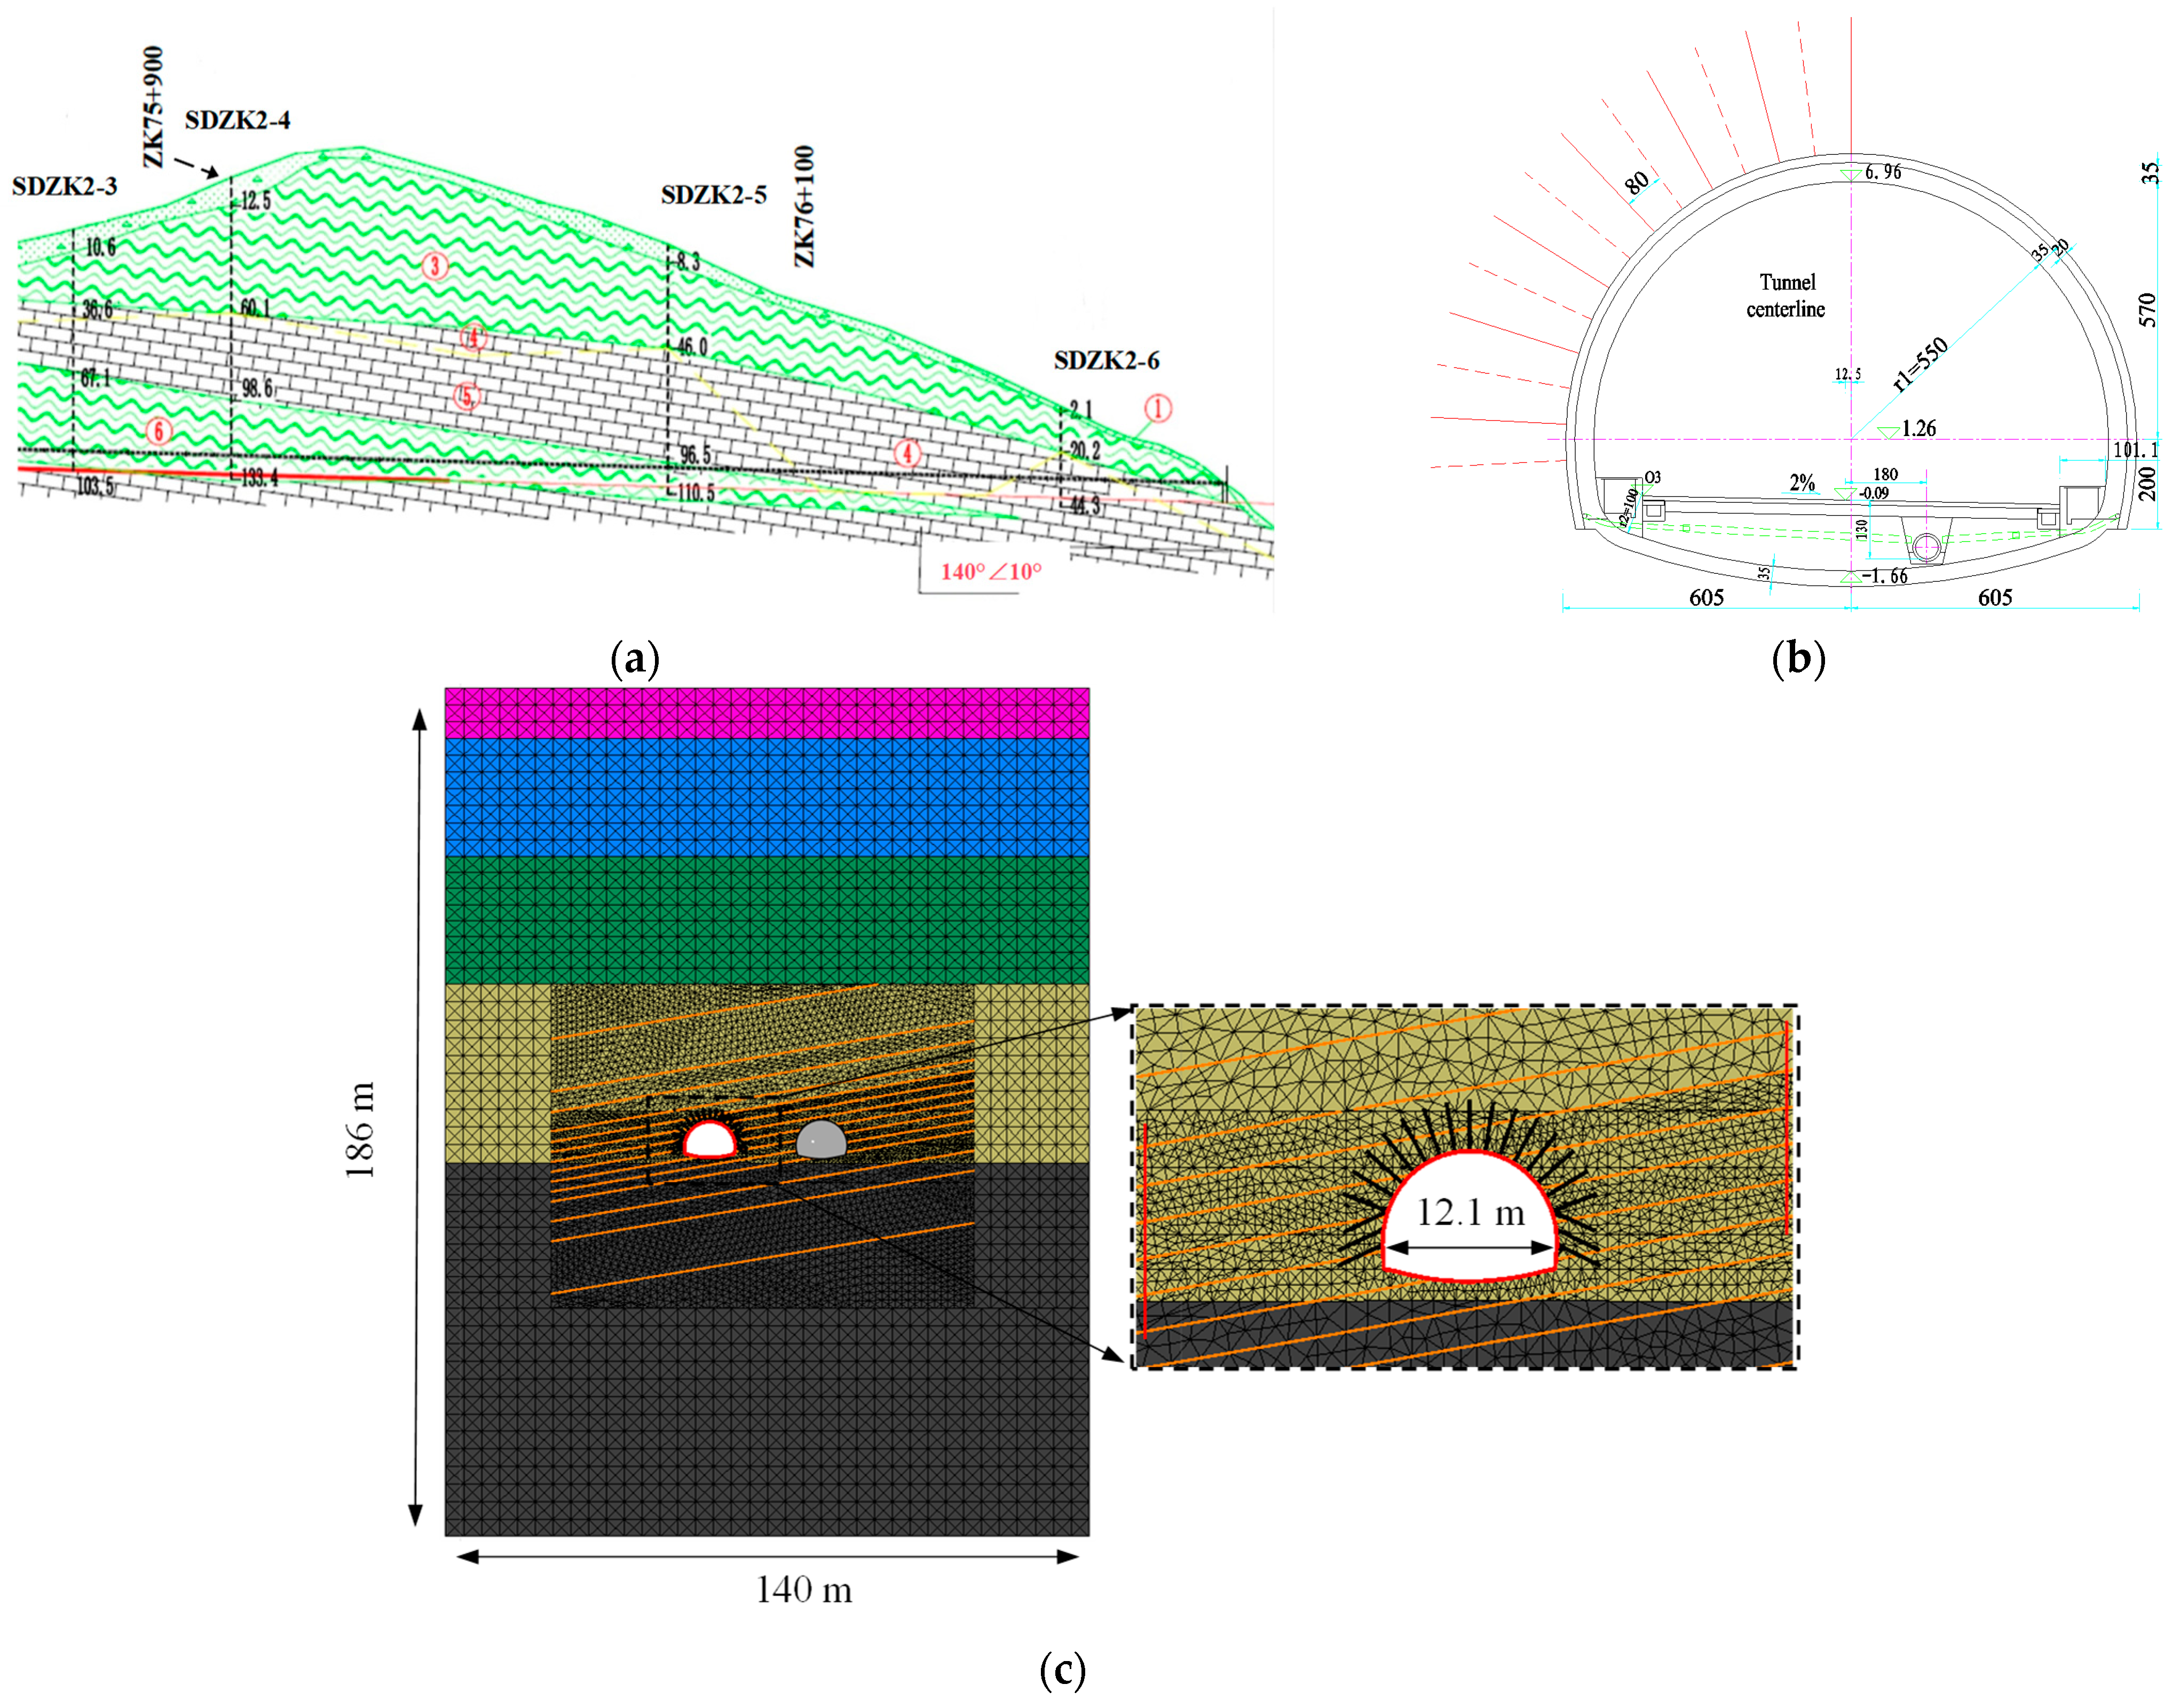
To further validate the proposed model, a mountainous tunnel in Yunnan Province was selected for numerical simulation. The analysis focused on the section from 100 m left of ZK75 + 900 to 10 m left of ZK76 + 100. The stratigraphic profile of the project site is shown in Figure 10a, which, from top to bottom, consists of gravelly soil, slate, limestone interbedded with slate, and slate interbedded with limestone. Borehole SDZK2-3, located on the left side of ZK75 + 900, was selected as the analysis point, where the tunnel burial depth is 95.0 m. A tunnel model was established based on the corresponding geological data to analyze the evolution of crown settlement displacement over time, and the numerical model is illustrated in (Figure 10).
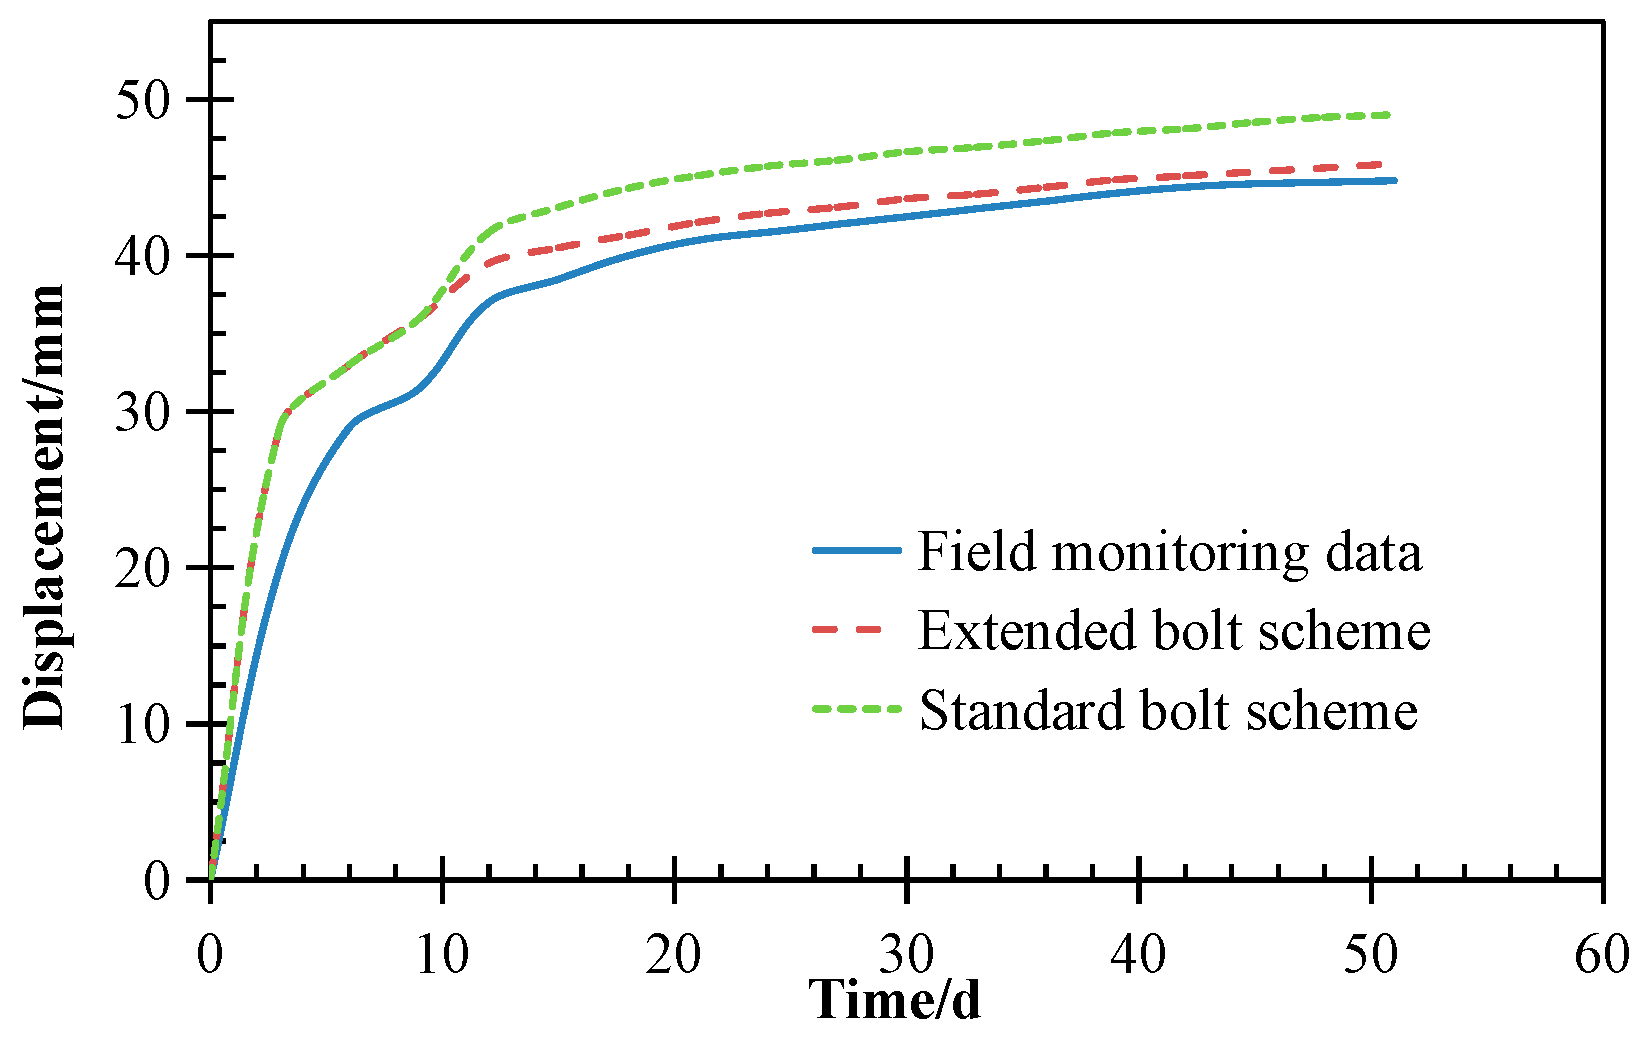
The geological parameters are listed in Table 3. The joint parameters were adopted consistently with those described in Section 3.2. Both the 3.0 m standard bolt support scheme and the locally extended 6.0 m bolt reinforcement scheme were considered. The calculation procedure followed the workflow illustrated in Figure 4, and the settlement displacements were recorded. A comparison between the numerical simulation results and field monitoring data is presented in Figure 11.
In Figure 11, a comparison between the monitoring data and numerical simulations reveals that the simulated crown settlement was slightly overestimated during the first 10 days. Beyond 20 days, the results obtained from the locally extended bolt scheme exhibit good agreement with the field monitoring data, both trending toward a settlement of approximately 40 mm. Given that engineering projects are primarily concerned with the final displacement, the numerical simulations provide valuable reference. The numerical analysis further indicates that the application of locally extended bolts alters the stress state of certain engineering joints, thereby enhancing their shear resistance. This transforms the initial rapid creep into a slower creep development, enabling the surrounding rock to reach a stable state after 40 days. Under the optimized bolt configuration, the tunnel crown settlement tends toward approximately 46.0 mm.

3.5. Discussions

Using UDEC software, creep effect calculations for jointed tunnels were performed, and a variable parameter assignment method for joints was established, which effectively captures the time-dependent creep behavior of jointed rock masses. Based on this approach, an optimal bolt support pattern was determined, where a combination of long and short bolts can effectively reduce the extent of the surrounding strongly disturbed zone. The standard bolt length is 3.0 m. As shown in Figure 8a,b, the length of the disturbed zone along calculation line 5 consistently exceeds 4.0 m, reaching a maximum of 5.72 m—well beyond the bolt length. Although the bolts themselves do not undergo yield failure, once the disturbed zone extends beyond the reinforced region, the surrounding rock within the tensile strain failure zone loses its load-bearing capacity, allowing tensile failure to propagate deeper into the rock mass. For the bolt reinforcement to be fully effective, the bolt length must exceed the extent of the disturbed zone. Therefore, it is necessary to adopt locally extended 6.0 m bolts. This ensures that after the tensile failure zone has fully developed, its final thickness remains slightly less than the bolt length, thereby maintaining the integrity of the reinforced rock mass.
Furthermore, the influence of time effects on the stability of jointed rock masses was considered. Analysis of vault settlement displacement and disturbed zone area over time (Figure 9) reveals the following evolution rates: from initial excavation to the third day, the average increase rates for vault settlement and disturbed zone area are 2.12 mm/d and 1.36 m2/d, respectively. From excavation to the 15th day, the rates decrease to 0.88 mm/d and 0.65 m2/d. From excavation to the 30th day, they further decrease to 0.23 mm/d and 0.24 m2/d. From excavation to the 60th day, the rates are 0.08 mm/d and 0.08 m2/d. This demonstrates that the increase rates for both vault settlement and disturbed zone area diminish over time. The corresponding increase rates from the third day to the 15th, 30th and 60th day are 2.0%, 0.92%, 0.31%, and 0.1%, respectively. Comparing displacement contour plots shows slow settlement development from the 15th day to the 30th day; while vault settlement displacement is locally concentrated and may exceed surrounding values, making its selection as a universal criterion challenging; tunnel stability can theoretically be determined by monitoring the increase rate of the disturbed zone area. Based on comprehensive analysis, an increase rate of 0.31% for the disturbed zone area is adopted as the stability criterion following excavation. This value can serve as a reference for jointed rock masses at medium depths. Future systematic analysis of different rock types, joint forms and burial depths is needed to establish a universally applicable criterion for determining surrounding rock disturbance zone variation rates.
Grouting is increasingly employed for joint reinforcement, particularly in weak and fractured zones [31,32,33]. However, the current numerical model does not yet incorporate the effects of grouting. While several laboratory-scale experiments have investigated the strengthening effect of grouting on joints [34], the time-dependent behavior of grouted joint tunnels remains insufficiently addressed. As a next step, a creep model specifically developed for grouted rock masses will be established. Following a methodology analogous to that presented in this study, the long-term stability of grouted joint tunnels will be systematically evaluated and analyzed.

4. Conclusions

This study investigates the shear creep behavior of rock joints using UDEC numerical analysis software. By incorporating the time-dependent evolution of shear stiffness, the simulation framework is extended to capture the long-term response of jointed rock mass tunnels. The main conclusions are drawn as follows:
  • A novel implementation in UDEC, which incorporates a theoretical equation for the time-dependent evolution of shear stiffness to simulate joint shear creep, reveals that tunnel crown settlement increases by 19.1% and the disturbed zone area expands by 10.9% compared to conventional methods.
  • Extending the length of rock bolts at the tunnel arch shoulder significantly reduces the extent of the surrounding disturbed zone. The optimized bolt configuration decreases vault settlement and disturbed zone area by 37.5% and 25.3%, respectively.
  • Creep effects exert a substantial influence on the stability of jointed rock mass tunnels. The critical increase rate of the disturbed zone area, corresponding to a stable tunnel state, is determined to be 0.31%.

Author Contributions

Conceptualization, D.Z. and L.D.; methodology, W.Z.; software, P.Y.; validation, B.M.H. and D.Z.; formal analysis, P.Y.; investigation, L.D.; resources, W.Z.; data curation, P.Y.; writing—original draft preparation, D.Z.; writing—review and editing, L.D.; visualization, B.M.H.; supervision, L.D.; project administration, W.Z.; funding acquisition, D.Z. All authors have read and agreed to the published version of the manuscript.

Funding

This research was funded by the National Natural Science Foundation of China (Grant No. 42177141), Major R&D project of Zhejiang Province Department of Transportation (No. 2025ZD001).

Data Availability Statement

Data will be made available on request.

Acknowledgments

We appreciate the editors and reviewers for providing constructive and careful comments that significantly improved the manuscript.

Conflicts of Interest

Authors Dong Zhou and Peng Ying were employed by the company Zhejiang Communications Investment Group Expressway Construction and Management Co., Ltd. Author Wenjie Zhang was employed by the company China First Highway Engineering Co., Ltd. The remaining authors declare that the research was conducted in the absence of any commercial or financial relationships that could be construed as a potential conflict of interest.

References

  1. Patton, F.D. Multiple Modes of Shear Failure in Rock. In Proceedings of the 1st Congress of International Society of Rock Mechanics, Lisbon, Portugal, 25 September–1 October 1966. [Google Scholar]
  2. Barton, N.; Choubey, V. The shear strength of rock joints in theory and practice. Rock Mech. 1977, 10, 1–54. [Google Scholar] [CrossRef] [Scilit]
  3. Zhou, C.; Lang, Z.; Huang, S.; Dong, Q.; Wang, Y.; Zheng, W. A comprehensive review of experimental studies on shear behavior of bolted rock joints with varying rock joint and bolt parameters and normal stress. Deep Undergr Sci Eng. 2025, 4, 189–209. [Google Scholar] [CrossRef] [Scilit]
  4. Sun, J. Some advances in the study of rock rheology mechanics and its engineering application. J. Rock Mech. Eng. 2007, 6, 1081–1106. [Google Scholar]
  5. Jia, C.J.; Xu, W.Y.; Wang, R.B.; Wang, S.S.; Lin, Z.N. Experimental investigation on shear creep properties of undisturbed rock discontinuity in baihetan hydropower station. Int. J. Rock Mech. Min. Sci. 2018, 104, 27–33. [Google Scholar] [CrossRef] [Scilit]
  6. Frenelus, W.; Peng, H.; Zhang, J. Creep behavior of rocks and its application to the long-term stability of deep rock tunnels. Appl. Sci. 2022, 12, 8451. [Google Scholar] [CrossRef] [Scilit]
  7. Zhu, L.F.; Wang, L.Q.; Zheng, L.B.; Xia, N.; Wang, C.S. Shear creep characteristics and creep constitutive model of bolted rock joints. Eng. Geo. 2023, 327, 107368. [Google Scholar] [CrossRef] [Scilit]
  8. Shen, M.R.; Zhu, G.Q. Experimental study on creep characteristics of regular saw-tooth structural planes. J. Rock Mech. Eng. 2004, 2, 223–226. [Google Scholar]
  9. Yang, S.; Cheng, L. Non-stationary and nonlinear visco-elastic shear creep model for shale. Int. J. Rock Mech. Min. Sci. 2011, 48, 1011–1020. [Google Scholar] [CrossRef] [Scilit]
  10. Gutiérrez, J.G.; Senent, E.P.; Graterol, P.; Zeng, R. Rock shear creep modelling: DEM—Rate process theory approach. Int. J. Rock Mech. Min. Sci. 2023, 161, 105295. [Google Scholar] [CrossRef] [Scilit]
  11. Shen, M.R.; Zhang, Q.Z. Model test study on shear characteristics of regular saw-tooth structural planes. J. Rock Mech. Eng. 2010, 29, 713–719. [Google Scholar]
  12. Wang, Z. Time-Dependent Characteristics and Mechanism of Structural Planes with Different Roughness. Ph.D. Thesis, Tongji University, Shanghai, China, 2018. [Google Scholar]
  13. Xu, W.Y.; Yang, S.Q.; Chu, W.J. Nonlinear viscoelastoplastic rheological model (Hohai model) of rock and its engineering application. J. Rock Mech. Eng. 2006, 25, 433–447. [Google Scholar]
  14. Zhang, Q.Z.; Shen, M.R.; Ding, W.Q. Study of shear creep constitutive model of weak structural plane of greenschist. Rock Soil Mech. 2012, 33, 3632–3638. [Google Scholar]
  15. Liu, K.Y.; Xue, Y.T.; Zhou, H. Nonlinear viscoelastoplastic creep model of soft rock with time-dependent parameters. J. Univ. Min. Tech. 2018, 47, 921–928. [Google Scholar]
  16. Lin, H.; Zhang, X.; Cao, R.H.; Wen, Z.J. Improved nonlinear Burgers shear creep model based on the time-dependent shear strength for rock. Environ. Earth Sci. 2020, 79, 149. [Google Scholar] [CrossRef] [Scilit]
  17. Wang, M.; Chen, B.; Zhao, H. Data-Driven Rock Strength Parameter Identification Using Artificial Bee Colony Algorithm. Buildings 2022, 12, 725. [Google Scholar] [CrossRef] [Scilit]
  18. Zhang, J.B.; Yang, Z.Q.; Du, R.H. Study on deformation characteristics of tunnel structures based on anisotropic creep properties. J. Undergr. Space Engi. 2025, 21, 917–928. [Google Scholar]
  19. Zhao, K.; Ma, H.L.; Shi, X.L. Long-term stability evaluation of compressed air energy storage salt caverns based on a creep-fatigue constitutive model. Rock Soil Mech. 2025, 46, 1–12. [Google Scholar]
  20. Keneny, J. Time-dependent drift degradation due to theprogressive failure of rock bridges along discontinuities. Int. J. Rock Mech. Min. Sci. 2005, 42, 35–46. [Google Scholar] [CrossRef] [Scilit]
  21. Yang, Z.W.; Jin, A.B.; Zhou, Y. Parameter calibration of Burgers model and particle flow analysis of rock creep characteristics. Rock Soil Mech. 2015, 36, 240–248. [Google Scholar]
  22. Guo, R.T.; Lai, D.J.; Li, S.L.; Dan, L.Z.; Li, W.J. Study on long-term deformation of tunnel surrounding rock considering creep characteristics of structural planes. Safety Environ. Eng. 2024, 31, 99–108. [Google Scholar]
  23. Yang, L.; Pathirage, M. Discrete Modeling of Aging Creep in Concrete. Buildings 2025, 15, 2841. [Google Scholar] [CrossRef] [Scilit]
  24. Sun, C.; Wang, W.Z.; Wang, L.G. Equivalent creep damage model and large deformation law of soft rock under complex stress. J. Min. Strata Eng. 2025, 7, 170–181. [Google Scholar]
  25. Lai, X.; Yuan, W.; Wang, W.; Sun, R.; Du, P.; Lin, H.; Fu, X.; Niu, Q.; Yin, C. The Influence of Different Shear Directions on the Shear Resistance Characteristics of Rock Joints. Buildings 2023, 13, 2556. [Google Scholar] [CrossRef] [Scilit]
  26. Du, M.R.; Yin, P.J.; Zhang, Y. Shear behavior of 3D-printed rock joints based on fractal characteristics. J. Eng. Geo. 2025, 33, 458–470. [Google Scholar]
  27. Zhou, D. Study on Mechanical Behavior and Model of Grouted Rock Mass Discontinuities Considering Time-Dependent Characteristics. Ph.D. Thesis, Tongji University, Shanghai, China, 2023. [Google Scholar]
  28. Yang, L.D.; Ding, W.Q. Study on stability of surrounding rock in underground powerhouse caverns. Rock Soil Mech. 1997, 18, 177–181. [Google Scholar]
  29. Wu, S.C. Rock Mechanics; Higher Education Press: Beijing, China, 2021; p. 429. [Google Scholar]
  30. Zhang, H.T.; Li, X.R. Study on construction method optimization for large-section bifurcated tunnel in Hutiaoxia. Constr. Tech. 2021, 50, 121–125. [Google Scholar]
  31. Zhao, Z.H.; Zhou, D. Mechanical properties and failure modes of rock samples with grout-infilled flaws A particle mechanics modeling. J. Natural Gas Sci. Eng. 2016, 34, 702–715. [Google Scholar] [CrossRef] [Scilit]
  32. Lu, Y.; Wang, L.; Li, Z. Experimental Study on the Shear Behavior of Regular Sandstone Joints Filled with Cement Grout. Rock Mech. Rock Eng. 2017, 50, 1321–1336. [Google Scholar] [CrossRef] [Scilit]
  33. Sun, F.T.; She, C.X.; Wan, L.T. Peak shear strength model of rock joints filled with cement slurry. J. Rock Mech. Eng. 2014, 33, 2481–2489. [Google Scholar]
  34. Li, K.; She, C.X. Experimental study on shear characteristics and shear creep characteristics of grouted joints. J. Wuhan Univ. 2011, 44, 423–426. [Google Scholar]
Figure 1. The shear model. (a) The loading stress; (b) model grid division.
Buildings 16 00977 g001
Figure 2. Comparison of test data and simulated data for joints with different normal stresses. (a) Normal stress is 1.0 MPa; (b) normal stress is 2.0 MPa.
Buildings 16 00977 g002
Figure 3. Numerical model of the tunnel excavation in a jointed rock mass (joints are represented by thick colored lines, colors represent distinct joint sets).
Buildings 16 00977 g003
Figure 4. The flowchart and calculated lines around the tunnel. (a) The calculation flowchart; (b) the calculated line.
Buildings 16 00977 g004
Figure 5. Displacement contour and strongly disturbed zone of jointed rock tunnel with constant shear stiffness (unit: m; the dashed lines denote joints in (b)). (a) Displacement contour; (b) strongly disturbed zone.
Buildings 16 00977 g005
Figure 6. Displacement contour and strongly disturbed zone of jointed rock tunnel with variable shear stiffness (unit: m). (a) Displacement contour; (b) strongly disturbed zone.
Buildings 16 00977 g006
Figure 7. Four rock bolts layout patterns. (a) M-1; (b) M-2; (c) M-3; (d) M-4.
Buildings 16 00977 g007aBuildings 16 00977 g007b
Figure 8. Disturbed zones corresponding to the four bolt patterns. (a) M-1; (b) M-2; (c) M-3; (d) M-4.
Buildings 16 00977 g008
Figure 9. Displacement contour and strongly disturbed zone of the jointed rock mass tunnel at different days (unit: m). (a) Displacement contour at the third day; (b) strongly disturbed zone at the third day; (c) displacement contour at the 15th day; (d) strongly disturbed zone at the 15th day; (e) displacement contour at the 30th day; (f) strongly disturbed zone at the 30th day; (g) displacement contour at the 60th day; (h) strongly disturbed zone at the 60th day.
Buildings 16 00977 g009
Figure 10. Schematic diagram of the Yunnan tunnel model. (a) The geological profile; (b) tunnel cross-section; (c) numerical model.
Buildings 16 00977 g010
Figure 11. Comparison between monitored and numerical simulated crown settlement.
Buildings 16 00977 g011
Table 1. The creep parameters of joint samples.
SY-xxτ
MPa
G0
MPa/mm
G1
MPa/mm
η3
MPa·h
η4
MPa·h
R2
10.593.1849.38314.18 0.944
0.713.1840.18261.22 0.926
0.833.0529.2546.34130.240.902
0.952.4829.2546.34130.240.977
1.072.1129.2546.34130.240.858
21.124.8468.16260.24 0.931
1.344.8456.94219.42 0.917
1.584.8447.98183.23 0.995
1.804.2038.1536.64302.360.972
2.023.2838.1536.64302.360.915
Table 2. The material parameters of the model.
Parameters of RockValuesParameters of JointsValues
Elastic modulus4.01 GPaInitial normal stiffness100.0 GPa
Poisson’s ratio0.32Initial shear stiffness10.0 GPa
Cohesion0.45 MPaCohesion0.1 MPa
Internal friction angle33.0°Internal friction angle24.0°
Table 3. Geological parameters of the strata for the Yunnan tunnel.
LayerRock TypeThicknessE/MPaφ/°c/MPa
1Gravel soil10.60.223.00.05
2Slate26.00.9726.00.16
3Limestone30.51.5829.00.30
4Slate & limestone36.42.0533.00.45
5Limestone & slate60.53.0435.00.70
Disclaimer/Publisher’s Note: The statements, opinions and data contained in all publications are solely those of the individual author(s) and contributor(s) and not of MDPI and/or the editor(s). MDPI and/or the editor(s) disclaim responsibility for any injury to people or property resulting from any ideas, methods, instructions or products referred to in the content.