Article

Research on Thermal Performance and Structural Optimization of Finned Shell-and-Tube Storage Units for Air-Source Heat Pump Systems


1
School of Railway Engineering, Jilin Tiedao University, Jilin 132299, China
2
School of Engineering, Jilin Normal University, Siping 136000, China
3
School of Environmental & Municipal Engineering, Lanzhou Jiaotong University, Lanzhou 730070, China
*
Author to whom correspondence should be addressed.
Buildings 2026, 16(5), 909; https://doi.org/10.3390/buildings16050909
Submission received: 21 January 2026 / Revised: 12 February 2026 / Accepted: 19 February 2026 / Published: 25 February 2026
(This article belongs to the Special Issue Carbon-Neutral Pathways for Urban Building Design)

Abstract

Thermal storage tanks offer significant potential for addressing the performance degradation and supply–demand mismatch of air-source heat pump (ASHP) systems in cold regions. This study employs a combined numerical and experimental approach to systematically investigate the impacts of fin structure, composite phase change material (CPCM) composition, and inlet temperature on the performance of shell-and-tube storage units. Results indicate that natural convection is the dominant heat transfer mechanism, and the incorporation of expanded graphite (EG) substantially enhances the thermal conductivity of the PCM. A critical finding is the identification of an optimal finning coefficient range (4.16 to 5.68) that maximizes enhancement performance. A validated numerical model (error < 5%) and a predictive formula for melting time were developed. Experimental data show that the optimized finned structure reduces PCM melting time by 47% to 59%. This research provides theoretical and practical tools for designing high-efficiency thermal storage, supporting the development of flexible and integrated building energy systems.

1. Introduction

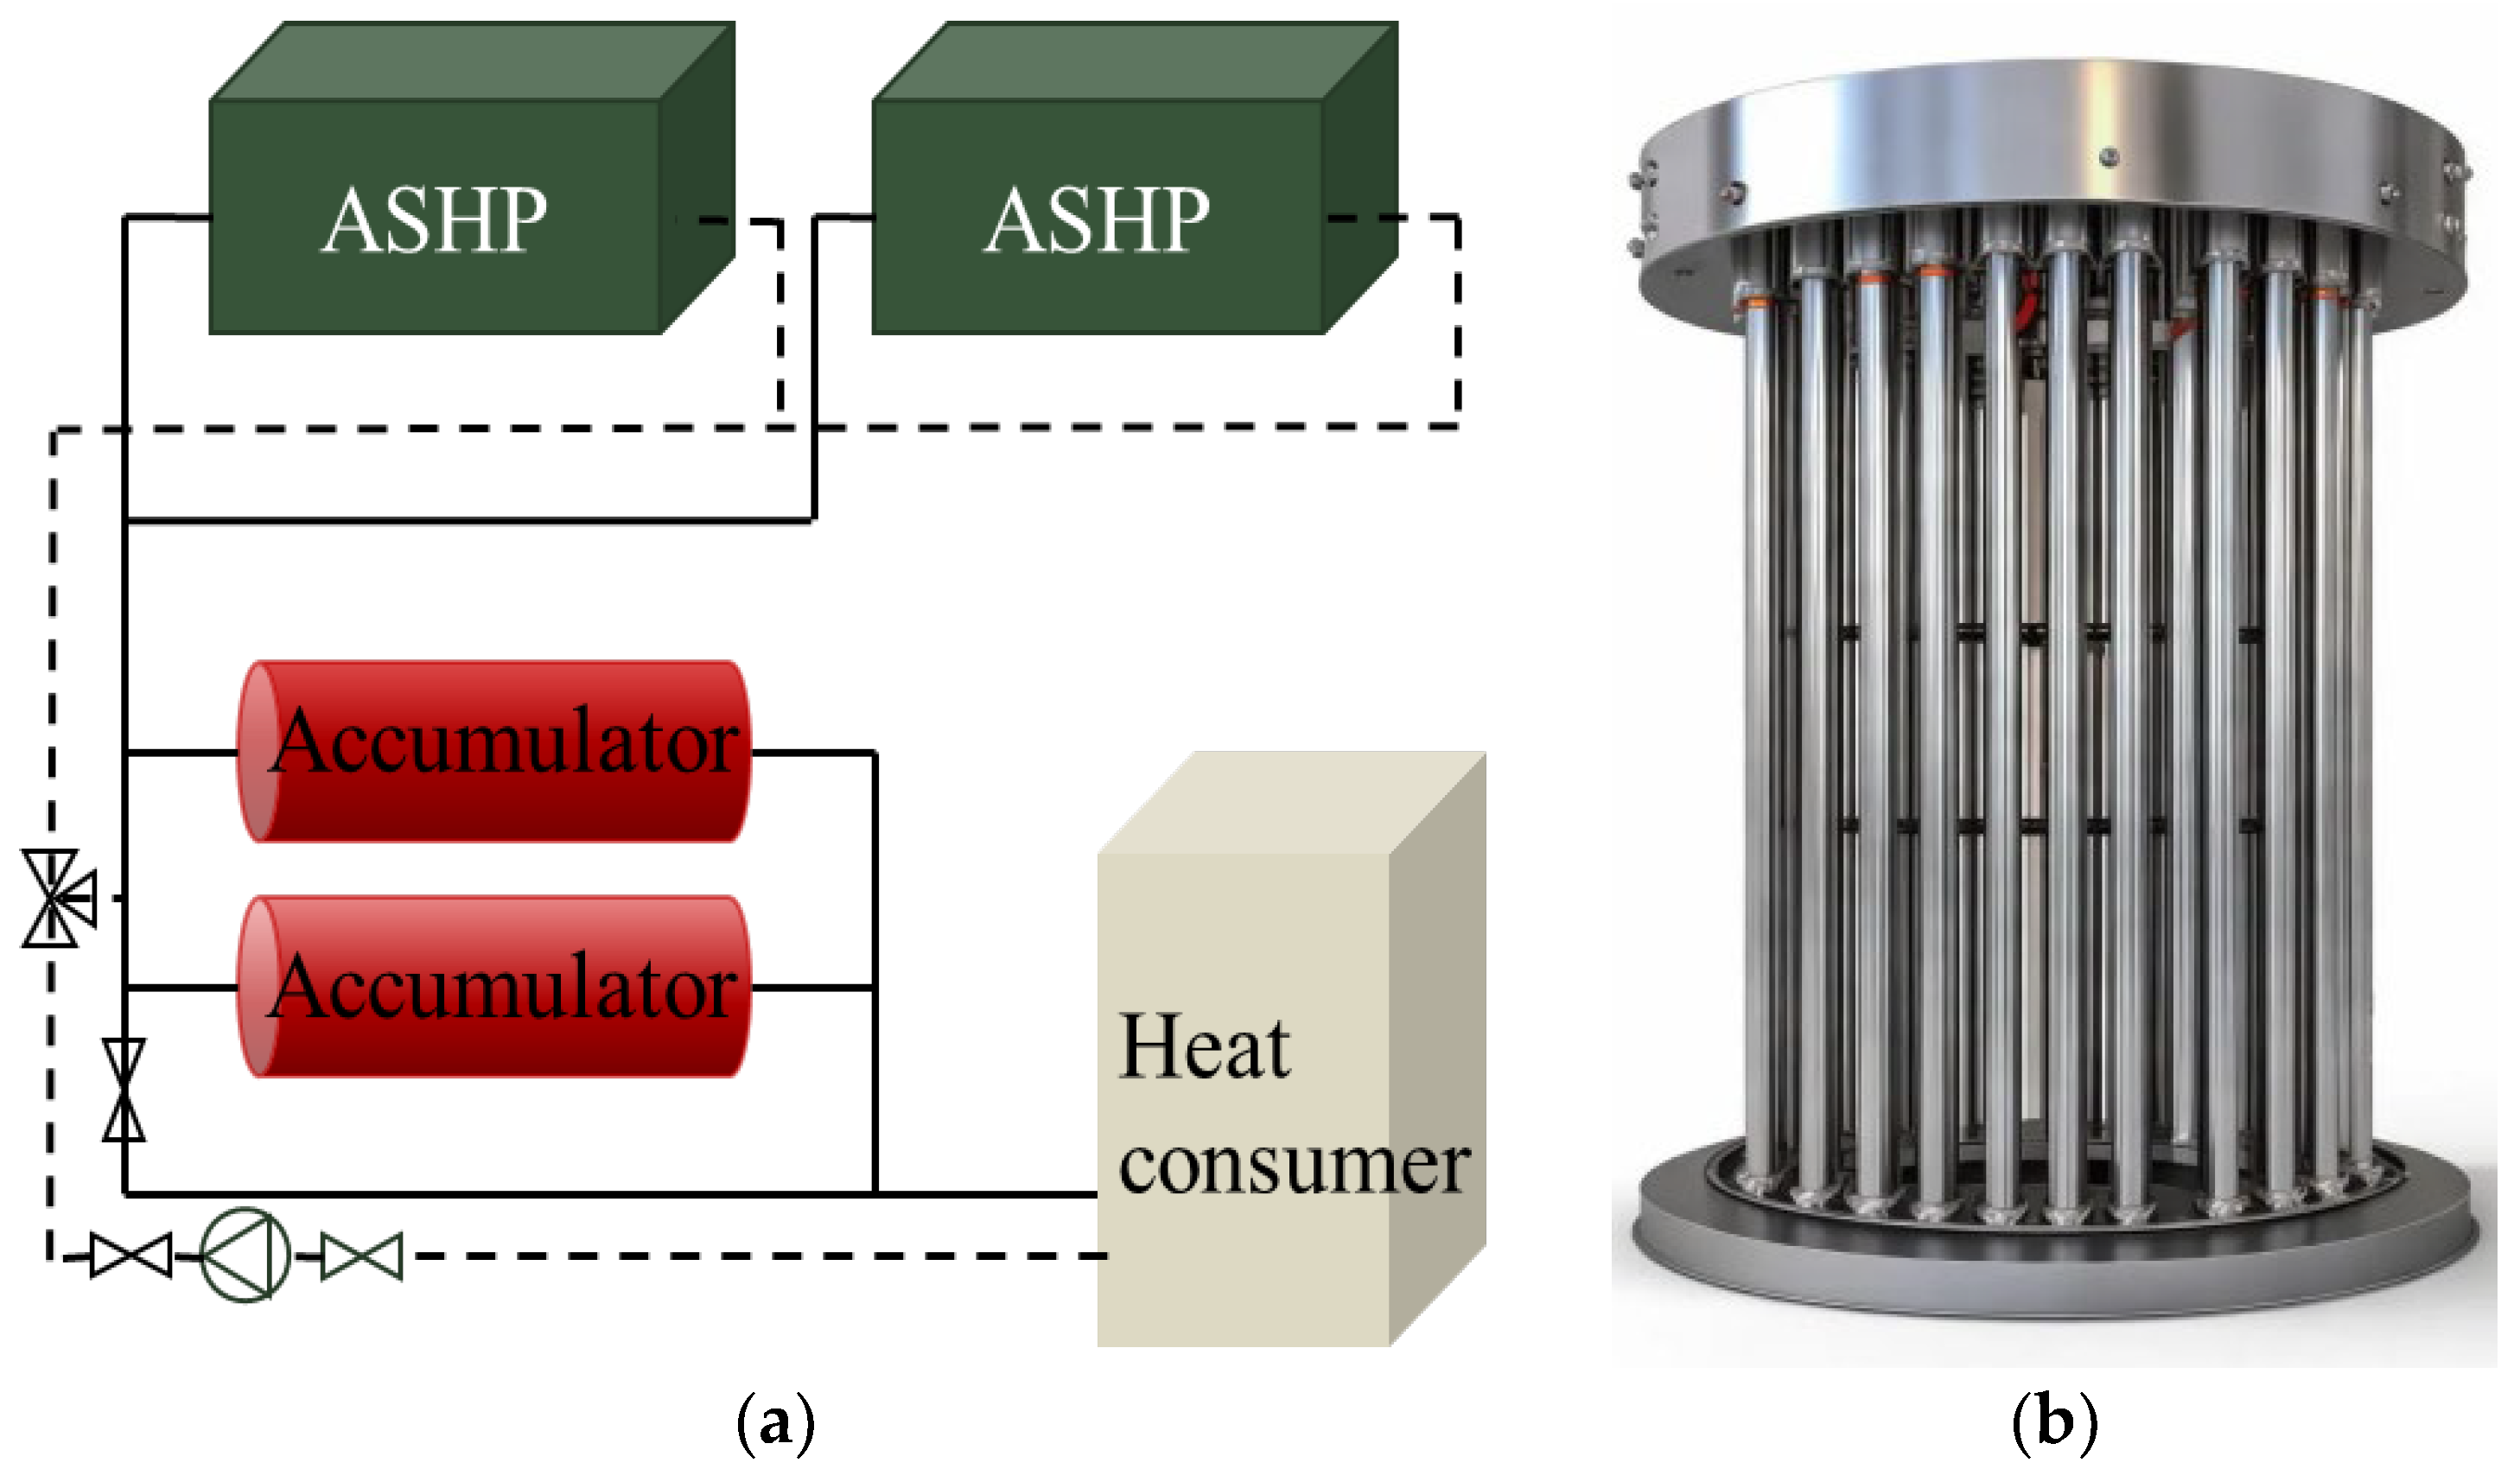
Building heating accounts for a significant portion of global energy consumption and carbon emissions, so transitioning to clean energy is crucial for achieving the dual carbon goals. Organizations such as the International Energy Agency (IEA) have identified air-source heat pumps (ASHPs) as a key technology for replacing fossil fuel heating systems [1]. However, Northern China faces significant challenges in meeting its dual carbon targets due to the extensive heating demands across its vast territory, which remains predominantly reliant on fossil fuels [2,3]. ASHPs have received widespread attention due to their simplicity and high efficiency, making them a promising option for clean heating [4]. However, users employing ASHPs in severely cold regions experience problems such as a sharp decline in heating capacity and energy efficiency, an irreconcilable mismatch between heating supply and demand, poor economic viability, and system shutdowns [5]. As illustrated in Figure 1, the ASHP system coupled with a heat storage unit effectively addresses these issues [6,7]. Specifically, when outdoor temperatures exceed the set point and/or users can utilize off-peak electricity rates, the ASHP operates to provide heating while charging the storage unit [8,9]. Conversely, during periods of low outdoor temperatures and peak electricity pricing, the ASHP shuts down and the stored heat is released to supply the user. Consequently, research into high-capacity thermal storage units with rapid heat storage and release capabilities, along with their storage materials, has become essential for the efficient application of ASHP-coupled clean heating systems [10]. Among these materials, paraffin wax (PA) offers substantial heat storage capacity with controllable phase change temperatures, and shell-and-tube thermal storage units feature simple structures and strong heat storage capabilities. Combining these two elements to enhance the heat storage and release performance of accumulators further holds significant potential for heating systems coupled with ASHPs, particularly in severely cold regions [11].
The properties of phase change materials are one of the key factors influencing the operational performance of heat storage devices. Phase change materials with high heat storage capacity and rapid storage and release capabilities can enhance the storage device’s heat storage capacity and thermal conductivity, thereby improving its performance. Mills et al. [12] observed that phase change materials composed of composite polyacrylonitrile (PA) and expanded graphite (EG) exhibit thermal conductivities 20 to 130 times higher than pure PA, alongside greater heat storage density. Tian and Zhao et al. observed that incorporating foamed metals into PCMs could enhance thermal conduction by three to ten times, with this effect becoming more pronounced as the pore size and porosity of the PCMs decreased [13,14]. Using experimental and simulation methods, Hosseini et al. [15] found that the heat storage and release efficiency of a paraffin RT50 phase change shell-and-tube heat accumulator increases with the inlet temperature of the heat transfer fluid. Hamid Masoumi et al. [16] experimentally and numerically demonstrated a 7% increase in liquid-phase thermal conductivity and a 15% increase in solid-phase thermal conductivity by incorporating 0.39 wt% TiO2 nanoparticles into the phase change material SA within a shell-and-tube heat accumulator.
An efficient and rational structure is crucial for improving the heat storage and release characteristics of accumulators. Measures such as adding fins and optimizing the structural layout of heat exchange tubes can effectively improve their efficiency in storing and releasing heat. Through experimental and simulation studies, Hamid Masoumi et al. discovered that longitudinal fins on the inner tube significantly increase the melting rate of PCMs in shell-and-tube thermal storage units. Wu Xuehong et al. [17] found that, by experimentally comparing three novel shell-and-tube phase change accumulator designs, those incorporating a layered internal structure and inclined fins exhibited the highest heat transfer performance. Wang Weiqi et al. [18] analyzed the melting heat transfer characteristics of PA-35 on the exterior of rectangular ring-finned tubes in shell-and-tube thermal storage units and proposed dividing the external phase change melting process into three distinct stages with markedly different heat transfer rates, each suited to varying power demands. Increasing the inlet temperature of the hot fluid and the temperature difference across the phase change material enhances the overall heat transfer capacity. Francis Agyenim et al. [19,20] analyzed the temperature variations in the phase change material erythritol within single-tube longitudinal finned and multi-tube shell-and-tube accumulators. They observed that the heat transfer process within the accumulator is essentially two-dimensional and dominated by radial heat transfer. The multiple natural convection cells formed within the multi-tube structure significantly alter the flow pattern at the solid–liquid interface. Furthermore, at an average temperature of 80 °C, the solidification process can recover 70.9% of the stored heat. M.J. Hosseini et al. [21] investigated the effects of fin height and Stefan number on the performance of an eight-fin rectangular double-tube heat accumulator and observed that increasing fin length reduced the melting time of the phase change material while enhancing thermal diffusivity.
In summary, coupled thermal storage units are a vital technology for improving the heating performance of ASHPs in extremely cold areas. However, optimizing composite phase change materials and accumulator structures to overcome the bottleneck in heat storage and release performance remains a core challenge in current research. This paper addresses this challenge by undertaking systematic research centered on the mechanism of finned structure reinforcement. Firstly, a shell-and-tube heat storage unit model based on an expanded graphite/paraffin CPCM was designed and validated. Through experimental preparation and performance characterization, CPCM with excellent thermal conductivity was obtained. Secondly, an experimental rig was constructed to test four finned unit heat storage devices, providing robust experimental evidence for the accuracy of the numerical model. Furthermore, unlike previous studies that merely compared discrete fin configurations, this work systematically establishes the coupling relationship between the finning coefficient and accumulator performance, identifying an optimal design range of 4.16–5.68 that maximizes enhancement effectiveness while avoiding the suppression of natural convection. Through numerical simulations, the comprehensive influence of the finning coefficient on heat transfer rates, liquid phase fraction evolution, and heat storage/release duration was analyzed in depth. This reveals the trade-off between enhanced thermal conductivity and suppressed natural convection within the finned structure, providing theoretical guidance for optimizing accumulator structures. Finally, a melting time prediction formula applicable to systematic design was developed (With fins: Melting Time = 0.12Tin2 − 24.43Tin + 1145.72), enabling rapid preliminary design and performance evaluation without extensive numerical simulations. Based on extensive numerical simulations and an analysis of experimental data, this empirical formula simplifies complex heat transfer processes, facilitating the rapid design and performance evaluation of coupled thermal storage units within ASHP heating systems.

2. Materials and Methods

2.1. Influence of EG Content on the Mechanism of Thermal Conductivity

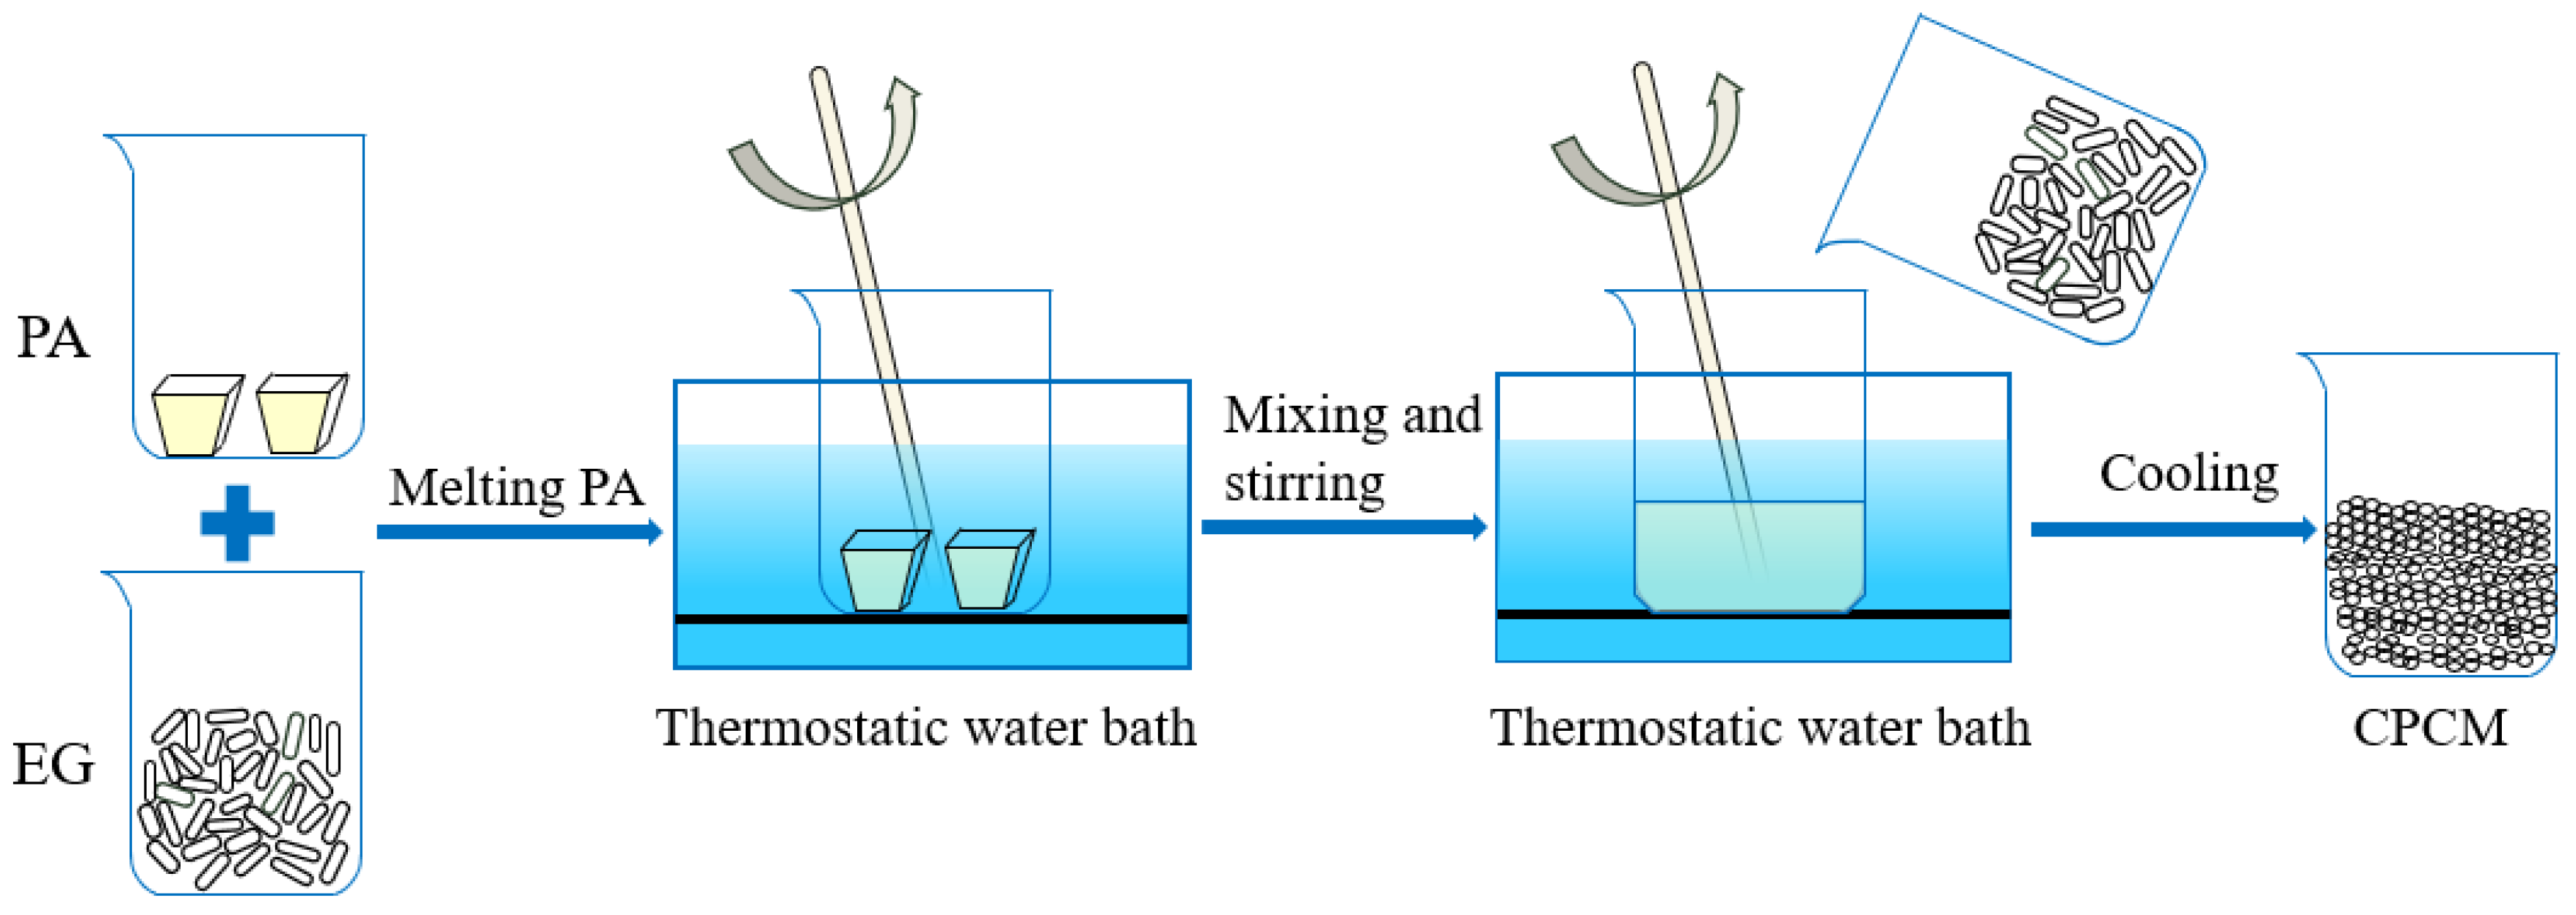
Since ASHP systems usually supply heating water at around 50 °C, paraffin wax is an ideal phase change material due to its substantial heat storage capacity, moderate phase change temperature, low cost, and non-toxic properties. This study selected paraffin wax (PA) with a phase transition temperature of 42–44 °C as the base phase change material. Furthermore, given that porous expanded graphite has high thermal conductivity, incorporating it into the composite can enhance the thermal conductivity of the PA phase change material stably. Therefore, expanded graphite with a particle size of 200 mesh was selected as the adsorbent material. The CPCM was prepared using the melt impregnation method illustrated in Figure 2. As CPCM’s thermal properties can be adjusted by varying the EG content to meet optimal thermal performance requirements under different application conditions, this study prepared four composite phase change materials: CPCM1 (EG:PA = 1:7), CPCM2 (EG:PA = 1:8), CPCM3 (EG:PA = 1:9) and CPCM4 (EG:PA = 1:10). Each of these composites has a different EG:PA ratio.
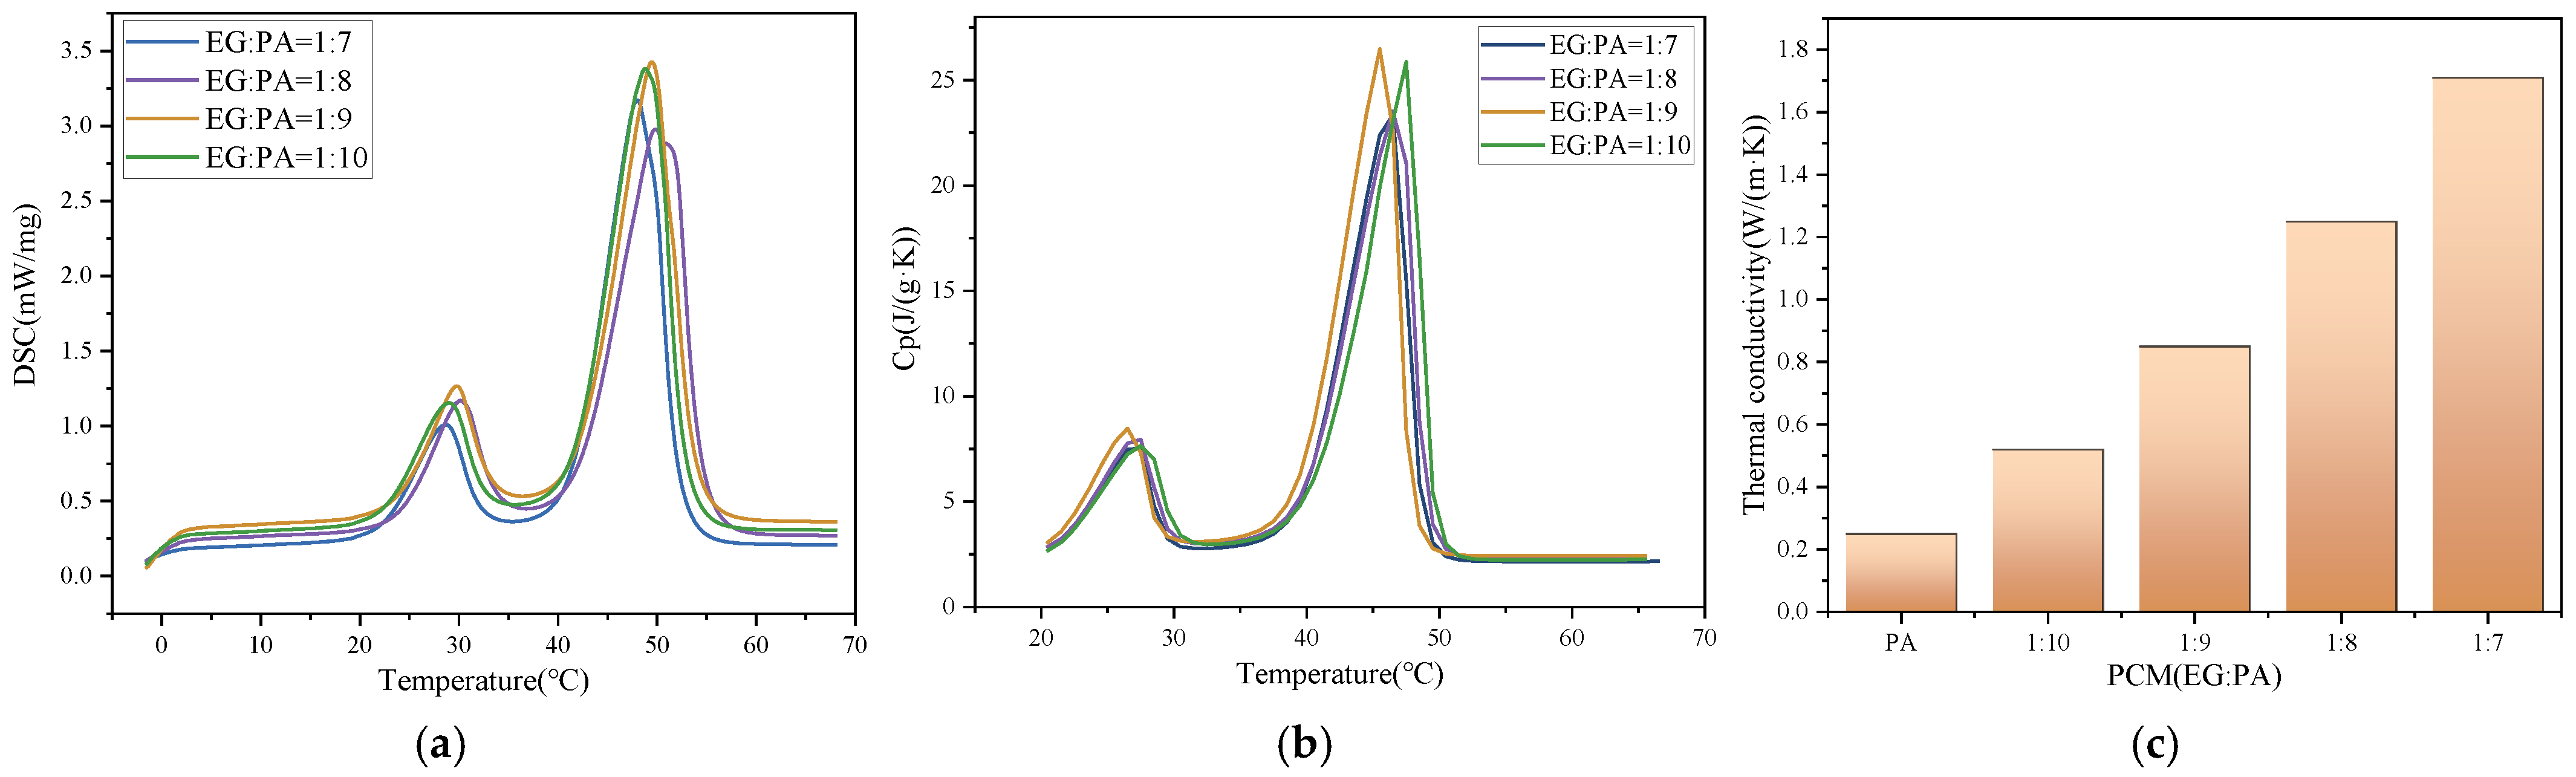
This study employed a simultaneous thermal analyzer and a differential scanning calorimeter DSC 200 F3 (NETZSCH-Gerätebau GmbH, Selb, Germany) with temperature accuracy of less than 0.1 K and a laser thermal analyzer (NETZSCH, Germany, LFA457, with a temperature range of −125 to 1100 °C) to characterize the phase transition temperatures, specific heat capacities and thermal conductivities of PA, ethylene glycol EG, and the four composite phase change materials (CPCMs). The results are presented in Figure 3a–c. Table 1 provides specific physical parameter values, including density, phase transition temperature, specific heat capacity, thermal conductivity and phase transition latent heat, for PA, EG and the four CPCMs.
As the density of the porous medium EG is significantly lower than that of PA and the overall volume of CPCM increases with the addition of EG while the mass per unit volume decreases, the density of CPCM progressively diminishes with rising EG content. Figure 3a shows the relationship between heat flux density and temperature for four composite phase change materials within the 0–70 °C range. The peak interval and the area under the curve represent the phase change temperature and latent heat, respectively. Table 1 summarizes the phase transition temperatures and latent heats for paraffin wax (PA) and EG, as well as the four phase change materials. It is evident that PA exhibits the lowest phase transition temperature. As the EG content increases, the phase transition temperature of the CPCMs rises, though not particularly markedly. The area under the peak curve of the DSC curve increases with the PA content in the CPCMs, as does the corresponding latent heat of phase change. CPCM1 has the lowest latent heat of phase change. Figure 3b shows the specific heat capacities of pure paraffin wax and the four composite phase change materials. As the EG content decreases, the specific heat capacities of the composite materials increase. The reduction in the specific heat capacity of CPCM4 may be attributed to its higher PA content, which could overflow upon heating. As can be seen in Figure 3c and in Table 1, the thermal conductivity of pure paraffin wax is 0.242 W/(m·K). As the EG mass fraction increases, the thermal conductivity of all four composite phase change materials also increases. This demonstrates that adding EG effectively enhances the thermal conductivity coefficient of CPCMs, thereby improving the heat storage device’s heat transfer efficiency. Based on the above analysis, this paper selects CPCM3 as the phase change material to analyze the performance of the heat storage tank.
As shown in Table 1 and Figure 3, the four composite phase change materials (CPCM1–CPCM4) exhibit different thermophysical characteristics due to the variation in expanded graphite (EG) mass fraction. Although CPCM1 and CPCM2 show higher thermal conductivity, their latent heat is significantly reduced because of the increased EG content. Conversely, CPCM4 presents the highest latent heat but a relatively low thermal conductivity, which limits its heat transfer enhancement capability.
CPCM3 was therefore selected as the reference PCM in this study because it provides a balanced compromise between thermal conductivity, latent heat, and density, which is more representative of practical engineering applications. Similar trade-offs between heat transfer enhancement and energy storage density have been widely reported in the literature, indicating that excessive addition of high-conductivity additives may improve conduction but at the expense of latent heat capacity and volumetric energy density [22,23,24].
From an engineering perspective, CPCM3 achieves sufficient thermal conductivity enhancement while maintaining a relatively high latent heat, making it suitable for investigating the coupled effects of material modification and structural optimization. Consequently, CPCM3 was adopted in the subsequent numerical simulations and experimental analyses as a representative composite PCM.

2.2. Physical Model

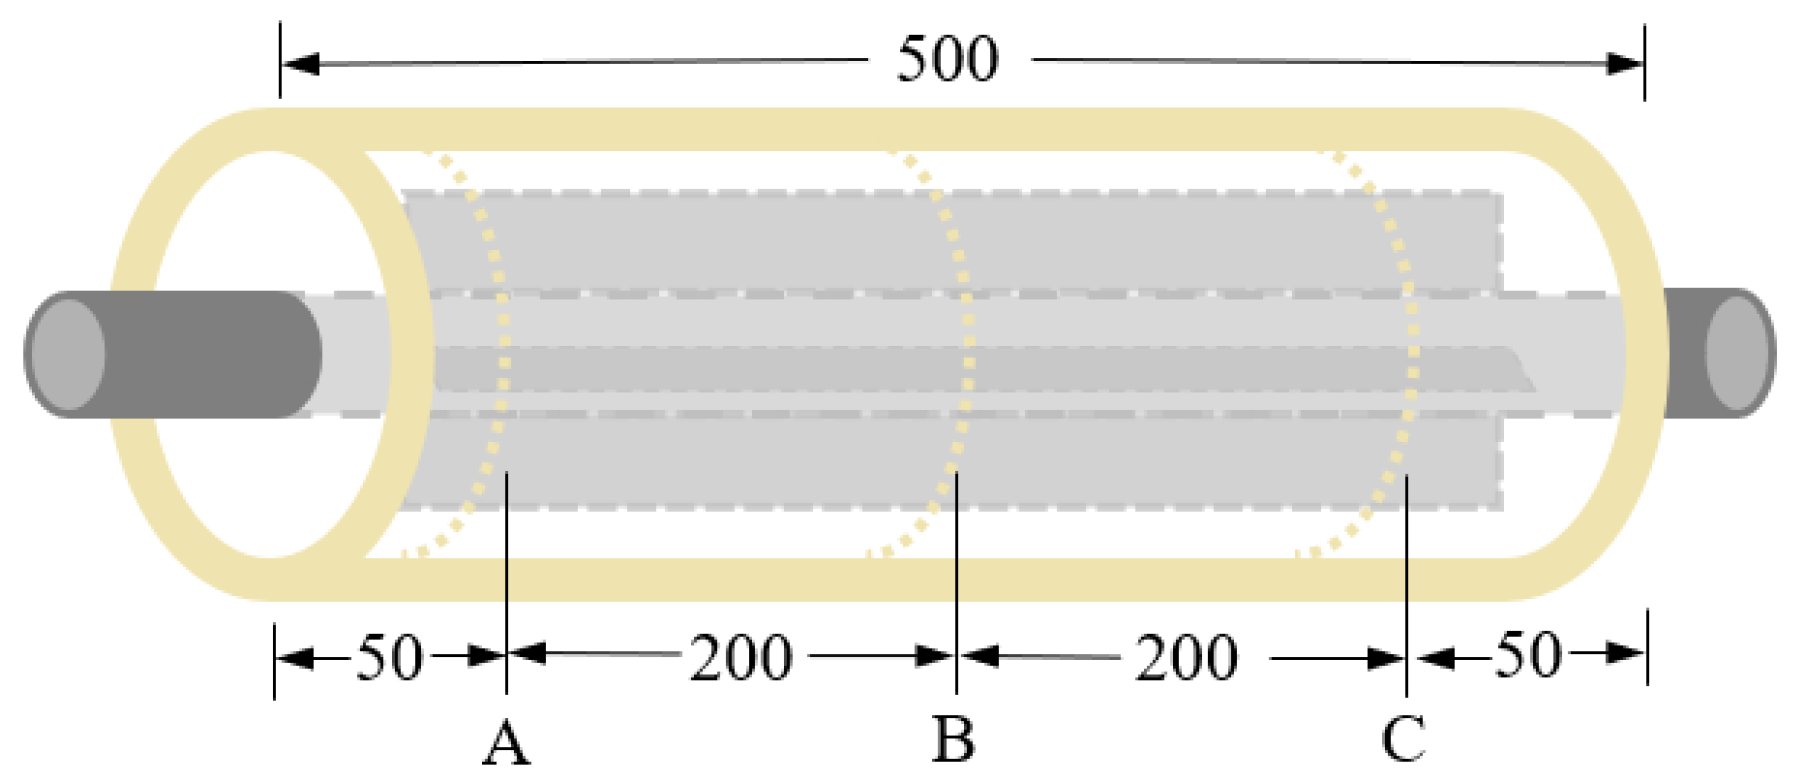
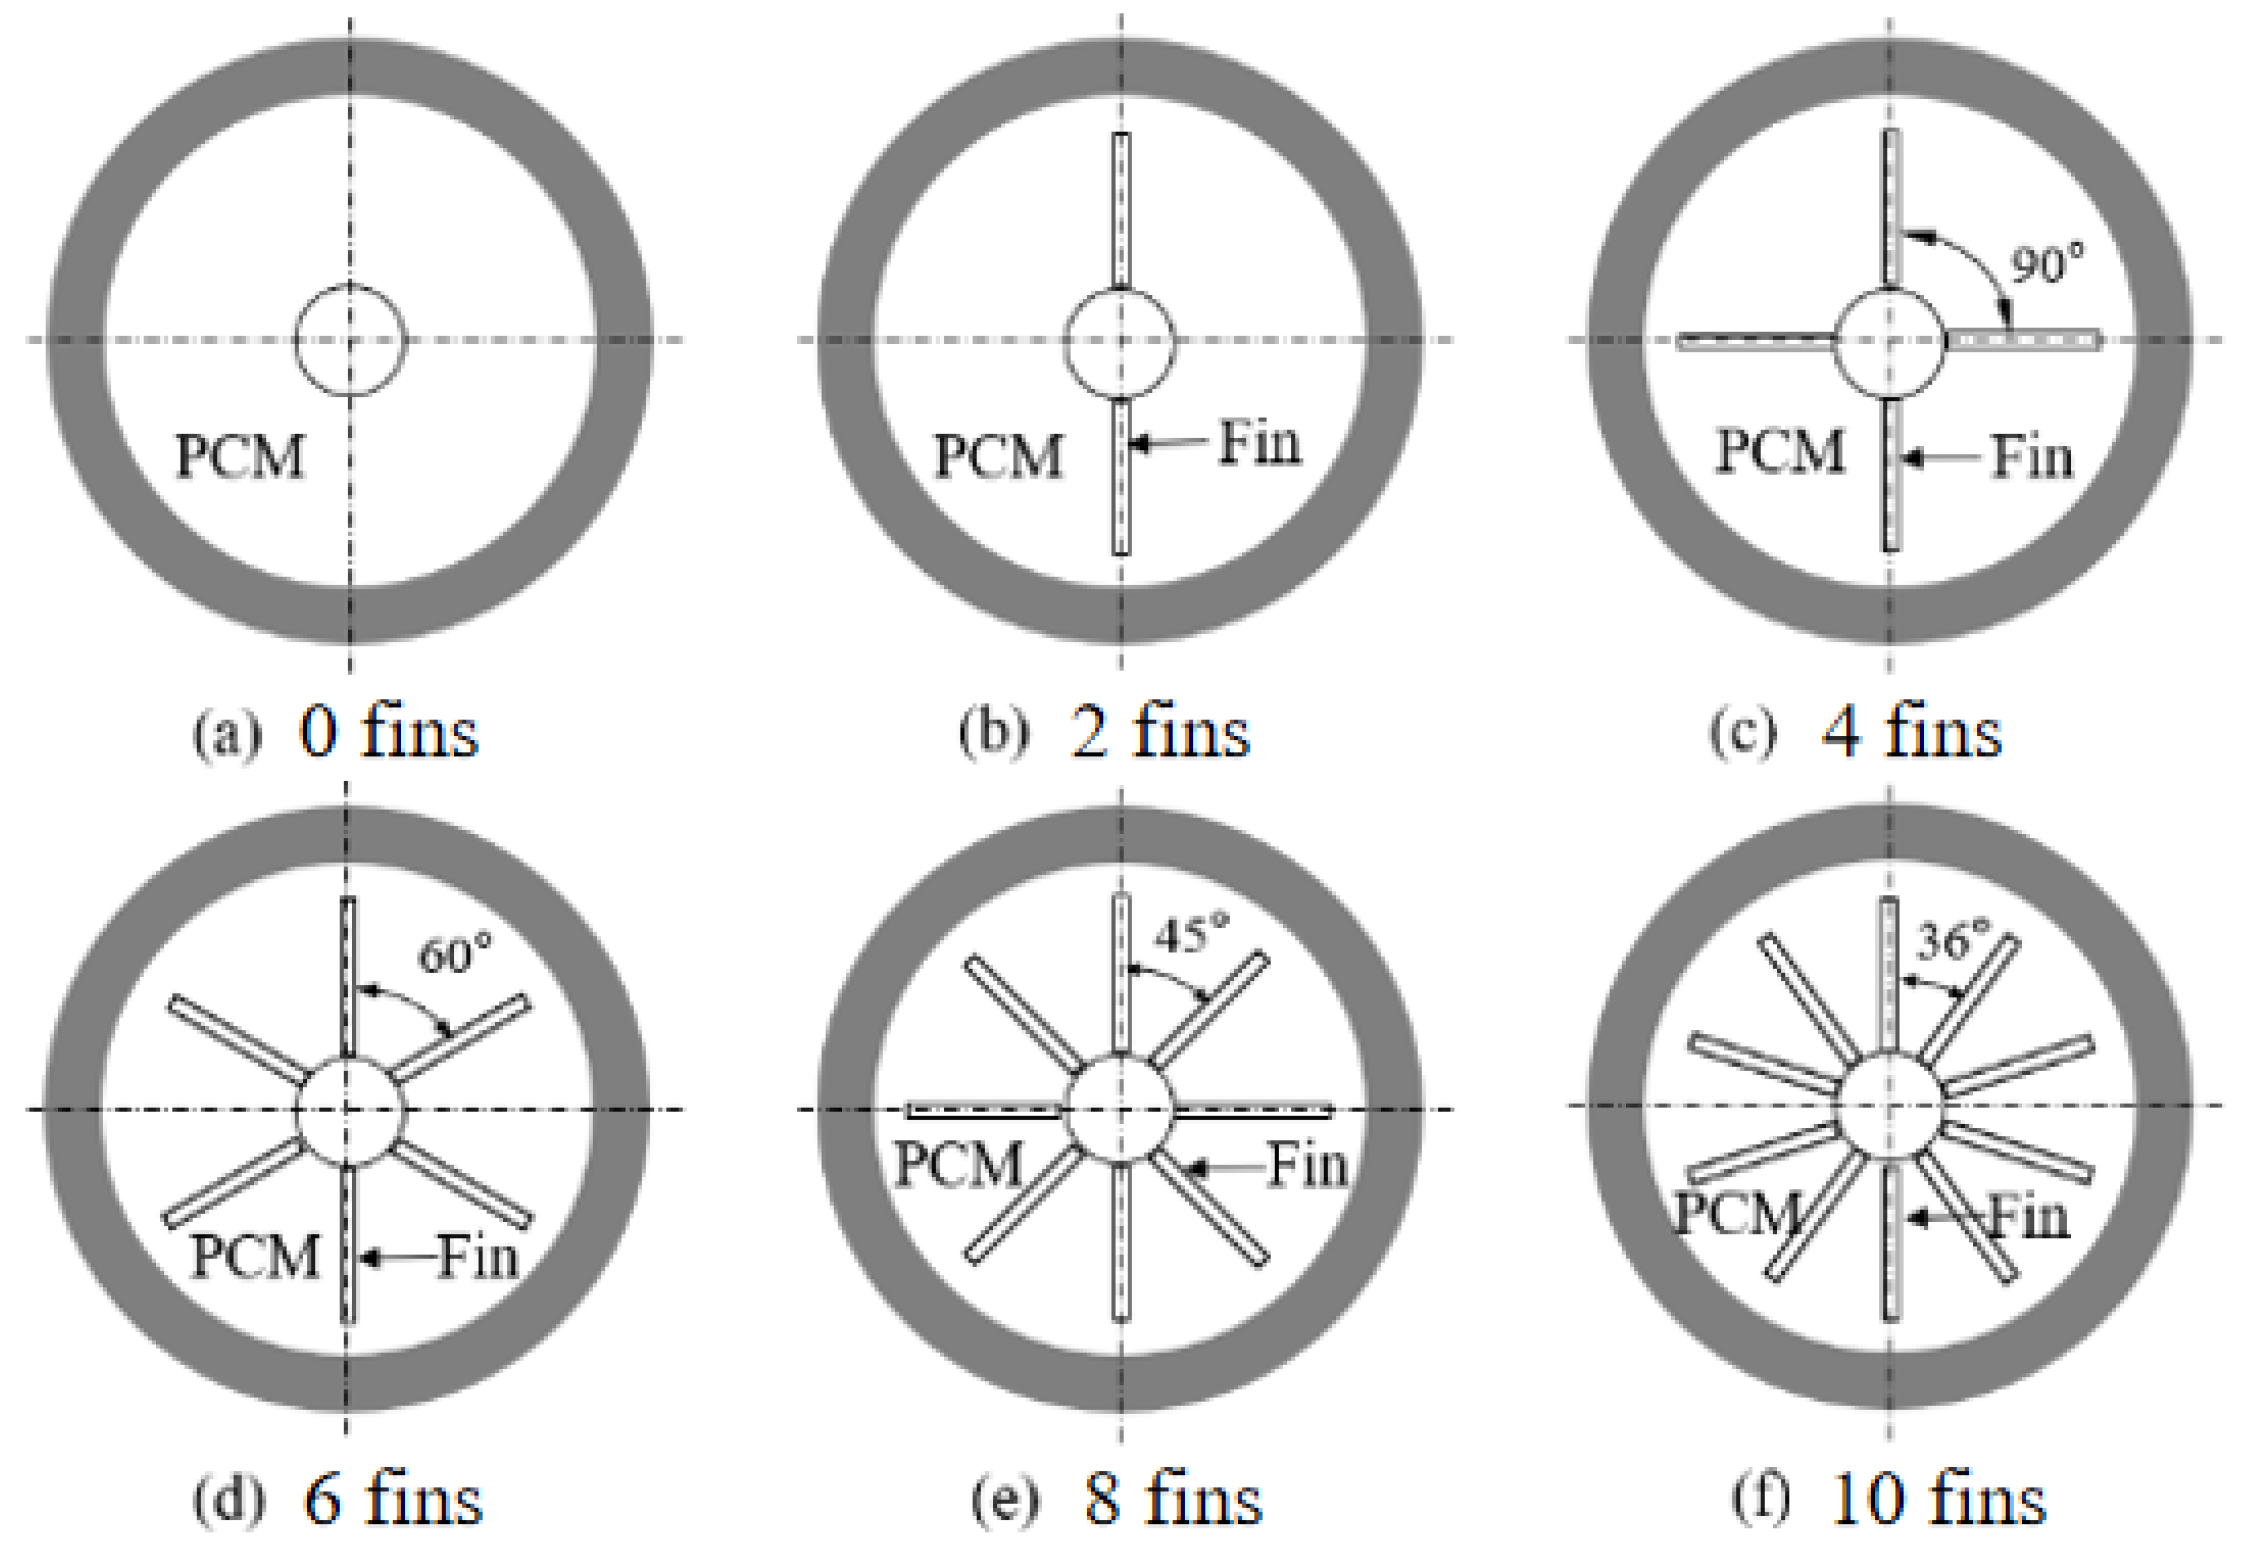
Considering the numerous advantages of horizontally mounted shell-and-tube phase change thermal storage units and the simplification of analysis they offer, this paper focuses on a single unit of such an accumulator to construct the horizontally mounted shell-and-tube unit accumulator shown in Figure 4. The circular outer shell is thermally insulated and has an inner diameter of 100 mm and a length of 500 mm. The central heat exchange tube is a thin-walled steel pipe with a wall thickness of 2 mm and an inner diameter of 20 mm. The shell side is fully filled with CPCM3. During operation, heating cycle water flows longitudinally through the central heat transfer tube, washing the tube wall. Meanwhile, the phase change material either liquefies to store heat or solidifies to release heat in the shell side. In order to investigate the influence of fin structure and area on the heat storage and release rates of the unit accumulator, this study builds upon the finless unit heat accumulator depicted in Figure 5a. Longitudinal fins were added to the outer surface of the central heat transfer tube at intervals of 2, 4, 6, 8 and 10 fins, yielding five finned unit thermal storage units depicted in Figure 5b–f. All fins have a thickness of 2 mm, a length of 400 mm and a height of 30 mm.

2.3. Numerical Model

2.3.1. Model Assumptions

The numerical model is based on the following assumptions:
(1)
Thermophysical properties of the PCM are constant within the operating temperature range.
(2)
The PCM is incompressible and isotropic, with negligible volume change during phase change.
(3)
The standard k-ε turbulence model is employed primarily to enhance numerical stability and capture local velocity perturbations in the buoyancy-driven natural convection of the liquid PCM. While the overall flow regime is laminar to weakly turbulent (Rayleigh number ~106–107), the k-ε model provides robust convergence for the transient, phase-change-coupled simulation. The Boussinesq approximation is adopted for buoyancy effects, and validation against experimental data confirms that this modeling strategy reasonably predicts the overall melting time and temperature evolution.
(4)
Radiation heat transfer is neglected, and the outer wall is adiabatic.

2.3.2. Governing Equations

This paper uses ANSYS Fluent 2022 R1 (ANSYS Inc., Canonsburg, PA, USA) to develop a three-dimensional, unsteady model based on the enthalpy-porous medium method. The governing equations include continuity, momentum, energy, and turbulence equations, with the following assumptions: the PCM is treated as a porous medium in the mushy zone; natural convection is governed by the Bossiness approximation and gravitational effects are included [21,25,26].
Continuity equation:
· ρ P C M V = 0
Momentum equation:
𝜕 ρ P C M u P C M 𝜕 τ + V · · ρ P C M u P C M = 𝜕 P P C M 𝜕 x + μ P C M 2 u P C M + S x
𝜕 ρ P C M v P C M 𝜕 τ + V · · ρ P C M v P C M = 𝜕 P P C M 𝜕 y + μ P C M 2 v P C M + S y
𝜕 ρ P C M w P C M 𝜕 τ + V · · ρ P C M w P C M = 𝜕 P P C M 𝜕 z + μ P C M 2 w P C M S b + S z
where V = ( u , v , w ) is the velocity vector; ρ , μ, and β are the density, dynamic viscosity, and thermal expansion coefficient of the liquid PCM, respectively; and Sx, Sy, Sz are the damping source terms in the enthalpy-porous model.
Energy equation:
𝜕 ρ P C M H 𝜕 τ + · ρ P C M V H = λ P C M T P C M
This study uses the enthalpy-porous medium fixed-mesh method. During computation, the physical and thermal properties of the phase change material are controlled by varying the liquid fraction, f, as expressed in Equation (6). When 0 < f < 1, the phase change material is in a solid–liquid mixture state and is treated as a porous medium.
f = 0                                   T P C M < T s                                             T P C M T s T l T s                 T s < T P C M < T l                             1                                 T P C M > T l                                            
Assuming a uniform initial temperature of the phase change material for the melting process, the initial temperature is set to room temperature. The inlet boundary condition uses a velocity inlet with the inlet water temperature and the velocity of the heat transfer fluid [25,27].
T H T F = T i n     ,     u H T F = u i n     ,     v H T F = 0     ,     w H T F = 0
The outlet employs a free outflow boundary condition;
The outer wall surface employs an adiabatic boundary condition:
𝜕 T P C M 𝜕 x w a l l = 0 ,   𝜕 T P C M 𝜕 y w a l l = 0 ,   𝜕 T P C M 𝜕 z w a l l = 0
Symmetry boundaries are applied to the symmetry plane:
𝜕 T 𝜕 y = 0 , 𝜕 v 𝜕 y = 0 , 𝜕 w 𝜕 y = 0

2.4. Assessment of Regional Discretization and Mesh Independence

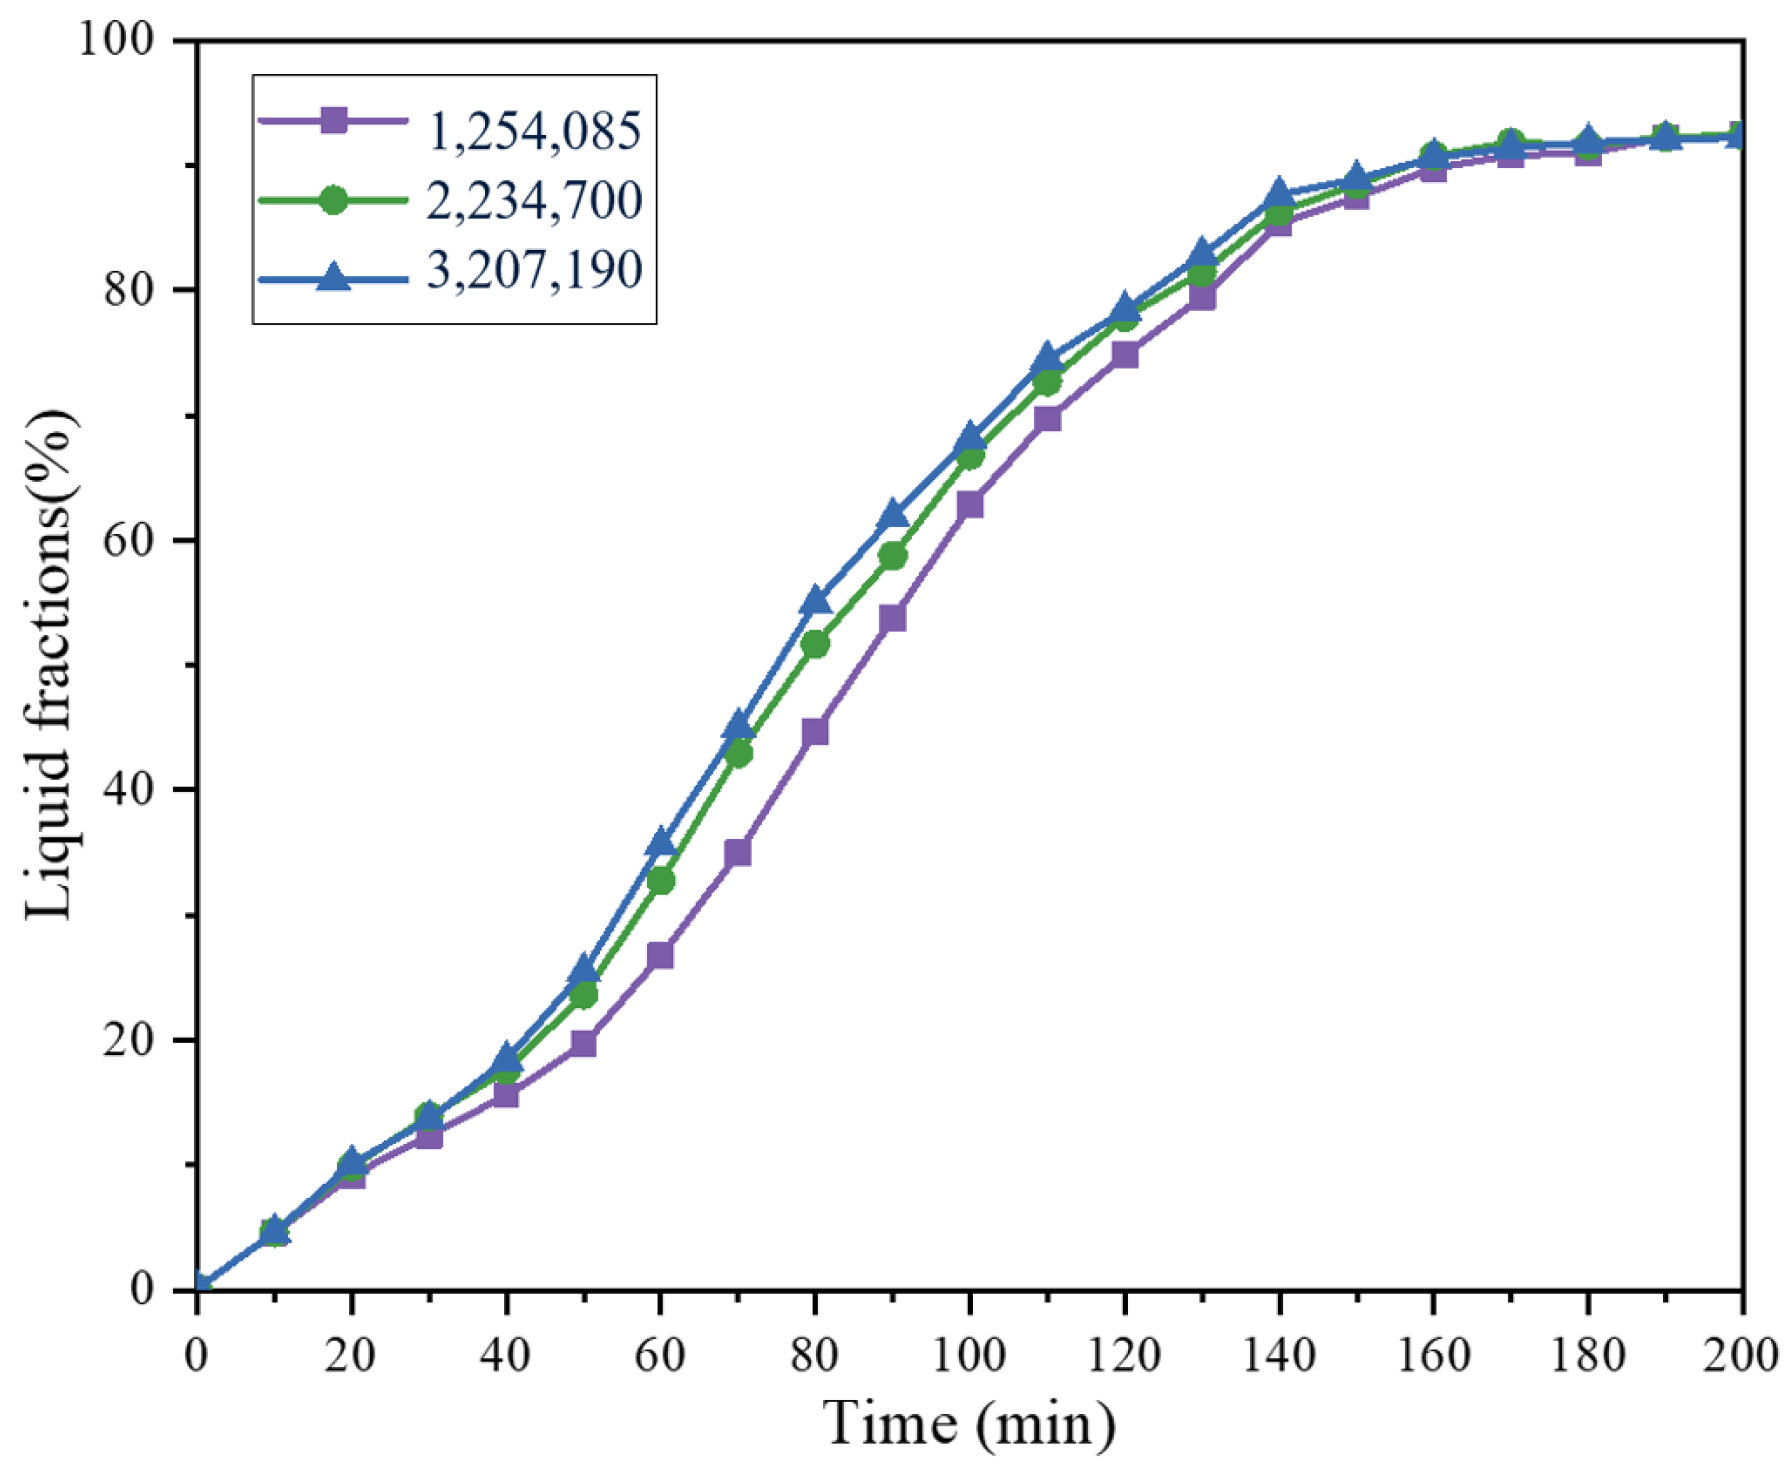
To ensure the reliability of the numerical results, a mesh independence analysis was performed using three different mesh densities. The criterion for mesh independence was defined based on key global performance indicators of the thermal storage unit, namely the total PCM melting time and the evolution of the average PCM temperature, as these quantities directly reflect the overall heat storage behavior of the system [28].
As the mesh number increased from 1,254,085 to 2,234,700 elements, the relative deviation in the predicted melting time and average PCM temperature was found to be less than 2% as shown in Figure 6. A further refinement to 3,207,190 elements resulted in negligible changes in these quantities, indicating that numerical convergence had been achieved. Therefore, the mesh with 2,234,700 elements was selected as a compromise between computational accuracy and efficiency.
This mesh independence assessment strategy, based on physically meaningful integral quantities rather than local point variables, is consistent with common practices in numerical simulations of phase change heat transfer problems [29,30].

3. Numerical Results and Discussion

3.1. The Influence of Heat Exchanger Tube Structure

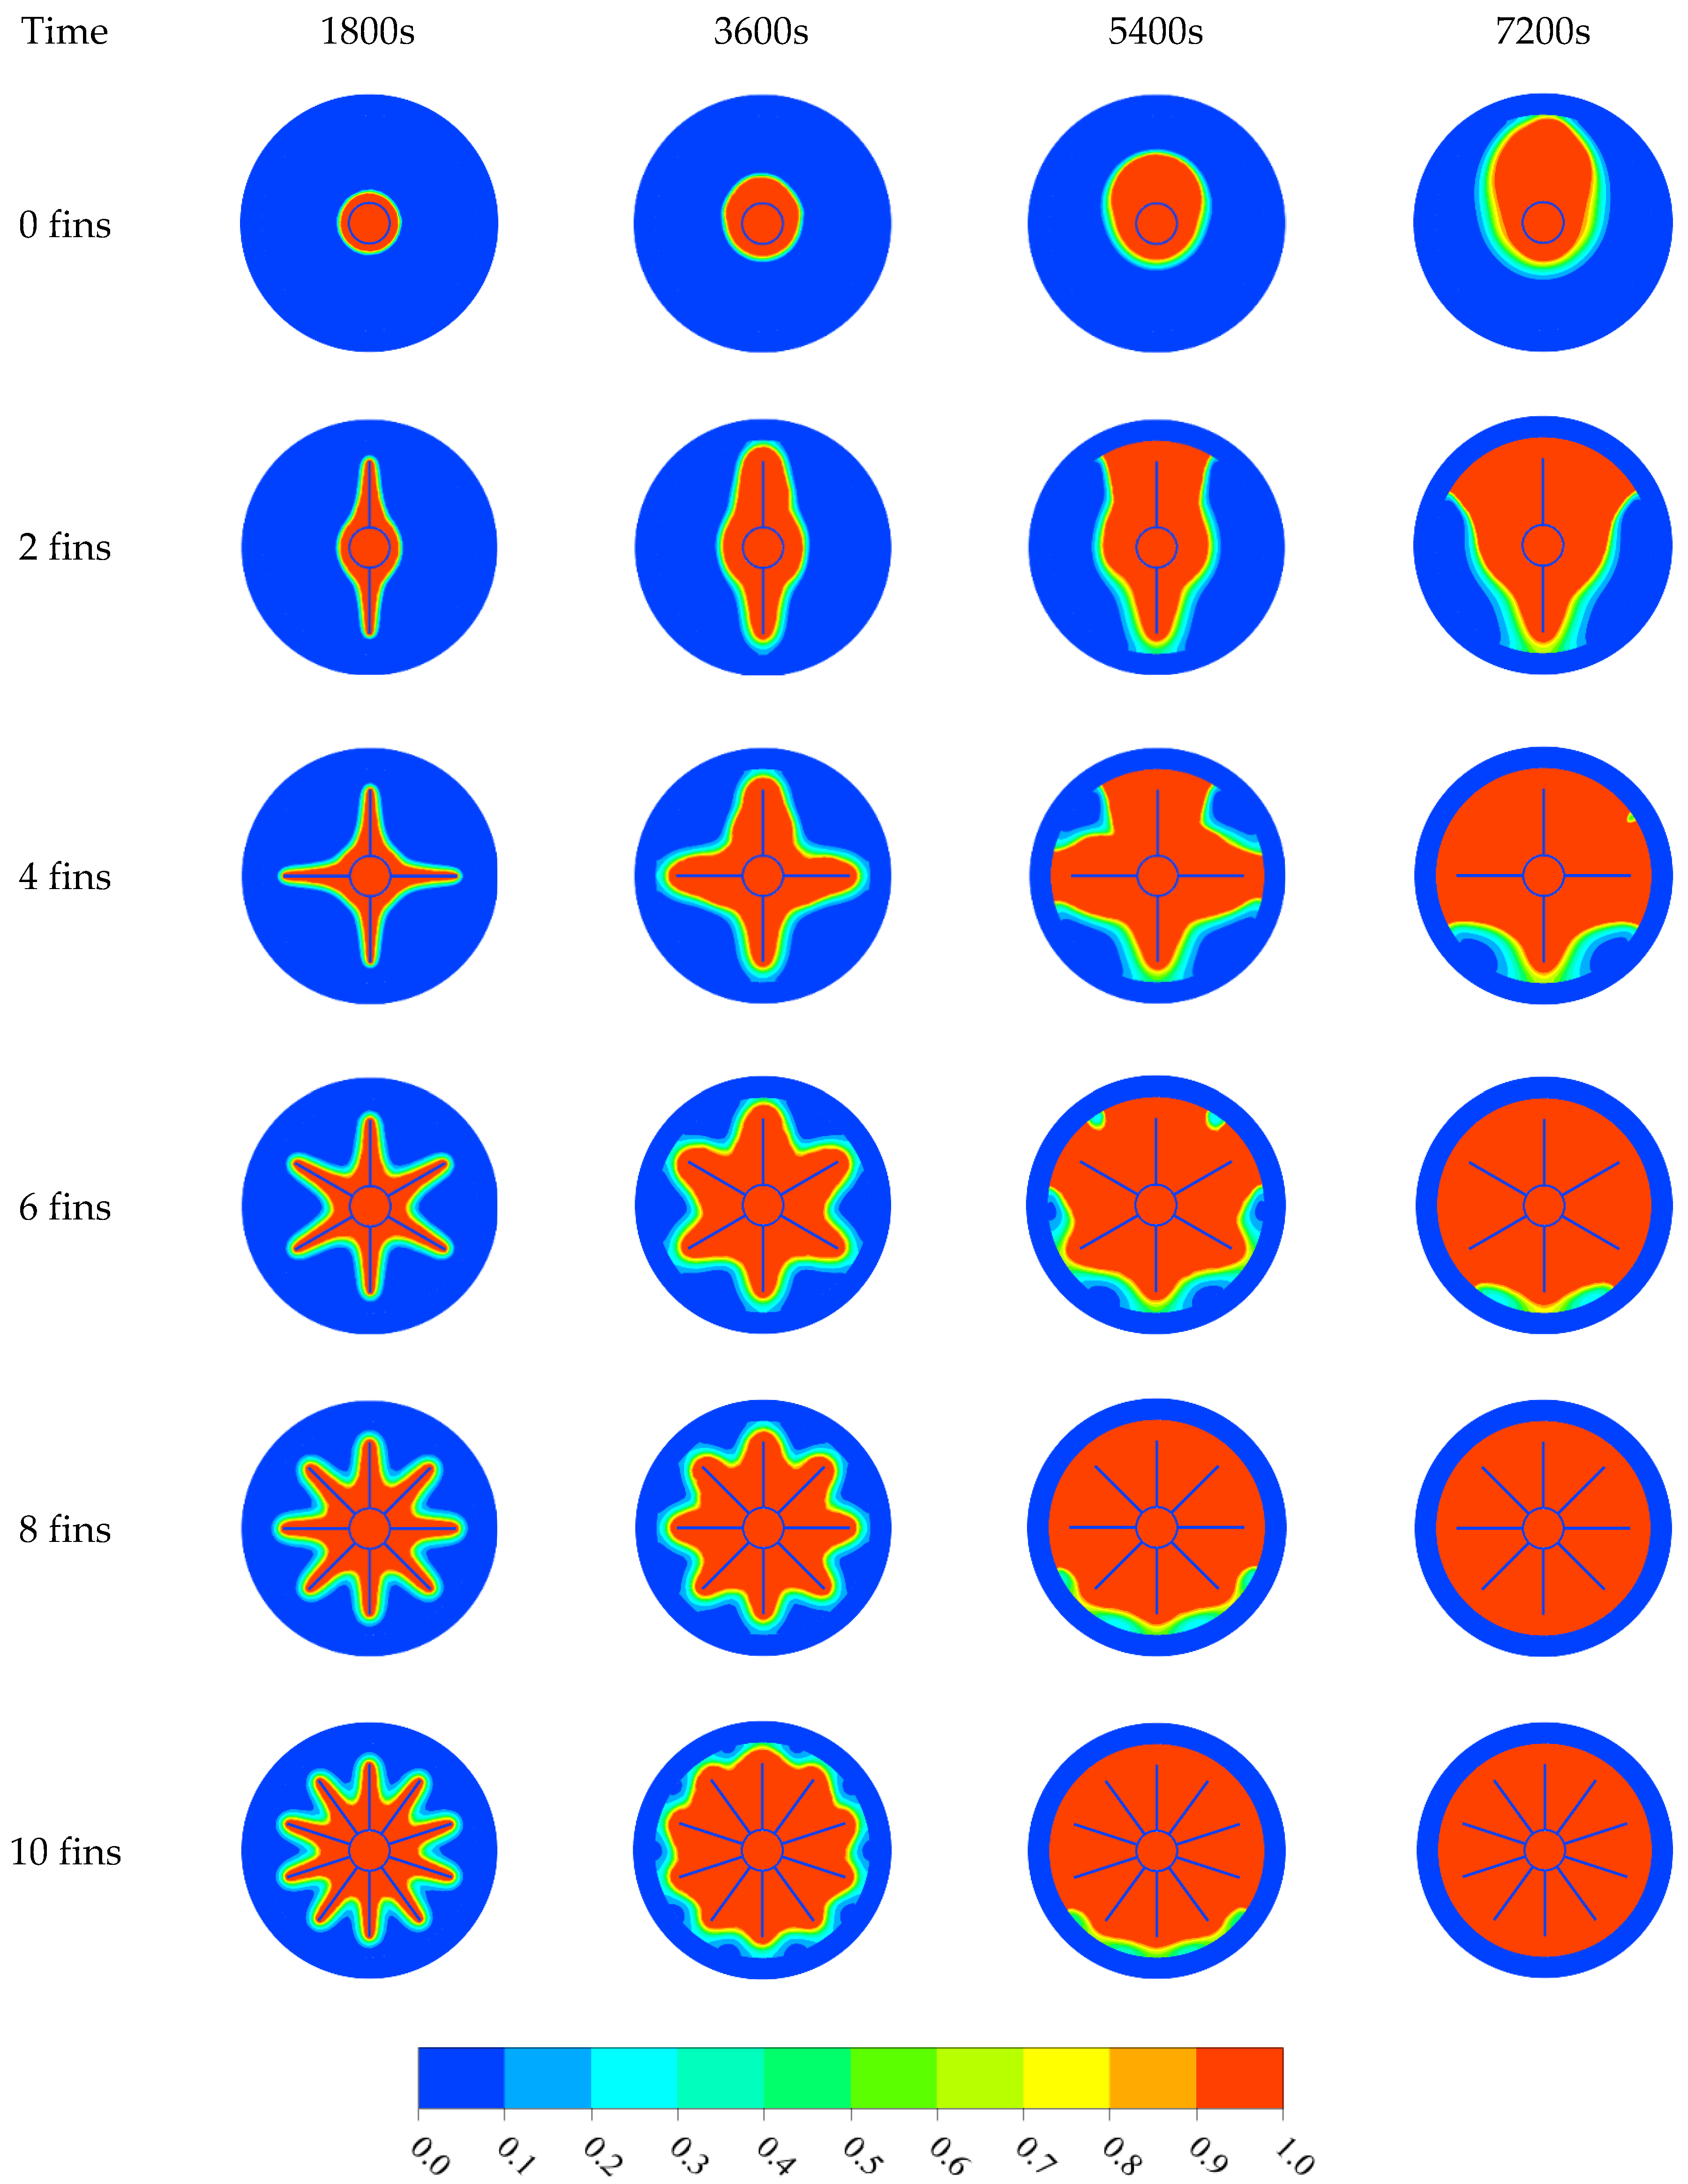
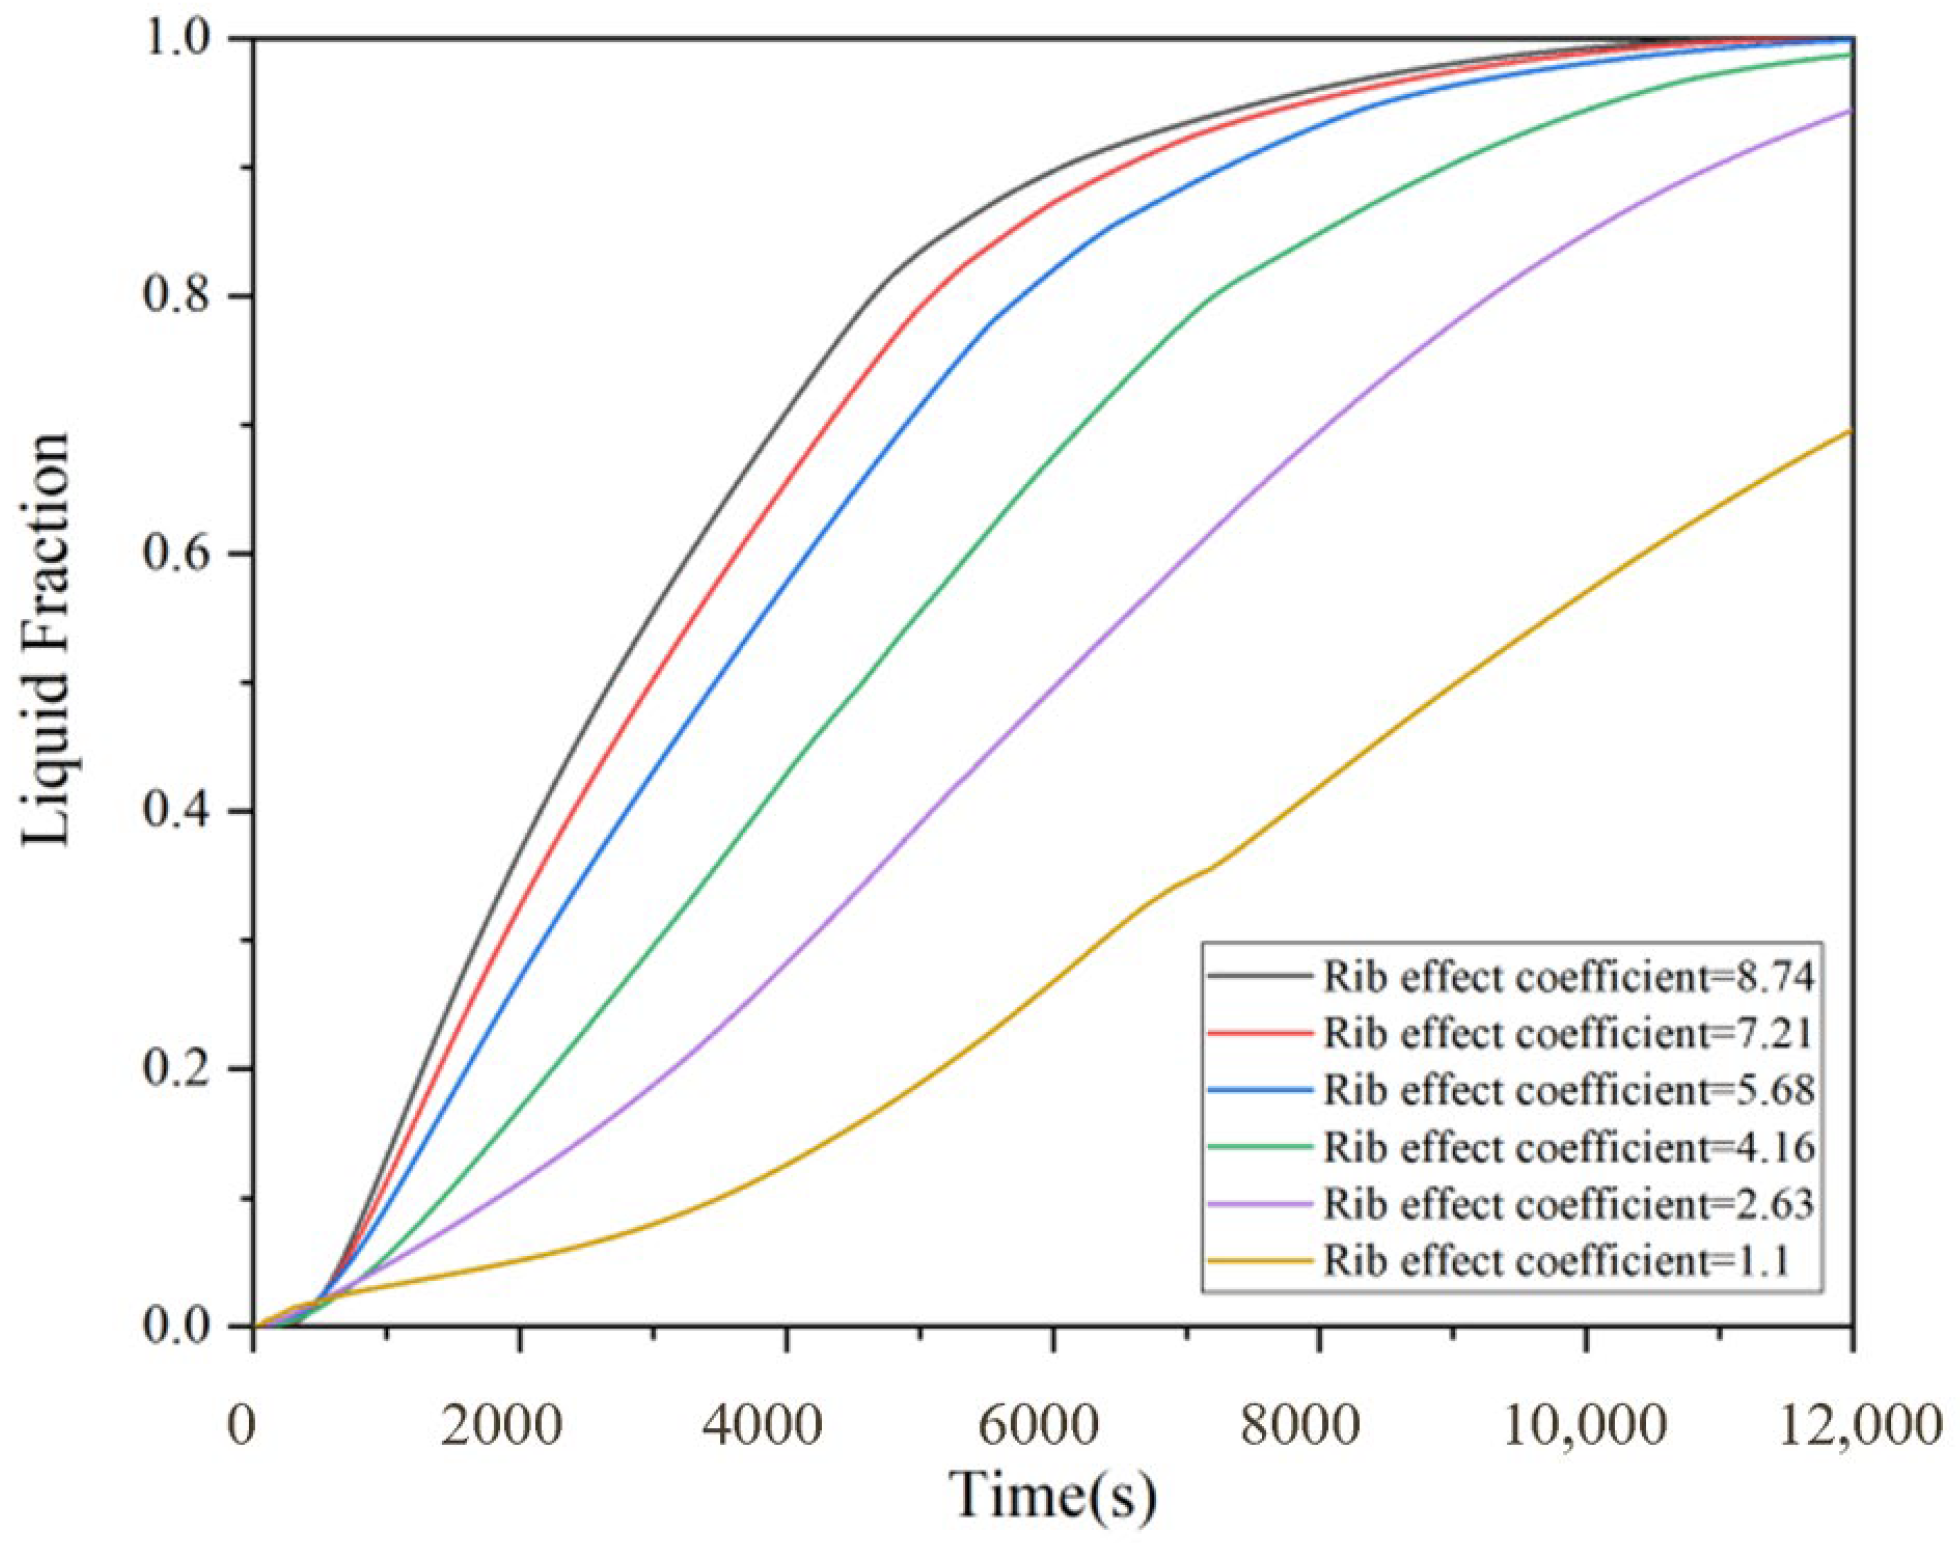
The finning coefficient serves as a key performance indicator for finned heat transfer tubes, representing the ratio of the external surface area to the internal volume of a smooth tube after fin attachment, as expressed in Equation (10). This study investigates six finned tube configurations (0–10 fins) to determine how fin density influences PCM melting behavior and heat transfer mechanisms as shown in Figure 7. Throughout the calculations, the inlet temperature of the heating hot water (HTF) within the heat exchange tubes is maintained at 50 °C. According to Equation (10), the finning coefficients for the six finned heat transfer tube structures are 1.1, 2.63, 4.16, 5.68, 7.21, and 8.74, respectively.
β = A 0 A i
where β denotes the finning coefficient; A0 represents the external surface area per unit length of the finned tube; and Ai represents the internal surface area per unit length of the tube.
Figure 8 illustrates the variation in the liquid phase fraction of the phase change material within six storage units during the initial heat storage periods of 0.5, 1, 1.5 and 2 h. Compared to storage units with smooth heat exchange tubes, the addition of fins accelerates the melting process. However, as the fin area and quantity increase, the effect on the heat storage rate gradually diminishes. Due to buoyancy convection of the heated liquid-phase heat storage material, the phase change rate of the solid-phase heat storage material in the upper part of the heat exchange tube is faster. This is particularly pronounced in smooth and vertical double-fin configurations. Nevertheless, as the fin area and number increase further, the phase change process within the heat storage material becomes increasingly uniform.
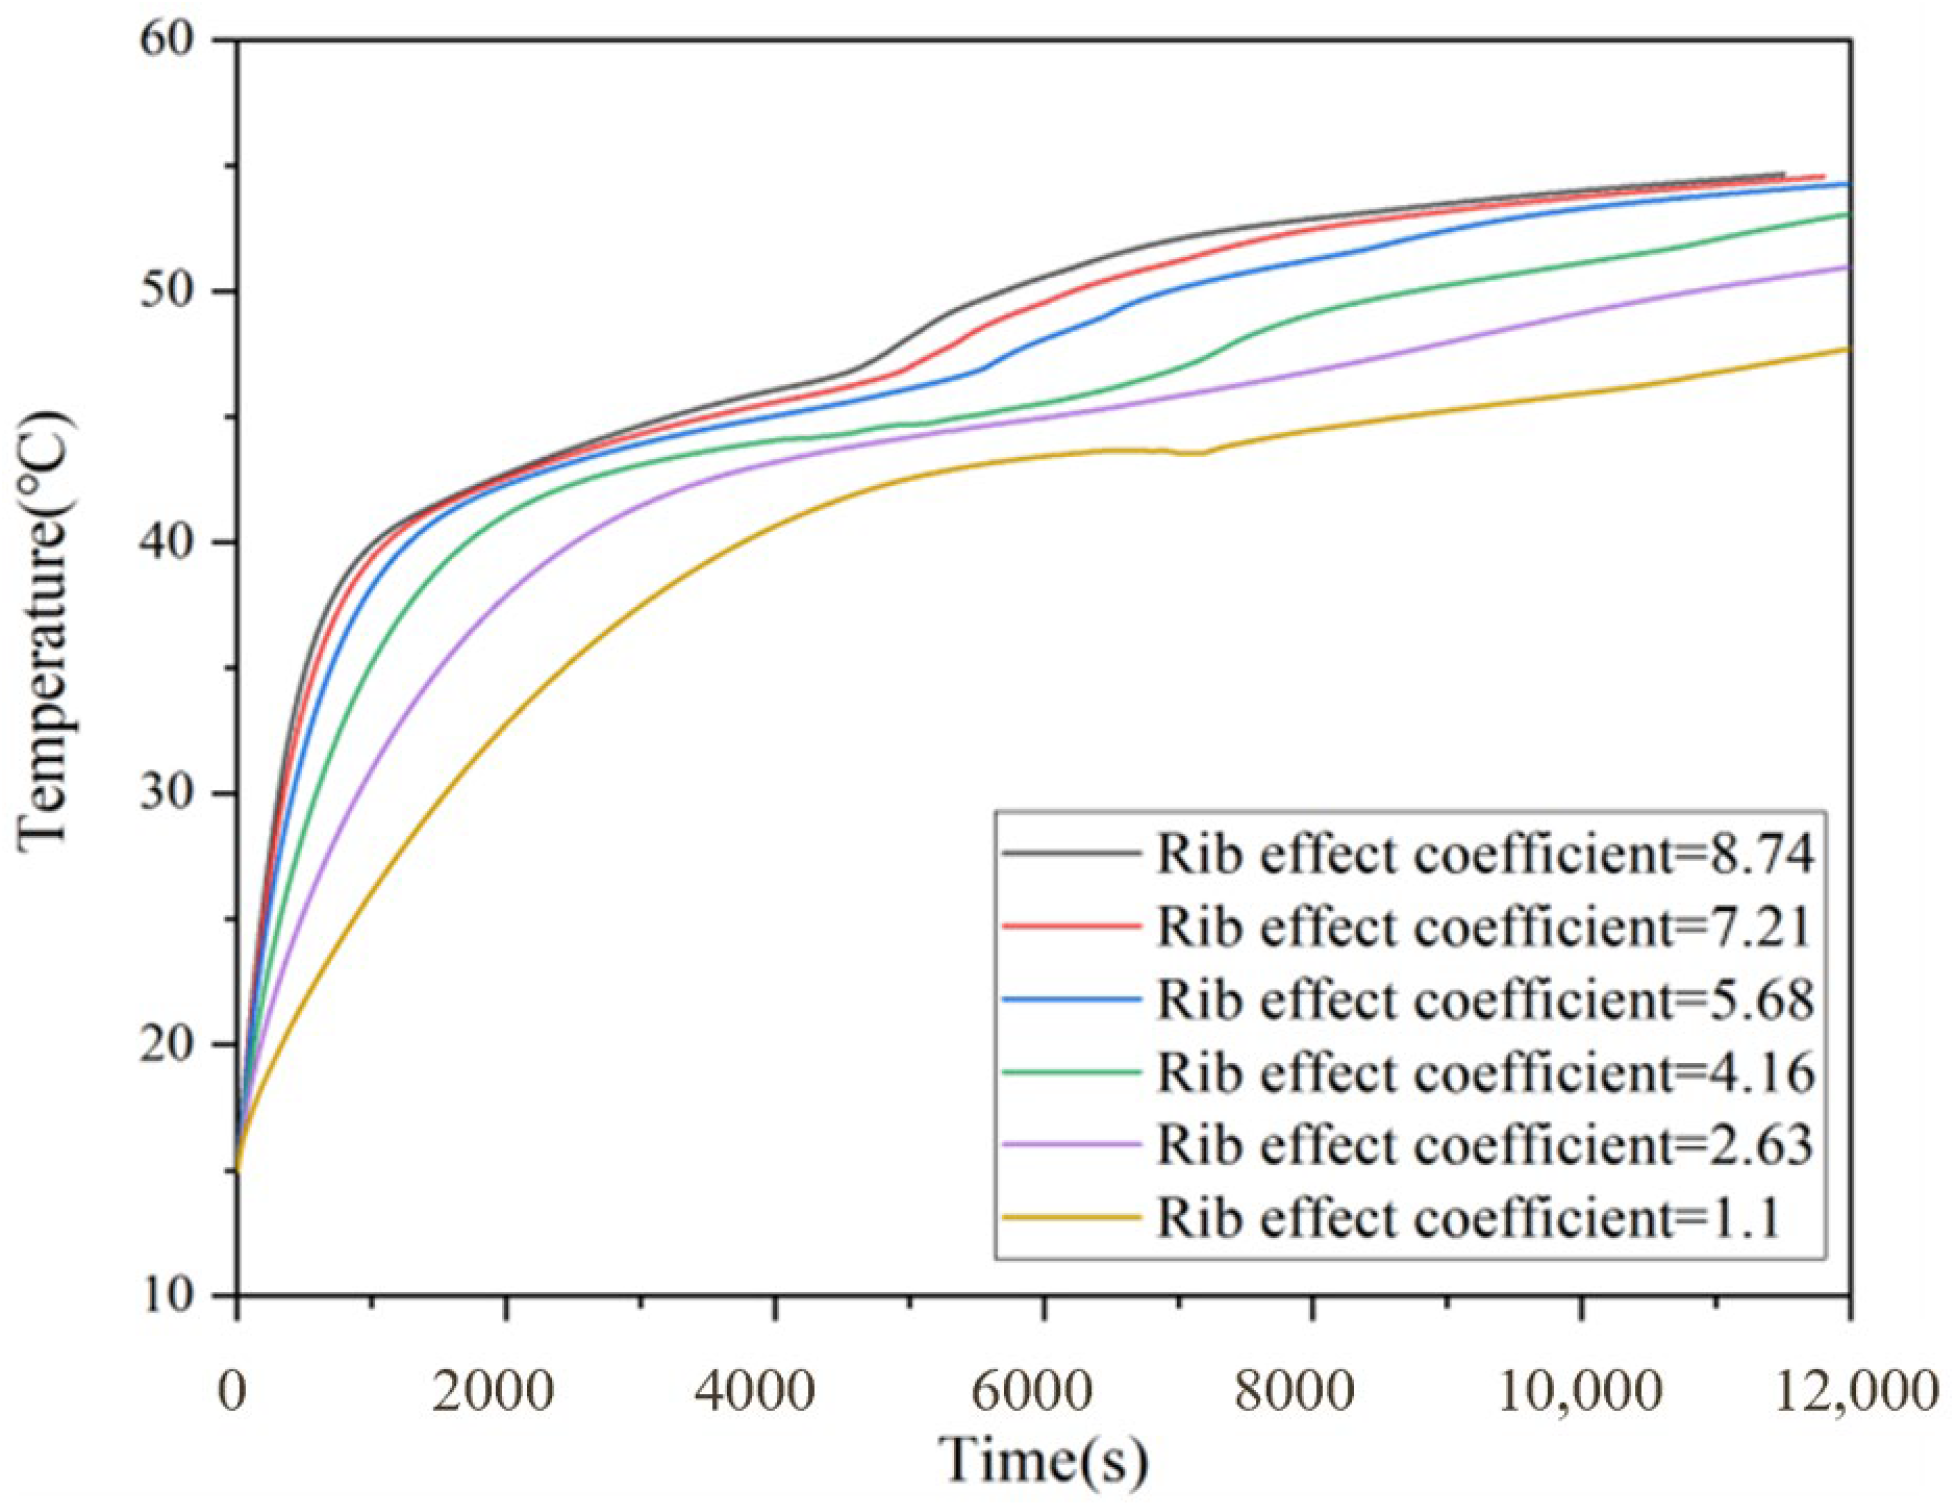
Heat is transferred from the heat carrier to the thermal storage unit. As shown in Figure 8 and Figure 9, during the initial phase, thermal conduction primarily influences the temperature within the storage unit, causing a rapid rise in temperature. Subsequently, phase change gradually becomes the dominant process, resulting in a slower rate of temperature change. During the heat conduction-dominated phase, higher finning coefficients are evident and correlate with greater temperature change rates. The phase change-dominated phase comprises two stages: an initial phase change driven by fin conduction, followed by a phase change induced by convective heat transfer from melting PCM. During this phase, heat storage units with high finning coefficients exhibit a brief, sharp rise in average temperature, accompanied by a sudden decrease in the growth rate of the liquid phase fraction. This transition occurs as the phase change mechanism shifts from fin conduction to convective heat transfer via the molten PCM; the timing of this transition is delayed as the finning coefficient decreases. At a melting duration of 10,000 s, the finning coefficient ranged from 1.1 to 8.74. For each 1.5-unit increase in the finning coefficient, the average temperature within the heat accumulator increased by 1.006%, 0.667%, 0.617%, 0.144% and 0.076%, respectively. The decreasing increments indicate diminishing marginal enhancement as fin density increases. This is because, once a certain threshold is reached, the fins introduce geometric constraints that suppress natural convection pathways within the PCM, preventing the melting rate from increasing rapidly and sustainably. When the ribbing coefficient increased from 1.1 to 5.68, both the growth rate of the liquid phase fraction and the average temperature rise within the heat accumulator increased markedly. Beyond a ribbing coefficient of 5.68, however, both growth rates gradually diminished. The non-monotonic behavior results from the competition between enhanced radial conduction and restricted convection circulation at high fin densities. This suppression effect does not imply an additional hydraulic resistance term in the momentum equations, but rather reflects a geometric limitation imposed by the fin arrangement on natural convection circulation. The observed non-monotonic relationship between the finning coefficient and melting performance therefore results from the competing roles of enhanced conduction and restricted natural convection, as evidenced by the temperature field and liquid fraction evolution shown in Figure 7, Figure 8 and Figure 9. At a melting time of 2000 s, the ribbing coefficient increased from 1.1 to 8.74, with each subsequent increment of approximately 1.5 exhibiting a smaller increase. The increase in the liquid phase fraction of the phase change material also diminished progressively.
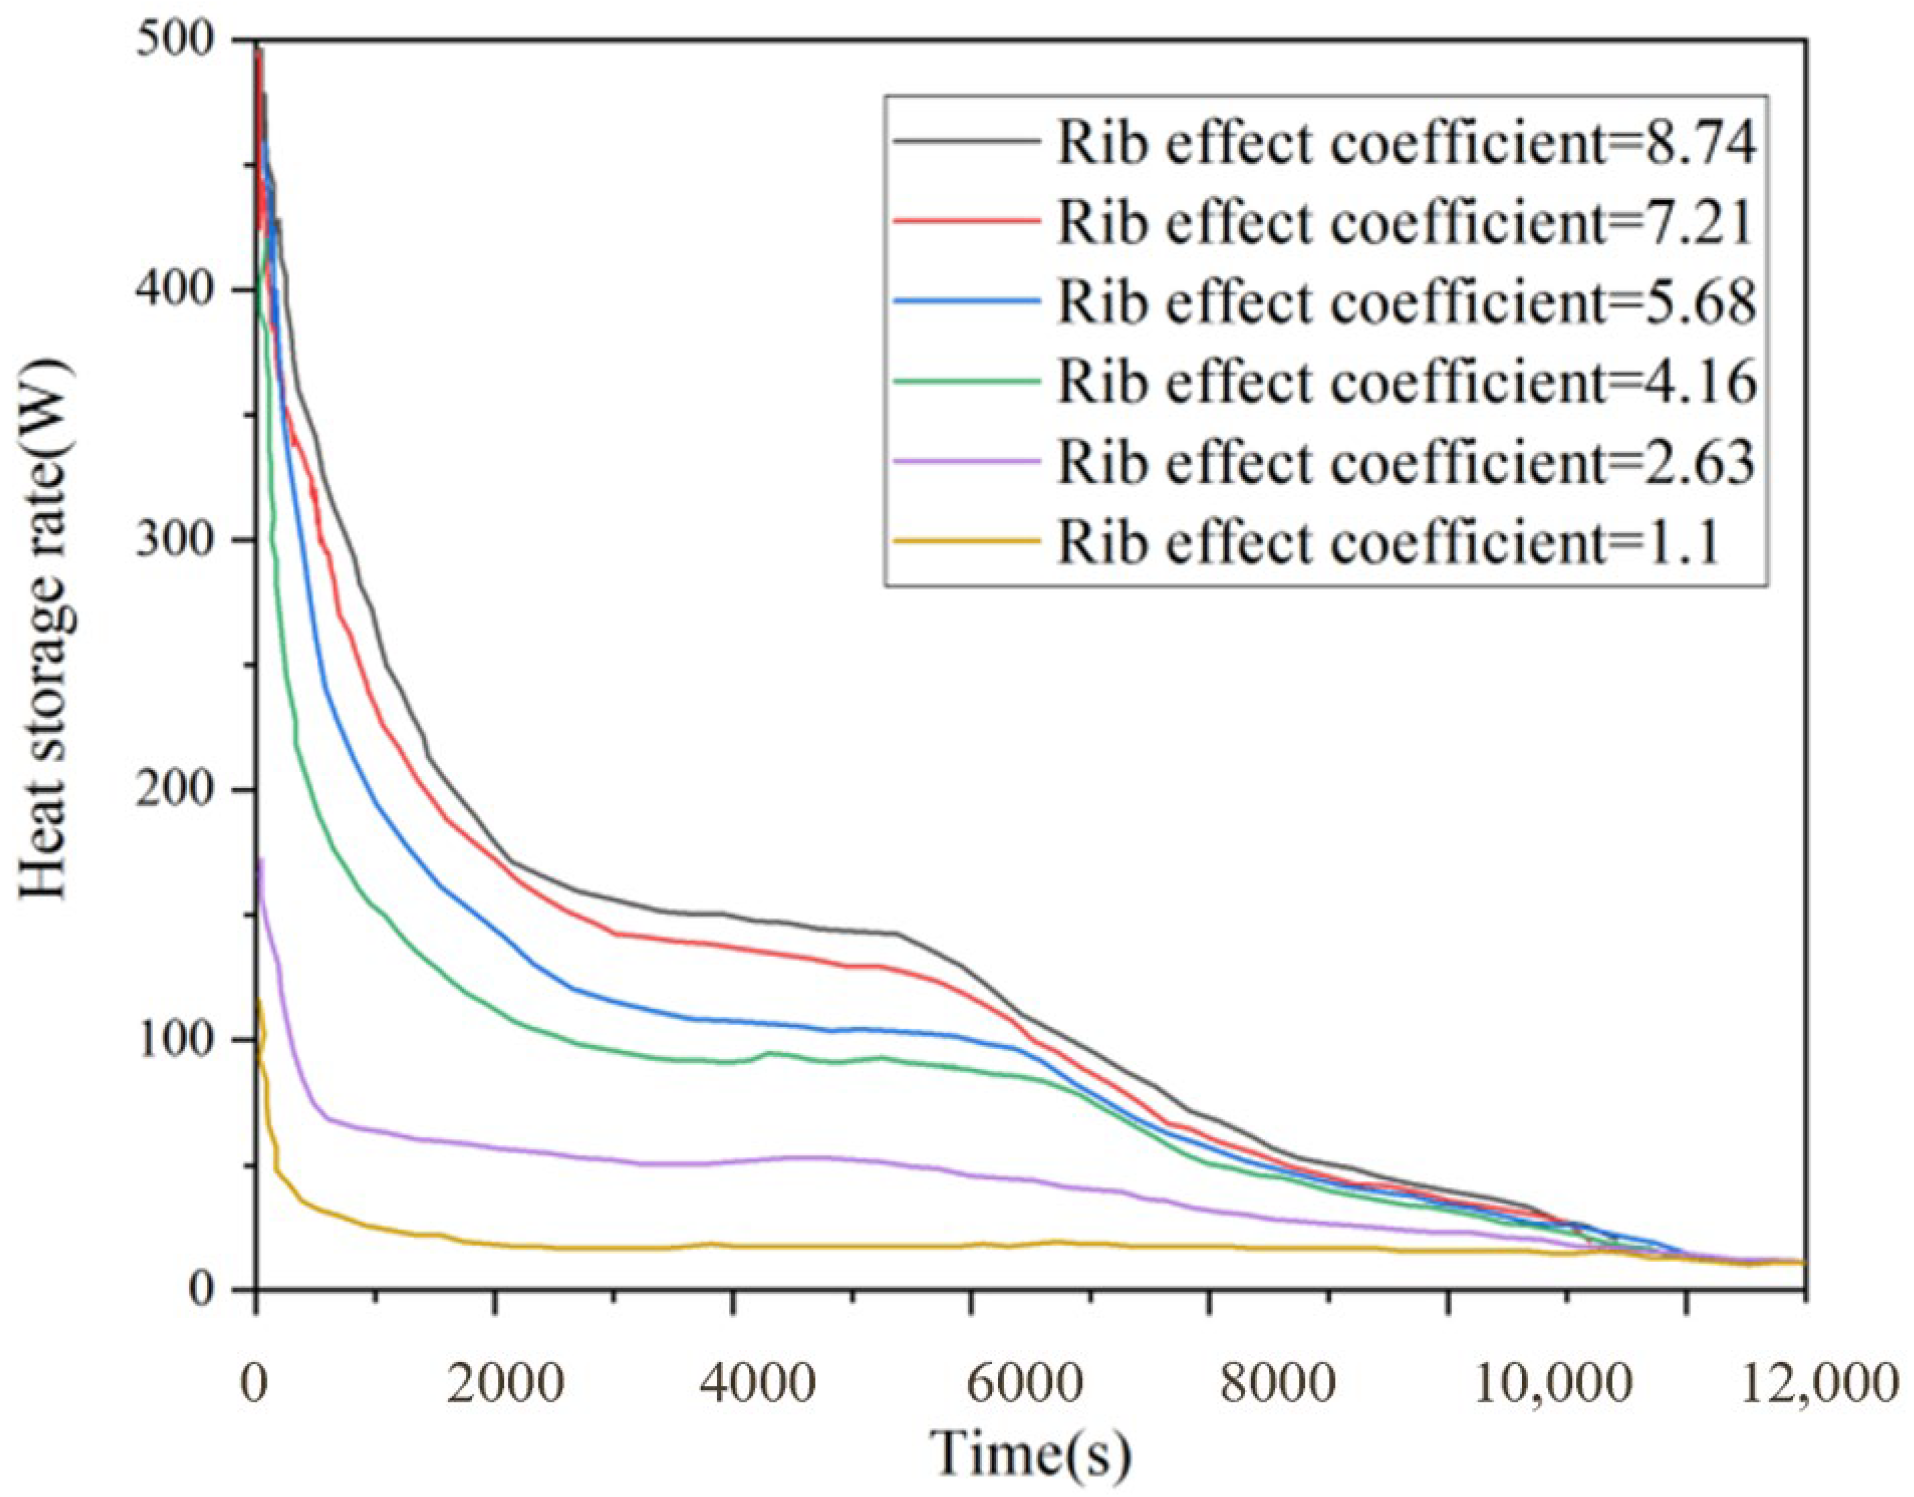
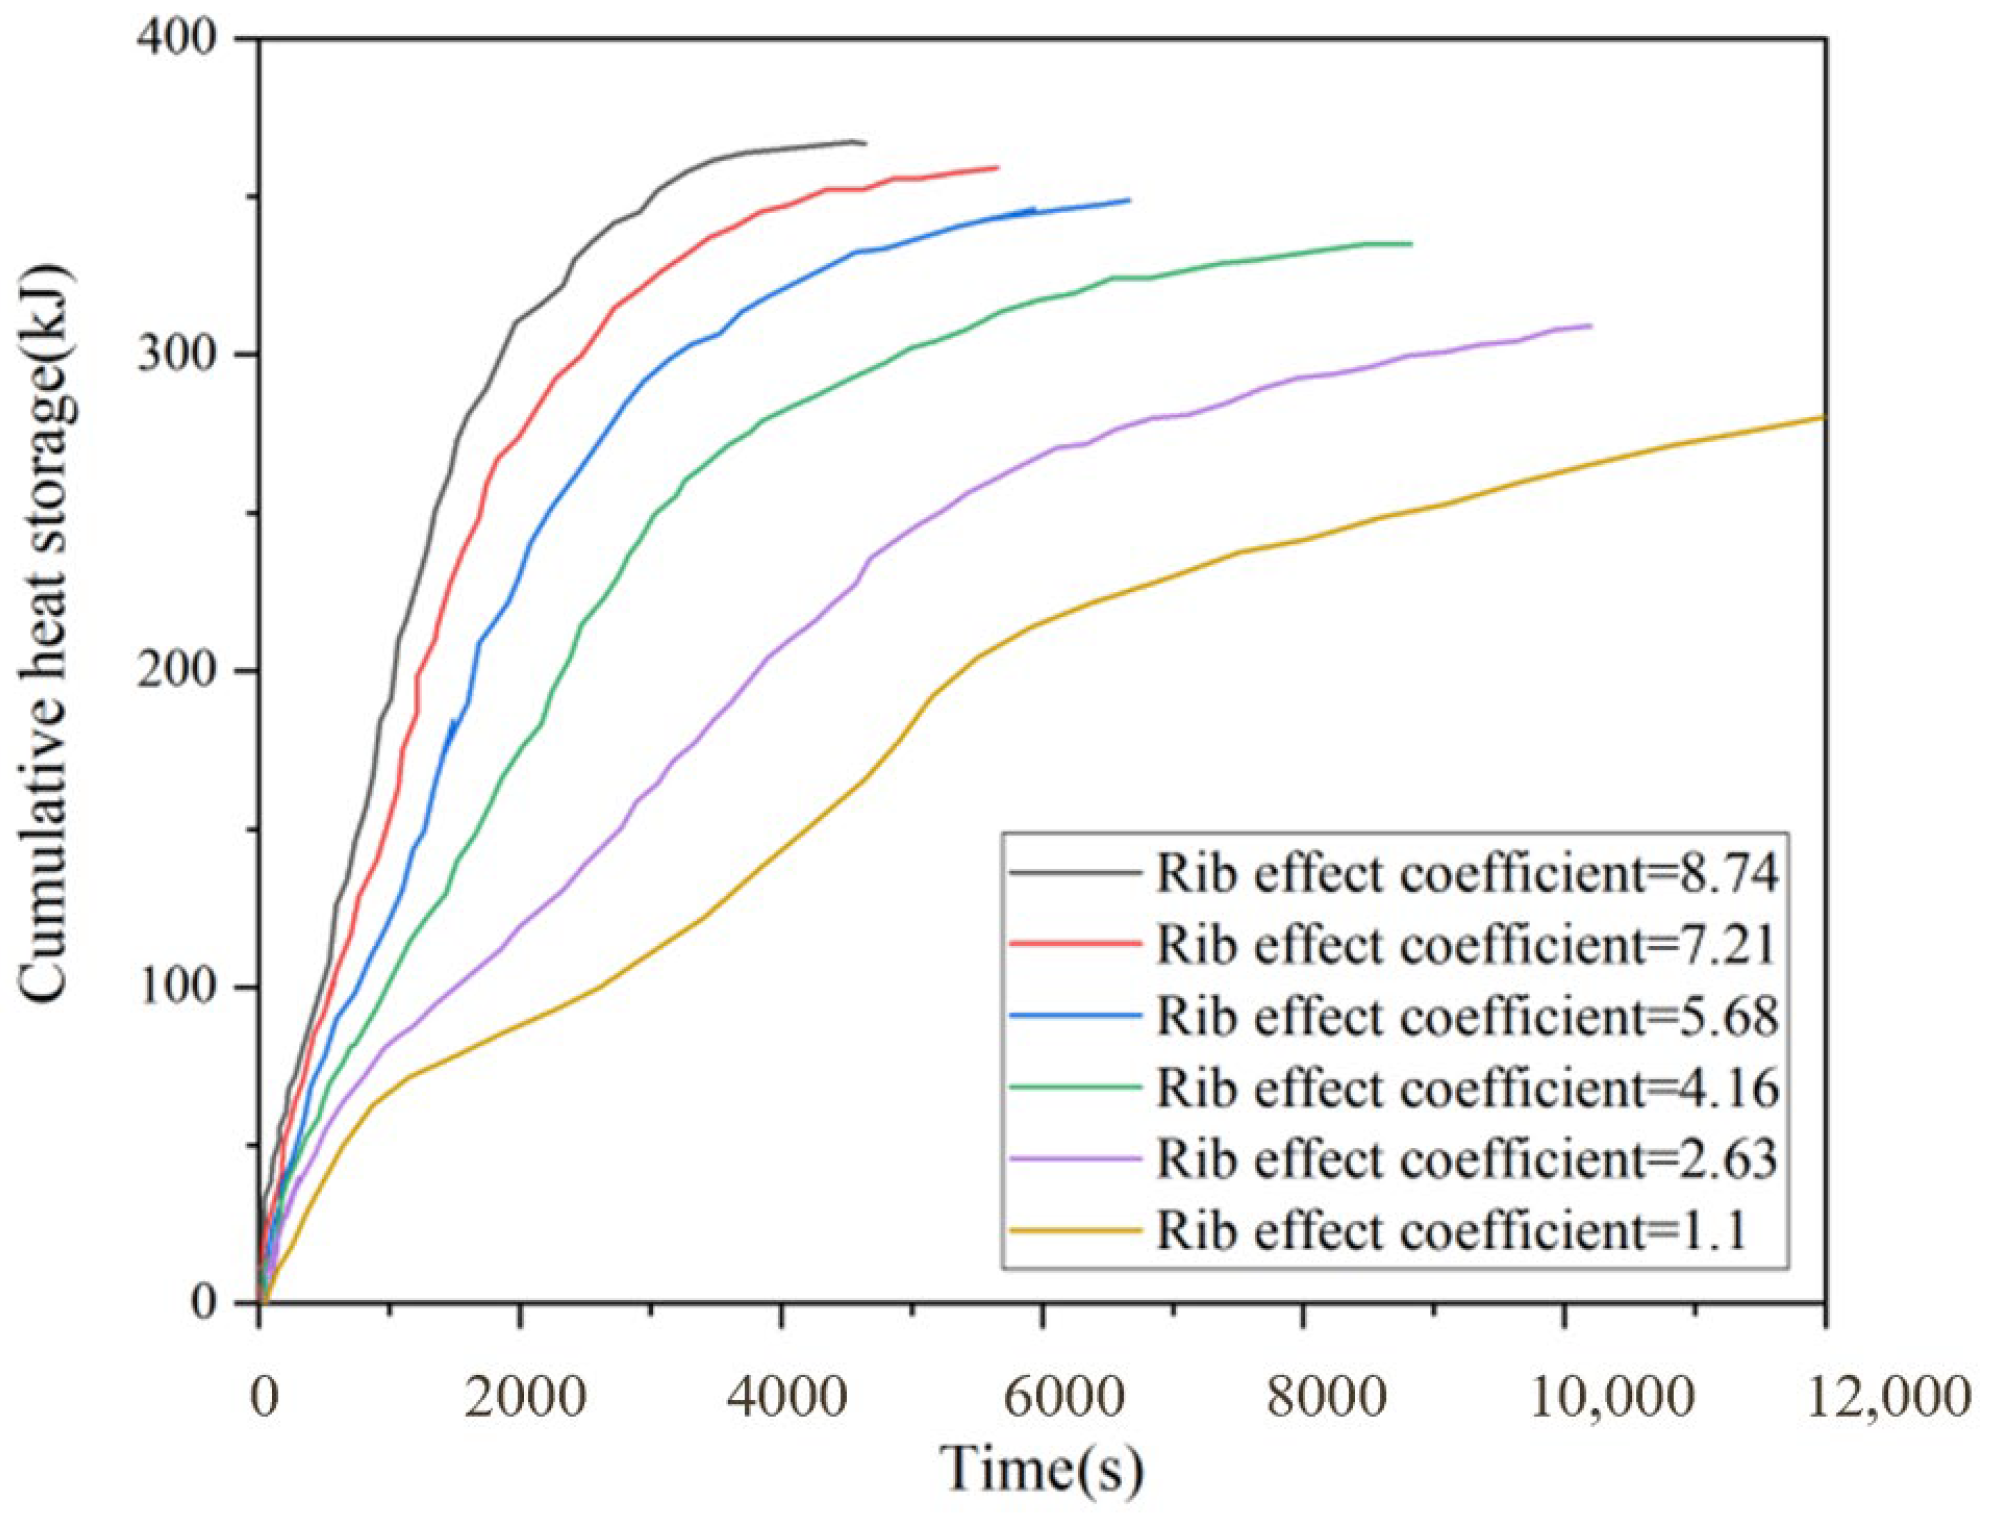
As can be seen from the heat storage rate curve of the phase change material within the accumulator (Figure 10), the accumulator’s heat storage rate decreases rapidly within the first 1000 s due to the swift rise in its average temperature. After 1000 s, when the finning coefficient is below 4.16, the heat storage rate declines gradually. This indicates that, at this finning coefficient, the heat storage efficiency of the phase change process remains unaffected by the heat transfer mode. When the finning coefficient exceeds 4.16, the heat storage rate initially decreases rapidly before stabilizing and then declining slowly, exhibiting the characteristics of the phase change process. Overall, the increase in the heat storage rate decreases progressively as the finning coefficient rises. As shown in Figure 11, the heat storage capacity curve of the phase change material within the accumulator reveals that, at any given time, higher finning coefficients correspond to greater heat storage capacity. Under identical boundary conditions influenced by the heat storage rate, a higher finning coefficient yields a greater rate of increase in heat storage capacity. At t = 2000 s, as the finning coefficient increases from 1.1 to 8.74, the respective increases in heat storage capacity within the phase change material are 36.55%, 43.15%, 25.88%, 16.57% and 12.14%, with each increment of approximately 1.5. This indicates that the rate of increase in heat storage capacity initially rises and then diminishes as the finning coefficient increases. The maximum increase in heat storage capacity occurs when the finning coefficient rises from 2.63 to 4.16. Accordingly, the range of 4.16–5.68 represents an optimal balance between conduction enhancement and preservation of natural convection. Taking into account practicality and economic viability, preliminary conclusions suggest that the optimal range for the finning coefficient is between 4.16 and 5.68.
Figure 11 and Figure 12 show how the liquid fraction is distributed within unfinned and finned heat storage tanks during the melting process of the PCM, when the HTF temperature is set at 50 °C. Melting proceeds from conduction-dominated heating to convection-assisted transport. The simulation results are similar to those in Figure 8, with melting commencing around the heat exchange tube. However, due to natural convection occurring in the direction of gravity, the thickness of the liquid region increases more rapidly towards the top. As shown, the surface temperature decreases in the axial direction of the fins and the PCM melts faster at the base of the fins (near the heat exchange tube) than at their tips because conduction is the main heat transfer mechanism in this direction. After 110 min of melting in the finless accumulator, 52% of the total PCM in the container had melted; adding fins increased this figure to 83%.

3.2. Effect of Inlet Temperature

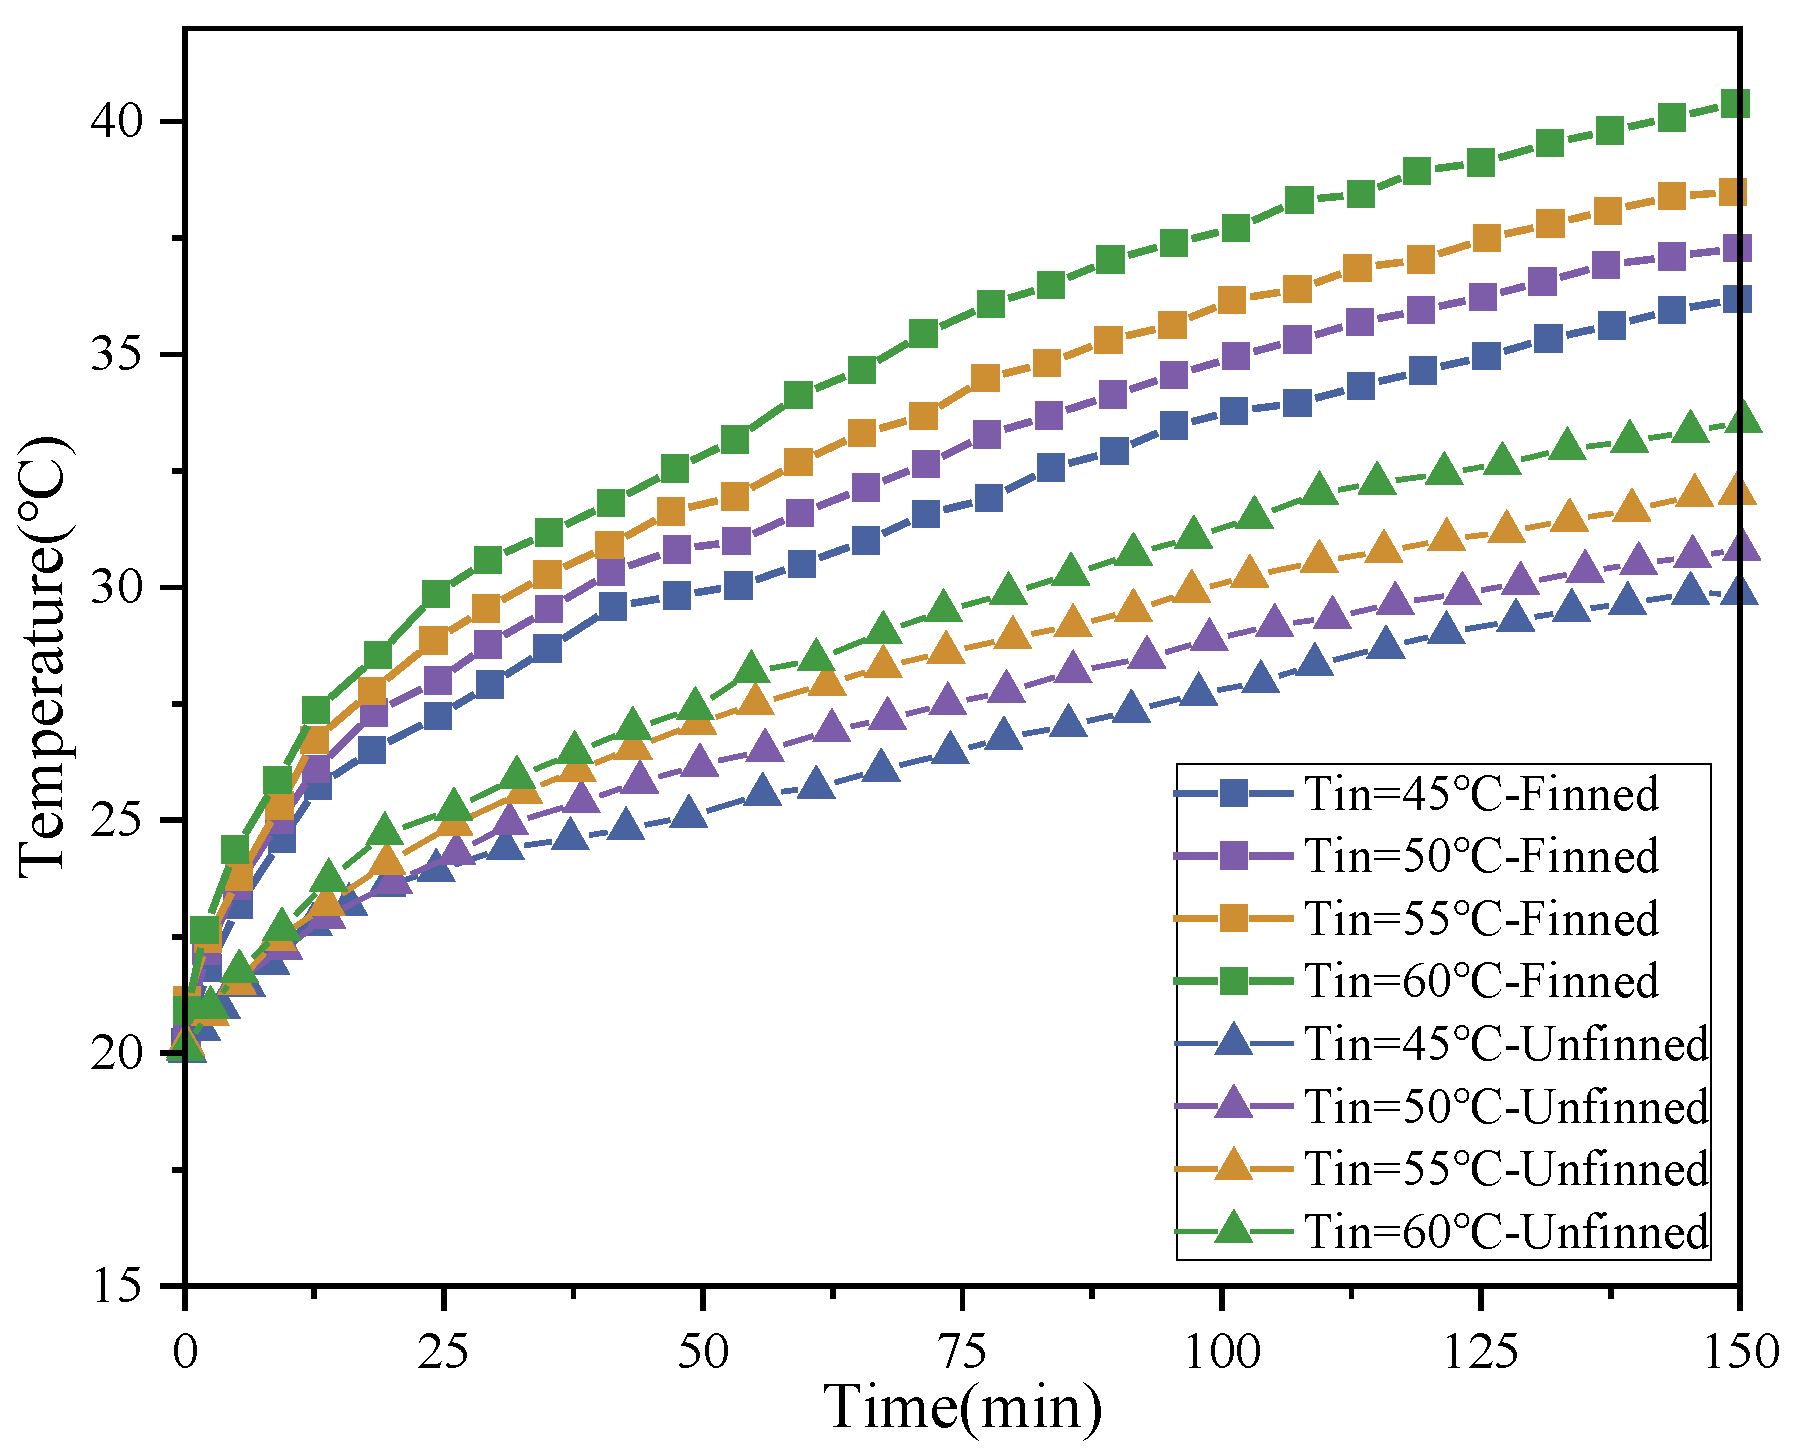
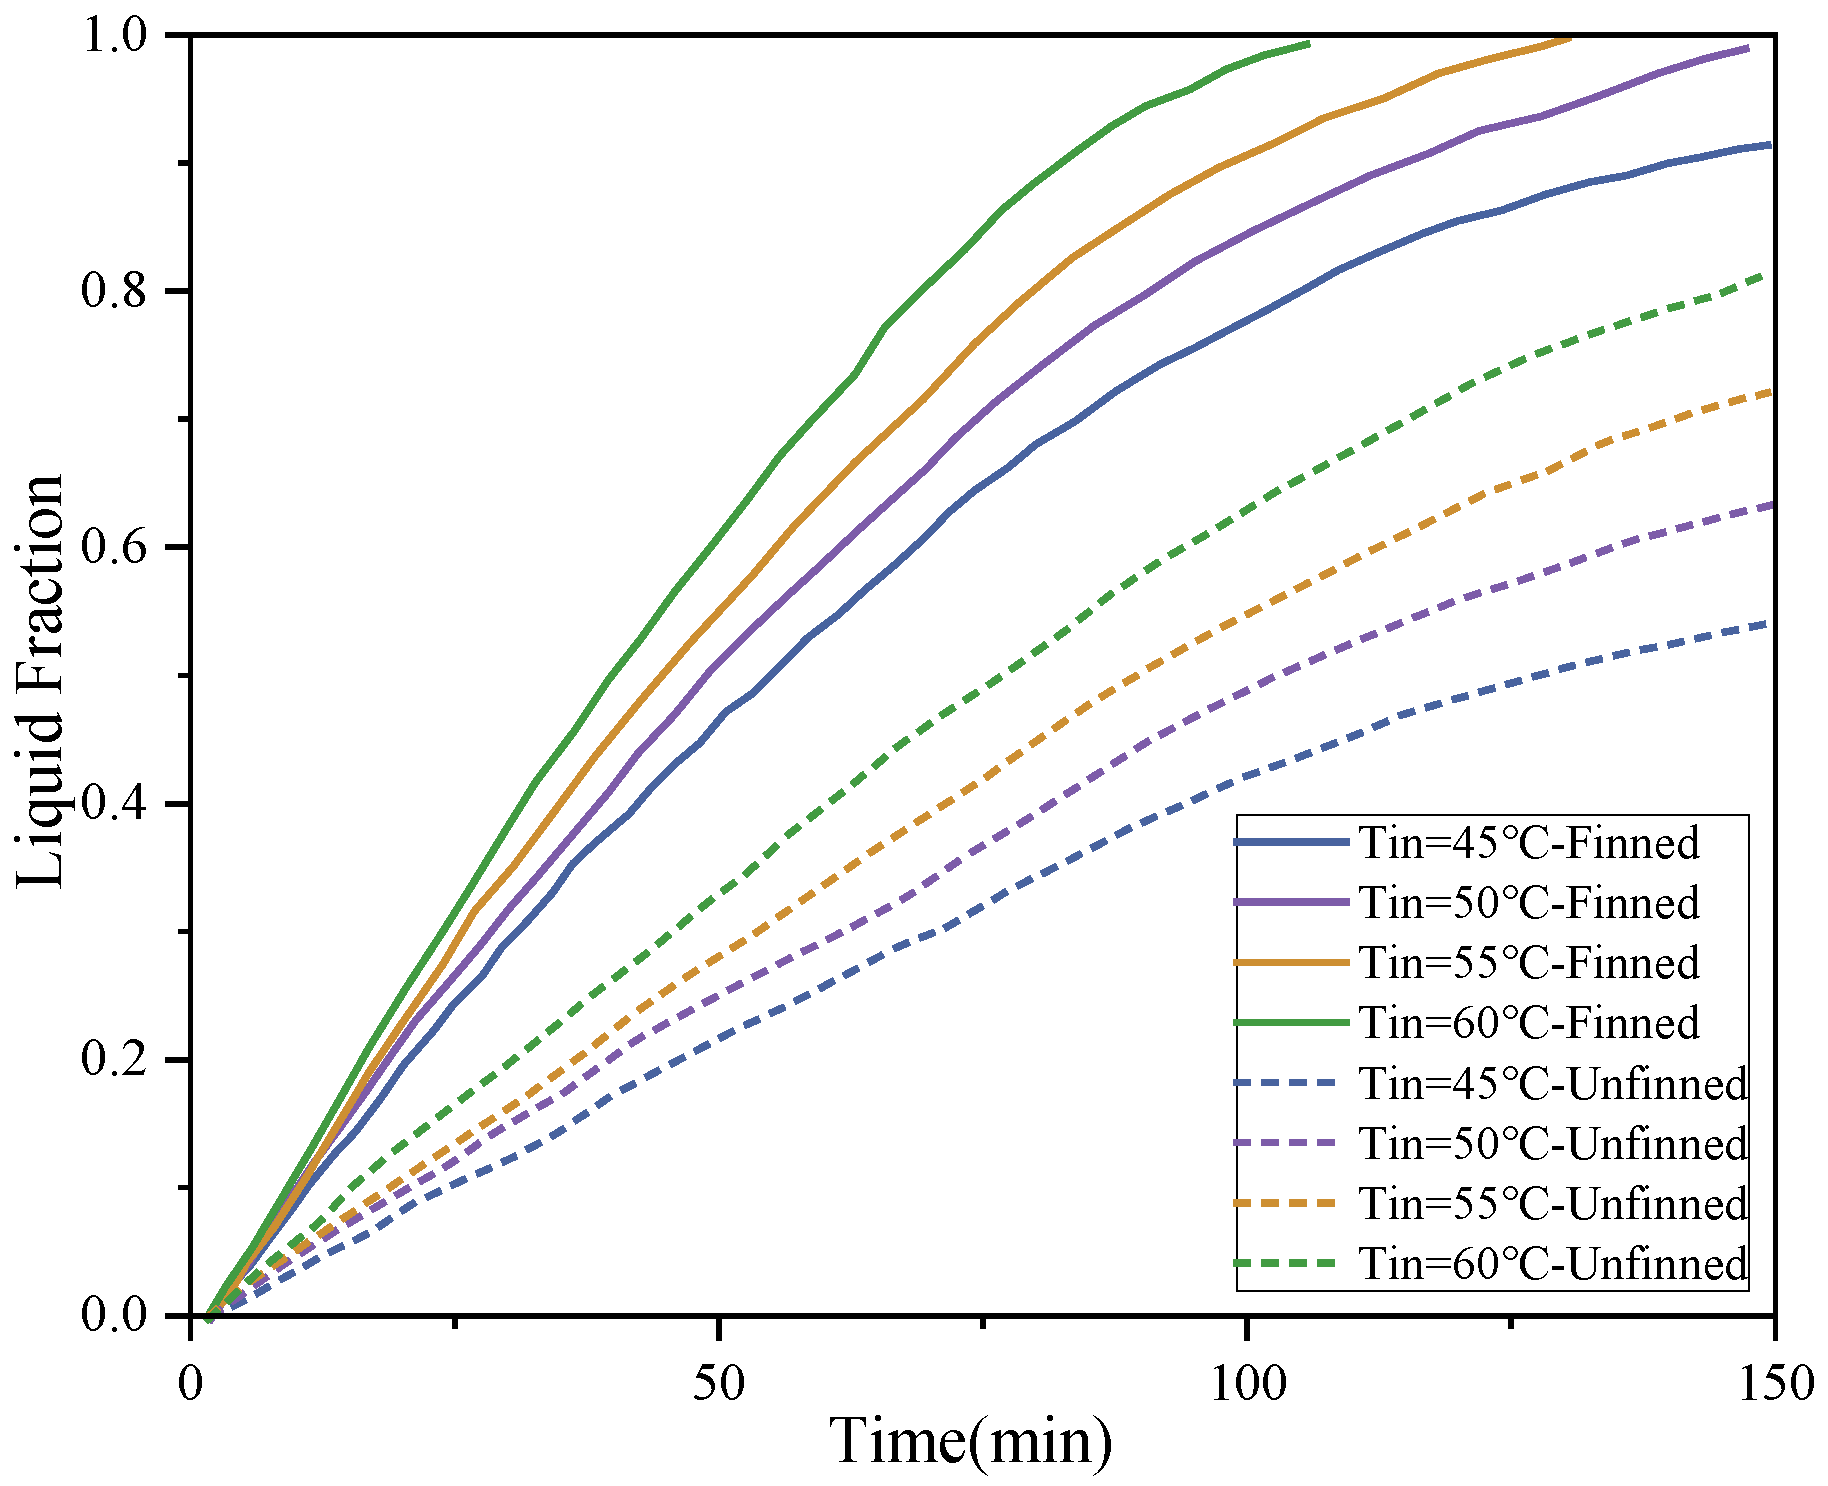
In terms of the supply water temperature of the air-source heat pump heating system, Figure 12 was selected to illustrate the comparison of the average temperature and liquid phase fraction of the PCM during the heat storage process, with inlet HTF temperatures of Tin = 45 °C, 50 °C, 55 °C and 60 °C and a constant flow rate of 3 L/min. The overall average temperature within the system was calculated using a Fluent simulation, with monitoring points positioned identically to those in Figure 5. The temperature curves reveal three distinct states during PCM melting, culminating in an increase in temperature. Increasing inlet temperature strengthens the thermal driving force and accelerates the overall melting process. Consequently, increasing the HTF inlet temperature reduces PCM melting duration. Figure 13 shows the liquid phase fraction of the PCM over time at various inlet temperatures. Unlike structural modification discussed in Section 3.1, variation in inlet temperature does not alter the internal flow topology but changes the magnitude of the temperature difference. The results show that altering the HTF inlet temperature has a significant impact on overall heat transfer. Calculations based on data from 1.5 h after the onset of the melting process show that raising the HTF temperature from 45 °C to 60 °C increased the liquid phase fraction of the PCM by 22% in the unfinned accumulator and by 33% in the finned accumulator.
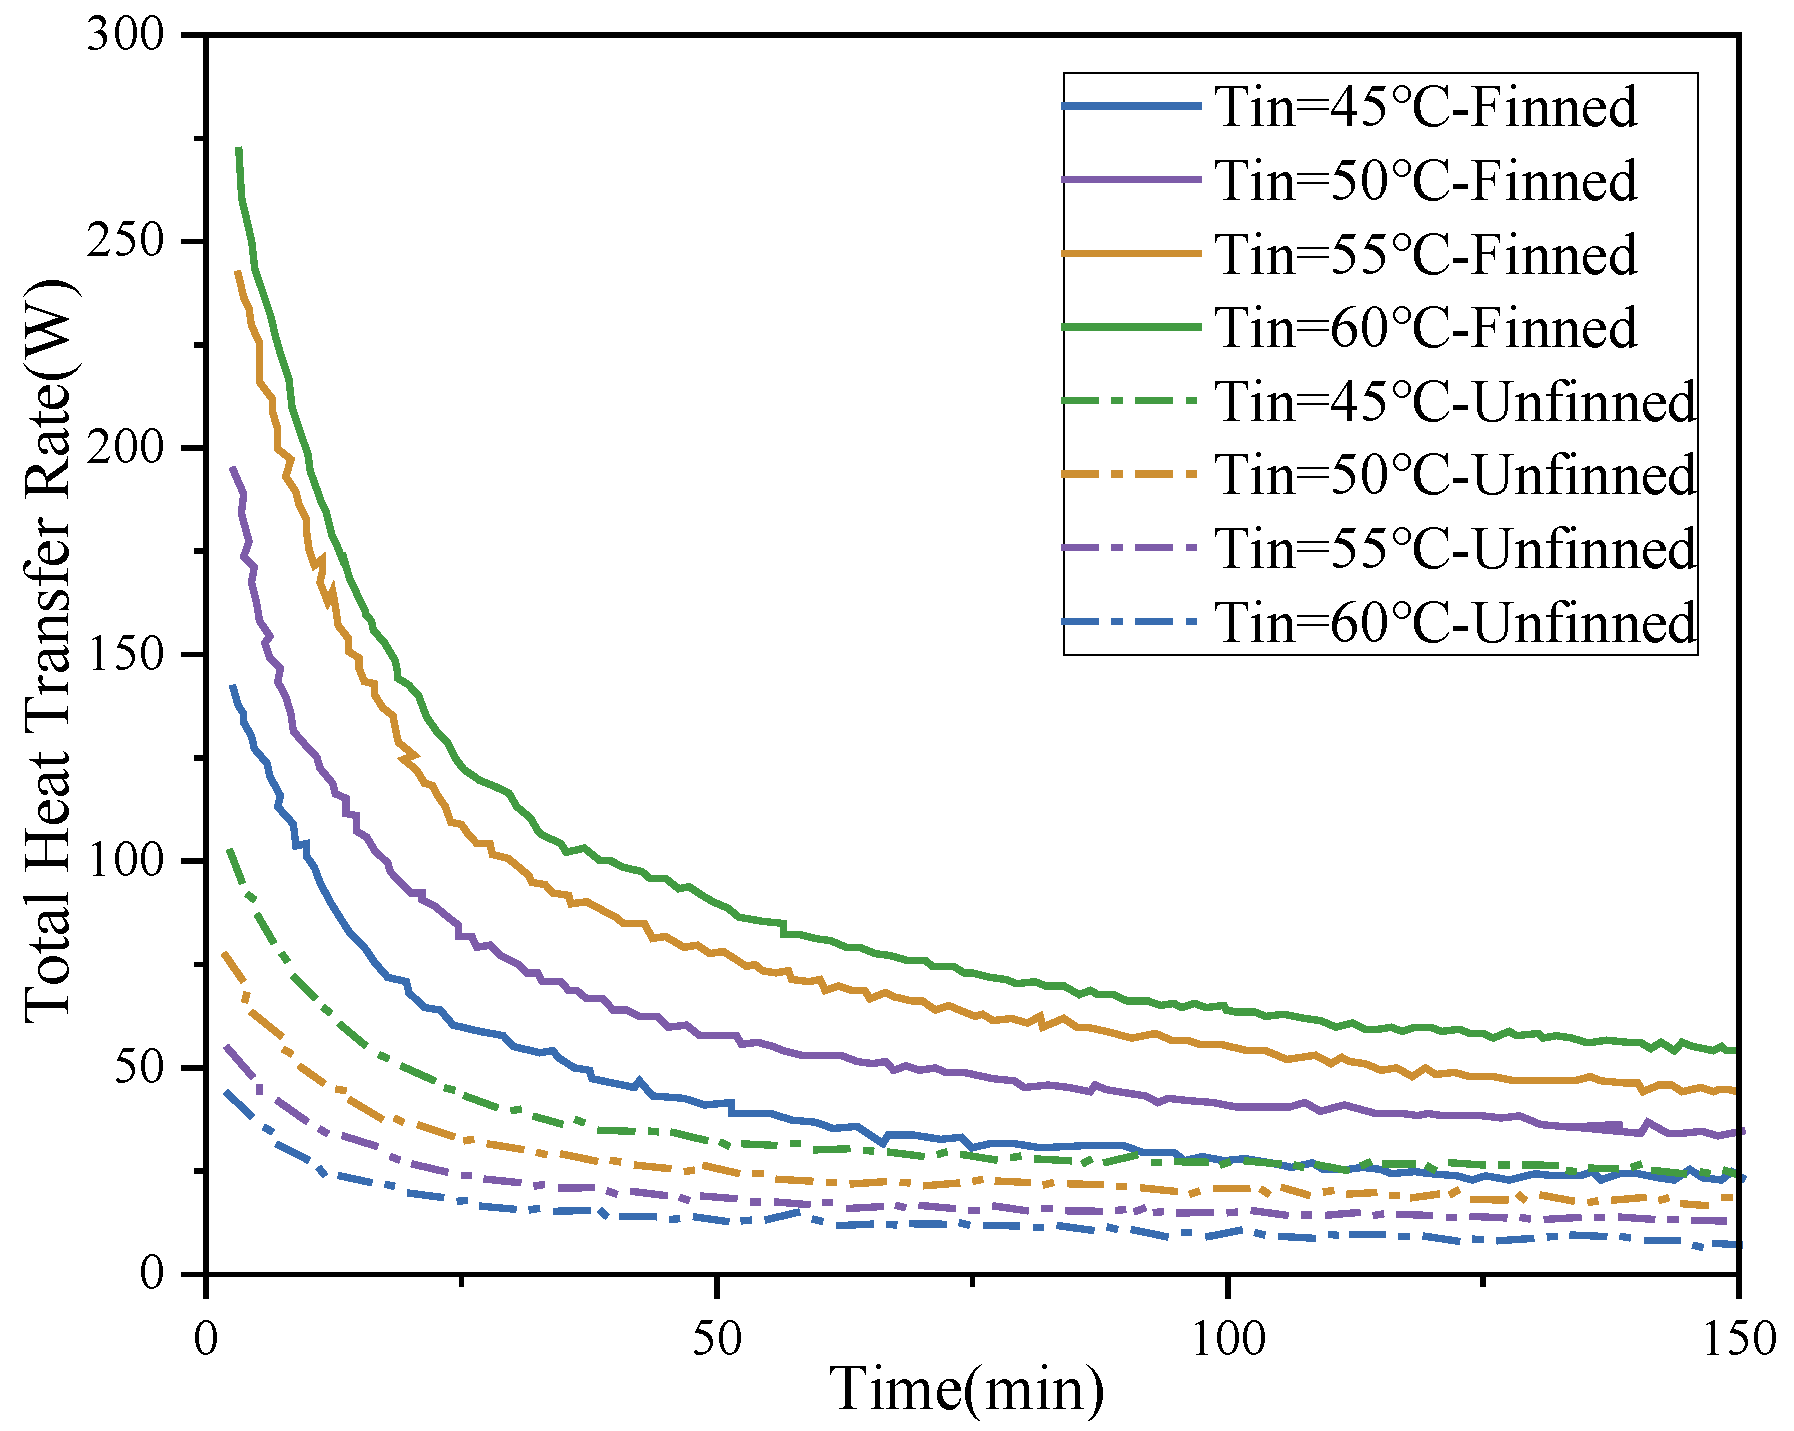
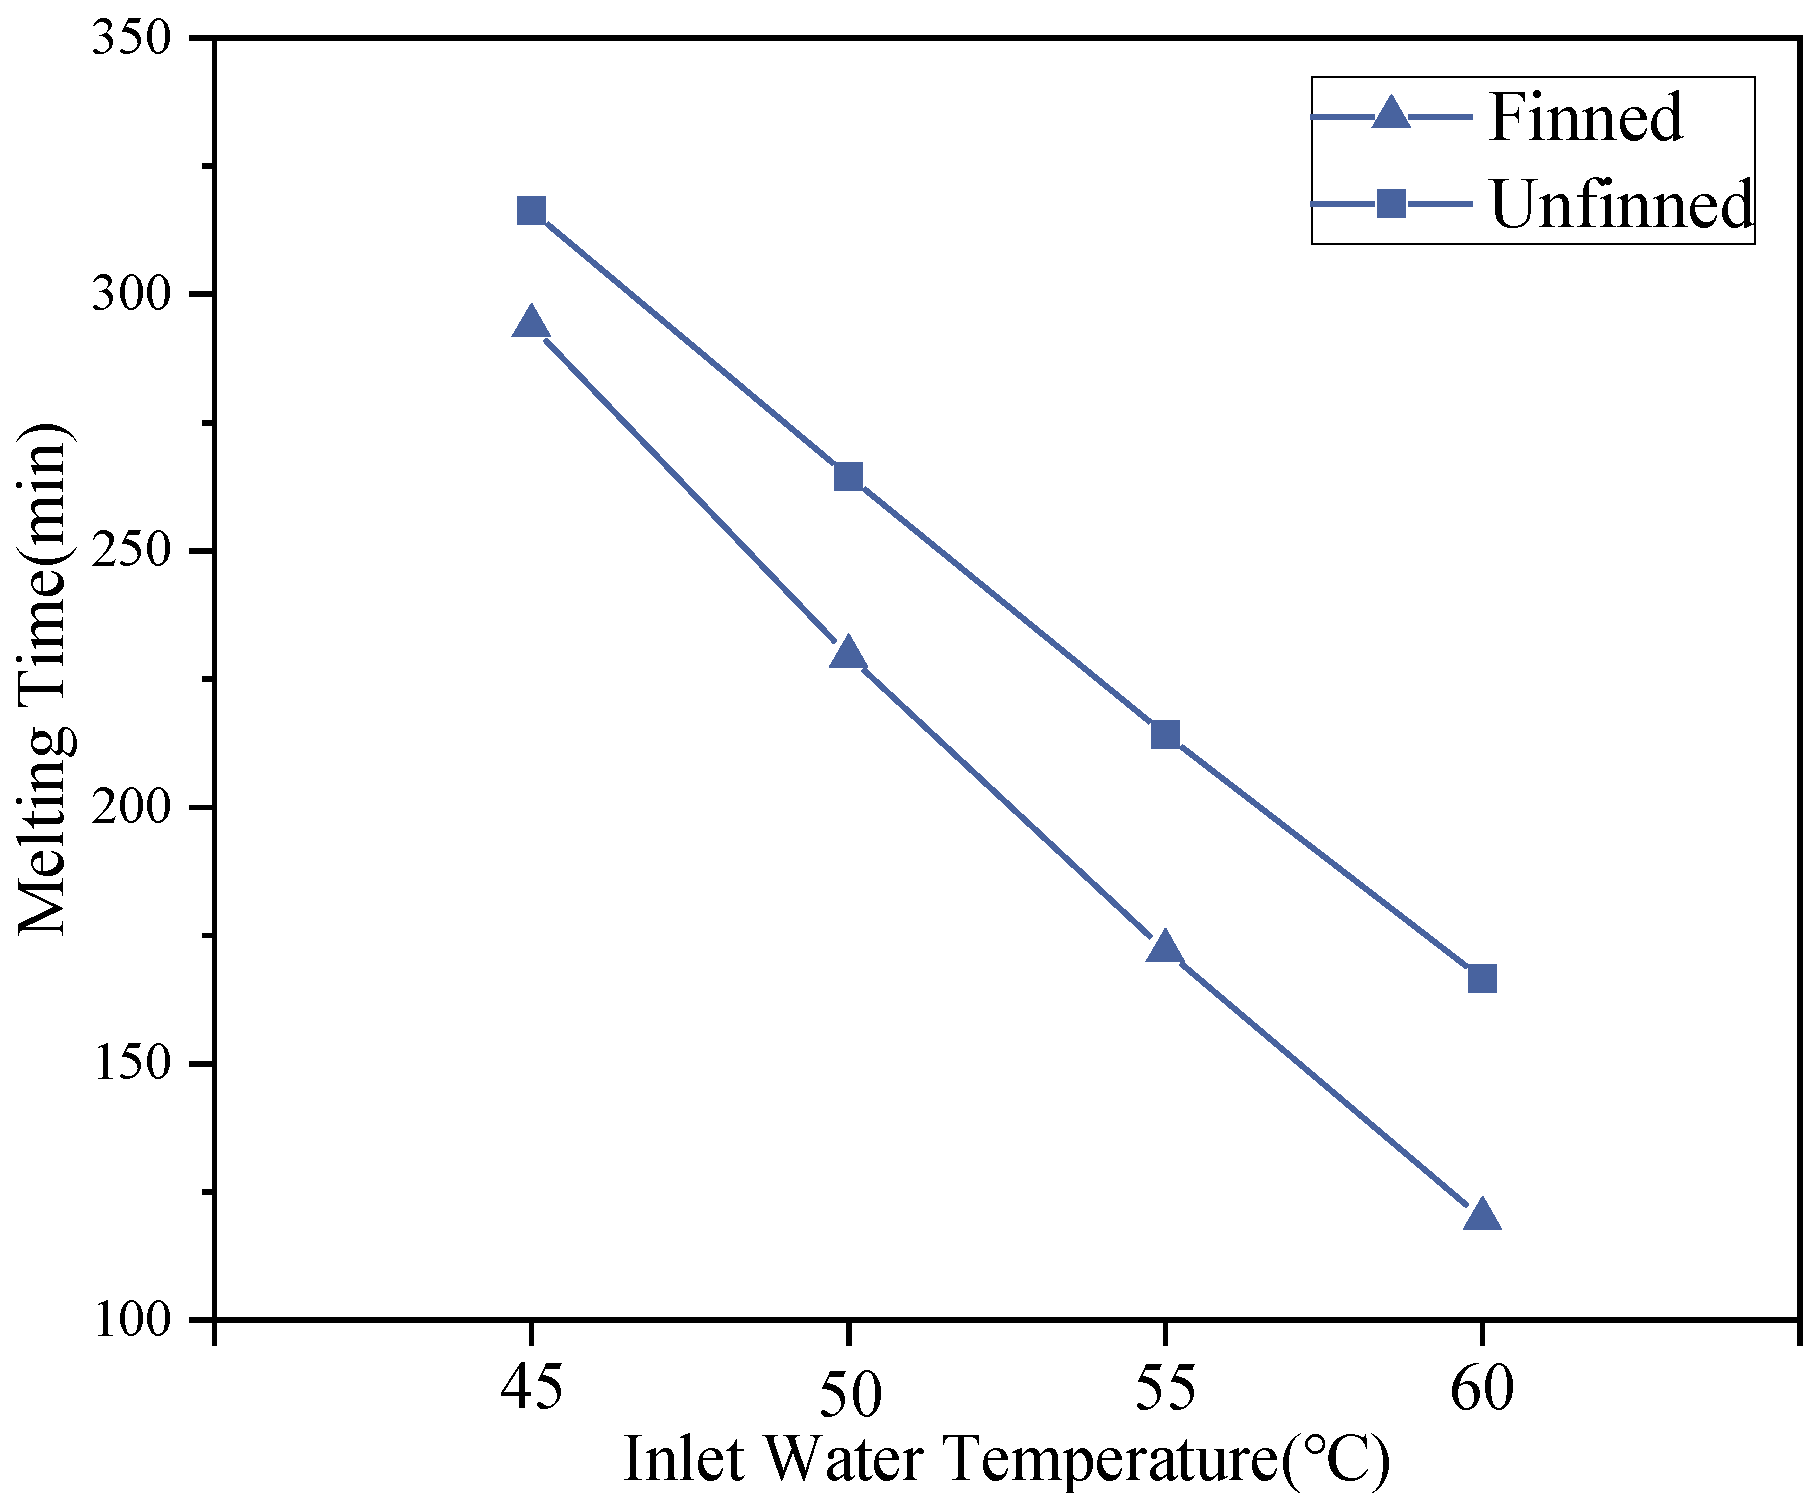
Figure 14 shows the heat transfer rate of the thermal storage unit during the heat storage process. Initially, the heat transfer rate is at its maximum due to the large temperature difference between the water and the PCM. Subsequently, as the PCM temperature gradually approaches that of the water, the heat power decreases progressively. Under identical inlet temperature conditions, the finned unit maintains a higher heat transfer rate due to enhanced conduction pathways. Figure 15 shows the time taken for full PCM melting, expressed as the inlet temperature of the heat accumulator. When the inlet water temperature increases from 45 °C to 60 °C, it can be seen that the total melting time decreases by 47% for the unfinned accumulator and by 59% for the finned accumulator.
Experimental data was collated, in which the inlet temperature was varied and the time required for complete PCM melting was measured at each temperature. A statistical analysis method involving polynomial fitting was employed to analyze the data. The fitted formula was then applied to new inlet temperature values to validate its accuracy. Calculations confirmed that the fitted formula accurately predicted the new data, thereby establishing its reliability. Table 2 presents the fitted formula for the time required for PCM to fully melt within the finned heat accumulator at different inlet temperatures, with and without fins.
The proposed polynomial correlations for predicting the PCM melting time are empirical in nature and were derived by fitting experimental and numerical data within a limited inlet temperature range of 45–60 °C. Within this range, the correlations exhibit good agreement with the measured melting times and are intended to provide a convenient engineering tool for preliminary design and performance estimation.
It should be noted that the coefficients in the fitted equations do not represent fundamental physical parameters, but rather reflect the combined effects of heat transfer conditions, material properties, and geometric configuration of the thermal storage unit. Therefore, extrapolation beyond the investigated temperature range or application to different geometries and PCM systems should be performed with caution. For conditions outside the present range, additional calibration or re-fitting based on corresponding experimental or numerical data is required.

3.3. Techno-Economic Considerations

Although the primary objective of this study is to investigate heat transfer enhancement and structural optimization, a brief techno-economic assessment is provided to contextualize the engineering applicability of the findings. The incorporation of longitudinal fins inevitably increases manufacturing complexity and material costs due to additional machining requirements and extended heat transfer surface area. However, the experimental and numerical results demonstrate that fin-enhanced structures reduce PCM melting time by 47–59% compared to unfinned configurations. This performance gain enables two potential system-level economic benefits: (i) reduction in storage unit volume or quantity for equivalent thermal capacity, thereby decreasing footprint and installation costs; (ii) shortened system operation duration or reduced heat pump cycling frequency, which may lower operational energy consumption and equipment wear. Compared with increasing EG mass fraction—which may reduce latent heat capacity and introduce material compatibility issues—structural optimization improves heat transfer while preserving thermophysical properties. The optimal finning coefficient range of 4.16–5.68 identified in this study represents a balanced design point where heat transfer enhancement is maximized without excessive manufacturing burden. The identified optimal range provides a practical compromise between thermal performance and manufacturing cost. Detailed life-cycle cost modeling and multi-objective optimization incorporating specific manufacturing processes and regional economic parameters are beyond the scope of this study and will be addressed in future work.

4. Experimental Verification of the Function of Unit Heat Storage Tank Fins

4.1. Experimental System

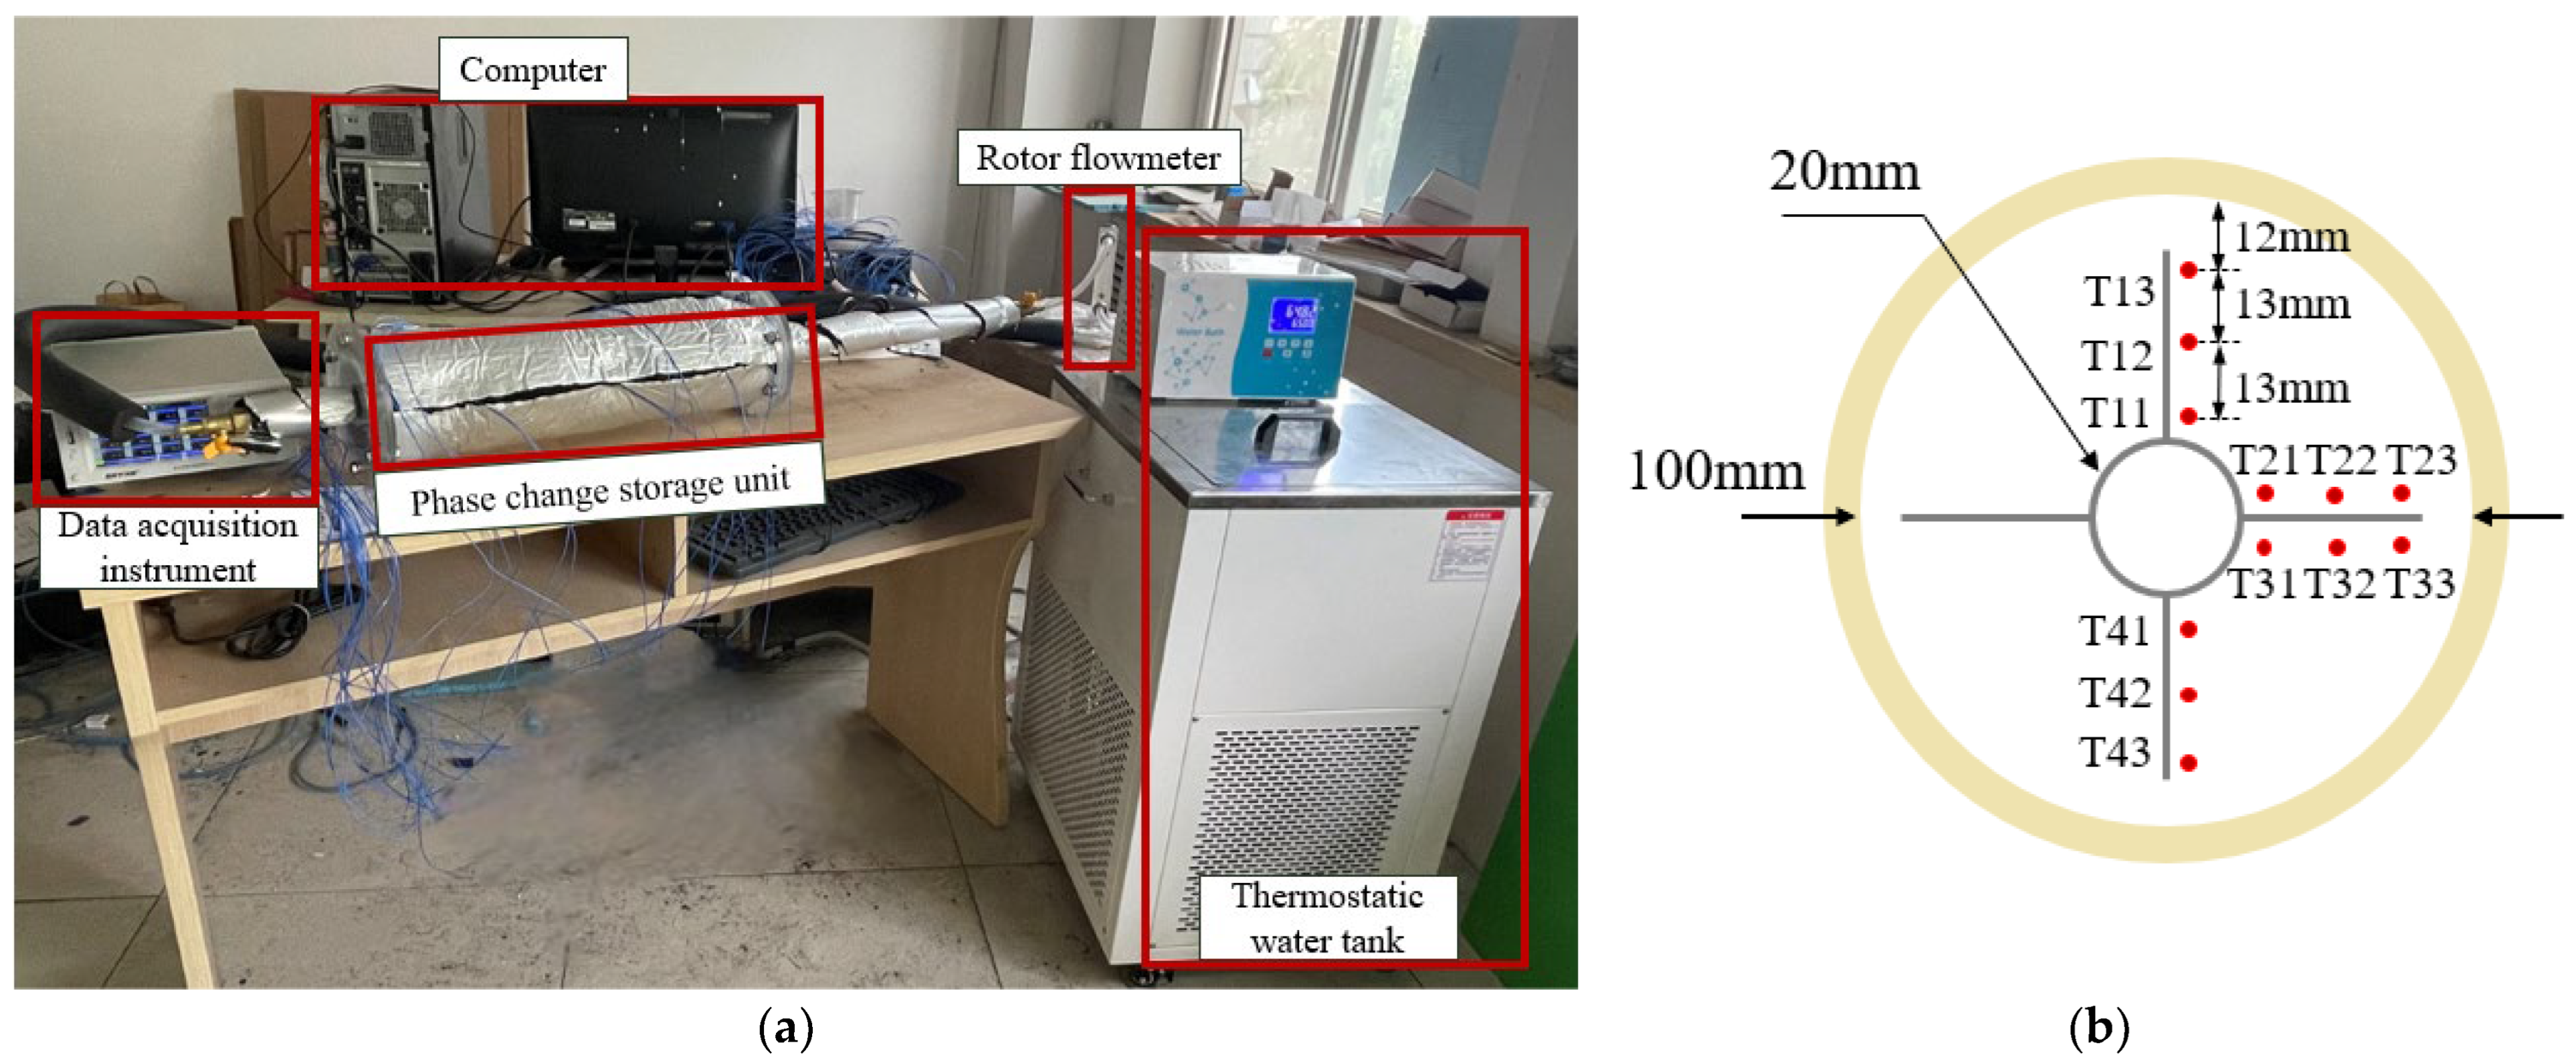
The system comprises a constant-temperature water tank, a heat storage unit, a data acquisition instrument and a computer. Figure 16a illustrates its experimental setup. The system operates in both heat storage and heat release modes. In heat storage mode, the constant-temperature water tank acts as a heat source, heating the phase change material within the accumulator to achieve thermal storage. In heat release mode, the low-temperature water tank acts as the cold source, cooling the phase change material and enabling heat dissipation. This thesis primarily investigates the heat storage process within the accumulator.
A Type K thermocouple is positioned within the heat accumulator and connected to a data acquisition instrument, which records temperatures at various points during the phase transition process. A rotor flowmeter with a measurement accuracy of 0.02 L/min is connected to regulate and record the mass flow rate of the heat transfer fluid. Figure 16b shows where the thermocouples are located inside the heat accumulator. It also shows the radial distances between each thermocouple and the outer wall of the heat transfer tubes. The number 1 in T12 shows the first angle and the number 2 shows the second radial position. Additionally, two thermocouples are positioned at the inlet and outlet of the heat exchange tubes to measure the temperatures of the heat transfer fluid at the inlet and outlet. The outer surface of the heat accumulator is insulated with 20 mm thick, double-sided aluminum foil insulation batting to prevent heat loss to the surrounding environment.

4.2. Numerical Model and Method Validation

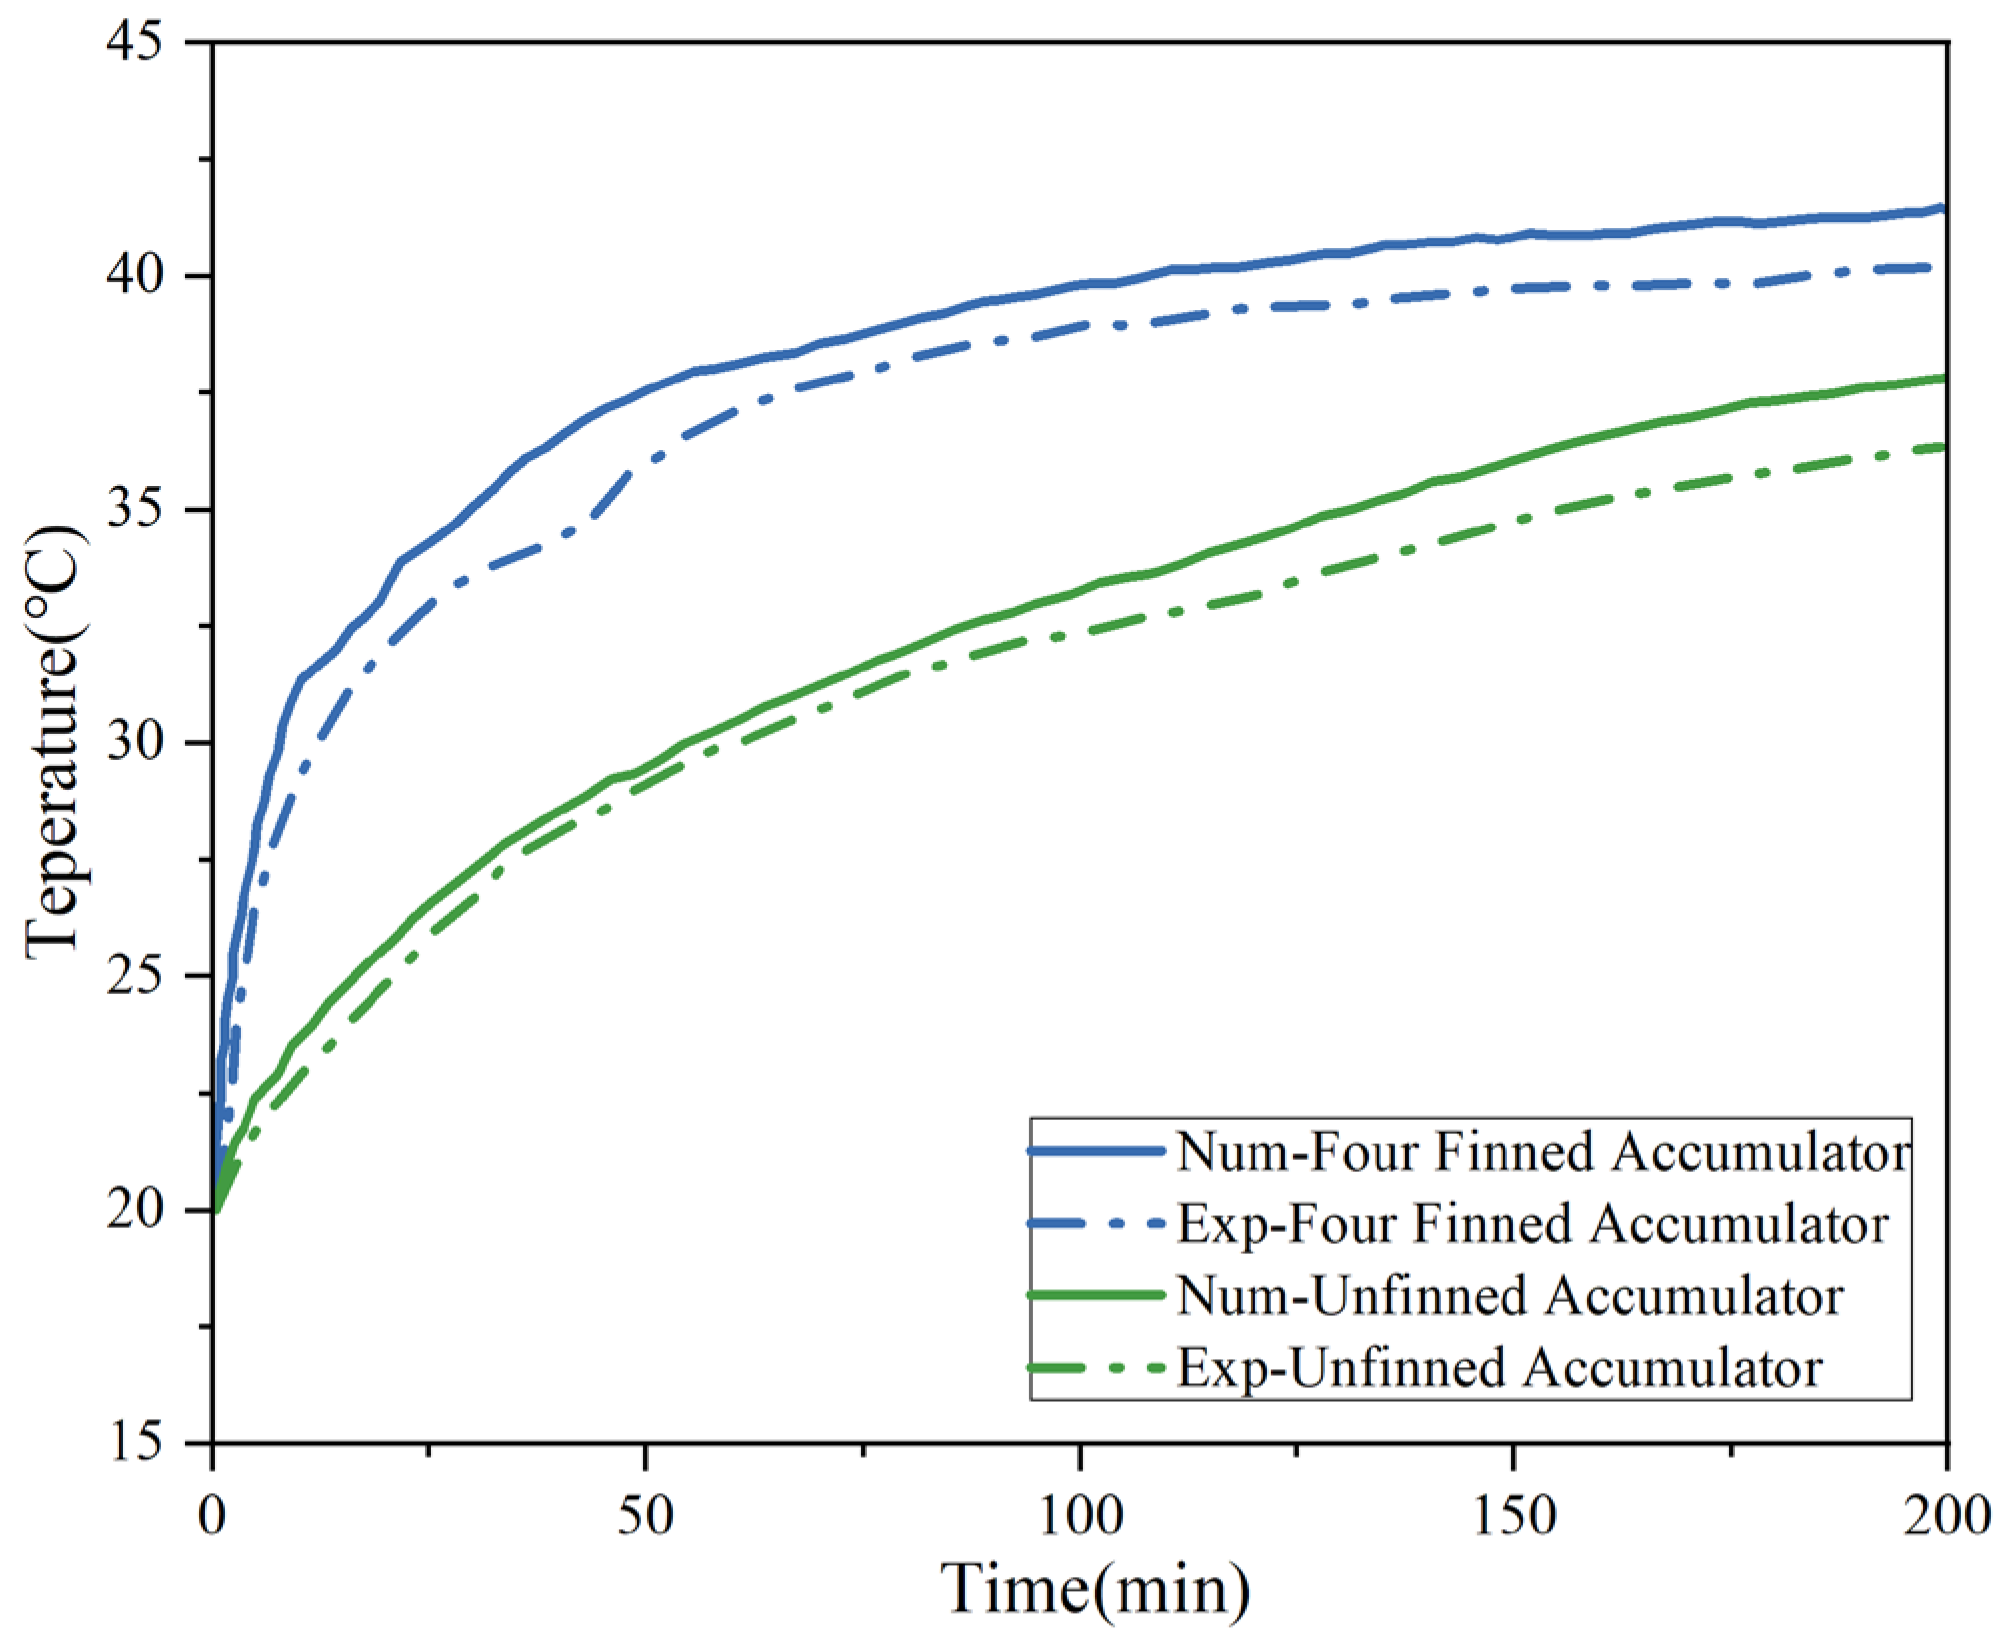
Figure 17 shows how the average PCM temperature varies over time for both finned and non-finned structures. This figure uses experimental test results to validate the outcomes of the numerical simulation. The experimental and simulated temperature trends are consistent, indicating good agreement. The average PCM temperature is selected as the primary validation metric because it represents the integral thermal response of the storage unit and is directly relevant to system-level performance evaluation. Meanwhile, the local temperature evolution at individual thermocouple locations exhibits consistent trends with numerical predictions, confirming that the model captures both global and local heat transfer behaviors. However, due to unavoidable heat losses during testing, the experimental results are consistently lower than the simulations. Furthermore, the finite precision of the software and computer may introduce minor discrepancies between the simulated and experimental results, with the difference increasing from an initial margin of less than 1% to 5%. The discrepancy sources include heat losses through insulation, contact thermal resistance at interfaces (fins–PCM, tube–PCM), sensor measurement uncertainty (±0.1 K), and numerical discretization errors. Consequently, the experimental and numerical simulation results exhibit minor deviations. These deviations arise from unavoidable experimental non-idealities and the homogeneous material assumptions adopted in the numerical model.
In summary, despite the minor discrepancies between the experiments and simulations that are attributable to real-world physical conditions, the maximum error remains below 5% and the trends are well aligned. The maximum deviation below 5% validates the reliability of the numerical model for subsequent parametric analysis.

4.3. Experimental Results and Discussion

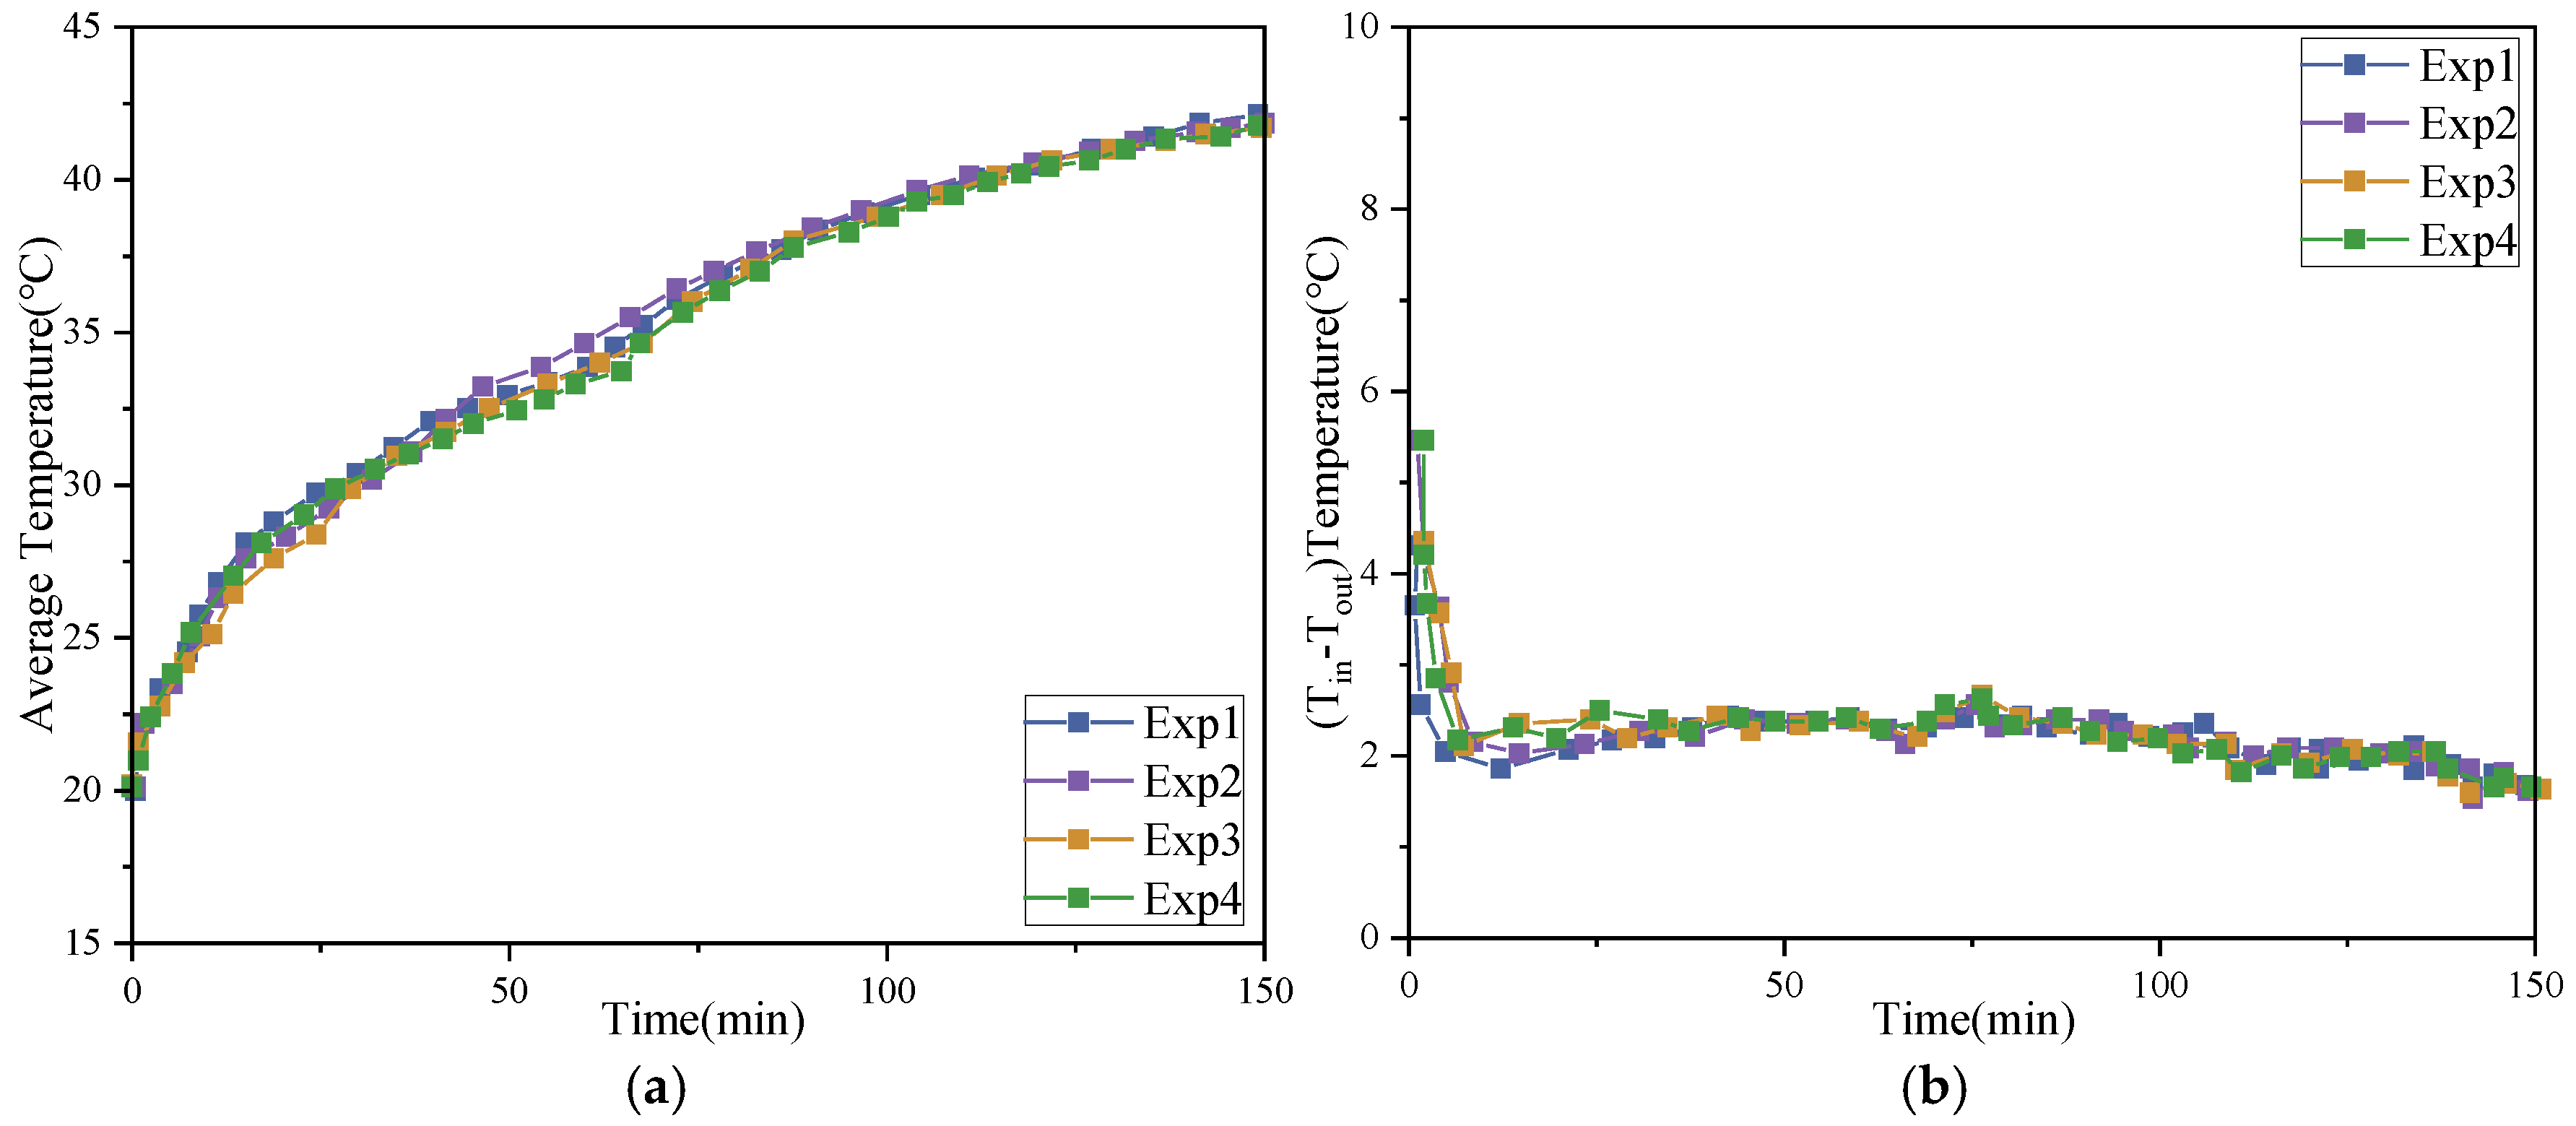
To validate the reproducibility of the experimental results and analyze the influence of temperature gradients on the heat transfer characteristics of the thermal storage system further, four repeatability experiments were conducted at an inlet temperature of 50 °C, using CPCM3 as the phase change material at measurement point T21. As shown in Figure 18a,b, the experimental results illustrate variations in the average internal temperature of the accumulator and the inlet–outlet temperature difference. The results across all groups exhibit high consistency, with maximum deviations consistently maintained below 1%. This demonstrates the excellent repeatability and measurement reliability of the experimental system. Similar trends were observed for other inlet temperature conditions, closely aligning with the temperature evolution patterns predicted by numerical simulations. These results further support the consistency between experimental observations and numerical predictions.
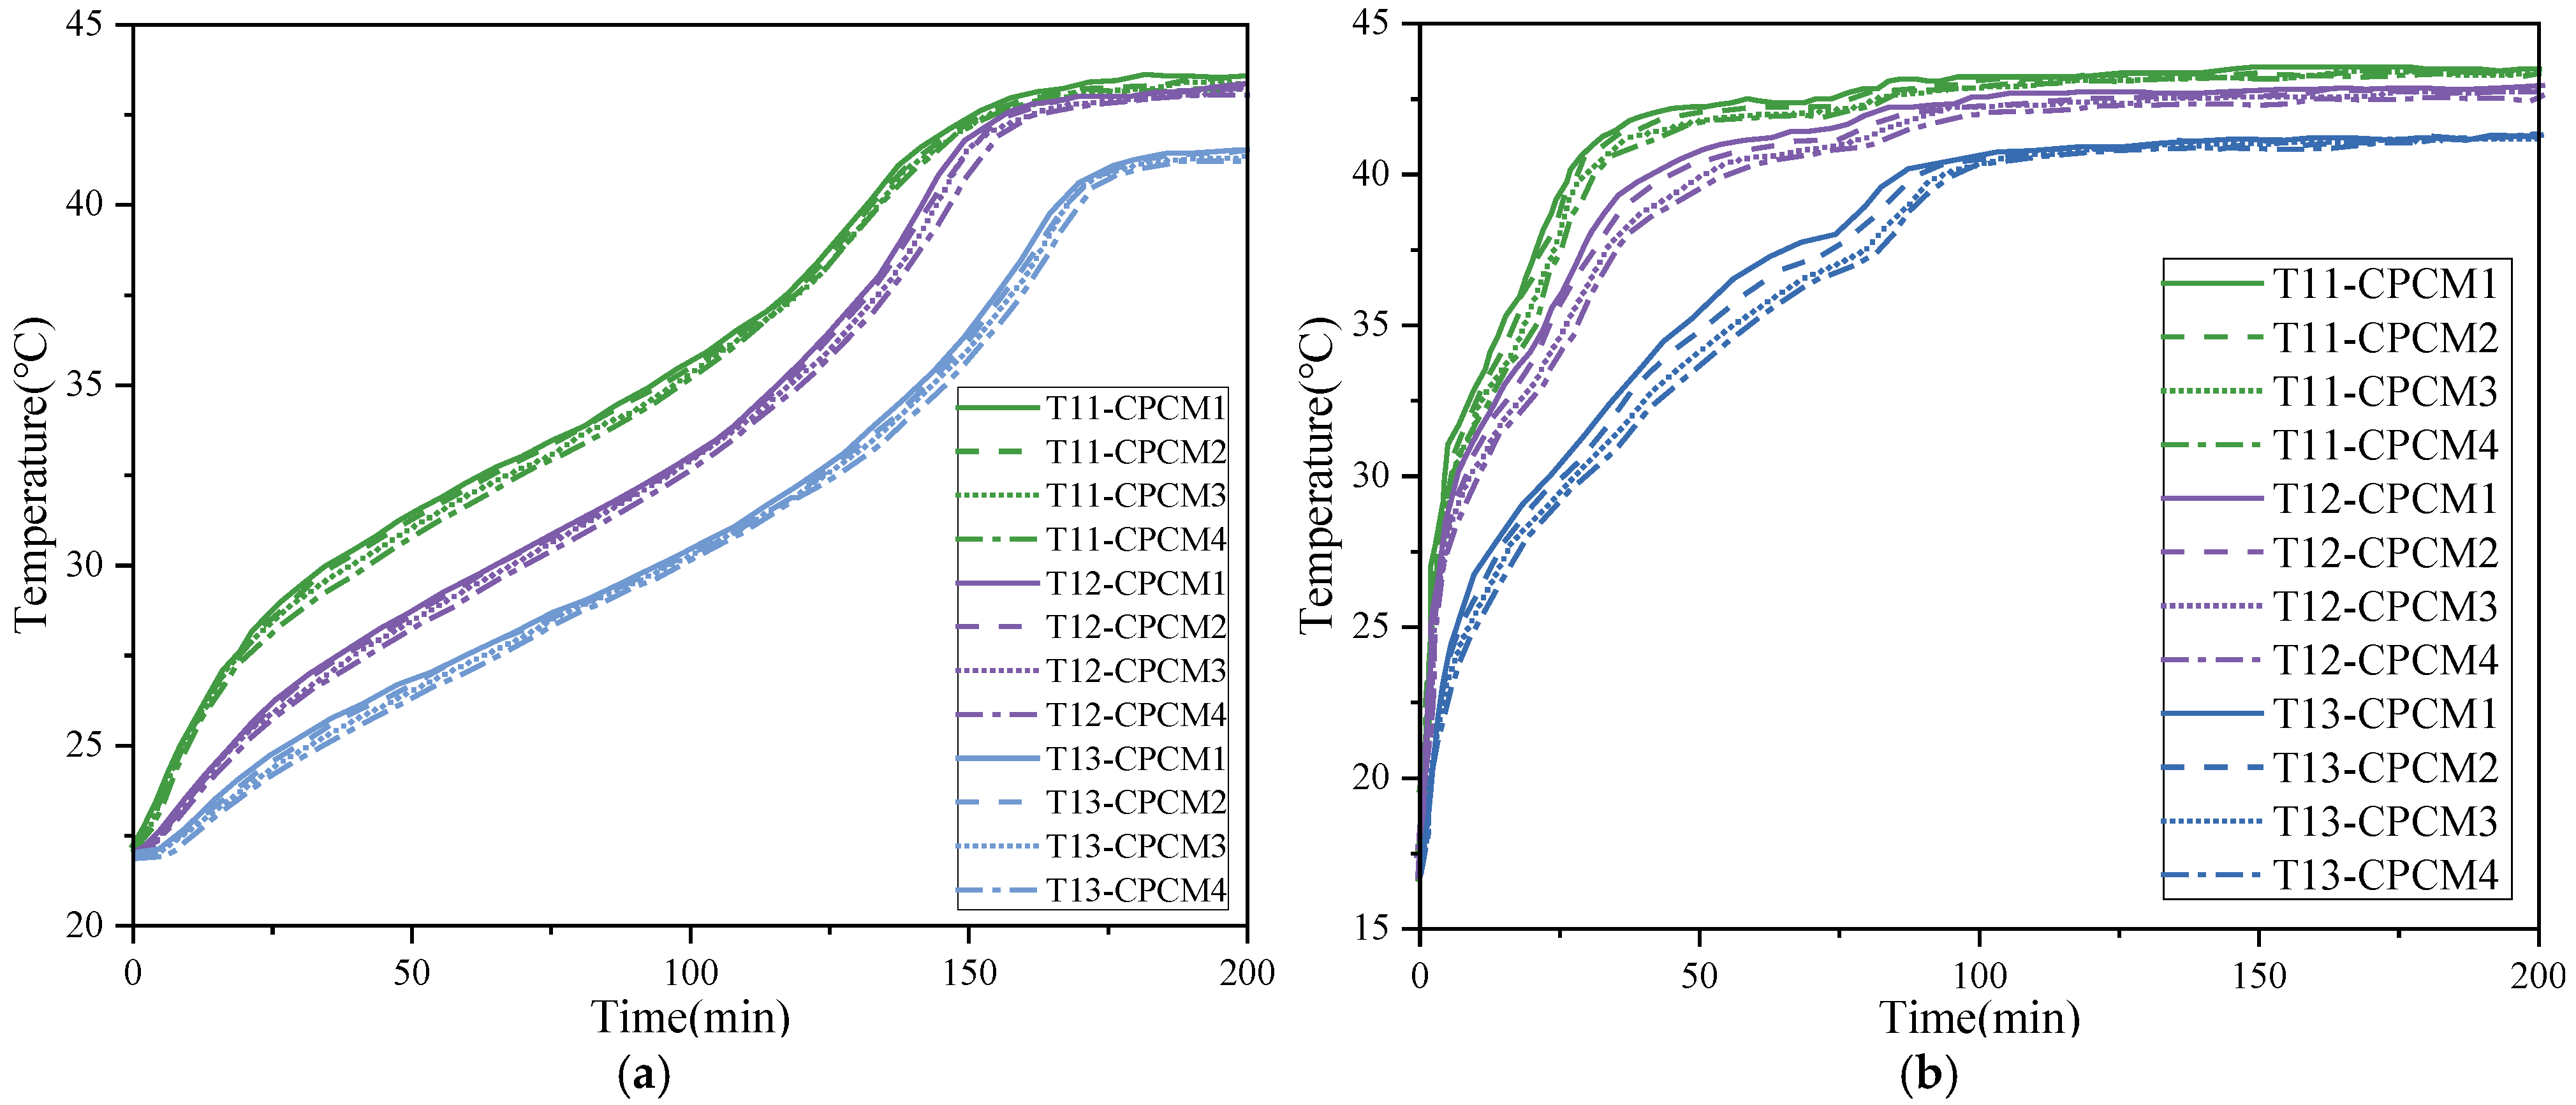
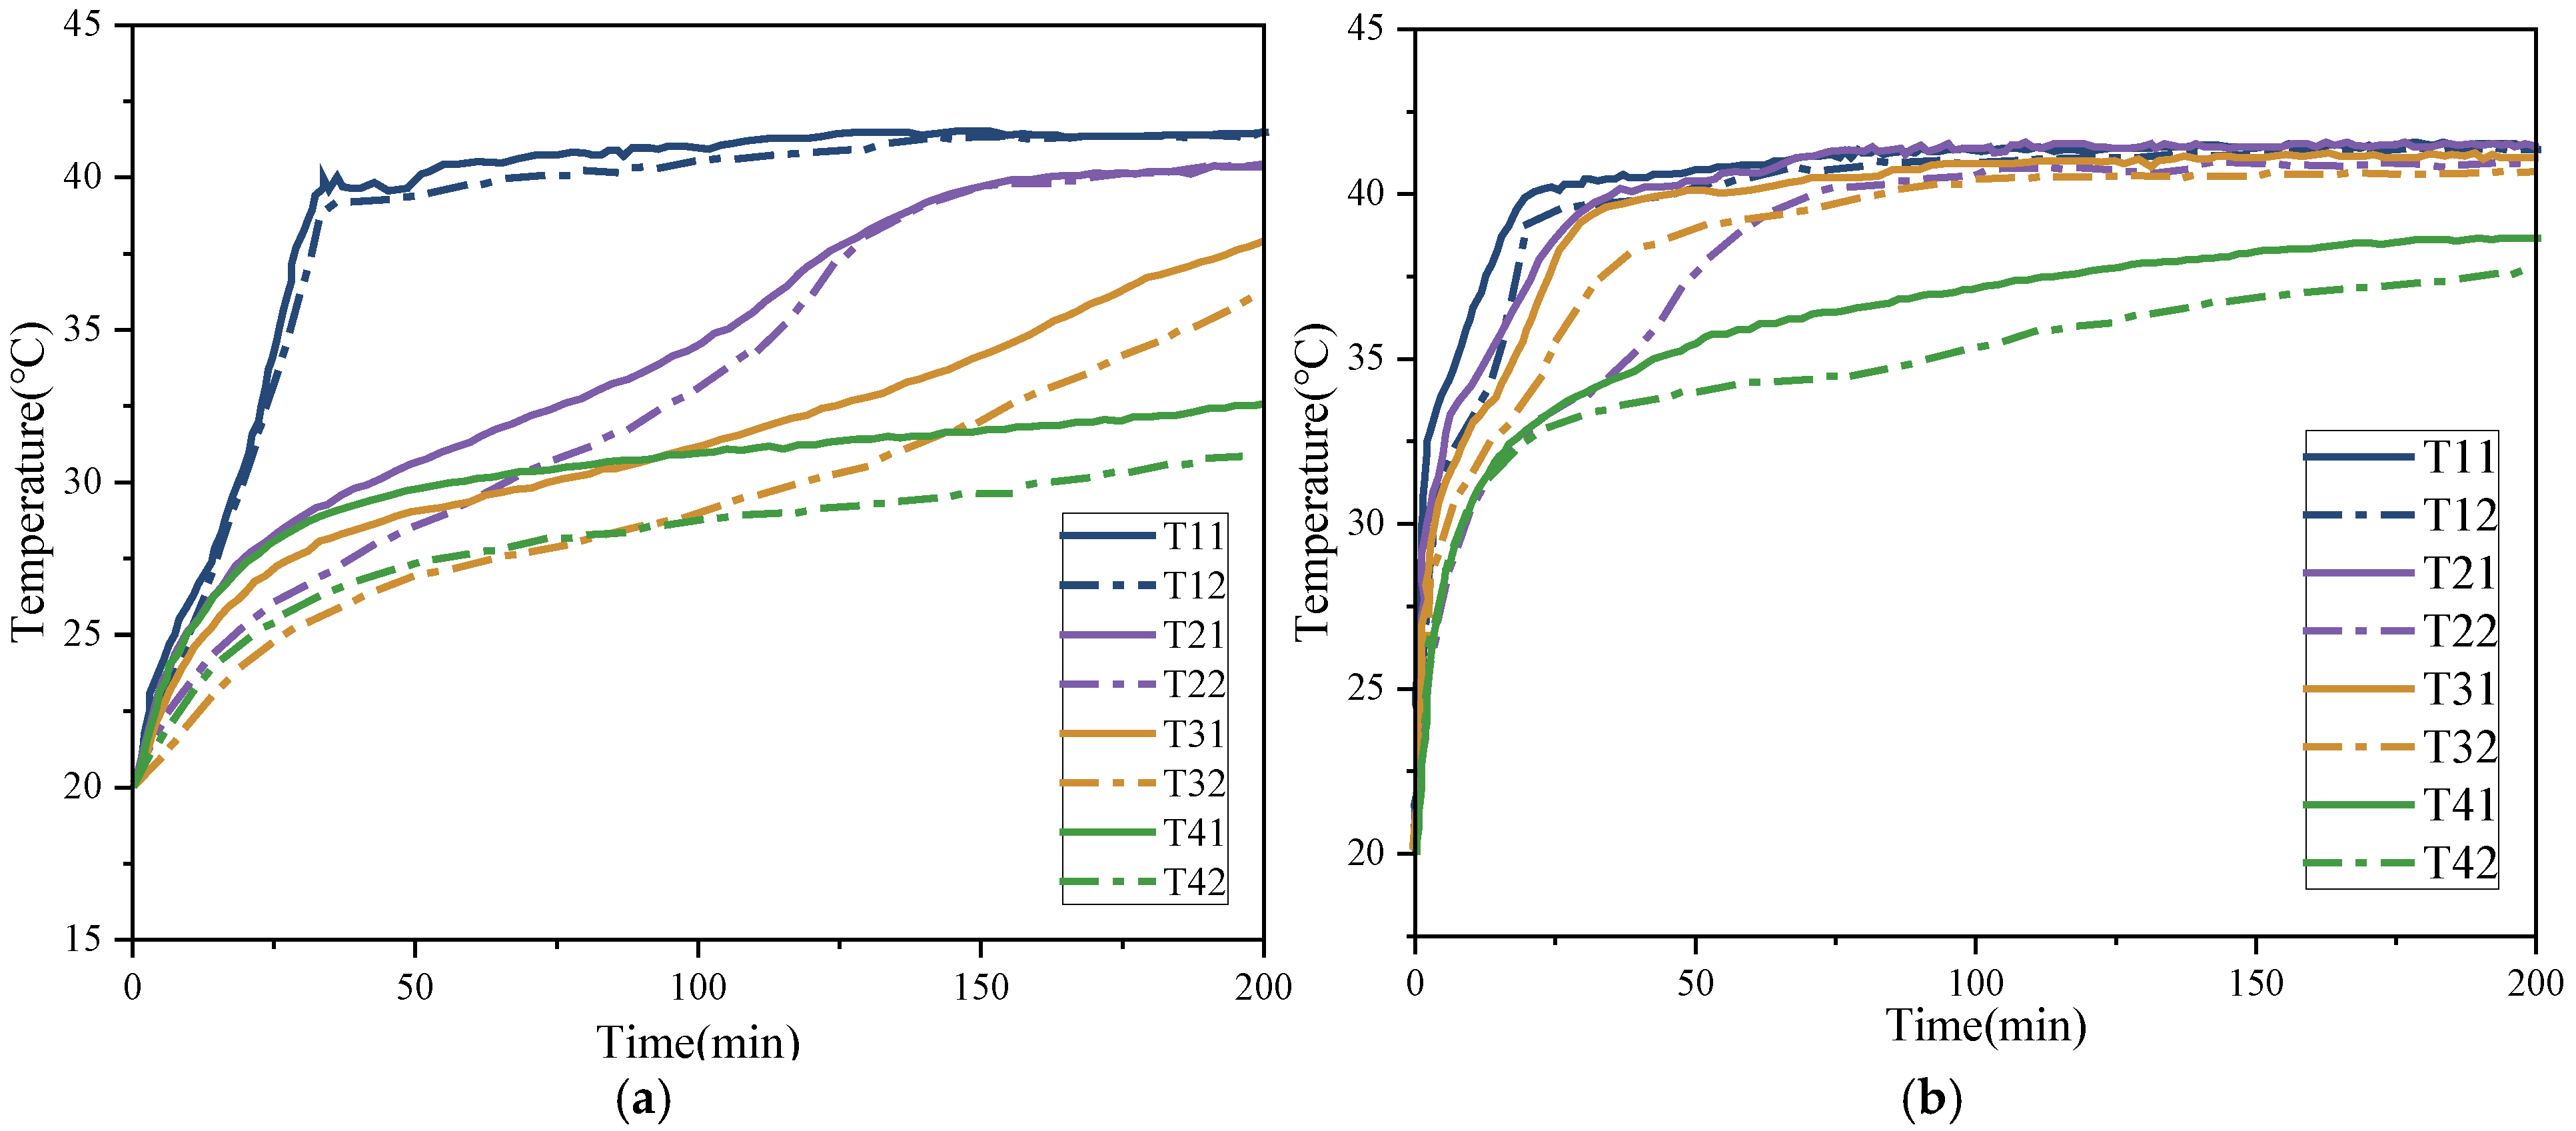
To elucidate the local heat transfer characteristics PCM melting within the device, Figure 19a,b present the temperature–time evolution of the PCM at the first and second radial thermocouple positions (T11–T41 and T12–T42) in both finned and unfinned heat storage units, respectively. During the experiment, the inlet temperature and flow rate were 50 °C and 3 L/min, respectively. During the initial phase of the experiment, while the PCM was in its solid state, heat transfer within the accumulator was predominantly conductive, resulting in a rapid temperature increase at all measurement points. As the PCM reached its phase transition temperature and began to melt, the rate of temperature increase slowed markedly. This behavior is consistent with the latent heat absorption stage predicted numerically.
Following the transition of the PCM into its liquid phase, natural convection progressively became the dominant heat transfer mechanism. Temperature gradients between upper and lower positions indicate buoyancy-driven flow development within the melted PCM. This characteristic was particularly pronounced in the un-finned heat accumulator, consistent with the distribution trends observed in the velocity and temperature fields from numerical simulations. Similar trends have been reported in previous PCM melting studies. Liu et al. investigated the synergistic enhancement of heat conduction and natural convection in longitudinally finned latent heat storage cavities [31], while Wang et al. observed the detrimental impact of natural convection in vertical shell-and-tube latent heat storage units [32].
By contrast, the temperature distribution within the heat accumulator shows markedly different characteristics after the addition of fins. The temperature variation curves at each radial measurement point (T11, T12, T21, T22, T31 and T32) become more concentrated and steeper within the finned accumulator, indicating that the fins significantly enhance the conduction of heat within the PCM. The presence of fins reduces thermal resistance during the early melting stage. This mitigates the impact of natural convection on localized heat transfer non-uniformity, resulting in more synchronized temperature evolution across the measurement points. This trend is consistent with the numerical prediction of more uniform temperature fields under finned conditions.
The aforementioned experimental and simulation results collectively demonstrate that finned structures can significantly improve the heat transfer performance of PCM thermal storage units, reducing melting times and improving temperature uniformity. Similar conclusions have been reported in previous studies on fin-enhanced PCM thermal storage systems [33], further substantiating the sound rationality and universal applicability of the observed trend of enhanced heat transfer in this research.
Figure 20a and Figure 20b illustrate the effect of varying the EG mass fraction in CPCM on the temperature evolution of the first-angle thermocouple in finned and unfinned configurations, respectively. Overall, as the EG mass fraction increases, the CPCM’s heat transfer rate markedly improves. This trend is consistent with existing research that conclude that EG significantly enhances the effective thermal conductivity of PCM and with the heat transfer enhancement patterns predicted in the numerical simulations of this study [34]. Under the finned structure condition (Figure 20a), the temperature evolution can be distinctly divided into three phases. First, there is a rapid temperature rise within 0–25 min, during which the PCM remains solid and heat transfer is dominated by conduction. Second, there is a deceleration in the temperature rise rate between 25 and 100 min, indicating that the PCM is gradually entering the phase transition range, where latent heat absorption inhibits further temperature increase. Finally, following 100–150 min, temperatures rise rapidly once more until the entire system approaches the phase transition temperature and stabilizes. As melting progresses, buoyancy-driven flow gradually strengthens within the liquid PCM region. This multi-stage temperature evolution characteristic, alongside the progressive expansion of the naturally convicted region, has been widely observed in experimental and numerical studies of PCM melting processes [35].
It is noteworthy that the influence of EG addition on temperature variation becomes relatively limited under the finned structure during the later stages. Under finned conditions, structural conduction pathways dominate overall resistance, reducing sensitivity to material conductivity enhancement. Consequently, while the introduction of EG markedly accelerates the temperature response during the initial heating phase by enhancing the effective thermal conductivity of the CPCM, this intensifying effect becomes less significant during the later stages of phase change. For the unfinned heat accumulator (Figure 20b), the temperature variation trend broadly mirrors that of the finned structure. However, the time taken to reach the phase transition temperature is significantly reduced, shortening the process by around 100 min. In the absence of fins, the system becomes more sensitive to changes in PCM effective conductivity. Consequently, it accelerates both the initiation of phase transition and the overall heating rate. This result aligns with existing research concluding that un-finned structures exhibit greater sensitivity to PCM thermal conductivity performance [36].
A comparative analysis of Figure 20a,b further reveals that the introduction of fins significantly increases the effective heat transfer area of the heat accumulator. The fin structure primarily enhances conduction pathways, while EG addition modifies material conductivity. Consequently, the time required to reach the phase transition temperature is reduced by more than half compared to the structure without fins. Structural and material enhancements contribute at different melting stages, producing a coupled but non-additive improvement.
CPCM thermal stability consideration. The experimental results are obtained from the initial melting cycles of CPCM3, assuming constant thermophysical properties during the tests. Previous studies indicate that expanded graphite/paraffin composite PCMs generally exhibit satisfactory structural integrity and thermal performance retention under limited thermal cycles (e.g., <100 cycles), attributed to the capillary and surface adsorption forces of the porous EG matrix [37,38]. However, potential long-term degradation mechanisms—including paraffin leakage, reduction in effective thermal conductivity, and phase transition temperature shifts after extended cy-cling—are not quantified in the present study. These effects may influence long-term performance and therefore require further investigation.

5. Limitations and Future Work

The present study is subject to several limitations that merit discussion.
(1)
Idealized modeling assumptions. The numerical model adopts adiabatic outer boundary conditions and assumes constant thermophysical properties for the PCM. In practical systems, however, heat losses to the ambient and temperature-dependent variations in material properties may influence the thermal response and overall performance.
(2)
Focus on the charging process. The investigation primarily addresses the melting (charging) behavior of the PCM. In contrast, the solidification (discharging) process—characterized by weakened natural convection, potential supercooling, and reversed heat flux direction—has not been systematically examined. A detailed analysis of discharge performance is necessary for comprehensive system evaluation.
(3)
Long-term thermal cycling stability. Although CPCM3 exhibited stable behavior during the initial experimental cycles, its long-term performance under extended thermal cycling (e.g., >1000 cycles) has not been assessed. Possible degradation mechanisms—including paraffin leakage from the EG porous matrix, gradual reduction in effective thermal conductivity, and phase transition temperature drift—require quantitative investigation to enable reliable lifetime prediction.
(4)
Scope of techno-economic evaluation. The techno-economic discussion in this study re-mains qualitative. While fin structures increase manufacturing complexity, they reduce melting time by 47–59%, suggesting potential system-level economic benefits. However, detailed life-cycle cost modeling incorporating material cost, fabrication processes, and regional economic parameters was beyond the present scope.
Accordingly, future work will focus on incorporating non-ideal boundary conditions and experimentally quantifying heat losses, systematically investigating solidification dynamics and discharge optimization, evaluating long-term thermal cycling stability over extended operational cycles, and conducting comprehensive techno-economic optimization to enhance the practical applicability of fin-enhanced PCM thermal storage systems.

6. Conclusions

This study involved an experimental analysis of temperature variations during PCM melting within heat storage tanks of different structures, in order to investigate their thermal storage characteristics. Numerical simulation methods were also used to examine how structural design variations, the addition of expanded graphite, and higher inlet temperatures affect PCM melting in the storage tanks. Water was used as the HTF and PA and EG were used as the PCMs at different mass fractions. Studies were conducted for an air-source heat pump heating system using HTF temperatures of 45, 50, 55 and 60 °C, examining both finned and non-finned thermal storage units. The following conclusions were drawn:
(1)
The study revealed the nonlinear influence of fin structure on heat storage performance and proposed an optimal design range. Research indicates that a higher finning coefficient does not necessarily equate to superior performance; excessively high values may impede natural convection within the PCM, thereby adversely affecting performance. Through systematic analysis, the optimal finning coefficient range for this system was determined to be 4.16–5.68 for the first time, providing crucial theoretical groundwork for the structural optimization of heat storage devices.
(2)
The intensification effect of fin structures on the heat storage process was quantified and a high-precision predictive model was developed. Experimental results indicate that, within an inlet temperature range of 45–60 °C, adding fins significantly reduces total PCM melting time by between 47% and 59%. Building upon this, we developed a reliable numerical model that was verified experimentally and showed less than 5% deviation from the measured data. This further yielded a melting time prediction formula suitable for rapid design. With fins: Melting Time = 0.12Tin 2 − 24.43Tin + 1145.72; Without fins: Melting time = 0.04 Tin2 − 14.27 Tin + 876.08.
(3)
The synergistic and competitive relationship between material modification (the addition of expanded graphite) and structural optimization (the addition of fins) is elucidated. Although incorporating EG significantly improves the thermal conductivity of the PCM, comparative studies suggest that optimizing the fin structure has a more significant impact on overall heat storage rates. Therefore, in engineering applications, structural optimization should be prioritized as the primary strategy for improving the performance of heat storage devices.
Finally, the proposed ‘structural optimization–performance prediction’ research paradigm has excellent universality. This methodology can be applied to the design of modular thermal storage systems comprising multiple units arranged in series or in parallel. It will provide a solid theoretical basis for the development of efficient, compact thermal storage devices suitable for large-scale clean heating applications, thus promoting the wider use of air-source heat pumps in very cold areas.

Author Contributions

All authors contributed to the study’s conception and design. M.W.: Conceptualization, Methodology, Investigation, Formal analysis, Data curation, Writing—original draft preparation, Writing—review and editing. T.Z.: Conceptualization, Supervision, Methodology, Formal analysis, Writing—review and editing. W.Z.: Methodology, Validation, Data curation, Writing—review and editing. Y.W.: Investigation, Validation, Writing—review and editing. All authors have read and agreed to the published version of the manuscript.

Funding

The research received no external funding.

Data Availability Statement

The data that support the findings of this study are available from the corresponding author, [Tianyang Zhang, zhangtiany1997@foxmail.com], upon reasonable request.

Conflicts of Interest

The authors declare no potential conflict of interest concerning the research, authorship, and/or publication of this article.

References

  1. Adamo, A.; Martín, H.; de la Hoz, J.; Rubio, J. A review of worldwide strategies for promoting high-temperature heat pumps. Appl. Sci. 2025, 15, 839. [Google Scholar] [CrossRef] [Scilit]
  2. Zhu, X.; Gong, B. Risk Challenges and Path Options for Realizing the Dual-Carbon Goal in the Context of High-Quality Development in China; Chinese Governance and Transformation Towards Carbon Neutrality; Springer Nature: Singapore, 2025; pp. 71–89. [Google Scholar]
  3. Yang, Y.; Lo, K. China’s renewable energy and energy efficiency policies toward carbon neutrality: A systematic cross-sectoral review. Energy Environ. 2024, 35, 491–509. [Google Scholar] [CrossRef] [Scilit]
  4. Christodoulides, P.; Christou, C.; Florides, G.A. Ground source heat pumps in buildings revisited and prospects. Energies 2024, 17, 3329. [Google Scholar] [CrossRef] [Scilit]
  5. Sjöblom, P. Power-to-Heat Systems for District Heating: A Comparative Analysis of Air Source and Ground Source Heat Pumps. 2025. Available online: https://www.doria.fi/handle/10024/190784 (accessed on 6 January 2026).
  6. Hu, W.; Chang, M.; Jin, F.; Shao, Z.; Ye, L. Study on heat storage and release characteristics and energy-efficient heating operating temperature conditions of phase change heat storage air source heat pump systems. Renew. Energy 2021, 39, 908–915. [Google Scholar] [CrossRef]
  7. da Cunha, S.R.L.; de Aguiar, J.L.B. Phase change materials and energy efficiency of buildings: A review of knowledge. J. Energy Storage 2020, 27, 101083. [Google Scholar] [CrossRef] [Scilit]
  8. Rapucha, A.; Narayanan, R.; Jha, M. Heat pumps with smart control in managing Australian residential electrical load during transition to net zero emissions. Energies 2024, 17, 2977. [Google Scholar] [CrossRef] [Scilit]
  9. Mokarram, N.H. Peak Shaving Potential Using a Novel Flexible Two-Stage Heat Pump for Heating and Cooling. Ph.D. Thesis, University of Glasgow, Glasgow, UK, 2025. [Google Scholar]
  10. Gao, J.; Li, S.; Wu, F.; Jiang, L.; Zhao, Y.; Zhang, X. Study on efficient heating method by solar coupled air source heat pump system with phase change heat storage in severe cold region. Appl. Energy 2024, 367, 123206. [Google Scholar] [CrossRef] [Scilit]
  11. Rogowski, M.; Fabrykiewicz, M.; Andrzejczyk, R. Melting in Shell-and-Tube and Shell-and-Coil Thermal Energy Storage: Analytical Correlation for Melting Fraction. Energies 2025, 18, 2923. [Google Scholar] [CrossRef] [Scilit]
  12. Mills, A.; Farid, M.; Selman, J.R.; Al-Hallaj, S. Thermal conductivity enhancement of phase change materials using a graphite matrix. Appl. Therm. Eng. 2006, 26, 1652–1661. [Google Scholar] [CrossRef] [Scilit]
  13. Tian, Y.; Zhao, C.Y. A numerical investigation of heat transfer in phase change materials (PCMs) embedded in porous metals. Energy 2011, 36, 5539–5546. [Google Scholar] [CrossRef] [Scilit]
  14. Zhao, C.Y.; Zhou, D.; Wu, Z.G. Heat Transfer Enhancement of Phase Change Materials (PCMs) in Low and High Temperature Thermal Storage by Using Porous Materials. Int. Heat Transf. Conf. 2010, 49422, 435–441. [Google Scholar]
  15. Hosseini, M.; Rahimi, M.; Bahrampoury, R. Experimental and computational evolution of a shell and tube heat exchanger as a PCM thermal storage system. Int. Commun. Heat Mass Transf. 2014, 50, 128–136. [Google Scholar] [CrossRef] [Scilit]
  16. Masoumi, H.R.; Haghighi Khoshkhoo, R. Investigation of melting of nanoparticle-enhanced phase change materials (NePCMs) in a shell-and-tube heat exchanger with longitudinal fins. Heat Mass Transf. 2020, 57, 681–701. [Google Scholar] [CrossRef] [Scilit]
  17. Wu, X.; Gao, L.; Zhai, Y.; Wang, Y.; Wang, Y. The present study constitutes an experimental investigation into the enhancement of heat transfer in shell-and-tube phase change heat storage devices. J. Eng. Thermophys. 2021, 42, 1004–1008. [Google Scholar]
  18. Wang, W.; Xing, Y.; Zheng, W.; Hao, Z. Study on Phase Change Heat Transfer Characteristics and Fractal Optimisation of Annular Ribbed Fin Tubes. J. Beijing Univ. Aeronaut. Astronaut. 2022, 48, 2520–2528. [Google Scholar] [CrossRef]
  19. Agyenim, F.; Eames, P.; Smyth, M. Heat transfer enhancement in medium temperature thermal energy storage system using a multitube heat transfer array. Renew. Energy 2010, 35, 198–207. [Google Scholar] [CrossRef] [Scilit]
  20. Agyenim, F.; Eames, P.; Smyth, M. Experimental study on the melting and solidification behavior of a medium temperature phase change storage material (Erythritol) system augmented with fins to power a LiBr/H2O absorption cooling system. Renew. Energy 2011, 36, 108–117. [Google Scholar] [CrossRef] [Scilit]
  21. Hosseini, M.; Ranjbar, A.; Rahimi, M.; Bahrampoury, R. Experimental and numerical evaluation of longitudinally finned latent heat thermal storage systems. Energy Build. 2015, 99, 263–272. [Google Scholar] [CrossRef] [Scilit]
  22. Huang, Y.; Song, L.; Wu, S.; Liu, X. Investigation on the thermal performance of a multi-tube finned latent heat thermal storage pool. Appl. Therm. Eng. 2022, 200, 117658. [Google Scholar] [CrossRef] [Scilit]
  23. Wang, Y.; Quan, Z.; Jing, H.; Wang, L.; Zhao, Y. Performance and operation strategy optimization of a new dual-source building energy supply system with heat pumps and energy storage. Energy Convers. Manag. 2021, 239, 114204. [Google Scholar] [CrossRef] [Scilit]
  24. Tiari, S.; Hockins, A.; Moretti, S. Experimental Investigation of Latent Heat Thermal Energy Storage System Enhanced by Annular and Radial Fins. In Proceedings of the ASME 2021 15th International Conference on Energy Sustainability Collocated with the ASME 2021 Heat Transfer Summer Conference, Virtual, 16–18 June 2021; Volume 84881, p. V001T06A007. [Google Scholar]
  25. Jin, Y. Research on Enhanced Heat Transfer in Horizontal Shell-and-Tube Phase Change Heat Storage Units. Master’s Thesis, Tsinghua University, Beijing, China, 2019. [Google Scholar] [CrossRef]
  26. Guo, W. Numerical Simulation and Experimental Study on the Performance of a Dual-Heat-Source Heat Pump with Phase Change Heat Storage Heat Exchanger. Master’s Thesis, Nanchang University, Nanchang, China, 2014. [Google Scholar]
  27. Jin, Y.; Sheng, F.; Sheng, L.; Wang, X.; Li, H. Study on Heat Transfer Mechanism of Horizontal Shell-and-Tube Phase Change Heat Storage Unit. Heat. Vent. Air Cond. 2021, 52, 99–104+94. [Google Scholar]
  28. Zhang, X.; Savoie, M.; Quinn, M.K.; Parslew, B.; Revell, A. Simulation of Flow Around a Finite Rectangular Prism: Influence of Mesh, Model, and Subgrid Length Scale. Entropy 2025, 27, 65. [Google Scholar] [CrossRef] [Scilit]
  29. Łach, Ł.; Svyetlichnyy, D. Advances in numerical modeling for heat transfer and thermal management: A review of computational approaches and environmental impacts. Energies 2025, 18, 1302. [Google Scholar] [CrossRef] [Scilit]
  30. Hussien, S.A.; Ali, A.B.M.; Alkhatib, O.J.; Mahariq, I. Enhanced passive thermal management of lithium-ion batteries with conical cy-lindrical chamber incorporating various phase change materials. Sci. Rep. 2025, 15, 35675. [Google Scholar] [CrossRef] [Scilit] [PubMed]
  31. Liu, H.Y.; Yang, S.S.; Qu, B.C.; Wu, C.M.; Li, Y.R. Synergistic enhancement of heat conduction and natural convection in latent heat storage cavities with longitudinal fins. Int. J. Heat Mass Transf. 2025, 236, 126291. [Google Scholar] [CrossRef] [Scilit]
  32. Wang, L.; Wang, L.; Wang, Y. The negative effect of natural convection in a vertical shell and tube latent heat energy storage unit. Appl. Therm. Eng. 2024, 244, 122688. [Google Scholar] [CrossRef] [Scilit]
  33. Nair, A.M.; Wilson, C.; Kamkari, B.; Locke, J.; Huang, M.J.; Griffiths, P.; Hewitt, N.J. Advancing thermal performance in PCM-based energy storage: A comparative study with fins, expanded graphite, and combined configurations. Energy Convers. Manag. X 2024, 23, 100627. [Google Scholar] [CrossRef] [Scilit]
  34. Ma, F.; Liang, Y.; Tao, Z.; Guo, X.; Guo, Q.; Liu, Z. A novel PCM/expanded graphite composite sphere with high thermal conductivity and excellent shape stability used for a packed-bed thermal energy system. Diam. Relat. Mater. 2024, 145, 111102. [Google Scholar] [CrossRef] [Scilit]
  35. Farshineh Adl, H. EFFECT OF FORCED CONVECTION AND COMPRESSIBILITY ON TRANSIENT MELTING BEHAVIOR OF PCM IN A CAVITY. 2025. Available online: https://open.metu.edu.tr/handle/11511/115592 (accessed on 8 January 2026).
  36. Proia, P.; Sbragaglia, M.; Falcucci, G. Heat transfer modulation in Phase Change Materials via fin insertion. arXiv 2025, arXiv:2507.04851. [Google Scholar]
  37. Zhao, Y.; Jin, L.; Zou, B.; Qiao, G.; Zhang, T.; Cong, L.; Jiang, F.; Li, C.; Huang, Y.; Ding, Y. Expanded graphite–Paraffin composite phase change materials: Effect of particle size on the composite structure and properties. Appl. Therm. Eng. 2020, 171, 115015. [Google Scholar] [CrossRef] [Scilit]
  38. Zhao, Y.; Huang, S.; Jin, Z.; Xie, Z.; Guo, H.; Xie, H. Thermally Conductive Shape-Stabilized Phase Change Materials Enabled by Paraffin Wax and Nanoporous Structural Expanded Graphite. Nanomaterials 2025, 15, 110. [Google Scholar] [CrossRef] [Scilit] [PubMed]
Figure 1. (a) Schematic diagram of air-source heat pump with thermal storage system; (b) Internal Structure Diagram of Thermal Storage Tank.
Buildings 16 00909 g001
Figure 2. Preparation of CPCM.
Buildings 16 00909 g002
Figure 3. Physical property characterization of CPCM: (a) DSC, (b) Specific heat capacity, (c) Thermal conductivity.
Buildings 16 00909 g003
Figure 4. Physical Model of Unit Heat Storage Tank. (A, B, C: three measurement points).
Buildings 16 00909 g004
Figure 5. Fin Mounting Position of Heat Storage Unit.
Buildings 16 00909 g005
Figure 6. Assessment of Grid Independence.
Buildings 16 00909 g006
Figure 7. Temporal evolution of liquid phase fraction distribution in the thermal storage unit during melting (Tin = 50 °C, flow rate = 3 L/min).
Buildings 16 00909 g007
Figure 8. Evolution of average PCM temperature in the thermal storage unit under different finning coefficients (Tin = 50 °C).
Buildings 16 00909 g008
Figure 9. Evolution of liquid phase fraction in the thermal storage unit under different finning coefficients (Tin = 50 °C).
Buildings 16 00909 g009
Figure 10. Evolution of heat storage rate of the PCM in the thermal storage unit under different finning coefficients (Tin = 50 °C).
Buildings 16 00909 g010
Figure 11. Evolution of cumulative heat storage capacity in the thermal storage unit under different finning coefficients (Tin = 50 °C).
Buildings 16 00909 g011
Figure 12. Evolution of average PCM temperature in the thermal storage unit with and without fins at different inlet temperatures (finned: β = 4.16; Tin = 45~60 °C).
Buildings 16 00909 g012
Figure 13. Evolution of liquid phase fraction in the thermal storage unit with and without fins at different inlet temperatures (finned: β = 4.16; Tin = 45~60 °C).
Buildings 16 00909 g013
Figure 14. Evolution of overall heat transfer rate in the thermal storage unit with and without fins at different inlet temperatures (finned: β = 4.16; Tin = 45~60 °C).
Buildings 16 00909 g014
Figure 15. Complete melting time of the PCM in the thermal storage unit with and without fins as a function of inlet temperature (finned: β = 4.16; Tin = 45–60 °C).
Buildings 16 00909 g015
Figure 16. Experimental system diagram. (a) Photograph of the experimental apparatus. (b) Distribution of thermocouples within the heat storage unit.
Buildings 16 00909 g016
Figure 17. Validation of the numerical model against experimental data for the thermal storage unit with and without fins (Tin = 50 °C).
Buildings 16 00909 g017
Figure 18. Repeatability test at Tin = 50 °C. (a) Average temperature curve of the PCM. (b) Temperature difference at the inlet and outlet of the heat storage unit.
Buildings 16 00909 g018
Figure 19. First and second radial thermocouple temperatures. (a) Without fins. (b) With fins.
Buildings 16 00909 g019
Figure 20. Temperature at the first-angle thermocouple of the CPCM. (a) Without fins. (b) With fins.
Buildings 16 00909 g020
Table 1. Thermophysical properties of PA, EG, and CPCMs with varying EG:PA mass ratios (prepared by melt impregnation method).
Physical ParameterCPCM1CPCM2CPCM3CPCM4PA
EG:PA1:71:81:91:10/
Density (kg/m3)831842857865880
Phase transition temperature (°C)41.1–43.641.7–44.242.4–44.341.5–44.240–42
Specific heat capacity (J/(g·K))2.142.352.422.242.56
Thermal conductivity (W/(m·K))1.781.280.950.520.24
Latent heat of phase change (kJ/kg)159.9170.1176.2178.3183.6
Table 2. Empirical prediction formulas and melting times for complete PCM melting in the thermal storage unit with and without fins at different inlet temperatures (Tin = 45~60 °C, CPCM3, flow rate = 3 L/min).
StructureFitting FormulaTin = 45 °CTin = 50 °CTin = 55 °CTin = 60 °C
FinnedMelting Time = 0.12Tin2 − 24.43Tin + 1145.72293.95220.49172.04119.8
UnfinnedMelting Time = 0.04Tin2 − 14.27Tin + 876.08316.29264.53214.18166.5
Disclaimer/Publisher’s Note: The statements, opinions and data contained in all publications are solely those of the individual author(s) and contributor(s) and not of MDPI and/or the editor(s). MDPI and/or the editor(s) disclaim responsibility for any injury to people or property resulting from any ideas, methods, instructions or products referred to in the content.