Article

Evaluating Dynamic Reaction Forces at Anchorages to Enhance the Safety of Mast Climbing Work Platforms


by
Xueyan S. Xu
1,
Christopher M. Warren
1,
Robert S. White
1,
John Z. Wu
1,
Francois Villeneuve
2,
Ren G. Dong
1 and
Christopher S. Pan
1,*
1
National Institute for Occupational Safety and Health (NIOSH), Morgantown, WV 26505, USA
2
FRACO USA, Inc., St. Mathias-Sur-Richelien, QC J3L 6B6, Canada
*
Author to whom correspondence should be addressed.
Buildings 2026, 16(4), 878; https://doi.org/10.3390/buildings16040878
Submission received: 20 January 2026 / Revised: 11 February 2026 / Accepted: 16 February 2026 / Published: 22 February 2026

Abstract

Mast climbing work platforms (MCWPs) are designed to vertically access building facades and other structures to perform various construction tasks. The mast in an MCWP system is structurally considered “slender”, its anchorages to the building play an important role in maintaining its stability. Failure of anchorages can affect overall structural stability, potentially increasing the risk of the mast collapsing. The anchorages and their attachments to a construction structure are likely among the most critical components for the MCWPs. This study developed an instrumented anchorage using strain gauges to measure and understand the anchorage reaction forces and to identify the major factors for the measurement of those forces. In the experiment, a single mast work platform was used at a simulated work site. Besides the anchoring reaction forces, the vibration motions on the platform were also measured. The study found that the amount of the load on the platform, the position of the load on the platform, and the platform’s vertical position on the mast may all affect the reaction forces on the anchorages. Such effects varied with the specific anchorages installed at different heights of the mast. The dynamic forces on the anchorages were correlated to the platform vibrations.

1. Introduction

Mast climbing work platforms (MCWPs) are designed and constructed for vertical access to building facades and other structures [1,2]. Each MCWP can be supported by a single mast or multiple masts, depending on the span of the required work platform. Each mast is supported on a solid base and is anchored to a building or other structure if it exceeds a certain height. The platform is rigidly fixed on the elevating unit(s) that can be operated either manually or through electric, pneumatic, or hydraulic motors. MCWPs are used by many different construction trades, such as masons, plasterers, drywallers, insulation installers, carpenters/framers, siding contractors, ironworkers, glass and glazers, painters, demolition crews, and managers in building construction. They are generally more efficient and cost-effective to use than traditional scaffolds, especially for large construction projects [3]. MCWPs have also been considered one of the ergonomic technologies suitable for controlling musculoskeletal disorders among construction workers [4,5,6]. Consequently, MCWPs have been increasingly used since the 1990s. MCWP, their increased use also raises significant safety issues and concerns, since the consequences of an MCWP failure can be catastrophic, comparable to those of traditional scaffold failure [7,8,9,10]. While the safety of MCWPs in the United States is governed under OSHA Regulation 29 CFR1926, Subpart L-Scaffolds [11], related national and international standards exist [1,2,12,13]. Although research and technology development have been conducted to help control the safety of MCWPs [14,15,16,17], catastrophic failures of MCWPs are still happening (e.g., [18,19,20,21,22]). Further studies are needed to evaluate methods and designs to improve the reliable, safe use of MCWPs.
As the mast in an MCWP system is “slender” structurally, its anchorages can play an important role in maintaining the stability of the system, especially when the mast is beyond a certain height. The anchorages and their attachments to the building are likely among the most critical for maintaining the structural stability of the entire mast climbing system. Furthermore, the installation of the anchorages at the construction sites may involve some uncertainties, such as the strength and stability of the construction structures they are attached to, the availability of ideal anchorage locations on the construction structure, and the selection of suitable anchoring structures and dimensions for each anchoring location. Failure of the anchorage at one of the anchoring locations may cause the redistribution of load through the entire system, causing overloading of other anchoring sites, some mast components, and the instability of the entire MCWP. A better understanding of the basic characteristics of the forces acting on the anchorages during working conditions of the MCWP would help improve the design, installation, and maintenance of the system. This knowledge may also help improve work practices on the platform. A previous modeling study revealed that the reaction forces in MCWP anchorages are sensitive to the loading conditions on the platform and the platform’s height on the mast [23]. However, the finite element modeling contains some assumptions that are irrelevant to in situ conditions, and the modeling results have not been validated by experimental results.
Experimental studies using shaking table tests have been widely employed to evaluate the stability and dynamic response of structural systems subjected to transient and dynamic loading conditions. Shaking table experiments have been conducted on a variety of structural configurations, including steel and reinforced concrete frames, freestanding equipment, and hybrid structural systems. These works have been comprehensively reviewed in the literature [24], revealing consistent use of acceleration, displacement, drift, and force measurements to characterize dynamic response and identify instability mechanisms [24,25,26,27]. These studies have demonstrated that dynamic force, boundary condition behavior, and load path redistribution play decisive roles in governing structural stability, particularly for slender or lightly braced systems. The experimental results from these studies provide critical validation for analytical and numerical models and offer insight into how localized failures or stiffness degradation can lead to global instability. Although MCWPs are not typically subjected to seismic loading, the experimental methodologies and findings from shaking table studies are highly relevant, as MCWPs are similarly slender structures whose stability depends strongly on anchorage performance and force redistribution under dynamic working conditions.
In addition, although the loading limits on the anchorages of each MCWP are usually specified in a User’s Manual [28], it is unknown whether the dynamic reaction forces could go beyond those limits and what their statistical distribution patterns might be. Such knowledge is important for improving mast anchorage design and installation. The specific aims of this study were to develop an instrumented anchorage using strain gauges and to apply it to confirm/identify the characteristics of the anchorage reaction forces through a series of laboratory and field experiments. While the experiments were designed primarily for testing and evaluating the instrumented anchorages, the experimental results can also enhance the understanding of the nature of the anchorage reaction forces.

2. Methods

2.1. Design and Calibration of an Instrumented Anchorage

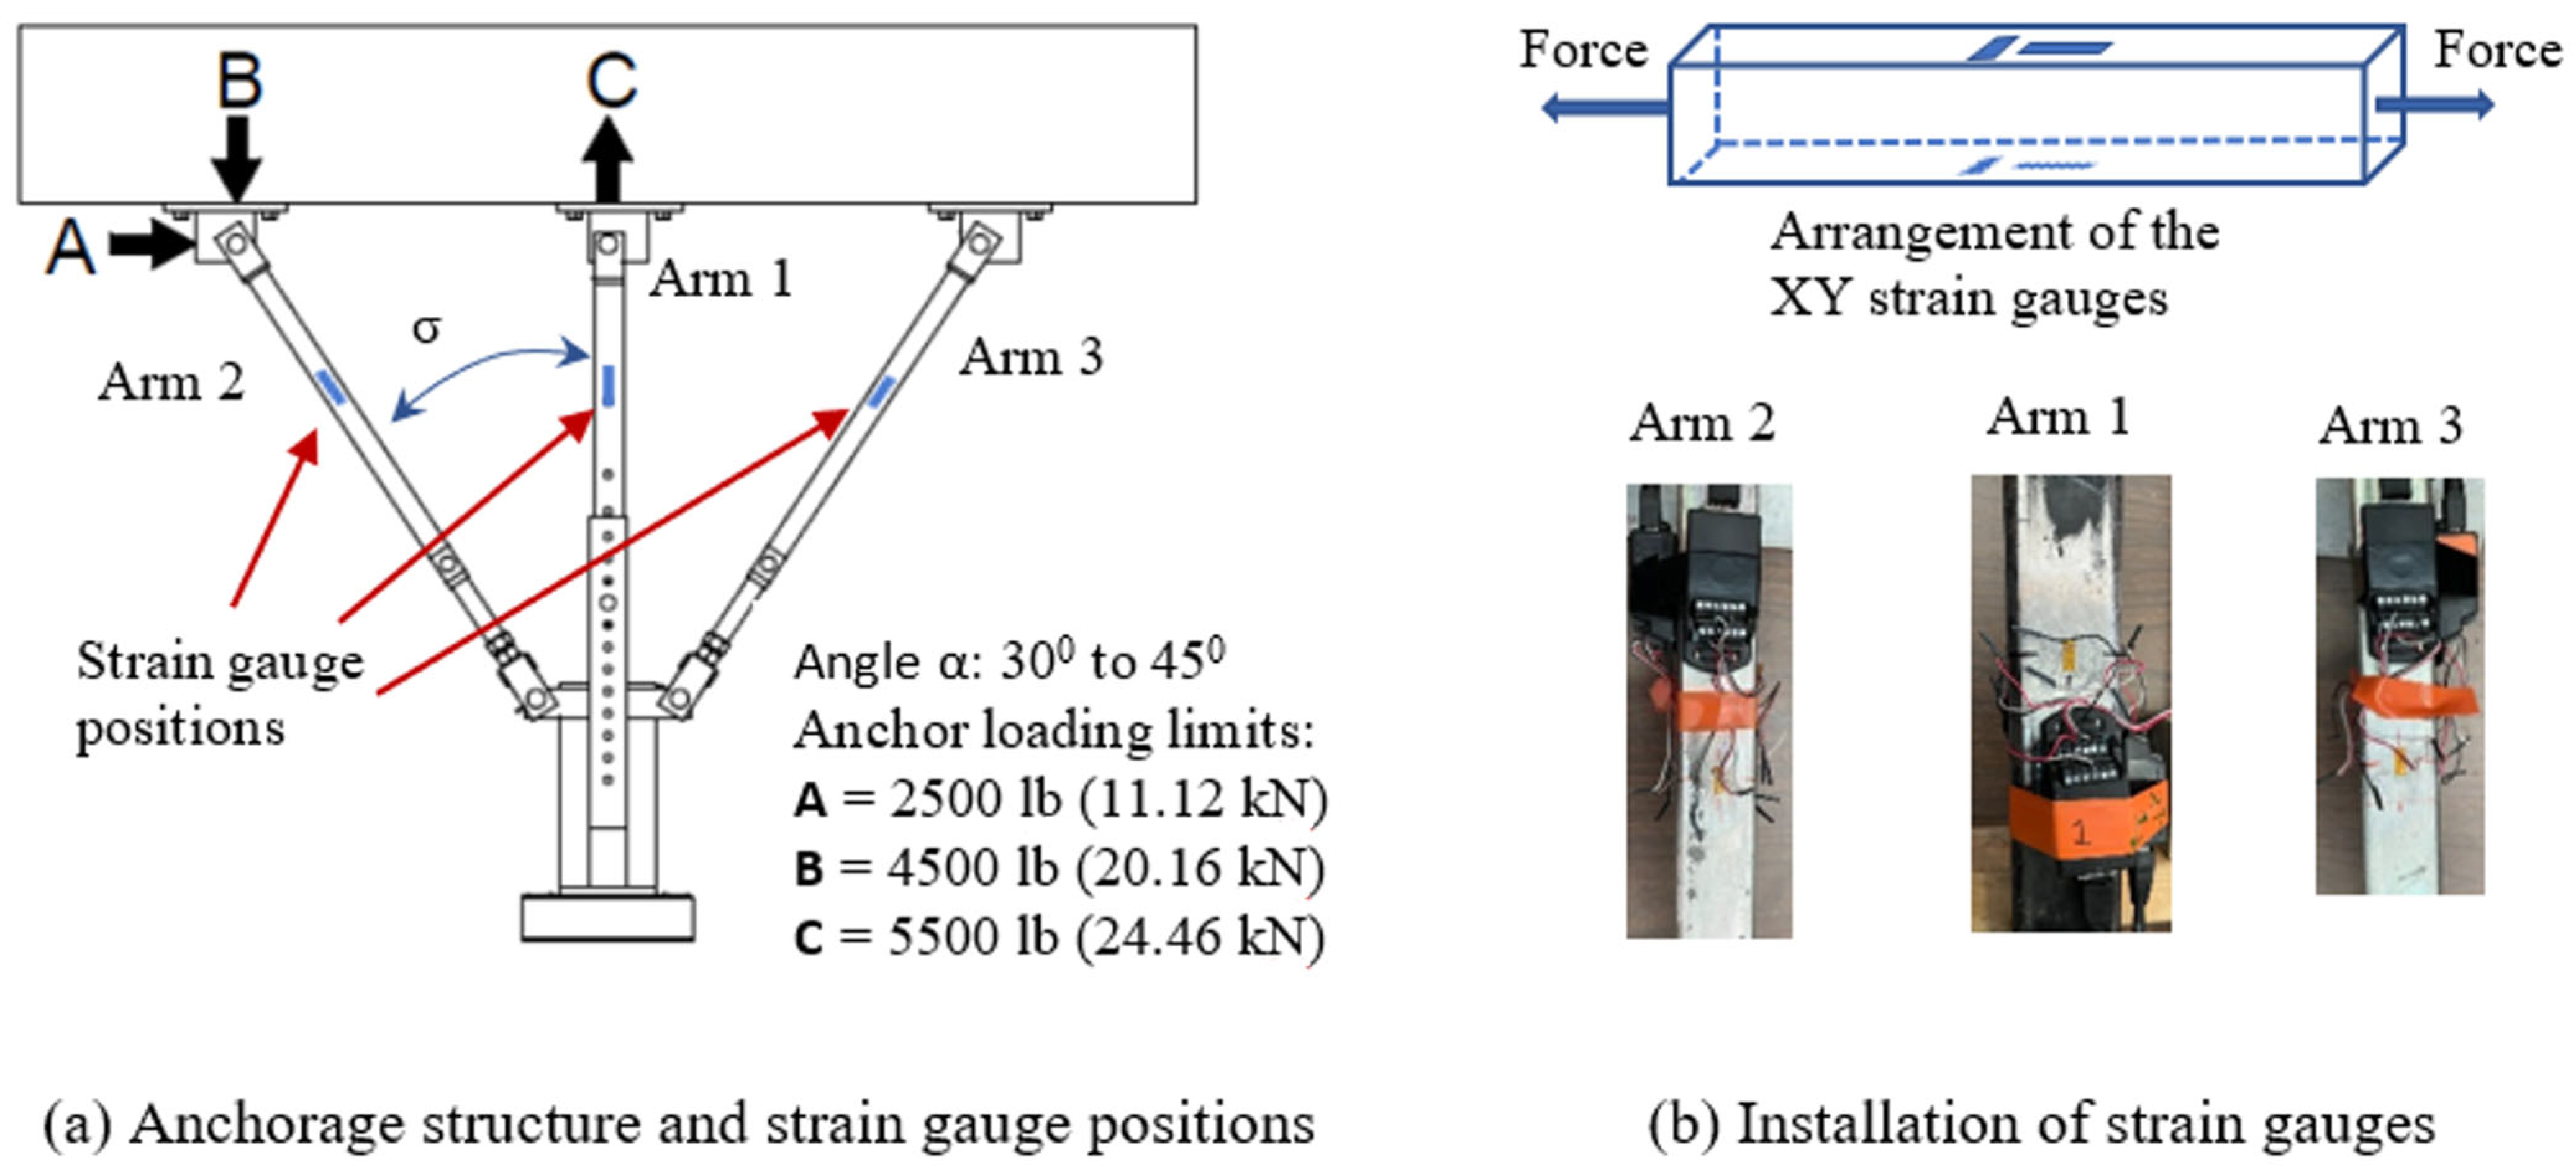
An instrumented anchorage was developed based on a typical mast anchorage regularly used on the MCWPs manufactured by FRACO Products. Its basic structure and loading limits are illustrated in Figure 1a (FRACO User’s Manual for ACT-8 [28]). Each anchorage includes three arms, which are made of steel pipes. The center arm of the anchorage is larger, while the two side arms are identical in dimensions. Each arm is connected to an attachment fixture using a pin. Each of the arms is subjected to uniaxial loading; therefore, the force should be along its longitudinal direction. The reaction forces in each anchorage can be fully determined by measuring the tension or compression strain on each of the three arms. This was achieved by installing strain gauges at the middle portion of each arm, as shown in Figure 1a,b. To minimize the effect of temperature on the force measurement, a set of XY strain gauges with a 0/900 TEE planar rosette pattern (OMEGA, SGT-3BH/350-XY11, Omega Engineering, Norwalk, CT, USA) was selected and installed on the two opposite surfaces of each arm to form a full Wheatstone bridge for the force (Figure 1b). While one full Wheatstone bridge should be sufficient, sets of strain gauges were placed on each of the arm’s four surfaces so that two full Wheatstone bridges were formed. This was done to maximize data collection at the testing site. As a result, there are six full Wheatstone bridge outputs of reaction forces measured from the three arms of each instrumented anchorage. Two instrumented anchorages were used in this study. A strain gauge module (NI 9237, National Instruments, Austin, TX, USA) with a LabView (LabView 2014, version 14.0.1) program was used to collect the force measurement. Each of the instrumented arms was first calibrated using a dead-weight method in laboratory tests. While one end of the arm was hanging on a scale connected with a hoist, a weight was placed on the other end of the arm. The initial reading for the unloaded condition was set to zero. Six different weights from 1023 N to 4493 N were applied subsequently in the calibration tests. Two trials were performed for each weight treatment.

2.2. System Experiments

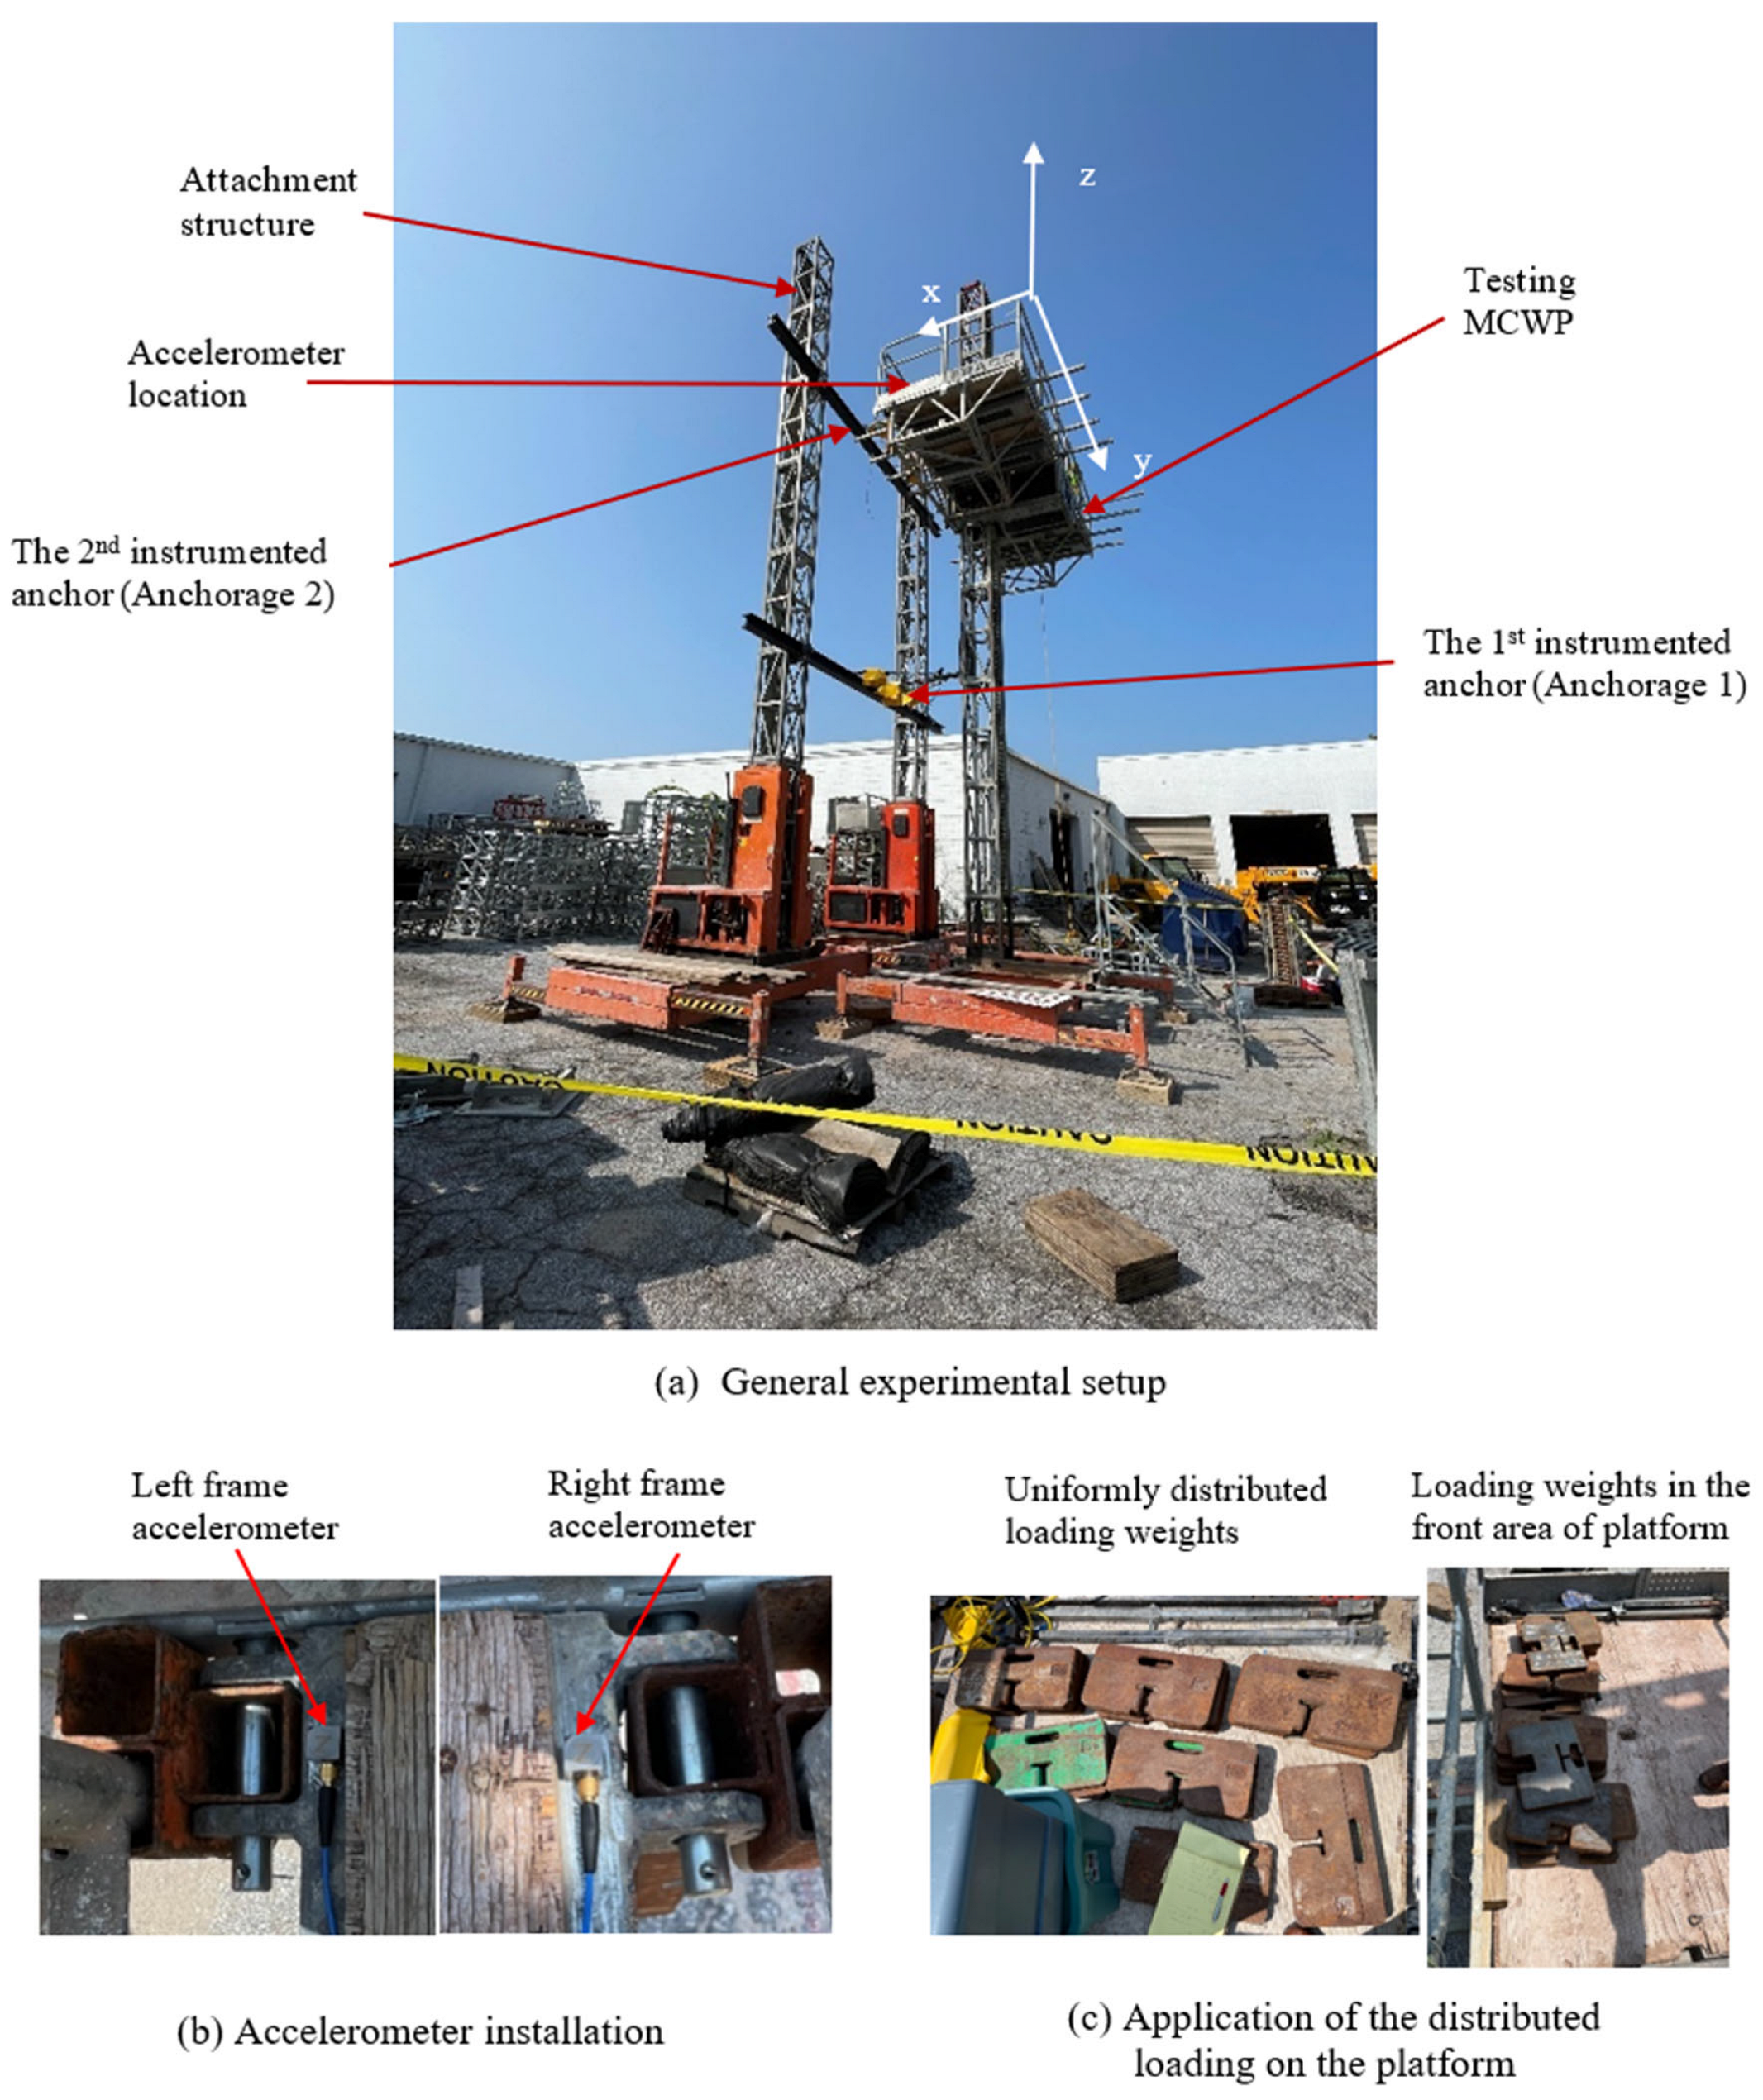
A series of experiments were conducted to evaluate the concept of using strain gauge-instrumented anchorages and to help understand the characteristics of the anchorage reaction forces at a simulated working site. A pictorial view of the experimental setup is illustrated in Figure 2. The setup included three single-mast MCWP systems (ACT-8, FRACO Inc., St. Mathias-Sur-Richelien, QC, Canada) with freestanding bases [28]. One of the MCWP was used for testing, the other two were tied together with two steel beams to serve as an attachment structure for the anchorages. To measure the anchorage reaction forces, the test MCWP was anchored to the attachment structure using the instrumented anchorages. The first anchorage was installed at a height of 10.7 feet (3.3 m) from the base, and the second anchorage was installed at 25.7 feet (7.8 m) from the base. Two tri-axial accelerometers (PCB, 356A15, PCB Piezotronics, Depew, NY, USA) were used to measure the dynamic motions on the platform. One of the accelerometers was secured, using glue, on the left and right symmetric corners of the floor frame of the platform (Figure 2b). The x-y-z orientations of each accelerometer were aligned with the platform coordinate system, as shown in Figure 2a.
The measurement instruments were set up on the platform. The reaction forces on the two anchorages were measured separately. The measurements were conducted by 3 engineers secured on the platform with personal protection devices. The total weight of the 3 engineers, together with the measurement instruments on the platform, was about 650 lb or 2.89 kN. The testing matrix included the following variables:
(1)
The platform was stationary at six distinct positions of different heights (Pi, i = 1, 2, … 6): P1 = 2.3 m; P2 = 3.3 m; P3 = 4.3 m; P4 = 6.8 m; P5 = 7.8 m; and P6 = 8.8 m. The position was measured from the ground to the platform floor. P2 was the height of the first anchor, and P5 was the height of the second anchor.
(2)
The forces and accelerations were also measured during the movement of the platform from one position to another position, for example, P1 → P3 or P3 → P1.
(3)
Besides the engineers and measurement instruments on the platform, three loading conditions were considered: (i) No load; (ii) 990 lb; and (iii) 1980 lb. The loads consisted of steel weighting blocks, each weighing 55 lb or 245 N, as shown in Figure 2c.
(4)
Two loading distributions for the 990 lb load: (i) uniformly distributed on the right side of the platform and (ii) in the front area on the left side of the platform.
(5)
Two loading distributions for the 1980 lb load: (i) uniformly distributed on both sides of the platform and (ii) in the front area on both sides of the platform, as shown in Figure 2c.
Two trials were performed for each test treatment when the platform was at each stationary height position. The time history data of the reaction force and platform accelerations were recorded for more than 20 s in each trial (usually in the range of 20 to 40 s). The sampling rate for the force measurement was 10 Hz, while that for the acceleration measurement was 100 Hz. The tests were conducted from 10 a.m. to 2 p.m. over two days. It was mostly sunny with mild wind during the testing time.

2.3. Post-Experiment Examinations of the Instrumented Anchorages

The environmental temperature at the testing site varied from 70 °F to 95 °F (21 °C to 35 °C) during the field experiments. The testing system was fully exposed to the sun during the experiment. Due to radiant heating, the temperature of the steel anchorages could be much higher than the environmental temperature. This factor likely contributed to the baseline drifts observed during the field experiment. To determine the significance of this temperature effect, a series of temperature experiments were conducted after the field experiments were completed. First, the force readings of the six instrumented arms were reset to zero in the laboratory maintained at about 73 °F (23 °C). Then, they were moved outside the laboratory and fully exposed to the sun for about 2 hrs. The force baseline drifts were recorded, together with the measurement of the surface temperature on each arm near the strain gauge location using an infrared thermometer. After another 2–3 h period outdoors, when the environmental temperature reached its highest level, another set of measurements was made. Then, the anchorages were moved back to the laboratory and were allowed to cool down for more than 2 h. The last set of measurements was then made when the temperature of the arm surface returned to room temperature. Two sequential measurements were performed for each measuring time or treatment on two separate days. Another series of calibration tests was also conducted in the laboratory at room temperature. The post-experiment calibration used the same method and procedures as those used in the original calibration tests.

3. Data Analyses and Results

3.1. Calibration Results

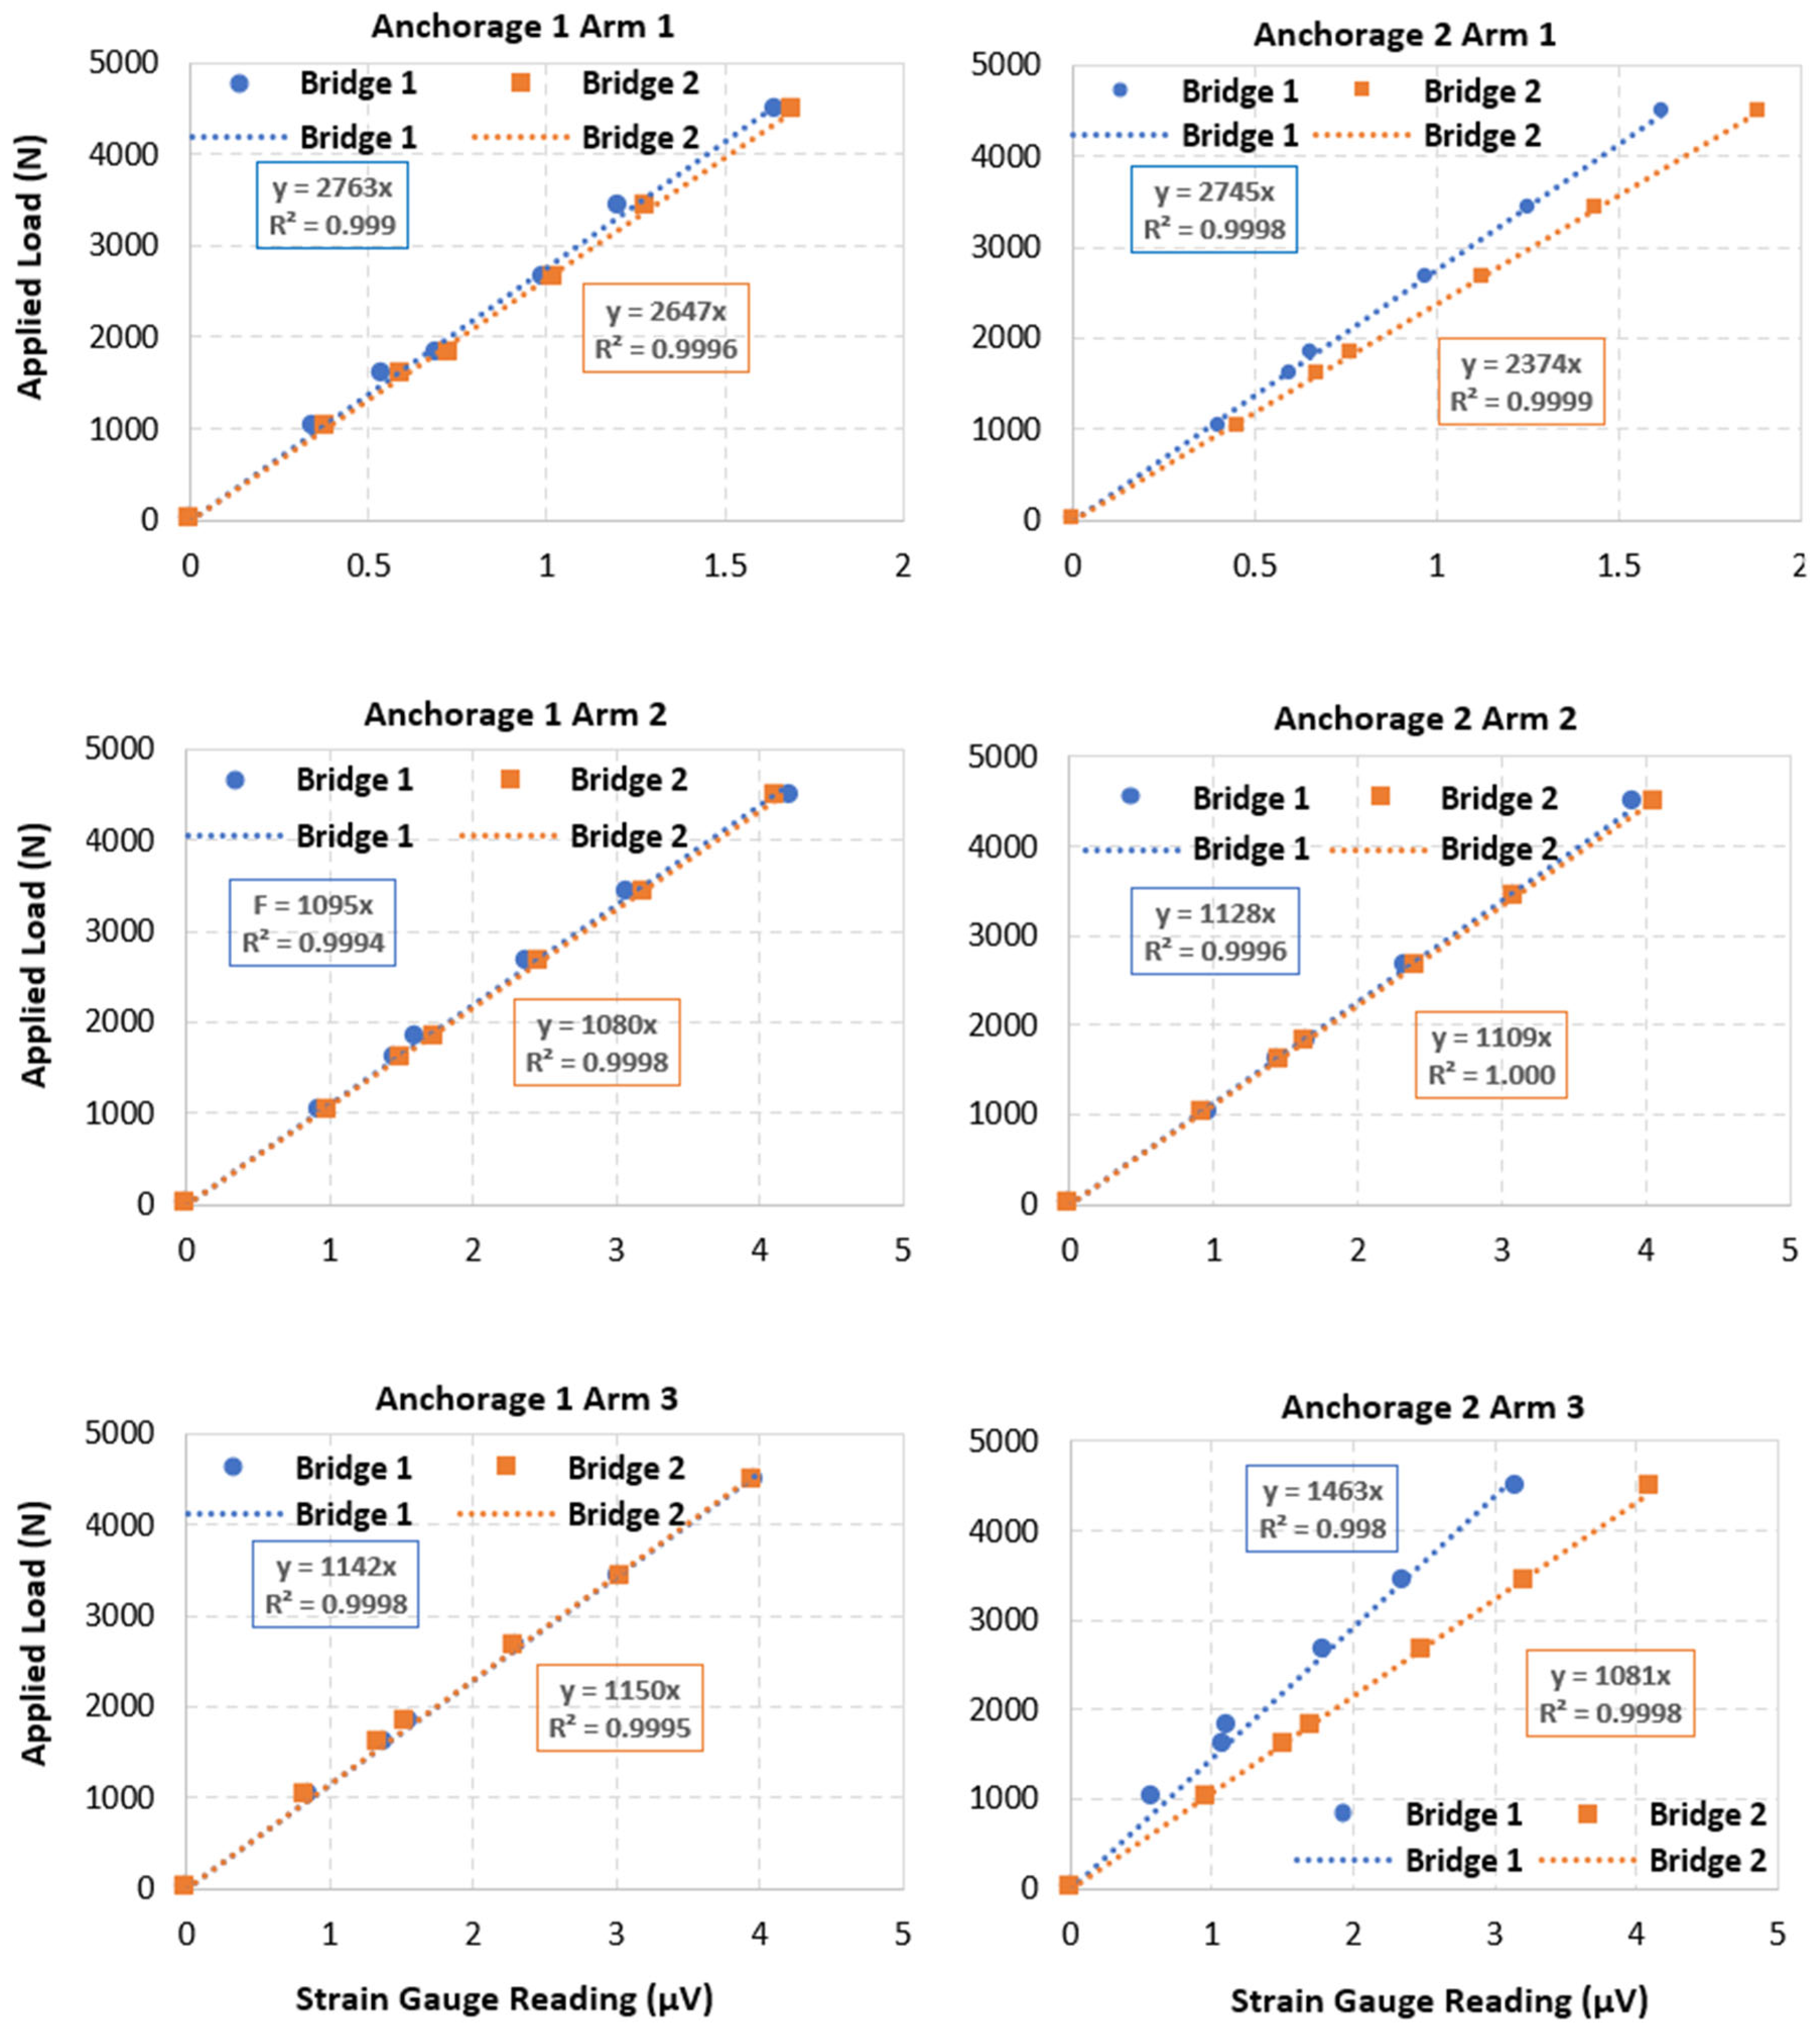
The results obtained in the initial calibration are plotted in Figure 3. The applied load and the output reading have an excellent linear relationship. In most cases, the two calibration curves on each of the three arms are identical to each other. The calibration factors determined from both the original and post-experiment calibration tests are listed in Table 1. Their differences were less than 5%, except for the first bridge on Arm 1 of Anchorage 2. The mean values of the calibration factors were used in the calculations of the anchorage reaction forces presented in the following sections.

3.2. Temperature Testing Results

Table 2 lists the baseline values of the force measured at four different times/temperatures on the arms of the two instrumented anchorages. The baseline drift generally increased with the increase in the temperature of the steel arms. The maximum drift was 1.853 kN. The drift varied among different anchorage arms and bridges. The two bridges on the same arm also had significantly different drifts. Unexpectedly, the drift did not return to the initial reading measured under room temperature after the arms were moved back to the lab and allowed to cool down to room temperature.

3.3. Dynamic Forces on the Anchorages and Their Relationships with the Platform Vibrations

The large effects of temperature on the force measurement made it impossible to determine the absolute value of the anchorage reaction force. The effects, however, should not significantly affect the dynamic component of the force or the relative change in the static component of the force when measured over a short period. The dynamic force (FDynamic) can be identified from the total force (FTotal) by subtracting its static component (FStatic) that can be taken as the mean of the total force measured in each trial:
F D y n a m i c t = F T o t a l t F S t a t i c = F T o t a l t   1 N i = 1 N F T o t a l i
where t is time, N is the number of points measured in the trial, and F S t a t i c was calculated as the average of F T o t a l over the measurement trial.
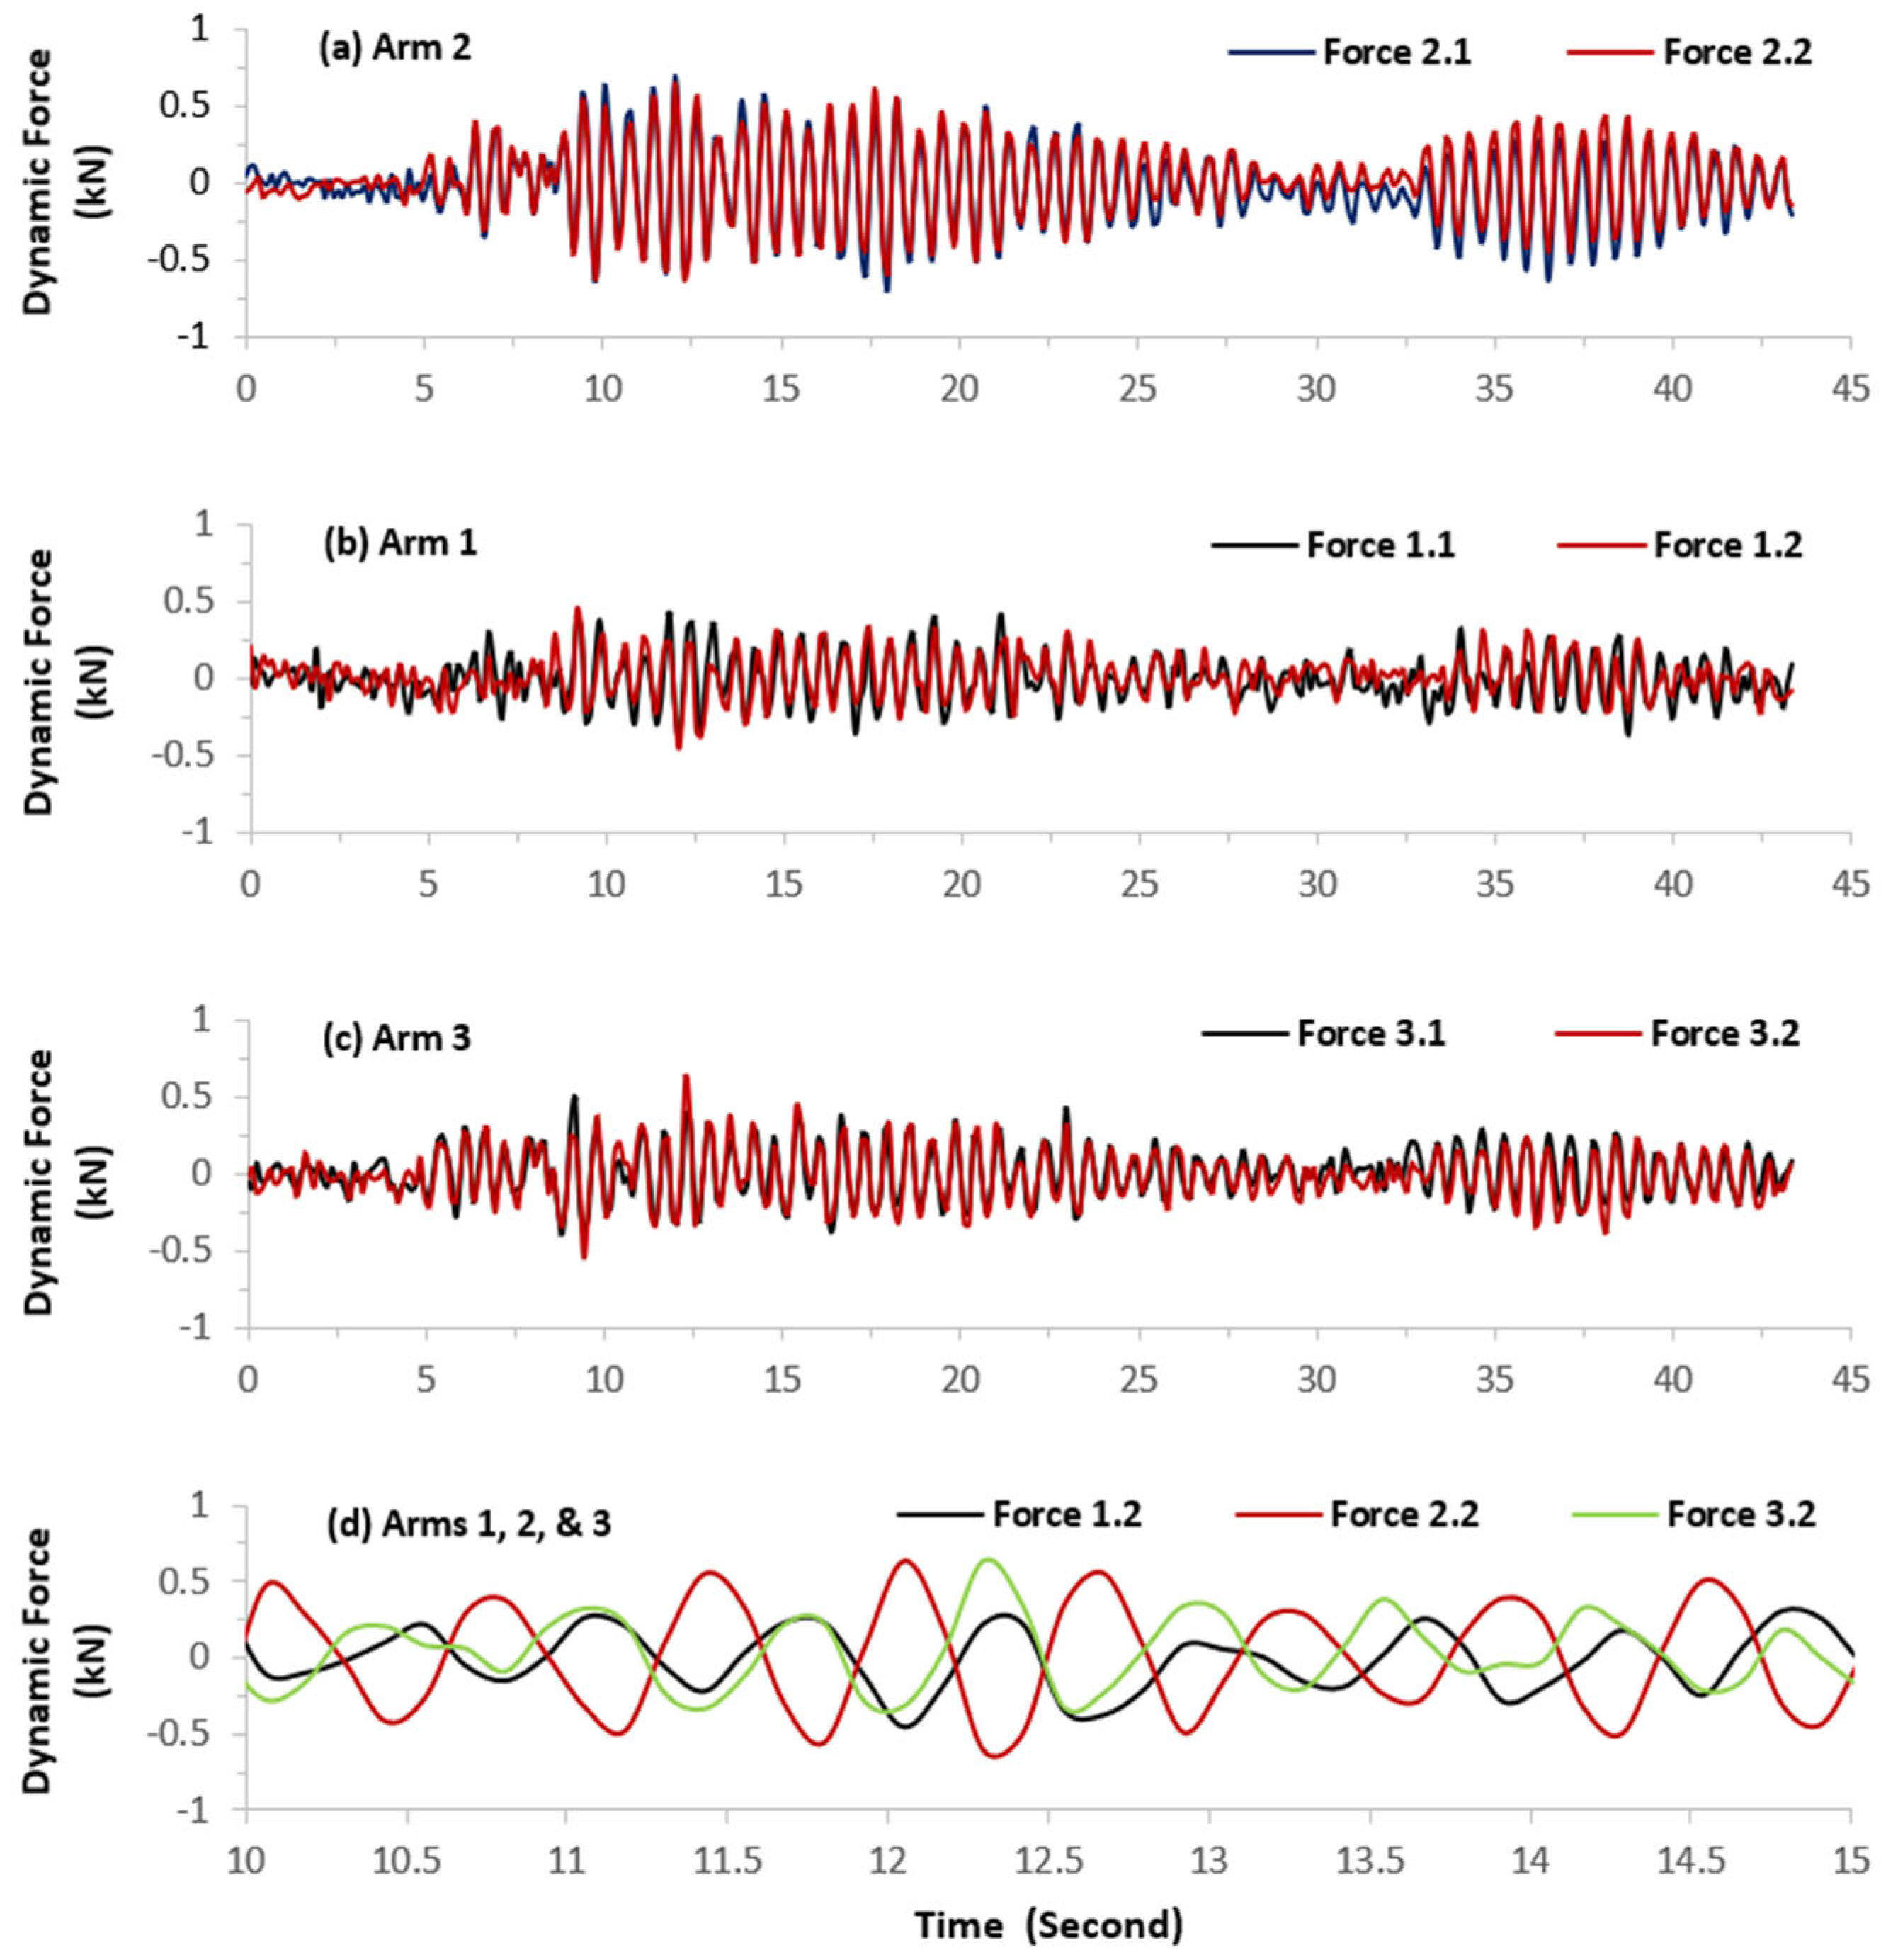
As examples, Figure 4 illustrates the time histories of the dynamic forces measured in one of the trials on the first anchorage when the platform was stationary at P3 (4.3 m from the ground). The dynamic forces in this case were mostly caused by the movements of the people on the platform. The dynamic forces measured with the two different full Wheatstone bridges on each arm were very similar to each other, which suggests that the strain gauges worked as expected. This also confirms that the reaction force on each arm of the anchorage was primarily along the axial direction of the arm. Although the anchorage structure is symmetric, the magnitudes of the dynamic forces were not symmetrically distributed in the three arms; the dynamic force on Arm 2 (Force 2.1 or 2.2) was generally larger than those on Arm 1 and Arm 3 under these testing treatments. Besides the differences in their magnitudes, the dynamic forces on the three arms also have significant differences in their phases, as shown in Figure 4d. The dynamic force on Arm 2 (Force 2.1) was almost in the opposite phase to those on Arm 1 and Arm 3 (Force 1.1 and Force 3.1). However, the dynamic forces on the three arms had the same dominant vibration frequency, which was about 1.6 Hz.
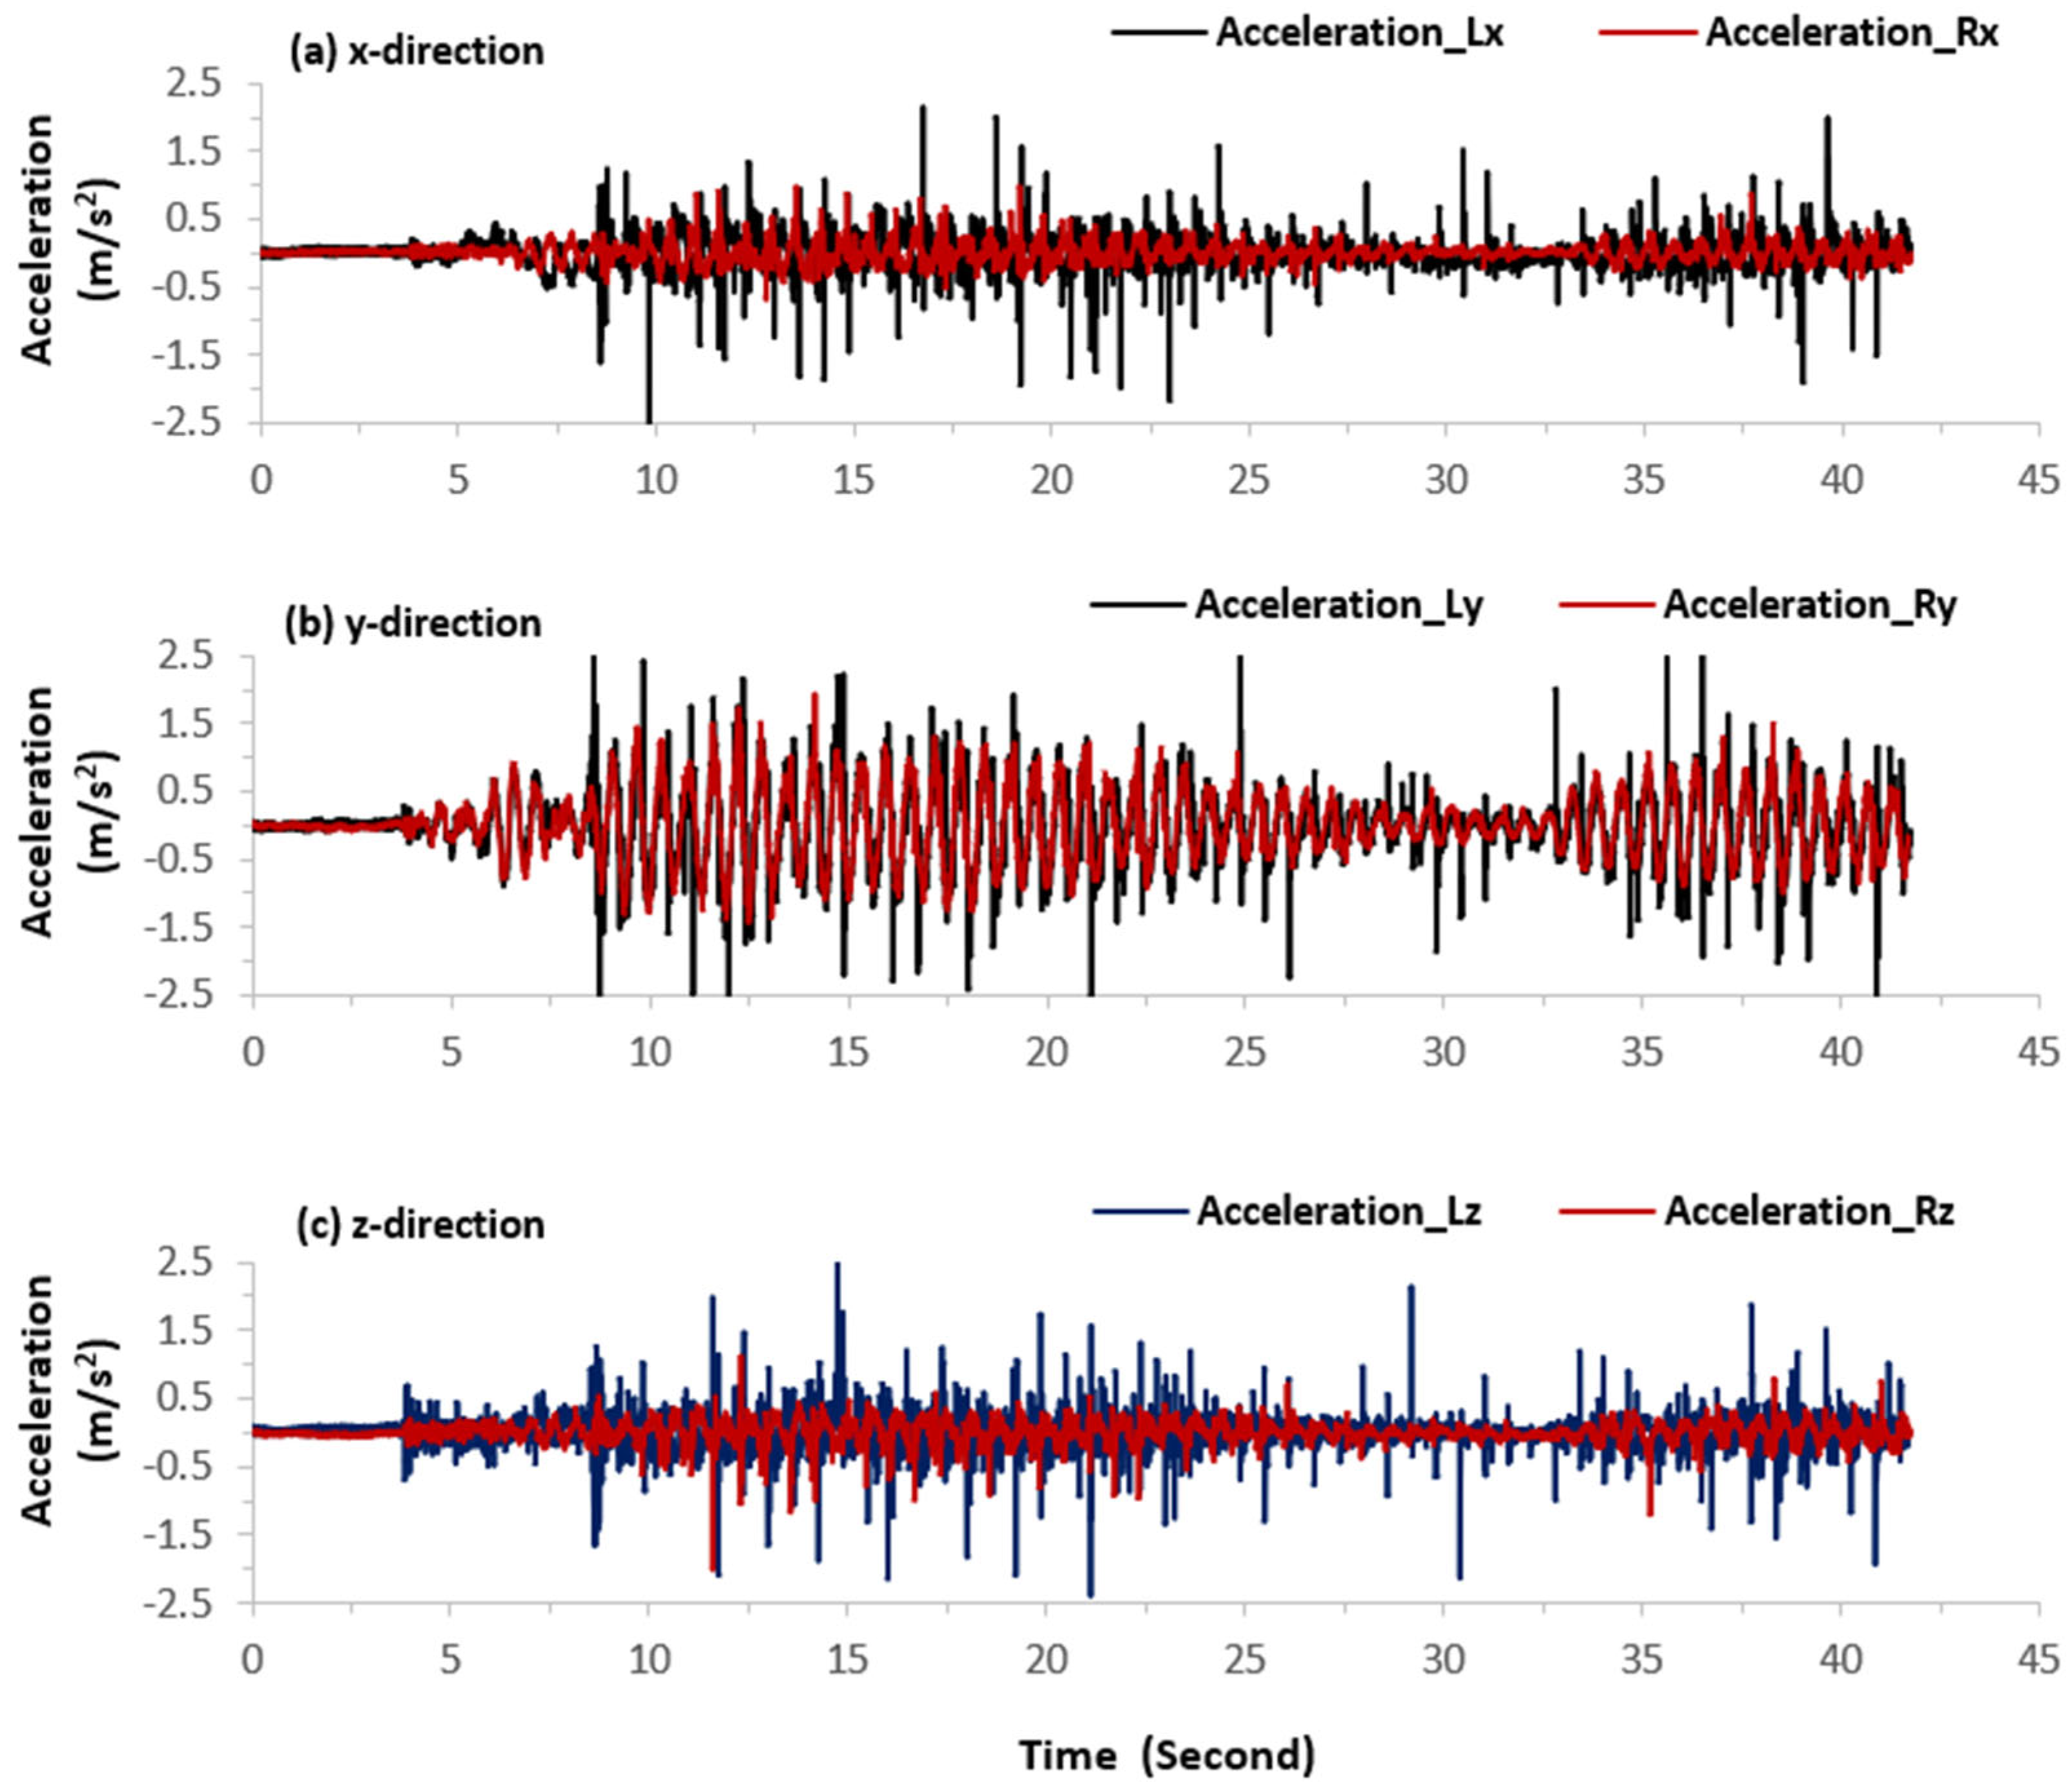
Figure 5 illustrates the time histories of the accelerations corresponding to the dynamic forces shown in Figure 4. The vibration accelerations also had the same major vibration frequency (1.6 Hz) as that of the dynamic forces. As shown in Figure 5a, the acceleration of the dominant vibration frequency measured on the left side of the platform was not in phase with that measured on the right side. This indicates that, besides some translational vibration in the x-direction, the platform also had some yaw or rotational vibration around the z-axis. The two accelerations measured in the y-direction had a clear sinusoidal vibration pattern that was observed in the reaction forces shown in Figure 4. Also, the vibration accelerations measured at the two locations were in phase. Their magnitudes were also similar. These observations indicate that the platform had a translational vibration at the dominant frequency. Like that observed in the x-direction, the two accelerations in the z-direction at the dominant vibration frequency were also out of phase. This indicates that, besides some vibration in the vertical direction, the platform had some rotational vibration around the x-axis of the platform.
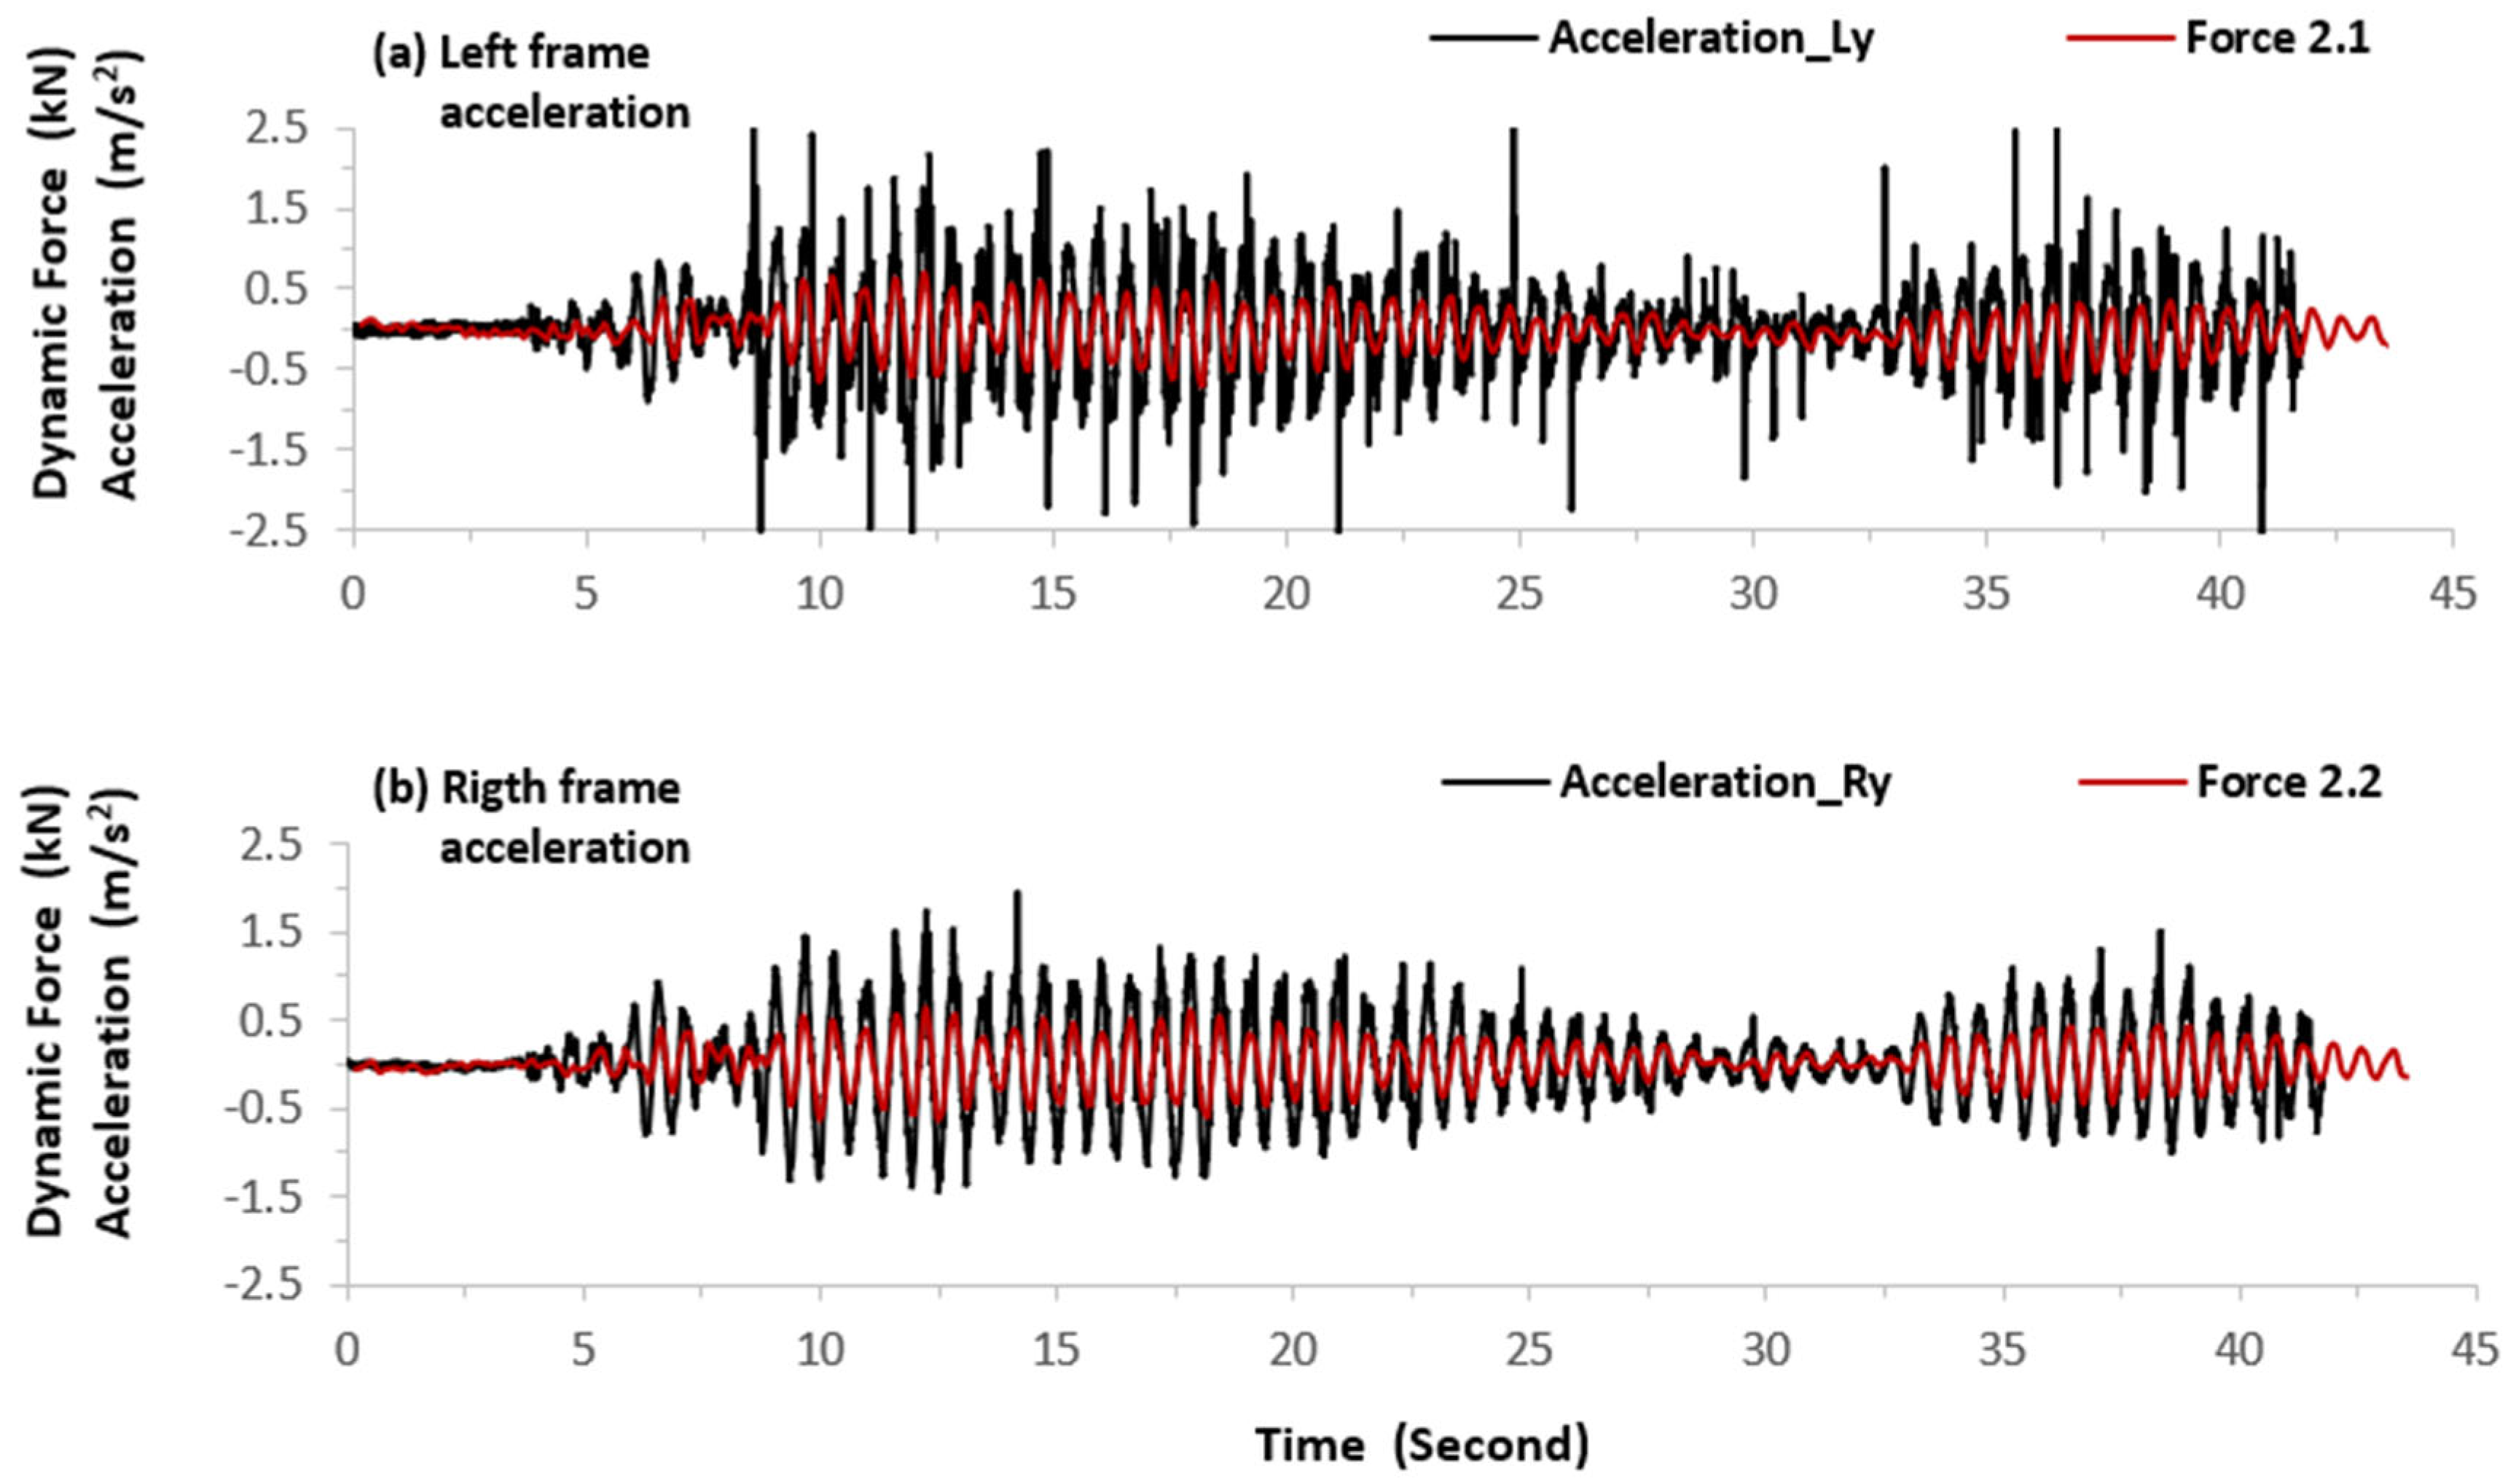
To further examine the relationship between platform motions and the anchorage dynamic forces, the representative accelerations measured in the y-direction are plotted in Figure 6, together with the representative dynamic forces measured on Arm 2. As expected, they generally matched very well.
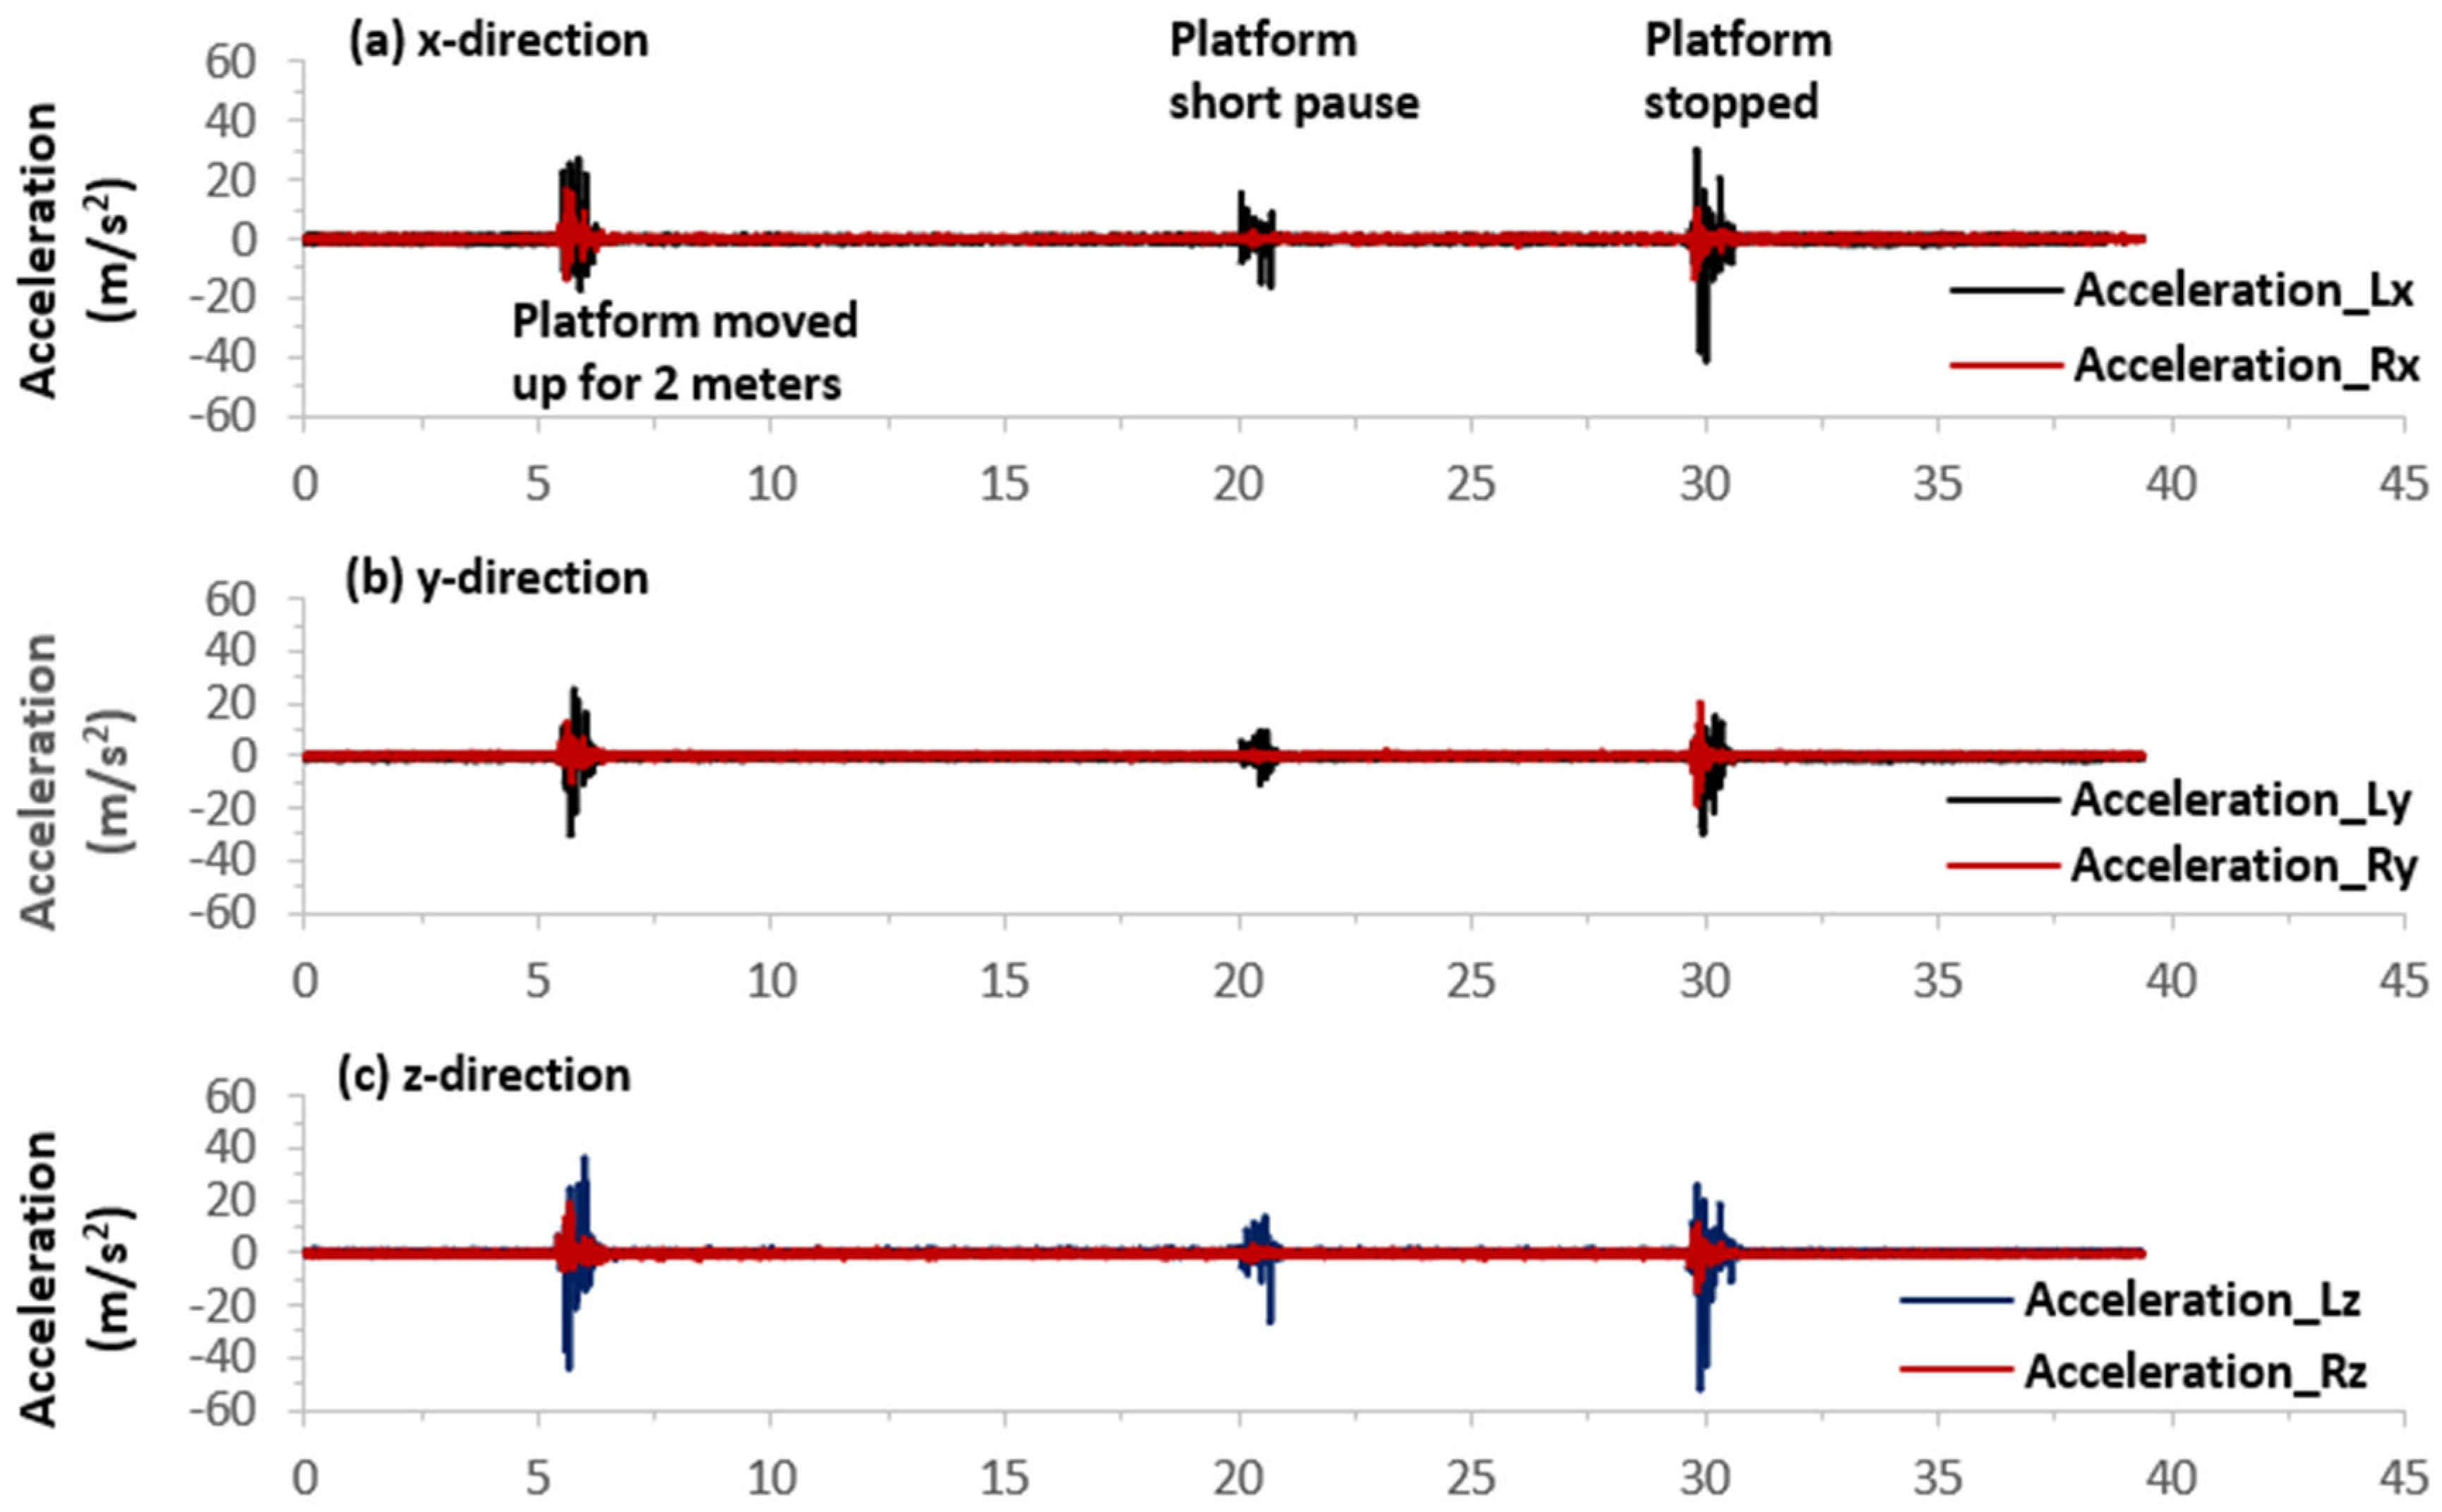
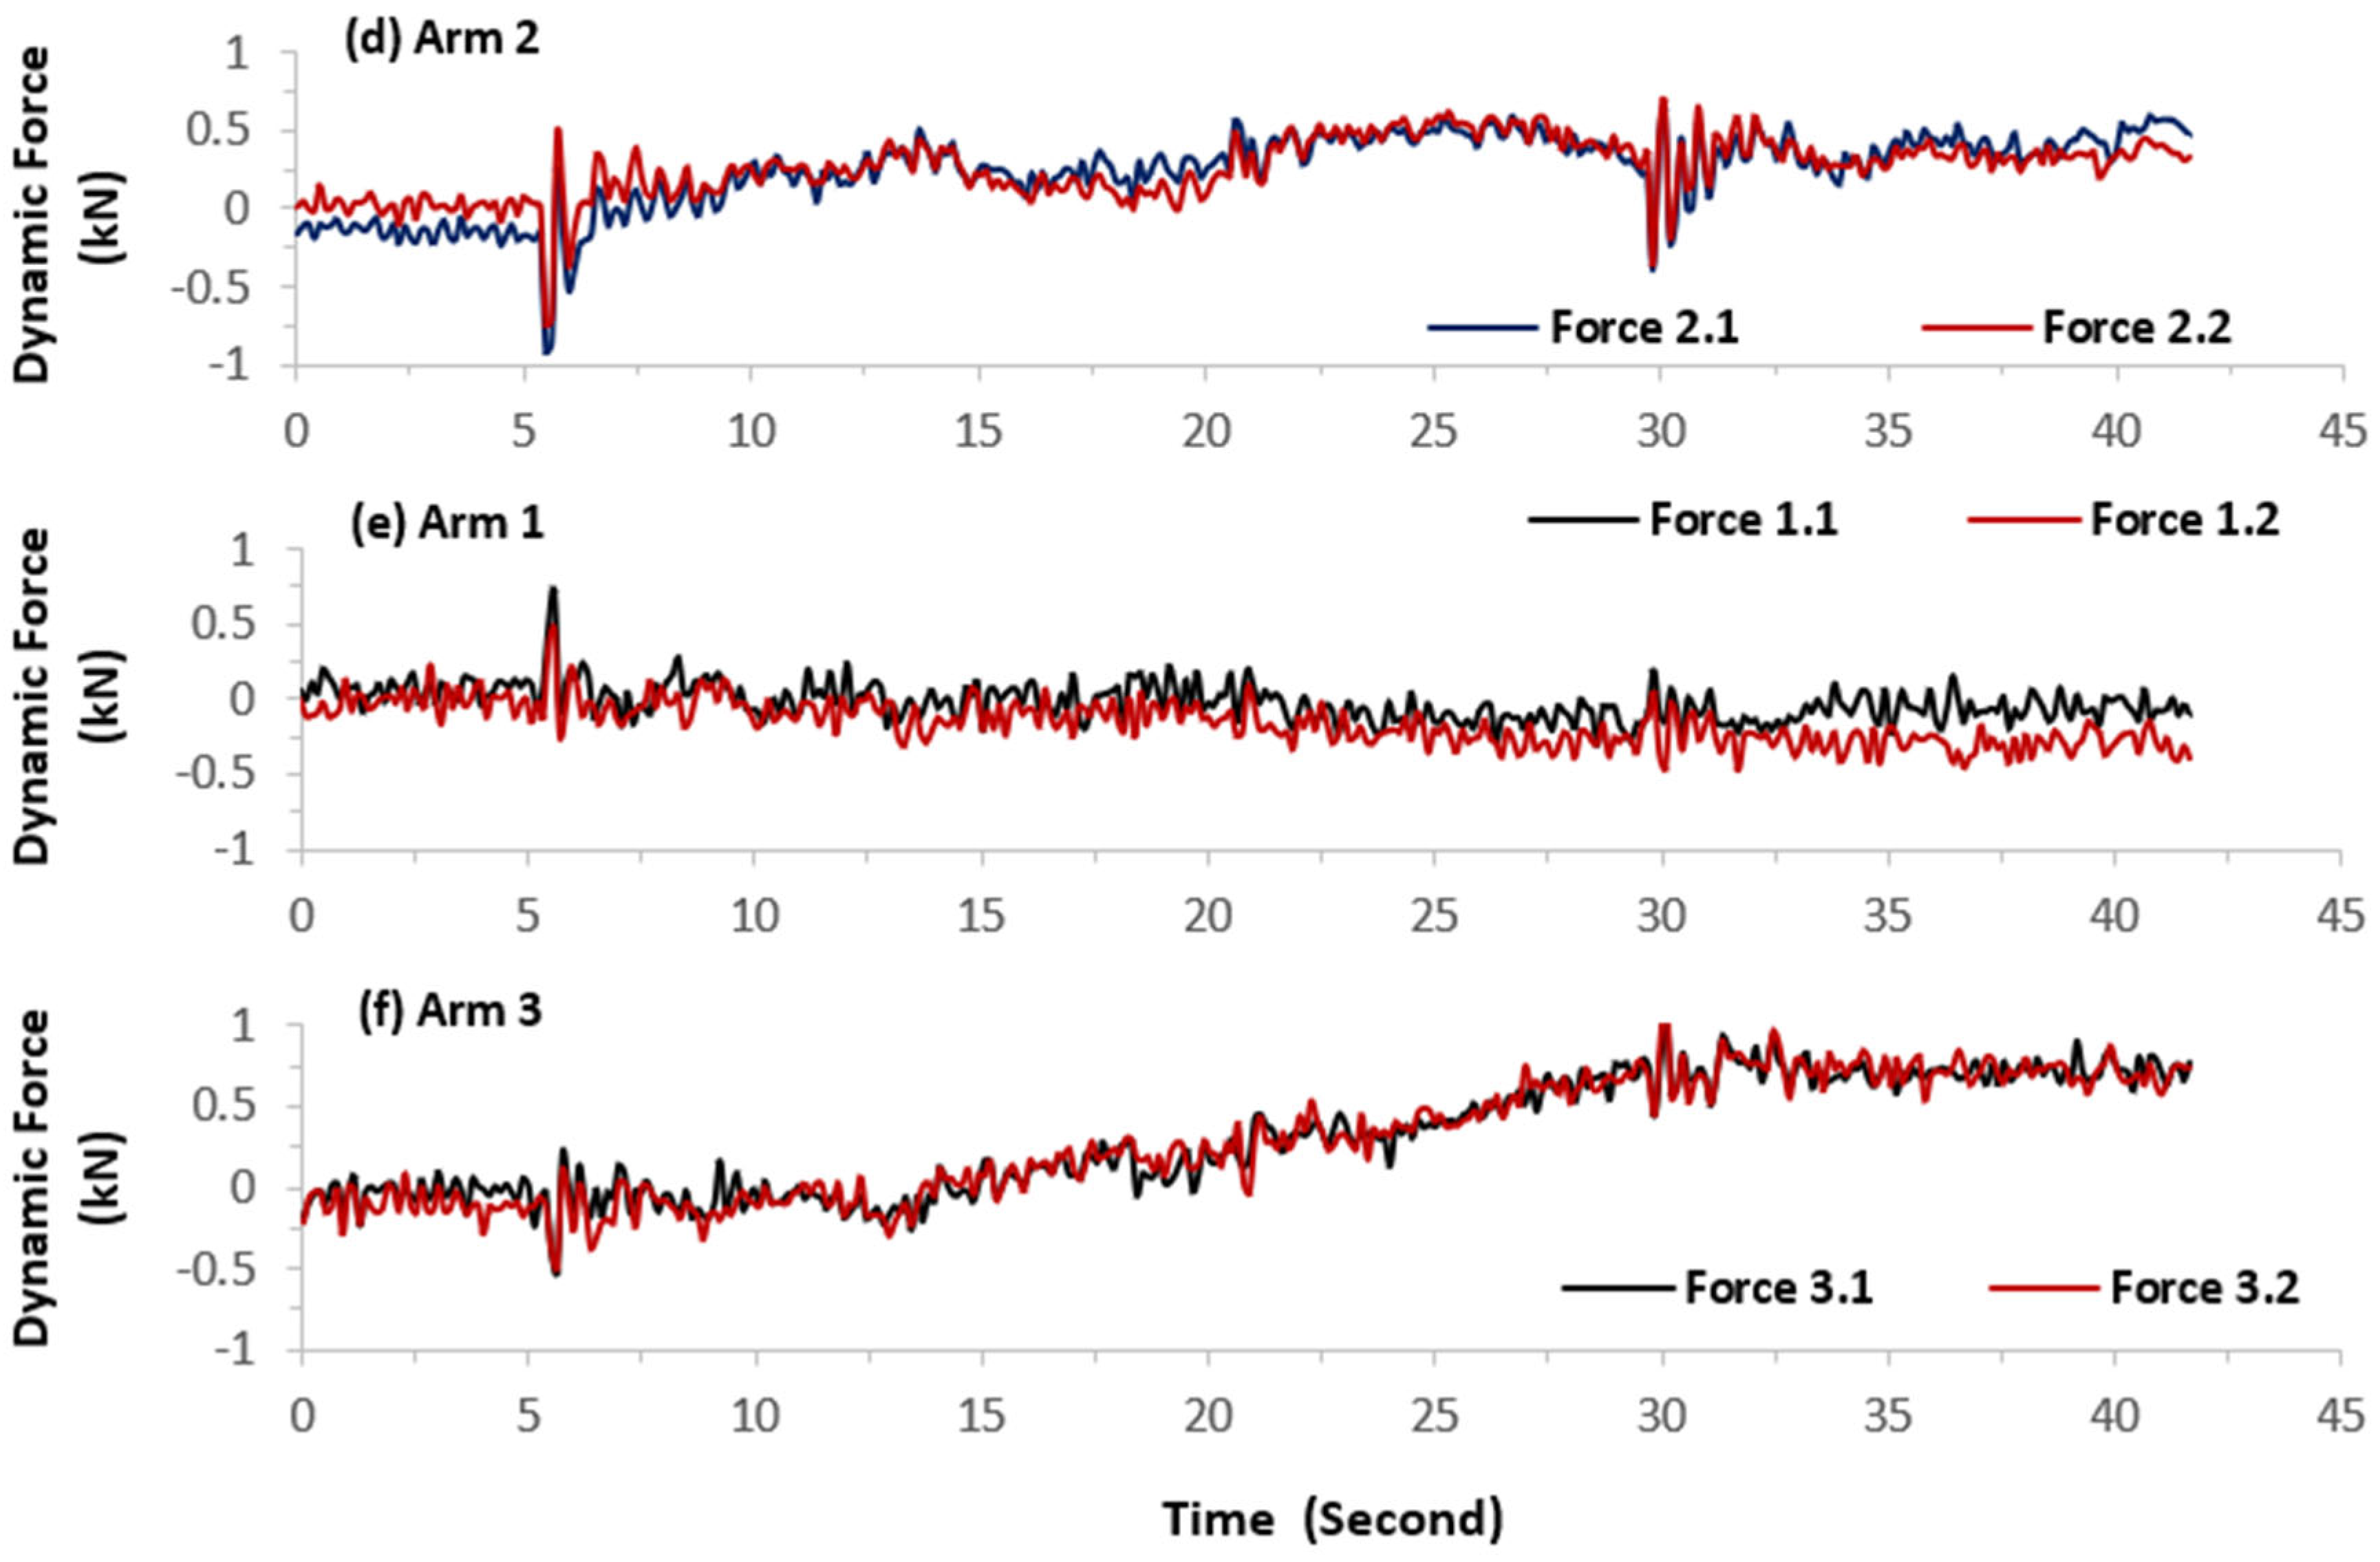
Figure 7 illustrates the time histories of platform accelerations and anchorage dynamic forces measured while moving the platform from P1 to P3. The elevator engine was on during the entire measurement, which doubled the baseline noise level of the acceleration. Large shock accelerations of the platform were generated when starting and stopping the platform. In some cases, the peak shock accelerations were more than 4 g or 40 m/s2, as shown in Figure 7c. Except for these transient shocks, the accelerations were generally at their noise levels. This indicates that, besides the transition periods, platform movement along the mast at a constant speed did not cause substantial vibration of the platform. As expected, the transient shocks resulted in some dynamic forces in the anchorage, as shown in Figure 7d–f. Besides the transient shock forces, platform movement also caused some changes in the static component of the force measured on each arm of the anchorage. The operation of the screw mechanism (e.g., rack-and-pinion and ratchet drive) may also contribute to the anchorage dynamic forces. To clearly identify such effects, each force shown in Figure 7d–f is the relative force (FRelative) calculated using the following formula:
F R e l a t i v e t = F T o t a l t F R e f e r e n c e S t a t i c = F T o t a l t 1 N i = 1 N F R e f e r e n c e T o t a l i
where t is time, and F R e f e r e n c e S t a t i c is the average baseline force measured when the platform was stationary at position P1 on the mast.

3.4. The Relative Static Component of the Anchorage Reaction Force

The results shown in Figure 7d–f also reveal that the effect of platform height on the static force varied with the specific arm of the anchorage. To examine the effect of the platform position and applied load on the total force on each anchor, the relative anchorage force in the x-direction (FRelative anchorage-x) was calculated using the following formula:
F R e l a t i v e   a n c h o r a g e x = 1 2 F 1.1 + F 1.2 + ( F 2.1 + F 2.2 + F 3.1 + F 3.2 ) cos α
As shown in Figure 1a, Fi.j (i = 1, 2, 3; j = 1, 2) is the relative force on Arm i and Bridge j, calculated using Equation (2). The angle α is taken as 30°, corresponding to the anchorage installation configuration adopted in this study. The x-direction is defined in Figure 2a and aligns with Arm 1 in Figure 1a. Therefore, for Arms 2 and 3, only the force components projected onto the x-direction are considered.
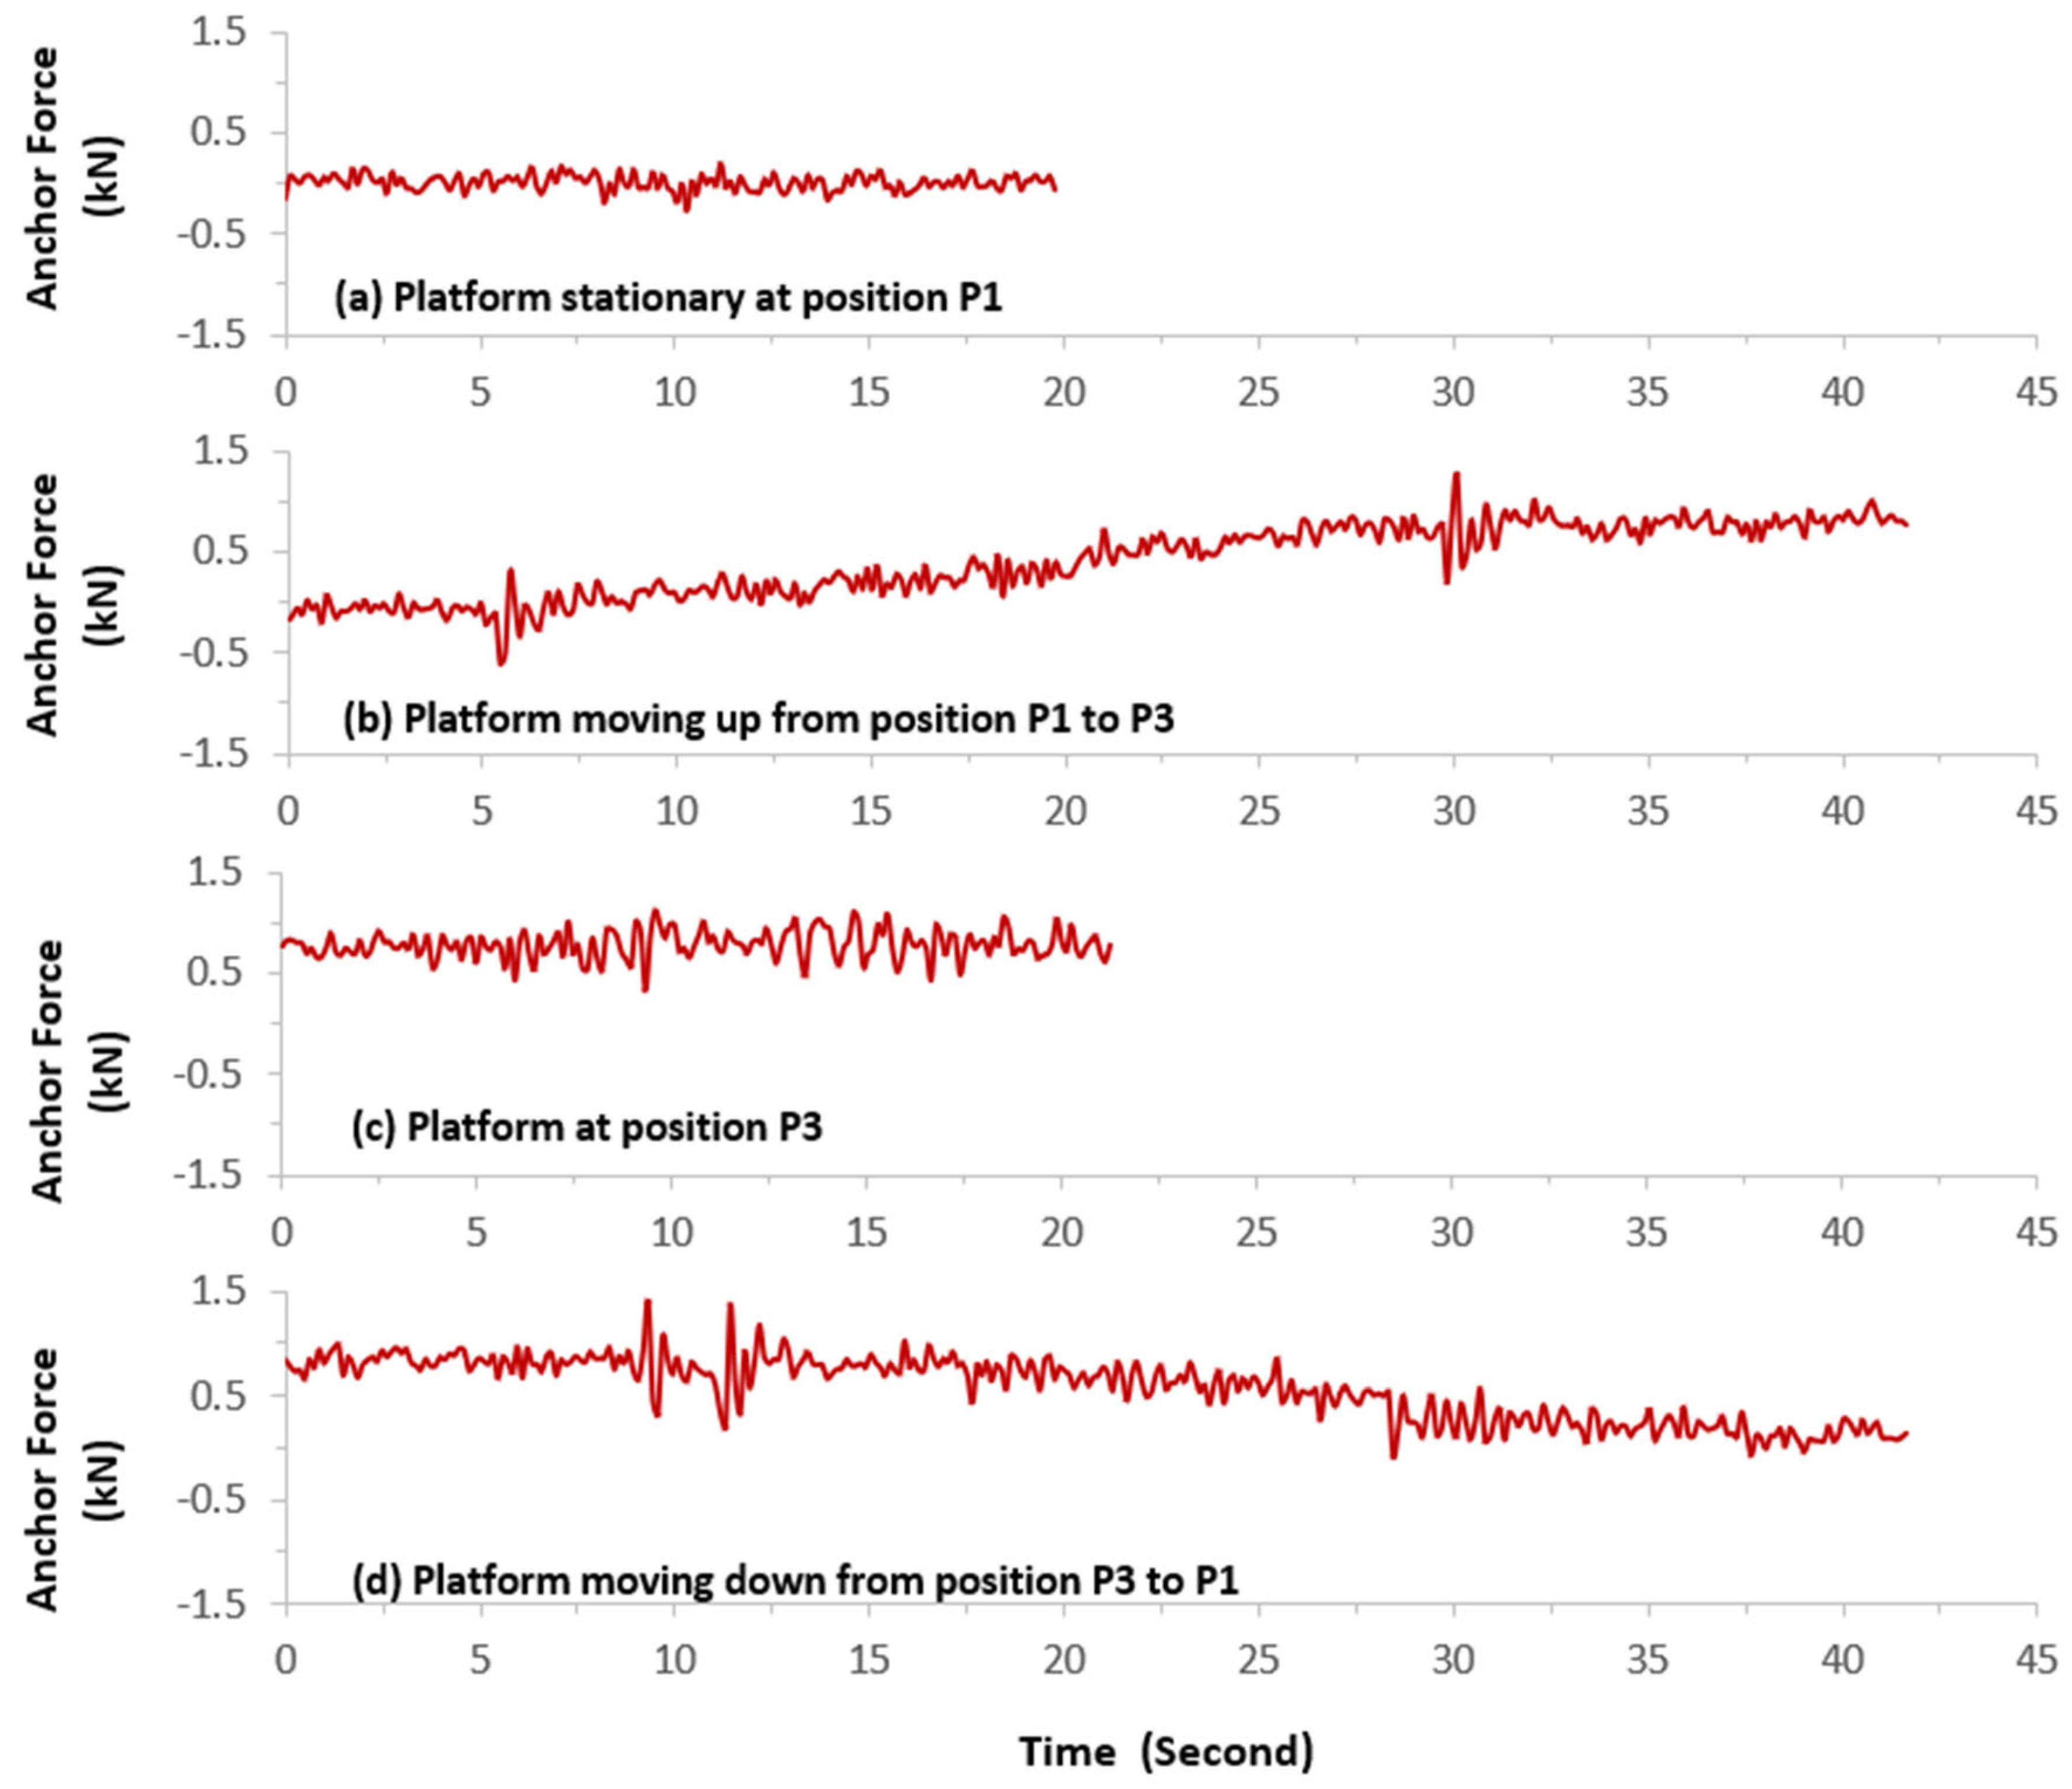
For example, Figure 8 illustrates the time histories of the relative forces for several different test treatments. When the platform was stationary at position P1 (reference position for measuring the baseline), the total anchorage force also remained stationary (Figure 8a). When the platform moved up from position P1 to P3, the total anchorage force increased (Figure 8b). It maintained the increase in total anchorage force at the higher level (Figure 8c) when the platform stayed at this position. As expected, it returned to its initial level when the platform moved down from position P3 to P1 (Figure 8d).
As shown from the data in Table 2 and the force data illustrated in Figure 7 and Figure 8, the possible environmental and temperature effects on the force measurement observed in this study could be larger than the anchorage forces resulting from changes in the platform position and the limited loads applied on the platform. This made it difficult to accurately quantify the effects of the platform position and applied load on the anchorage forces. However, the relative changes in the forces estimated using Equation (3) may reveal some useful information on the position and loading effects. For this purpose, the mean value of the relative anchorage force measured at position P1 on the same testing day with no load applied to the platform was used as the reference for comparing the force values measured under different platform positions and load treatments. The mean values of the relative static forces for the first anchorage are listed in Table 3. To make it easier for a direct comparison, the reference value in the table was set to zero. Each series of force data in the time history included more than 150 points. For simplicity, the significant difference between two series of data was determined using a t-test (Array1, Array 2, 2 tails, Type-3 (heteroscedastic)) in Excel. The results indicate that increasing the platform height statistically significantly increased the anchorage total force (p < 0.001). Increasing the platform load generally increased the difference among anchorage static forces at different platform heights (p < 0.001), which confirms that the load is also a statistically significant influencing factor. The data also suggests that there is an interaction between the applied load and the loading position on the platform.
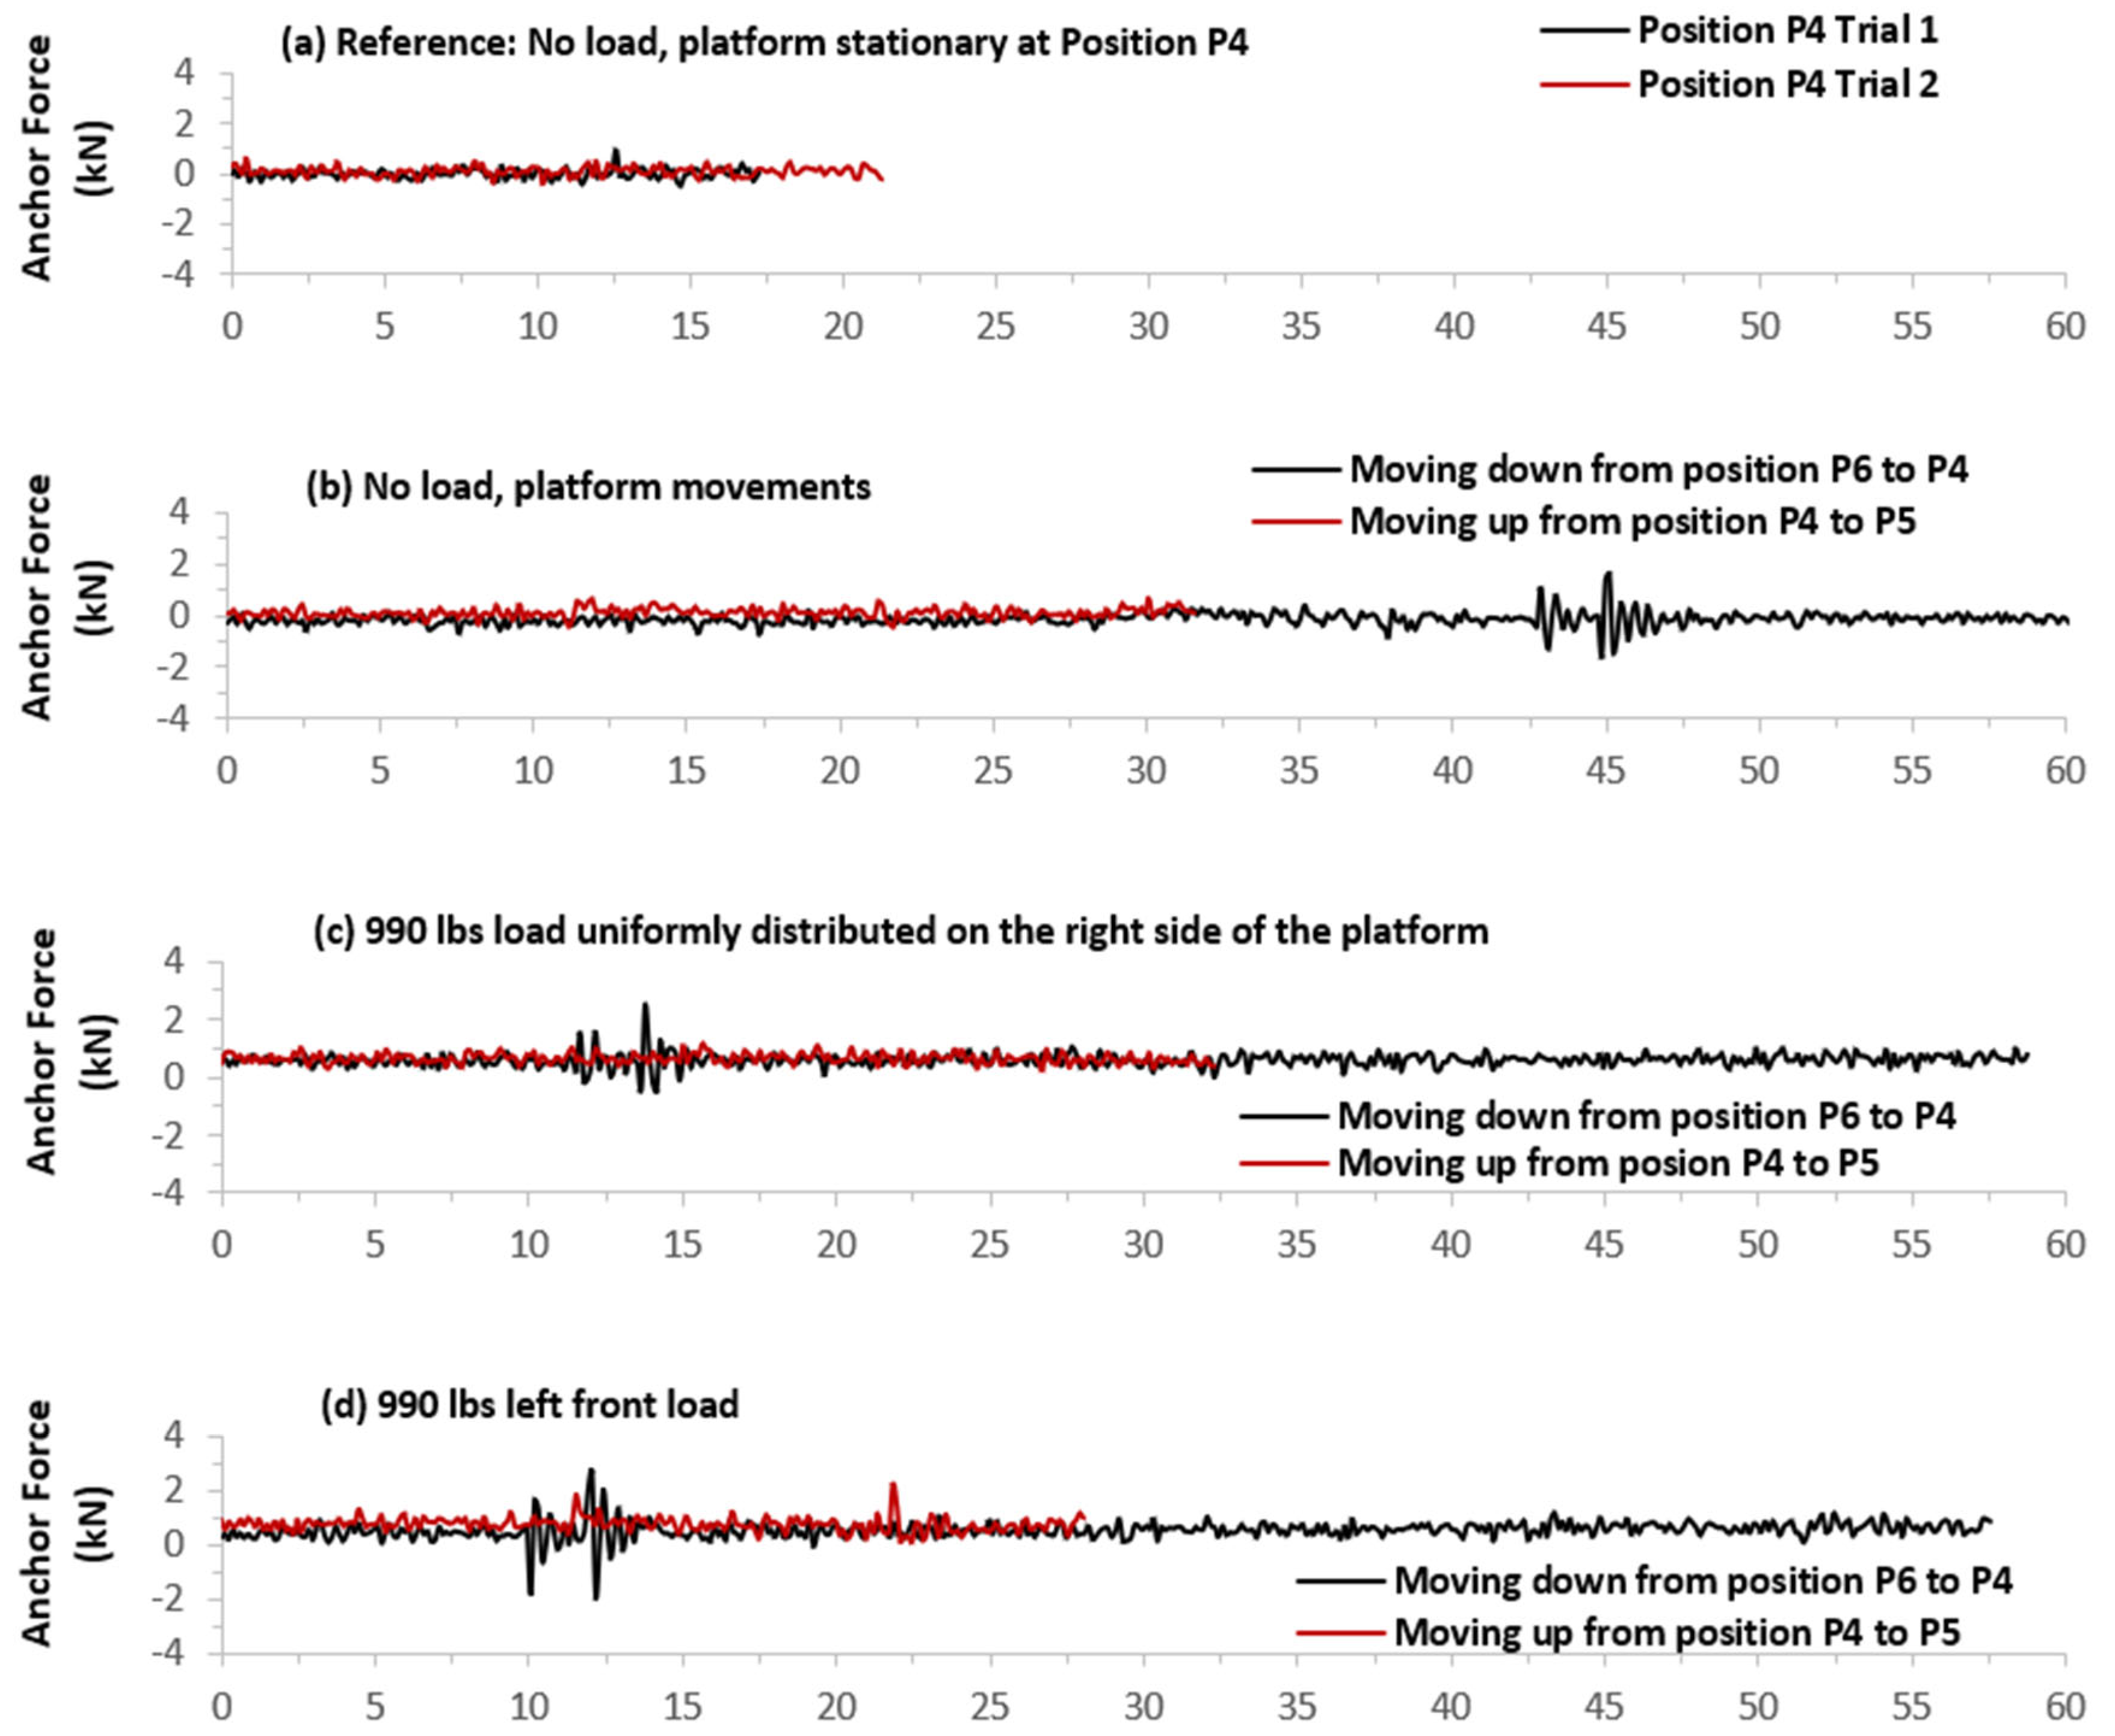
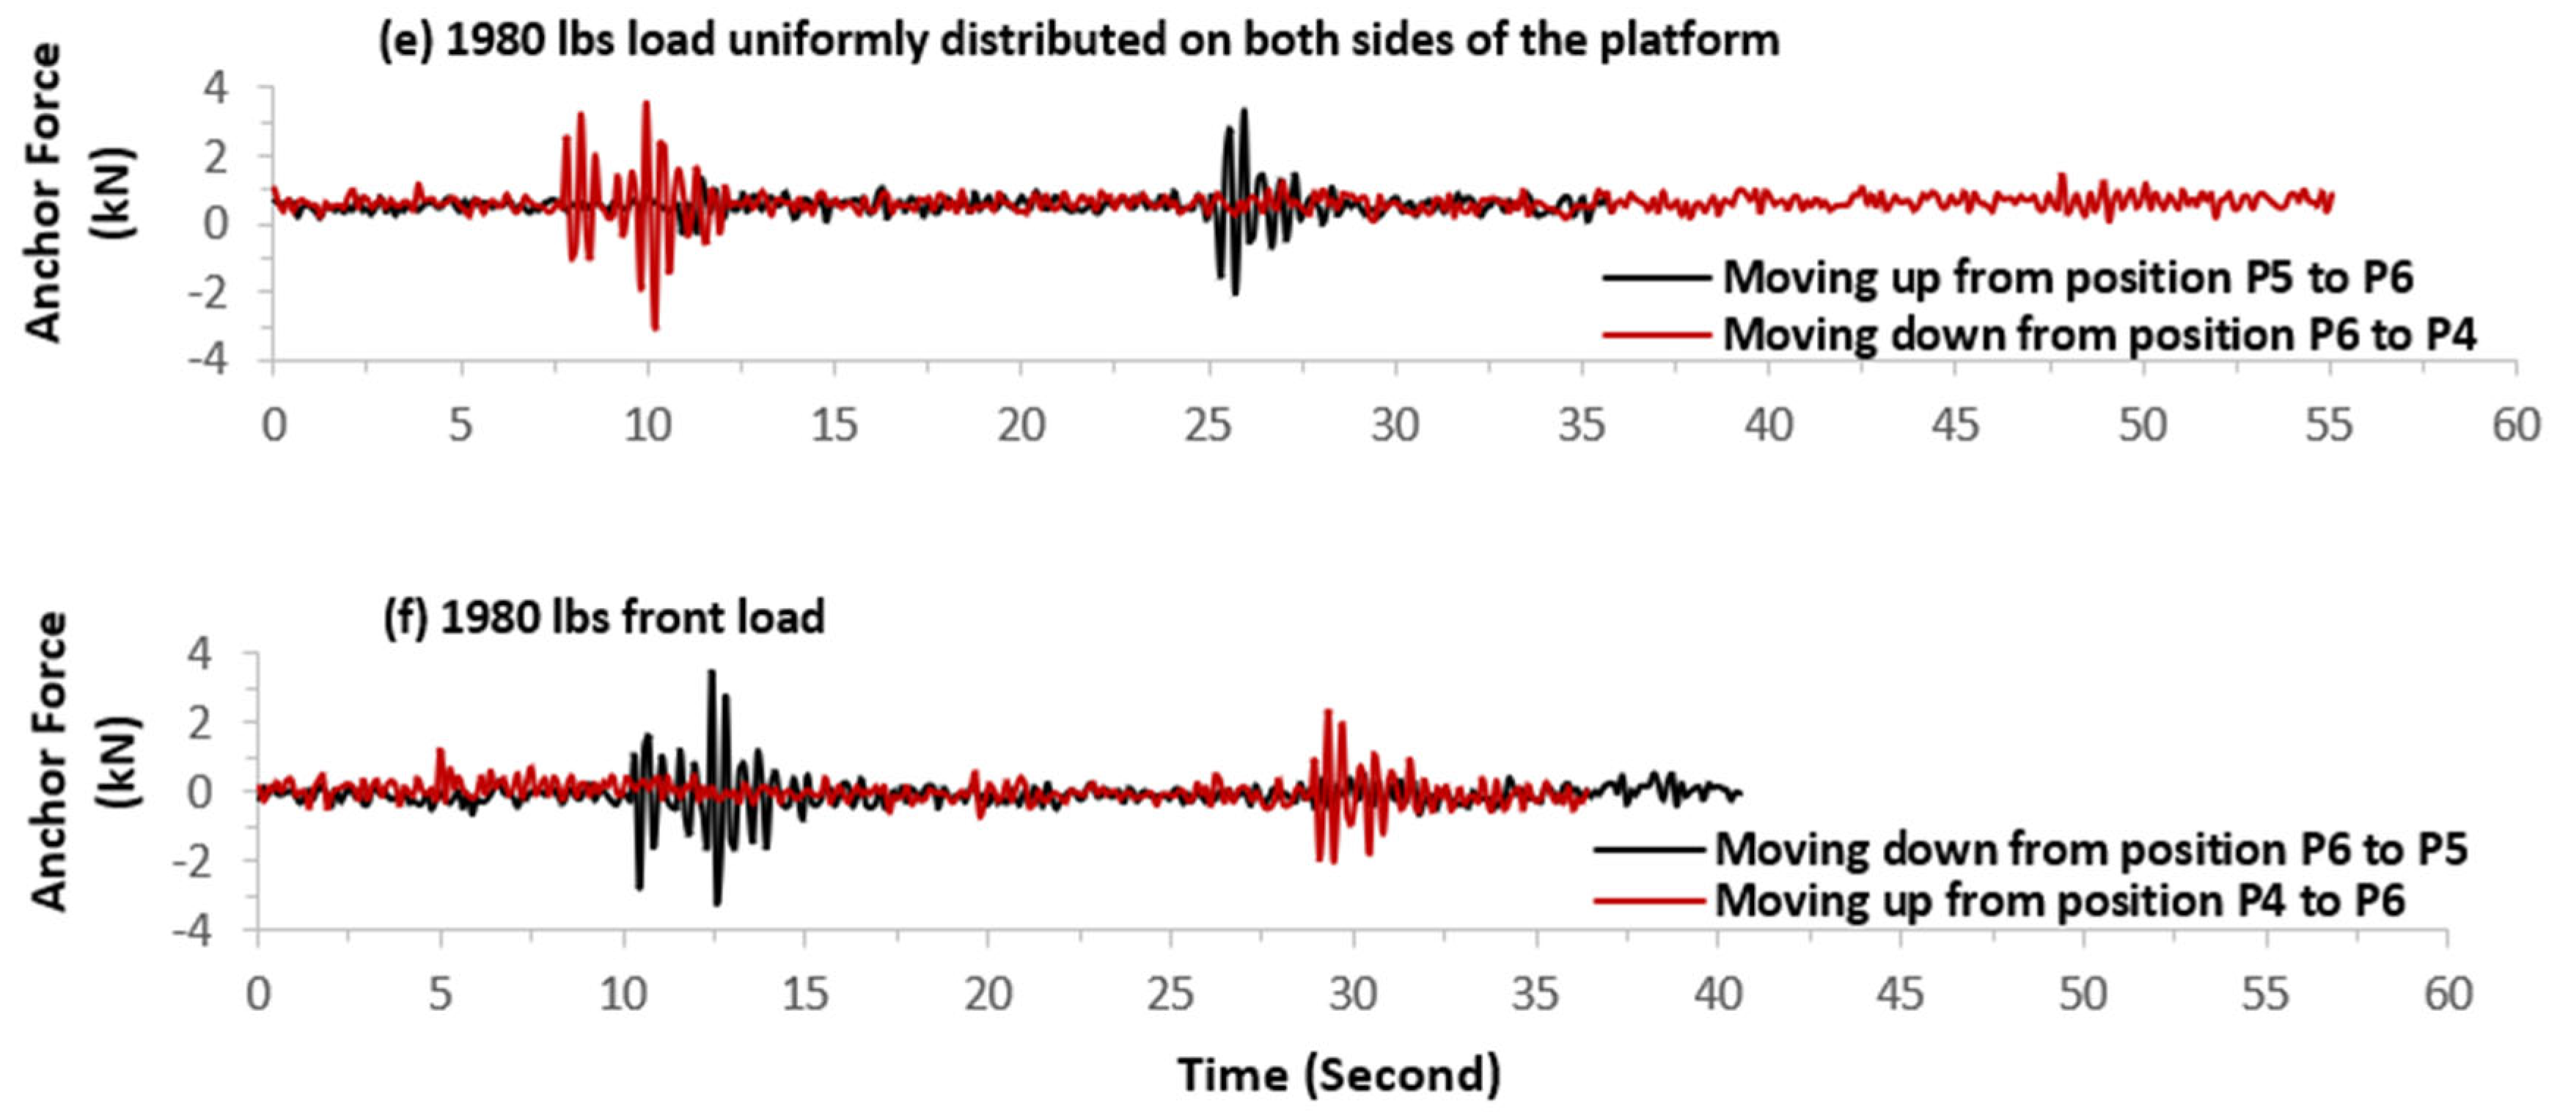
Figure 9 illustrates the total relative forces in the x-direction measured on the second anchorage. Like the method used to analyze the data measured on the first anchorage, the mean value of forces measured at position P4 shown in Figure 9a was used as the reference in Equation (3) to calculate the forces for the other testing treatments. In contrast to the first anchorage shown in Figure 8, the up and down movements of the platform did not obviously change the static component of the anchorage force (Figure 9b–f). Also, changes in the applied load and its loading position on the platform only slightly affected the static component of the anchorage force. However, the dynamic forces on the second anchorage were generally larger than those observed on the first anchorage, especially when the applied load was increased (Figure 9e,f).

4. Discussion

A single mast climbing work platform system (ACT-8) with its freestanding height was used for the experiments conducted in this study. Within the freestanding height, the operation of the platform within its rated load was in a safe range, as observed in the current study. The 1980 lb load used in this study was less than 20% of its allowable maximum load (10,000 lb. or 44.8 kN) [28]. For these reasons, the anchorage reaction forces should not be substantial. The flexibility of the structure built for the MCWP anchorages in this study may further reduce the anchorage reaction forces. The results obtained and illustrated in Figure 7, Figure 8 and Figure 9 and Table 3 are consistent with these hypotheses; the measured reaction forces were much less than the allowed anchorage loads listed in Figure 1a. The experimental results did reveal some useful information for understanding the anchorage reaction forces and for the feasibility of using such forces to assess the MCWP stability.

4.1. Temperature Effects

While it might be difficult to install a commercially available load cell on the anchorage arms without changing their mechanical properties or the strength and stiffness of the anchorage, the reaction forces can be detected using strain gauges installed on the anchorage arms. Although the full Wheatstone Bridge used in this study should have compensated for temperature effects, substantial baseline drifts of the force measurement due to sun exposure and temperature change still occurred (Table 2). The maximum drift (1.853 kN) was on Bridge 1 of Arm 3 on the second anchorage. Its component in the y-direction was 0.927 kN, which was 8.34% of the allowable maximum load (11.12 kN) on this arm. The maximum drift is likely to be higher at construction sites because the environmental temperature can vary in a larger range than what occurred in this study. Such a large drift is not acceptable for many applications that would use anchorage force measurement. The maximum drift should be controlled to less than 5% of the allowable maximum load. The baseline drift issue can be resolved or minimized using the following approaches:
(1)
As shown in Table 2, not every bridge had a large baseline drift. The lowest drift (0.003 kN) was on Bridge 1 of Arm 3 on the first anchorage. Its component in the y-direction was only 0.01% of the allowable maximum load. However, the drift on Bridge 2 of Arm 3 (0.847 kN) was much higher than that on Bridge 1, although their exposure conditions were identical. These observations indicate that some of the bridges installed and used in this study were of poor quality. It may be possible to achieve acceptable bridge quality by improving the installation of the strain gauges and their wire connections. The thickness of the glue underneath each strain gauge should also be as small as possible to minimize the plastic deformation and/or crimping effect of glue material due to temperature changes. In addition to electrical quality, consistent bonding between the strain gauge and the anchorage arm under elevated temperature is critical. Variations in adhesive thickness, curing conditions, or surface preparation can lead to differential thermal expansion between the gauge and the substrate, amplifying apparent strain under temperature changes.
(2)
The use of more sensitive strain gauges may also help increase the reliability of the measurement. Larger strain gauges can be used, as a large area on each arm surface is available for the installation of the gauges, and the strains resulting from the axial force are likely to be uniformly distributed on the surface.
(3)
The measurement uncertainties could have also resulted from poor wire connections from the strain gauges to the computer data acquisition system. The use of a wireless data acquisition device installed near the strain gauge location could minimize issues with the wire connections. A wireless data acquisition device would make it convenient and efficient to measure and assess the anchorage reaction forces. Pre-instrumented anchorage arms might be built with a wireless communication function and installed on the MCWP when it is assembled.
(4)
The impact of temperature variations may also be mitigated by directly measuring the temperature at or near the strain gauge location and applying temperature compensation during data processing. The use of co-located temperature sensors or dummy gauges mounted on unstrained regions of the anchorage arm could help separate mechanical strain from thermally induced strain. Such approaches are commonly used in structural monitoring applications and could further reduce baseline drift in anchorage force measurements.
For field applications, anchorage force measurements may also be interpreted relative to short-term baselines or evaluated using incremental changes rather than absolute force values. Such approaches may reduce sensitivity to slow temperature-induced drift while still capturing force redistribution due to operational or loading changes.

4.2. Dynamic Forces

The dynamic forces are superposed on the static forces caused by static loads such as worker weight and material weight. They can be reliably identified from the data measured in this study. As shown in Figure 4, Figure 5, Figure 6, Figure 7, Figure 8 and Figure 9, significant dynamic forces on the anchorages can result from the movements and/or actions of the workers on the platform and the starting and stopping of the platform. The combined effects of the activities of the workers on the platform and the platform operations may lead to high dynamic forces. As shown in Figure 9, their peak magnitudes could be more than 3 kN, which is much higher than the static forces. Combined with a large static force, such large dynamic forces may cause fatigue damage to the anchorages. The peak dynamic forces can be minimized by improving the smoothness of the starting and stopping movements of the platform. Minimizing the number of starting and stopping movements of the platform, especially when the platform is loaded, can reduce the number of vibration cycles, which may also effectively reduce the potential of fatigue damage to the anchorages. Traditionally, MCWP design considers only static loading; the vibration and dynamic loading during the operation are not considered. The safety and reliability of the MCWP system can be enhanced if the factors of vibration and dynamics are included in the system design.
The platform vibrations and the associated anchorage reaction forces shown in Figure 4, Figure 5 and Figure 6 suggest that the MCWP used in this study is likely to have its fundamental resonant frequency at about 1.6 Hz. Because such a frequency is within the major frequency range of the natural movements and actions of the people on the platform, near sinusoidal vibrations and dynamic forces were observed in some of the tests when there were test engineers moving around on the platform. Increasing the load on the platform can reduce the resonant frequency and platform vibration. This, however, may not effectively reduce the dynamic forces, as the increased mass may increase the inertial force, as shown in Figure 9. The most effective approach minimizing such dynamic forces is to minimize large movements or actions of the workers on the platform.
In some scenarios, the peak shock accelerations reached as high as 4 g or 40 m/s2 in a short period (Figure 7c). However, the high accelerations for a short duration (0.5–1.0 ms), as observed in the study, would not imply that the structure is at a failure risk. From the view of structural mechanics, structures will fail due to excessive stress or deflection, not accelerations. A high acceleration over a short period will not result in a large motion or deflection of the mast and platform, causing the instability of the structure.

4.3. Effects of Platform Positions and Loading Conditions on the Anchorage Static Forces

Theoretically, the platform height and loading conditions should affect the anchorage static forces [23]. The static forces measured at the first anchorage (listed in Table 3 and shown in Figure 7 and Figure 8) are consistent with theoretical modeling predictions, confirming the significance of these influencing factors. The forces measured on different arms of the anchorage were not symmetric, as demonstrated in Figure 4, which was not consistent with modeling predictions. This may be because the actual structure of the entire MCWP and their joint connection tightness was not symmetrical, as assumed in the modeling analyses. Also not consistent with the modeling prediction, the forces measured on the second anchorage, as shown in Figure 9, were not substantially affected by platform height and loading conditions. This may be partially due to the following reasons: (i) the total height of the single mast platform used in the experiment was 2/3 of the platform height used in the reported modeling study [23]; (ii) the applied loads in the experiment were much less than those used in the modeling study; and (iii) the attached structure used in the experiment was flexible, while in the modeling analyses a rigid structure was assumed for the anchorage attachment. For these reasons, the measured anchorage reaction forces should be much less than those determined from modeling predictions. The above-mentioned temperature effects could also have made it difficult to reliably detect the actual anchorage reaction forces.

4.4. Other Limitations of the Study

In addition to the above-discussed limitations, there were other limitations that can be overcome in further studies. First, the forces on all the instrumented anchorages and the accelerations on the platform should be simultaneously measured during each of the test treatments, but this was not achieved in the current study. This limitation, together with some of the above-mentioned limitations, may be avoided by using a wireless measurement system. The baseline drift of the system should be examined under real working environmental conditions before using it for a field study.
The field experiment should be conducted on an MCWP at a worksite or closely simulated worksite with real construction anchorage attachments. Higher loading levels should also be applied. In the present study, the system was tested up to approximately 1980 lb, which represents about 20% of the platform’s total capacity. This limitation was imposed due to safety considerations during the testing. Mast climber systems are typically evaluated at their maximum capacity only under static loading conditions. It is highly possible for the system to fail under considerably lower loads in dynamic conditions as compared to static loads. In real construction sites, structures may fail not solely due to their static load capacity but rather as a result of a loss of dynamic or structural stability, which can occur under loads that are significantly less than their designed capacity.
If the temperature effects can be adequately controlled or compensated for, the installation forces on the anchorages should also be measured and examined. Finally, the limited range and type of loading used in this study are insufficient to develop empirical equations to quantify the complex nature of the dynamic behavior of the structures, which may be dependent on multiple factors, such as temperature, dynamic load, and anchor system placement on columns.
The interactions of the mast climber system can influence the movements of the workers on the platform, thereby impacting the dynamic postural stability of the workers. Future research should take into account the safety of workers when assessing the mechanical performance of the MCWPs [29,30].

5. Conclusions

This study developed an instrumented anchorage using a strain gauge method and applied it to measure reaction forces on different arms of the anchorage to identify the major factors that might affect the measurement of the reaction forces. This study found that the amount of load on the platform, loading position, and platform position on the mast may affect the reaction forces. Their specific effects varied with the specific anchorages installed at different heights on the mast. The dynamic forces on the anchorages were found to correlate with the platform vibrations. The movements of workers on the platform and the starting and stopping of the platform’s elevating devices could generate significant dynamic forces on the arms of the anchorages. The peak magnitudes of the dynamic reaction forces could be higher than the static reaction forces in some cases. The experimental results suggest that it is feasible to measure and assess anchorage reaction forces to help assure the safety of MCWP operations. This study also found that temperature variations at construction sites could substantially affect the force measurement made using the strain gauge method. This is a critical issue that needs to be resolved or minimized.

Author Contributions

X.S.X. contributed to experimental development and execution, data analysis, and manuscript preparation. C.M.W. and R.S.W. managed the laboratory and field experimental setup and execution. J.Z.W. conceived the study and its design and supervised the experimental testing and data analysis. F.V. was responsible for the design, construction, and supervision of the field study test site. R.G.D. conceived and designed the study and led the experimental tests, data analysis, and manuscript preparation. C.S.P. secured the funding for the study, led and supervised the overall project, and coordinated communication with industry partners. All co-authors played an active role in drafting the revision of the manuscript. All authors have read and agreed to the published version of the manuscript.

Funding

The project was supported by the National Institute for Occupational Safety and Health (NIOSH) through an internal funding source (927ZLEX), and CDC Foundation.

Data Availability Statement

The original contributions presented in this study are included in the article. Further inquiries can be directed to the corresponding author.

Acknowledgments

This project was made possible through a partnership with the CDC Foundation. We want to express our gratitude to the Job-Site Safety Institute for their generous contributions to this project via the CDC Foundation. We would like to acknowledge the major contributions of Fraco Products Ltd. to this study. Besides designing and building the attachment structures and setting up the mast climbing work platform for the study, the staff of Fraco Products, especially Graham Johnson, Mauricio Magana, and Gordon Eyre, provided training for our test engineers, and helped assure the safety of the test system and test engineers during the experiment. We would also like to thank our NIOSH colleagues (Daniel Welcome, Bryan Wimer, and Sam Stone) who helped develop the instrumented anchorages and/or design of the experiment. The findings and conclusions in this report are those of the authors and do not necessarily represent the official position of the National Institute for Occupational Safety and Health, Centers for Disease Control and Prevention. Mention of any company or product does not constitute endorsement by the National Institute for Occupational Safety and Health, Centers for Disease Control and Prevention.

Conflicts of Interest

Author Francois Villeneuve was employed by the company FRACO USA, Inc. The remaining authors declare that the research was conducted in the absence of any commercial or financial relationships that could be construed as a potential conflict of interest.

References

  1. ANSI-SAIA-A92.9-2011-R2017; American National Standard for Mast-Climbing Work Platforms. American National Standards Institute: New York, NY, USA, 2017.
  2. ISO-16369; Elevating Work Platforms—Mast-Climbing Work Platforms. International Organization for Standardization: Geneva, Switzerland, 2007.
  3. Reber, N.L. Mast Climber Safety. Masonry Magazine, 1 March 2018.
  4. Pan, C.S.; Chiou, S.S.; Hsiao, H.; Keane, P. Ergonomic hazards and controls for elevating devices in construction. In Occupational Ergonomics: Theory and Applications; Bhattacharya, A., McGlothlin, J.D., Eds.; CRC Press Inc.: Boca Raton, FL, USA, 2012; Volume 25, pp. 653–693. [Google Scholar]
  5. Pan, C.S.; Ning, X.; Wimer, B.M.; Zwiener, J.; Kau, T.Y. Biomechanical assessment while using production tables on mast climbing work platforms. Appl. Ergon. 2021, 90, 103276. [Google Scholar] [CrossRef] [Scilit] [PubMed]
  6. van der Molen, H.F.; Sluiter, J.K.; Frings-Dresen, M.H. Is the use of ergonomic measures associated with behavioural change phases? Ergonomics 2006, 49, 1–11. [Google Scholar] [CrossRef] [Scilit] [PubMed]
  7. Liu, F.; Marshall, M.; Ayub, M. Collapse of a Mast Climbing Work Platform (Scaffold) in Miami, Florida March 4, 1995; U.S. Department of Labor; Occupational Safety and Health Administration (OSHA): Washington, DC, USA, 1995.
  8. Ayub, M.; Shah, D. Investigation of the June 20, 2001, Partial Collapse of the Mast Climbing Platform at Cambridge, MA; U.S. Department of Labor; Occupational Safety and Health Administration (OSHA): Washington, DC, USA, 2001.
  9. Ayub, M.; Menon, G.; Jarvis, M.P. Investigation of the June 10, 2009 Mast Climbing Platform Collapse in Austin, Texas; U.S. Department of Labor; Occupational Safety and Health Administration (OSHA): Washington, DC, USA, 2009.
  10. Ayub, M.; Jin, S.; Shah, D.; Menon, G.; Horres, B.; McClaren, J.; Capps, K.D. Investigation of the March 23, 2015 Mast Climbing Scaffold Collapse During Dismantling at Raleigh, NC; U.S. Department of Labor; Occupational Safety and Health Administration (OSHA): Washington, DC, USA, 2015.
  11. OSHA. Safety and Health Regulations for Construction. Regulation 29 CFR 1926 Subpart L—Scaffolds; OSHA: Washington, DC, USA, 1996. Available online: https://www.osha.gov/laws-regs/regulations/standardnumber/1926 (accessed on 15 February 2026).
  12. IPAF. IPAF Guidelines for the Safe Use of Mast Climbing Work Platforms. International Powered Access Federation, US ed.; IPAF Ref. USAO 07/10-002, 2010. IPAF Guidelines for the Safe Use of Mast Climbing Work Platforms (USAO 0710-002 EN-US).pdf. 2018. Available online: https://www.ipaf.org/sites/default/files/2018-01/IPAF%20Guidelines%20for%20the%20Safe%20Use%20of%20Mast%20Climbing%20Work%20Platforms%20%28USAO%200710-002%20EN-US%29.pdf (accessed on 15 February 2026).
  13. Construction Plant-Hire Association (CPA). Tying Construction Hoists and Mast Climbing Work Platforms to Supporting Structures. CPA Good Practice Guide (Ref. CHIG 1901). 2019. Available online: https://cpa.uk.net/wp-content/uploads/2025/04/CPA-CHIG1901-GPG-Tying-Hoists-to-Supporting-Structures-Rev-1-191201.pdf (accessed on 15 February 2026).
  14. CPWR. Reaching Higher—Recommendation for the Safe Use of Mast Climbing Work Platforms; Work Group on Mast Climbing Work Platforms; The Center for Construction Research and Training: Silver Spring, MD, USA, 2010; Available online: https://www.cpwr.com/wp-content/uploads/CPWRReachingHigheronline.pdf (accessed on 15 February 2026).
  15. Wang, W.; Jia, W.; Fen, H.; Yin, C. Research and implementation of remote monitoring system for mast-climbing working platform. Comput. Sci. 2018, 45, 553–557. [Google Scholar]
  16. Wimer, B.M.; Pan, C.S.; Lutz, T.; Hause, M.; Xu, S.; Warren, C.M.; Dong, R.G. Evaluating the stability of a freestanding mast climbing work platform. J. Saf. Res. 2017, 62, 163–172. [Google Scholar] [CrossRef] [Scilit] [PubMed]
  17. Dong, R.G.; Pan, C.S.; Wu, J.Z. Safety Design, Use, and Research of Mast Climbing Work Platforms. J. Constr. Eng. Manag. 2025, 151, 03125009. [Google Scholar] [CrossRef] [Scilit]
  18. HSE. Mast Climbing Work Platforms: Failure to Detect Mechanical Failure in Drive Units Leading to Uncontrolled Fall of Platforms. HSE News, 22 May 2022.
  19. Kenney, A.; Bracken, D. Raleigh scaffolding collapse kills 3 construction workers. The News and Observer, 24 March 2015.
  20. Vertikal. Mast Climber Fatalities in Zaragoza, Spain. Vertikal Report. 2021. Available online: https://vertikal.net/en/news/story/37349/mast-climber-fatalities#:~:text=Two%20men%20died%20when%20a,the%20start%20of%20the%20week (accessed on 15 February 2026).
  21. Vertikal. Mast Climber Fatality Updated in Liverpool, UK Vertikal Report. 2021. Available online: https://vertikal.net/en/news/story/37755/uk-mast-climber-fatality-updated (accessed on 15 February 2026).
  22. WCNC. Families Identify 3 Dead After Scaffolding Collapsed at a Construction Site near Uptown Charlotte. WCNC News, 2 January 2023. Available online: https://www.wcnc.com/article/news/local/construction-accident-charlotte-nc/275-5b9aed5c-901a-4801-906e-b72dbec61a3b? (accessed on 15 February 2026).
  23. Wu, J.Z.; Pan, C.S.; Wimer, B.M.; Warren, C.M.; Villeneuve, F.; Dong, R.G. A Finite Element Analysis of the Effects of Anchorage Reaction Forces and Moments on Structural Stability of Mast Climbing Work Platforms. J. Multiscale Model. 2023, 14, 2350008. [Google Scholar] [CrossRef] [Scilit]
  24. Kan, Y.; Rong, X.; Zhang, J. Shaking table test research on novel frame structures: A review. Buildings 2025, 15, 1368. [Google Scholar] [CrossRef] [Scilit]
  25. He, X.; Chen, Y.; Zhou, Z.; Ke, K. Fuse replacement implementation by shaking table tests on hybrid moment-resisting frame. J. Build. Eng. 2024, 95, 110232. [Google Scholar] [CrossRef] [Scilit]
  26. Cao, Y.S.; Zhao, Y.L.; Li, J. Shaking table model test of steel frame structure. Appl. Mech. Mater. 2012, 166–169, 343–348. [Google Scholar] [CrossRef] [Scilit]
  27. Shen, J.; Nie, Q.; Jia, S. Shaking table tests and analysis of the seismic behavior of external steel frames with viscoelastic nodal dampers. Sci. Rep. 2026, 16, 4157. [Google Scholar] [CrossRef] [Scilit] [PubMed]
  28. FRACO. User’s Manual: Mast Climbing Work Platform—ACT-8. 2018. Available online: https://www.fraco.com/en/documents/98030280-14-MU-ACT8-EN-CE-05-2019.pdf (accessed on 15 February 2026).
  29. Zheng, L.; Pan, C.; Wei, L.; Bahreinizad, H.; Chowdhury, S.; Ning, X.; Santos, F. Shoulder-assist exoskeleton effects on balance and muscle activity during a block-laying task on a simulated mast climber. Int. J. Ind. Ergon. 2024, 104, 103652. [Google Scholar] [CrossRef] [Scilit] [PubMed]
  30. Zheng, L.; Pan, C.; Kia, K.; Chan, A.; Salehi, M.; Moorehead, A.; Kim, J.H. Effects of shoulder-assist exoskeletons on muscle activity and balance during a wire pulling task on a simulated scissor lift. Appl. Ergon. 2026, 132, 104694. [Google Scholar] [CrossRef] [Scilit] [PubMed]
Figure 1. Instrumentation of strain gauges on a typical symmetric anchor.
Buildings 16 00878 g001
Figure 2. A pictorial view of the general experimental setup for characterizing the anchorage reacting forces on a single-mast climbing work platform.
Buildings 16 00878 g002
Figure 3. Calibration results for each of the six arms on the two instrumented anchorages.
Buildings 16 00878 g003
Figure 4. The dynamic forces measured on the three arms of the first anchorage.
Buildings 16 00878 g004
Figure 5. The accelerations measured in the three directions (x, y, and z) on the left (L) side frame and right (R) side frame of the work platform floor.
Buildings 16 00878 g005
Figure 6. The relationship between platform acceleration and the anchorage dynamic force.
Buildings 16 00878 g006
Figure 7. The platform accelerations and anchorage relative forces measured during the moving-up process of the platform (P1 to P3).
Buildings 16 00878 g007aBuildings 16 00878 g007b
Figure 8. The total anchorage forces in the x-direction in four different testing treatments.
Buildings 16 00878 g008
Figure 9. Total forces in the x-direction on the second anchorage under different testing treatments.
Buildings 16 00878 g009aBuildings 16 00878 g009b
Table 1. Comparisons of the calibration results of the two instrumented anchorages before (BF) and after (AF) the field experiment.
Calibration Time Before (BF) or After (AF) Field TestsArm 1Arm 2Arm 3
Bridge 1 (1.1)Bridge 2 (1.2)Bridge 1 (2.1)Bridge 2 (2.2)Bridge 1 (3.1)Bridge 2 (3.2)
Anchorage 1 Calibration Factors (N/Strain Reading)
BF276326471095108011421150
AF289425991083108410971110
Mean282926231089108211201130
Difference (%)4.63−1.83−1.100.37−4.02−3.63
Anchorage 2 Calibration Factors (N/Strain Reading)
BF274523741128110914631081
AF228924921157111115771058
Mean251724331143111015201070
Difference (%)−18.124.852.540.180.00−2.15
Table 2. Effects of steel arm temperature on the baseline drift of the force measurement on the two instrumented anchorages.
Measurement Time and Environmental
Conditions
Temperature Measured on Anchorage Arm (°F/°C) Arm 1Arm 2Arm 3
Bridge 1 (1.1)Bridge 2 (1.2)Bridge 1 (2.1)Bridge 2 (2.2)Bridge 1 (3.1)Bridge 2 (3.2)
Force Baseline Drift on Anchorage 1 (kN)
10 a.m., lab indoor70 °F/21 °C0.011−0.0600.0170.037−0.0600.101
12 p.m., outdoor with sun exposure for >1.5 h92 °F/33 °C1.1080.1900.637−0.1770.0030.847
3 p.m., outdoor with sun exposure for >4.5 h101 °F/38 °C1.7230.2200.457−0.194−0.0070.460
5 p.m., indoor after cooled down for >2 h73 °F/23 °C1.617−0.323−0.2820.057−0.297−0.232
Force Baseline Drift on Anchorage 2 (kN)
10 a.m., lab indoor
70 °F/21 °C0.030−0.048−0.028−0.0140.037−0.009
12 p.m., outdoor with sun exposure for >1.5 h92 °F/33 °C−0.5620.979−0.1450.0591.853−0.334
3 p.m., outdoor with sun exposure for >4.5 h101 °F/38 °C−0.2911.636−0.5260.0071.849−0.719
5 p.m., indoor after cooled down for >2 h73 °F/23 °C0.5700.266−0.387−0.2591.492−0.312
Table 3. The mean values of the relative forces on the first anchorage measured when the platform was at different height positions (P1, P2, and P3) and with five different loading conditions.
Anchorage 1Platform PositionPlatform Loading Conditions
No Load990 lb
Uniformly Distributed on Right Side
990 lb
Left Front
1980 lb
Uniformly Distributed on Both Sides
1980 lb front Area of Both Sides
Anchorage 1 static force (kN)P1* 0.00** 0.000.720.05−0.05
P2 −0.650.990.270.03
P30.840.511.641.281.31
The difference between the forces at P1 and P3 (kN)0.840.510.921.231.36
* Reference for unloaded platform tested on Day 1; ** Reference for loaded platform tested on Day 2.
Disclaimer/Publisher’s Note: The statements, opinions and data contained in all publications are solely those of the individual author(s) and contributor(s) and not of MDPI and/or the editor(s). MDPI and/or the editor(s) disclaim responsibility for any injury to people or property resulting from any ideas, methods, instructions or products referred to in the content.