1. Introduction
Sustainable resource management and waste reduction have become critical concerns amid accelerating urbanization and increasing global consumption in the twenty-first century [
1,
2]. These challenges demand urgent attention, as they exert considerable pressure on natural resources, drive environmental degradation, and strain municipal waste management systems [
3,
4]. Among contributing sectors, the construction industry plays a significant role, generating vast quantities of construction and demolition waste (CDW) [
5]. Notably, CDW accounts for approximately 20–40% of the total solid waste stream in many regions [
6]. In the United States alone, over 600 million tons of CDW were produced in 2018—more than double the volume of municipal solid waste [
7].
The mismanagement of CDW poses a major sustainability challenge [
8]. Urban areas, in particular, face persistent difficulties in effectively handling demolition debris [
9]. The dynamic nature of urban development results in volatile CDW volumes, often tied to large-scale infrastructure projects, leading to logistical inefficiencies when relying on static planning models [
10]. These inefficiencies are further exacerbated by traffic congestion, which inflates hauling costs and delays transport [
11]. Budget and institutional constraints frequently prevent municipalities from investing in modern waste management infrastructure, and substantial shares of recyclable or recoverable construction materials still end up in landfills [
12].
This study is presented as a metropolitan case study in Wuhan, China. While the proposed methodology is transferable, direct generalization of Wuhan-calibrated parameters (e.g., costs, facility characteristics, contract terms, and traffic conditions) to other cities is not appropriate without local data collection and calibration. Moreover, the framework does not assume fully digitalized municipal infrastructure: a minimum viable implementation can rely on routinely available inputs (e.g., approximate demolition volumes, facility capacities, road-network distances/times, and fleet availability), whereas higher-fidelity inputs (e.g., high-resolution traffic feeds, automated weighbridge data, or IoT-enabled fleet monitoring) improve accuracy but are optional and can be adopted incrementally.
Traditionally, municipalities have relied on deterministic models for evaluating the siting of recycling facilities [
13]. While useful for baseline planning, deterministic approaches often fail to represent uncertainty in demolition patterns and urban traffic conditions [
6]. They also commonly emphasize single objectives (e.g., cost), which can underrepresent environmental and operational considerations [
14]. Accordingly, recent research has increasingly shifted toward models that (i) represent uncertainty explicitly, (ii) integrate transport and allocation decisions with facility planning, and (iii) evaluate candidate strategies using multi-criteria decision logic.
Across waste-management domains, uncertainty-aware location-routing and capacity-planning models have been developed for streams such as medical waste, e-waste, hazardous waste, and municipal solid waste, frequently incorporating time windows, capacity limits, and multiple objectives [
15,
16]. These studies underscore that variability in supply, travel conditions, and risk-related criteria can materially change both feasibility and cost, motivating scenario-based planning rather than single-shot deterministic optimization. In construction-focused contexts, robust facility location formulations similarly show that total system cost and operational viability are sensitive to uncertainty in waste supply and transportation conditions [
17]. In CDW systems, this sensitivity is amplified by project-driven spikes in demolition activity and by congestion-induced volatility, which together create frequent mismatches between available trucking resources and contracted facility throughput.
A closer look at the relevant body of work shows three dominant methodological streams that are directly connected to the CDW facility-selection problem. First, a large set of studies treats facility siting/selection primarily as a multi-criteria decision problem under ambiguity, where fuzzy-set extensions and hybrid MCDM schemes (e.g., FFS/IVIFS-based scoring, SWARA/MARCOS-type ranking, and related hybrids) are used to prioritize candidate locations when quantitative inputs are incomplete or expert judgment is central [
18,
19,
20,
21,
22,
23]. These approaches offer strong interpretability for planners but typically do not model operational logistics end-to-end (truck dispatch, transport and allocation decisions, and capacity-feasibility under uncertain waste volumes) and therefore can understate the cost and service implications of a selected site set.
Second, a growing line of research formulates waste systems as integrated location–routing and capacity-planning problems, often with multiple objectives and uncertainty-aware constraints (e.g., time windows, risk/emissions, chance constraints, and robust or distributionally robust variants) [
15,
16,
24,
25,
26,
27]. These models improve operational realism and can jointly optimize facility use and transport decisions; however, their computational burden often increases sharply with network scale and stochastic replications, motivating the use of metaheuristics or hybrid strategies for practical-sized instances.
Third, metaheuristic and hybrid optimization has been repeatedly shown to be effective for complex waste logistics, including facility-network design and routing decisions (e.g., tabu search and evolutionary or decomposition-based neighborhood search), and more recently learning-assisted or hyper-heuristic variants [
28,
29,
30,
31]. While these algorithms can generate many feasible, near-optimal candidates, decision-makers still face the challenge of selecting among alternatives that trade cost, service coverage, and environmental outcomes differently [
2]. This is where benchmarking tools such as DEA become valuable: DEA has been used to evaluate relative efficiency across multiple inputs/outputs (including sustainability indicators) and can serve as a transparent screening layer on top of simulation–optimization results [
32,
33,
34]. In sum, existing studies provide important building blocks, but an integrated workflow that (i) stress-tests strategies via simulation under uncertainty, (ii) searches efficiently via a hybrid optimization engine, and (iii) ranks the resulting alternatives via multi-criteria efficiency benchmarking remains limited for urban CDW facility contracting and routing decisions.
To cope with this volatility, simulation provides a practical way to generate comparable performance outcomes under repeated realizations of uncertain inputs. Discrete-event simulation and related scenario-based tools can represent stochastic waste generation, operational disruptions, and congestion effects that are difficult to capture in purely deterministic formulations [
10]. By stress-testing candidate facility and transportation strategies across many realizations, simulation enables robust screening of policies that remain effective when waste volumes and travel conditions depart from nominal assumptions.
At the same time, integrated CDW planning induces a large combinatorial decision space—facility subsets, waste allocation, transport decisions, and operating parameters—for which exact optimization quickly becomes impractical. Metaheuristics therefore play a central role in delivering high-quality solutions with tractable runtime [
35,
36], and hybrid or learning-enhanced variants have further improved robustness in green logistics applications [
30,
31]. Yet metaheuristic search typically produces sets of near-optimal alternatives, and decision support remains incomplete when there is no principled way to compare these candidates across economic, environmental, and operational criteria. This motivates coupling simulation–optimization with a transparent multi-criteria benchmarking layer that can discriminate among competing near-optimal strategies without subjective weight tuning.
Multi-criteria decision-making (MCDM) approaches (e.g., AHP/TOPSIS/PROMETHEE and fuzzy extensions) are widely used in facility siting and waste-management planning [
22,
23]. However, many MCDM methods rely on explicit preference elicitation or fixed weights, which becomes challenging when planners aim to benchmark strategies using observed inputs and outputs under uncertainty. In this setting, Data Envelopment Analysis (DEA) offers an efficiency-frontier framework for comparing multiple candidates with multiple inputs and outputs without imposing a priori weights, and it has been applied to sustainability-oriented logistics and waste systems [
33,
34]. DEA is thus well suited for screening solution sets produced by simulation-driven metaheuristics, where many candidates are feasible but differ subtly in cost, service coverage, and environmental performance.
Despite these advances, the CDW facility-selection literature remains fragmented: simulation, metaheuristic optimization, and multi-criteria benchmarking are often applied in isolation, weakening decision support when uncertainty, transport decisions, and multi-criteria screening are not integrated within a single workflow [
37]. Moreover, many studies provide extensive algorithmic detail but limited clarity on implementation requirements and transferability conditions, particularly for municipalities with heterogeneous data maturity and constrained technical capacity.
Against this background, this paper develops and demonstrates an integrated, simulation-driven decision-support framework for urban CDW management that jointly addresses facility selection and operational waste transportation decisions under uncertainty. The framework evaluates three operational propositions through simulation and optimization: (i) coordinating dispatch intensity with contracted facility capacity materially affects transportation cost and unmoved waste under stochastic waste generation; (ii) certain facility combinations remain efficient across economic, operational, and environmental indicators even when uncertainty produces many near-optimal solutions; and (iii) an efficiency-frontier benchmark based on Data Envelopment Analysis (DEA) provides transparent discrimination among candidate strategies without subjective weights. Methodologically, we contribute (1) a unified simulation–optimization pipeline in which a metaheuristic engine searches facility configurations and associated dispatch–allocation policies under stochastic conditions; (2) a discrete-event simulation layer that captures uncertainty in waste quantities and transportation conditions for scenario-based evaluation; (3) a DEA-based benchmarking stage that ranks near-optimal scenarios across economic, operational, and environmental dimensions to support facility selection and contracting decisions; and (4) a Wuhan metropolitan case study that reports computational results while explicitly stating limitations and transferability conditions.
2. Problem Statement
We study a stochastic, finite-horizon, network-based decision problem arising in the tactical planning of construction and demolition waste (CDW) transportation and recycling in an urban environment. The physical system is represented by a directed graph , where the node set is partitioned as the disjoint union . The set denotes construction and demolition sites acting as stochastic sources, denotes candidate recycling facilities acting as capacitated sinks, and denotes truck depots serving as origins for mobile transportation resources. The arc set encodes admissible transportation links. Each arc is characterized by deterministic distance , nominal travel time , and unit transportation cost .
A homogeneous fleet of trucks indexed by operates over a finite planning horizon . Trucks are modeled as reusable transportation resources within and may perform multiple pickup–delivery cycles over the horizon. Each cycle consists of dispatch from a depot or the truck’s current location, service at a single construction site, and delivery to a recycling facility. Upon completing a delivery, a truck may proceed to another site and repeat the cycle as long as remaining time within permits. Fleet activation is regulated by a dispatch intensity parameter , imposing an upper bound on the number of trucks that may be active during the planning horizon.
Uncertainty enters the system through stochastic waste generation at construction sites. For each site , the generated waste is modeled as a non-negative random variable defined on a probability space , with distribution . The joint stochastic supply vector is denoted by . Each recycling facility is characterized by a nominal processing capacity . Under an operating regime specified by a capacity scaling factor , the effective capacity is given by .
The strategic decision concerns the selection (contracting) of recycling facilities. Let
denote the family of admissible facility subsets, where
K is fixed exogenously by contractual, regulatory, or policy considerations. Conditional on a chosen facility subset
and regime parameters
, the operational problem is to determine dispatching and allocation decisions that transform the stochastic supply
into realized waste flows over
toward the selected sinks
F, subject to: (i) a dispatch cardinality constraint (≤
active trucks), (ii) time-feasibility of each truck’s sequence of pickup–delivery cycles within the planning horizon
, (iii) facility capacity constraints
, and (iv) waste-availability constraints.
For a given , system performance is represented by random functionals capturing (a) transportation costs induced by empty-haul and loaded movements over , (b) facility processing costs as functions of delivered waste volumes, and (c) residual waste not transported within the planning horizon. The objective is to identify a facility subset and an associated operational decision rule that minimizes expected system inefficiency under uncertainty. The problem is intrinsically non-analytic due to combinatorial facility selection, state-dependent feasibility, and the black-box nature of the induced performance functionals, thereby motivating a simulation-based optimization and post-optimization efficiency evaluation strategy.
3. Solution Methodology
This section presents the proposed end-to-end solution methodology for simulation-driven recycling facility selection under uncertainty. The framework integrates three tightly coupled components: (i) a stochastic simulation layer that evaluates operational feasibility and performance under uncertain waste generation and transportation conditions; (ii) a metaheuristic optimization engine that searches over facility configurations and associated dispatch–allocation policies using a sample-average approximation (SAA); and (iii) a Data Envelopment Analysis (DEA) stage that benchmarks near-optimal solutions across economic, operational, and environmental dimensions. Crucially, the Genetic Algorithm (GA) does not evaluate candidate policies using a single deterministic objective value. Instead, each fitness evaluation triggers a Monte Carlo simulation with
R replications, where stochastic waste generation (and any other uncertain operational factors represented in the simulator) are resampled. The resulting fitness is the SAA estimator of the expected cost, ensuring that GA selection pressure is driven by expected performance rather than a single realization. To ensure fairness within-generation comparisons under stochastic noise, common random numbers are used so that all candidate policies evaluated in the same generation share the same replication set
(i.e., identical random seeds/scenarios), thereby improving ranking stability and reducing variance-induced misselection. The interaction between these components is summarized in Algorithm 1, which provides a high-level functional view of the proposed workflow. The subsequent subsections formalize each component in detail.
| Algorithm 1 Simulation–Optimization–DEA Framework for Urban CDW Management |
- 1:
Input: Network ; candidate facilities ; depots ; fleet ; horizon ; dispatch levels ; capacity levels ; Monte Carlo replications R. - 2:
Output: Ranked facility subsets with optimized operational policies. - 3:
Initialize DMU set - 4:
for all
do - 5:
for all do - 6:
Define admissible policy parameter space - 7:
GA initialization: generate population - 8:
for to do - 9:
Common random numbers: fix replication set for generation g - 10:
for all in population do - 11:
Fitness evaluation via Monte Carlo (SAA): - 12:
for to R do - 13:
Resample stochastic inputs using and obtain - 14:
Initialize simulator state and set - 15:
while and feasible actions exist do - 16:
Decode the highest-priority feasible action induced by - 17:
Execute dispatch–allocation decision and update - 18:
Update time index - 19:
end while - 20:
Compute sample-path cost - 21:
- 22:
end for - 23:
Set fitness - 24:
end for - 25:
Apply GA operators (selection, crossover, mutation, elitism) - 26:
if termination criterion satisfied then - 27:
break - 28:
end if - 29:
end for - 30:
Extract best policy - 31:
Compute performance indicators for DMU - 32:
Add DMU j to - 33:
end for - 34:
end for - 35:
DEA benchmarking: solve output-oriented CCR DEA over and compute efficiency scores - 36:
return ranked facility subsets and associated optimized policies
|
3.1. Genetic Algorithm Search with Priority-Based Policy Encoding
Fix a facility subset
and an operating regime
. The operational decision problem is cast as a stochastic policy optimization problem,
where
denotes a continuous policy parameter space and
is the expected system cost induced by the policy under stochastic operation.
Each policy vector
induces a deterministic, non-anticipative control policy through a priority-based decoding operator embedded in the simulator. Let
denote the system state at decision epoch
, comprising remaining waste, residual facility capacity, truck availability, and elapsed time. The admissible action set
includes all dispatch–allocation actions that satisfy dispatch limits, waste availability, facility capacity, and time-feasibility constraints. The decoding operator defines a mapping
where
is a priority score computed from the policy parameters. Feasibility is guaranteed by construction, eliminating the need for penalty terms or repair operators.
The resulting policy generates a state trajectory via the simulator’s transition dynamics until either the planning horizon is exhausted or no feasible actions remain. This encoding enables complex, state-dependent dispatch behavior to be optimized over a continuous search space without introducing explicit integer decision variables.
The search over is performed using a real-coded Genetic Algorithm (GA). At generation g, the population is evolved using selection, crossover, mutation, and elitist replacement, with fitness determined by Monte Carlo–estimated expected cost. The algorithm terminates after convergence or a maximum number of generations, yielding an approximate optimizer .
3.2. Embedded Monte Carlo Simulation for SAA-Based Fitness Evaluation
For a fixed
and policy
, system performance depends on stochastic waste generation and operational uncertainty. Let
denote the underlying probability space and
a realization. Executing
under
yields a sample-path cost
which aggregates transportation costs, processing costs, and penalties for residual unmoved waste.
The optimization objective is the expected cost
which is analytically intractable due to the simulator-based dynamics. Accordingly,
is approximated via a Sample Average Approximation (SAA). For a replication budget
R, the estimator is
The Monte Carlo experiment is embedded directly within the GA fitness evaluation. Each candidate policy is evaluated by executing R independent simulation replications, and the resulting is used as the fitness value. As , converges almost surely to Z by the Strong Law of Large Numbers, ensuring asymptotic consistency.
To reduce variance in fitness comparisons and mitigate noise-induced misselection, common random numbers (CRNs) are employed. Within each GA generation g, all individuals are evaluated using the same replication set , inducing correlated fitness estimates that improve ranking stability. Independence across generations is preserved by resampling the replication set at each generation. This design aligns selection pressure with expected performance while maintaining computational tractability.
3.3. Ex Post DEA Benchmarking and Ranking of Facility Alternatives
The simulation–optimization stage yields, for each facility subset and operating regime , an optimized policy together with Monte Carlo estimates of system performance. Each triple is treated as a decision-making unit (DMU) in an ex post efficiency analysis. Let denote the set of all DMUs.
For each , an input vector and an output vector are constructed from simulation-based performance indicators. Inputs capture committed structural and operational resources (e.g., number of contracted facilities, dispatch intensity, effective capacity), while outputs represent desirable outcomes such as transformed cost efficiency, service completeness, and environmental performance. All quantities are computed using consistent Monte Carlo estimators to ensure comparability.
Efficiency is assessed using an output-oriented constant-returns-to-scale (CCR) DEA model. For each DMU
j, the efficiency score
is obtained by solving
where
are intensity variables. The resulting score
measures the relative ability of DMU
j to transform inputs into outputs with respect to the empirical efficiency frontier.
By construction, DEA does not impose a priori preference weights across heterogeneous criteria. Instead, each DMU is benchmarked against the best observed combinations of economic, operational, and environmental performance generated by the simulation–optimization stage. This makes DEA particularly well suited for screening near-optimal solutions produced by stochastic metaheuristics, where multiple candidates exhibit similar expected cost but differ in multi-criteria trade-offs.
The final output of the framework is a ranked set of facility-selection and operating-regime alternatives, each supported by an optimized operational policy, Monte Carlo performance estimates, and a relative efficiency score that enables transparent, weight-free decision support under uncertainty.
4. Experimental Design and Case Study
This section outlines the experimental design and case-study setting used to evaluate the proposed simulation–optimization framework. Prior to reporting computational results, we define the benchmark scales, the facility-configuration space, the operating regimes (dispatch intensity and processing capacity), and the stochastic evaluation protocol (simulation replications and aggregation). This design ensures that performance differences in the next section reflect clearly specified changes in system scale and operating conditions, and that all comparisons are conducted on a consistent, reproducible basis.
4.1. Case Study Context, Benchmark Scales, and Configuration Space
The proposed framework is evaluated using a metropolitan construction and demolition waste (CDW) management case study calibrated to Wuhan, China. Wuhan is a rapidly urbanizing megacity with intensive redevelopment activity, heterogeneous demolition patterns, and a diversified network of recycling facilities. These characteristics create a demanding planning environment in which facility selection, capacity contracting, and transportation decisions must be coordinated under substantial uncertainty, making Wuhan a representative and challenging testbed for integrated CDW logistics analysis.
In the case study, construction and demolition sites are modeled as spatially distributed stochastic waste sources. Variability in waste generation reflects project-driven demolition activity and captures the inherent uncertainty faced by municipal planners when coordinating collection and recycling operations. Candidate recycling facilities are geographically dispersed and exhibit heterogeneous nominal processing capacities, representing differences in contractual throughput, technological capability, and operational availability. Transportation interactions among depots, waste generation sites, and recycling facilities are represented using network-based distances and cost coefficients, capturing the spatial structure of urban waste logistics and the economic implications of both empty-haul and loaded vehicle movements. While fine-grained traffic dynamics are abstracted, the representation remains sufficient to reflect congestion-sensitive cost accumulation and spatial trade-offs in large urban networks.
Building on this setting, a structured set of benchmark scenarios is constructed to examine the framework across increasing system scale and combinatorial complexity. The benchmarks reflect realistic growth patterns in urban CDW systems, where both the number of demolition sites and the pool of candidate facilities expand as redevelopment activity intensifies. Three benchmark scales are considered. The small-scale benchmark represents a compact urban subregion with a limited number of waste generation sites and recycling options and serves primarily as a sensitivity baseline. The medium-scale benchmark reflects a representative metropolitan planning context with a substantially expanded decision space. The large-scale benchmark captures highly complex urban environments in which demolition activity is widespread and facility contracting decisions must be made from a large and heterogeneous candidate pool. The benchmark scales and the resulting facility configuration space are summarized in
Table 1.
Across all benchmark scales, the strategic decision is to select exactly three recycling facilities from the available candidate pool. For each scale, all feasible facility triplets are exhaustively enumerated and evaluated. This eliminates sampling bias in facility selection and enables a complete characterization of the configuration space at each scale, which is essential for subsequent robustness assessment and efficiency benchmarking.
The progression from small to large benchmarks is designed to disentangle scale effects from operational effects. In smaller systems, performance differences are expected to be sensitive to both facility choice and operating regime, whereas in larger systems, structural advantages of certain facility combinations are expected to dominate despite variations in dispatch intensity or capacity allocation. This benchmark design therefore provides a rigorous foundation for analyzing how facility robustness, performance dispersion, and near-optimal solution sets evolve as urban CDW systems grow in size and complexity.
All numerical parameters, including waste-generation profiles, facility capacities, and transportation costs, are calibrated using data consistent with the Wuhan metropolitan context. At the same time, the experimental design deliberately avoids reliance on highly specialized or proprietary data sources. A minimum viable implementation requires only routinely available planning inputs, such as approximate demolition volumes, candidate facility capacities, fleet availability, and network distances. Higher-fidelity data can be incorporated to improve accuracy but are not required for applicability. Accordingly, while the reported numerical results are specific to Wuhan, the modeling assumptions, benchmark structure, and evaluation logic are transferable to other urban CDW management systems, subject to local calibration.
4.2. Operating Regimes and Performance Evaluation
System performance depends on both the selected facility set and the operating conditions under which collection and processing are executed. To isolate this interaction, we vary two core operational levers in urban CDW logistics: dispatch intensity and processing capacity. Their combination defines the operating regime used to evaluate each facility configuration.
Dispatch intensity specifies the share of the truck fleet that can be activated within the planning horizon, capturing how aggressively waste is collected and transported. Higher dispatch can improve service coverage but typically increases cost and environmental burden. Processing capacity represents the effective throughput available at contracted recycling facilities, reflecting contractual, technological, and operational limits on waste intake. Insufficient capacity can cause service failures regardless of dispatch effort, whereas excess capacity can buffer supply uncertainty but may be underutilized.
Each lever is tested at two levels (low/high), yielding four regimes: low-dispatch/low-capacity (L–L), low-dispatch/high-capacity (L–H), high-dispatch/low-capacity (H–L), and high-dispatch/high-capacity (H–H). Every facility configuration at each benchmark scale is evaluated under all four regimes (full-factorial design), enabling clean identification of main effects and interactions and supporting consistent cross-scale comparisons.
For each configuration–regime pair, performance is measured using three indicators. Economic efficiency is captured by the expected total system cost (transportation cost for empty-haul and loaded movements plus facility processing cost). Service completeness is measured by expected unmoved waste, i.e., waste not collected or processed within the planning horizon due to dispatch or capacity limits. Environmental performance is represented by an emissions-related indicator associated with transportation and processing activities.
For within-regime ranking, cost and unmoved waste are combined into a composite performance score, with unmoved waste assigned a substantially higher penalty. This reflects a planning priority in which meeting service requirements is non-negotiable, even if it increases transportation cost. Environmental outcomes are reported separately (not embedded in the composite score) so trade-offs can be assessed explicitly and incorporated later via multi-criteria efficiency benchmarking.
All indicators are estimated via repeated stochastic simulation with common random numbers, ensuring fair and statistically consistent comparison across facility configurations and operating regimes. This design provides a rigorous, transparent basis for the comparative results reported in the next section, including absolute performance, robustness, and efficiency patterns across scales and regimes.
4.3. Optimization Outcomes Under Operating Regimes
This subsection reports the direct outputs of the simulation–optimization layer, prior to any DEA-based multi-criteria benchmarking. For each benchmark scale and each operating regime, the optimization procedure identifies the recycling facility triplet that minimizes the composite performance score defined in
Section 4.2. At this stage, the objective is intentionally
regime-specific: alternatives are compared only within the same dispatch–capacity setting to isolate how facility selection performs under a fixed operational envelope.
Table 2 summarizes the best-performing facility configuration obtained for every combination of scale and operating regime. The table should be interpreted as an optimization-stage screening result: it highlights, under uncertainty, which facility triplet achieves the strongest performance with respect to (i) economic cost and (ii) service completeness (unmoved waste), as aggregated by the composite score. The environmental indicator is reported for diagnostic transparency but does not determine optimality at this optimization stage.
Importantly, the configurations listed in
Table 2 are
not presented as final decision recommendations. They represent within-regime optima and therefore do not support cross-regime or cross-scale efficiency claims. Instead, they provide a compact and structured candidate set that is forwarded to the DEA stage, where facility configurations are benchmarked jointly across economic, service, and environmental dimensions without imposing subjective weights and where cross-regime comparisons become methodologically meaningful.
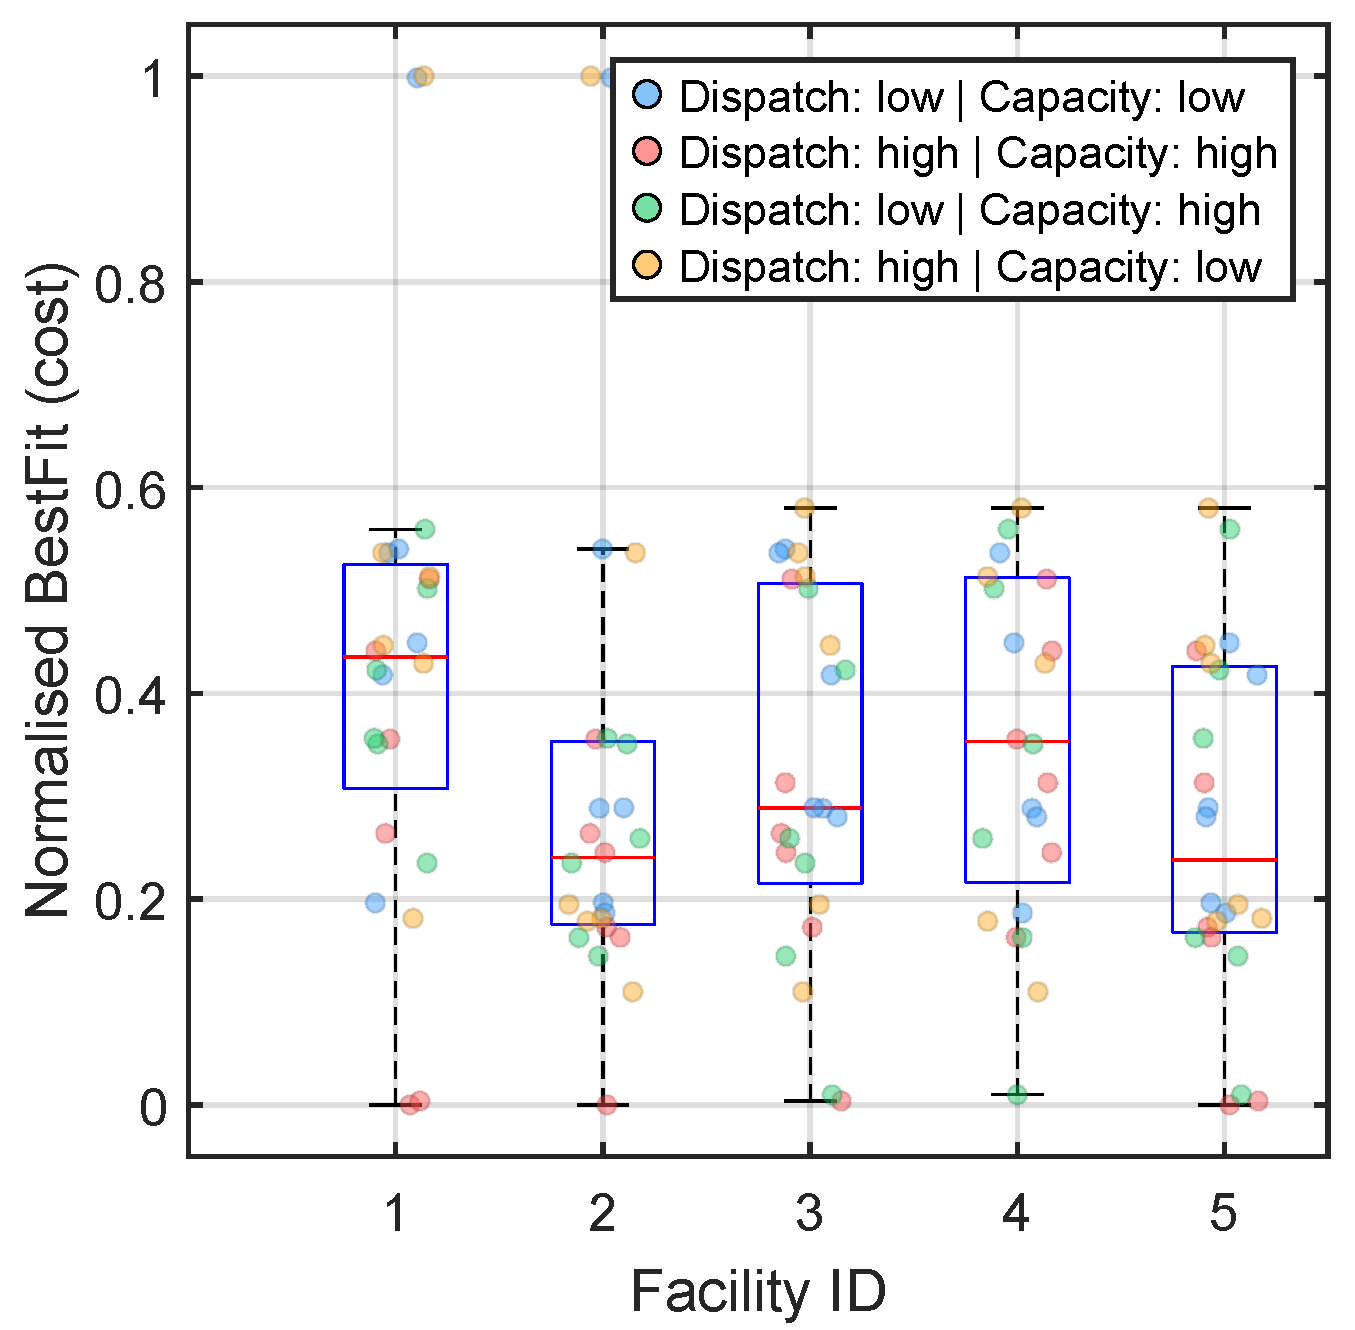
Figure 1,
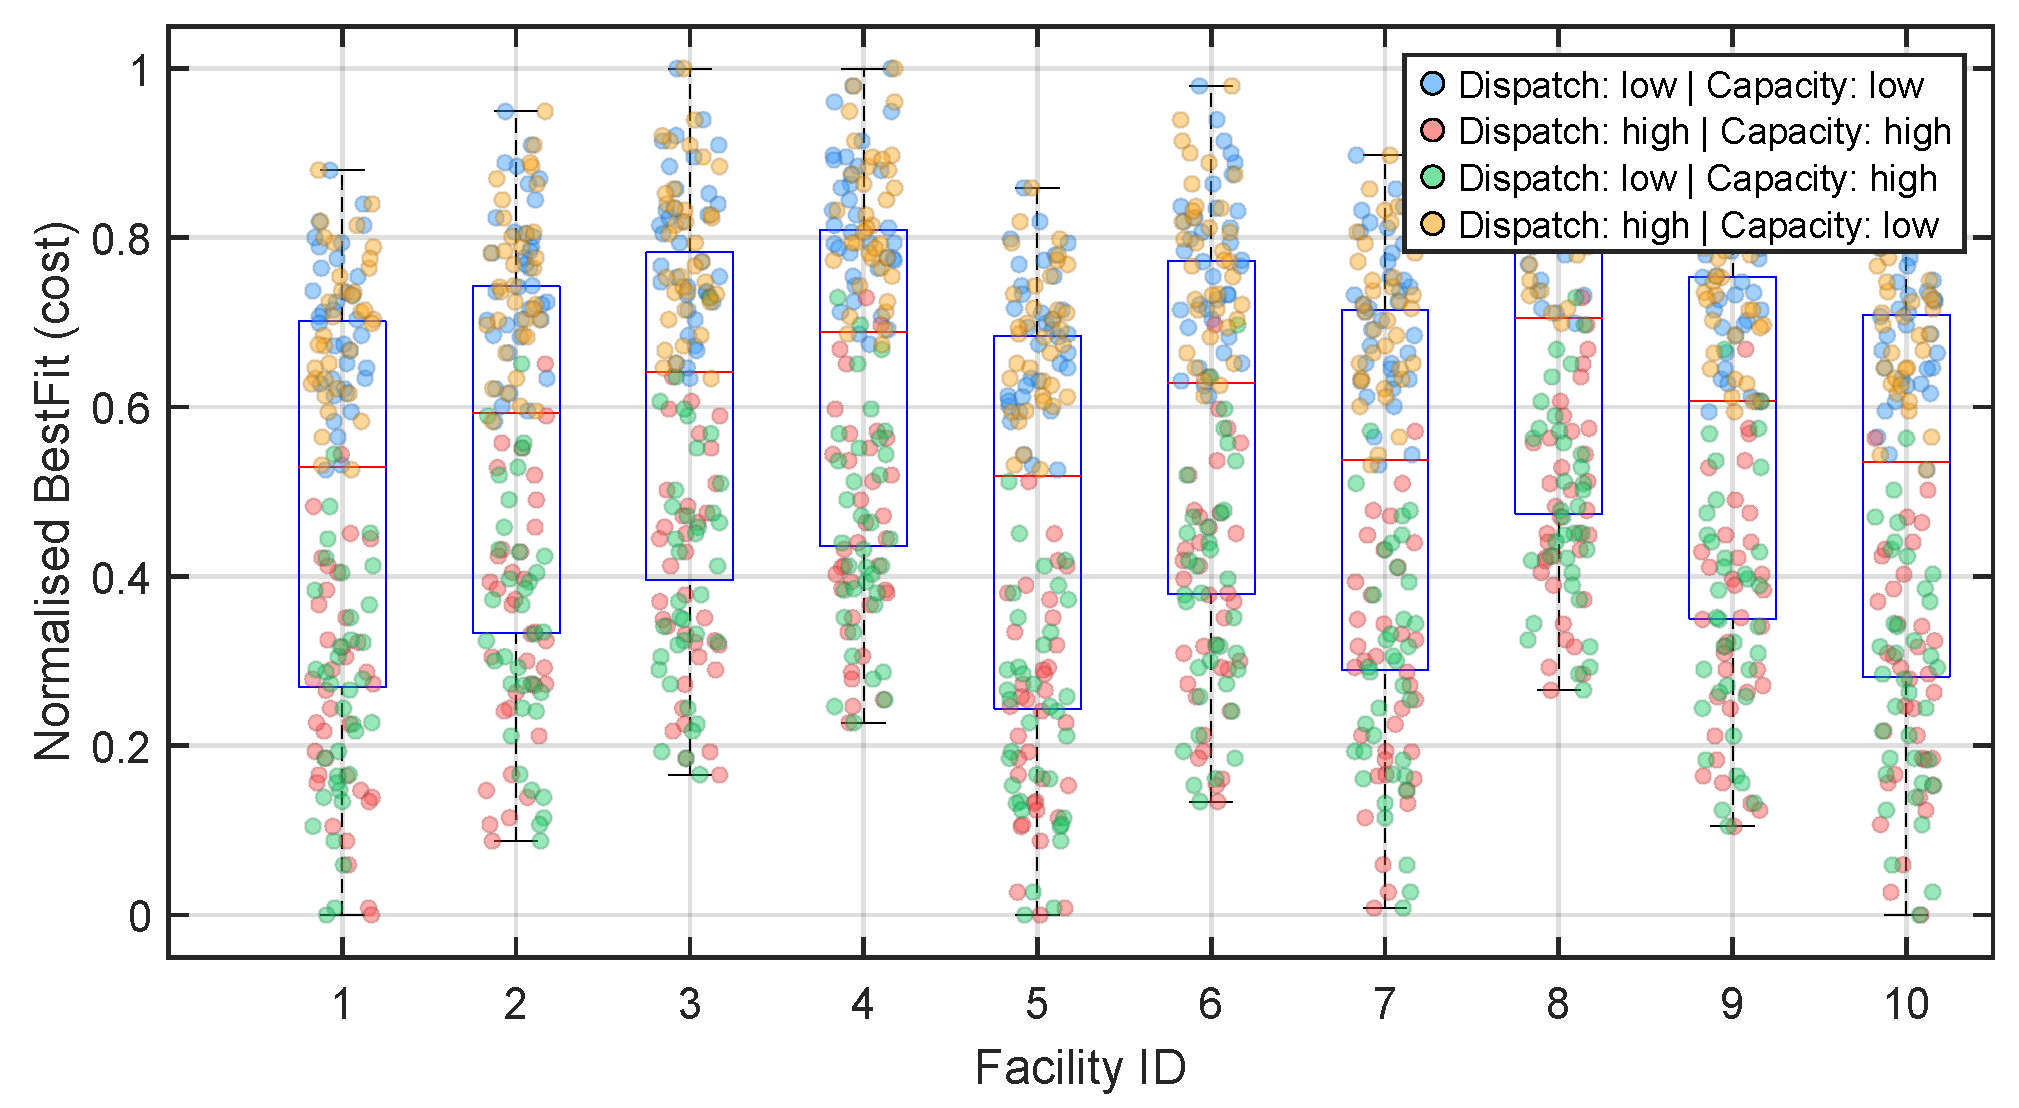
Figure 2 and
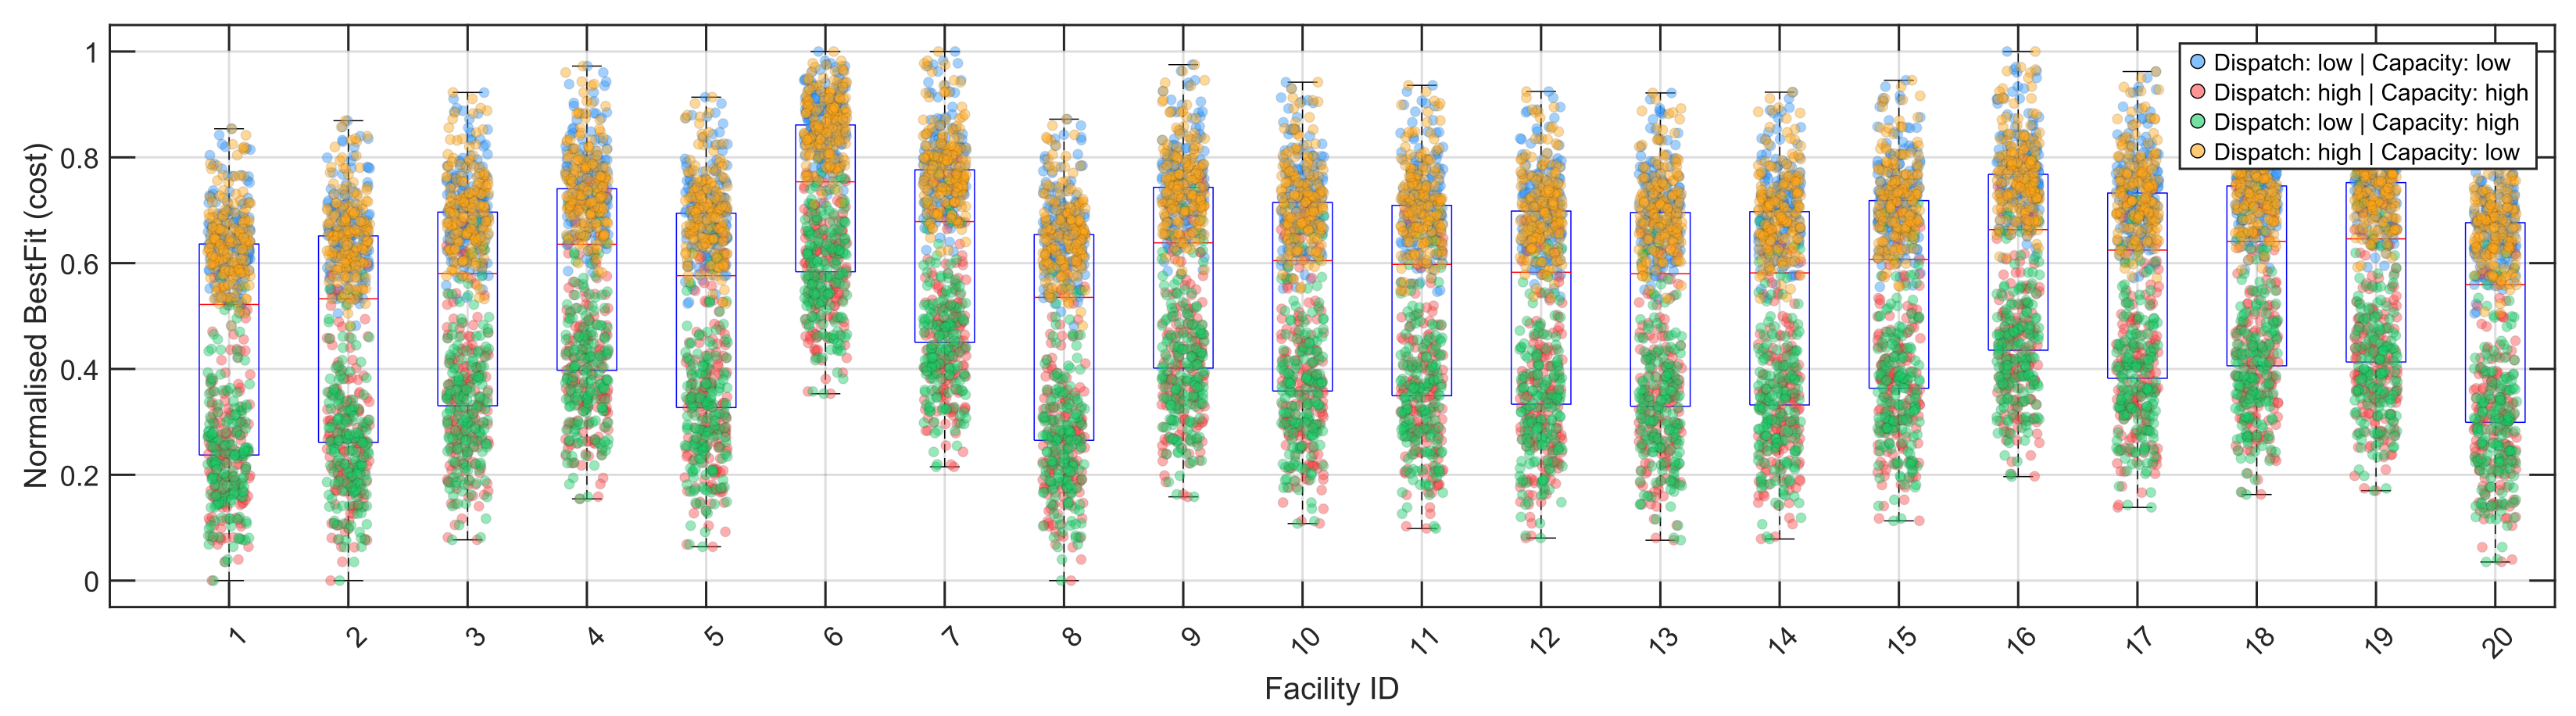
Figure 3 compare the distributions of the normalised BestFit (cost; lower is better) across facilities under four operating regimes defined by dispatch intensity (low/high) and capacity allocation (low/high). Several consistent patterns emerge across scales.
First, a clear dispatch–capacity interaction is observed: regimes that better align transport effort with processing capability yield lower central tendency and improved stability. In particular, the low dispatch–high capacity regime tends to achieve the lowest medians and comparatively tighter interquartile ranges, indicating more cost-efficient and robust outcomes. In contrast, high dispatch–low capacity frequently exhibits higher medians and wider dispersion, consistent with congestion/queuing and inefficiencies induced by mismatched upstream dispatching and downstream processing capacity.
Second, outcome variability increases with problem scale. The small-scale case (
Figure 1) shows relatively compact distributions, whereas the medium- and large-scale cases (
Figure 2 and
Figure 3) display noticeably larger spread and more pronounced tail behavior. This indicates that stochastic effects and network interactions amplify as the decision space expands, making coordination between dispatching and capacity allocation increasingly consequential.
Third, facility-level heterogeneity becomes more pronounced at larger scales (
Figure 3). Some facilities consistently achieve lower-cost distributions across regimes, while others remain persistently dominated, suggesting structural differences in accessibility, spatial positioning, or network effects. This reinforces that effective policy design requires facility-aware screening rather than uniform operating rules.
4.4. DEA-Based Efficiency Benchmarking Across System Scales
This subsection reports the final decision-support results from the Data Envelopment Analysis (DEA) stage. Building on the regime-specific optimization outcomes in the previous subsection, DEA benchmarks facility configurations jointly across economic, service, and environmental dimensions, enabling cross-regime and cross-configuration comparisons that are not meaningful at the optimization stage alone. Separate DEA models are solved for the small-, medium-, and large-scale instances to account for scale-dependent structural effects. For reporting clarity,
Table 3,
Table 4 and
Table 5 list the top 40 configurations (by efficiency) for each scale; lower-ranked and clearly dominated alternatives also exist but are omitted.
In the
small-scale benchmark (
Table 3), many configurations attain an efficiency score of 1.000 under low-dispatch regimes (both low and high capacity), indicating a dense efficiency frontier and substantial substitutability among facility triplets in compact networks. Discrimination improves under high dispatch: scores spread more widely and drop to about 0.72–0.85 in high-dispatch/high-capacity settings. This pattern suggests that aggressive truck mobilization in small systems often creates inefficiencies that are not fully compensated by service or environmental gains. Overall, small systems permit considerable flexibility under conservative operations, but become more sensitive to dispatch–capacity misalignment as dispatch intensity increases.
In the
medium-scale benchmark (
Table 4), the frontier becomes more selective, with fewer triplets achieving efficiency 1.000. Frontier solutions are concentrated in low-dispatch regimes, implying that moderate transport effort combined with appropriate facility selection yields the most balanced multi-criteria performance. Efficiency declines gradually away from the frontier and remains above 0.92 for many of the top-ranked alternatives, reflecting a transitional regime in which facility choice increasingly drives outcomes while some operational flexibility remains. High-dispatch regimes are again systematically less efficient, particularly when capacity is limited.
In the
large-scale benchmark (
Table 5), the frontier is highly concentrated: only a small set of facility triplets achieves scores at or near 1.000, typically under low-dispatch regimes and around specific facility “cores,” revealing strong structural dominance as system size and complexity grow. Dispersion is pronounced even among the top-ranked set, with many alternatives in the 0.92–0.96 range and further degradation when dispatch intensity increases without commensurate improvements in service or environmental performance. In large urban systems, operational tuning cannot compensate for suboptimal facility selection; dispatch–capacity misalignment compounds inefficiencies rather than correcting them.
Taken together, the DEA results reveal a clear scale-dependent transition in decision structure. Small systems exhibit a wide frontier with many interchangeable configurations; medium systems show partial consolidation with an emerging set of consistently strong triplets; and large systems exhibit a narrow frontier dominated by a few structurally advantaged facility combinations. These results also validate the two-stage decision logic: regime-specific optimization identifies strong candidates within a fixed operating envelope, while DEA provides the final discriminatory layer for cross-regime, multi-criteria screening. Consistently across scales, increasing dispatch intensity without structurally aligned facility selection is inefficient, whereas capacity-aware, conservatively dispatched configurations form the backbone of efficient CDW logistics as urban complexity increases.
4.5. Managerial and Planning Insights
The computational results provide actionable guidance for planners in CDW logistics, clarifying the relative roles of strategic facility selection, operating regimes, and system scale in achieving robust performance.
First, across the reported top-ranked alternatives, processing capacity emerges as a key driver of service completeness, especially at medium and large scales. While dispatch intensity affects responsiveness and operating cost, higher dispatch alone does not reliably offset downstream capacity limitations. Practically, this suggests prioritizing capacity contracting (or capacity assurance) as a strategic lever, and then using dispatch policies to fine-tune economic and environmental trade-offs.
Second, the results indicate a clear scale-dependent shift in decision structure. Small-scale systems exhibit a dense efficiency frontier, implying substantial substitutability among facility triplets under conservative regimes and therefore greater operational flexibility. As scale increases, the efficiency frontier becomes more selective and concentrates around a small set of structurally strong facility cores, reducing the scope for operational tuning to compensate for suboptimal facility choices. This implies that, in larger systems, identifying a robust facility backbone should be prioritized over frequent regime re-optimization.
Third, the DEA screening highlights that decision-makers are not restricted to a single “best” configuration. Even within the reported top-40 sets, many near-frontier alternatives remain competitive, offering practical flexibility when contractual, regulatory, or political constraints prevent adopting a single preferred triplet. A portfolio-based selection among near-efficient candidates can therefore improve implementability and resilience without large performance sacrifice.
Fourth, operating regimes characterized by aggressive dispatching are consistently associated with lower DEA efficiency in the reported results, particularly when dispatch decisions are not well aligned with the effective processing capacity and network structure. This underscores the need for coordinated planning across strategic (facility selection and capacity) and operational (dispatch intensity) layers; decisions made in isolation are more likely to propagate inefficiencies as network complexity grows.
Overall, the findings support an integrated planning perspective: as systems scale up, strategic facility selection increasingly dominates performance, while operational settings act as secondary controls for balancing cost, service, and environmental outcomes.
5. Conclusions
This study developed a simulation-driven decision-support framework for urban construction and demolition waste (CDW) logistics that integrates deterministic dispatch/assignment, stochastic performance evaluation under uncertainty, metaheuristic search over facility configurations, and multi-criteria efficiency benchmarking via Data Envelopment Analysis (DEA). The framework is demonstrated as a Wuhan case study and should be interpreted as a transferable methodological workflow that requires local calibration; it is not intended for direct extrapolation to cities with different data conditions, infrastructure, and regulatory settings.
Across benchmark scales and operating regimes, the results consistently indicate that service outcomes are dominated by the alignment between dispatch intensity and effective processing capacity. Adequate capacity contracting substantially reduces unmoved waste, whereas capacity shortages produce persistent service failures even when transportation effort is increased. Although higher dispatch intensity can reduce travel-cost components in some settings, it does not reliably improve overall system performance once service completeness and environmental impacts are considered jointly; in larger networks, intensified vehicle mobilization can amplify congestion- and activity-related burdens that erode efficiency gains.
DEA adds a final, transparent discrimination layer beyond regime-specific optimization. Rather than implying a single universally dominant design, DEA identifies a limited subset of facility configurations that lie on or near the efficiency frontier and remain competitive across regimes. As system scale increases, this frontier becomes more selective, signaling a structural transition in which strategic facility selection and capacity contracting increasingly drive performance, while operational tuning (dispatch intensity) mainly serves to manage secondary trade-offs among cost, service, and environmental outcomes. The existence of multiple near-frontier configurations also supports portfolio-based planning, enabling implementable choices under contractual, regulatory, or political constraints without substantial loss of performance.
Several limitations should be acknowledged. The current formulation adopts simplifying operational assumptions (e.g., dispatch structure and route abstractions) and relies on scenario-based simulation calibrated to Wuhan-consistent parameters; therefore, DEA efficiency scores and rankings depend on the representativeness of simulated scenarios and the selected indicator set. The evaluation is also static with respect to longer-term temporal evolution, and model fidelity may be constrained in resource-limited municipalities by data quality and availability (demolition volumes/timing, travel-time variability, fleet and facility constraints, and local cost structures), motivating phased adoption and local validation prior to operational use.
Future work should extend the framework to time-varying demolition and traffic conditions, multi-trip and shift-based vehicle operations, explicit budget and contractual constraints, and broader sustainability objectives including social/community impacts. Incorporating disposal locations, inter-municipal waste-sharing mechanisms, and systematic sensitivity analysis under policy and disruption scenarios (e.g., regulatory changes or extreme events) would further strengthen robustness and practical generalizability. Despite these limitations, the proposed simulation–optimization–DEA pipeline provides a pragmatic foundation for designing more resilient, cost-effective, and environmentally responsible CDW management strategies under uncertainty.