Article

Intelligent Evolutionary Optimisation Method for Ventilation-on-Demand Airflow Augmentation in Mine Ventilation Systems Based on JADE

College of Arts, Xi’an University of Science and Technology, Xi’an 710054, China
*
Author to whom correspondence should be addressed.
Buildings 2026, 16(3), 568; https://doi.org/10.3390/buildings16030568
Submission received: 17 December 2025 / Revised: 8 January 2026 / Accepted: 27 January 2026 / Published: 29 January 2026
(This article belongs to the Section Building Energy, Physics, Environment, and Systems)

Abstract

For mine ventilation-on-demand (VOD) scenarios, conventional joint optimisation of airflow augmentation and energy saving in mine ventilation systems is often constrained in practical engineering applications by shrinkage of the feasible region, limited adjustable resistance margins, and strongly multi-modal objective functions. These factors tend to result in low solution efficiency, pronounced sensitivity to initial values and insufficient solution robustness. In response to these challenges, a two-layer intelligent evolutionary optimisation framework, termed ES–Hybrid JADE with Competitive Niching, is developed in this study. In the outer layer, four classes of evolutionary algorithms—CMAES, DE, ES, and GA—are comparatively assessed over 50 repeated test runs, with a combined ranking based on convergence speed and solution quality adopted as the evaluation metric. ES, with a rank_mean of 2.0, is ultimately selected as the global hyper-parameter self-adaptive regulator. In the inner layer, four algorithms—COBYLA, JADE, PSO and TPE—are compared. The results indicate that JADE achieves the best overall performance in terms of terminal objective value, multi-dimensional performance trade-offs and robustness across random seeds. Furthermore, all four inner-layer algorithms attain feasible solutions with a success rate of 1.0 under the prescribed constraints, thereby ensuring that the entire optimisation process remains within the feasible domain. The proposed framework is applied to an exhaust-type dual-fan ventilation system in a coal mine in Shaanxi Province as an engineering case study. By integrating GA-based automatic ventilation network drawing (longest-path/connected-path) with roadway sensitivity analysis and maximum resistance increment assessment, two solution schemes—direct optimisation and composite optimisation—are constructed and compared. The results show that, within the airflow augmentation interval [0.40, 0.55], the two schemes are essentially equivalent in terms of the optimal augmentation effect, whereas the computation time of the composite optimisation scheme is reduced significantly from approximately 29 min to about 13 s, and a set of multi-modal elite solutions can be provided to support dispatch and decision-making. Under global constraints, a maximum achievable airflow increment of approximately 0.66 m3·s−1 is obtained for branch 10, and optimal dual-branch and triple-branch cooperative augmentation combinations, together with the corresponding power projections, are further derived. To the best of our knowledge, prior VOD airflow-augmentation studies have not combined feasibility-region contraction (via sensitivity- and resistance-margin gating) with a two-layer ES-tuned JADE optimiser equipped with Competitive Niching to output multiple feasible optima. This work provides new insight that the constrained airflow-augmentation problem is intrinsically multimodal, and that retaining multiple basins of attraction yields dispatch-ready elite solutions while achieving orders-of-magnitude runtime reduction through prediction-based constraints. The study demonstrates that the proposed two-layer intelligent evolutionary framework combines fast convergence with high solution stability under strict feasibility constraints, and can be employed as an engineering algorithmic core for energy-efficiency co-ordination in mine VOD control.

1. Introduction

The mine ventilation system constitutes the “circulatory and respiratory centre” of an underground mine. It is the core safeguard system for ensuring efficient production and intrinsic safety in mines, and it plays an indispensable role in maintaining a stable underground working environment, protecting miners’ lives and preventing major hazards [1]. Because the ventilation system is a complex integrated entity characterised by multi-factor coupling and can be abstracted as a topological network, numerous researchers have adopted this network representation as a theoretical starting point and have carried out systematic investigations into the theoretical formulation of mine ventilation network calculation, algorithmic improvements, and optimisation strategies for mine ventilation systems. A range of academically insightful and practically instructive concepts and technical schemes have thereby been proposed, which have provided important support for theoretical innovation and engineering application in the domain of mine ventilation systems [2,3,4].
Focusing more specifically on airflow augmentation strategies in mine ventilation systems, the main objective is to address insufficient airflow supply in specific demand roadways. By appropriately adjusting other roadways within the ventilation system that possess the capability for airflow control, and ensuring that the variations in roadway airflows remain within a controllable range for the entire system, a targeted increase in airflow in the designated roadway can be achieved [5].
With respect to airflow augmentation strategies in mine ventilation systems, researchers in China and abroad have conducted multi-faceted explorations from the perspectives of algorithmic development, engineering technology and field applications, and a series of innovative schemes have been proposed, thereby providing key support for the iterative development of this technical field.
In terms of algorithmic improvements, in view of the problems of high energy consumption and elevated control costs caused by non-uniform and unreasonable airflow distributions in complex mine ventilation networks, Lixue Wen, Jinmaio Wang and co-workers established a multi-objective optimisation model for airflow distribution in mine ventilation networks and proposed an improved IIWO algorithm, by which both the energy consumption of the ventilation network and the number of regulators were effectively reduced [6]. Prince, Ananda Shankar Hati and co-authors [7] proposed a novel algorithm that integrates an adaptive neuro-fuzzy interface with a genetic algorithm to predict the energy consumption and airflow in underground mine ventilation systems, thereby promoting the efficient development of mine ventilation and monitoring systems. Seyyed Mojtaba Fakhari and Hatem Mrad [8] presented an optimisation method for axial Chinook fans, in which experimental design and regression analysis were employed to optimise fan parameters. It was shown that the proposed method can effectively improve fan operating conditions and reduce fan damage under off-design optimal operating conditions.
Yonghong Liu, De Huang and co-researchers [9] proposed a CART regression-tree-based classification model to analyse the factors affecting frictional resistance, and it was found that roadway cross-sectional shape, the presence of pedestrians or equipment, and support type are important parameters for predicting frictional resistance. Lihong Zhou and Davood Bahrami [10] developed a derivative-based method for calculating ventilation network sensitivities, which reduced the complexity of sensitivity computation and improved computational efficiency.
Another group of researchers has taken algorithm design and model construction as the primary line of investigation, focusing on key technical issues such as intelligent decision-making, reliability assessment and fault diagnosis in mine ventilation systems, and corresponding tailored solutions have been proposed. Junqiao Li, Yucheng Li and co-authors [11] proposed a method for measuring air mass flow rate based on anemometer sensors, by which mass-flow balance correction was achieved, and the accuracy of ventilation data acquisition was significantly improved. Junqiao Li, Yucheng Li and colleagues [12] further proposed a multi-objective intelligent decision-making and coordinated control algorithm for mine ventilation, enabling intelligent decision-making in mine ventilation systems and addressing the problems of low accuracy, slow speed and difficulty in converging to a global optimum.
Li Liu, Jian Liu and others [13] developed a reliability assessment model for mine ventilation systems based on Markov chains, by which the transition probabilities between future operating states and steady-state probabilities were analysed, enabling fast evaluation of ventilation system operating reliability. Zhitao Zhang, Junqiao Li and co-workers [14] proposed a fault diagnosis framework for mine ventilation systems based on real-time online resistance changes, and, based on the theory of resistance objectivity, an optimised sensor layout scheme was designed, thereby achieving high accuracy in the identification and localisation of faults at the ventilation network level.
However, the engineering implementation and practical application of airflow control strategies in mine ventilation systems must be constrained by the actual adjustable resistance ranges of mine roadways and must be coupled with roadway sensitivity analysis and accurate ventilation network calculation so that practically applicable airflow control schemes for mine roadways can be obtained.
For field engineering applications, Yongyin Wang, Qizhi Pan and colleagues [15] investigated the presence or absence of leakage in different types of roadways, proposed an allocation method for mine design total airflow, and put forward management recommendations for daily operation. Haiqing Hao, Shuguang Jiang and co-researchers [16] proposed an energy-saving strategy for ventilation-on-demand airflow allocation in multi-fan networks. By adopting the loop airflow method and adjusting fan parameters, both ventilation-on-demand and fan energy-saving control were realised. I. Zeqiri, Jahir Gashi and others [17] proposed a method for adjusting the effectiveness of ventilation systems in diagonal systems, and examined the determination of airflow and main fan pressure differences in such systems, thereby providing comprehensive safety and comfort in the microclimate during mining activities. Ahmad Ihsan, Nuhindro PW and co-authors [18] proposed a neural-fuzzy-based mine VOD method, in which an ANFIS system was constructed to more rapidly monitor dynamic ventilation parameters and to provide accurate and fast feedback in the optimisation of fan power and the dilution of toxic and harmful gases. Yaozhong Han, Weimin Cheng and colleagues [19] performed quantitative analysis of natural ventilation pressure-sensitive branches, designed control schemes for natural ventilation pressure, and improved the ventilation system of the Wudong Coal Mine, thereby ensuring safe and efficient production.
To address the engineering and intelligent challenges associated with airflow augmentation strategies in mine ventilation systems in an efficient manner, an intelligent airflow regulation framework for mine ventilation systems is proposed in this study, building upon and extending previous research. To the best of our knowledge, no previous study has contracted the feasible resistance-adjustment region using Taylor-difference sensitivity gating and engineering resistance margins, and then solved the resulting VOD airflow-augmentation problem with a two-layer ES-tuned JADE search equipped with Competitive Niching to retain multiple feasible optima. The new scientific insight is that, under strict feasibility constraints, the airflow-augmentation objective becomes intrinsically multimodal; therefore, algorithms that preserve multiple basins of attraction are necessary to obtain robust, dispatch-ready solution sets. This insight also explains why prediction-based constraints can accelerate optimisation by orders of magnitude without sacrificing feasibility, because they restrict the search to physically meaningful regions where multimodal optima reside. First, a Taylor-series expansion method is employed to impose rapid constraints on roadway sensitivities and airflow augmentation thresholds, which significantly reduces the computational complexity associated with directly solving the sensitivity matrix. Secondly, the airflow resistance increments for augmentation are quantitatively constrained using actual mine engineering parameters, and technically feasible augmentation roadways are screened. In this manner, a targeted increase in the airflow of the objective roadway is achieved while ensuring that the overall airflow allocation of the ventilation system remains reasonable. Building upon existing intelligent optimisation algorithms, an ES–Hybrid JADE algorithm with Competitive Niching is developed to rapidly derive airflow augmentation strategies, thereby markedly reducing the time complexity associated with directly solving the airflow optimisation problem using the traditional loop airflow method [20,21]. Practical validation has demonstrated that the proposed framework delivers robust application performance, subject to the prerequisite of maintaining a reasonable global airflow allocation, and with energy consumption minimisation adopted as the optimisation objective, intelligent airflow augmentation of the mine ventilation system has been successfully achieved.

2. Materials and Methods

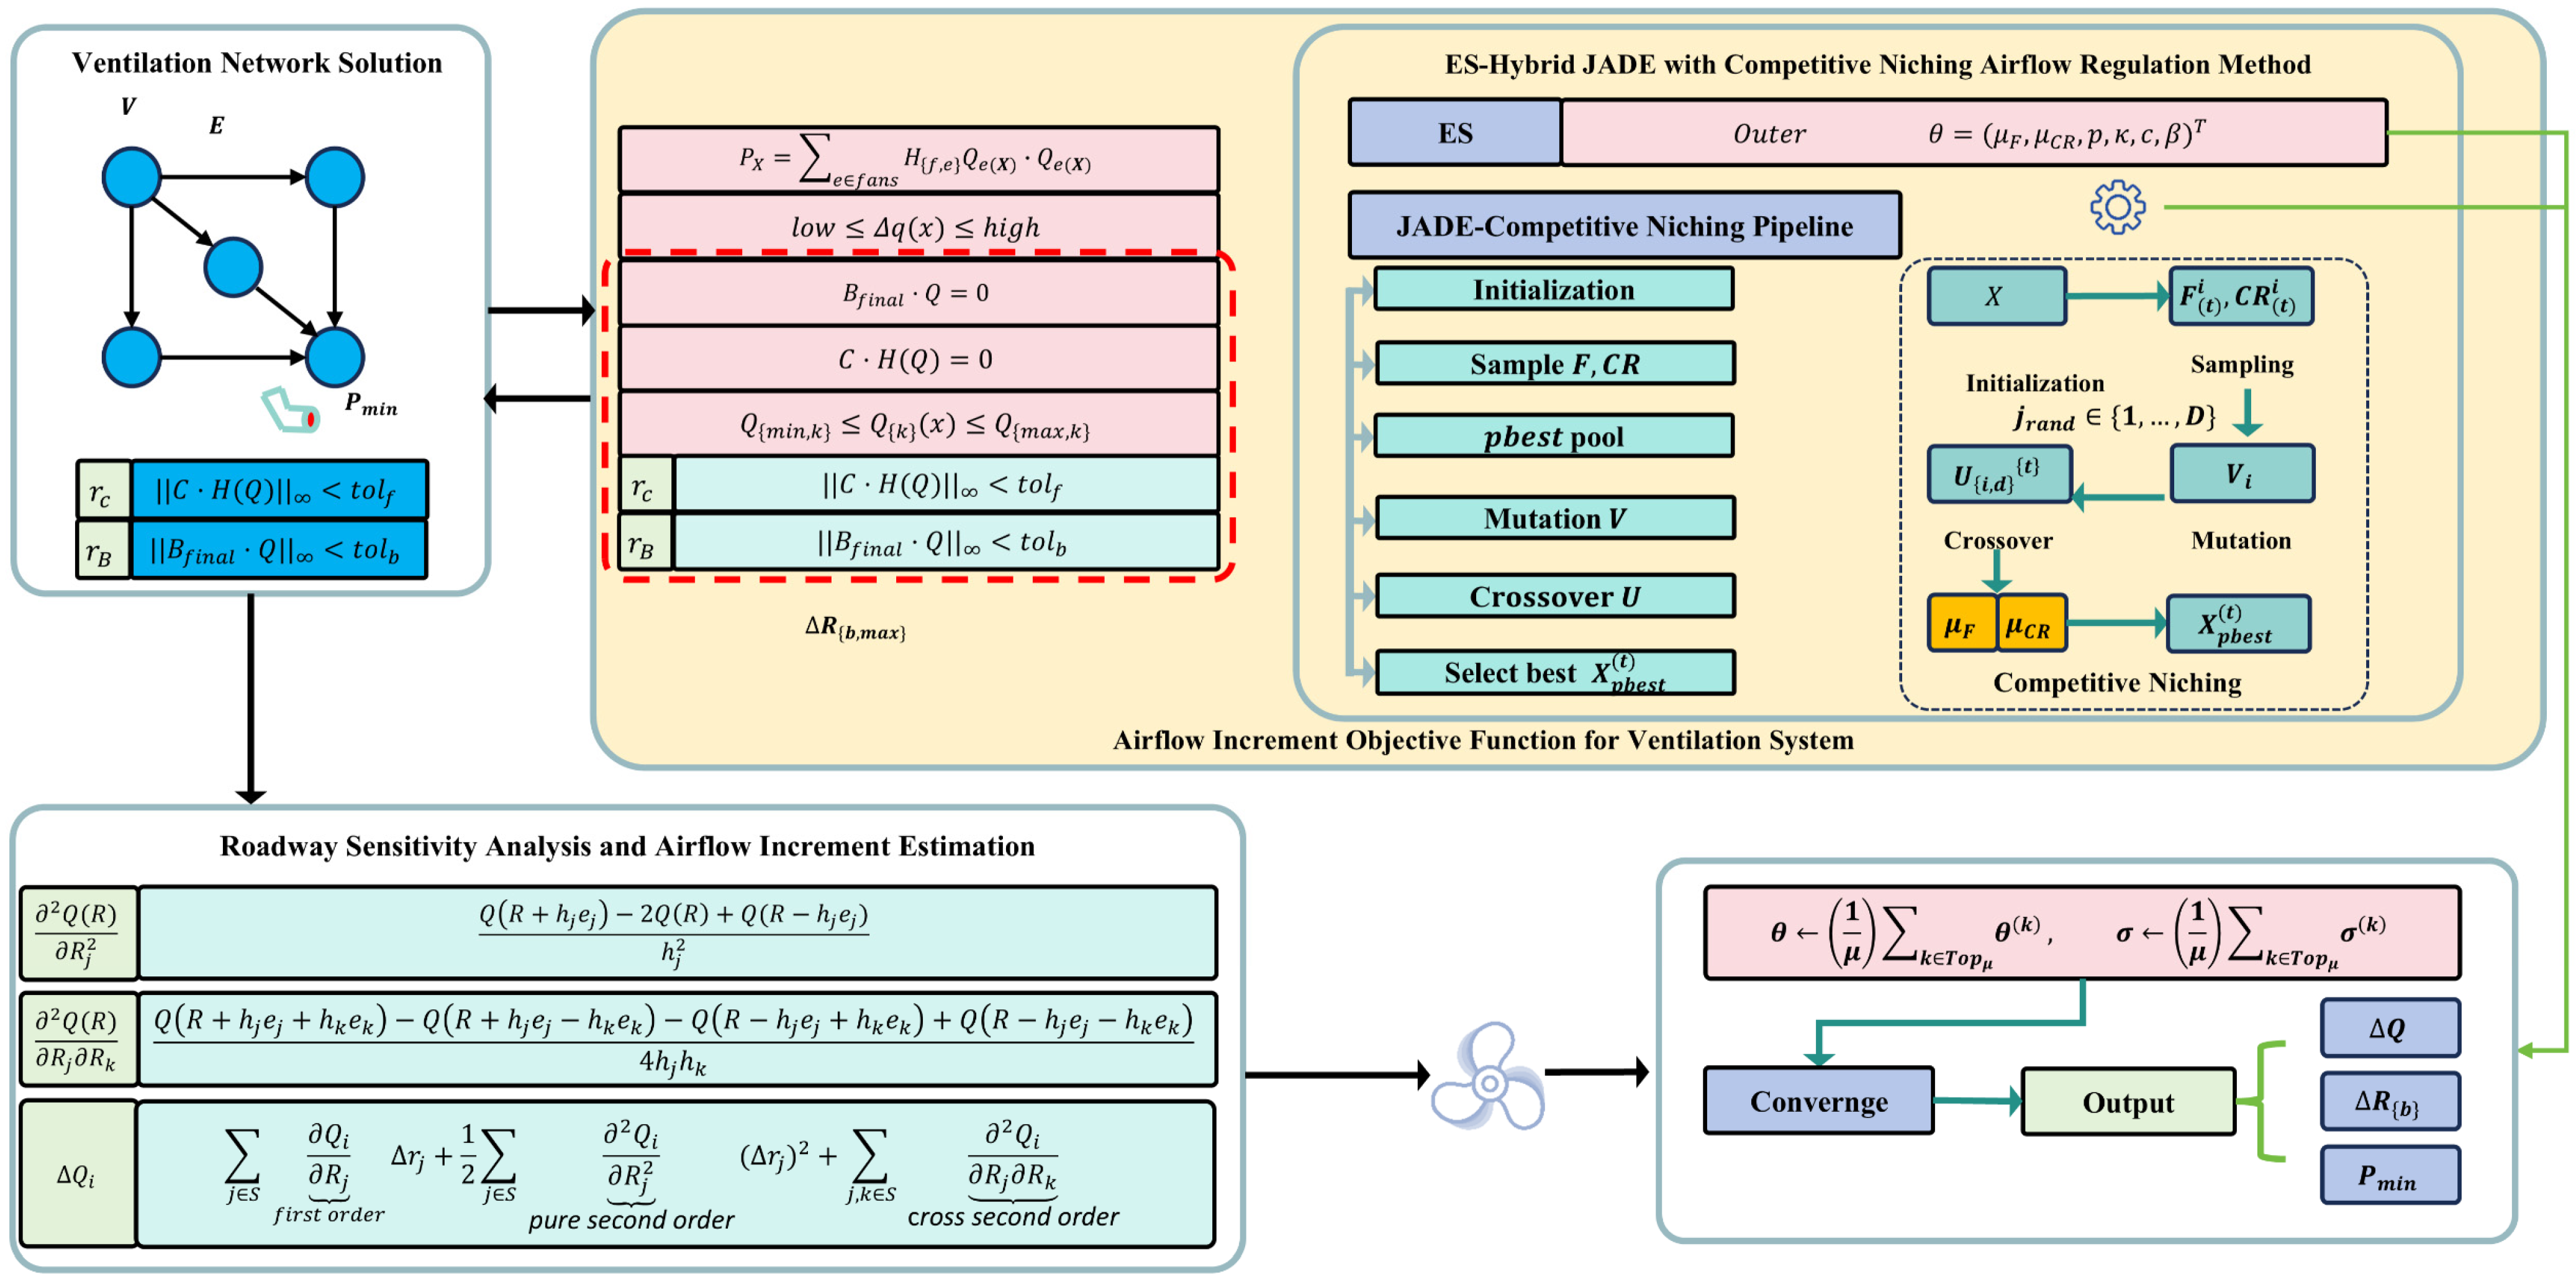
Figure 1 provides an overview of the integrated workflow proposed in this paper, comprising “ventilation-network solving–rapid sensitivity estimation–two-layer intelligent optimisation”. First, the ventilation network operating under multiple fans is solved iteratively using a dedicated network solver, and convergence is determined once the residuals of nodal mass conservation and loop energy conservation satisfy prescribed tolerances, yielding the baseline airflow allocation and power level. On this basis, the optimisation problem is formulated by taking the adjustable branch resistance increment Δ R as the decision vector X and minimising the total fan power P ( X ) , subject to physical and operational constraints, including the target-branch airflow-increment interval, upper and lower bounds on airflow for all branches, and residual constraints; consequently, a feasible resistance-adjustment region is defined. The Taylor-difference sensitivity module shown at the bottom then converts analytical sensitivities into efficient central/directional finite-difference approximations to estimate the Jacobian and Hessian, and, based on a second-order Taylor expansion, rapidly evaluates the objective airflow increment and its response to resistance perturbations, thereby providing a basis for the subsequent determination of the maximum adjustable resistance and sensitivity-based gating. Within this physically feasible domain, hyperparameters are adaptively tuned by the outer-layer ES, while the inner layer employs JADE as the core search engine to perform evolutionary iterations (initialisation, sampling of F and C R , construction of the p -best pool, and mutation), and Competitive Niching is incorporated for species partitioning and local competitive replacement so that premature convergence is suppressed and multimodal solutions are retained; as a result, a set of elite solutions satisfying the constraints can be obtained rapidly under a limited budget, and the corresponding Δ Q , Δ R and minimum power P m i n are produced for scheduling decision-making.

2.1. Solution of Mine Ventilation Networks with Multiple Fans in Joint Operation

2.1.1. Construction of the Ventilation Network Matrices

The mine ventilation network is abstracted as a directed graph G = ( V , E ) , where V = m denotes the number of nodes and E = n denotes the number of branches. For a connected network, the number of fundamental loops is given by l = n m + 1 .
To solve the ventilation network, an incidence matrix and a fundamental loop matrix are constructed. An incidence matrix B R m × n is first formed and then reduced in order. After appropriate reordering, the matrix is partitioned as B 11 R ( m k ) × l , B 12 R m k ) × ( m k , where k is the number of connected components. The reduced incidence matrix is then defined as B f i n a l = [   B 11   B 12   ] , B f i n a l R ( m 1 ) × n .
In order to ensure that each connected component is of full rank, one row is removed from each component so that the condition in Equation (1) is satisfied:
r a n k ( B f i n a l )   =   m     k
The fundamental loop matrix C is constructed according to Equation (2):
C = [ I l C 12 ] ,               C 12 = B 11 T ( B 12 T ) 1
B f i n a l · C T = 0
Once Equations (1)–(3) have been satisfied, the basic ventilation network matrices are fully specified.

2.1.2. Branch Characteristics

For any branch e , the airflow Q e is taken to be positive in the defined branch direction. Quadratic resistance and quadratic fan performance curves are adopted, as given in Equations (4)–(6):
H { R , e } ( Q e ) = R e · | Q e | · Q e
H { f , e } ( Q e ) = a e Q e 2 + b e Q e + c e
H { n a t , e } = H n o r m a l
In these expressions, R e is the resistance of the branch e ( N · s 2 / m 8 ); Q e is the airflow in the branch e ( m 3 /s); H R , e is the pressure loss due to resistance in the branch e (Pa); H f , e is the fan pressure (Pa); and H n a t , e is the natural ventilation pressure in branch e , taken as a prescribed value H n o r m a l .
The static pressure difference across the branch e , used in loop balancing, is then given by Equation (7):
H e ( Q ) = H { R , e } ( Q e ) H { f , e } ( Q e ) H { n a t , e }
Here, H e ( Q ) denotes the static pressure difference in the branch e (Pa).

2.1.3. Wind Network Calculation Control Equation

The governing equations of the ventilation network consist of the node mass conservation equations and the loop energy balance equations, which together form a coupled nonlinear system. These are expressed in Equations (8)–(10):
B f i n a l · Q = 0
C · H ( Q ) = 0
B f i n a l · Q = 0 ,             C · ( R · | Q | Q H f ( Q ) H { n a t } ) = 0
In Equation (10), Q is the vector of branch airflows; R is the diagonal matrix of branch resistances; H f ( Q ) is the vector of fan pressures; H n a t is the vector of natural ventilation pressures; and Q   Q denotes the element-wise product between Q and Q .

2.1.4. Iterative Solution of the Ventilation Network

In the loop space, the node mass conservation expressed in Equation (8) is used as the primary constraint. For the i -th fundamental loop, the perturbation B f i n a l ( Q + δ q i   c i T ) = 0 is imposed, where c i denotes the i -th row of the loop matrix C . The loop flow is then corrected, and updated airflow values are obtained. The loop residual and its approximate derivative are defined in Equations (11) and (12):
f i ( Q ) = e c { i   e } ( R e | Q e | Q e H { f , e } ( Q e ) H { n a t , e } )
d f i ( Q ) e c { i   e } 2 ( 2 R e · m a x ( | Q e | ,   q ε ) )
and the loop correction δ q i is updated according to Equation (13):
δ q i = f i / d f i
In Equation (12), q ε is a derivative floor that is introduced to avoid vanishing derivatives.
The iterative solution of the ventilation network is terminated when both residual criteria r c = C   H ( Q ) < t o l f , r B = B f i n a l   Q < t o l b are satisfied. In this study, the tolerances are set as t o l f = t o l b = 10 6 . These two residual constraints constitute key criteria for controlling both the numerical accuracy of the network solution and the reliability of the computational procedure. In practical applications, when both residuals fall below 10 6 , the resulting solution accuracy is generally sufficient to meet the airflow-calculation requirements of mine ventilation engineering.

2.2. Taylor-Difference-Based Method for Mine Roadway Sensitivity

In the design optimisation and operational control of mine ventilation systems, roadway sensitivity analysis constitutes a key technical step for assessing the potential to increase airflow in specific roadways. In current engineering practice, the most widely used approach is to construct and solve a sensitivity matrix for the network, so that quantitative evidence can be provided for the feasibility assessment of airflow adjustment [22]. To improve the computational efficiency of roadway sensitivity analysis, a Taylor expansion approach is adopted, whereby analytical expressions of roadway sensitivities are transformed into finite-difference approximations.
For a network with n branches, the branch resistances are denoted by the vector R = ( R 1 , , R n ) T .
To simplify the computation of resistance sensitivities, both the Jacobian J = Q R R n × n and the branch-wise second-order Hessian matrices H i = [ 2 Q i R j   R k ] j , k are approximated using central and directional finite differences, thereby enabling efficient evaluation. For each branch j , a step size h j = 0.01   Δ R m a x , j is selected, where Δ R m a x , j is determined by the admissible adjustment range of branch resistance [23].
The first-order sensitivity Q / R j is approximated by the central difference formula in Equation (14):
Q ( R ) R j Q R + h j e j Q R h j e j 2 h j
where e j is the j -th standard basis vector. By assembling the results for all j , the Jacobian J is obtained.
The second-order sensitivities are similarly approximated and can be separated into diagonal and off-diagonal (cross) terms, as expressed in Equations (15) and (16). The second-order sensitivity finite-difference method is applicable to quantifying the degree to which the objective airflow responds to coupled effects arising from multiple branches. Through finite-difference operations, the second-order response of the objective airflow under simultaneous variations in several branches can be characterised accurately, thereby enabling airflow sensitivity analysis under multi-branch interaction. Branches exhibiting high sensitivity indicate that the network-wide airflow distribution is strongly responsive to changes in those branches; consequently, regulating the resistance of such branches can substantially alter the airflow allocation of the entire ventilation network.
2 Q ( R ) R j 2 Q R + h j e j 2 Q R + Q ( R h j e j ) h j 2
2 Q ( R ) R j R k Q R + h j e j + h k e k Q R + h j e j h k e k Q R h j e j + h k e k + Q R h j e j h k e k 4 h j h k
Airflow changes are then estimated by a second-order Taylor expansion. When small resistance adjustments Δ r = ( Δ r 1 , , Δ r n ) T are planned on a subset of branches S , the airflow increment for the branch i can be approximated by the second-order Taylor expansion in Equation (17) [23]:
Δ Q i j S   Q i R j f i r s t   o r d e r Δ r j + 1 2 j S   2 Q i R j 2 pure   second   order ( Δ r j ) 2 + j , k S   2 Q i R j R k cross   second   order Δ r j Δ r k , i = 1 , , n .

2.3. ES–Hybrid JADE with Competitive Niching for Airflow Regulation

Because direct optimisation of airflow regulation via repeated solution of the full ventilation network is computationally inefficient, an ES–Hybrid JADE with Competitive Niching scheme is adopted to accelerate the solution of the airflow adjustment problem. An evolution strategy (ES) [24] is employed as the outer optimiser, and JADE (Adaptive Differential Evolution with Optional External Archive) [25] is used as the inner optimiser for self-adaptive hyper-parameter adjustment. In this way, rapid airflow regulation is achieved within a physically reasonable resistance adjustment region.

2.3.1. Optimisation Problem and Constraints

The decision vector X R D consists of the resistance increments Δ R of the adjustable branches, i.e., X = ( Δ R b 1 , Δ R b 2 ,   ) T , X [ l , u ] R D , where b d { 1 , , D } denotes the actual branch index corresponding to the dimension d , and l and u represent the lower and upper bounds of the adjustable resistance increments. The updated branch resistances are defined in Equation (18):
R b d X = R b d 0 + X d ,       R b X = R b d 0       i f   b   D
where R b d X is the resistance of the adjustable branch b d after modification and R b d 0 is its initial resistance.
The primary optimisation objective is to minimise the total fan power, as expressed in Equation (19):
P X = e f a n s H { f , e } Q e ( X ) · Q e ( X )
where P X is the total fan power (kW); Q e ( X ) is the airflow of fan branch e ( m 3 /s); and H f , e is the corresponding fan pressure (Pa). The airflow vector Q ( X ) is obtained by solving the ventilation network equations, and the airflow increment of the target branch is given by Δ q ( X ) = Q t a r g e t ( X ) Q t a r g e t 0 .
Due to service life and wear, the fan pressure and fan power characteristic curves can deviate substantially from their factory-specified profiles. By aggregating the power across all underground branches and estimating the in situ fan pressure curve from the measured airflow curve, the total airflow-related power of the entire system can be computed more effectively [26].
If the node mass conservation and loop energy conservation equations in Equations (8)–(10) were imposed directly as constraints within a generic optimisation framework, without exploiting the structure of the ventilation network, the resulting constraint strength would be relatively weak and the computational efficiency low, compared with a dedicated ventilation network solver in which the conservation laws are embedded into the solution logic. Therefore, in this study, the dedicated network solver is used directly, instead of imposing the conservation equations as explicit constraints in the optimisation problem.
The physical and operational constraints are expressed in Equations (20)–(22):
l o w Δ q ( x ) h i g h
Q { m i n , k } Q { k } ( x ) Q { m a x , k }   ,       k
r c = | | C · H ( Q ) | | < t o l f ,       r B = | | B f i n a l · Q | | < t o l b
In Equation (20), l o w and h i g h define the admissible range of the target airflow increment Δ q ( X ) . For ordinary branches, the permissible airflow range is chosen as [ 0.7 ,   1.3 ] times the original airflow; for demand branches, [ 1.0 ,   1.3 ] times the original airflow is adopted; and for fan branches, the allowable airflow range is restricted to lie between 60% and 90% of the fan’s peak-efficiency region on its characteristic curve.

2.3.2. Inner-Layer JADE Optimisation

Within the inner algorithm, an initial population of N individuals is generated by uniformly sampling the resistance increments for each adjustable branch within its admissible interval, i.e., Δ R b 0 [ 0 , Δ R b , m a x ] , i = 1 , , N , such that the resulting Δ q ( X ) lies within the target interval, while P X is minimised.
Two adaptive sampling schemes are then applied to each individual. The scaling factor F ( t ) i is drawn from a Cauchy distribution and truncated to ( 0,1 ] , while the crossover probability C R ( t ) i is drawn from a normal distribution and truncated to ( 0,1 ] , as expressed in Equations (23) and (24):
F ( t ) i ~ C a u c h y ( μ F t , 0.1 ) 1 ( 0,1 ]
C R ( t ) i ~ N o r m a l ( μ C R t , 0.1 ) 1 ( 0,1 ]
where μ F t and μ C R t are the generation-dependent location parameters, and 1 ( 0,1 ] denotes truncation to the interval ( 0,1 ] . When F i t ( 0,1 ] , the search is encouraged to be biased towards the current best individuals; when C R ( t ) i ( 0,1 ] , the probability that a dimension adopts the mutated value is controlled.
The p -best mutation strategy is then applied. The population is sorted in ascending order of P X , and the best p N individuals are collected into the candidate set P t . For the i -th individual, the mutant vector V i is generated as in Equation (25):
P X = e f a n s H { f , e } Q e ( X ) · Q e ( X )
where X p b e s t P t ; X r 1 is drawn uniformly at random from the current population with r 1 i ; and Z r 2 is chosen with equal probability from the union of the current population and an external archive of historical individuals.
A binomial crossover is then performed. A random index j r a n d { 1 , , D } is selected to ensure that at least one dimension is inherited from the mutant. For each dimension d , the trial vector U i is formed according to Equation (26):
U i , d t = V i , d t ,   i f   r a n d ( ) < C R t i ,         o r   d = j r a n d X { i , d } { t }
and U i is then clipped back to the bounds via U i = c l i p l u ( U i ) .
A greedy selection scheme is applied: if P ( U i ) P ( X i ) , then X i is replaced by U i ; otherwise, X i is retained. The archive of historical individuals is updated accordingly.
Finally, the parameter memories are updated. For each generation, the subset of accepted individuals is collected and used to update the memory means μ F and μ C R according to Equations (27) and (28):
μ F 1 c μ F + c · F i 2 F i
μ C R 1 c μ C R + c · m e a n ( C R i )
where c is a learning rate.

2.3.3. Competitive Niching

To suppress premature convergence, a “Competitive Niching/speciation” strategy is employed. A normalised distance measure and a neighbourhood radius are used to partition the population into species, and competitive replacement and p -best selection is performed within local neighbourhoods [27].
Because the airflow augmentation problem is solved within a feasible region, maintenance of multiple basins of attraction is required. The normalised distance and neighbourhood radius are defined in Equations (29) and (30):
d ( x , y ) = ( x y ) ( u l )
σ t = κ · m e d i a n i < j d ( X i , X j )
where denotes element-wise division; κ is a scaling parameter; and σ t is the generation-dependent species radius.
Species are formed by selecting centres c k in descending order of fitness and assigning all individuals within distance σ t to the species of c k ; uncovered individuals are then used to form new species centres.
Competitive selection is then performed locally. For each trial vector U i , only its nearest competitor within the ball neighbourhood N i = { j : d ( U i , X j t )   is   minimal } is considered. The update rule is given in Equation (31):
X j ( t + 1 ) = U i ,       i f   F ( U i ) F ( X j ( t ) ) X j t ,       o r ,   j = a r g m i n j d ( U i , X j ( t ) )
Within each species, the p -best individuals used in mutation are selected probabilistically. With probability β , X p b e s t t is drawn from the T o p p · S i elites within the species S ( i ) of individual i ; with probability 1 β , X p b e s t t is drawn from the T o p p · N elites of the entire population, as described in Equation (32):
X p b e s t ( t ) ~ T o p p · S i S i ,   p r o b a b i l i t y   β T o p p · N G l o b a l ,   p r o b a b i l i t y   1 β
where S ( i ) is the index set of the species containing the individual i , and T o p k ( S ) denotes the best k members of a set S in terms of objective value P .

2.3.4. ES-Based Adaptive Tuning of JADE and Niching Hyper-Parameters

The hyper-parameter vector is defined as θ = ( μ F , μ C R , p , κ , c , β ) T , and a ( μ / μ , λ ) -ES scheme is adopted, where λ is the number of candidate hyper-parameter vectors generated per generation and μ is the number of parents selected for recombination. The notation ( μ / μ , λ ) -ES indicates that μ parents are recombined to produce λ offspring, from which the best μ are selected as the new parents.
In each ES generation, λ candidate hyper-parameter vectors are sampled as described in Equations (33) and (34):
σ ( k ) = σ · e τ 0 N 0 + τ z k ,       z k ~ N ( 0 , I )
θ ( k ) = θ + σ ( k ) z k ,       k = 1 , , λ
where σ R > 0 M denotes the positive step sizes for each hyper-parameter; N 0 N ( 0 , I ) is a global step perturbation with strength controlled by τ 0 ; z k N ( 0 , I ) is a per-dimension Gaussian noise with strength τ ; σ k are log-normally updated step sizes; and denotes the element-wise product.
Each candidate θ k is then evaluated by running the inner algorithm for a small, fixed budget of G e v a l generations, and recording both the best objective value and a diversity indicator, as expressed in Equations (35) and (36):
f b e s t ( k ) = m i n t < e v a l m i n i F ( X i t ; θ ( k ) )
M ( k ) = N u m b e r   o f   S p e c i e s ( X ( t ) ; θ ( k ) )
Here f b e s t k is the best objective value achieved under hyperparameters θ k , and M k is the number of species identified in the population.
The outer-layer ES fitness is scalarised as J ( θ k ) = f b e s t k + γ   ϕ ( M k ) , where the penalty term ϕ ( M k ) is defined in terms of a target species number M t a r g e t as ϕ ( M k ) = m a x ( 0 ,   M t a r g e t M k ) .
Finally, the top μ candidates with the smallest fitness values are selected and recombined by arithmetic averaging, as shown in Equation (37):
θ 1 μ k T o p μ θ k ,       σ 1 μ k T o p μ σ k
The inner algorithm is terminated once a stable set of feasible solutions has been obtained, whereas the outer ES is terminated upon reaching the predefined iteration budget. The final output consists of the actual resistance increments Δ R for each adjustable branch. Hyperparameter selection was carried out entirely by the outer-layer ES and was not manually tuned. We specified broad, the literature-informed bounds for the JADE control parameters and for the niching parameters, and initialised ES by uniform sampling within these bounds. In each ES generation, each candidate hyper-parameter vector was evaluated by running the inner JADE-with-niching optimiser for a fixed small budget; the ES fitness combined the best objective value and a diversity term, averaged over repeated runs with different random seeds. The final hyper-parameter setting used in all experiments corresponds to the best ES candidate at termination. To avoid information leakage, all validation analyses were performed only after the ES tuning stage was completed; these validation scenarios were not used to update the ES or to select hyperparameters during tuning.

3. Results

The ventilation system of a coal mine in Shaanxi Province, equipped with two main exhaust fans, was selected as the case study. For this system, the algorithm implementation and simulation environment were established in Python 3.9, and all computations were performed on a workstation equipped with an Intel Core i7-8750H processor. On this basis, simulation-based studies and validation of airflow augmentation optimisation strategies for the mine ventilation system were carried out.

3.1. Basic Description of the Mine Ventilation System

The initial steady-state solution of the ventilation network is summarised in Table 1. The fan performance curves for the two main fans are given by
y 1 = 0.1146506544704216   Q 2 + 11.30231253476595   Q + 2179.569279959018 , y 2 = 2.918052726036858   Q 2 + 145.9026363018429   Q + 4620.091081643846 .
where y 1 corresponds to the Main Exhaust Airway and y 2 corresponds to the 385 Return Air Fan Roadway. The column “Type” denotes the roadway type, with 1 indicating an ordinary roadway, 2 a working-face roadway and 3 a fan roadway. The column “Air Pressure” represents the natural ventilation pressure. The residuals of the network solution, r c and r b , both satisfy the convergence criterion of 10 6 .
In the test results, it was observed that, if a dedicated network solver is not employed and the conservation laws are instead imposed as explicit optimisation constraints, the optimisation process is far more likely to diverge; moreover, the computational speed decreases as the number of loop equations (i.e., the size of the nonlinear constraint system) increases. It should also be noted that numerical divergence may still occur even with a dedicated solver, because the convergence of iterative methods depends strongly on the choice of initial values and on the properties of the Jacobian matrix. If the initial airflow values are set excessively large, oscillatory divergence can occur; therefore, on the basis of a preliminary understanding of plausible airflow magnitudes, an initial value of 0.001 was adopted to mitigate this issue effectively. In addition, if topological redundancy exists in the network (leading to a singular Jacobian with zero determinant), the Jacobian becomes non-invertible, and the solution process may terminate. In such cases, measurement errors in the initial data can further lead to inaccurate solutions. After convergence, the computed airflow rates can be compared against roadways with known airflow values to verify solution accuracy, thereby providing a reliable basis for the subsequent optimisation stage.

3.2. Maximum Increment of Roadway Resistance

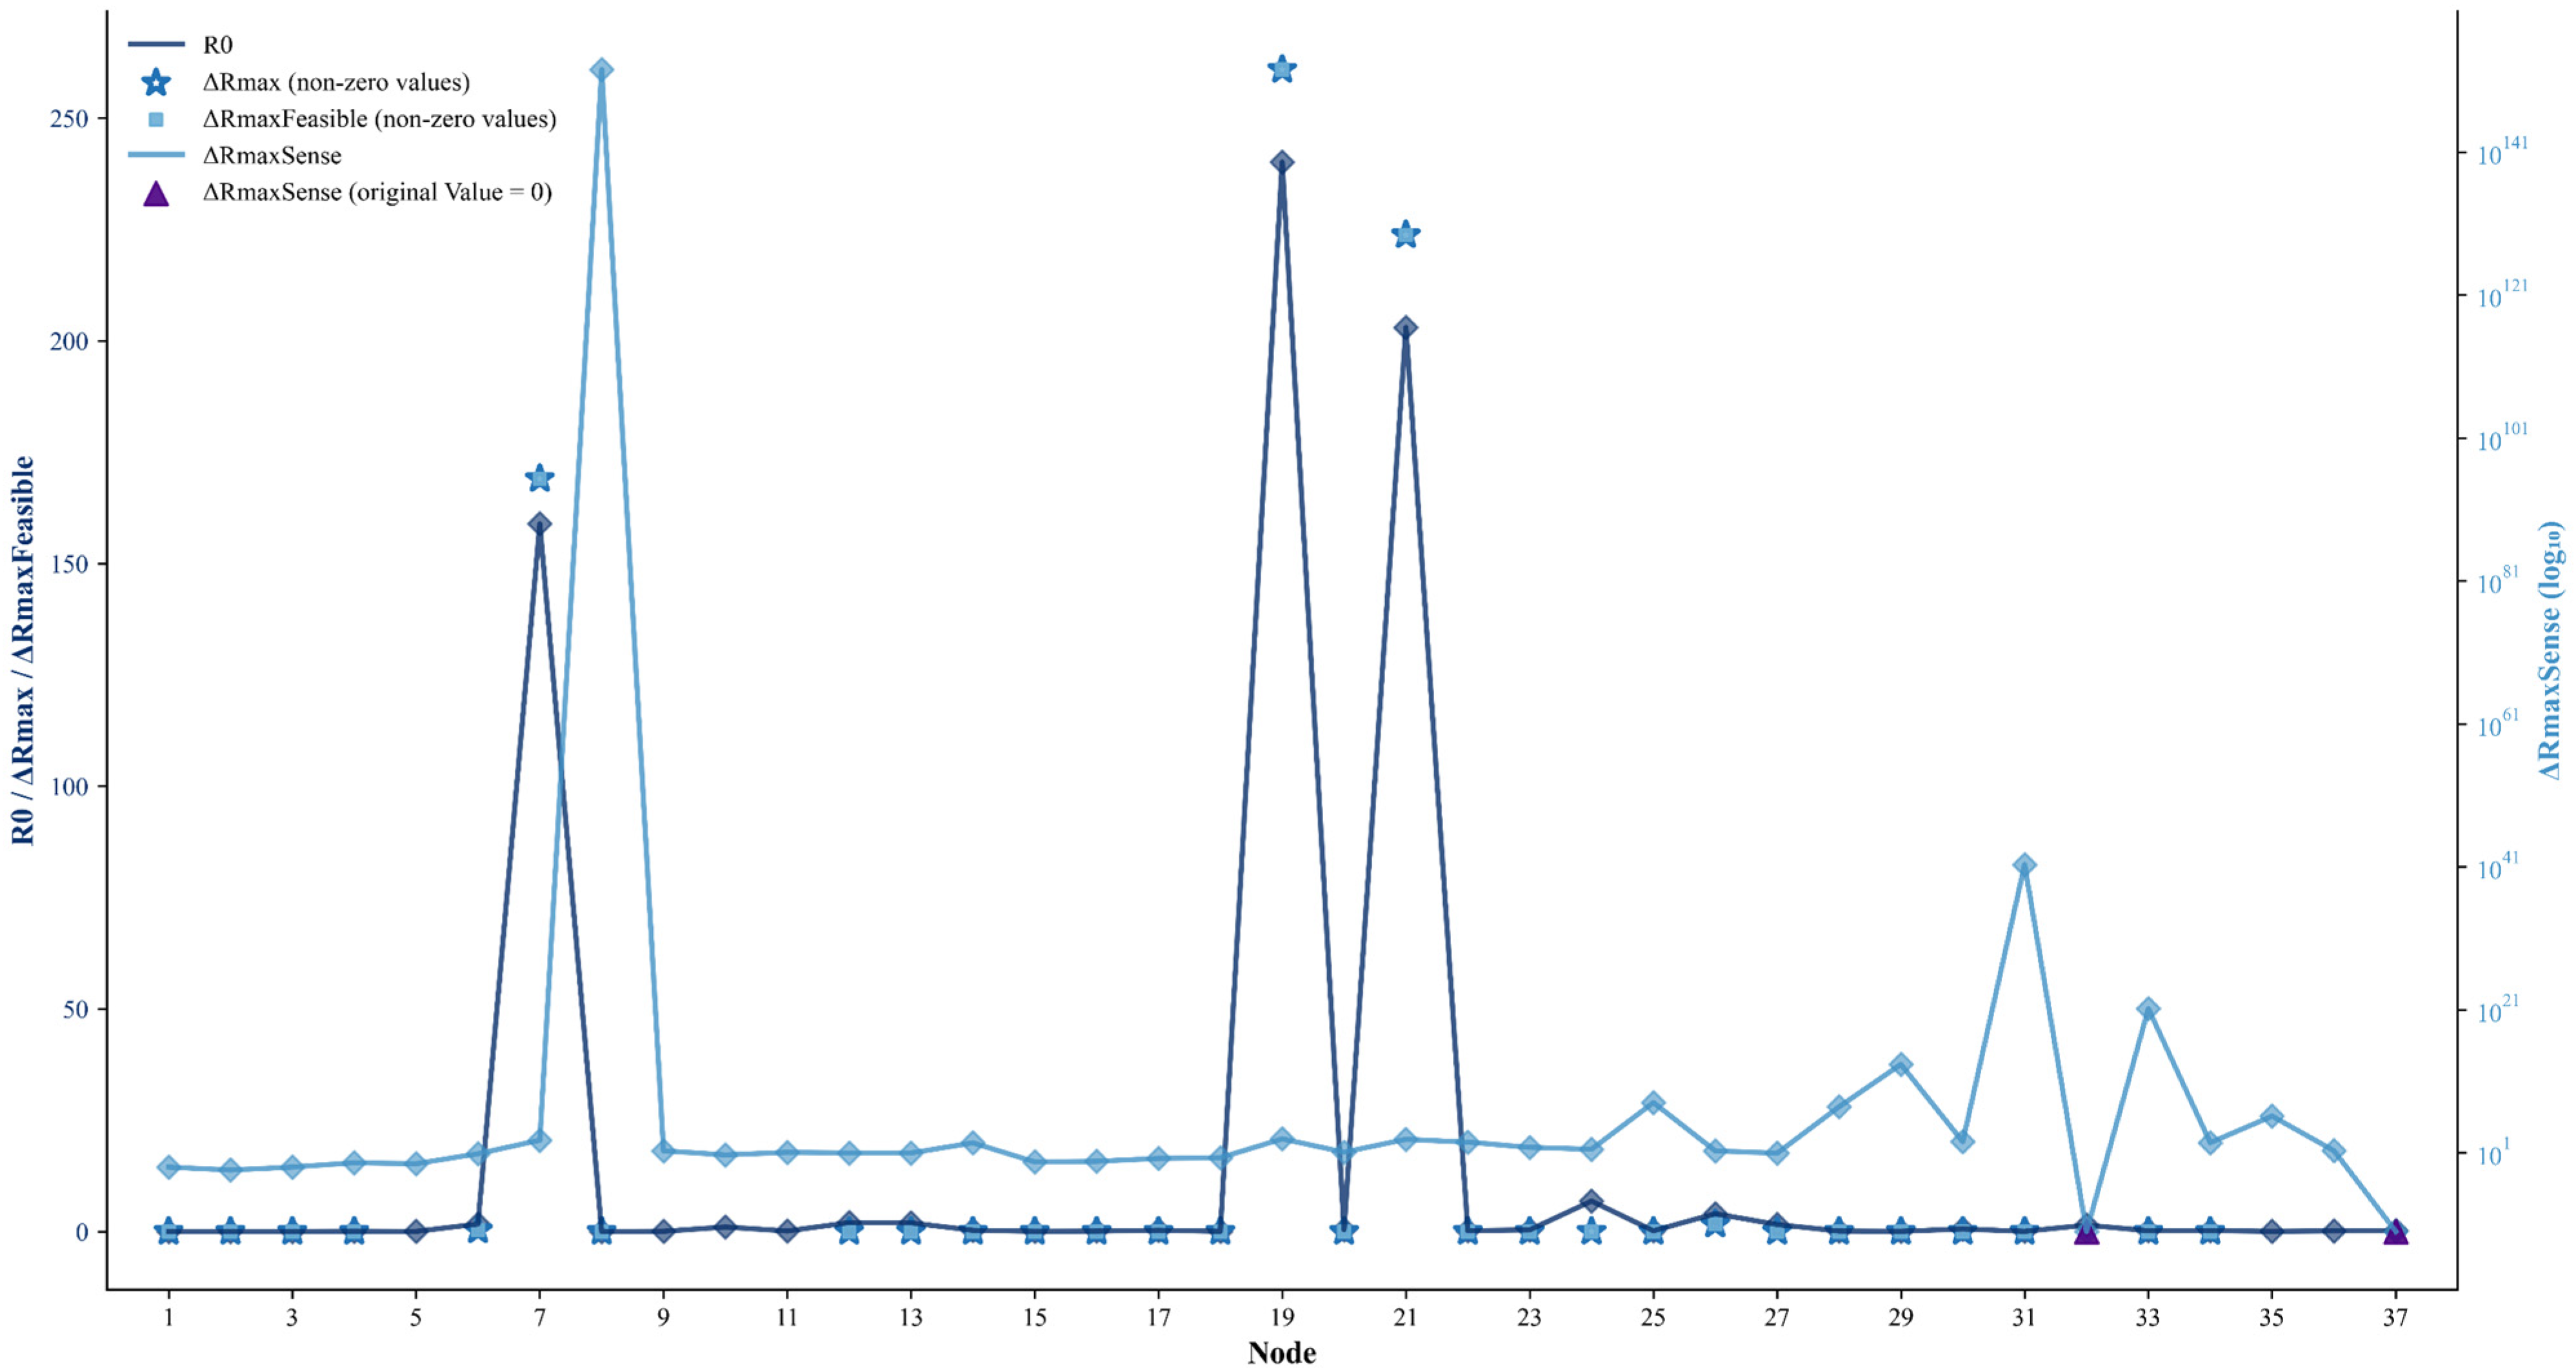
On the basis of the constraint in Equation (21), the maximum additional resistance for each branch was calculated. The results are shown in Figure 2. In this figure, Δ R m a x , F e a s i b l e denotes the maximum increment in resistance for each roadway that does not violate the upper and lower bounds of airflow in any branch of the network; Δ R m a x , S e n s e denotes the maximum resistance increment at which the adjustment sensitivity of each roadway drops below a specified threshold; Δ R m a x represents the actual maximum resistance increment under the combined constraints; and R 0 denotes the initial resistance.

3.3. Optimal Branch Combinations for Airflow Augmentation

Branch 10 was selected as the primary target branch for regulation. For all branches in the system, Equations (14)–(17) were applied sequentially to perform single-branch independent adjustment, dual-branch combined adjustment and triple-branch combined adjustment. With airflow augmentation maximisation as the objective, different adjustment schemes were compared in terms of their augmentation performance, and optimal branch combinations were identified that balance regulatory efficiency with system feasibility.
Table 2 presents the deviations between airflow augmentation values predicted by the Taylor-difference method and the actual values obtained from the full network solution. It can be observed that the deviations between the predicted augmentation Δ Q t a r g e t , p r e d and the actual augmentation Δ Q t a r g e t , a c t u a l are generally small. This behaviour confirms the reliability of the Taylor-difference method for airflow increment estimation. Consequently, the predicted results were used as the core basis for the subsequent “maximum airflow constraint” in the optimisation framework.
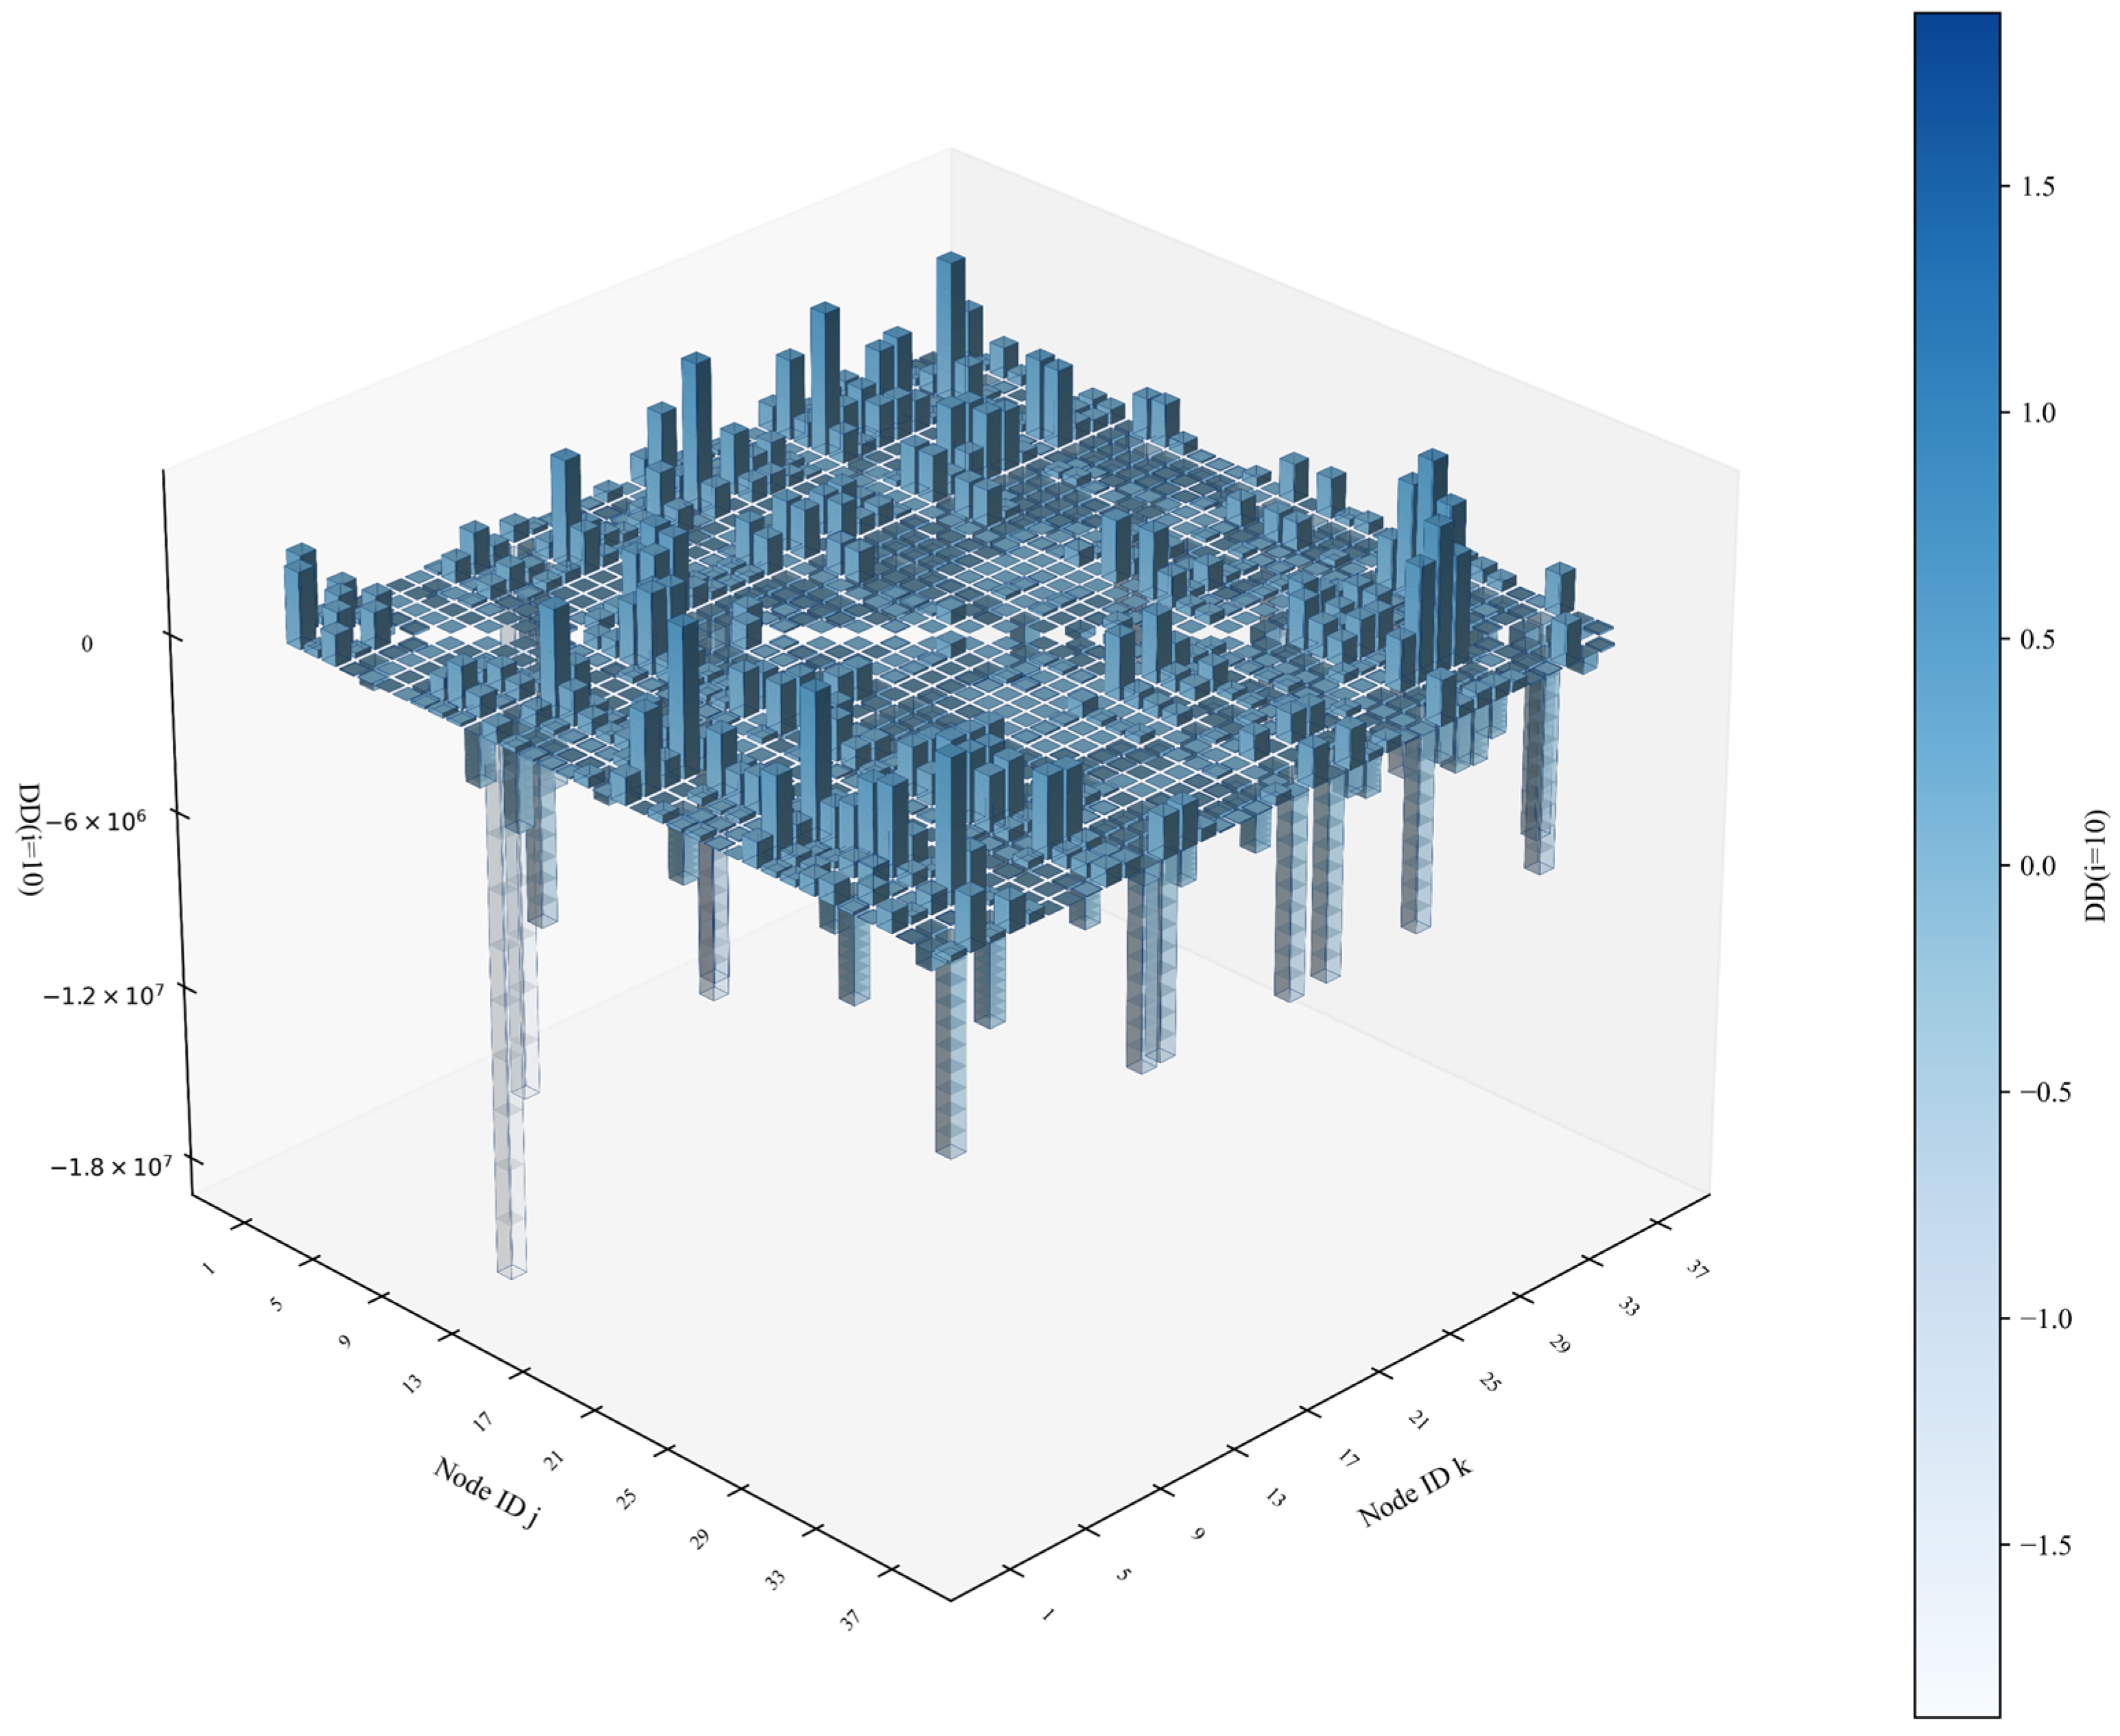
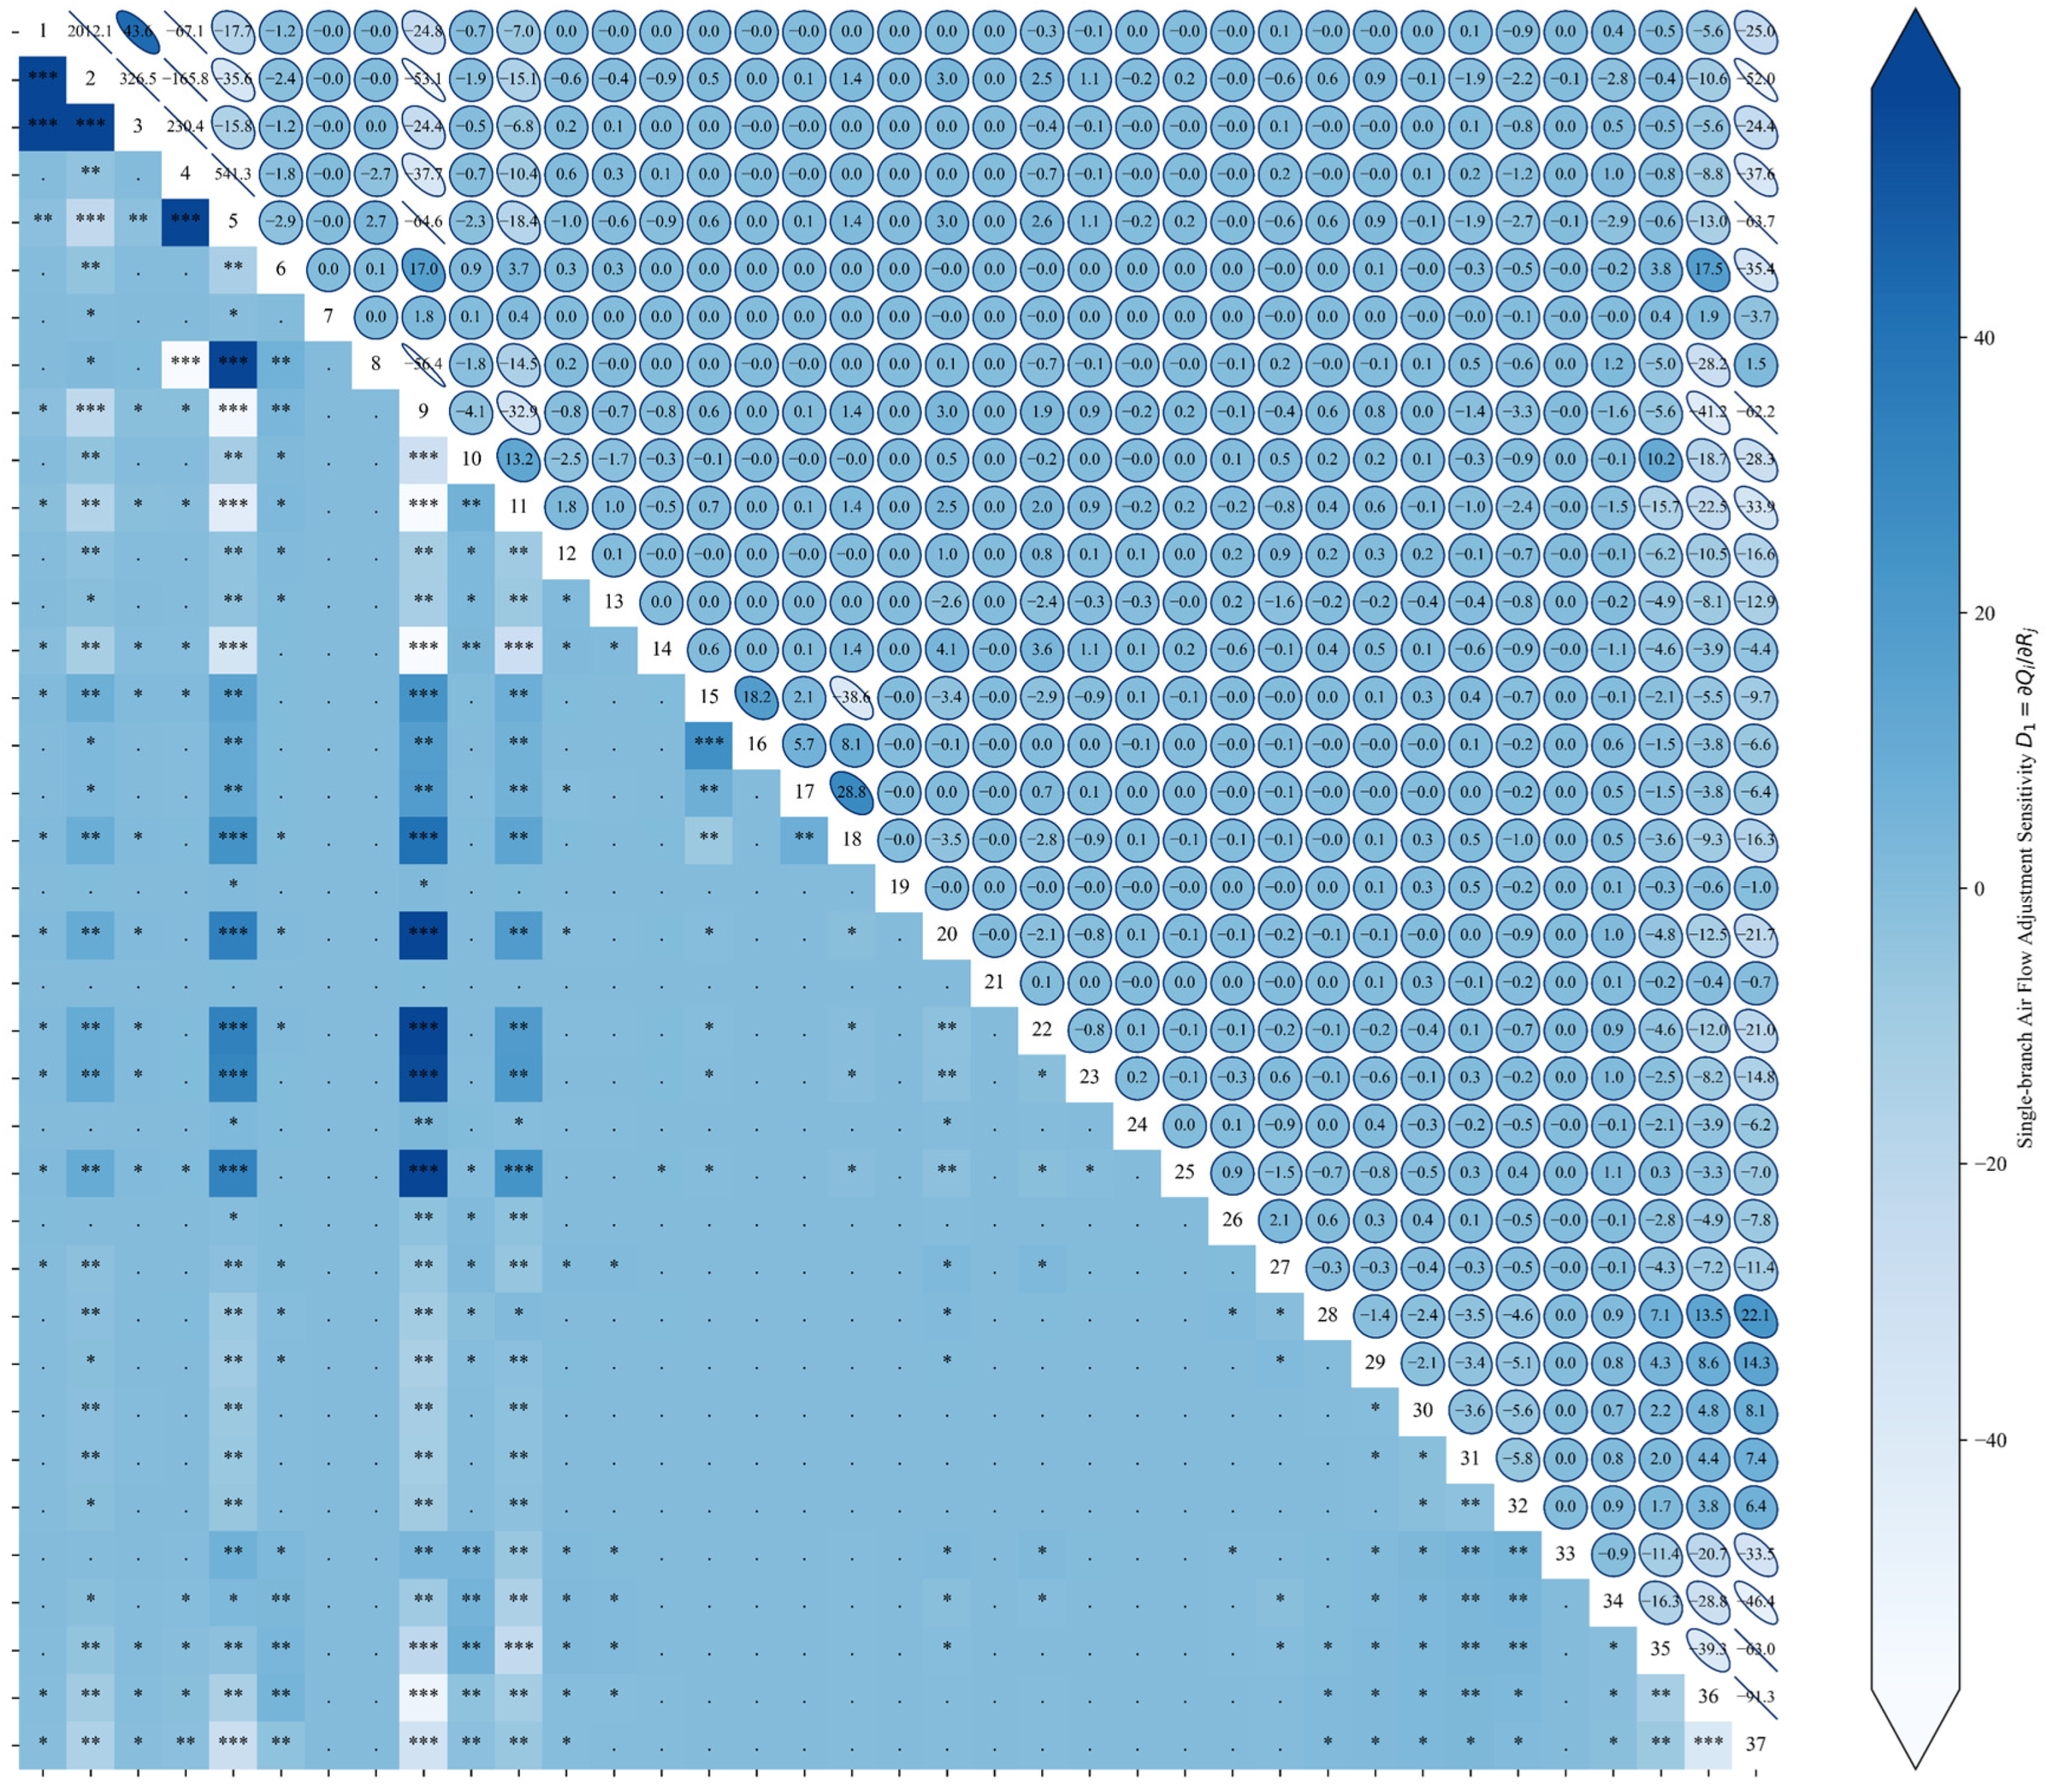
On this basis, a sensitivity matrix for dual-branch regulation of branch 10 and an inter-branch sensitivity map were plotted, as shown in Figure 3 and Figure 4.
Figure 3 depicts the second-order sensitivity matrix for dual-branch regulation of Branch 10, presented as a three-dimensional bar chart. The figure visualises the distribution of second-order sensitivities when Branch 10 is treated as the objective branch, and its airflow is adjusted through paired (dual-branch) regulation. The two horizontal axes correspond to the indices of the regulating branches (Node_ID; i and j ), while the vertical axis represents the magnitude of the second-order sensitivity indicator ( D D i ). Here, Node i and Node j denote the two control branches whose resistance adjustments are combined to regulate the airflow in Branch 10. The bar height and colour jointly encode the effect magnitude and direction; darker colours indicate a stronger positive influence, whereas lighter colours indicate a stronger negative influence. The results reveal a distinctly non-uniform distribution across branch pairs, with certain combinations exhibiting markedly larger second-order sensitivities (highlighted by prominent bars), thereby providing quantitative evidence for identifying effective dual-branch combinations for cooperative regulation of Branch 10 and enhancing the efficiency and specificity of airflow control.
Figure 4 presents the inter-branch sensitivity analysis, where a heatmap integrated with node-based visualisation is used to characterise sensitivity relationships between branches. Circular markers correspond to individual branches, and the colour mapping from red to blue represents the sensitivity magnitude and direction. Specifically, darker colours denote stronger positive effects (i.e., larger positive values indicating a greater positive influence on the airflow of the corresponding branch), whereas lighter colours denote stronger negative effects (i.e., more negative values indicating a greater negative influence). Marker shape and colour intensity are used jointly to reflect the strength of airflow-response coupling between branches induced by resistance regulation. Substantial heterogeneity in sensitivity is observed across the network, and strong coupling is evident for certain branch pairs, which provides direct quantitative support for identifying key regulating branches and for interpreting cooperative versus constraining relationships among branches.

3.4. Practical Airflow Augmentation Strategies for the Ventilation System

3.4.1. Comparison of Outer-Layer Optimisation Algorithms

To illustrate more clearly the performance differences among algorithms, PSO (Particle Swarm Optimisation) with Competitive Niching was used as a baseline, and four outer-layer optimisation algorithms were selected for comparison: CMAES (Covariance Matrix Adaptation Evolution Strategy), DE (Differential Evolution), ES (Evolution Strategy) and GA (Genetic Algorithm). Each algorithm was tested 50 times, and performance was evaluated based on statistics over these repeated runs. The results are shown in Figure 5, Figure 6, Figure 7 and Figure 8 and Table 3.
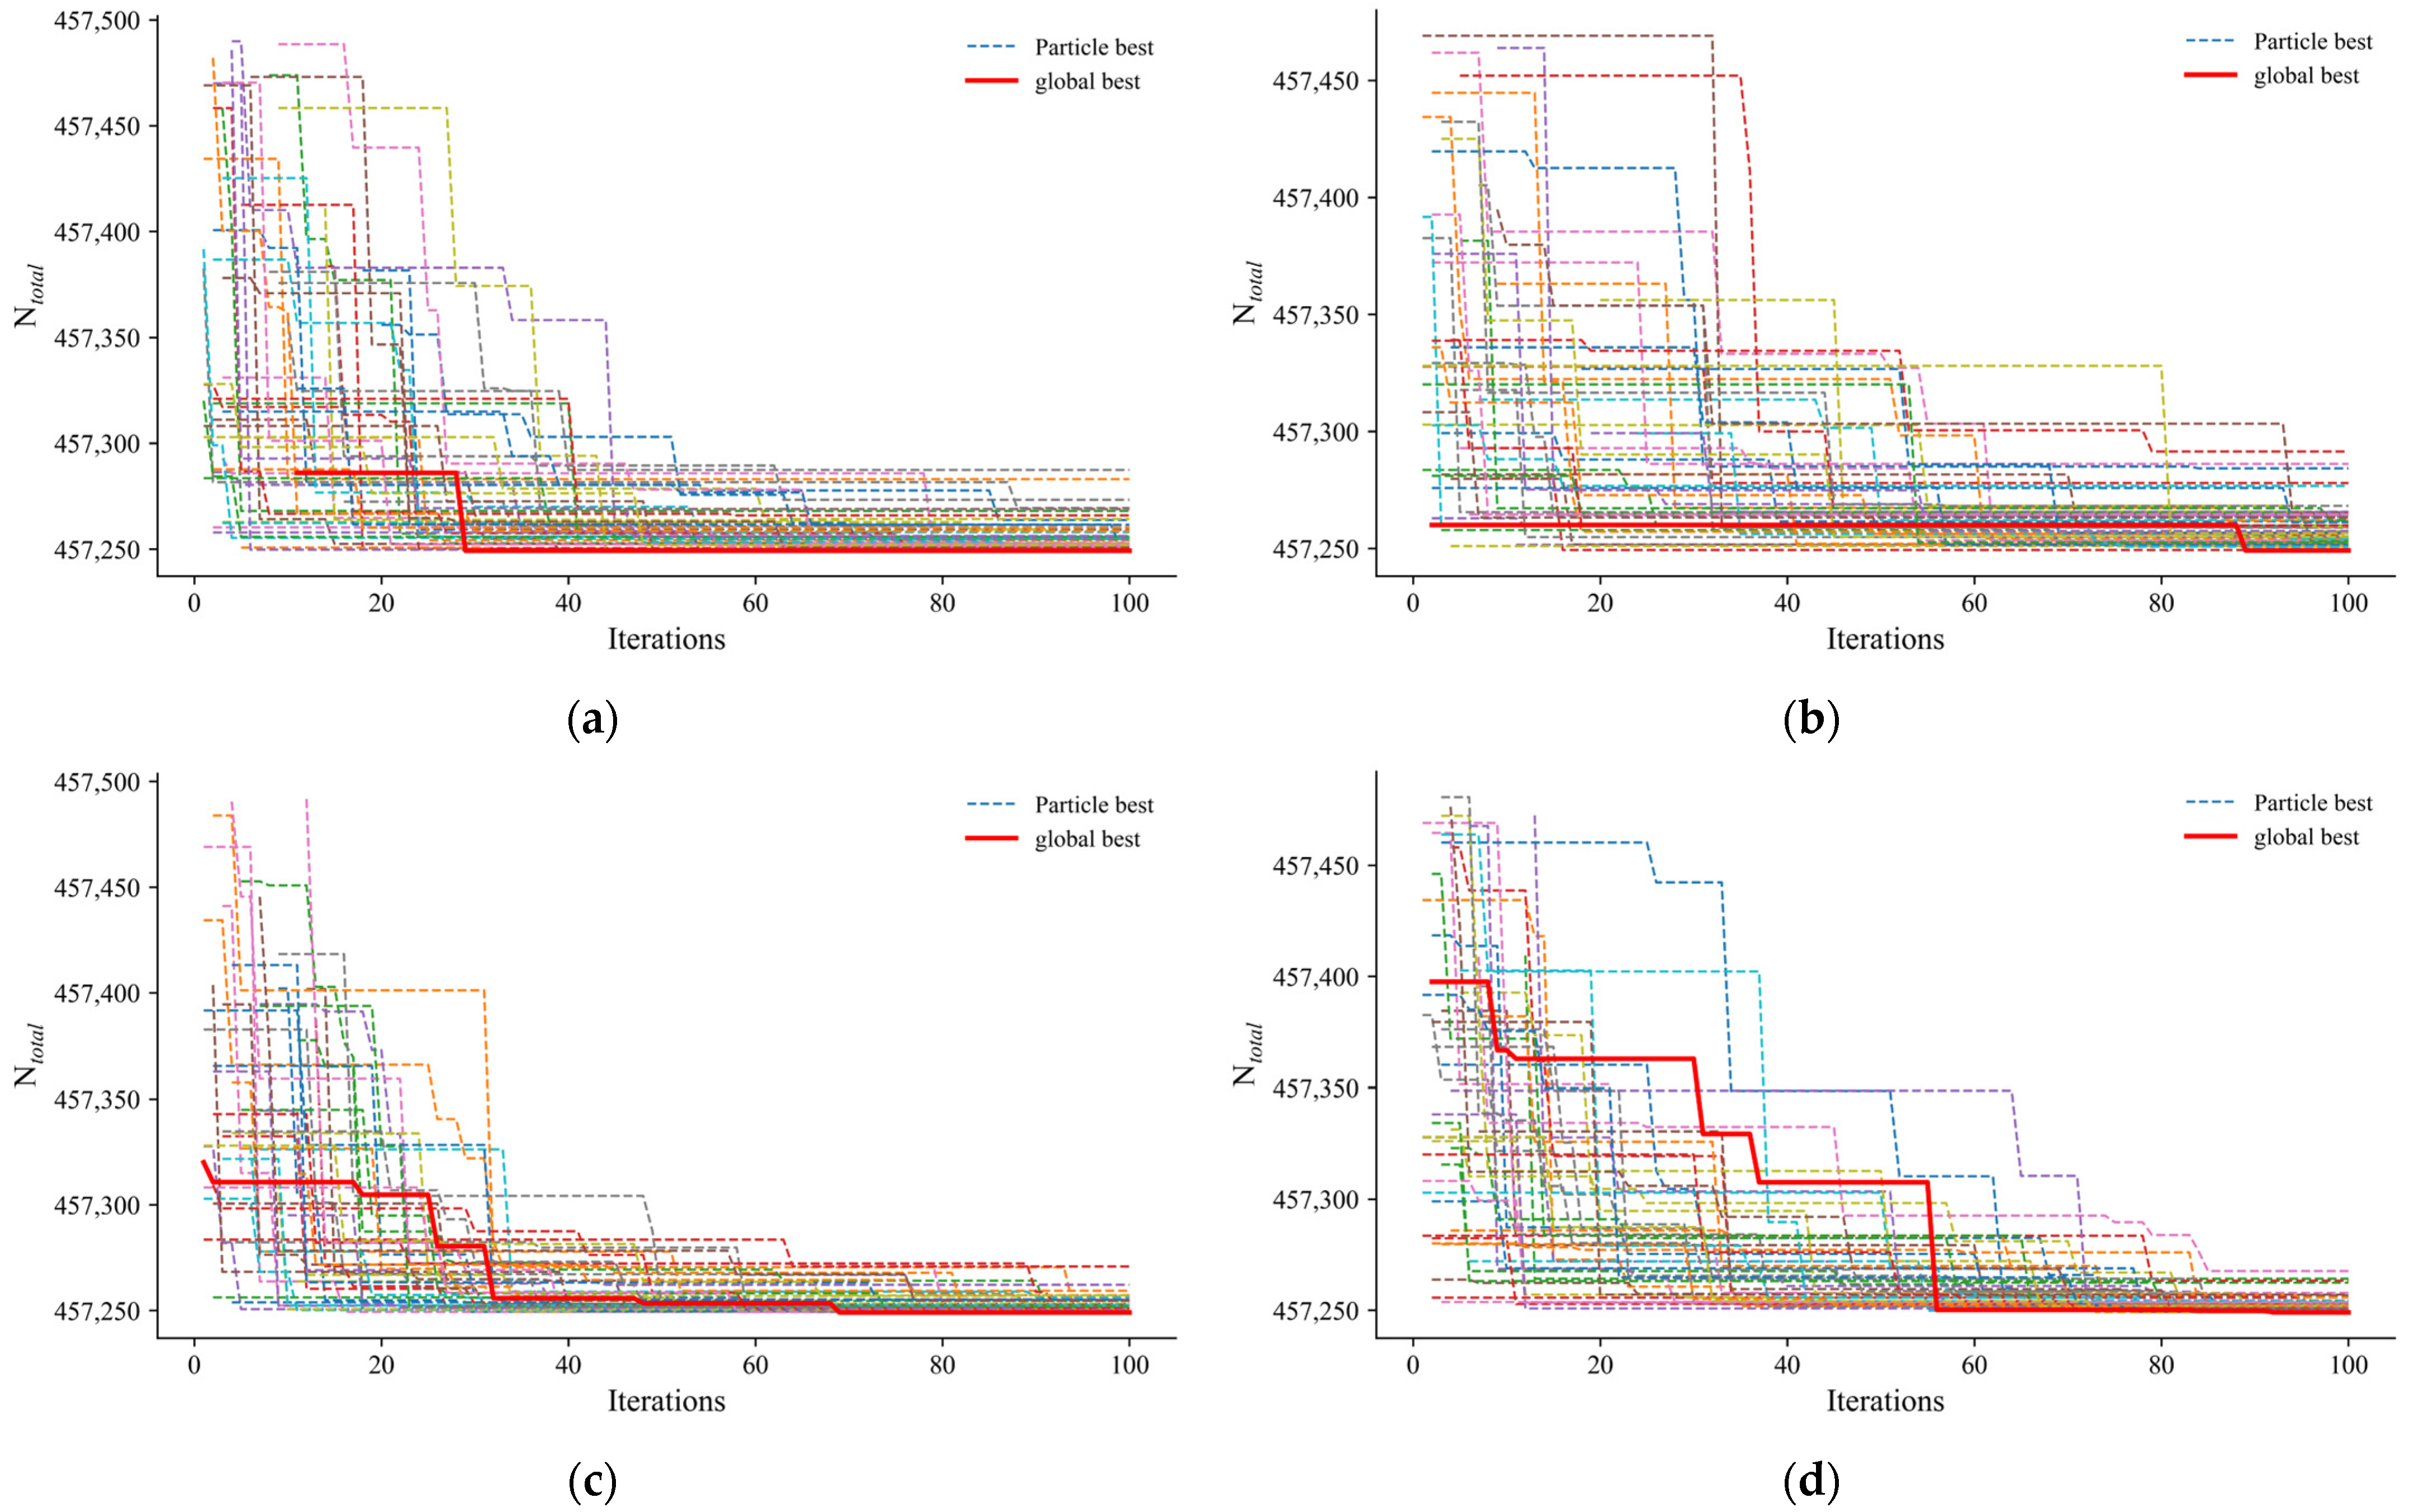
Figure 5 (convergence curves for the four outer-layer optimisation algorithms) shows the convergence processes of CMAES, DE, ES and GA (dashed lines represent particle-best, solid lines represent global-best). In Figure 5a,b, CMAES and DE exhibit rapid decreases in the global-best value in the early iterations, followed by stabilisation. In contrast, ES and GA in Figure 5c,d converge more gradually, and the final global-best values differ from those of CMAES and DE, reflecting algorithmic differences in search speed and convergence accuracy.
Table 4 (results of optimal parameter search for the four algorithms) quantifies the key parameters and performance metrics, including inertia weight ( w ), cognitive learning factor ( c 1 ), social learning factor ( c 2 ), energy-efficiency metric ( e f ), and search-related parameters (search rate s r , number of neighbours numneighbors , step size stepsize , number of particles n particles and the number of iterations n iters ).
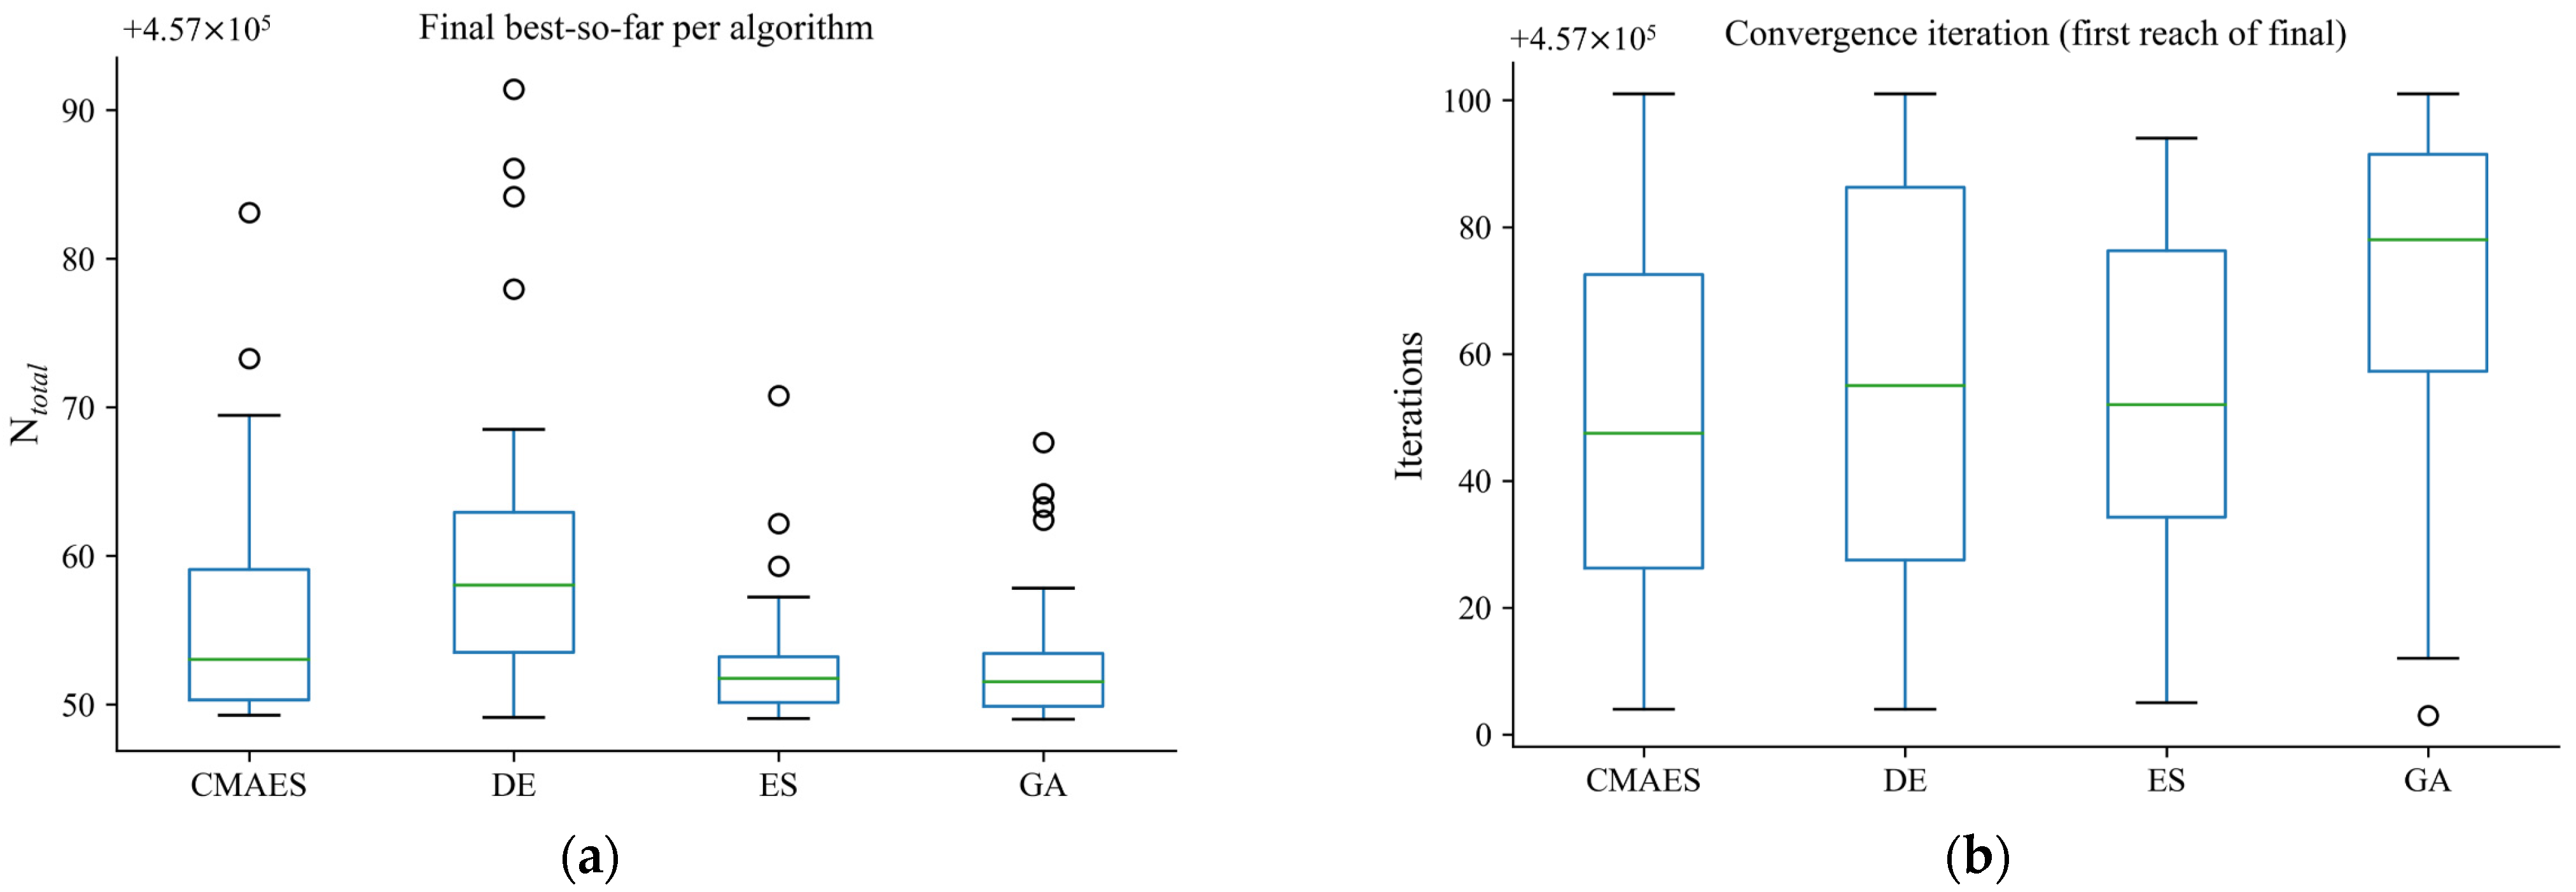
Figure 6 (boxplots of iteration counts) compares the iterative performance of the algorithms from two perspectives: “minimum power under the average iteration count” (Figure 6a) and “first convergence over all iteration counts” (Figure 6b). The boxplot in Figure 6a reflects the distribution of iteration counts when the minimum power is reached. The ES algorithm exhibits a more compact and favourable box, indicating stronger consistency in the iteration count required to reach the minimum power. Figure 6b shows the distribution of iteration counts at first convergence. GA exhibits extreme values (with a minimum close to zero), whereas ES shows more tightly bounded quartiles, indicating more stable first-convergence performance.
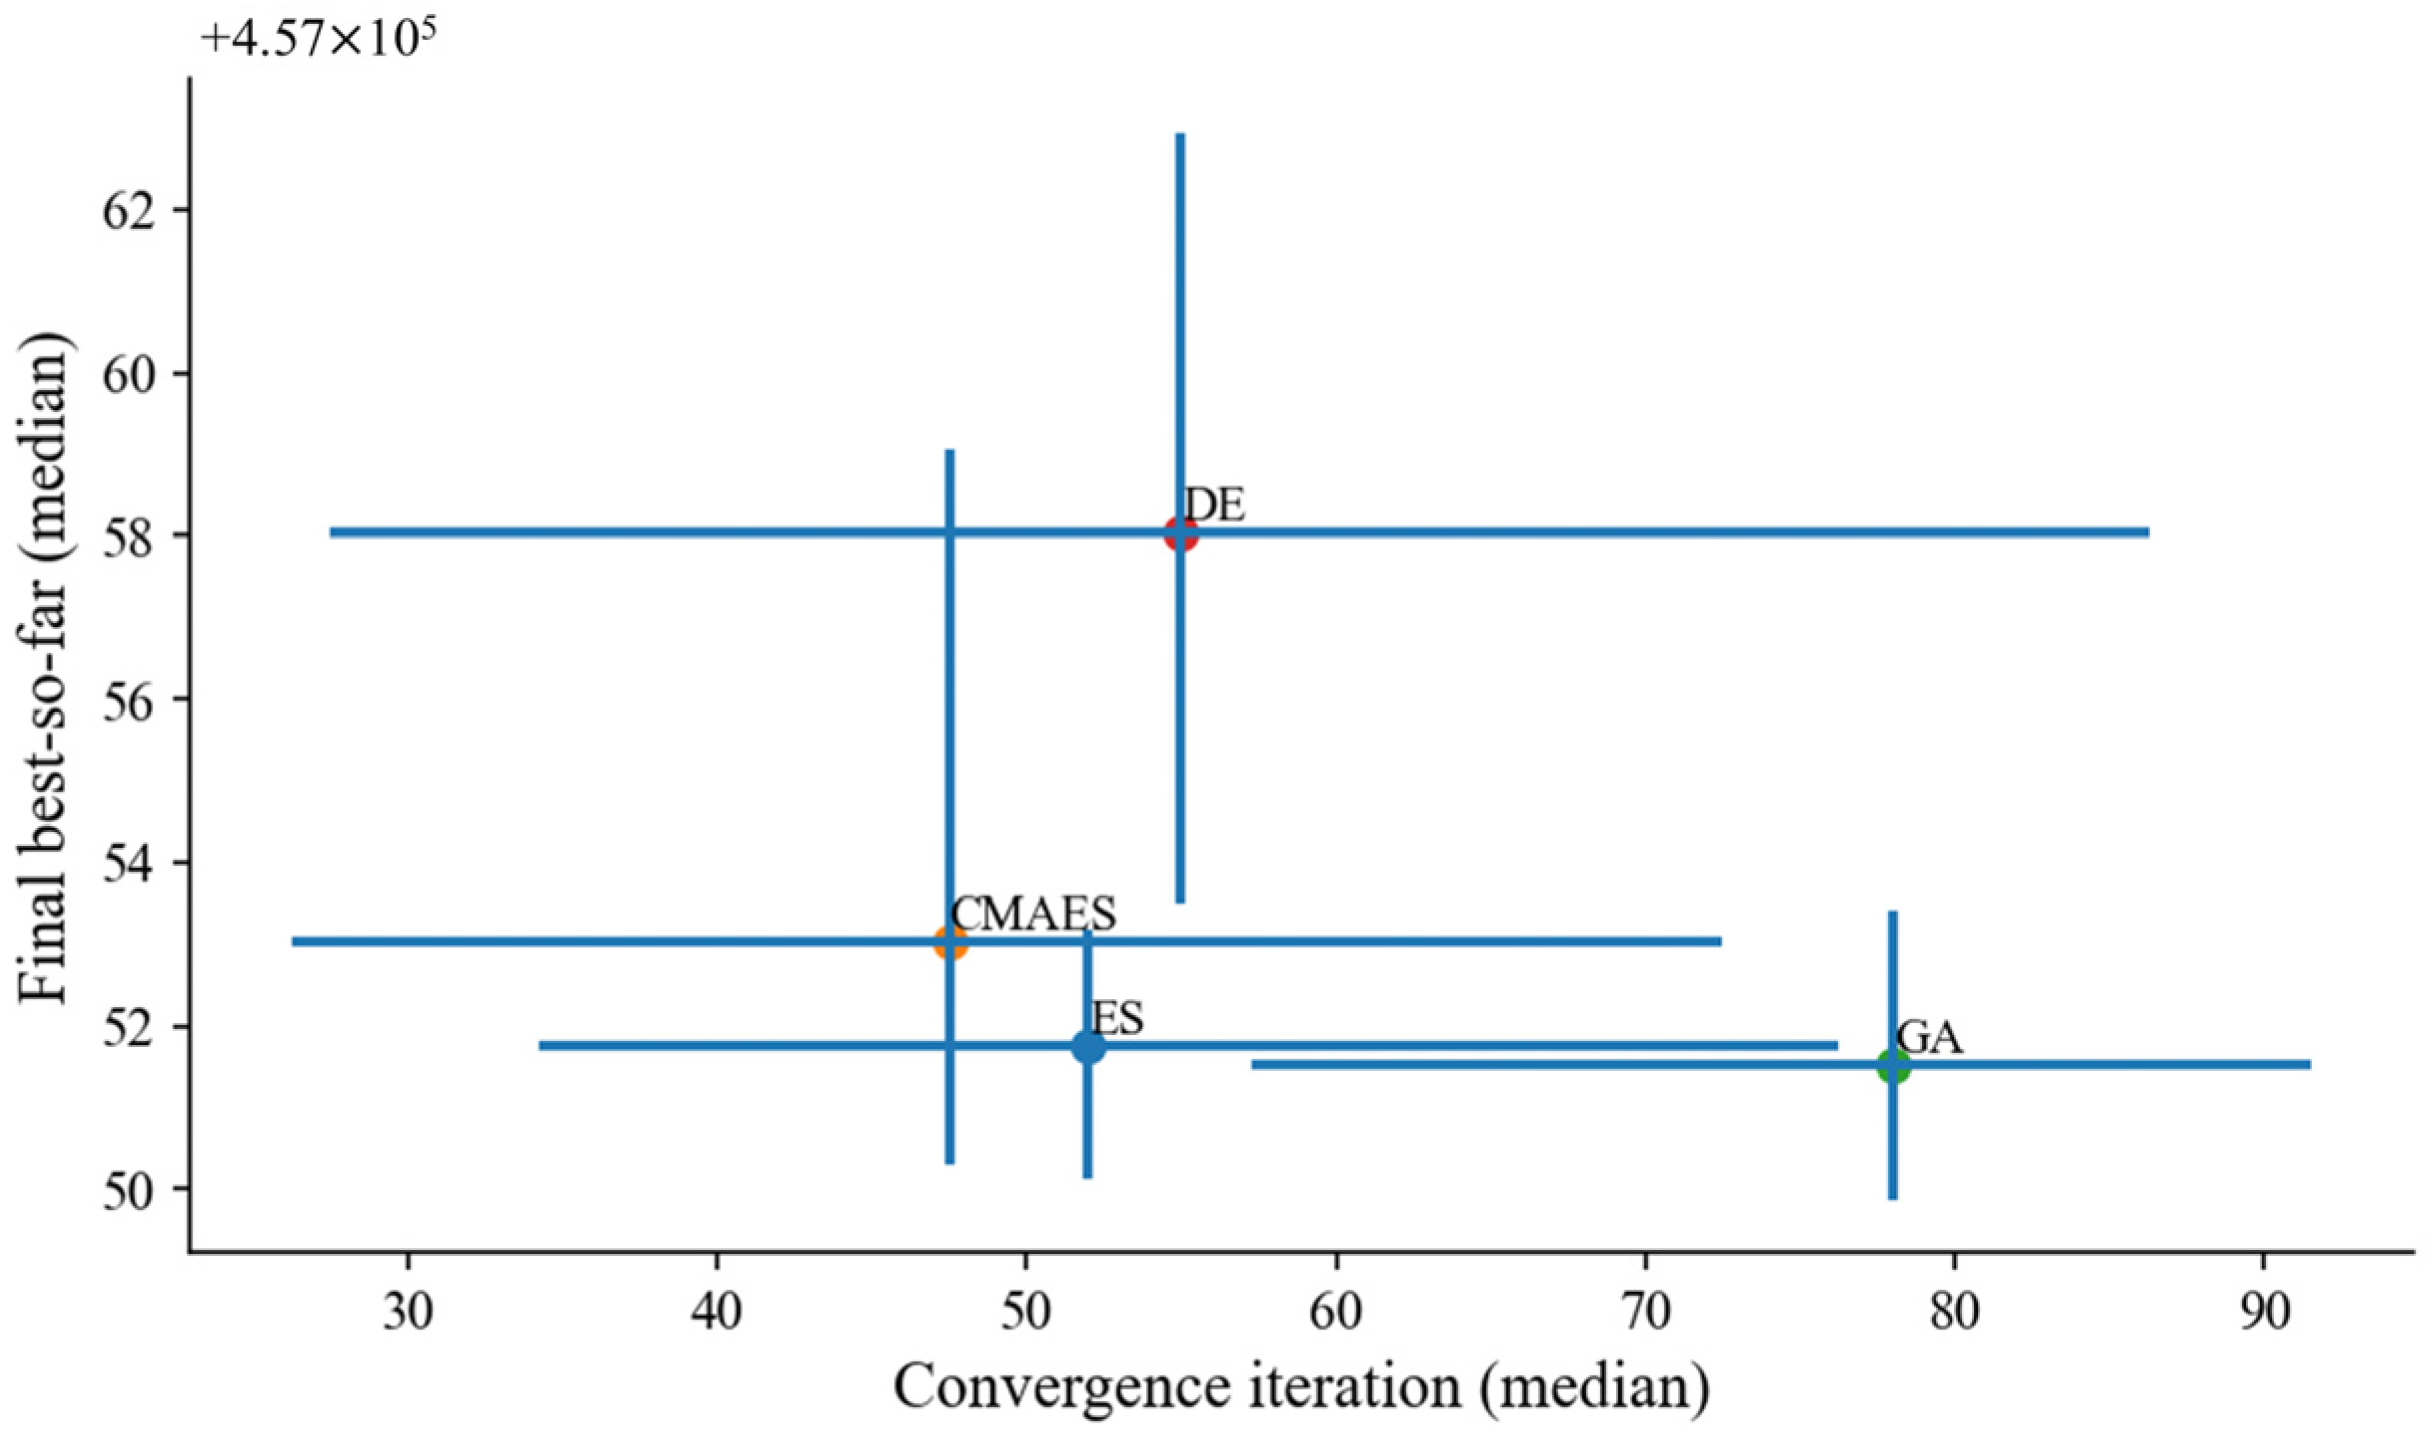
Figure 7 (relationship between final best value and median convergence iteration for the four outer-layer algorithms) uses scatter plots with error bars to depict the relationship between the median final best-so-far value and the median convergence iteration for CMAES, DE, ES, and GA.
From Table 4, it can be observed that ES and CMAES both achieve a rank_mean of 2.0 (the lowest and therefore best combined ranking), indicating superior overall performance. For ES, both the median final objective value (final_median = 457,251.758342) and the median number of iterations (iter_median = 52.0) are ranked second, showing a balanced trade-off between convergence speed and solution quality. For CMAES, iter_median (47.5) is ranked first (best convergence efficiency), whereas final_median (457,253.022821) is ranked third (slightly inferior search accuracy compared with ES). GA has a rank_mean of 2.5: its final_median ranks first (best search accuracy), but its iter_median ranks fourth (poorer convergence efficiency). DE has a rank_mean of 3.5, indicating relatively weaker overall performance. Considering the median objective value primarily and secondarily the median convergence iterations, ES is selected as the preferred outer-layer optimisation algorithm.

3.4.2. Comparison of Inner-Layer Optimisation Algorithms

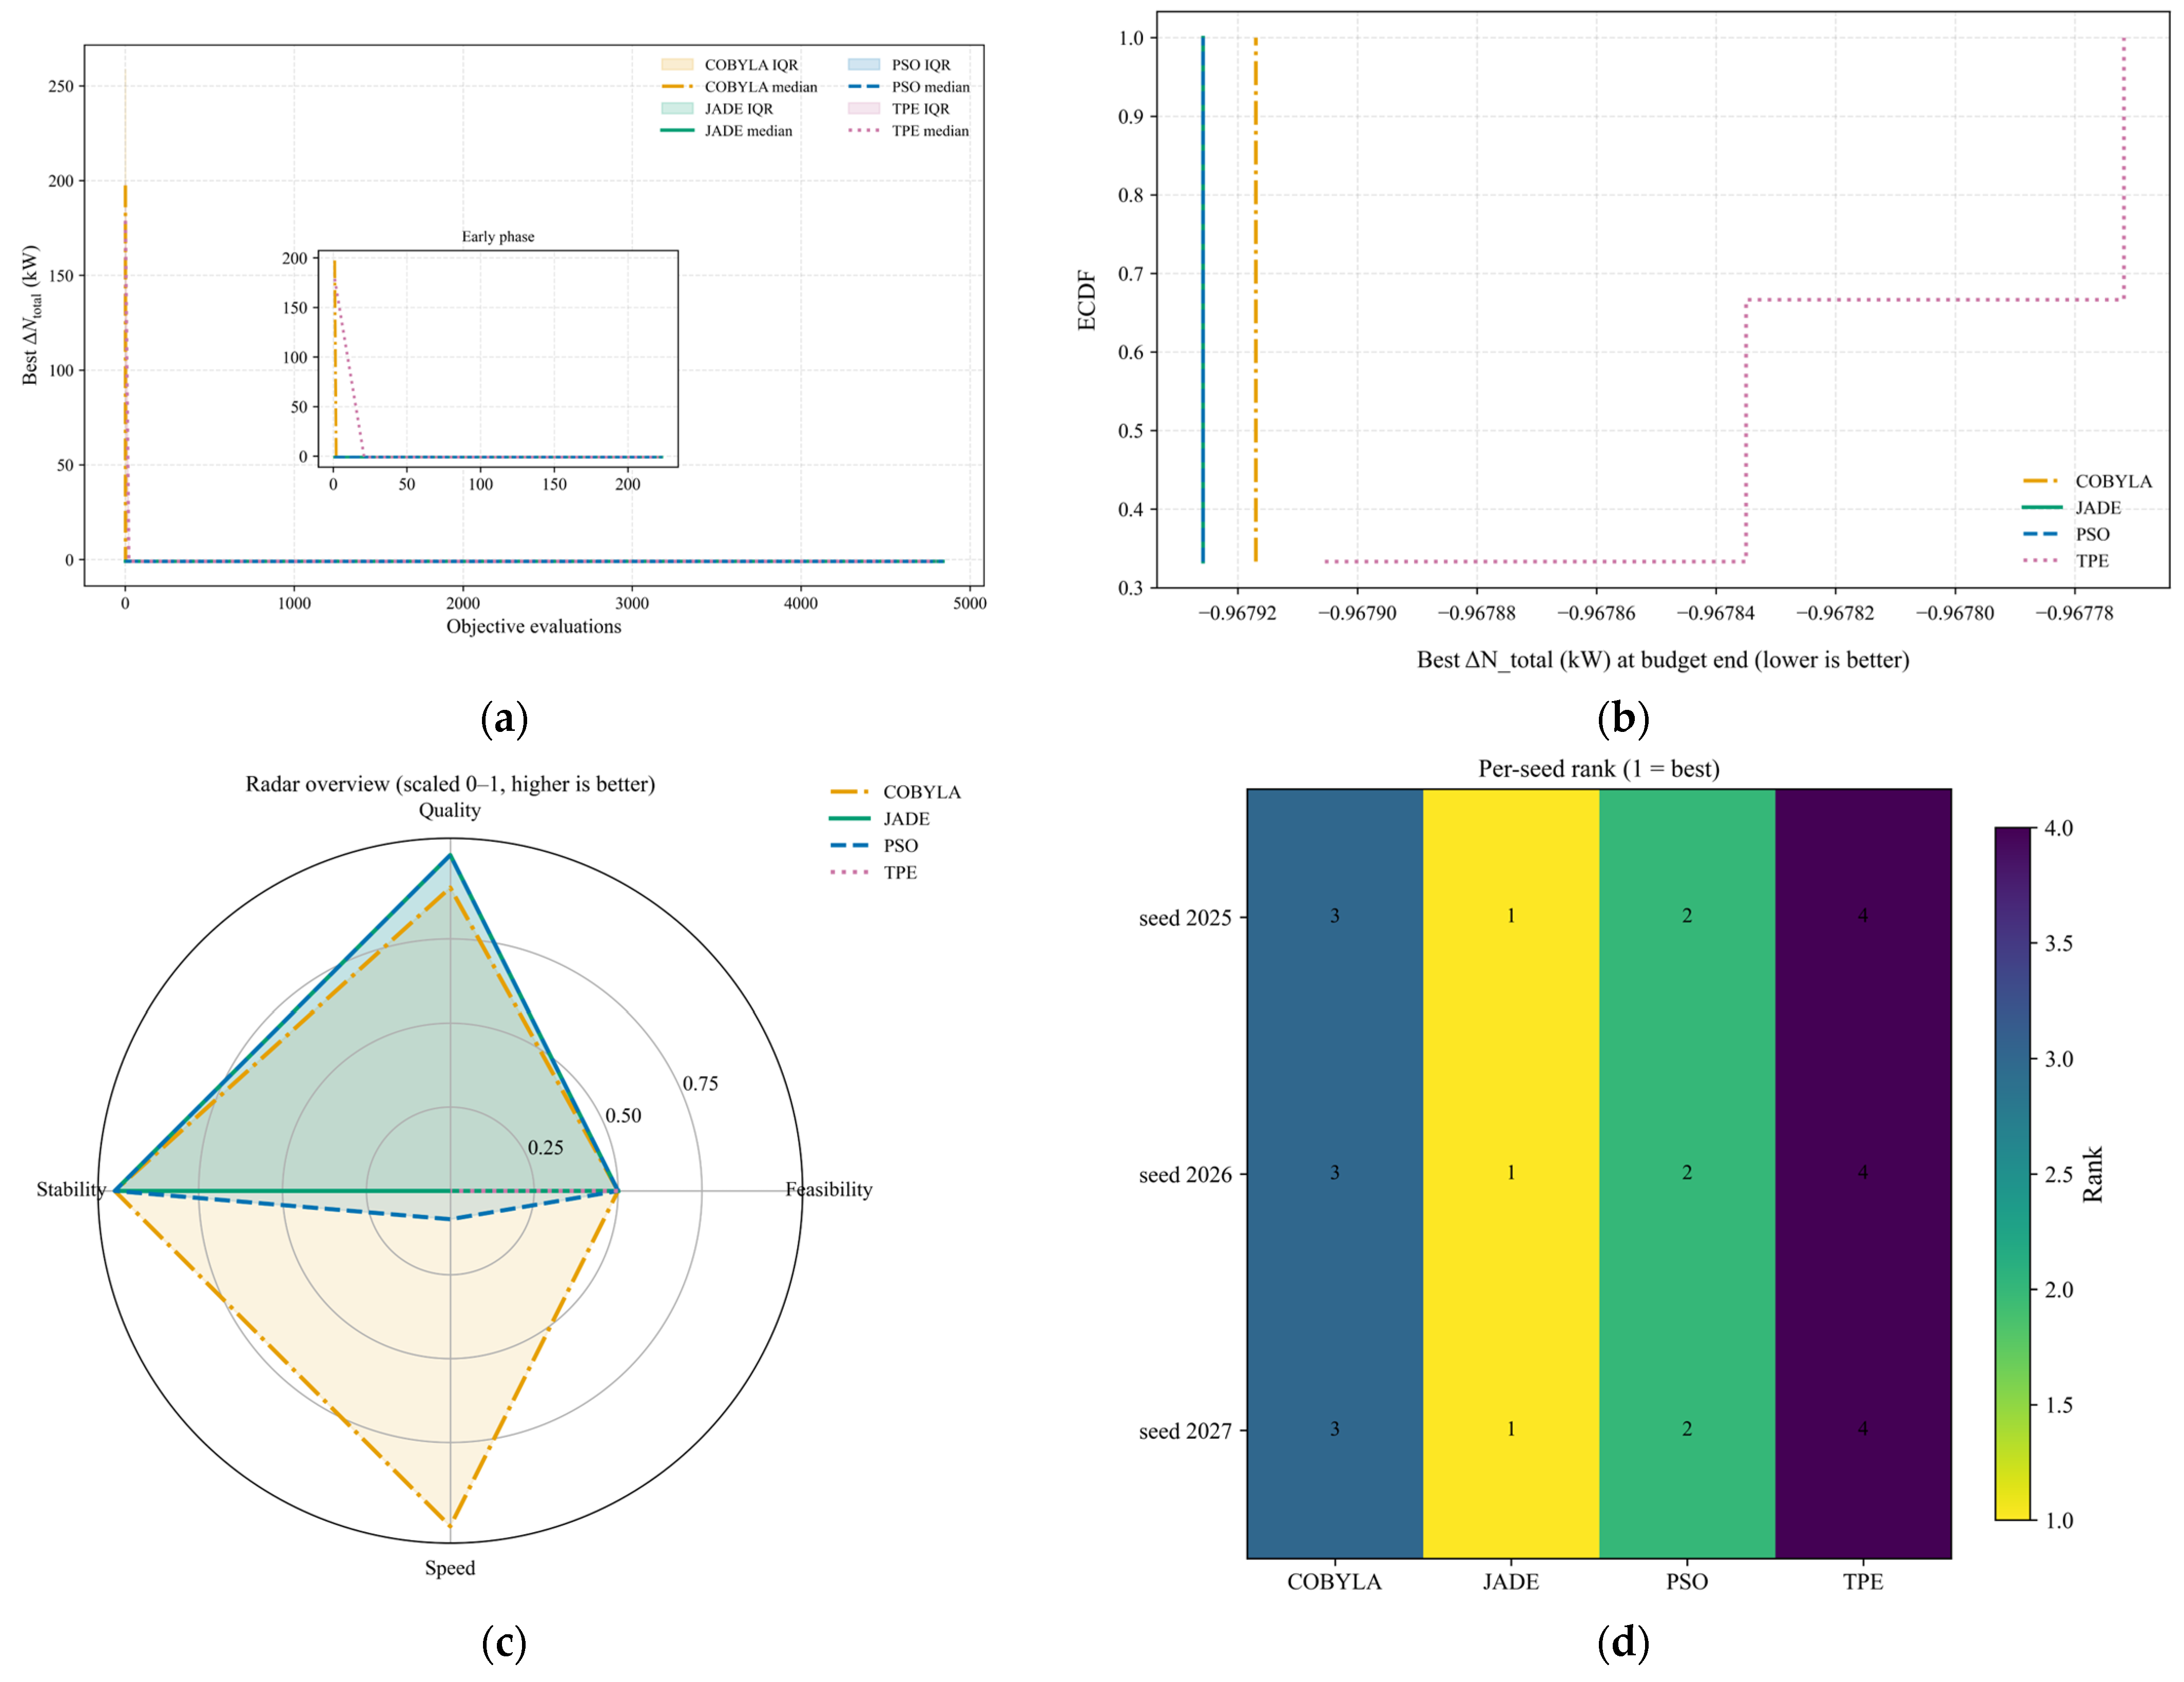
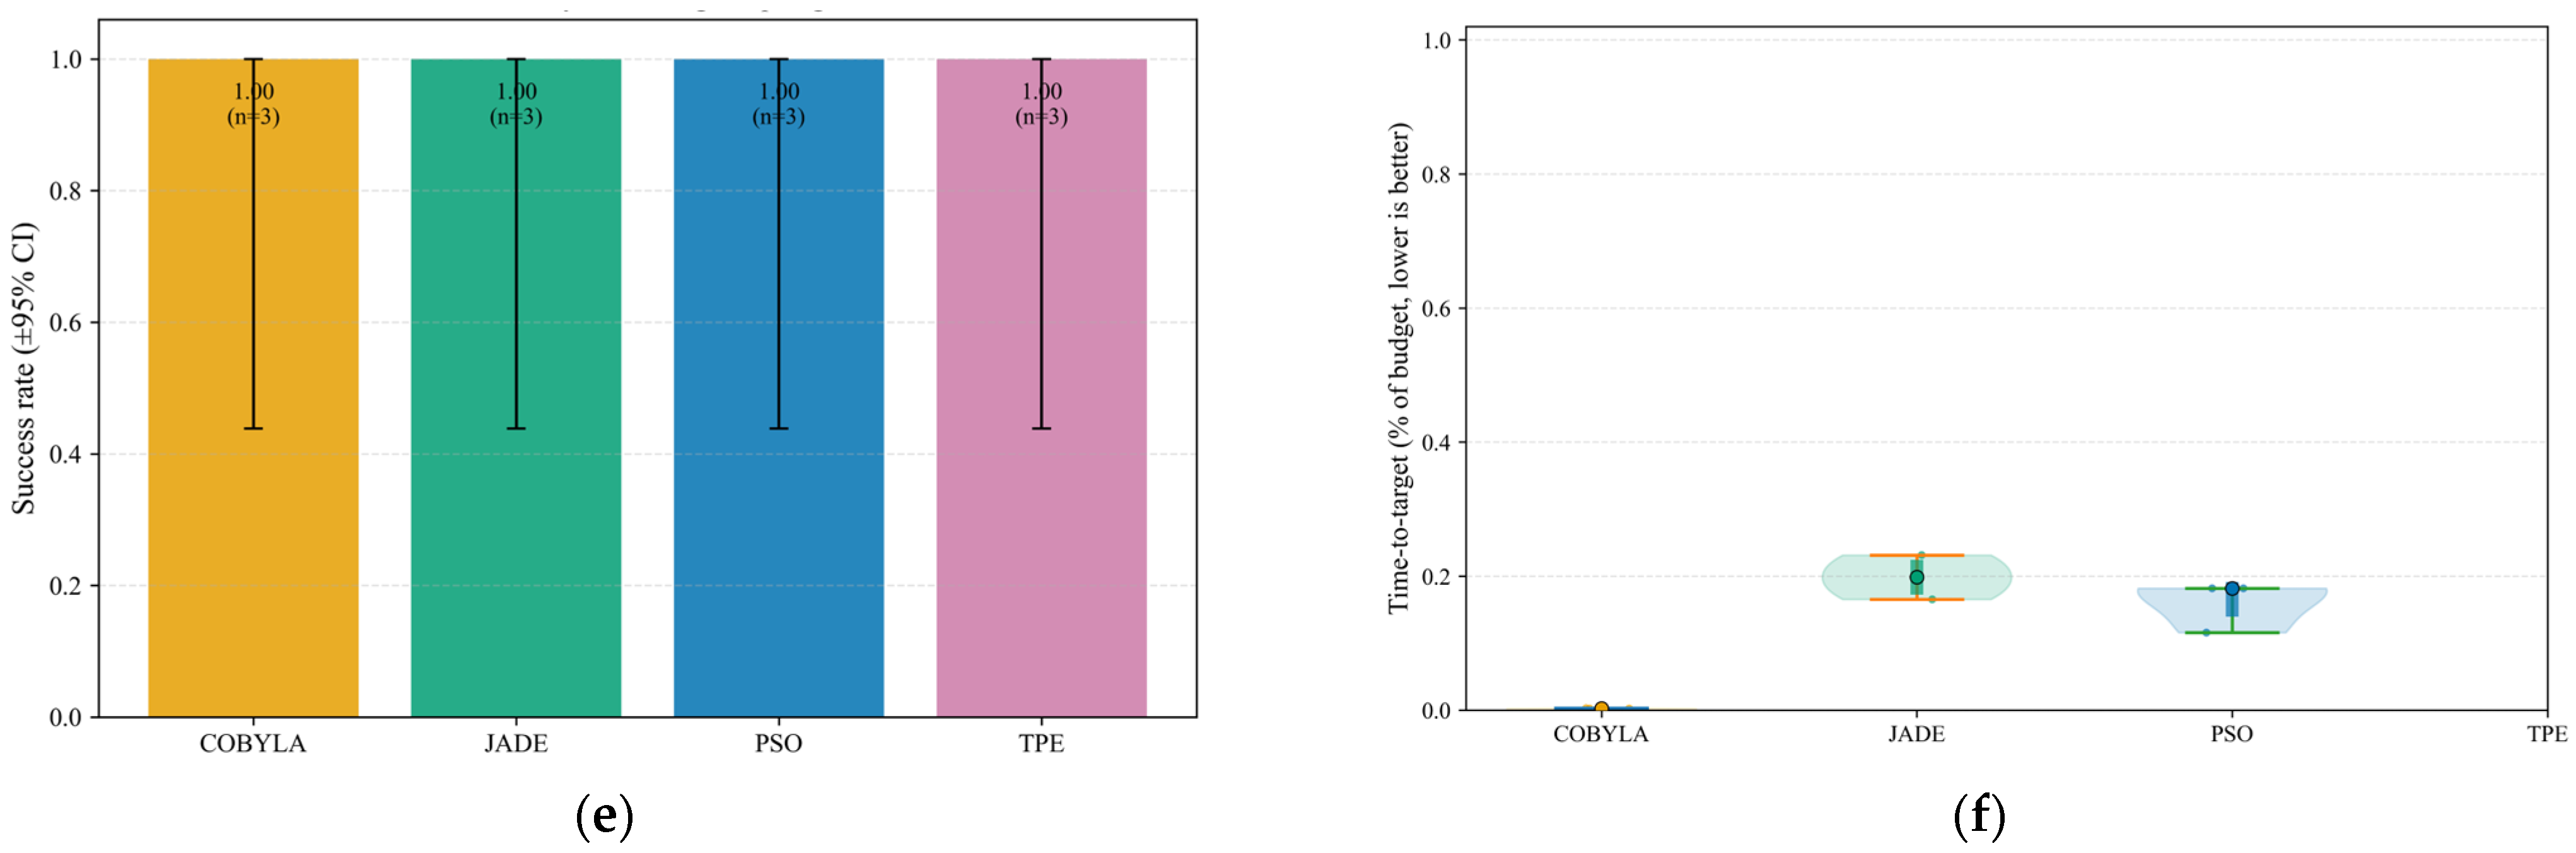
To benchmark the inner-layer optimisation algorithms systematically, COBYLA (Constrained Optimisation BY Linear Approximation), JADE (adaptive differential evolution), PSO (particle swarm optimisation) and TPE (tree-structured Parzen estimator) were compared under an identical computational budget, as summarised in Figure 8a–f. Overall, JADE demonstrates the most favourable trade-off between terminal solution quality, stability and cross-seed robustness, whereas COBYLA converges fastest but exhibits weaker long-horizon stability.
Specifically, the ECDF of the end-of-budget best Δ N total  Figure 8a shows that JADE and PSO dominate the other candidates, with their curves shifted leftwards, indicating a higher probability of achieving lower Δ N total ; moreover, JADE is comparable to PSO in generating very low Δ N total solutions, while COBYLA yields more scattered outcomes and TPE performs worst overall.
The convergence traces in Figure 8b further reveal that COBYLA reduces Δ N total rapidly at the beginning but then suffers pronounced oscillations, suggesting sensitivity and insufficient long-term stability, whereas JADE and PSO converge more smoothly and maintain stable best-so-far performance over the full evaluation horizon, with JADE sustaining a competitive median level near the optimum region.
The radar chart in Figure 8c (quality, feasibility, speed and stability; normalised to 0–1) highlights JADE as the most balanced optimiser: it achieves the highest score in solution quality, strong stability, and feasibility comparable to PSO, with only a modest speed disadvantage relative to COBYLA; in contrast, COBYLA’s advantage is mainly speed at the expense of quality and stability, PSO is more balanced but inferior to JADE in quality, and TPE shows no clear strengths across dimensions.
Importantly, feasibility is not a confounding factor, as Figure 8d indicates that all four algorithms achieve a success rate of 1.0 within the target Δ q   range (n = 3), providing a common baseline for performance comparison. Robustness is then confirmed by the per-seed rankings in Figure 8e, where JADE consistently ranks first across all tested random seeds (2025–2027), followed by PSO, COBYLA and TPE.
Finally, the time-to-threshold analysis in Figure 8f shows that COBYLA reaches the median feasible-quality threshold almost immediately, whereas JADE typically requires about 20% of the budget and TPE fails to yield valid results; however, this metric mainly reflects the speed of entering a feasible-quality region, while JADE’s key advantage lies in maintaining solution continuity and improving quality beyond early convergence.
Taken together, these results justify selecting JADE as the inner-layer optimiser due to its superior terminal quality, balanced multi-dimensional performance and robust behaviour across random seeds. In summary, although COBYLA performs best in terms of convergence speed, JADE exhibits superior overall performance in final solution quality, multi-dimensional performance balance and cross-seed robustness. For this reason, JADE is selected as the optimal inner-layer optimisation algorithm.

3.5. Branch-Level Airflow Augmentation Strategy

On the basis of the above algorithm comparison and performance evaluation, the optimal algorithmic configuration for airflow augmentation in the ventilation system was determined, and targeted augmentation strategies were designed accordingly. Analysis indicates that, under the existing augmentation constraints of the ventilation system, the maximum achievable airflow increment for branch 10 is approximately 0.66 m3/s. Within the framework of the objective function described previously, and with “minimum number of resistance-regulated branches” as the principal selection criterion, two typical operating scenarios were selected for in-depth analysis, corresponding to Δ q intervals of [0.40, 0.55] and [0.55, 0.63], respectively.
For the interval [0.40, 0.55], the optimal combination of regulating branches was found to be branches 6 and 26. This dual-branch regulation scheme was, therefore, examined first.
(1)
Airflow increment in the range [0.40, 0.55]
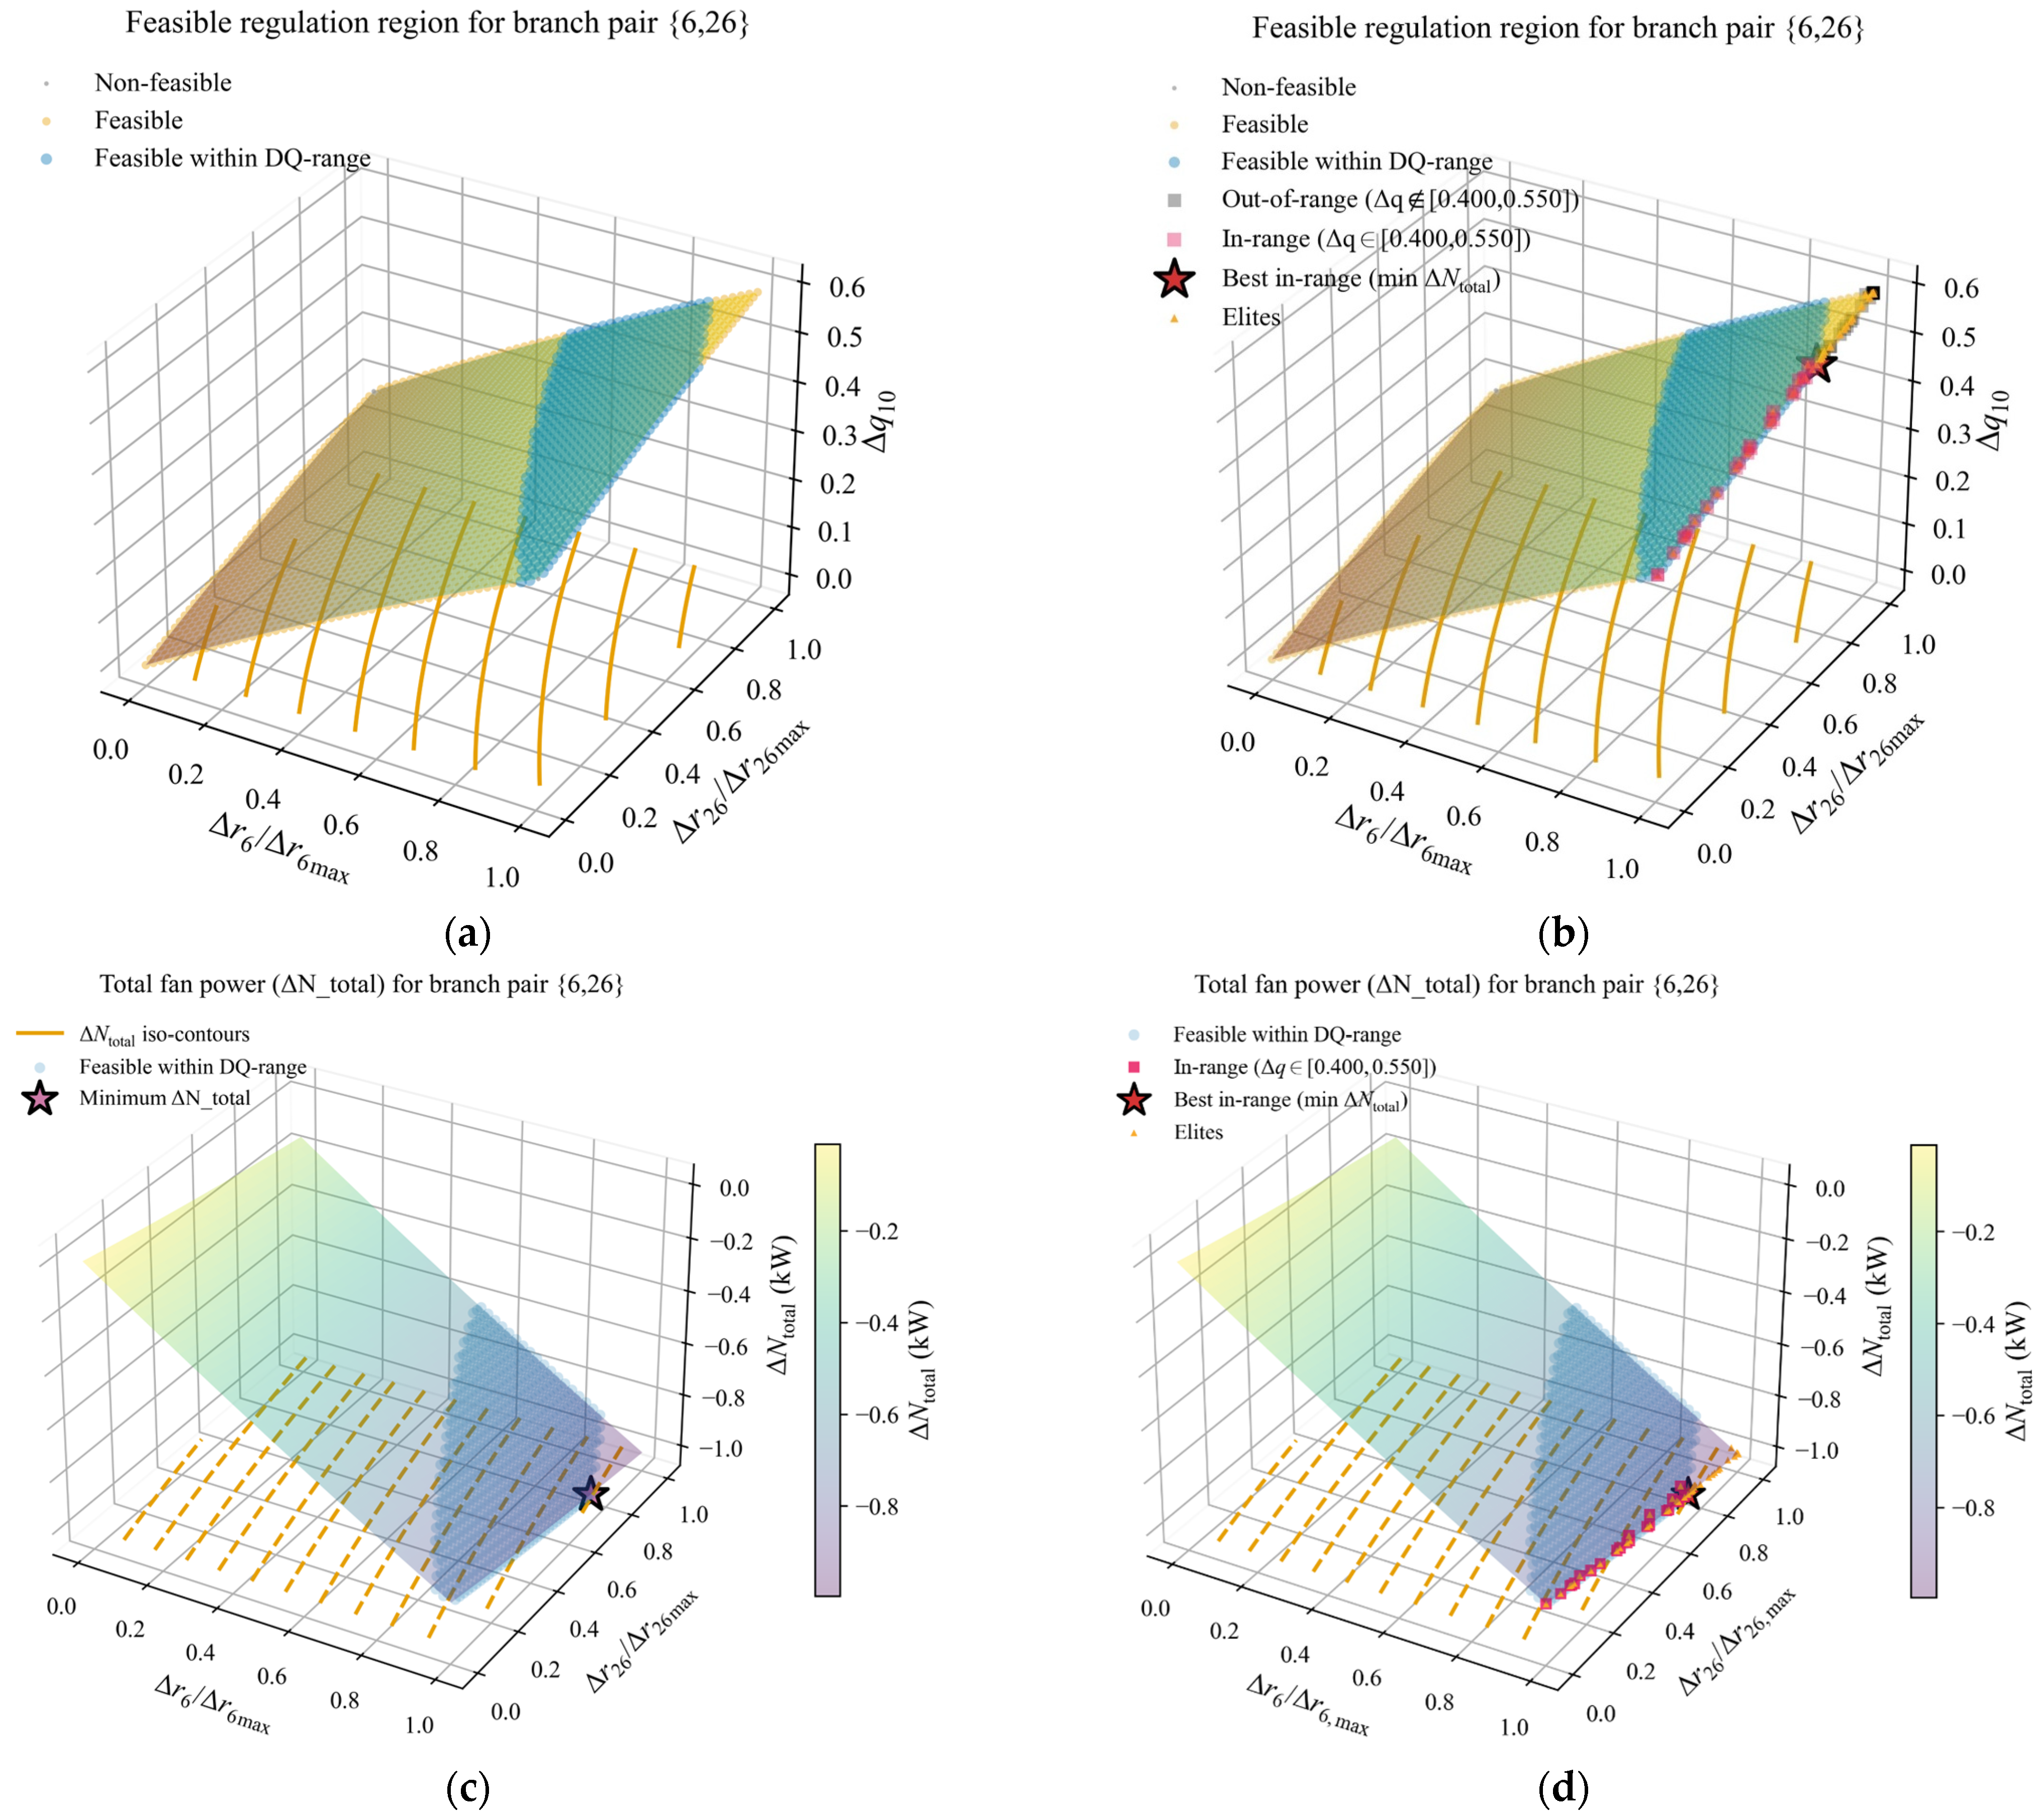
As shown in Figure 9, when the airflow increment is constrained to the interval 0.40–0.55 m3/s, a grid of 50 points was used. For a direct network solution, the optimal result is Δ q = 0.548603 m3/s, with a total power change Δ N total = 0.966647 kW, a resistance adjustment Δ R 6 = 0.326786 N·s2/m8 in branch 6, and Δ R 26 = 1.165532 N·s2/m8 in branch 26. Using the composite algorithm, the optimal result is Δ q = 0.5499395 m3/s and Δ N total = 0.96987 kW, with Δ R 6 = 0.326786 N·s2/m8 and Δ R 26 = 1.179383 N·s2/m8. The differences between the two methods are very small, and the composite algorithm even yields slightly better results with higher computational efficiency.
The two approaches show negligible differences in airflow augmentation and power optimisation, while the composite algorithm produces a better optimum and significantly higher runtime efficiency. Moreover, the “elite” solutions output by the composite algorithm exhibit a multi-modal distribution (as indicated by the coloured markers in Figure 9), which confirms the reliability of the model in searching multi-peak solution spaces and is consistent with the theoretical discussion on multi-modality in the earlier sections.
When a direct network solution with parallelisation and thread-pool computation is used, the runtime is approximately 29 min, whereas the composite algorithm requires only about 13 s, representing a substantial improvement in computational efficiency.
In addition, the multi-modal results of the composite algorithm provide multiple alternative adjustment schemes, as summarised in Table 5.
(2)
Airflow increment in the range [0.55, 0.63]
When the airflow increment is constrained to the interval [0.55, 0.63] m3/s, dual-branch optimisation becomes insufficient to satisfy the airflow augmentation requirements. The Taylor-difference-based combination analysis indicated that the combination [6 + 21 + 26] is the optimal triple-branch combination; thus, branches 6, 21 and 26 were selected for coordinated regulation.
For a direct network solution, the optimal result is Δ q = 0.627992 m3/s and Δ N total = 1.19779 kW, with resistance adjustments Δ R 6 = 0.326786 N·s2/m8, Δ R 21 = 223.7688 N·s2/m8 and Δ R 26 = 1.311450 N·s2/m8. Using the composite algorithm, the optimal result is Δ q = 0.629919 m3/s and Δ N total = 1.19964 kW, with Δ R 6 = 0.326786 N·s2/m8, Δ R 21 = 223.7688 N·s2/m8 and Δ R 26 = 1.285567 N·s2/m8. Again, the differences between the two methods are small.
With a parallelised direct solution, the runtime is approximately 43 min, whereas the composite algorithm requires only about 15 s, again demonstrating a substantial gain in efficiency.
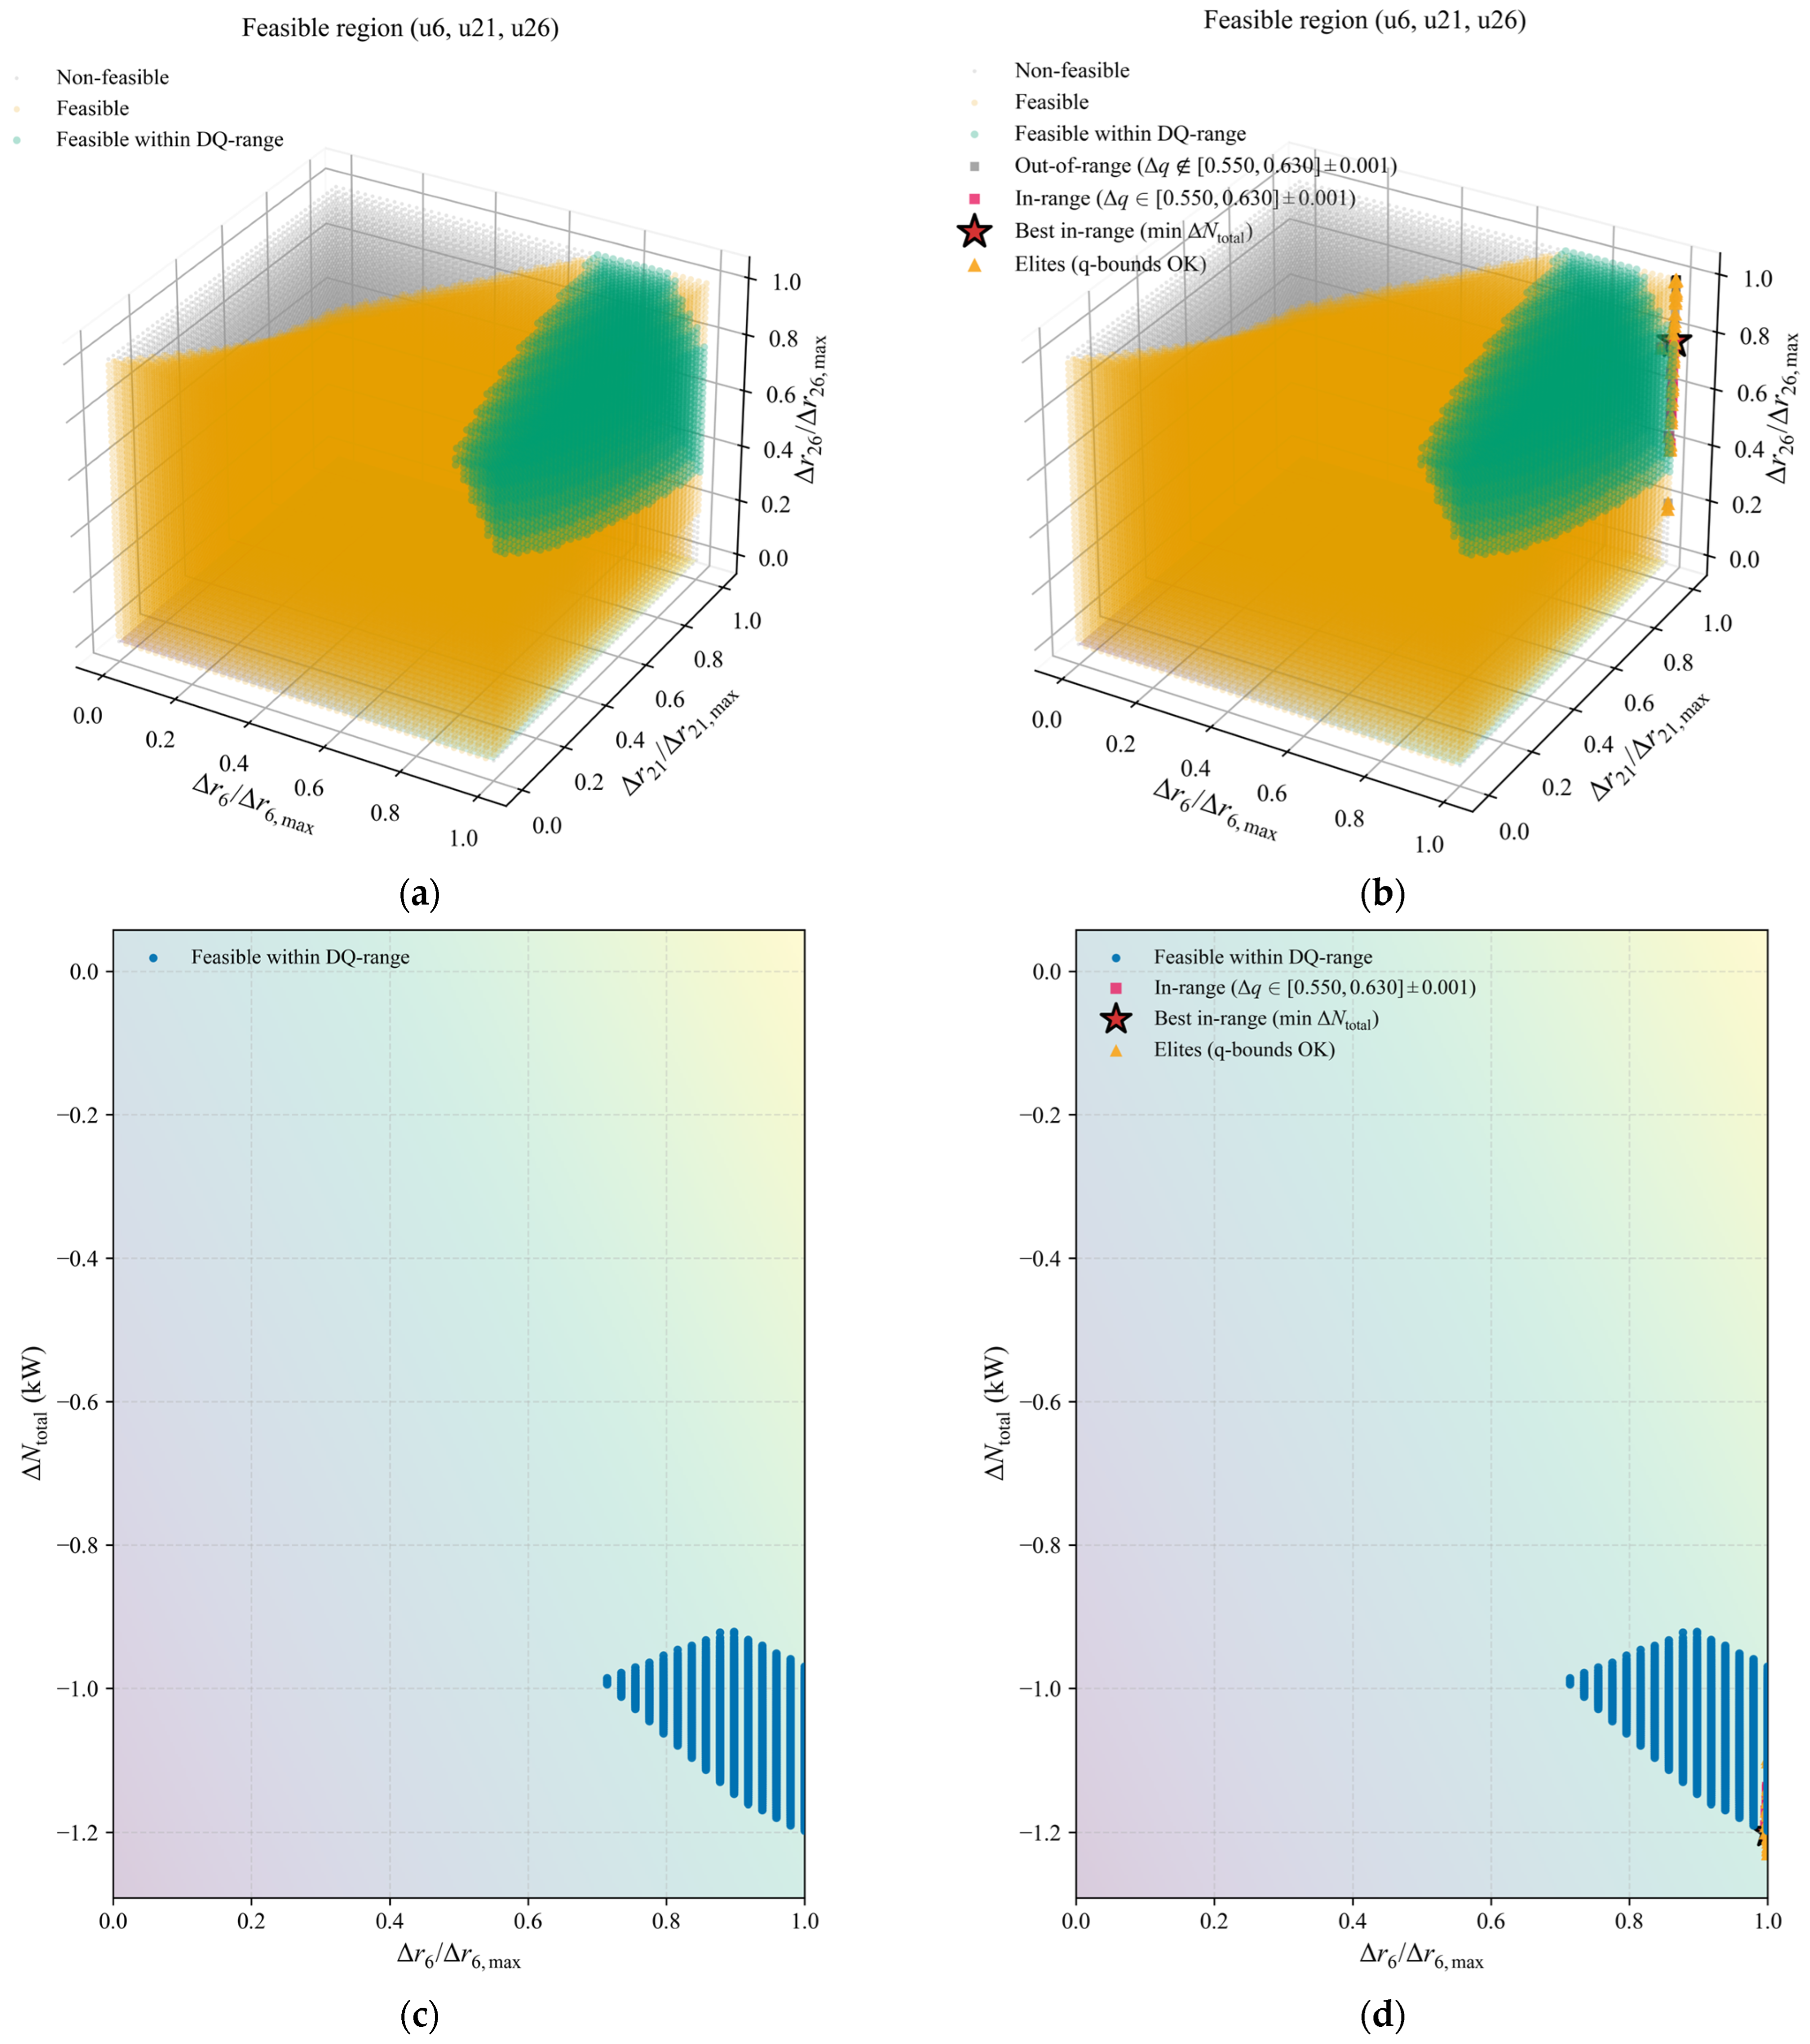
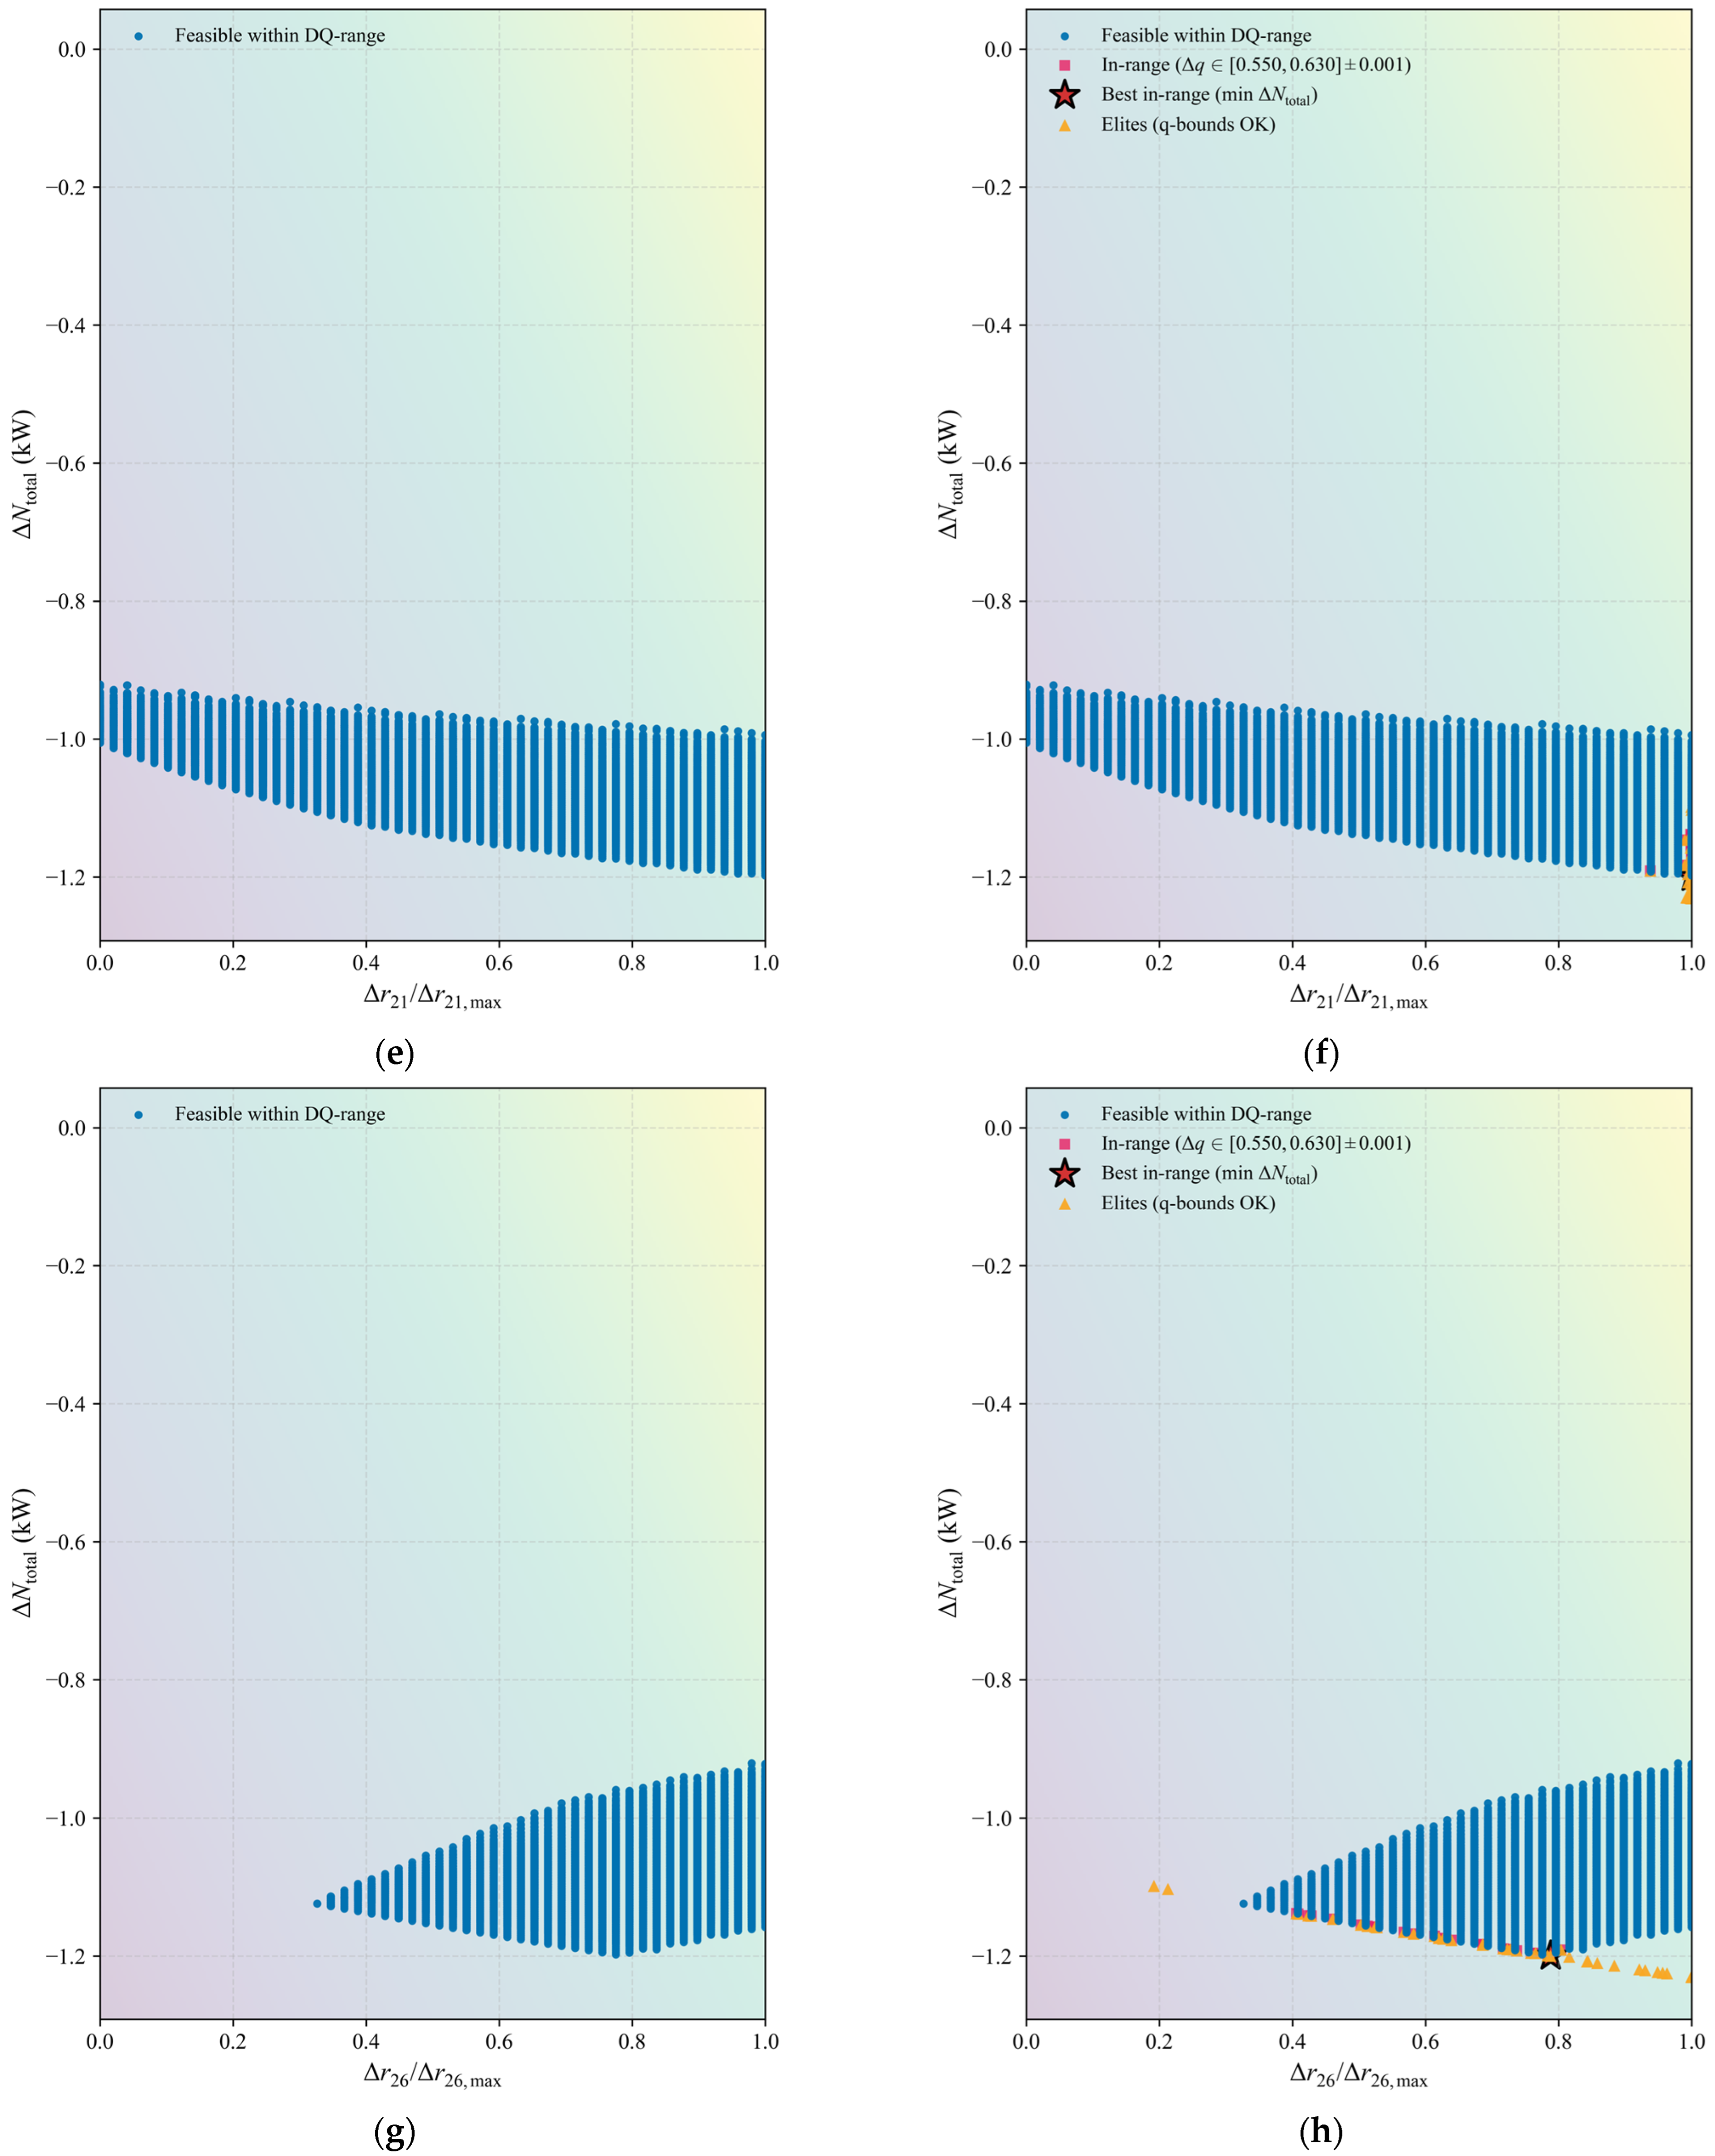
Figure 10 shows a comparison of the triple-branch regulation results for branches 6, 21 and 26, in terms of both feasible-solution regions and power projections for individual branches, thus contrasting the performance of the direct network solution and the composite algorithm. The corresponding multiple adjustment schemes are listed in Table 6.
Comparison of feasible-solution regions, Figure 10a shows the feasible-solution region obtained by direct network solution, where “non-feasible”, “feasible” and “feasible within Δ q -range” are marked in grey, yellow and green, respectively. The figure illustrates the distribution of the feasible region in the space of relative resistance increments Δ R 6 , m a x , Δ R 21 , m a x and Δ R 26 , m a x . Figure 10b shows the feasible-solution region obtained by the composite algorithm. In addition to “out-of-range” and “in-range” (solutions with Δ q [ 0.550,0.630 ] ± 0.001 ), annotations are added for the “best in-range” solution (minimum total power within the target Δ q range) and “elites” (feasible elite solutions satisfying the airflow constraints). These markers clearly delineate the solution clusters within the target Δ q interval and highlight both the global best solution (red star) and multiple high-quality elite solutions (triangles). This visualisation demonstrates the ability of the composite algorithm to accurately identify feasible regions, high-quality solutions and multiple solution clusters.
Comparison of branch-wise power projections, and taking branch 6 as an example, Figure 10c,d shows the projection of the relative resistance increment in branch 6 versus the total power change Δ N total . Figure 10c corresponds to a direct network solution, where only feasible solutions within the target Δ q ranges are shown. Figure 10d, under the composite algorithm, additionally marks solutions within the target Δ q range, the global best solution with minimum power and the elite solutions, allowing more precise identification of adjustment schemes that simultaneously satisfy the Δ q constraint and minimise power.
For branch 21, Figure 10e,f demonstrates that the elite and optimal solutions obtained by the composite algorithm are more concentrated in the region of lower total power, indicating a stronger focus of the solution distribution. For branch 26, Figure 10g,h shows that the composite algorithm not only clearly identifies solution clusters within the target Δ q range, but also marks the global optimum and multiple effective solutions with stars and triangles. These observations further demonstrate the advantages of the composite algorithm, in triple-branch coordinated regulation, in feasible-solution identification, elite-solution selection and robustness across multiple solutions.

4. Conclusions

This study addresses the airflow augmentation control problem in mine ventilation on demand (VOD), which is characterised by stringent constraints, a contracted feasibility region, and the coexistence of multiple viable solutions. An engineering-oriented closed-loop solution is therefore developed, with prior feasibility-region contraction, rapid feasibility screening, and multimodal optimisation output as its core elements. Unlike conventional direct optimisation approaches that rely on repeated full-network solving, the proposed method embeds key physical constraints explicitly into both the search space and the evaluation procedure, thereby achieving simultaneous improvements in computational speed, feasibility assurance and interpretability.
(1)
An engineering constraint-contraction mechanism based on feasibility-region bounds and sensitivity analysis is proposed, providing explicit limits on adjustable resistance. Feasible increments that do not violate system-wide airflow upper/lower bounds and effective increments filtered by sensitivity thresholds are jointly used to define constraints, from which the maximum practically implementable resistance increment for each branch is derived. In this way, invalid search regions are eliminated at the outset, ensuring that optimisation is performed within a physically meaningful domain.
(2)
Taylor-difference predictions are elevated to core constraints within the optimisation framework, thereby accelerating computation. It is demonstrated that the Taylor-difference estimates of the objective-branch airflow increment exhibit only small deviations from full-network solutions. These predictions are then used directly to construct the “maximum airflow” constraint for subsequent optimisation, which substantially reduces reliance on computationally expensive full-network iterative solving and forms a fast “prediction–constraint–search” closed loop.
(3)
A two-layer adaptive optimisation framework (ES–Hybrid JADE with Competitive Niching) is constructed to accelerate the generation of roadway airflow augmentation strategies. In the outer layer, ES is used to adaptively search the hyperparameter vector (with μ F , μ C R , p , κ , c , β , etc., treated as tuning variables), improving robustness across operating conditions and random seeds while enhancing engineering usability under limited trial budgets. In the inner layer, JADE performs the main search. Competitive Niching is incorporated to maintain multiple basins of attraction through species partitioning and local competitive replacement, preventing premature collapse to a single solution and enabling reliable output of multimodal elite solutions.
(4)
The real-time value of “near-optimal yet extremely fast” optimisation is validated in a real dual-main-fan system, and a practical set of alternative solutions is produced. Within the airflow-gain interval [ 0.40 ,   0.55 ] , the composite algorithm yields near-identical optimal results to direct solving, while reducing runtime from approximately 29 min to about 13 s, and simultaneously providing multimodal elite solutions that can accommodate different construction and scheduling preferences, thereby markedly improving online decision usability. Under global constraints, the maximum achievable airflow increment for the objective branch (Branch 10) is approximately 0.66 m3/s; under the segmented-interval strategy, the optimal dual-branch combination for [ 0.40 ,   0.55 ] is identified as Branches 6 and 26.
In summary, the proposed framework delivers a unified enhancement in convergence speed, solution stability and visual interpretability under strictly enforced feasibility-region constraints, and can serve as an engineering algorithmic core for mine VOD (ventilation on demand). The analysis procedure can also be applied to ventilation-network solutions of other mines to enable point-demand airflow control. Future work will focus on integrating online monitoring and multi-source sensors, and extending the framework to real-time sensor-stream data and multi-objective collaborative optimisation. In conjunction with quantum–classical ventilation-network solving algorithms, millisecond-scale variations in ventilation-network states are intended to be captured, so that airflow changes under varying air-state conditions and transitions of ventilation facilities can be analysed effectively, thereby supporting mine safety and intelligent operation.
For practical deployment, the proposed predictor-constrained optimiser can be embedded into a mine ventilation dispatch or digital-twin platform to generate feasible resistance-adjustment actions in near real time from routine sensor/SCADA inputs.
The retained set of multiple feasible optima can be presented as operator-selectable dispatch options, enabling rapid response to production shifts or emergency scenarios while respecting engineering safety margins.
Future work will prioritise field trials and extension to multi-objective VoD scheduling (e.g., energy, contaminant control, and equipment wear) and to other large-scale networked airflow/energy systems.

Author Contributions

Conceptualisation, G.N. and C.L.; methodology, G.N.; software, G.N.; validation, G.N. and C.L.; formal analysis, G.N.; investigation, G.N.; resources, G.N.; data curation, G.N.; writing—original draft preparation, G.N.; writing—review and editing, G.N.; visualisation, G.N.; supervision, G.N.; project administration, G.N.; funding acquisition, C.L. All authors have read and agreed to the published version of the manuscript.

Funding

This research was funded by the National Natural Science Foundation of China, grant number 52174204 and 51974233.

Data Availability Statement

The data are not publicly available due to commercial confidentiality, as they contain information that could compromise the privacy of research participants.

Conflicts of Interest

The authors declare no conflicts of interest.

References

  1. Wang, J.; Xiao, J.; Xue, Y.; Wen, L.; Shi, D. Optimization of Airflow Distribution in Mine Ventilation Networks Using the Modified Sooty Tern Optimization Algorithm. Min. Metall. Explor. 2024, 41, 239–257. [Google Scholar] [CrossRef] [Scilit]
  2. Liu, Y.; Liu, Z.; Gao, K.; Huang, Y.; Zhu, C. Efficient Graphical Algorithm of Sensor Distribution and Air Volume Reconstruction for a Smart Mine Ventilation Network. Sensors 2022, 22, 2096. [Google Scholar] [CrossRef] [Scilit]
  3. Nardo, M.D.; Yu, H. Intelligent Ventilation Systems in Mining Engineering: Is ZigBee WSN Technology the Best Choice? Appl. Syst. Innov. 2021, 4, 42. [Google Scholar] [CrossRef] [Scilit]
  4. Yan, Z.; Wang, Y.; Fan, J.; Huang, Y.; Zhong, Y. An Efficient Method for Optimizing Sensors’ Layout for Accurate Measurement of Underground Ventilation Networks. IEEE Access 2023, 11, 72630–72640. [Google Scholar] [CrossRef] [Scilit]
  5. Wang, K.; Jiang, S.; Wu, Z.; Shao, H.; Zhang, W.; Pei, X.; Cui, C. Intelligent Safety Adjustment of Branch Airflow Volume during Ventilation-on-Demand Changes in Coal Mines. Process Saf. Environ. Prot. 2017, 111, 491–506. [Google Scholar] [CrossRef] [Scilit]
  6. Wen, L.; Wang, J.; Wang, L.; Zhong, D.; Liu, Y. Optimization of Airflow Distribution in Mine Ventilation Networks Considering Ventilation Energy Consumption and Number of Regulators. Eng. Optim. 2025, 57, 3588–3609. [Google Scholar] [CrossRef] [Scilit]
  7. Prince; Hati, A.S.; Kumar, P. An Adaptive Neural Fuzzy Interface Structure Optimisation for Prediction of Energy Consumption and Airflow of a Ventilation System. Appl. Energy 2023, 337, 120879. [Google Scholar] [CrossRef] [Scilit]
  8. Fakhari, S.M.; Mrad, H. Optimization of an Axial-Flow Mine Ventilation Fan Based on Effects of Design Parameters. Results Eng. 2024, 21, 101662. [Google Scholar] [CrossRef] [Scilit]
  9. Liu, Y.; Huang, D.; Li, Y. Predictive Modelling of CART-Based Frictional Resistance in Mine Ventilation Systems. Min. Metall. Explor. 2022, 39, 301–315. [Google Scholar] [CrossRef] [Scilit]
  10. Zhou, L.; Bahrami, D. A Derivative Method to Calculate Resistance Sensitivity for Mine Ventilation Networks. Min. Metall. Explor. 2022, 39, 1833–1839. [Google Scholar] [CrossRef] [Scilit]
  11. Li, J.; Li, Y.; Zhang, J.; Li, B.; Zhang, Z.; Dong, J.; Cui, Y. Accurate and Real-Time Network Calculation for Mine Ventilation without Wind Resistance Measurement. J. Wind Eng. Ind. Aerodyn. 2022, 230, 105183. [Google Scholar] [CrossRef] [Scilit]
  12. Li, J.; Li, Y.; Zhang, W.; Dong, J.; Cui, Y. Multi-Objective Intelligent Decision and Linkage Control Algorithm for Mine Ventilation. Energies 2022, 15, 7980. [Google Scholar] [CrossRef] [Scilit]
  13. Liu, L.; Liu, J.; Zhou, Q. Mine Ventilation System Reliability Evaluation Based on a Markov Chain. Sci. Rep. 2022, 12, 17115. [Google Scholar] [CrossRef] [Scilit] [PubMed]
  14. Zhang, Z.; Li, J.; Li, Y. Real-Time Online Resistance-Alteration-Based Multiple-Fault Diagnosis Framework and Implementation for Mine Ventilation Systems. Adv. Eng. Inform. 2024, 59, 102305. [Google Scholar] [CrossRef] [Scilit]
  15. Wang, Y.; Pan, Q.; Gao, L.; Cao, Y.; Liu, P.; Yi, H.; Gao, C. Analysis of Distribution Method of Designed Air Quantity in Coal Mine Ventilation—A Case Study. Sci. Rep. 2024, 14, 10917. [Google Scholar] [CrossRef] [Scilit]
  16. Hao, H.; Jiang, S.; Wu, Z.; Wang, K.; Xi, X. Experimental Study on Precise Control Air Quantity on Demand by the Cooperation of Multiple Main Fans in Mine. J. Clean. Prod. 2023, 414, 137626. [Google Scholar] [CrossRef] [Scilit]
  17. Zeqiri, I.; Gashi, J.; Brahimaj, F.; Zeqiri, R. Effectiveness of Ventilation Regulation in a Simple Diagonal System of Underground Mines. Min. Miner. Depos. 2022, 16, 81–86. [Google Scholar] [CrossRef] [Scilit]
  18. Ihsan, A.; Widodo, N.P.; Cheng, J.; Wang, E. Ventilation on Demand in Underground Mines Using Neuro-Fuzzy Models: Modeling and Laboratory-Scale Experimental Validation. Eng. Appl. Artif. Intell. 2024, 133, 108048. [Google Scholar] [CrossRef] [Scilit]
  19. Han, Y.; Cheng, W.; Liu, H.; Wang, G.; Hu, Y. Treatment Methods for Natural Wind Pressure in Mines with Zonal Ventilation System with Diagonal Branches—A Case Study of Wudong Coal Mine. Energy Sources Part A Recovery Util. Environ. Eff. 2023, 45, 6118–6130. [Google Scholar] [CrossRef] [Scilit]
  20. Der, O. Multi-Output Prediction and Optimization of CO2 Laser Cutting Quality in FFF-Printed ASA Thermoplastics Using Machine Learning Approaches. Polymers 2025, 17, 1910. [Google Scholar] [CrossRef] [Scilit]
  21. Huang, S.; Fu, Z.; Liu, C.; Li, J. Multi-Objective Optimization of Fiber Laser Cutting Quality Characteristics of Glass Fiber Reinforced Plastic (GFRP) Materials. Opt. Laser Technol. 2023, 167, 109720. [Google Scholar] [CrossRef] [Scilit]
  22. Acuña, E.I.; Lowndes, I.S. A Review of Primary Mine Ventilation System Optimization. Interfaces 2014, 44, 163–175. [Google Scholar] [CrossRef] [Scilit]
  23. Chen, Y. Optimization of Ventilation On-Demand in Mines Based on Niche Particle Swarm Optimization Algorithm. Doctoral Dissertation, China University of Mining and Technology, Xuzhou, China, 2023. [Google Scholar]
  24. Knowles, J.; Corne, D. The Pareto Archived Evolution Strategy: A New Baseline Algorithm for Pareto Multiobjective Optimisation. In Proceedings of the 1999 Congress on Evolutionary Computation-CEC99 (Cat. No. 99TH8406); IEEE: Piscataway, NJ, USA, 1999; Volume 1, pp. 98–105. [Google Scholar]
  25. Zhang, J.; Sanderson, A.C. JADE: Adaptive Differential Evolution with Optional External Archive. IEEE Trans. Evol. Comput. 2009, 13, 945–958. [Google Scholar] [CrossRef] [Scilit]
  26. Wang, W.; Bai, Y.; Yang, Z.; Li, H.; Chen, Y.; Ma, Y. Research on optimization method of mine ventilation network based on GA-PSO. Min. Saf. Environ. Prot. 2025, 52, 24–29. [Google Scholar] [CrossRef]
  27. Lin, X.; Luo, W.; Xu, P. Differential Evolution for Multimodal Optimization with Species by Nearest-Better Clustering. IEEE Trans. Cybern. 2021, 51, 970–983. [Google Scholar] [CrossRef] [Scilit]
Figure 1. Overall framework diagram of the algorithm.
Buildings 16 00568 g001
Figure 2. Maximum resistance increment of each roadway in the ventilation network.
Buildings 16 00568 g002
Figure 3. Second-order sensitivity matrix for dual-branch regulation of branch 10.
Buildings 16 00568 g003
Figure 4. Inter-branch sensitivity analysis for the ventilation system. “***” indicates divisibility. When the divisibility of D subscript 1 is ≥the 95th percentile, it is marked with “***”; “**” indicates that the divisibility of capital D subscript 1 is ≥the 80th percentile and <the 95th percentile; “*” indicates that the divisibility of capital D subscript 1 is ≥the 60th percentile and <the 80th percentile; “·” indicates that the divisibility of capital D subscript 1 is <the 60th percentile. The more asterisks there are, the greater the absolute sensitivity of the single-branch resistance adjustment to the target air volume response.
Buildings 16 00568 g004
Figure 5. Convergence curves of the four outer-layer optimisation algorithms. (a) CMAES. (b) DE. (c) ES. (d) GA.
Buildings 16 00568 g005
Figure 6. Boxplot comparison of iteration counts. (a) Minimum power under average iteration count. (b) First convergence over all iteration counts.
Buildings 16 00568 g006
Figure 7. Relationship between median final best-so-far value and median convergence iteration for the four outer-layer optimisation algorithms.
Buildings 16 00568 g007
Figure 8. Comparative results of inner-layer optimisation algorithms. (a) ECDF of the best Δ N total at the end of the budget. (b) Evolution of the best Δ N total with the number of objective evaluations. (c) Radar chart of multi-dimensional performance. (d) Success rates within the target Δ q   range. (e) Per-seed ranking under different random seeds. (f) Proportion of time required to reach the median feasible-quality threshold.
Buildings 16 00568 g008aBuildings 16 00568 g008b
Figure 9. Comparison of dual-branch airflow augmentation results. (a) Direct network solution for airflow increment. (b) Airflow increment obtained by the composite algorithm. (c) Minimum power obtained by direct network solution. (d) Minimum power obtained by the composite algorithm.
Buildings 16 00568 g009
Figure 10. Comparison of triple-branch airflow augmentation results. (a) Feasible solution region from direct network solution. (b) Feasible solution region from the composite algorithm. (c) Power projection for branch 6 (direct solution). (d) Power projection for branch 6 (composite algorithm). (e) Power projection for branch 21 (direct solution). (f) Power projection for branch 21 (composite algorithm). (g) Power projection for branch 26 (direct solution). (h) Power projection for branch 26 (composite algorithm).
Buildings 16 00568 g010aBuildings 16 00568 g010b
Table 1. Initial ventilation network solution for the mine ventilation system.
NameNumberStart NodeEnd NodeTypeAir Resistance/N · s2/m8Airflow/m3/sFanAir Pressure/Pa
408 Car Yard11210.0227.910255.68
Vertical Shaft Rope Way21210.004558.840255.68
Auxiliary Shaft Rope Way31210.0227.910255.68
Auxiliary Blind Incline42410.062543.460488.25
Vertical Blind Incline52510.023371.200278.80
South Return Air Main64611.692433.910348.91
Explosive Depot 17461158.91813.490348.79
North Haulage Main 185410.00186.040209.44
North Haulage Main 295710.056177.25069.35
2323 Preparation Face10782130.890158.22
5# Coal Rail Roadway 1 (Upper)119710.115646.35088.86
11502 Driving Face129102217.84074.30
2321 Working Face1311921.937416.98024.01
5# Coal Rail Roadway 2 (Upper)1412910.269911.520139.15
Main Incline Shaft153110.055613.06021.63
Auxiliary Incline Shaft163110.092510.12021.63
Adit1721110.283211.34064.90
250 Car Yard1821310.050123.18043.27
Crossheading Air Leakage1920211240.13032.990174.85
250 Main Roadway20211910.424231.53066.67
Explosive Depot 22118191203.02692.86048.31
Measure Roadway22191610.199428.660114.99
Construction Measure Roadway23161510.361518.460127.11
08 Working Face24171626.839610.20012.12
5# Coal Rail Roadway 3 (Upper)25151210.16876.700131.96
08 Air Meeting and Personnel Incline2614151411.7504.84
11501 Working Face27131221.570518.2207.19
3# Coal Return Air Decline 128141310.101215.360129.57
Return Air Incline Roadway29171410.048227.120134.41
280 Bypass Roadway30181710.57537.330146.54
280 Return Air Roadway31201810.040540.200194.85
385 Return Air Fan Roadway3212031.430843.201369.71
3# Coal Return Air Decline 233131110.17352.850122.38
3# Coal Return Air Decline 334111010.197619.84098.36
3# Coal Return Air Decline 43510810.048837.680172.67
Return Air Crosscut368610.139868.580330.89
Main Exhaust Airway376130.1896106.0021028.60
Table 2. Deviations between predicted and actual airflow augmentation results.
Branch Combination Δ Q t a r g e t , p r e d /m3/s Δ Q t a r g e t , a c t u a l /m3/s
6 + 21 + 260.63905932890899290.661693882718577
6 + 26 + 340.59357603646843730.5912356166568671
6 + 260.59274719103164330.5912271980456367
6 + 300.42096468697696710.416435367192836
Table 3. Optimal parameter search results for the four outer-layer optimisation algorithms.
Algorithms w c 1 c 2 e f
CMAES0.811.171.800.36
DE0.562.472.103.13
ES0.871.221.6224.49
GA0.481.222.0910.68
s r n u m n e i g h b o r s s t e p s i z e n p a r t i c l e s n i t e r s
0.1531.223873
0.1940.642955
0.0332.184168
0.1940.854562
Table 4. Ranking of outer-layer optimisation algorithms.
Algorithmfinal_medianiter_medianrank_finalrank_iterrank_mean
ES457,251.7552.02.02.02.0
CMAES457,253.0247.53.01.02.0
GA457,251.5378.01.04.02.5
DE457,258.0355.03.03.03.5
Table 5. Multiple adjustment schemes obtained by the composite algorithm.
R 6 /N · s2/m8 R 26 /N · s2/m8 q /m3/s N t o t a l /Kw
0.32671.17930.5499−967.8704
0.32671.14880.5469−965.1666
0.32671.09720.5419−960.5506
0.32541.09390.5401−957.0837
Table 6. Multiple adjustment schemes obtained by the composite algorithm.
R 6 /N · s2/m8 R 26 /N · s2/m8 R 21 /N · s2/m8 q /m3/s N t o t a l /Kw
0.32671.2855223.76880.6299−1199.6412
0.32671.2784223.76880.6292−1198.9874
0.32671.2489222.54650.6261−1195.5269
0.32541.2378223.76880.6253−1195.2486
Disclaimer/Publisher’s Note: The statements, opinions and data contained in all publications are solely those of the individual author(s) and contributor(s) and not of MDPI and/or the editor(s). MDPI and/or the editor(s) disclaim responsibility for any injury to people or property resulting from any ideas, methods, instructions or products referred to in the content.