Article

Experimental Study on Mechanical Properties of Cemented Granular Materials with Coarse Aggregates

1
China Institute of Water Resources and Hydropower Research, Beijing 100038, China
2
Zhejiang Design Institute of Water Conservancy & Hydroelectric Power Co., Ltd., Hangzhou 310012, China
*
Author to whom correspondence should be addressed.
Buildings 2026, 16(3), 471; https://doi.org/10.3390/buildings16030471
Submission received: 4 January 2026 / Revised: 20 January 2026 / Accepted: 22 January 2026 / Published: 23 January 2026

Abstract

Cemented granular materials (CGMs) represent a transitional class of geomaterials where mechanical behavior is governed by the interplay between a discrete granular skeleton and a continuous cementitious matrix. While previous studies have focused on idealized spherical particles, this study aims to quantify the influence of the cement filling ratio (ranging from 10% to 100%) on the mechanical constitutive behavior of CGMs fabricated with large, irregular granitic aggregates (14–20 mm). Unconfined compressive tests and splitting tensile tests were conducted to evaluate the evolution of strength, stiffness, and failure modes. The results reveal a distinct mechanical transition governed by the cement filling ratio ( ρ m ). The elastic modulus and splitting tensile strength exhibited a linear increase with ρ m (R2 > 0.95), indicating a direct dependence on the volume fraction of the binding phase. In contrast, the unconfined compressive strength (UCS) and peak strain displayed a bilinear growth pattern with a critical inflection point at ρ m = 80%. For the specific irregular granitic aggregate skeleton investigated, this threshold marks the transition from contact-dominated stability to matrix-dominated continuum behavior. Below this threshold, strength gain is limited by the stability of discrete particle contacts; above 80%, the material behaves as a continuum, with UCS increasing rapidly to a maximum of 41.78 MPa at 100% filling. Furthermore, the dispersion of stress–strain responses significantly decreased as ρ m exceeded 50%, attributed to the homogenization of stress distribution within the specimen. These findings provide a quantitative basis for optimizing cement usage in ground reinforcement applications, identifying 80% as a critical design threshold.

1. Introduction

Cemented granular materials (CGMs), composed of granular aggregates bound by cementation agents, exhibit unique mechanical properties that bridge the characteristics of continuum and granular media. This has positioned them as a cross-disciplinary research focus in fields like geoengineering, civil engineering, and rock mechanics [1,2]. As a three-phase system of particles, cement matrix, and pores [3], CGMs derive strength from two key mechanisms: inter-particle cohesion that restricts particle movement and load transfer via the cement matrix, which alters the stress field [4,5]. The main failure mechanism of CGMs is closely associated with the cement filling ratio, leading to matrix fracture and diffusive crack propagation—an evolution consistent with the failure mechanism of cement-treated materials (e.g., cement-stabilized base materials) that rely on cementitious bonding for strength [6].
Experimental and numerical studies have shown that the interface bonding between particles and cement significantly influences CGM strength and failure modes. Mechanical behavior depends not only on load transfer between phases but also on the particle skeleton’s structure [7,8]. The initial particle contact network, similar to non-cohesive granular materials, dictates stress transfer and failure [9,10,11]. Cementation can occur as contact, surface, matrix, or dense bonding, reducing porosity and enhancing cohesive properties [4,12,13,14,15].
Geomechanical research on CGMs employs three primary approaches: laboratory tests on natural/man-made samples [16,17], prototype field experiments [18], and numerical simulations [19,20]. While numerical methods, particularly the Discrete Element Method (DEM), have advanced the understanding of microscopic force chains, they frequently rely on simplified spherical particle models to reduce computational cost. However, particle morphology is a governing factor in the mechanical behavior of granular assemblies. Research has demonstrated that the use of spherical approximations underestimates the shear strength contributed by geometric interlocking and fails to capture the stress concentrations inherent to angular vertices [21]. Experimental studies using idealized aggregates, such as glass beads or ceramic spheres, provide valuable benchmark data but cannot fully replicate the complex failure mechanisms of engineering materials like rock-filled concrete or grouted riprap. In systems with irregular aggregates, the failure path is dictated by a competition between the adhesive strength of the Interfacial Transition Zone (ITZ) and the cohesive strength of the matrix and aggregate. Crushed aggregates introduce tortuosity to the fracture plane and facilitate inter-particle locking that persists even after cement bond rupture—phenomena absent in spherical packings [3,17,22,23,24].
Consequently, a critical gap exists in the empirical characterization of CGMs fabricated with large, irregular coarse aggregates [24]. Mechanically, the irregular morphology of crushed aggregates is hypothesized to fundamentally alter the failure mechanism compared to spherical models. Specifically, the angular vertices and surface roughness of granitic aggregates are expected to enhance “grain interlocking”, thereby inhibiting the particle rotation that typically triggers collapse in spherical assemblies. This geometric interlocking is anticipated to maintain shear resistance even after the rupture of initial cement bonds, delaying strain localization.
This study specifically addresses these limitations with three clear objectives:
(1)
To fabricate CGM specimens using large, irregular crushed granitic aggregates (14–20 mm) that mimic the natural morphology of engineering CGMs (e.g., those used in hydraulic earth-rock embankments or ground reinforcement), overcoming the limitation of prior studies relying on spherical or simplified particles;
(2)
To systematically investigate the influence of cement filling ratio (ranging from 10% to 100%) on key mechanical properties of CGMs—including unconfined compressive strength, peak strain, elastic modulus, and splitting tensile strength—via controlled unconfined compressive tests and splitting tensile tests, with a focus on identifying potential threshold effects of cement filling ratio on mechanical behavior;
(3)
To bridge the gap between laboratory simplifications and field applications by clarifying the evolution of failure mechanisms (from discrete contact bond rupture to continuous cement matrix fracture) with increasing cement filling ratio, thereby providing quantitative mechanical parameters and structural design references for optimizing CGM-based engineering structures (e.g., cemented stone columns, reinforced earth-rock embankments, and pavement bases).
It is important to note that “CGM” represents a broad family of composite geomaterials, ranging from artificially cemented sands and stabilized pavement bases to rock-filled concrete. The mechanical behavior of these materials is highly configuration-dependent. This study focuses specifically on a gravity-grouted CGM system where a pre-existing skeleton of coarse, irregular aggregates is permeated by a self-compacting cement paste, preserving the initial granular fabric.

2. Materials and Methods

2.1. Materials

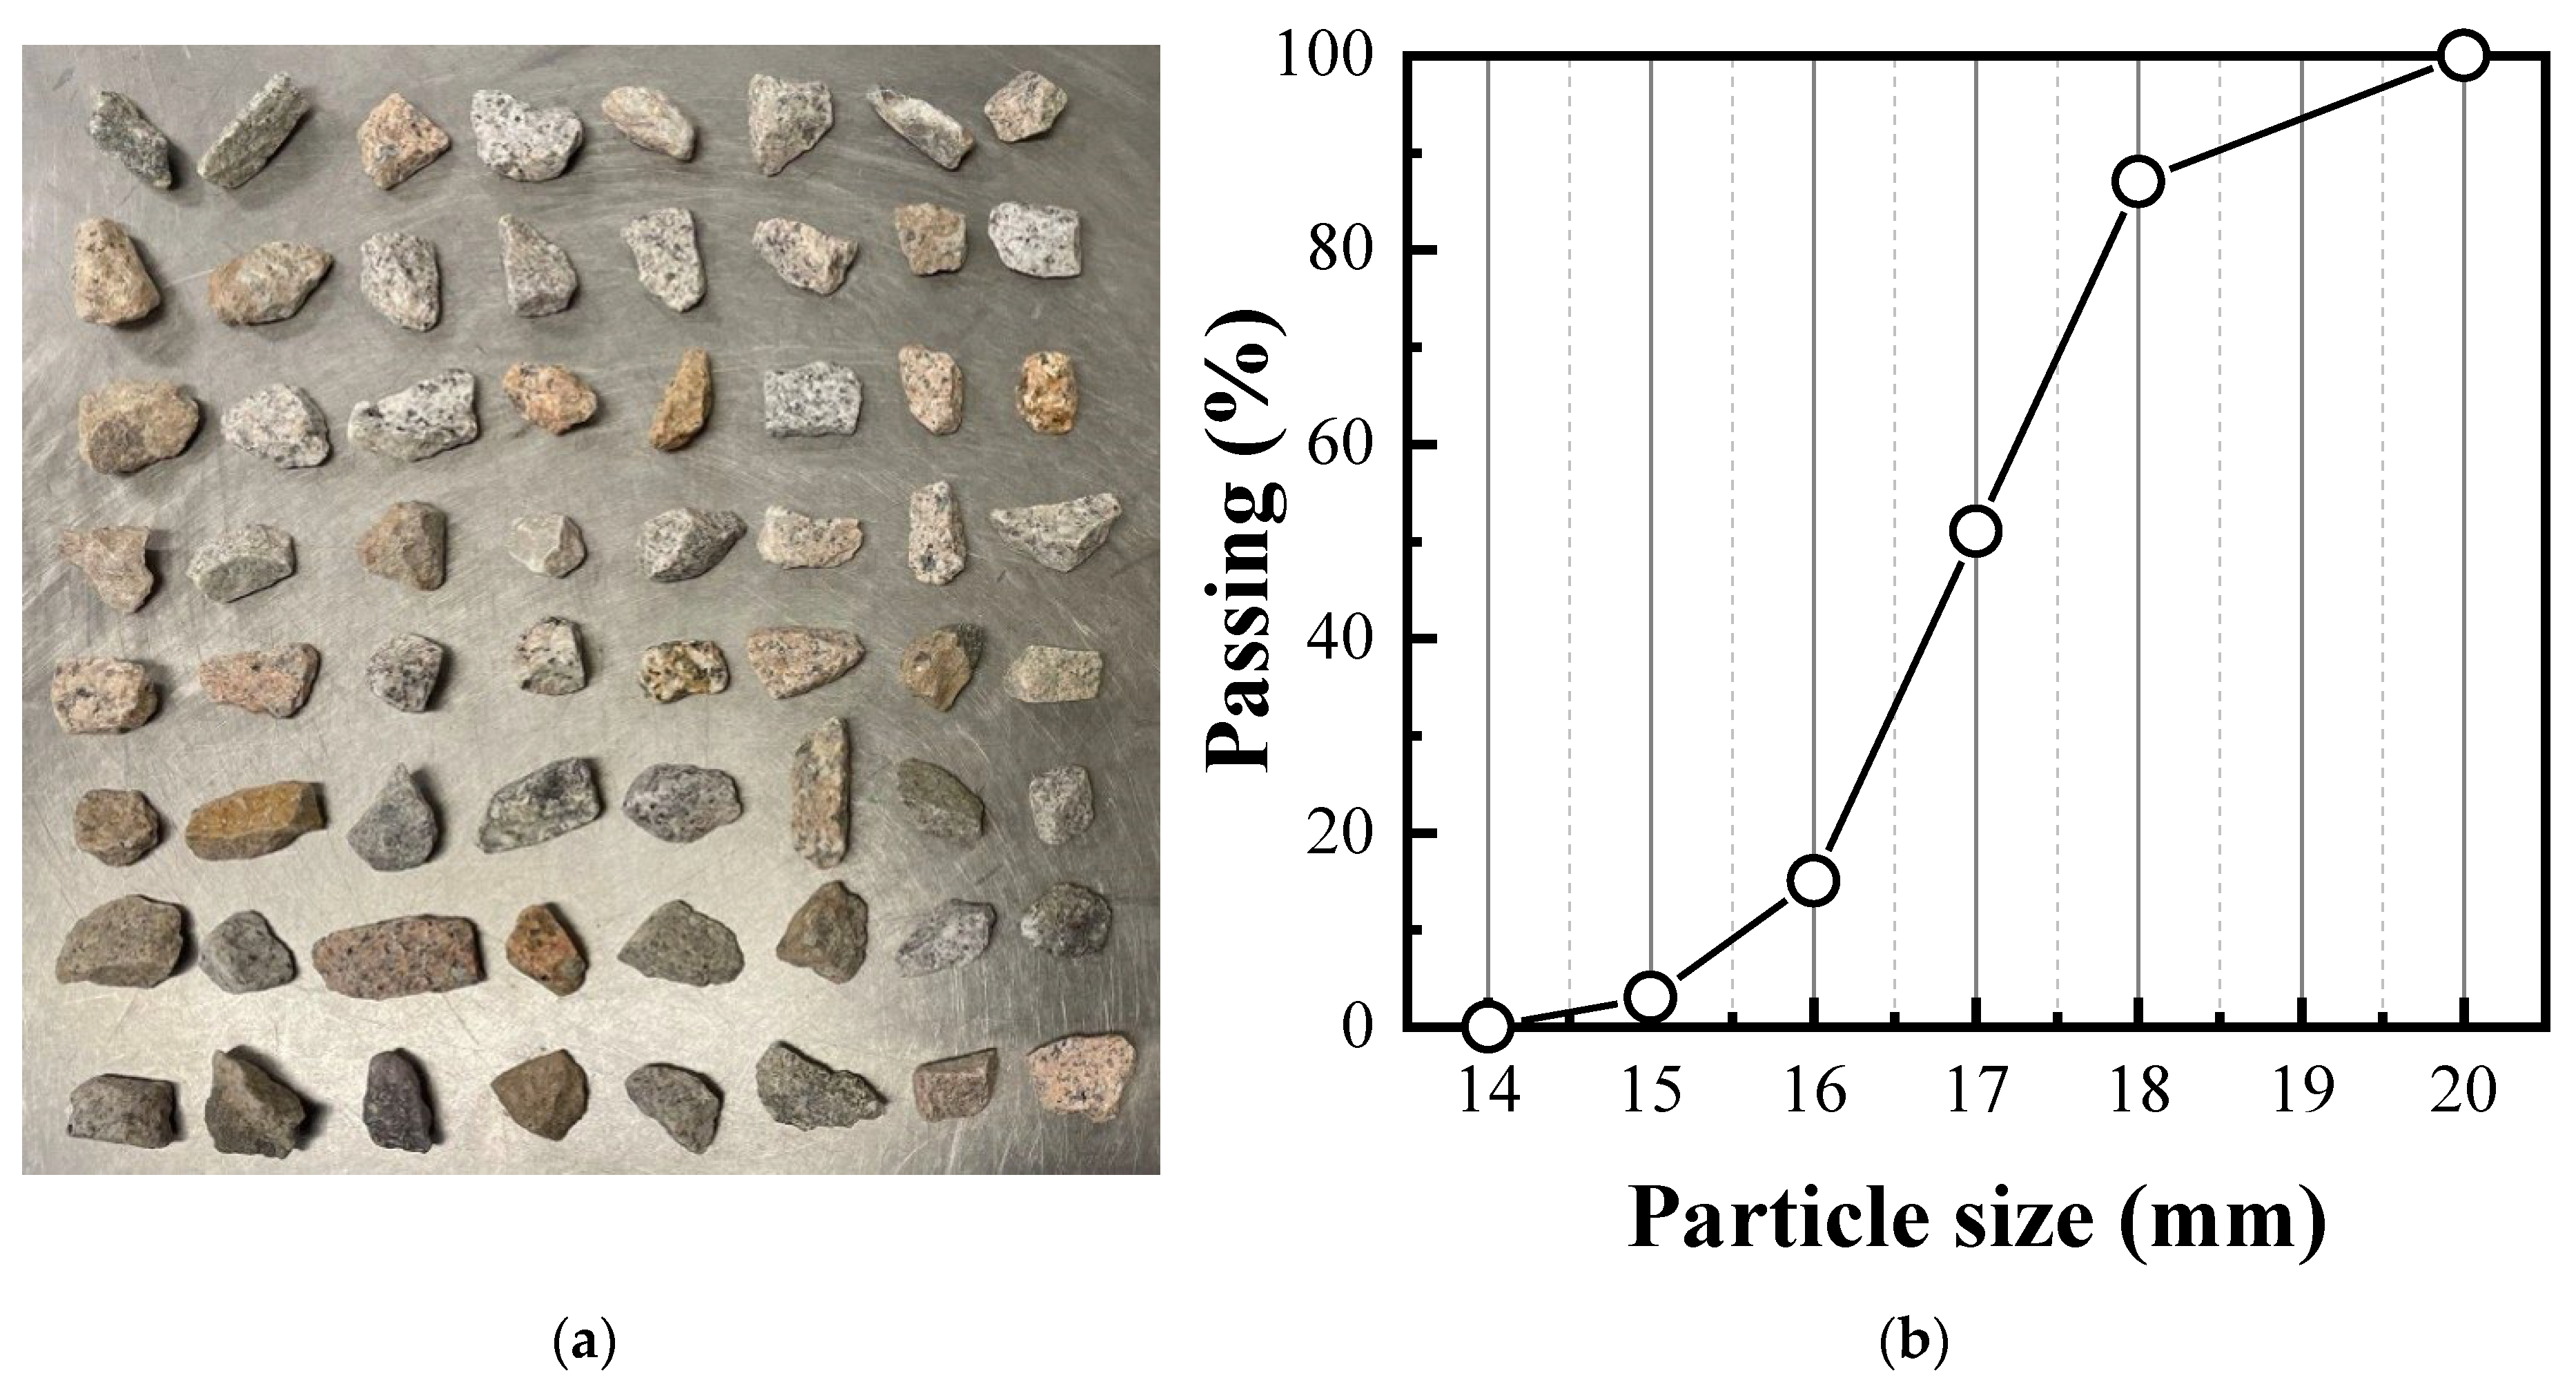
Crushed granitic rocks with a density of 2.78 g/cm3 were utilized to create the coarse aggregates of cemented granular materials (CGMs) for conducting unconfined compression and splitting tensile tests, as shown in Figure 1. As a typical acidic intrusive igneous rock widely used in construction, the granitic rock has well-documented inherent properties consistent with authoritative geological and material standards: its mineral composition is dominated by quartz (20–40%) and feldspar (50–70%, with potassium feldspar accounting for approximately two-thirds of the total feldspar), plus a small amount of biotite (≤5%); its chemical composition is characterized by high SiO2 content (67–76%), accompanied by Al2O3 (12–17%), K2O + Na2O (6–8%), and trace CaO, Fe2O3, and MgO. In terms of physical performance, it has low water absorption (0.1–0.7%) and low porosity (0.3–0.7%) due to its dense structure; in terms of mechanical performance, it has uniaxial compressive strength of 100–300 MPa and Shore hardness > 70 HSD, showing excellent mechanical stability and wear resistance. Initially, the rocks were sieved to obtain a grain size distribution ranging from 14 mm to 20 mm. All sieved aggregates were then washed with water and dried for later use to remove any dust particles present on the surface of the aggregates.
The self-compacting cement paste (SCCP), a widely used grouting material for reinforcing compromised earth-rock embankments, was employed in this study [25,26]. The SCCP was formulated by combining Portland cement Type-I 52.5 N, water, and a superplasticizer. The Portland cement has a typical chemical composition of SiO2 (20–24%), Al2O3 (4–7%), CaO (60–67%), and Fe2O3 (2–5%), with main mineral phases including tricalcium silicate (C3S, 50–60%) and dicalcium silicate (C2S, 15–25%); no additional mineral additives were added. The addition of the superplasticizer aimed to enhance the flowability and consistency of the cement paste, while having minimal effect on its strength [27]. The superplasticizer content was determined based on the mass ratio of cement. A volume ratio of water to cement, consisting solely of Portland cement, was maintained at 1.0 and explicitly defined as water-to-cement volume ratio (W:C on a volume basis). The density of Portland cement is 3.1 g/cm3. By calculating the weight of Portland cement using the volumetric ratio of water to cement and an electronic scale with a precision of 0.01 g, the mixture proportions were obtained as presented in Table 1.
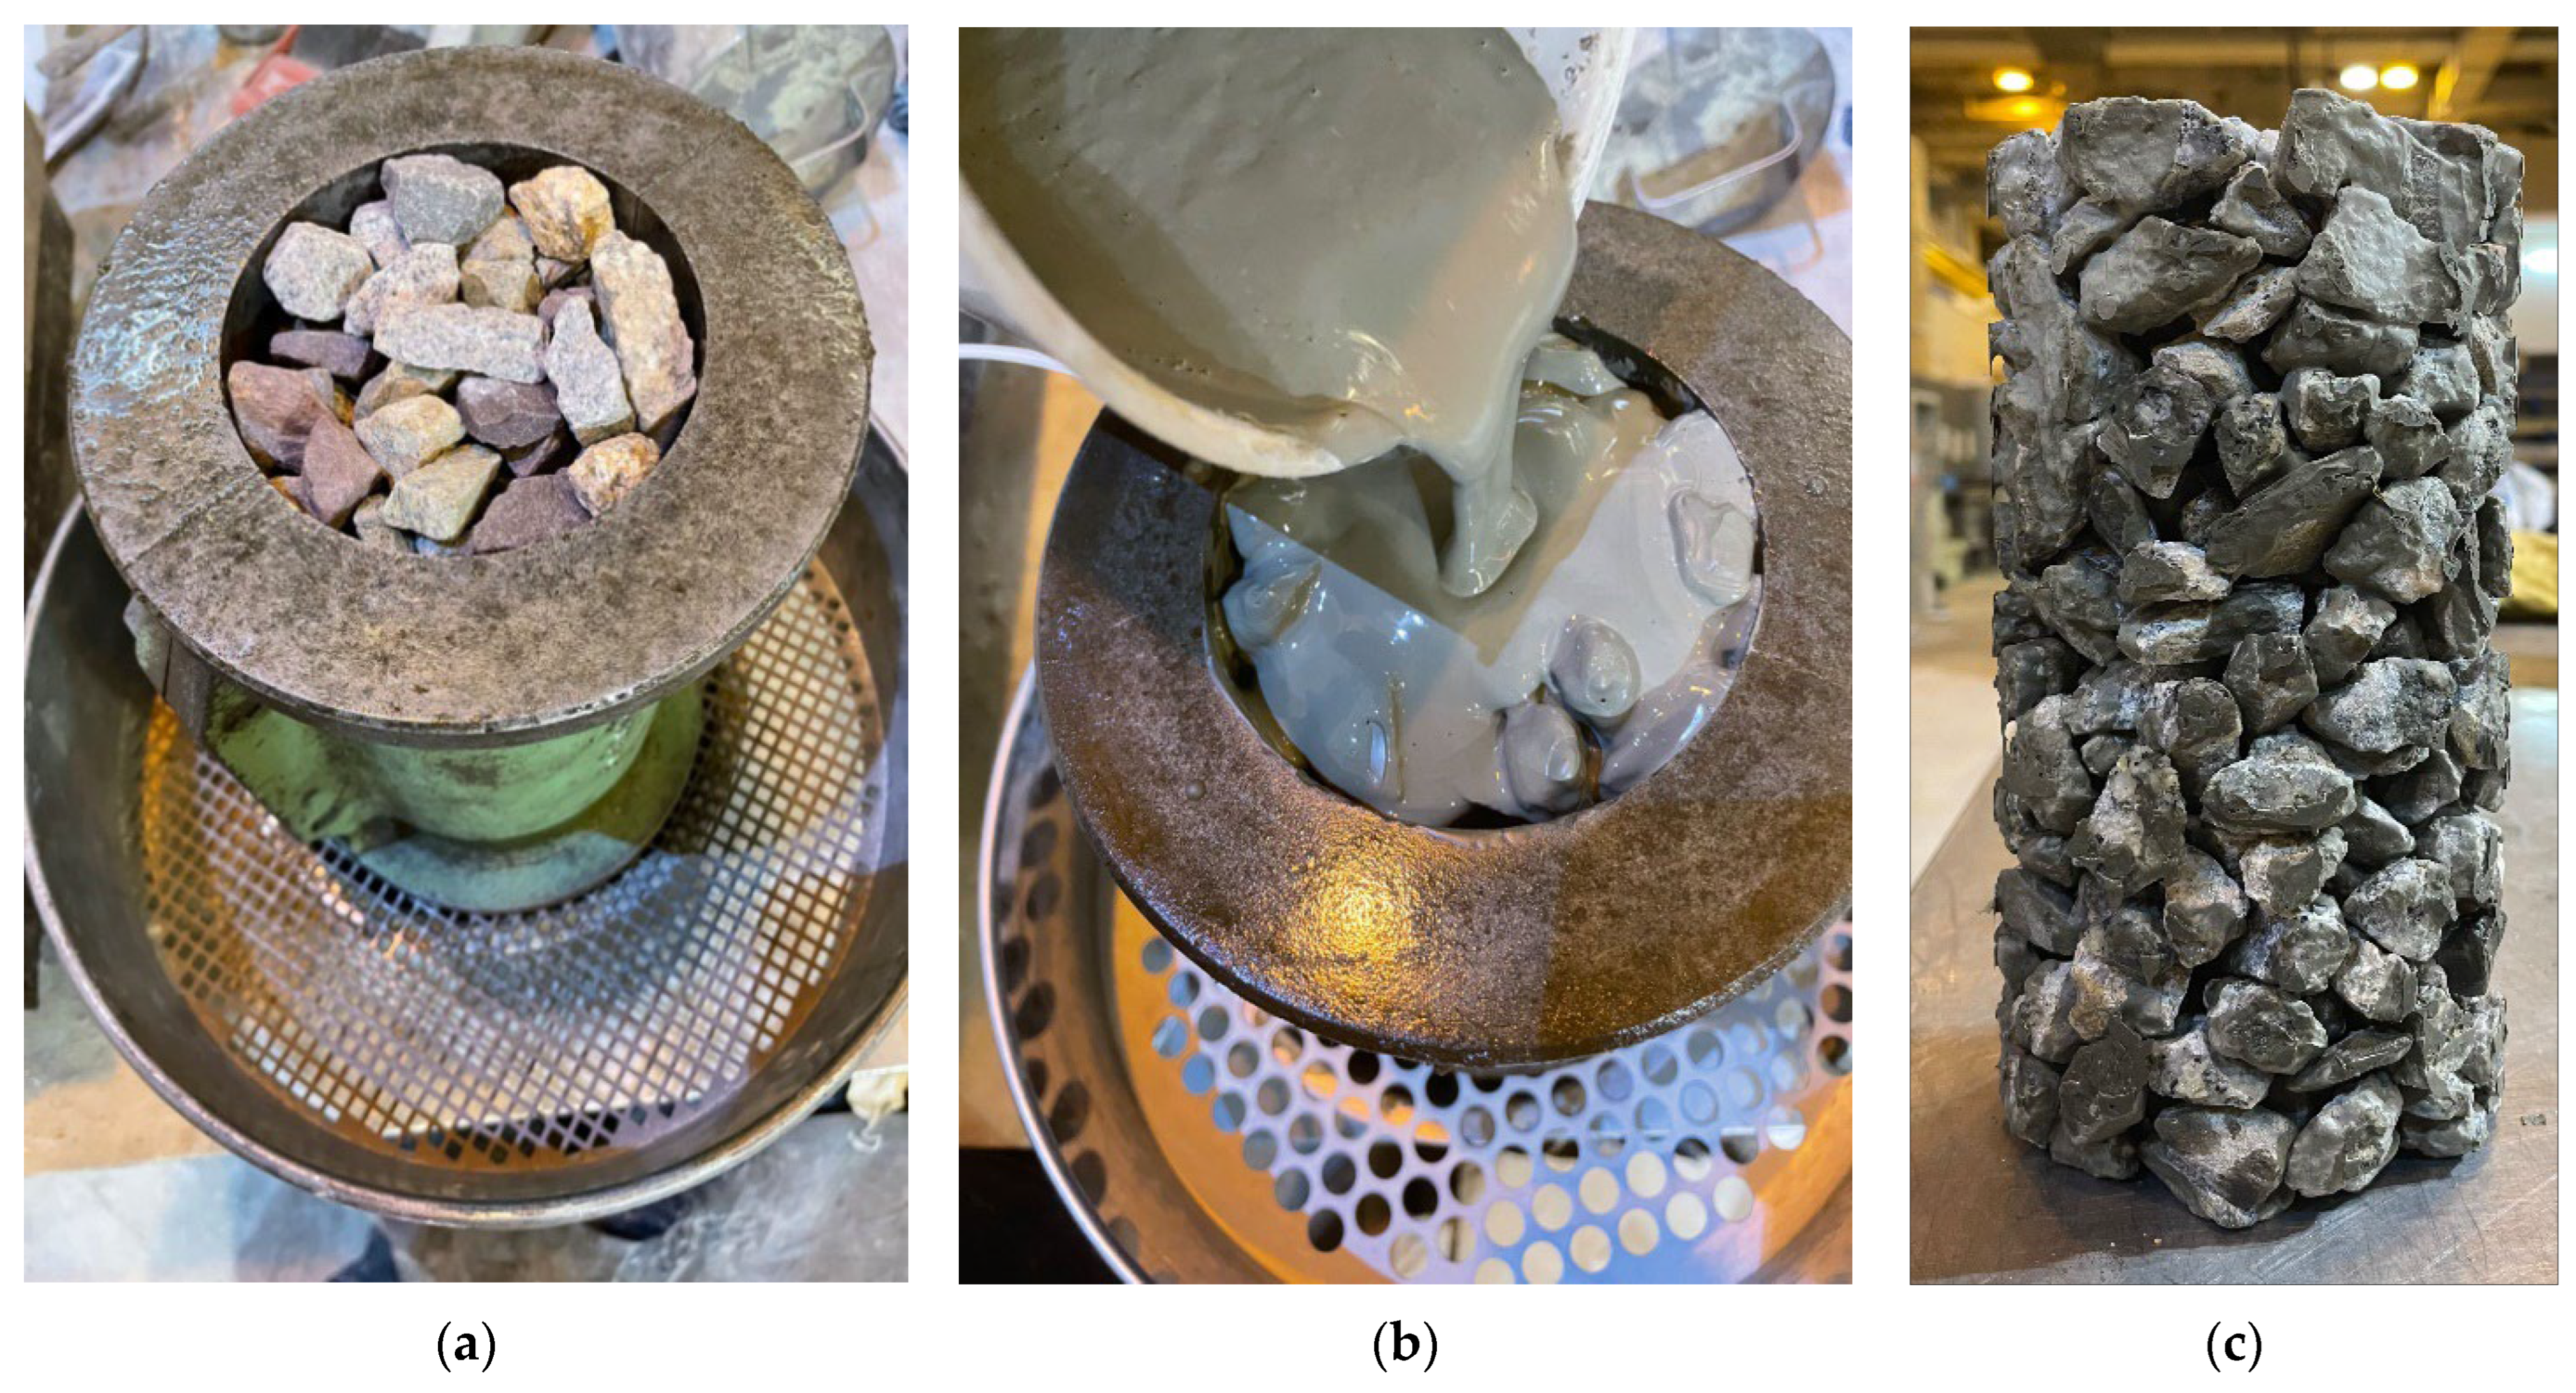
Cylindrical samples were manufactured in this study with a ratio of height to diameter of 2 ( 100 mm × 200 mm) (ASTM C0192_C0192M-14 [28]). The samples with different ratios of cementation were made referring to the technique of cementing technology [17], as shown in Figure 2. The process comprises the following steps: (1) Apply lubricating oil to the inner wall of the metal mold to facilitate easy separation of the sample from the mold upon removal. (2) Place the prepared hollow metal molds on a metal sieve with mesh openings smaller than the aggregate particle size to allow for the free flow of cement matrix out of the molds while preventing the aggregates from leaking out. (3) Place the rocks randomly in the mold and perform a slight vibration using a small handheld vibrator with low amplitude for 5–10 s—this operation only aims to help the aggregates settle naturally into a stable state without disrupting their random arrangement, rather than performing intentional compaction to alter the void ratio of the granular skeleton (Figure 2a). (4) Evenly pour the SCCP into the mold from the top. By virtue of its exceptional self-fluidity, low viscosity, and robust anti-segregation capability, the SCCP flows unimpeded from top to bottom throughout the chamber. The material’s optimized particle gradation and admixture formulation ensure uniform consistency during flow, preventing aggregate separation or cement paste segregation. Repeat the pouring process until the required cementation ratio is achieved (Figure 2b). (5) Cure the specimens for 28 days in a curing room at a temperature of 20 ± 2 °C and relative humidity above 95% (RH) before conducting the tests.
The concern over particle size relative to sample diameter necessitates a discussion on experimental setup rationality, rooted in the representative volume element (RVE) theory. For heterogeneous materials, accurately capturing macroscopic constitutive behavior relies on defining the RVE minimum size [29,30]. Homogenization-based models require RVEs large enough to represent material heterogeneity, with studies like Elvin [31] specifying 230 grains for homogeneous elastic response in freshwater ice. Ren and Zheng determined that the RVE size for cubic polycrystals should be approximately 20 times the crystal size—contextualizing the present study’s particle-scale considerations [32].
Triaxial testing standards directly inform RVE adequacy. ASTM D7181-20 [33] mandates the largest particle size to be less than 1/6 of the specimen diameter, while studies on coarse-grained materials validate that a 1/5 diameter-to-particle ratio suffices for specimens up to 1 m in diameter [34,35,36]. For the 300 mm diameter cylinder here, even the conservative 1/6 ratio permits particles up to 50 mm; the actual maximum particle size (20 mm) yields a 15:1 diameter-to-particle ratio, far exceeding safety thresholds. This ratio mitigates size effects by ensuring particles are sufficiently smaller than the specimen scale.
Concrete research further corroborates this setup. BS EN 12390-3 [37] specifies a 3.75:1 mold-to-aggregate ratio for 40 mm particles, whereas the present 15:1 ratio (300 mm diameter with 20 mm particles) exceeds this benchmark. Sim [38] found that favorable size ratios render normal weight concrete crack distribution insensitive to maximum aggregate size, while Faramarzi and Rezaee showed smaller particles reduce specimen heterogeneity, minimizing impacts on failure modes [39]. The large diameter-to-particle ratio here aligns with these findings, reducing microstructural variability.
In summary, the 100 mm diameter mold and 14–20 mm aggregate satisfy RVE requirements across mesoscale homogenization theory and mechanical testing standards. With a particle size less than 1/15 of the diameter—well below the 1/5 ratio validated in triaxial and concrete studies—the setup ensures the RVE is sufficiently large to capture representative macroscopic behavior without particle size effects. This configuration is theoretically grounded and empirically supported by the existing literature.
The cement filling ratio of CGM is determined by a simple calculation. ρ m is used to represent the filling ratio of cementation:
ρ m = V c V v × 100 %
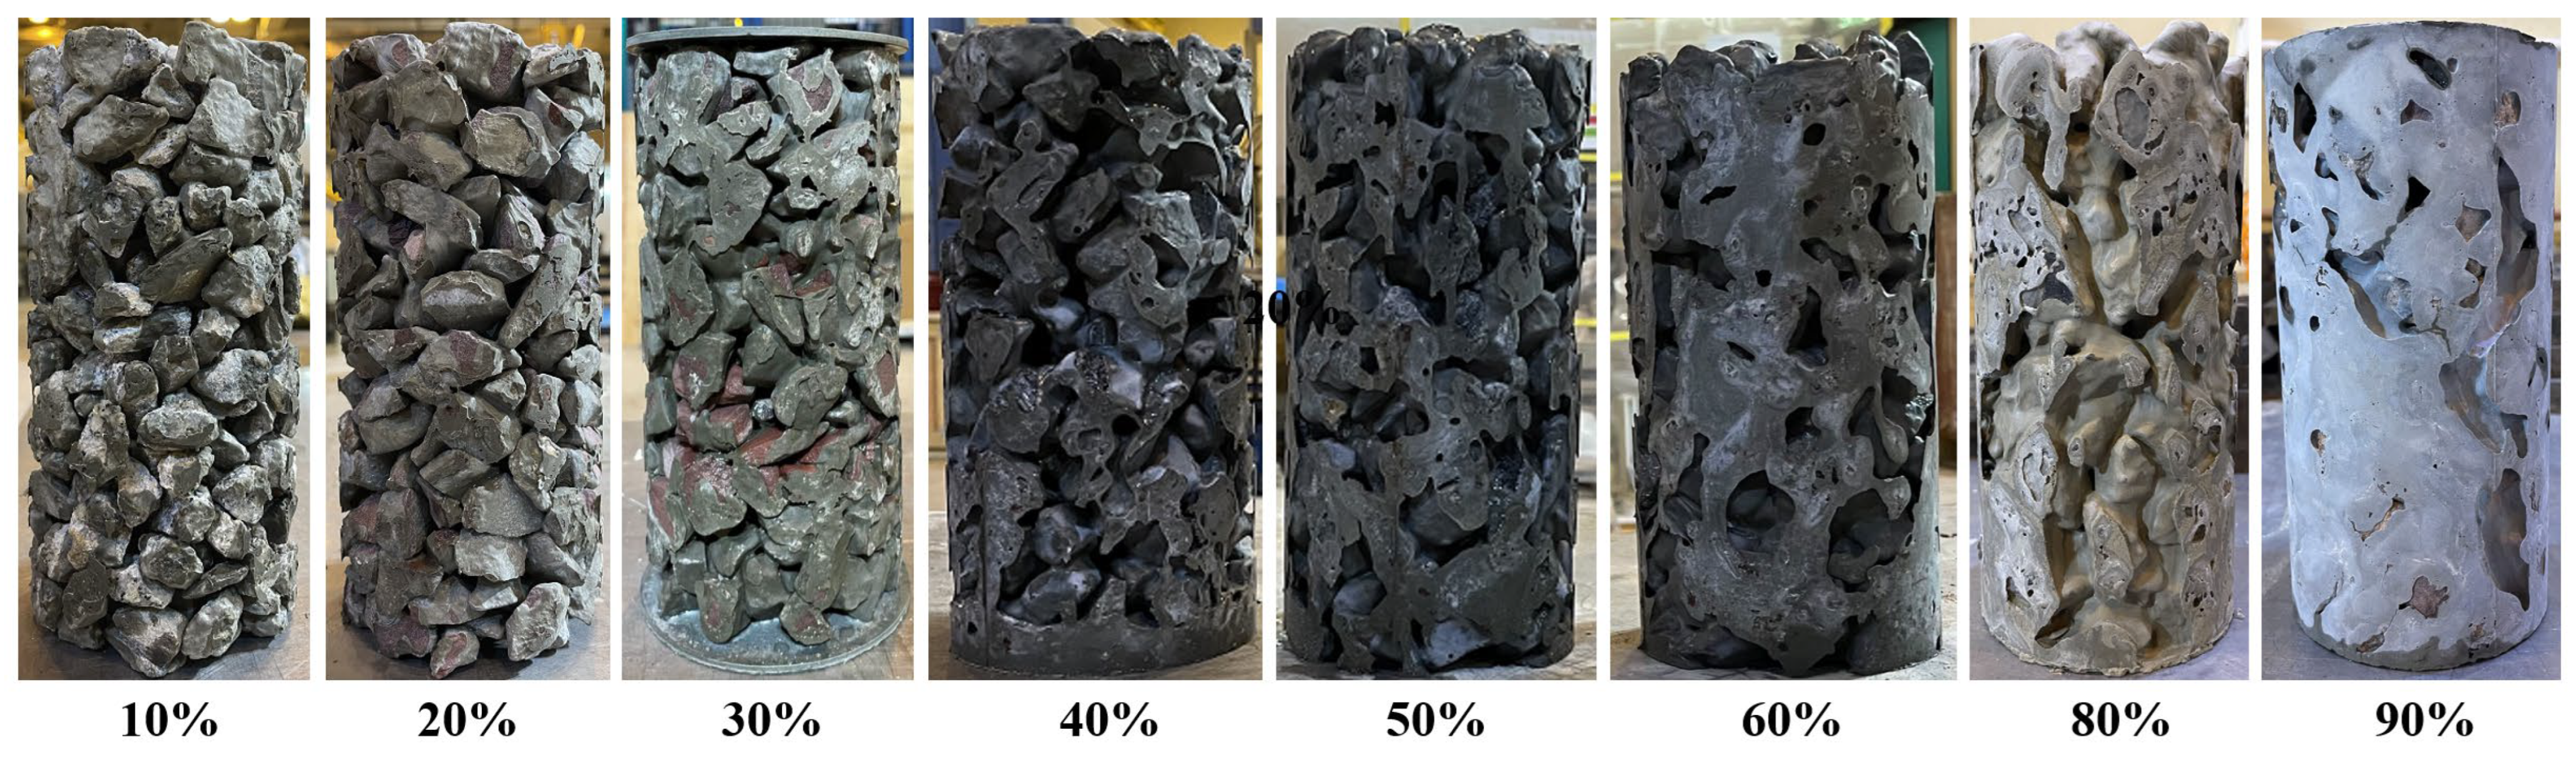
where V c represents the volume of SCCP left in the mold (sample); V v is the total volume of the void in the mold before pouring the SCCP. Initially, the mass of SCCP inflow and outflow from the mold is calculated to determine the volume of the SCCP remaining in the mold. The cementation filling ratio for each specimen can be subsequently calculated. By adjusting the admixture content, SCCP with varying fluidity and viscosity can be prepared to alter the volume of SCCP retained in the mold, thereby producing CGM samples with different cement filling ratios. The cement filling ratio range in this study is from 10% to 100% (fully filled). Figure 3 illustrates different specimens with cement ratios ranging from 10% to 90%. A value of 100% is the maximum cement filling ratio, indicating that all voids in the mold have been filled with cement paste.

2.2. Unconfined Compressive Test

The unconfined compressive test, or UCT, is a common laboratory test used to determine the compressive strength of a material, particularly soil and rock. The test involves subjecting a cylindrical specimen of the material to a compressive load along its axial direction until failure occurs. The formula for calculating the unconfined compressive stress (UCS) of a material using the results of an unconfined compressive test is
σ = P A 1 ε
where σ is the axial compressive stress, P is the force applied to the specimen for each set of readings, ε is the axial strain of the specimen for each set of readings, and A is the initial cross-sectional area of the specimen.
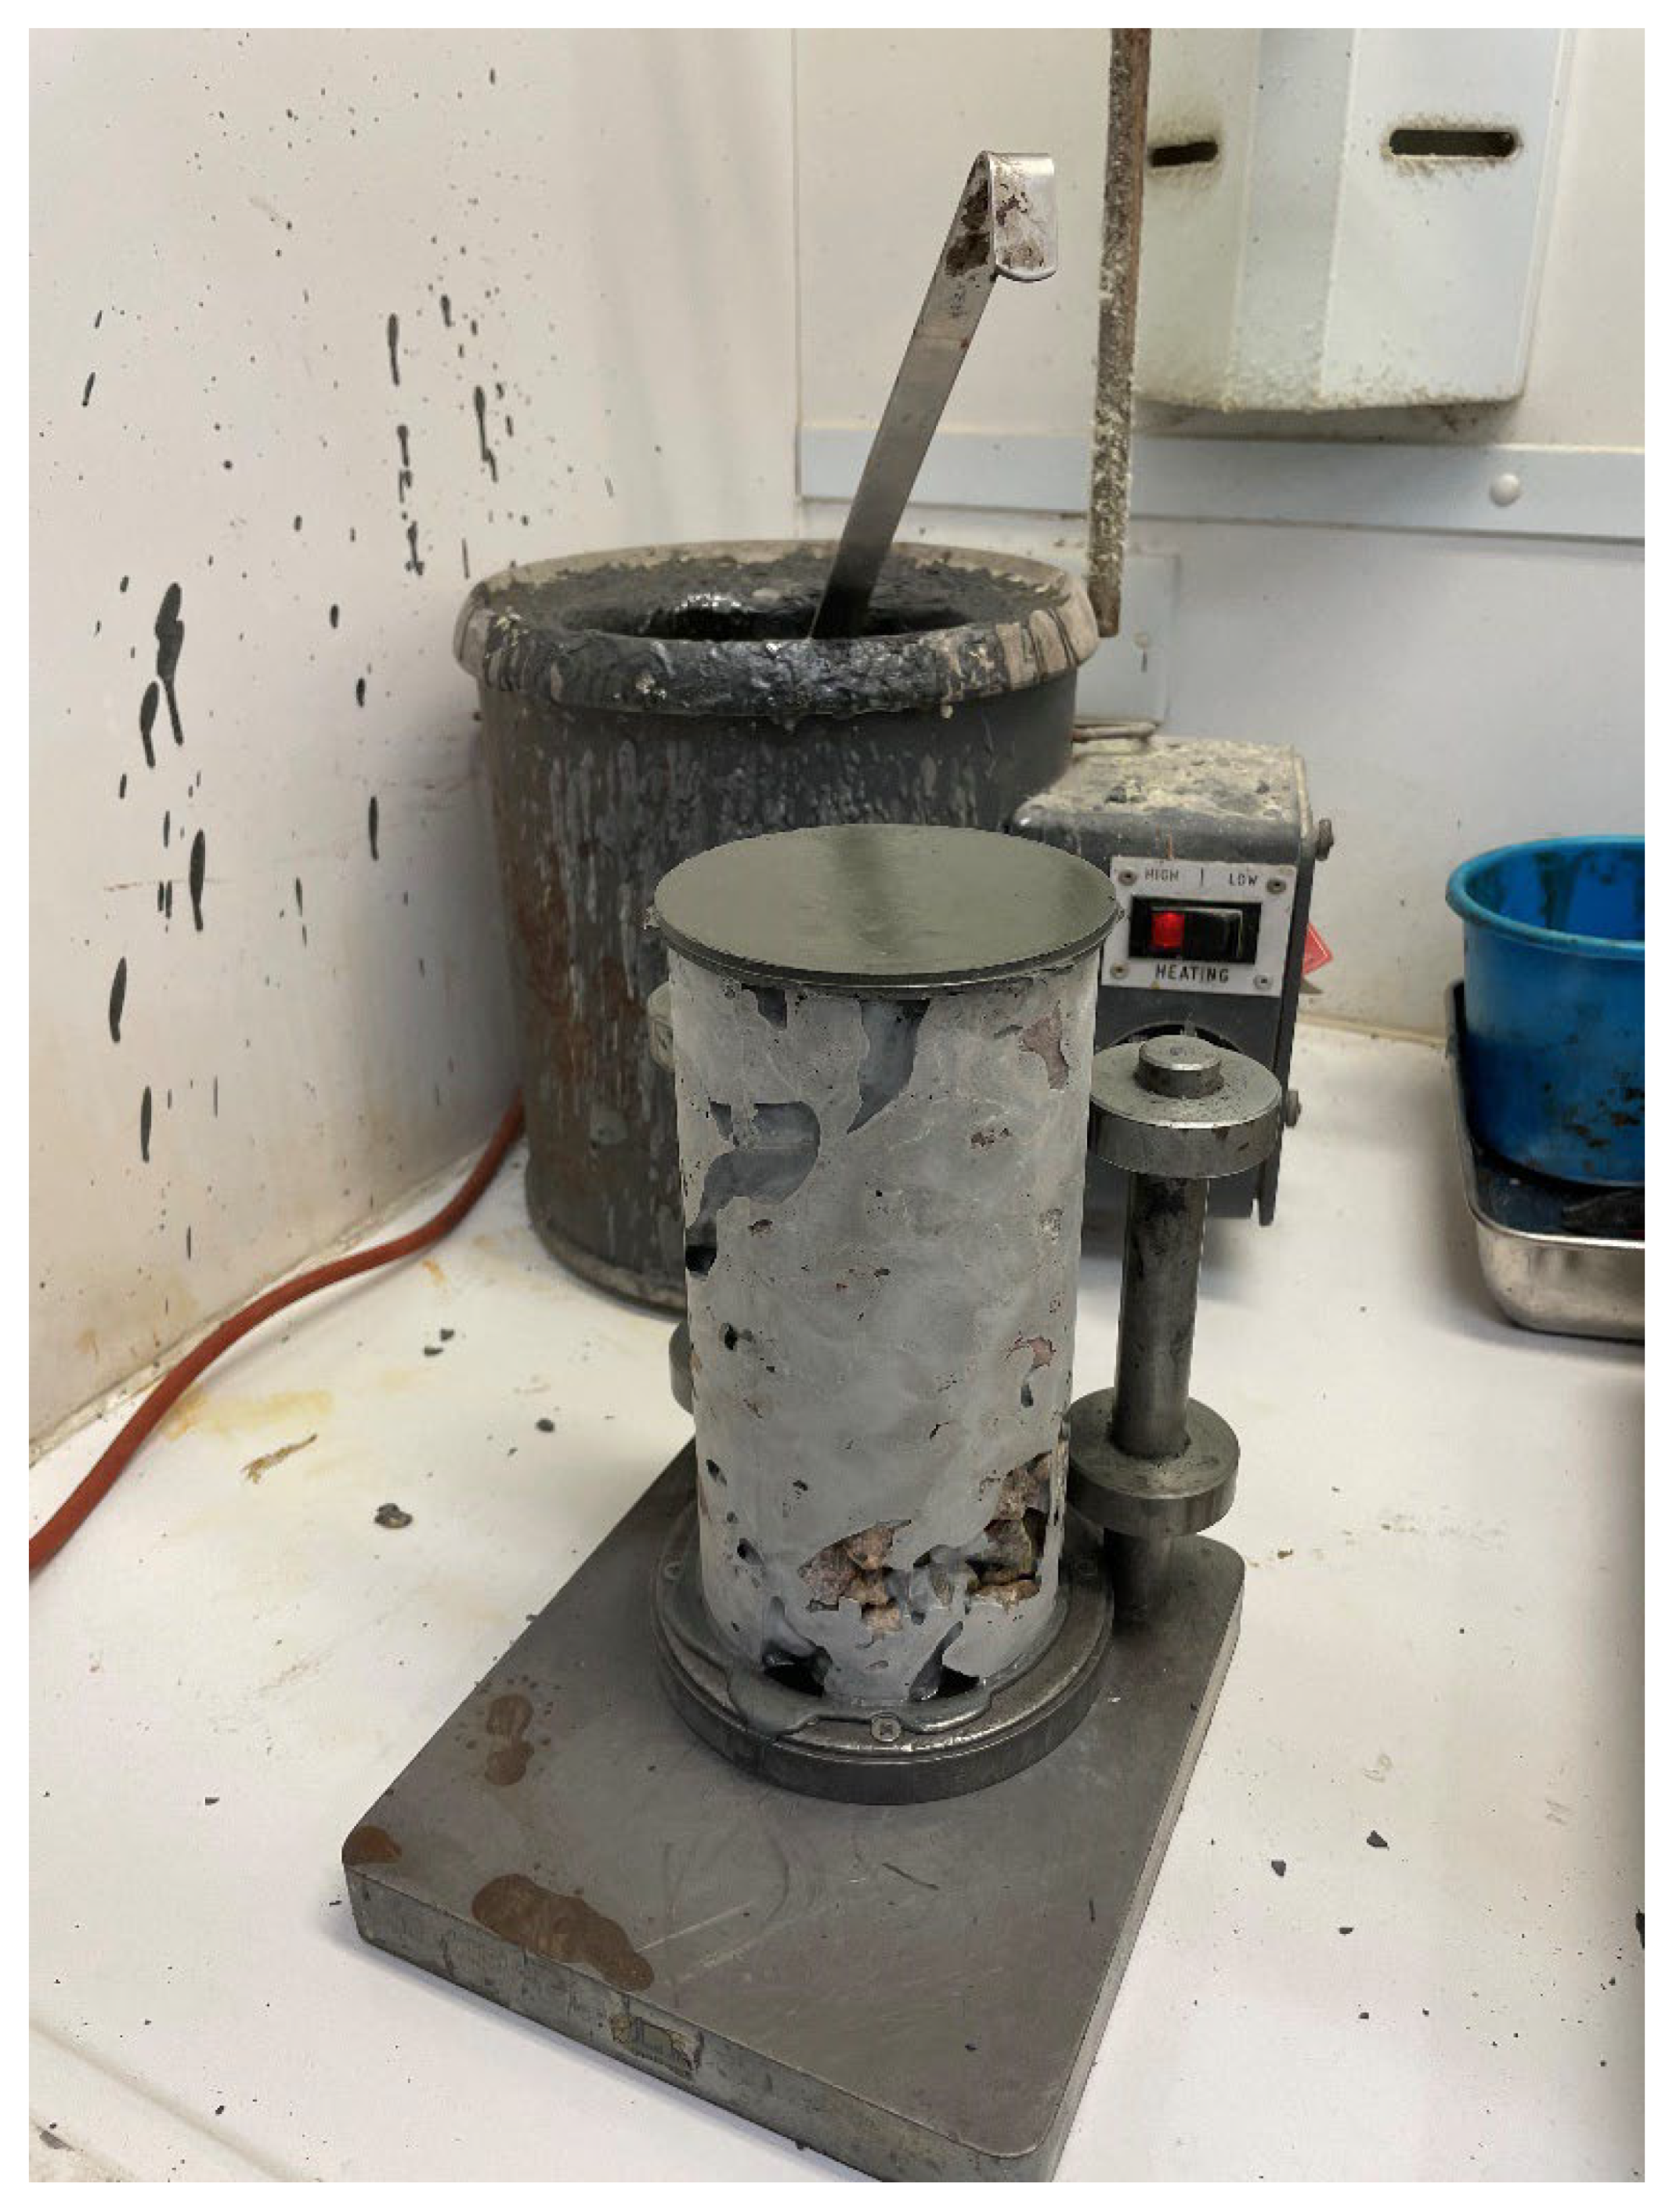
In order to achieve uniform stress distribution during loading and prevent eccentric forces, it is necessary to cap the upper and lower surfaces of the specimen prior to conducting the unconfined compressive test (UCT). This step is particularly crucial for CGM specimens that have irregular shapes and uneven surfaces (refer to Figure 4). Sulfur mortar is employed as the capping material, and the sulfur mortar specimens were prepared by incorporating silica flour, mica, and carbon as fillers. Silica flour is added to mitigate any potential odor-related concerns. The sulfur mortar specimens exhibit compressive strength ranging from 19 to 42 MPa, tensile strength exceeding 7.5 MPa, and flexural strength between 10 and 12 MPa.
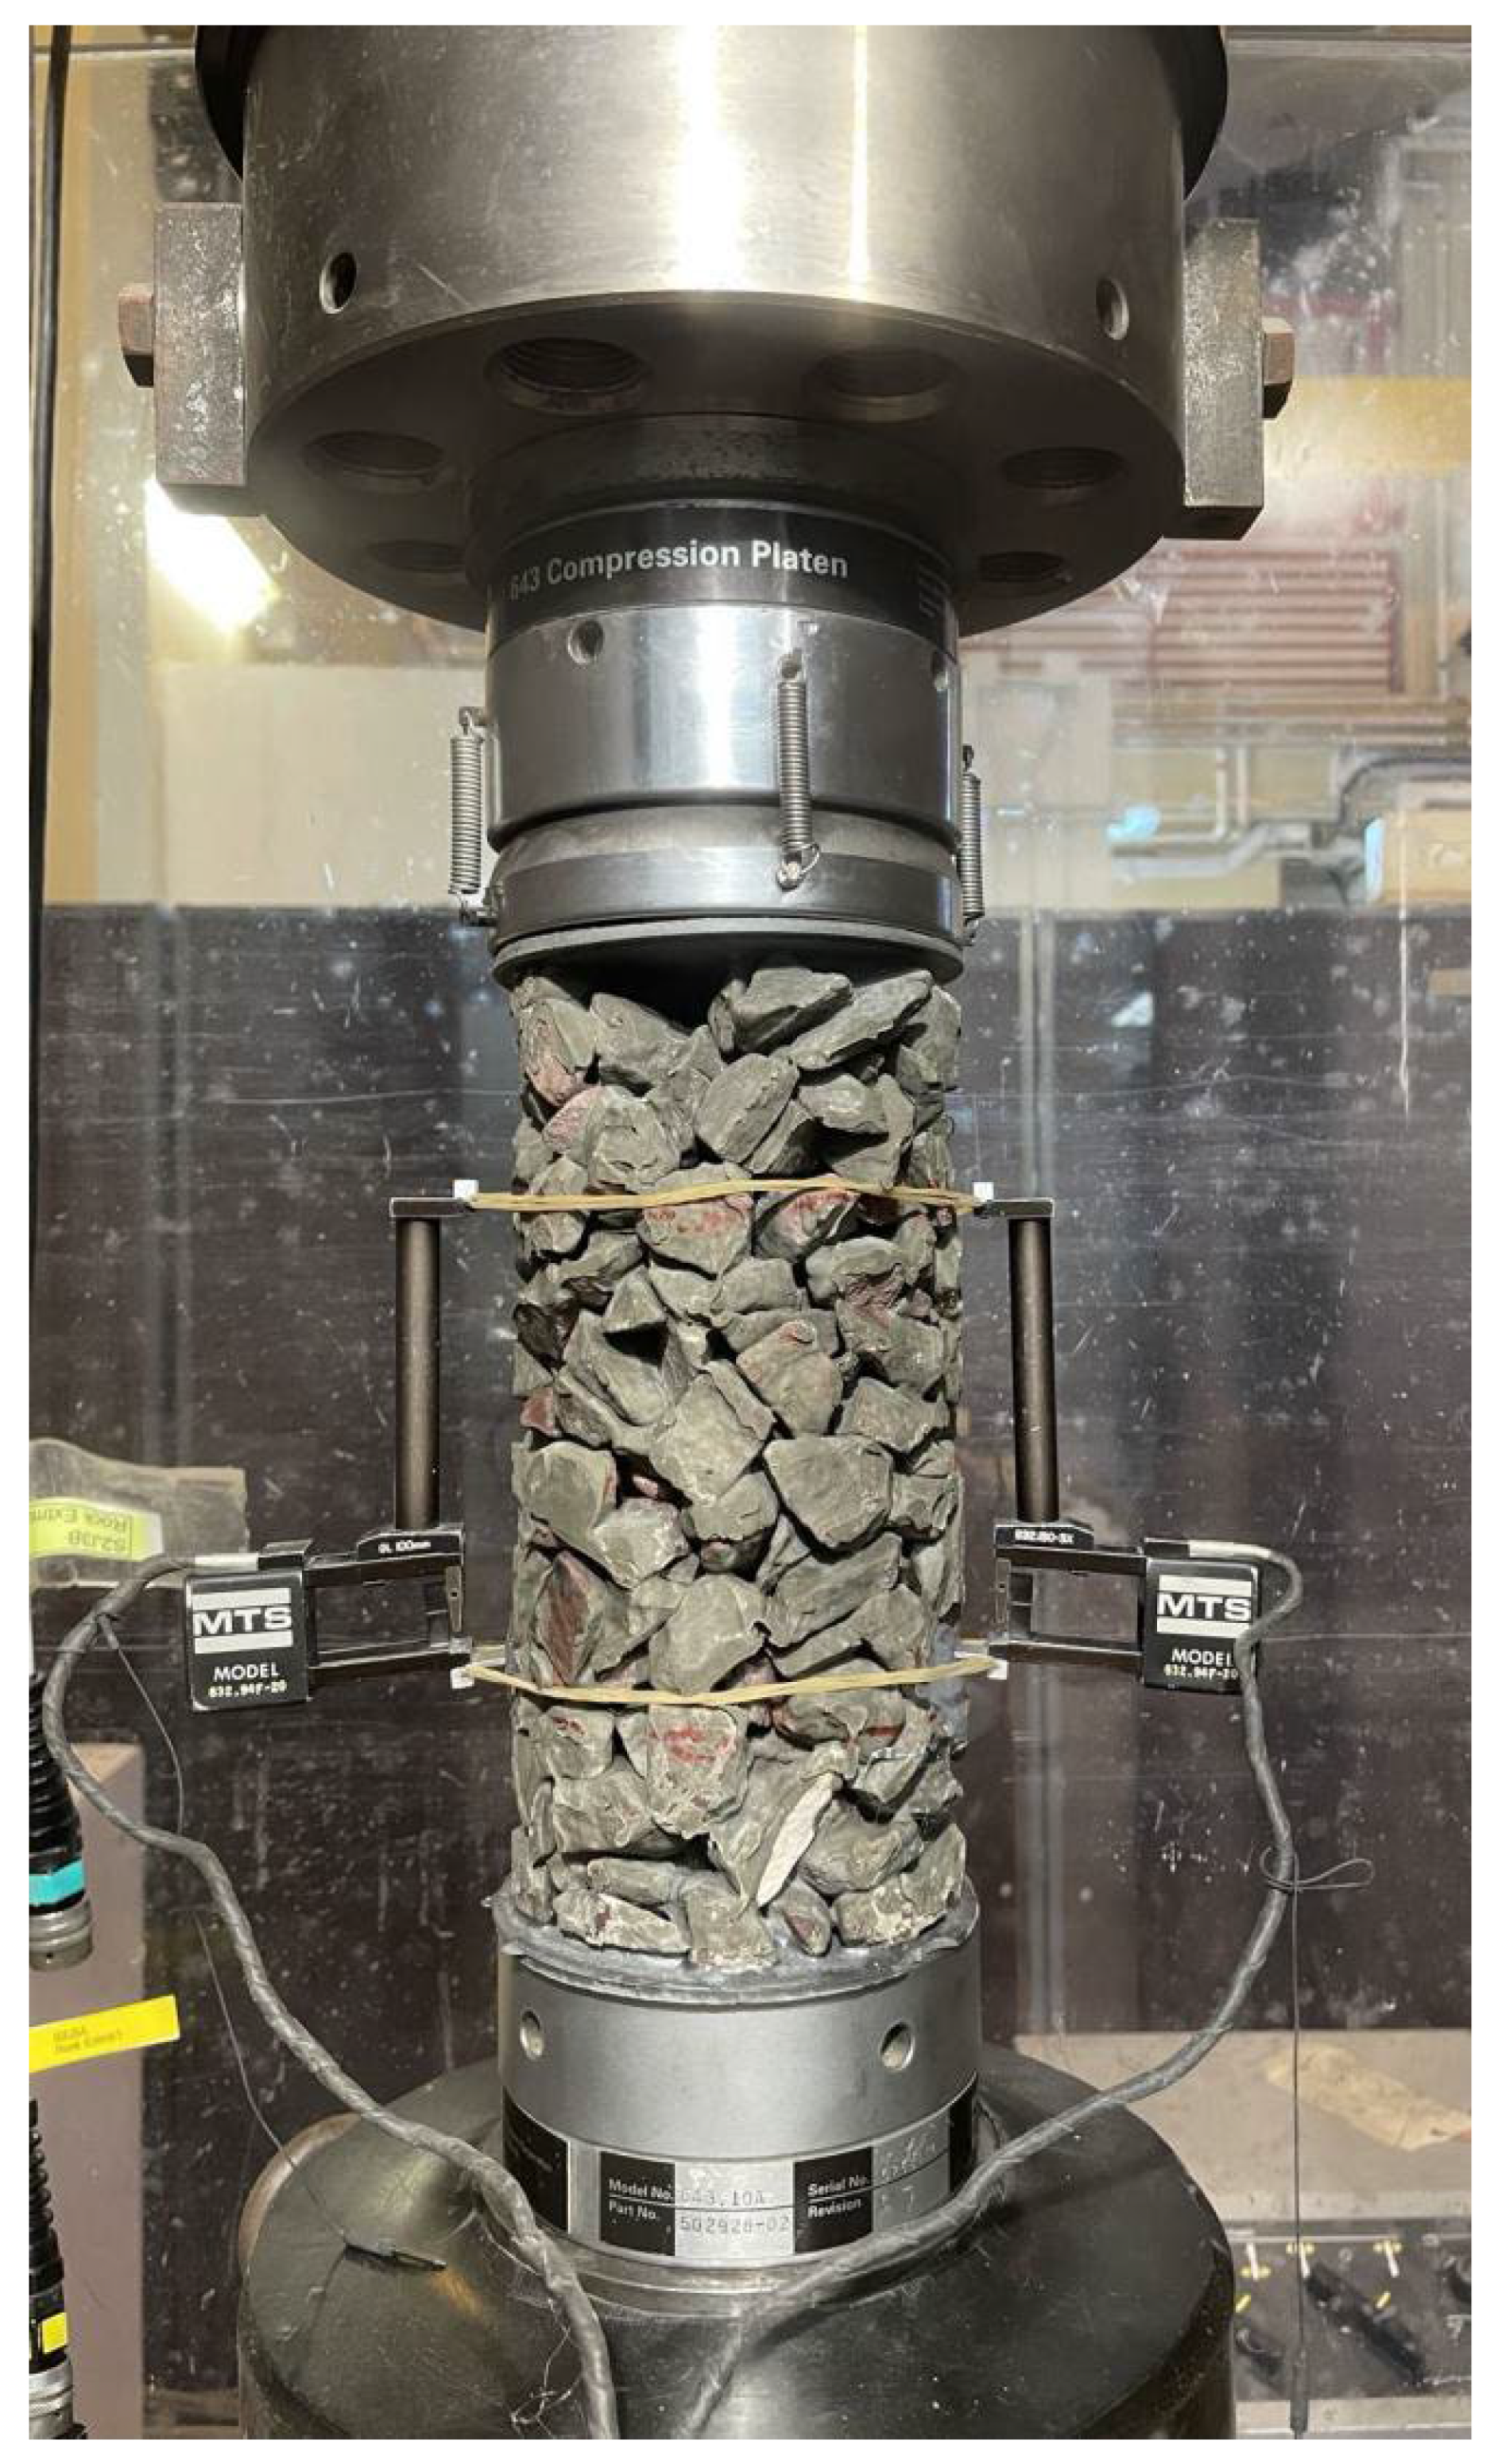
The MTS 815 testing system is used for the unconfined compression test, shown in Figure 5. The compression test is displacement-controlled with a displacement rate of 0.003 mm/min. Before loading, two local Linear Variable Differential Transformers (LVDTs) were fixed at the mid position on both specimen sides, with a global LVDT installed inside the testing machine. Axial stress and strain were measured in real-time to determine the ultimate compressive strength as the peak stress prior to failure. Samples were preloaded to 0.2 kN to ensure platen-specimen contact and minimize seating effects, followed by continuous compression until complete failure (ASTM D2166/D2166M-16 [40]).
For each filling ratio (10%, 20%, 30%, 40%, 50%, 60%, 80%, 90%, and 100%), five specimens of CGMs were prepared with randomly arranged aggregates, each subjected to an unconfined compressive strength test. Data analysis involved excluding outliers based on standard statistical criteria, with representative results used for mechanical property characterization.

2.3. Splitting Tensile Test

Tensile strength, as an important material parameter for evaluating the structural mechanical properties, is usually obtained through direct tensile tests or splitting tensile tests [41]. To achieve a more comprehensive understanding of the mechanical properties of CGM, tensile tests are necessary in addition to compressive tests. However, due to the irregularity of the CGM structure, only the splitting tensile test was conducted in this study. Splitting tensile tests were conducted using cylindrical specimens 100 mm × 200 mm prepared in the previous section, following ASTM C496/C496M-14 [28].
During the test, the load and the displacement were measured and recorded continuously, and the tensile strength of the material was calculated using the following formula:
T = 2 P π LD
where T is the splitting tensile strength, P is the load at failure, D is the diameter of the specimen, and L is the length of the specimen.
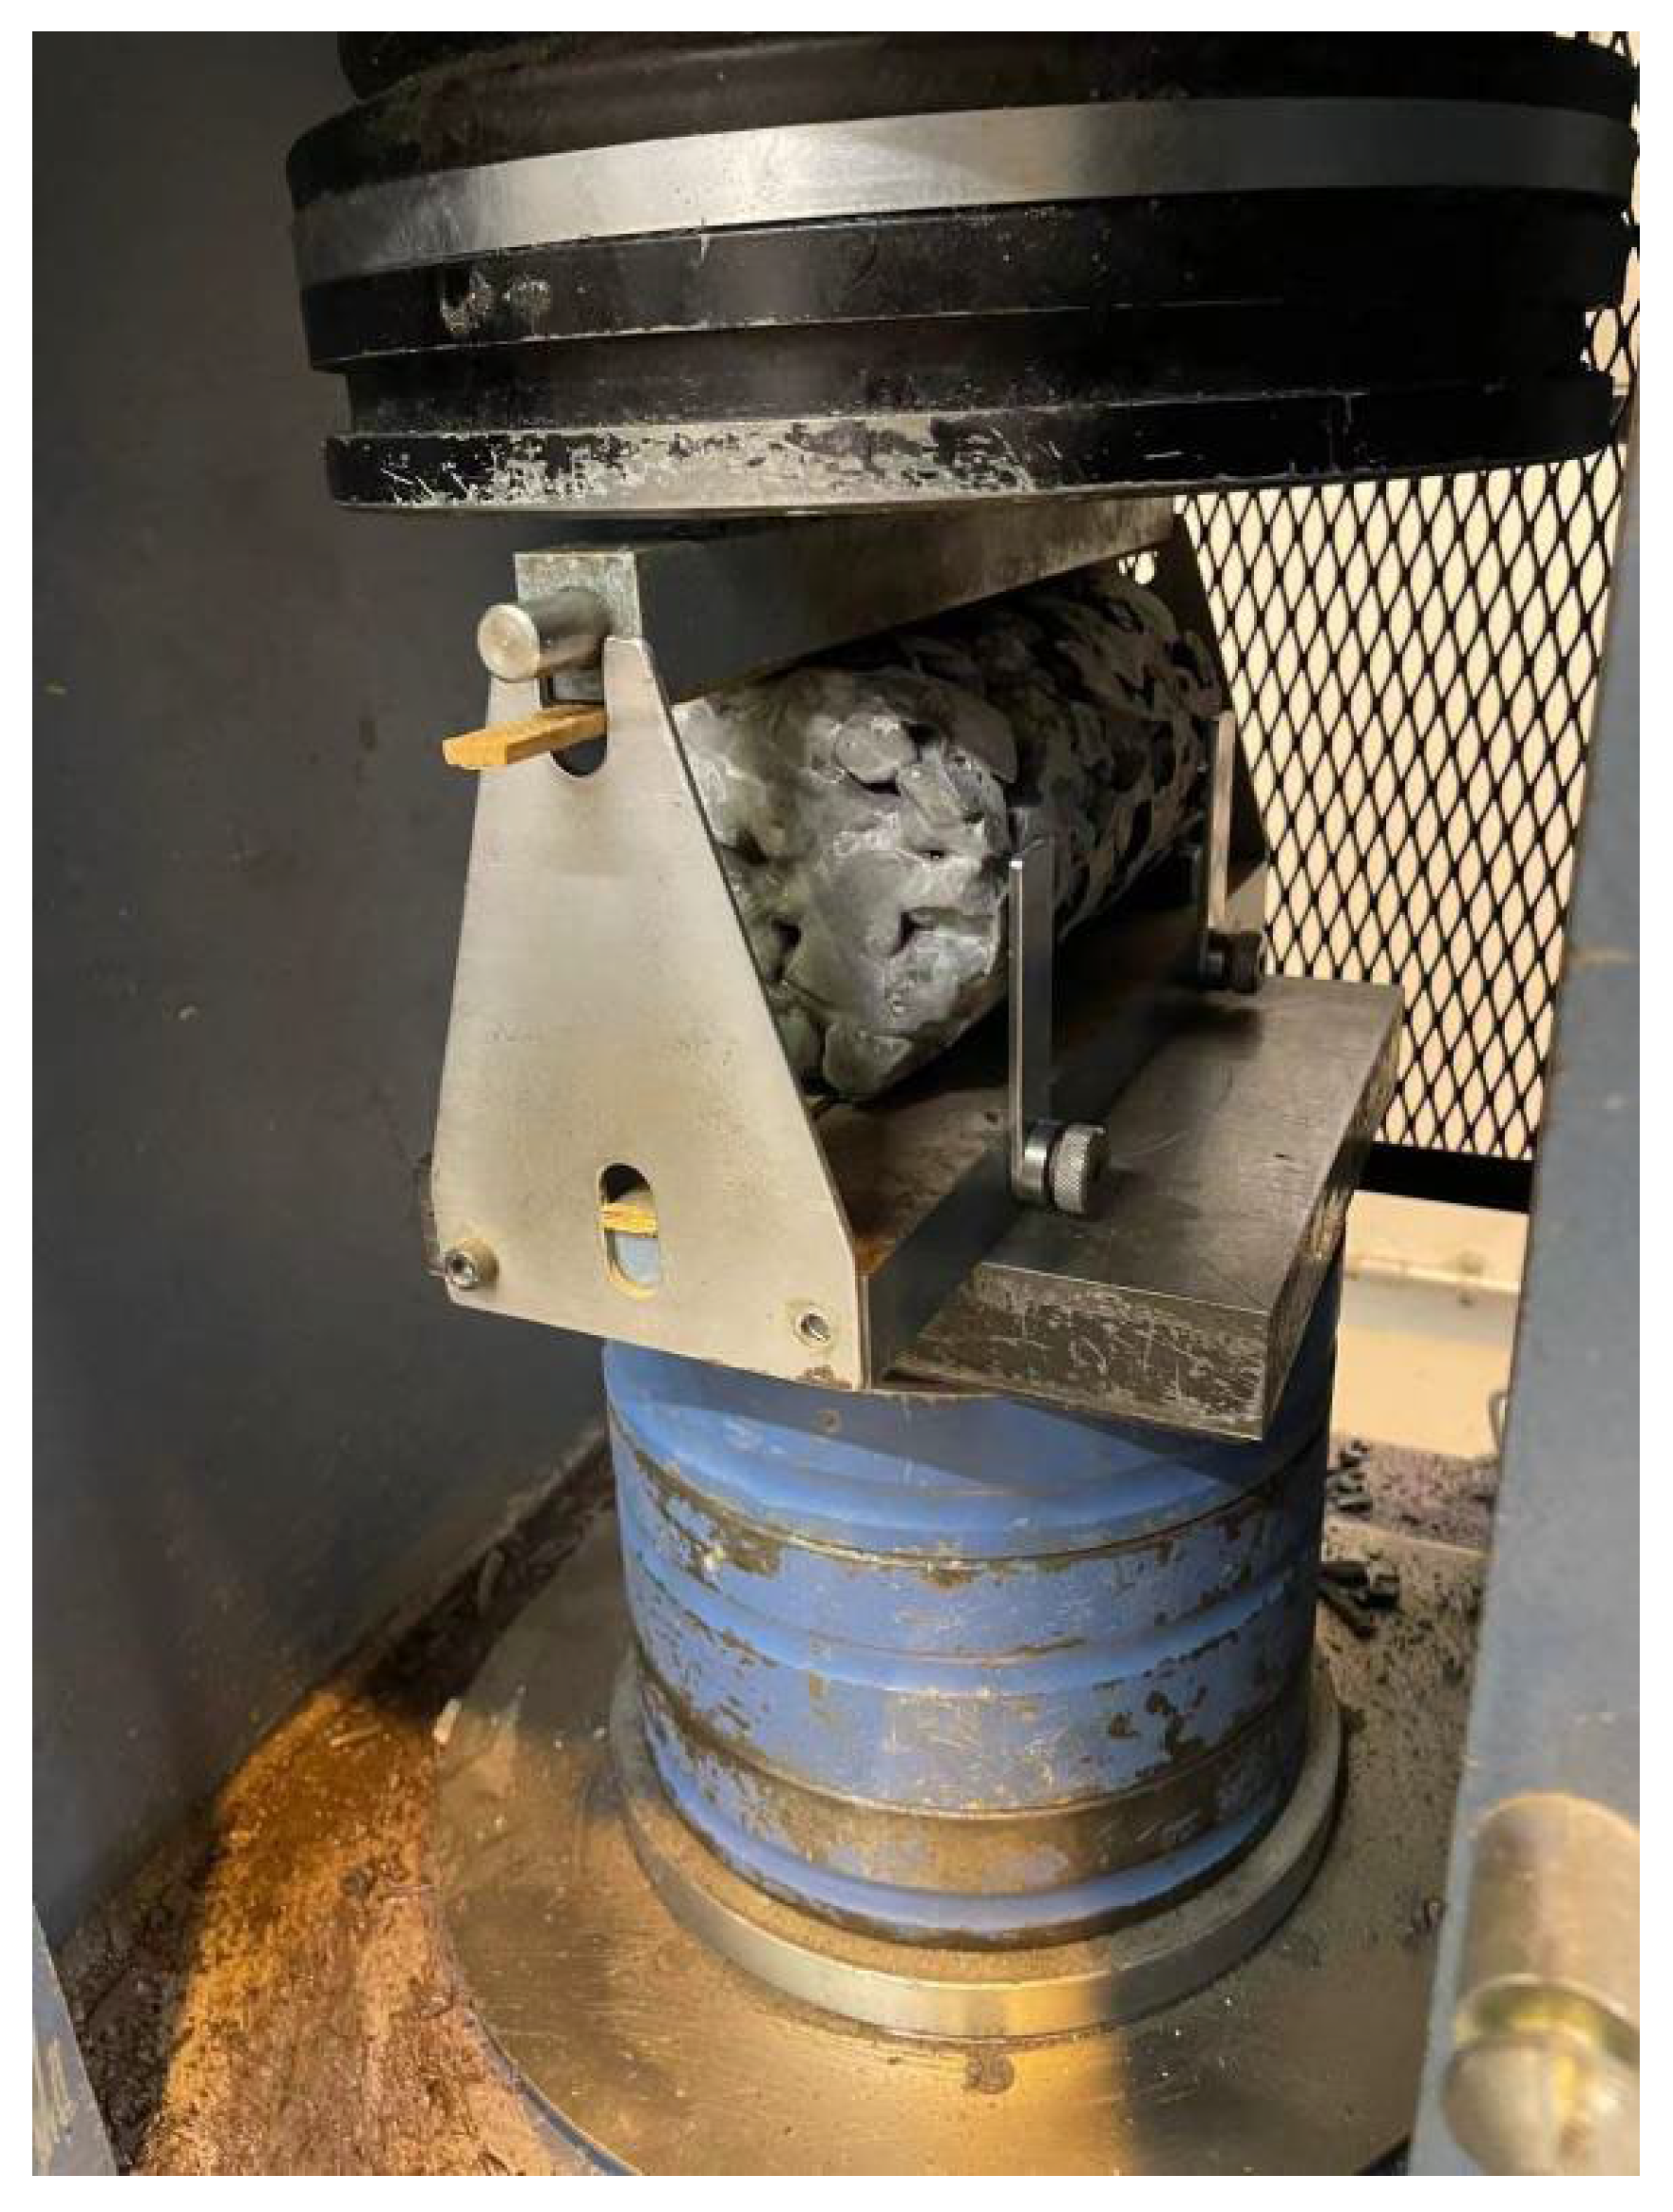
To ensure uniform force during the loading process, the specimen was fixed in the metal frame before loading, as shown in Figure 6. According to the specification, the loading rate is set to 1400 N/s.

3. Results

3.1. Unconfined Compressive Test

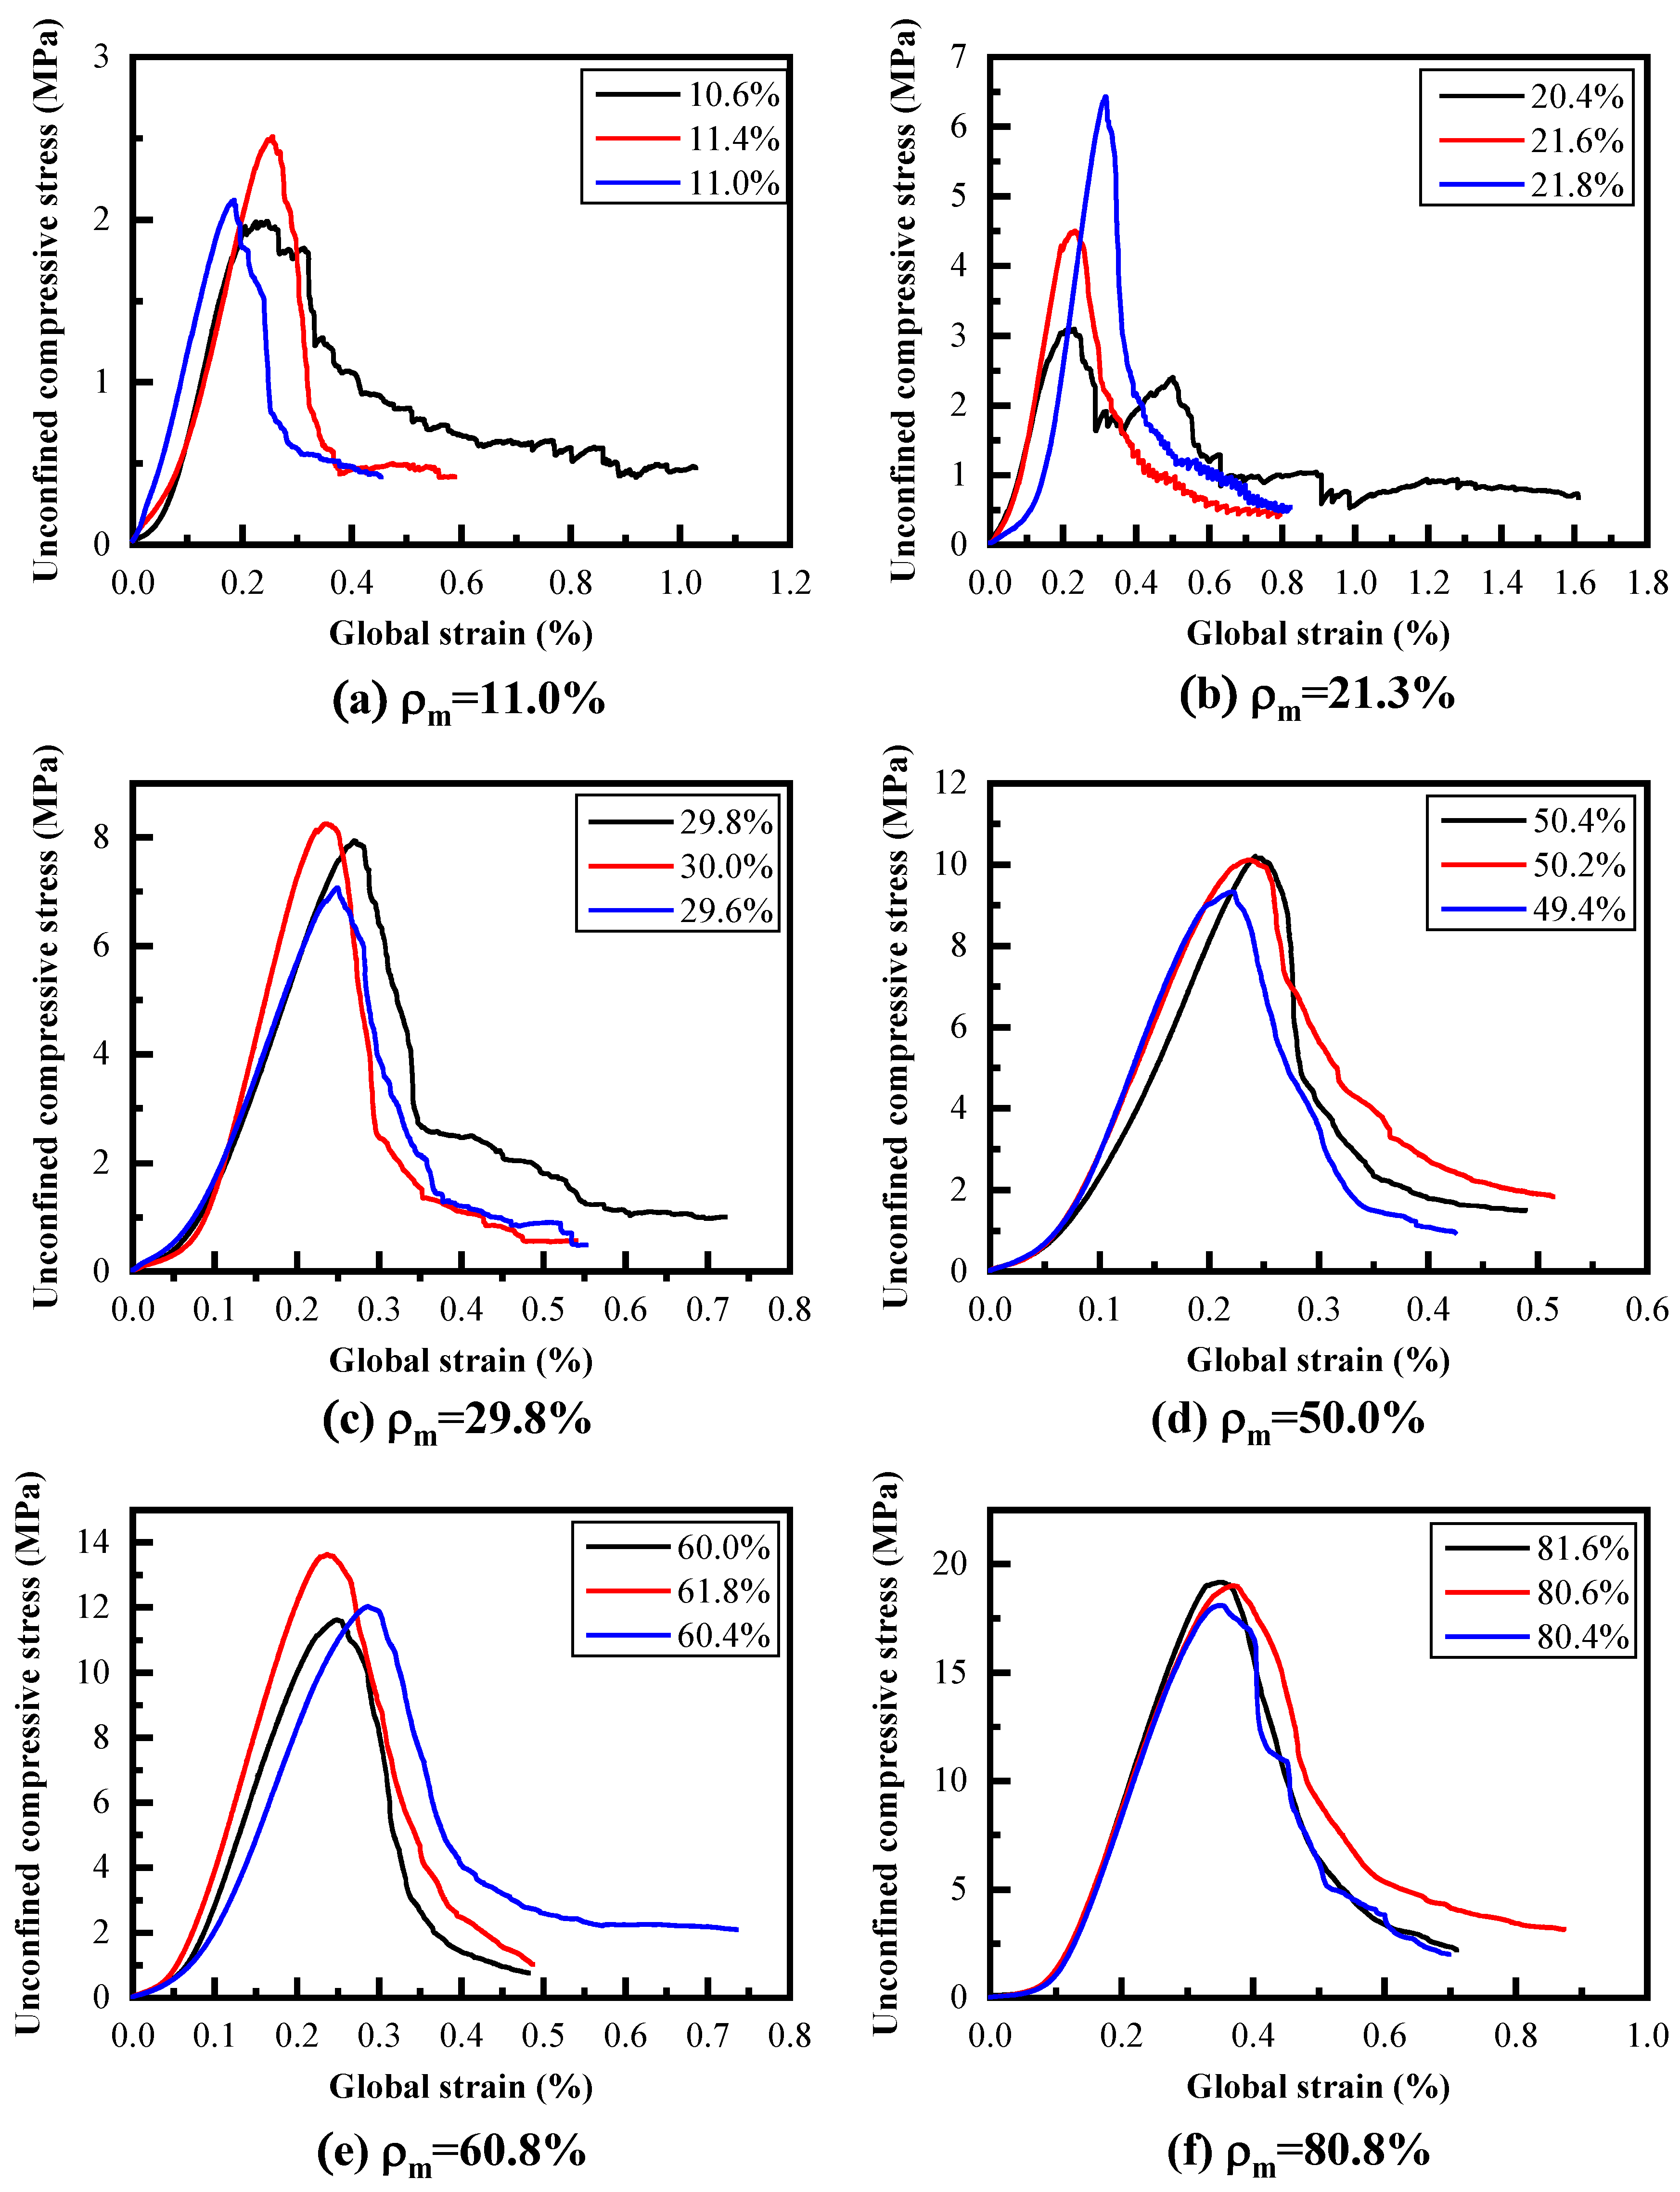
In Figure 7, the stress–strain curves of specimens with varying cement filling ratios are presented. Prior to reaching the peak stress, all curves exhibit a consistent trend: an initial nonlinear phase attributed to seating effects, followed by a linear elastic region. Notably, the 20% filling ratio specimens uniquely display a secondary stress peak–post-peak softening, a phenomenon not observed in other groups. We hypothesize that this behavior reflects the sequential mobilization of resistance mechanisms. The initial peak corresponds to the brittle rupture of the limited cement bridges (contact cementation). Following this rupture, the stress drops, but as the irregular aggregates shift, they likely engage in geometric interlocking and frictional contact, leading to a secondary rise in resistance (secondary peak). This phenomenon is characteristic of the transition zone where neither the cement network nor the granular skeleton fully dominates the initial stiffness. The 20% filling ratio is in a critical transition stage between contact cementation (≤10%—cement-only bonds at particle contact points) and partial compact cementation (≥30%—cement fills partial voids). In this stage, slight differences in aggregate arrangement or cement distribution (inevitable even with standardized sample preparation) can lead to localized cement bridges between non-adjacent particles. During loading, these bridges first fracture (causing initial post-peak softening), then the remaining aggregate–cement skeleton reconfigures and bears the load temporarily (forming the secondary stress peak). This is an intrinsic reflection of structural heterogeneity at the transition of cementation states rather than experimental error. In contrast, specimens with lower cement matrix contents (≤10%) undergo abrupt brittle failure after peak stress, whereas higher filling ratios (≥30%) exhibit progressive strain-softening without distinct secondary peaks, indicative of more ductile behavior.
As the filling ratio of the cemented matrix increases to 30%, the unconfined compressive strength of CGM specimens is approximately 7.7 MPa, and the residual strength also increases. There is strain softening observed in the stress–strain curve after the peak, as the stress continues to decrease with the increase in displacement until it ultimately fails. The role of the cement matrix as a force transmission and support structure becomes increasingly apparent as its content increases. The stress–strain curve of the specimen with 50% cementation shows strengths of 9.33 MPa, 10.11 MPa, and 10.5 MPa, respectively. The variation trend of the stress–strain curve is roughly similar to that of the 30% samples, undergoing a nonlinear concave phase (compaction stage), linear elastic phase, and non-brittle fracture stage after the peak. As the filling rate continues to increase, the compressive strength of CGM specimens significantly improves. When the cement matrix filling rate reaches 80%, the specimens exhibit a compressive strength of 18 MPa. Moreover, as the filling rate varies from 10% to 80%, the peak strain of the specimens increases, which will be discussed in detail in the following section. By comparing the post-peak curves, it can be observed that the specimens exhibit increasing ductility.
At low cementation level, the stress–strain curves have significant variation among various samples, comparing specimens with 11% vs. 21.3% cement filling ratios (Figure 7a,b). As the cement filling ratio increases, the dispersion of stress–strain curves of specimens gradually decreases, and the variation in stress–strain curves of specimens with the same cementation amount tends to become more consistent. This effect is particularly noticeable when the cement filling ratio exceeds 80% (Figure 7f). As the cement matrix fills the voids of the CGM, the cementation structure tends to become more coherent, and its mechanical properties become increasingly similar to those of conventional concrete structures. It is worth noting that at 100% filling, the material conceptually converges with “Rock-Filled Concrete”. However, unlike conventional concrete, where aggregates are suspended in a mortar matrix (matrix-supported), the gravity-grouting method ensures a clast-supported structure where the granular skeleton maintains point-to-point contacts. Thus, even at full saturation, the material retains the mechanical signature of a cemented granular assembly.
The observed reduction in the dispersion of stress–strain curves with increasing cement filling ratio can be attributed to the transition in the load-transfer mechanism and the homogenization of the mesostructure. At low filling ratios, the material behaves primarily as a granular medium. Load transmission is governed by discrete “force chains” formed through particle-to-particle contacts. The formation and stability of these force chains are stochastic and highly sensitive to the local packing arrangement and the random distribution of cement bridges. Consequently, minor variations in the initial particle arrangement during fabrication lead to significant fluctuations in macroscopic mechanical response, resulting in high data dispersion. As the filling ratio increases, particularly beyond the percolation threshold of 80%, the cement paste forms a continuous, percolating matrix that fills the interstitial voids. This matrix acts as a load-redistribution medium, allowing stress to diffuse through the bulk material rather than being channeled solely through discrete contact points. The continuous matrix mitigates the effects of local packing heterogeneities by bridging weak zones and homogenizing the stress field. Theoretically, this signifies that the specimen size increasingly satisfies the representative volume element (RVE) requirements for the composite, leading to statistically consistent mechanical properties and reduced variance among samples.
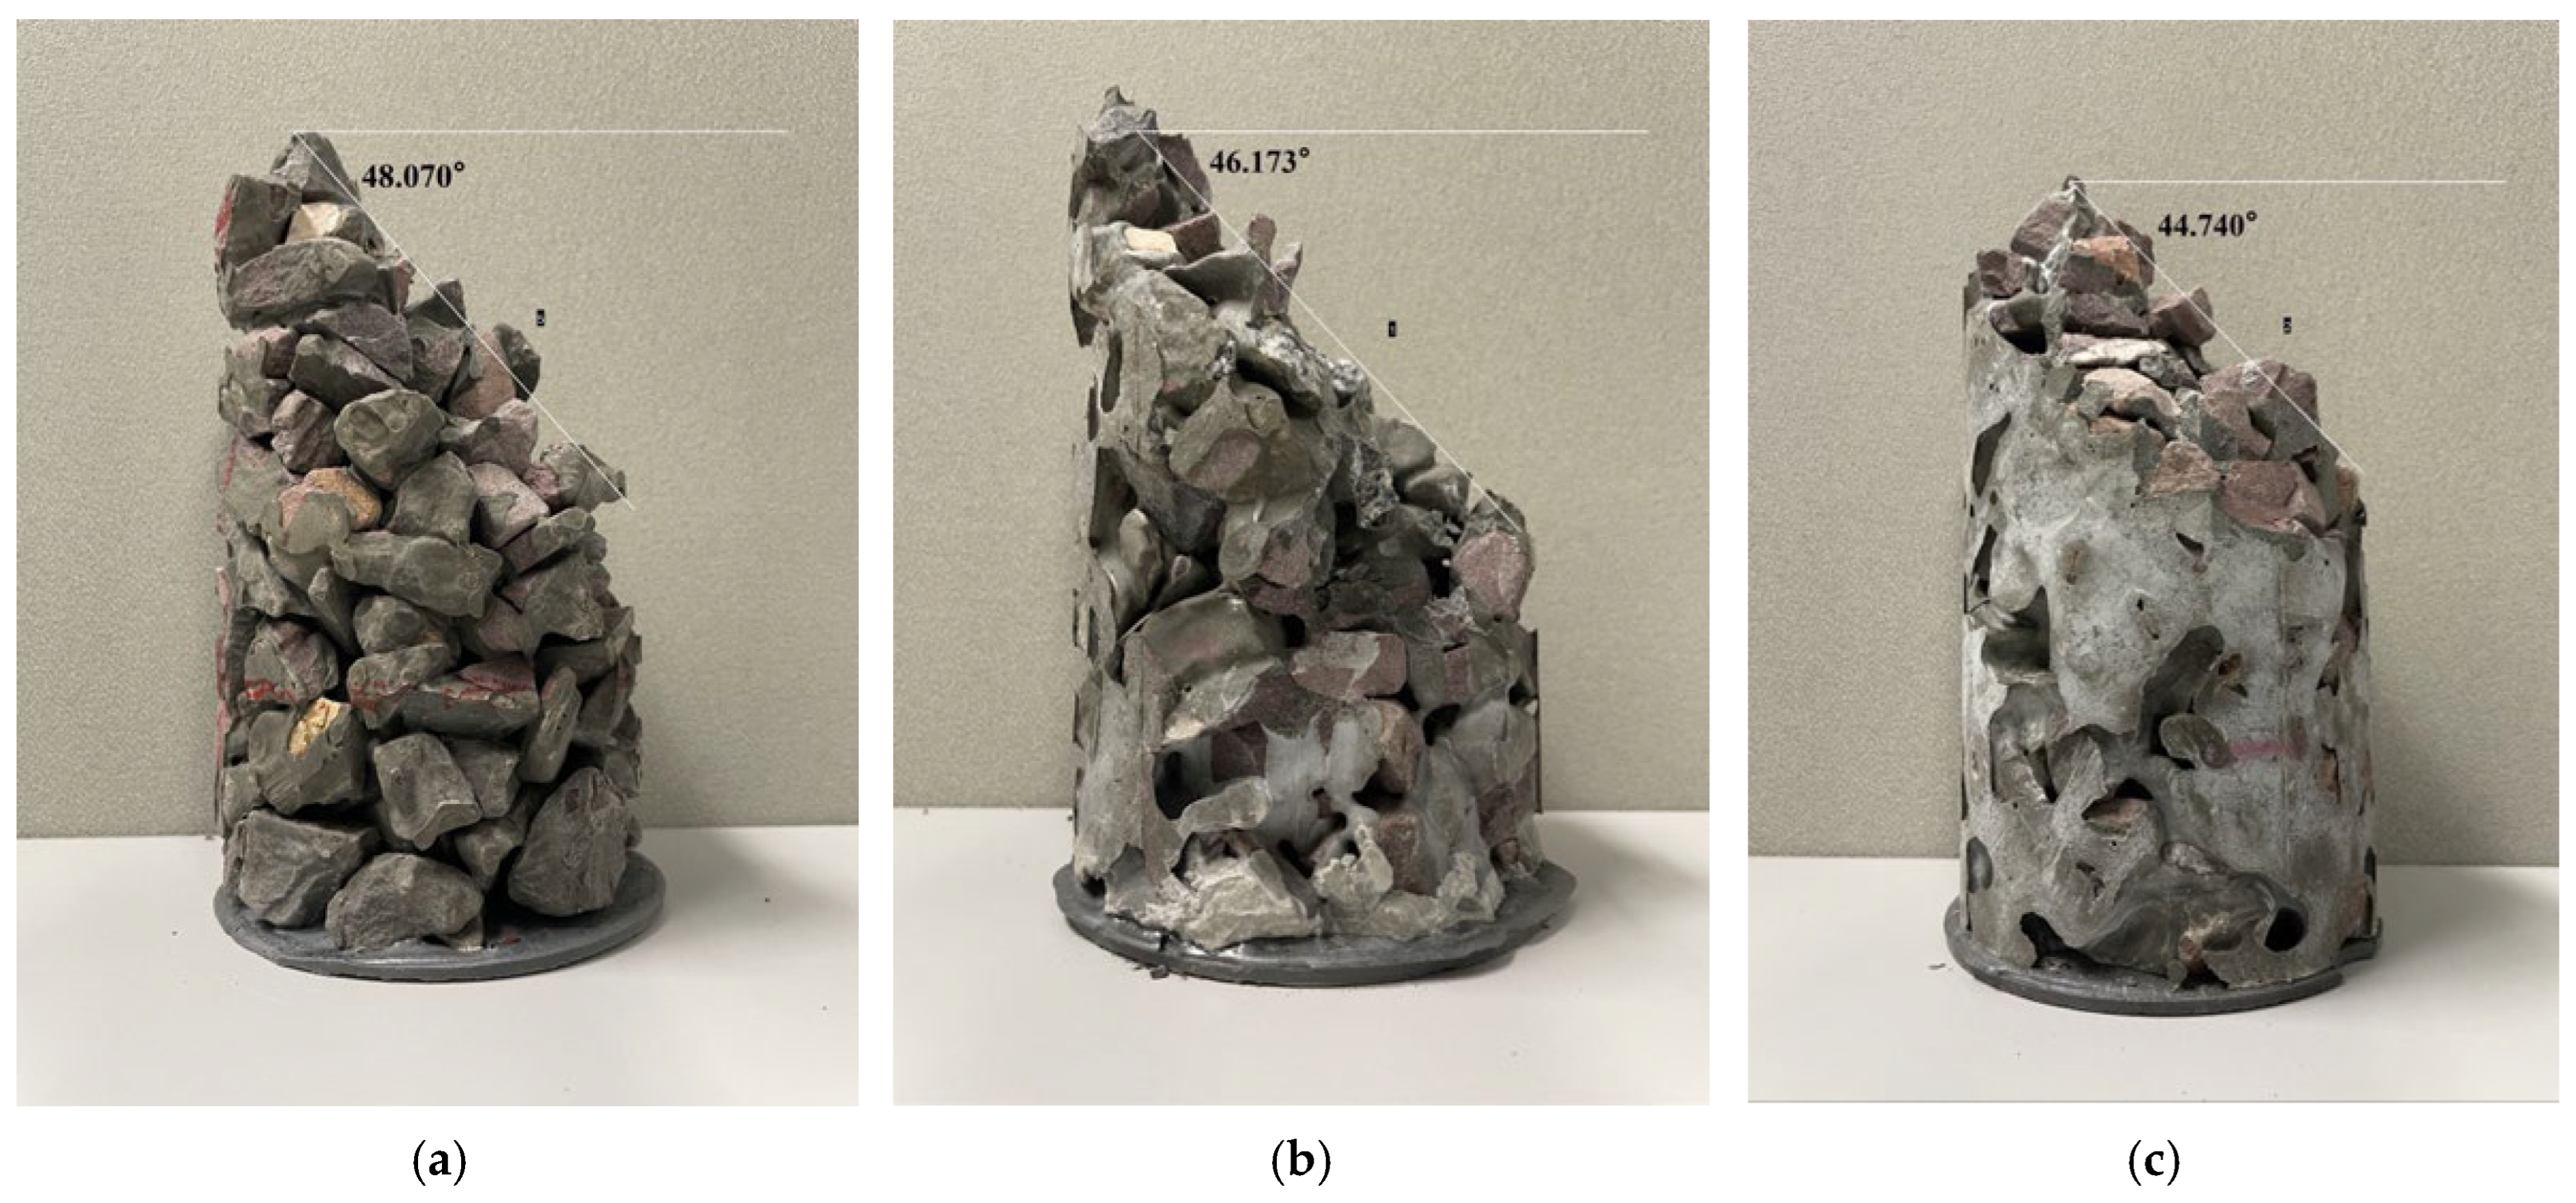
Figure 8 illustrates the post-failure condition of CGM specimens with different cement filling ratios. Based on the degree of cementation, they can be categorized as contact cementation (Figure 8a) for a corresponding filling ratio of 10%, partially contacted and partially compact cementation (Figure 8b) for a filling ratio of 30%, and compact cementation (Figure 8c) for a filling ratio of 80%. This further confirms that as the degree of cementation increases, the overall uniformity of the specimens improves, resulting in reduced variability in their mechanical behavior. The cross-section of the specimen after failure primarily exhibits cement matrix fractures, without noticeable rock breakage. Contrary to the initial observation of “similar fracture angles”, detailed measurements of post-failure specimens reveal a clear trend: the fracture angle increases with decreasing cementation. Specifically, the fracture angle is approximately 48.07° at a 10% filling ratio (Figure 8a), 46.17° at a 30% filling ratio (Figure 8b), and 44.74° at an 80% filling ratio (Figure 8c). This trend aligns with the physical mechanism that aggregates are more mobilized during loading at lower cementation levels. At low cement filling ratios (e.g., 10%), cement only forms discrete bonds at aggregate contact points, and the granular skeleton dominates load transfer. When loaded, the weak contact bonds rupture first, allowing aggregates to slide and rotate freely (i.e., higher mobilization), which causes the failure plane to deviate from the ideal 45° shear angle (typical for matrix-dominated failure) and form a larger angle. As the cement filling ratio increases, the continuous cement matrix binds aggregates tightly, restricting their mobilization; the failure mechanism shifts to shear fracture of the cement matrix, and the fracture angle gradually approaches the theoretical 45° shear angle.

3.2. Splitting Tensile Test

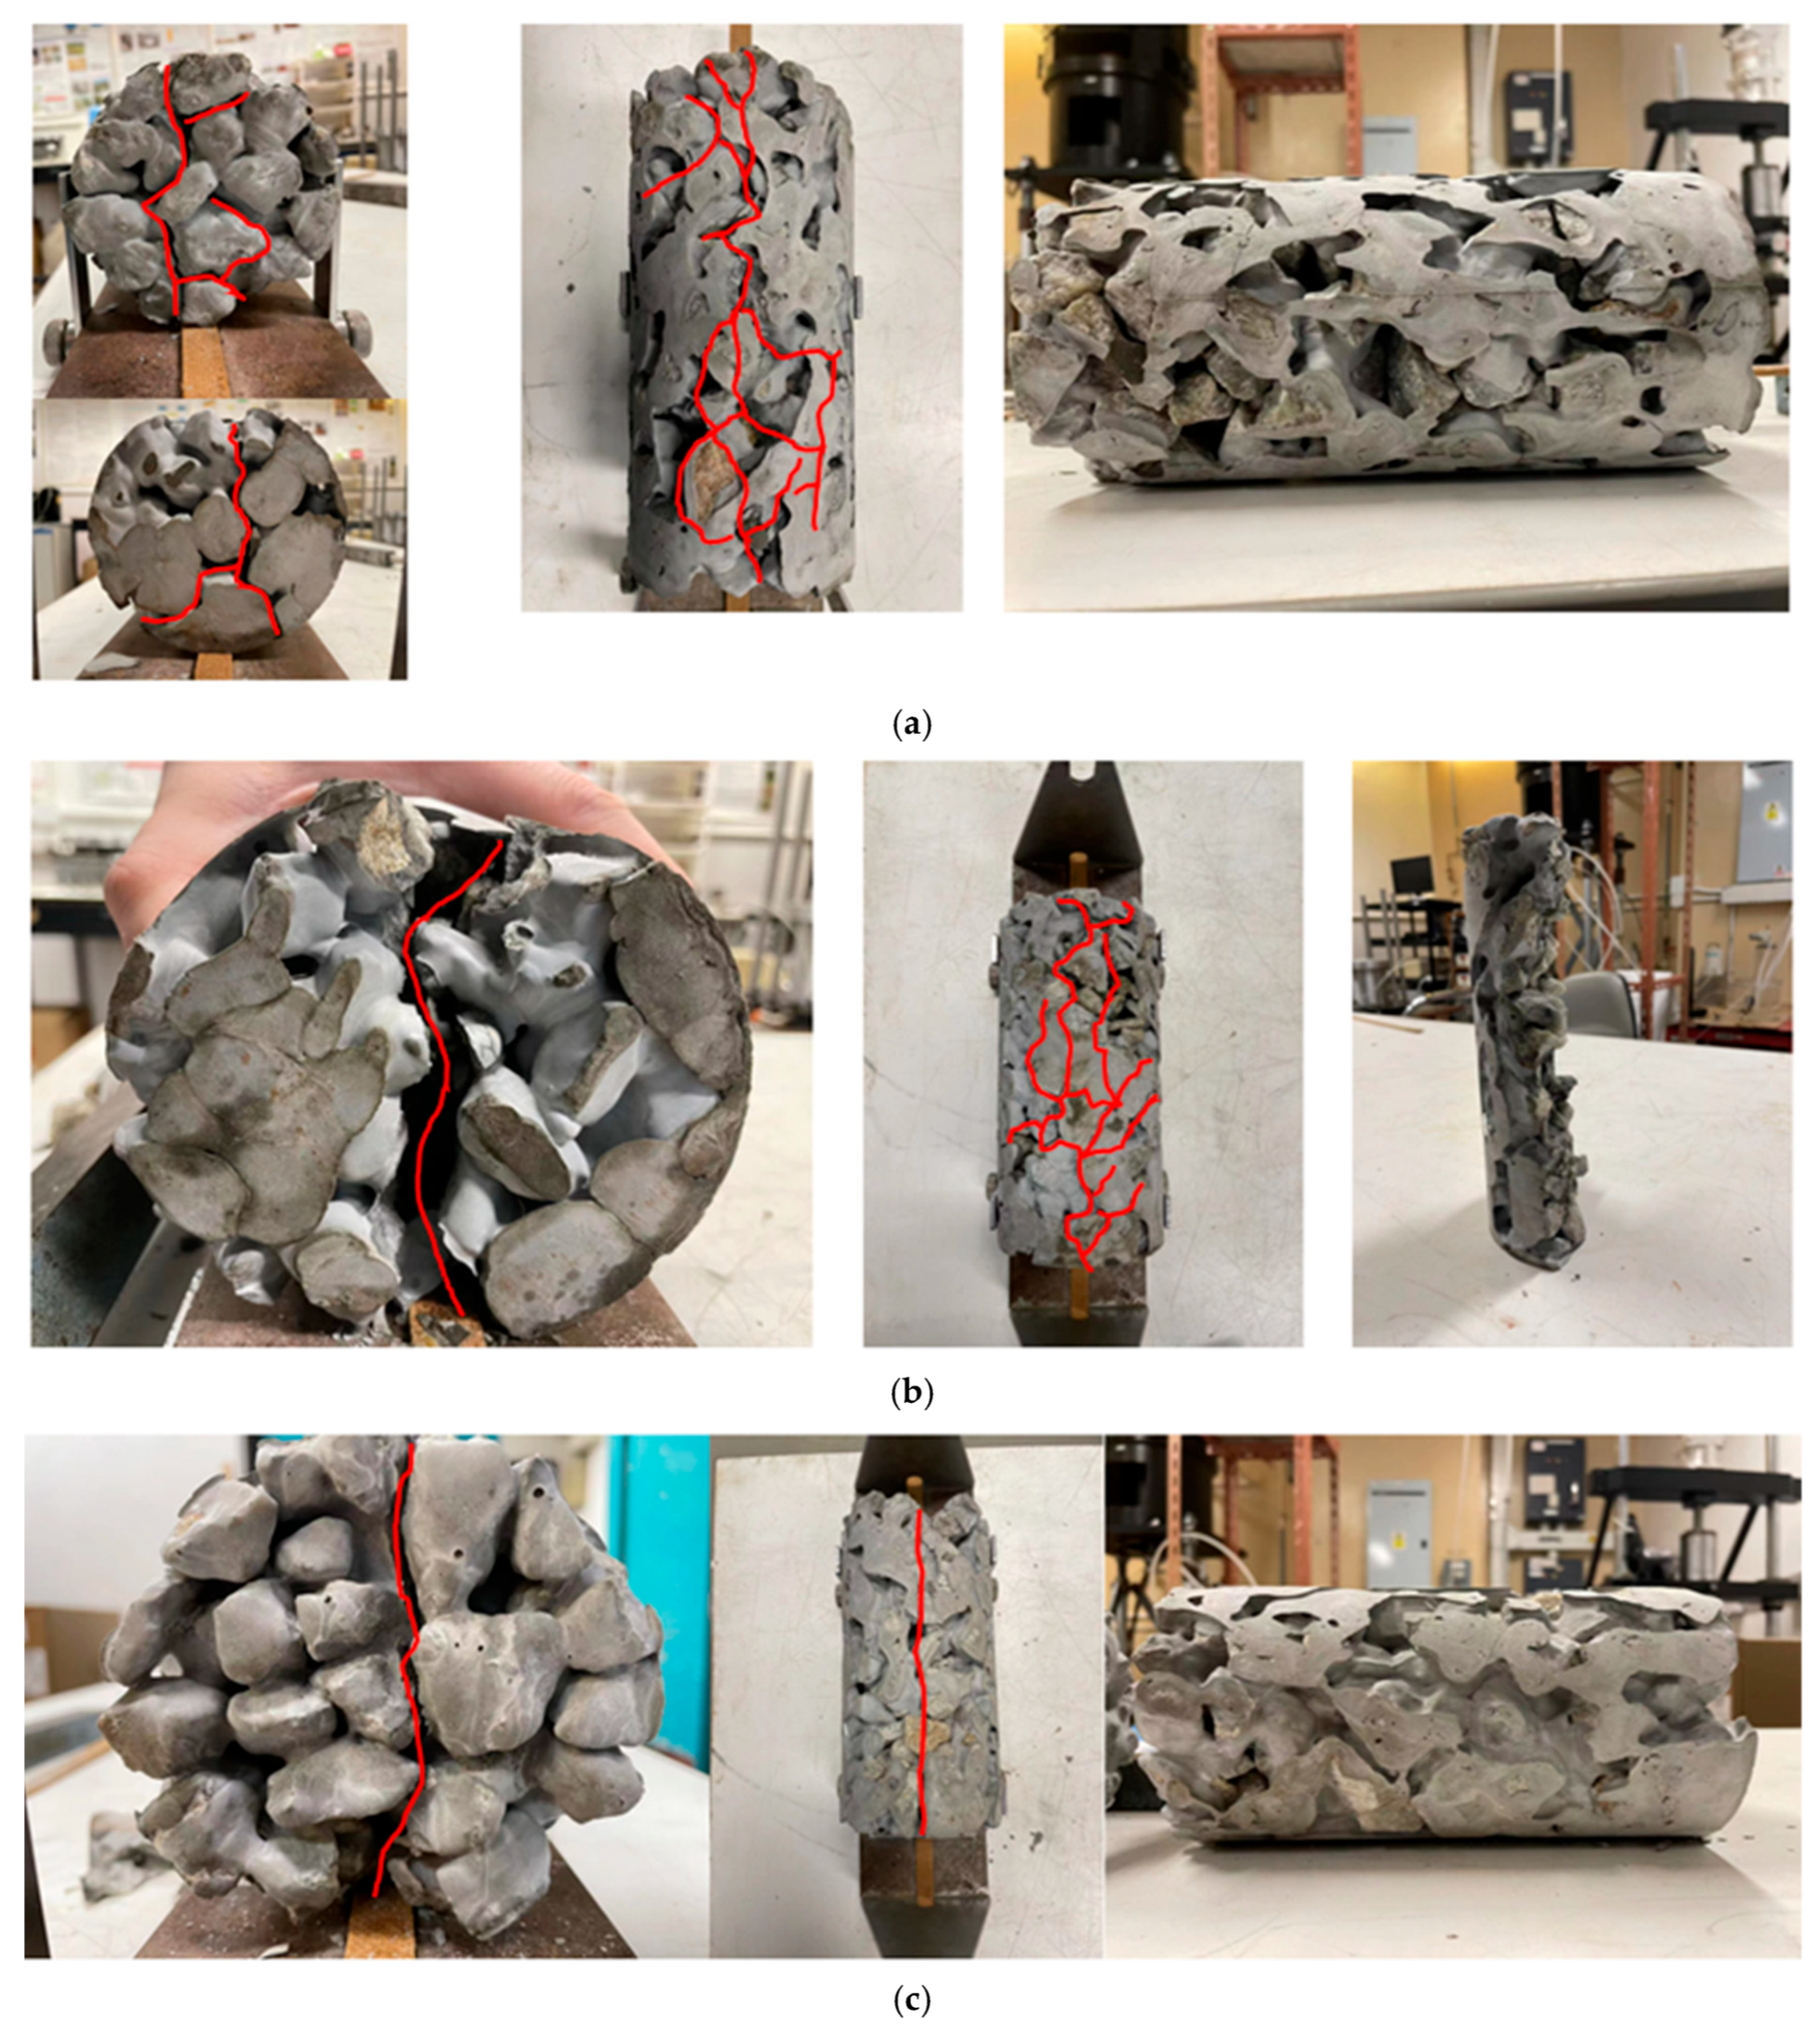
In the splitting tensile test, only the peak load can be recorded, and the stress–strain relationship cannot be reliably recorded. As a result, the mechanical behavior can only be analyzed based on the condition of the specimen after it has been destroyed (as shown in Figure 9). The photos reveal that when the specimen undergoes split tensile failure, cracks originate from the middle portion and propagate throughout the entire specimen. Ultimately, the specimen is split into two parts.
When the ratio of cementation is low (filling ratio ≤ 50%), the development of cracks is diffusive due to the interlocking and friction between aggregates. The irregular distribution of aggregates and uneven distribution of cementation result in irregular crack development along the bond. The dispersed cracks propagate and eventually lead to the failure of the specimen. As the cementation filling ratio increases, reaching 60% as depicted in Figure 9c, the fracture of the specimen becomes a well-defined plane, resembling that of conventional concrete specimens. The fracture surface reveals that failure occurs not only in the cementing material but also in the rock. In the splitting tensile test, the CGM did not exhibit the ductility displayed in the compressive test. The rapid fracture of the specimen under loading confirms that CGM is a brittle material that has strong resistance to compression but not to tension, similar to traditional materials such as concrete.
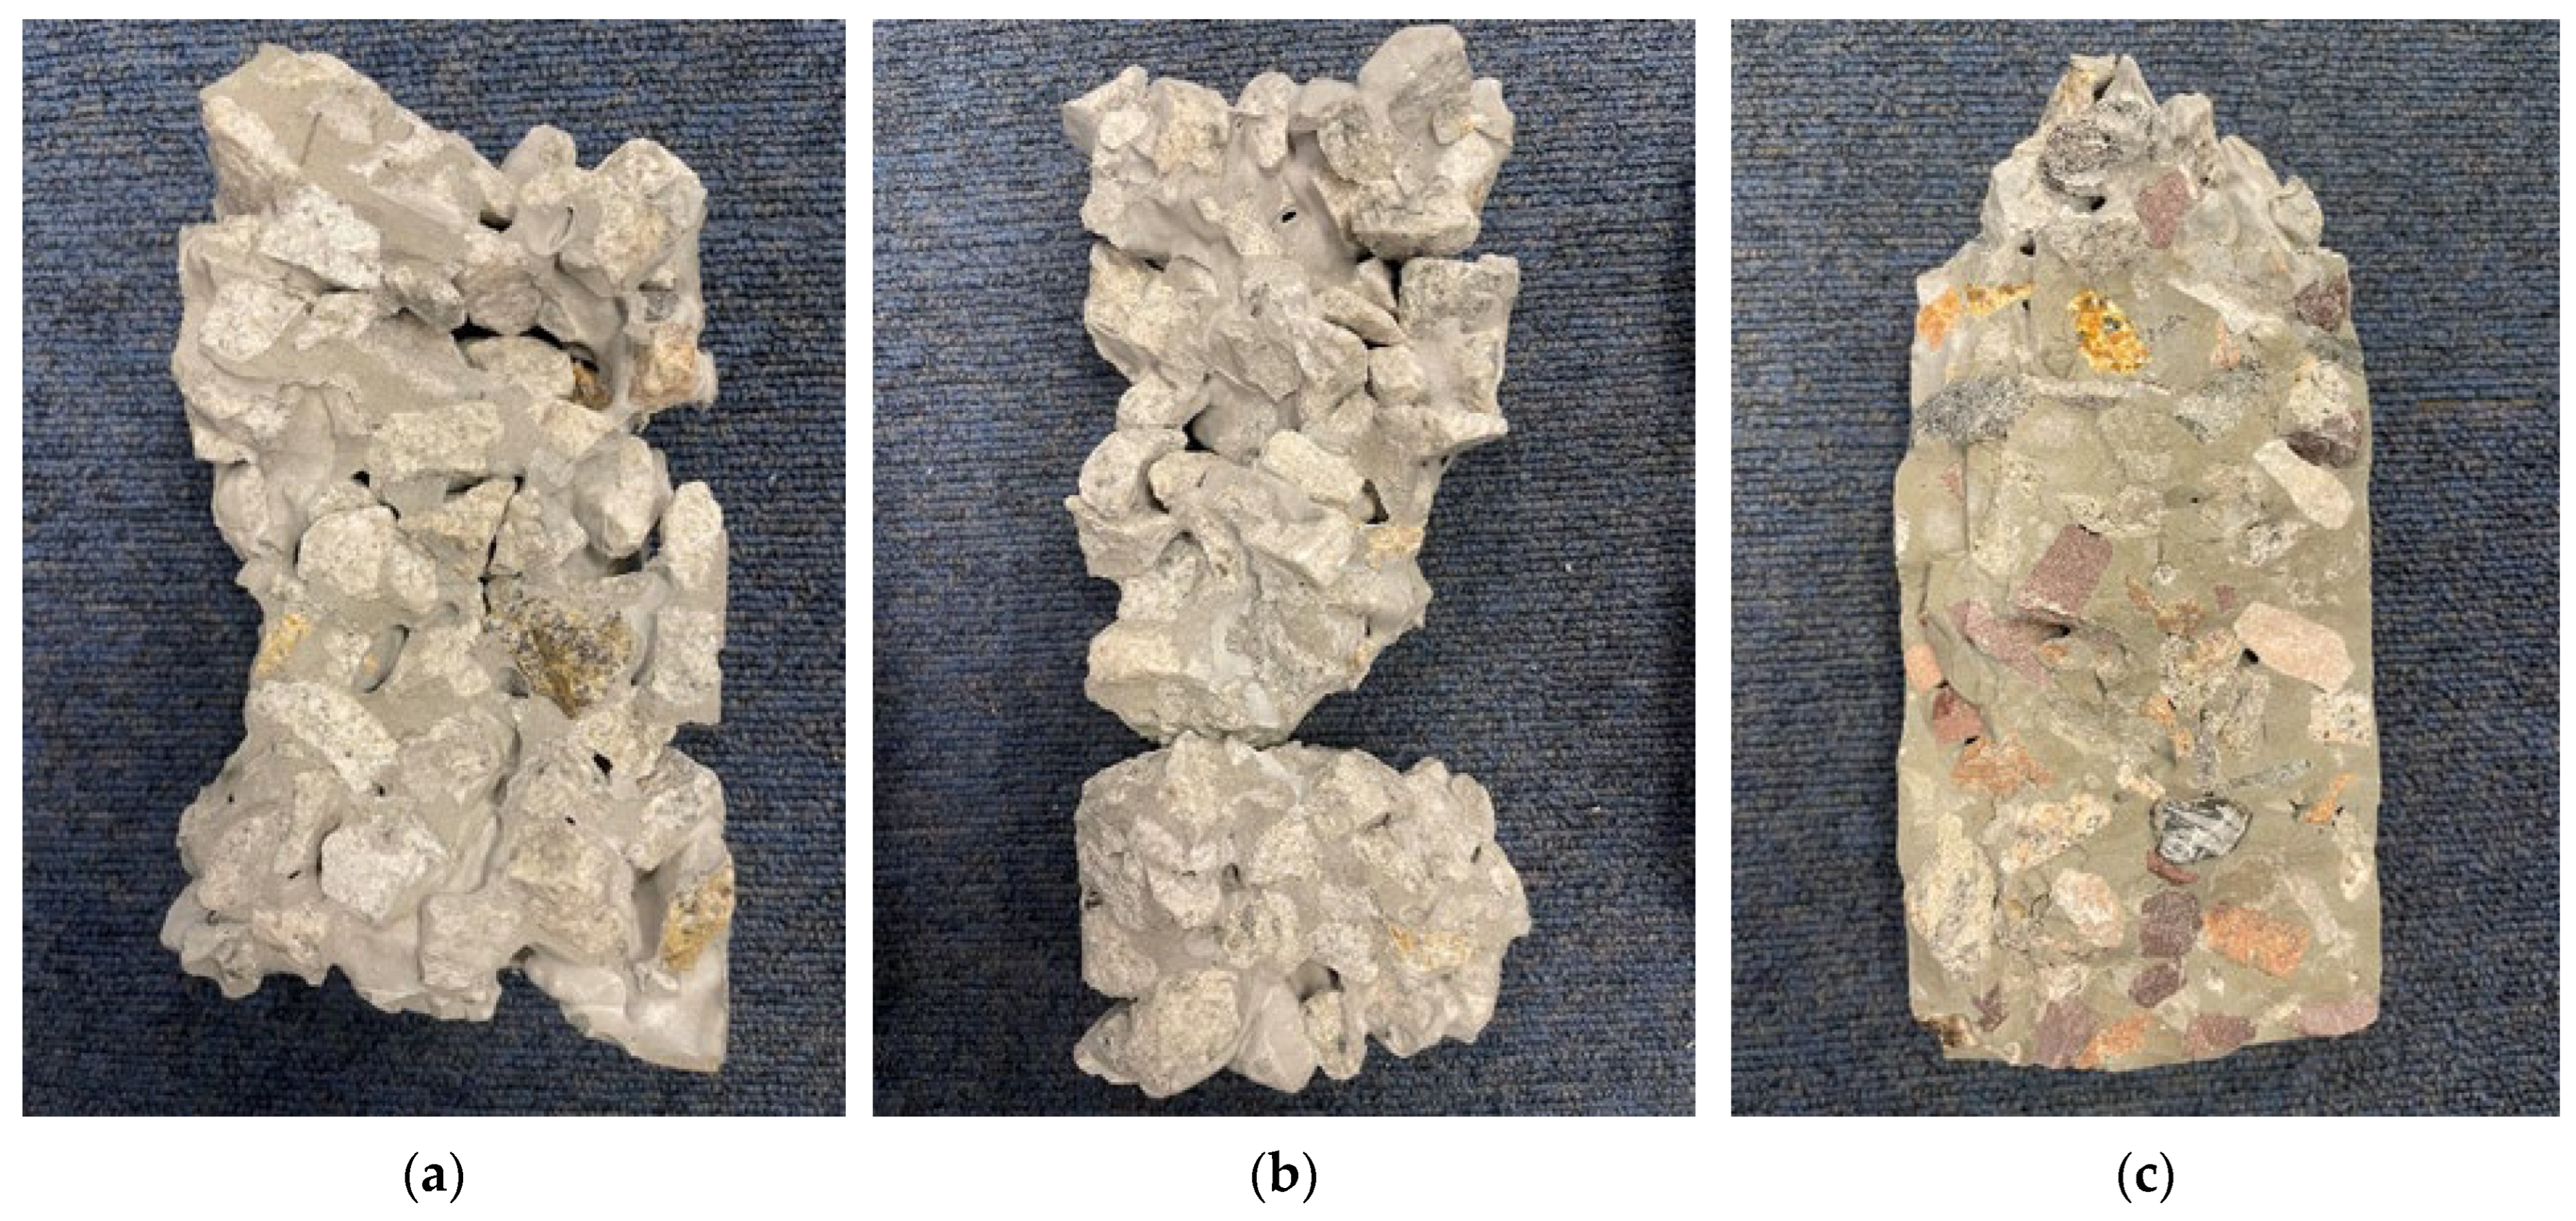
Figure 10 displays the failure mode of the CGM specimens after the split tensile test. Unlike the failure observed in the unconfined compressive test, the splitting occurs not only within the cement matrix but also results in rock fracturing. This indicates that crack development does not solely occur within a single material but simultaneously involves both the aggregate and the cement matrix. The cross-sections of CGMs with different filling levels exhibit various irregular discontinuities, as shown in the figure, which corroborate the previously mentioned partially contact and partially compact characteristic of CGMs.

4. Discussion

4.1. Unconfined Compressive Strength

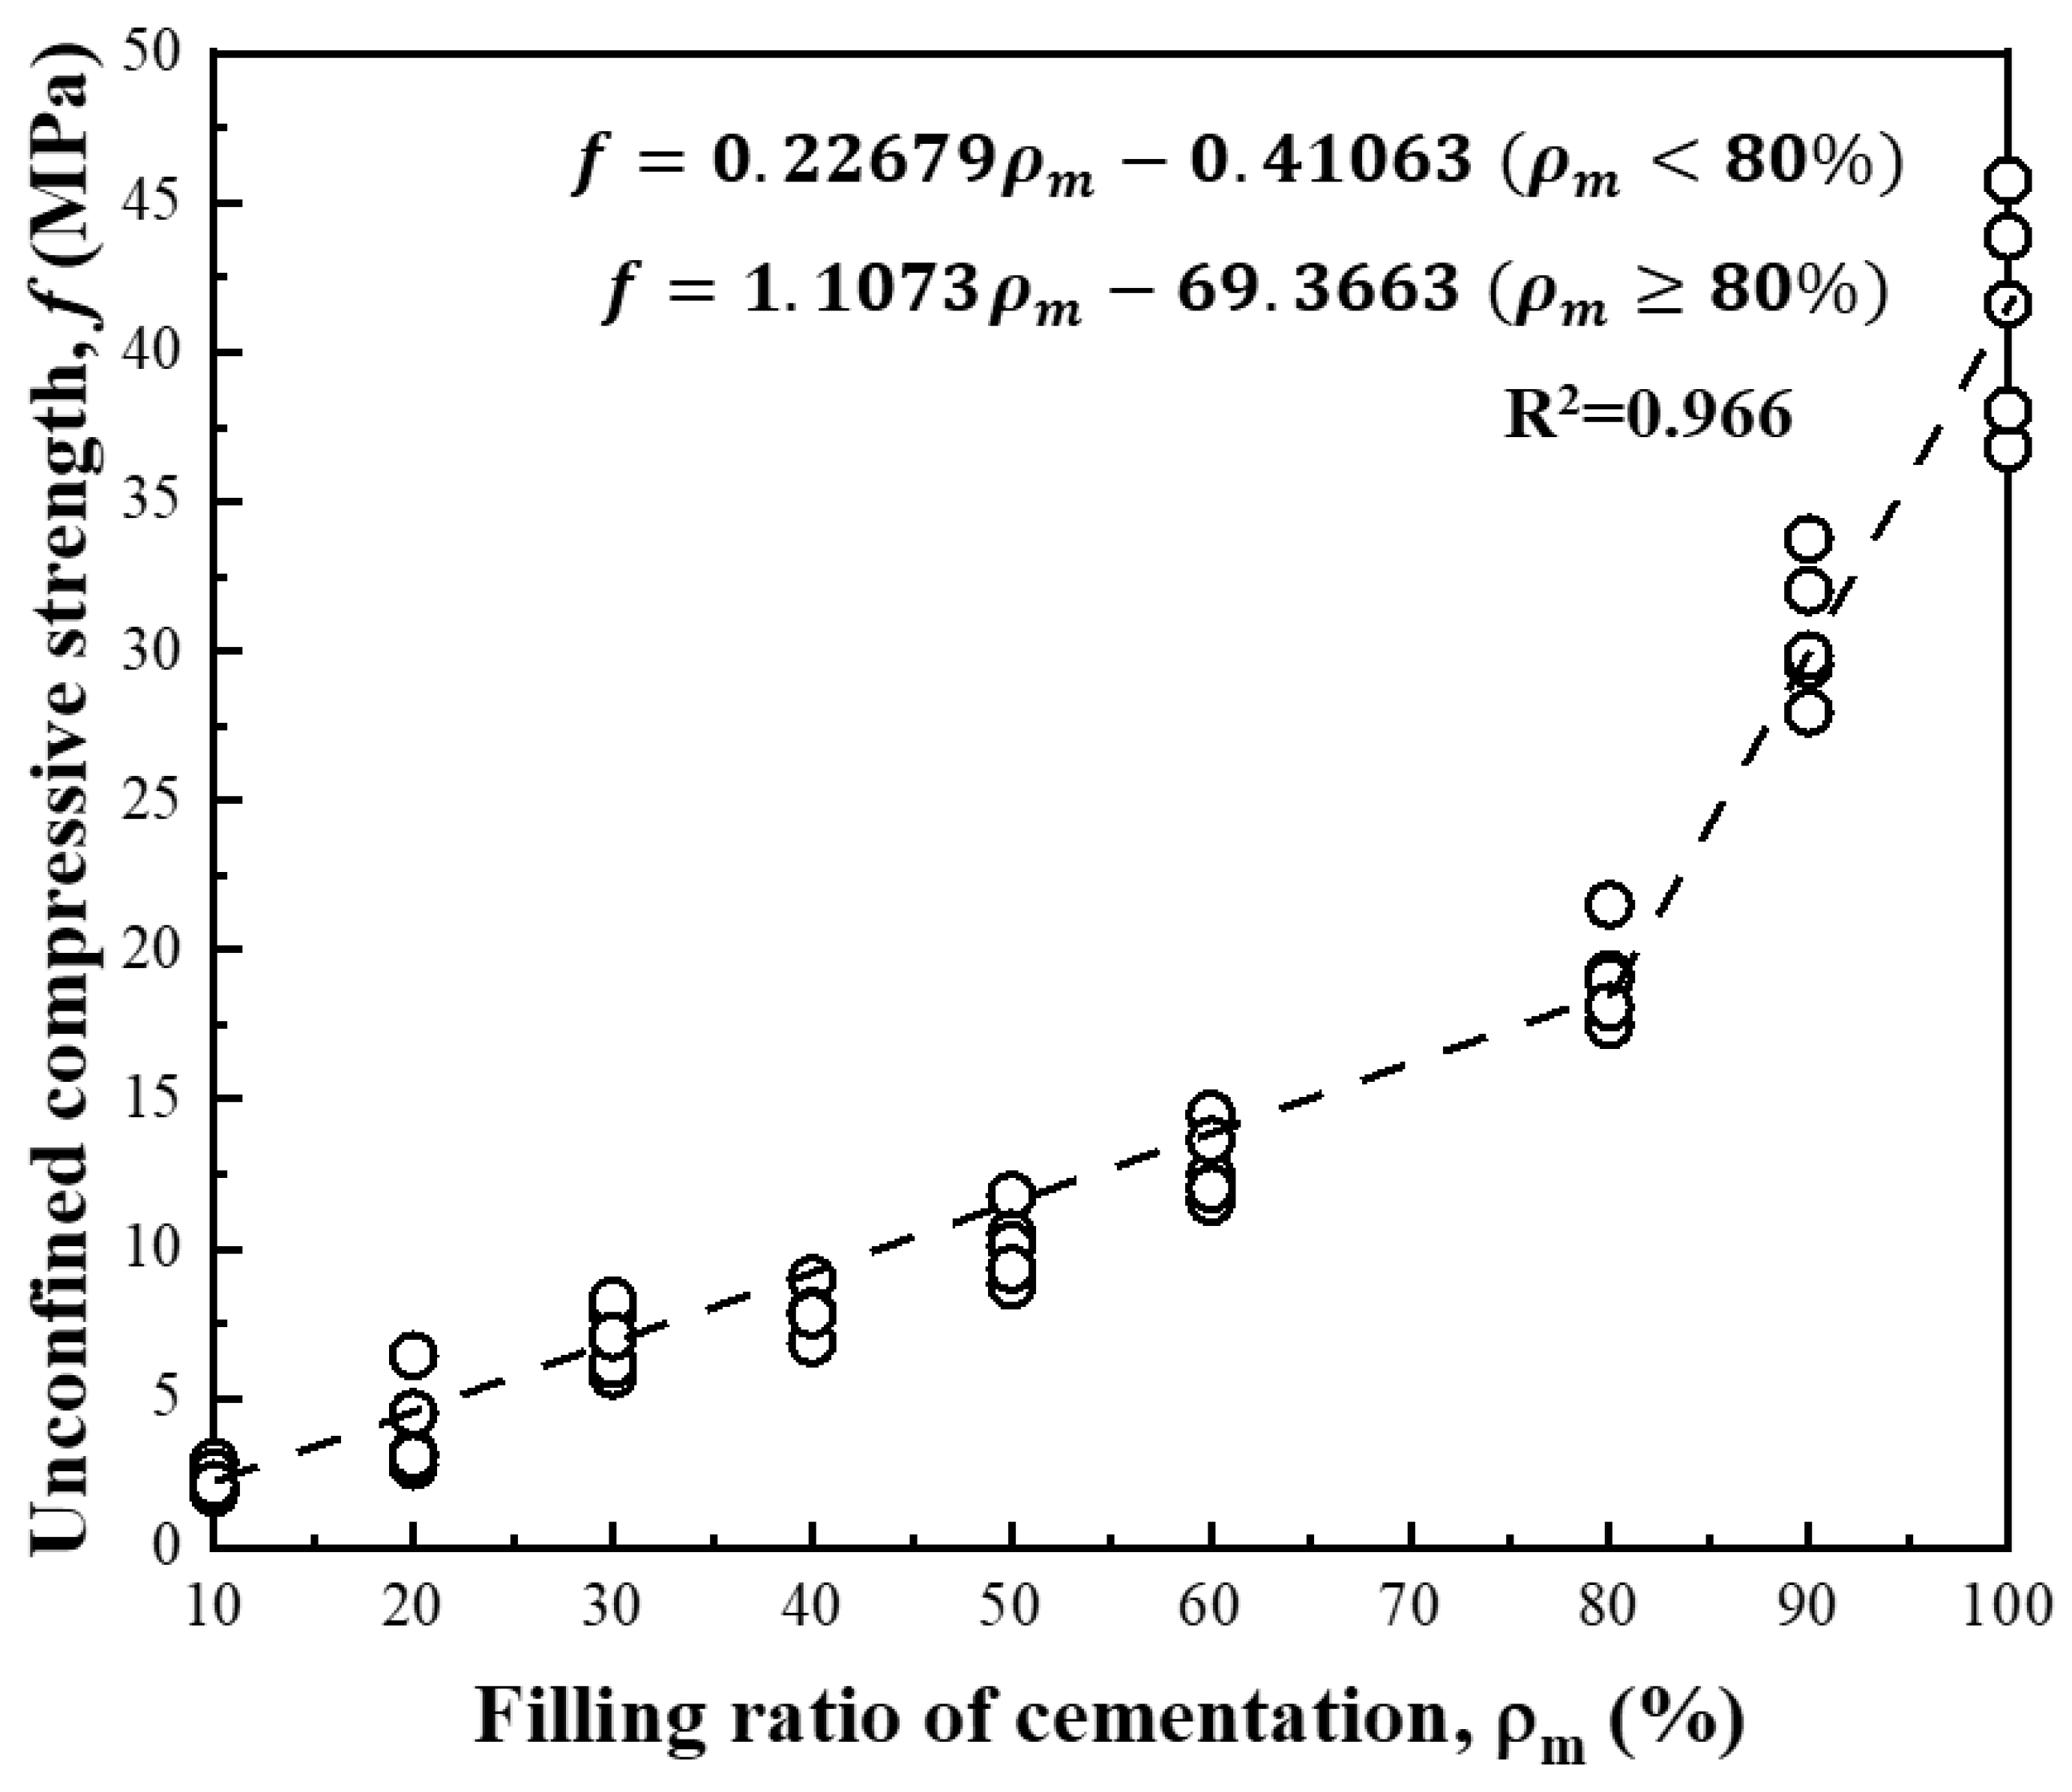
Figure 11 presents the correlation between the unconfined compressive strength of CGM and filling ratios of the cement matrix, obtained through the unconfined compressive test. The data shows nine different cement filling ratios, each with five specimens tested. As the cementation ratio increases, the unconfined compressive strength of CGM also increases. Based on the trend of these data points, two trend lines with different slopes were fitted. The inflection point of the trend change occurs when the filling ratio reaches 80%.
The relationship between unconfined compressive strength (UCS) and the cement filling ratio in this study exhibits a distinct bilinear trend with an inflection point at 80% filling. This contrasts with the smooth, nonlinear power-law relationships reported by Wang et al. for CGMs with spherical ceramic beads [17]. This phenomenon can be analyzed by examining cement matrix distribution among different filling ratios, as shown in Figure 10. The discrepancy highlights the role of aggregate morphology. For spherical particles, mechanical behavior evolves continuously as the contact area grows. In contrast, the irregular granitic aggregates used here provide significant initial skeletal stability through geometric interlocking. At a very low cementation filling ratio, a quite large amount of cement matrix is retained on the rock surface without forming an effective contact bond. With more cement matrix, the viscous self-compacting cement accumulates primarily at the contact zones between particles, resulting in an expansion of the cross-sectional area and formation of cohesive connections between grains, which linearly increase the strength of granular materials. When the cementation exceeds a certain threshold (possibly around 80%), the unconfined compressive strength increases rapidly with the amount of cementation.
The distinct bilinear relationship with an inflection point at 80% filling ratio can be understood through the lens of Percolation Theory. In a composite system, mechanical properties often exhibit a critical transition at the “percolation threshold”. Below 80% filling, the cement paste likely exists as discontinuous clusters or isolated bridges (pendular/funicular states), meaning the global stiffness is still dominated by the compliant granular skeleton. When the filling ratio exceeds 80%, the cement phase coalesces into a continuous, infinite cluster spanning the specimen boundaries (Rigidity Percolation). At this point, the load transfer mechanism bifurcates: stress is efficiently transmitted through the stiffer continuous cement matrix rather than the compliant particle contacts, resulting in the rapid increase in UCS. Hence, there are two distinct relationships between the amount of cementation and the increase in unconfined compressive strength.

4.2. Peak Strain

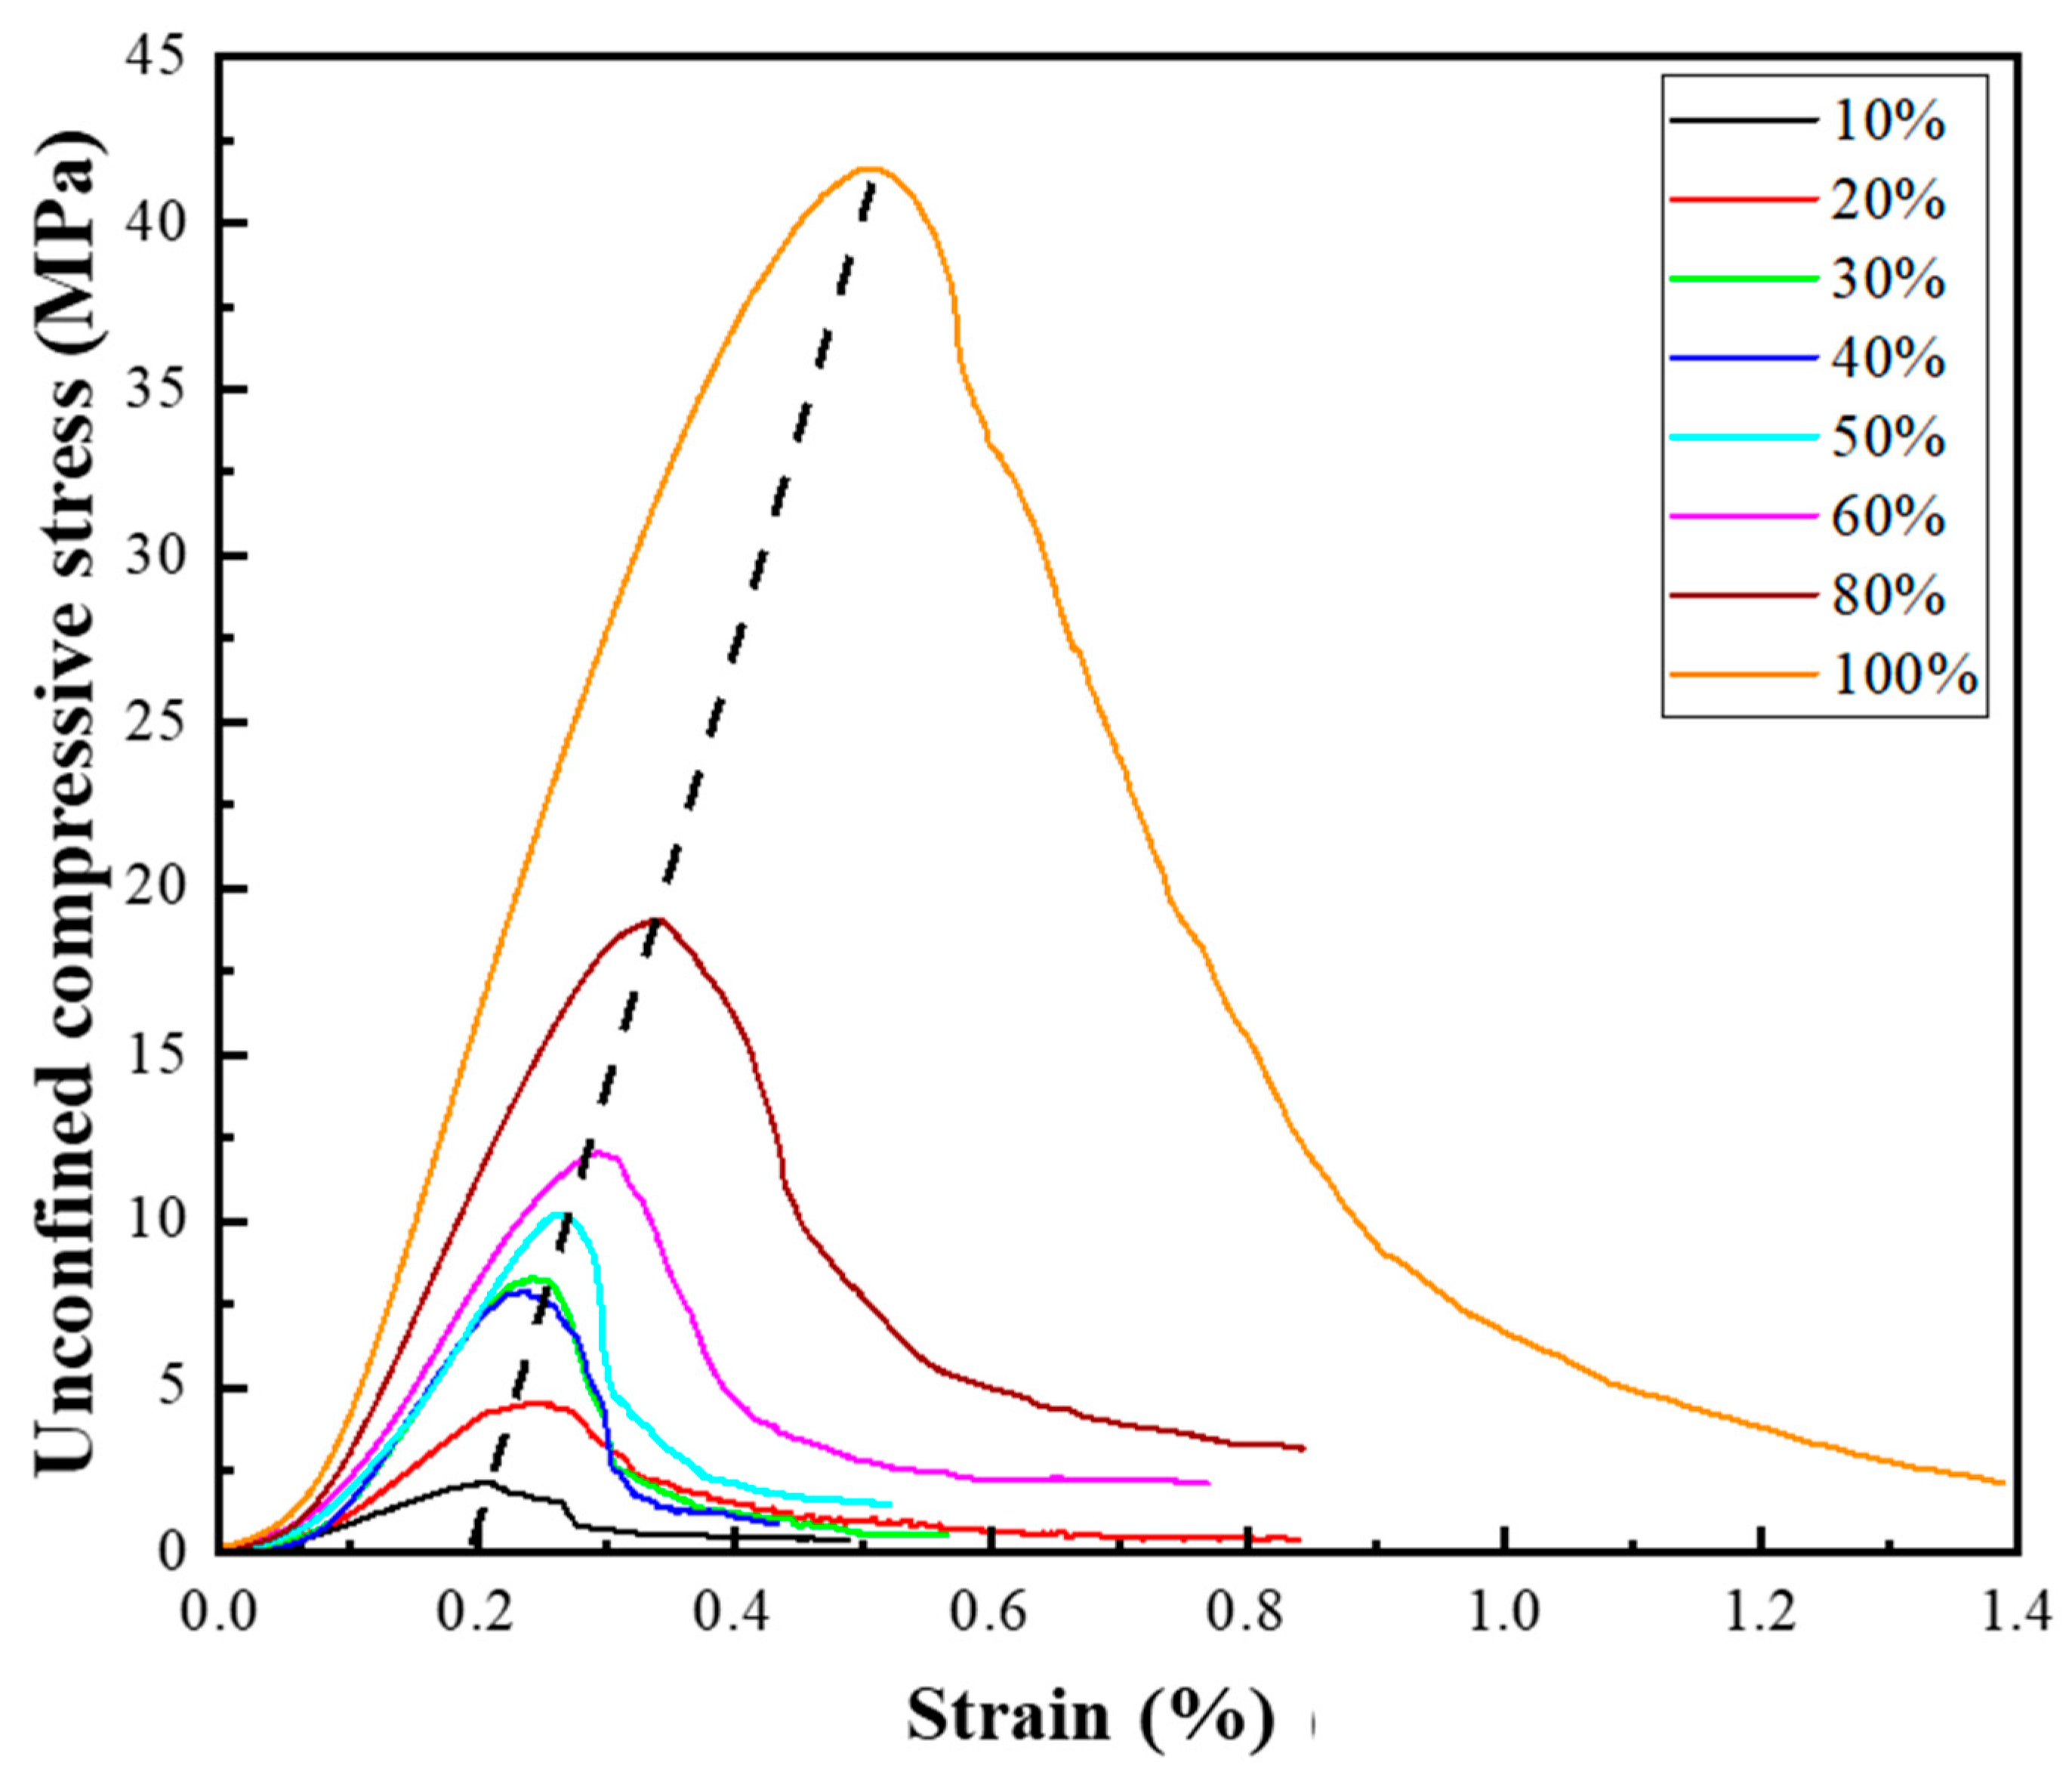
The peak strain of cemented granular material represents the axial deformation corresponding to the peak stress of the specimen. In order to analyze this, a representative stress–strain curve is chosen for each specimen with varying cementation ratios, and they are compiled and presented in Figure 12. All the curves exhibit a similar pattern. Initially, the stress increases gradually with the applied strain, a phenomenon commonly referred to as the “seating effect” [42]. Subsequently, the stress increases linearly with the strain until the sample begins to “yield” and reaches its unconfined compressive strength. Finally, the stress gradually decreases in the post-failure stage.
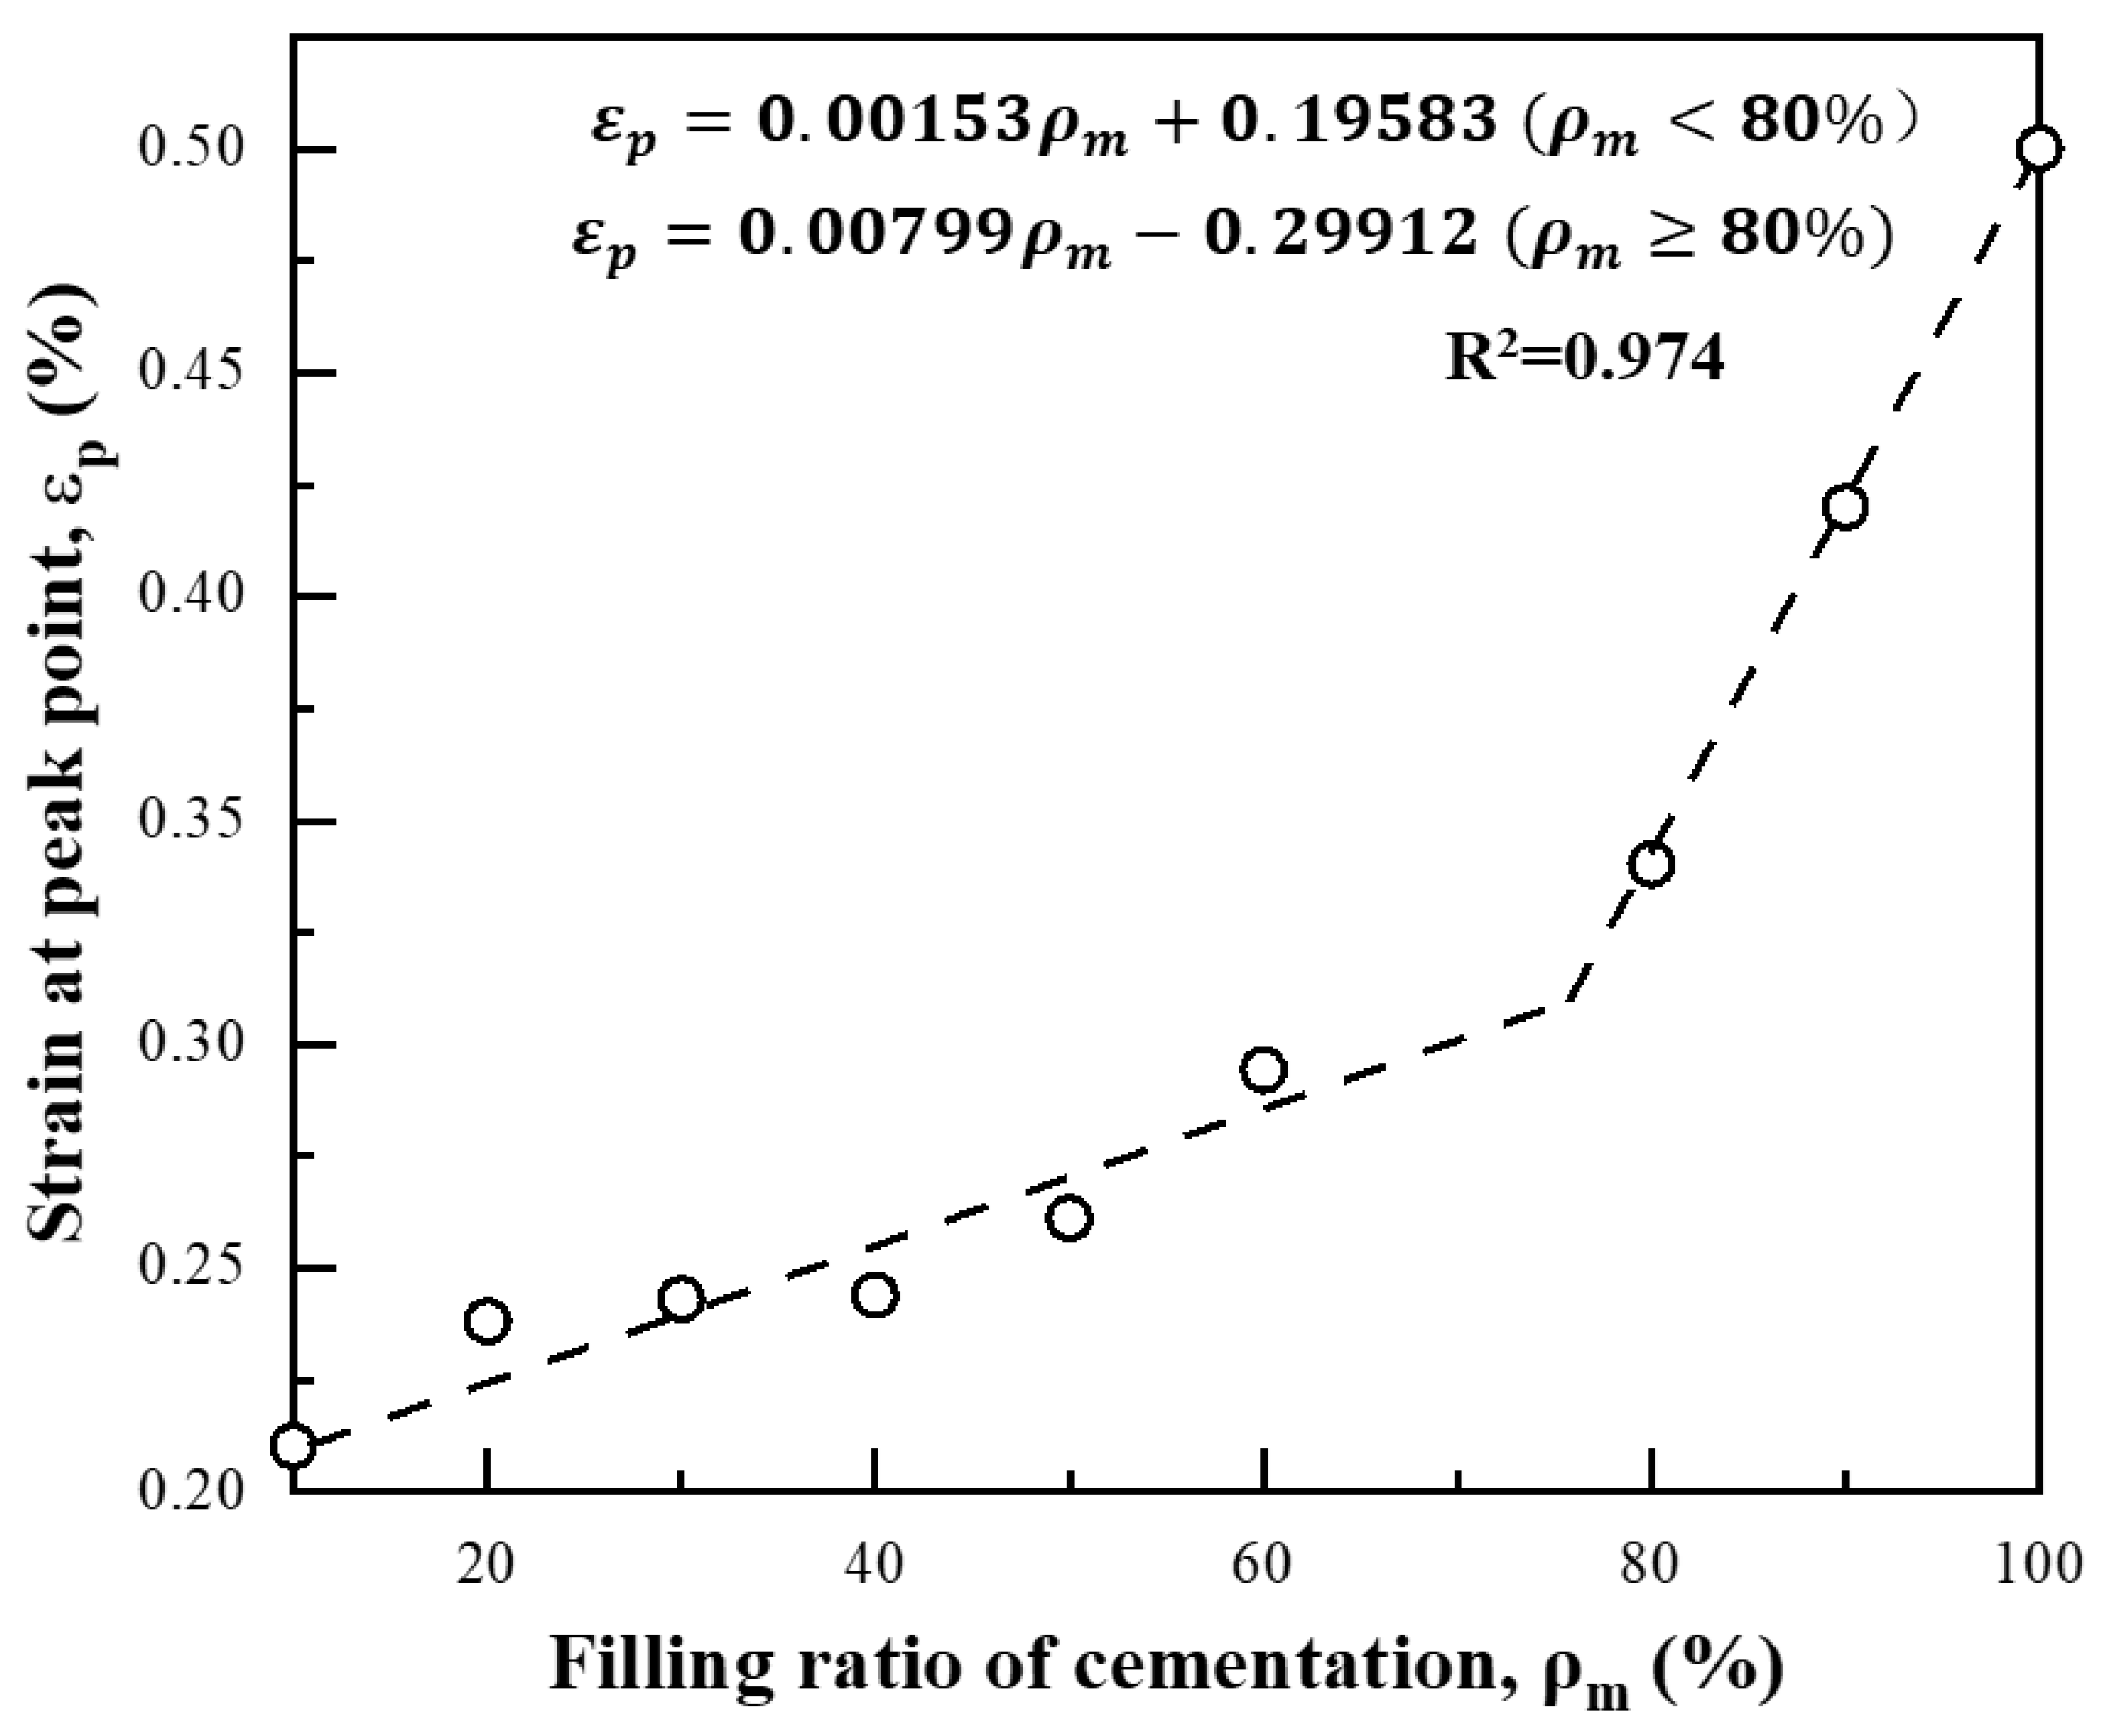
Upon comparing the stress–strain curves of different cement filling ratios, it is evident that the peak strain rises as the cement filling ratio increases. When the filling ratio increases from 10% to 30%, the peak strain increases from 0.2% to 0.25%. Additionally, all samples exhibit a ductile post-failure process. The strength and ductility of the samples are significantly enhanced with an increasing cement ratio. In order to understand the effect of cement filling ratio on peak strain, a graph showing the variation in peak strain with cemented material volume was created, as shown in Figure 13. Similarly to the unconfined compressive strength, the relationship between peak strain and cemented material volume is also bilinear, with a turning point appearing in the relationship curve when the cemented material volume reaches around 80%.

4.3. Modulus of Elasticity

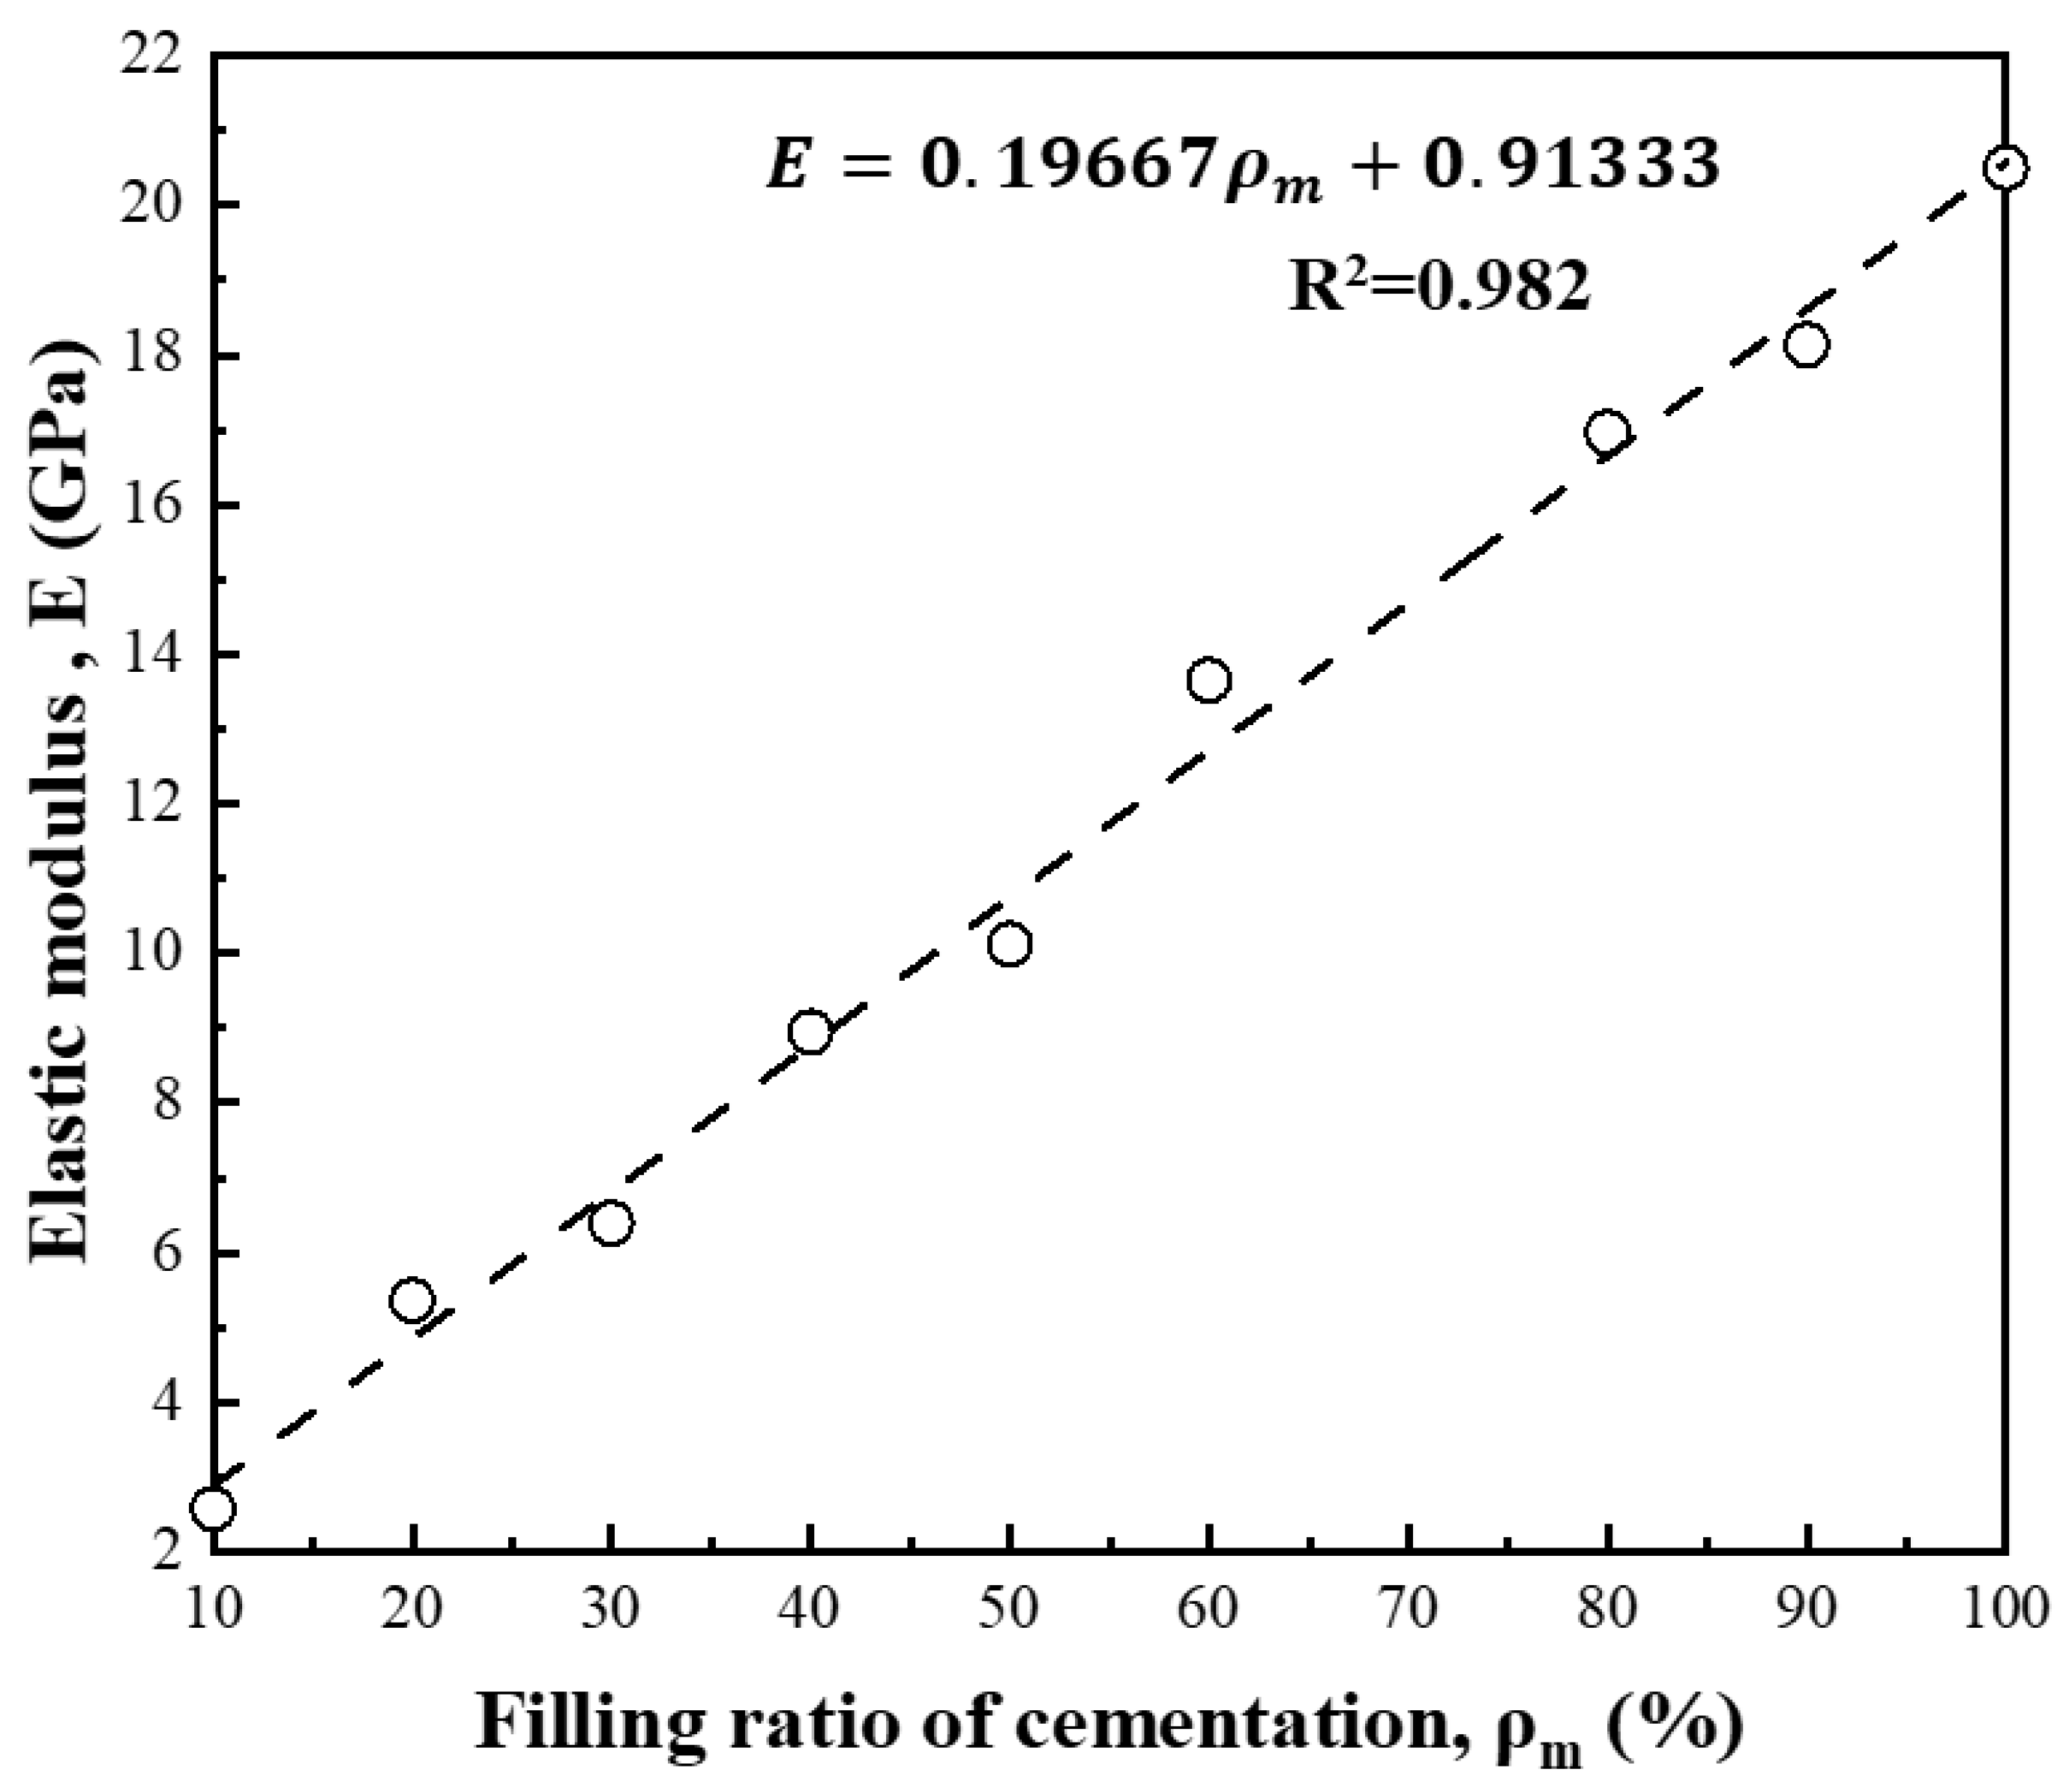
The elastic modulus of cemented granular material can be determined by linearly fitting the linear segment of the stress–strain curve of the cemented granular material obtained from the uniaxial compressive tests, with an R2 value of no less than 0.95 for the fitting. Figure 14 illustrates the variation in the elastic modulus of cemented granular material with the filling ratio of cementation. The data points in the figure correspond to the averaged cementation filling ratio and the averaged elastic modulus. The data analysis reveals a clear linear relationship between the elastic modulus and the cement filling ratio, indicating that the elastic modulus of cemented granular material increases proportionally with the cement filling ratio.
The linear elastic modulus differs from bilinear UCS because the elastic modulus depends on uniform growth of cement bonding area, while UCS is controlled by anti-macro-failure. The discrepancy with the literature is due to spherical aggregates (vs. irregular aggregates here, which form early “area-like” bonds). Its linear trend aligns with splitting tensile strength, as both rely on cement matrix continuity (no abrupt structural change).
Wang [17] conducted unconfined compression tests on CGM specimens cast with ceramic balls as aggregates and found that the unconfined compressive strength and elastic modulus of the specimens increased with an increase in the cement filling ratio. However, the relationships are both nonlinear. In this study, irregular coarse stones are used as aggregates. The relationship between unconfined compressive strength and cement filling ratio is nonlinear, with a significant increase in strength growth rate when the cement filling ratio exceeded 80%. However, the relationship between elastic modulus and cement filling ratio is linear. The linear evolution of the elastic modulus, contrasting with non-linear trends in spherical packings, is attributed to the “Grain-Locking” effect. In spherical assemblies, particle rotation contributes to non-linear stiffness. Here, the angular aggregates interlock, inhibiting rotation. Consequently, the composite stiffness behaves according to a parallel rule of mixtures, increasing linearly with the volume fraction of the stiff cement phase.

4.4. Splitting Tensile Strength

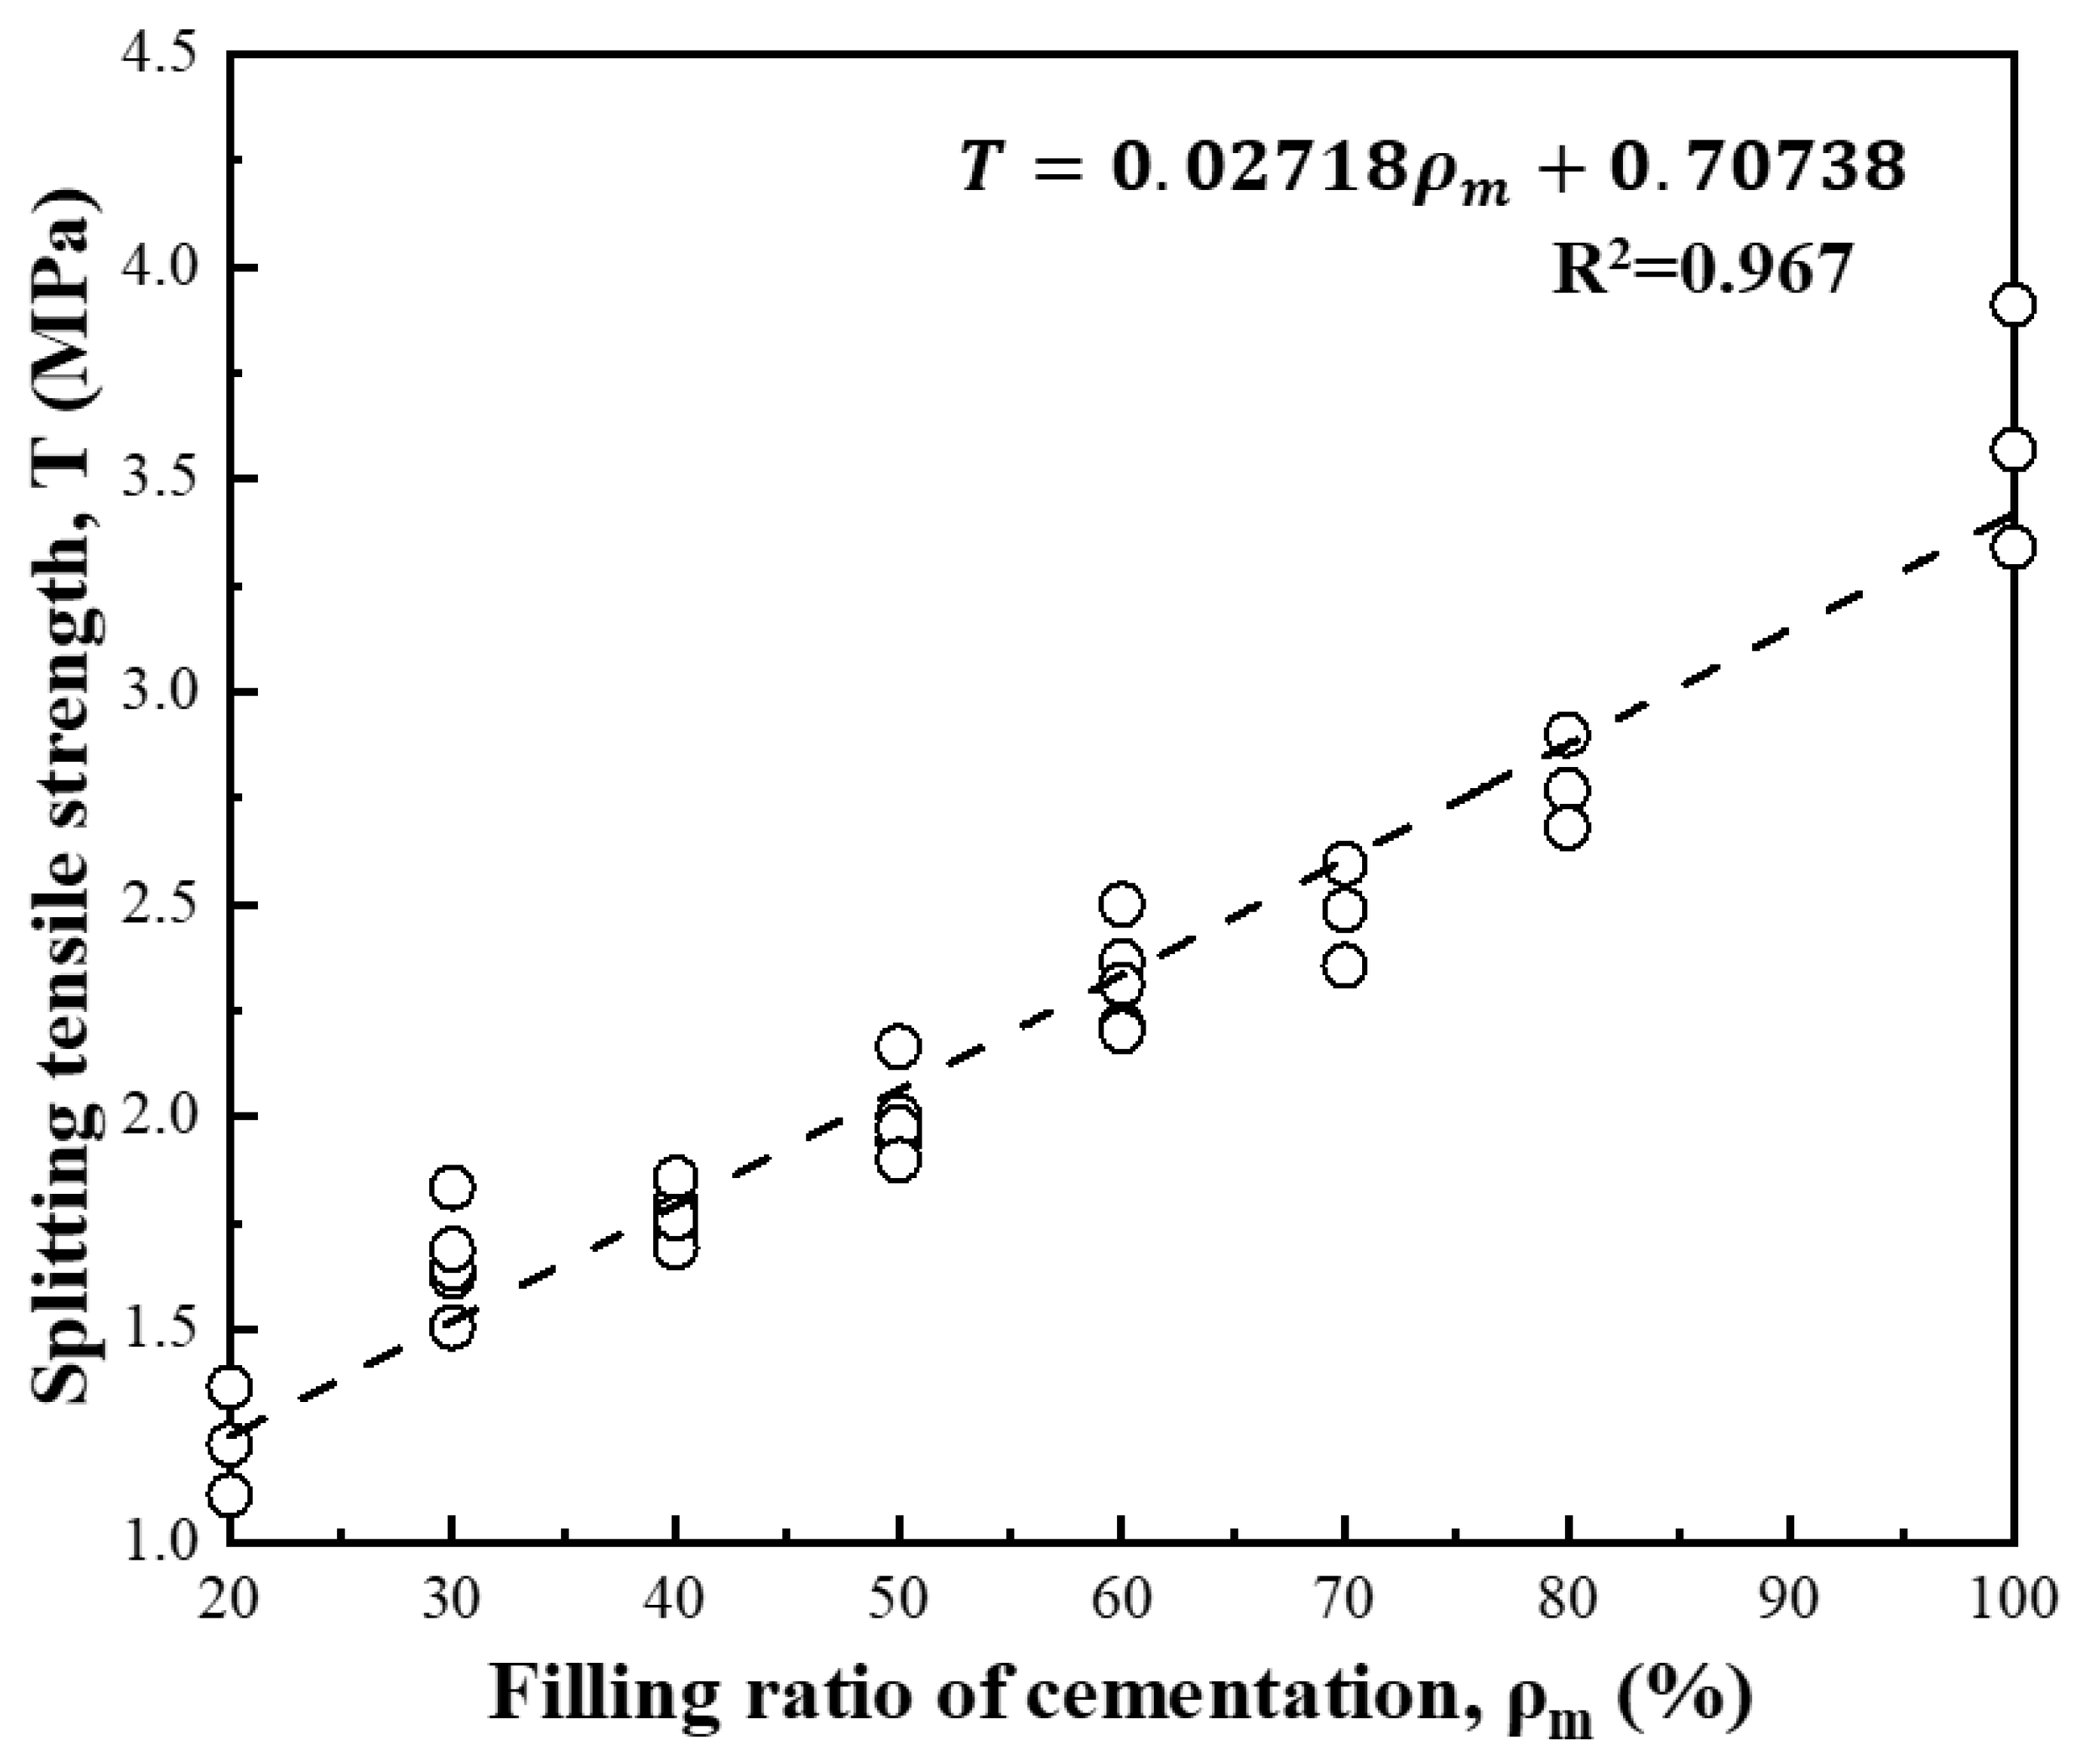
The splitting tensile tests provide the tensile strength of specimens, plotted in Figure 15. The splitting tensile strength is typically higher than the tensile strength determined by a direct tension test because short fissures weaken a specimen under direct tension more severely than they weaken a splitting tension specimen. The splitting tensile test results of several specimens with different filling ratios of cementation demonstrate that the splitting tensile strength of cemented granular materials increases with the cement filling ratio. By fitting the data points, it is observed that the relationship between splitting tensile strength and filling ratio of cementation is approximately linear when the cement filling ratio ranges from 20% to 100%. This differs from the results of the unconfined compressive test.
To explain the aforementioned phenomenon, the unconfined compressive strength and splitting tensile strength of specimens are compared with different filling ratios, as shown in Table 2.
The tensile-to-compressive strength ratio decreases from 1:3.8 at 20% to 1:11 at 100% cement filling ratio, reflecting distinct failure mechanisms in unconfined compression and splitting tensile tests: compressive strength exhibits a bilinear increase with filling ratio as load transfer transitions from aggregate-dominated to cement matrix-dominated, promoting diffusive crack patterns that dissipate more energy, while tensile strength grows linearly with filling ratio but fracture patterns shift from diffuse to planar as the cement matrix becomes more contiguous, exposing its inherent brittleness. This disparity arises because higher cement matrix content enhances compressive resistance via matrix-mediated load redistribution and diffusive cracking without proportionally improving tensile strength, which remains constrained by the matrix’s brittle failure along planar paths; thus, the decreasing strength ratio underscores how microstructural reinforcement preferentially stabilizes compressive load paths while tensile failure is governed by localized crack propagation, highlighting the critical role of cement matrix-induced architectural changes in dictating energy dissipation and failure modes. The fully cemented material is comparable to a concrete specimen, whose tensile strength is typically one-tenth of the compressive strength [43].
This decreasing tensile-to-compressive ratio is further tied to the dynamic microstructural evolution of CGM and holds key engineering implications: At low cement filling ratios (≤50%), cement exists as discrete bonds at aggregate contacts—under compression, the load is shared by cement matrix bonds and aggregate interlocking, with diffuse microcracks dissipating energy to mitigate strength loss; under tension, however, discrete bonds break suddenly, so tensile strength does not lag far behind compressive strength, resulting in a relatively high ratio (1:3.8–1:4.8). When the filling ratio exceeds 80%, the continuous cement matrix becomes the core load-bearing structure: compression benefits from the matrix’s ability to redistribute stress (driving rapid compressive strength growth), while tension is dominated by the matrix’s inherent brittleness—failure occurs along a single planar crack (Figure 9c), so tensile strength only increases linearly, failing to match the compressive strength’s growth rate; hence, the ratio drops to 1:11.
For engineering practice, this trend indicates that increasing SCCP content primarily optimizes CGM’s compressive performance (e.g., for cemented stone columns in foundation reinforcement) but does not proportionally enhance its tensile resistance. Therefore, in applications prone to tensile loads (e.g., CGM used in slope protection or hydraulic structure linings), supplementary measures—such as adding fiber to the cement matrix to inhibit planar crack propagation—should be considered to avoid tensile failure, which bridges the experimental findings with practical engineering needs.

5. Conclusions

The cemented granular material (CGM) samples with coarse aggregates are fabricated with the structuralized cementing technique. The effects of cement filling ratio on mechanical behavior and parameters of CGM are studied through unconfined compressive tests and splitting tensile tests. The conclusions are summarized as follows:
1. The complete stress–strain curve of CGM was obtained through an unconfined compression test. The results of unconfined compressive tests show that the mechanical behavior of CGM significantly depends on the filling ratio of cementation. In the post-peak region, all the samples exhibit strain-softening behavior, while maintaining a certain degree of ductility instead of a brittle failure. Both the unconfined compressive strength and ductility of the samples are greatly improved with an increasing cement ratio.
2. The elastic modulus changes linearly with the cement filling ratio. The maximum unconfined compressive strength increases with the cement filling ratio. However, the relationship between the unconfined compressive strength and cement filling ratio exhibits a bilinear relationship. When the cement ratio exceeds a threshold value of 80%, the unconfined compressive strength increases more significantly with the increase in the cement ratio, as compared with cases of lower cement ratios. This suggests that the internal structure of the granular packing is significantly altered when more void space is filled with cement matrix, leading to a corresponding change in its failure mechanism. The peak strain also exhibits a bilinear relationship with cement filling ratio. Detailed measurements reveal a subtle trend: fracture angles decrease from approximately 48° at 10% filling to 45° at 80% filling. This suggests a transition from a failure mode influenced by the internal friction of the granular skeleton to one dominated by the shear failure of the cement matrix.
3. The splitting tensile strength of CGM correlates linearly with cement filling ratio. The tensile-to-compressive strength ratio decreases with higher cementation. This trend arises because increasing cement matrix content enhances compressive load redistribution via matrix continuity and diffusive cracking, whereas tensile strength growth remains constrained by the matrix’s brittle planar failure—thus, the decreasing strength ratio inherently reflects how microstructural reinforcement preferentially augments compressive resistance over tensile capacity. Since the tensile strength of the CGM is relatively weak, it is advisable to avoid tensile failure of the CGM in practical applications.
4. This study’s core contributions are twofold: (1) It adopts irregular coarse aggregates (crushed granitic rocks) to simulate the natural morphology of CGM, addressing the limitation of previous studies that relied on spherical or uniform particles and bridging the gap between laboratory simplifications and field engineering needs; (2) It identifies the critical inflection point of cement filling ratio (80%) for CGM’s mechanical behavior and quantifies the distinct variation laws of key parameters (linear for elastic modulus and splitting tensile strength, bilinear for unconfined compressive strength and peak strain), providing a quantitative basis for CGM performance design. For practical applications, the findings can guide the optimization of cement dosage in CGM-based structures (e.g., cemented stone columns for foundation reinforcement): below 80% filling ratio, increasing cement content yields limited strength improvement, while exceeding 80% brings significant compressive strength growth—this helps balance structural performance and construction cost, avoiding excessive cement consumption.
5. This study has inherent limitations that require further exploration: (1) it only focuses on a single aggregate gradation (14–20 mm) and fixed curing conditions (20 ± 2 °C, relative humidity > 95%, 28 days), without considering the effects of aggregate size distribution or environmental factors (e.g., freeze–thaw cycles or dry–wet alternations) on CGM’s long-term mechanical properties; (2) it lacks microstructural observations (e.g., CT scanning or SEM imaging) to directly reveal the evolution of cement–aggregate bonding and pore structure, limiting in-depth interpretation of strength change mechanisms. Future research will (1) investigate the influence of different aggregate gradations and environmental aging on CGM’s mechanical behavior; (2) combine macro-mechanical tests with microstructural characterization to establish a multi-scale correlation between CGM’s microstructure and macro-performance; (3) explore modification measures (e.g., adding fibers to the cement matrix) to improve CGM’s tensile strength, addressing its weak tensile resistance in engineering scenarios.

Author Contributions

Conceptualization, Y.Z. and H.C.; Methodology, Y.Z. and K.Y.; Formal analysis, Y.Z. and H.C.; Investigation, Y.Z.; Resources, K.Y.; Data curation, Y.Z., H.C. and W.B.; Writing—original draft, Y.Z. and W.B.; Writing—review and editing, K.Y. and H.C.; Supervision, K.Y. All authors have read and agreed to the published version of the manuscript.

Funding

This research received no external funding.

Data Availability Statement

The original contributions presented in this study are included in the article. Further inquiries can be directed to the corresponding author.

Acknowledgments

The authors would like to acknowledge the support of the National Natural Science Foundation of China (NSFC Grant No. U2443232).

Conflicts of Interest

Author Kaijia Yu is employed by the Zhejiang Design Institute of Water Conservancy & Hydroelectric Power Co., Ltd. The remaining authors declare that the research was conducted in the absence of any commercial or financial relationships that could be construed as a potential conflict of interest.

References

  1. De Larrard, F.; Belloc, A. The Influence of Aggregate on the Compressive Strength of Normal and High-Strength Concrete. Mater. J. 1997, 94, 417–426. [Google Scholar] [CrossRef]
  2. Kendall, K.; Stainton, C. Adhesion and aggregation of fine particles. Powder Technol. 2001, 121, 223–229. [Google Scholar] [CrossRef]
  3. Topin, V.; Delenne, J.Y.; Radjai, F.; Brendel, L.; Mabille, F. Strength and failure of cemented granular matter. Eur. Phys. J. E 2007, 23, 413–429. [Google Scholar] [CrossRef]
  4. Delenne, J.Y.; Topin, V.; Radjai, F. Failure of cemented granular materials under simple compression: Experiments and numerical simulations. Acta Mech. 2009, 205, 9–21. [Google Scholar] [CrossRef]
  5. Hemmerle, A.; Schröter, M.; Goehring, L. A cohesive granular material with tunable elasticity. Sci. Rep. 2016, 6, 35650. [Google Scholar] [CrossRef]
  6. Srijib, C.; Jayantha, K. Basaltic Crushed Rock Stabilized with Cementitious Additives: Compressive Strength and Stiffness, Drying Shrinkage, and Capillary Flow Characteristics. Transp. Res. Rec. 2003, 1819, 18–26. [Google Scholar] [CrossRef]
  7. Elata, D.; Dvorkin, J. Pressure sensitivity of cemented granular materials. Mech. Mater. 1996, 23, 147–154. [Google Scholar] [CrossRef]
  8. Sienkiewicz, F.; Shukla, A.; Sadd, M.; Zhang, Z.; Dvorkin, J. A combined experimental and numerical scheme for the determination of contact loads between cemented particles. Mech. Mater. 1996, 22, 43–50. [Google Scholar] [CrossRef]
  9. Ouadfel, H.; Rothenburg, L. ‘Stress–force–fabric’ relationship for assemblies of ellipsoids. Mech. Mater. 2001, 33, 201–221. [Google Scholar] [CrossRef]
  10. Radjai, F.; Preechawuttipong, I.; Peyroux, R. Cohesive granular texture. In Continuous and Discontinuous Modelling of Cohesive-Frictional Materials; Lecture Notes in Physics; Springer: Berlin/Heidelberg, Germany, 2001; Volume 568, pp. 149–162. [Google Scholar] [CrossRef]
  11. Herrmann, H.J.; Roux, S. Statistical Models for the Fracture of Disordered Media; North-Holland: Amsterdam, The Netherlands, 1990. [Google Scholar] [CrossRef]
  12. Delenne, J.Y.; El Youssoufi, M.S.; Cherblanc, F.; Bénet, J.C. Mechanical behaviour and failure of cohesive granular materials. Int. J. Numer. Anal. Methods Geomech. 2004, 28, 1577–1594. [Google Scholar] [CrossRef]
  13. Liu, A.J.; Nagel, S.R. Jamming and Rheology: Constrained Dynamics on Microscopic and Macroscopic Scales. In Applied and Industrial Physics; CRC Press: Boca Raton, FL, USA, 2001. [Google Scholar] [CrossRef]
  14. Affes, R.; Delenne, J.Y.; Monerie, Y.; Radjaï, F.; Topin, V. Tensile strength and fracture of cemented granular aggregates. Eur. Phys. J. E 2012, 35, 117. [Google Scholar] [CrossRef]
  15. Tan, H.; Huang, Y.; Liu, C.; Geubelle, P.H. The Mori–Tanaka method for composite materials with nonlinear interface debonding. Int. J. Plast. 2005, 21, 1890–1918. [Google Scholar] [CrossRef]
  16. Consoli, N.C.; Cruz, R.C.; Floss, M.F.; Festugato, L. Parameters Controlling Tensile and Compressive Strength of Artificially Cemented Sand. J. Geotech. Geoenviron. Eng. 2009, 136, 759–763. [Google Scholar] [CrossRef]
  17. Wang, W.; Pan, J.; Jin, F. Mechanical Behavior of Cemented Granular Aggregates under Uniaxial Compression. J. Mater. Civ. Eng. 2009, 31, 04019047. [Google Scholar] [CrossRef]
  18. Schnaid, F.; Prietto, P.D.M.; Consoli, N.C. Characterization of Cemented Sand in Triaxial Compression. J. Geotech. Geoenviron. Eng. 2001, 127, 857–868. [Google Scholar] [CrossRef]
  19. Shen, Z.; Huang, D.; Wang, G.; Zhao, Y.; Jin, F. A mesoscale bond model for discrete element modeling of irregular cemented granular materials. Comput. Geotech. 2022, 152, 105051. [Google Scholar] [CrossRef]
  20. Mohajerani, S.; Wang, G.; Zhao, Y.; Jin, F. A novel peridynamics modelling of cemented granular materials. Acta Geotech. 2023, 18, 2529–2548. [Google Scholar] [CrossRef]
  21. Marigo, J.J.; Maurini, C.; Pham, K. An overview of the modelling of fracture by gradient damage models. Meccanica 2016, 51, 3107–3128. [Google Scholar] [CrossRef]
  22. Bernabé, Y.; Fryer, D.T.; Hayes, J.A. The effect of cement on the strength of granular rocks. Geophys. Res. Lett. 1992, 19, 1511–1514. [Google Scholar] [CrossRef]
  23. Consoli, N.C.; Foppa, D. Porosity/cement ratio controlling initial bulk modulus and incremental yield stress of an artificially cemented soil cured under stress. Geotech. Lett. 2014, 4, 22–26. [Google Scholar] [CrossRef]
  24. Soltanbeigi, B.; Podlozhnyuk, A.; Ooi, J.Y.; Kloss, C.; Papanicolopulos, S.A. Comparison of multi-sphere and superquadric particle representation for modelling shearing and flow characteristics of granular assemblies. In Proceedings of the EPJ Web of Conferences: Powders and Grains 2017—8th International Conference on Micromechanics on Granular Media, Montpellier, France, 3–7 July 2017; Volume 140, pp. 1–3. [Google Scholar] [CrossRef]
  25. An, X.; Wu, Q.; Jin, F.; Huang, M.; Zhou, H.; Chen, C.; Liu, C. Rock-filled concrete, the new norm of SCC in hydraulic engineering in China. Cem. Concr. Compos. 2014, 54, 89–99. [Google Scholar] [CrossRef]
  26. Xie, Y.; Corr, D.J.; Chaouche, M.; Jin, F.; Shah, S.P. Experimental study of filling capacity of self-compacting concrete and its influence on the properties of rock-filled concrete. Cem. Concr. Res. 2014, 56, 121–128. [Google Scholar] [CrossRef]
  27. Palacios, M.; Puertas, F.; Bowen, P.; Houst, Y.F. Effect of PCs superplasticizers on the rheological properties and hydration process of slag-blended cement pastes. J. Mater. Sci. 2009, 44, 2714–2723. [Google Scholar] [CrossRef]
  28. ASTM C192M-14; Standard Practice for Making and Curing Concrete Test Specimens in the Laboratory. ASTM: West Conshohocken, PA, USA, 2014. [CrossRef]
  29. Hill, R. Elastic properties of reinforced solids: Some theoretical principles. J. Mech. Phys. Solids 1963, 11, 357–372. [Google Scholar] [CrossRef]
  30. Li, S.; Wang, G. Introduction to Micromechanics and Nanomechanics, 2nd ed.; World Scientific Publishing Co.: Singapore, 2018. [Google Scholar] [CrossRef]
  31. Elvin, A. Number of grains required to homogenize elastic properties of polycrystalline ice. Mech. Mater. 1996, 22, 51–64. [Google Scholar] [CrossRef]
  32. Ren, Z.; Zheng, Q. A quantitative study of minimum sizes of representative volume elements of cubic polycrystals—Numerical experiments. J. Mech. Phys. Solids 2002, 50, 881–893. [Google Scholar] [CrossRef]
  33. ASTM D7181-20; Standard Test Method for Consolidated Drained Triaxial Compression Test for Soils. ASTM: West Conshohocken, PA, USA, 2020. [CrossRef]
  34. Bard, E.; Anabalón, M.E.; Campaña, J. Waste Rock Behavior at High Pressures: Dimensioning High Waste Rock Dumps. In Multiscale Geomechanics; John Wiley & Sons, Inc.: Hoboken, NJ, USA, 2013; pp. 83–112. [Google Scholar] [CrossRef]
  35. Hu, W.; Dano, C.; Hicher, P.-Y.; Le Touzo, J.-Y.; Derkx, F.; Merliot, E. Effect of sample size on the behavior of granular materials. Geotech. Test. J. 2011, 34, 186–197. [Google Scholar] [CrossRef]
  36. Verdugo, R.; De La Hoz, K. Strength and stiffness of coarse granular soils. In Solid Mechanics and Its Applications; Springer: Dordrecht, The Netherlands, 2007; Volume 146, pp. 243–252. [Google Scholar] [CrossRef]
  37. BS EN 12390-3:2019; Testing Hardened Concrete. Part 3, Compressive Strength of Test Specimens. BSI: London, UK, 2019.
  38. Sim, J.; Yang, K.; Jeon, J. Influence of aggregate size on the compressive size effect according to different concrete types. Constr. Build. Mater. 2013, 44, 716–725. [Google Scholar] [CrossRef]
  39. Faramarzi, L.; Rezaee, H. Testing the effects of sample and grain sizes on mechanical properties of concrete. J. Mater. Civ. Eng. 2018, 30, 04018065. [Google Scholar] [CrossRef]
  40. ASTM D2166/D2166M-16; Standard Test Method for Unconfined Compressive Strength of Cohesive Soil. ASTM: West Conshohocken, PA, USA, 2016. [CrossRef]
  41. Denneman, E.; Kearsley, E.P.; Visser, A.T. Splitting tensile test for fibre reinforced concrete. Mater. Struct. 2011, 44, 1441–1449. [Google Scholar] [CrossRef]
  42. Ho, T.O.; Chen, W.B.; Yin, J.H.; Wu, P.C.; Tsang, D.C.W. Stress-Strain behaviour of Cement-Stabilized Hong Kong marine deposits. Constr. Build. Mater. 2021, 274, 122103. [Google Scholar] [CrossRef]
  43. Shang, H.S.; Song, Y.P. Experimental study of strength and deformation of plain concrete under biaxial compression after freezing and thawing cycles. Cem. Concr. Res. 2006, 36, 1857–1864. [Google Scholar] [CrossRef]
Figure 1. (a) Crushed granitic rocks and (b) grain size distributions.
Buildings 16 00471 g001
Figure 2. Production of CGM specimens: (a) randomly place crushed stones into a prepared mold; (b) pour the cement paste evenly into the mold; and (c) create a CGM specimen with a diameter of 100 mm and a height of 200 mm.
Buildings 16 00471 g002
Figure 3. The specimens of cemented granular materials with different cement filling ratios.
Buildings 16 00471 g003
Figure 4. Capping the sample of CGM.
Buildings 16 00471 g004
Figure 5. MTS 815 for unconfined compressive test of cemented granular materials.
Buildings 16 00471 g005
Figure 6. Servo hydraulic machine for splitting tensile test of cemented granular materials.
Buildings 16 00471 g006
Figure 7. Stress–strain curve of cemented granular materials with different filling ratios ( ρ m ).
Buildings 16 00471 g007
Figure 8. The specimens of CGMs after failure: (a) ρ m = 10%, contact cementation; (b) ρ m = 30%, partially contact and partially compact cementation; (c) ρ m = 80%, compact cementation.
Buildings 16 00471 g008
Figure 9. The specimens failed after the splitting tensile test: (a) ρ m = 40 % , (b) ρ m = 50 % , and (c) ρ m = 60 % .
Buildings 16 00471 g009
Figure 10. The specimens of CGMs after the splitting tensile test: (a) ρ m = 30 % , (b) ρ m = 40 % , and (c) ρ m = 90 % .
Buildings 16 00471 g010
Figure 11. Effect of the cement filling ratio on unconfined compressive strength of cemented granular materials.
Buildings 16 00471 g011
Figure 12. Stress–strain curve of representative CGM specimens with different filling ratios.
Buildings 16 00471 g012
Figure 13. Effect of the filling ratio of cementation on the unconfined compressive peak strain of cemented granular materials.
Buildings 16 00471 g013
Figure 14. Effect of the filling ratio of cementation on the elastic modulus of cemented granular materials.
Buildings 16 00471 g014
Figure 15. Effect of the filling ratio of cementation on the splitting tensile strength of cemented granular materials.
Buildings 16 00471 g015
Table 1. Mix proportions of self-compacting cement paste.
TypeC (kg/m3)W (kg/m3)AD (kg/m3)W:C
CGM-10151947815.191.0
CGM-20151947814.881.0
CGM-30151947814.131.0
CGM-40151947813.671.0
CGM-50151947813.361.0
CGM-60151947812.911.0
CGM-80151947812.601.0
CGM-90151947812.281.0
CGM-100151947815.191.0
Note: The content of cement, water, and superplasticizer is represented by C, W, and AD, respectively; W:C denotes the volumetric ratio of water to cement (volume basis), and CGM-10 denotes that the cement filling ratio of the CGM is 10%.
Table 2. The ratio of compressive strength to tensile strength of CGM.
Cement Filling Ratio ρ m 20%30%40%50%60%80%100%
Splitting tensile strength (MPa)1.241.661.742.042.362.733.6
Compressive strength (MPa)4.677.757.839.9812.4218.7641.78
Tensile/compressive strength ratio1:3.81:4.71:4.51:4.81:5.21:6.91:11
Disclaimer/Publisher’s Note: The statements, opinions and data contained in all publications are solely those of the individual author(s) and contributor(s) and not of MDPI and/or the editor(s). MDPI and/or the editor(s) disclaim responsibility for any injury to people or property resulting from any ideas, methods, instructions or products referred to in the content.