2. Materials and Methods
2.1. Research Framework
The methodological framework of this study was developed to establish a reproducible and experimentally grounded workflow for evaluating the thermal and economic performance of wall insulation systems in cold–dry regions of Northwest China. Unlike conventional insulation-optimization studies that rely primarily on assumed thermal parameters or simulation-based estimates, the present framework explicitly links measured material-level thermal properties, dynamic building-scale energy simulation, and life-cycle economic evaluation within a unified analytical structure. The overall objective is not only to quantify thermal performance but also to identify insulation configurations that are both physically reliable and economically optimal under local climatic and market conditions.
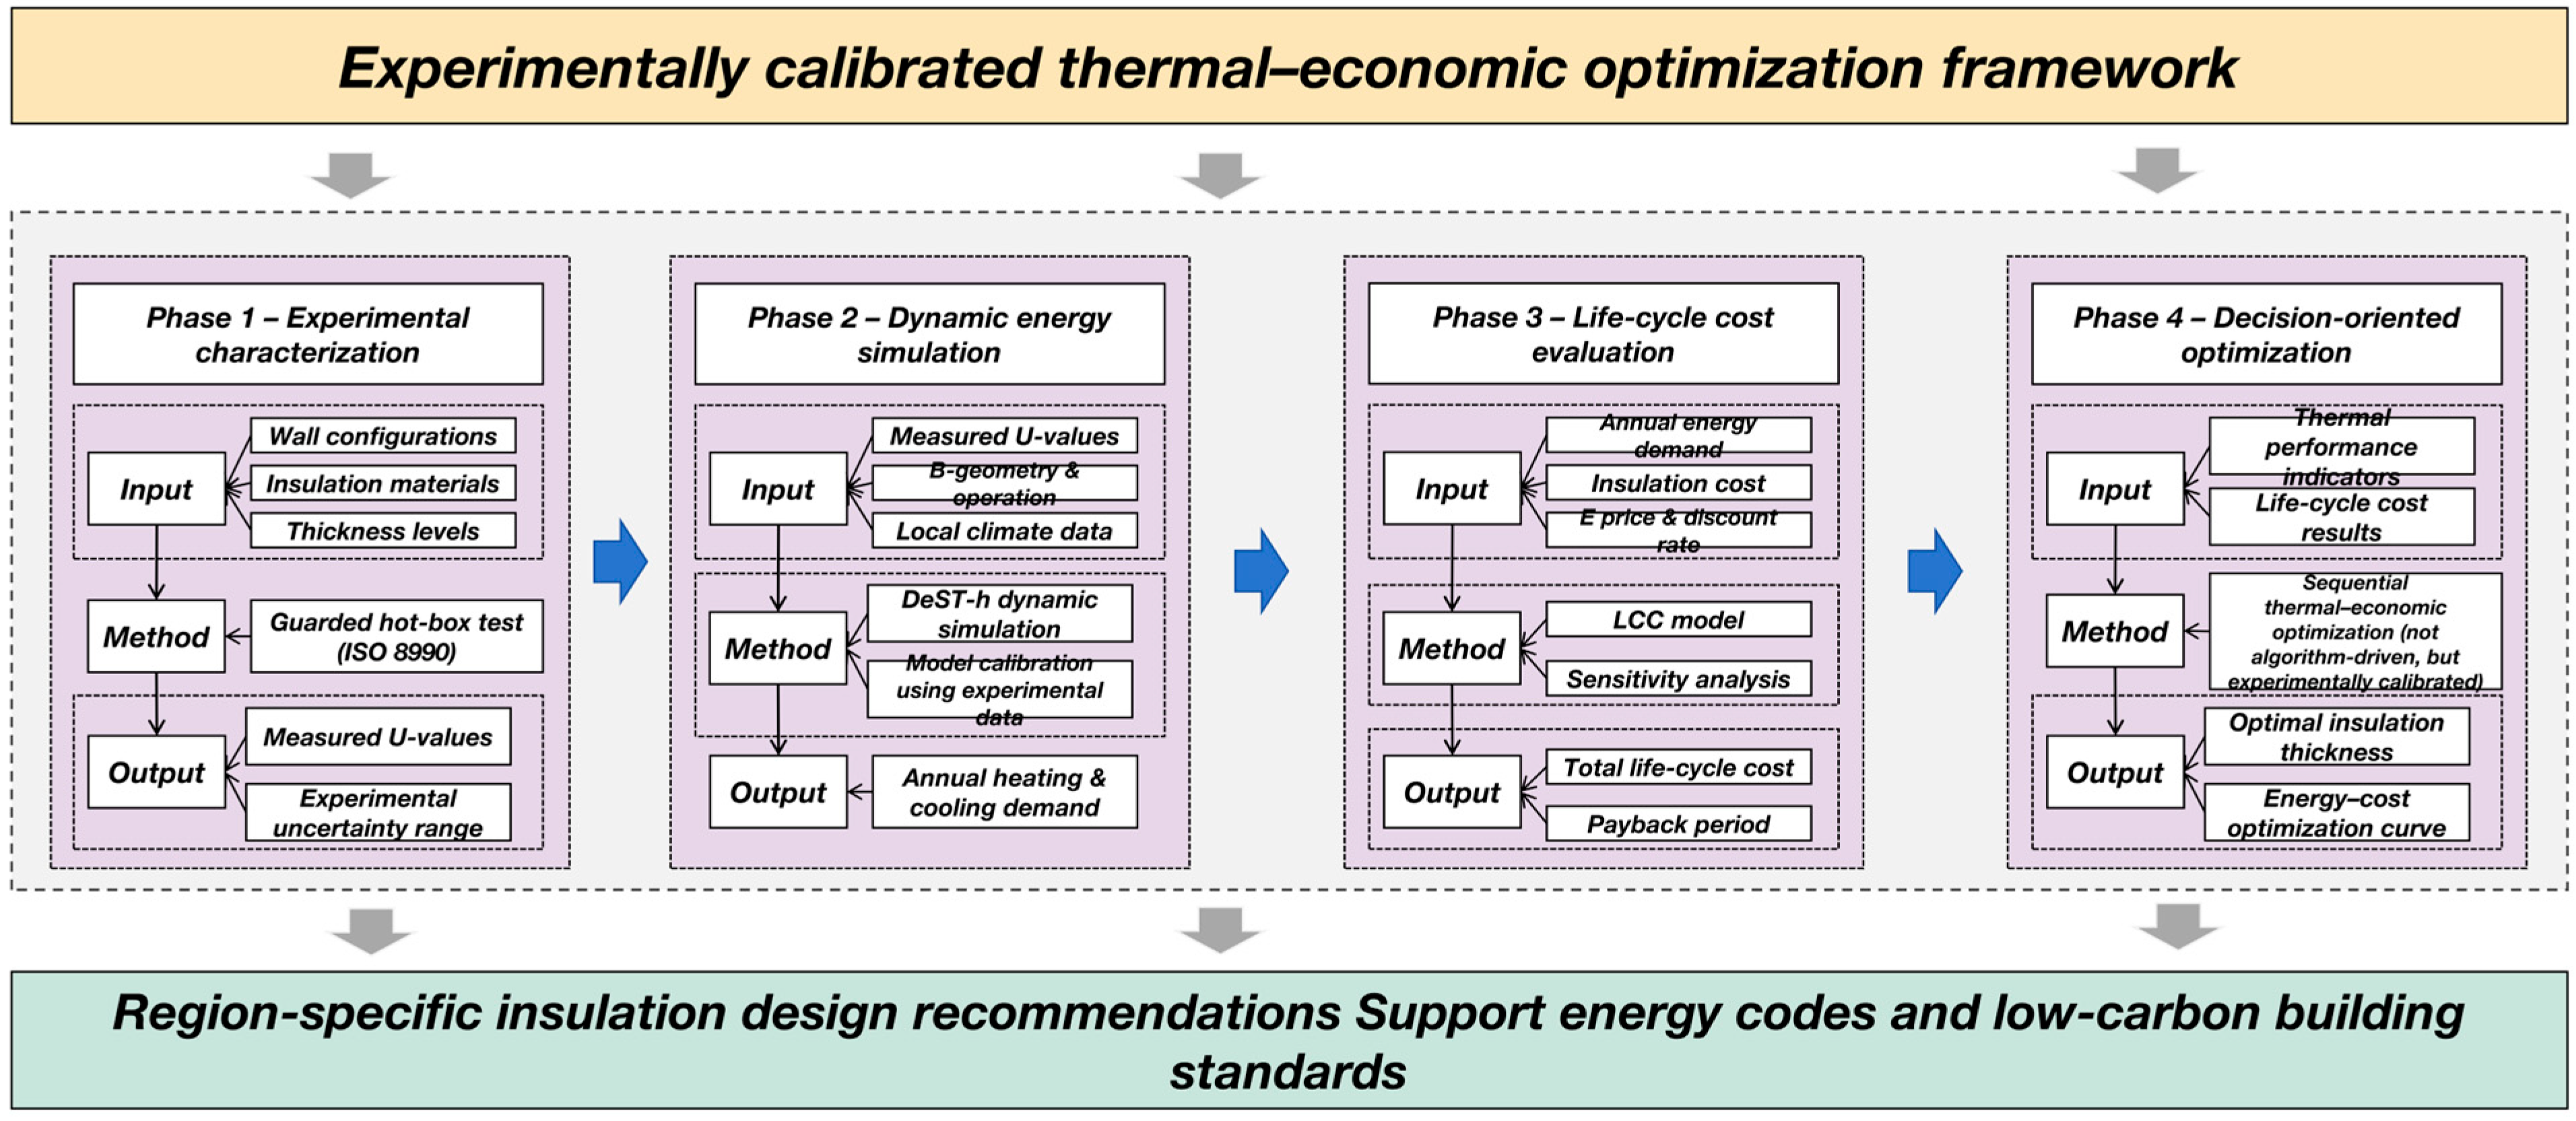
As illustrated in
Figure 2, the framework consists of four sequential and interlinked phases: (i) experimental characterization, (ii) dynamic energy simulation, (iii) life-cycle cost evaluation, and (iv) integrated decision-oriented optimization. Each phase produces well-defined outputs that serve as direct inputs to the subsequent phase, ensuring traceability and methodological transparency.
Phase 1: Experimental characterization.
The first phase focuses on the empirical determination of steady-state thermal transmittance (U-value) for representative multilayer wall assemblies. In contrast to studies that adopt theoretical or standard-based thermal resistances, this research employs calibrated guarded hot-box testing in accordance with ISO 8990:1994 [
85] to obtain experimentally verified thermal parameters. Three commonly used insulation materials—expanded polystyrene (EPS), extruded polystyrene (XPS), and rock wool (RW)—are investigated, each at three thickness levels (30 mm, 50 mm, and 70 mm). The primary outputs of this phase are material- and thickness-specific U-values with quantified uncertainty, which form the physical basis for subsequent simulation. By anchoring the analysis in laboratory measurements, Phase 1 reduces uncertainty associated with assumed thermal properties and enables direct comparison between experimental results and theoretical expectations.
Phase 2: Dynamic energy simulation.
In the second phase, the experimentally measured U-values are incorporated into a dynamic building energy simulation model using the DeST-h platform developed by Tsinghua University. A representative six-story residential building located in Xi’an is modeled, with geometry, occupancy schedules, internal gains, and ventilation rates consistent with China’s national energy-efficiency standard (JGJ26–2021). Unlike steady-state approaches, the dynamic simulation evaluates annual heating and cooling loads on an hourly basis, explicitly accounting for climatic variability, solar radiation, and thermal inertia. The key outputs of this phase are annual space-heating and cooling energy demands corresponding to each insulation configuration. Model calibration is performed by comparing experimentally derived heat-transfer behavior with simulated results, thereby ensuring that building-scale predictions remain consistent with measured physical performance.
Phase 3: Life-cycle cost (LCC) evaluation.
The third phase extends the analysis from energy performance to economic feasibility through a life-cycle cost framework. For each insulation configuration, the LCC is calculated by integrating initial insulation investment, annual energy-cost savings derived from simulation results, and discounted operating costs over a 25-year analysis period. This phase explicitly incorporates economic parameters such as discount rate, energy price, and system efficiency. Sensitivity analyses are conducted to assess the influence of key economic variables, allowing evaluation of the robustness of optimal solutions under uncertain market conditions. The primary output of Phase 3 is the total life-cycle cost associated with each insulation thickness and material option.
Phase 4: Integrated decision-oriented optimization.
The final phase synthesizes experimental, simulation, and economic outputs into a decision-support process aimed at identifying the thermal–economic optimum insulation configuration. Rather than applying complex multi-objective algorithms, the optimization is conducted through a sequential and transparent data-integration approach: experimentally measured U-values inform dynamic energy simulation; simulated annual energy demand feeds directly into the LCC model; and the insulation thickness that minimizes total life-cycle cost is identified as the economic optimum. This approach differs from many existing multi-criteria frameworks by prioritizing physical traceability and reproducibility over algorithmic complexity. The output of Phase 4 is a clearly defined optimal insulation thickness (or thickness range) for each material, supported by both thermal-performance metrics and economic justification.
Overall, the proposed framework bridges material-scale thermal characterization and building-scale energy and cost assessment within a coherent methodological structure. Its novelty lies in the explicit coupling of experimentally validated thermal parameters with dynamic simulation and economic optimization under cold–dry continental climatic conditions, where diurnal temperature variation and solar radiation strongly influence envelope performance. By grounding optimization decisions in measured data and transparent analytical steps, the framework enhances reproducibility and provides a practical basis for insulation design and policy guidance in Northwest China and similar climatic regions.
2.2. Study Area and Climatic Characteristics
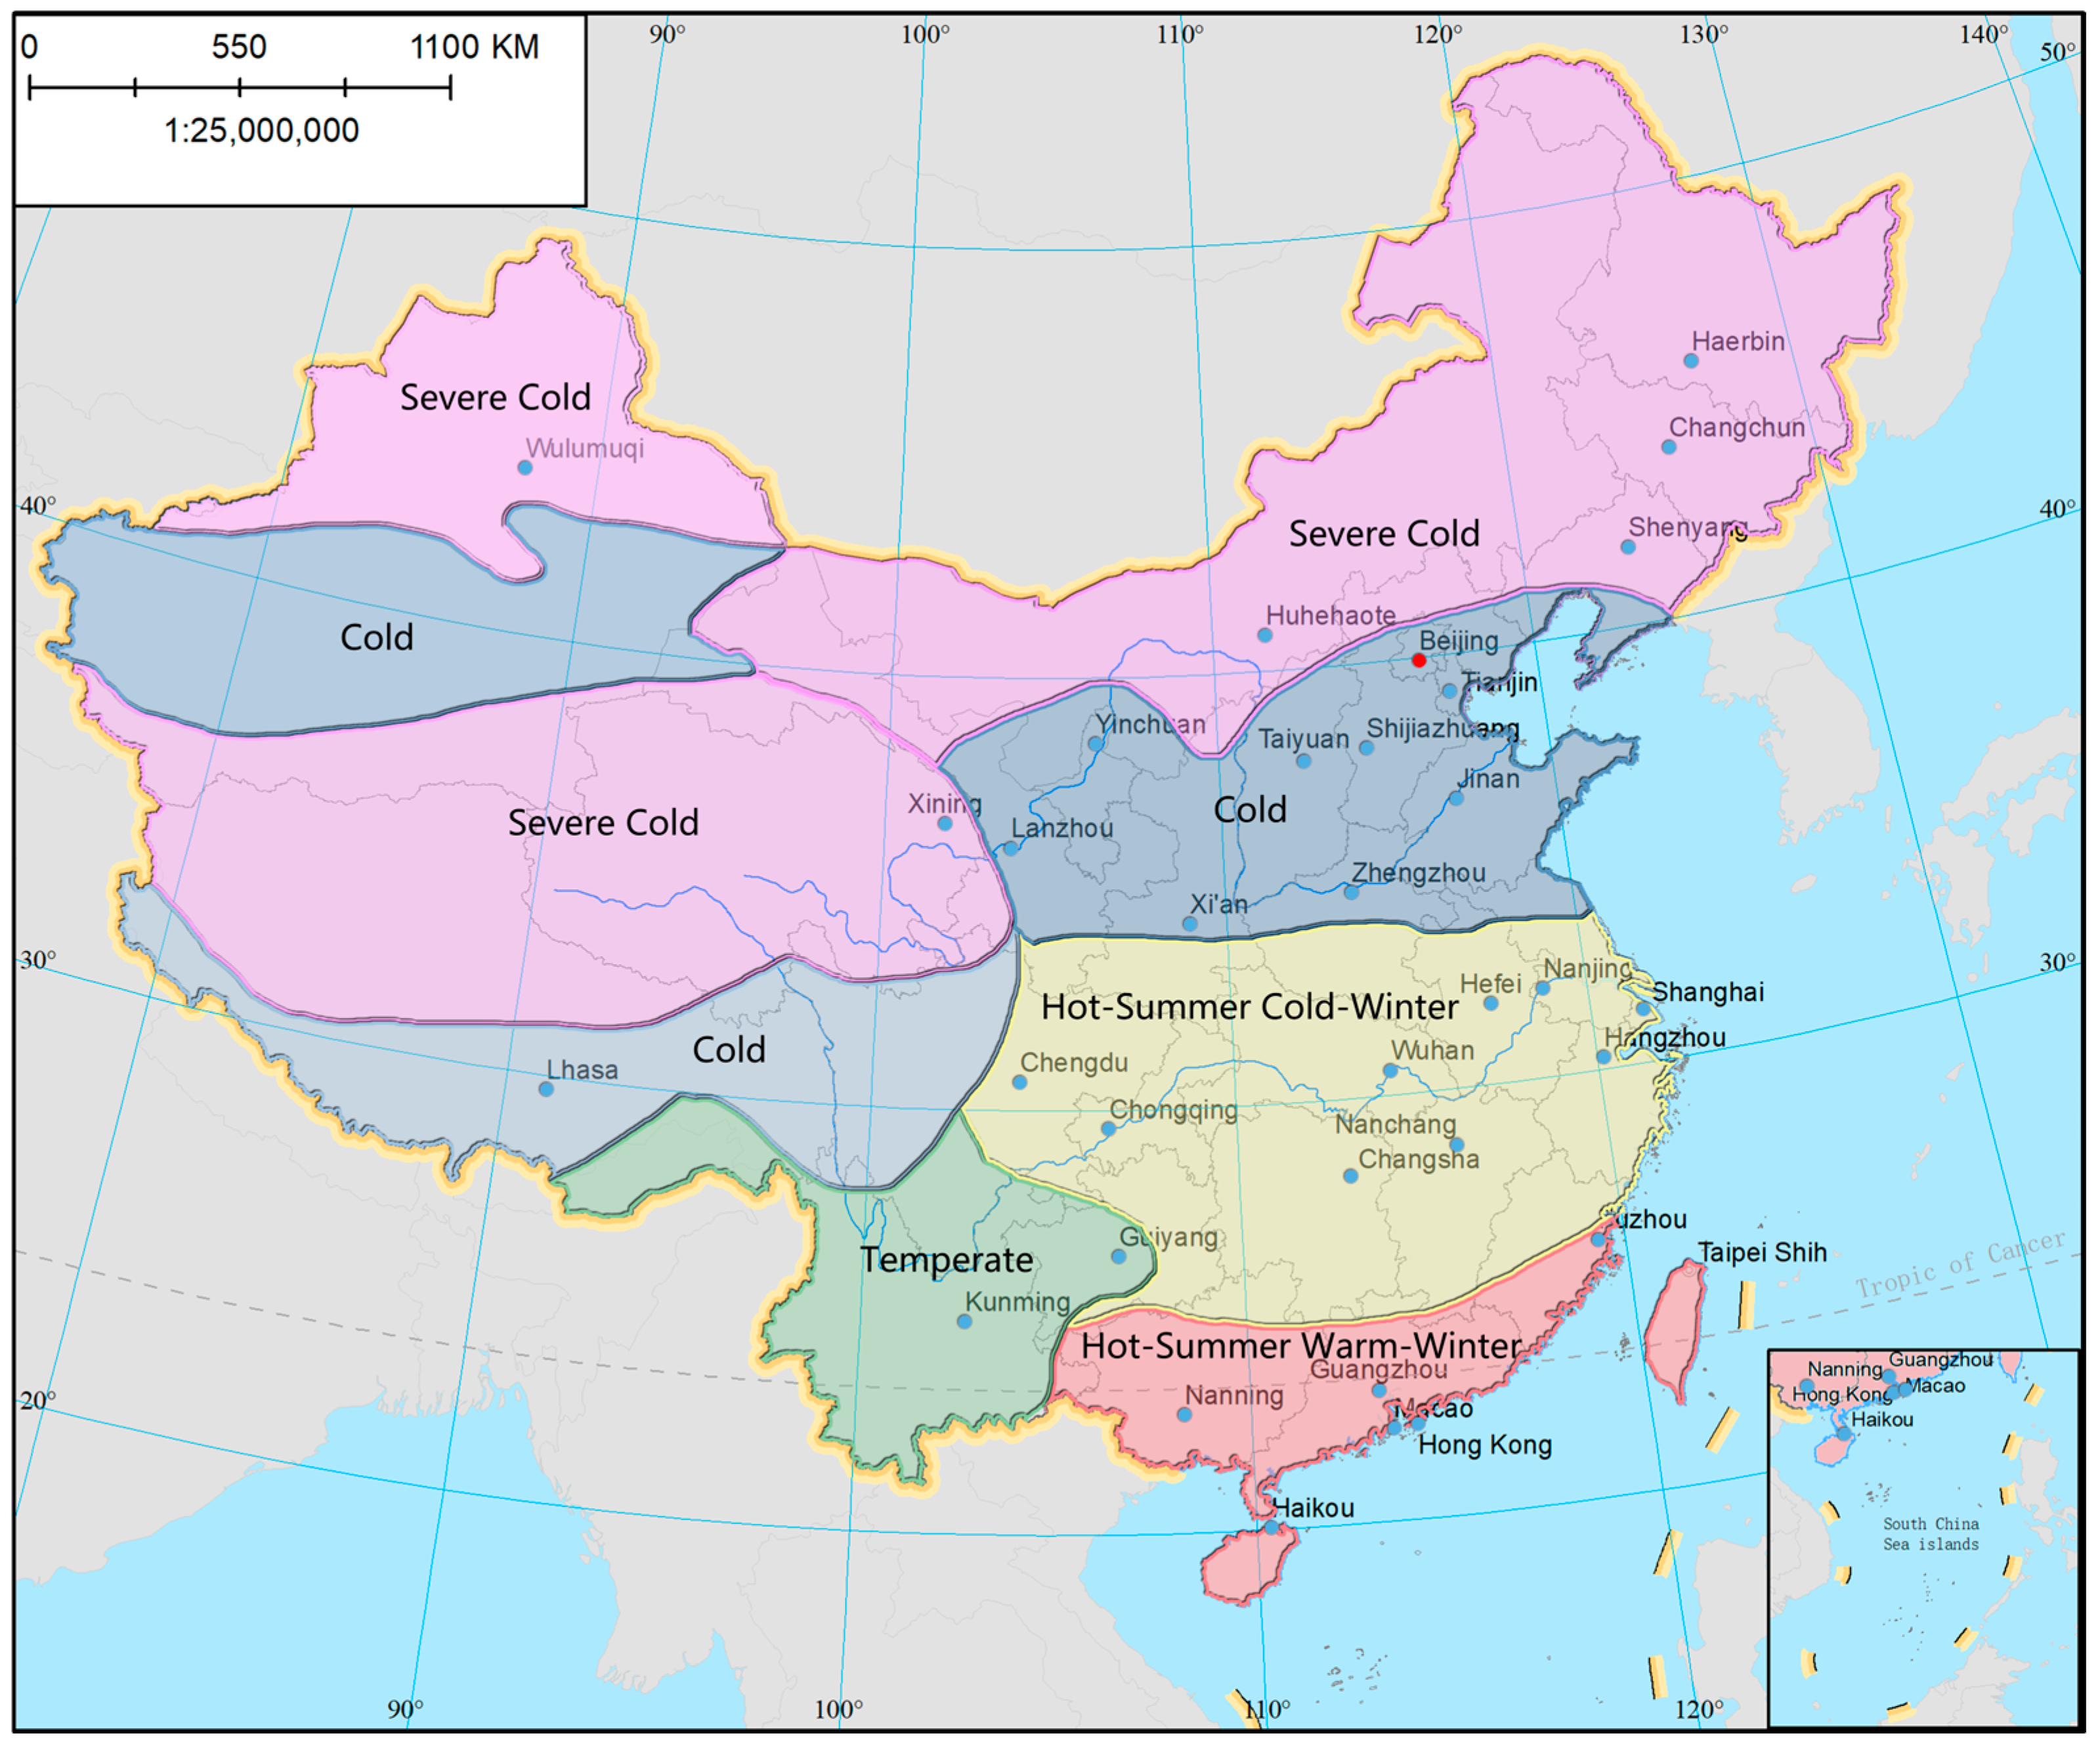
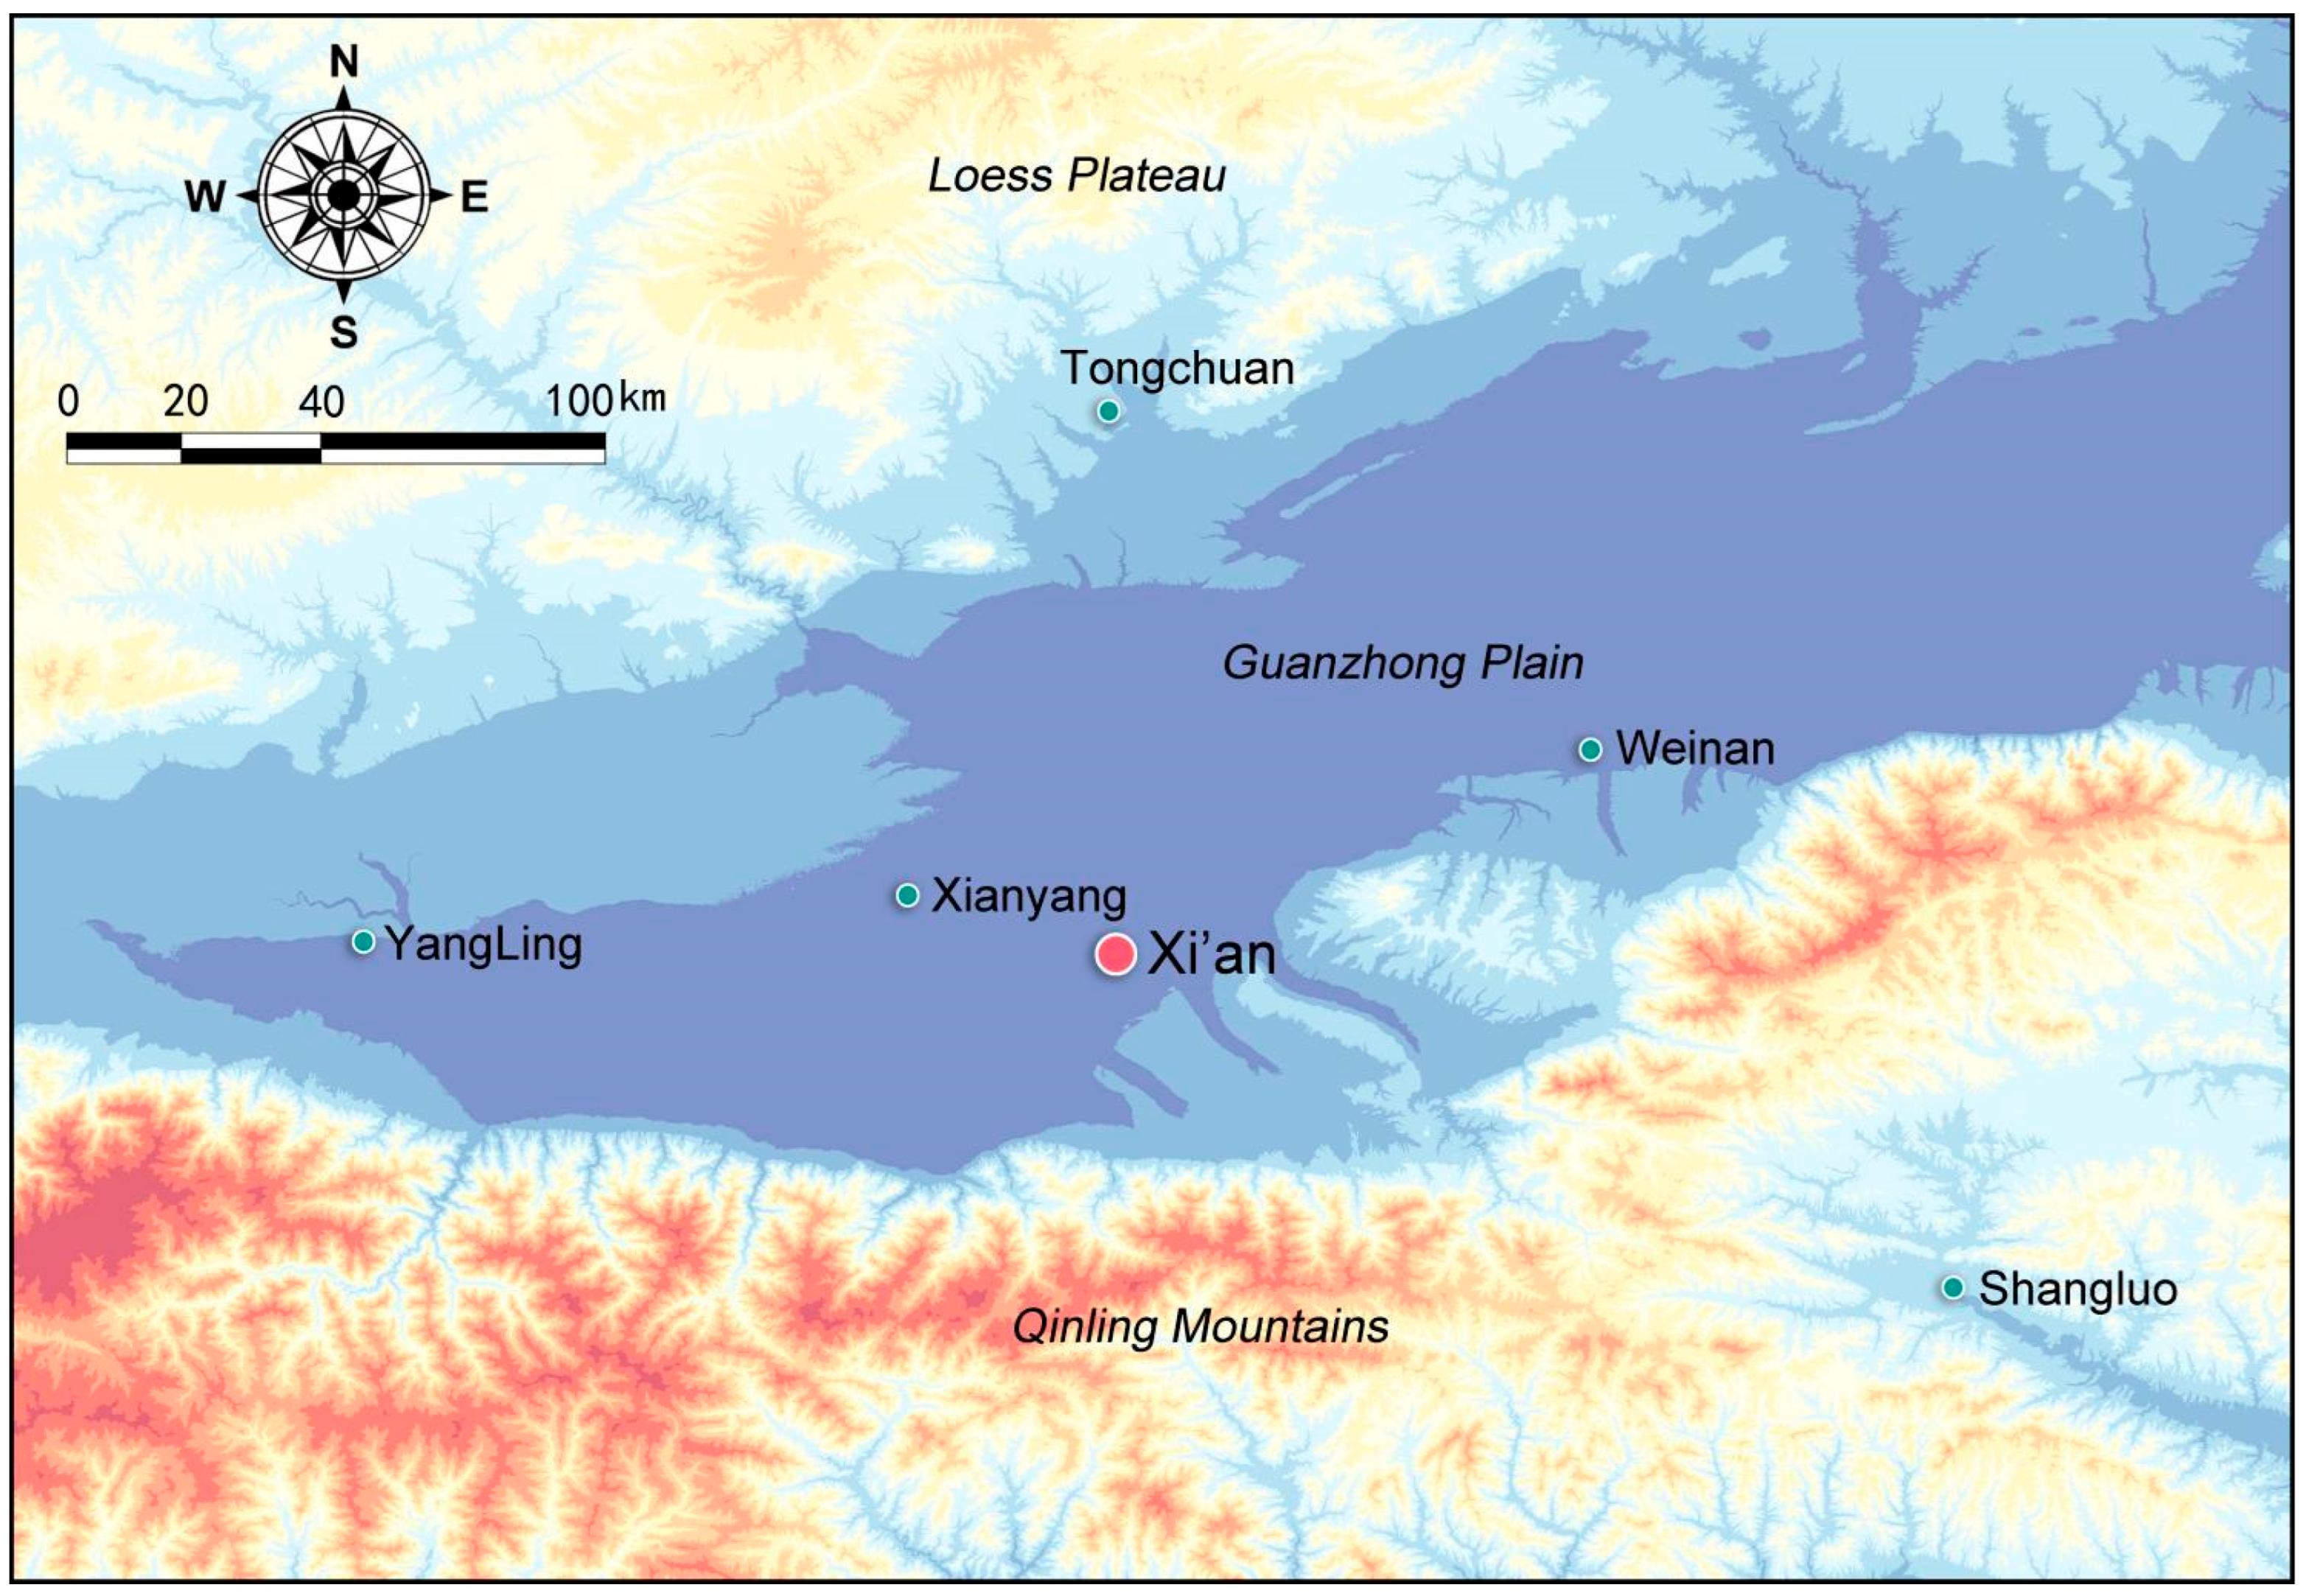
The study area selected for this research is Xi’an, the capital of Shaanxi Province, located in Northwest China (34°16′ N, 108°56′ E) at an average elevation of approximately 410 m. According to China’s building climate classification standard (GB 50176-2016) [
86], Xi’an belongs to the cold climatic zone and represents a typical cold–dry continental climate. Its location in the Guanzhong Basin, bounded by the Qinling Mountains to the south and the Loess Plateau to the north, results in pronounced diurnal temperature variation, long heating seasons, and relatively low atmospheric humidity (
Figure 3). These characteristics make Xi’an a representative case for investigating thermal–economic optimization of wall insulation systems in inland cold regions.
Based on long-term meteorological records from the China Meteorological Administration (CMA), Xi’an has an annual mean temperature of approximately 13.1 °C. Winter conditions are cold and dry, with January mean minimum temperatures ranging from −5 °C to −8 °C, while summer maximum temperatures may exceed 35 °C. The annual heating degree days (HDD) are approximately 3200–3400 °C·day, whereas cooling degree days (CDD) are relatively low (400–600 °C·day), indicating a heating-dominated energy demand profile for residential buildings.
Annual precipitation averages about 560 mm, with more than 65% occurring between June and September. During winter, relative humidity frequently falls below 40%, and the annual mean relative humidity is approximately 55%, which is considerably lower than that of humid continental regions in central and eastern China. Xi’an also receives relatively high solar radiation, with an annual total of approximately 5500 MJ/m2, influencing both transient wall heat transfer and potential passive solar gains.
The heating season in Xi’an typically extends from mid-November to late March, lasting approximately 145–155 days. Indoor design temperatures during this period are maintained at 18 °C in accordance with the Design Standard for Energy Efficiency of Residential Buildings in Cold and Severe Cold Zones (JGJ26–2021). The resulting indoor–outdoor temperature difference commonly exceeds 20 °C, causing conductive heat transfer through external walls to become a dominant contributor to heating demand. Previous studies indicate that external walls may account for 35–45% of total heat loss in typical residential buildings under such conditions.
In addition to climatic factors, Xi’an reflects construction practices common to Northwest China, including extensive use of prefabricated lightweight wall systems and external insulation. Variations in construction quality and material aging have led to inconsistent thermal performance, particularly in buildings constructed before 2010. These characteristics, combined with local energy prices and household income levels, highlight the importance of identifying insulation solutions that balance thermal effectiveness and economic feasibility.
The monthly variation of temperature, relative humidity, solar radiation, and precipitation in Xi’an is summarized in
Table 4. Overall, the combined effects of cold winters, low humidity, strong solar radiation, and a heating-dominated energy profile establish Xi’an as an appropriate and representative case for developing climate-responsive insulation optimization strategies applicable to cold–dry continental regions.
2.3. Experimental Methodology
2.3.1. Experimental Setup and Boundary Conditions
The experimental campaign was designed to determine the steady-state thermal transmittance (U-value) of multilayer wall assemblies incorporating three insulation materials—expanded polystyrene (EPS), extruded polystyrene (XPS), and rock wool (RW)—commonly used in residential buildings in Northwest China. All experiments were conducted in the Building Physics Laboratory of Xi’an Technological University between November 2023 and January 2024 under controlled indoor environmental conditions. The measurements followed the guarded hot-box method in accordance with ISO 8990:1994 [
85] and the Chinese standard GB/T 13475–2021 [
87], which specify standardized procedures for evaluating heat transfer through building envelope components.
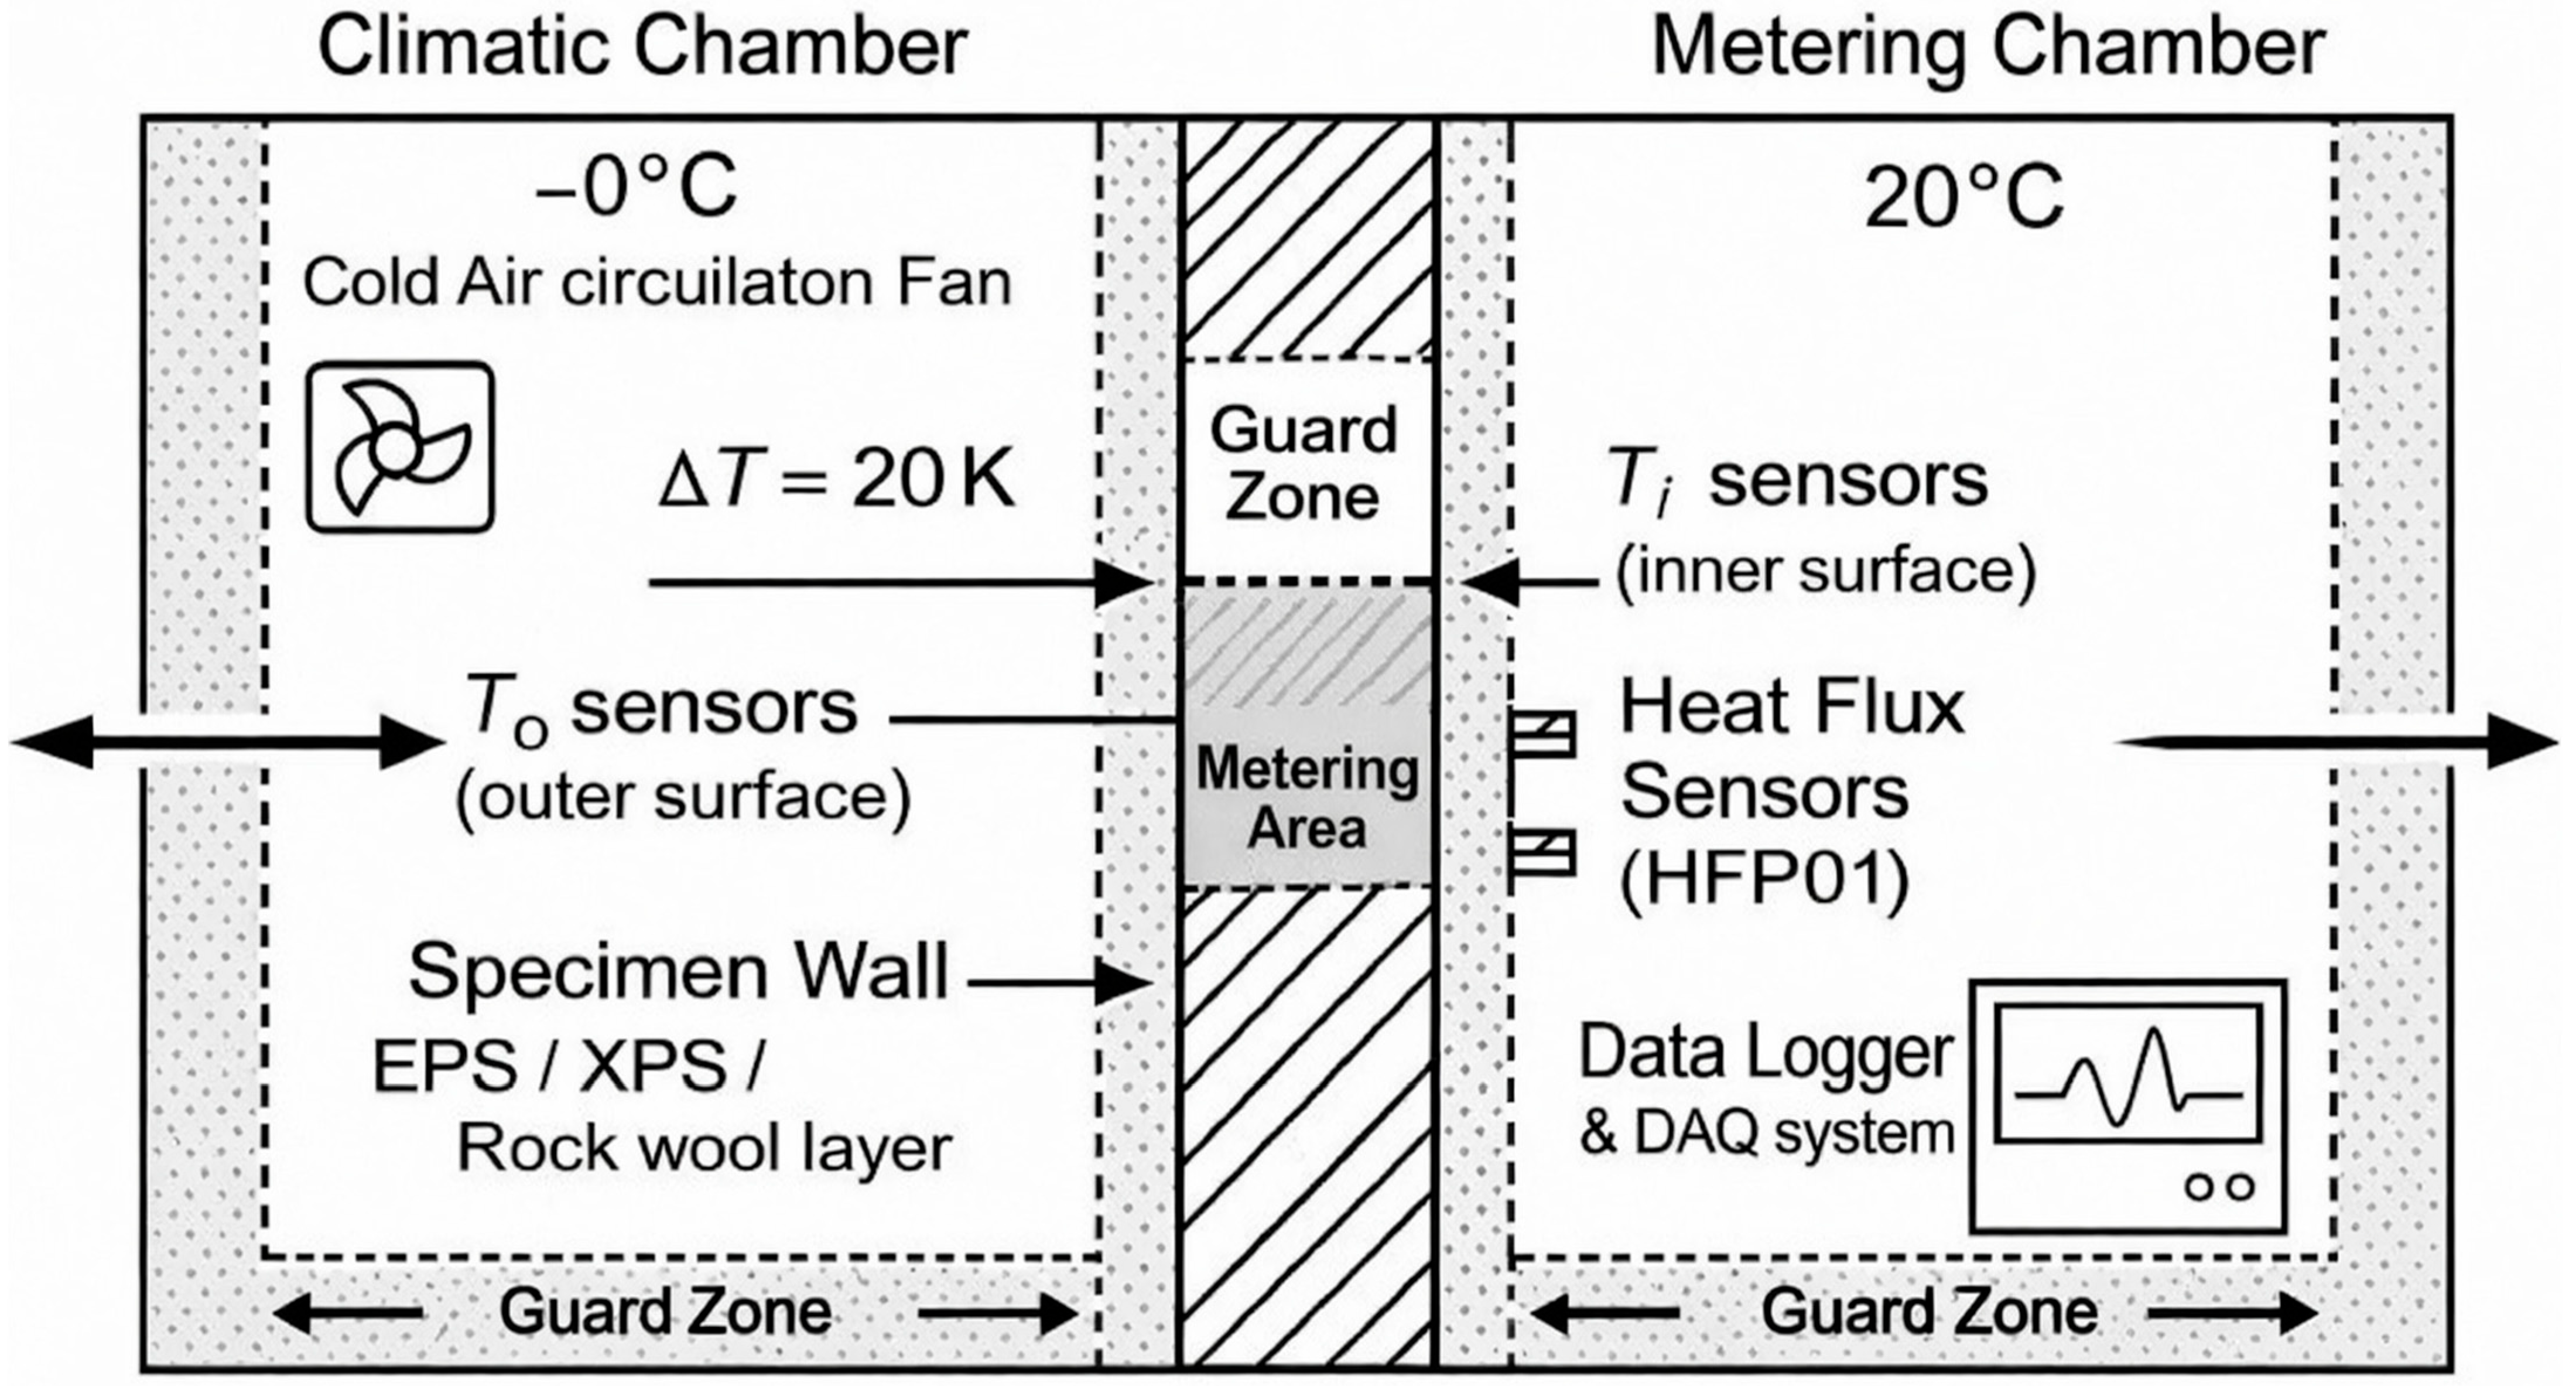
The guarded hot-box apparatus consisted of a metering chamber (0.8 m × 0.8 m × 0.4 m) and a climatic chamber (1.0 m × 1.0 m × 0.6 m), separated by the test specimen. The metering chamber represented indoor conditions and was maintained at 20 ± 0.5 °C, while the climatic chamber simulated outdoor winter conditions at 0 ± 0.5 °C, corresponding to typical heating-season conditions in Xi’an. A surrounding guard zone was employed to minimize lateral heat loss, ensuring that one-dimensional heat transfer through the metering area dominated the measured heat flow, as required by ISO 8990. During all steady-state tests, the temperature difference between the guard zone and the metering area was maintained within ±0.3 °C. This indicates that lateral heat transfer was negligible and confirms the effective operation of the guarded hot-box system in accordance with ISO 8990.
Type-T thermocouples (accuracy ±0.2 °C) were installed at twelve uniformly distributed locations on both the warm-side and cold-side surfaces of each specimen to monitor surface temperature distribution and verify thermal stability. Surface heat flux density was measured using calibrated heat-flux transducers (HFP01, Hukseflux (Hukseflux Thermal Sensors B.V., Delft, The Netherlands); accuracy ±3%) positioned at three representative locations within the metering area. Data were recorded at one-minute intervals using a NI CompactDAQ data acquisition system. Each test was conducted for at least 12 h, and only data obtained after steady-state conditions were achieved were used for subsequent analysis.
Each wall specimen measured 1000 mm × 1000 mm, with total thickness ranging from 250 to 350 mm depending on insulation type and thickness. The base wall assembly consisted of a 200 mm aerated concrete block (thermal conductivity λ = 0.42 W/m·K; density ρ = 600 kg/m3) finished with a 20 mm interior plaster layer. External insulation layers were applied using cementitious adhesive and protected by a 10 mm exterior render. Insulation thicknesses of 30 mm, 50 mm, and 70 mm were tested for each material to enable parametric comparison.
A schematic front view of the guarded hot-box experimental setup and sensor arrangement is shown in
Figure 4.
2.3.2. Data Processing and Thermal Transmittance Calculation
Under steady-state conditions, the surface heat flux through the specimen was evaluated based on Fourier’s law of heat conduction. Steady state was assumed to be reached when surface temperature variations on both sides of the specimen remained within ±0.3 °C for a continuous period of at least 2 h, in accordance with ISO 8990 requirements. The measured heat flux density was averaged spatially and temporally over this period to reduce random fluctuations. The total thermal resistance of the wall assembly was calculated as:
where
Ti and
T0 are the average warm-side and cold-side surface temperatures, respectively, and
q is the measured steady-state heat flux density (W/m
2). The overall thermal transmittance (U-value) was then calculated as:
where
Rsi and
Rso represent the internal and external surface resistances, taken as 0.13 and 0.04 m
2·K/W, respectively, in accordance with JGJ26–2021, and
Rw is the measured thermal resistance of the wall assembly excluding surface resistances. In this study, the experimentally derived thermal resistance
Rw represents the wall assembly excluding standardized internal and external surface resistances. The surface resistances (
Rsi and
Rso) are added only when calculating the effective U-value for building energy simulation, in accordance with JGJ26–2021.
Measurement uncertainty was estimated by considering instrument accuracy (thermocouples and heat-flux sensors), temperature stability, contact resistance, and data acquisition variability. The combined uncertainty of the U-value measurement was estimated to be within ±5%. Repeatability tests performed on identical EPS specimens yielded deviations within ±3.2%, confirming the reliability and reproducibility of the experimental procedure. Repeatability checks were performed for all insulation materials at representative thicknesses; EPS results are reported as a conservative example, while deviations for XPS and rock wool remained within the same uncertainty range.
2.3.3. Application of Experimental Data
The experimentally determined U-values obtained from the guarded hot-box tests were subsequently adopted as calibrated thermal parameters for numerical simulation. These values were directly implemented as external wall thermal transmittance inputs in the DeST-h model, ensuring consistency between laboratory measurements and building-scale energy simulations.
By using experimentally derived thermal parameters rather than literature-based assumptions, uncertainty in the simulation of envelope heat transfer was reduced. A detailed presentation and comparative analysis of the measured U-values and corresponding thermal resistances are provided in
Section 3.2.
2.4. Simulation Methodology
2.4.1. Model Development and Baseline Building
Dynamic energy simulations were performed using DeST-h (Design Simulation Tool for Heat Balance), a building energy modeling platform developed by Tsinghua University and widely used for building energy analysis in China. DeST-h employs an hourly heat-balance algorithm driven by meteorological data to evaluate heat transfer through envelope components and to estimate annual heating and cooling energy demand. The purpose of simulation in this study was to translate laboratory-measured thermal transmittance values into building-scale annual energy performance under Xi’an’s climatic conditions.
A representative six-story residential building was modeled according to the reference typology and compliance requirements specified in JGJ26-2021. The conditioned gross floor area was 2880 m2 (480 m2 per floor). The window system was modeled as double glazing (U = 2.6 W/m2·K; SHGC = 0.45) with an overall window-to-wall ratio consistent with the reference building. Internal heat gains were assigned based on occupants and appliances at 3.5 W/m2 and 5.0 W/m2, respectively. Space conditioning was modeled using a centralized system with a seasonal efficiency of 75%.
2.4.2. Weather Data, Boundary Conditions, and Input Parameters
The weather file used in DeST-h was based on a typical meteorological year (TMY) dataset for Xi’an derived from long-term meteorological records, including hourly dry-bulb temperature, relative humidity, wind speed, and solar radiation. Simulations were performed for a full annual cycle (8760 h). Heating and cooling setpoints were specified as 20 °C and 26 °C, respectively, consistent with common residential operation assumptions and relevant standards. Specifically, the TMY file was generated based on long-term hourly meteorological data obtained from the China Meteorological Administration (CMA) for the Xi’an meteorological station (Station ID: 57036), covering the period 1991–2020. The typical meteorological year was constructed following the standard statistical selection procedure recommended by CMA, in which representative months are selected to reproduce long-term climatic characteristics. For transparency and reproducibility, the key simulation input parameters are summarized in
Table 5, while the complete set of model inputs and schedules is provided in
Supplementary Table S1.
Measured U-values obtained from the guarded hot-box tests were directly implemented as the external-wall thermal transmittance for each insulation configuration. Other envelope parameters were held constant across scenarios to isolate the effect of insulation materials and thickness. Key envelope parameters are summarized in
Table 6, while a complete list of model inputs (geometry, schedules, system settings, and boundary conditions) is provided in
Supplementary Table S1 to ensure reproducibility. Raw experimental time-series data are available from the corresponding author upon reasonable request.
Infiltration was set to 0.7 air changes per hour (ACH). Heating system operation followed a daily schedule of 07:00–22:00 during the heating season, while cooling operation was applied based on setpoint control during summer conditions. For each insulation case, DeST-h produced hourly zone loads and annual heating/cooling energy intensities (kWh/m2·year), which were subsequently used as inputs to the life-cycle cost analysis.
2.4.3. Model Calibration and Validation
To enhance the reliability of simulation-based energy estimates, the DeST-h model was calibrated using experimentally measured steady-state heat flux data obtained from guarded hot-box tests. Under controlled boundary conditions (20 °C indoor/0 °C outdoor), the simulated heat flux through the external wall was compared with corresponding experimental measurements for representative insulation configurations (e.g., EPS–50 mm).
Model calibration performance was evaluated using standard statistical indicators, including the normalized mean bias error (NMBE) and the coefficient of variation of the root mean square error (CV(RMSE)), in accordance with the criteria recommended by ASHRAE Guideline 14–2014. The calibration procedure ensured that discrepancies between simulated and measured steady-state heat fluxes remained within acceptable tolerance limits, thereby confirming the suitability of the calibrated model for subsequent annual energy simulations. The calibration performance indicators for the validated insulation cases are summarized in
Table 7. For all cases, both NMBE and CV(RMSE) satisfy the acceptance criteria recommended by ASHRAE Guideline 14.
2.5. Life-Cycle Cost Analysis and Optimization Method
To determine the economically optimal insulation configuration, a life-cycle cost (LCC) analysis was conducted by integrating experimentally calibrated thermal performance with simulation-based annual energy demand. The LCC framework was employed as a decision-support method to identify the insulation thickness that minimizes total cost over the service life of the external wall system, rather than to provide a detailed economic interpretation at this stage.
2.5.1. Life-Cycle Cost Formulation
Given that residential buildings in Xi’an are heating-dominated, the LCC analysis focused on heating-related energy consumption. The analysis period was set to 25 years, corresponding to the typical service life of external thermal insulation systems in residential buildings under local construction practice. The total life-cycle cost per unit wall area,
CLCC (CNY/m
2), was calculated as:
where
C0 is the initial investment (CNY/m
2),
Et is the annual heating energy consumption (kWh/m
2·year),
Pe is the unit energy price (CNY/kWh),
r is the discount rate, and
N is the service life (years).
Annual energy demand values were derived directly from the DeST-h simulation results for each insulation material and thickness configuration. This approach ensures consistency between the thermal simulation and the economic evaluation, as both are based on the same experimentally calibrated envelope parameters.
2.5.2. Economic Assumptions and Input Parameters
Economic parameters were selected to reflect local market conditions in Xi’an. The unit energy price was set to 0.70 CNY/kWh, representing the equivalent cost of space-heating energy under current residential tariffs. The real discount rate was assumed to be 5%, consistent with the China Construction Cost Index (2023) and commonly adopted values in building life-cycle assessments.
Initial insulation investment costs were obtained from local market surveys conducted in 2024 and scaled linearly with insulation thickness. Reference costs for a 50 mm insulation layer were used as baseline values: 45 CNY/m2 for EPS, 55 CNY/m2 for XPS, and 50 CNY/m2 for rock wool. Installation and finishing costs were assumed to be included in these values. Maintenance and replacement costs were not considered, as external insulation systems are generally designed to operate without major replacement within the selected analysis period.
2.5.3. Optimization Criterion and Decision Rule
The optimization objective was defined as minimizing the total life-cycle cost CLCC for each insulation material. For a given material, multiple insulation thicknesses were evaluated, and the configuration corresponding to the minimum CLCC was identified as the economically optimal solution.
Rather than employing complex multi-objective algorithms, the optimization followed a transparent sequential procedure: (i) experimentally measured thermal transmittance values were used to calibrate dynamic energy simulations; (ii) simulated annual heating energy demand served as input to the LCC calculation; and (iii) the insulation thickness yielding the minimum life-cycle cost was selected. This decision-oriented approach prioritizes physical traceability and reproducibility, allowing the optimization process to be readily replicated for other climatic regions or economic conditions.
The resulting optimal insulation thicknesses and associated economic indicators were subsequently analyzed and compared in the Results section.
3. Results and Analysis
3.1. Model Validation
Prior to the analysis of annual energy performance and life-cycle cost outcomes, the accuracy of the DeST-h simulation model was evaluated through comparison with controlled laboratory measurements obtained from guarded hot-box experiments. The validation focused on steady-state heat transfer behavior of representative wall assemblies under identical boundary conditions.
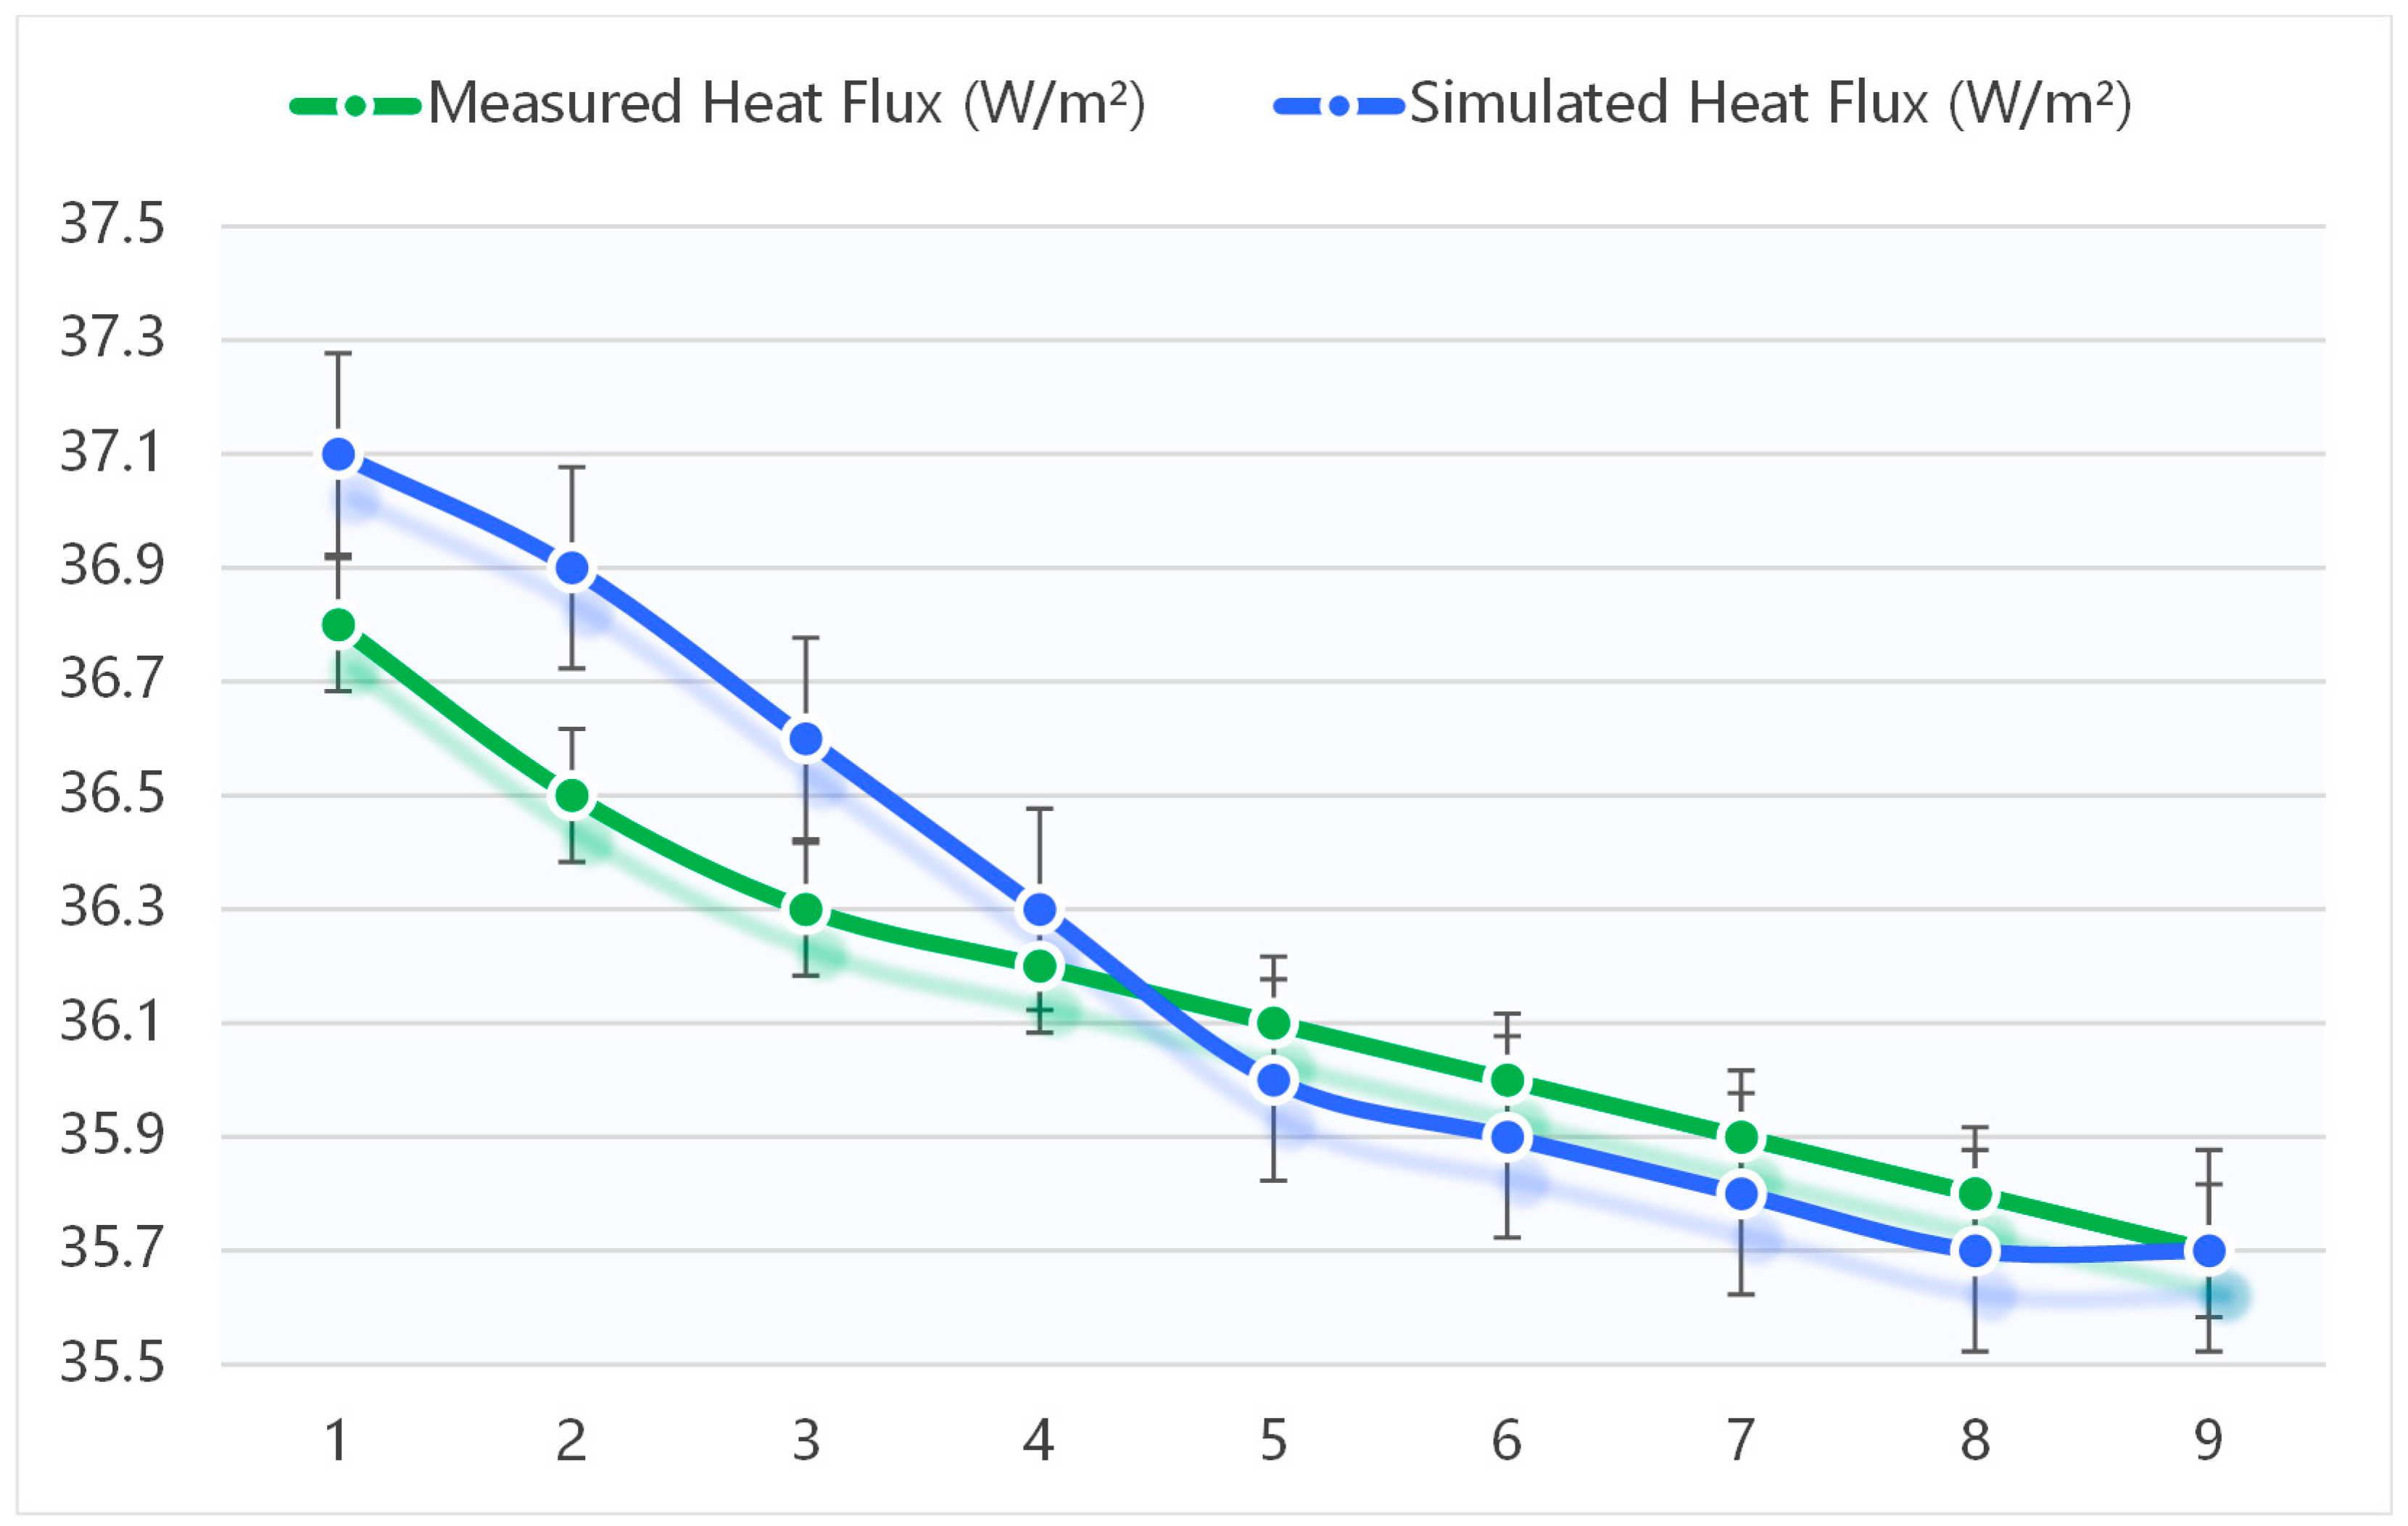
Figure 5 illustrates the comparison between experimentally measured and simulated steady-state heat fluxes for the EPS–50 mm insulation configuration. The simulated results exhibit strong agreement with the experimental data, with a coefficient of determination of R
2 = 0.97 and a mean relative deviation below 5%. The close correspondence between the two curves indicates that the calibrated DeST-h model is capable of reliably reproducing the measured heat-transfer characteristics of the wall assembly.
It should be noted that the experimentally measured U-values reported in this study correspond to the wall assembly thermal transmittance excluding standardized surface resistances (
Rsi and
Rso), as derived directly from guarded hot-box measurements. In contrast, the U-values implemented in the DeST-h simulation represent effective operational U-values, in which surface heat-transfer coefficients are explicitly considered. To further examine the robustness of the simulation model, the same validation procedure was applied to additional insulation materials. For the XPS-50 mm and rock wool-50 mm wall assemblies, the relative deviations between simulated and measured heat fluxes were 5.1% and 6.3%, respectively, as summarized in
Table 5. Across all validated cases, the simulation results show a slight tendency to underestimate heat loss by approximately 2–4%, while remaining well within the ±10% tolerance recommended by ASHRAE Guideline 14–2014.
A direct comparison of thermal transmittance values further confirms the consistency between experimental and numerical results. For the 50 mm insulation cases, the experimentally measured U-values were 0.45 W/m2·K for EPS, 0.41 W/m2·K for XPS, and 0.49 W/m2·K for rock wool, whereas the corresponding simulated values were 0.44, 0.40, and 0.47 W/m2·K, respectively. The differences, all within 0.02 W/m2·K, indicate a high level of agreement between the two approaches.
Overall, the validation results demonstrate that the calibrated DeST-h model provides a reliable representation of heat transfer through multilayer wall systems. This level of accuracy supports the application of the simulation model in subsequent analyses of annual heating and cooling energy demand, as well as in the life-cycle cost optimization of insulation systems under the cold–dry climatic conditions of Northwest China. Before conducting the full-scale energy and cost analyses, it was necessary to validate the reliability of the simulation model by comparing it with controlled laboratory measurements. The guarded hot-box experiment provided steady-state heat flux data for each wall configuration, while the DeST-h model simulated the same thermal conditions using measured boundary parameters.
3.2. Thermal Performance of Different Insulation Materials
The thermal performance of external wall insulation systems was evaluated based on experimentally measured steady-state thermal transmittance obtained from guarded hot-box tests. Three insulation materials—expanded polystyrene (EPS), extruded polystyrene (XPS), and rock wool (RW)—were investigated at thicknesses of 30 mm, 50 mm, and 70 mm, representing typical design ranges used in residential buildings in cold regions of Northwest China. For clarity, it should be emphasized that the uninsulated base wall adopted in this study serves solely as an internal reference for evaluating the relative thermal and energy performance of different insulation configurations, and does not represent the regulatory baseline used in national energy-efficiency standards.
The measured U-values and corresponding thermal resistances of all tested wall assemblies are summarized in
Table 8, together with the relative reduction in heat loss compared with the uninsulated reference wall.
As shown in
Table 7, increasing insulation thickness leads to a clear reduction in thermal transmittance for all materials. However, the magnitude of improvement decreases as thickness increases. Specifically, increasing insulation thickness from 30 mm to 50 mm results in a substantial reduction in U-value, whereas further thickening from 50 mm to 70 mm yields a noticeably smaller incremental improvement. This pattern indicates a diminishing marginal effect, whereby additional insulation produces progressively smaller reductions in conductive heat loss.
Clear differences are observed among the insulation materials. XPS consistently exhibits the lowest U-values at equivalent thicknesses, reflecting its closed-cell microstructure, which limits internal air convection and moisture penetration. EPS shows intermediate performance due to its bead-expanded structure, while rock wool presents relatively higher U-values, likely associated with its fibrous texture and higher intrinsic thermal conductivity under dry winter conditions.
The results further indicate that material selection has a greater influence on overall wall thermal performance than marginal increases in insulation thickness beyond approximately 50 mm. For example, the U-value achieved with 50 mm of XPS insulation is comparable to that obtained with 70 mm of EPS insulation. This suggests that equivalent thermal performance can be achieved with thinner insulation layers by selecting materials with superior thermal properties, offering practical advantages in wall thickness control and construction efficiency.
In addition to steady-state performance, the transient thermal response under typical diurnal temperature variations was examined. At a thickness of 50 mm, the reduction in inner surface temperature amplitude reached approximately 42% for XPS, 39% for EPS, and 36% for rock wool. This buffering effect contributes to improved indoor thermal stability and reduced short-term heating load fluctuations.
Overall, the experimental results demonstrate that insulation thicknesses beyond approximately 50 mm yield diminishing thermal returns under the cold and dry climatic conditions of Northwest China. Among the tested materials, XPS provides the most effective reduction in heat transfer at all thickness levels. These experimentally derived thermal characteristics provide a robust basis for the subsequent dynamic energy simulation and life-cycle cost evaluation.
3.3. Life-Cycle Cost Optimization
To identify the economically optimal insulation configuration, a life-cycle cost (LCC) analysis was conducted for each insulation material and thickness level by integrating initial investment costs with long-term operational energy savings. The analysis focuses on the economic performance of insulation systems over a representative service life, allowing a direct comparison between different materials and thicknesses under consistent climatic and economic conditions.
3.3.1. Annual Energy Consumption
The annual heating and cooling energy demands simulated using the DeST-h model, based on experimentally calibrated thermal parameters, are summarized in
Table 9. The results demonstrate a strong dependence of building energy consumption on both insulation material and thickness.
As shown in
Table 9, increasing insulation thickness from 30 mm to 50 mm leads to a substantial reduction in annual heating energy demand for all materials. In contrast, further increases beyond 50 mm result in comparatively small additional reductions, typically less than 3% of total annual energy use. Among the tested materials, XPS consistently exhibits the lowest annual energy consumption, achieving an average reduction of approximately 24% relative to the uninsulated baseline. EPS shows slightly lower savings, while rock wool delivers the smallest reduction, reflecting its higher thermal conductivity and reduced effectiveness under dry winter conditions.
Cooling energy demand shows only minor variation across insulation configurations, indicating that the primary contribution of wall insulation in Xi’an’s climate lies in reducing heating loads rather than cooling energy use.
3.3.2. Economic Evaluation and Optimal Thickness
The economic performance of different insulation materials and thicknesses was evaluated using life-cycle cost (LCC) analysis, and the results are summarized in
Table 10. The table presents the initial insulation cost, annual energy cost, total life-cycle cost over a 25-year period, and the corresponding payback period for each configuration.
As shown in
Table 10, all insulated wall configurations exhibit lower total life-cycle costs than the uninsulated baseline, indicating that the application of external insulation is economically justified under current local energy prices. However, clear differences are observed among insulation thicknesses and material types.
For all three insulation materials, the total LCC initially decreases with increasing insulation thickness and then rises again, forming a typical U-shaped trend. In the case of EPS insulation, the minimum LCC (1206 CNY/m2) occurs at a thickness of 50 mm, compared with 1244 CNY/m2 at 30 mm and 1228 CNY/m2 at 70 mm. This indicates that increasing EPS thickness beyond 50 mm leads to higher total costs despite continued reductions in annual energy expenditure.
A similar pattern is observed for XPS insulation. The 50 mm configuration yields the lowest total LCC (1185 CNY/m2), outperforming both the thinner 30 mm option (1222 CNY/m2) and the thicker 70 mm option (1210 CNY/m2). Owing to its superior thermal performance, XPS also achieves the shortest payback period among all tested materials, approximately 6.2 years at the optimal thickness.
For rock wool insulation, the economic optimum is likewise observed at 50 mm thickness, with a total LCC of 1215 CNY/m2. Thinner insulation (30 mm) results in higher annual energy costs and a longer payback period (7.6 years), while thicker insulation (70 mm) increases the initial investment and extends the payback period to approximately 8.0 years, without delivering proportionate additional energy savings.
Comparison across materials indicates that XPS consistently delivers the most favorable economic performance at its optimal thickness, followed closely by EPS, while rock wool exhibits slightly higher life-cycle costs due to its higher material cost and comparatively lower thermal efficiency. At the optimal thickness of 50 mm, the total LCC values are 1185 CNY/m2 for XPS, 1206 CNY/m2 for EPS, and 1215 CNY/m2 for rock wool.
The corresponding payback periods further confirm the economic advantage of the 50 mm insulation thickness. For all materials, payback periods are minimized at this thickness, whereas increasing insulation thickness to 70 mm extends the payback period despite marginal reductions in annual energy costs. These results demonstrate that, under current economic and climatic conditions in Xi’an, insulation thicknesses beyond 50 mm are not economically optimal.
In addition, a qualitative sensitivity assessment indicates that the economic optimum is moderately influenced by external economic parameters. Higher energy prices tend to favor slightly thicker insulation, whereas higher discount rates reduce the present value of long-term energy savings and thus shift the optimum toward thinner configurations. These trends suggest that policy measures such as energy subsidies or low-interest financing could enhance the economic attractiveness of higher-performance insulation systems.
4. Discussion
4.1. Physical Interpretation of Thermal Results
The combined experimental measurements (
Table 7) and model validation results (
Figure 5) indicate that increasing insulation thickness from 30 mm to 50 mm produces the most substantial reduction in thermal transmittance, whereas further thickening to 70 mm yields progressively diminishing gains. This non-linear behavior reflects fundamental characteristics of heat transfer in multilayer building envelopes.
From a macroscopic heat-transfer perspective, the initial addition of insulation significantly suppresses conductive heat flow through the opaque wall assembly. Once this dominant conduction pathway is effectively reduced, the overall heat loss becomes increasingly governed by boundary-related factors that do not scale proportionally with insulation thickness. These include surface film resistances, local thermal bridges at structural junctions, and heat transfer through adjacent envelope components such as window frames and slab edges. As a result, further increases in insulation thickness beyond a certain threshold lead to diminishing reductions in the overall U-value.
Differences in thermal performance among insulation materials can be explained by their distinct microstructural characteristics. XPS, characterized by a closed-cell pore structure, exhibits limited internal air movement and stable thermal conductivity under cold and dry conditions. EPS, composed of fused expanded beads, contains interstitial voids that allow minor micro-convective effects, resulting in moderately higher effective thermal conductivity. Rock wool, with its fibrous and highly porous structure, is more susceptible to air movement and moisture interaction, which can increase heat transfer under conditions of large diurnal temperature variation. These material-level mechanisms provide a consistent physical explanation for the experimentally observed ranking of thermal performance (XPS outperforming EPS and rock wool at identical thicknesses).
Beyond steady-state conditions, dynamic thermal behavior further clarifies the observed performance trends. Increasing insulation thickness dampens the amplitude of heat-flux fluctuations across the wall and delays the transmission of outdoor temperature variations to the indoor environment. This thermal buffering effect is particularly relevant in continental climates such as Xi’an, where pronounced day–night temperature swings are common during the heating season. However, once a moderate level of insulation is achieved, additional thickness contributes relatively little to further stabilizing indoor conditions, as internal heat gains and solar radiation partially offset daytime heat losses. This dynamic response reinforces the saturation effect observed in steady-state thermal metrics.
The interaction between insulation performance and air infiltration also plays a critical role in determining real-world heat loss. While laboratory measurements isolate conductive heat transfer, actual buildings experience convective losses through cracks, joints, and service penetrations. As infiltration increases, the relative contribution of wall conduction to total heat loss decreases, thereby reducing the marginal benefit of additional insulation. This interaction highlights the importance of integrating insulation design with airtightness strategies, particularly in windy and dry winter climates.
Thermal bridging at structural discontinuities further constrains the effectiveness of increasing insulation thickness. As conductive heat transfer through the insulated wall is reduced, localized bridges become a proportionally larger component of total heat loss. This explains why the overall thermal benefit of increasing insulation thickness from 50 mm to 70 mm is limited, despite measurable improvements in the insulation layer itself. In practical terms, continuous insulation detailing and thermal-bridge mitigation can deliver greater energy benefits than simply increasing insulation thickness.
The strong agreement between experimental measurements and numerical simulations (
Figure 5) confirms the reliability of the calibrated modeling approach and supports the physical interpretations discussed above. Together, the results demonstrate that, under the cold and dry climatic conditions of Northwest China, insulation optimization is governed by a balance between material properties, envelope boundary effects, and climatic dynamics. From a thermal standpoint, an insulation thickness of approximately 50 mm represents a practical equilibrium, beyond which further increases yield limited additional benefit when evaluated at the building scale.
4.2. Climatic Applicability and Transferability
Although the results of this study are derived from Xi’an, their implications extend beyond a single city. Xi’an represents a typical cold–dry continental climate in Northwest China, characterized by moderate-to-high heating degree days, pronounced diurnal temperature variations, and a prolonged heating season. Climatically, this regime lies between the severe-cold regions of Northeast China and the hot-summer–cold-winter transitional zones of central China. As such, Xi’an can be regarded as a representative midpoint for heating-dominated inland climates, allowing the findings of this study to offer transferable insights for other cities in Northwest China, such as Lanzhou, Yinchuan, and Xining, that share similar climatic characteristics.
In these cold–dry continental environments, the thermal behavior of insulation systems is governed not only by steady-state conductive resistance but also by strong radiative forcing, rapid nocturnal cooling, and low atmospheric moisture. Daytime solar radiation can significantly warm exterior wall surfaces under clear winter skies, while rapid radiative heat loss after sunset generates steep reverse temperature gradients across the envelope. Under such cyclic conditions, insulation materials with closed-cell structures, such as XPS and EPS, tend to exhibit stable thermal performance because they effectively resist internal air movement and moisture ingress. In contrast, fibrous materials such as rock wool may display greater variability in effective thermal conductivity when subjected to wind-driven convection and repeated temperature cycling. The experimental results observed in this study—where XPS consistently achieved lower and more stable U-values—are therefore consistent with the intrinsic physical behavior of these materials under continental climatic oscillations.
The transferability of the present findings can be further understood by considering broader climatic gradients. In severe-cold regions, where heating demand is substantially higher and outdoor temperatures remain below freezing for extended periods, the economic and thermal justification for thicker insulation generally increases. Conversely, in temperate or transitional climates, where heating contributes a smaller share of annual building energy use, the cost-optimal insulation thickness tends to be lower. Importantly, the relationship between heating demand and optimal insulation thickness is not linear. While increasing heating degree days enhances the energy-saving potential of insulation, the marginal benefit of additional thickness diminishes as non-conductive losses—such as infiltration, ventilation, and thermal bridging—become increasingly dominant. This general trend is consistent with findings reported in previous international studies conducted under a wide range of climatic conditions.
To contextualize the results obtained for Xi’an within China’s climatic diversity,
Table 10 provides indicative ranges of insulation thickness associated with broad heating-degree-day bands and commonly used insulation materials. These ranges are intended as qualitative guidance rather than prescriptive design values. They illustrate how the engineering logic derived from the Xi’an case—namely, the balance between conductive heat reduction, boundary losses, and economic constraints—can be adapted across different climatic contexts.
From a policy perspective, the findings highlight the importance of regionally differentiated insulation strategies. Current building energy standards often specify insulation requirements primarily based on climate zone classification, with limited consideration of local economic conditions, energy pricing, or material performance stability. The integrated experimental–simulation–economic framework adopted in this study offers an evidence-based approach for refining such standards by linking climatic intensity with cost-effectiveness. In cold–dry regions of Northwest China, where heating expenditures represent a significant share of household energy costs, optimizing envelope performance can simultaneously improve energy efficiency and thermal comfort without imposing excessive financial burdens.
Beyond China, the methodological approach and underlying design logic of this study are applicable to other continental interior climates characterized by low humidity, clear winter skies, and large diurnal temperature variations, such as parts of Central Asia, Eastern Europe, and North America. While specific numerical outcomes may differ depending on local climate and economic conditions, the principle of identifying a moderate insulation thickness that balances thermal effectiveness, constructability, and long-term cost remains broadly applicable.
In summary, the climatic applicability of this study lies not in the universality of a specific insulation thickness, but in the transferability of its optimization logic. The identification of approximately 50 mm insulation thickness in Xi’an should be interpreted as an engineering reference point rather than an absolute prescription. By emphasizing an empirically grounded and scalable decision framework, this study bridges region-specific experimentation with broader policy and design considerations, offering a pragmatic pathway toward climate-responsive and economically viable building envelope design in heating-dominated regions.
4.3. Economic and Policy Implications
The life-cycle cost (LCC) analysis provides a quantitative basis for understanding how insulation investments perform economically over a building’s operational lifetime. As demonstrated by the results in
Table 8, the relationship between insulation thickness and total LCC follows a clear U-shaped pattern, reflecting the trade-off between increasing upfront investment and decreasing operational energy expenditure. At lower insulation levels, incremental increases in thickness generate substantial reductions in heating energy demand that outweigh additional material costs. Beyond a moderate thickness, however, further reductions in energy consumption become progressively smaller, while capital costs continue to increase, leading to higher total life-cycle costs.
This behavior highlights a fundamental distinction between maximum energy efficiency and economic optimality. From a purely technical standpoint, increasing insulation thickness will always reduce conductive heat loss. From an economic perspective, however, the additional energy savings beyond the cost-optimal point are no longer sufficient to justify the higher initial investment within a typical building service life. The results therefore emphasize that effective insulation design should aim for cost-optimal performance rather than maximum thermal resistance, particularly in regions where energy prices are regulated or household heating costs are constrained.
Material selection further influences the economic outcome. Among the insulation systems evaluated, XPS exhibits the most favorable balance between thermal performance and life-cycle cost, achieving the lowest total LCC and the shortest payback period at its optimal thickness. EPS provides comparable economic performance but with slightly lower thermal efficiency, while rock wool generally incurs higher life-cycle costs due to its material characteristics and installation requirements. These differences suggest that economic rationality and non-energy considerations—such as fire safety, durability, and constructability—should be jointly considered when selecting insulation materials for cold-climate residential buildings.
An important implication of the LCC framework is that economic optimality is sensitive to broader market and policy conditions. Variations in energy pricing, financing conditions, or discount rates can shift the balance between upfront cost and long-term savings, thereby influencing the thickness at which insulation becomes economically optimal. This sensitivity indicates that insulation policy does not need to rely solely on rigid construction mandates. Instead, economic instruments—such as energy pricing mechanisms, preferential financing, or targeted incentives—can indirectly encourage higher-performance envelope solutions by improving the economic attractiveness of insulation investments.
From a broader policy perspective, the results suggest that moderate insulation upgrades can deliver substantial economic and environmental benefits when evaluated across the building stock. While the private economic optimum reflects direct cost recovery for building owners, the societal benefits of reduced energy demand—such as lower emissions, improved thermal comfort, and reduced peak heating loads—extend beyond individual payback considerations. This divergence between private and societal perspectives provides a rationale for public intervention to support cost-optimal insulation levels, particularly in regions where household income levels or heating tariff structures limit direct financial incentives for energy efficiency improvements.
The findings also have implications for the evolution of building energy regulations. Current prescriptive standards typically specify minimum insulation requirements based on climate-zone classification, with limited flexibility to account for local economic conditions or material performance differences. Integrating cost-optimal principles into regulatory frameworks could support a gradual transition toward performance-based standards, in which designers demonstrate that selected envelope solutions achieve an appropriate balance between thermal efficiency and life-cycle cost under local climatic and economic assumptions. Such an approach would enhance regulatory flexibility while maintaining alignment with long-term energy and carbon-reduction objectives.
In summary, the economic and policy implications of this study underscore the importance of moderation and optimization in insulation design. Rather than pursuing maximum insulation thickness, the results support the adoption of cost-optimal configurations that deliver substantial energy savings without imposing excessive financial burdens. Embedding life-cycle economic reasoning into design practice and policy formulation can help align engineering feasibility with economic rationality, thereby facilitating wider adoption of energy-efficient building envelopes in cold and heating-dominated regions.
4.4. Sensitivity, Uncertainty, and Risk Budgeting
Although the life-cycle cost (LCC) framework provides a coherent basis for identifying cost-optimal insulation configurations, its conclusions are inevitably influenced by multiple sources of uncertainty. These uncertainties arise from both economic parameters—such as future energy prices and financing conditions—and physical factors, including material aging, air infiltration, and construction quality. Understanding how these factors qualitatively affect the robustness of the optimal insulation range is essential for translating model-based findings into reliable design and policy guidance.
A sensitivity assessment was therefore conducted using representative scenario variations of key economic and physical parameters in
Table 11. Rather than defining a single deterministic optimum, the analysis focuses on identifying the relative direction and magnitude of change in cost-optimal insulation thickness and payback behavior under plausible boundary shifts. The results indicate that economic variables, particularly energy price and discount rate, exert the strongest influence on optimal insulation decisions. Higher energy prices or lower financing costs consistently favor thicker insulation by increasing the long-term value of saved energy, whereas lower tariffs or higher discount rates reduce the economic justification for additional insulation thickness.
Physical uncertainties play a secondary but non-negligible role. Long-term degradation of thermal performance, driven by moisture exposure, gas diffusion, or material aging, can moderately increase the insulation level required to achieve comparable life-cycle performance. This effect is more pronounced for fibrous or moisture-sensitive materials, reinforcing the importance of durability-oriented design and moisture control strategies. Measures such as continuous air–water barriers, vapor-permeable exterior finishes, and proper detailing at interfaces can significantly mitigate performance drift and preserve the economic validity of insulation investments over time.
Air infiltration and workmanship quality introduce another layer of uncertainty that is often underestimated in envelope optimization studies. While laboratory experiments isolate conductive heat transfer, real buildings experience variable air leakage through joints, penetrations, and construction tolerances. Elevated infiltration reduces the relative contribution of wall insulation to total heat loss, flattening the life-cycle cost curve and diminishing the marginal benefit of thicker insulation. This interaction suggests that improvements in airtightness can be economically comparable to moderate increases in insulation thickness, highlighting the need to coordinate insulation design with construction quality control and commissioning practices.
Thermal bridging further complicates the relationship between nominal insulation thickness and realized energy savings. Structural discontinuities—such as slab edges, balconies, and window perimeters—contribute localized heat losses that scale weakly with insulation thickness. As insulation levels increase, the relative impact of these bridges becomes more pronounced, potentially leading to overestimation of energy savings if they are neglected. Addressing thermal bridges through integrated façade design and careful detailing is therefore essential for maintaining the robustness of insulation optimization outcomes.
From a decision-making perspective, these uncertainties suggest that insulation design should be guided by a robust range rather than a single fixed optimum. For the climatic and economic context examined in this study, a moderate band around the identified benchmark thickness maintains near-minimum life-cycle cost across a wide range of plausible assumptions. This flexibility should be interpreted not as a lack of precision, but as a form of resilience that accommodates future variation in market conditions, material performance, and occupant behavior.
Importantly, uncertainty effects are asymmetric in their economic consequences. Overestimating insulation benefits can lead to higher upfront costs that are not fully recovered, while underestimating them primarily delays potential savings. This asymmetry implies that modestly conservative design choices—favoring the middle or upper portion of the robust range—may be economically prudent in buildings with long service lives or public ownership, whereas private developers with shorter investment horizons may rationally select the lower bound.
To enhance reproducibility, the robustness band is defined here using a quantitative decision rule. Specifically, insulation thicknesses yielding a total life-cycle cost within 3% of the minimum LCC for a given material are considered economically robust. Based on the LCC results in
Table 10, this criterion corresponds to insulation thicknesses in the range of approximately 45–60 mm under the studied climatic and economic conditions. This rule-based definition allows the recommended insulation band to be directly reproduced and adapted to other regions or cost structures.
In summary, the sensitivity and uncertainty analysis reinforces the central conclusion of this study: insulation optimization is not a deterministic calculation but a context-dependent decision shaped by economic variability, physical performance stability, and construction quality. Recognizing and explicitly addressing these uncertainties enhances the credibility and applicability of cost-optimal insulation strategies, ensuring that design decisions remain resilient under evolving climatic, market, and policy conditions.
It should be noted that the present life-cycle cost (LCC) analysis adopts constant real energy prices and does not explicitly account for energy price escalation or end-of-life costs such as dismantling, recycling, or residual value of insulation materials. These factors were intentionally excluded to maintain transparency and comparability across insulation options, given the substantial uncertainty associated with long-term price trajectories and end-of-life scenarios.
Nevertheless, the proposed LCC framework can be readily extended to incorporate energy price escalation rates or end-of-life cost components where reliable local data are available. Such extensions are expected to primarily affect the absolute LCC values rather than the relative ranking of insulation thicknesses, and are therefore left for future work.
It should be clarified that the present study focuses on building energy performance and life-cycle cost optimization. Standard indoor thermal comfort indicators—such as operative temperature distributions, overheating hours, or comfort-band compliance—were not explicitly evaluated. The transient discussion provided in this study is therefore limited to the physical interpretation of envelope heat-transfer behavior, rather than a comprehensive assessment of indoor thermal comfort.
4.5. Practical Guidelines for Design and Construction
The integrated experimental, simulation, and life-cycle cost analyses provide several practical insights for the design and construction of insulated residential buildings in cold–dry continental climates such as Northwest China. These guidelines aim to ensure that the thermal and economic benefits identified under laboratory and modeling conditions can be reliably realized in actual buildings.
The results indicate that extruded polystyrene (XPS) and expanded polystyrene (EPS) are the most suitable insulation materials for residential envelopes in Xi’an and similar regions. XPS offers superior thermal stability and moisture resistance under large diurnal temperature variations, while EPS provides a cost-effective alternative when properly protected against vapor ingress and aging. Rock wool remains appropriate for applications where fire resistance or acoustic performance is required, despite its relatively higher thermal transmittance at equivalent thickness.
From a combined thermal and economic perspective, an insulation thickness of approximately 50 mm represents the most balanced solution for XPS and EPS under current climatic and energy-price conditions. Rather than adopting a single fixed value, a robust design range of 45–60 mm is recommended, within which thermal performance and life-cycle cost remain stable under reasonable variations in energy price, discount rate, and material degradation. This range allows designers to adapt insulation thickness to project-specific priorities without compromising overall efficiency.
The effectiveness of insulation thickness is strongly influenced by construction quality. Simulation results confirm that air infiltration and thermal bridging can offset a substantial portion of conductive heat-loss reduction, particularly in cold and windy winter conditions. Achieving adequate airtightness, ensuring continuity of the insulation layer, and minimizing thermal bridges at slab edges, window perimeters, and structural junctions are therefore as important as increasing insulation thickness. In practice, improving airtightness can deliver energy savings comparable to adding 10–15 mm of insulation.
As envelope performance improves, coordination with heating-system operation becomes increasingly critical. Buildings with enhanced insulation benefit most from variable-flow heating systems and responsive controls that prevent overheating and enable occupants to realize the reduced heat demand. Insulation upgrades should therefore be implemented as part of an integrated energy-efficiency strategy rather than as an isolated measure.
Finally, maintaining long-term performance requires attention to installation quality and periodic inspection. Moisture ingress, mechanical damage, and degradation of finishing layers can reduce thermal effectiveness over time. Routine inspection and performance verification, such as infrared thermography and sealant checks, can help preserve both the thermal and economic benefits predicted by life-cycle cost analysis.
Overall, the findings emphasize that optimal insulation design is achieved through balance rather than maximization. Moderate insulation thickness, combined with appropriate material selection, careful detailing, and integrated system design, offers a reliable and cost-effective pathway toward improving building energy performance in cold–dry regions.
5. Conclusions
This study developed and applied an integrated framework to evaluate and optimize the thermal and economic performance of building wall insulation systems in cold–dry continental climates, using Xi’an as a representative case. By combining guarded hot-box experiments, dynamic building energy simulation, and life-cycle cost (LCC) analysis, the research establishes a robust link between material-level thermal behavior and building-scale energy and economic performance.
Experimental results demonstrated that increasing insulation thickness from 30 mm to 50 mm significantly reduces wall thermal transmittance, while further thickening to 70 mm yields only marginal additional benefits. This diminishing-return behavior reflects the growing influence of surface resistances, thermal bridging, and non-conductive heat losses. Among the investigated materials, extruded polystyrene (XPS) exhibited the best overall thermal performance, followed by expanded polystyrene (EPS), whereas rock wool showed higher sensitivity to air infiltration and moisture-related effects under cold–dry conditions.
Dynamic simulations calibrated with experimentally measured U-values confirmed these trends at the building scale. Annual heating demand decreased substantially with increasing insulation thickness, while cooling loads remained relatively insensitive to insulation configuration. The results indicate that, under Xi’an’s climatic conditions, thermal optimization should primarily target winter heat loss. A thickness range of approximately 45–60 mm provides a robust balance between energy savings and constructability across typical residential buildings.
Life-cycle cost analysis revealed that the economic optimum closely coincides with the thermal optimum. For both XPS and EPS, total life-cycle cost reached a minimum at approximately 50 mm thickness, corresponding to a payback period of about 6–8 years under current energy prices. Increasing insulation beyond this level extends the payback period without proportionate energy benefits, whereas thinner configurations lead to higher long-term heating costs. These findings highlight the importance of integrating economic evaluation with thermally calibrated simulations when defining insulation strategies for cold regions.
Overall, this study demonstrates that effective insulation design in cold–dry climates requires a balanced approach rather than maximization of material thickness. Moderate insulation levels, combined with appropriate material selection and construction quality, can achieve substantial energy savings while remaining economically feasible. The integrated experimental–simulation–economic framework proposed here provides a replicable methodology for evidence-based insulation optimization and offers practical guidance for improving building energy performance in Northwest China and other regions with similar continental climates.