Article

Digital Twin Success Factors and Their Impact on Efficiency, Energy, and Cost Under Economic Strength: A Structural Equation Modeling and XGBoost Approach


1
School of Housing, Building and Planning, Universiti Sains Malaysia, Gelugor 11800, Malaysia
2
Centre for Global Sustainability Studies, Universiti Sains Malaysia, Gelugor 11800, Malaysia
3
Thayer School of Engineering, Dartmouth College, Hanover, NH 03755, USA
4
School of Civil and Environmental Engineering, Nanyang Technological University, 50 Nanyang Avenue, Singapore 639798, Singapore
5
Oil Production Technology Research Institute of China National Petroleum Corporation Xinjiang Oilfield Branch, No. 87, Shengli Road, Karamay 834000, China
*
Authors to whom correspondence should be addressed.
Buildings 2026, 16(3), 467; https://doi.org/10.3390/buildings16030467
Submission received: 25 November 2025 / Revised: 6 January 2026 / Accepted: 8 January 2026 / Published: 23 January 2026
(This article belongs to the Section Construction Management, and Computers & Digitization)

Abstract

Digital twin (DT) technology is recognized for its transformative potential to enhance efficiency in the construction process. However, the full potential of DT in construction practices remains largely unrealised. Moreover, few studies explore how DT success factors affect efficiency improvement (EI), energy optimization (EO), and cost control (CC) in the context of economic strength (ES). The study applied a hybrid research method to examine the impact of key DT success factors on EI, EO, and CC under the moderation of ES. After a critical literature review, five key DT success factors were identified. Then, 490 valid questionnaires were analyzed with the Partial Least Squares Structural Equation Model (PLS-SEM) to assess how success factors affect DT effectiveness. This is complemented using extreme gradient boosting (XGBoost) to assess prediction accuracy and understand which factors most influenced EI, EO, and CC. Research shows that ES exerts a significant positive influence on the relationships between most success factors and performance outcomes. High levels of ES enhance the contribution of success factors to performance in EI, EO, and CC. Resource management (RM) has a strong influence on EI and EO, but a weaker influence on CC; process optimization (PO) has the strongest influence on EO, a moderate influence on CC, and the weakest influence on EI; real-time monitoring (R-Tm) primarily affects EI; sustainable design (SD) has a comprehensive and significant regulatory effect on EI, EO, and CC; and predictive maintenance (PM) has a strong influence on both EI and CC. In practice, it offers practical guidance for implementing DT and supports policy and resource planning for building stakeholders.

1. Introduction

The construction industry (CI) is under increasing pressure to improve project delivery, operational efficiency, and sustainability performance. As projects become more complex and resource-intensive, traditional methods often fall short in meeting expectations for time, cost, and environmental performance [1]. In response, digital transformation has gained momentum across the CI, with digital twin (DT) technology emerging as a promising solution to address persistent inefficiencies and data fragmentation [2]. DTs are dynamic, data-driven virtual replicas of physical assets, processes, or systems that enable real-time monitoring (R-Tm), simulation, and optimization throughout the asset lifecycle [3]. In the construction context, DTs synchronize physical project elements such as buildings, equipment, and workflows with digital models through continuous data exchange enabled by sensors, Internet of Things (IoT) devices, and building information modeling (BIM) [4]. This real-time linkage allows stakeholders to visualize performance, predict outcomes, and make informed decisions at various stages of project delivery and operation.
When effectively deployed, DTs support improvements in construction efficiency, energy, and cost by enhancing resource coordination, automating feedback loops, and enabling predictive maintenance (PM) and scenario analysis [1]. DTs enhance key performance areas, particularly efficiency, energy use, and cost, reflecting core industry goals around productivity, sustainability, and financial control. However, the economic strength (ES) of the company plays an important moderating role. According to Szwedkowski, companies with strong ES can allocate more resources to R&D, which is crucial for the successful integration of DT into operations [5]. EI is critical in construction, as it directly influences project delivery timelines, resource utilization, and overall productivity [6]. Energy optimization contributes to environmental sustainability and helps meet regulatory requirements by reducing consumption across the project lifecycle [7]. CC remains essential for maintaining budget adherence, minimizing financial risk, and ensuring a positive return on investment [8].
However, the full potential of DT in construction practices remains largely unrealized [9]. Among the issues that hinder the full realization of DT benefits is the lack of understanding of the critical factors that determine its effectiveness [10]. In many construction projects, DTs are adopted without clear evidence regarding specific implementation strategies, such as resource management (RM), process optimization, or PM, that most effectively contribute to performance improvement [11]. At the same time, although existing studies have emphasized the role of enterprise economic capabilities in digital transformation, its regulatory mechanism in the DT application path is still rarely explored [12]. In addition, the inherent fragmentation and complexity of the CI further complicates the implementation of data-driven support systems [13]. As a result, DT adoption in the CI still lags behind the aerospace and manufacturing industries. Driven by the need to improve DT adoption, several studies have been conducted, addressing several aspects of DT implementation in construction practices.
Among the seminal studies is the Qi and Tao [14] review, highlighting the DT concept as well as its applications in product design, production planning, manufacturing, and PM. Building on this, scholars like Rojas, et al. [15] provided a clear definition of DT in the construction context and its effectiveness in a robust framework, highlighting a knowledge gap in data interoperability, semantic integration, and real-time feedback mechanisms. Opoku, et al. [16] reviewed the state of DT adoption in construction and highlighted implementation challenges and research gaps, but did not analyze the measurable impacts of specific success factors across different performance dimensions. Rojas, Peña and Garcia [15] recent study affirmed the increasing adoption of DT and machine learning (ML) for anomaly detection and process optimization (PO) but stressed significant challenges in full-scale adoption due to numerous factors that require further research. Zhao et al. (2024) pointed out that enterprises of digital transformation practices focus more on technology and policy aspects, while research on “microeconomics foundations” such as internal financial capabilities and resource allocation capabilities is relatively insufficient [12]. Certainly, theoretical research has broadly conceptualized DT in the CI, but a significant gap remains in empirically quantifying how specific success factors, mediated by economic forces, influence measurable performance outcomes such as efficiency, energy, and cost. Few empirical studies quantify how DT success factors influence performance under economic strength. Therefore, this study proposes the following specific research questions. RQ1: What are the success factors of DT that influence building performance? RQ2: Whether the moderating effect of ES influences this relationship? RQ3: How do different DT success factors contribute to performance? This study aims to identify the critical success factors of DT and evaluate its impact on building performance outcomes, especially efficiency improvement (EI), energy optimization (EO), and cost control (CC), under enterprise economic regulation. Three specific research objectives were formulated:
  • RO1: To identify key DT success factors and moderating factors relevant to performance enhancement in construction.
  • RO2: To analyze the relationship between these success factors and performance outcomes such as efficiency, energy, and cost under economic regulation.
  • RO3: To evaluate the contribution of each success factor to performance and provide a basis for policy formulation and resource allocation.
This study collected 490 questionnaires from companies in the CI through a survey and conducted data analysis. The research found that, under the moderating effect of ES, most of the influencing paths were significant, with SD and PM having a strong impact on building performance. This study advances knowledge, providing a clear understanding with empirical evidence, regarding the distinct roles of DT key success factors in driving DT effectiveness and the regulatory role of corporate ES. In practice, it provides construction stakeholders with practical guidance for effectively implementing DT technology to actualize the full potential in construction practices. In academia the hybrid methodology offers unique scientific value by combining PLS-SEM for theoretical validation with XGBoost 3.1.2 for predictive precision. This complementarity bridges the gap between causal explanation and prediction, significantly enhancing the robustness of findings compared to prior single-method studies.

2. Literature Review

2.1. Digital Twin Application in the CI

In today’s era, the rapid development of new information technologies has brought unprecedented industrial transformation. In recent years, DT has attracted widespread attention for its potential to transform the CI. DT is a virtual representation of physical assets, enabling real-time perception and feedback of the operating status of physical equipment. It continuously acquires data from physical objects, builds and updates their digital models, and dynamically reflects actual operating conditions. The key to DT lies in the two-way interaction and coordination of data between virtual models and physical objects. Its operation is similar to that of cyber–physical systems, aiming to connect the real world with the digital world and achieve efficient information integration and response [17]. The earliest mention of “twins” was in the aerospace field and can be traced back to NASA’s Apollo program in the 1960s [18]. The NASA project entails creating two space vehicles, one of which will serve as a “twin” on Earth to mirror the space vehicle carrying out the mission. Rosen, et al. [19] defined a twin as a prototype that reflects spacecraft operations in real time. However, the “twin” at this time was a physical system. The digital aspect was not included in the title “twin.”
DT provides a platform that allows data to be collected, stored, managed, and shared among stakeholders, facilitating its transfer and ensuring its preservation [20]. The results revealed eight key areas for digital implementation, including (i) virtual design, (ii) project planning and management, (iii) asset management and maintenance, (iv) safety management, (v) energy efficiency and sustainability, (vi) quality control and management, (vii) supply chain management and logistics, and (viii) structural health monitoring [9]. During the design phase, DTs rely on building information modeling (BIM) to build visual, high-fidelity virtual models, supporting scenario simulation, performance analysis, and collaborative design, significantly improving design quality and decision-making efficiency [21]. During the construction phase, DT is integrated with IoT devices and on-site sensors to enable the R-Tm of construction progress, equipment status, and safety risks. They also support collaborative work between humans and robots, optimizing construction management and resource allocation [22]. During the operation and maintenance phase, DT continuously reflects the operating status of building facilities, providing data support for energy efficiency management, fault warning, and facility maintenance, extending the service life of buildings and reducing operation and maintenance costs [23].
According to a systematic review, DT has evolved from traditional BIM to an advanced platform that supports dynamic decision-making and data-driven management, showing great potential in areas such as smart cities, green buildings, and construction automation [21]. In addition, its innovative applications in building energy EI (such as the “deep energy twin” model) and geological engineering risk control further verify its key position in improving building quality, safety, and sustainability [24]. Therefore, in fast-growing industries, digital transformation still has huge, untapped potential and is expected to bring significant resource savings. However, despite its immense potential, the development of digital twins still faces shortcomings. Data integration and management capabilities are limited, making it difficult to ensure real-time, bidirectional collaboration. The depth and breadth of applications have not been fully realized, especially in complex fields such as the CI.

2.2. Performance Outcomes of Digital Twins: Efficiency, Energy, and Cost

DT connects physical entities with virtual models in real time, breaks down the data barriers between design, construction, and operation and maintenance, and keeps building information dynamically by updating throughout the entire life cycle, which can improve project efficiency, optimize energy use, and reduce costs. DT’s real-time data analysis further improves project management efficiency, ensuring that projects are completed on time and within budget. This technology supports the R-Tm of construction sites, visual progress management, quality tracking, and automatic early warning, significantly improving project execution efficiency and response speed [21]. DT requires simulation, prediction, and optimization in virtual models. It can quickly optimize solutions to manage processes and adapt to changing environments by learning data from multiple sources [25]. During the construction phase, the integration of DT with BIM and IoT devices makes the construction process more transparent, collaborative, and controllable, thereby effectively reducing rework and delays [22].
Statistics show that in 2019, energy consumption during the entire building life cycle in China (including building materials production, construction, and operation) was approximately 45.8%, of which the building materials production stage accounted for approximately 49.7%, the operation stage accounted for approximately 46.2%, and the construction stage accounted for approximately 4.1%. In terms of the use stage and related operation and maintenance strategies, DT can help achieve energy goals, achieve sustainable energy management, and optimize building energy efficiency to reduce carbon emissions [26]. Research shows that DT can integrate indoor environmental data, energy load forecasting, and HVAC system control logic to achieve dynamic adjustment, thereby improving energy efficiency and user comfort [27]. In addition, with the integration of deep learning technology, the “Deep Energy Twin” model can accurately identify building energy consumption patterns, predict future energy efficiency trends, and assist in formulating optimal energy management strategies [24]. Furthermore, DT helps integrate renewable energy into building systems. By modeling the interactions between renewable energy technologies and building operations, DT helps optimize the use of solar panels, wind turbines, and other sustainable energy solutions [28].
Research on low-carbon buildings usually considers the comprehensive cost-effectiveness of the construction and operation stages, takes the carbon emissions and total cost of the building’s entire life cycle as the optimization target, and establishes a multi-objective optimization model to minimize carbon emissions with limited cost investment [29]. DT supports CC across the design and construction phases by enabling virtual prototyping and early error detection, optimizing project planning and resource allocation, and coordinating the entire life cycle to reduce rework, delays, unplanned downtime and maintenance expenses [30]. During the operation phase, DT can be used to monitor equipment performance in real time and identify potential failures in advance, reducing the cost of manual inspections and unexpected repairs [23]. In addition, DT help improve the efficiency of resource allocation. By integrating data from multiple channels, DT can comprehensively present the overall operational status of the project, thereby strengthening collaboration among all parties involved and optimizing the scheduling and use of materials and human resources. This data-driven integration mechanism not only helps reduce resource waste but also improves resource utilization, thereby achieving significant cost savings during project implementation [31]. Research shows that construction projects that fully implement DT systems have shown significant cost-saving potential in equipment operation and maintenance, energy consumption, and human RM. However, existing research lacks a systematic, quantitative assessment of its long-term and comprehensive value. Therefore, how DTs balance cost and energy use to maximize return on investment over a building’s lifecycle remains a key challenge.

2.3. Moderating Factors Affecting the Application of Digital Technology in the CI

This study uses ES as a moderating factor because ES is an important indicator of the inherent stability of an enterprise and a key foundation for influencing risk management, financing, innovation, and the fulfillment of social responsibilities. It plays an important role in regulating the technological innovation and use of new products. In addition, The inclusion of ES is grounded in EMT, which posits that advanced economic capacity is a prerequisite for achieving environmental innovation. Within this framework, ES acts as a critical boundary condition, determining a firm’s ability to translate technical potential into tangible performance outcomes. Existing studies have shown that the ES of enterprises has a significant moderating effect in promoting the application of digital technology. Moshood, Rotimi, Shahzad and Bamgbade [31] found that companies with stronger financial capabilities showed stronger synergy between adopting green technologies and promoting the development of the digital economy, indicating that sufficient economic resources help amplify the performance returns of technological innovation. Similarly, Sghiri, et al. [32] pointed out that under different financial conditions, the impact of a company’s digital capabilities on its market performance varies, further confirming the moderating value of financial resources in the technology adoption path. Furthermore, Wang [33] also emphasize that a company’s financial capabilities can enhance the positive impact of IT innovation on performance. Therefore, a company’s ES not only directly influences its willingness and ability to adopt digital technologies but also plays a key moderating role between technology adoption and performance outcomes. ES can positively affect DT performance. However, few studies use quantitative methods. It is still unclear how DT success factors influence construction performance under different ES levels. This limits the development of targeted technology implementation strategies.
Some studies generally believe that DT has great potential to improve EI, EO, and CC. ES, as a key moderating factor, is theoretically expected to significantly enhance the performance returns of technology adoption. However, there is a lack of sufficient empirical evidence in the literature to quantitatively verify how specific success factors of DT are amplified or weakened under different ES conditions. This gap between theoretical assumptions and empirical quantification remains unresolved.

2.4. Success Factors Driving Digital Twin Performance in Construction

This section explores a range of factors that influence the effectiveness of DT, including: RM, PO, R-Tm, SD, PM, system modeling, environmental simulation, facility optimization, recycling planning, and decommissioning assessment. A table titled “Generic success factors” presents various success factors drawn from existing literature, see Table 1. With a significantly large number of publications, this presentation forms a relatively systematic theoretical framework and practical path. In contrast, research in areas such as system modeling, environmental simulation, facility optimization, recycling planning, and decommissioning assessment is relatively limited. The relevant results are fragmented and still in the exploratory stage, urgently requiring further theoretical development and application verification. Therefore, this study focuses on five factors: RM, PO, R-Tm, and SD. These five factors were specifically chosen because they constitute the core functional areas covering the entire building lifecycle. This selection avoids the fragmentation problems that have occurred in previous studies, ensuring a holistic assessment of the effectiveness of the “design, build, operation” framework. Furthermore, the purpose of this study is to demonstrate the necessity of conducting empirical research to identify and verify the most influential DT success factors in the CI.

2.5. Theoretical and Conceptual

Ecological Modernization Theory (EMT) provides a framework for understanding how the CI can address carbon emissions through innovation and sustainable practices. This theory suggests that environmental challenges can be tackled by incorporating ecological thinking into the CI [58]. This involves linking economic and environmental policies, and achieving this through the strict enforcement of environmental laws that promote the development of the CI [59]. In the context of the CI, EMT can be applied to the field of digital technologies. The CI can benefit from EMT by adopting digital technologies that promote sustainable development [60]. Guided by the EMT, this study focuses on the success factors of DT and discusses the positive impact of the three core performance objectives (EI, EO, and CC) in CI.
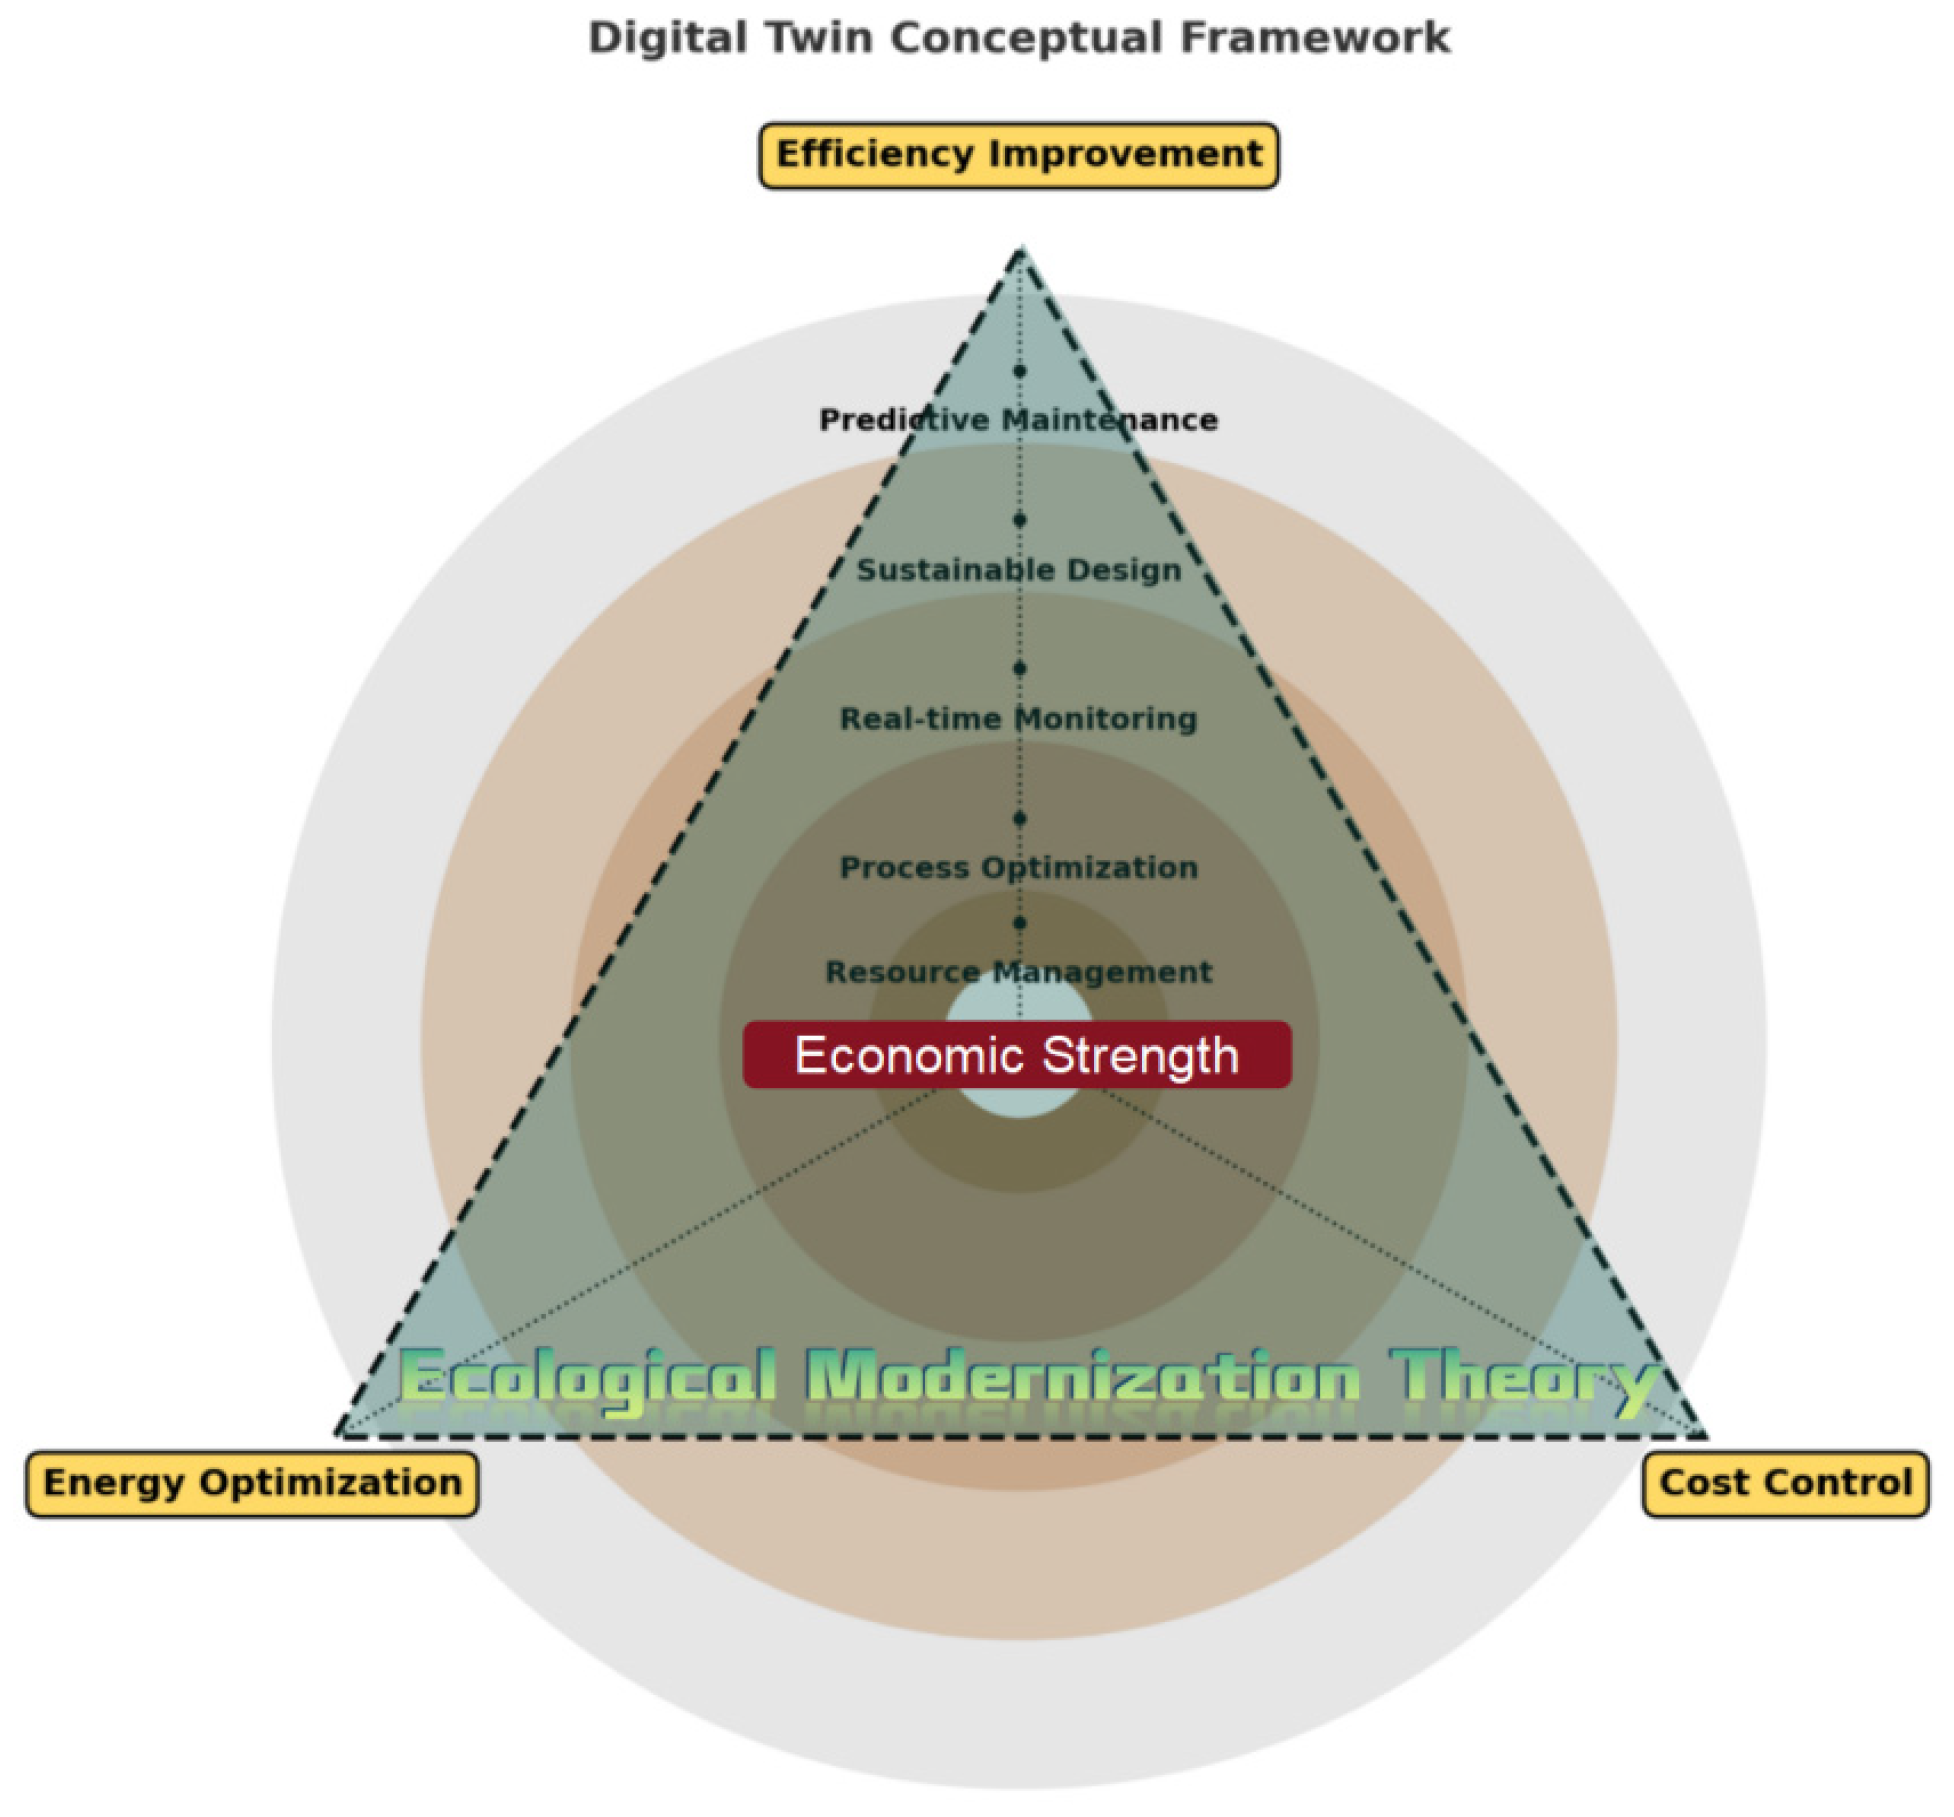
The five independent variables in the framework—RM, PO, R-Tm, and SD—represent key application areas of DT in construction management. The moderating variable ES in the framework represents the moderating relationship between success factors and building performance, as shown in Figure 1. These factors have direct or indirect effects on efficiency, energy, and cost through different mechanisms. The DT frameworks proposed in existing literature mostly focus on a single stage or specific application scenario in the CI, such as building life cycle management [61], facility maintenance [62], energy consumption optimization [63], or a BIM-integrated application [64]. These frameworks typically emphasize the integration of data collection, modeling techniques, and information flows, focusing on the path to achieving system functionality.
However, unlike these frameworks, which are oriented towards technical processes or phased goals, the framework proposed in this study takes a performance perspective. The independent variables in this framework consist of five dimensions of DT application: RM, PO, R-Tm, SD, and PM. These dimensions are hypothesized to be key success factors driving performance improvement. The dependent variables in this study include EI, EO, and CC. Furthermore, the moderating variable ES is included in the model to examine how it moderates the relationship between the key success factors of DT (RM, PO, R-Tm, SD, PM) and the three performance objectives (EI, EO, and CC). Because these elements recur in existing research and directly impact efficiency, energy, and cost throughout the building’s lifecycle, they collectively encapsulate the key management and technological mechanisms of DT empowerment. This study expands upon previous DT performance research by examining these core elements within a single framework and assessing their impact on EI, EO, and CC under ES regulation. Subsequently, based on the path relationships between the independent and dependent variables in the research framework, 15 research hypotheses were systematically proposed (see Table 2). The direct impact of each independent variable (RM, PO, R-Tm, SD, PM) on the three dependent variables (EI, EO, CC), and the role of the moderating variable ES in these relationships, were examined. These hypotheses not only provide a theoretical basis for subsequent empirical analysis but also contribute to a deeper understanding of the mechanisms and pathways by which DT improves performance in CI. In addition, this study empirically tested these pathways using PLS-SEM and ML methods, thereby enhancing the operability and practical guidance of the framework. In summary, prior research predominantly employs single-method approaches focused on partial variables, ignoring the potential of a hybrid PLS-SEM and XGBoost framework to systematically evaluate the DT success factors of a multi-dimensional performance pathway.

3. Methodology

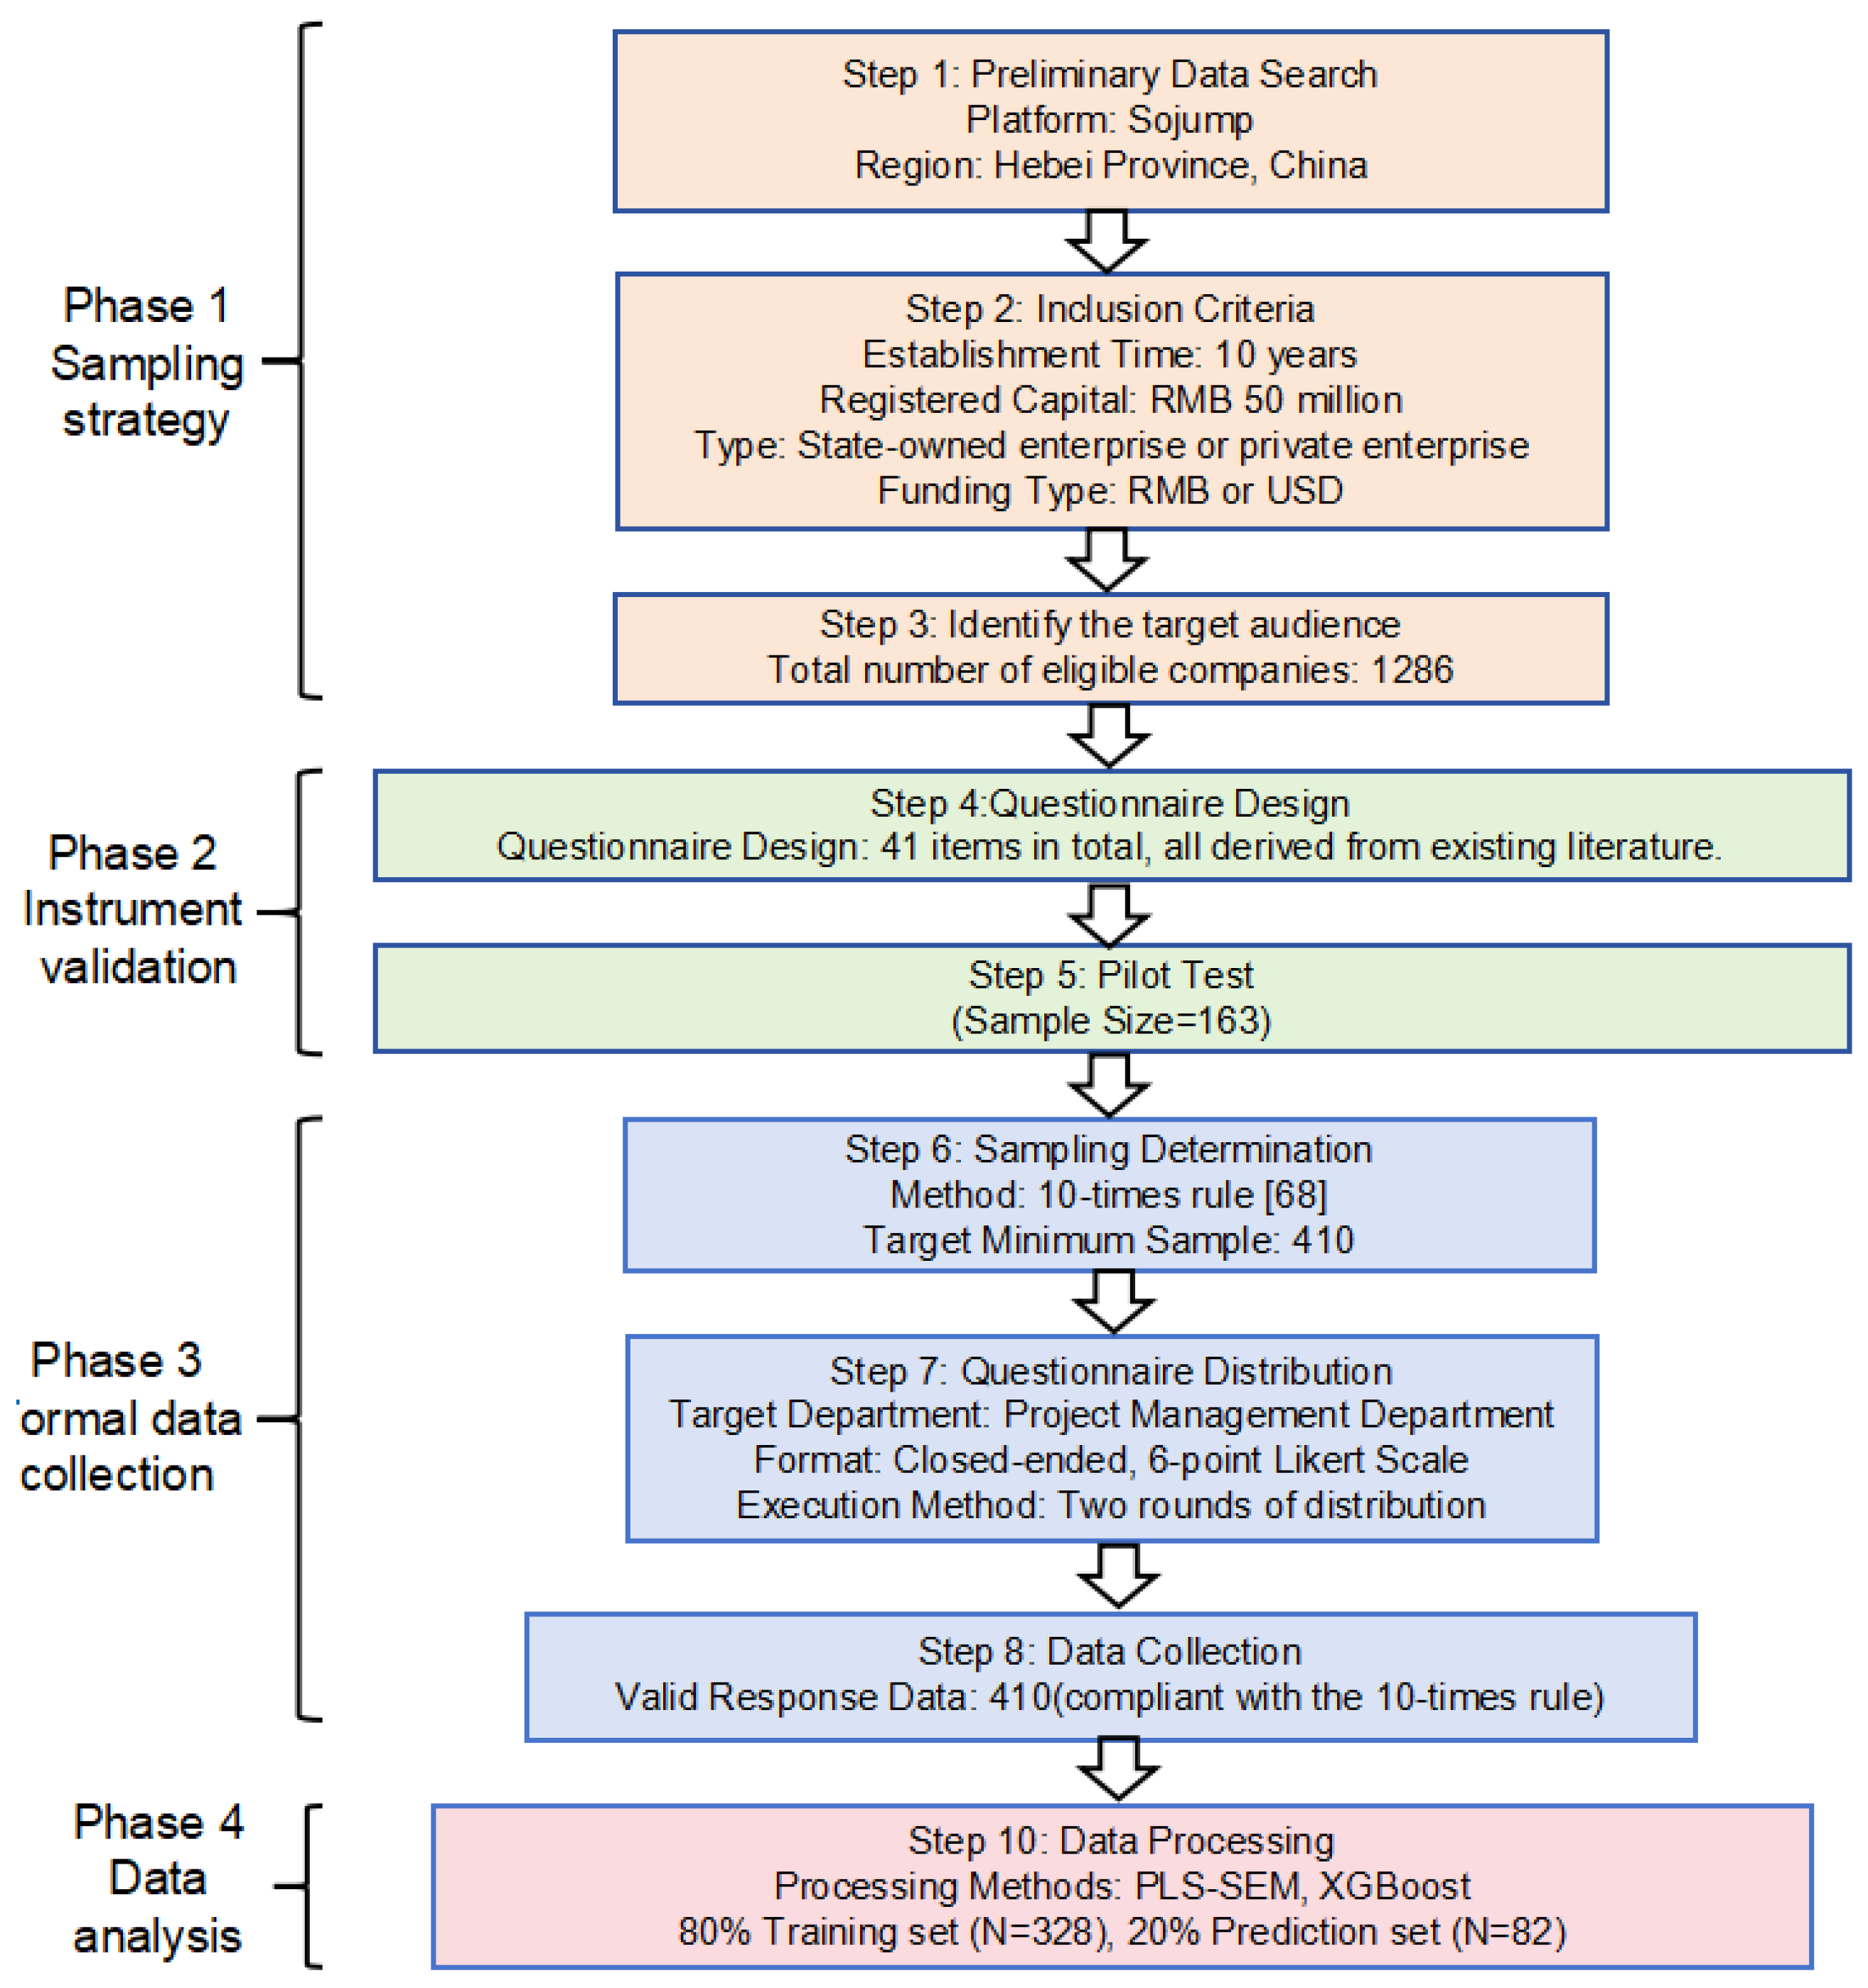
This study employed a quantitative research design to investigate how critical DT success factors affect efficiency, energy saving, and cost management. This study, grounded in confirmatory hypotheses, investigates how key DT dimensions influence building performance through a quantitative research approach. To maximize the internal validity of the study, data collection was limited to a single country. China, as one of the world’s largest construction markets, has a certain level of maturity in the application of DT and a strong demand for regional management decision-making and industry policy formulation. This study used the Sojump platform for searching, limiting the geographical scope to Hebei Province, because Xiong’an New Area is located in Hebei Province and it is the first such new area in the country. Its pioneering exploration in cutting-edge technologies such as DT, coupled with the urgent need for “dual-carbon” transformation under the background of high energy consumption, makes Hebei Province an ideal sample for studying the digital transformation of the CI and its decoupling from the environment. Other restrictions were also imposed: the companies to be established for more than 10 years; the registered capital to be more than 50 million RMB; the company type to be either a state-owned enterprise or a private enterprise; not a branch office; and the capital type to be RMB or USD. Based on these criteria, 1286 companies were found that met the requirements. Then, the minimum sample size for this study was determined to be 410 using the 10-times rule [68]. Then, closed-ended questionnaires were distributed to the project management department of the target company, see Appendix A, Table A1, for the full questionnaire, and results were collected. Although some items in this questionnaire do not directly mention DT, they represent the core functions of DT. Before issuance, preliminary communication to confirm whether the enterprise has a DT system or has carried out relevant practices was conducted. Only companies that meet the requirements of “actual use of DT” are eligible to fill out the questionnaire. Therefore, the data of this study are derived from real application experience, avoiding assumptions, thereby improving the credibility of the research results. A total of 490 data points were collected through two rounds of questionnaire distribution for research, which conforms to the 10-times rule for minimum sample size. Its response rate was 38% (490/1286 = 38%), which was considered acceptable [69]. The questionnaire used a six-point Likert scale (options ranging from “strongly disagree” to “strongly agree”). Compared with the traditional five-point scale, the six-point Likert scale does not have neutral items, which helps to improve discrimination [70]. See Figure 2 for the detailed process.
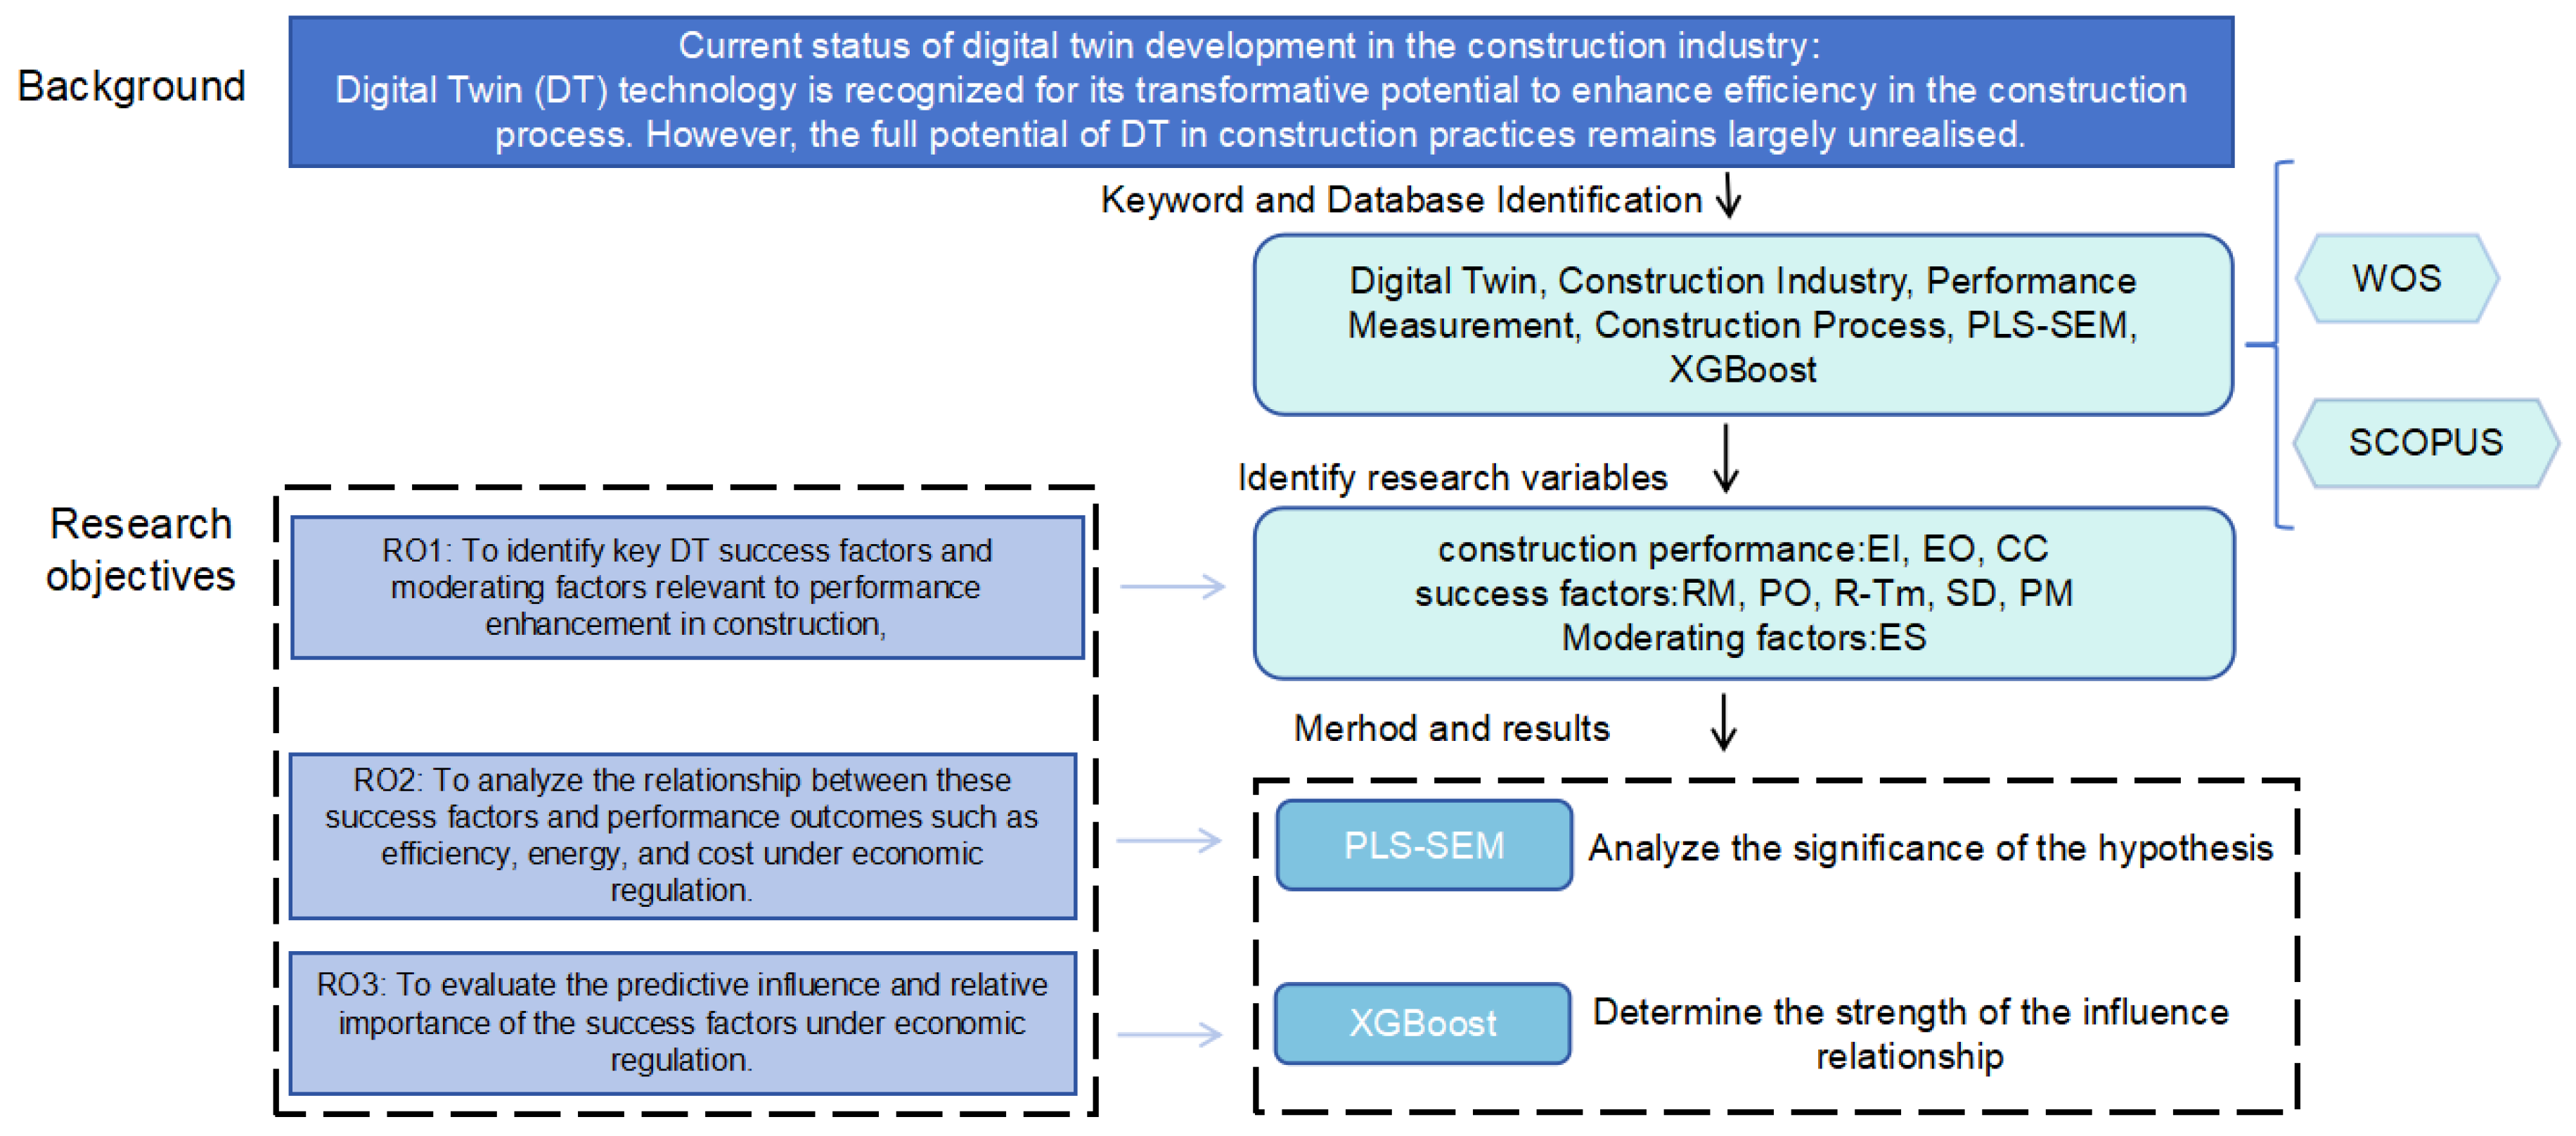
In this study, PLS-SEM was first used to test the significance of the paths, and then extreme gradient boosting (XGBoost) was used for ranking to compensate for the shortcomings of PLS-SEM in this function. This combination achieves complementarity between theoretical verification and practical prediction, thereby enhancing the explanatory and predictive capabilities of the theoretical model. Combining PLS-SEM and XGBoost results creates a complementary mix of theory-driven and data-driven approaches to test hypotheses, clarify variable relationships, and highlight practical value [71]. The overall methodological framework and research process are shown in Figure 3. To ensure the representativeness of the sample and the generalizability of the conclusions, this study employed a dual verification strategy. Statistically, the 490 samples not only met the “10-fold rule” of PLS-SEM but also significantly exceeded the sample size required for a 95% confidence level (approximately 305 samples) calculated using the Akosua, et al. [72] formula, effectively controlling sampling error. Regionally, although the data originated from Hebei Province, as a major resource-based construction province, its common challenges in digital transformation are representative of the industry. Furthermore, this study, that is based on the “economy, environment, technology” interaction mechanism proposed by EMT, has theoretical extrapolation value and can provide useful references for other developing regions.

3.1. Structural Equation Modeling Using Smart PLS

Structural Equation Modeling (SEM) is a multivariate statistical analysis technique used to simultaneously evaluate the causal relationships between multiple variables and the structural paths between latent variables. Given that this study is in the theoretical exploration stage and aims to predict the relationship between variables and verify the underlying model structure, PLS-SEM is a more appropriate method. It requires a low sample size and is suitable for situations with complex model structures, many variables, and data distributions that deviate from normality. It is particularly suitable for empirical research oriented towards prediction [73].
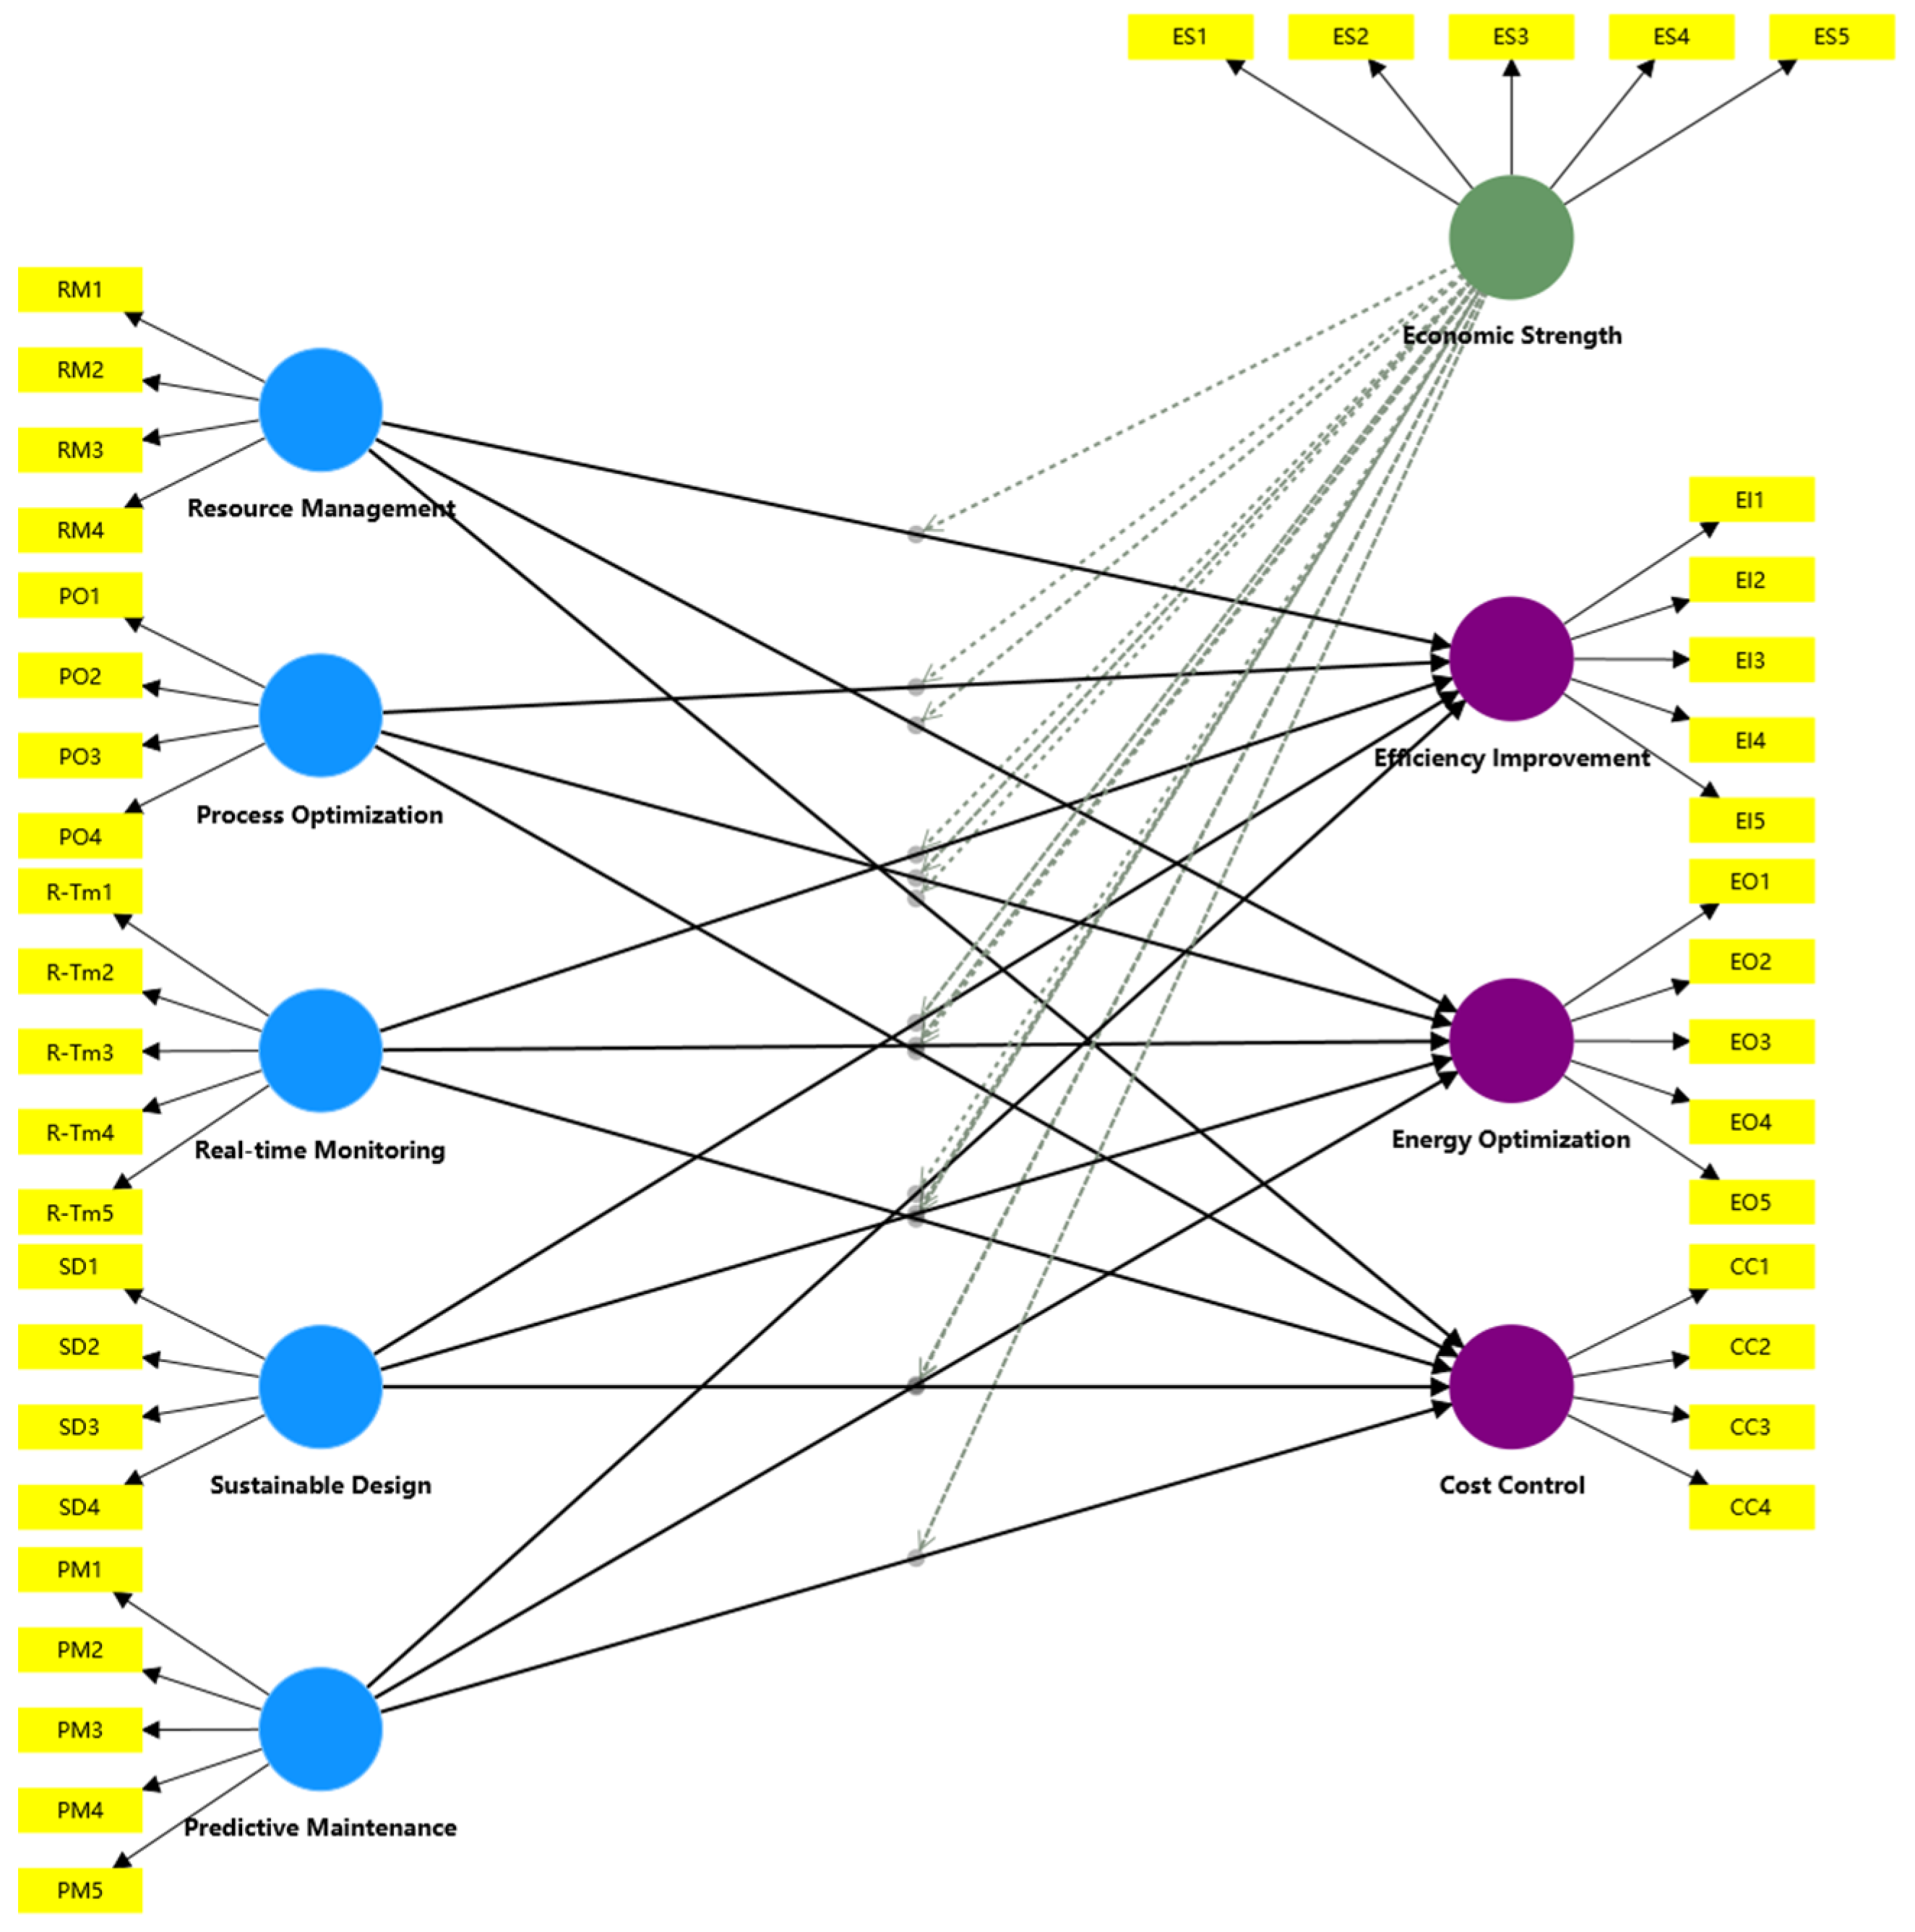
The collected data were analyzed using SmartPLS 4.1.0.9, an SEM tool, to evaluate the influence of five key success factors and ES on efficiency, cost, and energy performance, as depicted in the SEM framework (Figure 4). The analysis followed two main phases. First, a pilot test was conducted on 163 questionnaires, including Cronbach’s alpha (CA), composite reliability (CR), and average variance extracted (AVE). Detailed results are available in Appendix A, Table A2. Second, the Measurement Model Evaluation assessed the reliability using CA and CR for internal consistency and validity. Convergent validity was assessed via AVE, while discriminant validity was confirmed using the Fornell–Larcker criterion and cross-loading analysis. Second, the Structural Model Evaluation tested 15 research hypotheses derived from the research framework. Path coefficients were tested for significance, and the model’s explanatory power and predictive accuracy were determined using R2 and Q2 values. The significance of these paths was robustly validated using the Bootstrapping method. This comprehensive SEM application demonstrates the assessment of key success factors’ impact on efficiency, cost, and energy performance within the CI context.

3.2. Construction of the XGBoost Framework

XGBoost is an efficient gradient boosting algorithm that adds system- and algorithm-level optimizations to traditional boosted trees, improving performance, accuracy, and scalability [74]. Recent studies have applied XGBoost in various building and environmental contexts: Xu, et al. [75] explored the relationship between built environment indicators and residential land carbon emissions; Hou and Liu [76] developed a BO-XGBoost model to address carbon emissions in China CI. This study chose XGBoost because its gradient boosting is more accurate in predicting structured data and outperforms random forests [77]. Tree ensembles can output quantifiable feature importance, which is convenient for identifying key driving factors and avoids the “black box” problem of SVM and deep learning [78]; it is also more efficient and less costly for medium-sized questionnaire data. In this study, XGBoost hyperparameters via grid search introduced ES as a moderating variable, and interaction terms were manually constructed by calculating the products of independent variables (RM, PO, R-Tm, SD, PM) and the ES, achieving the output effect of the “moderation effects”. Feature engineering was enhanced by adding polynomials, interaction terms, ratios, and distances, as well as manually adjusting scale_pos_weight to improve predictive performance. In this study, a Standard Scaler was used for standardization, and the dataset was divided into 80% training set and 20% prediction set. To comprehensively evaluate the predictive performance and generalization ability of the model, this study employed multiple validation metrics. First, the coefficient of determination (R2) was used to measure the model’s explanatory power for the variance in the dependent variable. Second, the root mean square error (RMSE) and mean absolute error (MAE) were used to reflect the deviation between the model’s predicted values and the actual values. Furthermore, to prevent overfitting and verify the model’s robustness, a 5-fold cross-validation method was used to calculate the average R2 score, thereby evaluating the model’s stability and generalization ability under different data partitions. Details are provided in Appendix A, Table A3. With the model’s  t  iteration expressed as the sum of the outputs of the previous  t 1  trees and the new tree  f t . It can be expressed by Equation (1) as follows:
y ^ i ( t ) = j = 1 t   f j ( x i ) = y ^ i ( t 1 ) + f t ( x i )
Calculate the empirical loss. Based on the actual value and the predicted value,  l  can be square error, logarithmic loss, etc. The loss function can be calculated as Equation (2):
L = i = 1 n l y i , y ^ i
XGBoost augments the original GBDT loss with a regularization term Ω to control model complexity and prevent overfitting, as shown in Equation (3):
a b j = i l y i , y ^ i + j = 1 J Ω f j
In the formula,  Ω f t  is the regularization term,  T  is the number of leaf nodes,  w  represents the score assigned to the leaf nodes,  γ  is used to control the number of leaf nodes, thereby affecting the complexity of the tree structure, and  λ  ensures that the score of the leaf nodes does not become too large, which helps to maintain balance and prevent overfitting, as shown in Equation (4):
Ω f t = γ T + 1 2 λ k = 1 T w k 2
By substituting equations  g i = α y ^ i l ( y i , y ^ i ) y ^ = y ^ i ( t 1 )  and  g i = α y ^ i l ( y i , y ^ i ) y ^ = y ^ i ( t 1 )  into the following formula and performing a second-order Taylor expansion on the loss function, the objective function of the  t  tree can be derived, which can also be minimized using the tree structure, as shown in Equation (5):
a b j ( t ) i = 1 n [ l ( y i , y ^ i ( t 1 ) ) + g i f t ( x i ) + 1 2 h i f t ( x i ) 2 ] + Ω ( f t )
Given a set of samples contained in a leaf, its optimal weight has a closed-form solution. This step determines the optimal leaf weight under a fixed tree structure, as shown in Equation (6):
w k = i I k   g i i I k   h i + λ
In order to determine the gain of node splitting, the objective function is improved after a leaf is split into left and right co-leaves. Only when gain > 0 is it worth splitting, and it is used to search for the optimal partition, as shown in Equation (7) as follows (where  G L = i I L   g i , H L = i I L   h i , G and H are parent nodes):
gain = 1 2 [ G L 2 H L + λ + G R 2 H R + λ G 2 H + λ ] γ

4. Simulation Analysis Results

The results presented in this section strictly adhere to the conceptual framework established in this study. Following the framework’s logic, the causal paths from five success factors to three core performance outcomes were analyzed and validated. Furthermore, the moderating mechanism of ES was examined. Among the collected data, there are 65 companies with an annual revenue of less than one million, 99 companies with revenue between 1.01 million and 5 million, 129 companies with revenue between 5.01 million and 10 million, and the largest number of companies with annual revenue of more than 10 million, with 197 companies. For a detailed distribution, please see Table A4. The respondents from the 490 companies were as follows: 44 cost estimators, 271 mid-level technical personnel, 127 project managers, and 48 digital construction managers. For detailed percentages, please refer to Table A5. Following the order of data analysis, the results of PLS-SEM were presented first, followed by the results of XGBoost.

4.1. PLS-SEM

4.1.1. Measurement Model Assessment

Construct reliability was assessed using CA and CR. As shown in Table 3, CA ranged from 0.893 to 0.944 and CR from 0.926 to 0.944, all exceeding the 0.70 benchmark and indicating high reliability. Convergent validity was evaluated via factor loadings and AVE. As presented in Table 3, all items loaded strongly on their intended constructs (loadings > 0.70), and AVE values ranged from 0.714 to 0.787, exceeding the 0.50. These results indicate that each construct explains more variance in its indicators than is attributable to measurement error, thereby confirming convergent validity.
Discriminant validity was assessed using both the Heterotrait–Monotrait (HTMT) ratio and the Fornell–Larcker criterion. As shown in Table 4, all HTMT values are below the 0.85 cutoff, indicating satisfactory discriminant validity. Table 5 further shows that the square root of each construct’s AVE exceeds its correlations with other constructs, supporting the distinctiveness of the latent variables.

4.1.2. Structural Model Results and Hypothesis Testing

A path coefficient approaching +1 indicates a strong positive association between the latent variables, whereas a value approaching −1 reflects a strong negative association [68]. Following established guidelines, a path coefficient must reach statistical significance at the 0.05 level or lower to validate the corresponding hypothesized relationship. As presented in Table 6, four hypotheses yielded p-values exceeding 0.05, indicating that these relationships are not statistically significant. For the remaining hypotheses, the β values range from 0.079 to 0.177, the T-values from 2.086 to 3.825, and the p-values from 0.001 to 0.037, all below the 0.05 significance threshold. Consequently, all 11 of these hypotheses are considered statistically significant.
The specific findings are as follows: EI pathway: The results confirm that under ES regulation, RM, R-Tm, SD, and PM have significant positive effects on EI (H1, H7, H10, and H13 are valid). However, the path of PO to EI (H4) is not statistically significant.
EO pathway: RM, PO, SD, and PM all have significant effects on EO (H2, H5, H11, and H14 are valid). R-Tm has no significant direct effect on EO (H8 is not valid).
CC pathway: PO, SD, and PM have significant effects on CC (H6, H12, and H15 are valid). However, RM and R-Tm did not reach statistical significance in the CC model (H3, H9).

4.2. XGBoost Results

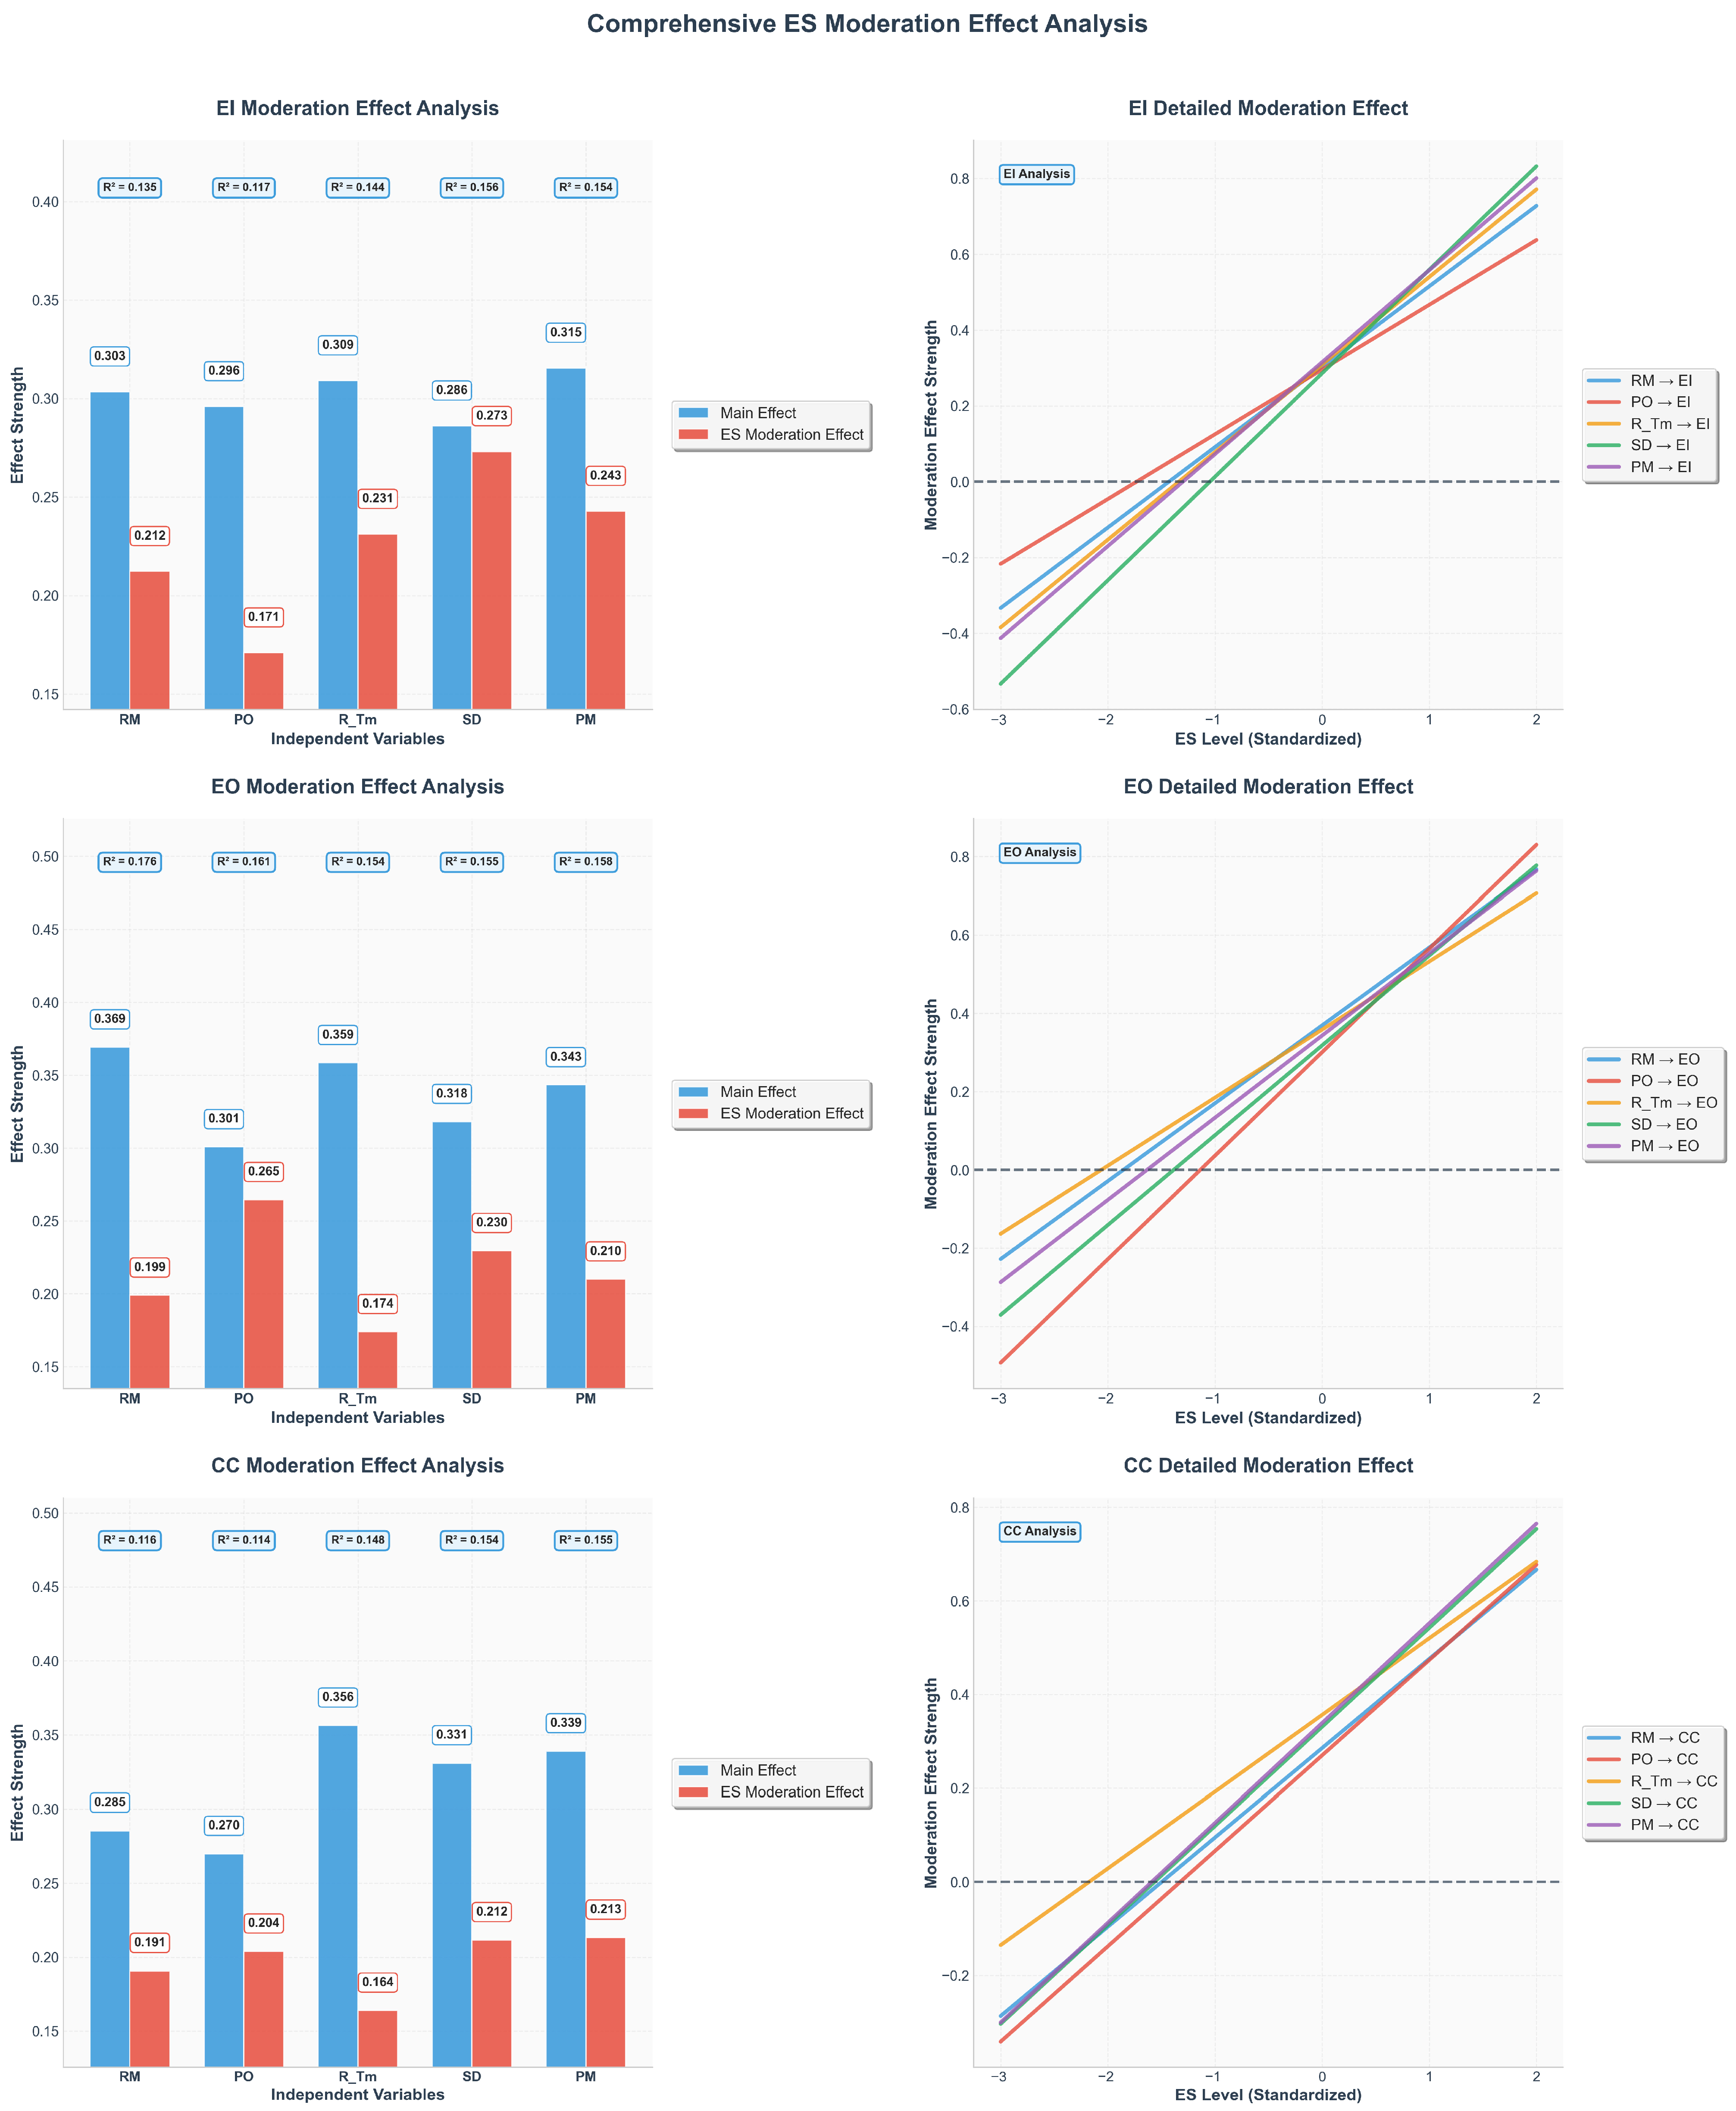
XGBoost analysis shows that ES, as a moderator, has a positive impact on all variables, with a main effect of 0.270–0.369 and an ES moderation effect of 0.164–0.273. See Table 7 for details. Figure 4 shows the impact of each dependent variable, and the impact relationships are as follows.

4.2.1. EI Model

The results in this section correspond to hypotheses H1, H4, H7, H10, and H13. As shown in Figure 5, RM, PO, R-Tm, SD, and PM have significant positive main effects on EI (0.286–0.315). ES also exerts a positive but weaker moderating effect (0.171–0.273). When ES is above the mean, these positive effects on EI are strengthened; when ES is low, some effects (such as PO) approach zero or are slightly weakened.

4.2.2. EO Model

The results in this section correspond to hypotheses H2, H5, H8, H11, and H14. As shown in Figure 5, the EO main effects range from 0.301 to 0.369, and ES moderating effects from 0.174 to 0.265, similar to the EI model. ES consistently amplifies the positive effects of management variables on EO, and the nearly parallel curves at high ES indicate comparable moderating sensitivity across variables.

4.2.3. CC Model

The results in this section correspond to hypotheses H3, H6, H9, H12, and H15. As shown in Figure 5, CC main effects range from 0.270 to 0.356 and ES moderating effects from 0.164 to 0.213. High ES strengthens the positive effects of the management variables on CC, whereas low ES weakens them without reversing their direction.
Overall, ES shows similar moderating strength in the EI and EO models but a weaker effect in the CC model. Across models, SD has the strongest moderating effect on EI, PO on EO, and PM on CC. Thus, ES acts as an “amplifier” strengthening the positive effects of these variables under high ES.
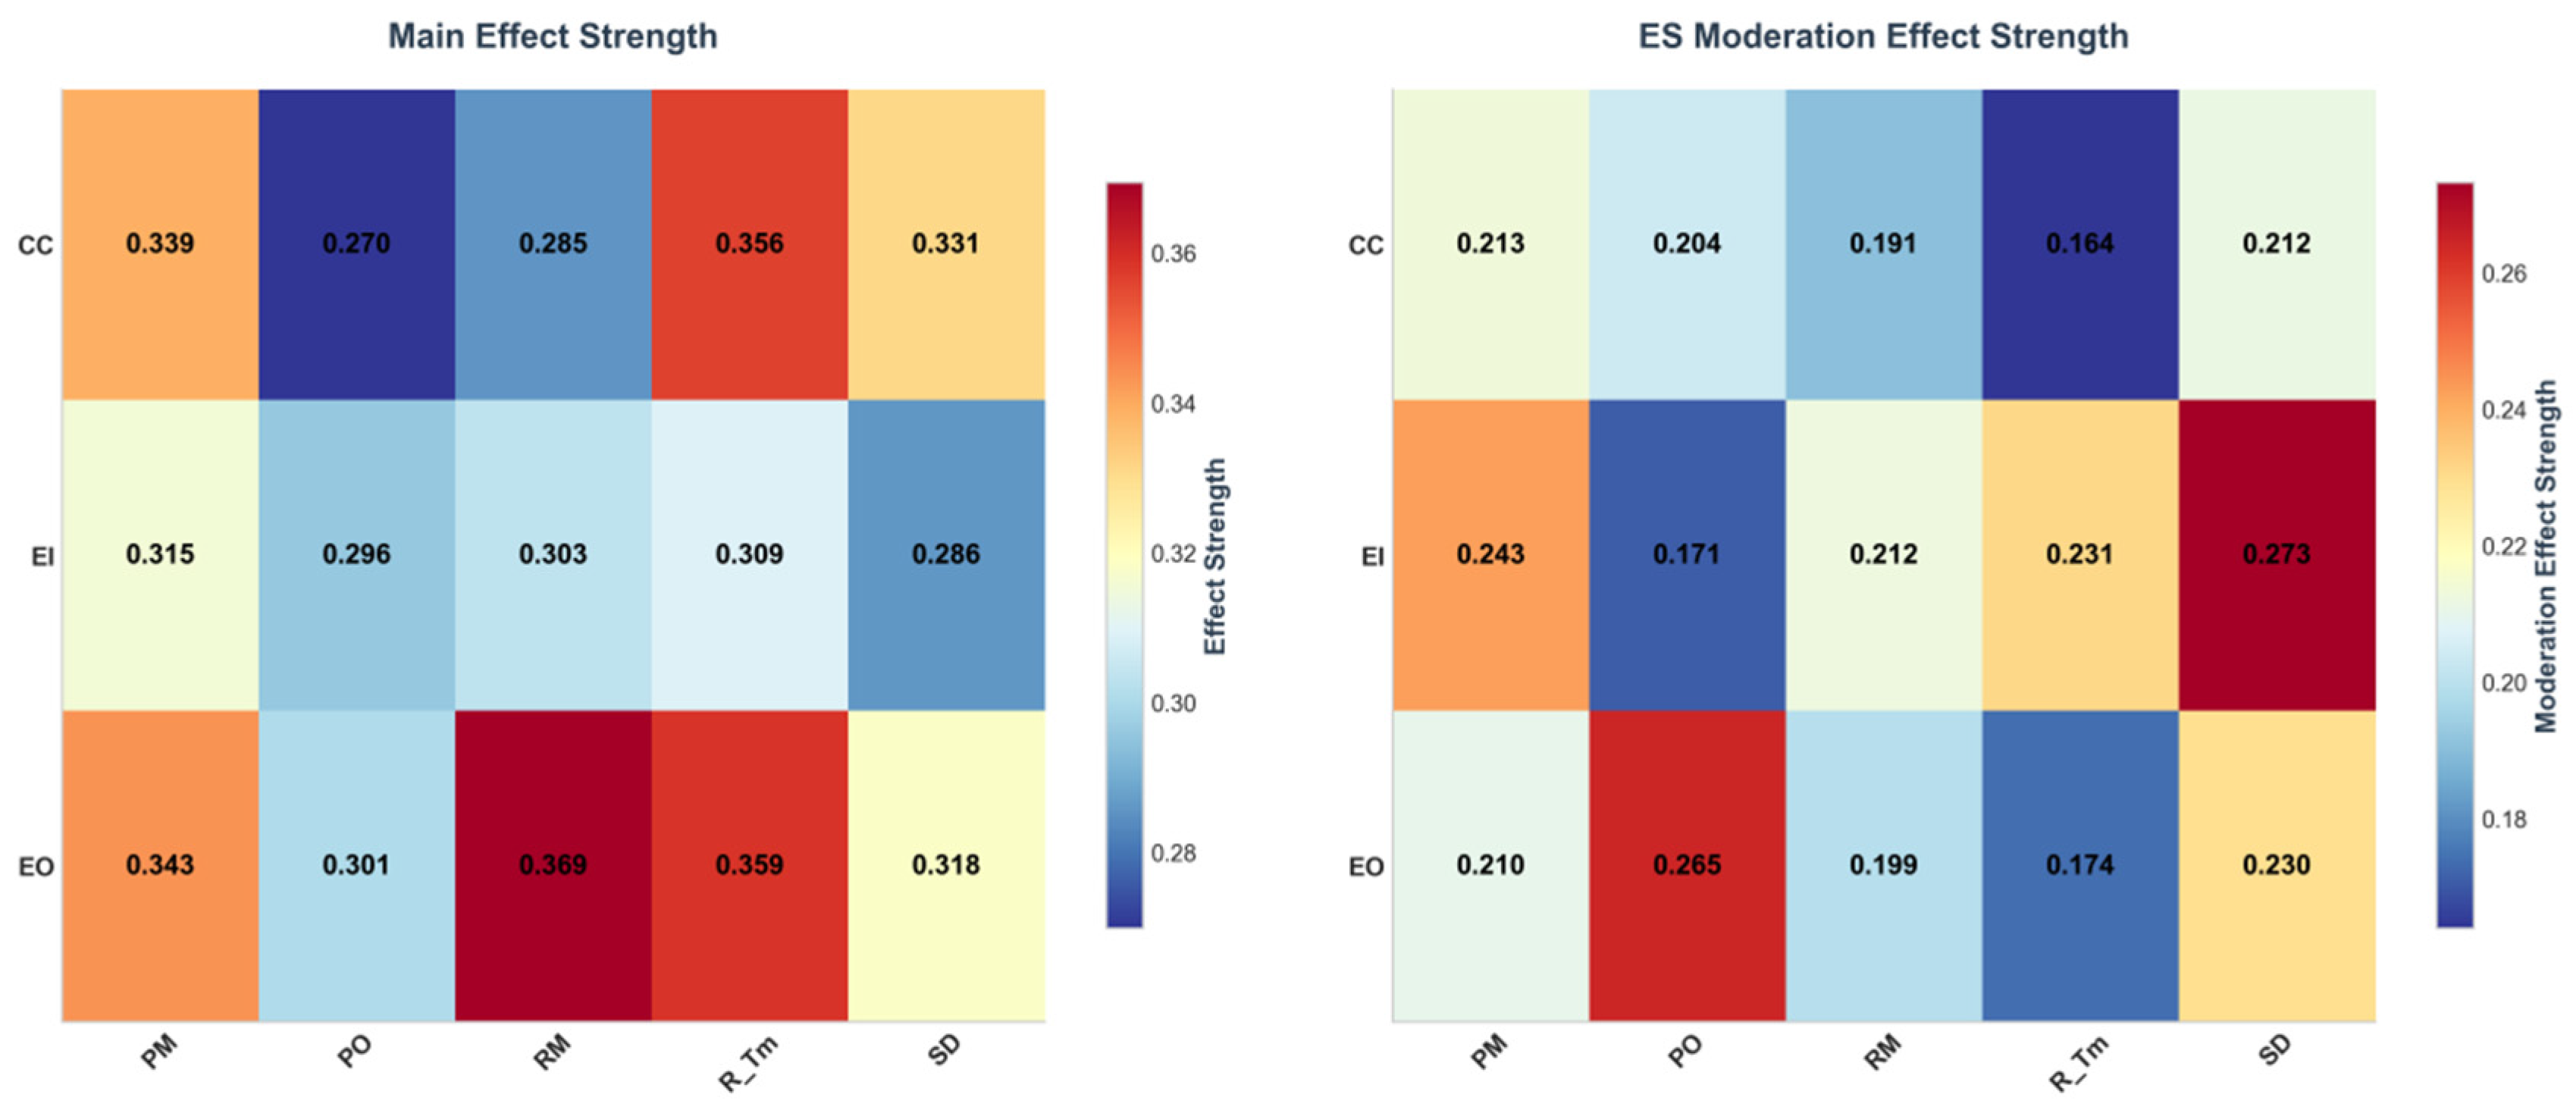
Figure 6 presents a heatmap comparing main and moderating effects of ES. For CC, R-Tm has the strongest main effect (0.356) and PO the weakest (0.270), while PM shows the strongest moderation (0.213) and R-Tm the weakest (0.164). For EI, PM has the largest main effect (0.315) and SD the smallest (0.286), whereas SD shows the strongest moderation (0.273) and PO the weakest (0.171). For EO, RM has the strongest main effect (0.369) and PO the weakest (0.301), while PO has the largest moderating effect (0.265) and R-Tm the smallest (0.174). Overall, ES exerts different amplifying effects on success factors across scenarios but generally acts as a positive amplifier, consistent with the PLS-SEM moderation results.
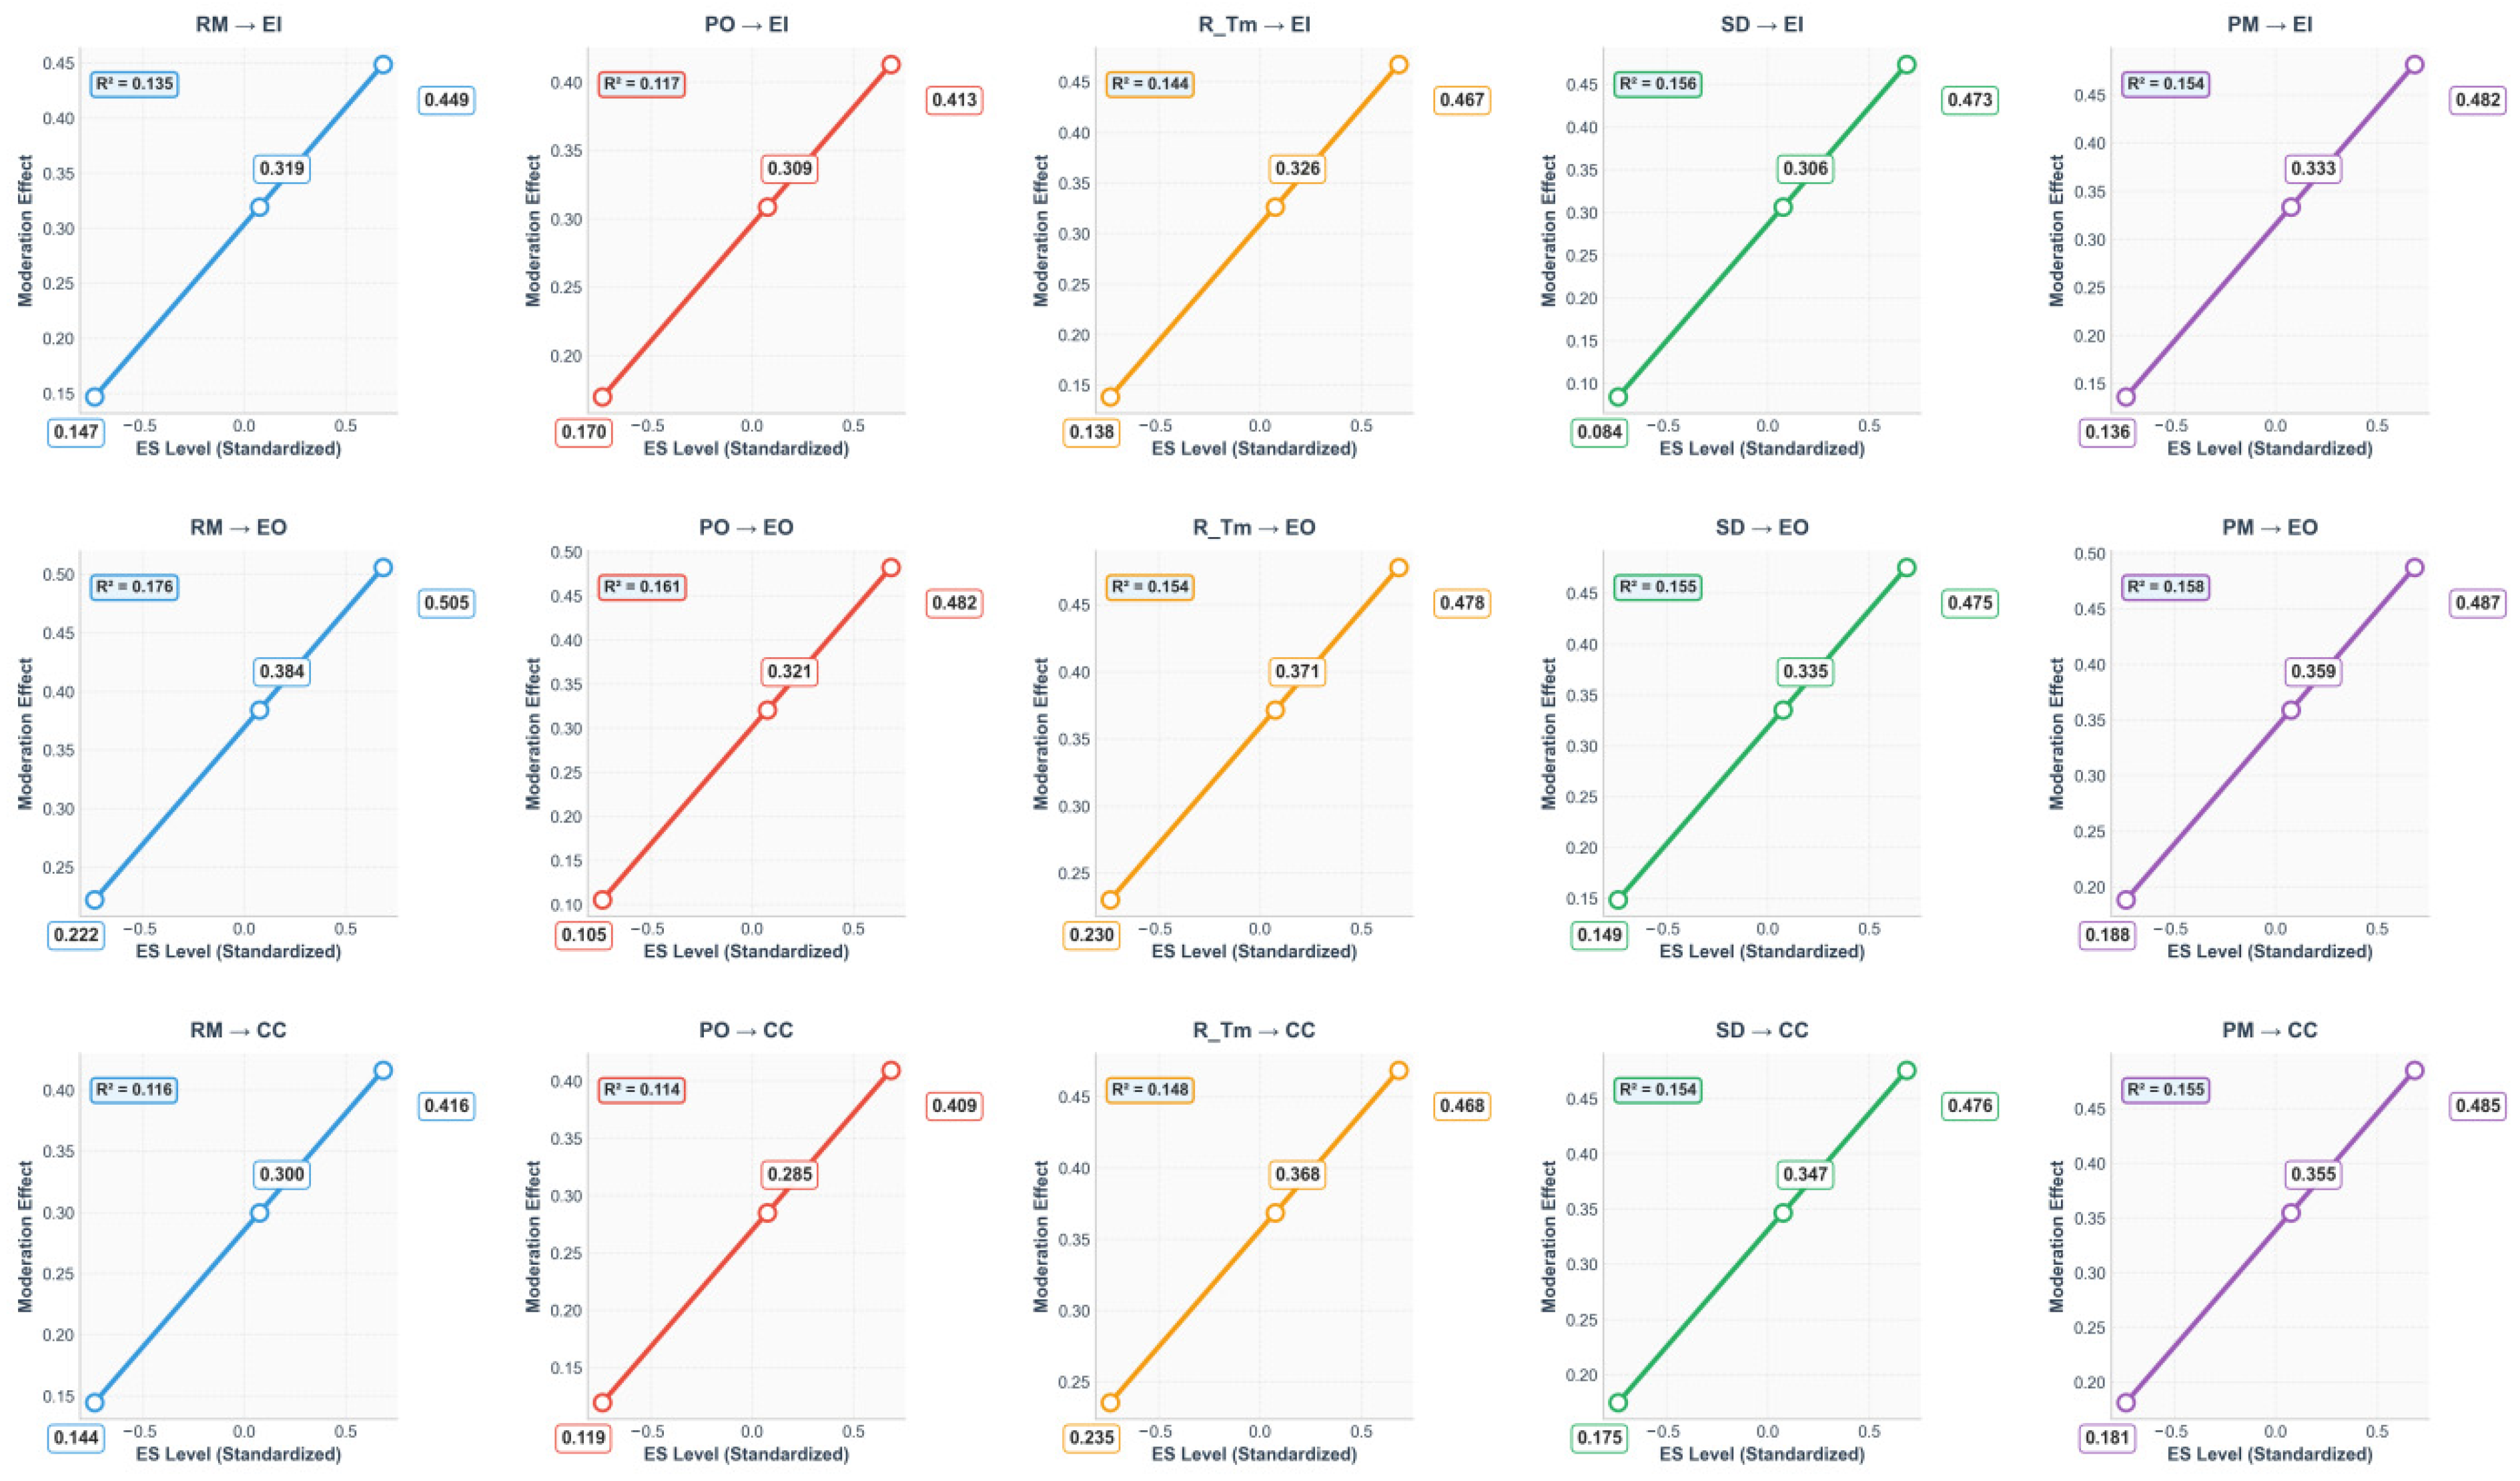
Figure 7 illustrates how ES moderates the relationships between success factors and performance outcomes. The x-axis values −0.5, 0, and 0.5 represent low, medium, and high ES, respectively, and the y-axis indicates the strength of this moderating effect. Higher values indicate a stronger moderating effect of ES on this internal relationship. The figure also reports R2 for each hypothesis set, indicating how much variance the model explains. In a discussion article on “acceptable R2” in empirical modeling in the social sciences, Peterson K. Ozili [79] pointed out the following: moderation effects are typically interaction effects, which simply alter the slope of the relationship between the independent and dependent variables. Their explanatory power is typically much weaker than that of direct predictors. An R2 of ≥0.10 is considered acceptable. In this study, the PO→CC effect had the lowest R2 (0.114) and the PM→EO effect had the highest R2 (0.158), both within acceptable ranges.

4.3. Cross-Method Validation of Effects

PLS-SEM and XGBoost yield consistent estimates of the predictive impact and relative importance of each success factor under ES, shown in Table 8. PLS-SEM p-values show that RM significantly moderates EI and EO (p < 0.05) and is marginally significant for CC (p = 0.064), aligning with XGBoost interaction results that indicate strong RM moderation for EI and EO but weaker influence on CC.
In terms of PO, the PLS-SEM p-value results show that its moderating effect on EO is the most significant (p = 0.001), while the significance of EI is poor. This is consistent with the conclusion in XGBoost analysis that PO has the highest moderating effect on EO (0.265). In addition, the moderating effect on CC is moderate, indicating that PO is most sensitive to operational EO under high ES conditions.
In the PLS-SEM, R-Tm was significant only in the EI dimension (p = 0.014), but not in EO and CC. XGBoost also revealed that its predictive impact on EI was higher than that on the other two dimensions. This suggests that the efficiency conversion of economic resources is more prominent in the EI context, while its role in EO and CC is relatively limited.
SD was the most consistently prominent factor across both methods. PLS-SEM revealed a significant positive moderating effect across all three dimensions: EI, EO, and CC (p < 0.05). XGBoost further quantified its high moderating effect across these dimensions (EI = 0.273, EO = 0.230, CC = 0.154), highlighting the centrality and universality of SD in DT implementation.
PM significantly impacted EI, EO, and CC in the PLS-SEM (p < 0.05). XGBoost also demonstrated a high predictive impact on EI and EO (EI = 0.243, CC = 0.210). This demonstrates that PM can effectively balance energy and efficiency under high ES conditions, ensuring dual optimization.
In summary, SD*ES and PM*ES showed significant positive effects on all three dependent variables (EI, EO, CC), with SD having the strongest driving effect on EI. This implies that in economically developed environments, systematic SD is the core engine for achieving comprehensive optimization of “efficiency, energy, and cost.” This finding confirms the strategic dominance of SD in complex systems, consistent with the views of Rashidian, et al. [80]. However, not all mechanisms achieve comprehensive gains. Notably, while R-Tm*ES significantly improves efficiency, it has no significant impact on EO and CC. This indicating that while R-Tm alone can accelerate operational response, it is difficult to directly translate into energy savings or cost reductions without further decision-making intervention. This finding provides an important perspective for revising existing literature. Similarly, while RM*ES improves efficiency and energy performance, its effect on CC is not significant, suggesting that refined RM at high ES levels may be accompanied by high implementation costs, thus offsetting some economic benefits.

5. Discussion

5.1. Interpretation of the Results

Overall, ES, as a moderating factor, has a significant positive impact on the relationship between most success factors and performance outcomes. This is consistent with the view of Wang, et al. [81] that economic level may affect the adoption of digital technology. A higher ES can amplify the performance contribution of success factors in the three dimensions of EI, EO, and CC. This study showed that of the 15 hypothesized relationships, 11 were supported, with the exception of RM*ES and CC, PO*ES and EI, R-Tm*ES and EO, and R-Tm*ES and CC, where p-values were greater than 0.05 but were slightly below significance. The specific analysis is as follows:
The H3 pathway was not significant, and ES did not significantly moderate the relationship between RM and CC. This result challenges the traditional assumption that RM necessarily reduces costs. Despite the strong ES structure, the high initial capital expenditure and subsequent operation and maintenance costs of DT infrastructure often offset the short-term labor or material savings brought by RM, thus masking the cost reduction effect of RM. This indicates that CC can no longer be improved simply by increasing technological investment. This is consistent with the view of Torres-García and Ramírez-Luján [82], which are limited by the “cost premium” in the early stage of transformation. Therefore, it is necessary to re-evaluate the financial value of DT from a long-term capitalization perspective.
The non-significant result of the H4 path between PO and EI challenges the traditional assumption that PO directly improves EI. This suggests that the impact of PO on efficiency has become more uniform across companies with different ES levels. The widespread use of lean management and standardized scheduling tools has gradually reduced the IT advantages of leading firms [83]. In the current industry context, relying on PO alone is no longer a core advantage, and without deeper technical integration, increased investment is unlikely to produce significant efficiency gains.
The failure of the H8 pathway challenges the inherent assumption that R-Tm affects EO. The results show that R-Tm alone, without specific technological intervention, can no longer directly drive a significant improvement in energy performance. As Davinack [84] stated: EO is a technically demanding independent pathway, and it is difficult to achieve actual emission reductions by R-Tm alone, unless there is a dedicated investment in sensing and simulation.
The non-significant H9 path challenges the assumption that R-Tm necessarily leads to cost reduction. This finding indicates that even under strong ES conditions, companies face difficulties in rapidly translating R-Tm into CC. One key reason is that the high operating costs, carbon compliance requirements, and long-term maintenance expenses associated with DT create a cost premium in the early stages, which offsets marginal savings in labor or materials. As noted by Zeng, et al. [85], the rigidity of these expenditures causes CC to exhibit a clear time lag, suggesting that R-Tm alone is insufficient to quickly compensate for the complexity of DT-related investments.
Specifically, under high ES, RM shows high moderating sensitivity for EI and EO, creating value mainly by improving energy use and operational efficiency, with cost reductions arising indirectly through lower energy consumption. When ES is strong, R-Tm can more easily boost efficiency, but its direct impact on energy and CC is limited and may require support from other factors. The universality and strategic role of SD in DT implementation suggest high conversion efficiency across different performance goals, while under high ES, PM can jointly enhance energy and efficiency and also address cost, making it a key mechanism for comprehensive optimization.

5.2. Comparison with Previous Studies

Our findings echo existing research in several key areas while providing new empirical insights. For example, Ba, et al. [86] and Ali, et al. [87] highlighted the energy saving potential of DT. The XGBoost findings further corroborate this finding and quantify the crucial facilitating role of ES in these pathways, a factor often overlooked in purely technical analyses.
Furthermore, while Opoku, Leal Filho, Hubert and Adejumo [16] identified common challenges in implementation, they did not analyze measurable impacts across different performance dimensions. Unlike previous studies that focused on single objectives such as life cycle cost [88] or energy efficiency [87], this study examines EI, EO, and CC simultaneously within a unified framework.
Notably, our study found that R-Tm alone does not significantly reduce costs, challenging the optimistic assumptions of Saback, Popescu, Täljsten and Blanksvärd [9]. This discrepancy suggests a cost disadvantage in early adoption of DT, consistent with the financial lag mechanism identified by Zeng, Ren and Ning [85]. By building upon our findings with EMT, we bridge the gap between technological potential and economic reality more effectively than previous single-method studies.
While existing research has focused on the impact of design delivery and related management and technical strategies on building performance, this study differs significantly from existing research in terms of its methodology and implementation approach. First, the existing literature often relies on single analytical techniques, such as systematic literature reviews, case studies, or SEM. While these techniques can reveal relationships between key success factors and performance, they struggle to balance predictive and explanatory power. This study combines PLS-SEM and XGBoost to construct a research mechanism encompassing theoretical causal analysis, data validation, and real-world prediction. PLS-SEM validated the statistical significance of the path, while XGBoost determined the degree of influence through feature importance and moderating effect, revealing the fluctuation patterns of DT performance under different ES gradients. This method effectively addresses common nonlinearity and potential multicollinearity issues in the questionnaire data. Traditional linear models often fail to capture the subtle changes in the impact of ES on variables at different levels. However, although this method improves prediction accuracy, it is still limited by the static properties of cross-sectional data and cannot capture the complete trajectory of the dynamic evolution of performance during DT implementation like time series analysis.

5.3. Implications for Practice and Policy

For enterprise practice, a differentiated strategy is adopted based on ES. Enterprises with sufficient resources should fully deploy DT to maximize overall benefits. Enterprises with limited resources should proceed in phases, focus on SD when economic strength is high, and then expand to the full process. At the same time, they should build a full lifecycle management system, strengthen cross-department collaboration to break down information silos, and ensure continuous resource optimization and performance improvement. In addition, to address implementation complexity, firms should adopt phased strategies that match their economic constraints and reduce upfront costs. Success also requires cross-departmental collaboration to remove silos. Firms should also upgrade data systems from passive monitoring to active decision-making interventions.
For policy-making, it shows policymakers how to tailor support by regional economic level to direct resources efficiently and accelerate the low-carbon transition. This study recommend a tiered support system based on regional economic levels. Developed regions should prioritize full digital transformation. Less developed regions can follow a gradual path with cost first and energy efficiency later. Governments can provide targeted incentives such as green financing and tax breaks. These measures guide enterprises toward high-value areas. They also reduce resource misallocation and accelerate the industry’s low-carbon transition.

6. Conclusions

This study innovatively integrates a hybrid PLS-SEM and XGBoost analytical framework at the academic level, constructing and validating an empirical model that links DT success factors with measurable performance outcomes. Using a hybrid analytical approach that combined PLS-SEM with ML techniques, the study provided both explanatory and predictive insights into DT performance. This study identified the five key DT success factors that drive construction performance, such as RM, PO, energy monitoring, SD, and PM. In addition, the moderating factor ES was also identified. SD and PM maintain high moderating effects in all dimensions, demonstrating their universal influence across domains, while PO also performs strongly in CC and EO. At the policy level, the study advocates for a tiered support system based on enterprise ES to promote substantive industrial decoupling through differentiated interventions. For industry practice, the study guides stakeholders to match digital assets accurately according to ES, maximize technological benefits by focusing on core driving factors, and avoid resource misallocation risks. Furthermore, by examining China’s CI, especially regions like Hebei under “dual-carbon” pressure, this study highlights the urgent need to decouple growth from environmental harm. The results show that DT success factors only yield strong efficiency and sustainability benefits when supported by high ES. This confirms the relevance of EMT in China and suggests that policy should not only promote technology use but also strengthen enterprise financial capacity to turn DT potential into real decarbonization outcomes.
While this research offers valuable theoretical and practical insights, several limitations should be acknowledged. To begin with, the sample is drawn primarily from selected urban areas in China, without a systematic comparison across different tiers of cities, which constrains the overall breadth of the dataset. Moreover, data collection is primarily based on questionnaire surveys, which may render the findings vulnerable to subjective bias, differences in respondents’ interpretations, and possible misapprehensions of the questions, particularly regarding the understanding of technical variables. While the study acknowledges the subjectivity of the questionnaire data, the seriousness of its potential biases must be emphasized. Social expectation bias may lead respondents to overestimate the effectiveness of their company’s DT, which can result in inflated path coefficients in the SEM model. Furthermore, the survey participants included a diverse range of roles, from cost estimators to project managers, and differences in technical understanding could introduce systematic biases, potentially affecting the accuracy of the thresholds predicted by the XGBoost analysis. Furthermore, because the data were gathered at a single point in time, the study is inherently constrained by the nature of cross-sectional analysis, limiting its ability to capture evolving relationships among variables. In addition, the current model without the integration of mediating factors, which narrows its scope and restricts the potential to explore more complex and nuanced relationships. Finally, the implementation of DT remains uncertain due to technological heterogeneity. Because the maturity and definition of DT vary across industries, its effectiveness often takes time to materialize, thus the actual results of DT are uncertain.
For future research: The scope of data collection can be expanded to cover more types of cities, and qualitative interviews can be combined with in-depth case studies to enhance the rigor and authenticity of the research results. Furthermore, the research scope can be extended to all stakeholders throughout the building lifecycle, such as developers, facility operators, and maintenance service providers, to build a more comprehensive framework for digital transformation applications. In terms of policy formulation: First, establish an ES-based tiered support mechanism to enhance the economic resilience of enterprises of different sizes through differentiated financial incentives. Second, shift funding focus to core drivers (SD, PM) for precise incentives to maximize value creation. Third, enforce unified data operation standards to ensure the effective flow of digital assets across stakeholders throughout the building lifecycle.

Author Contributions

Conceptualization, J.S., Q.L. and Y.X.; methodology, J.S. and Q.L.; software, J.S., Q.L. and Y.Z. validation, J.S., T.J.K. and S.L.; formal analysis, J.S.; investigation, J.S.; resources, A.O.; data curation, J.S.; writing—original draft preparation, J.S., Q.L. and S.L.; writing—review and editing, J.S. and S.L.; visualization, J.S. and Y.Z.; supervision, A.O. and T.J.K.; project administration, J.S. and S.L. All authors have read and agreed to the published version of the manuscript.

Funding

This research received no external funding.

Institutional Review Board Statement

This study aims to examine the carbon reduction pathways of digital twin technology in the. construction. industry. The research subjects are enterprises; therefore, all respondents to the questionnaire were enterprises, not individuals or animals. This is a non-interventional study and does not require ethical approval. To ensure the ethical integrity and reliability of the research· process, the following measures have been taken.

Informed Consent Statement

Informed Consent: All participating companies have been fully informed of the purpose, content, and methodology of the study and have expressed their informed consent by signing. consent forms, clearly indicating their voluntary participation and agreement to have their data. used in this study.

Data Availability Statement

The raw data supporting the conclusions of this article will be made available by the authors on request.

Conflicts of Interest

The authors declare that there are no known competing financial interests or personal relationships that could have appeared to influence the work reported in this paper.

Abbreviations

DTDigital twin
IoTInternet of Things
PLS-SEMPartial Least Squares Structural Equation Modeling
SEMStructural Equation Modeling
EMTEcological Modernization Theory
RMResource management
POProcess optimization
R-TmReal-time monitoring
SDSustainable design
PMPredictive maintenance
EIEfficiency improvement
EOEnergy optimization
CCCost control
ESEconomic strength
CRComposite reliability
AVEAverage variance extracted
CACronbach’s alpha
HTMTHeterotrait–Monotrait
XGBoostExtreme gradient boosting
R2Coefficient of determination
RMSERoot mean square error
MAEMean absolute error
BIMBuilding information modeling
PLMProduct Lifecycle Management
CIConstruction industry
MLMachine learning

Appendix A

Table A1. Questionnaire.
VariablesNo.Measurement ItemsIndicator Sources
RM1DT can achieve resource management in the construction field through facility management.[89]
2By adopting DT, stakeholders can better understand the status of buildings, thereby optimizing resource utilization.[17]
3DT utilizes multi-agent technology to model enterprise assets and processes, thereby optimizing resource management.[90]
4DT can be used to simulate resource flow, thereby optimizing resource management.[91]
PO5DT can optimize the construction process, improve quality and productivity.[26]
6During the construction phase, DT helps construction teams gain a clearer understanding of the project’s structure, materials, and processes, thereby enabling process optimization.[89]
7DT, as a virtual copy of physical assets, is an important tool in the construction industry and helps optimize processes.[37]
8The new generation DT platform supports multi-domain and multi-timescale simulation, which helps to optimize the operation process.[92]
R-Tm9DT monitors the real-time status of physical objects through virtual models.[4]
10DT monitors the lifecycle of physical assets through digital connectivity.[4]
11DT can perform continuous monitoring according to the set process.[4]
12DT acts as a dynamic information database during the construction phase, enabling real-time monitoring of the entire process from design and construction to use.[26]
13DT uses high-fidelity virtual models to achieve safety monitoring at construction sites.[26]
SD14DT supports the design and management of buildings throughout their lifecycle, which can reduce the impact on infrastructure and the environment, thereby improving sustainability.[26]
15DT provides a framework to help integrate sustainability goals into the design and management of building projects.[26]
16During the architectural design phase, DT can simulate the energy consumption of different schemes and select the energy-saving and environmentally friendly option.[17]
17DT improves design sustainability by simulating and optimizing each design stage.[89]
PM18DT can provide real-time updates of physical state and support data-driven predictive model analysis.[4]
19DT collects data, records, and assesses the current state of a building to help determine whether maintenance is needed.[41]
20DT can predict failures and optimize equipment maintenance plans, reducing downtime and extending equipment life.[67]
21DT is a tool that supports innovation and can drive the application of predictive maintenance strategies.[26]
22DT integrates real-time data to promptly identify and resolve problems, preventing them from escalating further.[21]
ES23Enterprises with strong economic strength should utilize digital transformation to improve their production levels.[93]
24Enterprises with strong economic strength can invest more resources in DT (Data Technology) and drive digital transformation.[94]
25Enterprises with stronger economic strength are better positioned to invest in DT technology, thereby optimizing asset management, reducing operating costs, and further improving profitability.[95]
26Companies with a strong economic foundation can shorten their life cycle and improve profitability through digital transformation.[96]
27Enterprises with strong economic strength can afford infrastructure construction and learning costs, thus promoting transformation.[97]
EI28DT improves work efficiency through predictive platforms.[4]
29DT improves work efficiency by troubleshooting remotely.[4]
30Regardless of the production department, using DT can make the design process and subsequent operations more efficient.[26]
31DT can facilitate design analysis and communication, and improve design and construction efficiency.[41]
32DT integrates quality control, safety management, and equipment management functions to help simplify on-site processes and improve work efficiency.[37]
EO33During the usage phase, DT helps achieve sustainable energy management and optimize building energy.[26]
34DT can optimize energy use and balance user comfort with energy consumption.[26]
35DT is not an important tool for regulating smart home energy systems.[98]
36During the design phase, DT can simulate the energy consumption of different schemes to help select energy-saving and environmentally friendly solutions.[17]
37DT supports real-time data acquisition and analysis, helping to detect faults early, intervene in a timely manner, and reduce energy waste.[99]
CC38DT can troubleshoot remotely, reducing maintenance costs.[4]
39Companies can use DT to test new designs, thereby reducing costs.[9]
40DT helps buildings save on operating costs by optimizing building performance and reducing emissions.[100]
41DT reduces maintenance costs and extends the lifespan of building materials through lifecycle management.[17]
Table A2. Pilot test results.
VariablesCACRAVE
CC0.7450.8390.567
EI0.7640.8400.528
EO0.7920.8640.595
ES0.8670.9050.659
PM0.7660.8440.525
PO0.8420.8940.679
R-Tm0.8270.8800.598
RM0.7450.8390.567
SD0.7640.8400.528
Table A3. XGBoost validation indicators.
IndexDefinition
R21 − Σ(y − ŷ)2/Σ(y − ȳ)2
RMSE√[(1/n) Σ(y − ŷ)2]
MAE‘(1/n) Σ
CVScore(1/k) × Σi Validation R2 (k = 5)
Table A4. Company size distribution table.
FrequencyPercentage
<100 million6512.9%
101–500 million9920.3%
501–1000 million12926.4%
>1000 million19740.4%
Total490100%
Table A5. Respondent statistics.
FrequencyPercentage
Cost Estimator448.6%
Mid-level Technical Personnel27155.5%
Project Manager12726%
Digital Construction Manager489.8%
Total490100%

References

  1. Yevu, S.K.; Owusu, E.K.; Chan, A.P.C.; Sepasgozar, S.M.E.; Kamat, V.R. Digital twin-enabled prefabrication supply chain for smart construction and carbon emissions evaluation in building projects. J. Build. Eng. 2023, 78, 107598. [Google Scholar] [CrossRef]
  2. Faraji, A.; Ghasemi, E.; Arya, S.H.; Mahabadi, H.A. Prediction of Effects of Industry 5.0 Concepts on Construction 5.0. In Proceedings of the 3rd International Conference on Recent Advances in Engineering, Innovation & Technology, Brussels, Belgium, 10 March 2025; Available online: https://www.researchgate.net/publication/385848718_Prediction_of_Effects_of_Industry_50_Concepts_on_Construction_50 (accessed on 8 December 2024).
  3. Wahbeh, W.; Kunz, D.; Hofmann, J.; Bereuter, P. Digital Twinning of the Built Environment–an Interdisciplinary Topic for Innovation in Didactics. ISPRS Ann. Photogramm. Remote Sens. Spat. Inf. Sci. 2020, 4, 231–237. [Google Scholar] [CrossRef]
  4. Madubuike, O.C.; Anumba, C.J.; Khallaf, R. A review of digital twin applications in construction. J. Inf. Technol. Constr. 2022, 27, 145–172. [Google Scholar] [CrossRef]
  5. Svadkovsky, V. The Use of Digital Twins to Improve the Operational Efficiency in the Extractive Industries. Strateg. Decis. Risk Manag. 2024, 14, 292–311. [Google Scholar] [CrossRef]
  6. Mu, H.; Cheng, M.; Tang, X.; Ding, R.; Ma, W. A hybrid distributed-centralized load sensing system for efficiency improvement of electrified construction machinery. Energy 2025, 314, 134123. [Google Scholar] [CrossRef]
  7. Samaratunga, M.; Li, S. Design for Low Carbon in the Construction Industry. In Global Net Zero Carbon Practices in Construction; Domingo, N., Senarathne, S., Wilkinson, S., Perera, S., Eds.; Springer Nature: Singapore, 2025; pp. 79–99. [Google Scholar] [CrossRef]
  8. Yilmaz, S.; Kumar, D.; Hada, S.; Demirkesen, S.; Zhang, C.; Li, H. A PMBOK-based construction cost management framework for BIM integration in construction projects. Int. J. Constr. Manag. 2025, 25, 861–875. [Google Scholar] [CrossRef]
  9. Saback, V.; Popescu, C.; Täljsten, B.; Blanksvärd, T. Analysis of Digital Twins in the Construction Industry: Current Trends and Applications. In Building for the Future: Durable, Sustainable, Resilient; Springer: Cham, Switzerland, 2023; pp. 1080–1088. [Google Scholar] [CrossRef]
  10. Barham, D.; Matarneh, S.T.; Tezel, A.; Hasan, S.; Mereb, W. Opportunities and challenges of digital twin applications in the Middle East construction industry. Urban. Sustain. Soc. 2025, 2, 229–256. [Google Scholar] [CrossRef]
  11. Beitelmal, W.; Alruwaythi, O. Exploring the Benefits of Digital Transformation (DT) for Infrastructure Asset Management (IAM) in Terms of Efficiency, Cost Savings, and Performance Optimization. Arab. J. Sci. Eng. 2025. [Google Scholar] [CrossRef]
  12. Zhao, X.; Chen, Q.A.; Zhang, H.; Chen, P.; Chen, S. A study on the influencing factors of corporate digital transformation: Empirical evidence from Chinese listed companies. Sci. Rep. 2024, 14, 6243. [Google Scholar] [CrossRef]
  13. Wu, L.; AbouRizk, S. Towards construction’s digital future: A roadmap for enhancing data value. In Canadian Society of Civil Engineering Annual Conference; Springer: Berlin/Heidelberg, Germany, 2021; Volume 68, pp. 225–238. [Google Scholar] [CrossRef]
  14. Qi, Q.; Tao, F. Digital Twin and Big Data Towards Smart Manufacturing and Industry 4.0: 360 Degree Comparison. IEEE Access 2018, 6, 3585–3593. [Google Scholar] [CrossRef]
  15. Rojas, L.; Peña, Á.; Garcia, J. AI-Driven Predictive Maintenance in Mining: A Systematic Literature Review on Fault Detection, Digital Twins, and Intelligent Asset Management. Appl. Sci. 2025, 15, 3337. [Google Scholar] [CrossRef]
  16. Opoku, S.K.; Leal Filho, W.; Hubert, F.; Adejumo, O. Climate Change and Health Preparedness in Africa: Analysing Trends in Six African Countries. Int. J. Environ. Res. Public Health 2021, 18, 4672. [Google Scholar] [CrossRef]
  17. Zhang, Z.; Wei, Z.; Court, S.; Yang, L.; Wang, S.; Thirunavukarasu, A.; Zhao, Y. A Review of Digital Twin Technologies for Enhanced Sustainability in the Construction Industry. Buildings 2024, 14, 1113. [Google Scholar] [CrossRef]
  18. Negri, E.; Fumagalli, L.; Macchi, M. A Review of the Roles of Digital Twin in CPS-based Production Systems. Procedia Manuf. 2017, 11, 939–948. [Google Scholar] [CrossRef]
  19. Rosen, R.; Von Wichert, G.; Lo, G.; Bettenhausen, K.D. About the importance of autonomy and digital twins for the future of manufacturing. IFAC-PapersOnLine 2015, 48, 567–572. [Google Scholar] [CrossRef]
  20. Saback, V. Digital Twins for Asset Management of Structures; Luleå University of Technology: Luleå, Sweden, 2022. [Google Scholar]
  21. Omrany, H.; Al-Obaidi, K.M.; Husain, A.; Ghaffarianhoseini, A. Digital Twins in the Construction Industry: A Comprehensive Review of Current Implementations, Enabling Technologies, and Future Directions. Sustainability 2023, 15, 10908. [Google Scholar] [CrossRef]
  22. Wang, X.; Yu, H.; McGee, W.; Menassa, C.C.; Kamat, V.R. Enabling Building Information Model-driven human-robot collaborative construction workflows with closed-loop digital twins. Comput. Ind. 2024, 161, 104112. [Google Scholar] [CrossRef]
  23. Bäcklund, K.; Lundqvist, P.; Molinari, M. Showcasing a digital twin for higher educational buildings: Developing the concept toward human centricity. Front. Built Environ. 2024, 10, 1347451. [Google Scholar] [CrossRef]
  24. Ni, Z.; Zhang, C.; Karlsson, M.; Gong, S. Leveraging Deep Learning and Digital Twins to Improve Energy Performance of Buildings. In Proceedings of the 2023 IEEE 3rd International Conference on Industrial Electronics for Sustainable Energy Systems (IESES), Shanghai, China, 26–28 July 2023. [Google Scholar] [CrossRef]
  25. Thelen, A.; Zhang, X.; Fink, O.; Lu, Y.; Ghosh, S.; Youn, B.D.; Todd, M.D.; Mahadevan, S.; Hu, C.; Hu, Z. A comprehensive review of digital twin—Part 1: Modeling and twinning enabling technologies. Struct. Multidiscip. Optim. 2022, 65, 354. [Google Scholar] [CrossRef]
  26. Lauria, M.; Azzalin, M. Digital Twin Approach in Buildings: Future Challenges via a Critical Literature Review. Buildings 2004, 14, 376. [Google Scholar] [CrossRef]
  27. Cespedes-Cubides, A.S.; Jradi, M. A review of building digital twins to improve energy efficiency in the building operational stage. Energy Inform. 2024, 7, 11. [Google Scholar] [CrossRef]
  28. Agouzoul, A.; Simeu, E.; Tabaa, M. Enhancement of Building Energy Consumption Using a Digital Twin based Neural Network Model Predictive Control. In Proceedings of the 2023 International Conference on Control, Automation and Diagnosis (ICCAD), Rome, Italy, 10–12 May 2023. [Google Scholar] [CrossRef]
  29. Zhao, S.; Zhu, Y.; Lou, P.; Hu, Y.; Xu, C.; Chen, Y. Optimization Model of Substation Building Envelope–Renewable Energy Utilization Based on Life-Cycle Minimum Carbon Emissions. Buildings 2023, 13, 1602. [Google Scholar] [CrossRef]
  30. Ghosh, D.P. Intelligent Infrastructure Delivery: AI-Driven Solutions for Lifecycle Design and Engineering Management. 2025. Available online: https://www.researchgate.net/profile/Debi-Prasad-Ghosh/publication/391279441_Intelligent_Infrastructure_Delivery_AI-Driven_Solutions_for_Lifecycle_Design_and_Engineering_Management/links/68112c54bfbe974b23bd7370/Intelligent-Infrastructure-Delivery-AI-Driven-Solutions-for-Lifecycle-Design-and-Engineering-Management.pdf (accessed on 8 December 2024).
  31. Moshood, T.D.; Rotimi, J.O.; Shahzad, W.; Bamgbade, J. Infrastructure digital twin technology: A new paradigm for future construction industry. Technol. Soc. 2024, 77, 102519. [Google Scholar] [CrossRef]
  32. Sghiri, A.; Gallab, M.; Merzouk, S.; Assoul, S. Leveraging Digital Twins for Enhancing Building Energy Efficiency: A Literature Review of Applications, Technologies, and Challenges. Buildings 2025, 15, 498. [Google Scholar] [CrossRef]
  33. Wang, D.S. Association between technological innovation and firm performance in small and medium-sized enterprises: The moderating effect of environmental factors. Int. J. Innov. Sci. 2019, 11, 227–240. [Google Scholar] [CrossRef]
  34. Lalmi, A.; Boumali, B.; Fernandes, G.; Boudemagh, S.S. Identifying the most used traditional project management practices in construction industry. Procedia Comput. Sci. 2025, 256, 1756–1763. [Google Scholar] [CrossRef]
  35. Alvarenga, C.B.C.S.; De Aguilar, M.T.P.; Sales, R.D.B.C.; Caldas, R.B. Digital twins a digital transformation for management of the construction industry. Contrib. A Las Cienc. Soc. 2024, 17, e4250. [Google Scholar] [CrossRef]
  36. Feng, H.; Chen, Q.; de Soto, B.G. Application of Digital Twin Technologies in Construction: An Overview of Opportunities And Challenges. In Proceedings of the 38th International Symposium on Automation and Robotics in Construction (ISARC 2021), Dubai, United Arab Emirates, 2–4 November 2021. [Google Scholar] [CrossRef]
  37. Alnajjar, O.; Atencio, E.; Turmo, J. Framework for Optimizing the Construction Process: The Integration of Lean Construction, Building Information Modeling (BIM), and Emerging Technologies. Appl. Sci. 2025, 15, 7253. [Google Scholar] [CrossRef]
  38. Chacón, R.; Posada, H.; Ramonell, C.; Jungmann, M.; Hartmann, T.; Khan, R.; Tomar, R. Digital twinning of building construction processes. Case study: A reinforced concrete cast-in structure. J. Build. Eng. 2024, 84, 108522. [Google Scholar] [CrossRef]
  39. Torres, J.; San-Mateos, R.; Lasarte, N.; Mediavilla, A.; Sagarna, M.; León, I. Building Digital Twins to Overcome Digitalization Barriers for Automating Construction Site Management. Buildings 2024, 14, 2238. [Google Scholar] [CrossRef]
  40. Rao, A.S.; Radanovic, M.; Liu, Y.; Hu, S.; Fang, Y.; Khoshelham, K.; Palaniswami, M.; Ngo, T. Real-time monitoring of construction sites: Sensors, methods, and applications. Autom. Constr. 2022, 136, 104099. [Google Scholar] [CrossRef]
  41. Shen, K.; Ding, L.; Wang, C.C. Development of a Framework to Support Whole-Life-Cycle Net-Zero-Carbon Buildings through Integration of Building Information Modelling and Digital Twins. Buildings 2022, 12, 1747. [Google Scholar] [CrossRef]
  42. Alhyari, A.A. The Integration of Sustainability in Project Management and its Impact on UAE Construction Projects Performance. Master’s Thesis, The British University, Dubai, United Arab Emirates, 2017. [Google Scholar]
  43. Liu, F.; Ouyang, T.; Huang, B.; Zhao, J. Research on Green Building Design Optimization Based on Building Information Modeling and Improved Genetic Algorithm. Adv. Civ. Eng. 2024, 2024, 9786711. [Google Scholar] [CrossRef]
  44. Borodinecs, A.; Palcikovskis, A.; Krumins, A.; Lebedeva, K. Optimizing office building operations: A framework for continuous dynamic energy simulations in decision-making for efficiency. Front. Built Environ. 2024, 10, 1405182. [Google Scholar] [CrossRef]
  45. Rohith, P.; Prabakaran, P.; Bharath, A.; Vaardini, S. Predictive Maintenance for Construction Equipment using Artificial Intelligence and Machine Learning. Int. J. Adv. Res. Sci. Commun. Technol. 2023, 3, 531–537. [Google Scholar] [CrossRef]
  46. Araya, F. Integration of discrete event simulation with other modeling techniques to simulate construction engineering and management: An overview. Rev. Construcción 2022, 21, 338–353. [Google Scholar] [CrossRef]
  47. Lehner, D.; Zhang, J.; Pfeiffer, J.; Sint, S.; Splettstößer, A.K.; Wimmer, M.; Wortmann, A. Model-driven engineering for digital twins: A systematic mapping study. Softw. Syst. Model. 2025, 24, 103179. [Google Scholar] [CrossRef]
  48. Pan, Y.; Zhu, M.; Lv, Y.; Yang, Y.; Liang, Y.; Yin, R.; Yang, Y.; Jia, X.; Wang, X.; Zeng, F.; et al. Building energy simulation and its application for building performance optimization: A review of methods, tools, and case studies. Adv. Appl. Energy 2023, 10, 100135. [Google Scholar] [CrossRef]
  49. Masubuchi, Y.; Hiraki, T.; Hiroi, Y.; Ibara, M.; Matsutani, K.; Zaizen, M.; Morita, J. Development of Digital Twin Environment Through Integration of Commercial Metaverse Platform and IoT Sensors of Smart Building. In Proceedings of the 2025 IEEE Conference on Virtual Reality and 3D User Interfaces Abstracts and Workshops, VRW, Saint Malo, France, 8–12 March 2025. [Google Scholar] [CrossRef]
  50. Wang, H.; Yu, C.; Zheng, J.; Jia, Y.; Liu, Z.; Yang, K. Digital-Twin-Based Operation and Maintenance Management Method for Large Underground Spaces. Buildings 2024, 14, 2577. [Google Scholar] [CrossRef]
  51. Abdelalim, A.M.; Essawy, A.; Sherif, A.; Salem, M.; Al-Adwani, M.; Abdullah, M.S. Optimizing Facilities Management Through Artificial Intelligence and Digital Twin Technology in Mega-Facilities. Sustainability 2025, 17, 1826. [Google Scholar] [CrossRef]
  52. Yu, L.; Ge, Q.; Han, K.; Ji, W.; Liu, Y. Designing optimal subsidy schemes and recycling plans for sustainable treatment of construction and demolition waste. arXiv 2025, arXiv:2504.10955. [Google Scholar] [CrossRef]
  53. Meng, X.; Das, S.; Meng, J. Integration of Digital Twin and Circular Economy in the Construction Industry. Sustainability 2023, 15, 13186. [Google Scholar] [CrossRef]
  54. Mügge, J.; Seegrün, A.; Hoyer, T.K.; Riedelsheimer, T.; Lindow, K. Digital Twins within the Circular Economy: Literature Review and Concept Presentation. Sustainability 2024, 16, 2748. [Google Scholar] [CrossRef]
  55. Moon, H.; Mirmotalebi, S.; Jang, Y.; Ahn, Y.; Kwon, N. Risk Evaluation of Radioactive Concrete Structure Decommissioning in Nuclear Power Plants Using Fuzzy-AHP. Buildings 2024, 14, 1536. [Google Scholar] [CrossRef]
  56. Boje, C.; Hahn Menacho, Á.J.; Marvuglia, A.; Benetto, E.; Kubicki, S.; Schaubroeck, T.; Navarrete Gutiérrez, T. A framework using BIM and digital twins in facilitating LCSA for buildings. J. Build. Eng. 2023, 76, 107232. [Google Scholar] [CrossRef]
  57. Petri, I.; Amin, A.; Ghoroghi, A.; Hodorog, A.; Rezgui, Y. Digital twins for dynamic life cycle assessment in the built environment. Sci. Total Environ. 2025, 993, 179930. [Google Scholar] [CrossRef] [PubMed]
  58. Jänicke, M. Ecological modernization—A paradise of feasibility but no general solution. In The Ecological Modernization Capacity of Japan and Germany: Comparing Nuclear Energy, Renewables, Automobility and Rare Earth Policy; Springer: Berlin/Heidelberg, Germany, 2020; pp. 13–23. [Google Scholar] [CrossRef]
  59. Buttel, F.H. Ecological Modernization as Social Theory; Pergamon: New York, NY, USA, 1999. [Google Scholar]
  60. Guo, X.; Yang, K. Summary of Theories on Ecological Modernization. Teach. Res. 2006, 2006, 46–52. [Google Scholar]
  61. Kor, M.; Yitmen, I.; Alizadehsalehi, S. An investigation for integration of deep learning and digital twins towards Construction 4.0. Smart Sustain. Built Environ. 2022, 12, 461–487. [Google Scholar] [CrossRef]
  62. Hakimi, O.; Liu, H.; Abudayyeh, O. Digital twin-enabled smart facility management: A bibliometric review. Front. Eng. Manag. 2024, 11, 32–49. [Google Scholar] [CrossRef]
  63. Xu, Y.; Zhang, J.; Qin, H.; Zhou, H.; Yang, Z. Digital twin-enabled hybrid deep evolutionary framework for smart building sustainable infrastructure management. Sustain. Energy Technol. Assess. 2024, 65, 103773. [Google Scholar] [CrossRef]
  64. Nguyen, T.D.H.N.; Ly, D.H.; Jang, H.; Dinh, H.N.N.; Ahn, Y. Digital twin framework to enhance facility management for relocatable modular buildings. Autom. Constr. 2025, 176, 106249. [Google Scholar] [CrossRef]
  65. Bhambri, P.; Rani, S.; Khang, A.; Soni, R. AI-Driven Digital Twin and Resource Optimization in Industry 4.0 Ecosystem. In AI-Driven Digital Twin and Industry 4.0; CRC Press: Boca Raton, FL, USA, 2024; pp. 182–201. [Google Scholar] [CrossRef]
  66. Mehdi, A.; Singh, M. From Blueprint to Build: The Symbiotic Relationship of Digital Twins and Physical Construction. In Proceedings of the 2024 3rd International Conference on Sentiment Analysis and Deep Learning (ICSADL), Bhimdatta, Nepal, 13–14 March 2024. [Google Scholar] [CrossRef]
  67. Piras, G.; Muzi, F.; Tiburcio, V.A. Digital Management Methodology for Building Production Optimization through Digital Twin and Artificial Intelligence Integration. Buildings 2024, 14, 2110. [Google Scholar] [CrossRef]
  68. Leguina, A. A Primer on Partial Least Squares Structural Equation Modeling (PLS-SEM); Taylor & Francis: New York, NY, USA, 2015. [Google Scholar]
  69. Dillman, D.A.; Smyth, J.D.; Christian, L.M. Internet, Phone, Mail, and Mixed-Mode Surveys: The Tailored Design Method; John Wiley & Sons, Inc.: Hoboken, NJ, USA, 2014; p. 17. [Google Scholar] [CrossRef]
  70. Gordon Wolf, M.; Nylund-Gibson, K.; Dowdy, E.; Furlong, M. An Analytic Approach for Deciding between 4-and 6-Point Likert-Type Response Options. In Grantee Submiss; 2019. Available online: https://eric.ed.gov/?id=ED591440 (accessed on 8 December 2024).
  71. Mazuruse, G.; Nyagadza, B. Barriers to adopting climate change awareness and education in Zimbabwe: A hybrid structural equation modelling and extreme gradient boosting approach. Qual. Quant. 2025, 1–30. [Google Scholar] [CrossRef]
  72. Akosua, A.S.; Yang, X.; Clement, M.; Zalia, A.-H.; Fathia, B.V. City Logistics Measures and Environmental Sustainability: An Evidence from Ghana. Am. J. Ind. Bus. Manag. 2021, 11, 582–597. [Google Scholar] [CrossRef]
  73. Hair, J.F.; Ringle, C.M.; Sarstedt, M. PLS-SEM: Indeed a silver bullet. J. Mark. Theory Pract. 2011, 19, 139–152. [Google Scholar] [CrossRef]
  74. Chen, T.; Guestrin, C. XGBoost: A Scalable Tree Boosting System. In Proceedings of the 22nd ACM SIGKDD International Conference on Knowledge Discovery and Data Mining, San Francisco, CA, USA, 13–17 August 2016; ACM: New York, NY, USA, 2016; pp. 785–794. [Google Scholar] [CrossRef]
  75. Xu, C.; Xiong, W.; Zhang, S.; Shi, H.; Wu, S.; Bao, S.; Xiao, T. Research on the Nonlinear Relationship Between Carbon Emissions from Residential Land and the Built Environment: A Case Study of Susong County, Anhui Province Using the XGBoost-SHAP Model. Land 2025, 14, 440. [Google Scholar] [CrossRef]
  76. Hou, Y.; Liu, S. Predictive modeling and validation of carbon emissions from China’s Coastal construction industry: A BO-XGBoost ensemble approach. Sustainability 2024, 16, 4215. [Google Scholar] [CrossRef]
  77. Gu, M.; Kang, S.; Xu, Z.; Lin, L.; Zhang, Z. AE-XGBoost: A Novel Approach for Machine Tool Machining Size Prediction Combining XGBoost, AE and SHAP. Mathematics 2025, 13, 835. [Google Scholar] [CrossRef]
  78. Yi, F.; Yang, H.; Chen, D.; Qin, Y.; Han, H.; Cui, J.; Bai, W.; Ma, Y.; Zhang, R.; Yu, H. XGBoost-SHAP-based interpretable diagnostic framework for alzheimer’s disease. BMC Med. Inform. Decis. Mak. 2023, 23, 137. [Google Scholar] [CrossRef]
  79. Ozili, P.K. The acceptable R-square in empirical modelling for social science research. In Social Research Methodology and Publishing Results: A Guide to Non-Native English Speakers; IGI Global: Hershey, PA, USA, 2023; pp. 134–143. [Google Scholar] [CrossRef]
  80. Rashidian, S.; Hossain, S.K.T.; Volz, K.; Teo, M. Enabling circularity in construction: A technology-phase alignment of construction 4.0 and circular economy principles. Sustain. Prod. Consum. 2025, 60, 245–259. [Google Scholar] [CrossRef]
  81. Wang, K.; Guo, M.; Di Sarno, L.; Sun, Y. Decoding BIM Adoption: A Meta-Analysis of 10 Years of Research-Exploring the Influence of Sample Size, Economic Level, and National Culture. Buildings 2024, 14, 920. [Google Scholar] [CrossRef]
  82. Torres-García, F.C.; Ramírez-Luján, S.L. Logistics Outsourcing as a Strategy for Business Efficiency: Mediating Role of ICT. In Proceedings of the 25th European Conference on Knowledge Management (2 Vols), Lima, Peru, 4–5 September 2025. [Google Scholar] [CrossRef]
  83. Zhiyuan, L.; Dawei, Z. Crowded Private Enterprises: General Equilibrium Efficiency of Private Enterprises. J. Financ. Econ. 2019, 45, 99–110. [Google Scholar]
  84. Davinack, A. The promise of quantum computing for population genetics and molecular ecology. Front. Quantum Sci. Technol. 2025, 4, 1657832. [Google Scholar] [CrossRef]
  85. Zeng, J.; Ren, J.; Ning, Z. Mediating effect of corporate social responsibility-based entrepreneurship on environmental improvement: Evidence from 475 heavy-polluting enterprises. J. Bus. Res. 2022, 149, 506–517. [Google Scholar] [CrossRef]
  86. Ba, L.; Tangour, F.; El Abbassi, I.; Absi, R. Analysis of Digital Twin Applications in Energy Efficiency: A Systematic Review. Sustainability 2025, 17, 3560. [Google Scholar] [CrossRef]
  87. Ali, Z.A.; Zain, M.; Hasan, R.; Pathan, M.S.; AlSalman, H.; Almisned, F.A. Digital twins: Cornerstone to circular economy and sustainability goals. In Environment Development and Sustainability; Springer: Berlin/Heidelberg, Germany, 2025. [Google Scholar] [CrossRef]
  88. Nagle, A.J.; Mullally, G.; Leahy, P.G.; Dunphy, N.P. Life cycle assessment of the use of decommissioned wind blades in second life applications. J. Environ. Manag. 2022, 302, 113994. [Google Scholar] [CrossRef]
  89. Yang, Z.; Tang, C.; Zhang, T.; Zhang, Z.; Doan, D.T. Digital Twins in Construction: Architecture, Applications, Trends and Challenges. Buildings 2024, 14, 2616. [Google Scholar] [CrossRef]
  90. Zadorozhnyi, Z.M.; Desyatnyuk, O.; Muravskyi, V.; Shevchuk, O. Combination of Digital Twin Technology and FinOps in Management Accounting Modeling. In Proceedings of the 2023 13th International Conference on Advanced Computer Information Technologies (ACIT), Wrocław, Poland, 21–23 September 2023. [Google Scholar] [CrossRef]
  91. Zhang, H.; Zhai, X.; Liu, Y.; Xia, Z.; Xia, T.; Du, G.; Zhou, H.; Franziska Strohmer, D.; Bazhin, A.V.; Li, Z.; et al. A Combined Digital Twin and Location-Based Management System. Research 2023, 6, 0184. [Google Scholar] [CrossRef]
  92. Zhang, Y.; Wang, W.; Yang, Q.; Tang, X.; Ruan, W.; Li, Y.; Daoerji, S.; Zhang, X.; Ye, Y.; Huang, J.; et al. Promoting digital twin technology application for process industry: A novel generation modelling platform and its implementations. Digit. Twins Appl. 2024, 1, 51–74. [Google Scholar] [CrossRef]
  93. Rodionov, N.; Tatarnikova, L. Digital twin technology as a modern approach to quality management. E3S Web Conf. 2021, 284, 04013. [Google Scholar] [CrossRef]
  94. Levina, A.; Kalyazina, S.; Levaniuk, D.; Zaitsev, A. Application of Digital Twins for Digital Transformation of Oil and Gas Enterprises. In International Scientific Conference Digital Technologies in Logistics and Infrastructure; Springer: Cham, Switzerland, 2021. [Google Scholar]
  95. Kelvin Edem, B.; Jesse, O.B.; Bernard Owusu, A.; Afari, N. Economic impact of digital twins on renewable energy investments. Eng. Sci. Technol. J. 2024, 5, 2232–2247. [Google Scholar] [CrossRef]
  96. Koscheyev, V.; Rapgof, V.; Vinogradova, V. Digital transformation of construction organizations. IOP Conf. Ser. Mater. Sci. Eng. 2019, 498, 012010. [Google Scholar] [CrossRef]
  97. Kshetri, N. The Economics of Digital Twins. Computer 2021, 54, 86–90. [Google Scholar] [CrossRef]
  98. Mohamad Zaidi, N.H.; Lim, C.H.; Razali, H. Mitigating the Energy Consumption and Carbon Emissions of a Residential Area in a Tropical City Using Digital Twin Technology: A Case Study of Bertam, Penang. Buildings 2024, 14, 638. [Google Scholar] [CrossRef]
  99. Mousavi, Y.; Gharineiat, Z.; Karimi, A.A.; McDougall, K.; Rossi, A.; Gonizzi Barsanti, S. Digital Twin Technology in Built Environment: A Review of Applications, Capabilities and Challenges. Smart Cities 2024, 7, 2594–2615. [Google Scholar] [CrossRef]
  100. Eslahi, M.; Farazdaghi, E.; Meouche, R.E. Towards Digital Twins in Sustainable Construction: Feasibility and Challenges. In Proceedings of the International Conference on Smart City Applications, Setubal, Portugal, 3–5 May 2019; Springer: Berlin/Heidelberg, Germany, 2023. [Google Scholar] [CrossRef]
Figure 1. Digital twin conceptual framework.
Buildings 16 00467 g001
Figure 2. Sample collection flowchart.
Buildings 16 00467 g002
Figure 3. Research flow of this study.
Buildings 16 00467 g003
Figure 4. SmartPLS model.
Buildings 16 00467 g004
Figure 5. Comprehensive ES moderation effect on EI, EO, and CC.
Buildings 16 00467 g005
Figure 6. Thermal analysis diagram.
Buildings 16 00467 g006
Figure 7. ES moderation effect analysis: IV impact on DV under ES moderation.
Buildings 16 00467 g007
Table 1. Generic success factors.
Explain the Impact on the CISourcesPerformance Dimensions (EI, EO, CC)
RMImprove the efficiency of utilizing people, materials, machines, and funds; avoid waste and conflicts; reduce costs; and ensure smooth construction schedule.[34,35,36]EI: RM optimizes resource allocation, increases productivity, and accelerates project delivery.
EO: RM precisely controls equipment and the supply chain, reduces energy consumption, and supports green construction.
CC: RM eliminates waste, utilizes resources efficiently, and achieves comprehensive budget control.
POBy improving the construction process, we can reduce waiting and repetitive work, shorten the construction period, and improve overall productivity.[31,37,38,39]EI: PO simplifies processes and eliminates bottlenecks, significantly improving project efficiency.
EO: PO optimizes planning and layout, reduces equipment idling, and lowers energy consumption.
CC: PO reduces waste and errors, directly controls operating expenses, and achieves cost savings.
R-TmAbility to promptly identify safety, quality, or schedule issues and make quick adjustments to reduce accidents and delays.[26,40,41]EI: R-Tm provides real-time feedback, quickly correcting deviations and improving on-site efficiency.
EO: R-Tm monitors energy consumption, promptly identifies waste, and optimizes energy usage.
CC: R-Tm provides risk warnings, reduces rework and downtime, and controls project losses.
SDReduce energy consumption and carbon emissions during the design phase, promote green buildings, and enhance the long-term value and environmental image of buildings.[17,26,42,43,44]EI: SD optimizes the structure, reduces materials and processes, and improves construction speed.
EO: SD enhances the building envelope and integrates high-efficiency systems, significantly reducing life-cycle energy consumption.
CC: SD has higher initial investment costs, but achieves long-term cost savings by reducing operating energy and maintenance expenses.
PMDiscover equipment hidden dangers in advance, reduce sudden shutdowns, reduce maintenance costs, and extend equipment service life.[26,41,45]EI: PM predicts failures, enables proactive maintenance, eliminates downtime, and ensures efficiency.
EO: PM maintains equipment in optimal condition, prevents performance degradation, and preserves energy efficiency.
CC: PM shifts from reactive to proactive maintenance, reduces emergency repairs, extends equipment lifespan, and controls significant losses.
System ModelingPredict risks and bottlenecks, optimize decision-making, and improve scientific management.[46,47]EI: System modeling simulation testing resolves design conflicts, optimizes construction sequences, and improves efficiency.
EO: System modeling evaluates energy consumption performance, guides the selection of efficient systems, and minimizes energy consumption.
CC: System modeling provides accurate budgeting, reduces design changes and on-site errors, and controls costs.
Environmental simulationEstimate factors such as lighting, ventilation, and noise during the design and construction phases to improve comfort and reduce the cost of later modifications.[48,49]EI: Environmental simulation optimizes design, reduces on-site disruptions, and improves construction efficiency.
EO: Environmental simulation accurately predicts demand, guides high-performance system integration, and minimizes life-cycle energy consumption.
CC: Environmental simulation identifies risks early, reduces long-term operating and maintenance costs, and controls overall costs.
Facility OptimizationImprove the layout rationality and utilization efficiency of construction sites and building facilities and reduce operating and construction costs.[50,51]EI: Facility optimization optimizes layout and routes, reducing movement and improving operational efficiency.
EO: Intelligent control significantly reduces operating energy consumption.
CC: Facility optimization increases asset utilization, reduces maintenance and energy costs, and delivers long-term savings.
Recycling PlanningPromote waste recycling, reduce environmental pollution, comply with green building and regulatory requirements, and save resources.[52,53,54]EI: Recycling planning standardizes on-site sorting, simplifies waste logistics, and improves operational efficiency.
EO: Recycling planning maximizes material recycling, reduces the extraction and processing of new materials, and lowers embodied energy consumption.
CC: Recycling planning reduces disposal costs, sells recycled materials, and achieves net cost savings.
Decommissioning AssessmentEnsure safety and compliance during building decommissioning, maximize material recovery value, and reduce environmental and safety risks associated with demolition.[55,56,57]EI: Decommissioning assessment involves advance planning and streamlined processes to improve demolition efficiency.
EO: Decommissioning assessment identifies high-value materials, reduces transportation and landfill waste, and lowers energy consumption.
CC: Decommissioning assessment utilizes accurate budgeting and material recycling to offset costs and effectively control decommissioning expenses.
Table 2. Hypothesis table.
No.HypothesisCitation
Evaluating the Influence of RM on EI, EO, and CC
H1ES moderates the relationship between RM and EI, making RM’s effect on EI positive when ES is sufficient.[65]
H2ES moderates the relationship between RM and EO, making RM’s effect on EO positive when ES is sufficient.[35]
H3ES moderates the relationship between RM and CC, making RM’s effect on CC positive when ES is sufficient.[17]
Evaluating the Influence of PO on EI, EO, and CC
H4ES moderates the relationship between PO and EI, making PO’s effect on EI positive when ES is sufficient.[37]
H5ES moderates the relationship between PO and EO, making PO’s effect on EO positive when ES is sufficient.[31]
H6ES moderates the relationship between PO and CC, making PO’s effect on CC positive when ES is sufficient.[1]
Evaluating the Influence of R-Tm on EI, EO, and CC
H7ES moderates the relationship between R-Tm and EI, making R-Tm’s effect on EI positive when ES is sufficient.[66]
H8ES moderates the relationship between R-Tm and EO, making R-Tm’s effect on EO positive when ES is sufficient.[17]
H9ES moderates the relationship between R-Tm and CC, making R-Tm’s effect on CC positive when ES is sufficient.[1]
Evaluating the Influence of SD on EI, EO, and CC
H10ES moderates the relationship between SD and EI, making SD’s effect on EI positive when ES is sufficient.[43]
H11ES moderates the relationship between SD and EO, making SD’s effect on EO positive when ES is sufficient.[17]
H12ES moderates the relationship between SD and CC, making SD’s effect on CC positive when ES is sufficient.[44]
Evaluating the Influence of PM on EI, EO, and CC
H13ES moderates the relationship between PM and EI, making PM’s effect on EI positive when ES is sufficient.[67]
H14ES moderates the relationship between PM and EO, making PM’s effect on EO positive when ES is sufficient.[17]
H15ES moderates the relationship between PM and CC, making PM’s effect on CC positive when ES is sufficient.[26]
Table 3. Measurement model assessment.
ConstructCACRAVE
RM0.9040.9320.775
PO0.9100.9370.787
R-Tm0.9230.9420.764
SD0.9040.9330.776
PM0.9260.9440.772
ES0.9040.9260.714
EI0.9190.9390.756
EO0.9090.9320.732
CC0.8930.9260.757
Table 4. HTMT ratio.
CCEIEOESPMPOR-TmRMSD
CC
EI0.599
EO0.5890.644
ES0.0450.0440.057
PM0.3560.3230.3570.043
PO0.2960.3230.3320.0480.224
R-Tm0.3780.3170.3780.0250.2340.279
RM0.3170.3330.4090.0510.2260.2660.207
SD0.3680.3160.3530.0380.2690.2440.2530.251
Table 5. Fornell–Larcker criterion.
CCEIEOESPMPOR-TmRMSD
CC0.870
EI0.5440.869
EO0.5300.5880.856
ES0.015−0.039−0.0550.845
PM0.3280.3010.3350.0080.879
PO0.2690.2970.302−0.0480.2060.887
R-Tm0.3440.2920.348−0.0110.2190.2560.874
RM0.2860.3050.374−0.0440.2080.2420.1900.881
SD0.3310.2890.321−0.0350.2480.2220.2290.2280.881
Table 6. Structural model results and hypothesis.
HypothesisRelationshipBeta βT-Valuep-ValuesResult
1RM*ES→EI0.0982.3390.019Supported
2RM*ES→EO0.0872.0860.037Supported
3RM*ES→CC0.0831.8550.064Unsupported
4PO*ES→EI0.0541.1780.239Unsupported
5PO*ES→EO0.173.8250.001Supported
6PO*ES→CC0.1112.3180.02Supported
7R-Tm*ES→EI0.1082.4580.014Supported
8R-Tm*ES→EO0.0410.970.332Unsupported
9R-Tm*ES→CC0.0491.2350.217Unsupported
10SD*ES→EI0.1773.7050.001Supported
11SD*ES→EO0.1383.4660.001Supported
12SD*ES→CC0.1242.9420.003Supported
13PM*ES→EI0.0942.2050.028Supported
14PM*ES→EO0.0792.1730.03Supported
15PM*ES→CC0.1112.3180.02Supported
Green data shows significant results, supporting the hypothesis; red data shows insignificant results, not supporting the hypothesis.
Table 7. ES moderation effect analysis table.
DVIVMain EffectES Moderation Effect
EIRM0.3030.212
EIPO0.2960.171
EIR-Tm0.3090.231
EISD0.2860.273
EIPM0.3150.243
EORM0.3690.199
EOPO0.3010.265
EOR-Tm0.3590.174
EOSD0.3180.230
EOPM0.3430.210
CCRM0.2850.191
CCPO0.2700.204
CCR-Tm0.3560.164
CCSD0.3310.212
CCPM0.3390.213
Table 8. Cross-method comparison of results.
EIEOCC
RM*ESp-values0.0190.0370.064
Interaction effect0.2120.1990.191
PO*ESp-values0.2390.0010.020
Interaction effect0.1710.2650.204
R-Tm*ESp-values0.0140.3320.217
Interaction effect0.2310.1740.148
SD*ESp-values0.0010.0010.003
Interaction effect0.2730.2300.154
PM*ESp-values0.0280.0300.020
Interaction effect0.2430.2100.155
Disclaimer/Publisher’s Note: The statements, opinions and data contained in all publications are solely those of the individual author(s) and contributor(s) and not of MDPI and/or the editor(s). MDPI and/or the editor(s) disclaim responsibility for any injury to people or property resulting from any ideas, methods, instructions or products referred to in the content.