1. Introduction
Safety monitoring [
1,
2] serves as the eyes and ears for safeguarding hydraulic structures. Deploying comprehensive and advanced safety monitoring systems, promptly installing monitoring facilities, and conducting timely analysis and feedback of monitoring results provides crucial support for understanding operational conditions during both construction and operational phases, ensuring construction and operational safety, and enabling scientific decision-making and scheduling. Safety monitoring plays a pivotal role in the safe management of hydropower projects throughout their construction and operational lifecycles. According to the relevant provisions of the “Code for Design of Slopes of Hydropower and Water Conservancy Projects” (DL/T5353-2006) [
3], the slopes at the dam shoulders, entrances and exits of spillway tunnels, and entrances and exits of power station structures are all classified as Grade I slopes. Among these, the dam shoulder slopes bear the loads of the arch dam during both construction and operation, and their deformation stability directly impacts the safety of the dam [
4,
5,
6].
Hydraulic pressure, seepage, and water–rock interaction [
7] are the primary factors causing deformation. Tan Yaosheng et al. [
8] analyzed monitoring data of the Baihetan Dam shoulder slope during construction and found that the sustained deformation of the natural slope above the left bank cut line is primarily controlled by the interlayered composition of sandstone and slate, the rock structure, and the shallow unloading and remodeling effects. The impact of impoundment is mainly reflected in the “upward accumulation” effect of deformation adjustment in the lower slope after impoundment. Yang Qiang et al. [
9] analyzed the impact of slope and foundation deformation during impoundment using a finite element method that simultaneously accounts for stiffness and strength reduction, based on monitoring data of displacement and valley-width contraction on the left bank slope of Jinping I Arch Dam. He Zhu et al. [
10] predicted the post-impoundment deformation and stability of the dam body by initially inverting mechanical rock creep parameters. Jin Xinxin et al. [
11] evaluated the operational behavior of Wudongde Hydropower Station during the initial impoundment phase. Results indicate that compared with similar high-arch dams, the Wudongde arch dam exhibits less overall deformation. He Ruxu et al. [
12] analyzed the mechanism behind the persistent deformation phenomenon in the left bank slope of Jinping Stage I Hydropower Station using a comprehensive monitoring approach combining surface and deep deformation monitoring. They summarized the mechanism as “upper continuous overturning—deep cracking—surface locking body relaxation—lower coordination with the dam body”. Zeng Zhen et al. [
13] similarly employed slope displacement and anchor cable stress monitoring to validate the effectiveness of arch shoulder slope reinforcement at Luozhahe Stage II Hydropower Station. Liu Qian et al. [
14] assessed the operational behavior of dams by monitoring actual deformation (horizontal displacement, vertical displacement, and joint opening/closing), seepage/seepage pressure, and stress–strain on both banks and landslide bodies. While safety monitoring can be used to analyze the performance of high-arch dams during construction and operation, it cannot predict their long-term stability or that of their engineering slopes [
15]. Numerous researchers [
16,
17,
18] have introduced further numerical calculation methods to respond to the limitations of field monitoring techniques. Ma, K. et al. [
19] combined microseismic monitoring with finite element numerical simulation to investigate the operational behavior of high-arch dams, using numerical methods to evaluate reservoir safety during different impoundment stages. Li Bo et al. [
20] calculated the self-induced volumetric deformation and stress state of concrete used in dams based on stress–strain monitoring data. Hu Lei et al. [
21] analyzed abnormal deformation in a concrete arch dam, concluding that a monitoring model incorporating pre-set aging factors that account for valley shrinkage effects is more reasonable. In summary, analyzing the performance of hydraulic structures and associated engineering slopes necessitates the application of new technologies such as model testing [
22,
23], collection of safety monitoring data, and big data analysis [
24]. The results of such work provide significant guidance for the impoundment and long-term operation of dams [
25].
The Wudongde Hydropower Station dam site features a narrow, transversal valley with steep banks and a deeply incised V-shaped profile. With a maximum dam height of 270 m, it is classified as an ultra-high-arch dam. In this paper, we describe our analysis of displacement data from the left and right abutment slopes, alongside monitoring data on anchor bolt stresses and anchor cable anchorage forces. By examining trend patterns and deformation mechanisms, we evaluate the behavior of the dam shoulder slopes during the impoundment phase of Wudongde Hydropower Station. The objective is to explore the characteristics of ultra-high-arch dams, anchor bolt stresses, and anchor cables’ anchorage forces based on the left and right abutment slopes of Wudongde Hydropower Station. We analyze the variation trends and deformation mechanisms of the abutment slopes and subsequently evaluate their behavior during the reservoir impoundment phase. This study aims to explore how multi-source monitoring data can be used to identify early signs of instability and validate the effectiveness of support systems for ultra-high-arch dams under the coupled effects of steep slopes and deep reservoir impoundment.
2. Overview of Engineering Geology
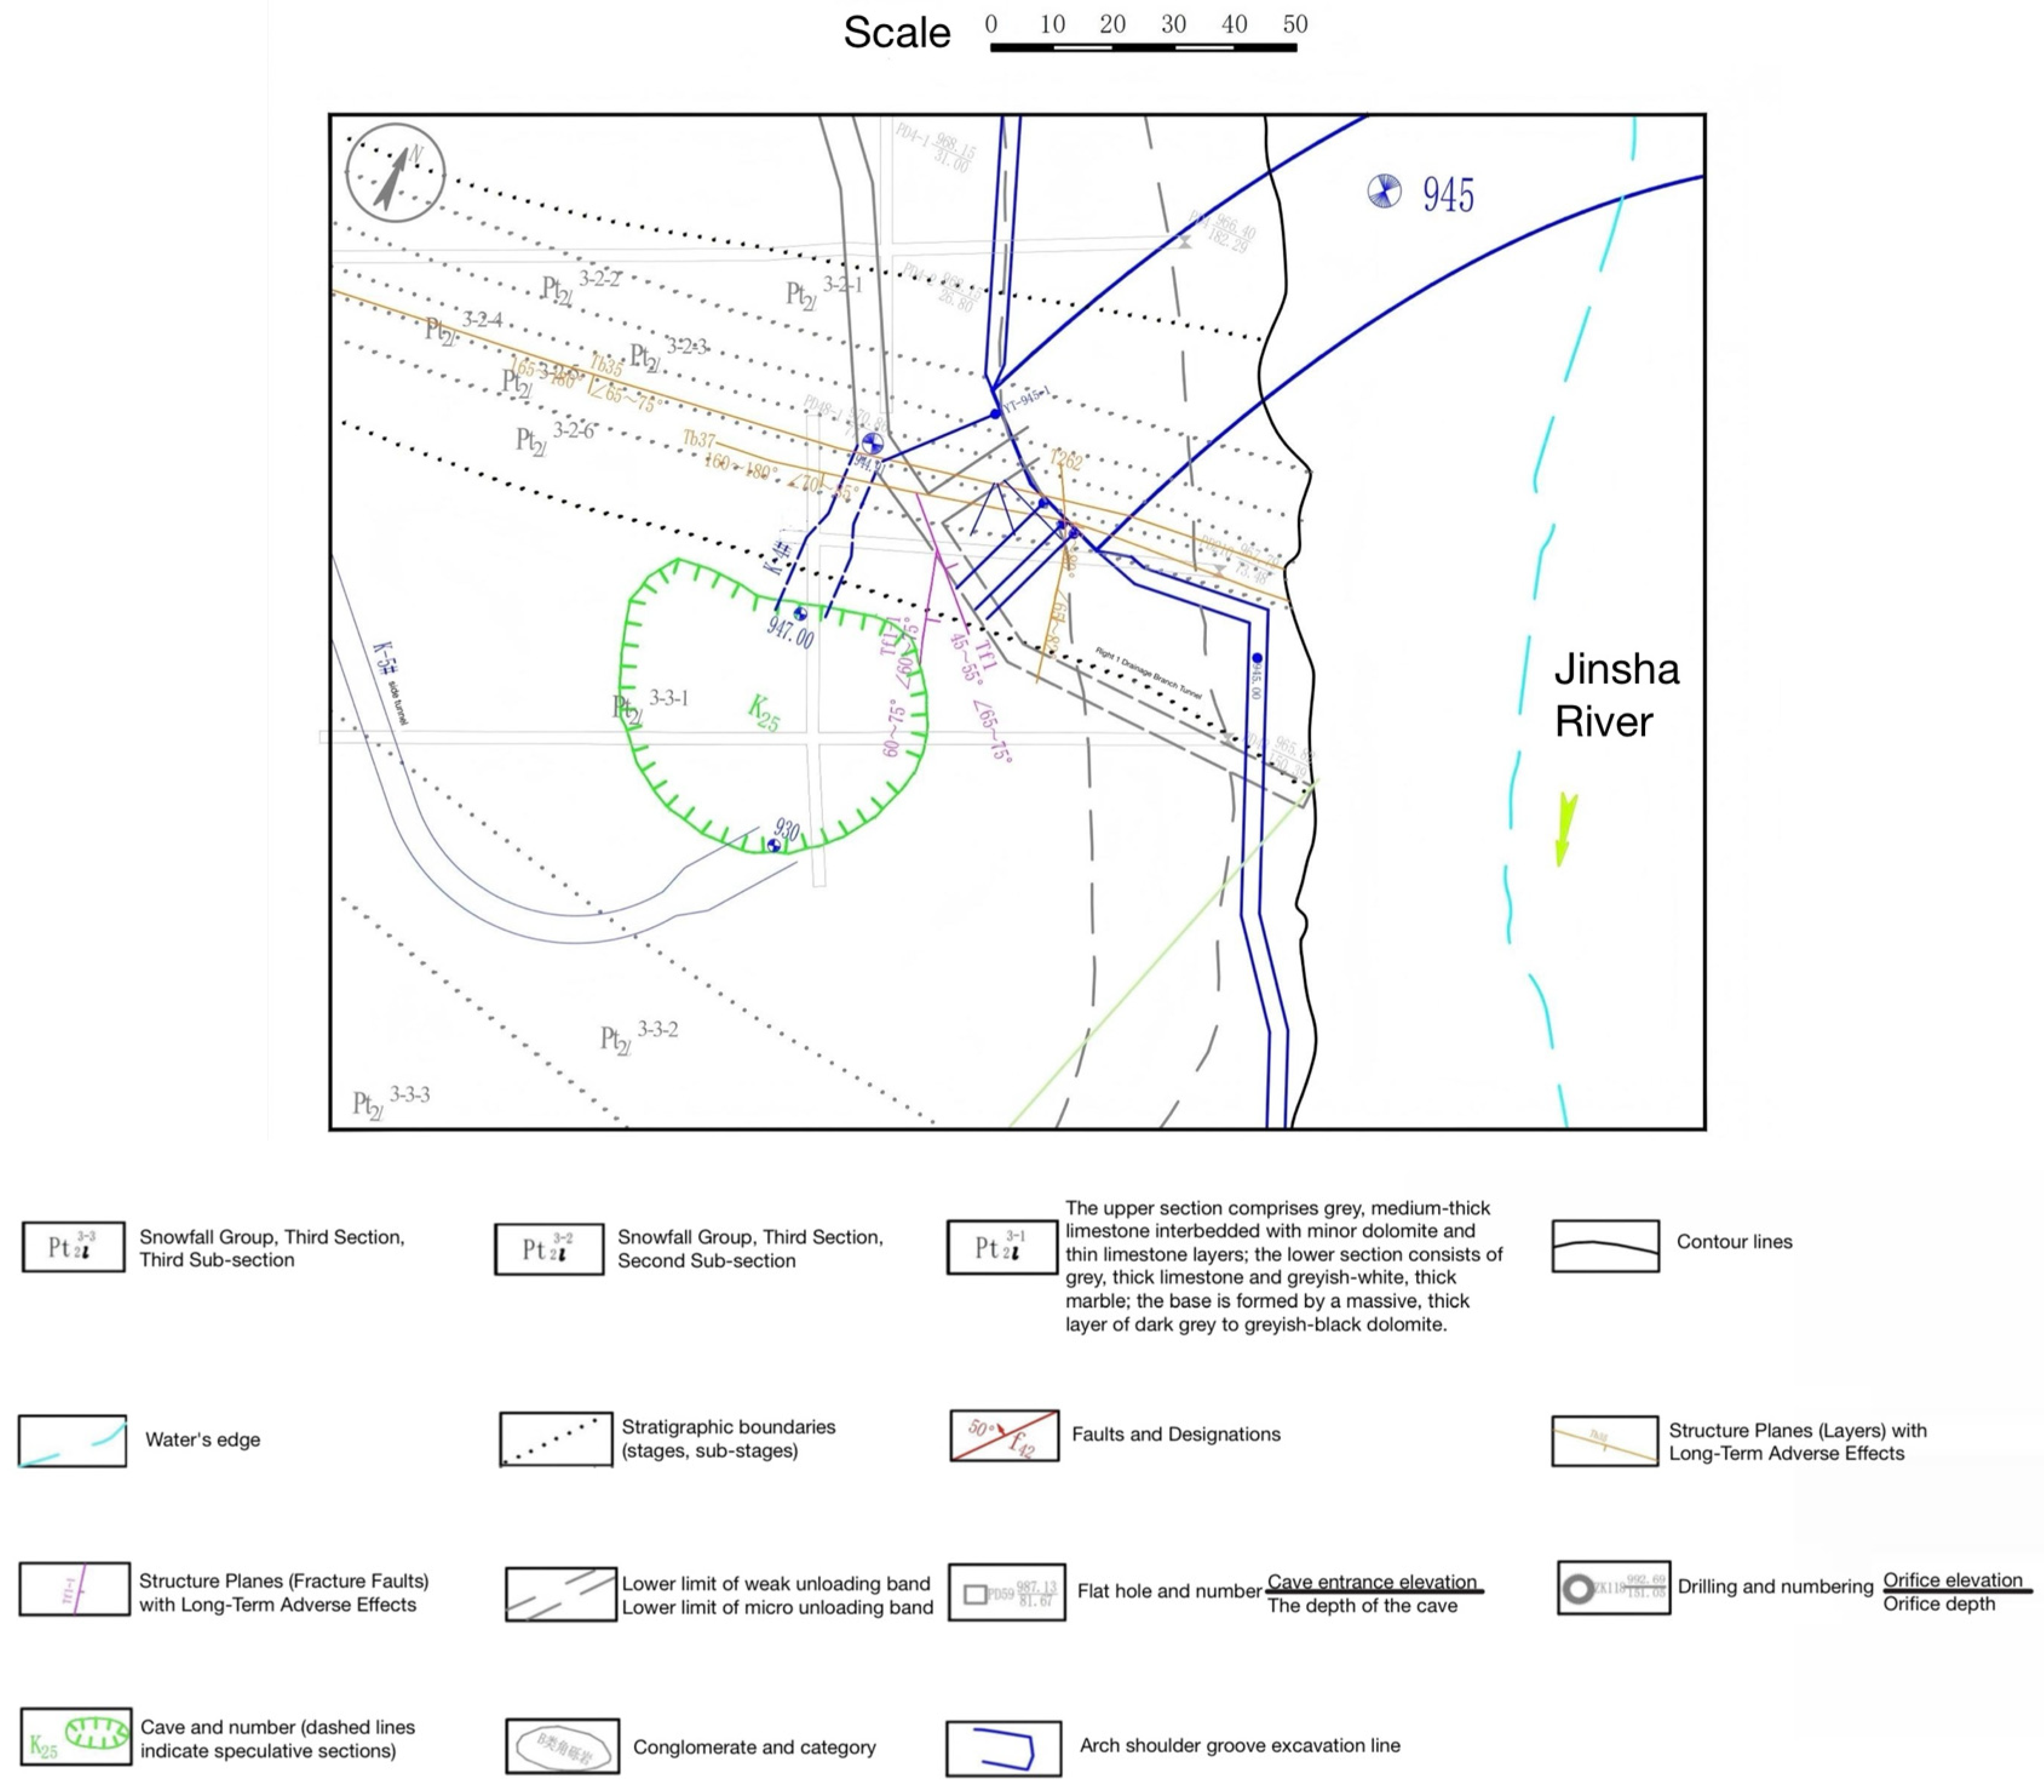
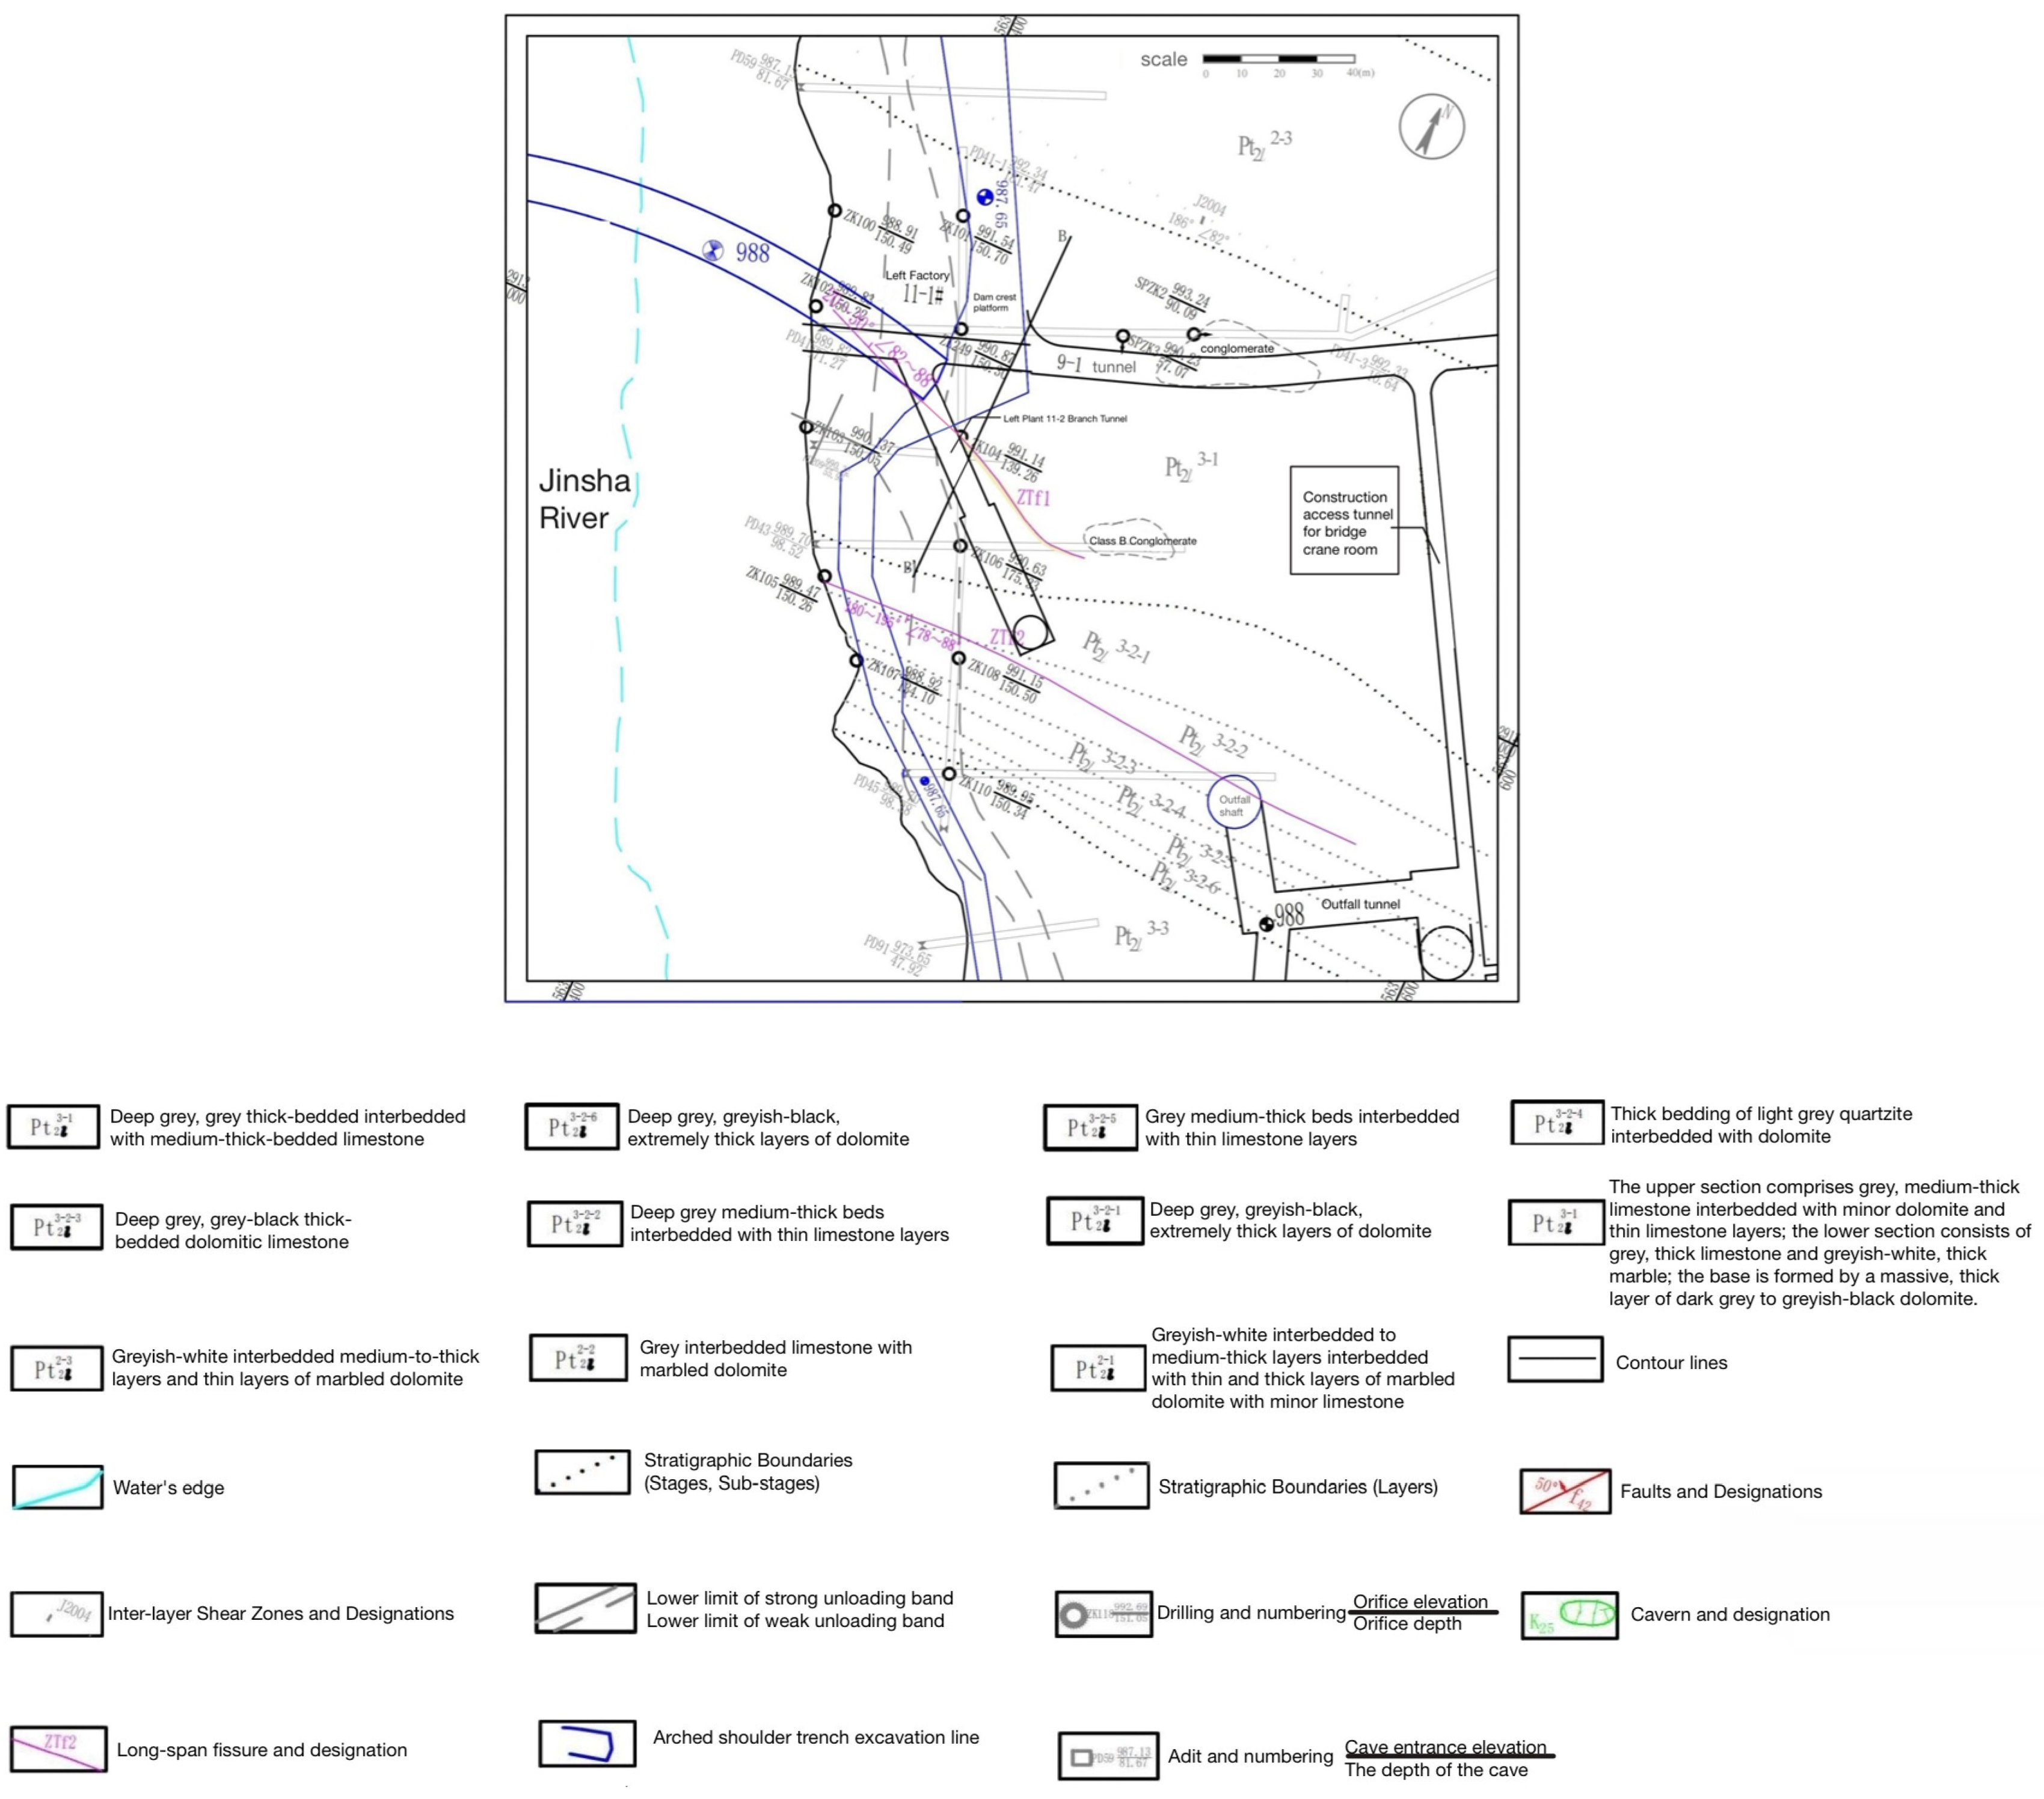
The dam site of Wudongde Hydropower Station is situated within the Sichuan–Yunnan rhombic block. The regional crustal stability zoning places it within the Huidong–Lupquan sub-block (I32-13) of the Panzhihua block (I32), which is classified as an area of relatively poor (to relatively better) stability. High slope stability represents one of the primary engineering geological challenges at the dam site. Engineering geological maps of the left and right bank slopes are presented in
Figure 1 and
Figure 2.
The gorge slopes on both sides of the dam site are steep, with the left bank rising 1036 m and the right bank 830 m above the riverbed elevation. A plateau (or gentle terrace) with an elevation of 1150 to 1200 m, situated slightly below the midpoint of the slopes, broadly divides the slopes into two sections. Below this level lies a steep slope with angles ranging from 60° to 75°, primarily composed of near-horizontal valleys formed by Luoxue Group limestone and marble, exhibiting hard rock properties. Above this level, the slopes generally become gentler: the left bank features an overall angle of 30° to 35°, comprising reverse slopes formed by hard rocks from the Sinian and Permian systems, while the right bank has an overall angle of 35° to 45°. The upper section of the right bank exhibits a parallel slope, although the strata exhibit gentle dip angles and limited thickness and are distant from the river valley. Faults are poorly developed, with their strike directions often intersecting the slope strike at significant angles. The slope rock mass predominantly consists of Neogene formations, exhibiting a limited unloading depth. Within the strongly unloaded zone, rock mass unloading fractures only open to a width of approximately 1 cm, displaying poor extensibility. Consequently, the stress levels within the bank slopes are not elevated. The slope of the left bank abutment channel can be divided into four sections along its strike: the upstream transverse slope, the upstream lateral slope, the frontal slope, and the downstream slope. The engineering slope rock mass is hard; faults and joints are generally poorly developed, being mostly short and minor. The inter-bed shear zone J2004 traverses the upstream transverse slope. The rock mass predominantly exhibits micro-to-neogene characteristics, primarily consisting of non-unloaded or weakly unloaded rock, with locally strongly unloaded rock being present at the top or outer flank. The rock mass quality is mainly Grade II1 to III1, with a small amount of Grade III2. The engineering slope presents no overall stability issues, but primary localized stability concerns include the stability of small blocks formed by the interlocking of bedding planes, minor local faults, joints, J2004, and localized overturning displacement on the downstream reverse slope.
The engineering slope of the shoulder trench on the right bank can be divided into four sections based on strike: the upstream transverse river slope, the upstream lateral slope, the frontal slope, and the downstream slope. The engineering slope’s rock mass is hard, while faults and joints are generally poorly developed, predominantly short, and minor. The f42 fault intersects with the upstream lateral slope at a small angle, inclined towards the slope. The rock mass is predominantly sub-fresh, consisting mainly of non-unloaded and weakly unloaded rock, with locally strongly unloaded rock being present at the top or outer flank. The rock mass quality is primarily Grade II1 to II2, with a small amount of Grade III2. The slopes do not present overall stability issues, but the primary localized stability concerns are the stability of small blocks formed by the interlacing of bedding planes, minor local faults and joints, and the localized overturning displacement of the reverse slope on the front face.
3. Design of the Water Storage Process and Dam Shoulder Slope Monitoring System
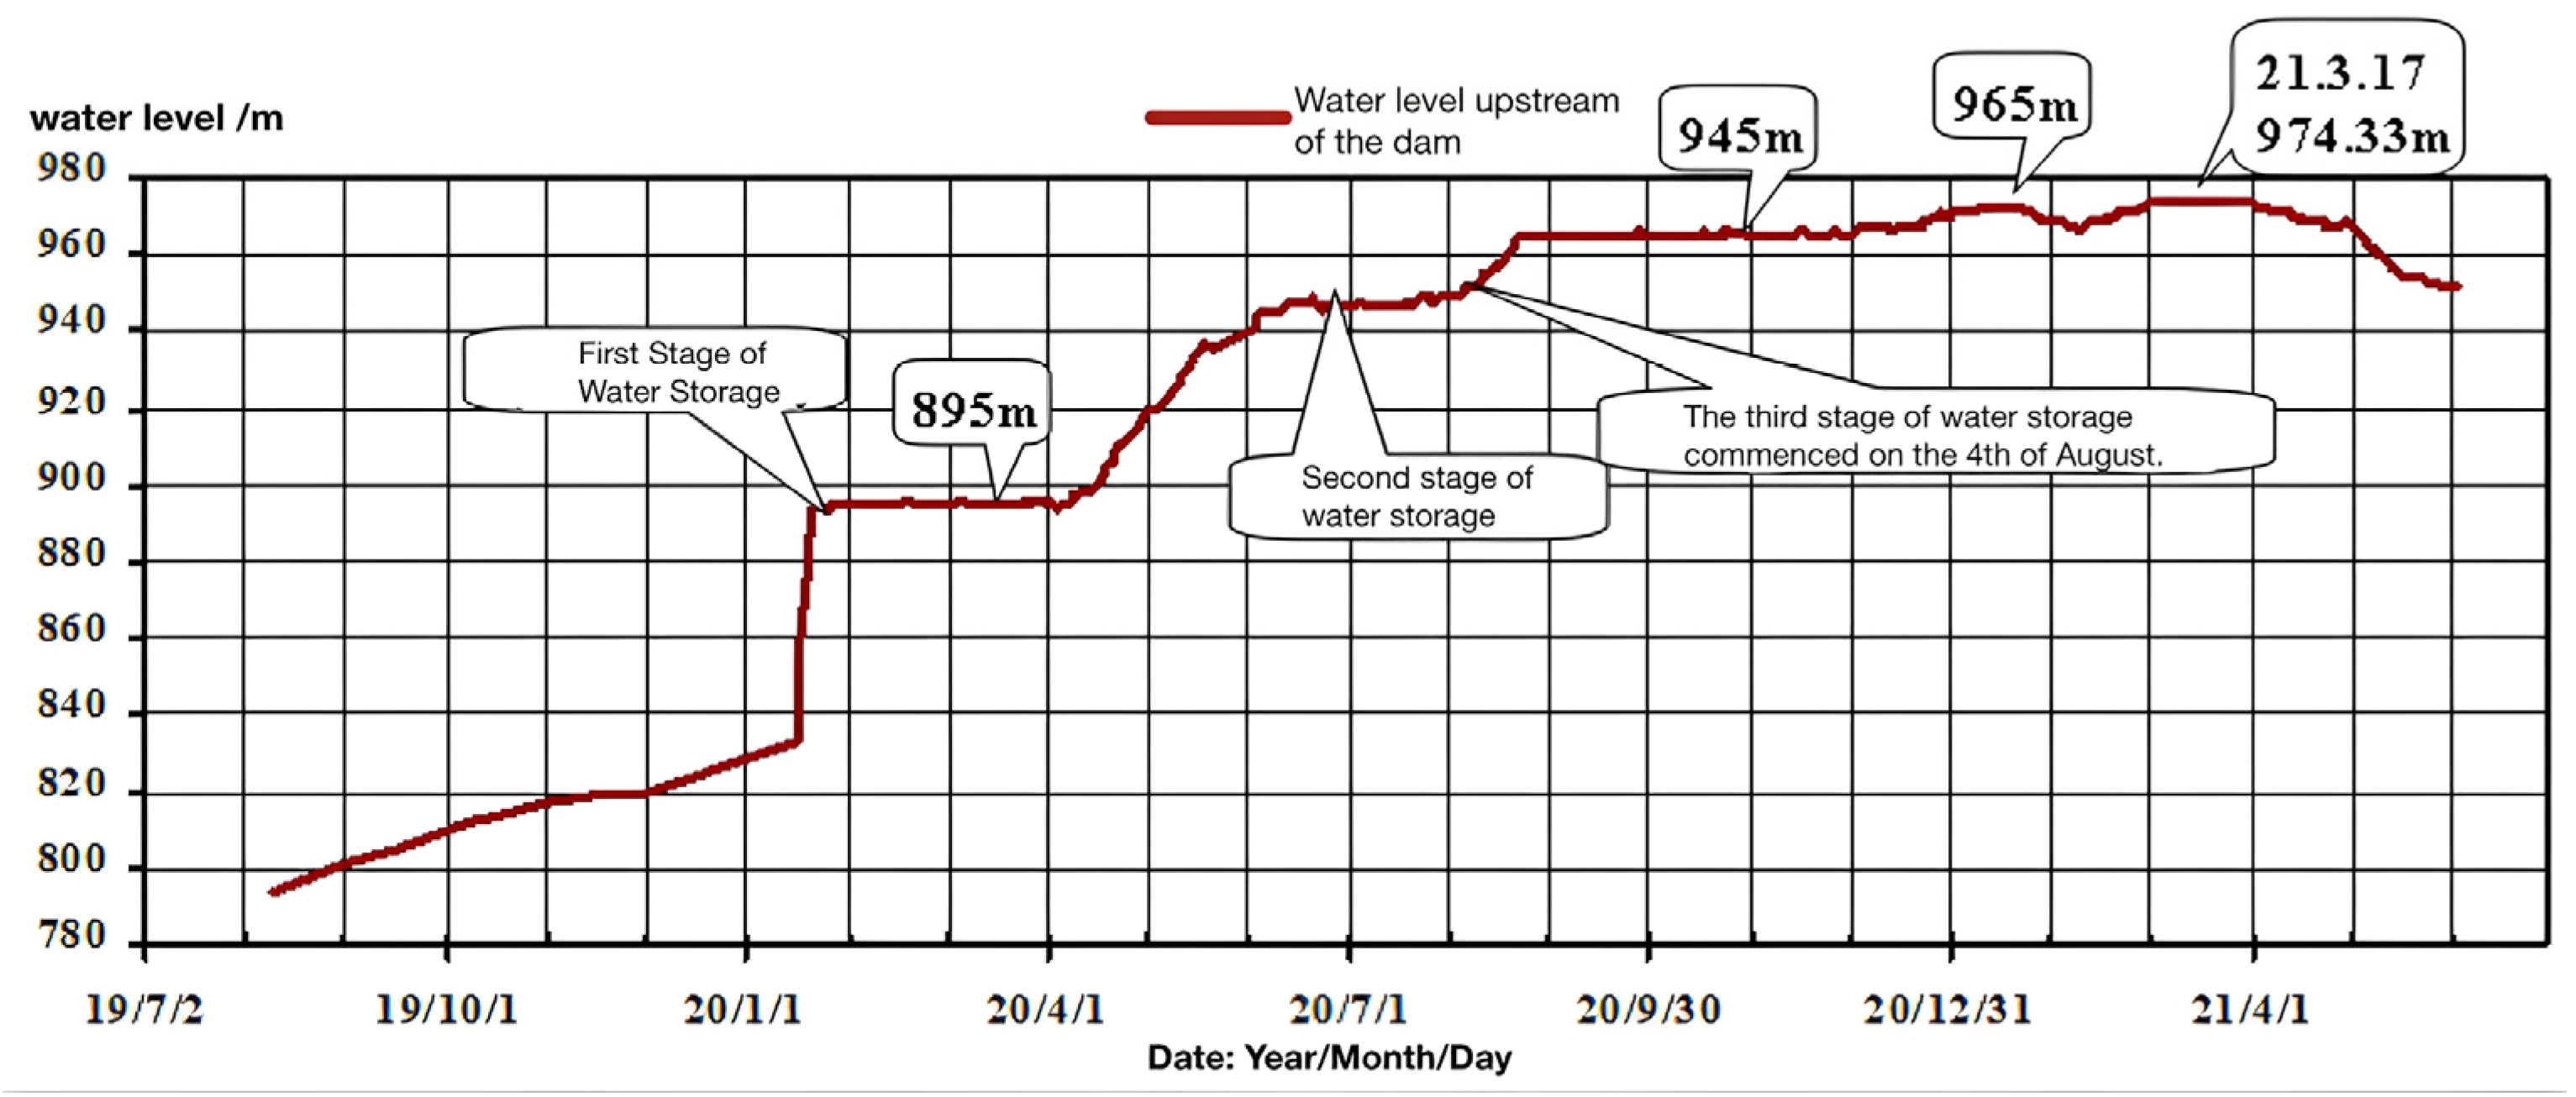
The first stage of impoundment at Wudongde Hydropower Station commenced at 15:30 on 15 January 2020 and concluded at 08:41 on 20 January, lasting 143.5 h. The reservoir water level rose cumulatively by 60.22 m, with a total impounded volume of 498 million cubic meters. The second stage of impoundment commenced at 08:00 on 6 May 2020 and concluded at 20:00 on 4 June 2020, lasting nearly 30 days. The reservoir water level rose cumulatively by 24.83 m, with a total impounded volume of 1.5 billion cubic meters. The third stage of impoundment commenced at 16:00 on 4 August 2020. By 03:00 on 23 August, the reservoir water level reached 965 m. This stage lasted 20 days, with a cumulative water level rise of 20 m and a storage volume of 1.84 billion cubic meters. A process curve of the water level upstream of Wudongde Dam is shown in
Figure 3.
3.1. Basic Requirements for Instrument and Equipment Selection
The fundamental requirements for selecting instruments and equipment are as follows: Manufacturers of the selected instruments must hold ISO 9000 [
26] series quality system certification. The instruments and equipment must have been deployed in no fewer than five major hydraulic and hydroelectric projects, with satisfactory operation for eight years or more. All technical specifications and performance indicators of the instruments and equipment must comply with relevant national standards. The instruments must exhibit simple construction, robust durability, straightforward operation, and reliable stability, facilitating calibration, installation, reading, operation, maintenance, and replacement. Range Selection Requirements: Instrument selection must be based on the instrument’s location and stress conditions, and its measurement range must exceed the maximum possible external load or deformation value to meet the structure’s monitoring requirements. Where feasible, advanced instruments and gauges that have been proven to work in multiple domestic and international dam projects should be prioritized, provided that they meet fundamental stability and reliability criteria. New instruments or gauges must undergo field testing and demonstrate satisfactory performance before deployment in actual projects. When replacing instruments with newer models, their compatibility and integration with existing equipment must be considered. Instrument types should be kept to a minimum or standardized, provided that technical requirements are met. For permanently installed instruments, long-term stability, standardized output signals, and compatibility with diverse automation systems should be prioritized.
3.2. Instrument and Equipment Selection
The selection of monitoring instruments and equipment for Wudongde Hydropower Station primarily considered the following factors: the importance of structures, structural characteristics, operational environment, instrument performance, long-term versus temporary nature, and technical–economic viability. Monitoring instruments with proven performance records both domestically and internationally were selected. Specific instrument models, suppliers, and primary materials are detailed below:
Multi-point displacement transducers, rebar gauges, anchor bolt stress gauges, cable force transducers, piezometers, strain gauges, and stress-free gauges were purchased from Beijing Jikang Company (Beijing, China), Guodian Nanjing Automation Company (Nanjing, China), and American Gage & Instrument Company (Lebanon, NH, USA).
The selected vibrating-wire reading device is the BGK408, produced by Beijing Jikang Company, while the selected differential resistance instrument reading device is the SQ-2A digital bridge, produced by Nanjing Automation Company.
Inclinometers (readers and sensors) must be selected from products manufactured by Newco, USA (Sinco (Durham Geo Enterprises Inc.), Atlanta, GA, USA), along with their accompanying tubing.
Total stations must be selected from Leica’s TM30 and TM50 models (Leica Geosystems, Heerbrugg, Switzerland).
GPS units must be selected from Leica’s Viva GNSS (Leica Geosystems, Heerbrugg, Switzerland) range.
Leveling instruments and leveling rods must be selected from Leica’s DNA03 (Leica Geosystems, Heerbrugg, Switzerland) digital leveling instrument and its accompanying indium steel ruler.
Prisms: Leica GPR1 (Leica Geosystems, Heerbrugg, Switzerland) circular prisms were used, manufactured by Leica Geosystems (Leica Geosystems, Heerbrugg, Switzerland) and comprising four components: Leica GPR1 circular prism, GPH1 (Leica Geosystems, Heerbrugg, Switzerland) single frame, GRT44 (Leica Geosystems, Heerbrugg, Switzerland) bracket, and GDF21 (Leica Geosystems, Heerbrugg, Switzerland) base.
Monitoring instrument cables: Matching cables were selected as per the contractual requirements.
Total stations, leveling instruments, leveling rods, and other monitoring equipment were submitted for verification to nationally designated metrology departments. Multi-point displacement transducers, rebar strain gauges, anchor rod stress gauges, anchor cable force gauges, piezometers, and associated cables underwent on-site inspection. Instrument testing assessed three aspects: mechanical properties, temperature performance, and waterproofing performance. Cable testing included insulation testing and waterproofing performance verification. The installation of monitoring instruments adhered to the Technical Specifications for Safety Monitoring of Concrete Dams and the technical requirements for instrument installation and observation specified in the design.
The selection of reference values is a key issue in ensuring the reliability of monitoring data. Instrument reference values are primarily selected according to the following requirements:
Surface displacement monitoring points: After two consecutive, independent observations passing inspection, their average value is taken as the reference value for the deformation monitoring point.
Multi-point displacement gauges: Readings taken at least 24 h after the final setting of the grout may serve as initial readings. The average value is adopted as the baseline when the difference between three consecutive readings is less than 1% of the full scale (F.S.).
Anchor rod stress gauges: Following final setting of the cement mortar, readings taken when the anchor rod and gauge deform in tandem with the surrounding mortar serve as initial readings and are typically recorded after 24 h.
Anchor cable force gauges: Initial readings are repeatedly measured, and when the difference between three consecutive readings does not exceed 2% of the gauge’s full scale, the average is taken as the zero reading.
Borehole inclinometer: Following installation, backfilling, and consolidation of the conduit, after at least three stable observations where two readings fall below the instrument’s precision threshold, their average is taken as the reference value.
Bedrock displacement gauge: Readings taken more than 24 h after final setting of the grout may serve as initial readings. The average of three consecutive readings with a difference of less than 1% of the full scale is adopted as the reference value.
Compression stress gauge: Commencing readings immediately after installation and calibration, the value that is recorded when the concrete is fully settled is taken as the initial reading.
Reinforcement gauge: Readings in which the gauge deforms with the surrounding material after concrete hardening, typically taken 12–24 h post-embedment, are selected.
Piezometer: The piezometer is immersed in water until the porous stone reaches saturation (usually one day), and the reading that is taken upon removal from the immersion water is used as the baseline value.
Strain gauge array: Readings are taken four times daily before the concrete reaches its maximum temperature rise. Typically, the value after 24 h is taken. The initial values for all strain gauges within the same array should be taken at the same time. The array must satisfy point temperature and point stress conditions regarding temperature and strain measurements. The point temperature condition means that the temperature readings of all instruments within the same array should be essentially consistent within a specified range. The point stress condition primarily requires that the strain readings of the four strain gauges within the same plane should be balanced.
Stress-free gauges: When embedded simultaneously with strain gauge sets, the readings of stress-free gauges should indicate the same time as the strain gauge set. When embedded with reinforcement gauges, they should be synchronized with the reinforcement gauge readings.
3.3. Survey Point Layout
The primary monitoring focus for dam shoulder slopes encompasses surface deformation, deep-seated deformation, and stress variations within the supporting structures. Emphasis is placed on monitoring localized rock masses and areas exhibiting significant deformation. Key monitoring instruments include surface displacement gauges, multi-point displacement meters, inclinometer boreholes, anchor rod stress gauges, cable force gauges, piezometers, and pressure monitoring tubes. The overall layout is detailed in
Table 1.
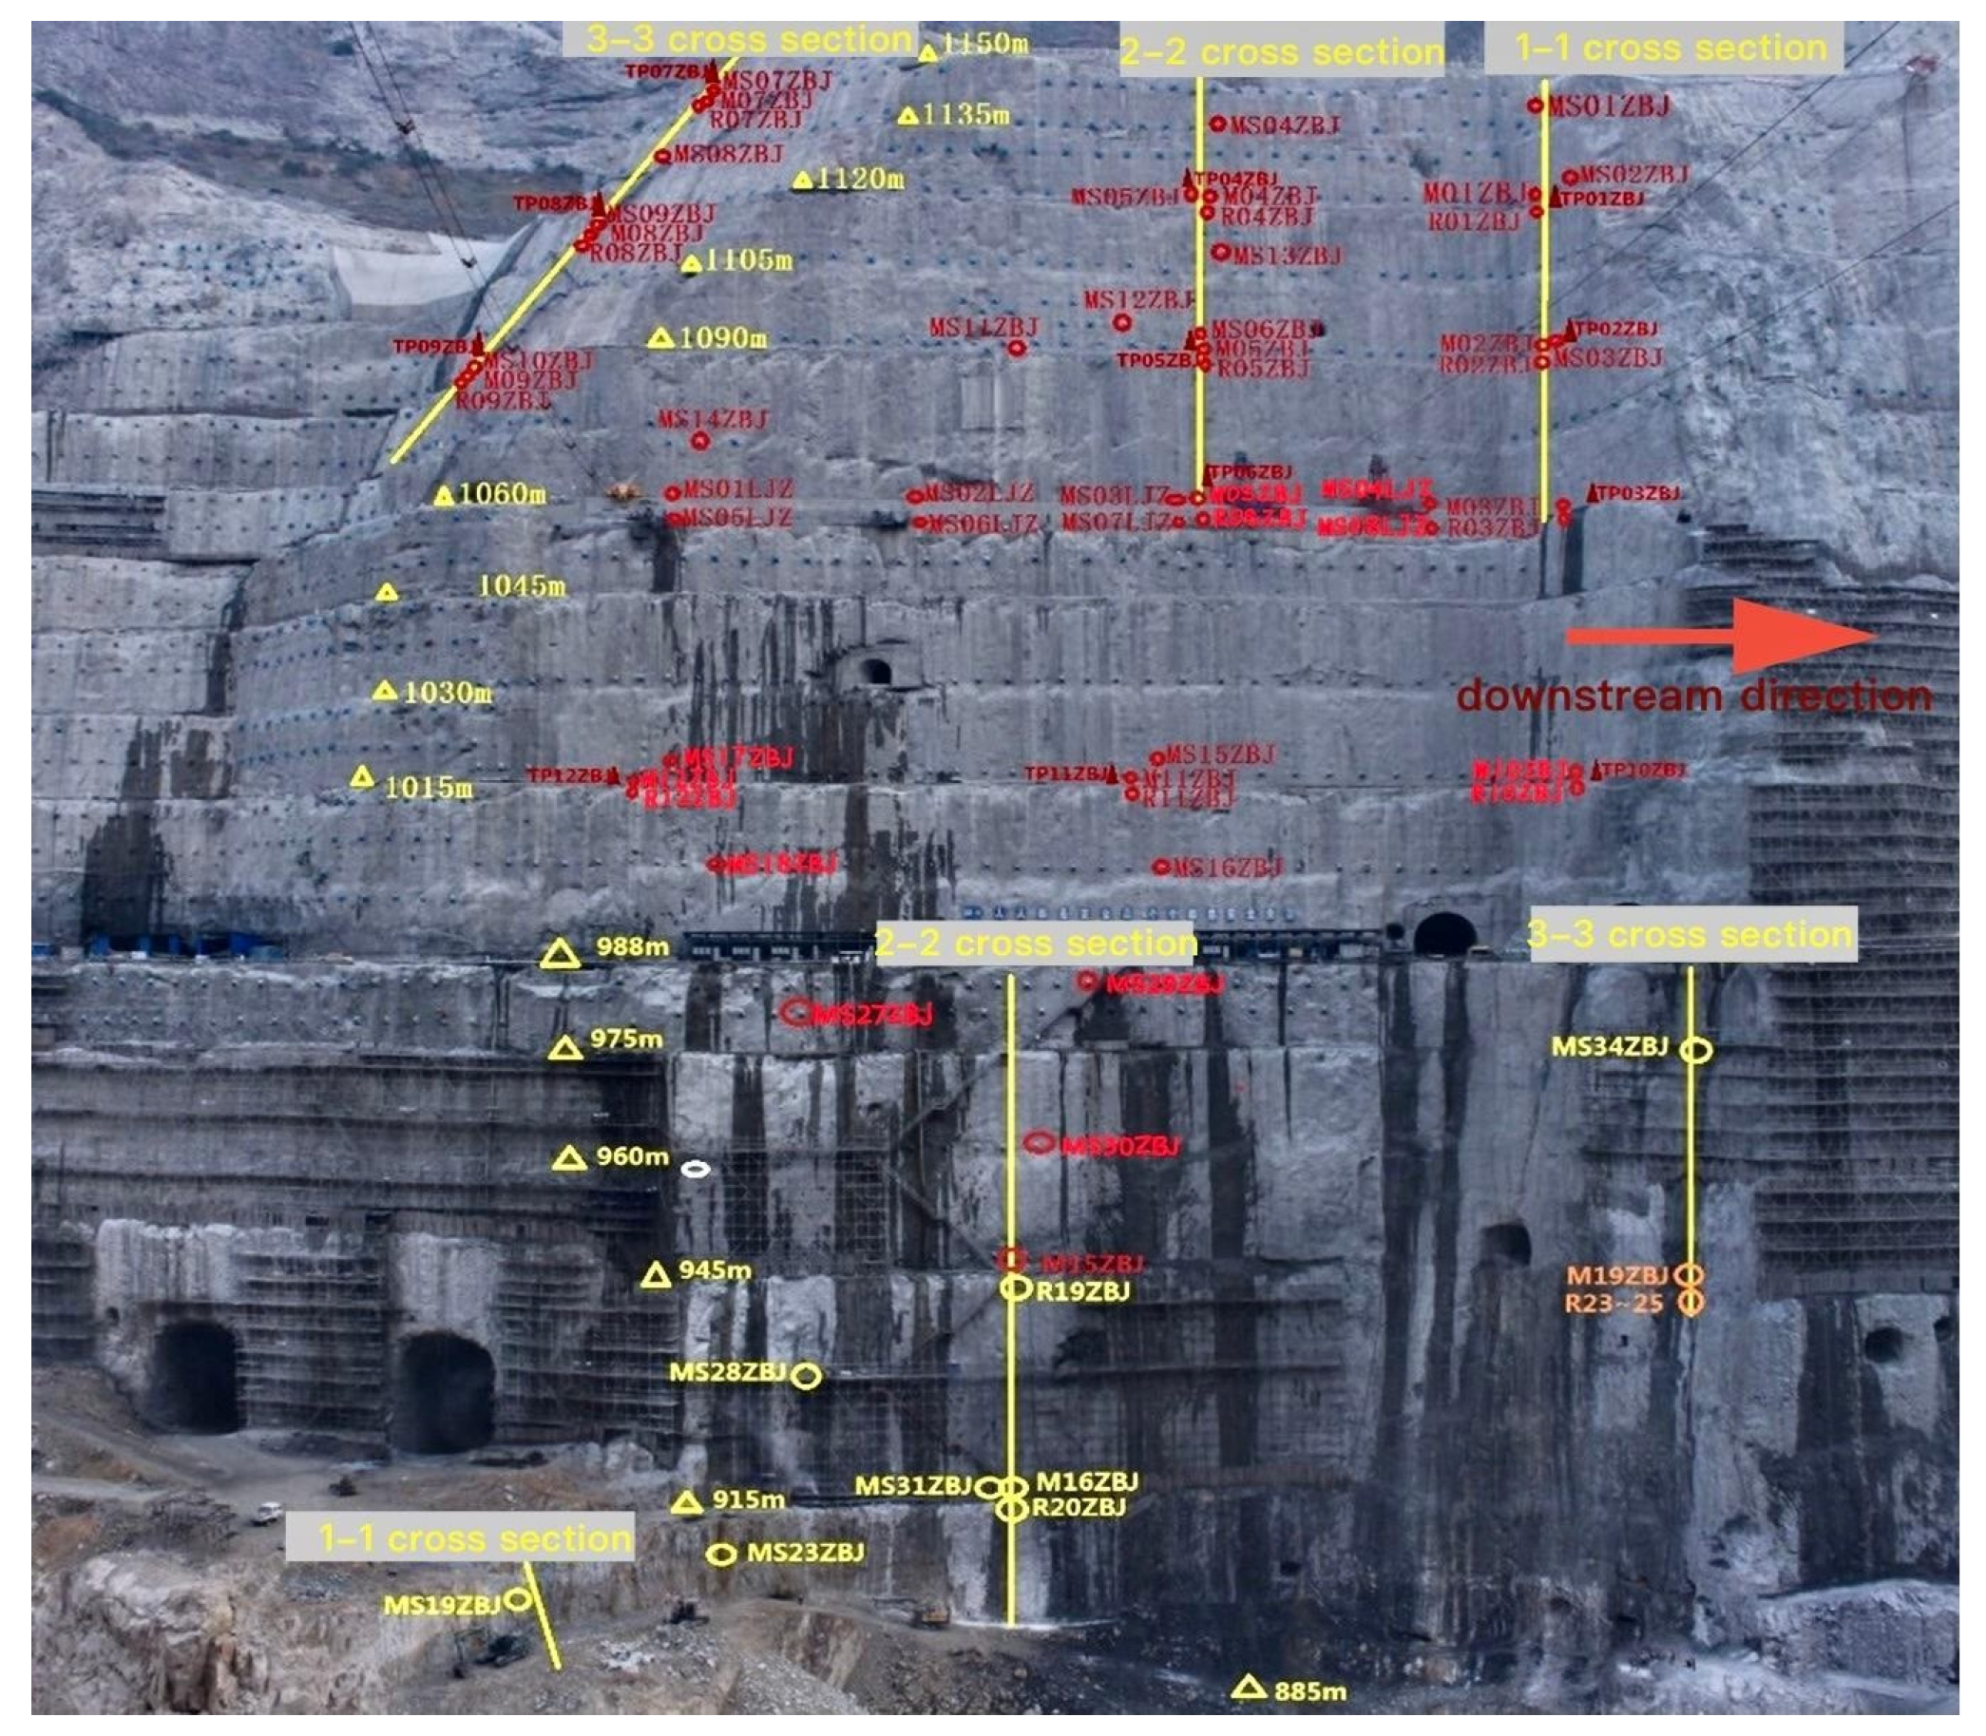
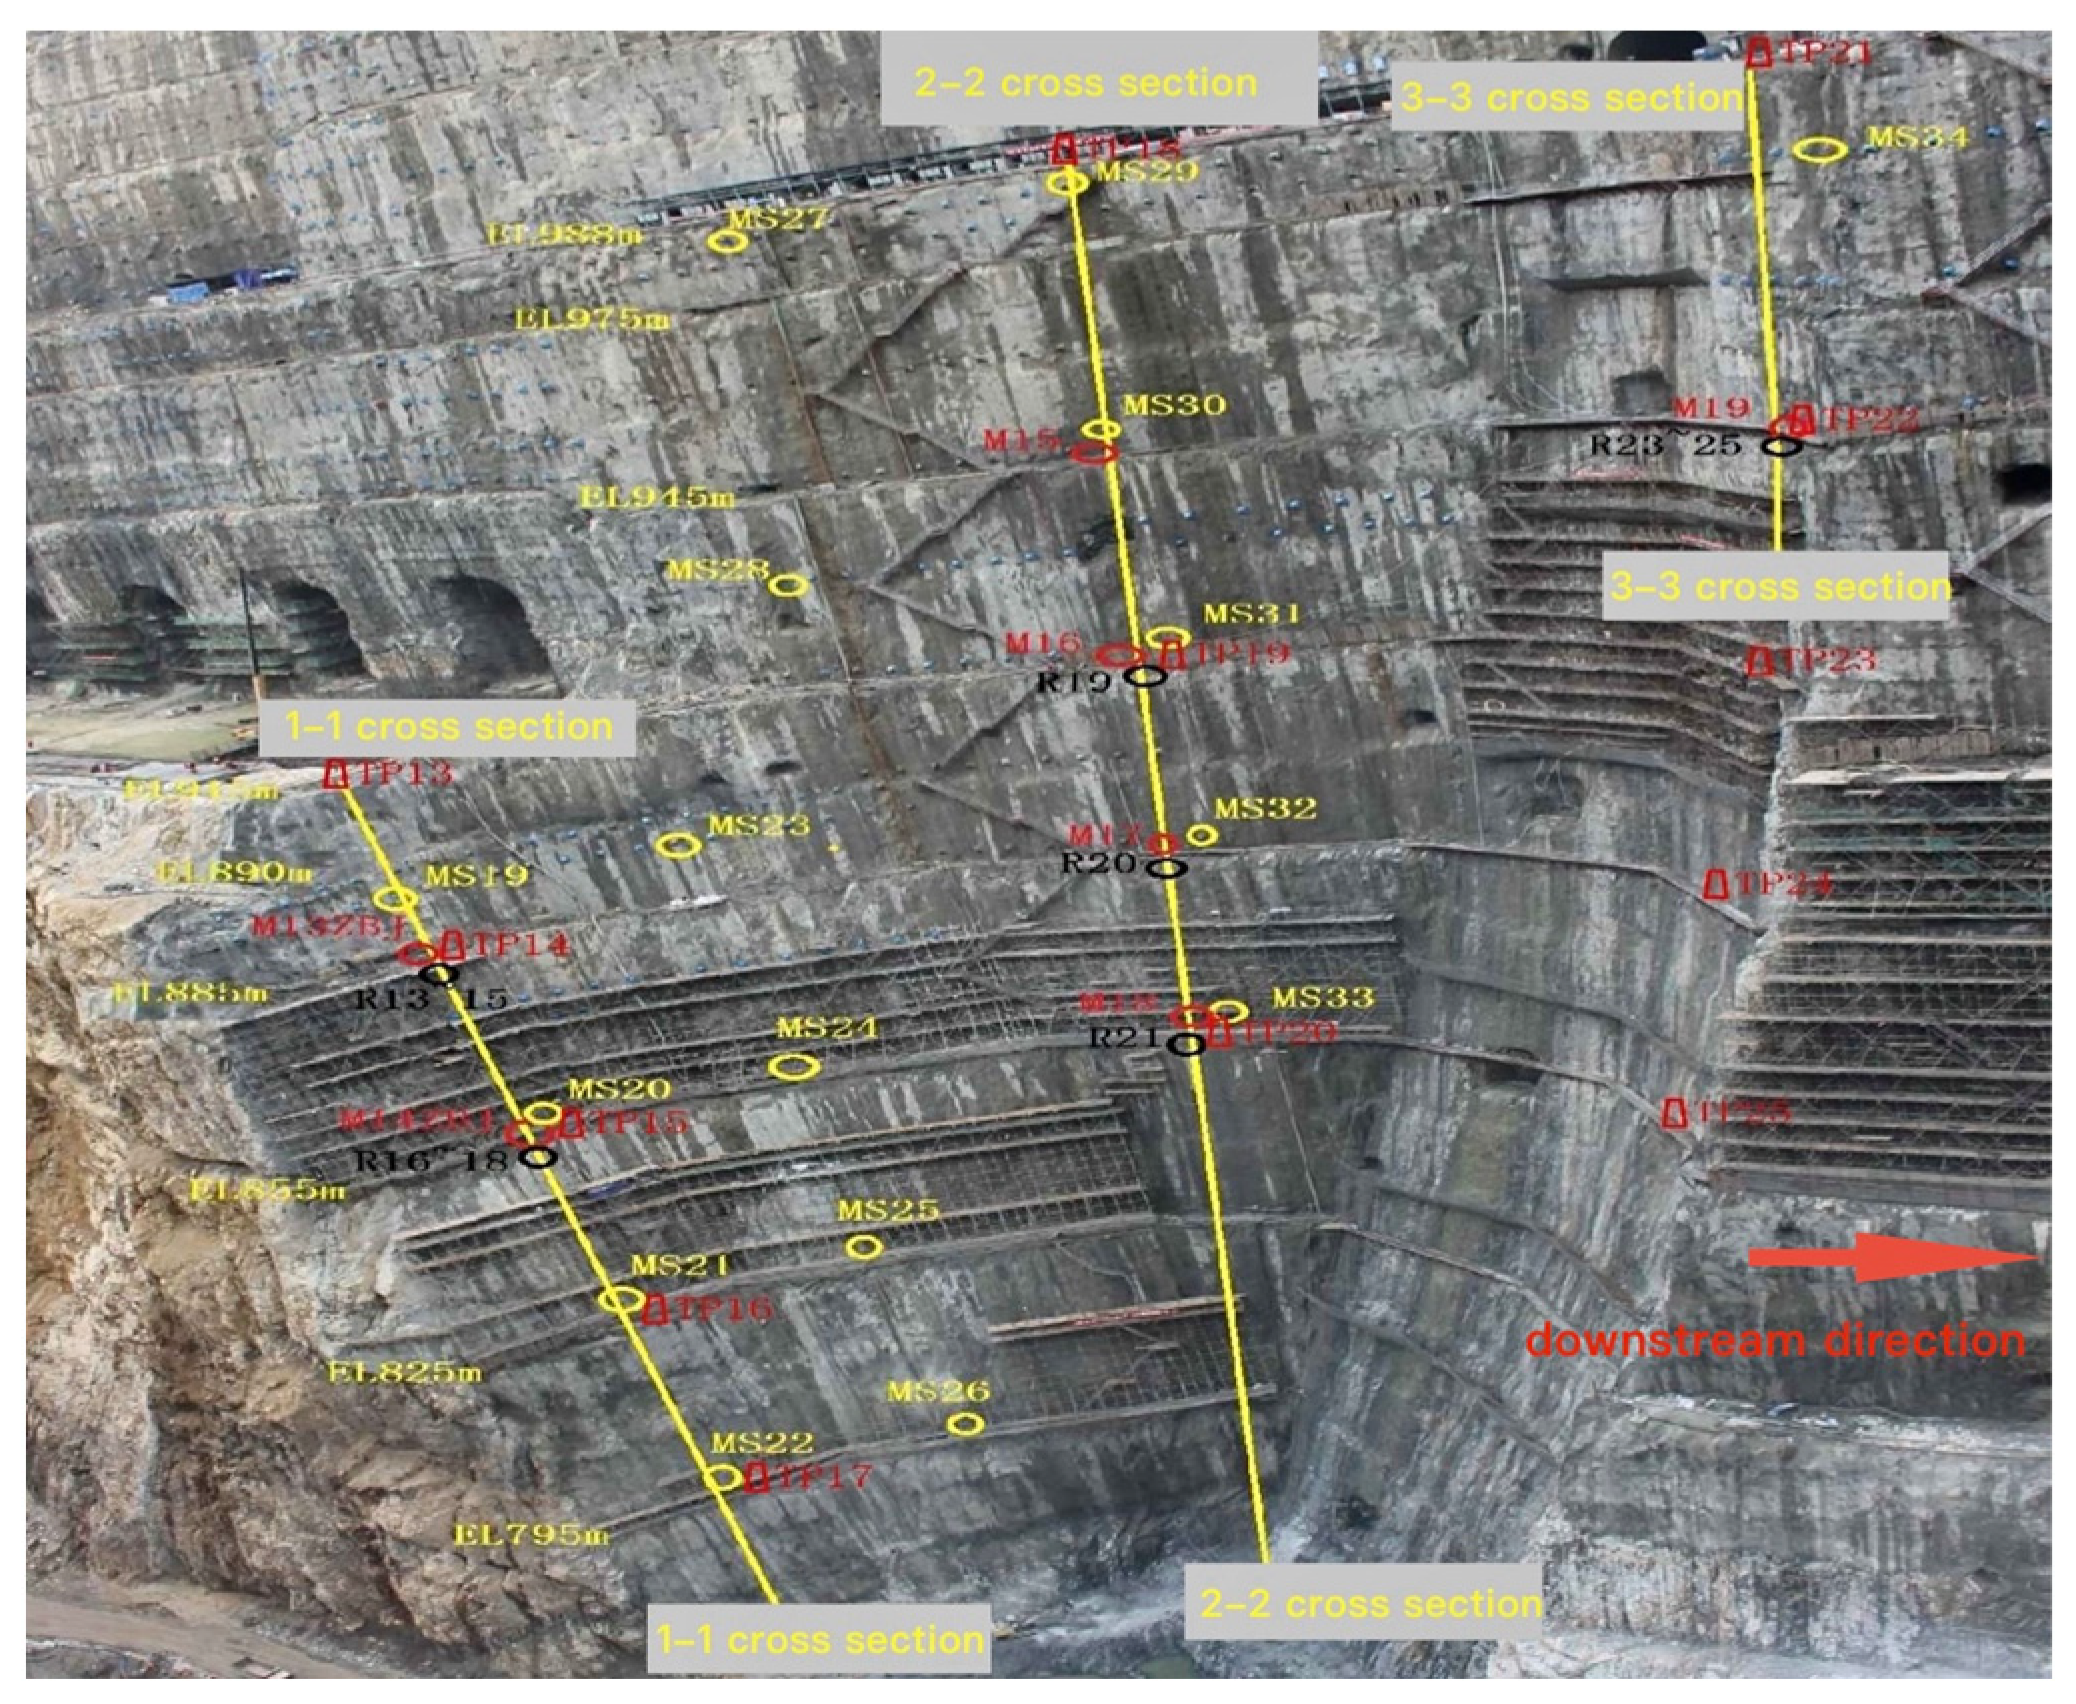
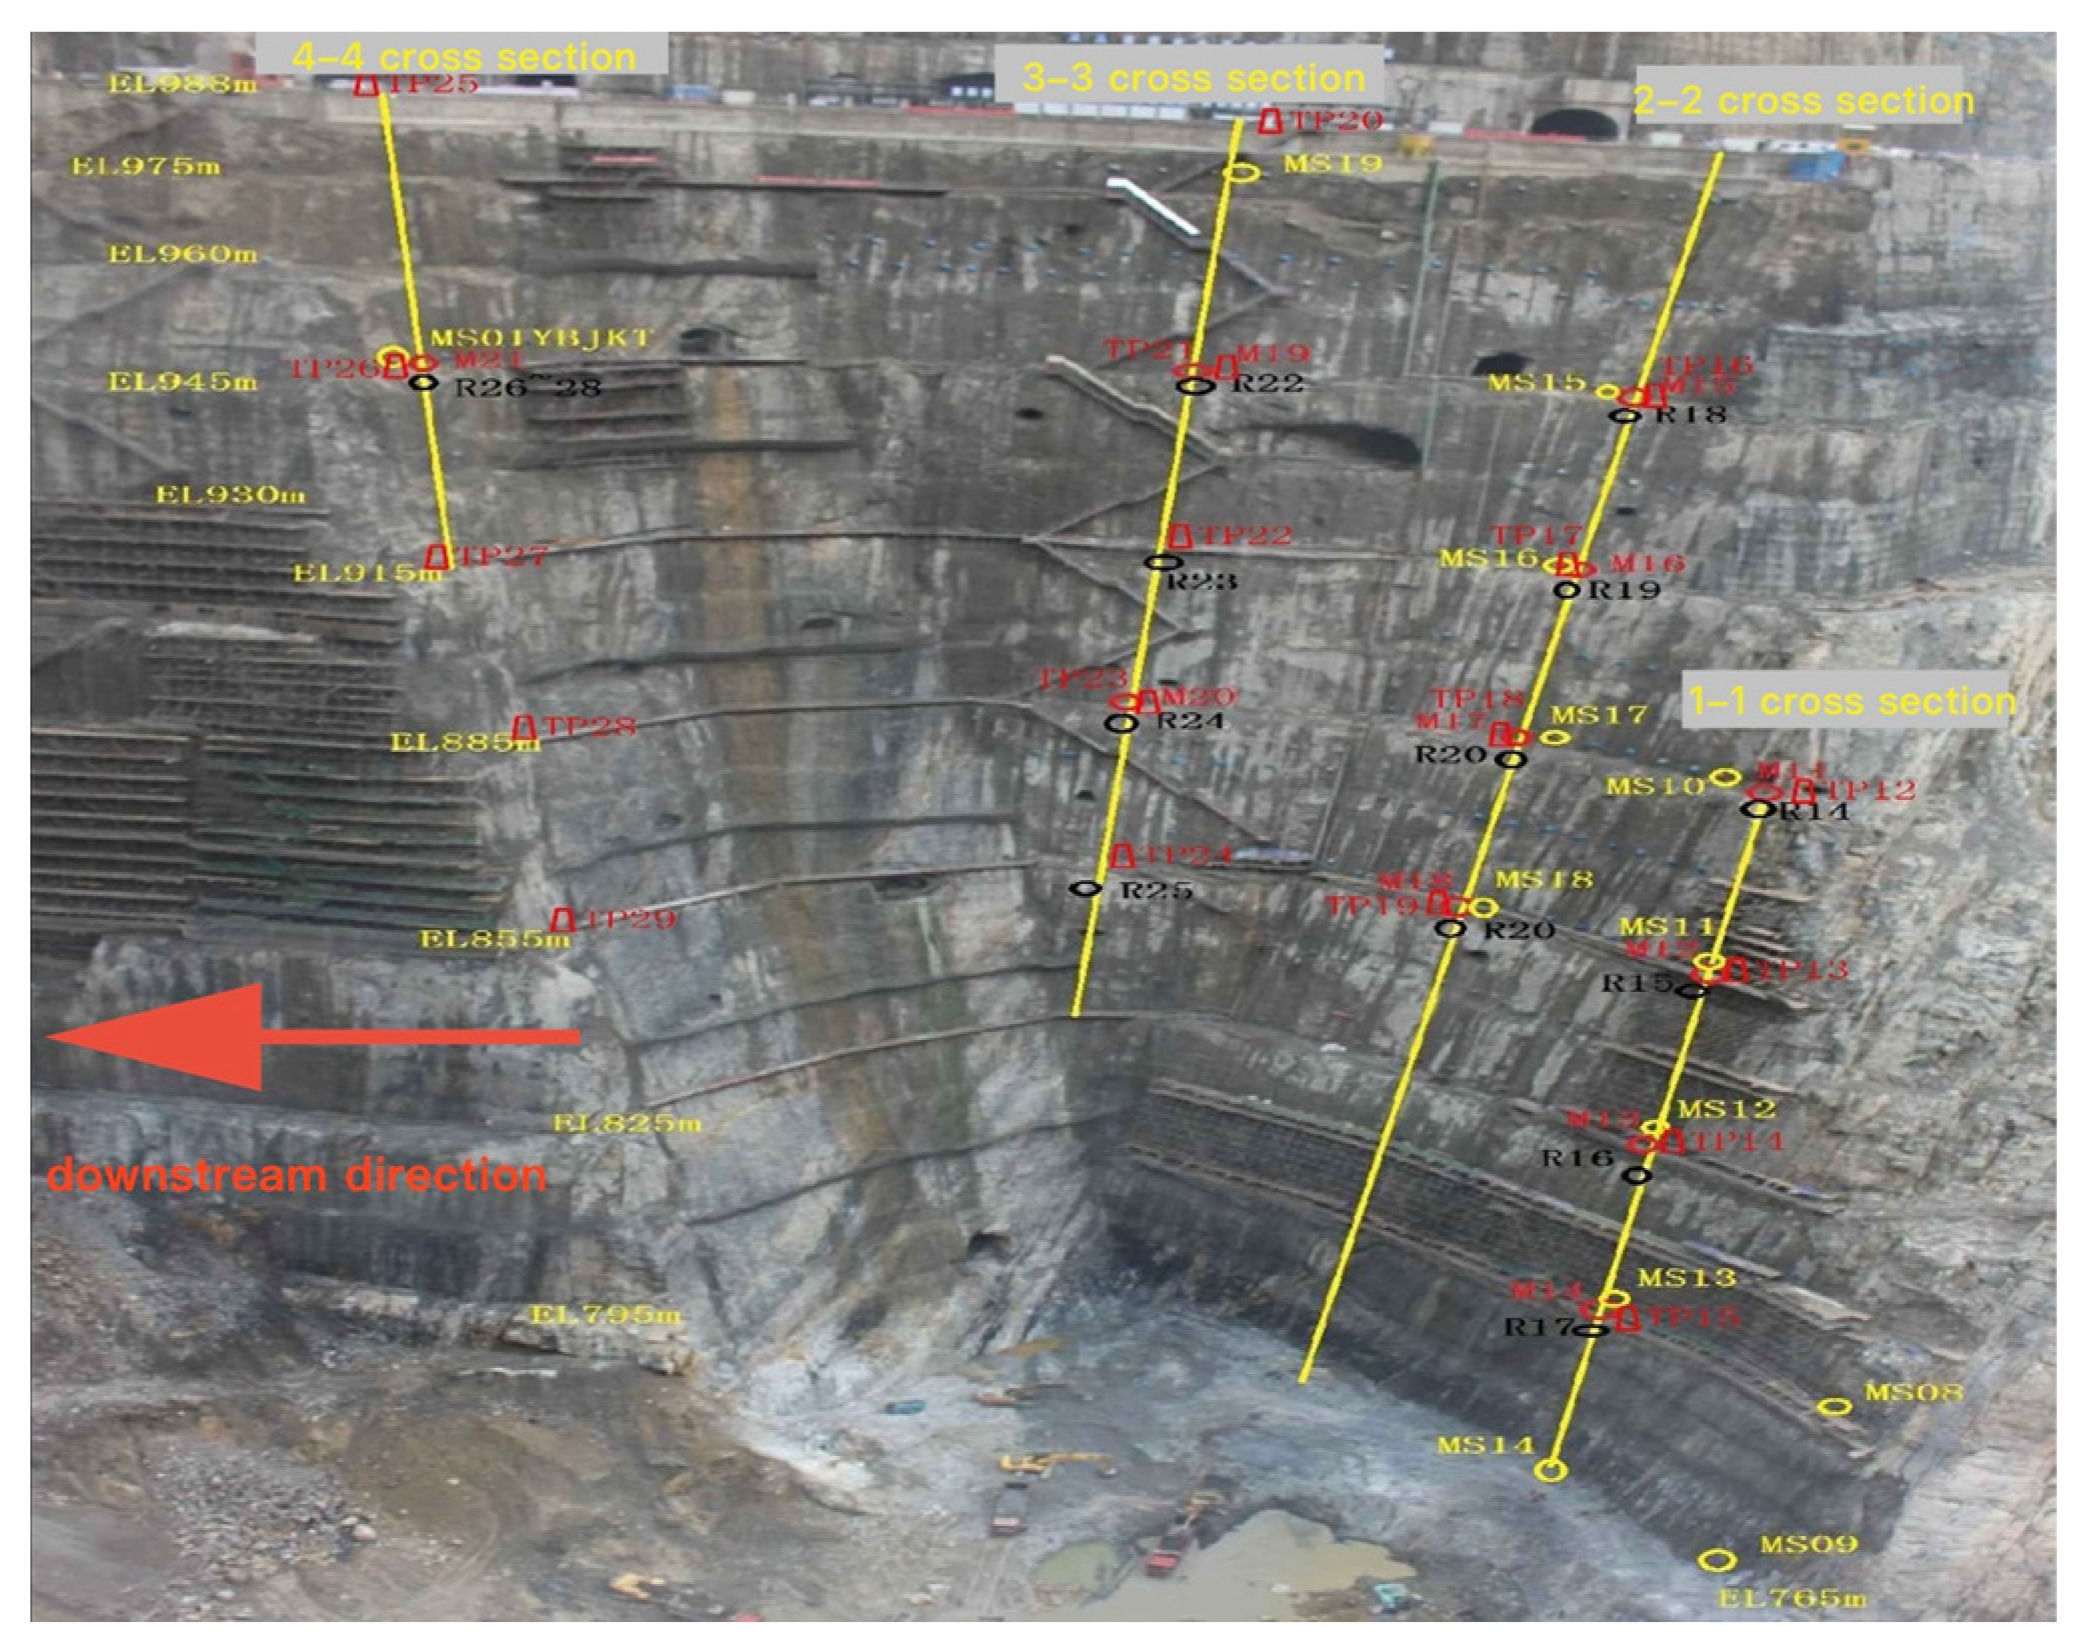
The left bank abutment slope (including the cableway platform slope) reaches a height of 447 m (elevation 718 m to 1165 m). A cableway platform is located at an elevation of 1053 m on the left bank abutment slope. The left abutment slope incorporates 19 sets of multi-point displacement transducers, 25 anchor rod stress gauges, 46 cable force gauges, and 20 surface displacement monitoring points. The layouts of the monitoring facilities below and above an elevation of 988.00 m on the left abutment are shown in
Figure 4 and
Figure 5, respectively.
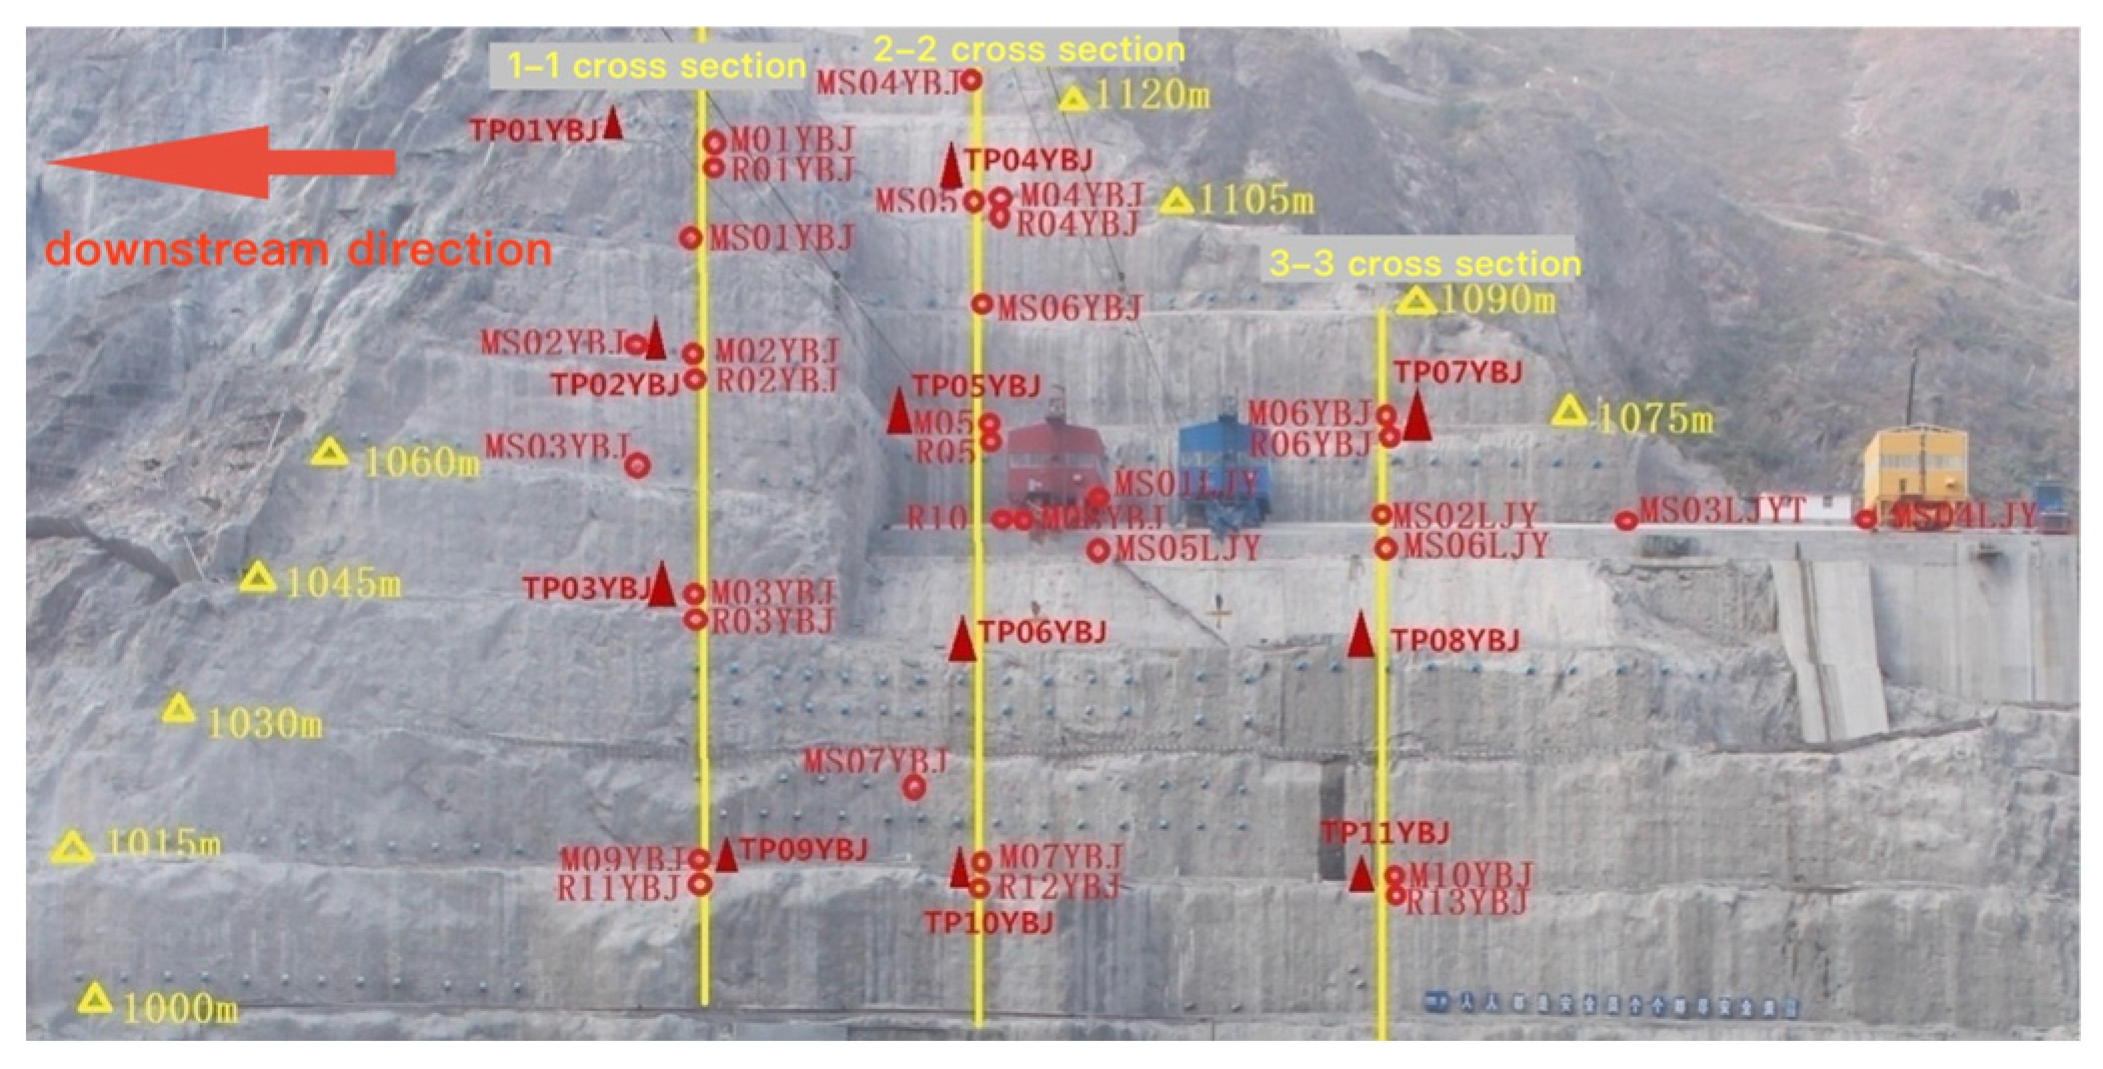
The right bank abutment slope (including the cableway platform slope) reaches a height of 431 m (elevation of 718 m to 1149 m). The cableway platform is situated at an elevation of 1057 m on the right bank shoulder slope. The slope incorporates 21 sets of multi-point displacement transducers, 28 anchor rod stress gauges, 27 cable force gauges, and 26 surface displacement monitoring points. The layouts of the monitoring facilities below and above an elevation of 988 m on the right bank shoulder are shown in
Figure 6 and
Figure 7, respectively.
4. Results
4.1. Left Bank Shoulder Slope
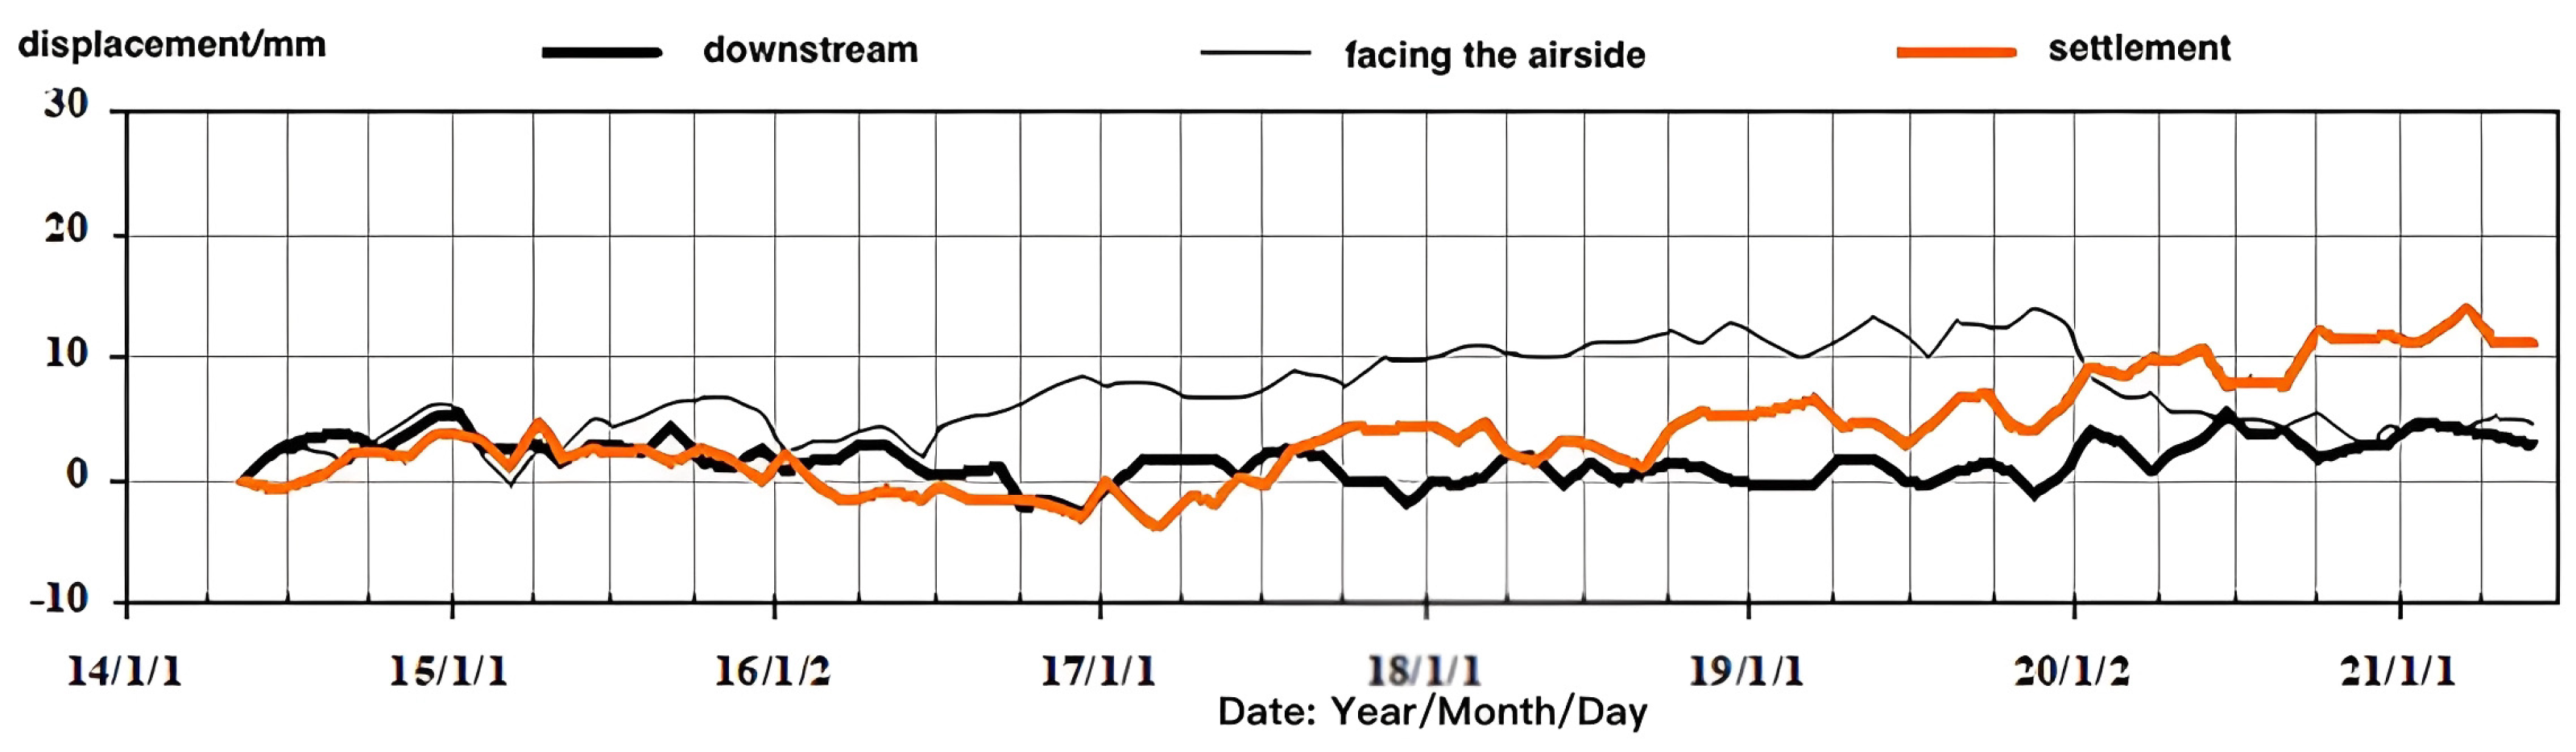
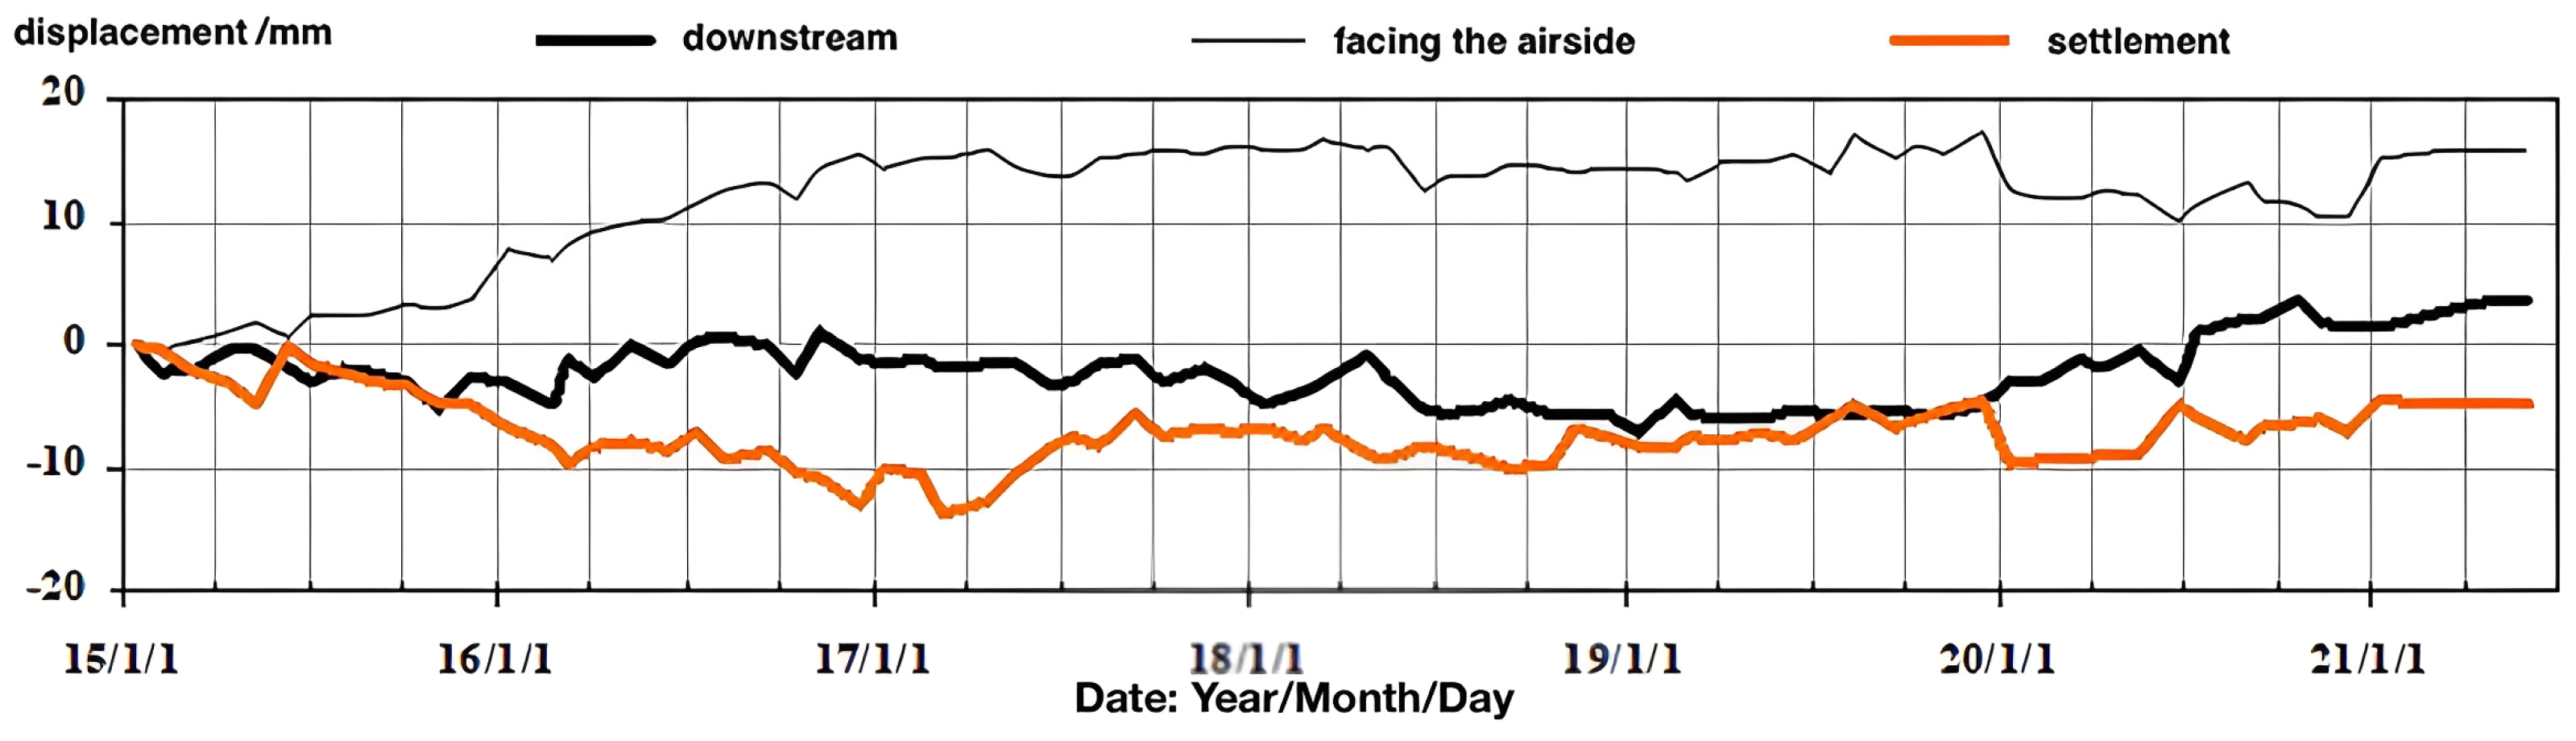
Twenty surface displacement measuring points have been set up on the left bank shoulder slope, with eleven of them being located at other measurement points. The typical displacement process lines of the measuring points are shown in
Figure 8,
Figure 9 and
Figure 10. In the X direction, downstream displacement is positive; in the Y direction, displacement towards the valley is positive; and in the H direction, subsidence is positive, while in the opposite direction, it is negative.
- (1)
All measurement points indicate that the downstream displacement ranges from −5.0 mm to 9.9 mm, the displacement toward the valley edge ranges from −4.4 mm to 5.4 mm, and the settlement ranges from −6.5 mm to 18.5 mm.
- (2)
The measured surface displacement values at 11 monitoring points indicate that compared with before water storage (on 14 January 2020), the downstream displacement increment ranges from −3.9 mm to 2.5 mm, the displacement increment towards the river valley overhanging the surface ranges from −10.0 mm to −1.2 mm, and the settlement increment ranges from 0.0 mm to 7.8 mm.
- (3)
The displacement of each measurement point downstream does not exceed 10.0 mm, the displacement towards the exposed face does not exceed 5.4 mm, and the settlement does not exceed 18.5 mm; the displacement amounts are all relatively small. There has been no positive displacement increment towards the valley’s exposed face at any measurement point, with no obvious displacement trends, indicating overall slope stability.
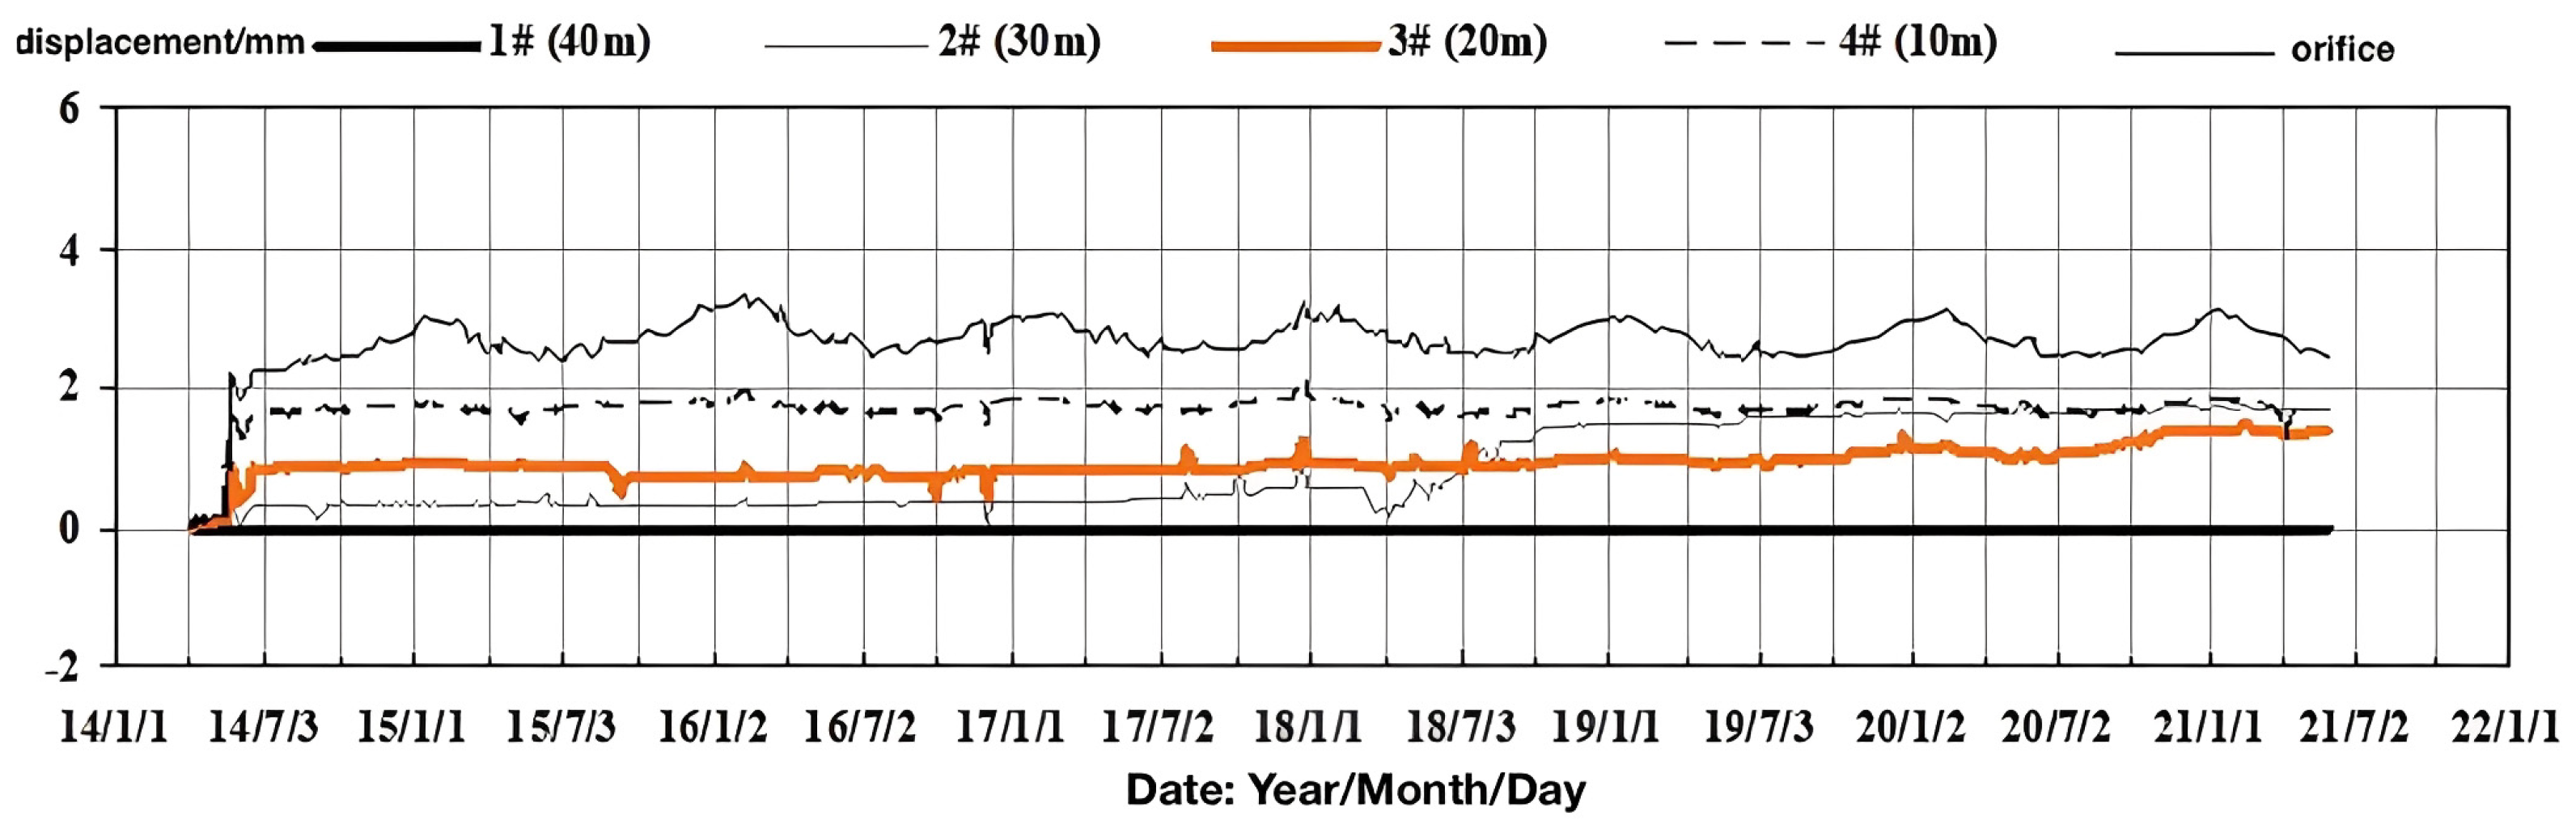
A total of 9 sets of four-point multi-point displacement meters and 10 sets of three-point multi-point displacement meters were installed on the left bank shoulder slope of the dam. The typical deformation process of measurement points is shown in
Figure 9. On 26 May 2021, the maximum displacement at the opening of the multi-point displacement meter on the left bank shoulder slope of the dam towards the void was 5.2 mm (M18ZBJ, elevation of 855.4 m), indicating a small deformation. The slope remained stable with no abnormalities after excavation and support. As of 26 May 2021, the cumulative deformation of the rock mass had increased by −1.8 mm to 2.0 mm compared with before water storage, indicating a small increment.
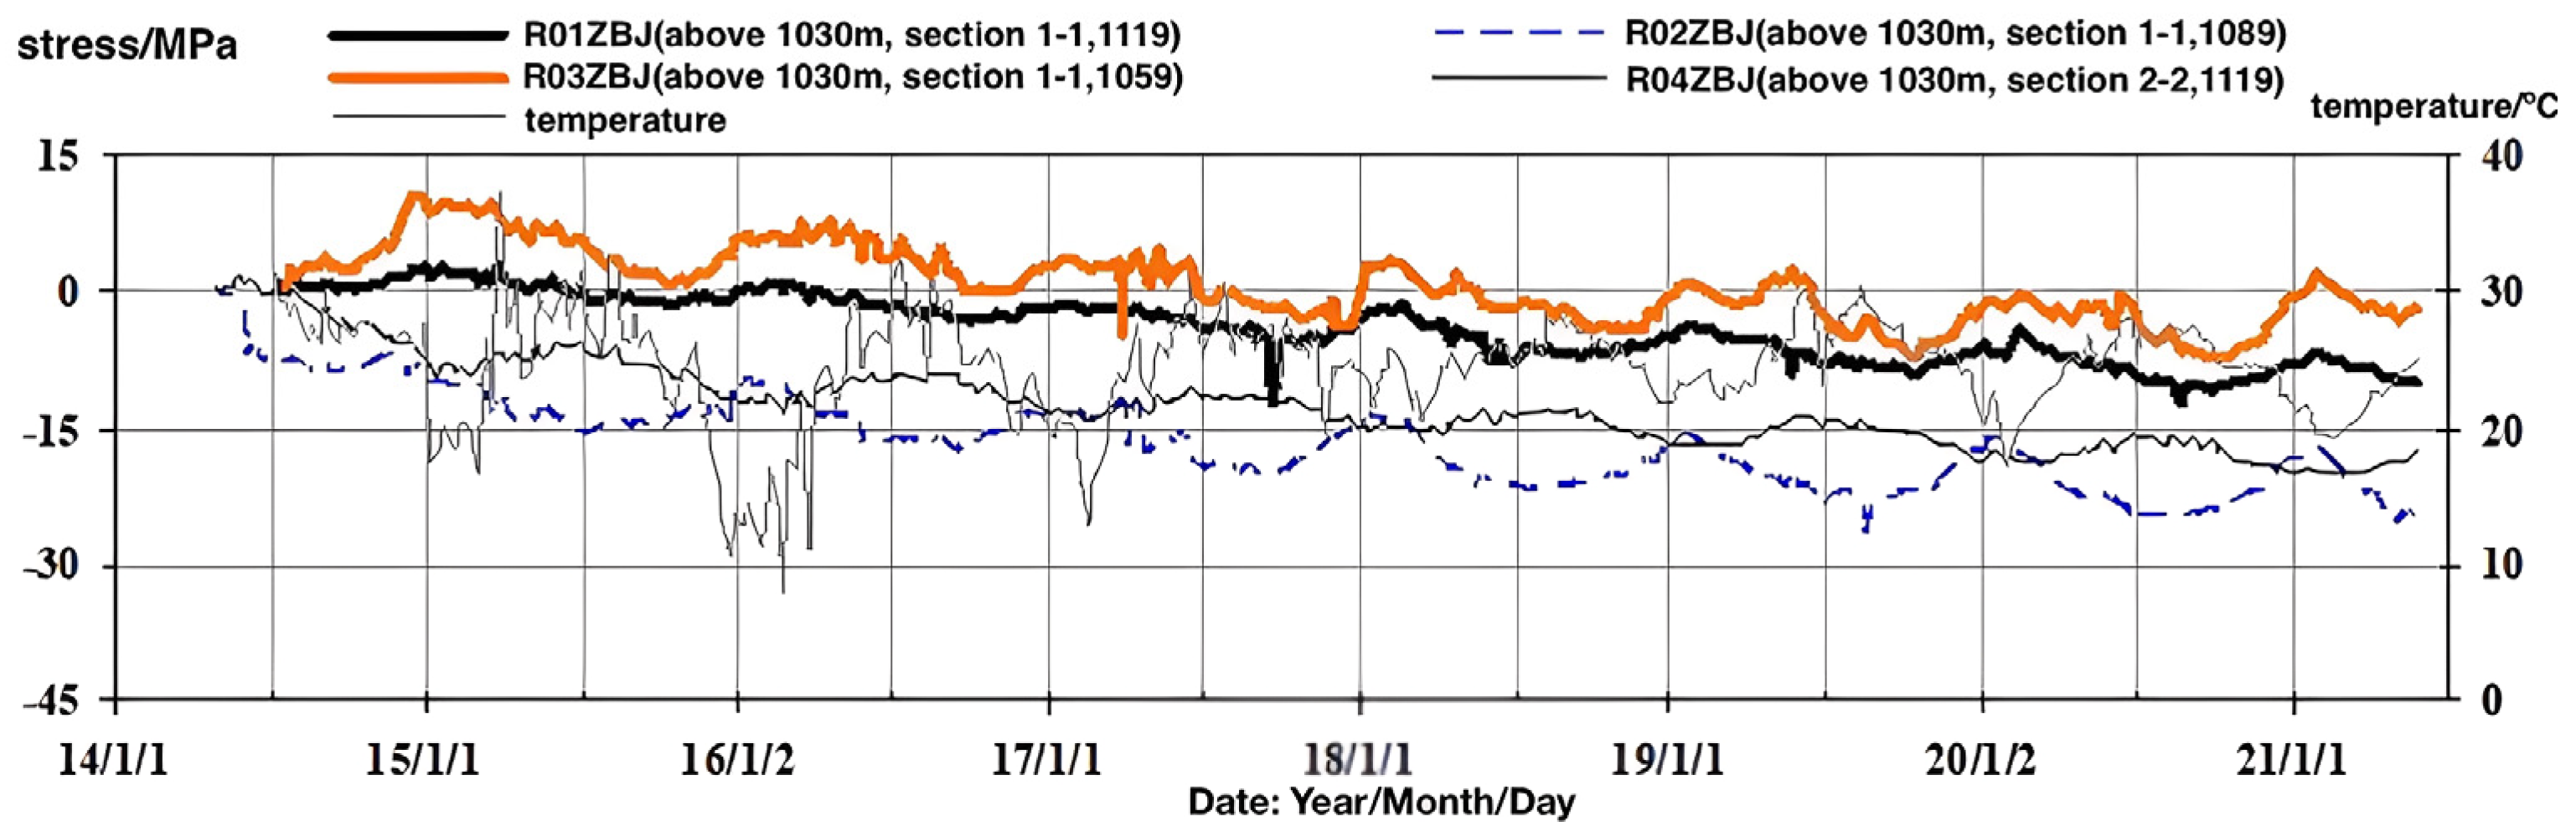
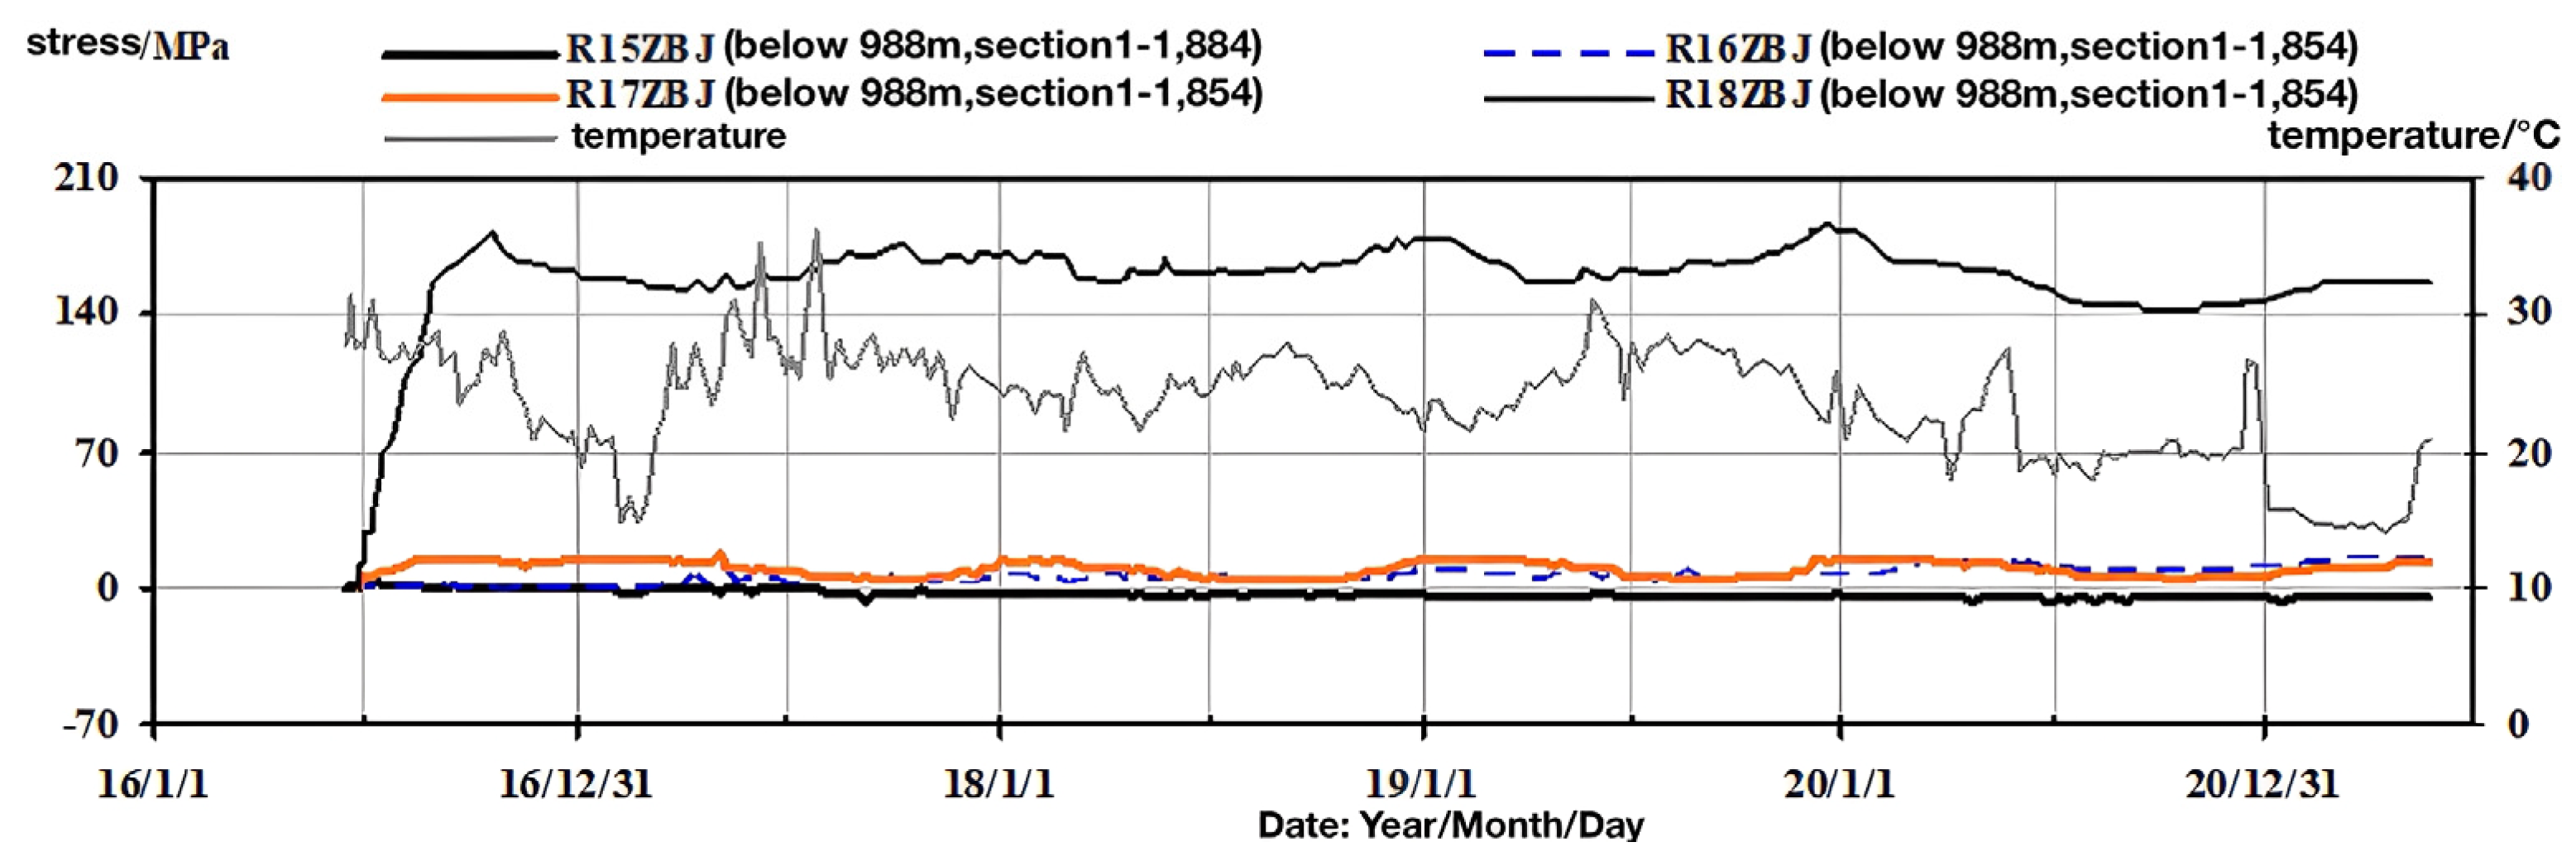
Twenty-five anchor rod strain gauges have been installed on the left bank shoulder slope of the dam, with measurements being obtained from twenty of them. The typical stress process line for the anchor rod measuring points is shown in
Figure 11 and
Figure 12. As of 26 May 2021, the stress range for the left bank shoulder slope’s anchor rods was −33.5 MPa to 184.8 MPa, with a maximum value of 184.8 MPa (R18ZBJ, section 1-1, elevation of 854 m). Aside from R18ZBJ, the stress at the remaining measuring points was below 15.2 MPa, indicating a low stress level, and the stress measurements have stabilized after the excavation and support of the slope. As of 26 May 2021, the change in measurements compared with before water storage ranged from −26.9 MPa to 9.1 MPa, showing minimal variation, and the measurements are now essentially stable.
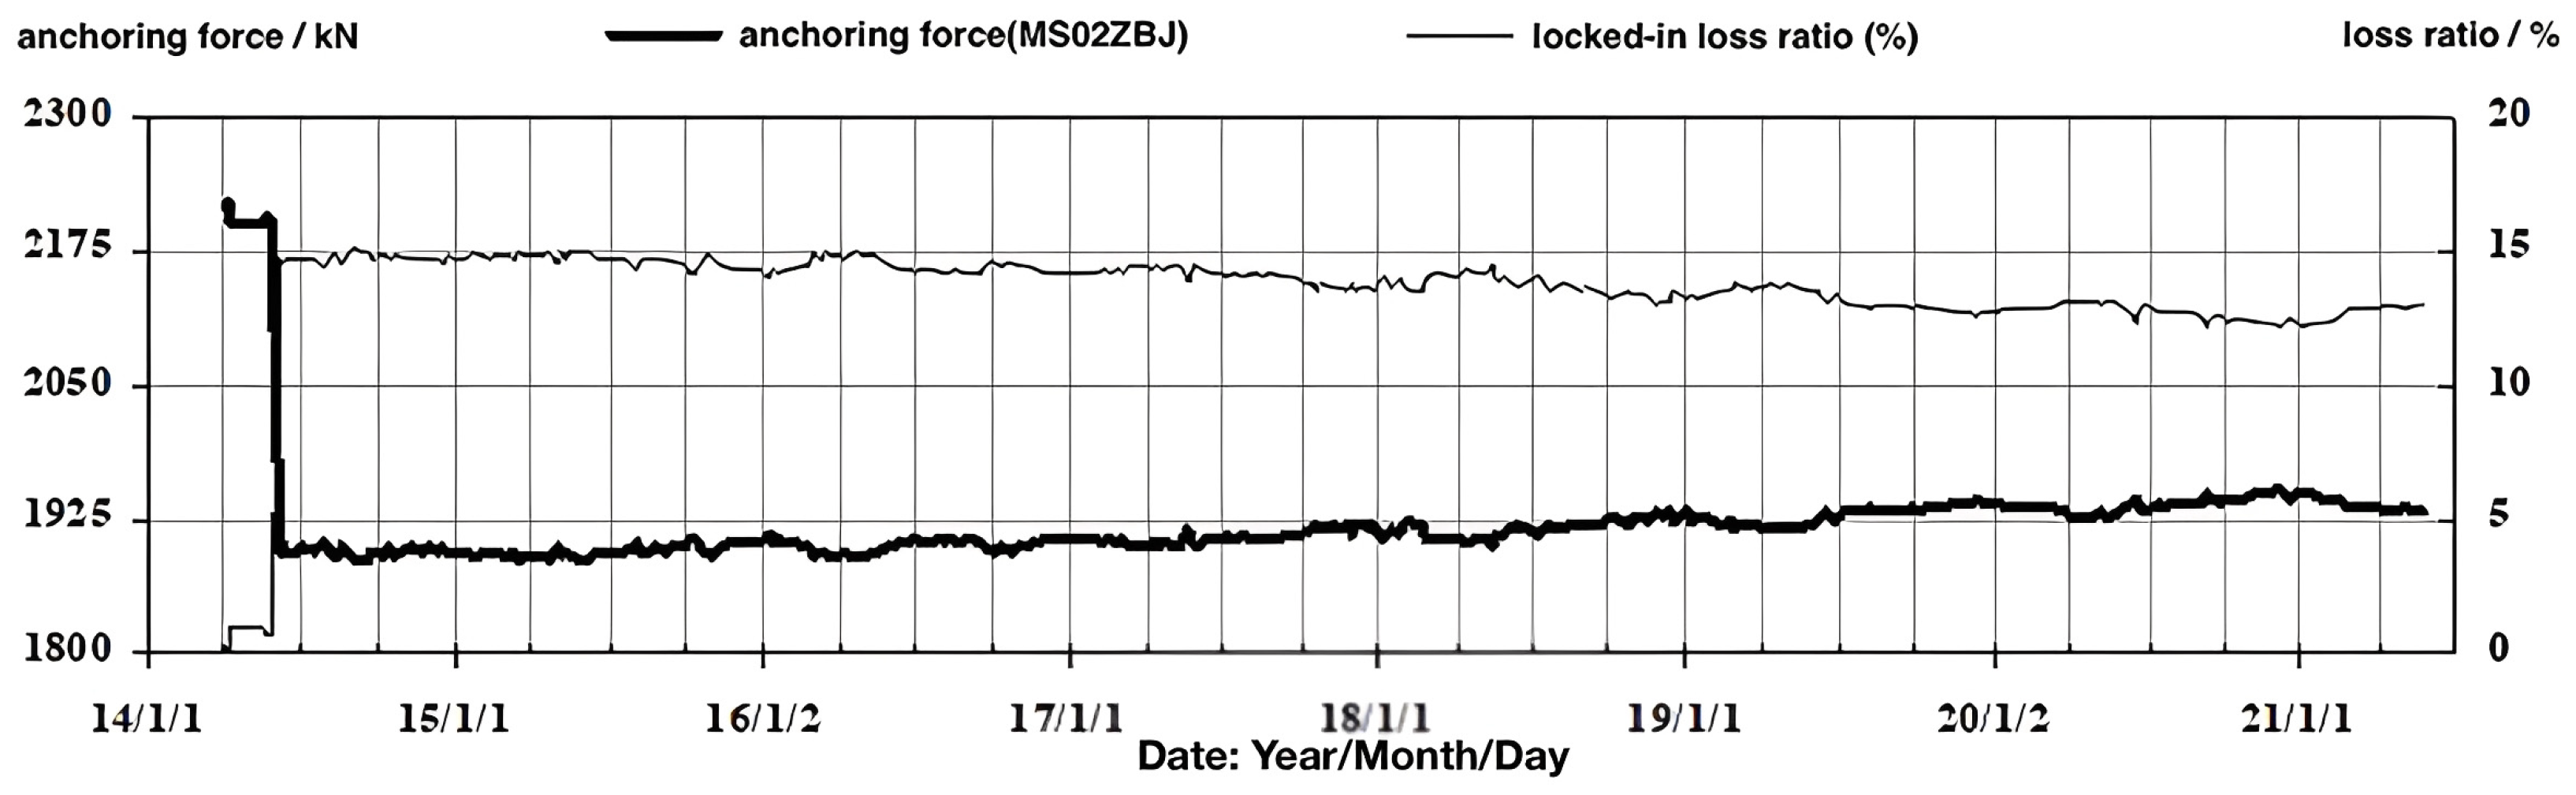
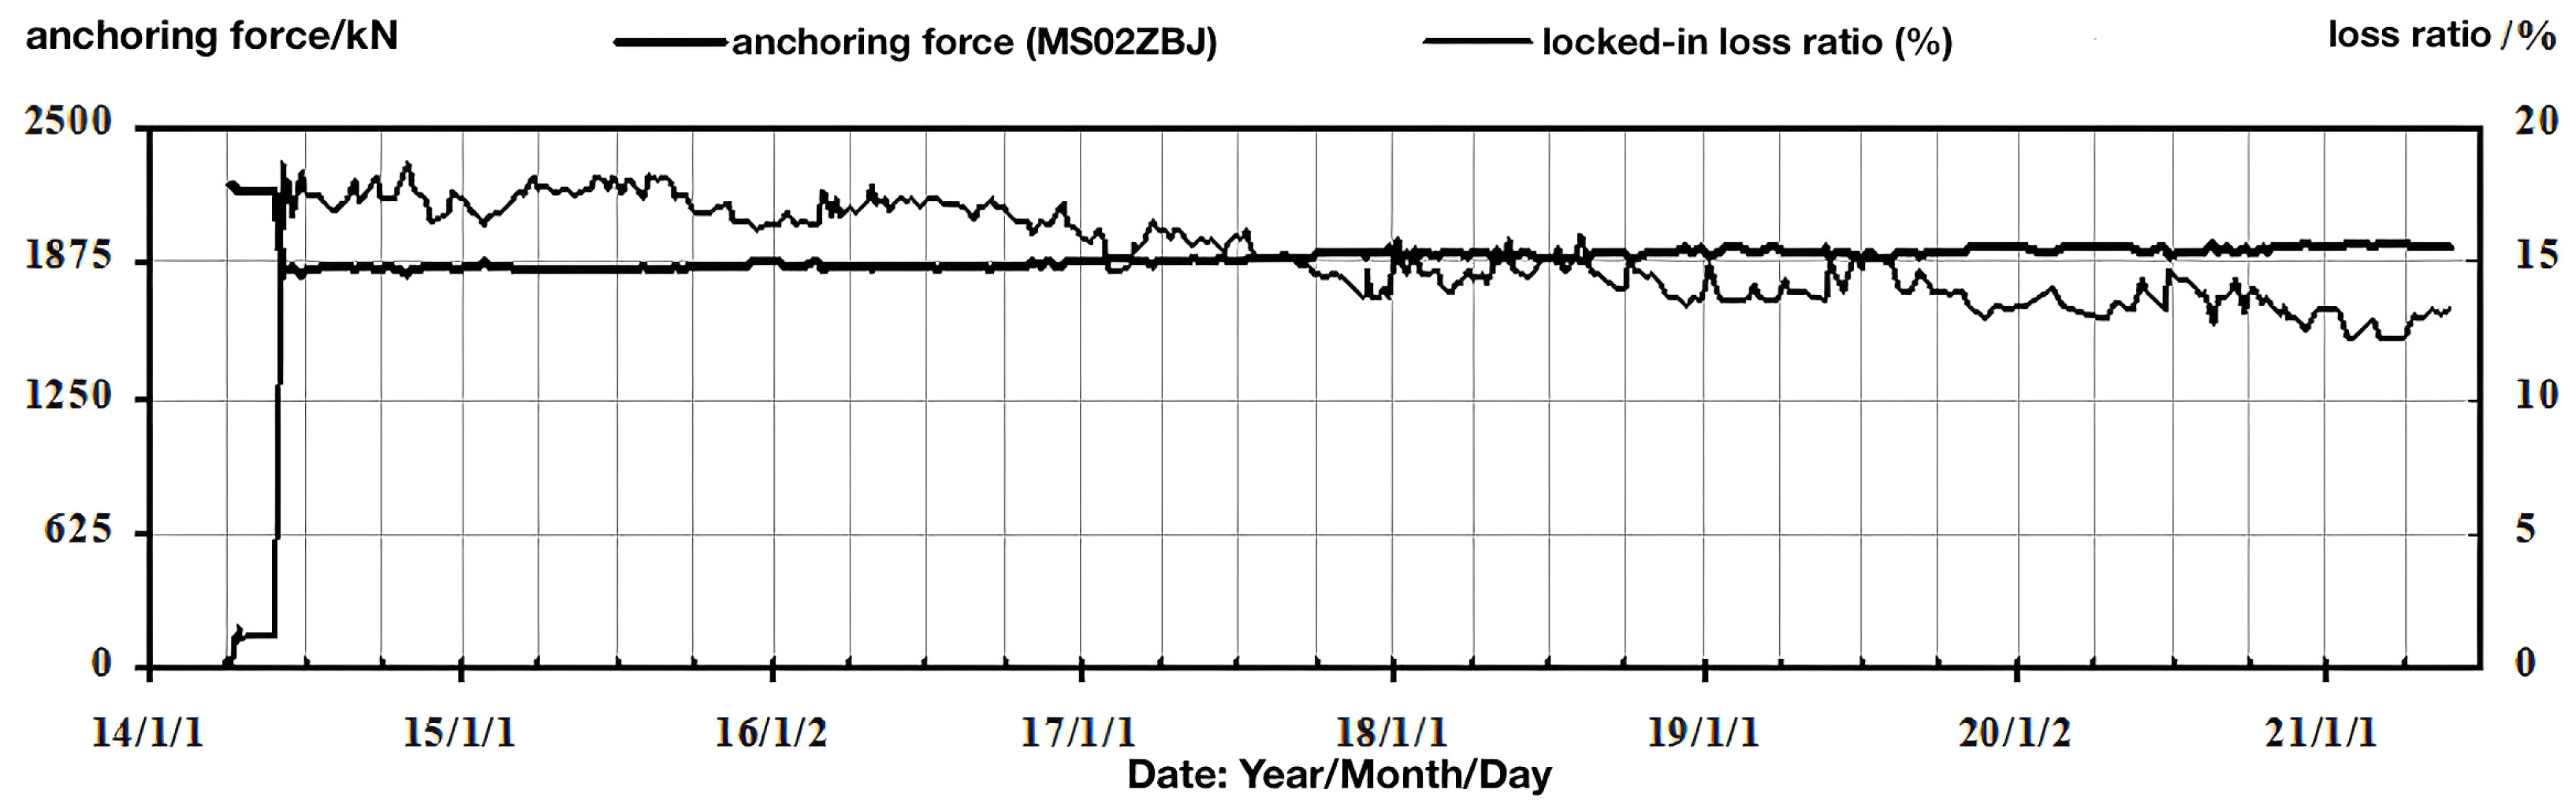
A total of 31 anchor cable load cells were installed on the left bank shoulder slope of the dam, and the measured anchoring force and loss rate data of typical measurement points are shown in
Figure 13 and
Figure 14. Based on the monitoring data for the anchor cable’s anchoring force, the range of loss rates for the anchor cables at the left bank shoulder slope of the dam is 0.2% to 20%. As of 26 May 2021, the post-locking loss rate range was −3.9% to 13.2%, with the maximum loss rate being 13.2% (MS05ZBJ, cross-section 2-2, elevation of 1030 m) and the maximum increase rate of the anchoring force being 3.9% (MS16ZBJ, between 1030 m and 988 m, at cross-section 2-2). The anchoring force and loss rate of the anchor cables have remained stable after the slope excavation and support. Compared with before water storage on 26 May 2021, the increment of the anchoring force was −83.4 kN to 39.5 kN, while the increment of the loss rate was −2.1% to 4.1%, with minor changes in anchor cable loads; the slope anchor cable loads have converged.
Monitoring of the left bank abutment slope was conducted using surface displacement monitoring points, multi-point displacement gauges, anchor rod stress gauges, and cable force gauges. The results indicate minimal displacement in all directions, confirming slope stability. Surface slope deformation remains negligible, with stable conditions post-excavation and minimal cumulative rock mass deformation increments. Anchor stress levels are low and stable, showing minimal variation post-support installation. The anchor force and loss rates fall within acceptable ranges, while cable load variations are small and convergent. Overall, the left abutment shoulder slope exhibits stable behavior.
4.2. Right Bank Shoulder Slope
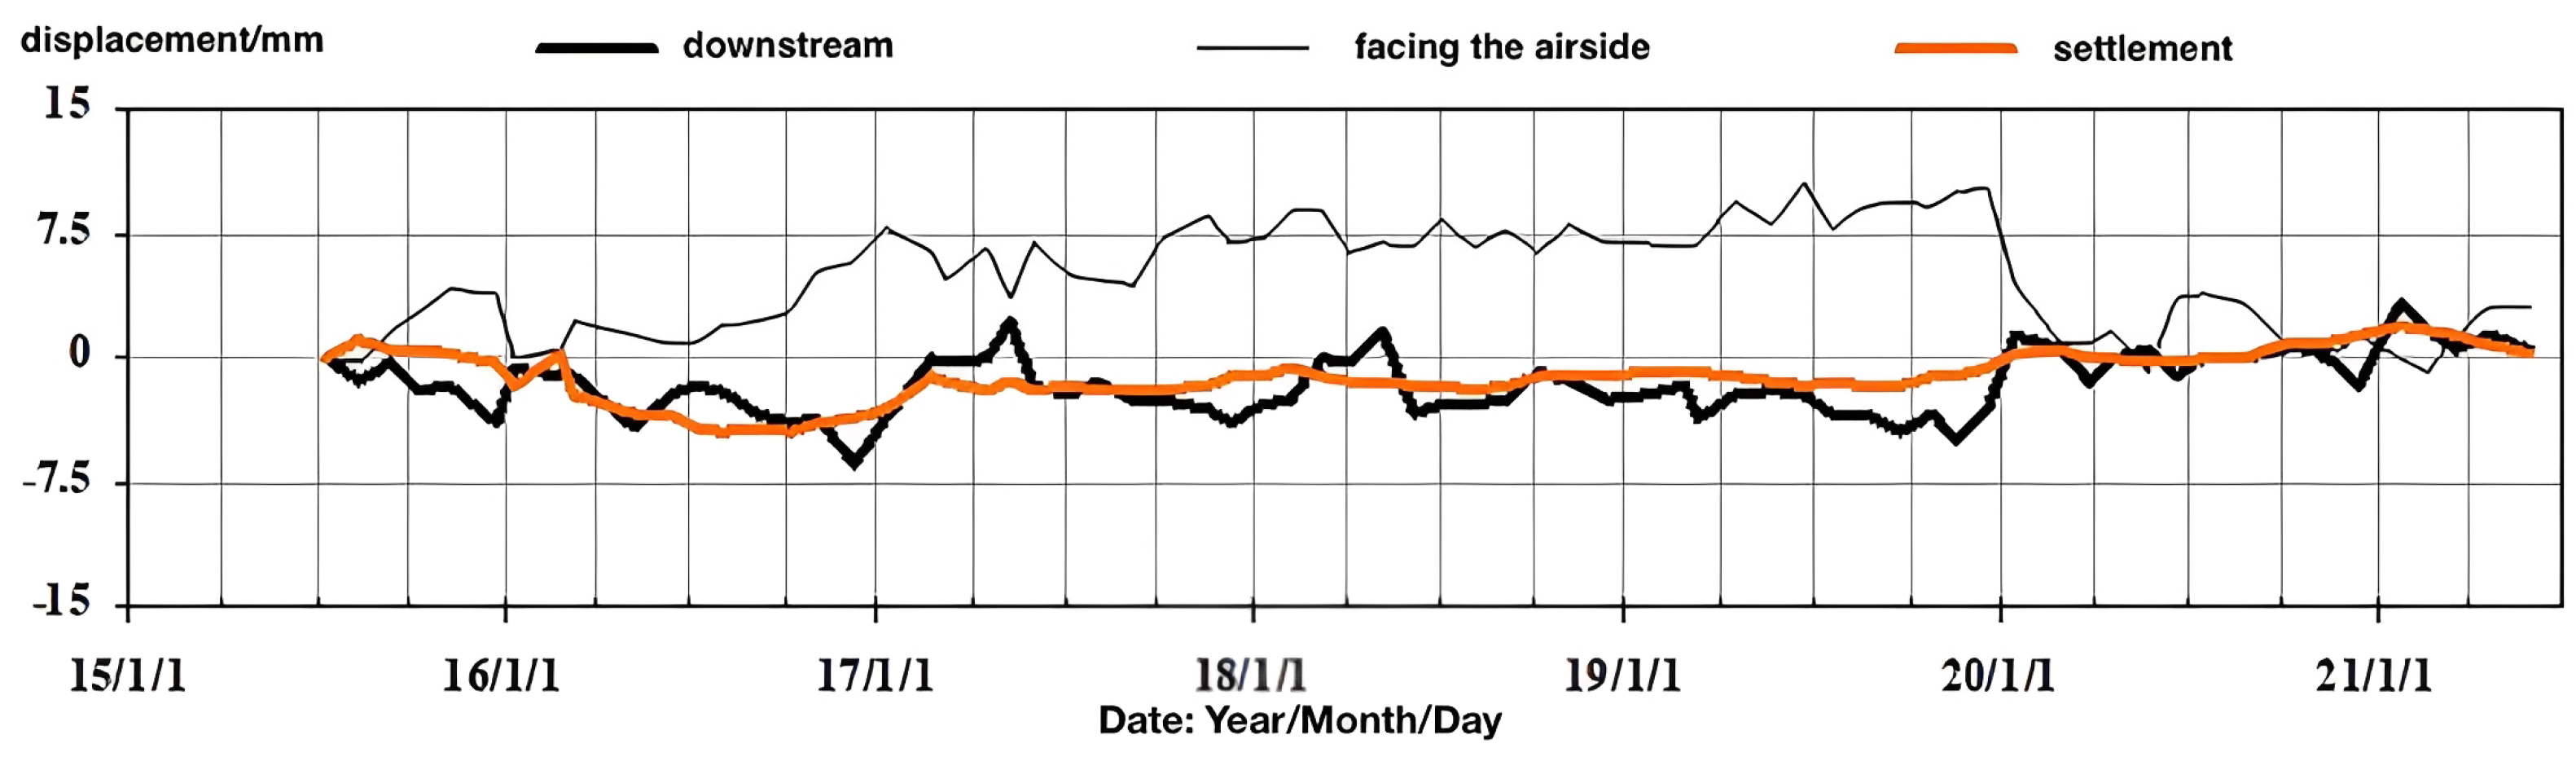
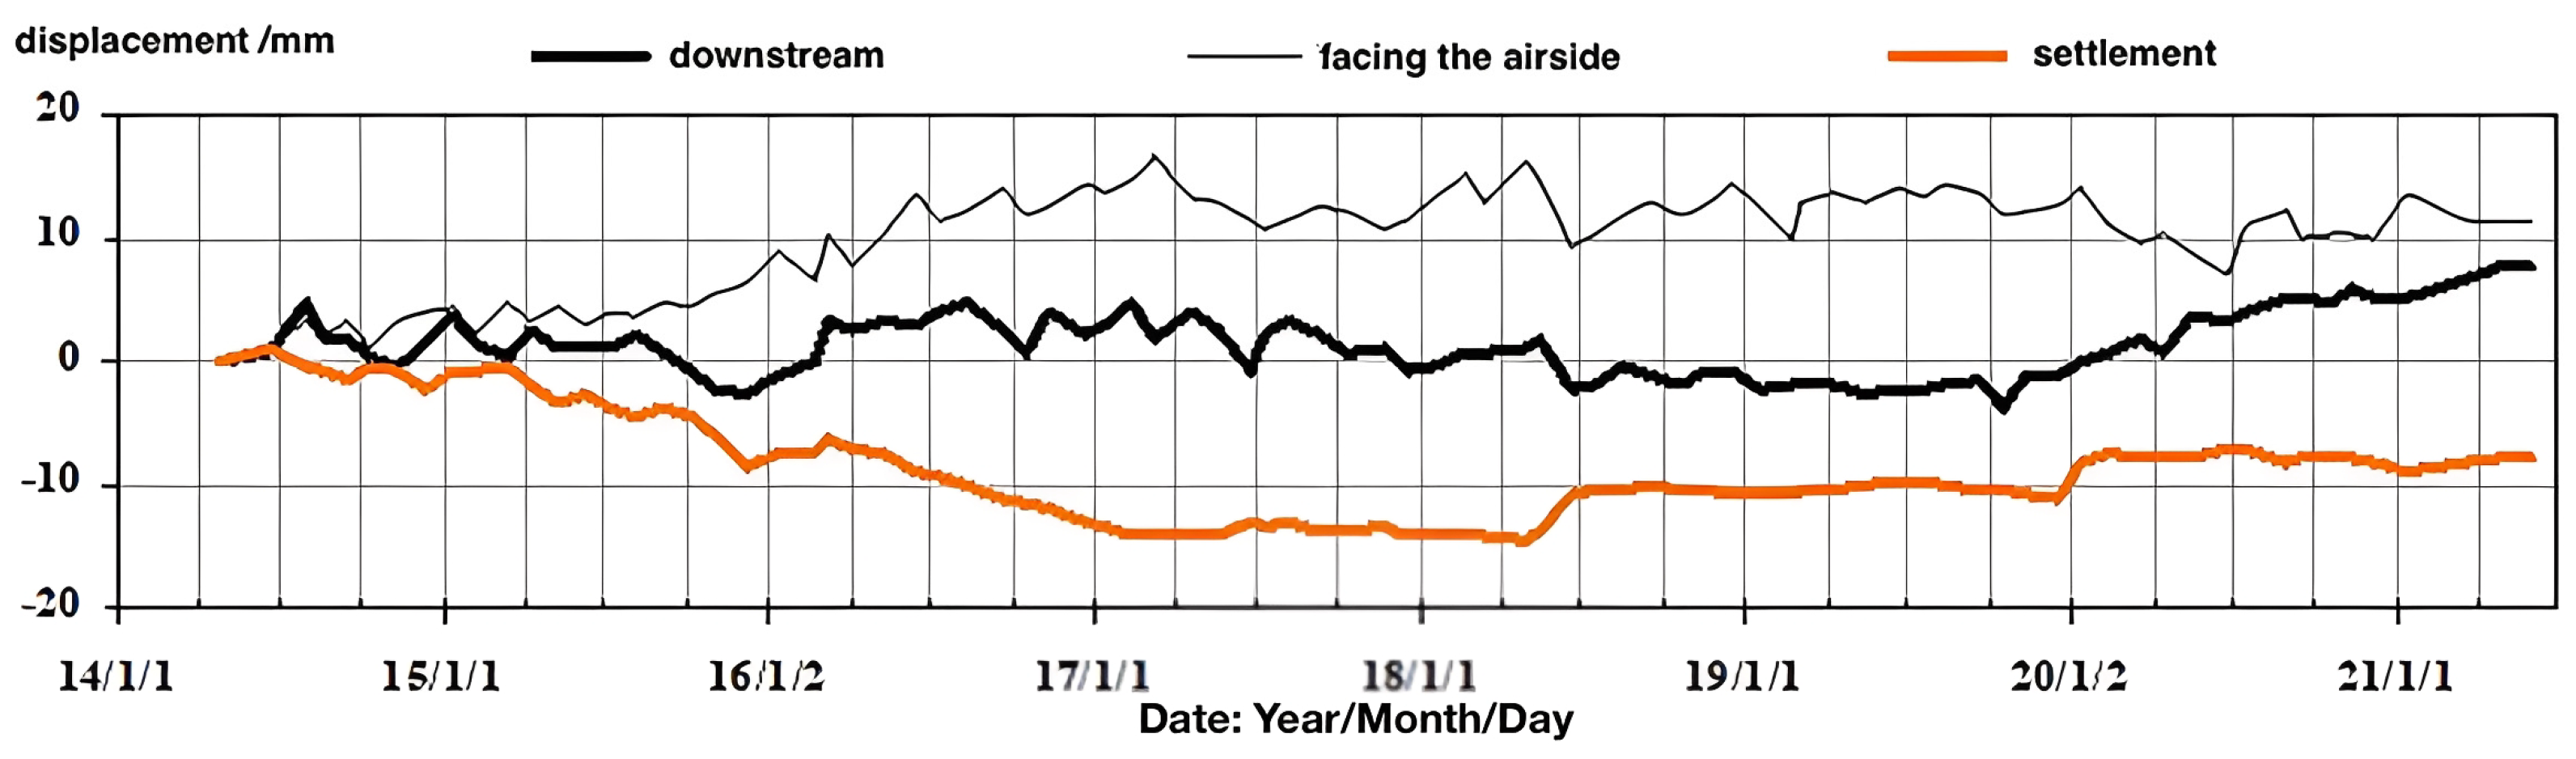
A total of 26 displacement measurement points are arranged on the right bank shoulder slope of the dam, with 14 points currently being monitored. The displacement process lines of typical measurement points can be seen in
Figure 15,
Figure 16 and
Figure 17. Similarly, in the X direction, downstream displacement is positive; in the Y direction, the displacement toward the valley slope is positive; and in the H direction, subsidence is positive, while in the opposite direction, it is negative.
- (1)
The final measured values of all measurement points indicate that the downstream displacement ranges from 1.3 mm to 14.6 mm, the displacement towards the valley cliff ranges from 0.4 mm to 23.0 mm, and the settlement ranges from −9.5 mm to 2.2 mm.
- (2)
The measurements from the 14 surface displacement measuring points indicate that compared with before water storage (14 January 2020), the downstream displacement increment ranges from −1.3 mm to 8.5 mm, the displacement increment towards the valley cliff ranges from −2.9 mm to 3.6 mm, and the annual settlement increment ranges from −0.7 mm to 5.0 mm.
- (3)
The displacement of each measuring point downstream does not exceed 14.6 mm, the displacement towards the valley cliff does not exceed 23.0 mm, and the settlement does not exceed 2.2 mm, all indicating relatively small displacements. The increase in displacement towards the valley cliff at each measuring point does not exceed 3.6 mm, which is also a small increment, indicating the overall stability of the slope.
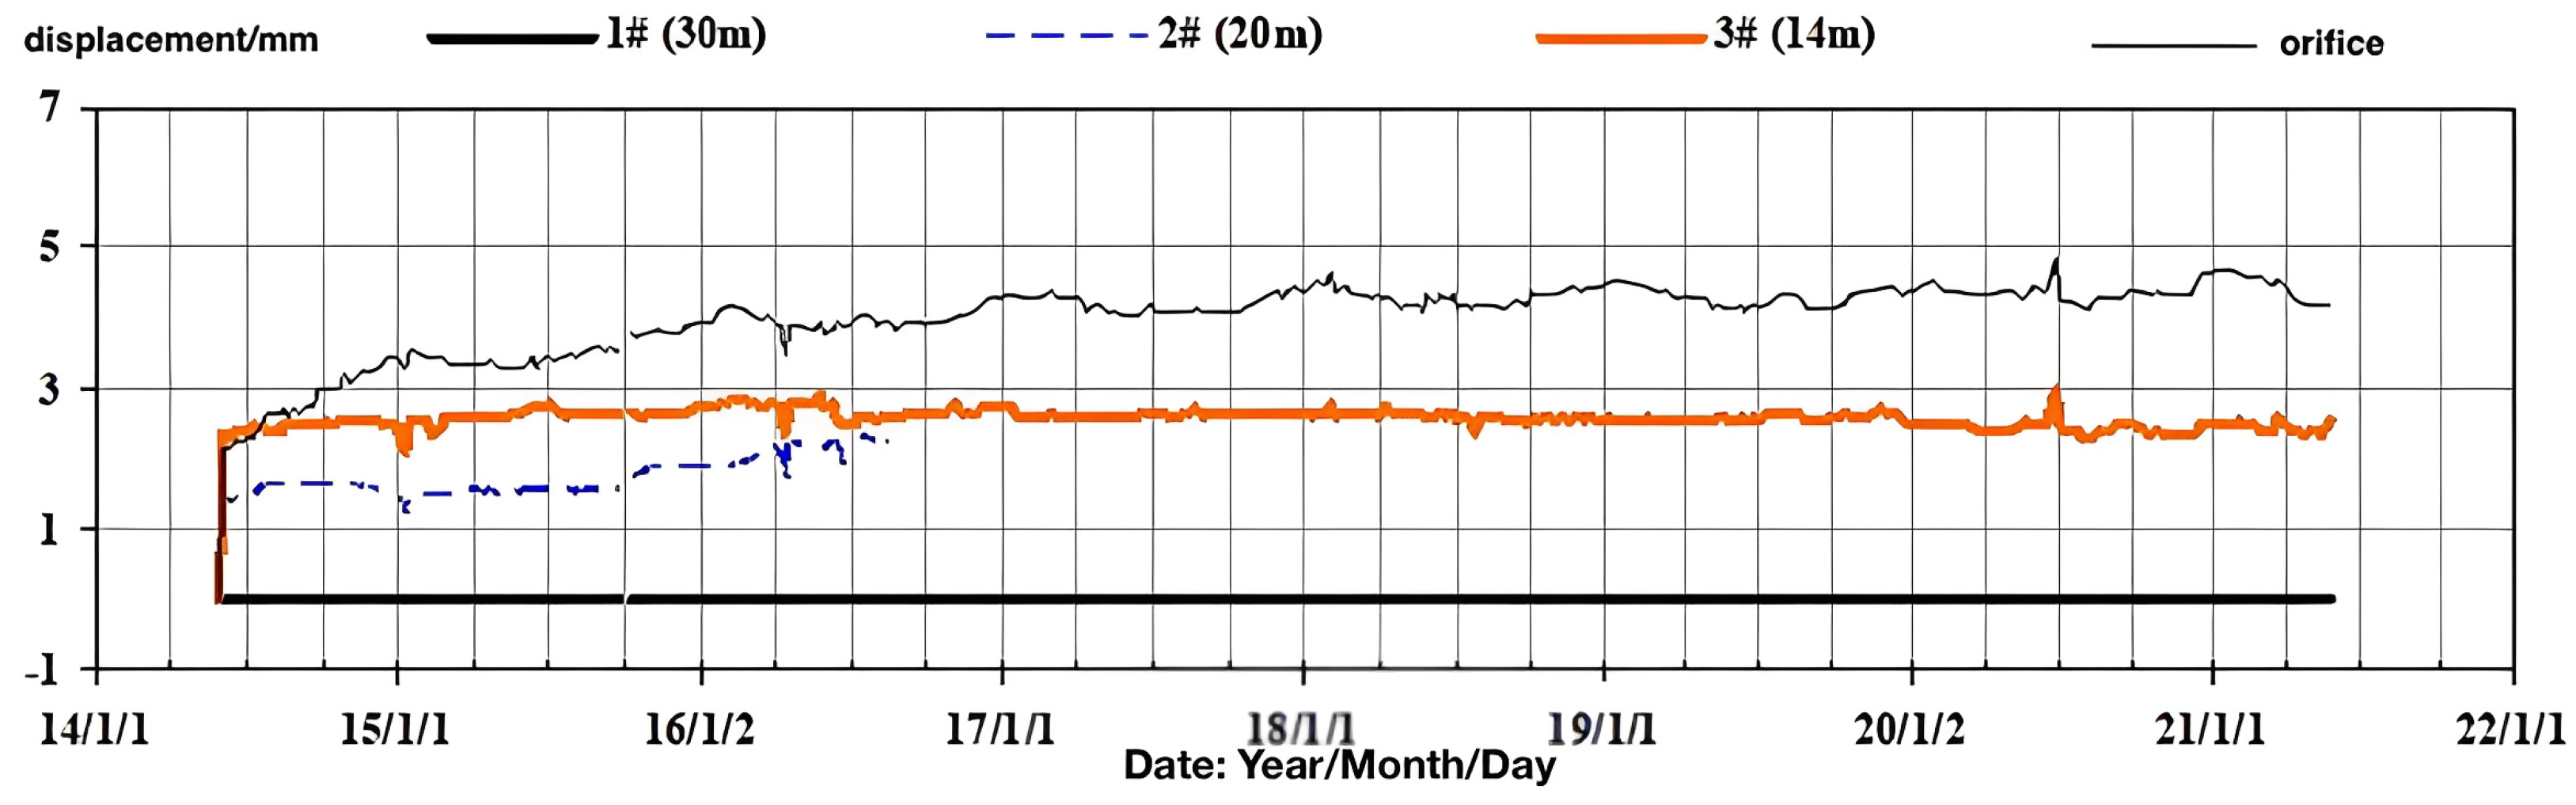
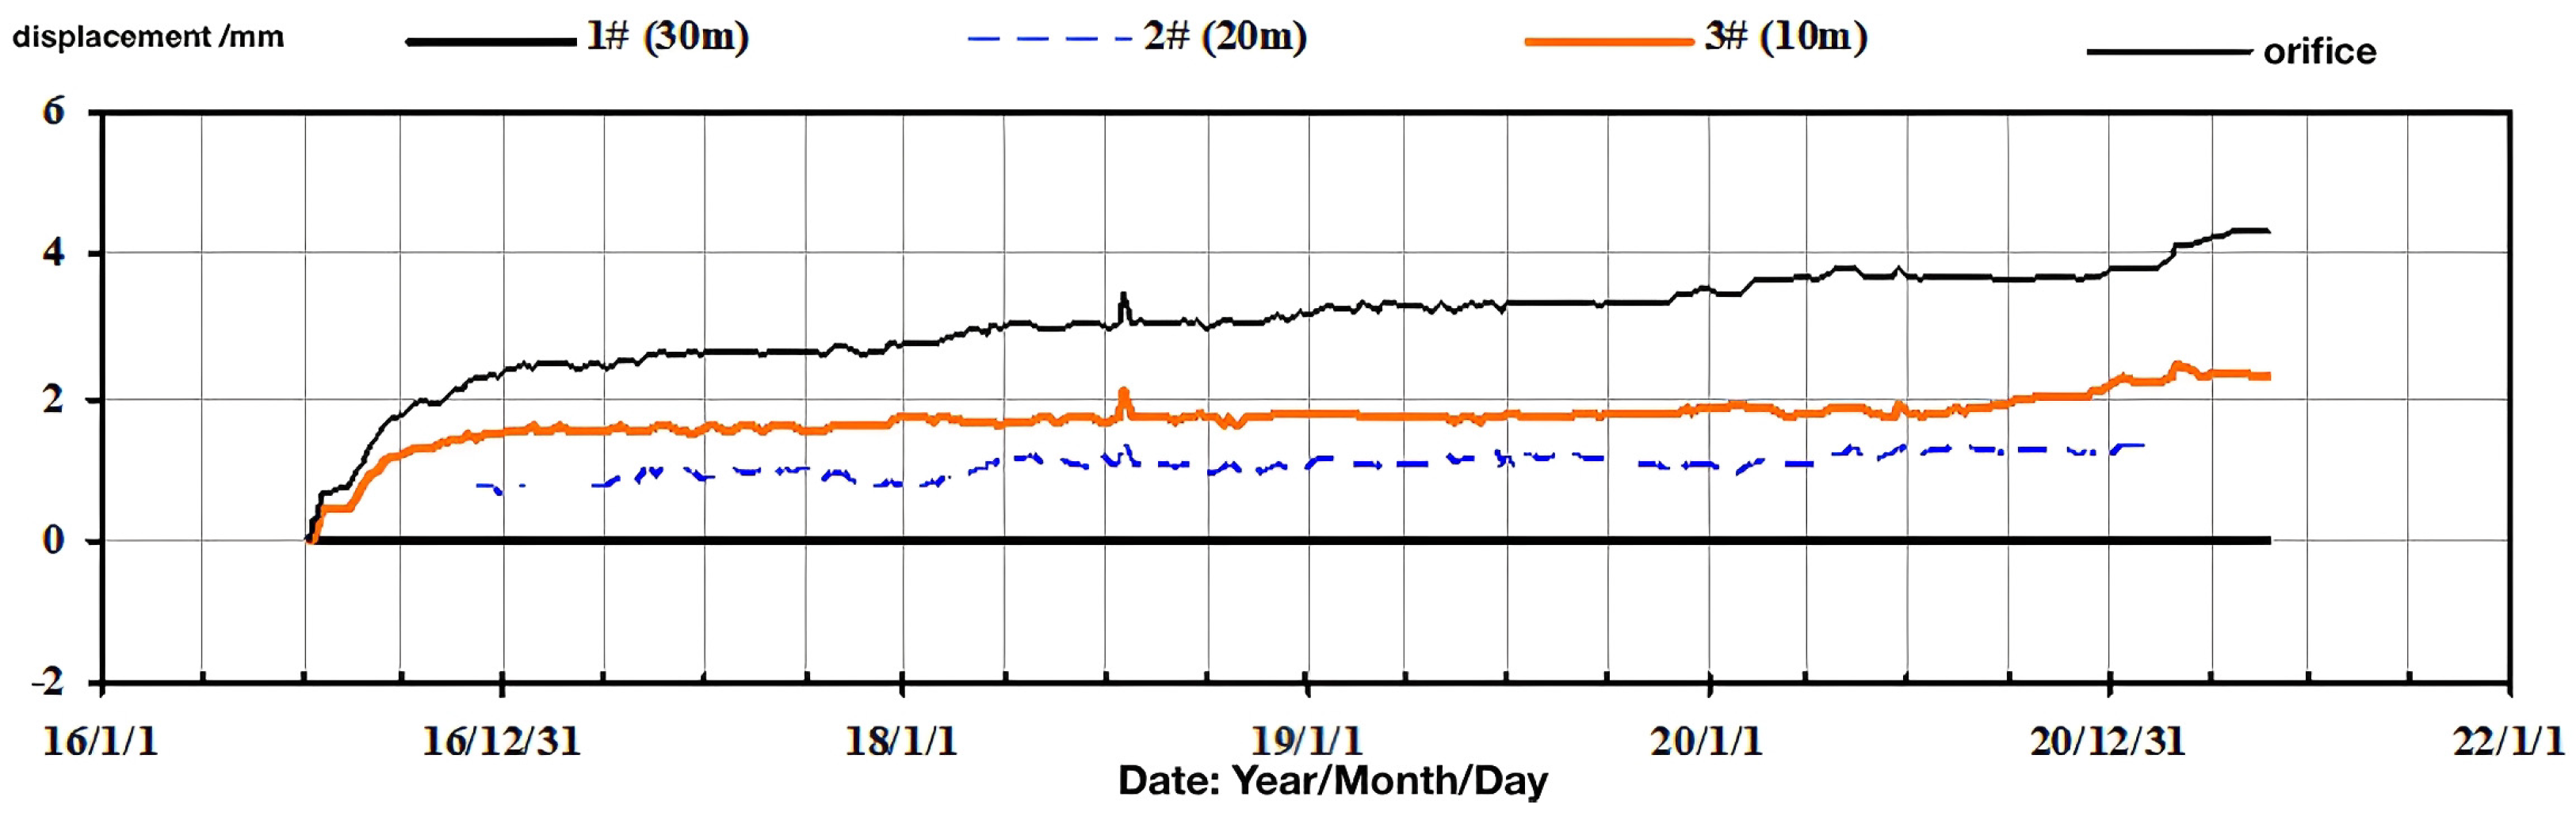
A total of 21 sets of multi-point displacement gauges were installed on the right bank shoulder slope of the dam (including 3 sets of the 4-point type, 1 set of the 6-point type, and 17 sets of the 3-point type), and the deformation process lines of the most commonly measured points of the rock mass are shown in
Figure 17. On 26 May 2021, the displacement range of the multi-point displacement gauge openings on the right bank shoulder slope of the dam toward the unsupported surface was −2.0 mm to 4.5 mm, indicating relatively small deformation. The cumulative deformation of the rock mass on 26 May 2021, increased by −1.4 mm to 1.9 mm compared with before water storage, which is a small increment. After the excavation and support of the slope were completed, the rock mass deformation stabilized without any abnormalities.
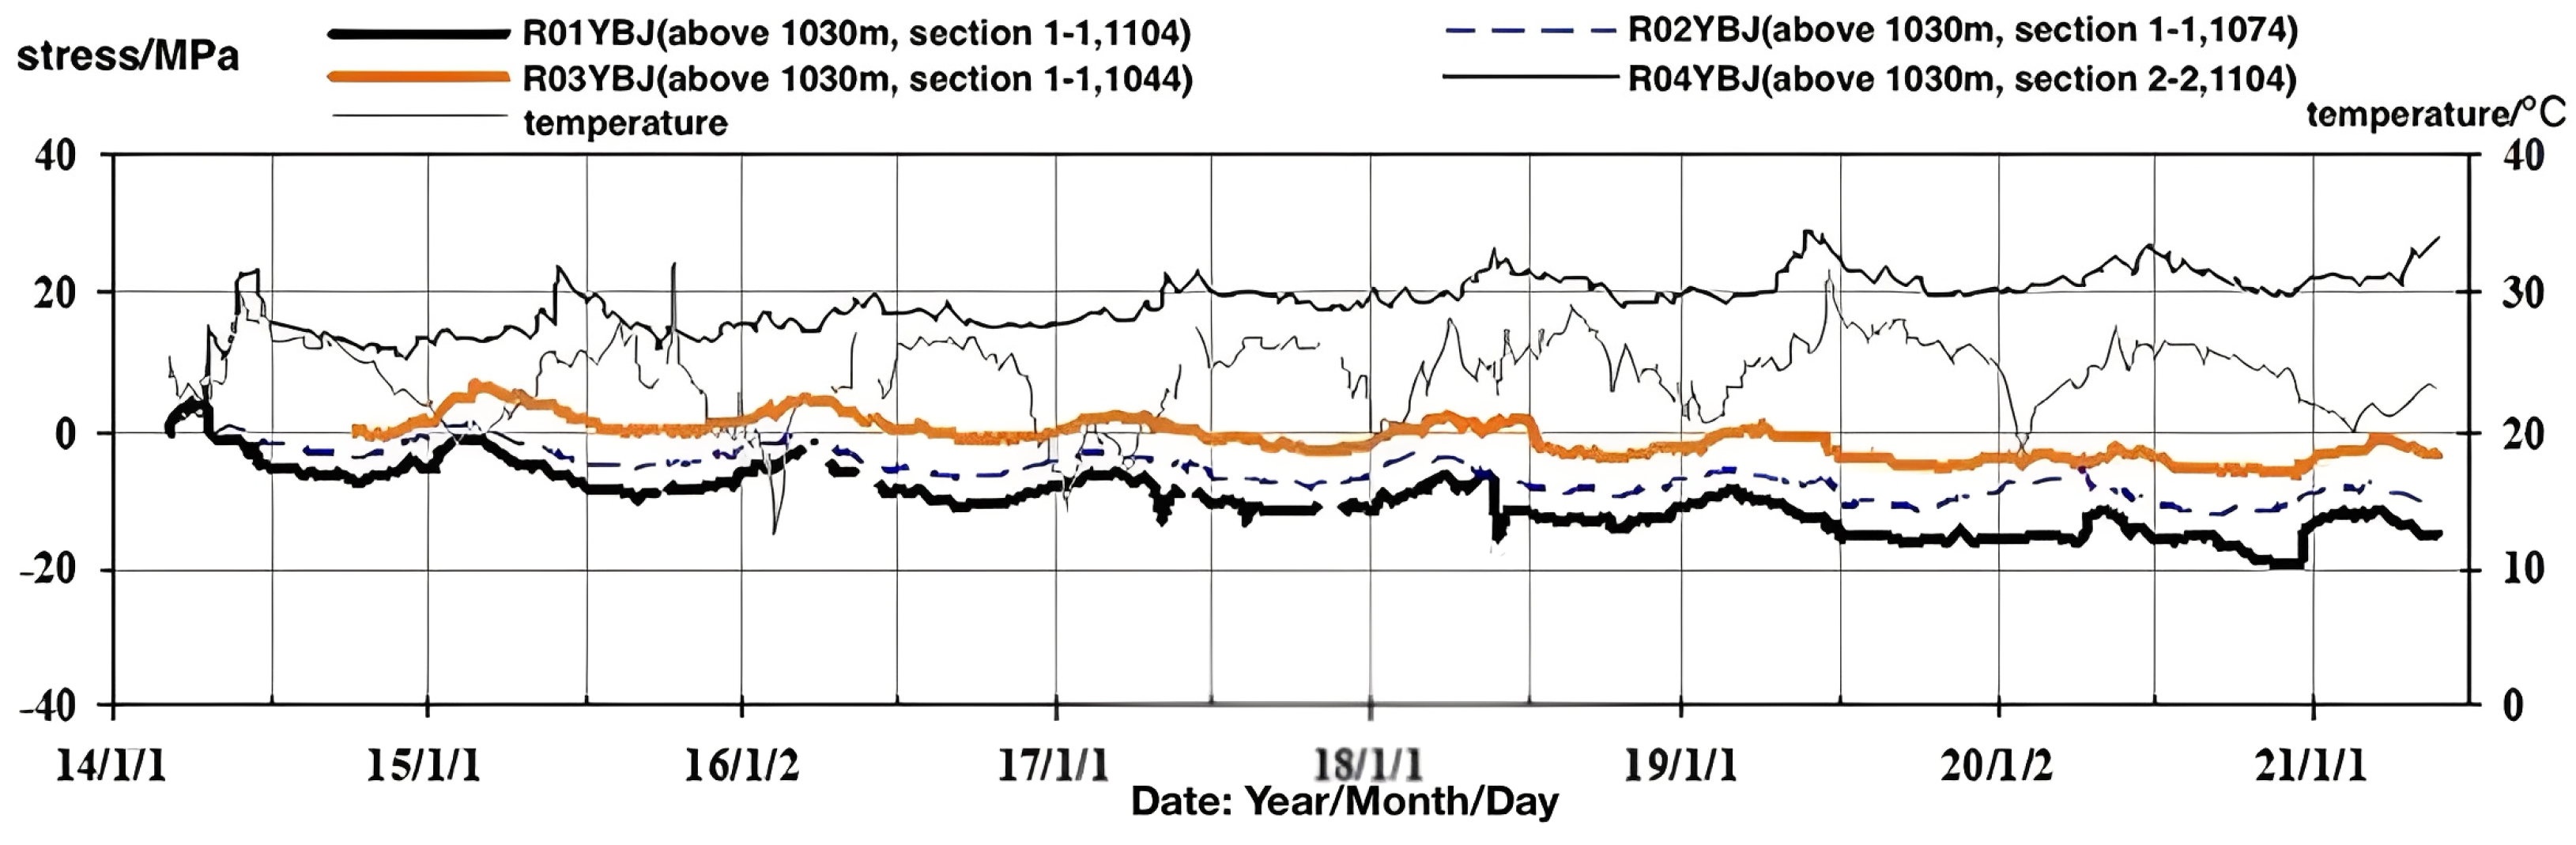
A total of 28 strain gauges were installed on the right bank shoulder slope, with measurements being taken from 27 of them. The typical stress process curve at the anchor rod measurement points is shown in
Figure 18. As of 26 May 2021, the stress range of the anchor rods on the right bank shoulder slope was −34.3 MPa to 46.4 MPa, with all measurement points showing low stress levels. After the installation of excavation support for the hill, the stress measurements became stable. The change in measurements before and after water retention ranged between −54.1 MPa and 10.2 MPa, with minimal fluctuations and stability in the readings.
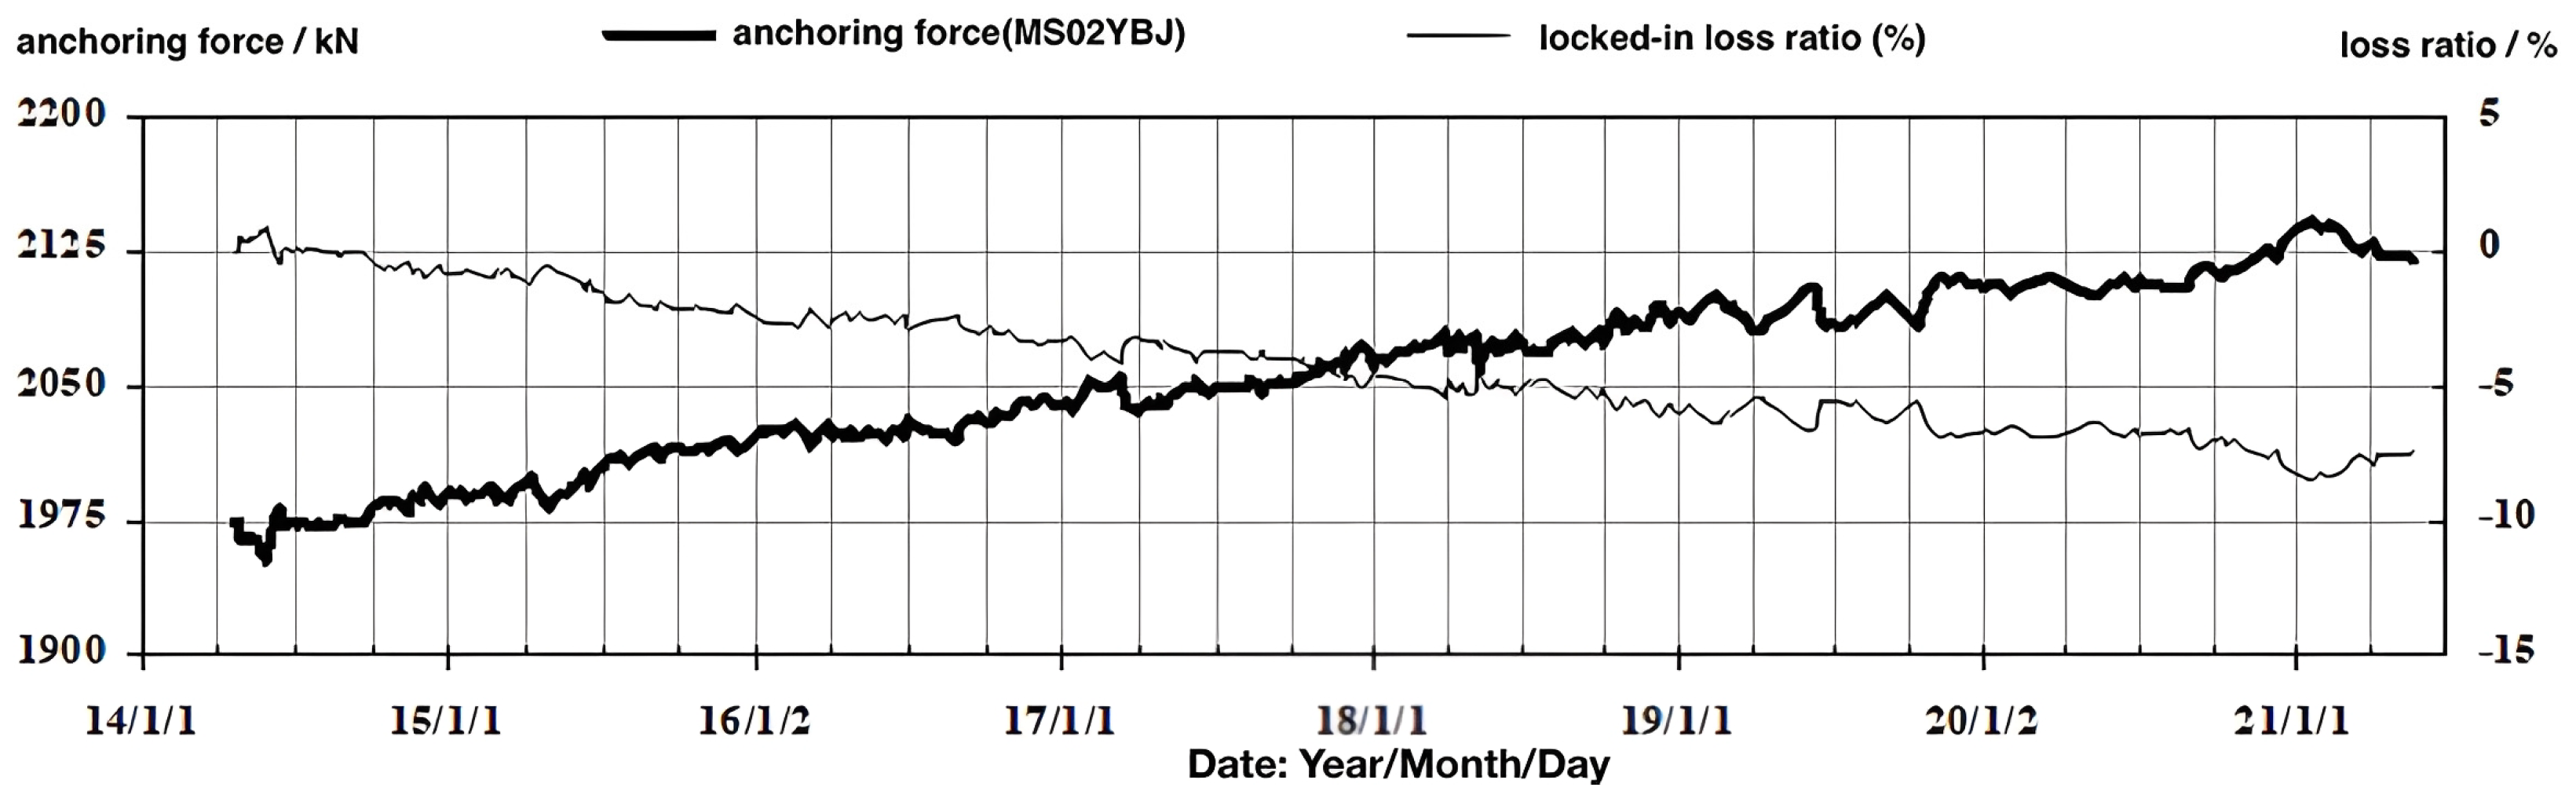
A total of 21 anchor cable force gauges were installed on the right bank shoulder slope, with the actual measured values of the anchorage force and loss rate for typical measurement points being shown in
Figure 19 and
Figure 20. The loss rate range for the locking of anchor cables on the right bank shoulder slope is 4.9% to 15.9%. On 26 May 2021, the loss rate after locking was within the range of −7.4% to 9.2%, with a maximum loss rate of 6.9% (MS03YBJ, above an elevation of 1030 m in section 1-1), and the maximum increase in the rate of anchorage force was 9.2% (MS13YBJ, below an elevation of 988 m in section 1-1). The anchorage force and loss rate of the anchor cables remained stable after the excavation and establishment of support for the slope were completed. Compared with before water storage, the increment in anchorage force was from −31.7 kN to 81.9 kN, while the increment in the loss rate was between −4.3% and 1.6%. The load variation in the anchor cables was relatively small, with the slope anchor cable load having converged.
During the reservoir filling process, displacement at monitoring points primarily manifested as movement toward the river valley and settlement. These changes were closely related to the filling stage, water level rise, monitoring point elevation, and hydrogeological conditions of the rock mass. The displacement profile reflected the progressive deformation adjustment of the rock mass under the filling load, which is consistent with the typical response characteristics of high slopes and dam foundations under reservoir water pressure.
Monitoring results from the right abutment slope indicate that the displacement, stress, and anchor cable lock loss rate all remain within safe limits, confirming overall slope stability. Displacement changes are minimal, anchor cable loads have largely converged, and rock mass deformation characteristics align with typical responses observed in high-arch dam abutment slopes during impoundment. Monitoring data indicate that the slope exhibits progressive deformation adjustment under impoundment loading, which is consistent with the anticipated stability and safety levels.
5. Discussion
The deformation characteristics of shoulder slopes in high-arch dams exhibit complexity and diversity [
7,
27,
28]. During reservoir impoundment, significant deformation occurs in these shoulder slopes, as has been confirmed by monitoring data from multiple Chinese high-arch dams (e.g., Jinping I [
29,
30], Xiluodu Hydropower Station, Baihetan Hydropower Station [
31], Sanhekou Reservoir Arch Dam [
32], and Shimenzi Roller-Compacted Concrete (RCC) Arch Dam [
33,
34,
35]. This deformation typically manifests as valley contraction, where the slopes on both sides of the dam move toward the river valley, with lateral displacements reaching tens of millimeters [
36,
37]. For instance, by October 2018, a specific arch dam project recorded a valley-narrowing lateral displacement of 89.54 mm [
37]. Research indicates that dam and foundation deformation constitutes irreversible plastic deformation that is closely linked to the impoundment process [
35]. Studies have also revealed unexpected upstream displacement in some ultra-high-arch dams during initial impoundment, alongside observed downstream dam deformation values that are significantly lower than numerical simulation results [
38].
Based on the displacement variation curve of the surface monitoring points, it can be observed that the displacement variation in the left abutment slope exhibits significant fluctuations before and after impoundment, stabilizing after impoundment is completed. Among these, deformation toward the free face is greater than settlement and downstream deformation, indicating that the abutment rock mass tends to compress toward the free face and exhibit increased settlement and downstream deformation under initial impoundment effects.
Therefore, the deformation of the abutment slope is primarily caused by impoundment and remains within a reasonable range. The magnitude of deformation varies across different elevation levels, with greater deformation occurring closer to the water level. As the elevation increases, the coordination effect of rock deformation manifests as a decrease in deformation amplitude. Following the completion of impoundment, some deformation rebound occurs during water level fluctuations.
Anchor stress gauges monitor the stress state of the slope anchoring system, with their changes directly reflecting the load transfer from rock mass deformation to the support structure. Monitoring of anchor stress and cable anchorage force indicates that impoundment generates significant compressive stress in the dam shoulder slope’s rock mass, meaning that reservoir water level fluctuations exert loading and unloading effects on the rock mass. During impoundment, the rising water level in the reservoir primarily affects anchor stress through the following mechanisms: (1) Hydrostatic pressure: Reservoir water exerts thrust on the slope surface, pushing rock mass toward the free face and increasing the tensile stress on anchors. (2) Seepage pressure and rock softening: Rising water levels alter the groundwater flow field, increasing the joint water pressure while reducing effective stress. This weakens the rock strength, increases deformation, and consequently elevates anchor loads. (3) Rock mass stress redistribution: Changes in valley loads caused by impoundment lead to the redistribution of slope stress. This may cause potential slip surfaces to shear, leading to anchor bolts bearing additional shear or tensile forces. The impoundment phase exhibits a clear temporal correlation with anchor stress changes, with stress transition points typically coinciding with rapid water level rises.
6. Conclusions
According to the monitoring data on the surface displacement, rock deformation, anchor bar stress, and anchor cable anchorage force of the embankment shoulder before and after the reservoir of Wudongde Hydropower Station was filled, there were no abnormal changes in deformation and stress of the embankment shoulder, and the reservoir is overall in a stable state. The specific conclusions are as follows:
According to the monitoring data on surface displacements on the dam shoulder slopes before and after the reservoir was filled, the maximum surface displacements at various monitoring points near the free face are 5.4 mm for the left bank shoulder slope of the dam and 23.0 mm for the right bank shoulder slope. The deformation of the dam shoulder slopes on both banks is relatively small and remained stable after excavation and installation of supports. The monitoring data on rock mass deformation on the dam shoulder slopes before and after the reservoir was filled indicate that the measurable deformation mainly occurred during the excavation process, with no significant increases in measured displacements after excavation and support installation were completed. There were no abnormal deformations during the reservoir period.
The monitoring results for the anchor rod stress gauge indicate that most measurement points have anchor rod stresses within 50 MPa, reflecting a low stress level. For anchor rod stress gauges exceeding 200 MPa, their measurements generally stabilize within 1 to 4 months after the initial measurement and remain steady. According to the measured data from the tension meter, most of the prestress loss rate after locking is within the range of ±15%, with changes in anchoring force primarily occurring during the slope excavation process and before the establishment of support was completed. A few gauges show significant increases in anchoring force but are mainly concentrated in areas with poor geological conditions, unloading zones, and locations with large deformations. Compared with before water storage, the changes in anchoring force and loss rate are relatively small. Overall, prestress changes mainly occur during the slope excavation process, while the anchoring forces of the anchor cables remain stable after the excavation and during the water storage process.
In summary, the deformation of shoulder slopes in high-arch dams is a complex process involving the coupled effects of multiple factors. Research in this area encompasses geological investigations, field monitoring, numerical simulations, theoretical analysis, and advanced machine learning methodologies. Future studies should continue to deepen our understanding of deformation mechanisms under complex geological conditions and multi-field interactions, while developing more precise and intelligent prediction and assessment models to ensure the long-term operational safety of high-arch dams.