Article

Interpretable Ensemble Learning with Effective Binder Formalism, Hyperbolic Hydration Kinetics, and Fickian Service-Life Projection for Grey Relational Pareto Optimization of Quaternary SCBA–GGBS–Zeolite–Nano-Silica Cementitious Systems


by
Kavindra Singh Dhami
1 and
Praveenkumar Thaloor Ramesh
2,*
1
Department of Civil Engineering, Graphic Era Deemed to be University, Dehradun 248002, India
2
Department of Civil Engineering & Center for Excellence in Research, Rajalakshmi Engineering College, Chennai 602105, India
*
Author to whom correspondence should be addressed.
Buildings 2026, 16(18), 3573; https://doi.org/10.3390/buildings16183573
Submission received: 14 July 2026 / Revised: 19 August 2026 / Accepted: 1 September 2026 / Published: 8 September 2026
(This article belongs to the Section Building Materials, and Repair & Renovation)

Abstract

The construction industry’s dependence on ordinary Portland cement (OPC) makes low-carbon binder systems an urgent priority; yet, the nonlinear interactions among multiple supplementary cementitious materials (SCMs) and nanomaterials complicate rational mix design. This study fuses explainable artificial intelligence (XAI) with a hierarchy of closed-form mathematical formalisms and an experimental durability programme for a quaternary sustainable concrete in which OPC is partially replaced by sugarcane bagasse ash (SCBA, 40 kg/m3), ground granulated blast furnace slag (GGBS, 60 kg/m3), natural zeolite (20 or 40 kg/m3) and nano-silica (0–20 kg/m3) at a constant water–binder ratio of 0.45. Thirteen mixes were tested for compressive and flexural strength, rapid chloride penetration (RCPT) and sulfuric acid resistance at 7, 28 and 56 days. The optimum blend (12 kg/m3 nano-silica) reached 45.0 MPa at 28 days, 49.5% above the control, while reducing chloride charge by 70% and acid mass loss by 65%. Information theoretic discrimination among three competing hydration kinetics laws selects the hyperbolic rate model with an Akaike weight of 1.000 (ΔAICc > 32), showing the blend raises the ultimate strength ceiling by 46% while delaying half-strength by only two days. Within this mix series, effective binder (k-value) analysis indicates that, at low dosage, one kilogram of nano-silica contributes 28-day strength broadly comparable to that of several tens of kilograms of OPC (a dataset-specific, dose-dependent estimate rather than a general mass equivalence), and three independent estimators—the experimental peak, the response surface stationary point (12.8 kg/m3) and the marginal efficiency zero (13.2 kg/m3)—converge on an optimum nano-silica dosage of 3.0–3.3% of binder. Principal component analysis compresses the six-dimensional strength–durability response into a single latent statistical axis (interpreted as an indicator of pore connectivity) carrying 91.5% of the variance, and a Fickian error function solution seeded by Berke–Hicks conversion of RCPT charge projects a 3.4-fold extension of the chloride-initiation service life (36.7 versus 10.8 years at 50 mm cover). Six machine learning models were benchmarked; extremely randomized trees performed best (R2 = 0.9905, RMSE = 0.920 MPa; leave-one-out R2 = 0.986; bootstrap 95% CI on R2 [0.981, 0.996]), and SHAP force plot attributions were triangulated with Sobol global sensitivity indices (curing age 75.4%, nano-silica 23.1% of output variance) and response surface significance tests. The optimized mixes cut embodied CO2 by 26–32% and improve eco-strength efficiency 2.1-fold; grey relational analysis over six strength, durability and carbon criteria ranks the 12 kg/m3 nano-silica mixes first. The framework demonstrates how interpretable machine learning, information theoretic model selection, diffusion theoretic service-life projection and experimental durability evidence can be unified into a transparent, physically validated basis for sustainable concrete mix design.

1. Introduction

The construction industry is one of the largest consumers of natural resources and a major contributor to global greenhouse gas emissions, primarily carbon dioxide, owing to the extensive use of ordinary Portland cement (OPC). Cement production is responsible for around 7–8% of global carbon dioxide emissions [1]. These emissions arise mainly from the calcination of limestone and the combustion of fossil fuels during clinker manufacture, making cement one of the most carbon-intensive constituents of concrete. Coupled with the large-scale extraction of raw materials and aggregates, this places the sector at the centre of global efforts towards resource efficiency and low-carbon construction. This makes the development of sustainable alternatives with reduced environmental impact while retaining mechanical and durability properties imperative. The use of supplementary cementitious materials (SCMs) and industrial by-products has been recognized as a promising approach for the development of eco-friendly concrete with lower embodied energy and better long-term performance, and recent work on solid waste-modified binders for ground and structural applications further illustrates the potential of waste-derived cementitious systems [2]. There is growing interest in many SCMs due to their pozzolanic and latent hydraulic properties, such as sugarcane bagasse ash (SCBA), ground granulated blast furnace slag (GGBS) and natural zeolite.
Sugarcane bagasse ash (SCBA) is a waste material produced in large amounts by the sugarcane industry, providing a sustainable waste management route and contributing reactive silica to the cementitious matrix. Recently, the use of the SCBA in concrete as an SCM has been studied in several studies and about 10% cement replacement with SCBA was found to improve durability and mechanical properties as well as to reduce CO2 emissions and costs [3,4,5]. SCBA can refine the concrete microstructure, mitigate alkali–silica reaction, and facilitate the formation of extra C-S-H gel [3].
Durability tests, including the rapid chloride penetration test and water sorptivity, indicate that SCBA significantly improves resistance to chloride penetration and water absorption, enhancing long-term durability [6,7,8,9,10]. In addition, utilization of SCBA in concrete mitigates the environmental issues associated with its landfill disposal. The optimum replacement level is generally reported as 10–20% to balance durability and strength [4,5,11], and SCBA incorporation has been shown to reduce the likelihood of reinforcement corrosion, particularly in marine environments [12]. SCBA therefore acts as a sustainable and effective partial substitute for traditional cement and contributes to eco-friendly construction practice.
GGBS, a by-product of the steel industry, is well-known for its contribution to long-term strength, durability and resistance to aggressive environments [13,14]. Recent research confirms its capacity to enhance the mechanical properties of concrete, including compressive, flexural and tensile strength, at an optimum replacement level of around 40% [15,16,17]. It also improves workability and reduces permeability, enhancing resistance to chloride penetration, sulphate attack and alkali–silica reaction [15,18,19]. The slower early strength development characteristic of GGBS can be mitigated by chemical admixtures such as calcium nitrate [20]. GGBS can be effectively combined with fly ash, recycled aggregates and biochar to produce more sustainable concretes [21,22,23], and its use reduces the carbon footprint while improving long-term performance and durability [20,24,25]. Despite these advantages, the optimum GGBS content must be determined carefully to avoid loss of structural performance [17,26]. GGBS is thus a promising SCM that supports sustainable construction while enhancing concrete performance [15,16,18,24].
Natural zeolite has a high aluminosilicate content and a porous structure that provides ion-exchange capacity and contributes to pore refinement and durability improvement. It is a natural pozzolan that is effective in reducing CO2 emissions through partial replacement of Portland cement [27,28,29]. Studies show that zeolite improves the compressive strength and durability of concrete over time despite a reduction in early strength relative to conventional concrete [28,30,31]. Zeolite addition also enhances resistance to water penetration, chloride ion permeability and freeze–thaw cycling, making it attractive for harsh environments [30,31,32]. However, the high surface area of zeolite increases superplasticizer demand, which can be managed by combining different superplasticizer types [27,30]. Zeolite’s capacity to refine the pore structure reduces porosity and improves mechanical properties [32]. Despite the challenges of reduced workability and slow initial strength gain, the long-term benefits make zeolite a promising alternative material [28,33,34]. The combined use of SCMs and zeolite modifies the hydration mechanism, microstructure and mechanical performance of concrete. In recent years, nano-scale materials such as nano-silica have been introduced to further enhance blended cement systems [35]. Nano-silica acts as a highly reactive pozzolan and nucleation agent, accelerating hydration, refining pore structure and improving the interfacial transition zone (ITZ) between cement paste and aggregate. However, the combined use of multiple SCMs and nanoparticles introduces significant complexity into mix-design optimization, since the resulting mechanical properties are governed by highly nonlinear interactions among material composition, curing conditions and hydration kinetics.
These complex relationships are difficult to capture using traditional empirical and regression-based approaches, which rely on time-consuming trial-and-error experimentation. Machine learning (ML) techniques are therefore now widely used to predict concrete properties, especially compressive, tensile and flexural strength [36,37,38]. ML models predict with high accuracy but are often ‘black boxes’ lacking transparency and interpretability. This limitation is a significant challenge to their adoption in civil engineering practice where understanding the influence of input parameters is essential for quality control, material design and regulatory acceptance.
This gap is addressed by explainable artificial intelligence (XAI) which provides interpretable insights into model predictions. XAI techniques such as Shapley additive explanations (SHAP) [39] quantify feature importance and explain individual predictions, thereby increasing trust, scientific understanding and reliability; SHAP interpretations of concrete strength models have been shown to accord with the known physical behaviour of cementitious systems, validating the causality of ML predictions [36], and SHAP-augmented gradient boosting has been applied to chloride penetration prediction in SCM concretes [37]. In sustainable concrete research, XAI plays a vital role in identifying the relative contributions of SCMs, nano-silica and curing parameters to mechanical performance, facilitating rational mix design rather than purely data-driven optimization.
The existing literature nevertheless contains several critical gaps. First, few studies have applied explainable AI techniques to multi-blended sustainable concrete systems that simultaneously combine industrial by-products, agro-industrial waste and nanomaterials. Second, many studies focus on predictive modelling without validating the physical implications of model outputs through durability testing and closed-form analytical modelling. Third, individual studies have addressed elements such as uncertainty quantification, information theoretic discrimination among competing kinetic laws, diffusion theoretic service-life projection or global (as opposed to local) sensitivity analysis, but these are rarely integrated within a single study; to the best of our knowledge, their combined use alongside explainable AI in a multi-blended sustainable concrete system has received limited attention.
This study uses explainable AI to predict and interpret the mechanical properties of SCBA–GGBS–zeolite–nano-silica-blended concrete and validates the AI findings through experimental durability testing and a suite of closed-form analytical models. The novelty of the work is sixfold: (i) integration of XAI-driven prediction with comprehensive experimental durability assessment in a quaternary sustainable binder system; (ii) triangulation of three formally distinct interpretability frameworks—SHAP local attributions [39], response surface significance testing and Sobol global variance decomposition [40,41]; (iii) derivation of the optimum nano-silica dosage by three independent mathematical routes (the experimental peak, the response surface stationary point and the marginal cementing efficiency criterion in the sense of Papadakis and co-workers [42,43]), which converge on 12–13 kg/m3; (iv) information theoretic selection among competing hydration kinetics laws using the corrected Akaike criterion [44]; (v) projection of chloride-initiation service life through an error function solution of Fick’s second law seeded by Berke–Hicks conversion of RCPT charge [45,46]; and (vi) rigorous uncertainty quantification of model accuracy through bootstrap confidence intervals [47] and leave-one-out cross-validation, together with principal component compression of the multiresponse dataset [48], design-code benchmarking of the flexural–compressive relationship, embodied carbon accounting and grey relational multi-criteria optimization [49]. The framework ensures that the AI-based predictions are corroborated by experimental evidence, thus increasing the practical relevance and scientific credibility of the study and helping to broaden the adoption of explainable AI in the field of construction materials engineering.

2. Materials and Methodology

2.1. Materials

The binder was ordinary Portland cement (OPC) conforming to IS 12269 (53 grade) procured from local market, with a specific gravity of approximately 3.15 and a Blaine fineness of about 320–340 m2/kg. Sugarcane bagasse ash (SCBA), obtained from a local sugar mill, had a specific gravity of approximately 2.2 and a fineness passing 45 µm, obtained from sugarcane industry, Roorkee. Ground granulated blast furnace slag (GGBS) procured from a steel plant had a specific gravity of approximately 2.9 and a Blaine fineness of about 400–420 m2/kg. Natural zeolite (clinoptilolite-type) had a specific gravity of about 2.2 and a mean particle size in the 5–10 µm range.
Nano-silica was a commercial amorphous product with a mean primary particle size of 10–20 nm, a BET specific surface area of approximately 200 m2/g, and SiO2 content ≥ 99%; its content was varied to observe changes in mechanical performance and matrix densification. Crushed granite coarse aggregate with a nominal maximum size of 20 mm (specific gravity ≈ 2.7) and river sand conforming to Zone II (specific gravity ≈ 2.65) were used as coarse and fine aggregate, respectively. Potable water free from impurities was used for mixing and curing.

2.2. Mix Proportioning

The combined effects of SCBA, GGBS, zeolite and nano-silica on the mechanical and durability performance were investigated using a total of 13 concrete mixes (Table 1). The total binder content was maintained at 400 kg/m3 in all mixes to ensure consistency of comparison across material combinations. The control mix, BM-0, contains 100% OPC. Two series of multi-blended sustainable mixes were designed on the basis of zeolite replacement level. In the BM-1 series, 30% of the cement was replaced by SCBA (40 kg/m3), GGBS (60 kg/m3) and zeolite (20 kg/m3); nano-silica was then added in six dosages from 0 to 20 kg/m3 (0–5% by weight of total binder), designated BM-1-N0 to BM-1-N5, with the OPC content correspondingly reduced to maintain constant total binder. In the BM-2 series, the SCBA and GGBS contents remain at 40 and 60 kg/m3 while the zeolite content is raised to 40 kg/m3, with nano-silica again varied from 0 to 20 kg/m3 (BM-2-N0 to BM-2-N5). The water content was maintained at 180 kg/m3, giving a constant water–binder ratio of 0.45 for all mixes, and the fine and coarse aggregate contents were held constant at 659.89 and 1144.8 kg/m3 respectively, so that differences in performance can be attributed to binder composition alone.

2.3. Mixing, Casting and Curing

Concrete was mixed in a laboratory pan mixer. The dry materials (OPC, SCBA, GGBS, zeolite and aggregates) were first blended to ensure uniform distribution. Nano-silica was pre-dispersed in the mixing water to improve the dispersion in the cementitious matrix and to reduce agglomeration. Gradually, water containing nano-silica was added to the dry mix with continuous mixing until a homogeneous concrete was obtained. Fresh concrete was cast in standard moulds for mechanical and durability test specimens, compacted on vibrating table to remove the entrapped air, demoulded after 24 h and water-cured at room temperature until the specified test ages of 7, 28 and 56 days.

2.4. Test Methods

The compressive strength was determined on 150 mm cube specimens in accordance with IS 516 [50], and the flexural strength on prisms in accordance with ASTM C78 [51] (third-point loading), at 7, 28 and 56 days. Compressive strength was measured at a loading rate conforming to ASTM C39 (approximately 0.25 MPa/s), and flexural strength under third-point loading at the rate specified in ASTM C78, using a calibrated compression/flexure testing machine of adequate capacity. The resistance to chloride ion penetration was determined by the rapid chloride penetration test (RCPT) on 100 mm diameter × 50 mm thick discs in accordance with ASTM C1202 [52] and expressed as the total charge passed in coulombs; prior to testing, specimens were conditioned by vacuum saturation in accordance with ASTM C1202 (vacuum applied for approximately 3 h, followed by de-aired water immersion under vacuum for approximately 1 h and then soaking for about 18 h). The sulfuric acid resistance was evaluated following the general procedure of ASTM C267 [53]. After 28 days of water curing, 150 mm cube specimens were surface-dried, weighed to obtain the initial mass, and fully immersed in a 5% (by mass) sulfuric acid solution (initial pH ≈ 0.3), with a solution-volume-to-specimen-surface-area ratio maintained so that the specimens remained completely submerged throughout the test. The solution was renewed every two weeks to counter neutralisation and to maintain the target acidity. At each test age, the specimens were removed, gently brushed under running water to remove loose reaction products, surface-dried, and reweighed; the acid resistance was expressed as the percentage mass loss relative to the initial mass.

2.5. Machine Learning and Explainability Framework

The 13 mixes tested at three ages yield a dataset of 39 observations with six input features: OPC, SCBA, GGBS, zeolite and nano-silica contents (kg/m3) and curing age (days). Six regression models were developed: an artificial neural network (ANN; two hidden layers of 32 and 16 neurons, L-BFGS optimizer, standardized inputs), support vector machine (SVM, RBF kernel) [54], random forest (RF, 300 trees) [55], extremely randomized trees (ERT, 300 trees) [56], XGBoost (400 estimators, maximum depth 4, learning rate 0.08) [57] and LightGBM (400 estimators) [58]. The data were partitioned into 70% training and 30% testing (12 test samples) with a fixed random seed to ensure reproducibility. Model performance was quantified by the coefficient of determination (R2) and root-mean-square error (RMSE), supplemented by non-parametric bootstrap confidence intervals (2000 resamples of the test predictions) [47] and leave-one-out cross-validation (LOOCV) over all 39 observations. Local explainability was assessed with SHAP force plots, beeswarm summaries and dependence plots [39]; global sensitivity was quantified by Sobol variance decomposition [40] with Saltelli sampling [41] applied to the best-performing model over the physically admissible design space, with the OPC content adjusted by mass balance.

2.6. Analytical and Statistical Framework

The experimental results were further interrogated through a hierarchy of closed-form mathematical models: (i) competing hydration kinetics laws discriminated by the corrected Akaike information criterion (AICc) and Akaike weights [44,59]; (ii) a reduced quadratic response surface with analytic stationary-point extraction; (iii) the effective binder (k-value) formalism of Papadakis and co-workers [42,43] extended to a dose-dependent efficiency for nano-silica; (iv) an error function solution of Fick’s second law of diffusion, seeded by the Berke–Hicks empirical conversion of RCPT charge to an apparent diffusion coefficient, for chloride-initiation service-life projection [45,46]; (v) principal component analysis (PCA) of the standardized multiresponse matrix to extract the latent dimensionality of the strength–durability coupling [48]; and (vi) grey relational analysis for multi-criteria mix optimization [49]. The regression models were evaluated primarily through their goodness of fit (R2 and adjusted R2) and the statistical significance of the individual terms. Given the limited number of observations, the fitted coefficients are interpreted as descriptive of the present dataset rather than as a basis for extrapolation beyond the studied composition range, and only terms significant at the 5% level are interpreted mechanistically.

3. Results and Discussion

3.1. Compressive Strength

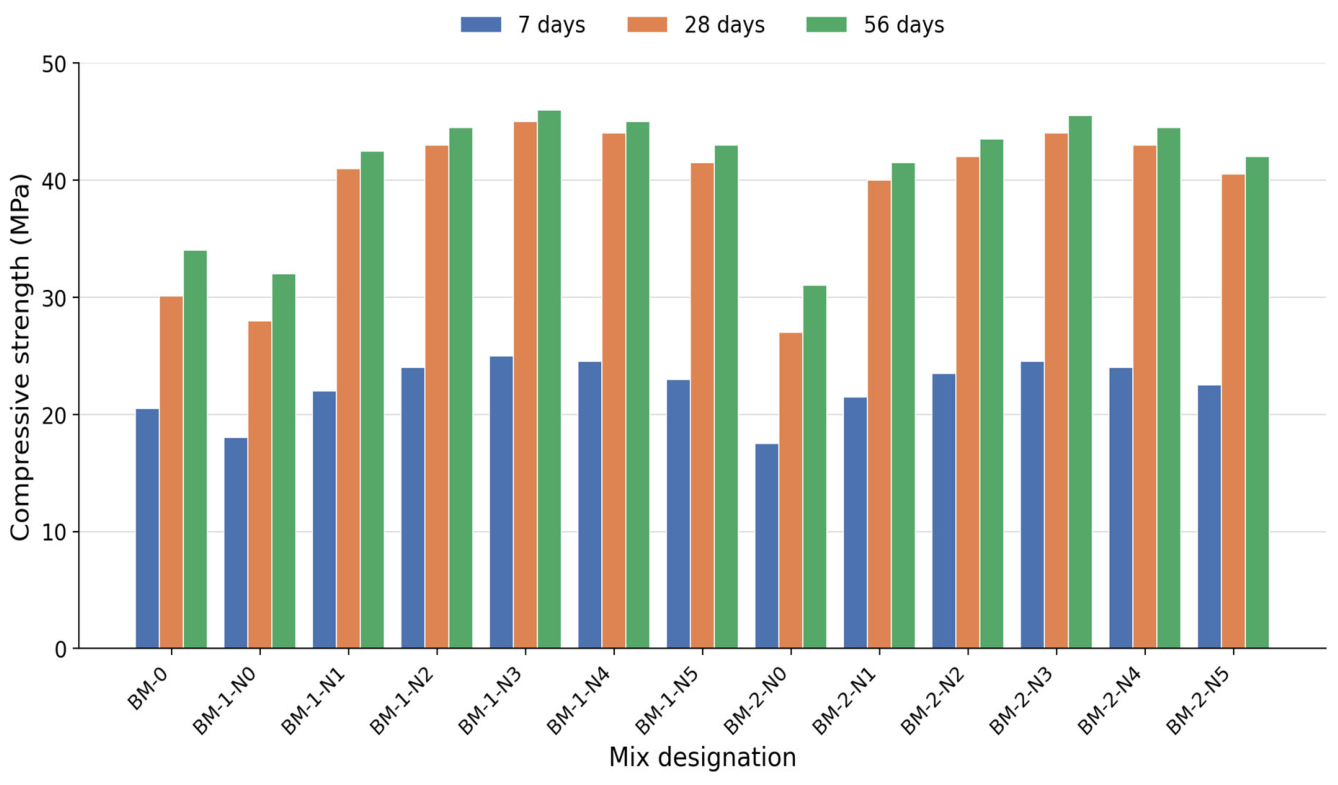
The strength development of the multi-blended mixes at 7, 28 and 56 days (Figure 1 and Figure 2) shows the combined effect of the SCMs and nano-silica on the hydration kinetics and matrix densification. The control mix shows relatively higher strength at 7 days due to rapid hydration of OPC leading to the release of large amount of portlandite and early formation of C-S-H. In contrast, the mixes with SCBA, GGBS and zeolite without nano-silica (BM-1-N0, BM-2-N0) present lower early-age strength, due to the slower pozzolanic reactivity of SCBA and zeolite and to clinker dilution. GGBS contributes very little at very early ages, because the latent hydraulic reactivity of GGBS is dependent on the availability of enough calcium hydroxide and high-alkalinity environment for activation. However, the incorporation of nano-silica enhances early strength by providing reactive nucleation sites for the C–S–H formation leading to faster cement hydration and promoting early pozzolanic reactions, which is in agreement with the reported improvements in 7- and 28-day strength at moderate nano-silica doses [35].
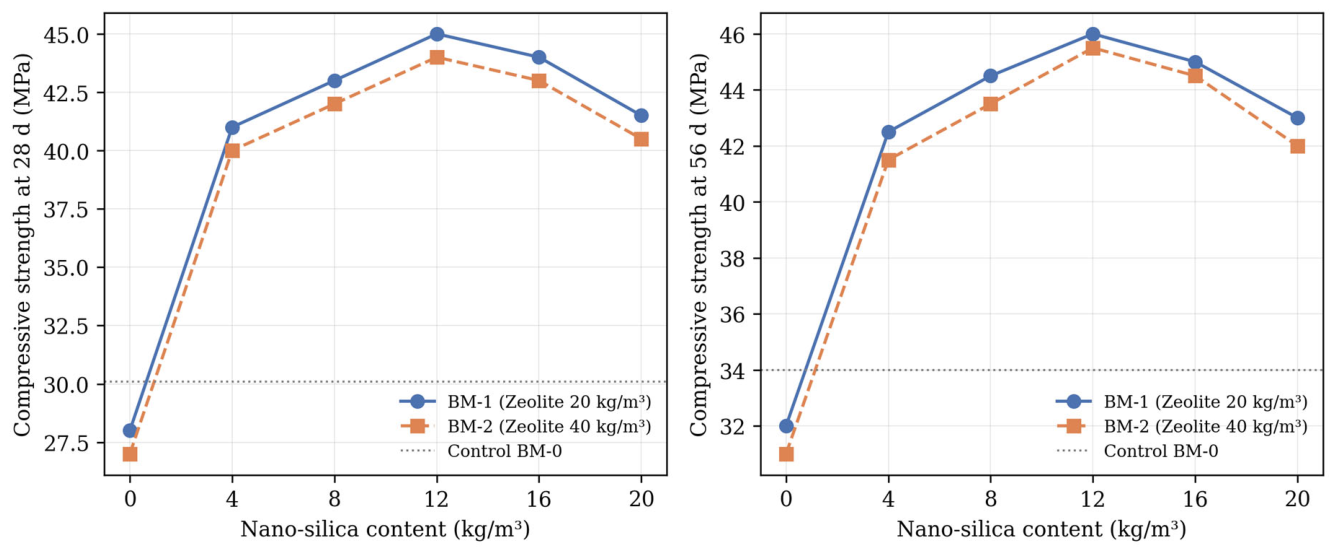
The combined effect of SCBA, GGBS, zeolite and nano-silica becomes increasingly evident at 28 and 56 days. Secondary C–S–H formation from SCBA and nano-silica, combined with C–A–S–H gel formation from GGBS, produces a denser and more homogeneous microstructure, while zeolite contributes sustained hydration through internal curing enabled by its high internal surface area and water-retention capacity; analogous links between microstructural densification, mechanical performance and environmental impact have been reported for multi-solid-waste-modified cementitious systems [60]. By 28 and 56 days the compressive strength of the SCM-rich mixes overtakes the control: the optimum mix BM-1-N3 (12 kg/m3 nano-silica) reaches 45.0 MPa at 28 days, 49.5% above the control (30.1 MPa), and 46.0 MPa at 56 days.
Peak strength occurs at a moderate nano-silica dose, confirming the existence of an optimum content beyond which agglomeration, increased water demand and poor dispersion reduce strength. Above the optimum, particle agglomeration creates weak zones and elevates microcracking, while the increased viscosity and water demand cause inadequate dispersion and higher porosity when not compensated by superplasticizers; the strength consequently declines at 16 and 20 kg/m3 despite the higher specific surface area available for reaction. The quantitative identification of this optimum is addressed analytically in Section 3.3. The BM-2 series (40 kg/m3 zeolite) follows the same dose–response pattern at a slightly lower level (approximately 1 MPa at each dosage), showing that the additional zeolite behaves primarily as a mild diluent at 28 days while retaining its internal curing and pore refinement benefits.

3.2. Flexural Strength

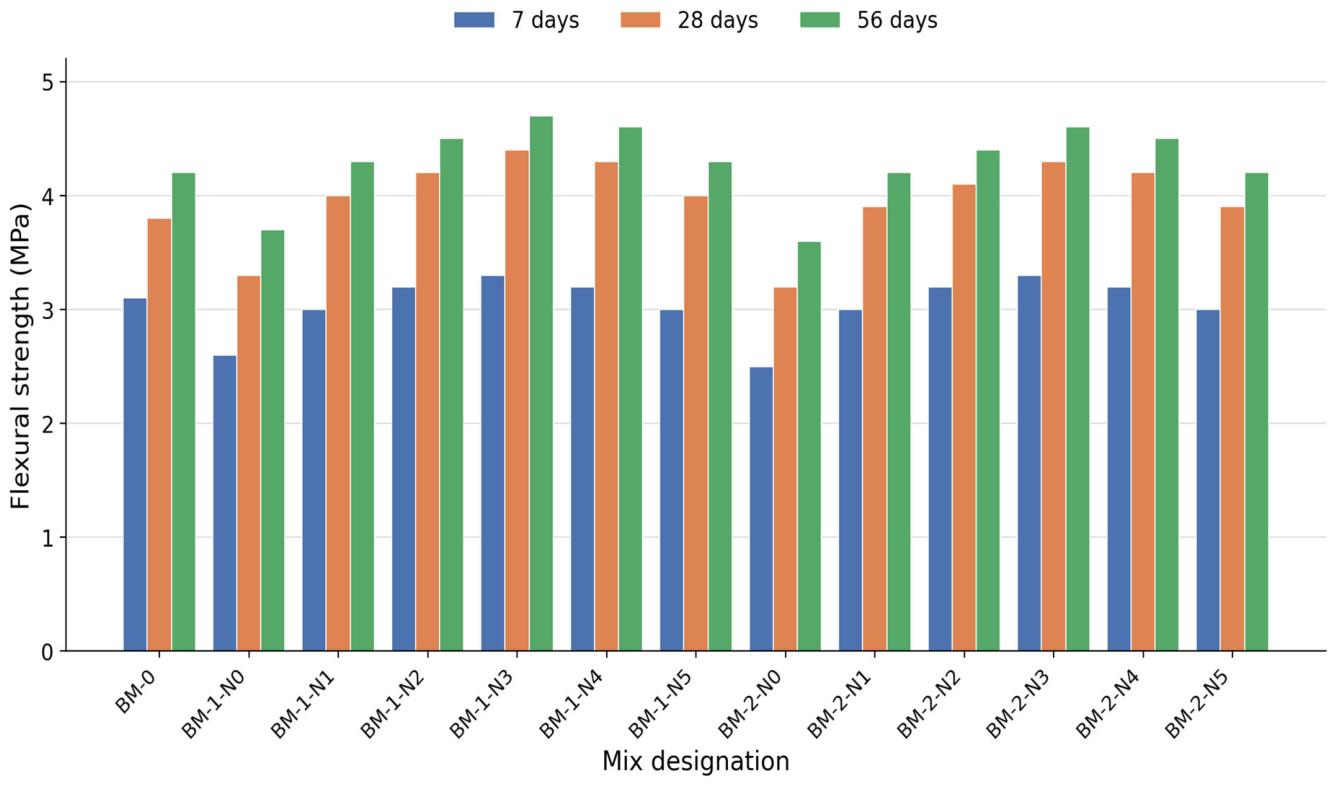
The flexural strength (Figure 3) follows the trends of the compressive strength, but it is more sensitive to the quality of the interfacial transition zone (ITZ) and to resistance to microcracking. The control mix shows a flexural strength in accordance with its compressive strength, while the SCM only mixes show slightly lower early-age values due to delayed hydration and weaker ITZ development. Nano-silica addition improves the flexural strength of concrete at all ages of curing by modifying the ITZ, reducing micro-voids, and improving the paste–aggregate bonding; nano-silica-modified mixes showed improved resistance to microcrack propagation and improved crack-bridging capability. Like the compressive strength response, the flexural strength decreases beyond the optimum dosage due to particle agglomeration and local stress concentrations. The quantitative relation between the two strengths and its comparison with design-code expressions are given in Section 3.3.3.

3.3. Analytical Modelling of Strength Development

To develop the experimental observations into transferable quantitative laws, five closed-form analyses were conducted strength development kinetics with information theoretic model discrimination flexural–compressive relationship benchmarked against design codes response surface model with an analytic optimum cementing efficiency (k-value) analysis.

3.3.1. Strength Development Kinetics

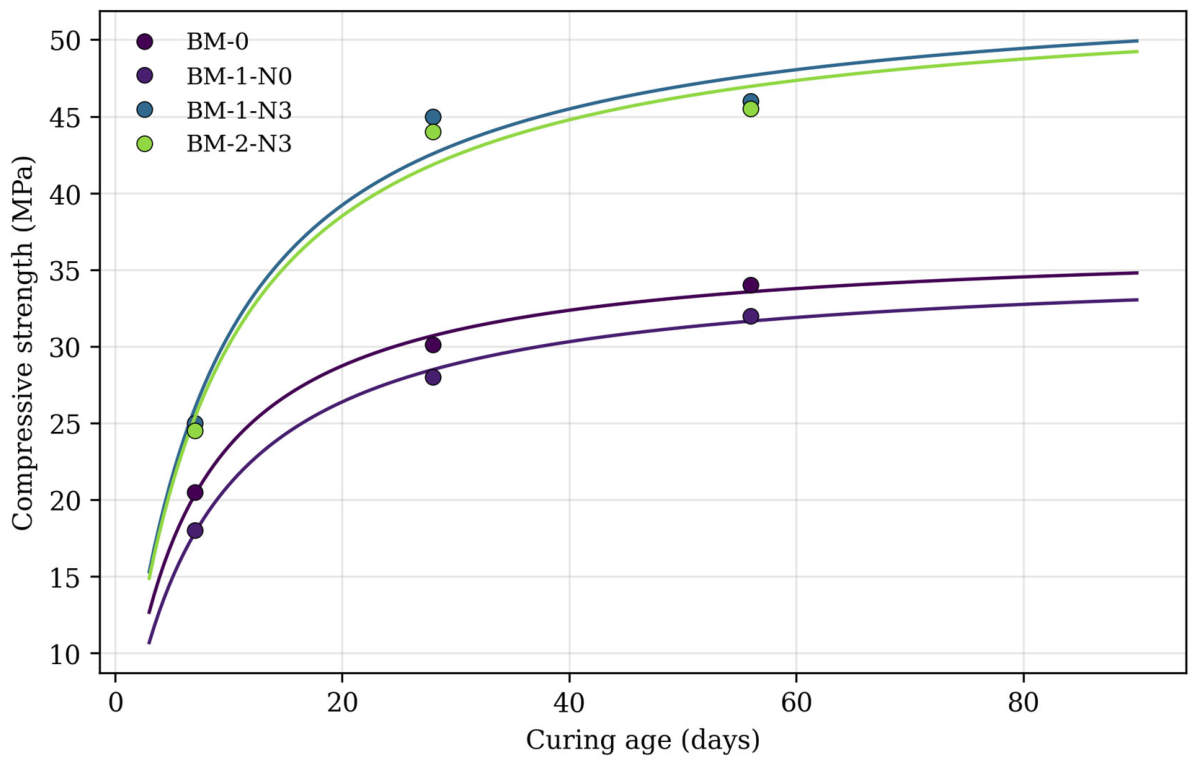
The time evolution of the compressive strength of each mix was fitted with the two-parameter hyperbolic rate law well known from the maturity theory [59]:
f c t   =   f u   t k   +   t
where f u is the asymptotic (ultimate) strength and k is the characteristic age at which half of the f u is reached. The model is suitable for all 13 mixes with R2 ≥ 0.966 (Table 2, Figure 4). There are two physically meaningful results. The first is that the ternary SCM blend increases the strength ceiling; it does not just delay it: fu increases from 37.0 MPa to 54.1 MPa (BM-1-N3), an increase of 46% in projected ultimate strength. Second, the age k at half strength increases only moderately (5.8 to 7.6 days), quantifying the early-age penalty of clinker dilution: the blended systems attain 50% of their much higher ultimate strength just 2 days later than the control. The nano-silica dosage of 12 kg/m3 (BM-1-N3) shows the maximum rate index f u k (7.11 MPa/day) in comparison to the nano-silica dosage of 0 kg/m3 (BM-1-N0) (5.10 MPa/day) as an initial slope indicator of early strength productivity, indicating that nano-silica compensates the nucleation deficit of the diluted clinker.

3.3.2. Information Theoretic Discrimination Among Competing Kinetic Laws

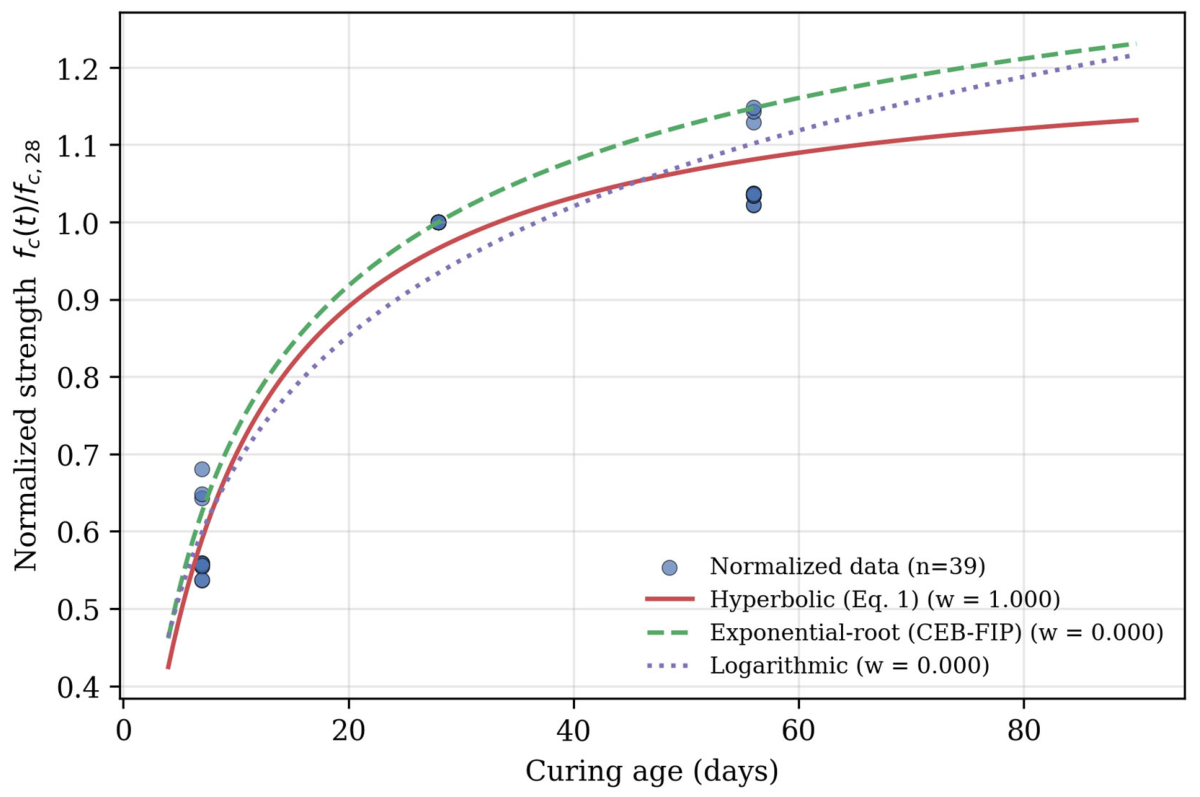
The form of Equation (1) is not arbitrary: it was chosen in preference to two well-established competitors, the exponential root law of the CEB-FIP form, f c t / f c , 28 = exp[s(1 − √(28/t))] and the logarithmic law f c t = a + b•ln t, by fitting all three forms to the pooled normalised dataset (n = 39, strengths normalised by the 28 day value of each mix) and comparing the three forms using the corrected Akaike information criterion (AICc) [44]. AICc penalises model complexity but rewards goodness of fit. The associated Akaike weights w i give the probability that each candidate is the best (Kullback–Leibler-closest) model in the set. The hyperbolic law is strongly preferred (Table 3, Figure 5) with an Akaike weight of 1.000, ΔAICc = 32.2 compared with the exponential root law and ΔAICc = 23.3 compared with the logarithmic law—differences that are well beyond the conventional threshold of ‘decisive evidence’ at ΔAICc = 10. The hyperbolic fit of the pooled data gives a global half-strength age of 7.6 days and a normalised asymptote of 1.23, meaning that the family of mixes reaches on average 90% of its ultimate strength by about 68 days. The physical consequence of the superiority of the saturating hyperbolic form relative to the unbounded logarithmic law is due to the finite capacity of the pozzolanic reservoir: the gain of strength must plateau upon consumption of the available portlandite and reactive silica. The three kinetic laws were compared on the pooled normalised dataset because normalising each mix by its own 28-day strength removes level differences and isolates the shape of the strength gain trajectory, allowing the functional form to be discriminated across all mixes simultaneously rather than from only three points per mix. The hyperbolic law also fits each individual mix well, with R2 ≥ 0.966 for all thirteen mixes (Table 2), indicating that the preferred form is consistent at the individual mix level.

3.3.3. Flexural–Compressive Power Law and Design-Code Comparison

Pooling all 39 paired observations, the flexural strength follows the power law:
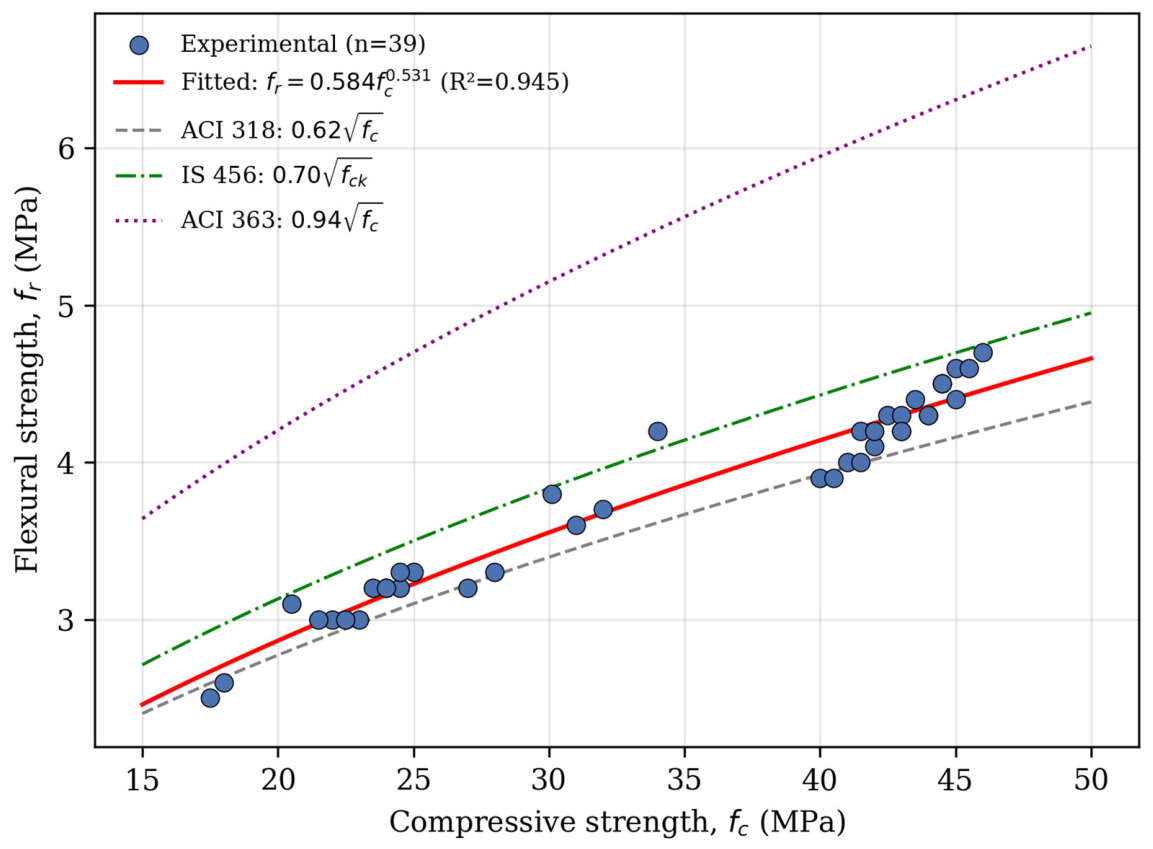
f r   =   0.584   f c 0.531                   ( R 2 = 0.945 )
The fitted exponent (0.531 ± 0.043) is statistically indistinguishable from the square-root form assumed by design codes, validating f c -type expressions for this multi-blended system. The fitted relationship lies between the ACI 318 lower-bound modulus of rupture (0.62√ f c ) and the IS 456 expression (0.70√ f c k ), and well below the ACI 363 high-strength expression (0.94√ f c ) (Figure 6). Practically, code-based flexural estimates therefore remain conservative-to-accurate for SCBA–GGBS–zeolite–nano-silica concrete and no bespoke correction is required for structural design—a point of direct regulatory relevance.

3.3.4. Response Surface Model and Analytic Optimum Nano-Silica Dosage

A reduced quadratic response surface was fitted to the twelve blended mixes at 28 days (the zeolite quadratic term is inestimable with two zeolite levels and was excluded):
f c , 28   =   30.48   +   2.558 N S     0.050 Z     0.0999 N S 2     0.000 N S · Z
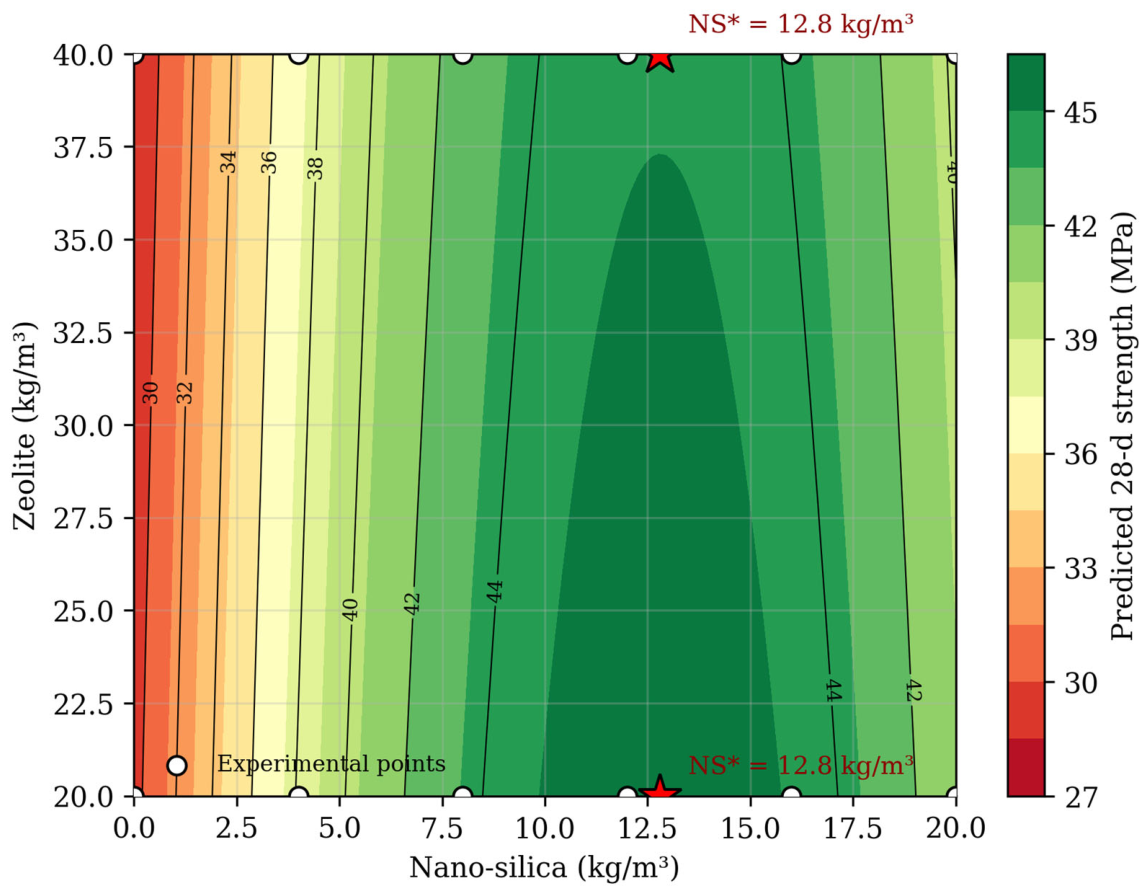
with R2 = 0.935 and adjusted R2 = 0.898 (Table 4). The nano-silica linear (p = 0.0003) and quadratic (p = 0.0002) terms are highly significant; the zeolite main effect (p = 0.63) and the NS × Z interaction (p ≈ 1.0) are not. Setting ∂ f c /∂NS = 0 yields the stationary (optimum) dosage:
N S   =   β 1   +   β 5 Z 2 β 3
independent of the zeolite level (Figure 7). The concave curvature (β3 < 0) is the mathematical signature of the agglomeration/dispersion limit mechanism discussed in Section 3.1, and the statistically null NS × Z interaction demonstrates that the nano-silica optimum is robust to the zeolite content within the range studied—a practically valuable mix-design rule.

3.3.5. Cementing Efficiency (k-Value) Analysis

Following the effective binder (k-value) concept introduced for SCM concretes by Papadakis and co-workers [42,43], the strength coefficient a = f c , 28 ·W/C = 13.55 MPa per unit binder–water ratio was calibrated on the control mix. For each blended mix, the effective binder B e f f = f c , 28 ·W/a was computed and the binder surplus regressed on composition:
B e f f     O P C   =   k S G · S C B A + G G B S   +   k Z · Z   +   k 1 · N S   +   k 2 · N S 2                   ( R 2 = 0.942 )
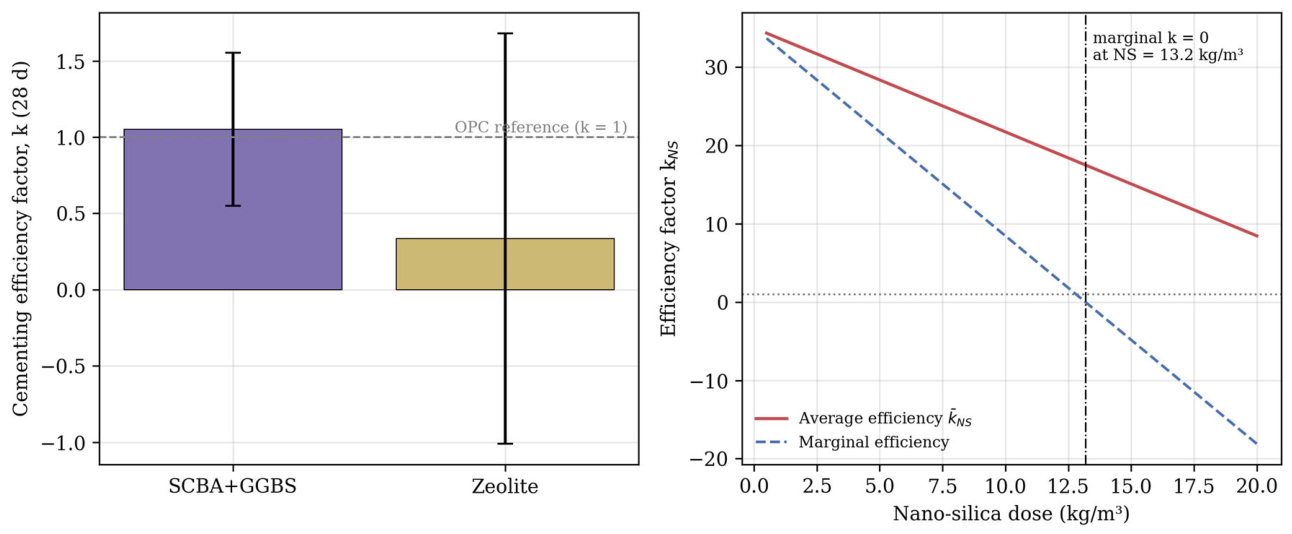
yielding k S C B A + G G B S = 1.05 ± 0.26, k Z e o l i t e = 0.34 ± 0.69 and a dose-dependent nano-silica efficiency k N S N S = 35.0 − 1.33·NS (Table 5, Figure 8). Three findings emerge. (i) The combined SCBA + GGBS fraction achieves an efficiency statistically equal to unity at 28 days—the agro-industrial blend replaces clinker one-for-one in strength terms. (ii) The point estimate for zeolite lies below unity (k = 0.34 ± 0.69), consistent with the k-values below unity reported for natural pozzolans at 28 days [43], although the wide standard error means it is not statistically distinguishable from unity in this dataset; the estimate is therefore taken only as an indication that zeolite acts primarily as a diluent and internal-curing agent at this age. (iii) Within the present dataset, nano-silica exhibits a high apparent efficiency at low dose—the regression implies that one kilogram of nano-silica contributes 28-day strength of the same order as several tens of kilograms of OPC—although this is a dataset-specific, dose-dependent estimate that requires external validation before it can be treated as a general mass equivalence relationship; its marginal efficiency falls linearly and crosses zero at 13.2 kg/m3, in remarkable agreement with the experimental peak (12 kg/m3) and the response surface stationary point (12.8 kg/m3). The convergence of three independent estimators on NS* ≈ 12–13 kg/m3 (3.0–3.3% of binder) constitutes strong internal validation of the reported optimum.

3.4. Durability Performance

3.4.1. Rapid Chloride Penetration

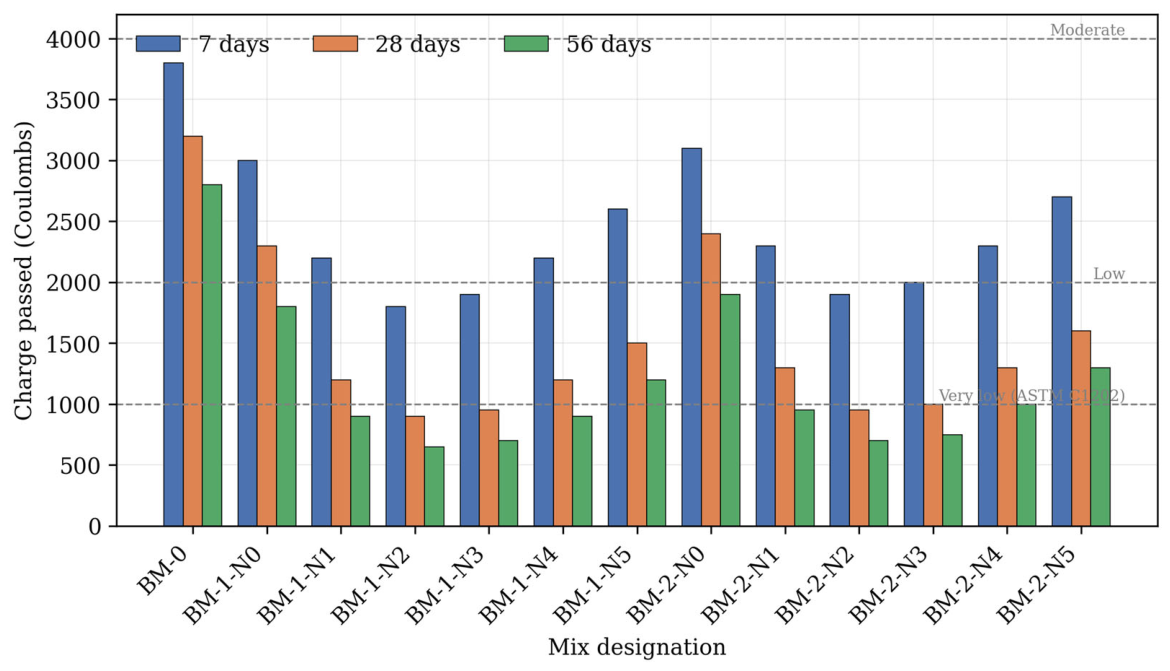
The rapid chloride penetration test (Figure 9) reveals a substantial enhancement in durability for all multi-blended mixes relative to the control. The control mix shows moderate chloride permeability characteristic of conventional OPC concrete (3200 C at 28 days). Partial replacement of OPC by SCBA, GGBS and zeolite reduces the charge passed through pore refinement and reduced capillary pore connectivity, while nano-silica further improves chloride resistance by filling micro-pores, accelerating pozzolanic reactions and promoting dense C–S–H and C–A–S–H gel formation. At 28 days, the optimally dosed mixes fall in the ASTM C1202 ‘very low’ permeability class (BM-1-N2: 900 C; BM-1-N3: 950 C—a 70–72% reduction relative to control), and continued hydration and matrix densification sustain the improvement to 56 days (650–750 C). When the nano-silica dose exceeds the optimum, inadequate dispersion and increased microcracking cause a modest rise in RCPT values, reinforcing the existence of an optimum dosage.

3.4.2. Acid Attack Resistance

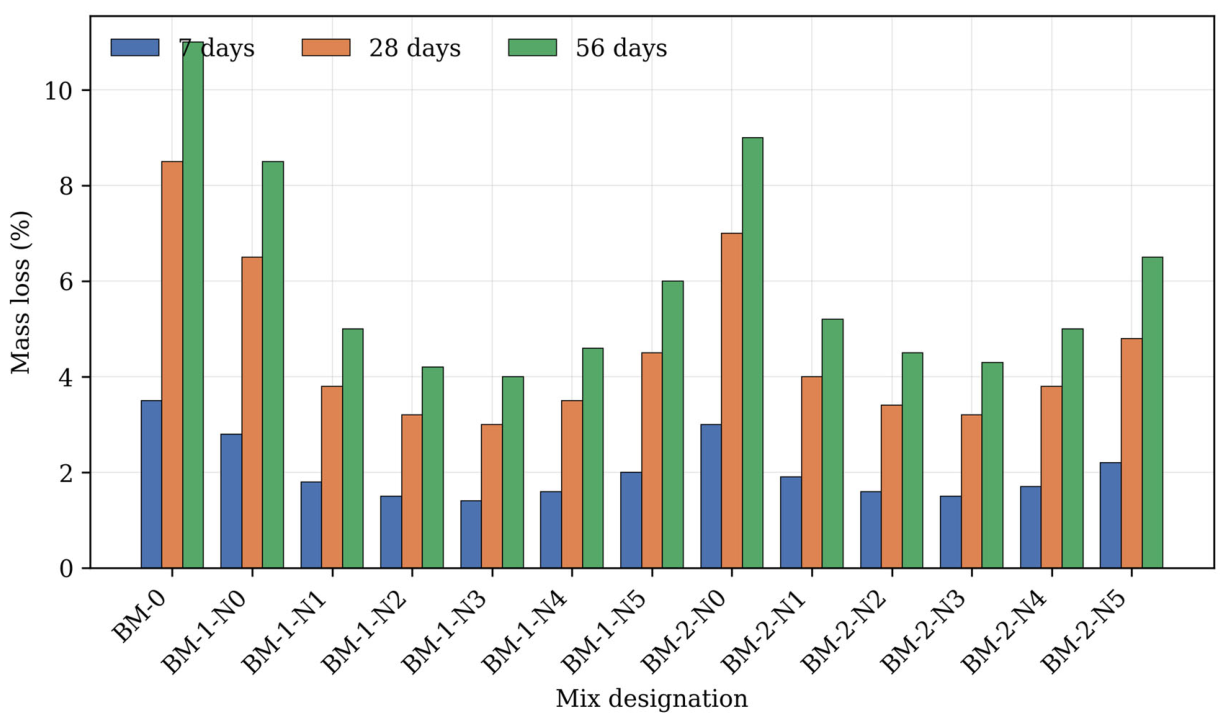
Acid resistance (Figure 10) is a function of the amount of calcium hydroxide available, the porosity and the continuity of the matrix. The control mix, with a high amount of free Ca(OH)2 that reacts with the acidic medium to form gypsum and expansive ettringite, shows the highest mass loss (11.0% at 56 days) due to surface degradation and material loss. The SCM-based mixes have lower free lime contents, which limits the acid binder reaction, while nano-silica rapidly consumes calcium hydroxide to form a stable silica-rich gel and reduces acid ingress by pore refinement. The optimally dosed mixes exhibit the lowest mass loss (BM-1-N3: 4.0% at 56 days, a 64% reduction), confirming the strong correlation between dense matrix, reduced calcium hydroxide content and chemical durability. Above the optimum dosage, localised defects arising from nano-silica agglomeration produce a higher mass loss.

3.4.3. Durability–Strength Coupling

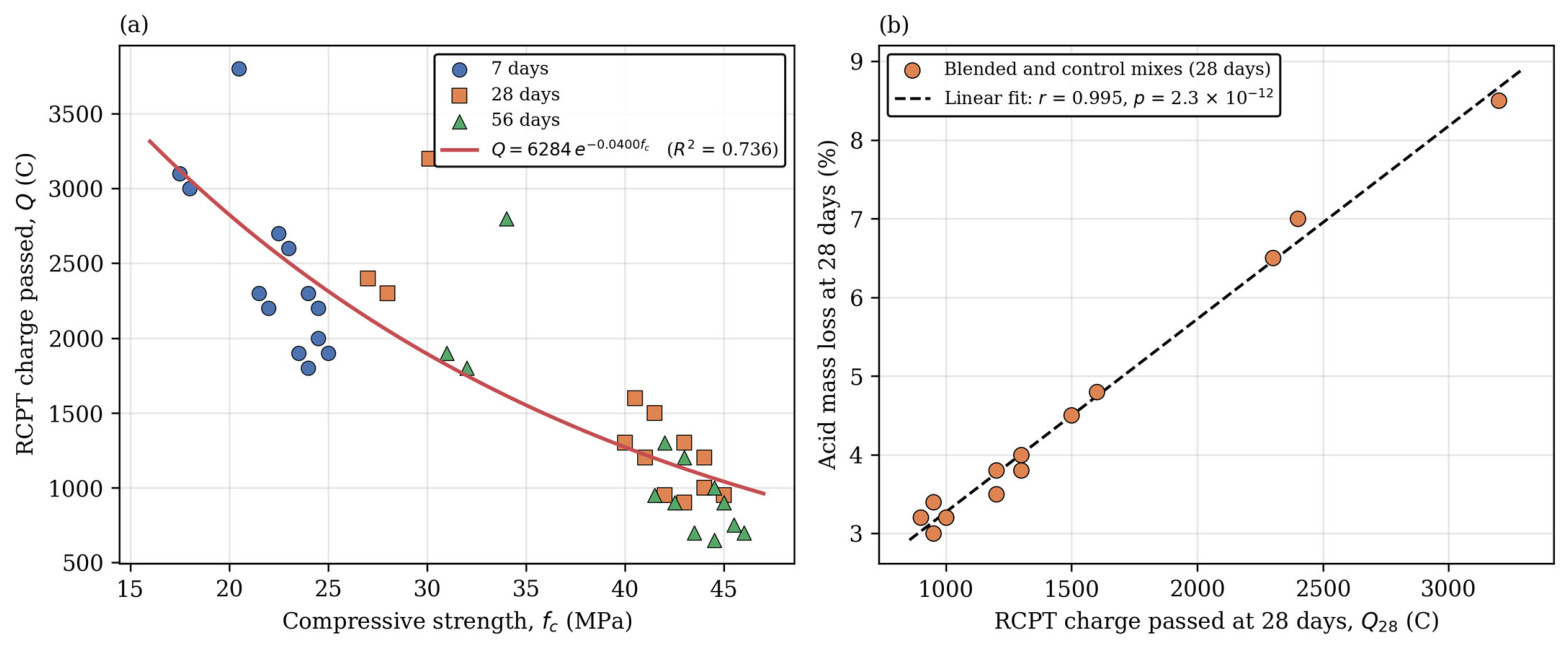
The mechanical and durability datasets were linked quantitatively. Chloride permeability decays exponentially with compressive strength at all ages and mixtures:
Q   =   6284   e x p 0.0400 · f c                   ( R 2 = 0.736 )
where each increase in strength of 17.3 MPa corresponds to halving the amount of charge passed. More strikingly, the RCPT charge and the acid mass loss are almost perfectly collinear across the 13 mixes at 28 days (Pearson r = 0.995, p < 10−11; Figure 11), suggesting that a single latent variable-capillary pore connectivity-governs both transport-controlled degradation mechanisms. This is quantitative cross-test confirmation of the matrix densification argument: the blended mixes are not only stronger, but they are also on a common pore refinement path that simultaneously enhances chloride and acid resistance.

3.4.4. Latent-Variable (Principal Component) Analysis of the Multiresponse Dataset

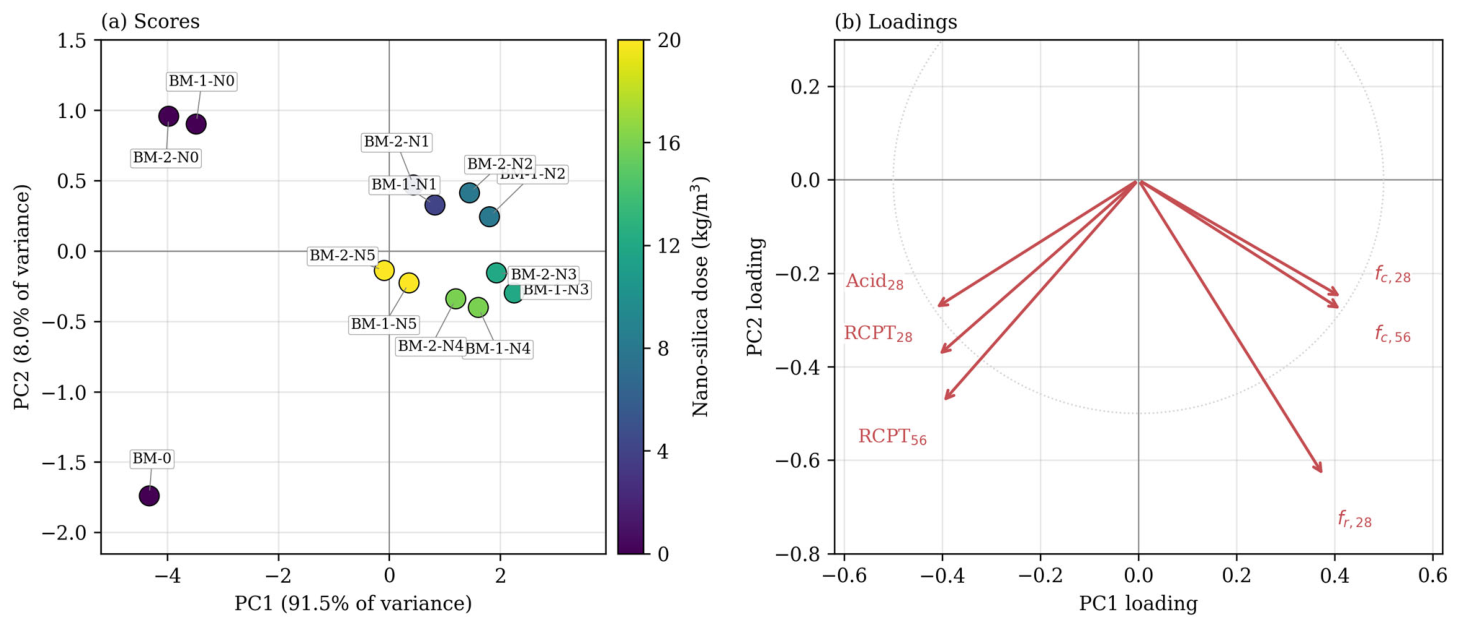
The single-mechanism hypothesis suggested by Equation (6) and the 0.995 correlation was tested formally by principal component analysis [48] of the standardized six-dimensional response matrix { f c , 28 , f r , 28 , RCPT28, acid28, f c , 56 , RCPT56} over the 13 mixes. The first principal component carries 91.5% of the total variance (second component: 8.0%), and its loading vector has the exact sign structure of a pore connectivity axis: uniform positive loadings on the strength responses (+0.42, +0.38, +0.42) and uniform negative loadings on the transport and degradation responses (−0.41, −0.42, −0.40) (Table 6, Figure 12). The mixes order themselves along PC1 monotonically with nano-silica dose up to the optimum and fold back beyond it, reproducing the concave dose–response Equation (3) in a model-free, unsupervised projection. The near-one-dimensionality of the response space is a strong quantitative statement: strength gain, chloride resistance and acid resistance in this system are not independent design objectives but coupled manifestations of a single underlying microstructural state variable, so that optimizing any one of them along the nano-silica axis simultaneously optimizes the others.

3.4.5. Fickian Service-Life Projection from RCPT-Derived Diffusion Coefficients

To translate the RCPT results into an engineering-relevant durability metric, the 56-day charge passed Q was converted to an apparent chloride diffusion coefficient using the empirical relation of Berke and Hicks [45]:
D a p p   c m 2 / s   =   0.0103   ×   10 8   ·   Q 0.84
and the chloride-initiation period was projected from the error function solution of Fick’s second law for a semi-infinite medium with constant surface concentration, following the classical corrosion-initiation framework of Tuutti [46]:
C x , t   =   C s 1     e r f x 2 D a p p · t         t i   =   x 2 4 · D a p p · e r f 1 1     C c r C s 2
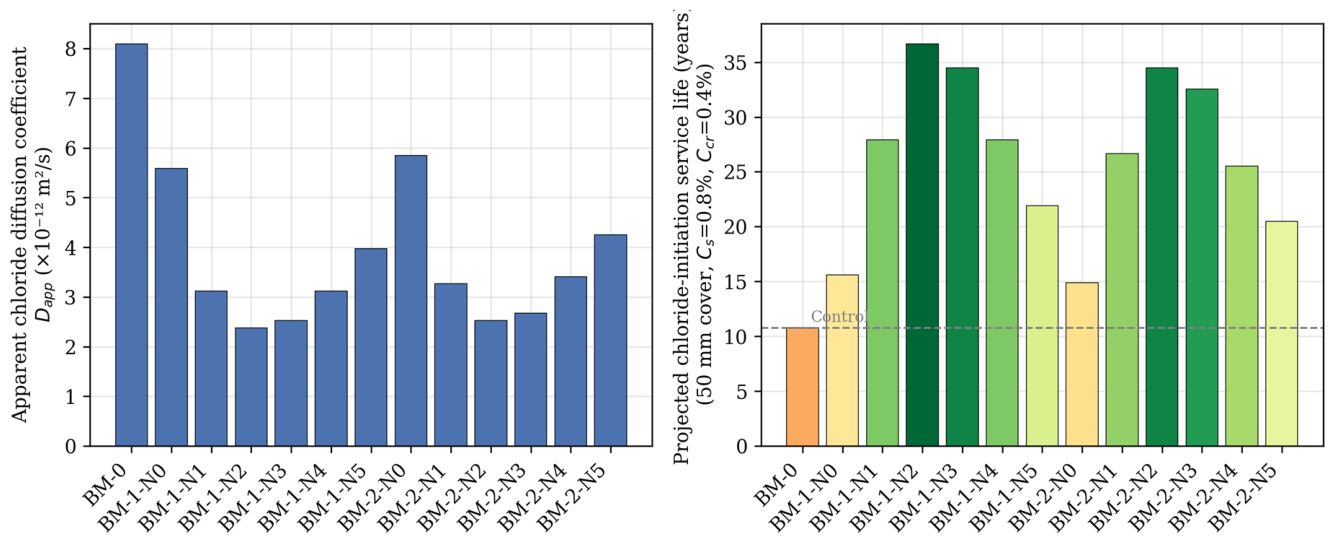
with cover depth x = 50 mm, surface chloride concentration C s = 0.8% and critical threshold C c r = 0.4% by mass of binder—representative severe-exposure values. The results (Table 7, Figure 13) show that the apparent diffusion coefficient falls from 8.10 × 10⁻¹² m2/s for the control to 2.38 × 10⁻¹² m2/s for BM-1-N2, and the projected chloride-initiation service life correspondingly rises from 10.8 years to 36.7 years—a 3.4-fold extension—with BM-1-N3 and BM-2-N2 close behind (34.5 years, 3.2-fold). Even the nano-silica-free blended mixes achieve a 1.4-fold extension. Two caveats apply and are stated explicitly: the Berke–Hicks conversion loses accuracy above approximately 2000 C owing to Joule heating of the cell (affecting only the control and the N0 mixes, whose service lives are therefore, if anything, overestimated, making the reported improvement ratios conservative), and the constant-D assumption neglects the continued hydration of the SCM-rich systems, which would further slow chloride ingress in service. The projection therefore represents a conservative lower bound on the durability benefit of the optimized blends.

3.5. Sustainability Assessment and Multi-Criteria Optimization

3.5.1. Embodied CO2 and Eco-Strength Efficiency

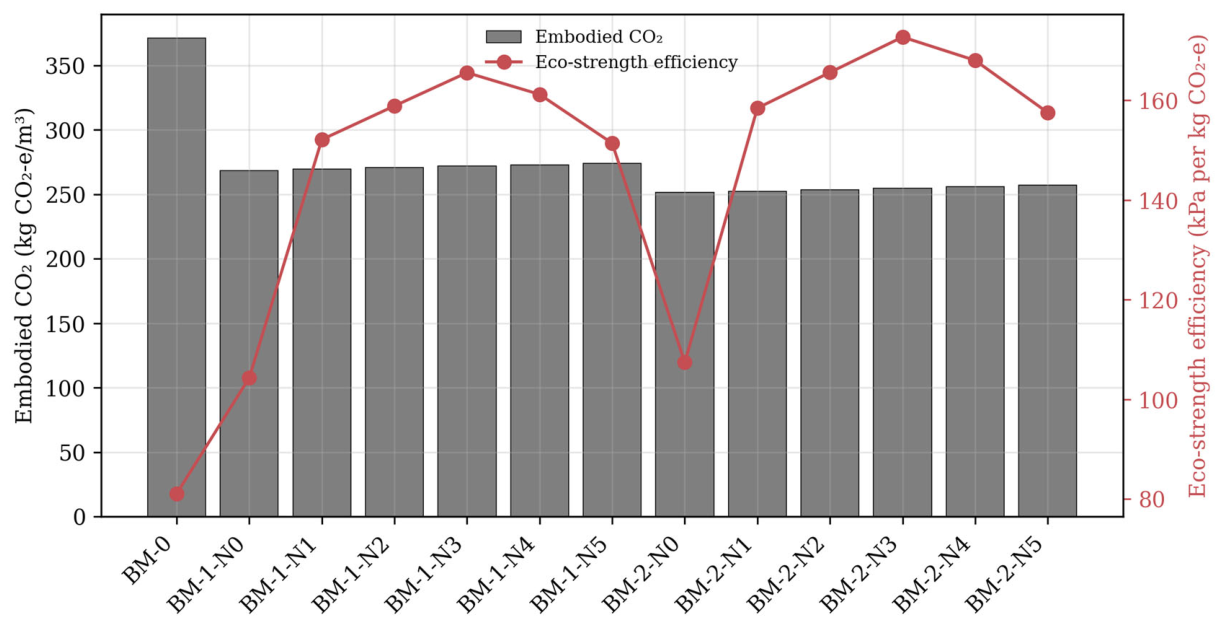
Cradle-to-gate-embodied CO2 was computed per mix using representative emission factors (OPC 0.912, GGBS 0.083, SCBA 0.010, zeolite 0.060, nano-silica 1.20 kg CO2-e/kg, plus aggregates and water). The cradle-to-gate-embodied CO2 emission factors were adopted from published sources: the Inventory of Carbon and Energy (ICE) database for OPC, GGBS and aggregates [61], and material-specific life cycle assessment studies for sugarcane bagasse ash [62], natural zeolite [63] and nano-silica [64]. All values are expressed per kilogram of material (kg CO2-e/kg). Following the co-product allocation used in the ICE database, the low factor for GGBS reflects its status as a steel industry co-product, while the factors for SCBA, zeolite and nano-silica correspond to the collected/processed material as used. It should be noted that such factors carry inherent variability arising from differences in system boundaries, allocation methods and regional data sources; the absolute embodied CO2 figures should therefore be read as representative estimates. The comparative ranking of the mixes is nonetheless robust to this variability, since it is governed primarily by the large difference in clinker content between the control and the blended systems. The 30–40% clinker replacement cuts embodied CO2 from 371 kg CO2-e/m3 (BM-0) to 251–274 kg CO2-e/m3 despite the carbon-intensive nano-silica—a 26–32% reduction (Table 8, Figure 14). Because strength simultaneously rises, the eco-strength efficiency (28-day strength per unit embodied CO2) improves from 81 kPa per kg CO2-e for the control to 173 kPa per kg CO2-e for BM-2-N3, a 2.1-fold improvement. Notably, the BM-2 series (higher zeolite) is the sustainability optimum even though BM-1-N3 is the strength optimum, because the extra zeolite displaces more clinker at a negligible strength penalty.

3.5.2. Grey Relational Multi-Criteria Ranking

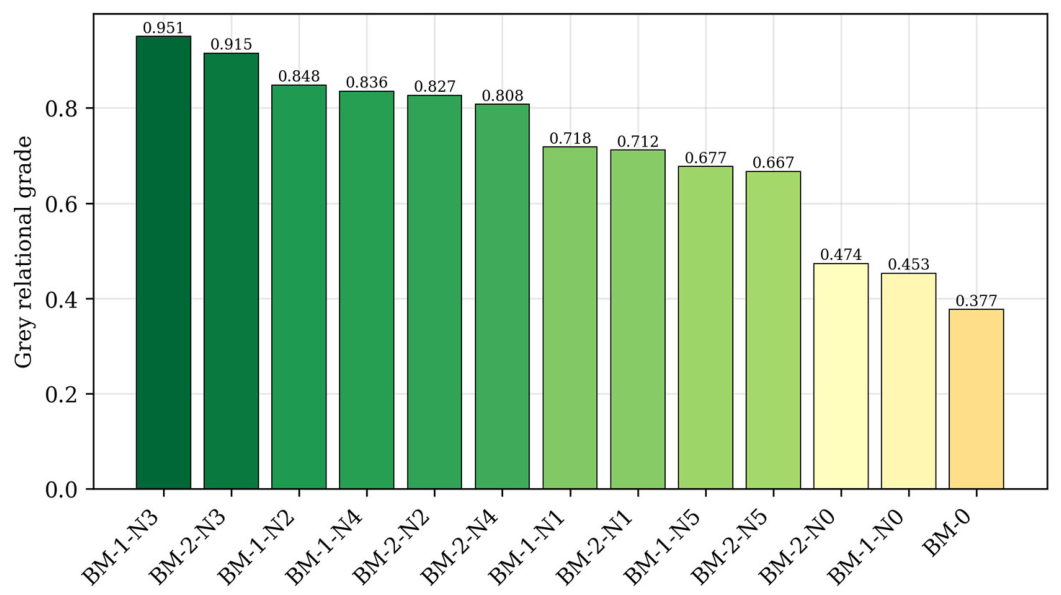
Because strength, chloride resistance, acid resistance and carbon footprint do not peak in the same mix, grey relational analysis (GRA), rooted in grey systems theory [49], was performed over six criteria ( f c , 28 ↑, f c , 56 ↑, f r , 28 ↑, RCPT28↓, acid loss28↓, CO2↓) with distinguishing coefficient ζ = 0.5. The grey relational grade (Table 9, Figure 15) ranks BM-1-N3 first, followed by BM-2-N3 and BM-1-N2, while the control BM-0 ranks last. GRA converts the multi-response dataset into a single defensible mix-selection decision, confirming 12 kg/m3 nano-silica with 20 kg/m3 zeolite as the overall optimum, with 40 kg/m3 zeolite as a near-equivalent alternative when the carbon criterion is weighted more heavily—a Pareto structure consistent with the one-dimensional latent variable identified in Section 3.4.4.

3.6. Machine Learning Prediction of Compressive Strength

3.6.1. Model Performance Based on R2 and RMSE

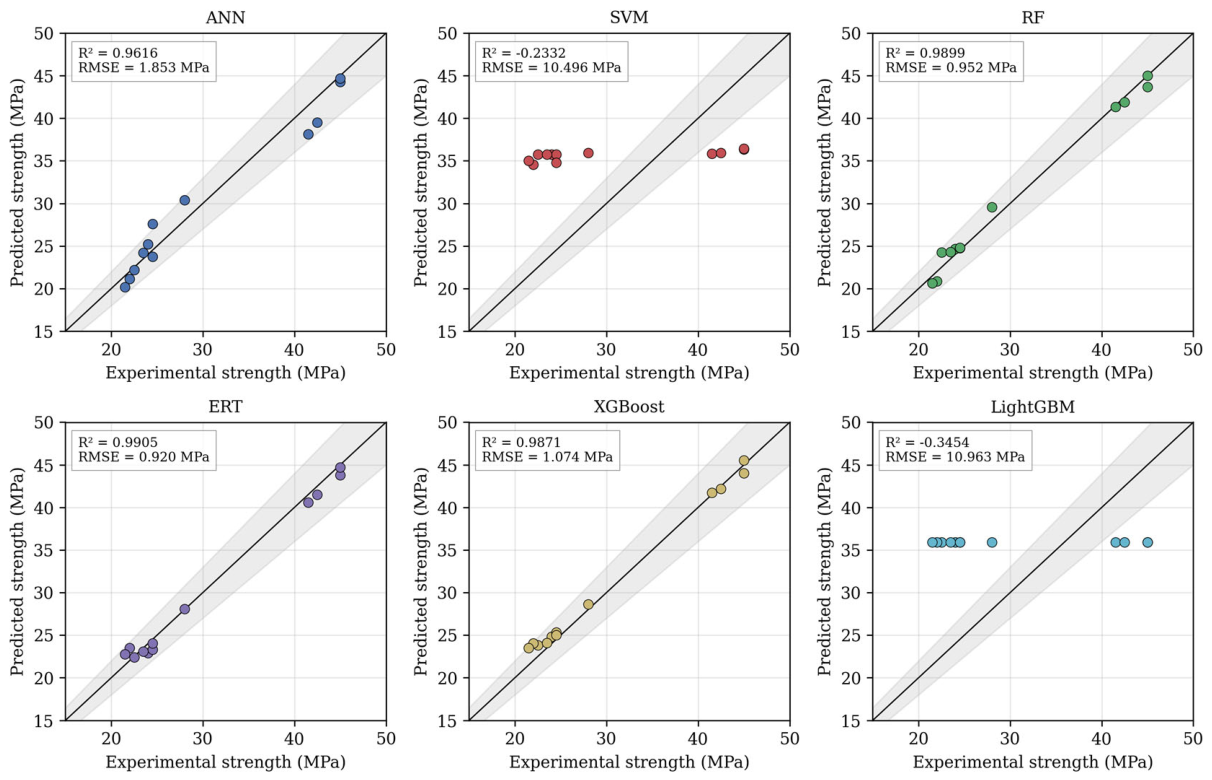
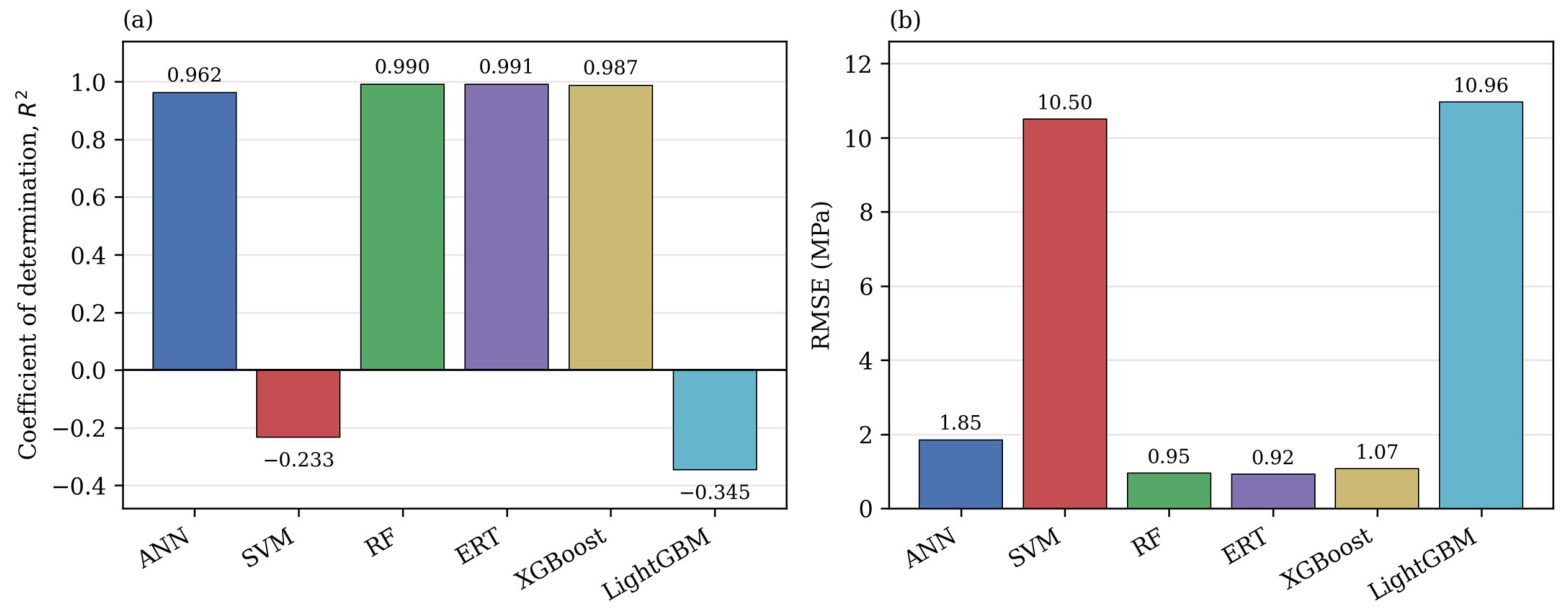
The predictive performance of the developed models was quantified by the coefficient of determination (R2) and root-mean-square error (RMSE) on the 12-sample test set (Table 10, Figure 16, Figure 17, Figure 18 and Figure 19). The ensemble tree techniques such as random forest (RF) [55], extremely randomised trees (ERT) [56] and XGBoost [57] had better accuracy with RMSE < 1.1 MPa and R2 > 0.98. The ERT model (R2 = 0.9905, RMSE = 0.920 MPa) showed the best accuracy, followed by RF (R2 = 0.9899, RMSE = 0.952 MPa), which confirmed that the ensemble learning model was capable of capturing the nonlinear and interactive effects governing the strength development of multi-blended sustainable concrete, in line with the ensemble dominance trend identified among the concrete ML literature [36,38]. The XGBoost also showed a good performance (R2 = 0.9871, RMSE = 1.074 MPa), confirming the applicability of the gradient-boosting methods for complex cementitious systems, even if it was slightly less accurate than RF and ERT.
The ANN demonstrated good predictive performance (R2 = 0.9616, RMSE = 1.853 MPa) indicating good agreement between actual and predicted values; however, it was less accurate than the tree ensembles—consistent with the sensitivity of neural networks to dataset size and distribution. However, the models of SVM [54] and LightGBM [58] generated negative R2 values of −0.2332 and −0.3454, respectively, and RMSEs above 10 MPa. A negative R2 suggests that the predictions are worse than a simple mean-based predictor. In Table 10, both models collapse to near-constant predictions around the training mean (≈35.7–35.9 MPa), which reflects an insufficient adaptation to the small dataset without extensive hyperparameter optimization or data augmentation. Overall, ERT, RF and XGBoost are the best models for this type of problem since they are better than ANN, SVM and LightGBM in terms of accuracy and minimizing the error.

3.6.2. Uncertainty Quantification of the Best Model

Point metrics on a 12-sample test set carry sampling uncertainty that is rarely reported in this literature. Non-parametric bootstrap resampling [47] of the ERT test predictions (2000 replicates) gives 95% confidence intervals of R2 ∈ [0.981, 0.996] and RMSE ∈ [0.62, 0.96] MPa. Leave-one-out cross-validation over all 39 observations—the most stringent protocol available for a dataset of this size—yields R2 = 0.986 and RMSE = 1.15 MPa, confirming that the ensemble’s accuracy is not an artefact of a favourable train–test split. Even at the lower confidence bound, the ERT model remains suitable for mix-design screening at an accuracy better than ±2 MPa.

3.7. Explainable AI Analysis

3.7.1. SHAP Force Plot Interpretation

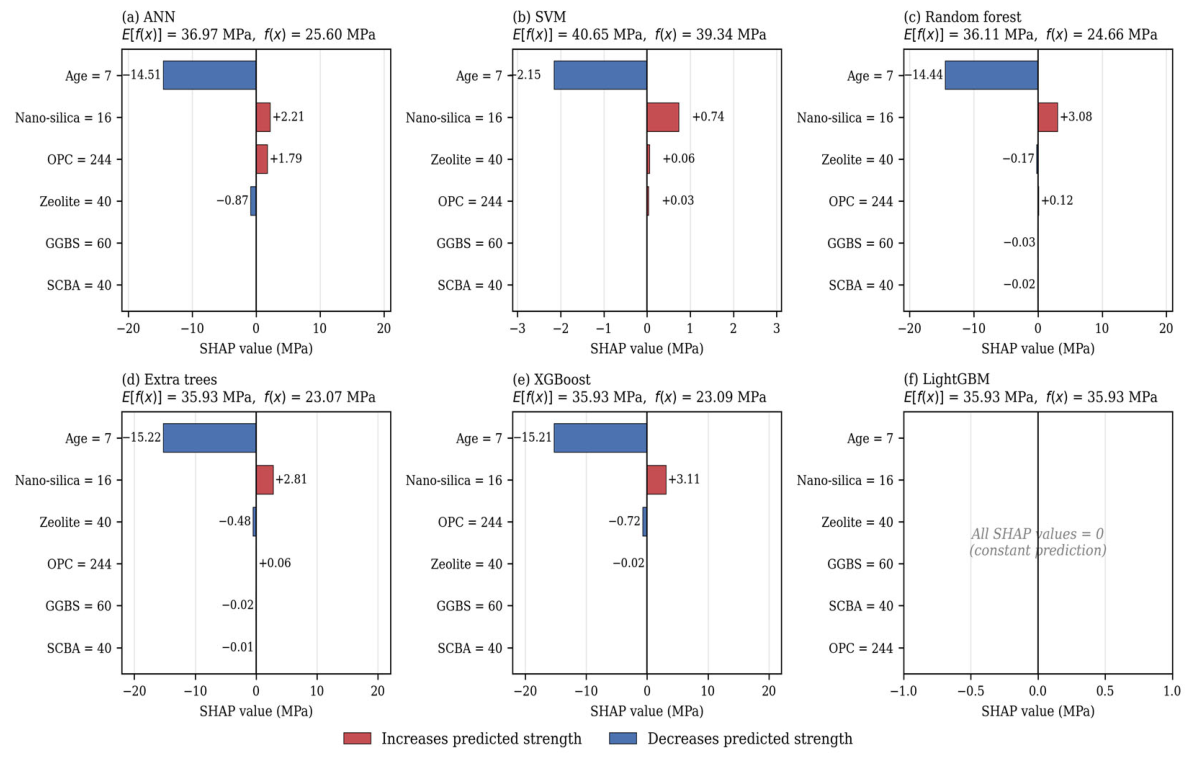
SHAP force plots (Figure 20), constructed from the Shapley value decomposition of individual predictions [39], provide a local explainability framework showing how each model attributes a prediction to feature-wise positive and negative contributions relative to a base value, enabling a direct comparison of decision logic and local sensitivity across algorithms—an approach whose physical consistency for concrete strength models has been established in the recent literature [36,37].
Because the Extra Trees (ERT) model gave the best predictive accuracy, its force plot is interpreted in most detail. For the early-age instance shown, the ERT attribution suggests that OPC and nano-silica contribute positively to the predicted strength, while curing age, zeolite and GGBS appear as the main negative contributors; the relatively sharp, isolated contribution steps are consistent with the randomised split selection of the extremely randomised trees.
The remaining models behave broadly compatibly. The ANN shows a smooth, distributed pattern that appears to integrate competing effects; XGBoost gives a similarly balanced attribution with OPC and nano-silica positive, and curing age and zeolite negative; and random forest yields a more discrete, step-like pattern dominated by a few features. By contrast, the SVM attribution appears over-concentrated on a small number of composition parameters, and the LightGBM force plot remains close to the base value with little local structure.
These force plot readings are local, instance-level explanations of model behaviour rather than direct experimental evidence and are therefore interpreted qualitatively. Nonetheless, the better-performing models (in particular, the Extra Trees model) tend to agree that nano-silica and OPC act as positive contributors and curing age as the dominant early-age negative contributor, whereas SVM and LightGBM show weaker or less structured local attributions consistent with their lower accuracy. This reinforces the value of considering predictive accuracy and explainability together when selecting machine learning models for sustainable concrete.

3.7.2. Global SHAP Importance and Dependence Structure

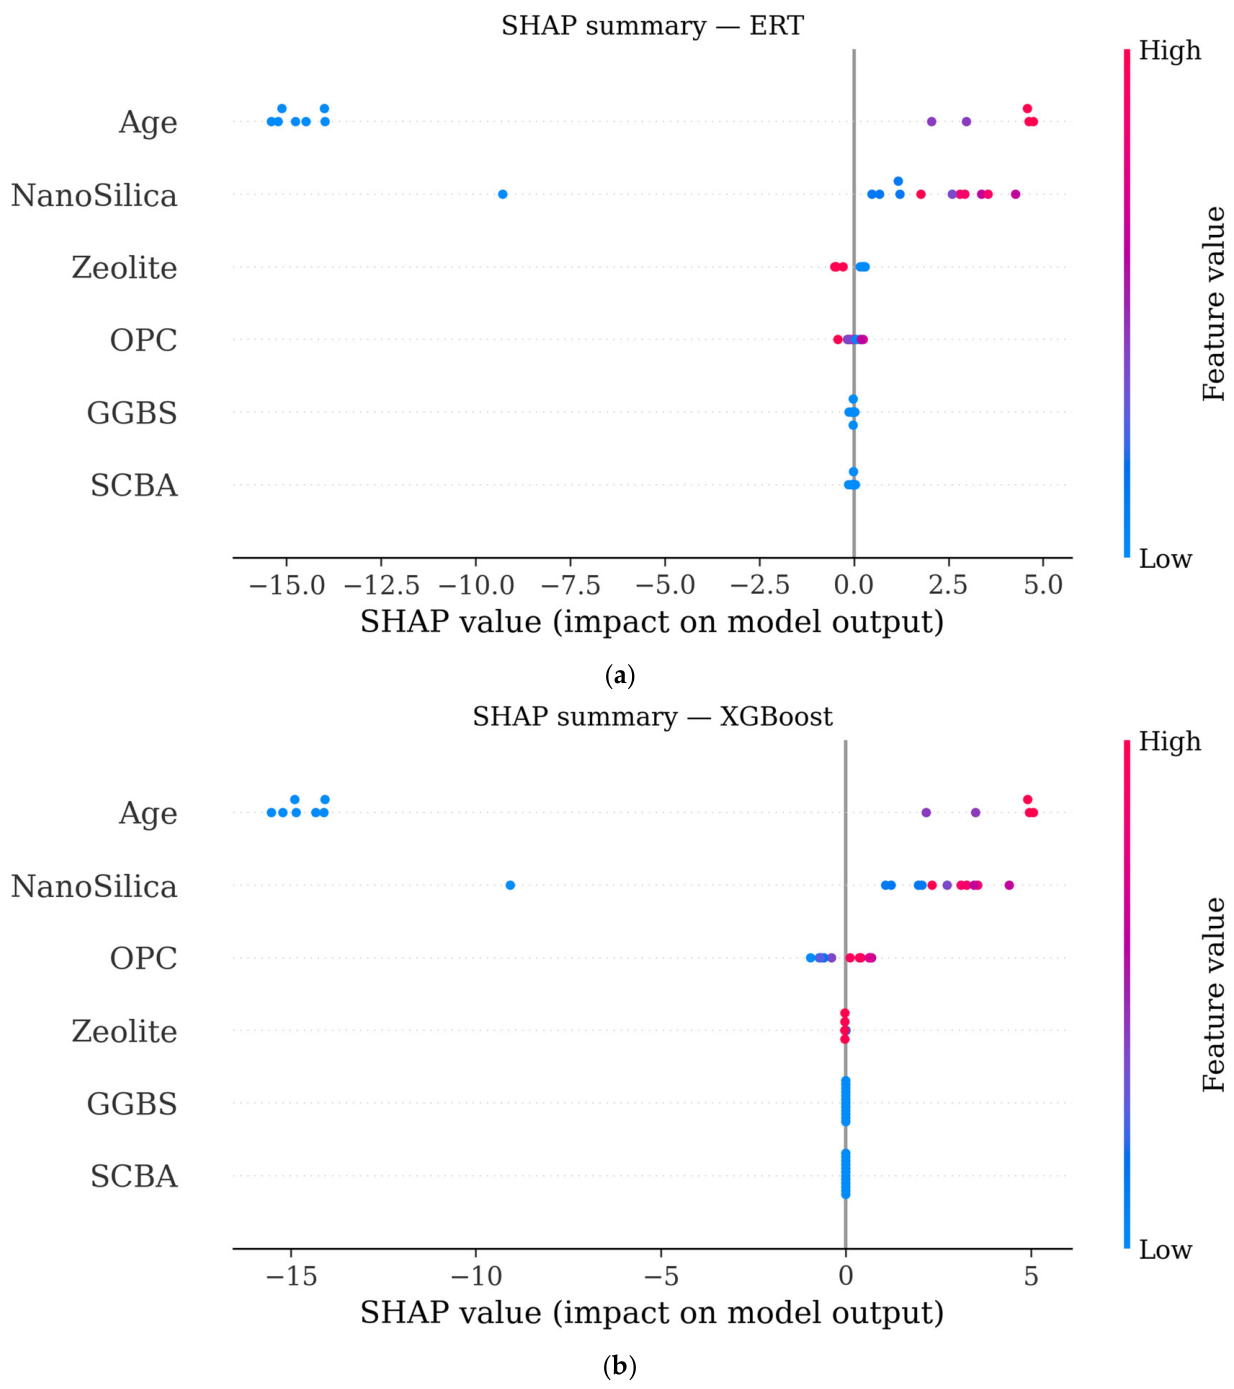
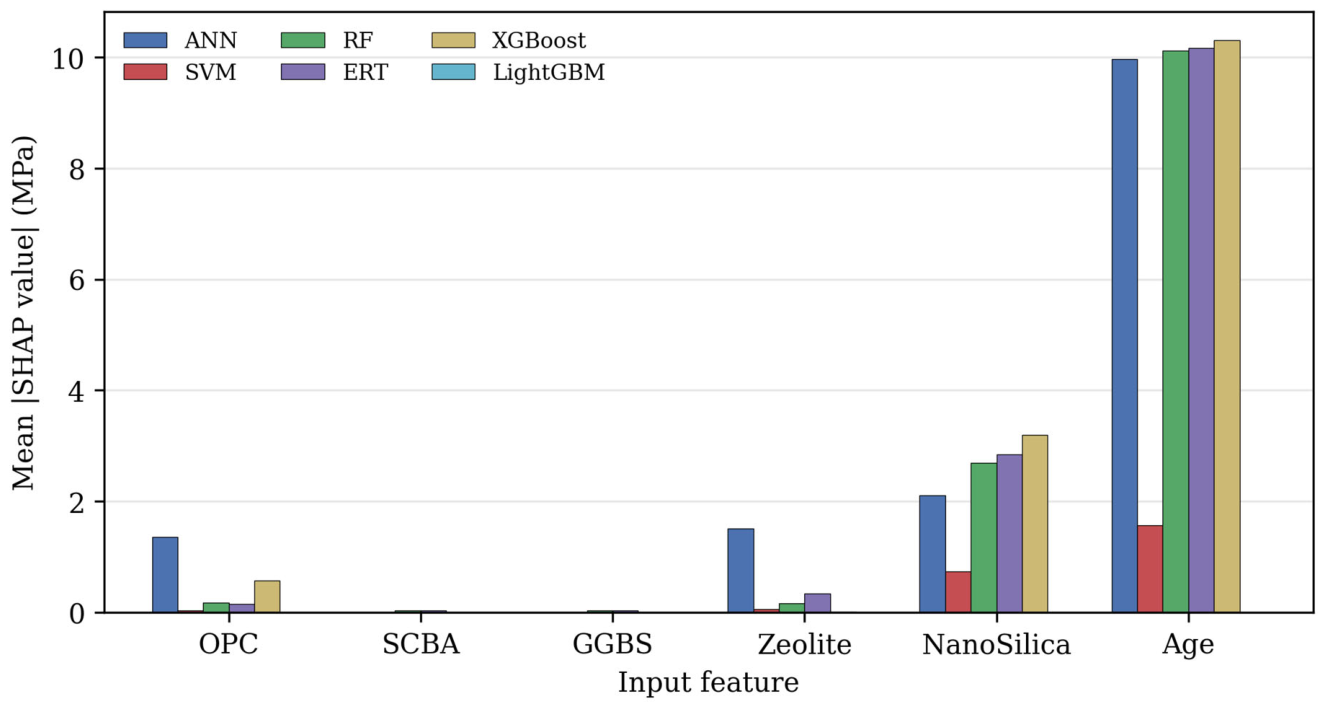
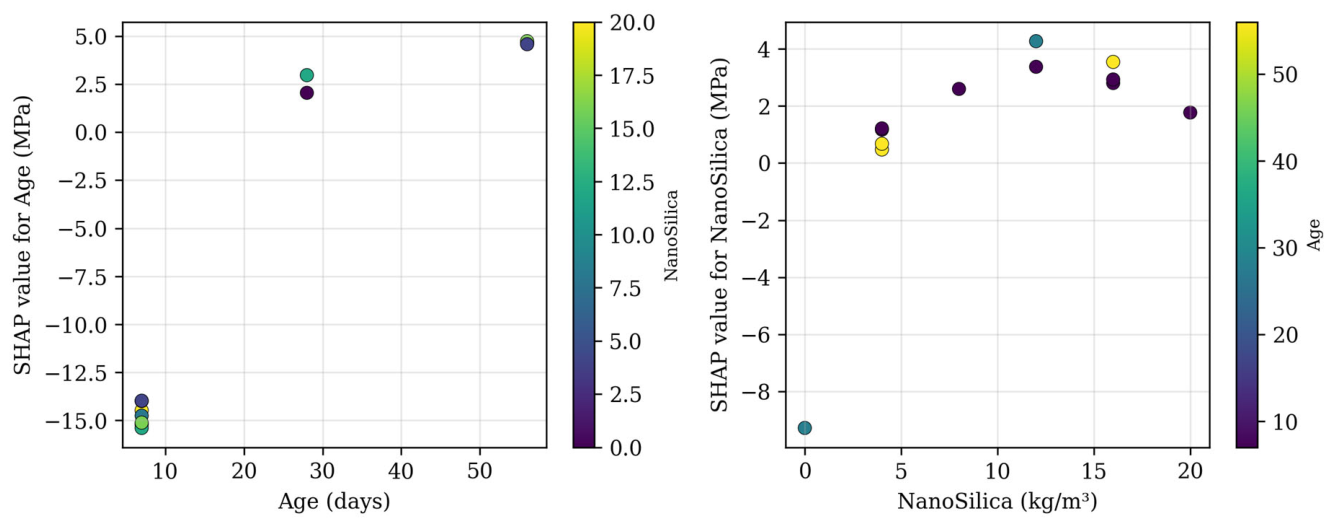
Beyond single-instance force plots, the beeswarm summaries (Figure 21) and cross-model mean-|SHAP| importance (Figure 22) show that curing age carries the largest average attribution magnitude in the accurate models, followed by nano-silica and OPC, with zeolite, SCBA and GGBS contributing smaller effects—the latter two partly because they are constant across the blended mixes and vary only against the control. The dependence plots (Figure 23) reveal the physically expected structure: the age attribution rises steeply from 7 to 28 days and saturates towards 56 days, mirroring the hyperbolic kinetics selected in Section 3.3.2, while the nano-silica attribution increases up to the optimum dose and flattens or declines beyond it, mirroring the concave response surface of Equation (3). The consistency between the data-driven SHAP structure and the closed-form analytical models is itself a validation of both.

3.7.3. Sobol Global Sensitivity Analysis

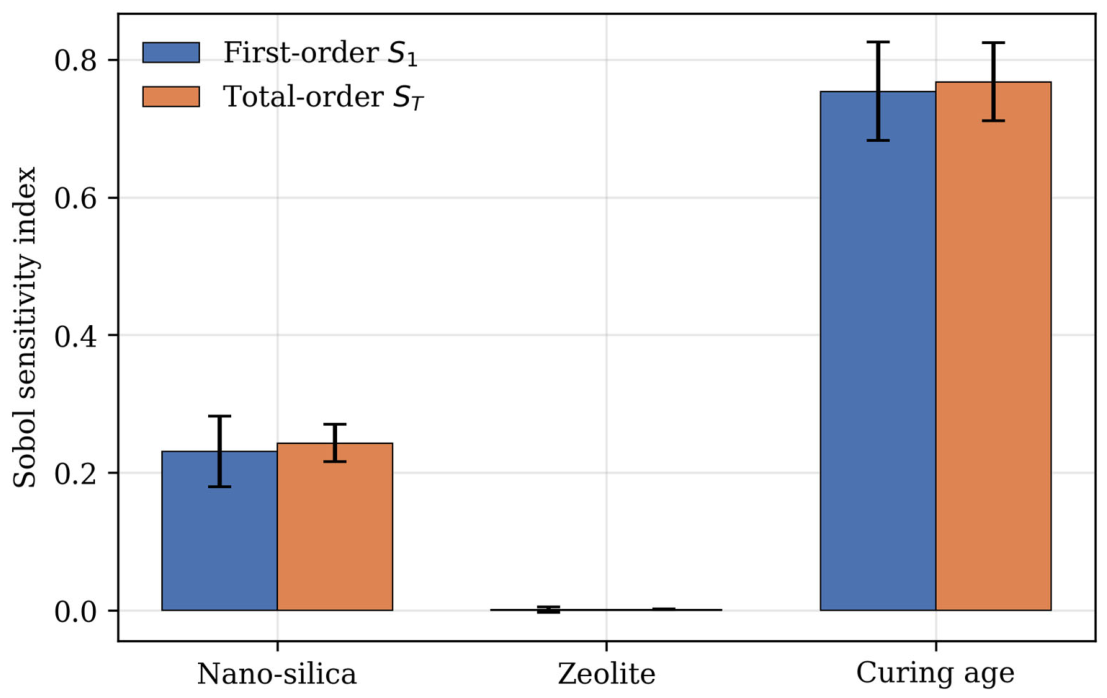
SHAP quantifies local, instance-level attributions; to complement it with a global variance decomposition, Sobol indices [40] were computed on the trained ERT model using Saltelli sampling [41] over the physically admissible design space (nano-silica 0–20 kg/m3, zeolite 20–40 kg/m3, age 7–56 days, OPC adjusted by mass balance). Curing age explains 75.4% of the output variance (S1 = 0.754), nano-silica 23.1% and zeolite less than 1% (Table 11, Figure 24). Total-order indices barely exceed first-order indices, showing the strength response is essentially additive in the studied ranges—consistent with the statistically null NS × Z interaction found by the response surface analysis, with the one-dimensional latent structure of Section 3.4.4, and with the SHAP dependence structure. The agreement between three formally distinct interpretability frameworks—SHAP local attributions, response surface significance tests and Sobol global decomposition—constitutes a triangulated explainability argument that substantially strengthens the reliability of the XAI conclusions.

3.8. Limitations and Future Work

This study has several limitations that should be considered when interpreting the results and that define directions for future work. First, fresh-state properties (slump, flow, fresh density and air content) were not measured, and no superplasticizer or other chemical admixture was used; all mixtures were proportioned at a fixed water-to-binder ratio of 0.45. Because zeolite and nano-silica have high specific surface areas, they may have increased water demand and altered workability, and, in the absence of workability control, this could have produced differences in entrapped air content and compaction between mixtures that contribute to the observed strength and RCPT results. Fresh-state behaviour is therefore a potential confounding factor, and fresh-state characterisation together with admixture-based workability control is recommended in future studies.
Second, no direct microstructural or pore structure characterisation (for example XRD, TGA/DTG, SEM/EDS, MIP or NMR) was performed. Consequently, the mechanistic explanations invoked in the preceding sections—additional C–S–H/C–A–S–H formation, portlandite consumption, improvement in the interfacial transition zone, pore refinement, internal curing, nano-silica agglomeration and microcracking—should be regarded as plausible inferences consistent with the mechanical and durability evidence and with the literature, rather than as directly demonstrated results. In the same spirit, the dominant principal component is a statistical latent variable that correlates with the strength–durability response and is interpreted, but not measured, as an indicator of pore connectivity. Direct microstructural characterisation to confirm these mechanisms is an important avenue for future work.
Third, because SCBA (40 kg/m3) and GGBS (60 kg/m3) were held constant across all blended mixtures, their individual contributions and interaction cannot be identified from the present design; the effective binder results for the agro-industrial fraction apply to the specific fixed 40:60 SCBA:GGBS combination studied and should not be generalised to either material alone. SCBA-only, GGBS-only and variable ratio series are recommended to resolve these individual effects.

4. Conclusions

A quaternary sustainable binder replacing 30–40% of OPC with SCBA (40 kg/m3), GGBS (60 kg/m3), zeolite (20–40 kg/m3) and nano-silica (0–20 kg/m3) was characterized experimentally, modelled analytically and predicted with explainable machine learning. The following conclusions are drawn:
  • The optimum mix (BM-1-N3, 12 kg/m3 nano-silica, 20 kg/m3 zeolite) reached 45.0 MPa at 28 days—49.5% above the OPC control—with corresponding gains in flexural strength (4.4 vs. 3.8 MPa), a 70% reduction in RCPT charge (950 vs. 3200 C, ASTM C1202 ‘very low’ class) and a 65% reduction in 28-day acid mass loss.
  • Information theoretic discrimination among three candidate hydration kinetics laws selects the hyperbolic rate model with an Akaike weight of 1.000 (ΔAICc > 23 against both competitors), reflecting the finite pozzolanic reservoir of the system. The fitted kinetics (Equation (1), per-mix R2 ≥ 0.966) show the blend raises the projected ultimate strength by 46% (37.0 → 54.1 MPa) while delaying the half-strength age by only about two days; nano-silica maximizes the early strength rate index f u k .
  • Three independent mathematical routes—the experimental peak (12 kg/m3), the response surface stationary point (12.8 kg/m3, Equation (4)) and the dose at which the marginal cementing efficiency of nano-silica vanishes (13.2 kg/m3, Equation (5))—converge on an optimum nano-silica dosage of 3.0–3.3% of binder, and the statistically null NS × Z interaction shows this optimum is insensitive to the zeolite level.
  • Effective binder analysis in the k-value formalism shows the SCBA + GGBS fraction replaces clinker one-for-one in 28-day strength terms (k = 1.05 ± 0.26), and within this dataset, nano-silica shows a high dose-dependent cementing efficiency at low dose (a dataset-specific estimate requiring external validation, not a general mass equivalence relationship).
  • The flexural–compressive relationship f r = 0.584· f c 0.531 (R2 = 0.945) is statistically consistent with the square-root form of design codes and lies between the ACI 318 and IS 456 expressions, indicating that existing code equations remain applicable to this multi-blended system.
  • RCPT charge and acid mass loss are near-perfectly collinear at 28 days (r = 0.995), and principal component analysis shows that a single latent statistical component accounts for 91.5% of the variance of the six-dimensional strength–durability response (this dominant component is interpreted as an indicator of pore connectivity, which was not directly measured): strength, chloride resistance and acid resistance are coupled manifestations of one microstructural state variable, not independent design objectives.
  • Fickian service-life projection, seeded by Berke–Hicks conversion of the 56-day RCPT charge to apparent diffusion coefficients (Equations (7) and (8)), indicates a conservative 3.4-fold extension of the chloride-initiation period at 50 mm cover (36.7 versus 10.8 years) for the optimized blends.
  • Among six ML models, extremely randomized trees performed best (R2 = 0.9905, RMSE = 0.920 MPa), followed by RF and XGBoost; SVM and LightGBM failed on this dataset (negative R2, near-constant predictions). Bootstrap 95% confidence intervals (R2 ∈ [0.981, 0.996]) and leave-one-out cross-validation (R2 = 0.986, RMSE = 1.15 MPa) confirm that the ERT accuracy is robust and not split-dependent.
  • SHAP force plots, beeswarm summaries and dependence plots agree with response surface significance tests and Sobol global sensitivity indices (age 75.4%, nano-silica 23.1% of variance; negligible interactions): a triangulated explainability result in which the data-driven attributions reproduce the closed-form dose–response and kinetic laws.
  • The blended mixes cut embodied CO2 by 26–32% and improve eco-strength efficiency 2.1-fold; grey relational analysis over six strength, durability and carbon criteria ranks BM-1-N3 first, with BM-2-N3 being a near-equivalent lower-carbon alternative.
  • The unified framework—experimental testing, information theoretic kinetic model selection, effective binder formalism, diffusion theoretic service-life projection, latent variable compression, interpretable ML with uncertainty quantification, and sustainability accounting—provides a transparent, physically validated template for the design of multi-blended sustainable concretes.

Author Contributions

K.S.D. and P.T.R. conceptualised and designed the study; K.S.D. and P.T.R. processed and analyzed the data; K.S.D. and P.T.R. wrote the manuscript; P.T.R. edited and revised the manuscript. All authors have read and agreed to the published version of the manuscript.

Funding

This research received no external funding.

Institutional Review Board Statement

Not applicable.

Informed Consent Statement

Not applicable.

Data Availability Statement

The original contributions presented in this study are included in the article.

Conflicts of Interest

The authors declare no conflicts of interest.

References

  1. Andrew, R.M. Global CO2 emissions from cement production. Earth Syst. Sci. Data 2018, 10, 195–217. [Google Scholar] [CrossRef] [Scilit]
  2. Xu, Q.; Chen, D.; Tang, S.; Wen, Y.; Yang, C.; Xiong, J.; Zhou, Y. A residue-modified magnesium oxysulfate cement composite: Tailoring and efficacy for loess reinforcement. Constr. Build. Mater. 2026, 519, 145916. [Google Scholar] [CrossRef] [Scilit]
  3. Ullah, M.F.; Tang, H.; Ullah, A.; Toth, Z.; Ahmad, M.; Alzlfawi, A. Mechanical and environmental performance of sugarcane bagasse ash from Khyber Pakhtunkhwa in sustainable concrete. Sci. Rep. 2025, 15, 24571. [Google Scholar] [CrossRef] [Scilit] [PubMed]
  4. Jha, P.; Sachan, A.K.; Singh, R.P. Agro-waste sugarcane bagasse ash (ScBA) as partial replacement of binder material in concrete. Mater. Today Proc. 2021, 44, 419–427. [Google Scholar] [CrossRef] [Scilit]
  5. Sankeeth, S.; Prabhath, A.A.N.; Damruwan, H.G.H.; Herath, H.M.S.T.; Priyadarshana, H.V.V.; Kumara, S.P.S.N.B.S.; Lewangamage, C.S.; Koswattage, K.R. Optimizing mechanical properties of concrete using sugarcane bagasse ash. Results Eng. 2025, 27, 105968. [Google Scholar] [CrossRef] [Scilit]
  6. Bahurudeen, A.; Santhanam, M. Performance evaluation of sugarcane bagasse ash-based cement for durable concrete. In Proceedings of the 4th International Conference on Durability of Concrete Structures, Lafayette, Indiana, 24–26 July 2014; Purdue University: West Lafayette, IN, USA, 2014. [Google Scholar]
  7. Kirthiga, R.; Elavenil, S. Synergistic effects of bagasse ash and silica fume on strength and durability properties of sustainable cement mortars. Eng. Res. Express 2025, 7, 035109. [Google Scholar] [CrossRef] [Scilit]
  8. Bahurudeen, A.; Kanraj, D.; Dev, V.G.; Santhanam, M. Performance evaluation of sugarcane bagasse ash blended cement in concrete. Cem. Concr. Compos. 2015, 59, 77–88. [Google Scholar] [CrossRef] [Scilit]
  9. Xu, Q.; Ji, T.; Gao, S.J.; Yang, Z.; Wu, N. Characteristics and applications of sugar cane bagasse ash waste in cementitious materials. Materials 2018, 12, 39. [Google Scholar] [CrossRef] [Scilit] [PubMed]
  10. Deepika, S.; Anand, G.; Bahurudeen, A.; Santhanam, M. Construction products with sugarcane bagasse ash binder. J. Mater. Civ. Eng. 2017, 29, 04017189. [Google Scholar] [CrossRef] [Scilit]
  11. Tabish, M.; Zaheer, M.M.; Baqi, A. Age dependent properties of concrete incorporating mechanically processed ultra-fine sugarcane bagasse ash. Constr. Build. Mater. 2025, 494, 143509. [Google Scholar] [CrossRef] [Scilit]
  12. Pandey, S.; Gandhi, S.; Murthy, Y.I. Effect of addition of sugarcane bagasse ash on half-cell potential of cathodically protected RCC structures subjected to chloride ingress. Mater. Today Proc. 2023, in press. [Google Scholar] [CrossRef] [Scilit]
  13. Chen, J.W.; Liao, Y.S.; Ma, F.; Tang, S.W. Effect of ground granulated blast furnace slag on hydration characteristics of ferrite-rich calcium sulfoaluminate cement in seawater. J. Cent. South Univ. 2025, 32, 189–204. [Google Scholar] [CrossRef] [Scilit]
  14. Liao, Y.; Cai, Z.; Deng, F.; Ye, J.; Wang, K.; Tang, S. Hydration behavior and thermodynamic modelling of ferroaluminate cement blended with steel slag. J. Build. Eng. 2024, 97, 110833. [Google Scholar] [CrossRef] [Scilit]
  15. Özbay, E.; Erdemir, M.; Durmuş, H.İ. Utilization and efficiency of ground granulated blast furnace slag on concrete properties—A review. Constr. Build. Mater. 2016, 105, 423–434. [Google Scholar] [CrossRef] [Scilit]
  16. Kumar, R.; Mehta, P.K.; Pal, P.R.; Ashiq, T.M. Relation among mechanical properties of ground granulated blast furnace slag concrete. Int. J. Civ. Eng. Technol. 2017, 8, 123–130. [Google Scholar]
  17. Saranya, P.; Nagarajan, P.; Shashikala, A.P. Eco-friendly GGBS concrete: A state-of-the-art review. IOP Conf. Ser. Mater. Sci. Eng. 2018, 330, 012057. [Google Scholar] [CrossRef] [Scilit]
  18. Ramezanianpour, A.A.; Kazemian, A.; Radaei, E.; AzariJafari, H.; Moghaddam, M.A. Influence of Iranian low-reactivity GGBFS on the properties of mortars and concretes by Taguchi method. Comput. Concr. 2014, 13, 423–436. [Google Scholar] [CrossRef] [Scilit]
  19. Teng, S.; Lim, T.Y.D.; Divsholi, B.S. Durability and mechanical properties of high strength concrete incorporating ultra fine ground granulated blast-furnace slag. Constr. Build. Mater. 2013, 40, 875–881. [Google Scholar] [CrossRef] [Scilit]
  20. Joshi, R.A.; Joshi, S.G.; Londhe, S.N.; Kunte, U. Influence of calcium nitrate on the development of compressive strength and carbonation resistance of GGBS concrete. Innov. Infrastruct. Solut. 2025, 10, 293. [Google Scholar] [CrossRef] [Scilit]
  21. Gholampour, A.; Zheng, J.; Ozbakkaloglu, T. Development of waste-based concretes containing foundry sand, recycled fine aggregate, ground granulated blast furnace slag and fly ash. Constr. Build. Mater. 2021, 267, 121004. [Google Scholar] [CrossRef] [Scilit]
  22. Kallimani, R.; Minde, P. Investigation on combined use of biochar and ground granulated blast furnace slag as a supplementary admixture in concrete. Environ. Sci. Pollut. Res. 2025, 32, 8201–8218. [Google Scholar] [CrossRef] [Scilit] [PubMed]
  23. Majhi, R.K.; Nayak, A.N.; Mukharjee, B.B. Development of sustainable concrete using recycled coarse aggregate and ground granulated blast furnace slag. Constr. Build. Mater. 2018, 159, 417–430. [Google Scholar] [CrossRef] [Scilit]
  24. Cahyani, R.A.T.; Rusdianto, Y. An overview of behaviour of concrete with granulated blast furnace slag as partial cement replacement. IOP Conf. Ser. Earth Environ. Sci. 2021, 933, 012006. [Google Scholar] [CrossRef] [Scilit]
  25. Akintayo, B.D.; Olanrewaju, O.A. Utilizing industrial waste for sustainable concrete: A critical analysis of ground granulated blast furnace slag in cement production. In Proceedings of the 2024 IEEE International Conference on Industrial Engineering and Engineering Management (IEEM), Bangkok, Thailand, 15–18 December 2024; pp. 1432–1438. [Google Scholar]
  26. Gautam, A.; Tung, S. Advancing sustainability in concrete construction: Enhancing thermal resilience and structural strength with ground granulated blast furnace slag. Asian J. Civ. Eng. 2024, 25, 6119–6129. [Google Scholar] [CrossRef] [Scilit]
  27. AzariJafari, H.; Shekarchi, M.; Berenjian, J.; Ahmadi, B. Enhancing workability retention of concrete containing natural zeolite by superplasticizers’ combination. Spec. Publ. 2015, 302, 416–424. [Google Scholar] [CrossRef] [Scilit]
  28. Tran, Y.T.; Lee, J.; Kumar, P.; Kim, K.H.; Lee, S.S. Natural zeolite and its application in concrete composite production. Compos. Part B 2019, 165, 354–364. [Google Scholar] [CrossRef] [Scilit]
  29. Shekarchi, M.; Ahmadi, B.; Najimi, M. Use of natural zeolite as pozzolanic material in cement and concrete composites. In Handbook of Natural Zeolites; Bentham Science Publishers: Hilversum, The Netherlands, 2012; pp. 665–694. [Google Scholar]
  30. Markiv, T.; Sobol, K.; Franus, M.; Franus, W. Mechanical and durability properties of concretes incorporating natural zeolite. Arch. Civ. Mech. Eng. 2016, 16, 554–562. [Google Scholar] [CrossRef] [Scilit]
  31. Najimi, M.; Sobhani, J.; Ahmadi, B.; Shekarchi, M. An experimental study on durability properties of concrete containing zeolite as a highly reactive natural pozzolan. Constr. Build. Mater. 2012, 35, 1023–1033. [Google Scholar] [CrossRef] [Scilit]
  32. Zhu, D.; Wen, A.; Mu, D.; Tang, A.; Jiang, L.; Yang, W. Investigation into compressive property, chloride ion permeability, and pore fractal characteristics of the cement mortar incorporated with zeolite powder. Constr. Build. Mater. 2024, 411, 134522. [Google Scholar] [CrossRef] [Scilit]
  33. Derogar, S. Effect of zeolite on dewatering, mechanical properties and durability of cement mortar. Adv. Cem. Res. 2017, 29, 174–182. [Google Scholar] [CrossRef] [Scilit]
  34. Ahmadi, B.; Shekarchi, M. Use of natural zeolite as a supplementary cementitious material. Cem. Concr. Compos. 2010, 32, 134–141. [Google Scholar] [CrossRef] [Scilit]
  35. Xu, J.; Li, Y.; Lu, L.; Cheng, X.; Li, L. Strength and durability of marine cement-based mortar modified by colloidal nano-silica with epoxy silane for low CO2 emission. J. Clean. Prod. 2023, 382, 135281. [Google Scholar] [CrossRef] [Scilit]
  36. Ekanayake, I.U.; Meddage, D.P.P.; Rathnayake, U. A novel approach to explain the black-box nature of machine learning in compressive strength predictions of concrete using Shapley additive explanations (SHAP). Case Stud. Constr. Mater. 2022, 16, e01059. [Google Scholar] [CrossRef] [Scilit]
  37. Abdulalim Alabdullah, A.; Iqbal, M.; Zahid, M.; Khan, K.; Nasir Amin, M.; Jalal, F.E. Prediction of rapid chloride penetration resistance of metakaolin based high strength concrete using Light GBM and XGBoost models by incorporating SHAP analysis. Constr. Build. Mater. 2022, 345, 128296. [Google Scholar] [CrossRef] [Scilit]
  38. Feng, D.C.; Liu, Z.T.; Wang, X.D.; Chen, Y.; Chang, J.Q.; Wei, D.F.; Jiang, Z.M. Machine learning-based compressive strength prediction for concrete: An adaptive boosting approach. Constr. Build. Mater. 2020, 230, 117000. [Google Scholar] [CrossRef] [Scilit]
  39. Lundberg, S.M.; Lee, S.I. A unified approach to interpreting model predictions. Adv. Neural Inf. Process. Syst. 2017, 30, 4765–4774. [Google Scholar]
  40. Sobol, I.M. Global sensitivity indices for nonlinear mathematical models and their Monte Carlo estimates. Math. Comput. Simul. 2001, 55, 271–280. [Google Scholar] [CrossRef] [Scilit]
  41. Saltelli, A. Making best use of model evaluations to compute sensitivity indices. Comput. Phys. Commun. 2002, 145, 280–297. [Google Scholar] [CrossRef] [Scilit]
  42. Papadakis, V.G.; Tsimas, S. Supplementary cementing materials in concrete. Part I: Efficiency and design. Cem. Concr. Res. 2002, 32, 1525–1532. [Google Scholar]
  43. Papadakis, V.G.; Antiohos, S.; Tsimas, S. Supplementary cementing materials in concrete. Part II: A fundamental estimation of the efficiency factor. Cem. Concr. Res. 2002, 32, 1533–1538. [Google Scholar]
  44. Akaike, H. A new look at the statistical model identification. IEEE Trans. Autom. Control 1974, 19, 716–723. [Google Scholar] [CrossRef] [Scilit]
  45. Berke, N.S.; Hicks, M.C. Estimating the life cycle of reinforced concrete decks and marine piles using laboratory diffusion and corrosion data. In Corrosion Forms and Control for Infrastructure; ASTM International: West Conshohocken, PA, USA, 1992; pp. 207–231. [Google Scholar]
  46. Tuutti, K. Corrosion of Steel in Concrete; Swedish Cement and Concrete Research Institute: Stockholm, Sweden, 1982. [Google Scholar]
  47. Efron, B.; Tibshirani, R.J. An Introduction to the Bootstrap; Chapman & Hall: New York, NY, USA, 1993. [Google Scholar]
  48. Jolliffe, I.T. Principal Component Analysis, 2nd ed.; Springer: New York, NY, USA, 2002. [Google Scholar]
  49. Zhang, S.; Zheng, S.; Wang, E.; Dai, H. Grey model study on strength and pore structure of self-compacting concrete with different aggregates based on NMR. J. Build. Eng. 2023, 64, 105560. [Google Scholar] [CrossRef] [Scilit]
  50. IS 516 (Part 1/Sec 1): 2021; Hardened Concrete—Methods of Test, Part 1: Testing of Strength of Hardened Concrete, Section 1: Compressive, Flexural and Split Tensile Strength, 1st Revision. Bureau of Indian Standards: New Delhi, India, 2021.
  51. ASTM C78/C78M-22; Standard Test Method for Flexural Strength of Concrete (Using Simple Beam with Third-Point Loading). ASTM International: West Conshohocken, PA, USA, 2022.
  52. ASTM C1202-19; Standard Test Method for Electrical Indication of Concrete’s Ability to Resist Chloride Ion Penetration. ASTM International: West Conshohocken, PA, USA, 2019.
  53. ASTM C267-20; Standard Test Methods for Chemical Resistance of Mortars, Grouts, and Monolithic Surfacings and Polymer Concretes. ASTM International: West Conshohocken, PA, USA, 2020.
  54. Cortes, C.; Vapnik, V. Support-vector networks. Mach. Learn. 1995, 20, 273–297. [Google Scholar] [CrossRef] [Scilit]
  55. Breiman, L. Random forests. Mach. Learn. 2001, 45, 5–32. [Google Scholar] [CrossRef] [Scilit]
  56. Geurts, P.; Ernst, D.; Wehenkel, L. Extremely randomized trees. Mach. Learn. 2006, 63, 3–42. [Google Scholar] [CrossRef] [Scilit]
  57. Chen, T.; Guestrin, C. XGBoost: A scalable tree boosting system. In Proceedings of the 22nd ACM SIGKDD International Conference on Knowledge Discovery and Data Mining, San Francisco, CA, USA, 13–17 August 2016; pp. 785–794. [Google Scholar]
  58. Ke, G.; Meng, Q.; Finley, T.; Wang, T.; Chen, W.; Ma, W.; Ye, Q.; Liu, T.-Y. LightGBM: A highly efficient gradient boosting decision tree. Adv. Neural Inf. Process. Syst. 2017, 30, 3146–3154. [Google Scholar]
  59. Carino, N.J. The maturity method: Theory and application. Cem. Concr. Aggreg. 1984, 6, 61–73. [Google Scholar] [CrossRef] [Scilit]
  60. Chen, D.; Xu, Q.; Tang, S.; Xiong, J.; Ma, L.; Dong, S.; Sun, Y.; He, X.; Hai, C.; Zhou, Y. Sustainable stabilization of loess via multi-solid waste-modified magnesium oxysulfate cement: Microstructure, mechanics, and environmental impact. Chem. Eng. J. 2026, 545, 179396. [Google Scholar] [CrossRef] [Scilit]
  61. Hammond, G.P.; Jones, C.I. Inventory of Carbon and Energy (ICE), version 2.0; Sustainable Energy Research Team, University of Bath: Bath, UK, 2011.
  62. Francioso, V.; Lopez-Arias, M.; Moro, C.; Jung, N.; Velay-Lizancos, M. Impact of curing temperature on the life cycle assessment of sugarcane bagasse ash as a partial replacement of cement in mortars. Sustainability 2023, 15, 142. [Google Scholar] [CrossRef] [Scilit]
  63. Mostafaei, H.; Bahmani, H. Sustainable high-performance concrete using zeolite powder: Mechanical and carbon footprint analyses. Buildings 2024, 14, 3660. [Google Scholar] [CrossRef] [Scilit]
  64. Raveendran, N.; Krishnan, V. Engineering performance and environmental assessment of sustainable concrete incorporating nano silica and metakaolin as cementitious materials. Sci. Rep. 2025, 15, 1482. [Google Scholar] [CrossRef] [Scilit] [PubMed]
Figure 1. Compressive strength development of all mixes at 7, 28 and 56 days.
Buildings 16 03573 g001
Figure 2. Nano-silica dose–response of compressive strength for the BM-1 and BM-2 series at 28 and 56 days.
Buildings 16 03573 g002
Figure 3. Flexural strength of all mixes at 7, 28 and 56 days.
Buildings 16 03573 g003
Figure 4. Hyperbolic strength development fits (Equation (1)) for representative mixes.
Buildings 16 03573 g004
Figure 5. Competing kinetic laws fitted to the pooled normalized strength data with Akaike weights.
Buildings 16 03573 g005
Figure 6. Flexural–compressive strength relationship (Equation (2)) compared with ACI 318, ACI 363 and IS 456 code expressions.
Buildings 16 03573 g006
Figure 7. Response surface of 28-day compressive strength over the nano-silica–zeolite design space (Equation (3)). White circles denote the experimental mixes; red stars and the dashed line denote the analytic optimum dosage NS* = 12.8 kg/m3 obtained from Equation (4), where the asterisk indicates the stationary point of the fitted response surface.
Buildings 16 03573 g007
Figure 8. Cementing efficiency factors: (left) SCBA + GGBS and zeolite relative to OPC; (right) dose-dependent average and marginal efficiency of nano-silica.
Buildings 16 03573 g008
Figure 9. RCPT charge passed with ASTM C1202 permeability classification bands.
Buildings 16 03573 g009
Figure 10. Mass loss under sulfuric acid exposure.
Buildings 16 03573 g010
Figure 11. Durability- strength coupling: (a) exponential decay of RCPT charge with compressive strength (Equation (6)); (b) collinearity of RCPT charge and acid mass loss at 28 days.
Buildings 16 03573 g011
Figure 12. Principal component analysis of the standardised six-dimensional response matrix over the thirteen mixes: (a) scores in the PC1–PC2 plane, with markers coloured by nano-silica dose; (b) response loadings on PC1 and PC2. PC1 (91.5% of variance) is interpreted as a latent statistical axis that correlates with the strength–durability response and is tentatively associated with pore connectivity.
Buildings 16 03573 g012
Figure 13. (left) Apparent chloride diffusion coefficients from Equation (7); (right) projected chloride-initiation service life from Equation (8) (50 mm cover, C s = 0.8%, C c r = 0.4%).
Buildings 16 03573 g013
Figure 14. Embodied CO2 per mix and eco-strength efficiency.
Buildings 16 03573 g014
Figure 15. Grey relational grade ranking of all mixes over six strength, durability and carbon criteria.
Buildings 16 03573 g015
Figure 16. Parity plots of predicted versus experimental compressive strength for the six models (±10% band shaded).
Buildings 16 03573 g016
Figure 17. Comparison of (a) R2 and (b) RMSE across the six models.
Buildings 16 03573 g017
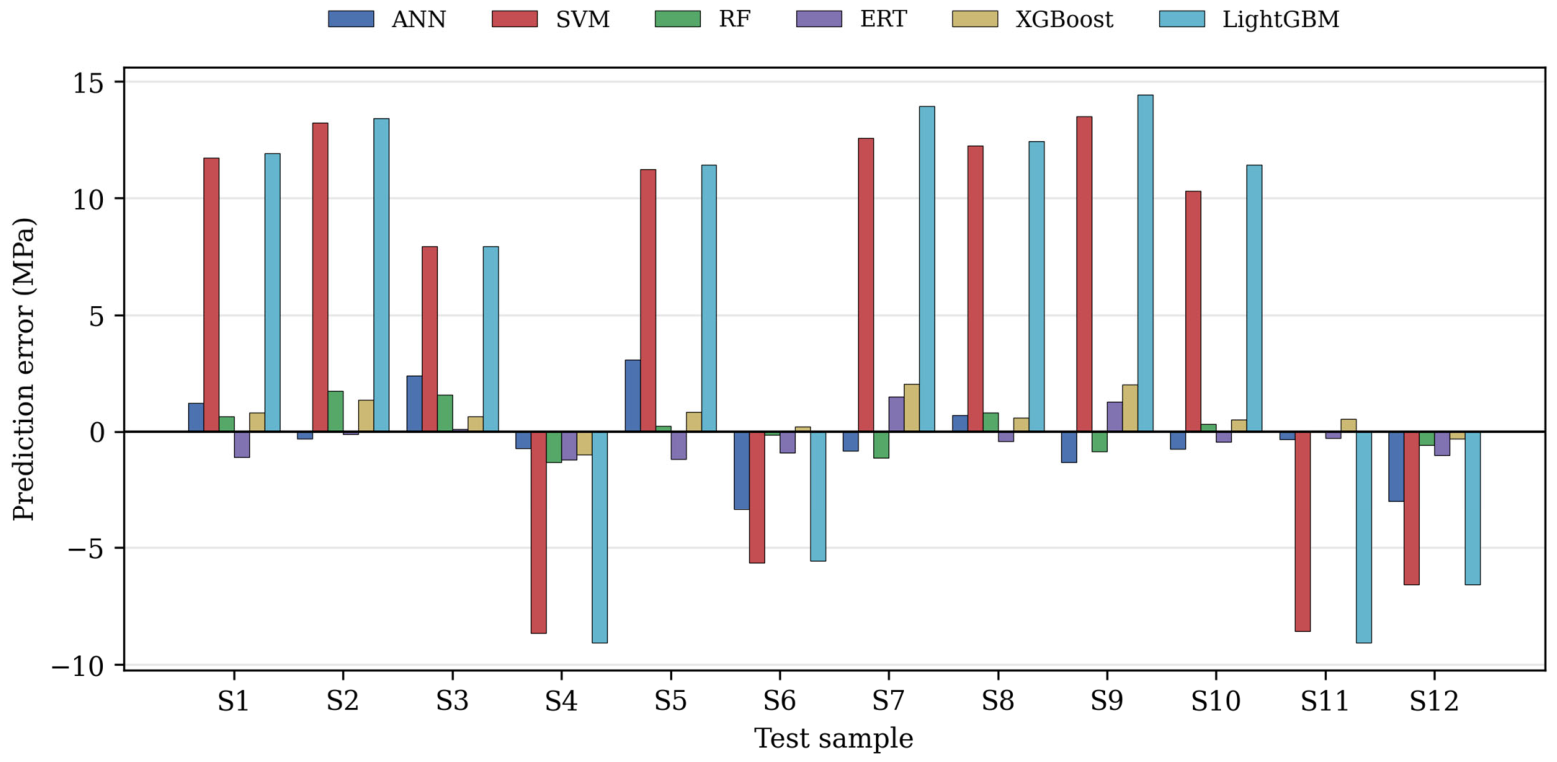
Figure 18. Per-sample prediction errors on the test set.
Buildings 16 03573 g018
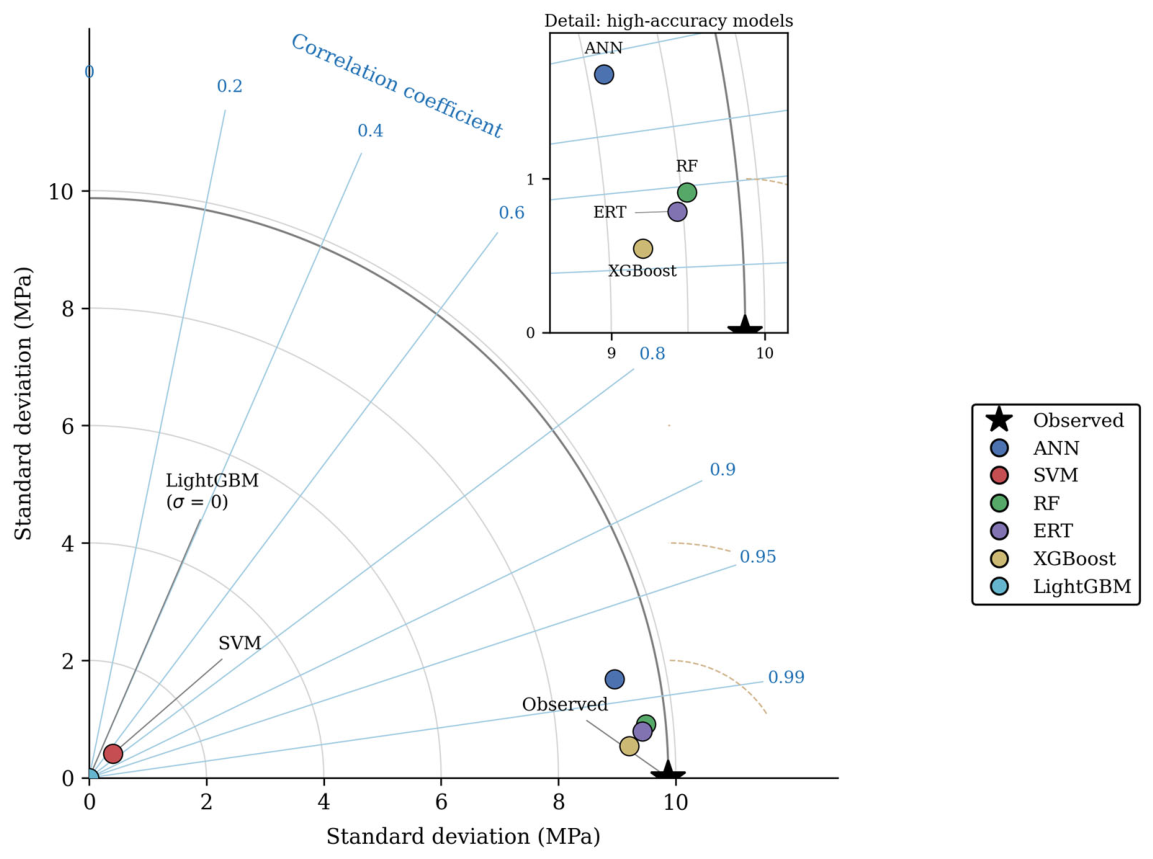
Figure 19. Taylor diagram summarizing correlation, variability and RMS error of all models against the observations.
Buildings 16 03573 g019
Figure 20. Local SHAP explanations for a representative test instance (Mix BM-2-N4 at 7 days; measured strength 24.0 MPa) for (a) ANN, (b) SVM, (c) random forest, (d) extra trees, (e) XGBoost and (f) LightGBM. Bars give each feature’s Shapley contribution in MPa relative to the model’s base value E[f(x)]; red increases and blue decreases the predicted strength. LightGBM returns a constant prediction, so all its Shapley values are zero.
Buildings 16 03573 g020
Figure 21. (a) SHAP beeswarm summary—ERT. (b) SHAP beeswarm summary—XGBoost.
Buildings 16 03573 g021
Figure 22. Mean |SHAP| feature importance across all six models.
Buildings 16 03573 g022
Figure 23. SHAP dependence plots (ERT): curing age coloured by nano-silica dose, and nano-silica coloured by curing age.
Buildings 16 03573 g023
Figure 24. First-order and total-order Sobol sensitivity indices.
Buildings 16 03573 g024
Table 1. Mix proportions (kg/m3).
MixOPCSCBAGGBSZeoliteNano-SilicaWaterFine agg.Coarse agg.
BM-04000000180659.891144.8
BM-1-N02804060200180659.891144.8
BM-1-N12764060204180659.891144.8
BM-1-N22724060208180659.891144.8
BM-1-N326840602012180659.891144.8
BM-1-N426440602016180659.891144.8
BM-1-N526040602020180659.891144.8
BM-2-N02604060400180659.891144.8
BM-2-N12564060404180659.891144.8
BM-2-N22524060408180659.891144.8
BM-2-N324840604012180659.891144.8
BM-2-N424440604016180659.891144.8
BM-2-N524040604020180659.891144.8
Table 2. Hyperbolic strength development parameters (Equation (1)).
Mix f u (MPa)k (Days)R2 f u k (MPa/Day)
BM-037.05.760.9946.42
BM-1-N035.66.990.9965.10
BM-1-N150.68.470.9715.97
BM-1-N252.37.750.9746.75
BM-1-N354.17.610.9667.11
BM-1-N452.97.580.9666.98
BM-1-N550.67.890.9746.41
BM-2-N034.46.920.9954.97
BM-2-N149.48.460.9725.84
BM-2-N251.07.720.9746.61
BM-2-N353.57.780.9736.88
BM-2-N452.37.750.9746.75
BM-2-N549.47.870.9746.28
Table 3. Information theoretic discrimination among kinetic laws (pooled normalized data, n = 39).
ModelParametersR2AICcΔAICcAkaike Weight
Hyperbolic (Equation (1))20.9579−235.90.01.000
Exponential root (CEB-FIP)10.8980−203.732.20.000
Logarithmic20.9235−212.523.30.000
Table 4. Response surface coefficients (Equation (3)).
TermβSEtp
130.48213.18369.57<0.001
NS2.55850.37696.79<0.001
Z−0.05000.0979−0.510.625
NS2−0.09990.0138−7.22<0.001
NS × Z0.00000.00810.001.000
Table 5. Effective binder efficiency parameters (Equation (5)).
ParameterValueSE
a_MPa_per_B/W13.545
k S C B A + G G B S 1.0510.256
k Z e o l i t e 0.3360.687
k N S _linear35.0003.585
k N S _quadratic−1.3270.172
Table 6. PCA loadings of the standardized 28/56-day multiresponse matrix.
ResponsePC1 LoadingPC2 Loading
fc280.418−0.254
fr280.380−0.637
RCPT28−0.412−0.379
Acid28−0.418−0.278
fc560.417−0.281
RCPT56−0.402−0.480
Table 7. RCPT-derived apparent diffusion coefficients and projected chloride-initiation service life (Equations (7) and (8)).
MixQ56 (C) D a p p (×10−12 m2/s) t i (Years)Extension vs. Control
BM-028008.1010.81.00×
BM-1-N018005.5915.61.45×
BM-1-N19003.1227.92.59×
BM-1-N26502.3836.73.41×
BM-1-N37002.5334.53.20×
BM-1-N49003.1227.92.59×
BM-1-N512003.9821.92.04×
BM-2-N019005.8514.91.39×
BM-2-N19503.2726.72.48×
BM-2-N27002.5334.53.20×
BM-2-N37502.6832.53.02×
BM-2-N410003.4125.52.38×
BM-2-N513004.2520.51.91×
Table 8. Cradle-to-gate embodied CO2 per cubic metre, 28-day compressive strength, derived eco-strength efficiency and CO2 reduction relative to the control mix.
MixCO2 (kg CO2-e/m3) f c , 28 (MPa)Eco-Efficiency (kPa per kg CO2-e)CO2 Reduction (%)
BM-037130.181.10.0
BM-1-N026828.0104.327.7
BM-1-N127041.0152.127.4
BM-1-N227143.0158.827.1
BM-1-N327245.0165.526.8
BM-1-N427344.0161.226.5
BM-1-N527441.5151.426.1
BM-2-N025127.0107.432.3
BM-2-N125340.0158.432.0
BM-2-N225442.0165.631.7
BM-2-N325544.0172.731.4
BM-2-N425643.0168.031.1
BM-2-N525740.5157.530.7
Table 9. Grey relational grades and ranking.
RankMixGRG
1BM-1-N30.9506
2BM-2-N30.9154
3BM-1-N20.8483
4BM-1-N40.8356
5BM-2-N20.8268
6BM-2-N40.8078
7BM-1-N10.7182
8BM-2-N10.7116
9BM-1-N50.6772
10BM-2-N50.6671
11BM-2-N00.4736
12BM-1-N00.4529
13BM-00.3769
Table 10. Actual versus predicted compressive strength on the 12-sample test set.
SActualANNErr %SVMErr %RFErr %ERTErr %XGBErr %LGBMErr %
124.0025.22−5.1035.74−48.9224.65−2.7122.904.6024.82−3.4035.93−49.71
222.5022.191.3835.74−58.8524.24−7.7222.390.4723.85−5.9835.93−59.69
328.0030.40−8.5835.94−28.3529.59−5.6628.09−0.3328.65−2.3235.93−28.32
445.0044.281.6036.3519.2343.682.9343.802.6744.022.1835.9320.16
524.5027.58−12.5835.74−45.8824.75−123.334.7925.33−3.3835.93−46.65
641.5038.148.1035.8513.6241.360.3340.602.1741.71−0.5135.9313.42
722.0021.163.8034.56−57.1120.875.1423.48−6.7424.05−9.3035.93−63.32
823.5024.21−3.0335.74−52.0924.30−3.4023.091.7324.09−2.5135.93−52.89
921.5020.176.1835.00−62.7920.643.9822.77−5.9223.52−9.3935.93−67.11
1024.5023.772.9834.81−42.0824.83−1.3424.071.7725.01−2.0935.93−46.65
1145.0044.670.7436.4319.0445.01−0.0244.720.6345.53−1.1735.9320.16
1242.5039.527.0235.9315.4641.921.3841.492.3942.190.7235.9315.46
Table 11. Sobol sensitivity indices of the ERT surrogate.
FactorS195% CIS_T95% CI
NanoSilica0.231±0.0510.243±0.027
Zeolite0.002±0.0040.002±0.000
Age0.754±0.0720.767±0.057
Disclaimer/Publisher’s Note: The statements, opinions and data contained in all publications are solely those of the individual author(s) and contributor(s) and not of MDPI and/or the editor(s). MDPI and/or the editor(s) disclaim responsibility for any injury to people or property resulting from any ideas, methods, instructions or products referred to in the content.