Article

Damage Behavior of a Truncated-Cone Concrete Target Under Coupled Reactive-Jet Penetration and Deflagration


State Key Laboratory of Explosion Science and Safety Protection, Beijing Institute of Technology, Beijing 100081, China
*
Author to whom correspondence should be addressed.
Buildings 2026, 16(17), 3417; https://doi.org/10.3390/buildings16173417
Submission received: 23 July 2026 / Revised: 16 August 2026 / Accepted: 19 August 2026 / Published: 26 August 2026
(This article belongs to the Section Building Structures)

Abstract

To investigate the damage behavior of a truncated-cone concrete target (TCCT) under the coupled action of reactive-jet penetration and deflagration, full-scale experiments were conducted to characterize the damage induced in the TCCT by different reactive shaped charge liner (RSCL) structures. The results show that, under the coupled action of reactive-jet penetration and deflagration, the TCCT exhibits a damage mode characterized by upper crushing and lower fracture, which is significantly affected by the RSCL structure. Based on a combined analysis of a segmented numerical simulation method for reactive-jet penetration and deflagration and the full-scale experimental results, the gain relationship between the residual mass of the reactive jet and the deflagration enhancement effect was revealed. The study shows that the internal damage of the concrete target is mainly caused by compressive waves, whereas the damage to the bottom and sidewalls is mainly caused by tensile waves reflected from the walls. The deflagration enhancement effect of the reactive jet is positively correlated with its residual mass. On average, the deflagration enhancement increased the final damaged depth and the fully damaged cross-sectional area of the TCCT by 33.4% and 117.4%, respectively.

1. Introduction

Concrete structures are widely used in modern urban, military, and other constructions because of their excellent mechanical performance and durability, and they are one of the most important structural forms in modern engineering construction [1]. With the growing complexity of engineering application scenarios, concrete structures must not only withstand long-term loads and environmental effects but may also be subjected to extreme conditions such as blast impact and penetration-induced damage [2,3,4]. Therefore, an in-depth study of the mechanical behavior and damage mechanisms of concrete structures is of great significance for improving the safety of engineering structures, refining protective design theories, and ensuring the protective capability of major infrastructure and national defense works.
Currently, research on the damage behavior of concrete media under penetration and blast loading mainly focuses on contact explosions and near-field explosions [5]. These studies have clarified the amplification effect of penetration-induced pre-damage on subsequent blast damage and have revealed the key influence of parameters such as explosive burial depth and penetration location on the damage range of large-scale structures such as concrete gravity dams. Qi et al. [6] systematically analyzed the failure mechanisms of reinforced concrete structures from four aspects: mesoscopic characteristics, static failure modes, dynamic failure mechanisms, and the role of reinforcement. They further summarized the action mechanisms of three core damage modes, namely blast loading, kinetic-energy penetration, and jet impact, on concrete structures. Based on a concrete elastoplastic model and damage theory, Jin et al. [7] derived expressions for the principal strain field and damage variable near crack tips in concrete gravity dams and established a theoretical analysis model for the damaged region of gravity dams under near-field blast loading. Cao et al. [8] explored the “optimal penetration position” that may lead to the maximum damage effect in concrete gravity dams under penetration-blast loading. Their study showed that concrete gravity dams under internal explosion are mainly characterized by local failure dominated by tensile damage but also exhibit a tendency toward overall failure such as lateral “splitting” and vertical “overturning.” Zhu et al. [9] used the drilling and blasting method to conduct explosion experiments and numerical simulations of shallow-buried and deep-buried cased charges with different burial depths and casing thicknesses and analyzed the macro-morphological evolution of ejecta craters in shallow-buried explosions as well as the plastic damage evolution law of concrete in deep-buried confined explosions. In summary, research on concrete in infinite media has gradually progressed from macroscopic failure mechanisms to quantitative analysis of specific damage scenarios such as near-field explosions and penetration-blast coupling.
Compared with concrete structures in an infinite medium, the action mechanisms and damage characteristics of finite-size truncated-cone concrete targets (TCCTs) under localized loading are more complex. This complexity stems from the fact that the outer surfaces of finite structures are relatively close, requiring consideration of the tensile wave effects caused by stress wave reflection at all free surfaces [10], which makes the analysis of the stress wave mechanism more challenging [11,12,13,14]. Xiao et al. [15] revealed the damage evolution mechanism of concrete members under contact explosion from a macro-meso coupled perspective, providing a theoretical basis for understanding the damage process of concrete targets from a multiscale viewpoint. Ma et al. [16] evaluated the damage capability of cylindrical charges against concrete truncated cones under air contact explosion, jet penetration charge (JPC), and explosively formed projectile (EFP) loading, and proposed a method for characterizing the damage degree of truncated cones. Hao et al. [17] studied the damage characteristics of concrete truncated cones under top contact explosion and found that the tensile damage at the side surface and top corner was much more severe than that at the bottom. Kang et al. [18,19,20] investigated the damage modes of truncated cones under top contact and side contact explosions and identified a characteristic coupled mode of “upper crushing and lower fracturing.” In summary, the damage forms of finite-size concrete structures under contact explosion are relatively complex, and are jointly affected by shock waves, reflected waves, transmitted waves, and diffracted waves. Different charge configurations and explosion positions lead to distinct damage modes, which usually present the coexistence of local crushing and tensile failure.
Reactive charges are a new type of energetic shaped charge fabricated by filling polymers with metal powder and then hardening them through cold pressing and sintering [21,22]. Reactive materials based on polytetrafluoroethylene (PTFE) possess a certain level of mechanical strength and can release chemical energy upon impact, triggering explosion-like reactions and generating large amounts of gaseous products [23,24,25]. The reactive jet formed by a reactive shaped charge has mechanical strength similar to that of an inert metal jet. It first penetrates the target by relying on its own kinetic energy, and after a certain delay it detonates inside the target, rapidly releasing a large amount of chemical energy and gaseous products. Through the combined action of penetration and explosion, it enhances the damage effect on the target and achieves efficient destruction [26,27,28]. Many scholars have conducted preliminary studies on the penetration of concrete targets by reactive jets. Zhou et al. [29] studied the stress wave propagation characteristics in semi-infinite concrete under the combined action of reactive jet penetration and explosion. Su et al. [30] investigated the dynamic damage behavior of composite concrete structures under the combined action of reactive jet penetration and explosion and showed that reactive jet deflagration-enhanced damage can greatly improve the destructive effect on composite concrete structures.
At present, research on concrete targets mainly focuses on shock wave effects, damage modes of TCCTs under contact explosion, and the damage behavior of large-size concrete targets under reactive jets. Studies on the damage modes and dynamic response behavior of finite-size truncated-cone concrete structures under reactive jet loading are relatively limited. The understanding of their damage mechanisms remains insufficient, and the relevant theoretical models and failure criteria lack support, which limits the accuracy of evaluating the damage resistance and protective design of such targets. Therefore, based on previous studies, this paper conducts full-scale experiments on reactive shaped charges acting on a TCCT, and statistically analyzes the damage of concrete targets produced by reactive shaped charges with different structures. Combined with a penetration-deflagration segmented numerical algorithm and the introduction of reactive jet relaxation time, the damage modes of finite-size truncated-cone concrete structures under the combined action of reactive jet penetration and explosion, as well as the damage gain induced by reactive jet deflagration enhancement, are analyzed.

2. Materials and Methods

2.1. Experimental Section

2.1.1. Preparation of the Reactive Shaped Charge Liner (RSCL)

The RSCLs used in the experiments were all fluoropolymer-based reactive materials, composed of 73.5% PTFE (DuPont, type MP 1500 J, Wilmington, DE, USA) and 26.5% Al (Hunan Goldsky Aluminum Industry High-Tech Co., Ltd., Changsha, China, JT-4). The preparation of this RSCL mainly involves three steps [31]:
(1)
Powder mixing: PTFE powder was dried in a vacuum environment at 82 °C and dehydrated at high temperature, so that the resulting powder was less likely to agglomerate. Aluminum powder was then added slowly in multiple batches for dry mixing to obtain a uniformly mixed PTFE/Al reactive material powder.
(2)
Cold pressing: According to the liner structure, the required mass of reactive material powder was calculated. The mixed and dried powder was weighed, passed through a coarse sieve, and then loaded into the mold. Pressure was applied at 300 MPa to obtain the specimen. The specimen was then placed under ambient pressure and temperature for 24 h to remove internal air and residual stress.
(3)
Sintering and hardening: Under nitrogen protection, the cold-pressed reactive material liner was sintered and hardened. The temperature was raised to a maximum of 389 °C, held for 4 h, then lowered to 315 °C at a rate of 0.5 °C/min and maintained for 4 h. After sintering, the liner was cooled in the furnace to room temperature [32].
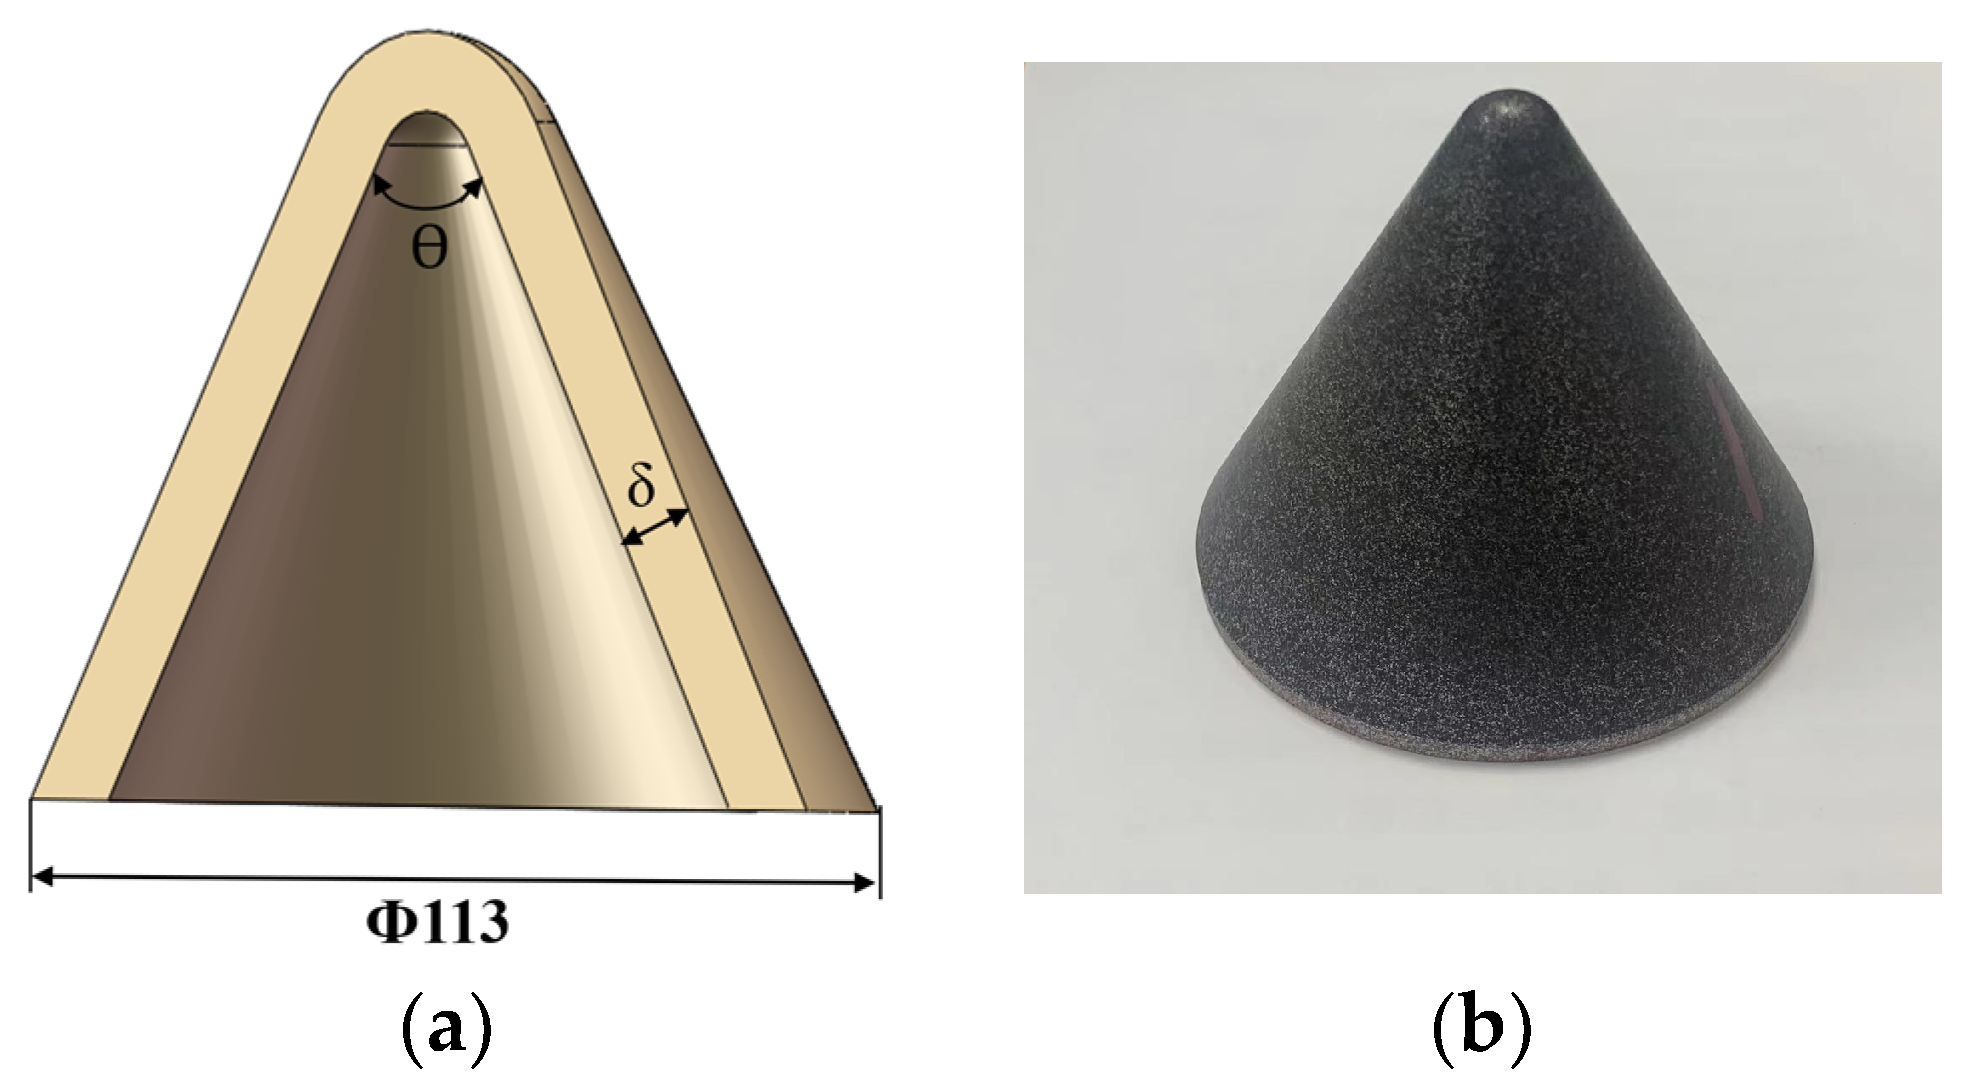
The thicknesses of the reactive material liners δ were 0.08 charge diameter (CD) and 0.10 CD, respectively, and the cone angles θ were 60° and 70°, respectively. The geometric configurations and typical samples of the RSCLs prepared by the above three steps are shown in Figure 1.

2.1.2. Experimental Setup

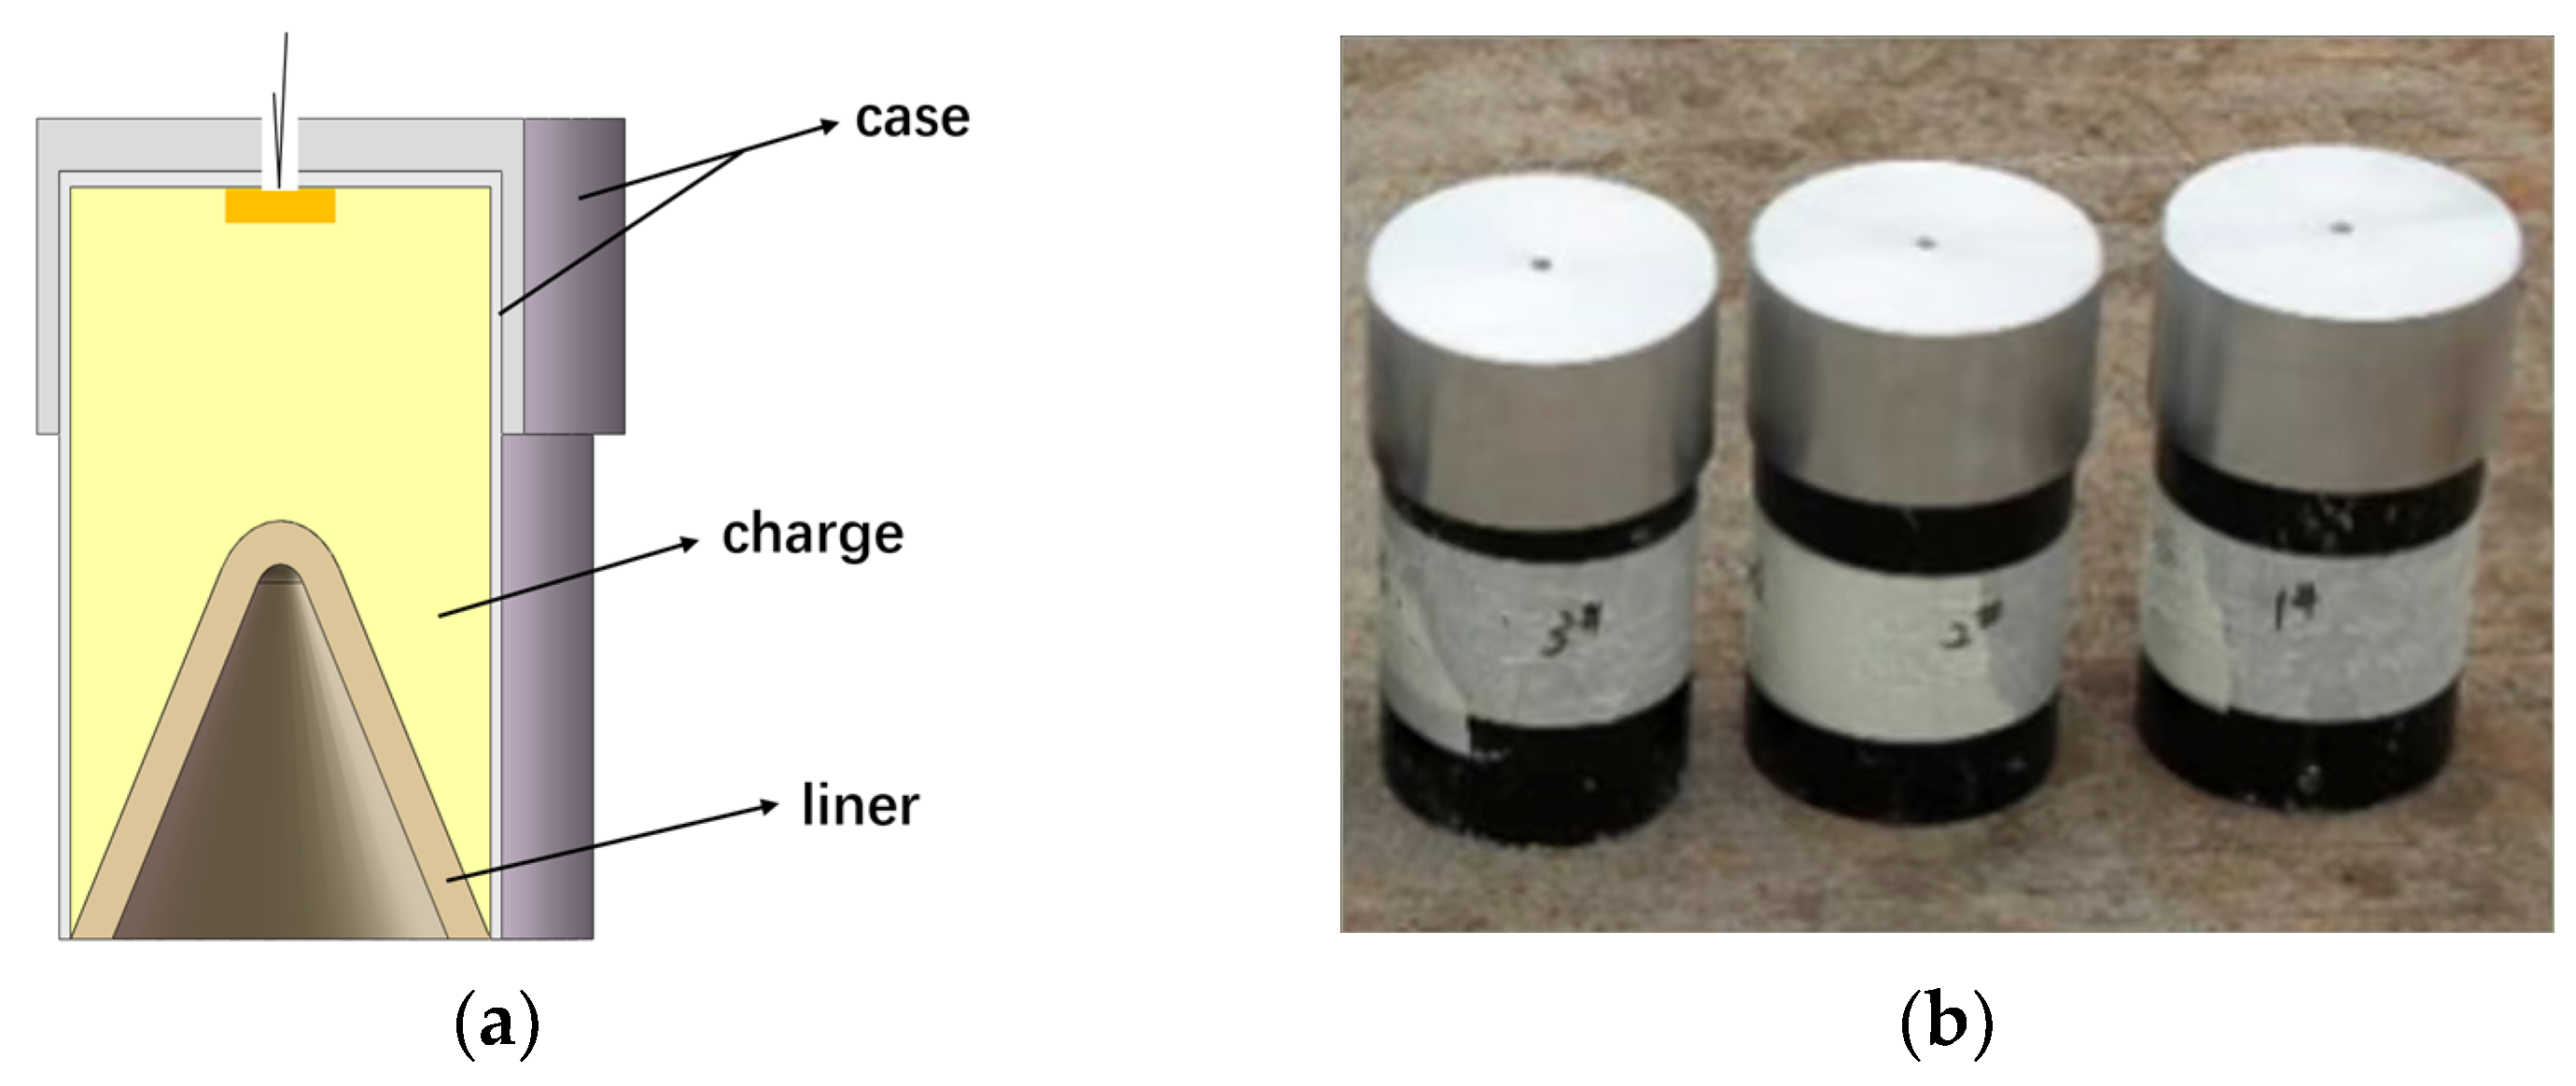
The diameter of the RSCL was 113 mm. The liner wall thicknesses were 0.08 CD and 0.1 CD, and the cone angles were 60° and 70°, respectively. The reactive shaped charge warhead used in the test is shown in Figure 2. The charge length was 143 mm, the casing thickness was 3 mm, the explosive material was 8701, and the casing material was 45 steel.
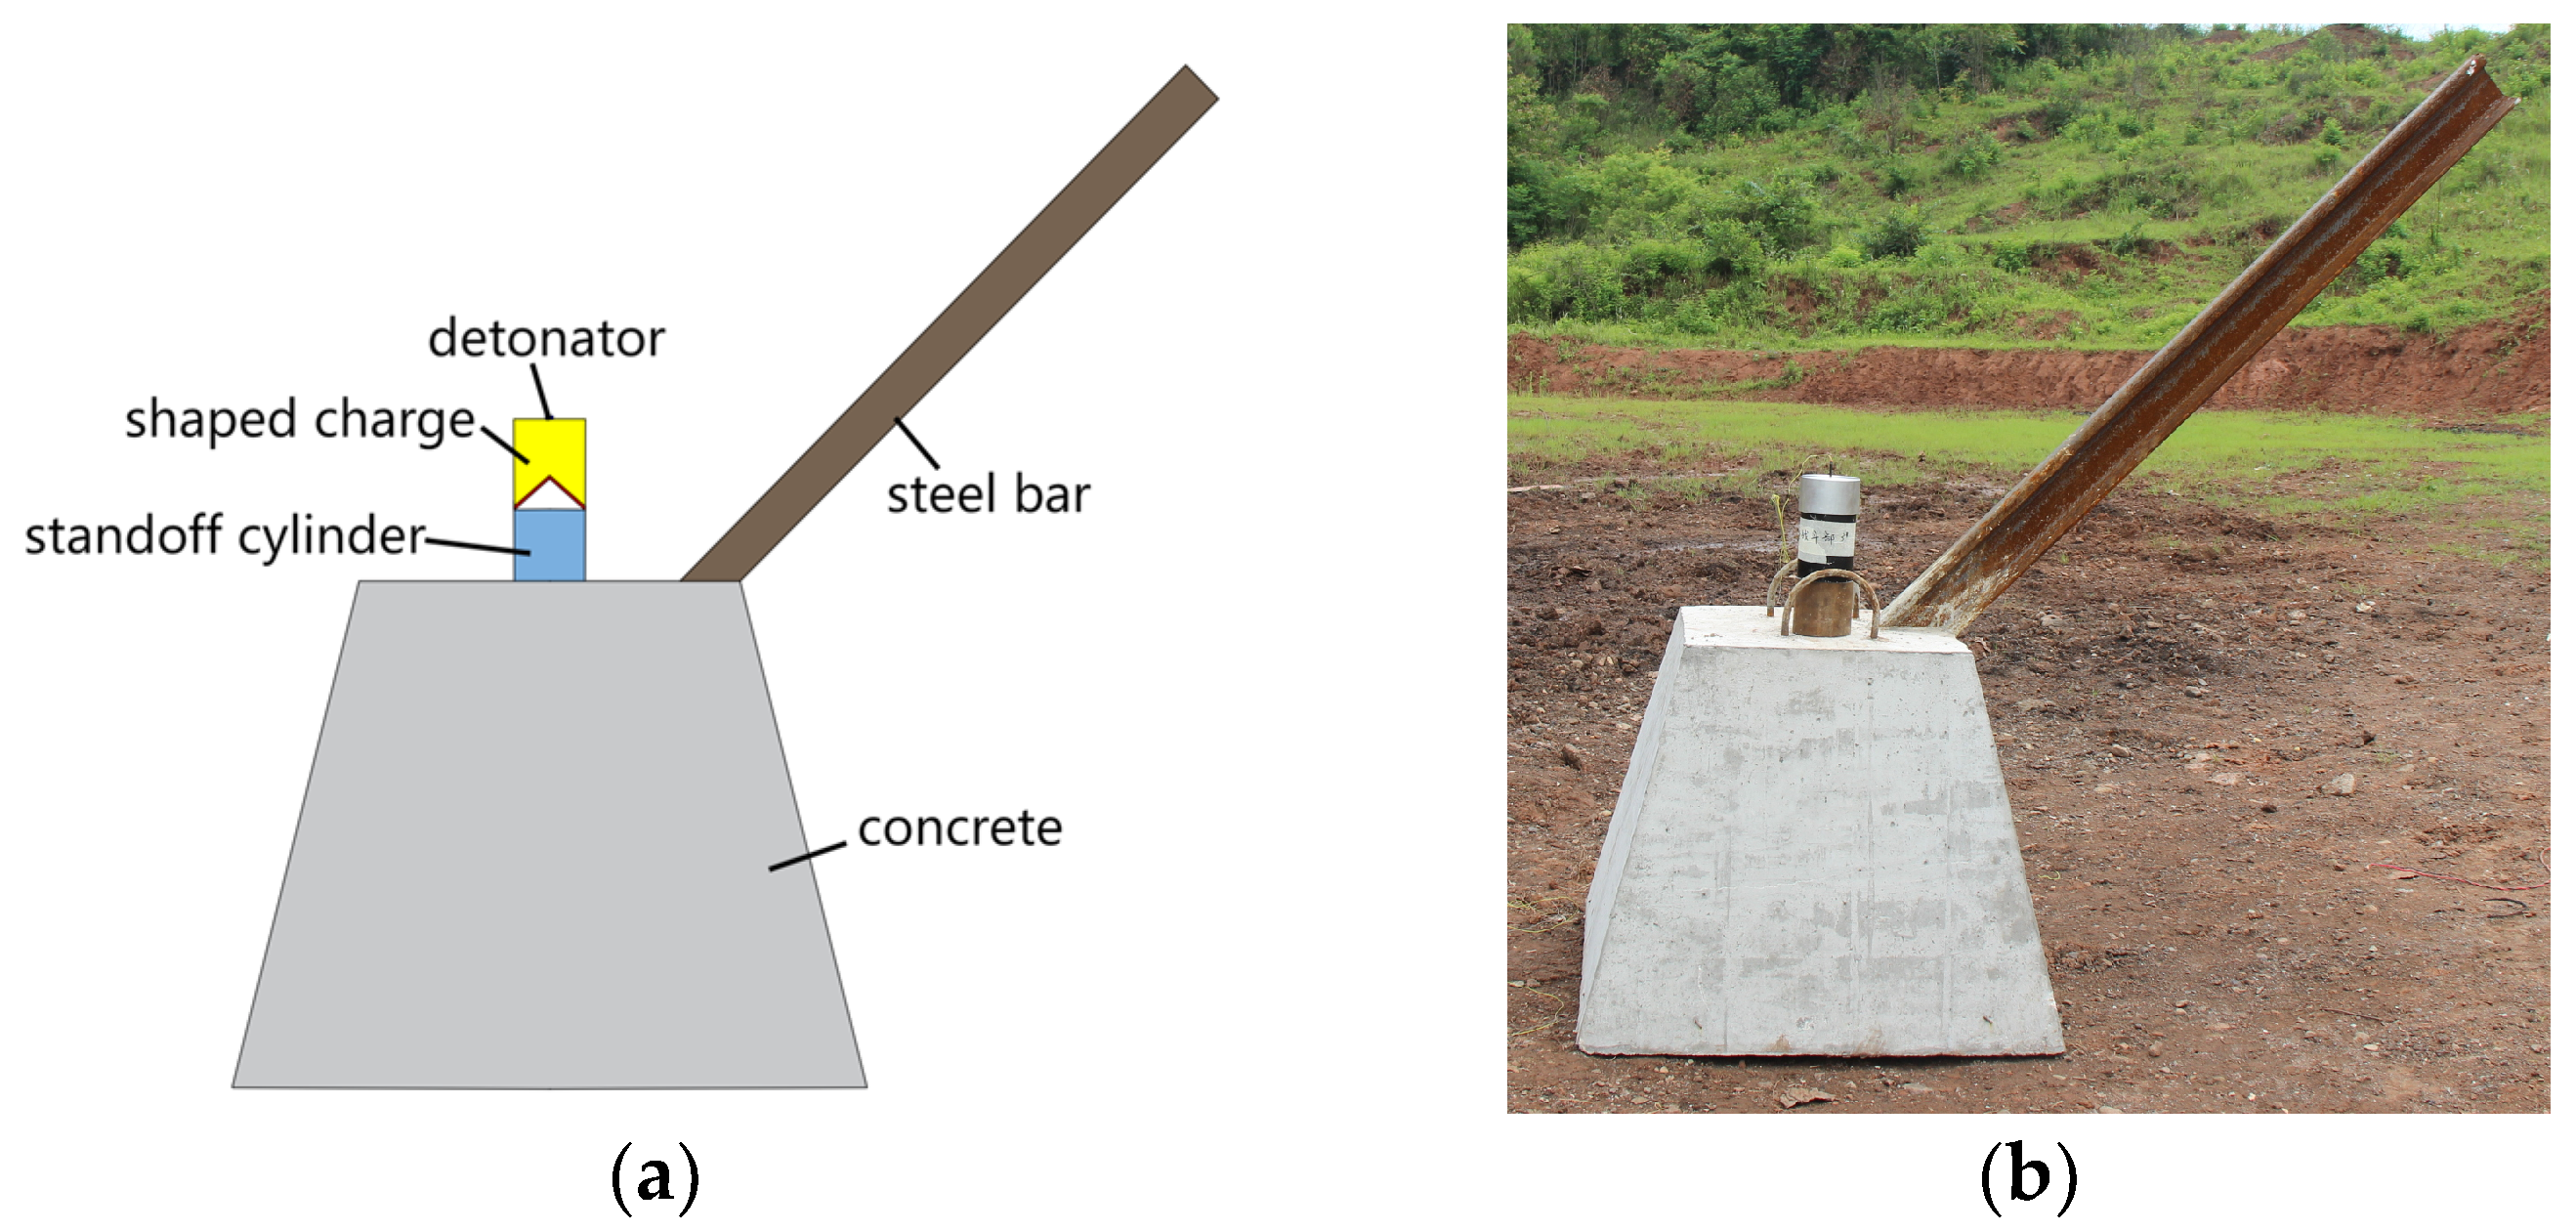
The experimental setup mainly consisted of the reactive shaped charge warhead, the standoff cylinder, and the concrete target. Specifically, it included the booster charge column, detonator, RSCL, main charge, and casing. The standoff cylinder was a hollow circular cylinder with a height of 120 mm and a wall thickness of 5 mm. During the test, high-speed ground photography and drone aerial photography were used to record the damage process.
The concrete target was a frustum-shaped block with an upper base of 600 mm × 600 mm, a lower base of 1000 mm × 1000 mm, and a height of 800 mm. The concrete was cast in accordance with the C35 design-strength grade. Within 12 h after casting, the target was covered and maintained in a moist condition. During the first 7 d, it was protected from direct sunlight and watered three times daily, followed by natural curing for another 21 d. Thus, the concrete age at the time of testing was 28 d. According to the fabrication specification, the static compressive strength of the concrete target was required to be not less than 35 MPa. No independent compressive-strength test was conducted; therefore, the actual compressive strength was unavailable, and 35 MPa represents the specified minimum strength rather than a measured value.
The concrete target was unreinforced, with no reinforcing bars or reinforcement mesh. A single steel rail, serving as the tested structural component rather than concrete reinforcement, was obliquely embedded through the upper surface of the target. The rail was inclined at 45–55° relative to the upper surface and had an embedment length of 600 mm measured along its longitudinal axis. The projection of the rail axis onto the upper surface was parallel to two opposite edges of the target, and the rail–concrete intersection was located 150 mm from the upper edge in the direction of inclination.
In the test, the reactive shaped charge warhead was placed on the standoff cylinder, and the standoff cylinder was positioned at the geometric center of the upper base of the concrete target. The test principle and site arrangement are shown in Figure 3. The specific test conditions are listed in Table 1, mainly involving the damage behavior of concrete targets under RSCLs with different thicknesses and cone angles.

2.2. Numerical Simulation

2.2.1. Material Model

Numerical simulations were performed using ANSYS AUTODYN 2022 R1 (ANSYS, Inc., Canonsburg, PA, USA). The material and structure of the reactive shaped charge were kept the same as those used in the experiments. In the simulation, the strength models and equations of state of the air, explosive, and casing in the computational domain are listed in Table 2, and the concrete material parameters are listed in Table 3. Before the relaxation time of the reactive material, the reactive jet was considered inert and was described in the same way as 45 steel using the shock equation of state and the Johnson-Cook strength model to capture large strain, large strain rate, and high-temperature behavior [33,34].
Because reactive materials exhibit reaction delay characteristics, the process by which the reactive shaped charge acts on this finite-size concrete target can be divided into two stages [28]:
The first stage is the jet formation and kinetic penetration stage. In this stage, the reactive material is treated as inert, and the numerical simulation focuses only on the penetration behavior of the reactive jet into the concrete target. The reactive material is described using the shock equation of state and the Johnson–Cook strength model. Based on split Hopkinson pressure bar compression tests and quasi-static compression tests, Raftenberg et al. [35] obtained the material parameters of unreacted PTFE/Al, as shown in Table 4. Here, c0 and s denote the material shock adiabatic parameters, A is the yield strength, B is the strain hardening constant, n is the strain hardening exponent, c is the strain-rate hardening constant, and m is the thermal softening coefficient.
The second stage is the deflagration reaction stage of the reactive jet. After reaching the relaxation time, the remaining reactive jet undergoes a violent deflagration inside the concrete target, releasing a large amount of chemical energy and gaseous products [36]. In this stage, the structural damage behavior of the remaining reactive jet on the concrete target is mainly investigated. The intense chemical reaction of the reactive material in this stage can be described by the Jones–Wilkins–Lee (JWL) equation of state. The parameters of 8701 and the activated reactive material are listed in Table 5, and the specific form of the JWL equation for the reactive material is as follows [31]:
p = 4.7356 × 10⁵ e 50.467 V + 30.62 e 4.9234 V + 0.31403 C v
In the equation, p is pressure, V is specific volume, T is temperature, and Cv is constant-volume specific heat.

2.2.2. Piecewise Numerical Algorithm for Penetration-Deflagration

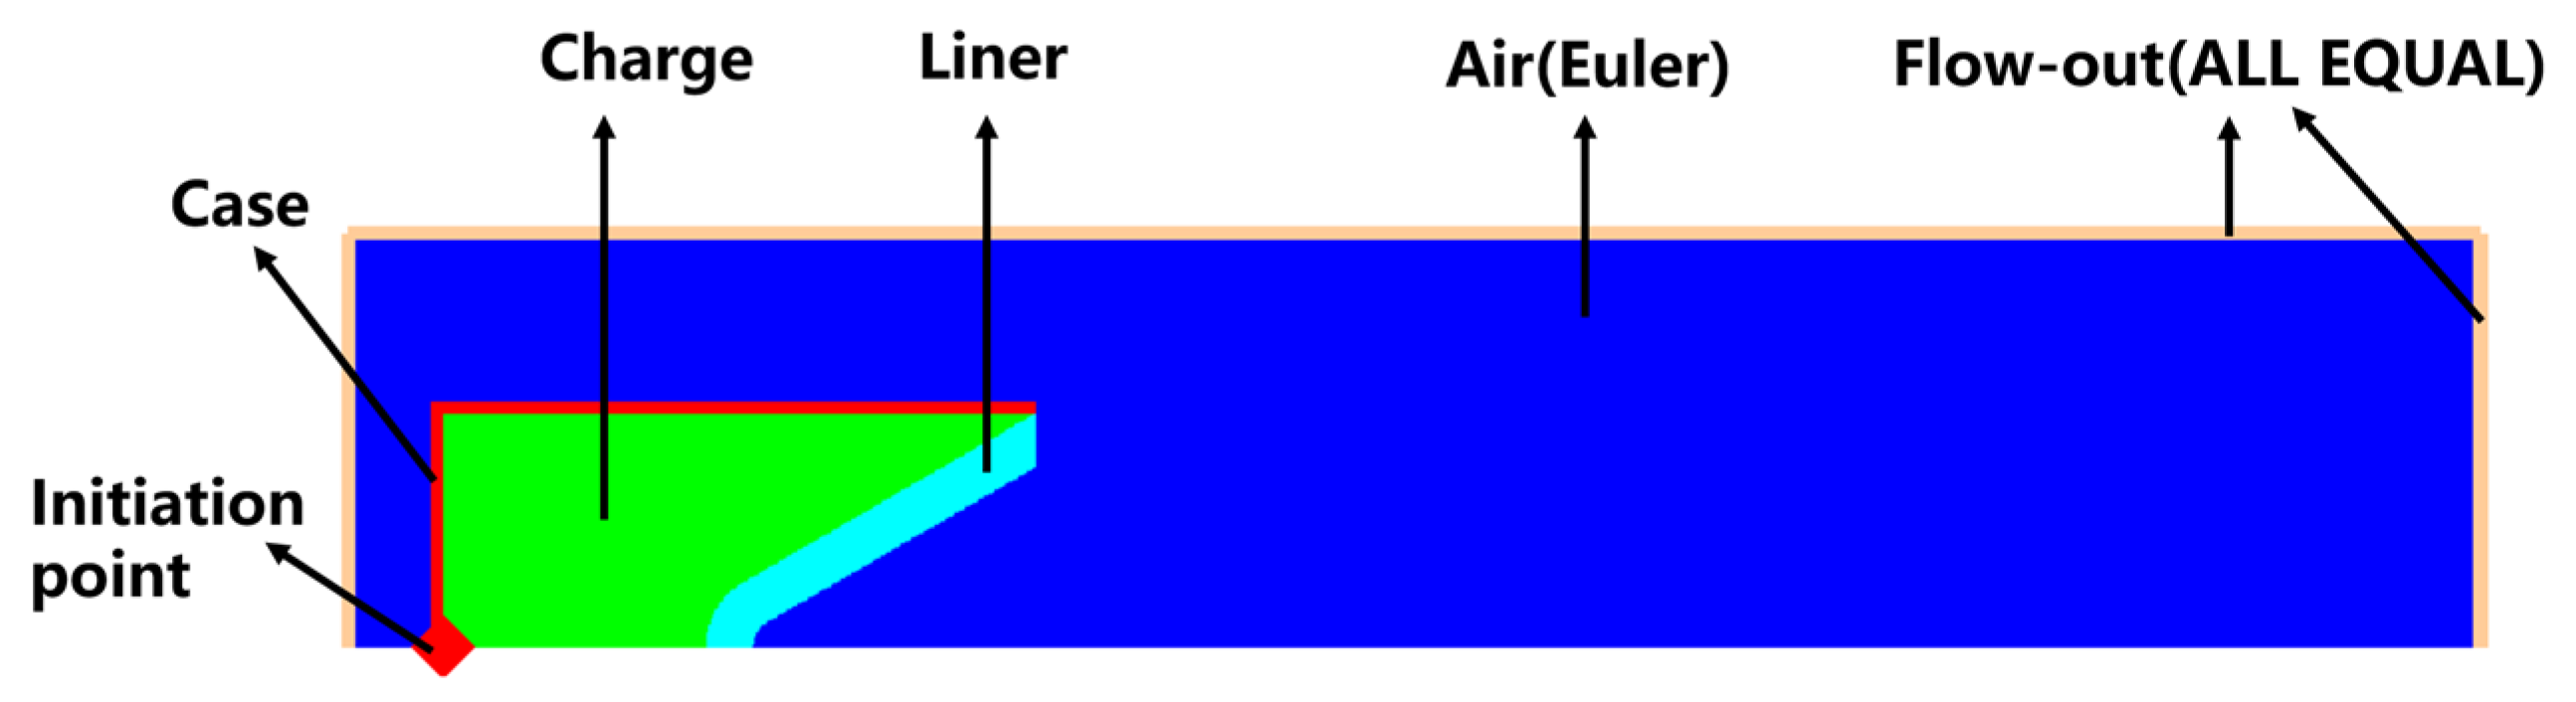
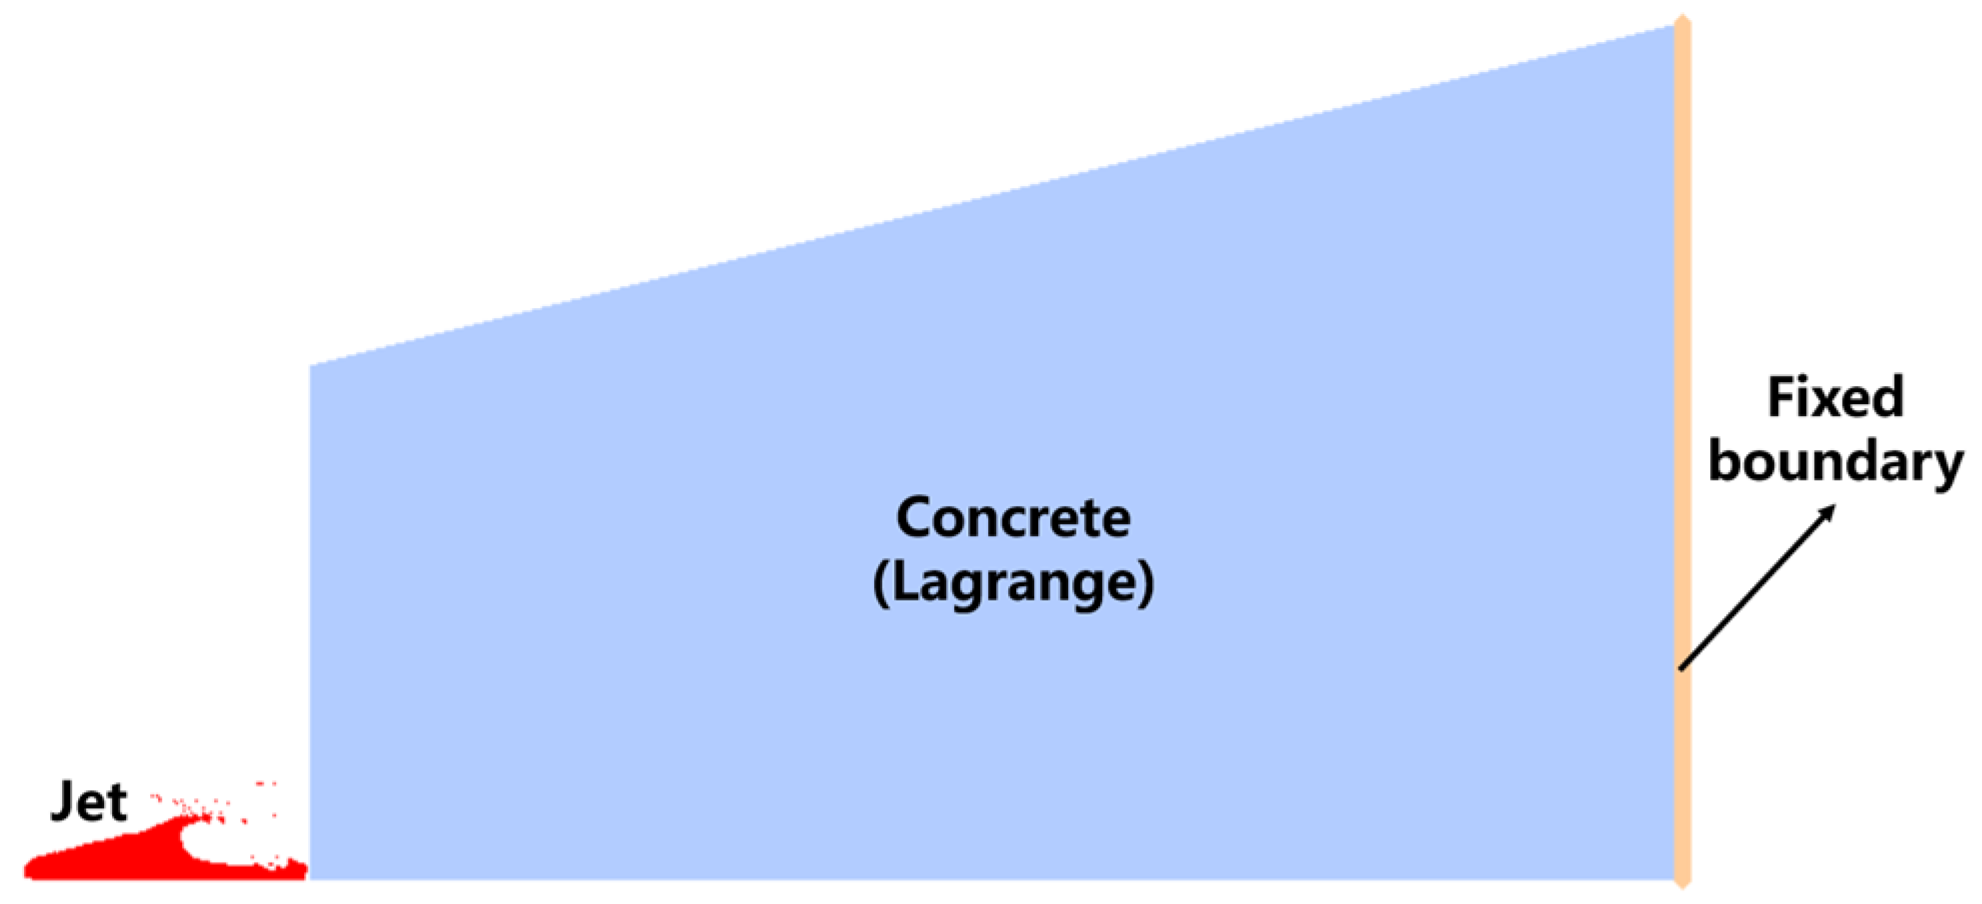
To improve computational efficiency, a two-dimensional axisymmetric half-model was used in the numerical simulation. The reactive jet formation process was calculated using the Euler algorithm, and the computational model is shown in Figure 4. When the reactive jet reached the prescribed stand-off distance, it was extracted and mapped onto the concrete target modeled with the Smoothed particle hydrodynamics (SPH) algorithm for the kinetic penetration stage of the reactive jet, as shown in Figure 5.
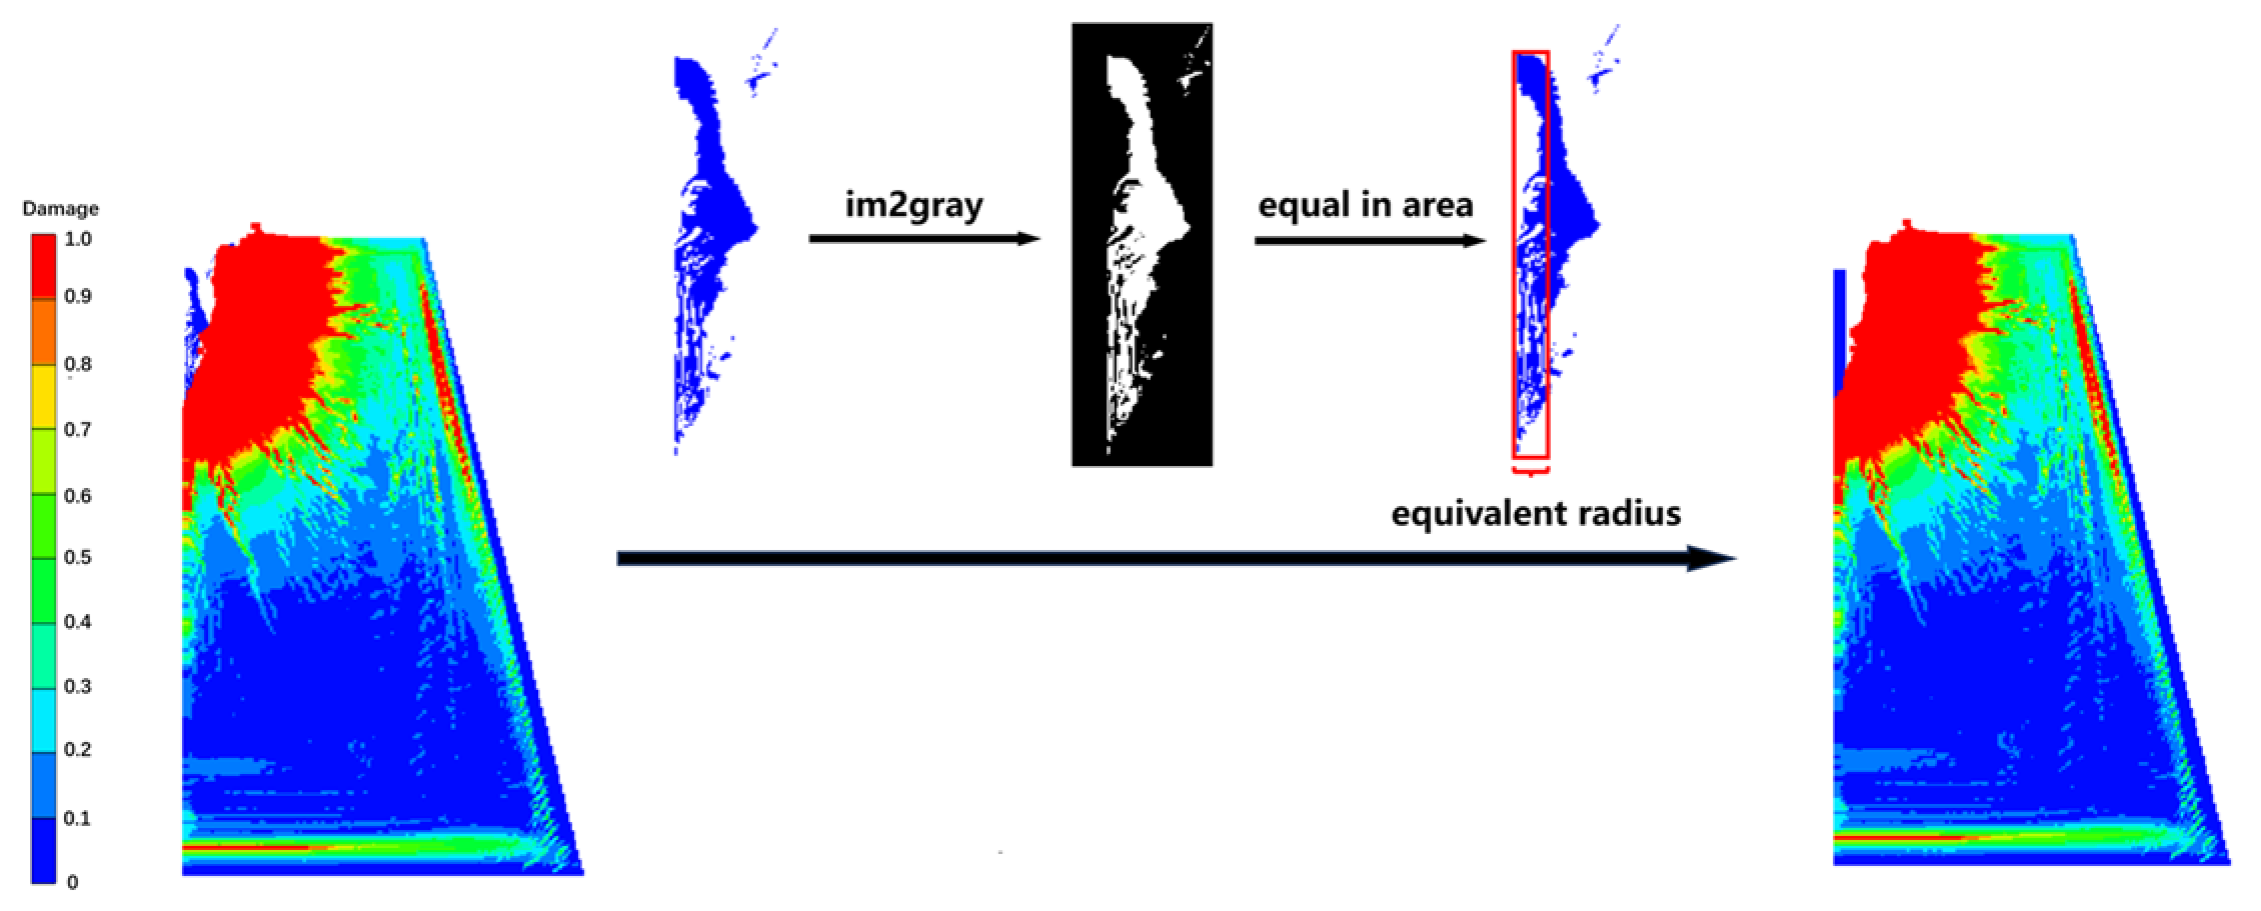
Before the second-stage calculation, the JWL model of the reactive material was introduced into the jet at time τ by means of a restart procedure, converting the jet into SPH particles with reaction parameters to simulate the enhanced damage caused by the chemical reaction. During algorithm conversion, the reactive jet that had reached the relaxation time was simplified as an equivalent cylindrical jet of equal mass [29]. First, the image of the reactive jet at the end of penetration was extracted and binarized using the im2gray function in MATLAB R2022a (MathWorks, Natick, MA, USA), and then the cross-sectional area of the jet was calculated using the imageRegionAnalyzer function. Finally, while keeping the height of the cylindrical charge equal to the jet length, the equivalent radius of the cylindrical charge was calculated, and the cylindrical jet for SPH was established. The algorithm conversion and jet equivalence process are shown in Figure 6. Through continuous simulation and algorithm conversion, the combined damage mechanism of kinetic penetration and deflagration-induced chemical energy release of the reactive jet acting on the concrete target was effectively resolved.

3. Results

3.1. Concrete Target Damage Process

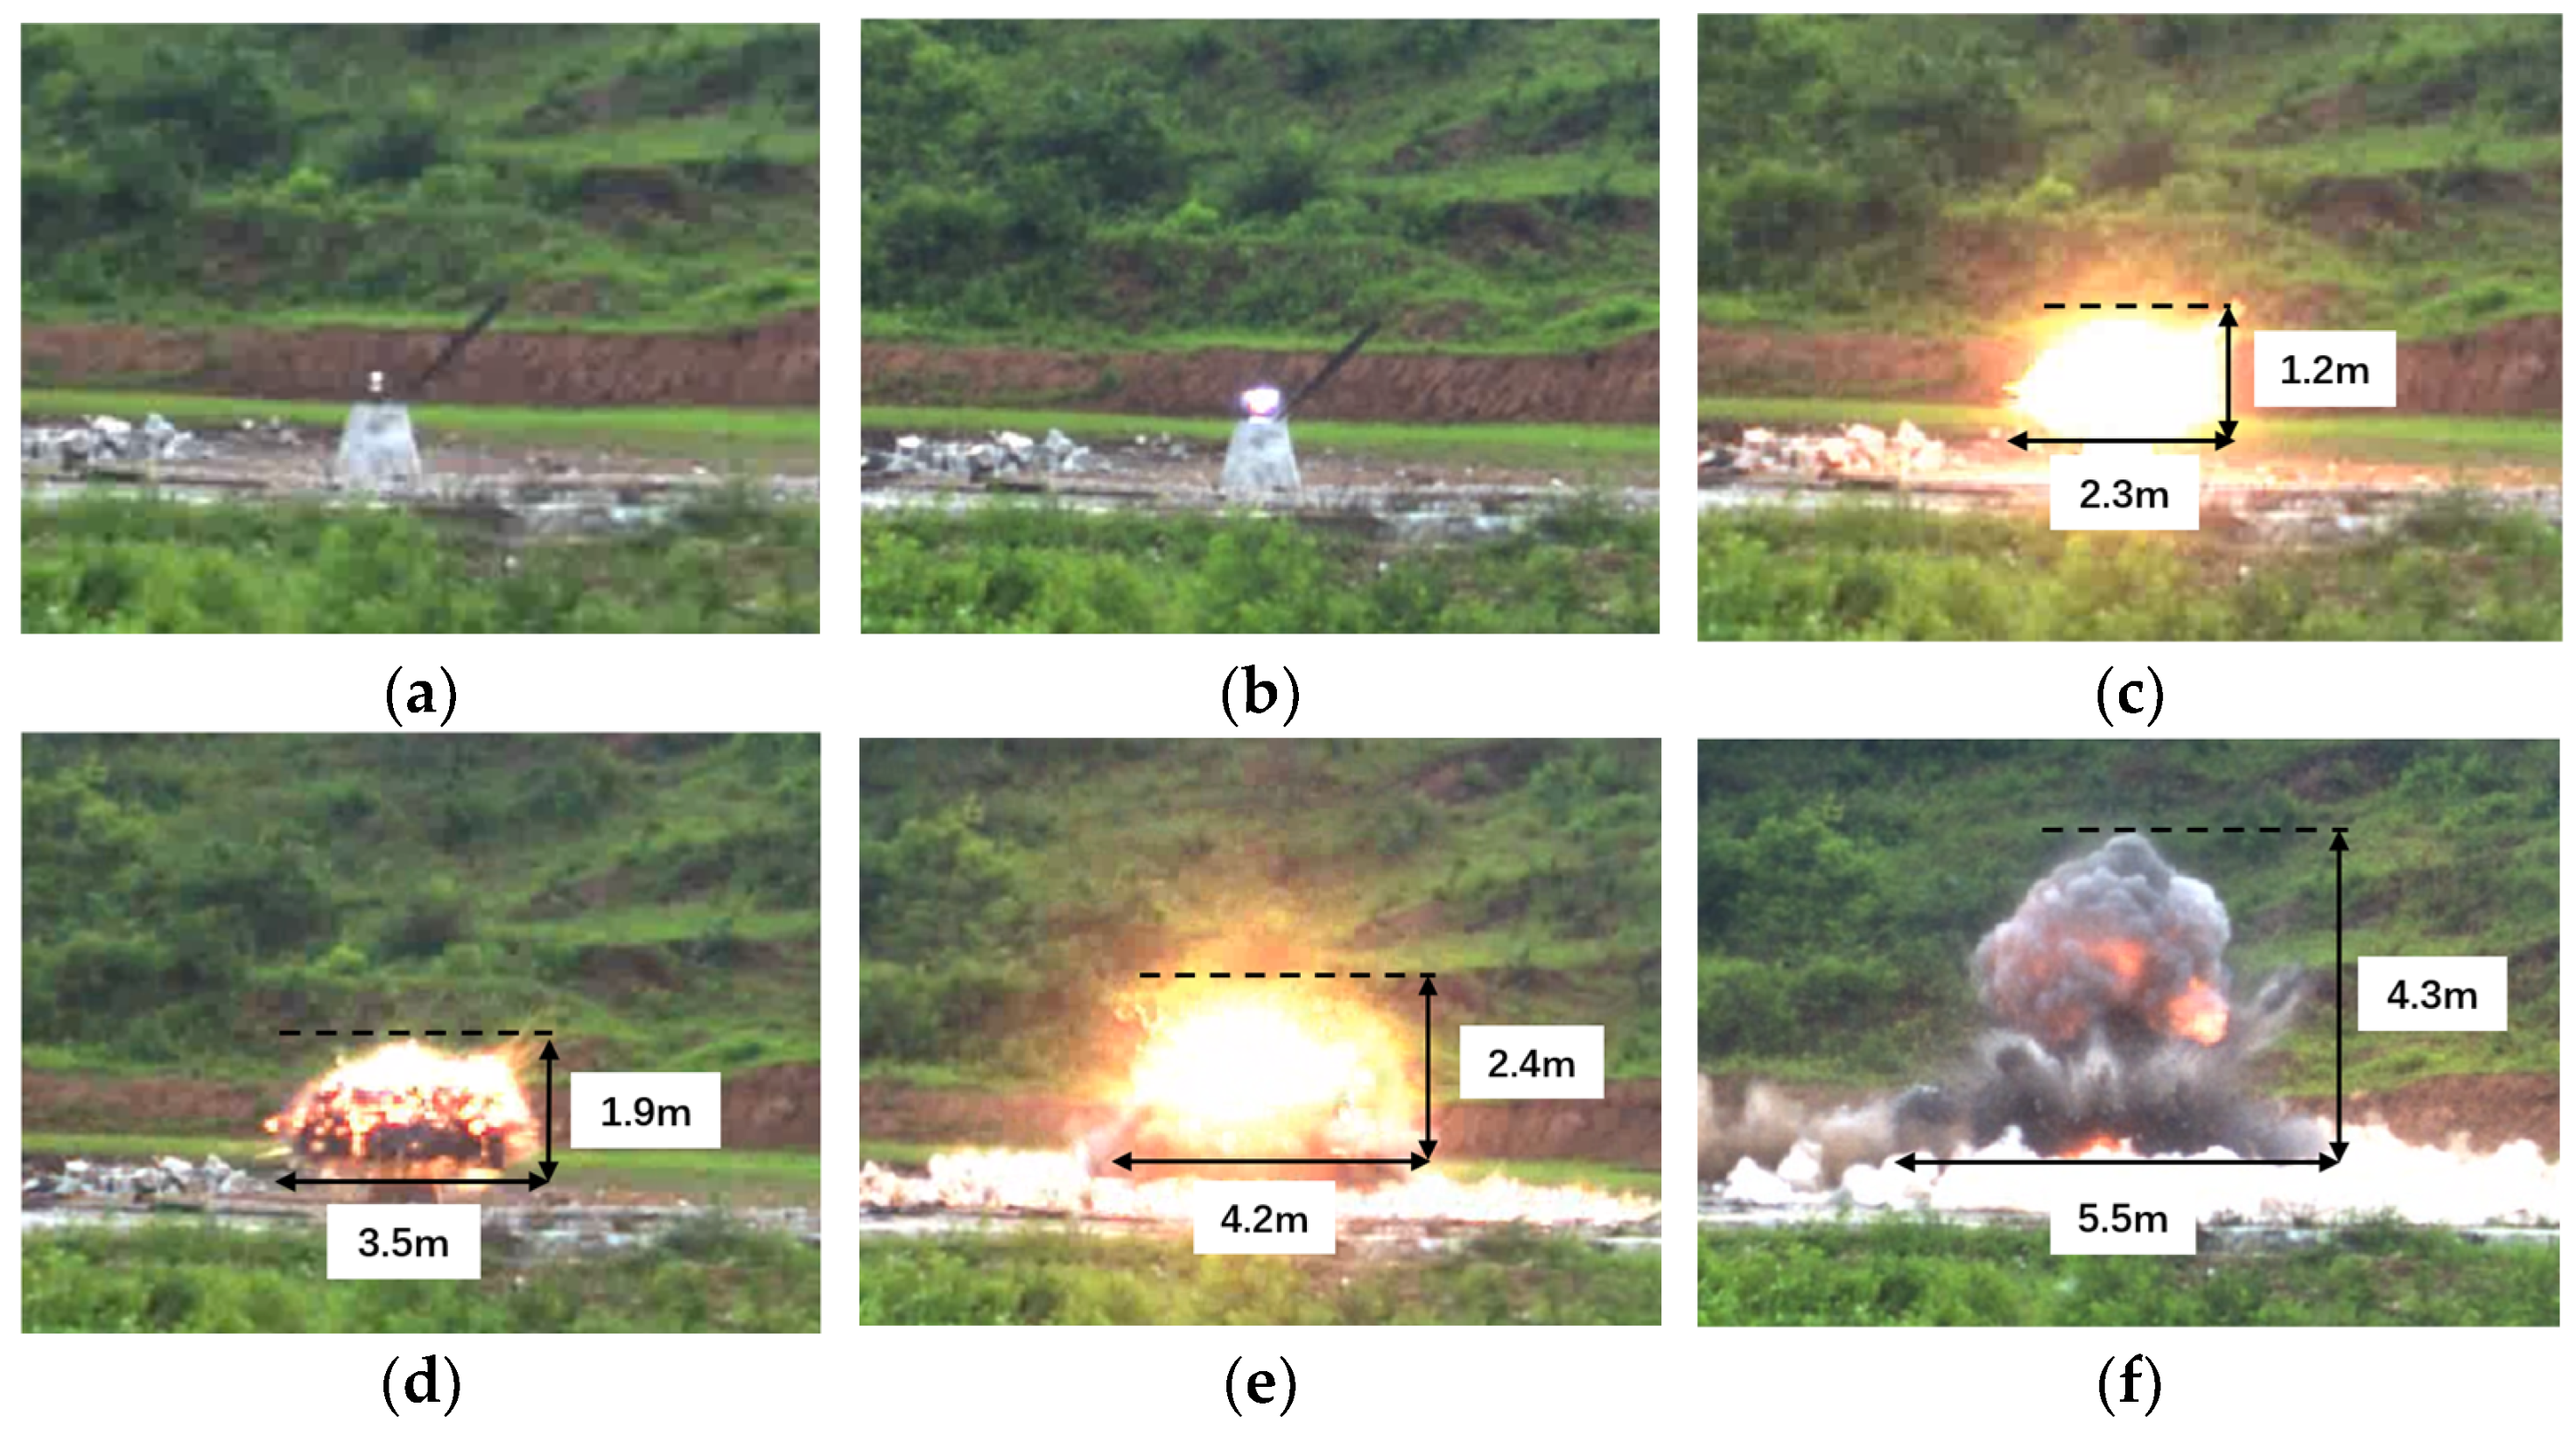
The typical damage process of the TCCT under the action of the reactive shaped charge warhead is shown in Figure 7. At t1, the shaped charge and the concrete target were in the initial state. At t2, the main charge of the shaped charge detonated, producing a flash of light, and the liner began to collapse under the action of the detonation wave. At t3, the charge emitted an intense flash of light, and the reactive jet entered the kinetic penetration stage. At t4, black reaction products appeared in the bright flash. This was because, under the impact loading, the reactive jet reached the reaction relaxation time, the internal PTFE matrix began to react, and C2F4 was released. When the reactive material did not fully react, fine carbon particles were formed and suspended in the air, producing visible black products. The main reaction process is given in [30]:
4Al + 3C2F4 → 4AlF3(g) + 6C
4Al + C2F4 → 4AlF + 2C
2Al + C2F4 → 2AlF2(g) + 2C
The formation of these products indicates that the reactive material underwent a violent deflagration reaction during penetration. At t5, the reactive material reacted completely, producing a strong and intense flash. At t6, the reaction had basically ended, and the black products took on a mushroom-cloud shape and dispersed with the smoke. Meanwhile, the concrete target fractured, and the resulting fragments were thrown outward in all directions.

3.2. Concrete Target Damage Results

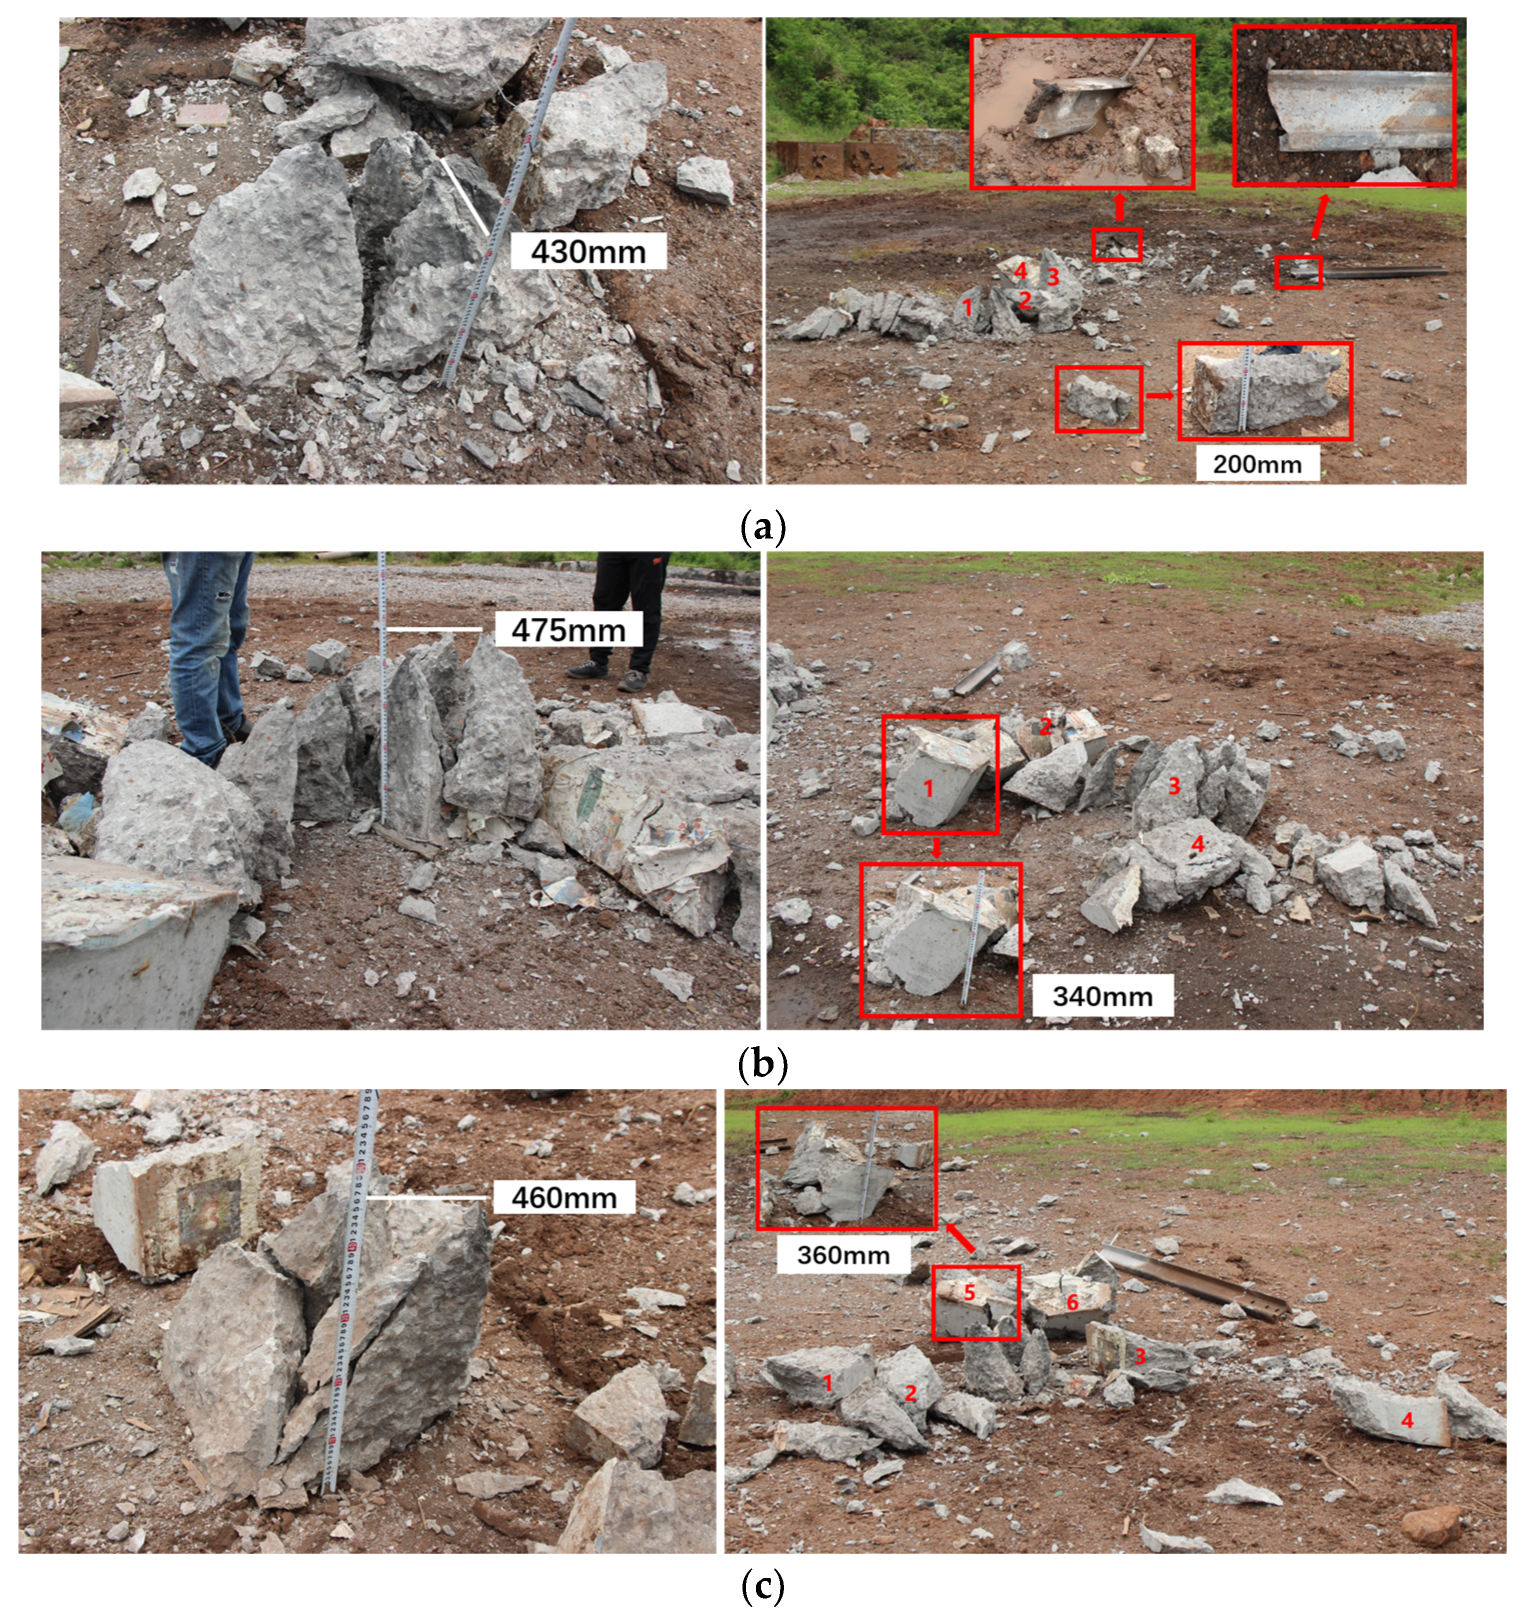
The TCCT exhibited different damage modes under the action of shaped charges equipped with RSCLs of different structures. According to the test results, fragments with lengths greater than 300 mm in two directions were defined as large fragments, fragments with lengths less than 100 mm in all directions were defined as ineffective fragments, and the rest were defined as small fragments. The total number of large and small fragments was taken as the number of effective fragments. Since the reactive shaped charge warhead was located at the center of the top surface of the concrete target and the target dimensions increased gradually from top to bottom, the upper and lower parts of the truncated-cone concrete target exhibited different failure modes under the coupled action of reactive jet kinetic penetration and internal deflagration. The upper part underwent pulverization damage, producing mainly small and ineffective fragments, while the lower part underwent fracture damage, producing mainly large fragments. Therefore, the upper part of the TCCT was defined as the pulverized zone and the lower part as the fractured zone [19]. The damage to the concrete target under different charge configurations is shown in Figure 8.
Under the action of the reactive shaped charge warhead, the upper part of the concrete target was completely fragmented, producing a large number of ineffective fragments, which were mainly scattered around the original target position. The lower part of the concrete target fractured into larger fragments, and the size and number of these large fragments were significantly affected by the RSCL structure in the shaped charge. For the Type I RSCL shaped charge, the damage to the concrete target is shown in Figure 8a. The maximum remaining height of the concrete target was 430 mm, there were four large fragments, the steel rail in the target flew approximately 10 m away from the original concrete area and fractured, and the number of ineffective fragments was large, with a scattering range of about 20 m. The test results for the Type II RSCL shaped charge are shown in Figure 8b. The maximum remaining height of the concrete target was 475 mm, and there were also four large fragments. However, the fragments of all types were distributed more concentrically than in the Type I case, mainly around the original position of the concrete target. The steel rail flew approximately 5 m away from the fragment area and did not fracture. After the Type III RSCL shaped charge acted on the target, the remaining height of the concrete target was 460 mm, there were six large fragments, the total number of effective fragments was smaller, and the fragment scattering range was smaller than that under the previous two conditions. The steel rail structure remained intact and did not fly out of the fragment area.
Table 6 summarizes the statistics of concrete fragments under RSCLs with different structures. The comparison shows that the Type I RSCL shaped charge had the strongest combined penetration-blast damage capability against this finite-size concrete target, as indicated by the smallest remaining target height, the largest fragment scattering range, and the most severe steel rail damage. Under the other two conditions, the remaining target height, fragment scattering range, and degree of steel rail damage were all lower.

3.3. Typical Penetration-Blast Coupled Damage Process

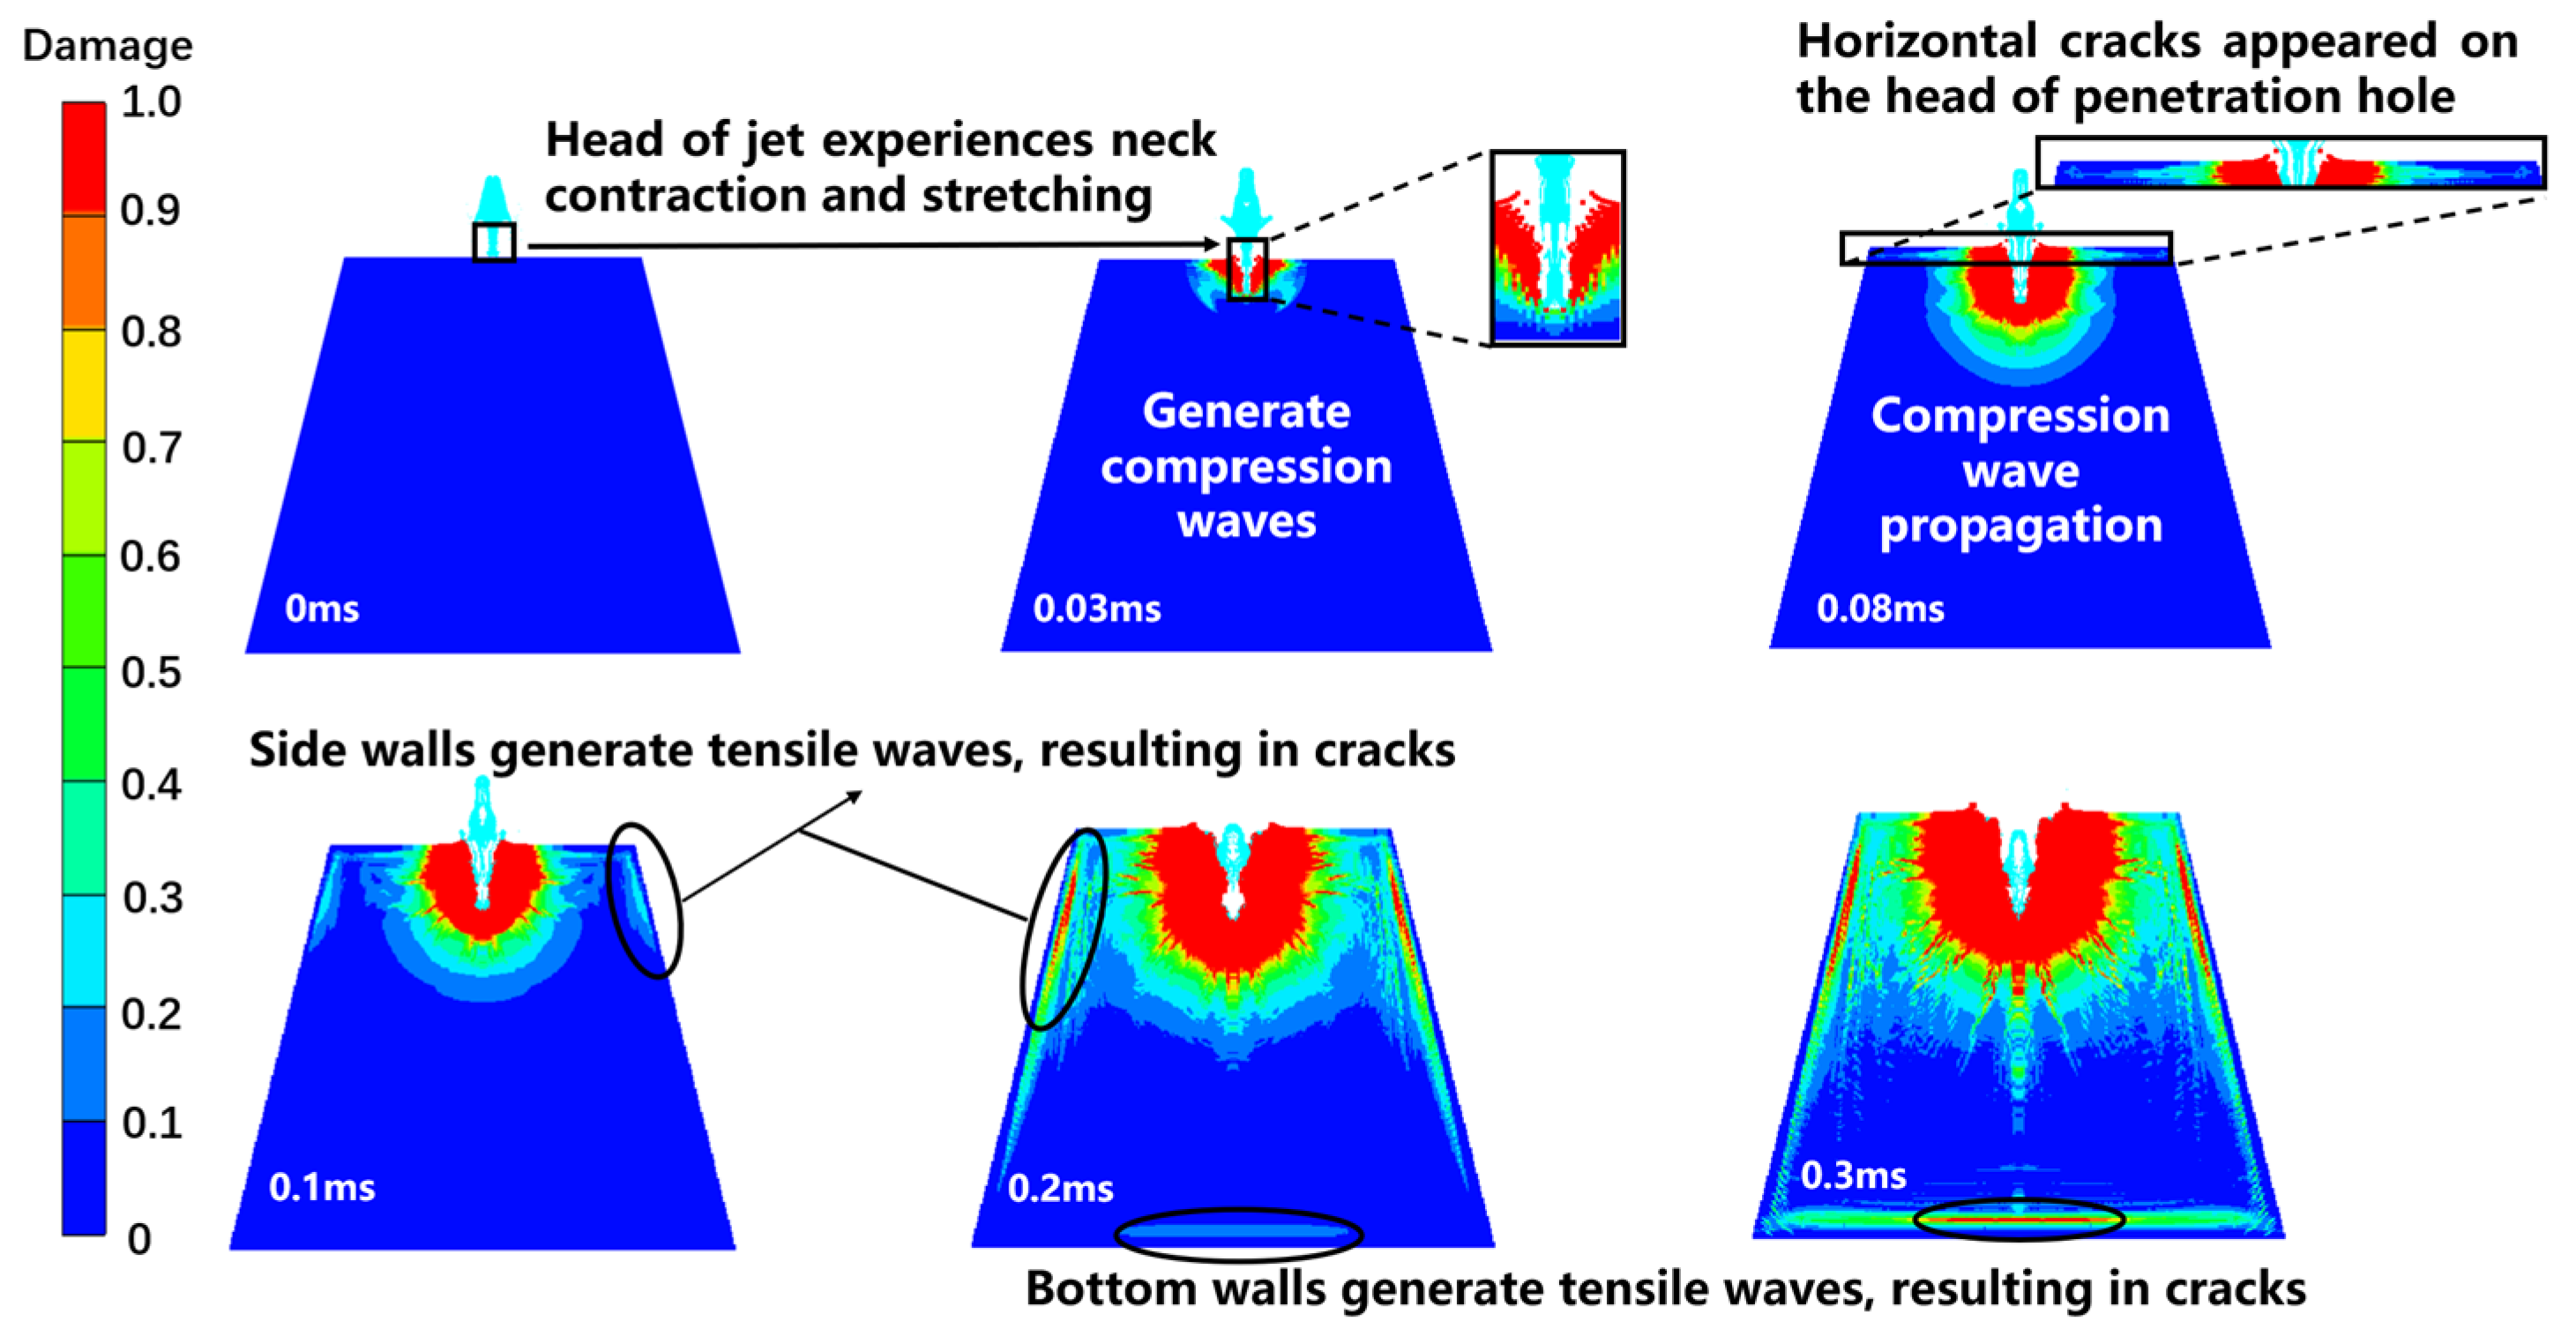
The damage contours of the reactive jet penetrating the concrete target are shown in Figure 9. In the damage contours, the damage level is classified from 0 to 1, where 1 indicates complete material damage. The reactive jet begins penetration from the center of the concrete target. The jet tip has high velocity, pressure, and temperature at this moment; therefore, a region with high temperature, high pressure, and high strain rate is formed at the center of the concrete target, and an initial compressive wave is transmitted, causing compressive damage to the axial region of the concrete target. The head of the reactive jet undergoes large deformation and experiences necking and stretching.
Thereafter, the reactive jet continues to penetrate the concrete target and is gradually stretched and fractured. At 0.08 ms, transverse cracks appear on the upper surface of the concrete target under the action of the compressive wave. As the damage depth increases and the compressive wave continues to propagate inward, longitudinal cracks appear along the axis of the target plate. At 0.1 ms, as the compressive wave reflects from the side walls, tensile damage appears on the side walls of the concrete target, forming cracks. At 0.2 ms, the compressive wave reaches the bottom of the concrete target. Due to the fixed boundary at the interface between the simulated concrete target and the ground, the compressive wave is reflected as a tensile wave and propagates into the concrete target, causing tensile damage at the bottom and forming tensile cracks. After that, as the penetration time increases, the cracks caused by the reactive jet in the concrete target continue to grow.
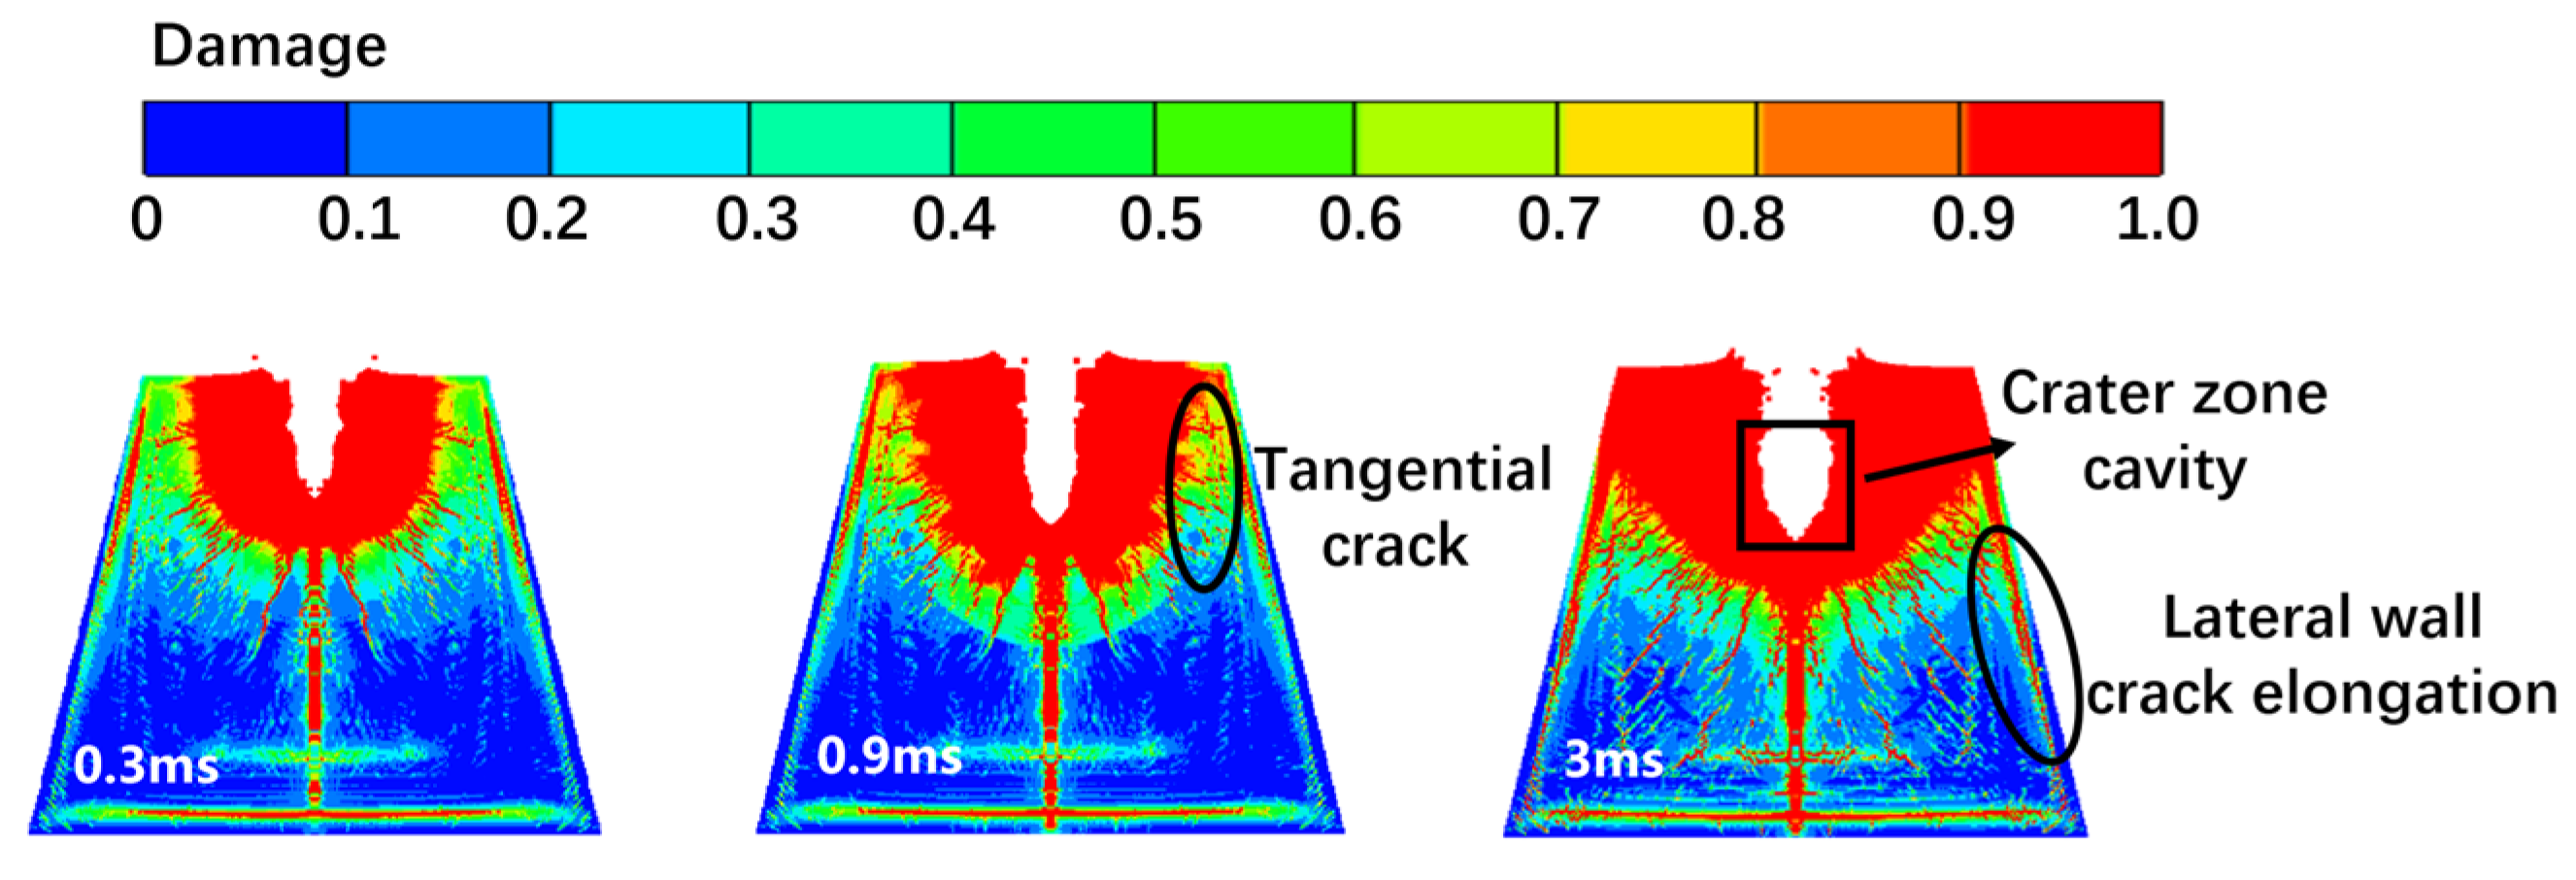
When the reactive jet reaches the relaxation time, it is activated and undergoes deflagration. The deflagration-enhanced damage process of the reactive jet on the concrete target is shown in Figure 10. The action of the reactive shaped charge warhead on the concrete hard target first relies on the kinetic penetration of the reactive jet into the concrete target. In this process, the reactive damage material does not react and forms a through-hole under kinetic energy. The unreacted reactive jet enters the target through the hole and undergoes a deflagration reaction after reaching the relaxation time. A large amount of energy and heat is released in the penetration channel, causing a sharp increase in the internal pressure of the target. The concrete target fractures, and a cavity forms in the fractured zone.
From the radial cracks on the outer surface of the concrete target and the uplift around it, it can be seen that the internal explosive damage effect of the reactive material on the concrete target at this stage belongs to loosened blasting [35]. In this case, because the deflagration depth increases, the energy used to throw the concrete medium decreases while the energy used for destruction increases, resulting in a distinct cavity inside the concrete target.

4. Discussion

4.1. Characteristics of Reactive Jet Formation

The jet parameters listed in Table 7 were extracted at the instant when the jet tip first reached the target surface at a stand-off distance of 120 mm, immediately before any jet–target interaction occurred. Thus, these parameters characterize the pre-impact jet state after 120 mm of free flight rather than the initial formation state. The jet length was measured along the axial direction from the foremost jet particle to the rearmost particle identified as part of the jet body.
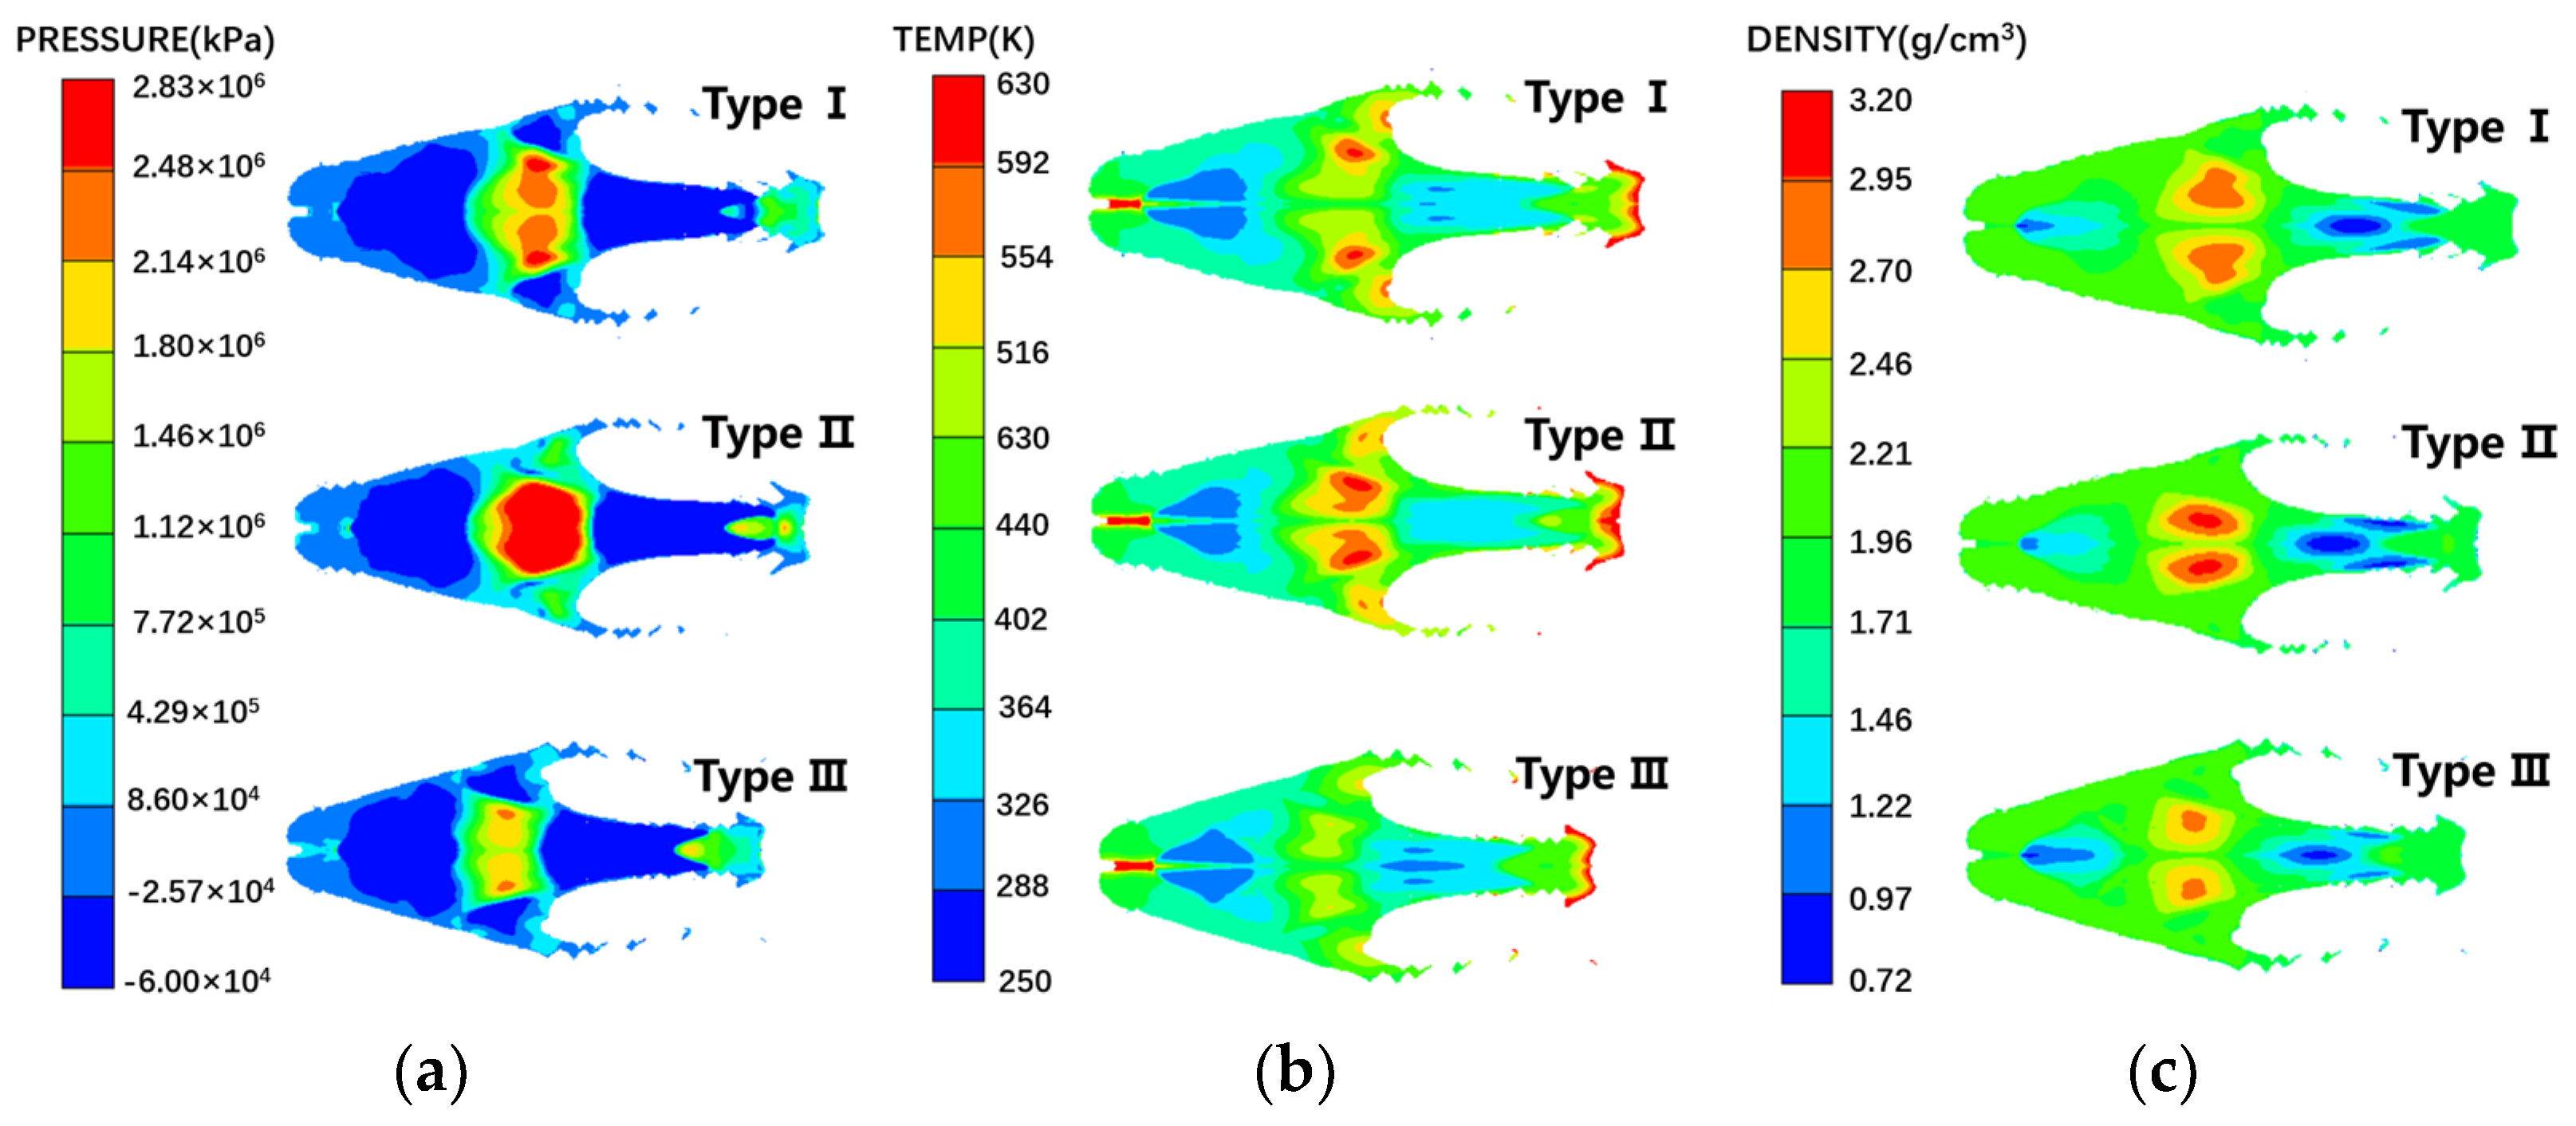
It can be seen that as the cone angle and the liner wall thickness decrease, the head velocity of the reactive jet increases. The reactive jet formed by the Type II liner, hereinafter referred to as the Type II reactive jet, has the highest head velocity, while the reactive jet formed by the Type III liner, hereinafter referred to as the Type III reactive jet, has the lowest head velocity. The tail velocity increases with increasing cone angle and liner thickness. The jet length decreases as the cone angle of the liner increases, while the effect of liner wall thickness on jet length is not obvious. Therefore, the Type II reactive jet has the largest velocity gradient, and the Type III reactive jet has the smallest velocity gradient. There is no significant difference in the diameter of the reactive jets formed by the three warheads. Among them, the reactive jet formed by the Type I liner, hereinafter referred to as the Type I reactive jet, has the largest diameter, and the Type II reactive jet has the smallest diameter, with a difference of only 3 mm.
The pressure, temperature, and density distributions of the reactive jets before impact are shown in Figure 11. It can be seen that the high-pressure, high-temperature, and high-density regions of the three reactive jets are distributed in roughly the same manner. The Type II reactive jet has the highest peak pressure, temperature, and density, whereas the Type III reactive jet has the lowest peak pressure, temperature, and density. Combined with the jet lengths of the three reactive jets, the Type II reactive jet exhibits larger pressure, temperature, and density gradients, while the Type III reactive jet has the smallest gradients in all parameters.

4.2. Dynamic Response Characteristics of the Concrete Target

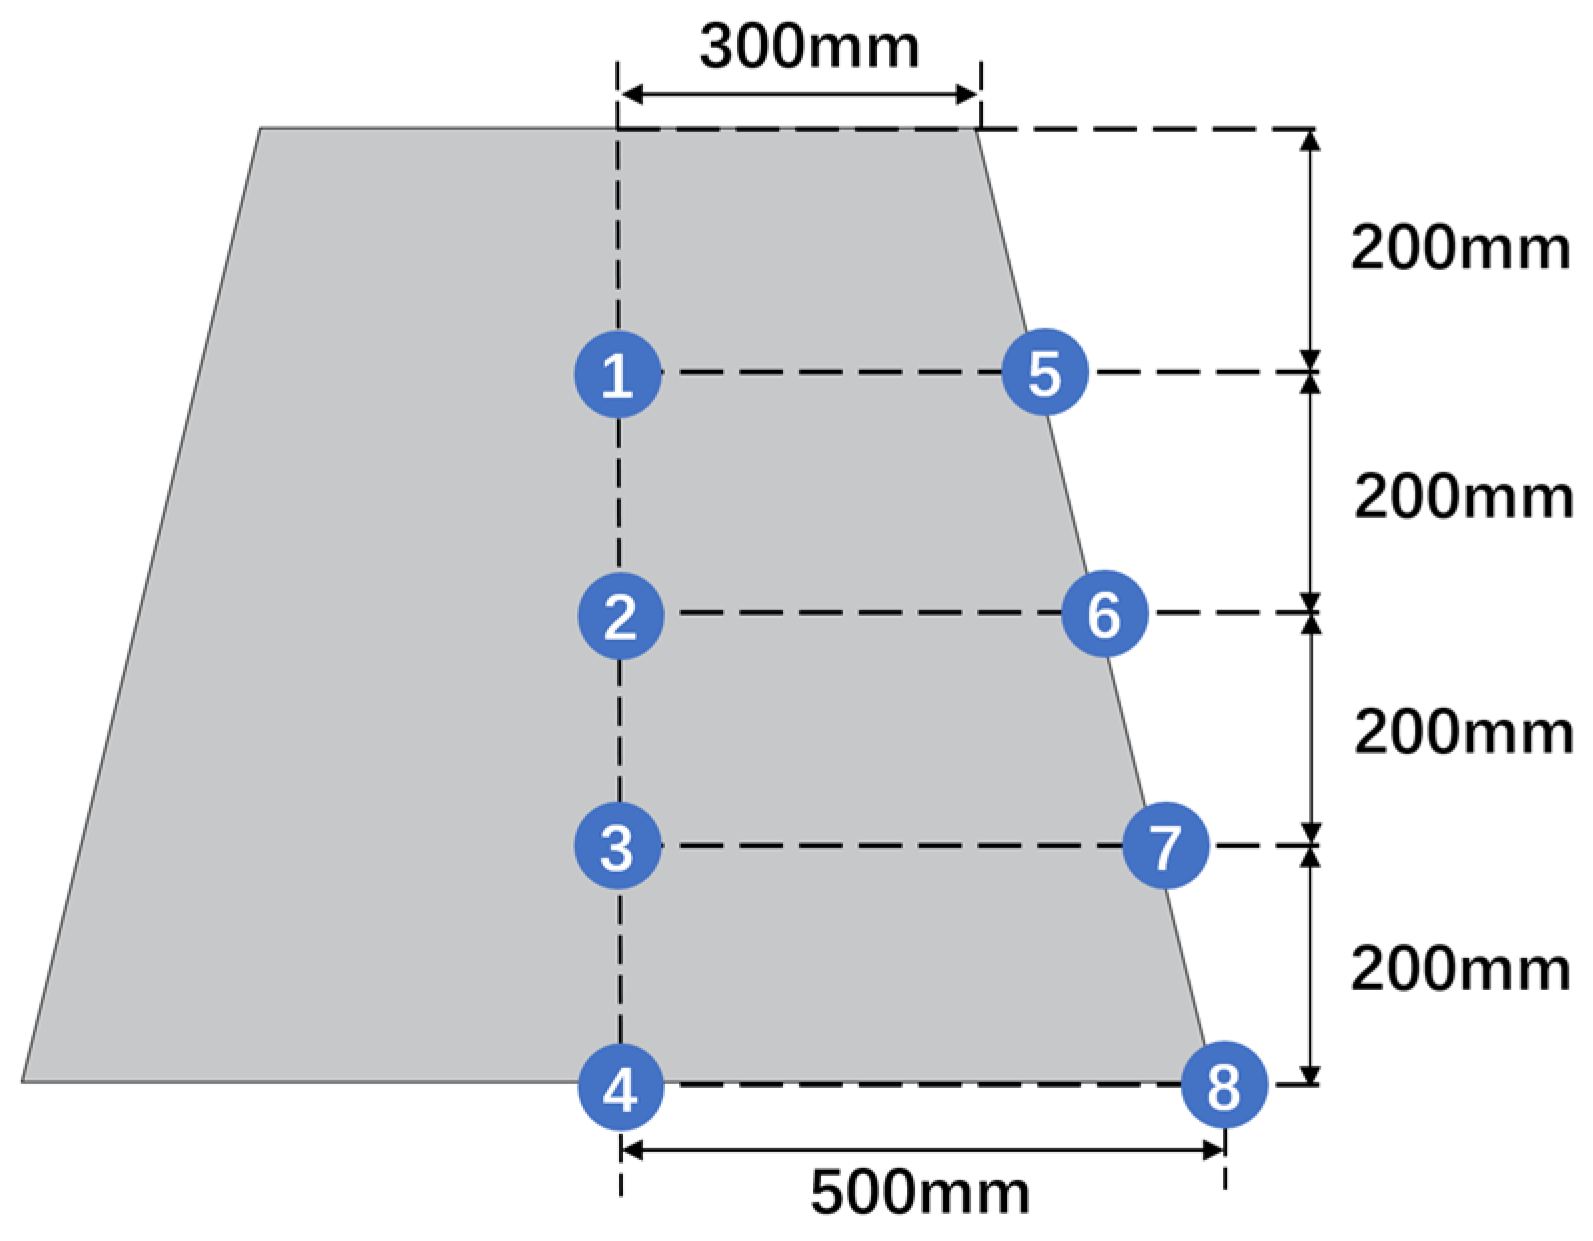
To better describe the action process of this TCCT during the kinetic penetration stage of the reactive jet, several fixed observation points were arranged on the concrete target to obtain pressure–time curves at different positions. The observation point layout is shown in Figure 12. Since the medium corresponding to Observation Point 1 failed during the process of reactive jet penetration into the target plate, it is not analyzed here.
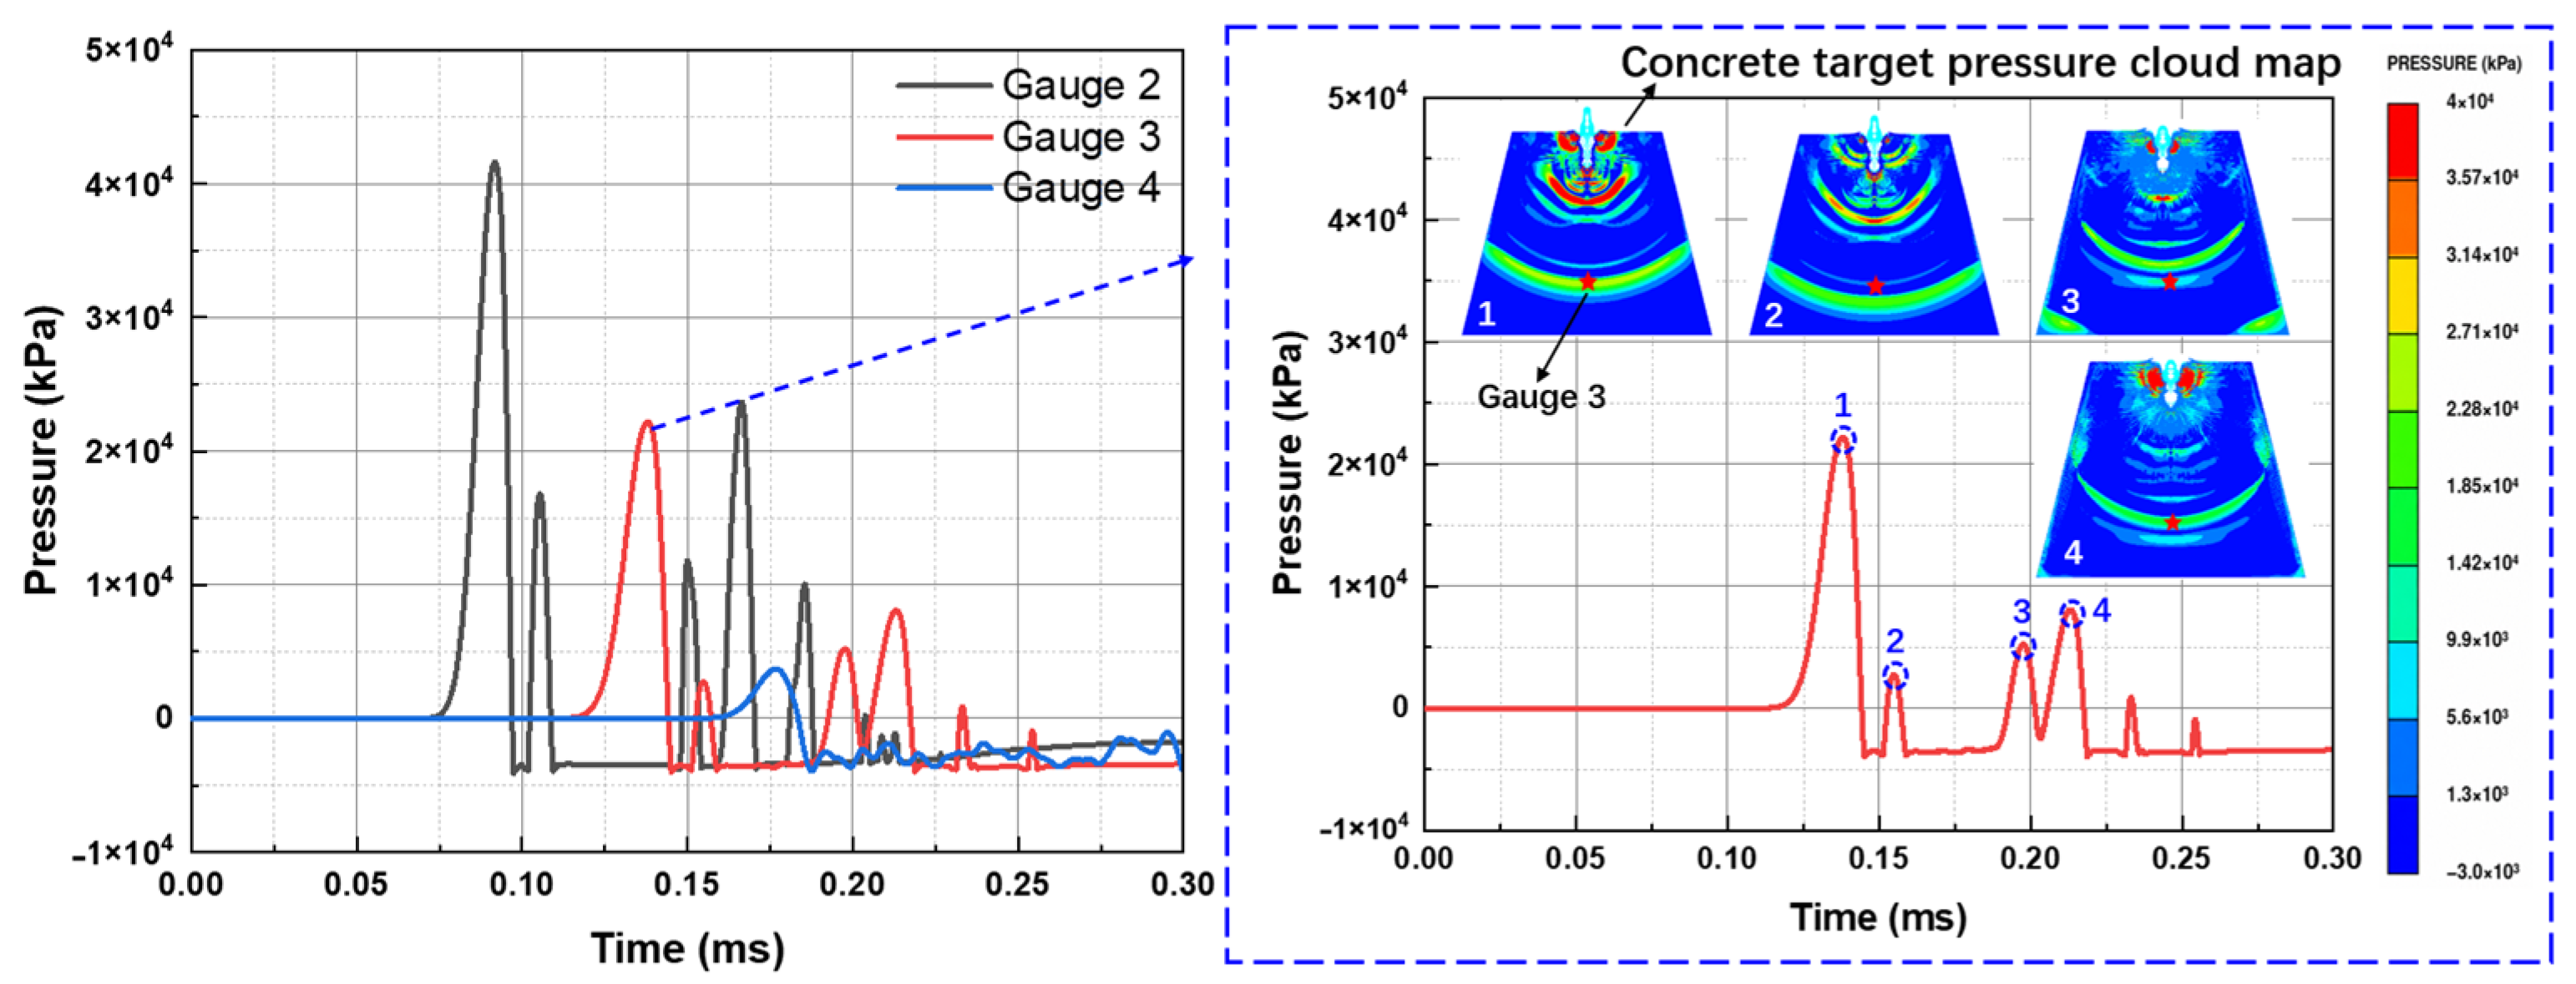
According to Figure 13, multiple pressure peaks appear at all observation points on the axis of the concrete target during the kinetic penetration process, and the pressure exhibits a consistent time-varying trend. Taking the pressure variation at Observation Point 3 as an example, four distinct pressure peaks occur during the kinetic penetration stage of the reactive jet. Based on the pressure contours of the concrete target corresponding to the occurrence times of these four pressure peaks, the reason for the multiple peaks is that the reactive jet is not a cylindrical penetrator with a uniform width. During kinetic penetration, in addition to the impact between the jet head and the target plate, which generates a compressive wave with the largest peak value (Class I compressive wave), when the jet width becomes larger than the already formed penetration diameter, it continues to generate compressive waves with smaller peak values in the concrete target (Class II compressive waves). The peak values of this type of compressive wave are always lower than those of the Class I compressive wave, and the pressure peak is closely related to the difference between the reactive jet width and the penetration diameter at that moment, as well as the jet velocity. Therefore, the medium near the axis of the concrete target is subjected to multiple compressive waves continuously, ultimately causing damage to the concrete target.
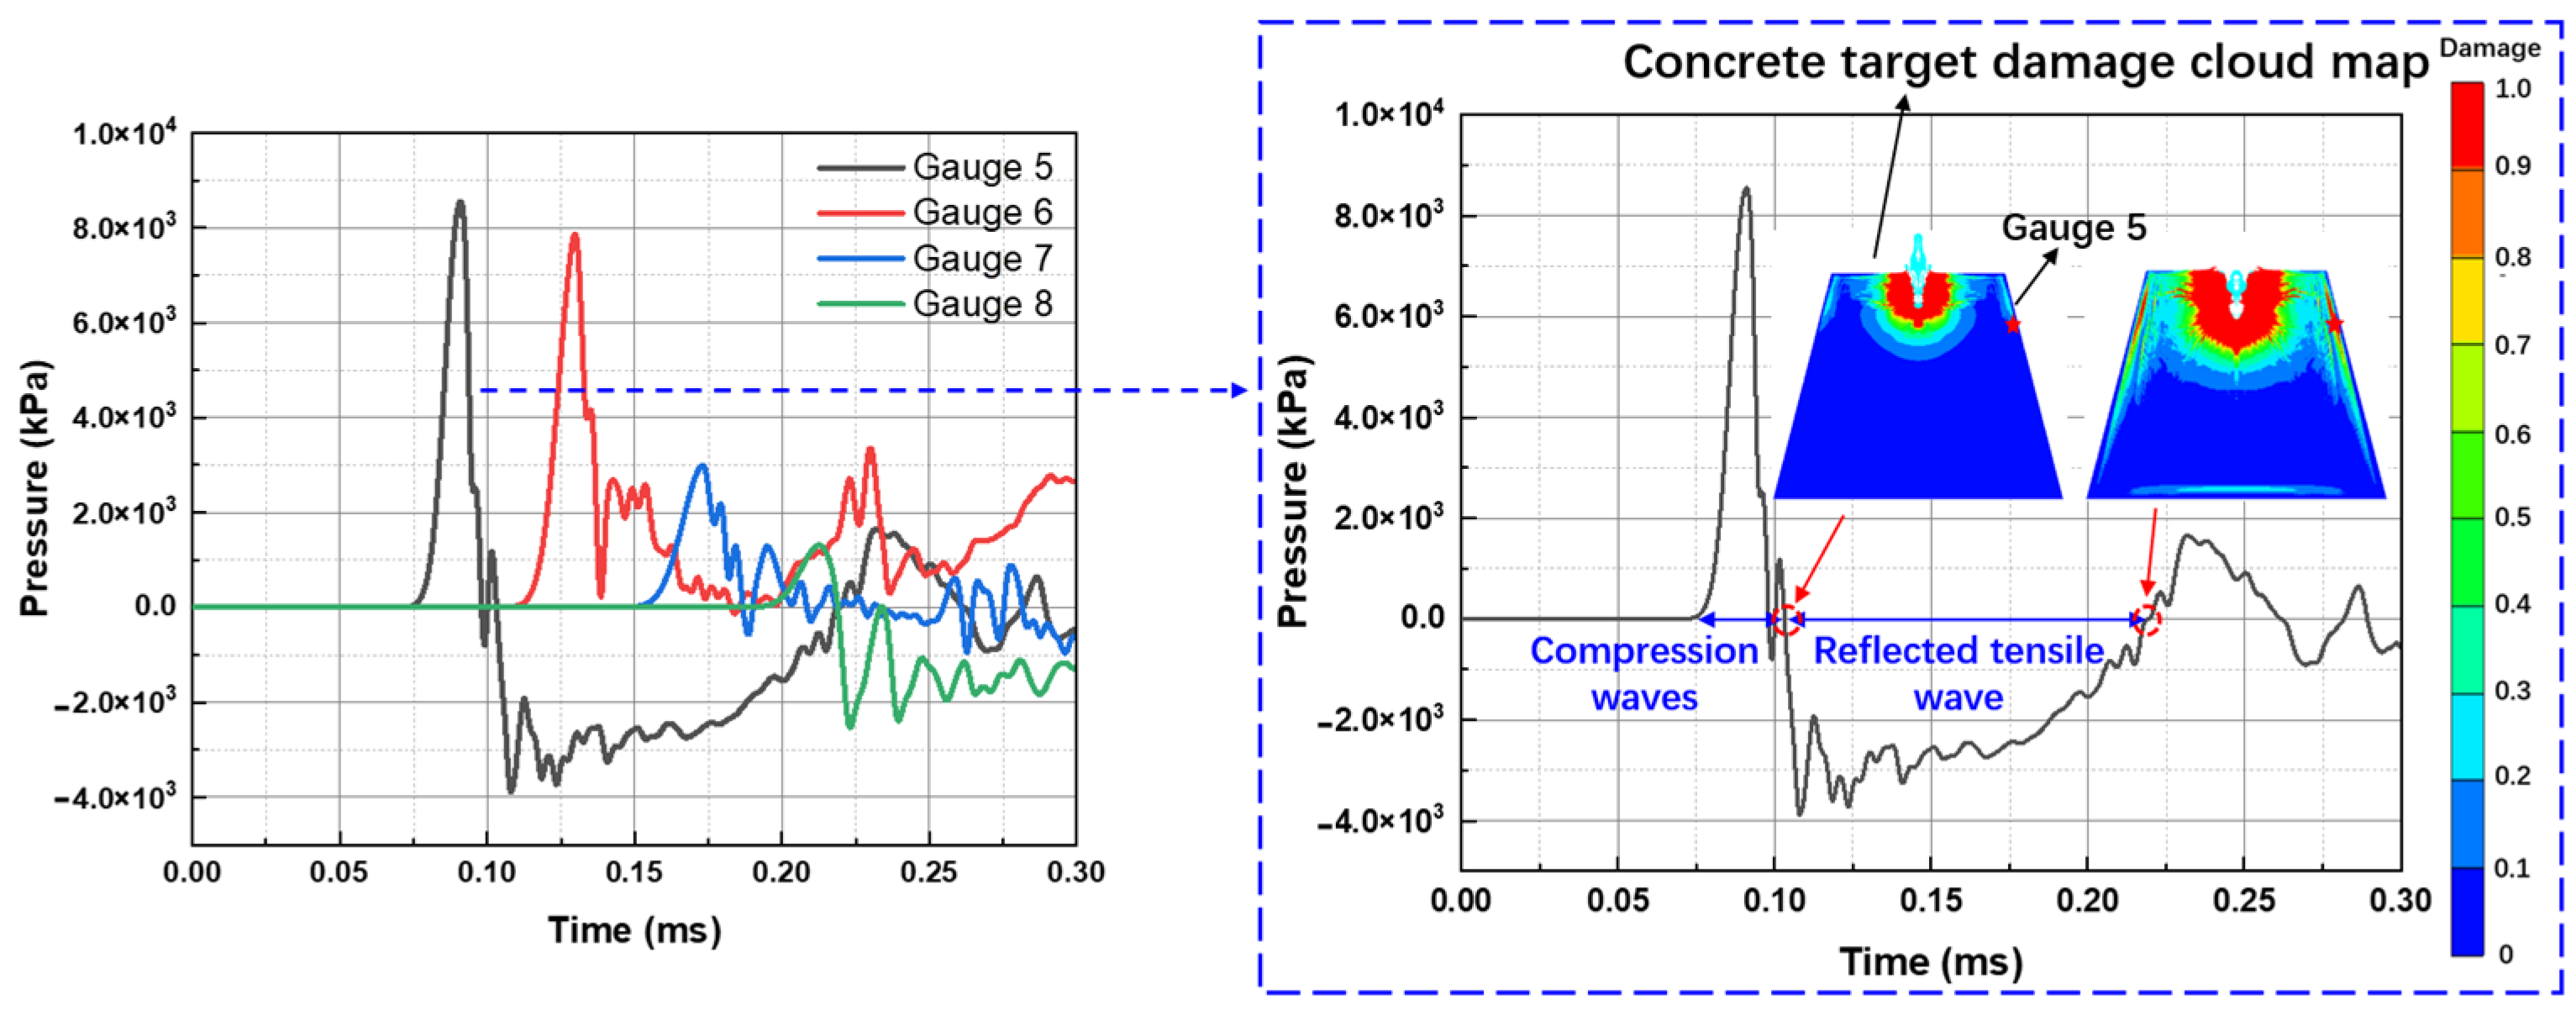
Figure 14 shows the pressure variation at different positions on the side wall of the concrete target. Compared with the axis, only one distinct positive pressure peak appears at the side wall, after which the side wall of the concrete target is mainly subjected to negative pressure. This is because the peak value of the Class I compressive wave is relatively large, and after reflection from the side wall, the peak value of the corresponding tensile wave is greater than that of the subsequent Class II compressive wave transmitted from the penetration channel. Therefore, although the side wall of the concrete target, like the axis, is continuously subjected to multiple compressive waves, no multiple positive pressure peaks appear; instead, it experiences long-duration negative pressure. Taking Observation Point 5 as an example, combined with the damage contour of the concrete target, it can be seen that after the positive-pressure action of the Class I compressive wave ends, the side wall is damaged, but the damage is slight and no cracks appear. After the negative-pressure action of the reflected tensile wave ends, obvious cracks appear on the side wall. Therefore, the damage to the side wall of the conical frustum concrete target is mainly caused by the reflected tensile wave.
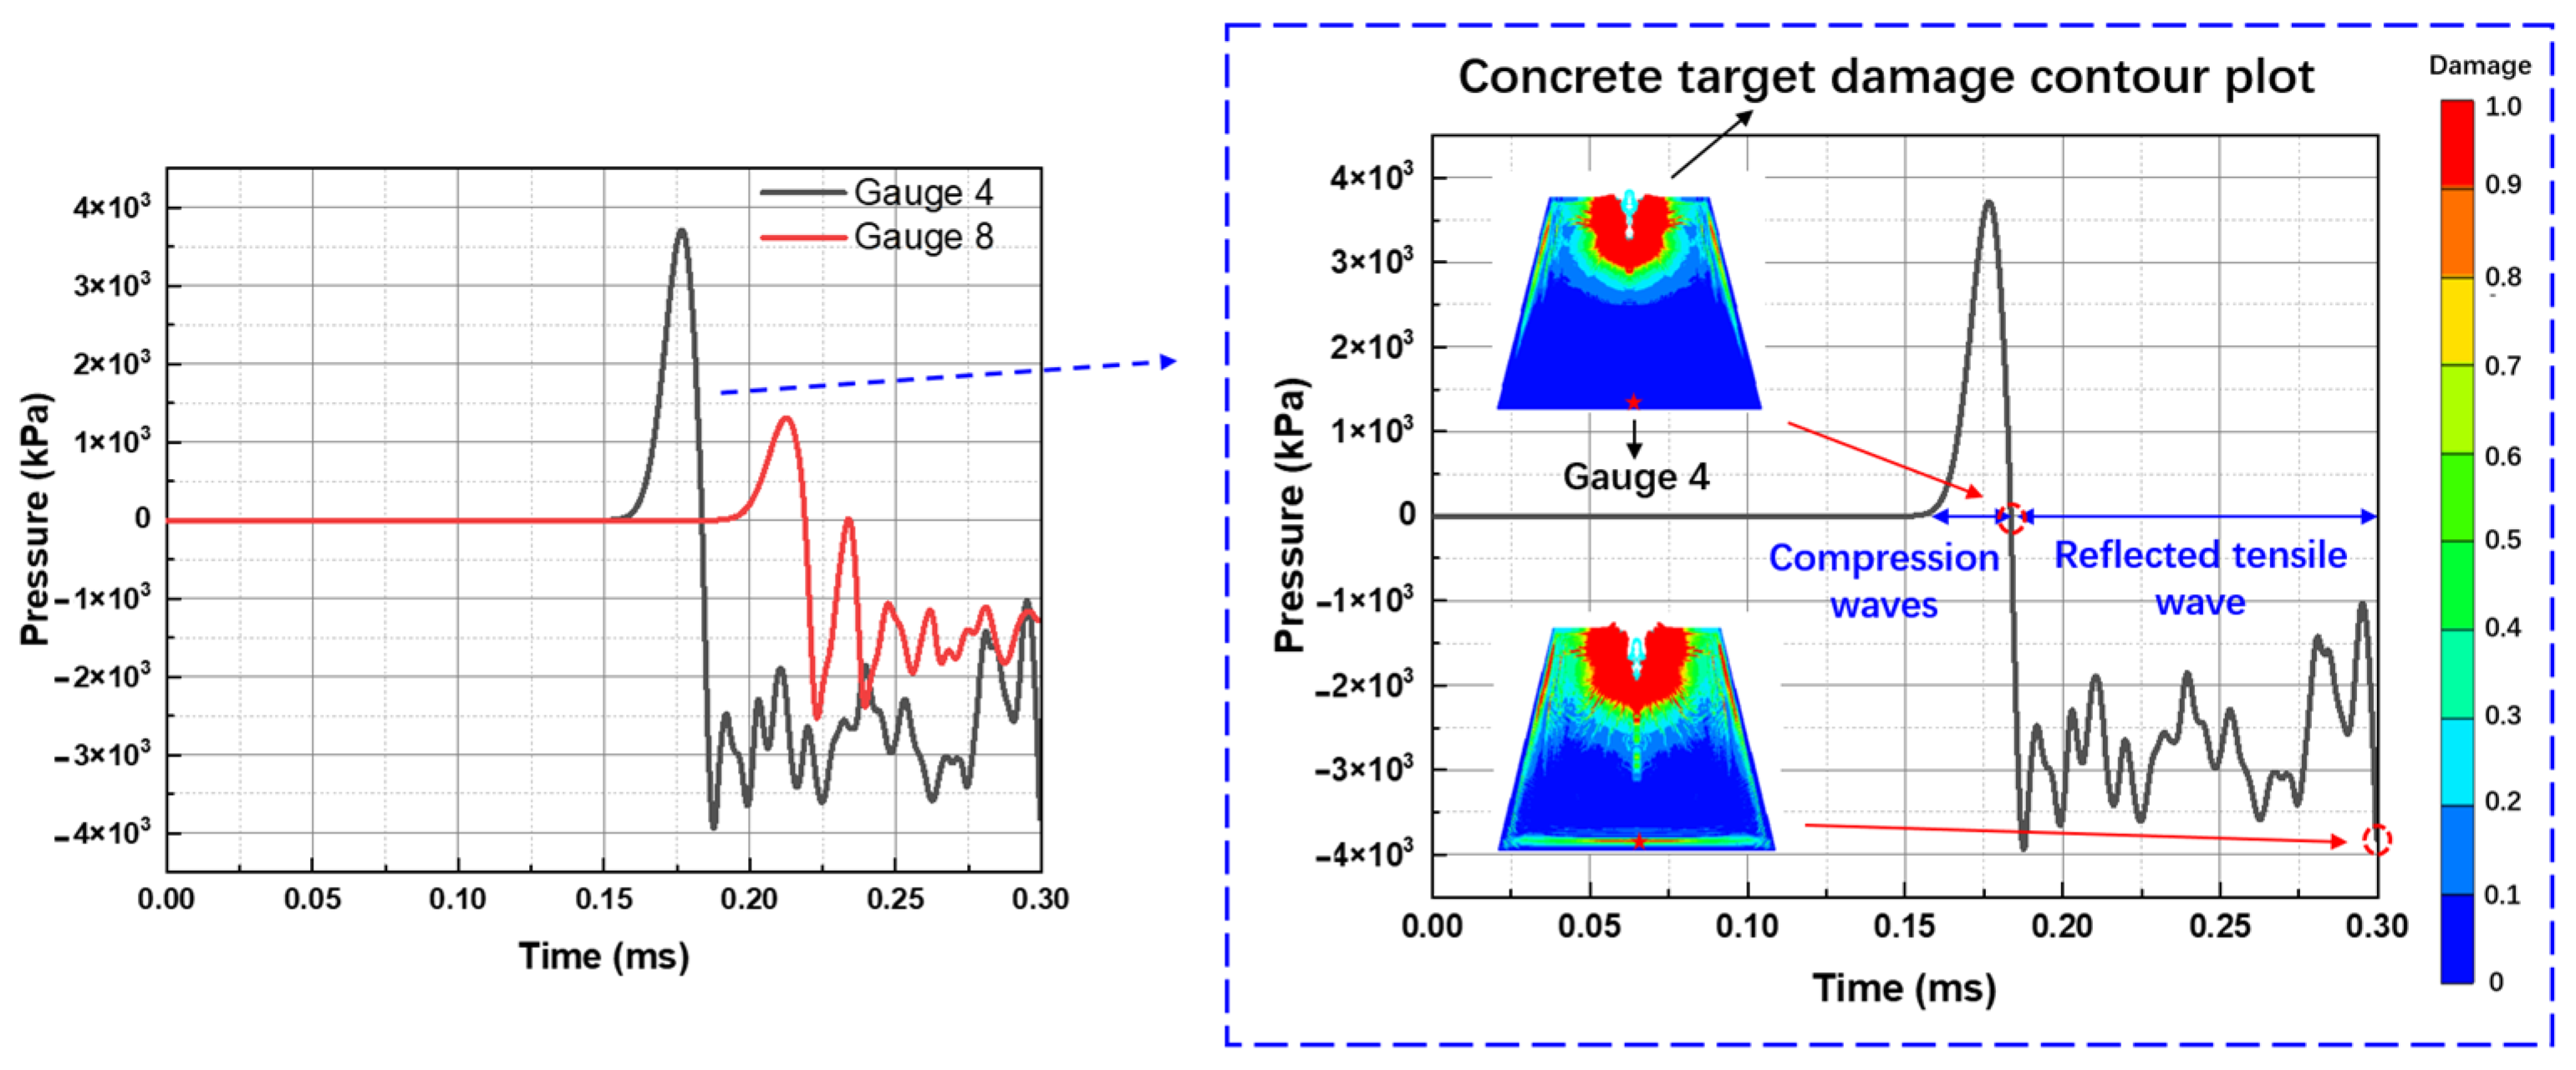
Figure 15 shows the pressure variation with time at different positions on the bottom of the concrete target. Similar to the side wall, the bottom is mainly subjected to the action of the Class I compressive wave and its reflected wave. Taking Observation Point 4 as an example, and in combination with the damage contour of the concrete target, it can be seen that after the positive-pressure action ends, almost no damage appears at the bottom of the concrete target. After that, the bottom of the concrete target continues to be subjected to negative pressure. When the kinetic penetration stage of the reactive jet ends, the damage at the bottom becomes pronounced and cracks appear. Therefore, the damage at the bottom of the conical frustum concrete target, like that at the side wall, is mainly caused by the reflected tensile wave.
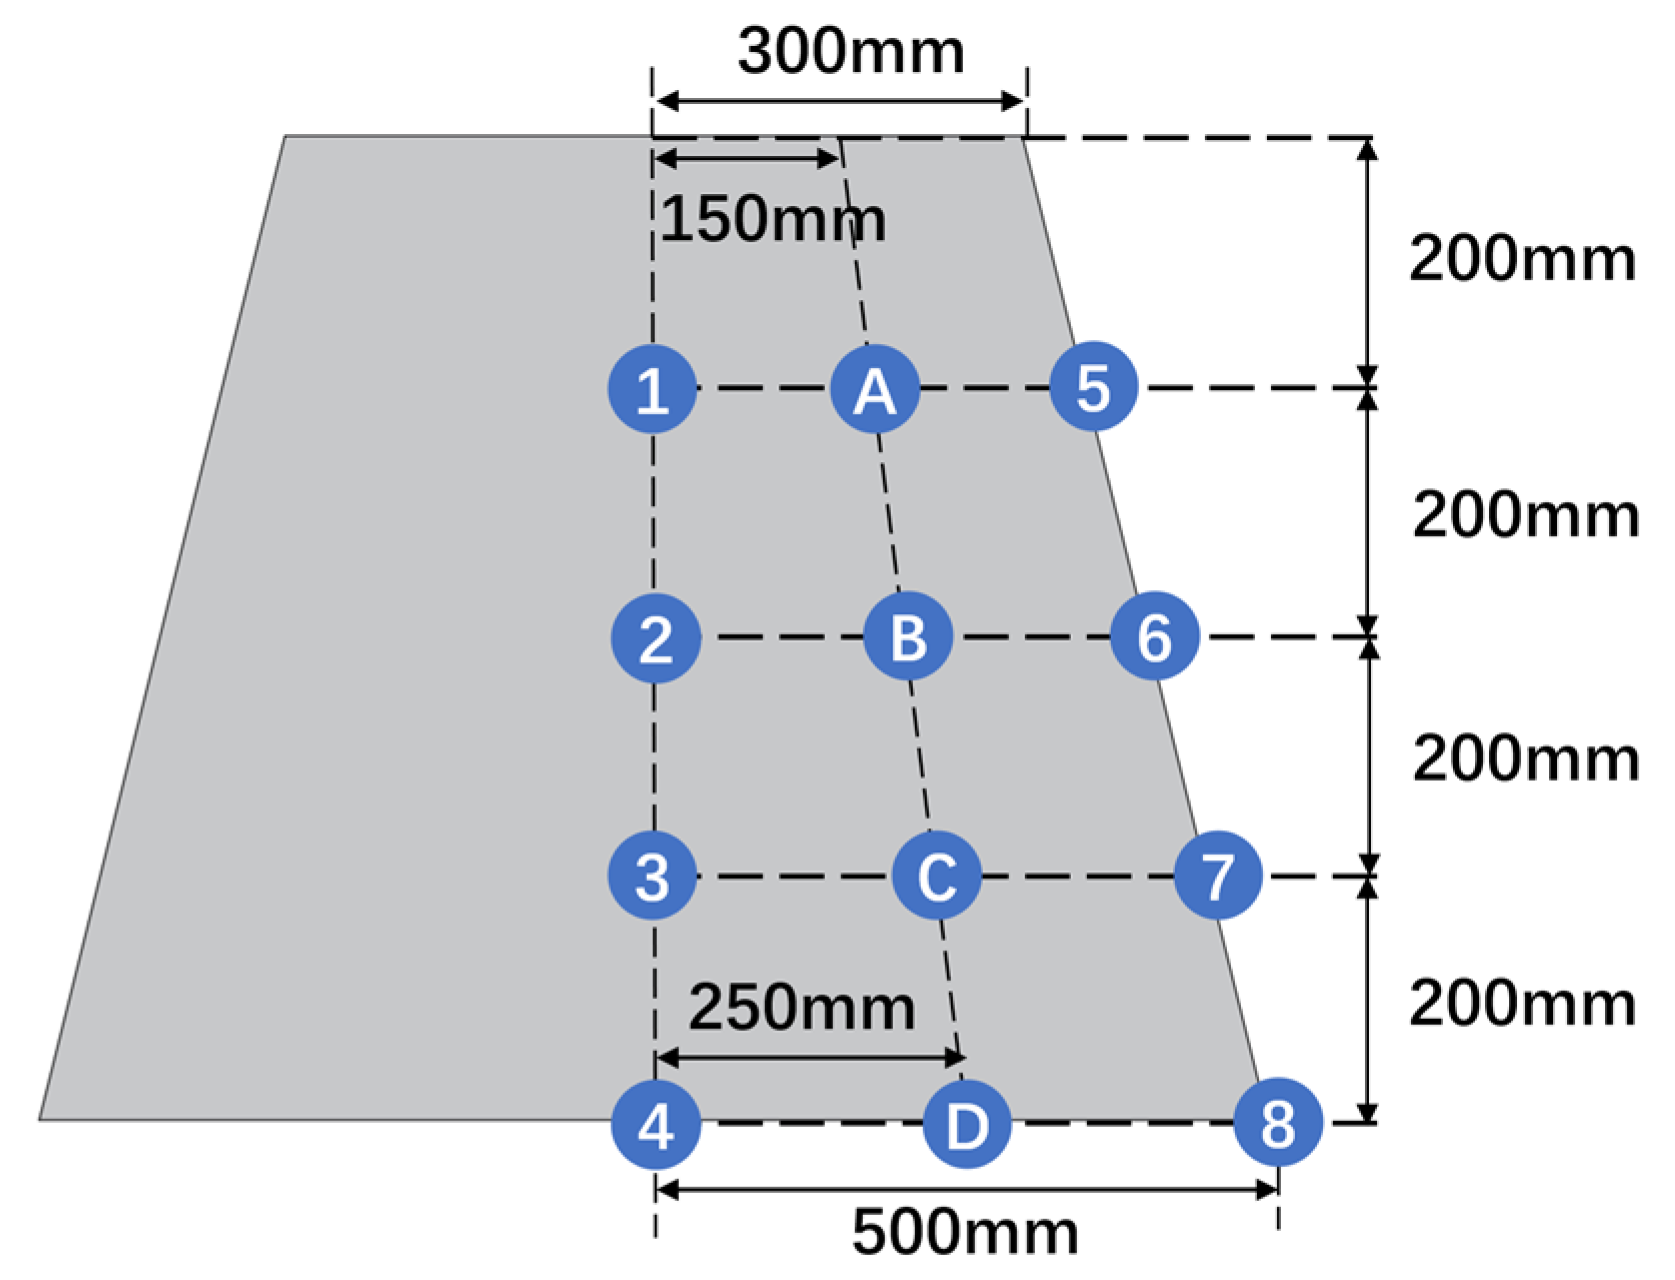
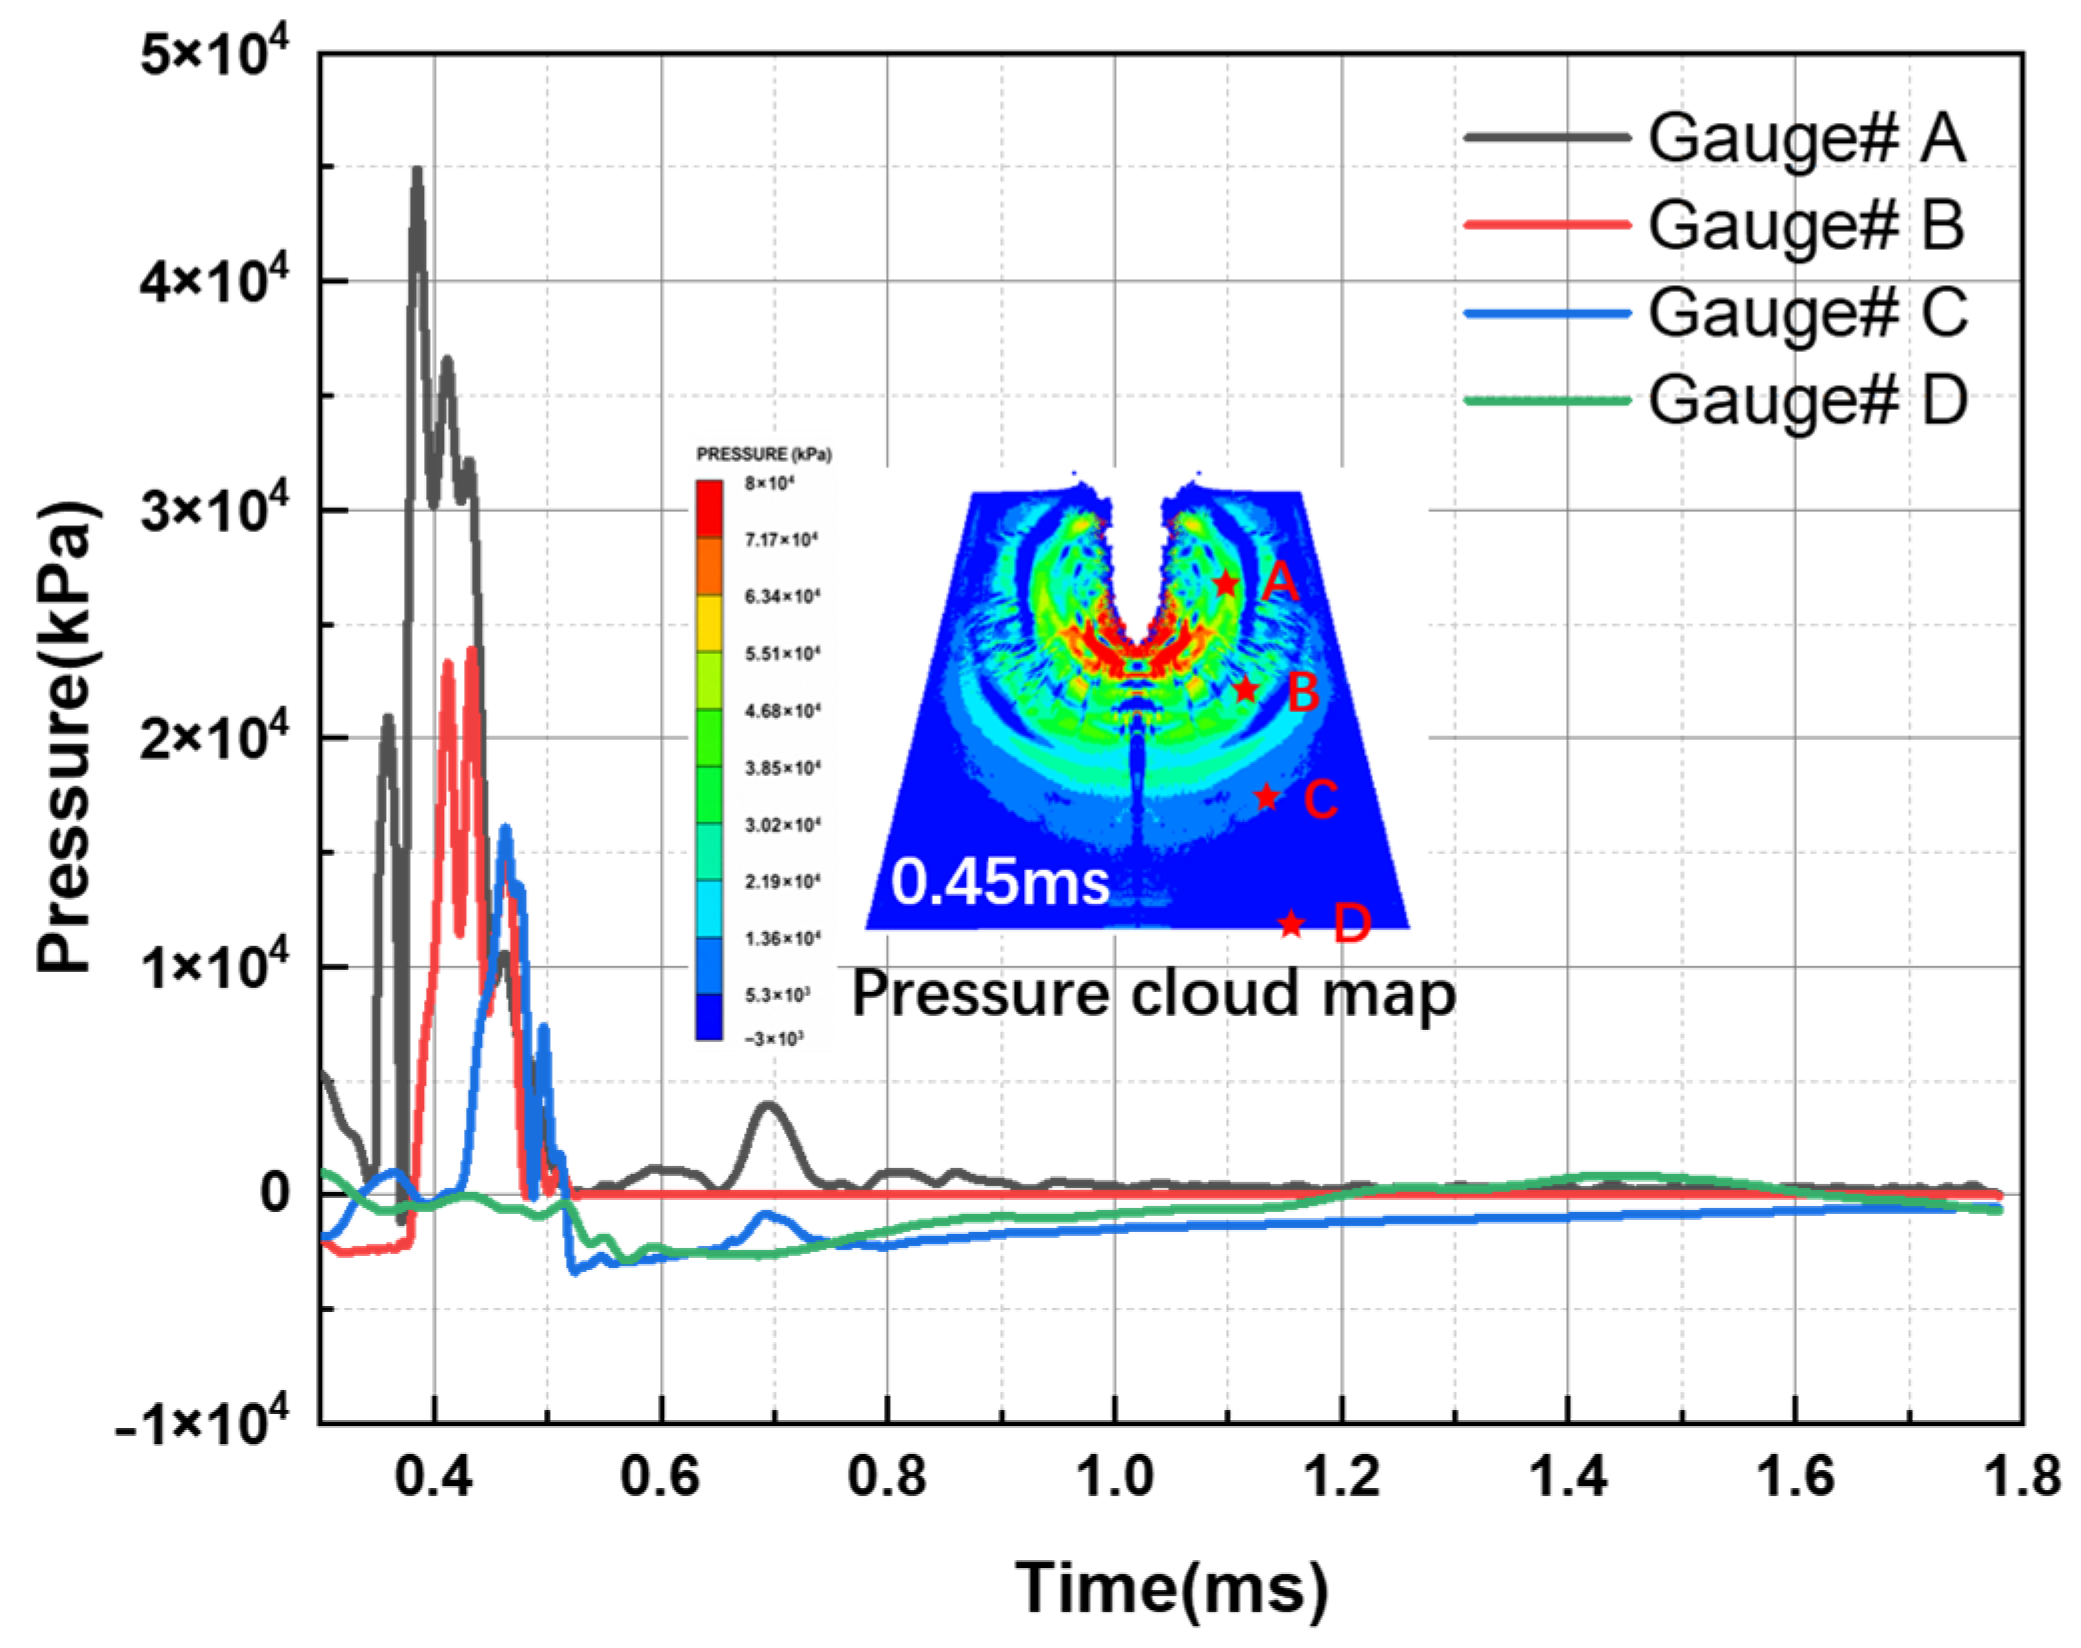
To obtain the pressure–time curves at different positions of the concrete target under deflagration, observation points were also arranged at various locations on the concrete target, and four additional observation points, A, B, C, and D, were added inside the concrete target to record the loading conditions at different times. The arrangement of the observation points is shown in Figure 16. The medium corresponding to Observation Point 1 had already failed during the kinetic penetration stage and therefore is not analyzed. After 1.8 ms, the variation in detonation pressure acting on the concrete target becomes relatively small. To better capture the action details of the detonation wave on the target plate, the pressure–time curves at different positions of the concrete target during the deflagration stage of the reactive jet are limited to the interval from 0.3 ms to 1.8 ms.
Figure 17 shows the pressure variation at different positions inside the concrete target. Since the concrete along the axis fails during the deflagration intensification process, resulting in the formation of a penetration hole, the pressure–time curves at Observation Points 1 to 4 only exhibit a transient peak and then drop to zero, and therefore no longer have analytical value. However, as can be seen from the four internal observation points A, B, C, and D, during the deflagration intensification stage, the medium inside the concrete target is still mainly subjected to positive pressure, and the wave propagates rapidly, having fully reached the four observation points within 0.3 ms after initiation. After the action of the detonation wave ends, the pressure gradually approaches zero.
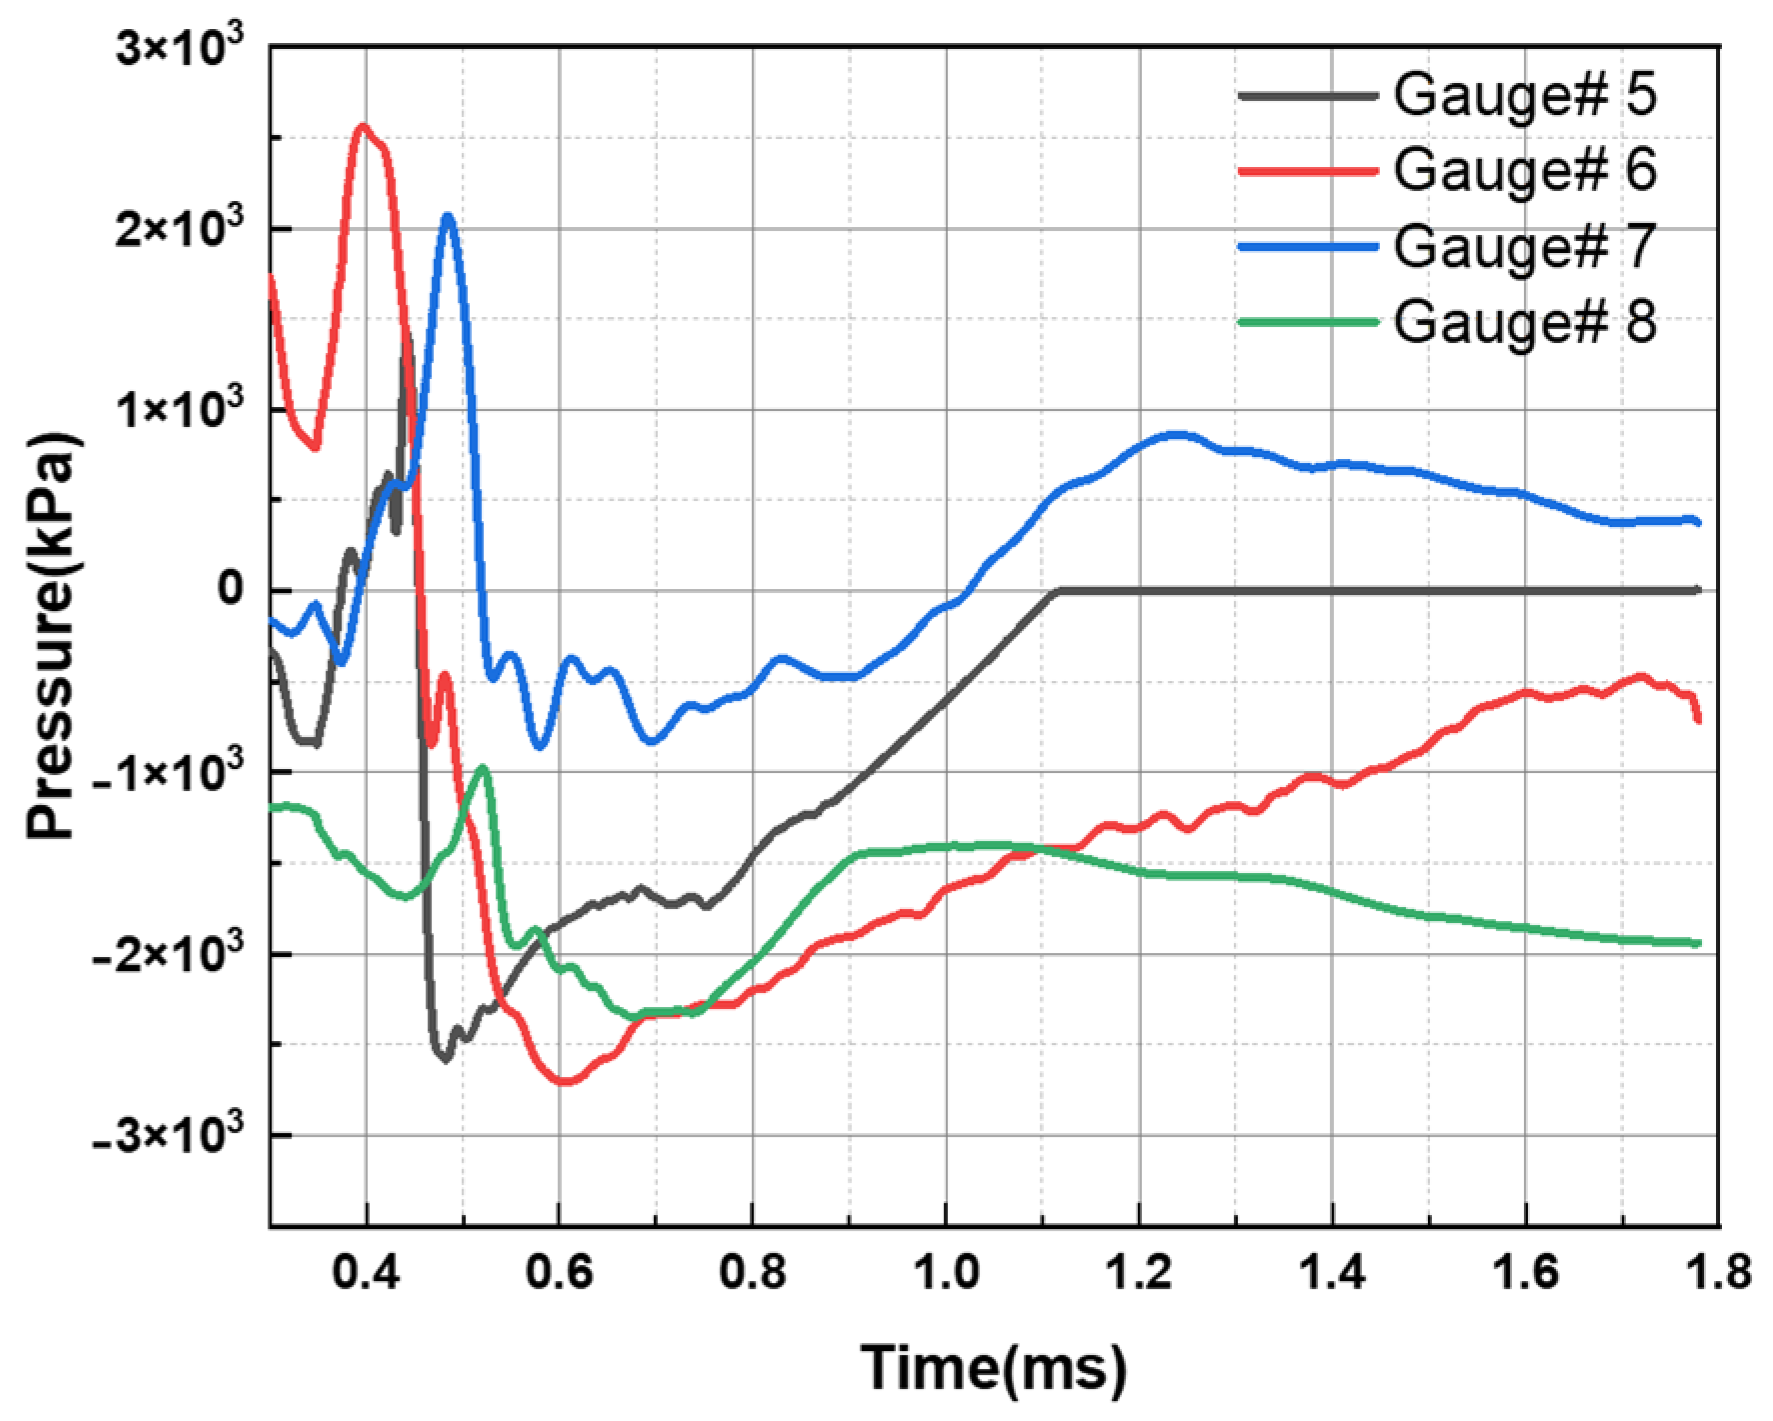
As can be seen from Figure 18, after the detonation wave first propagates to the side wall of the concrete target, a reflected tensile wave is formed, and the duration of the negative-pressure action of the tensile wave is significantly longer than the duration of the positive-pressure action of the detonation wave. Observation Point 5, which had already been damaged during the kinetic penetration stage, became completely ineffective after being subjected again to alternating compression and tension in the deflagration intensification stage, and the pressure state showed 0 kPa after 1.1 ms.
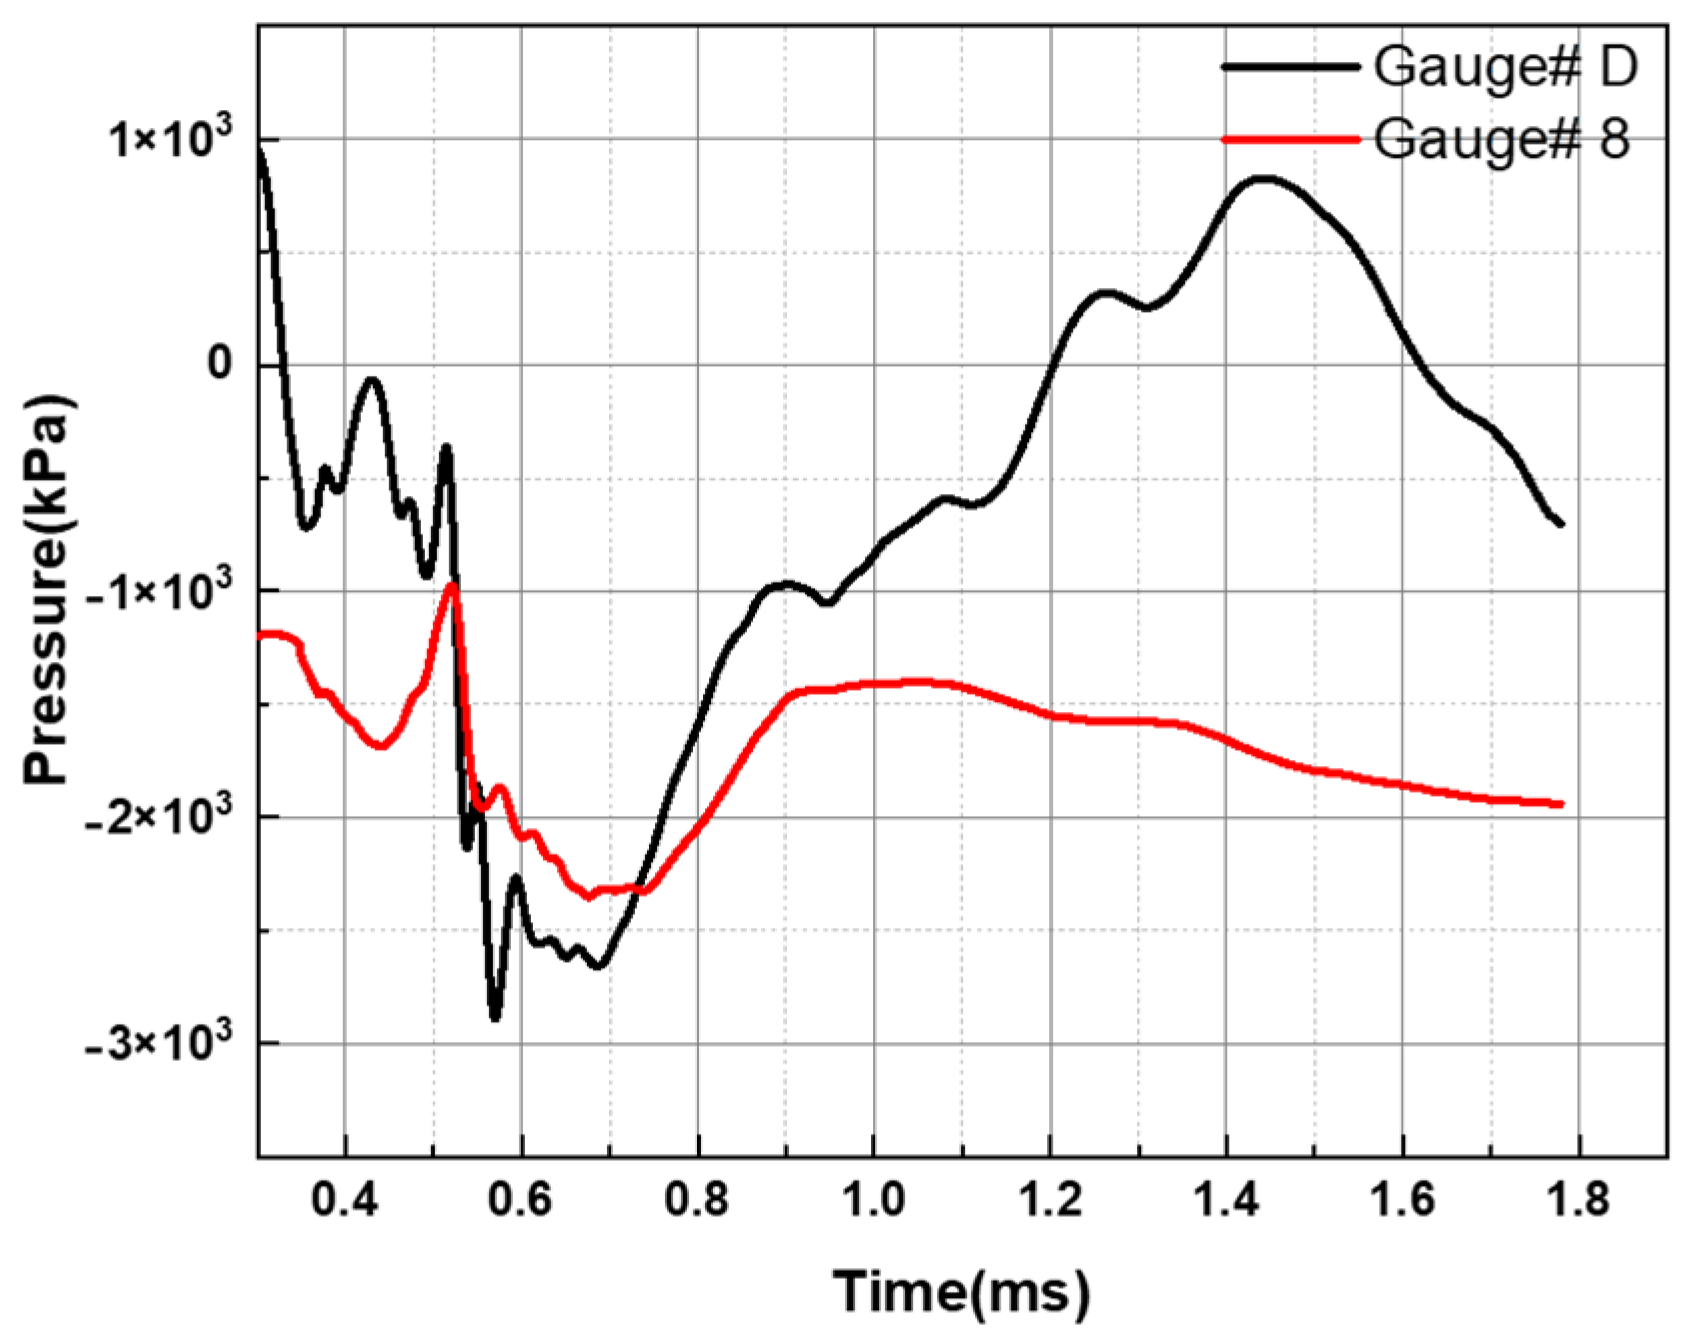
Figure 19 shows the pressure–time curves at different positions on the bottom of the concrete target. During the late stage of kinetic penetration, the bottom of the concrete target is continuously subjected to the negative-pressure action of the reflected tensile wave. In the deflagration intensification stage, the activation of the reactive material generates a detonation wave with a high peak value, and the bottom of the concrete target is subjected to positive pressure. Thereafter, reflected tensile waves are generated at the boundary, and the bottom is again subjected to negative pressure. Due to the specific structure of this finite-sized concrete target, reflected waves are generated near the side wall and bottom around Observation Point 8 before the detonation wave reaches it. Therefore, when the detonation wave propagates to this observation point, the medium is still under negative pressure. Accordingly, during the deflagration intensification stage, the damage to the side wall and bottom of the concrete target is mainly caused by the negative-pressure action of the tensile wave.
Combined with the experimental results, the concrete target under the action of the reactive shaped charge mainly exhibits damage characteristics such as local fragmentation, spalling, and steel rail damage, and the damage is mainly concentrated in the bottom and side wall regions, while the area near the central axis remains relatively intact. This indicates that the central region of the target is mainly subjected to compressive waves, with crushing and compaction as the dominant damage modes, whereas the bottom and side wall regions are mainly controlled by tensile waves and are therefore prone to dynamic splitting, spalling, and fragment scattering.

4.3. Deflagration-Enhanced Damage Characteristics

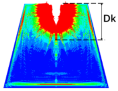
The kinetic-stage damage depth Dk is defined as the axial extent of the fully damaged zone at the end of the inert penetration stage. The final damage depth Df is the axial extent of the fully damaged zone after deflagration. Table 8 presents the damage effects of the reactive jet on the concrete target at different stages obtained from numerical simulation. From the internal and overall damage conditions of the target, Type I reactive jets produce the strongest deflagration-enhanced effect, whereas Type III reactive jets produce the weakest effect, which is consistent with the experimental results. Furthermore, a comparison between the experimental damage morphology shown in Figure 8 and the numerical damage contours presented in Table 8 shows good qualitative agreement in the overall damage modes. In both the experiments and simulations, the upper part of the concrete target undergoes severe crushing and fragmentation, whereas the lower part is mainly fractured and separated into relatively large concrete blocks. The consistency in both the damage-severity ranking and the principal damage modes supports the reasonableness and validity of the numerical model [37,38,39,40].
The deflagration pressure of the reactive material after activation in the concrete target depends on the mass of reactive material that enters the penetration hole. The final bursting damage effect of the concrete target depends on the expansion degree of the high-pressure gaseous products and the deflagration pressure. The deflagration pressure in the penetration hole is [41]:
p 0 = γ 1 V e m e
where γ is the specific heat ratio of the gaseous products, V e is the volume of the penetration hole, m is the mass of the reactive material, and e is the specific internal energy of the reactive material.
Assuming that the deflagration products expand entropically to the crack-tip region, the volume of the deflagration products is
V = 4 3 π ( L 2 + a 2 ) 1.5
where L is the average deflagration depth, and a is the crack length.
According to Equations (5) and (6), the deflagration pressure and the volume of the deflagration products are proportional to the residual mass of the reactive jet and the deflagration depth, i.e., the kinetic penetration depth. According to Table 8, Type I reactive jets have the maximum kinetic penetration depth, whereas Type III reactive jets have the minimum kinetic penetration depth.
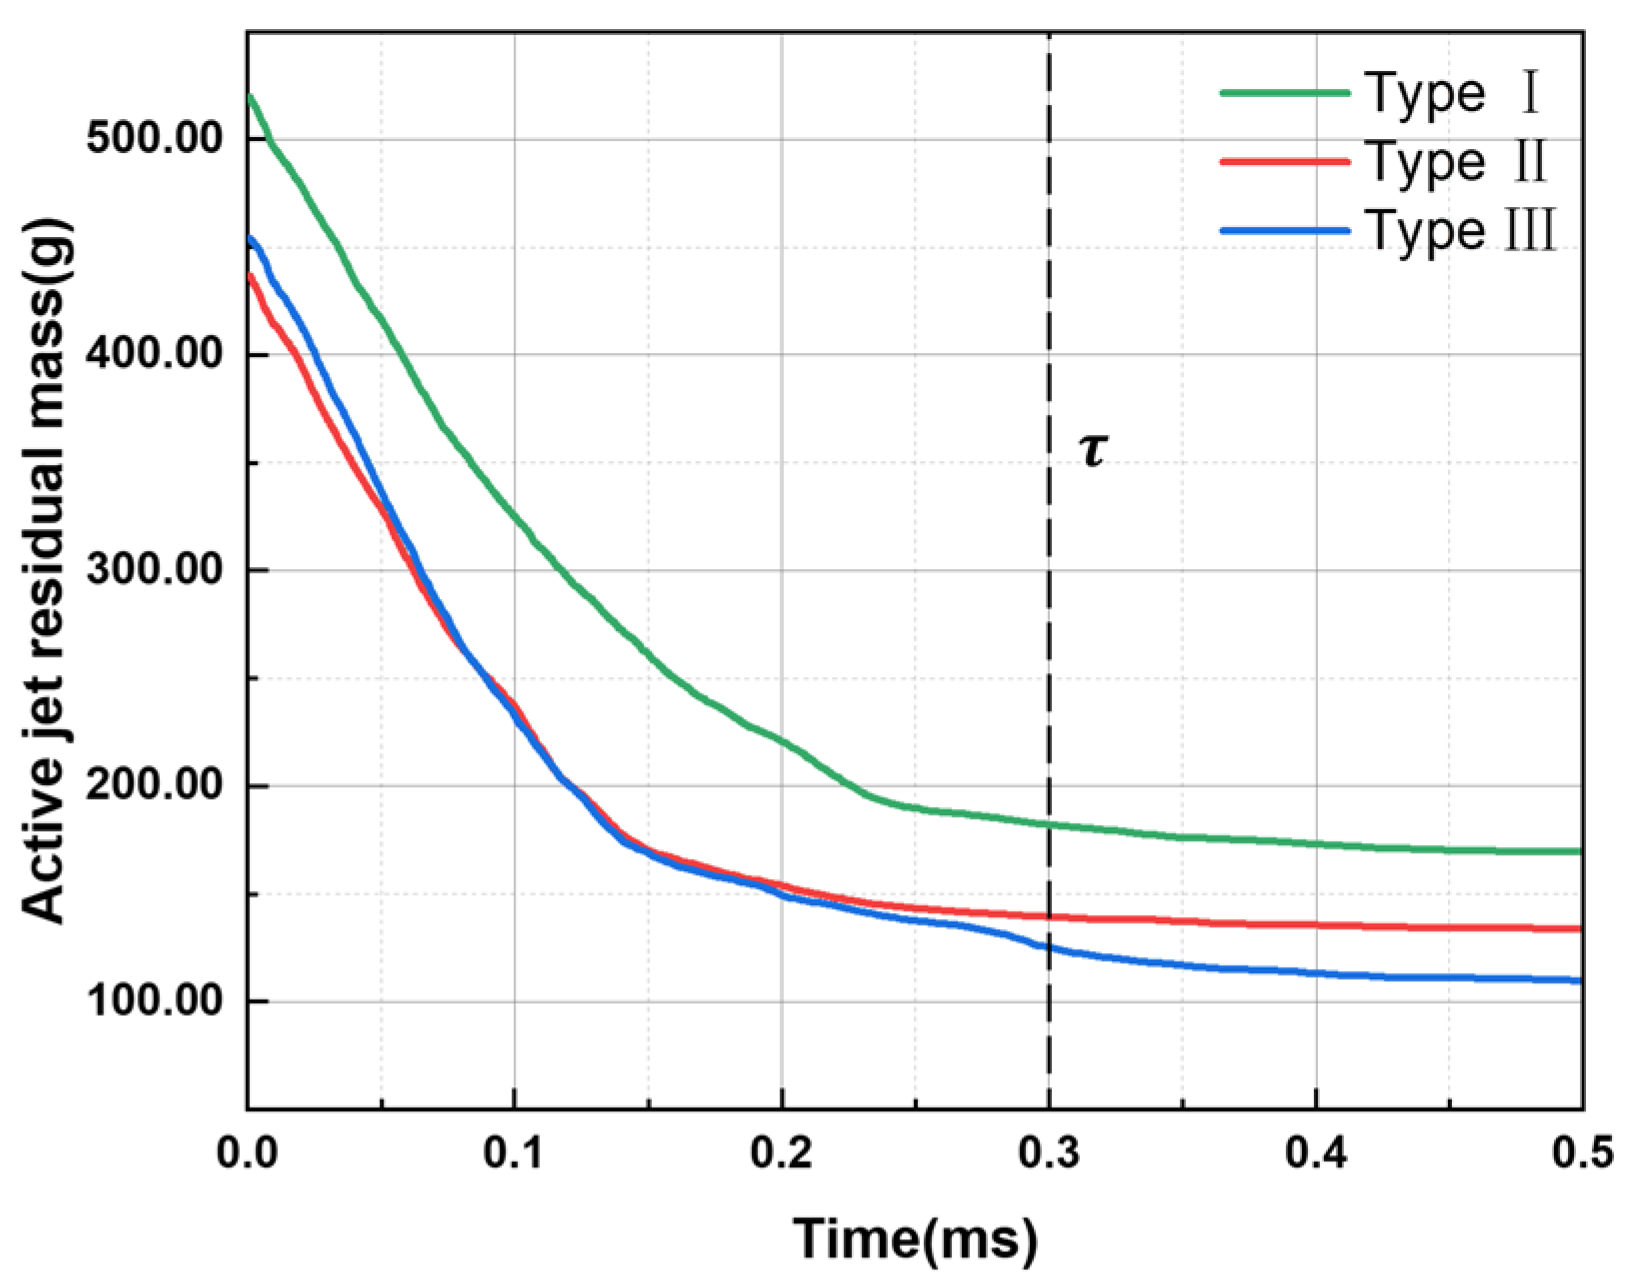
Previous studies have shown that the activation characteristics of reactive materials are influenced by factors such as material formulation, target conditions, and warhead configuration [30,42]. In related material systems, reaction activation has been observed at a time scale of approximately 0.30 ms [43]. Considering these findings, the relaxation time was set to τ = 0.3 ms as the baseline modeling parameter for the configuration investigated in this study. To assess the influence of the relaxation time selection on the main results, a sensitivity analysis was conducted for the Type I configuration using 0.3000, 0.3125, and 0.3750 ms [30]. Table 9 compares the damage results obtained using different relaxation times. The final fully damaged depth and fully damaged area after deflagration were compared. When the relaxation time varied from 0.3000 to 0.3750 ms, the maximum variations in the final fully damaged depth and fully damaged area of the Type I configuration were 2.17% and 3.88%, respectively. Therefore, within the investigated range of relaxation times, the macroscopic fully damaged results under the investigated conditions showed limited sensitivity to changes in the relaxation time.
Figure 20 shows the variation in the residual mass of jets formed by different reactive shaped charges with penetration time. It can be seen that, at the relaxation time, Type I reactive jets retain the largest residual mass, while Type III reactive jets retain the smallest residual mass. Therefore, Type I reactive jets exhibit the best bursting damage effect, whereas Type III reactive jets show the worst effect. Combined with the jet formation results in Section 3.1, Type I reactive jets have the largest initial mass as well as the largest residual mass. As shown in Figure 11, the pressure, temperature, and density distributions of Type III reactive jets are all relatively low, resulting in greater mass loss during penetration. Consequently, although the initial mass of Type III reactive jets is slightly larger than that of Type II jets, their residual mass at the relaxation time is the smallest.
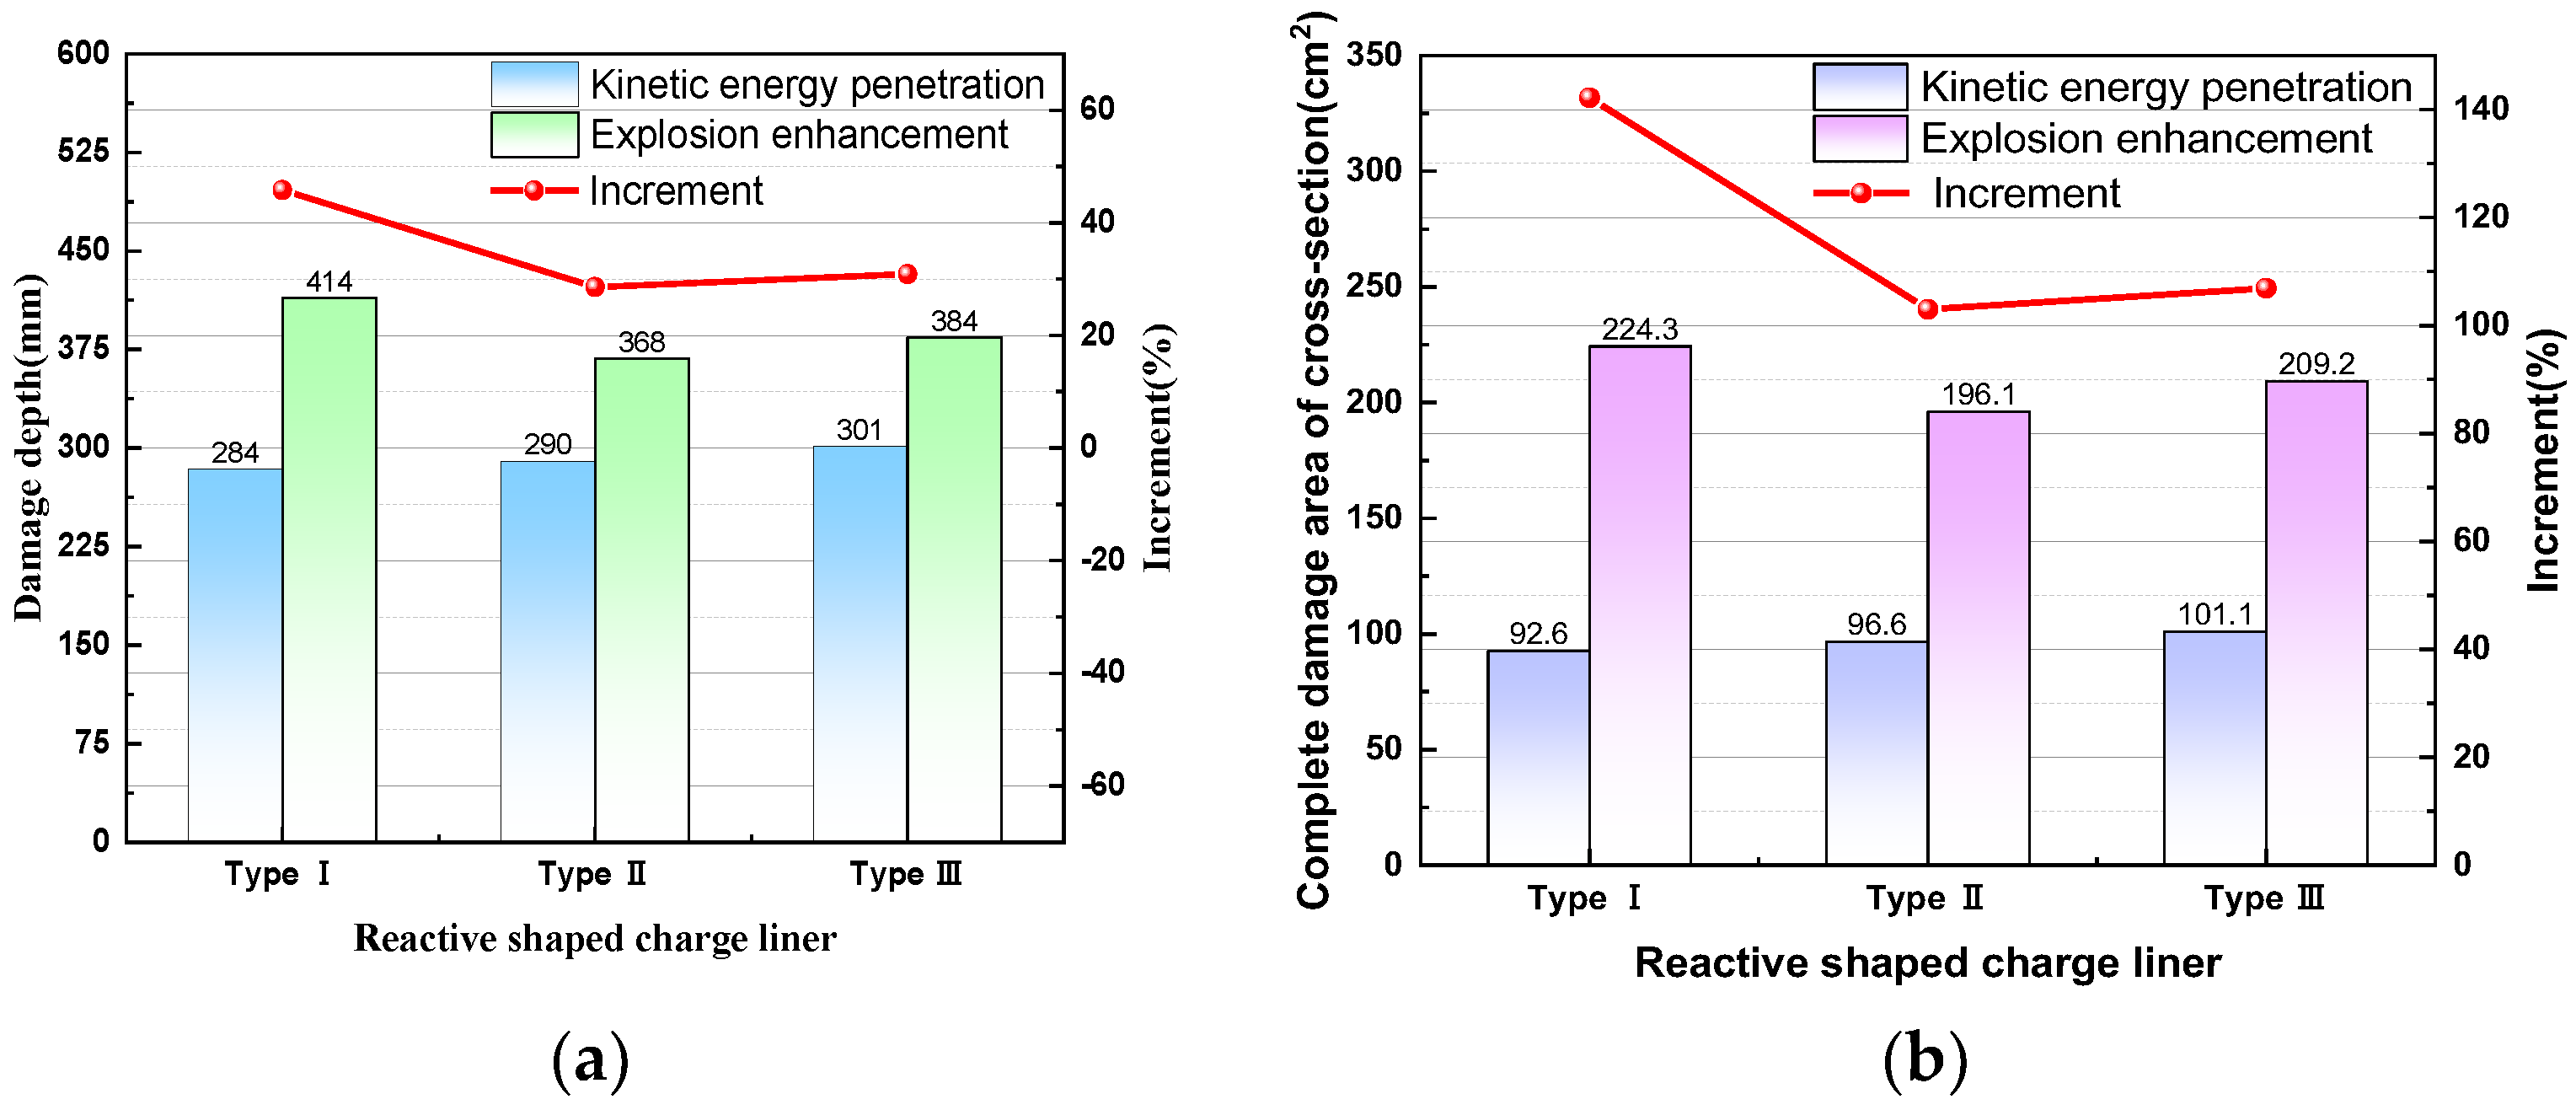
The deflagration-enhanced damage depth and the experimental results are listed in Table 10. It can be seen that the errors between the numerical simulation and the experimental results are all within 15%, which demonstrates the validity of the numerical calculation model. In this study, the full-damage region is defined as the red region corresponding to a damage level of 1 in the damage contours. Following the equivalent-radius calculation method described in Section 2.2, the damage contours of the concrete target at different times were extracted. The im2gray function and Image Region Analyzer in MATLAB were subsequently used to identify the full-damage regions and measure their areas during the kinetic-penetration and deflagration-enhancement stages. This area, together with the final damage depth, is taken as the quantitative basis for evaluating the damage effect of the reactive jet on the concrete target. As shown in Figure 21, under deflagration enhancement, the damage depth of the reactive jet into the concrete target increases by 33.4% on average, and the completely damaged area increases by 117.4% on average. It can be seen that the deflagration-enhanced effect of the reactive jet provides a significant improvement in the damage effect on this type of finite-sized concrete target.

5. Conclusions

This study combines full-scale damage tests, numerical simulations, and theoretical analysis to investigate the dynamic damage behavior of frustum-shaped concrete targets under the kinetic penetration and deflagration-enhanced effects of reactive jets. The main conclusions are as follows:
(1) Full-scale damage tests were conducted on TCCT under the action of reactive jets. According to the test results, when the concrete target is subjected to the top reactive jet, the upper part mainly undergoes a pulverization effect, while the lower part mainly undergoes a fracture effect. In addition, changes in the structure of the reactive shaped charge have a significant influence on the damage effect on such concrete targets. Charges with a smaller cone angle and larger thickness produce better damage performance.
(2) Through segmented numerical simulation of the kinetic penetration and deflagration-enhancement stages of a reactive jet acting on a finite-sized frustum-shaped concrete target, and by combining pressure–time curves, the damage mechanisms of this type of concrete target at different stages are revealed. The internal damage of the concrete target is mainly caused by compressive waves, whereas the damage to the bottom and side walls is mainly caused by reflected tensile waves.
(3) Through a comprehensive analysis of the numerical simulation and full-scale test results, the amplification relationship between the residual mass of the reactive jet and the deflagration-enhanced effect is clarified. Under the deflagration-enhanced action of the reactive jet, the damage depth and the fully damaged cross-sectional area of this type of finite-sized concrete target are increased by an average of 33.4% and 117.4%, respectively.

Author Contributions

Conceptualization, M.C., T.C., W.R., Y.Z. and H.G.; methodology, M.C., T.C., W.R., Y.Z. and H.G.; software, M.C., T.C. and H.G.; validation, M.C. and W.R.; formal analysis, M.C. and T.C.; investigation, M.C., T.C. and H.G.; resources, M.C.; data curation, T.C. and W.R.; writing—original draft preparation, M.C.; writing—review and editing, M.C. and H.G.; visualization, W.R.; supervision, Y.Z. and H.G.; project administration, Y.Z. and H.G.; funding acquisition, Y.Z. and H.G. All authors have read and agreed to the published version of the manuscript.

Funding

This research was funded by the Youth Foundation of the State Key Laboratory of Explosion Science and Safety Protection (No. QNKT25-08).

Data Availability Statement

The original contributions presented in this study are included in the article. Further inquiries can be directed to the corresponding author.

Conflicts of Interest

The authors declare no conflicts of interest.

Abbreviations

The following abbreviations are used in this manuscript:
TCCTTruncated-Cone Concrete Target
RSCLReactive Shaped Charge Liner
PTFEPolytetrafluoroethylene
CDCharge Diameter
JWLJones–Wilkins–Lee
SPHSmoothed Particle Hydrodynamics

References

  1. Allam, A.S.; Nik-Bakht, M. From demolition to deconstruction of the built environment: A synthesis of the literature. J. Build. Eng. 2023, 64, 105679. [Google Scholar] [CrossRef] [Scilit]
  2. Ning, J.; Yang, S.; Ma, T.; Xu, X. Fragment behavior of concrete slab subjected to blast loading. Eng. Fail. Anal. 2022, 138, 106370. [Google Scholar] [CrossRef] [Scilit]
  3. Fan, Y.; Chen, L.; Hong, J.; Yu, R.; Xiang, H.; Fang, Q. Considering explosive charge shape and embedded depth in the design of concrete shelter thickness. Def. Technol. 2023, 20, 44–57. [Google Scholar] [CrossRef] [Scilit]
  4. Mu, C.; Zhou, H.; Ma, H. Prediction method for ground shock parameters of explosion in concrete. Constr. Build. Mater. 2021, 291, 123372. [Google Scholar] [CrossRef] [Scilit]
  5. Liu, C.K.; Gao, F.; Deng, S.X.; Wang, Z.; Lu, H.; Deng, G.Q.; Wang, M.Y. Investigation on the damage and assessment of steel-concrete-steel composite structures subjected to penetration and explosive loadings. Structures 2026, 83, 110841. [Google Scholar] [CrossRef] [Scilit]
  6. Qi, G.F.; Lei, J.Y.; Liang, Z.F. Review of damage behavior of reinforced concrete structures under typical explosion and pact loads. J. Ordnance Equip. Eng. 2025, 46, 282–294. [Google Scholar]
  7. Jin, S.Y.; Zhang, K.F.; Li, X.Y.; Peng, Y.; Lu, F.Y. Theoretical model and experimental verification of damage zones in concrete gravity dams subjected to near-field explosion. Trans. Beijing Inst. Technol. 2025, 45, 1021–1030. [Google Scholar]
  8. Cao, M.S.; Han, B.; Kong, X.Z.; Fang, Q.; Xie, H.B.; Lei, Y.M.; Hu, J. Penetration-blast damage effects of earth-penetrating weapons on concrete gravity dams and the optimal strike location. Eng. Mech. 2026, 43, 1–18. [Google Scholar]
  9. Zhu, F.X.; Gao, F.; Liu, C.K.; Deng, S. Influence law of explosion damage effect of shell charge in concrete. J. Vib. Shock 2025, 44, 278–288. [Google Scholar]
  10. Ma, R.; Wang, X.; You, S.; Sun, Z.; Huang, F. Experimental and numerical analysis of near-field detonation products and shock wave characteristics for cylindrical charge. Def. Technol. 2025, 53, 242–258. [Google Scholar] [CrossRef] [Scilit]
  11. Shi, X.; Zheng, R.; Ye, C. Damage mechanism of reinforced concrete shear walls under axial compressive force and contact explosion. Buildings 2026, 16, 2132. [Google Scholar] [CrossRef] [Scilit]
  12. Huang, H.; Dai, S.; Cao, K.; Tang, C.; Zhang, X.; Zhang, C.; Qiu, Q. Study on damage behavior and anti-explosion performance of steel fiber-reinforced cellular concrete under underwater contact explosion. Buildings 2026, 16, 1975. [Google Scholar] [CrossRef] [Scilit]
  13. Měrková, A.; Perrot, A.; Mašek, J.; Kheml, P.; Konrád, P.; Sovják, R.; Hála, P. Resistance of high-performance concrete structural members with dispersed fibre reinforcement, E-glass/epoxy layer and polyurethane coating to direct contact blast. Int. J. Prot. Struct. 2026, 17, 518–547. [Google Scholar] [CrossRef] [Scilit]
  14. Ngo, T.N.; Nguyen, D.X.; Mai, C.V.; Dam, T.T. Experimental and numerical investigation of damage assessment in high-strength concrete slabs subjected to contact explosions. J. Struct. Integr. Maint. 2026, 11, 2616864. [Google Scholar] [CrossRef] [Scilit]
  15. Xiao, Y.; Zhu, W.; Wang, T.; Rabczuk, T. Damage evolution mechanism in concrete components under contact explosion: A coupled macro-meso perspective. Int. J. Impact Eng. 2026, 209, 105577. [Google Scholar] [CrossRef] [Scilit]
  16. Ma, S.X.; Xie, X.B.; Li, X.D.; Zhong, M.S.; Ji, Y.Z.Y. Vulnerability evaluation of concrete obstacle under action of shaped charge penetrators. J. Vib. Shock 2024, 43, 46–53. [Google Scholar]
  17. Hao, L.K.; Gu, W.B.; Zou, S.X.; Chen, H.; Liu, S.; Yang, H. Damage study of concrete obstacle caused by air contact explosion of group charge. J. Ordnance Equip. Eng. 2022, 43, 97–102. [Google Scholar]
  18. Kang, G.X.; Yan, H.C.; Zhang, Y.D.; Liu, M.J.; Hao, L.K. Experimental and numerical investigation on the damage effects of concrete pier under contact explosion. Acta Armamentarii 2024, 45, 144–155. [Google Scholar]
  19. Kang, G.X.; Zhang, Y.D.; Xie, X.B.; Gu, W.B. Investigation of blasting effects and mechanisms on concrete frustums under side-contact explosions. Def. Technol. 2025, 49, 113–127. [Google Scholar] [CrossRef] [Scilit]
  20. Kang, G.X.; Zhang, Y.D.; Xie, X.B.; Gu, W.B.; Song, W.Y.; Wang, M.J. Blasting-induced damage mechanisms and fragmentation of concrete frustums. J. Perform. Constr. Facil. 2026, 40, 04026001. [Google Scholar] [CrossRef] [Scilit]
  21. Sun, T.; Wang, H.; Wang, S.; Ge, C.; Hu, D.; Chen, P.; Zheng, Y. Formation behaviors of rod-like reactive shaped charge penetrator and their effects on damage capability. Def. Technol. 2024, 32, 242–253. [Google Scholar] [CrossRef] [Scilit]
  22. Zheng, Y.F.; Bie, H.Y.; Wang, S.P.; Li, P.L.; Zhang, H.Y.; Ge, C. Formation behaviors of coated reactive explosively formed projectile. Materials 2022, 15, 8886. [Google Scholar] [CrossRef] [Scilit] [PubMed]
  23. Lu, A.; Zhou, H.; Luo, F.; Zheng, C.; Kong, X.; Wu, W. Study on blast loading of charges with Al/PTFE reactive casing in confined spaces. Int. J. Impact Eng. 2026, 213, 105693. [Google Scholar] [CrossRef] [Scilit]
  24. Ren, K.; Chen, J.; Qing, H.; Chen, R.; Chen, P.; Lin, Y.; Baoyue, G. Study on shock-induced chemical energy release behavior of Al/W/PTFE reactive material with mechanical-thermal-chemical coupling SPH approach. Propellants Explos. Pyrotech. 2020, 45, 1937–1948. [Google Scholar] [CrossRef] [Scilit]
  25. Wu, J.; Liu, Q.; Feng, B.; Yin, Q.; Li, Y.; Wu, S.; Yu, Z.; Huang, J.; Ren, X. Improving the energy release characteristics of PTFE/Al by doping magnesium hydride. Def. Technol. 2022, 18, 219–228. [Google Scholar] [CrossRef] [Scilit]
  26. Li, H.D.; Duan, H.; Zhang, Z.; Zheng, Y.F. Study on perforation behavior of PTFE/Al Reactive material composite jet impacting steel target. Materials 2023, 16, 2715. [Google Scholar] [CrossRef] [Scilit] [PubMed]
  27. Guo, H.G.; Su, C.H.; Cai, Y.-Q.; He, S.; Yu, Q.-B.; Wang, H.F. Reactive jet density distribution effect on its penetration behavior. Def. Technol. 2023, 24, 190–202. [Google Scholar] [CrossRef] [Scilit]
  28. Zheng, Y.F.; Zhang, H.Y.; Li, P.L.; Zheng, Z.J.; Guo, H.G. Mesoscale formation and energy release characteristics of PTFE/Al reactive jet. Propellants Explos. Pyrotech. 2024, 49, e202300310. [Google Scholar] [CrossRef] [Scilit]
  29. Zhou, X.; Feng, B.; Chen, L.; Wang, R.; Li, Y. Stress wave effects in a semi-infinite concrete target under the coupled action of reactive jet penetration and internal explosion. Chin. J. Energ. Mater. 2025, 33, 689–702. [Google Scholar]
  30. Su, C.H.; Wang, Z.; Ma, H.B.; Zheng, Y.; Wang, H. Dynamic damage characteristics of composite concrete structure subjected to reactive jet. Acta Armamentarii 2024, 45, 135–146. [Google Scholar]
  31. Su, C.H.; Li, Z.Y.; Zheng, Y.F.; Zheng, Z.J.; Guo, H.G. Penetration-deflagration Experiment and Coupling Mechanism of Reactive Liner Shaped Charge. Acta Armamentarii 2023, 44, 334–344. [Google Scholar]
  32. Wang, H.F.; He, S.; Cai, Y.Q.; Xiang, J.; Su, C.H.; Guo, H.G. Damage behavior of multi-layer spaced target plates penetrated by reactive composite jet. Acta Armamentarii 2023, 44, 325–333. [Google Scholar]
  33. Zhang, H.; Zheng, Y.F.; Yu, Q.B.; Ge, C.; Su, C.H.; Wang, H.F. Penetration and internal blast behavior of reactive liner enhanced shaped charge against concrete space. Def. Technol. 2022, 18, 952–962. [Google Scholar] [CrossRef] [Scilit]
  34. Su, C.; Li, P.; Zhang, J.; Liu, A.; Zheng, Y.; Wang, H. Dynamic response characteristics of composite concrete structures subjected to reactive jet impact. Buildings 2024, 14, 624. [Google Scholar] [CrossRef] [Scilit]
  35. Raftenberg, M.N.; Mock, W., Jr.; Kirby, G.C. Modeling the impact deformation of rods of a pressed PTFE/Al composite mixture. Int. J. Impact Eng. 2008, 35, 1735–1744. [Google Scholar] [CrossRef] [Scilit]
  36. Xiao, J.G. Research on Damage Effects of Multi-Layered Concrete Targets Impacted by Explosively Formed Penetrator; Beijing Institute of Technology: Beijing, China, 2016. [Google Scholar]
  37. Zhang, Y.; Zhang, X.R.; Zhao, W.D.; Hu, F. Similarity law study of shaped charges penetrating a concrete target. Buildings 2022, 12, 2268. [Google Scholar] [CrossRef] [Scilit]
  38. Niu, Y.Q.; Huang, Z.X.; Jia, X.; Zu, X.D.; Xiao, Q.Q. Research on the penetration performance of shaped charge jet into block stone concrete targets. Int. J. Impact Eng. 2024, 193, 105060. [Google Scholar] [CrossRef] [Scilit]
  39. Cao, C.; Wang, J.X.; Kong, L.Q.; Tang, K.; Xiao, Y.; Gu, Y.; Yang, M.; Wang, J. Study on the formation characteristics of underwater hemispherical shaped charge jet and its penetration performance into concrete. Def. Technol. 2025, 47, 180–196. [Google Scholar] [CrossRef] [Scilit]
  40. Kim, J.H.; Yoo, H.S.; Jo, Y.B.; Kim, E.S. GPU-parallelized SPH solver for accurate hypervelocity impact simulation of shaped charge jet penetration in concrete structures. Int. J. Fract. 2025, 249, 52. [Google Scholar] [CrossRef] [Scilit]
  41. Xiao, J.; Zhang, X.; Guo, Z.; Wang, H. Enhanced Damage Effects of Multi-Layered Concrete Target Produced by Reactive Materials Liner. Propellants Explos. Pyrotech. 2018, 43, 955–961. [Google Scholar] [CrossRef] [Scilit]
  42. Wang, H.F.; Guo, H.G.; Geng, B.Q.; Yu, Q.B.; Zheng, Y.F. Application of PTFE/Al reactive materials for double-layered liner shaped charge. Materials 2019, 12, 2768. [Google Scholar] [CrossRef] [Scilit] [PubMed]
  43. Wei, R.; Liu, Y.; Xiao, J.; Yang, Y.; Zhang, J. Influence of structural parameters of layered interception compound reactive liner on combined penetrating and implosion effects. J. Phys. Conf. Ser. 2024, 2891, 032009. [Google Scholar] [CrossRef] [Scilit]
Figure 1. Geometric configuration and actual sample of the RSCL: (a) Three-dimensional sectional schematic. (b) Photograph of the actual sample.
Buildings 16 03417 g001
Figure 2. Reactive shaped charge warhead: (a) Schematic diagram of the warhead structure. (b) Photograph of the warhead.
Buildings 16 03417 g002
Figure 3. Test principle and site arrangement: (a) Schematic diagram of the test setup. (b) Test site arrangement.
Buildings 16 03417 g003
Figure 4. Simulation model of the reactive jet formation process.
Buildings 16 03417 g004
Figure 5. Simulation model of the kinetic penetration stage of the reactive jet against the TCCT.
Buildings 16 03417 g005
Figure 6. Schematic of the algorithm conversion for reactive-jet penetration-deflagration and the jet equivalence process.
Buildings 16 03417 g006
Figure 7. Typical high-speed photography of the concrete target under the action of the reactive shaped charge warhead: (a) Initial state at t1. (b) Detonation of the charge at t2. (c) Kinetic penetration at t3. (d) Initial reaction of the reactive jet at t4. (e) Complete reaction of the reactive jet at t5. (f) Fracture of the concrete target at t6.
Buildings 16 03417 g007
Figure 8. Damage to the concrete target under different operating conditions of the warhead: (a) Type I. (b) Type II. (c) Type III. (The red numbers indicate the identified large fragments.).
Buildings 16 03417 g008
Figure 9. Damage contours of the reactive jet kinetic penetration process against the TCCT.
Buildings 16 03417 g009
Figure 10. Damage contours of the reactive jet during deflagration damage of the TCCT.
Buildings 16 03417 g010
Figure 11. Pressure, temperature, and density distributions of the reactive jet at a stand-off distance of 120 mm: (a) Pressure distribution. (b) Temperature distribution. (c) Density distribution.
Buildings 16 03417 g011
Figure 12. Schematic diagram of observation-point locations on the TCCT during the kinetic penetration stage (Numbers 1–8 denote the predefined observation points).
Buildings 16 03417 g012
Figure 13. Pressure–time variations at different positions along the concrete target axis.
Buildings 16 03417 g013
Figure 14. Pressure–time variations at different positions on the side wall of the concrete target during the kinetic penetration stage.
Buildings 16 03417 g014
Figure 15. Pressure–time variations at different positions at the bottom of the concrete target during the kinetic penetration stage.
Buildings 16 03417 g015
Figure 16. Schematic diagram of observation point positions on the concrete target.
Buildings 16 03417 g016
Figure 17. Pressure-time variations at different positions inside the concrete target.
Buildings 16 03417 g017
Figure 18. Pressure–time variations at different positions on the side wall of the concrete target during the deflagration stage.
Buildings 16 03417 g018
Figure 19. Pressure–time variations at different positions at the bottom of the concrete target during the deflagration stage.
Buildings 16 03417 g019
Figure 20. Variation of the residual mass of jets formed by different reactive shaped charges with penetration time (The vertical dotted line indicates the relaxation time τ = 0.3 ms).
Buildings 16 03417 g020
Figure 21. Comparison of damage between kinetic penetration and deflagration-enhanced effects: (a) Damage depth. (b) Fully damaged cross-sectional area.
Buildings 16 03417 g021
Table 1. Test conditions.
Test No.LinerThicknessCone Angle/°Standoff
1Type I0.10 CD60120 mm
2Type II0.08 CD60120 mm
3Type III0.10 CD70120 mm
Table 2. Materials, equations of state, and strength models used in the numerical simulation.
PartMaterialEquation of StateStrength Model
airAirIdeal Gas-
case45 steelShockJohnson-Cook
charge8701JWLNone
ConcCONC-35 MPAP-alphaRHT
Table 3. Concrete material parameters [29].
ρ/(kg∙m−3)fc/(MPa)G/(GPa) f t * f s * ANQ0
22983516.70.10.181.60.610.68
BAFNFD1D2Pel (MPa)Pco (MPa)Np
1.05 × 10−21.60.60.041.023.36.0 × 1033.0
Table 4. Material parameters of 45 steel and unreacted PTFE/Al [34].
Materialρ
(kg∙m−3)
G
(GPa)
A1
(MPa)
B1
(MPa)
nC1mTmelt
(K)
Ca
(m/s)
S1 Γ
45 steel7830775073200.280.0641.06179345701.922.17
PTFE/Al227022.72502250.370.0671.077553301.342.0
Table 5. Material parameters of reacting PTFE/Al and 8701 explosive [34].
Materialρ0 (kg∙m−3)D (m·s−1)Pej (GPa)A2 (GPa)B2 (GPa)R1R2 ω
PTFE/Al227052002115.90.002370.60.38
87011710813528.6524.237.6784.21.10.34
Table 6. Statistics of concrete target damage under different warheads.
RSCL TypeRemaining Height of Concrete TargetNumber of Effective FragmentsNumber of Large FragmentsDamage to Steel Rail
I430 mm194Flew approximately 10 m away from the fragment area; fractured.
II475 mm234Flew approximately 5 m away from the fragment area; remained intact.
III460 mm146Remained within the fragment area; remained intact.
Table 7. Numerical simulation results of reactive jet formation under different liners.
Reactive LinerVelocity ContourHead Velocity (m/s)Tail Velocity (m/s)Jet Length (mm)Jet Diameter (mm)
Type I
(0.10 CD, 60°)
Buildings 16 03417 i0017324583164.579
Type II
(0.08 CD, 60°)
Buildings 16 03417 i0027518669164.576
Type III
(0.10 CD, 70°)
Buildings 16 03417 i003696579115277
Table 8. Comparison of the damage effects of the reactive jet on the concrete target at different stages.
RSCLContour Plot of the Damaged Cross-Section After Kinetic PenetrationContour Plot of the Damaged Cross-Section After Deflagration Enhancement
IBuildings 16 03417 i004Buildings 16 03417 i005
IIBuildings 16 03417 i006Buildings 16 03417 i007
IIIBuildings 16 03417 i008Buildings 16 03417 i009
Table 9. Comparison of damage results under different relaxation times.
Relaxation TimeDamage AssessmentFinal Fully Damaged Depth (mm)Fully Damaged Area (cm2)
0.3000Buildings 16 03417 i010414224.3
0.3125Buildings 16 03417 i011417220.1
0.3750Buildings 16 03417 i012423215.6
Table 10. Comparison of final damage depth between numerical simulation and experiment.
WarheadNumerical Simulation Final Damage Depth/mmExperimental Final Damage Depth/mmError
I41437011.9%
II36832513.2%
III38434012.9%
Disclaimer/Publisher’s Note: The statements, opinions and data contained in all publications are solely those of the individual author(s) and contributor(s) and not of MDPI and/or the editor(s). MDPI and/or the editor(s) disclaim responsibility for any injury to people or property resulting from any ideas, methods, instructions or products referred to in the content.