Article

Investigation of Fresh Concrete Lateral Pressure on Single-Sided Wall Formwork: Using Embedded Pressure Sensors


by
Arūnas Stašauskas
1,* and
Mindaugas Daukšys
2
1
UAB Doka Lietuva, Vilniaus g. 9, Paežerių k., Vilniaus raj., 14256 Paežeriai, Lithuania
2
Faculty of Civil Engineering and Architecture, Kaunas University of Technology, 51367 Kaunas, Lithuania
*
Author to whom correspondence should be addressed.
Buildings 2026, 16(17), 3413; https://doi.org/10.3390/buildings16173413
Submission received: 17 June 2026 / Revised: 31 July 2026 / Accepted: 19 August 2026 / Published: 26 August 2026
(This article belongs to the Section Building Structures)

Abstract

A full-scale field investigation was performed to evaluate the lateral pressure exerted by fresh concrete on a 6.67 m-high single-sided wall formwork during on-site casting. Five embedded pressure sensors were installed at various elevations to enable high-frequency, real-time monitoring of pressure evolution throughout the casting process. The experimental programme captured the combined effects of casting rate, staged placement, internal vibration, and casting interruptions, and the measured results were compared with widely used design models (ACI 347R-14, DIN 18218, and CIRIA R108). The results indicate a strongly non-hydrostatic pressure distribution, with a maximum pressure of 56 kN/m2 occurring at an intermediate height, rather than at the base, exceeding the design value by more than twice. Transient pressure peaks were closely associated with vibration, while casting interruptions promoted thixotropic structural build-up and reduced pressure recovery in lower regions. Comparison with design models demonstrates that commonly used approaches may significantly underestimate peak pressures unless conservative assumptions or calibrated parameters are applied. These findings provide rare full-scale field evidence of time-dependent and vibration-induced pressure behaviour and highlight the importance of real-time monitoring for capturing transient effects. The study contributes to an improved understanding of fresh concrete behaviour in single-sided wall systems and supports the development of safer, more reliable formwork design approaches.

1. Introduction

Lateral pressure exerted by fresh concrete is a critical design consideration for vertical formwork panels, anchors, and supporting systems. Accurate prediction of this pressure is essential to ensure structural safety and construction efficiency, as underestimated loads may lead to formwork failure. At the same time, overly conservative assumptions can increase material and labour costs. The most basic upper-bound assumption is a hydrostatic pressure distribution proportional to the concrete unit weight and placement height [1,2]. However, field observations and experimental studies have shown that fresh concrete behaves as a time-dependent thixotropic material, in which the internal structure rebuilds at rest and breaks down under shear and vibration, leading to pressure levels that deviate significantly from hydrostatic conditions [3,4,5,6]. As a result, lateral pressure is influenced not only by unit weight and casting height, but also by casting rate, concrete temperature, workability, vibration practice, and casting interruptions [4,7].
Current design guidance remains largely empirical. In North America, ACI 347R provides widely adopted pressure envelopes [2,8,9,10,11]; in Europe, DIN 18218 is commonly applied [9]; and in the UK, temporary works practice frequently references CIRIA recommendations [10] via BS 5975 [10]. A key divergence between design approaches concerns whether maximum pressure is assumed to occur at the base (hydrostatic assumption) or whether non-hydrostatic peak pressures may develop at intermediate heights due to staged placement, consolidation, and structural build-up [3,12]. In particular, vibration-induced pressure peaks remain difficult to capture with simplified design expressions [4,13]. This problem is especially relevant for single-sided wall formwork systems, where support conditions differ from those in conventional double-sided formwork.
Despite decades of research, high-temporal-resolution full-scale field datasets remain scarce, limiting the validation of existing predictive models under realistic construction conditions [14,15]. Recent reviews and model assessment studies further highlight the limitations of current predictive approaches and emphasise the need for field-validated pressure data under realistic construction conditions [2,15]. At the same time, recent advances in rheology-based modelling have demonstrated that the evolution of formwork pressure is strongly governed by thixotropic structural build-up and delayed pressure-response mechanisms [16,17].
To address this gap, full-scale lateral pressure measurements were obtained from a 6.67 m-high reinforced-concrete wall cast in the field, using embedded sensors at multiple elevations. The results demonstrate a strongly non-hydrostatic pressure distribution, with peak pressures occurring at intermediate heights and exceeding the design limit. The main objective of this work is to quantify the evolution of pressure with time and height, identify the mechanisms governing peak pressure development, and assess the accuracy of widely used design models (ACI 347R-14, DIN 18218, and CIRIA-based approaches) against field measurements. Key mechanisms governing lateral pressure development are summarised in Table 1, based on the reviewed literature.
Table 1 provides a synthesised overview of the fundamental mechanisms governing lateral pressure in fresh concrete, integrating findings from rheological theory, experimental studies, and empirical design approaches. It highlights the dominant roles of thixotropy, time-dependent structural buildup, and vibration-induced structural breakdown in governing pressure evolution, thereby explaining why real pressure distributions often deviate from hydrostatic assumptions. A single parameter does not govern lateral pressure; rather, it results from the interaction of multiple factors, including casting rate, temperature, mixture composition, and construction procedures. This multi-factorial nature introduces significant uncertainty into existing design models, which are typically based on simplified or empirical assumptions. The mechanisms summarised in the table provide the theoretical basis for interpreting the observed non-hydrostatic pressure distribution and the occurrence of peak pressures at intermediate heights. The mechanisms summarised in the table support explanations of experimentally observed phenomena, such as vibration-induced pressure spikes, partial pressure recovery after casting interruptions, and progressive pressure decay due to structural build-up. More recent studies have further demonstrated that vibration affects pressure not only by temporarily reducing the yield stress but also by destroying and rebuilding the internal network structure of fresh concrete [19]. This mechanism provides an additional physical explanation for transient pressure amplification and subsequent pressure decay observed during wall casting operations. It also reveals that linking theoretical concepts to observed behaviour reinforces the argument that an improved understanding of coupled rheological and construction effects is essential for developing more reliable, physically based formwork pressure prediction models.
The objective of this study is to investigate the time- and height-dependent development of lateral pressure in fresh concrete on single-sided wall formwork under real construction conditions using embedded pressure sensors, and to evaluate the applicability of commonly used design models for predicting non-hydrostatic pressure behaviour. The research focused on quantifying the evolution of lateral pressure over time and height during staged wall casting with internal vibration; identifying the mechanisms controlling peak pressure magnitude and its vertical location; and comparing measured pressures with predictions from ACI 347R-14, DIN 18218, and CIRIA R108-type approaches.

2. Materials and Methods

The experimental methodology adopted in the present work is based on the assumption that fresh concrete behaves as a time-dependent thixotropic material, in which lateral pressure is governed by the balance between self-weight and structural build-up [3,12,21]. In contrast to hydrostatic assumptions, pressure decreases over time as the yield stress increases, while casting operations and internal vibration may temporarily restore fluid-like behaviour [4,13]. To investigate these mechanisms under realistic conditions, a full-scale field experiment was conducted using a single-sided wall formwork system instrumented with embedded pressure sensors [20,22]. The study examines the combined influence of structural configuration, concrete properties, casting procedure, and vibration on pressure development, supported by high-frequency measurements. The dataset is further processed using a structured spatio-temporal analysis, enabling reconstruction of the pressure field and identification of non-hydrostatic behaviour. This integrated approach provides a consistent basis for evaluating the applicability and limitations of existing design models [7,10,14,16].

2.1. Project and Formwork Configuration

The experiment was conducted in Vilnius, Lithuania, on 30 September. The ambient temperature was 16 °C, and the humidity was 60%. It was carried out during the casting of a reinforced concrete wall with the following geometry:
  • Height—6.67 m, width—6.0 m; wall thickness—0.30 m;
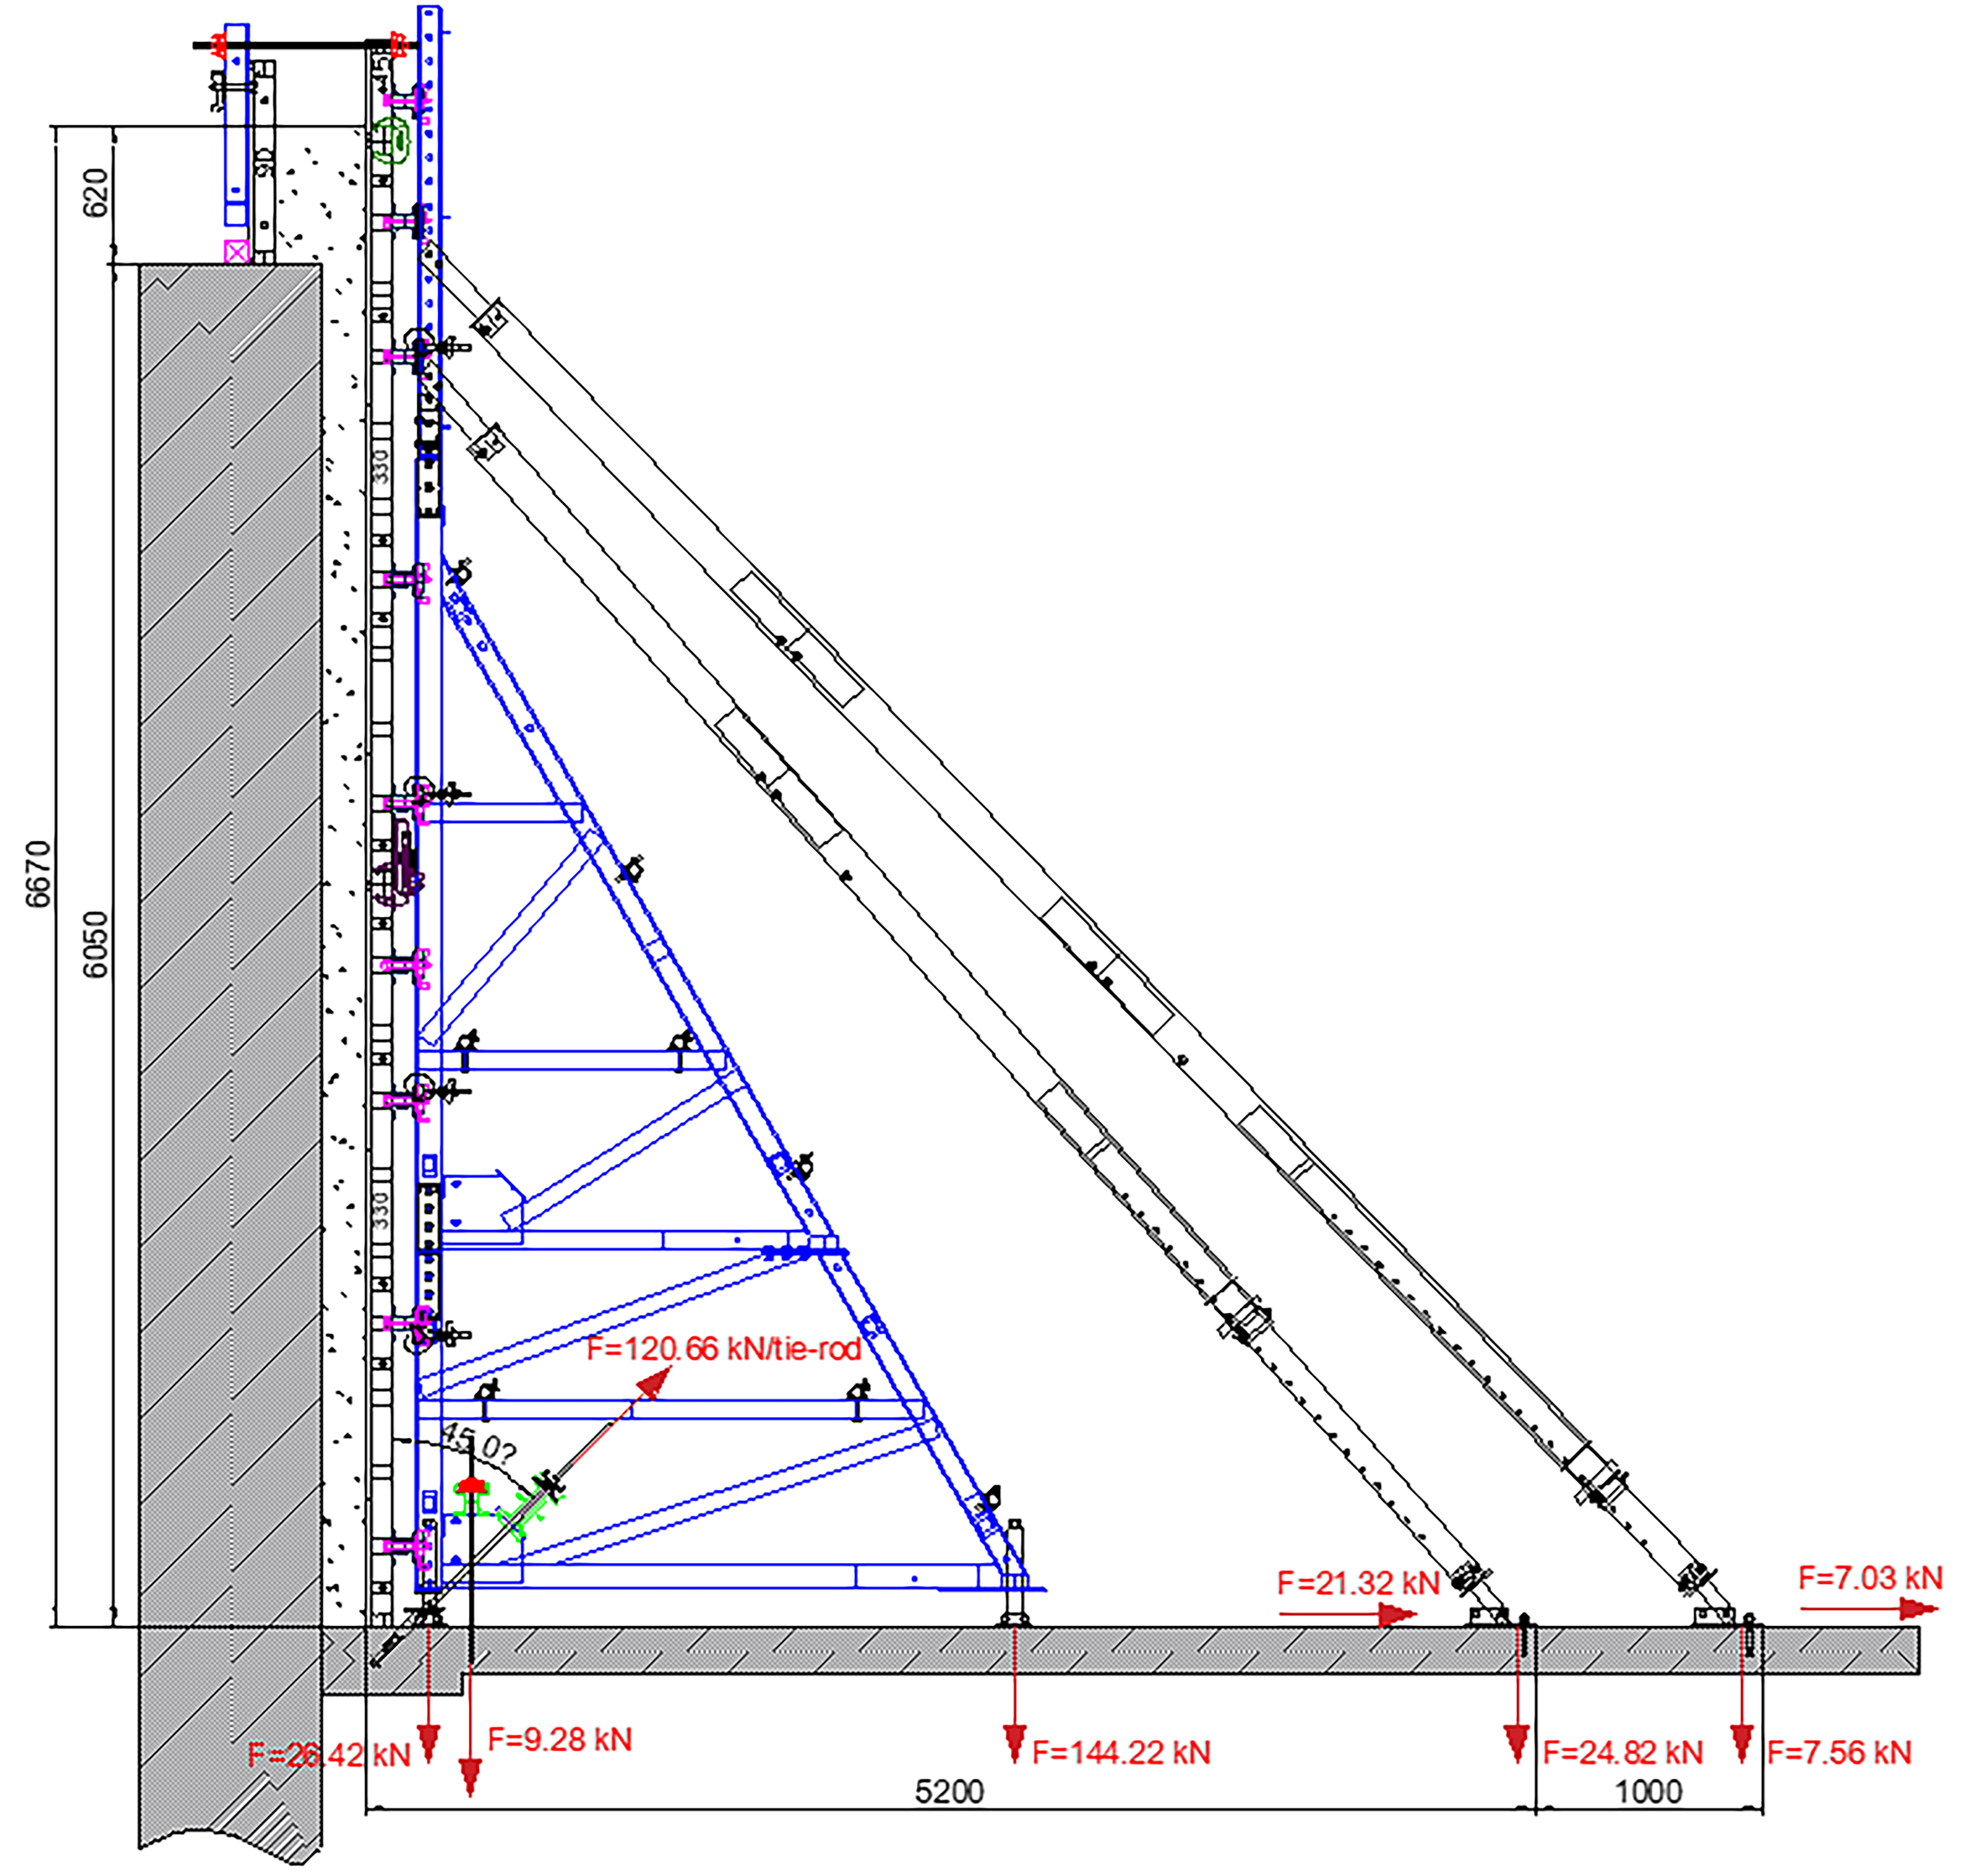
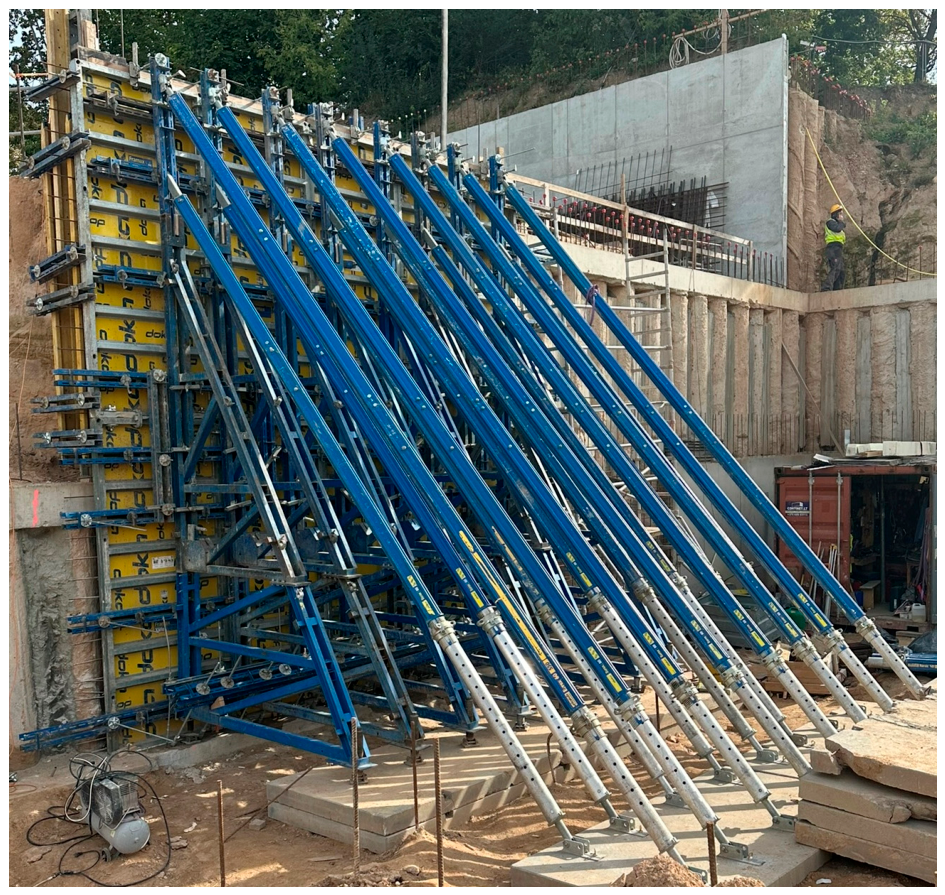
  • Formwork: single-sided steel wall formwork (Framax Xlife (Doka GmbH, Amstetten, Austria)), supported by an external bracing system (supporting construction frames “Universal” + Eurex 60 (Doka GmbH, Amstetten, Austria)) and fixed to the foundation with 20 mm anchors (Figure 1 and Figure 2) [17,23];
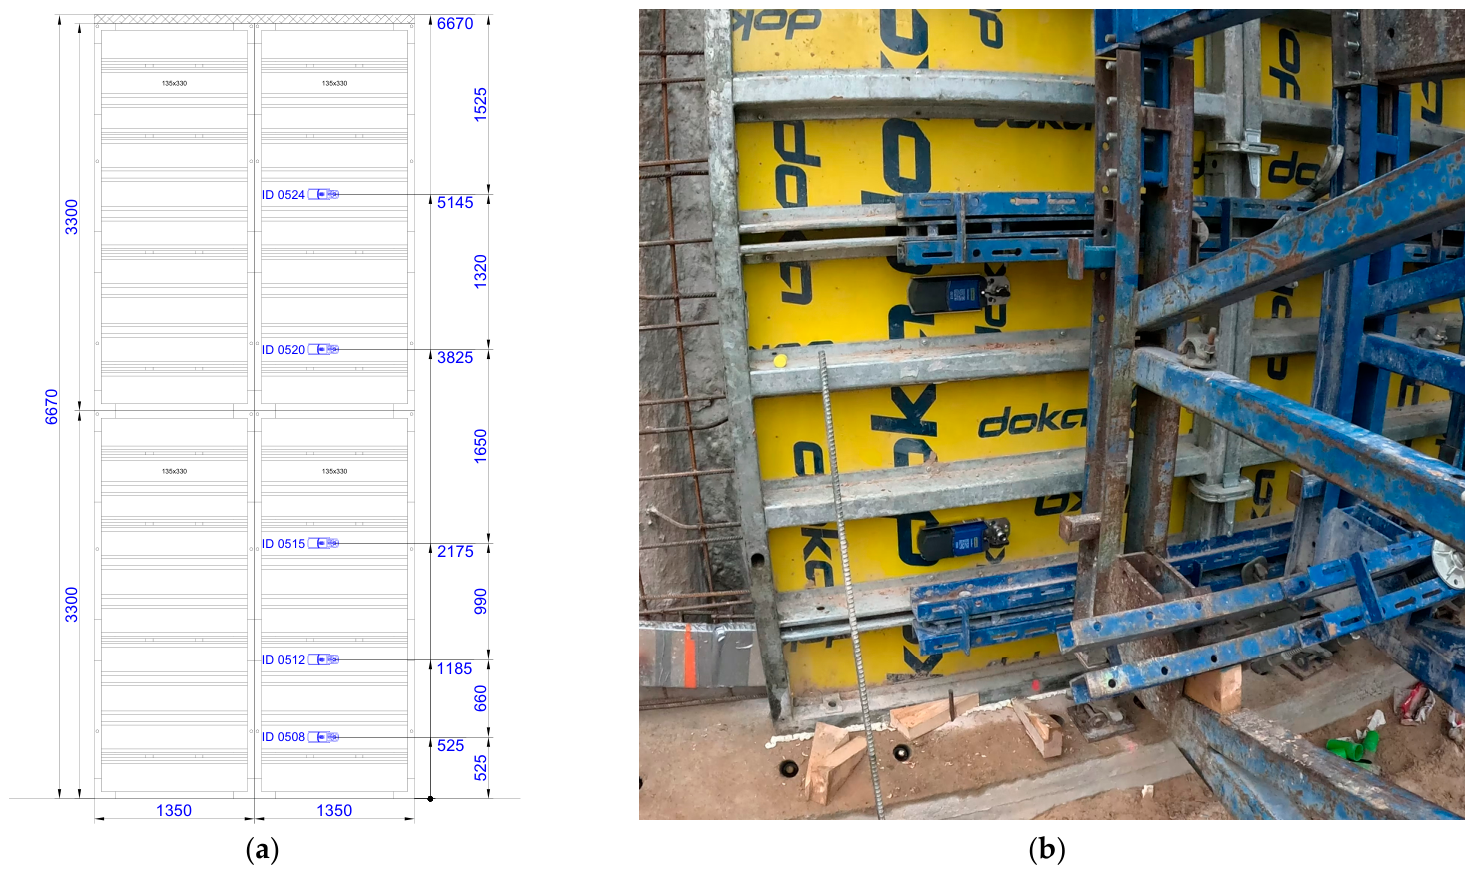
  • Sensor setup shown in Figure 3 and Table 2. A full DokaXact monitoring report is provided in Appendix A.
The configuration corresponds to typical single-sided wall construction conditions, in which lateral stability and anchorage influence pressure development [12,17].

2.2. Concrete Mix and Fresh Properties

Fresh concrete properties of C30/37 strength class concrete that can be used in exposure classes XC3, XD1, XF2 at the time of placement were as follows:
  • Concrete mixture temperature: 23 °C;
  • Slump value: ~200 mm (S4 consistency);
  • Fresh concrete density: 2385 kg/m3;
  • Air content (by pressure method): ~4%;
  • Maximum aggregate size (Dmax): 16 mm.
The temperature of fresh concrete was determined in accordance with LST EN 12350-1:2019 [24]; the slump of fresh concrete was determined in accordance with LST EN 12350-2:2019 [25]; the density of fresh concrete was determined in accordance with LST EN 12350-6:2019 [26]; and the air content of compacted fresh concrete was determined in accordance with LST EN 12350-7 [27]. These parameters are consistent with pumpable structural concrete mixes used in wall construction and fall within ranges known to influence thixotropic pressure development [3,4,9].
The unit weight used for theoretical hydrostatic comparison was calculated as:
γ c   =   ρ · g   = 2385   · 9.81 1000 =   23.40   k N / m 3 ,
where
  • γ c —unit weight, kN/m3;
  • ρ —density of the fresh concrete, kg/m3;
  • g—acceleration due to gravity, ~9.81 m/s2.

2.3. Casting Procedure and Vibration

Fresh concrete was placed in successive lifts of approximately 0.5 m, with an average casting rate of ~1.5 m/h. Fresh concrete was compacted using internal vibrators (approximately 1 kW power), which are known to significantly affect transient lateral pressure peaks, by locally remobilizing the fresh concrete structure [4,13]. A controlled interruption of 35 min (11:08–11:43) occurred during casting. This interruption allowed partial structural build-up of the fresh concrete and influenced subsequent pressure redistribution, consistent with time-dependent thixotropic behaviour [3,12].

2.4. Instrumentation and Data Acquisition

Lateral pressure was measured using embedded DokaXact pressure sensors, a system (Doka GmbH, Amstetten, Austria) developed for real-time monitoring of formwork pressure development [22]. The DokaXact system is a digital monitoring solution that continuously records and transmits pressure data during concreting, providing full transparency of pressure evolution throughout the casting process. The DokaXact Pressure sensor directly measures the fresh-concrete pressure acting on the sensing surface in contact with the concrete, enabling accurate monitoring of lateral pressure development under real-world construction conditions.

2.4.1. System Architecture and Data Transmission

The measurement system consists of: a pressure sensor (Trafag industrial sensor (Trafag AG, Bubikon, Switzerland)), a DokaXact data acquisition unit, and an autonomous battery module. Measured values are transmitted via Bluetooth to a mobile device, which then forwards them to the DokaXact web portal, where real-time visualisation and data storage are provided. The system operates as a mesh network of interconnected sensors, enabling data acquisition from multiple locations while requiring connection to only one device.

2.4.2. Pressure Sensor, Data Acquisition Unit, Power Supply

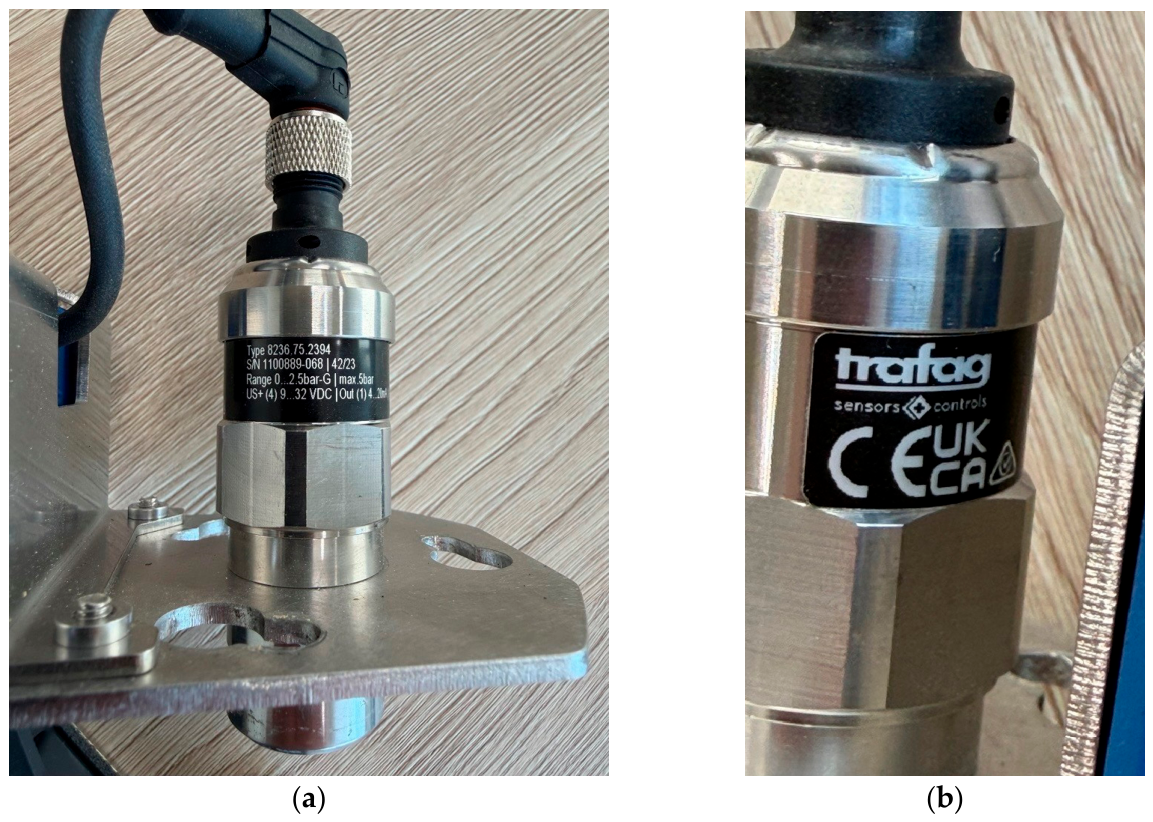
Pressure measurements were taken using an integrated Trafag industrial pressure sensor (Type 8236.75.2394) mounted on a dedicated adapter plate (Figure 4 and Table 3).
The Trafag industrial pressure sensor is supplied as a factory-calibrated measurement device. No additional calibration was performed on site because the sensors were deployed within the DokaXact monitoring system as delivered by the manufacturer.
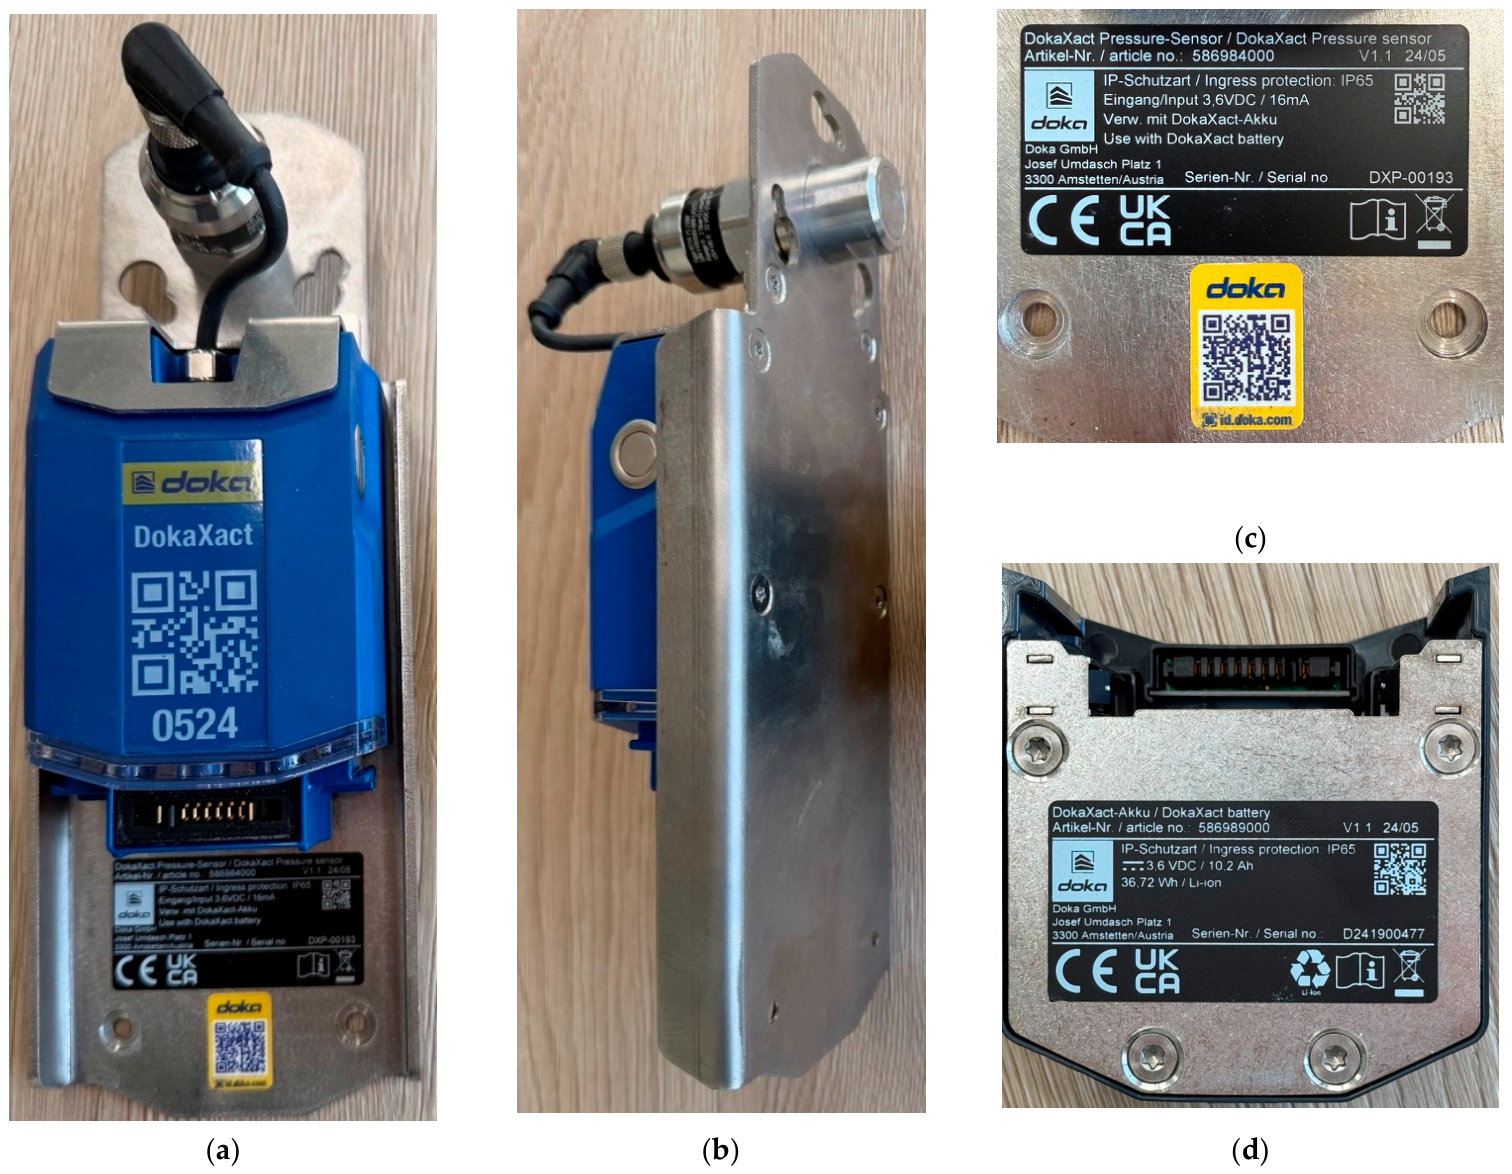
Data Acquisition Unit (DokaXact) (Figure 5).
Each sensor was connected to a DokaXact data acquisition unit, which was responsible for:
  • signal conditioning and conversion;
  • continuous high-frequency recording;
  • wireless communication;
  • sensor identification.
Power Supply and System Autonomy.
The system was powered by a DokaXact Li-ion battery module (Figure 5d), characterised by:
  • Voltage: 3.6 V DC;
  • Capacity: 10.2 Ah (36.72 Wh);
  • Protection class: IP65.

2.4.3. Measurement Principle

The measurement principle is based on direct sensing of the pressure acting on the formwork-contact surface, which differs fundamentally from indirect estimation using theoretical models.

2.4.4. Measurement Setup

Fresh concrete was pumped using a concrete pump and gravity-placed in ~0.50 m lifts to a total height of 6.67 m. Internal vibration was applied after each lift. DokaXact sensors installed at multiple heights recorded lateral pressure throughout the placement. The complete measurement chain can be summarised as: Fresh concrete pressure → Sensor diaphragm → 4–20 mA signal → DokaXact unit → Bluetooth transmission → mobile device → cloud/web portal → dataset.
The sensors were installed at fixed elevations before concreting and remained in place throughout the entire casting process. Sensor positions were selected to provide pressure measurements across both the lower and upper wall regions.

2.4.5. Data Acquisition Characteristics

The system provides high-frequency monitoring (~3 s intervals), enabling capture of:
  • transient pressure peaks during placement;
  • rapid pressure changes caused by vibration;
  • time-dependent pressure decay after the peak.
All sensors operated under identical acquisition settings and sampling intervals. Measurements were automatically recorded continuously throughout the casting process, without manual intervention.
High-frequency, real-time monitoring with DokaXact captures transient pressure peaks during placement and vibration, providing a more realistic representation of the evolution of lateral concrete pressure and enabling optimised casting strategies beyond conventional design assumptions [8,17].

2.4.6. Measurement Reliability and Accuracy

The DokaXact Pressure system used in this study incorporates a factory-calibrated Trafag industrial pressure transmitter. According to the manufacturer, all pressure sensors are pre-calibrated before delivery, and assembled DokaXact units undergo systematic quality-control testing before deployment.
The pressure transmitter generates a standard industrial 4–20 mA analogue output signal proportional to the measured pressure. The DokaXact acquisition unit converts this signal into engineering pressure values for storage and visualisation.
Before concrete placement, sensors were installed under unloaded conditions and baseline readings were verified. According to the manufacturer’s specifications, the DokaXact Pressure sensor provides a typical accuracy of ±1% and a maximum deviation of ±2% of full scale. Consequently, the measurement uncertainty is considered small relative to the pressure range recorded during the experiment.
No field recalibration was performed because the system was supplied as a factory-calibrated industrial measurement system.

2.5. Data Processing, Interpolation, and Visualisation Methodology

The data analysis and visualisation procedure was implemented in Python 3.14.3, using widely used scientific computing libraries, including Pandas 3.0.2, NumPy 2.4.4, Matplotlib 3.10.8, and SciPy 1.17.1. The complete Python implementation used for pressure reconstruction is provided in Appendix B.
It should be emphasised that all peak pressures reported in Table 4 are directly measured sensor values. Interpolation, spline approximation, and Gaussian smoothing were applied exclusively for the reconstruction and visualisation of the pressure field and were not used to determine the reported maximum pressures.

2.5.1. Data Acquisition and Preprocessing

Experimental data were imported from a Microsoft Excel file using the Pandas library. The dataset comprised time records, sensor heights, and corresponding measured pressure values. The relevant columns were defined as: height H in metres, time T in UTC format (hh:mm:ss), and pressure P in kN/m2. The dataset was prepared from raw sensor logs and structured into a standardised Excel format (Sensor ID|Height|Time|Pressure). Each timestamp contained measurements from five embedded sensors at fixed heights (0.525 m to 5.145 m). The dataset comprises 6362 valid records, with an average sampling interval of approximately 3 s, spanning 07:12:05–13:06:59 (UTC), corresponding to 10:12:05–16:06:59 local time in Vilnius (EET, UTC+3). Time data were converted to a continuous numerical representation (seconds from midnight) to enable quantitative analysis. Height values were standardised by replacing decimal separators and casting to floating-point format. Pressure values were converted to numeric form. Special measurement values were preserved rather than removed: pressure values of 0 indicate initial or unloaded conditions, while values of −1 indicate sensor or communication errors. Incomplete rows and corrupted entries were removed; however, no outlier filtering or smoothing was applied at this stage to preserve the integrity of raw field measurements.
Values equal to 0 were retained because they represented unloaded or inactive measurement conditions. Values equal to −1 indicated communication or sensor-status errors and were excluded from quantitative analysis. These records were subsequently treated as missing values during interpolation and visualisation.

2.5.2. Handling of Missing Data

Due to real-world measurement conditions, the dataset contains communication gaps. A total of 37 interruptions were identified, corresponding to approximately 1697 missing data points relative to the nominal 3-s sampling interval. Missing data were identified when time-step differences exceeded the expected sampling interval. These gaps were retained and addressed during interpolation rather than removed, ensuring a realistic representation of field conditions.

2.5.3. Selection of Representative Time Steps

To capture the most significant structural response, the method identifies peak loading conditions. For each sensor height, the five highest pressure values were extracted using rank-based filtering. The corresponding time instances were aggregated and deduplicated to produce a set of critical time steps. The dataset’s initial and final time values were also included to ensure full temporal coverage. Furthermore, the dataset comprises four distinct casting or monitoring phases, identified by temporal gaps exceeding five minutes. These phases were taken into account during the selection process to avoid mixing independent casting events.

2.5.4. Construction of the Pressure Dataset in Space–Time Domain

At each selected time step, pressure measurements at different heights were compiled. Only time sections with sufficient vertical resolution (at least three measurement points) were retained. The resulting dataset comprises discrete observations in the two-dimensional spatiotemporal domain (H, T) with associated pressure values P. For analysis, the dataset was logically reorganised into a time-aligned matrix (wide format), with each timestamp containing synchronised pressure values across all sensor heights. This transformation enables direct comparison of pressure evolution along the vertical axis.

2.5.5. Surface Interpolation

A continuous pressure field P(H, T) was reconstructed via scattered-data interpolation. Specifically, the SciPy function griddata was used to interpolate irregularly spaced measurements onto a structured grid defined over the height and time dimensions. Linear interpolation was used as the primary method for its balance of accuracy and computational efficiency. Temporal interpolation was applied only to short-duration gaps caused by missing data. In contrast, large gaps between casting phases were explicitly excluded from interpolation to prevent non-physical continuity between independent events. Missing values in the interpolated grid were subsequently filled using nearest-neighbor interpolation to ensure complete surface coverage.

2.5.6. Signal Smoothing

To reduce noise while preserving spatial variation, a Gaussian filter was applied only along the temporal axis. This approach smooths temporal fluctuations without distorting the physical distribution of pressure with height. The filtering process enhances the interpretability of the pressure field and improves visual continuity. Smoothing was applied conservatively to avoid altering peak pressure values or masking abrupt changes in casting dynamics.

2.5.7. Section Curve Approximation

For each selected time step, vertical pressure profiles were approximated using univariate spline interpolation. This method provides smooth, continuous curves that represent the pressure distribution with height while maintaining a controlled level of smoothing. Spline parameters were chosen to balance smoothness with fidelity to measured data, ensuring that key physical features, such as pressure gradients and peak zones, were preserved.

2.5.8. Visualization

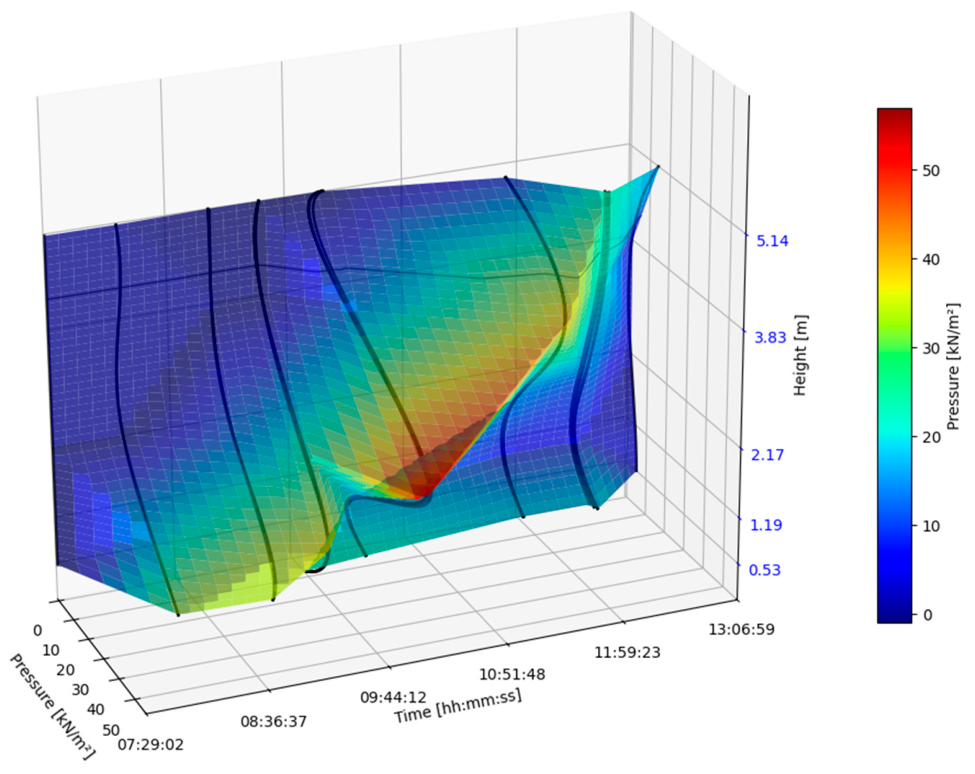
A three-dimensional visualisation of the pressure envelope was generated using Matplotlib. The plot shows: pressure P on the x-axis, time T on the y-axis, and height H on the z-axis.
The interpolated pressure surface was rendered using a JET colourmap, where colour intensity corresponds to pressure magnitude. To enhance interpretability:
  • contour lines were superimposed on the surface to indicate pressure gradients;
  • spline-based section curves were plotted as black lines to highlight discrete measurement profiles;
  • sensor heights were explicitly marked on the vertical axis.
Axis orientations for pressure and time were intentionally inverted to conform to engineering visualisation conventions. Time labels were formatted in a human-readable hh:mm:ss format. A colour bar was included to provide a quantitative reference for pressure values. Visualisation was performed both globally and for each identified casting phase to ensure the correct interpretation of pressure evolution within individual casting intervals.

2.5.9. Summary

The implemented methodology combines:
  • data cleaning and transformation (Pandas, NumPy);
  • peak detection for selecting the critical state;
  • multidimensional interpolation (SciPy griddata);
  • signal smoothing (Gaussian filtering);
  • curve fitting (univariate splines);
  • and advanced 3D visualisation (Matplotlib).
The methodology explicitly accounts for real-world data characteristics, including multiple casting phases, irregular sampling, and missing data due to communication losses, ensuring that the resulting pressure-field representation remains physically meaningful. This integrated approach enables the construction of a continuous, interpretable pressure-envelope surface that effectively represents the evolution of lateral concrete pressure as a function of both height and time.

3. Results

This section presents the measured evolution of fresh-concrete lateral pressure, derived from full-scale field monitoring using embedded sensors. The results are analysed in terms of vertical pressure distribution, time-dependent behaviour, and the influence of casting operations, including staged placement, vibration, and interruptions. Particular attention is given to identifying deviations from conventional hydrostatic assumptions and to determining the magnitude and location of peak pressures within the formwork system.

3.1. Peak Pressures and Vertical Distribution

Peak lateral pressures measured by the embedded sensor system are summarised in Table 4.
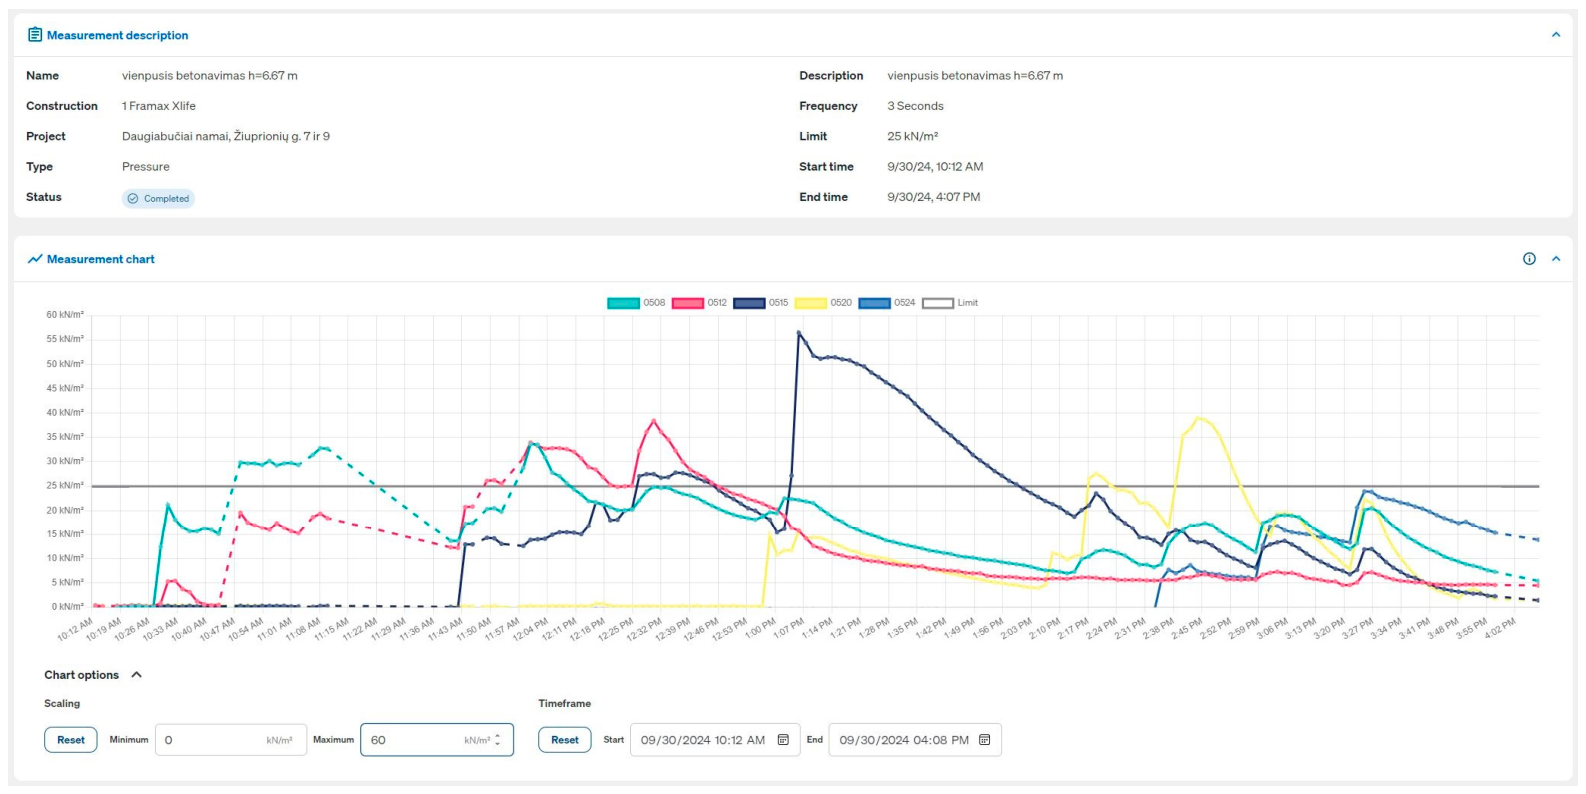
The maximum recorded lateral pressure (56 kN/m2) occurred at an intermediate height of approximately 2.2 m, rather than at the base of the formwork (Figure 6 and Table 4). This confirms a distinctly non-hydrostatic pressure distribution under real casting and vibration conditions, consistent with thixotropic and time-dependent concrete behaviour reported in the literature [3,4,12].

3.2. Time Evolution and Effect of Casting Interruption

Pressure evolution followed a stepwise pattern corresponding to successive 0.5 m concrete lifts. Each placement stage produced a transient increase in lateral pressure, particularly during active vibration, indicating strong sensitivity to local mechanical disturbance [4,13]. Short-duration pressure spikes were observed during internal vibration phases, confirming the influence of shear-induced structural breakdown on temporary pressure increases. A 35-min interruption in casting led to stabilisation of pressure in the lower sensor zones. After resumption of casting, previously observed peak values were not fully recovered in the lower regions, indicating partial structural build-up during rest periods. This behaviour is consistent with the thixotropic structural build-up and recovery of fresh concrete at rest [3,12].

3.3. Exceedance of Design Pressure Limits

The specified project design limit was 25 kN/m2, whereas the maximum measured value was 56 kN/m2. This represents an exceedance of more than 100% relative to the assumed design envelope. The results indicate that the adopted design value was non-representative of the applied casting rate, vibration practice, and single-sided formwork conditions. Similar discrepancies between simplified design models and field measurements have been reported in previous studies and code comparisons [11,12,13,14].

4. Discussion and Comparison with Fresh Concrete Lateral Pressure Design Models

This chapter compares lateral pressures of fresh concrete in steel single-sided wall formwork using different design models: ACI 347R-14 (2014), which provides recommendations and engineering guidance for the design, construction, operation, and removal of concrete formwork systems and is one of the most widely used references in concrete construction and research; DIN 18218:2018, used to calculate the pressure of fresh concrete on vertical formwork during concrete casting, and its main purpose is to help engineers and contractors safely design and dimension formwork systems for walls, columns, and other vertical concrete elements; and CIRIA Report R108, important because it moved beyond assuming fully hydrostatic pressure and introduced more realistic approaches to pressure development based on concrete stiffening and placement conditions.

4.1. Hydrostatic Reference (Upper Bound)

Hydrostatic pressure is given by:
P h y d ( H ) = γ c H ,
The theoretical maximum pressure at the base of the wall (H = 6.67 m) is:
P h y d ( H ) = 23.40 6.67 = 156.1 kN / m 2 ,
where
  • P h y d —the theoretical maximum pressure at the base of the wall, kN/m2;
  • γ c —unit weight, kN/m3;
  • H —wall height, m.
This represents a fully fluidised upper bound and is not representative of fresh concrete behaviour under real construction conditions, where structural build-up and thixotropy reduce effective pressures [3,4].

4.2. Wall Formwork Model in Accordance with ACI 347R-14 (2014)

For wall formwork, ACI 347R-14:2014 provides an empirical expression for the maximum pressure on vertical formwork at controlled casting rates:
P m a x ,   A C I = C w C c ( 7.2 + 785 · R T + 17.8 )
with bounds:
28.7 C w P m a x ,   A C I γ c H
Since the calculated pressure falls below the minimum ACI design pressure 28.7   k N / m 2 36.1   k N / m 2 156.1   k N / m 2 , the governing ACI design value becomes P m a x ,   A C I = 36.1 kN / m 2 .
Where
  • P m a x ,   A C I —maximum lateral pressure of fresh concrete acting on the formwork under controlled casting rates, kN/m2;
  • C w —coefficient which accounts for the unit weight coefficient of concrete;
  • C c —coefficient which accounts for the influence of cement type and admixtures on setting characteristics;
  • C w = C c = 1.0 ;
  • R—rate of concrete placement, m/h, R = 1.5   m / h
  • T—concrete mixture temperature during placement, °C, T = 23   ° C
For the investigated casting conditions, the ACI 347R-14 prediction underestimated the measured peak pressure of 56 kN/m2 [8,28].

4.3. Consistency-Based Model in Accordance with DIN 18218:2018

DIN 18218 expresses pressure as a function of the casting rate and setting-dependent factors:
σ h , k , m a x = f ( ν , K 1 , t E )
Here:
  • σ h , k , m a x —maximum lateral stress on formwork, kN/m2;
  • ν —casting rate, m/h; ν = 1.5   m / h ;
  • K1—empirical coefficient depending on concrete properties, consistency, temperature, or formwork conditions;
  • t E —effective setting time of fresh concrete, h.
Since direct measurements of setting time were not available, a sensitivity analysis was conducted using representative effective setting times reported for ordinary Portland cement concrete under comparable site conditions (Table 5). For S4 slump class fresh concrete, effective setting times typically range from t E = 4.0 8.0   h , depending on admixtures, temperature, and cement characteristics. The empirical coefficient K 1 generally varies between 6.5 K 1 9.0 for normal-weight vibrated concrete.
The results confirm that DIN 18218 yields accurate predictions only when the effective setting time and material-dependent parameters are realistically defined. Without calibration, the method exhibits a wide prediction range, underscoring its sensitivity to rheological input parameters [9,10].

4.4. Fresh Concrete Lateral Pressure in Accordance with CIRIA Report R108

The CIRIA R108 methodology evaluates lateral pressure using empirical design charts derived from full-scale experiments. Unlike analytical models, CIRIA does not provide a single closed-form equation; instead, the maximum lateral pressure is determined as a function of casting rate, temperature, and concrete characteristics through graphical relationships. The pressure distribution is assumed to be hydrostatic until a limiting pressure P m a x is reached:
P ( H ) = m i n ( γ c H ,   P m a x )
where
P ( H ) —lateral pressure at depth, H (kN/m2);
γ c —unit weight of fresh concrete, (kN/m3);
H —wall height, (m);
P m a x —maximum pressure obtained from CIRIA design charts (kN/m2).
For ordinary Portland cement concretes, CIRIA introduces a temperature factor:
K = ( 36 T + 16 ) 2
where
Concrete temperature, T = 23   ° C ;
Temperature factor, K = 0.852 ;
The theoretical hydrostatic pressure at the base of the wall is taken from (Formula (2)):
P h y d ( H ) = 23.40 6.67 = 156.1 kN / m 2 ,
This value represents the upper hydrostatic limit and is significantly higher than pressures typically observed in practice because concrete progressively gains shear strength during placement.
For wall formwork, CIRIA R108 may be expressed as:
P m a x = γ c [ C 1 R | C 2 K H C 1 R ]
where
P m a x —maximum lateral pressure of fresh concrete on formwork, kN/m2;
D—unit weight (density factor) of fresh concrete, kN/m3;
C 1 —is a formwork geometry coefficient that accounts for the influence of the structural element being cast on the development of lateral pressure. For vertical wall formwork, the coefficient is commonly taken as: C 1 = 1 ;
R—rate of concrete placement, m/h; R = 1.5   m / h ;
C 2 —is an empirical concrete consistency and setting coefficient that reflects the influence of fresh concrete rheology, workability, admixtures, and rate of strength development on lateral pressure;
K—temperature factor;
H—wall height, m, H = 6.67   m ;
T—concrete mixture temperature, °C, T = 23   ° C .
The investigated concrete fell within consistency class S4 according to EN 206 (slump 160–210 mm). Although CIRIA R108 does not explicitly classify concrete using modern EN 206 consistency classes, the selected coefficient is considered representative of highly workable, pumped concrete with admixtures and yields predictions consistent with measured field pressures. Since P m a x = 49.6   k N / m 2 < P h = 156.1   k N / m 2 the governing CIRIA design pressure is P ( H ) = 49.6   k N / m 2 . This value corresponds to approximately 32% of the full hydrostatic pressure, indicating a significant reduction in lateral pressure due to concrete stiffening during placement. The result is consistent with CIRIA’s empirical observation that, at moderate casting rates (≈1.5 m/h) and normal temperatures, pressure development is controlled by setting behaviour rather than by purely hydrostatic action.

4.5. Summary of Model Comparison

The measured maximum lateral pressure during casting was 56.0 kN/m2, significantly lower than the hydrostatic pressure of 156.1 kN/m2 (Table 6). This confirms that the investigated concrete did not behave as a purely hydrostatic fluid and that pressure reduction due to setting and structural build-up occurred during placement. Among the evaluated design approaches, the CIRIA R108 model provided the closest prediction to the measured value, with a deviation of only 11.4%. This good agreement is attributed to the incorporation of temperature-dependent setting effects and placement rate, which better represent the behaviour of highly workable S4 slump-class fresh concrete during casting. The ACI 347R-14 model predicted a maximum pressure of 36.1 kN/m2, underestimating the measured value by 35.5%. Although the model is simple and widely used in practice, it appears less suitable for the casting conditions investigated, which involved pumped S4 concrete and internal vibration. Under these conditions, fresh concrete can retain its fluid characteristics longer, resulting in higher pressures than predicted by the ACI formulation. The DIN 18218 method produced a wide prediction range (39–102 kN/m2), demonstrating high sensitivity to the assumed effective setting time and empirical material parameters. When representative parameter values were selected, the DIN prediction approached the measured pressure; however, without project-specific calibration, substantial uncertainty remains.

4.6. Mechanism of Mid-Height Pressure Maximum

The observed non-hydrostatic pressure distribution, with a maximum at approximately 2.2 m, is interpreted as arising from the simultaneous operation of pressure-generating and pressure-reducing mechanisms during casting. Freshly placed and vibrated concrete behaves like a fluid, promoting pressure transmission. In contrast, previously placed concrete progressively undergoes thixotropic structural build-up and increased resistance to deformation. Similar interactions between structural breakdown under vibration and the progressive rebuilding of the internal concrete network have been reported by Li et al. [19]. Consequently, the measured pressure field may be viewed as a transient equilibrium between structural build-up and structural breakdown processes [4,12,19]. Similar non-hydrostatic pressure distributions and geometry-dependent pressure responses have recently been reported in full-scale investigations of vertical and inclined formwork systems [20].
While lower layers undergo progressive thixotropic stiffening, freshly placed and vibrated layers remain temporarily fluidised, resulting in peak lateral pressure developing away from the base. This behaviour aligns with previous experimental and rheological studies showing that concrete exhibits time-dependent structural build-up and stress recovery at rest [3,4,5,12], which can significantly alter lateral pressure distributions in vertical formwork systems. Similar conclusions regarding the role of thixotropic structural build-up and its influence on pressure transmission have been reported using intrinsic pressure models and quantitative thixotropic indices [16,17,18]. These studies demonstrated that pressure evolution can be accurately related to structural build-up and thixotropic parameters measured experimentally.
Compared with conventional double-sided wall formwork, single-sided systems exhibit asymmetric restraint conditions and different stiffness characteristics. Foundation anchorage and external support frames affect deformation compatibility and may alter stress-redistribution paths. Consequently, local pressure concentrations may develop differently from those observed in symmetrically supported wall systems.
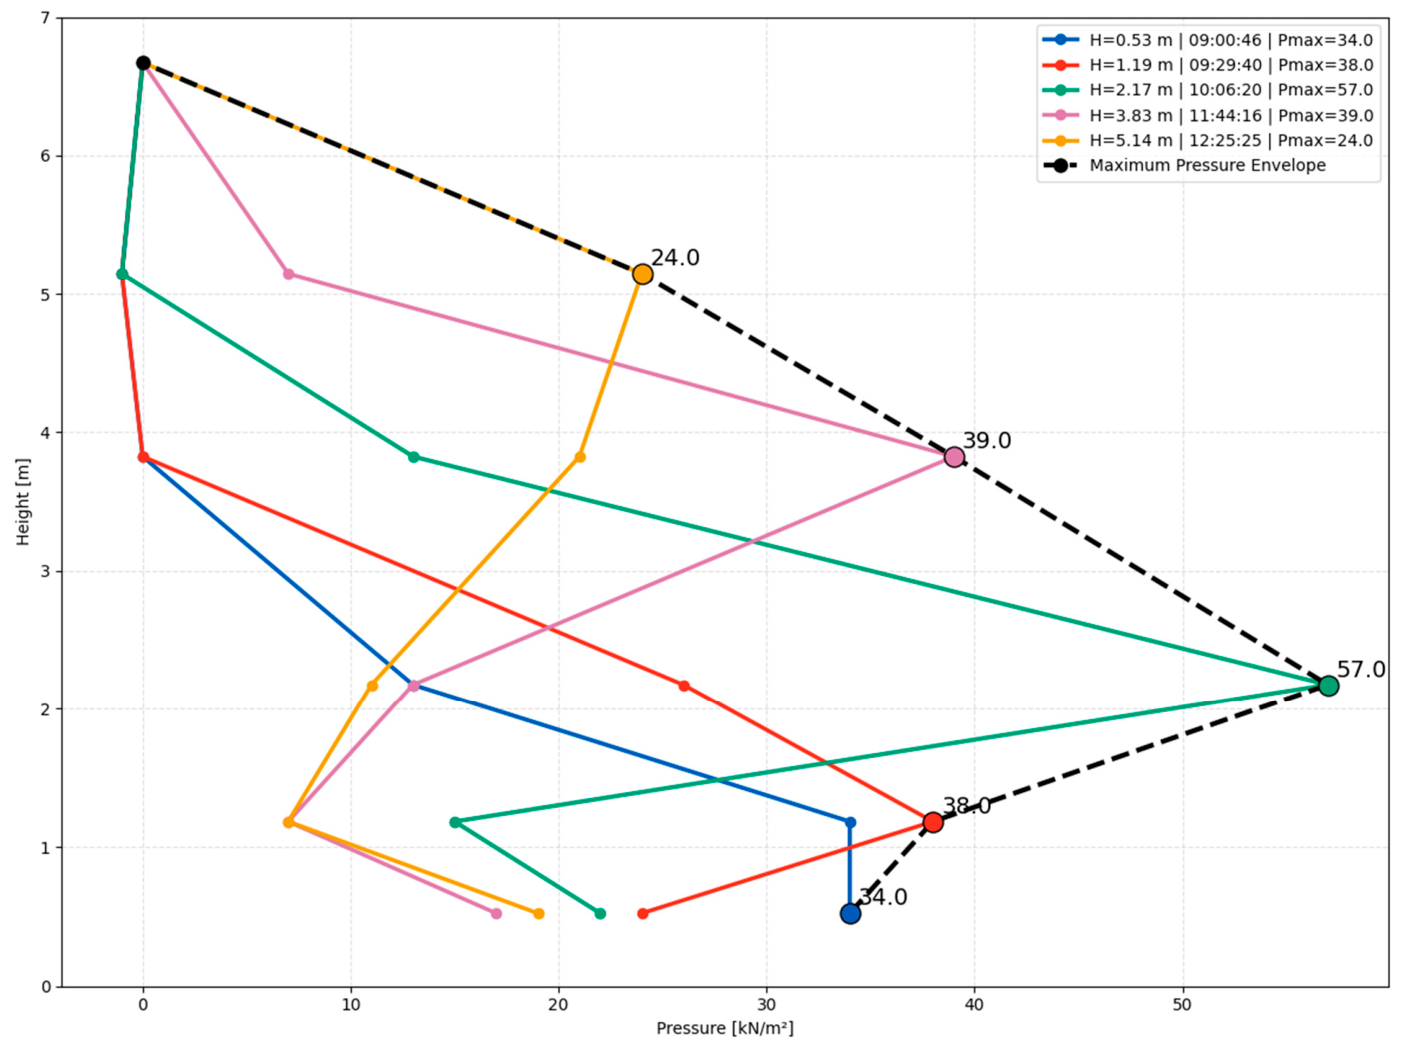
The maximum-pressure envelope shown in Figure 7 provides direct evidence of the non-hydrostatic nature of pressure development during casting. Contrary to hydrostatic behaviour, which the maximum pressure would be expected at the base of the wall, the measured maximum pressure of 57 kN/m2 occurred at an intermediate elevation of approximately 2.2 m. This observation indicates that pressure transmission is governed by interacting rheological and construction-related processes rather than solely by the self-weight of fresh concrete. The pressure envelope, therefore, serves as the basis for the mechanistic interpretation developed in the following section.

Relative Contribution of Governing Mechanisms

The observed pressure distribution is governed by several interacting mechanisms that act simultaneously during casting. Based on the measured pressure evolution and the documented casting sequence, these mechanisms can be qualitatively classified according to their anticipated influence on pressure development.
The dominant pressure-reduction mechanism is considered to be thixotropic structural build-up. During periods of rest, the concrete progressively develops internal structure and increasing yield stress, thereby reducing its ability to transmit hydrostatic pressure [3,4,6,12]. Evidence for this process is provided by the pressure decay observed during the 35-min casting interruption.
The dominant pressure-amplifying mechanism is vibration-induced re-fluidisation. Internal vibration temporarily breaks down the previously developed structure, restores fluid-like behaviour, and produces short-duration pressure spikes. Similar behaviour has been reported in studies investigating vibration-induced structural breakdown and pressure amplification [7,12,13,19].
The concentration of peak events during periods of active vibration supports the significance of this mechanism.
Additional mechanisms include stress redistribution, wall friction, local arching effects, and settlement. These mechanisms influence stress transfer within the concrete body and may shift the location of maximum pressure [2,17,19] from the base of the wall.
The pressure field may therefore be interpreted as a transient equilibrium between pressure-generating processes (placement and vibration) and pressure-reducing processes (thixotropic structural build-up and stress redistribution).
Because only pressure measurements were available, the relative contribution of each mechanism could not be quantified independently. Direct quantitative separation would require complementary rheological measurements, wall-deformation monitoring, interfacial-friction measurements or coupled numerical modelling. Therefore, the proposed interpretation should be regarded as a mechanistic framework rather than a quantitative decomposition of the governing phenomena.
The ranking presented in Table 7 is qualitative and based on the interpretation of the measured pressure evolution, together with findings reported in previous studies.
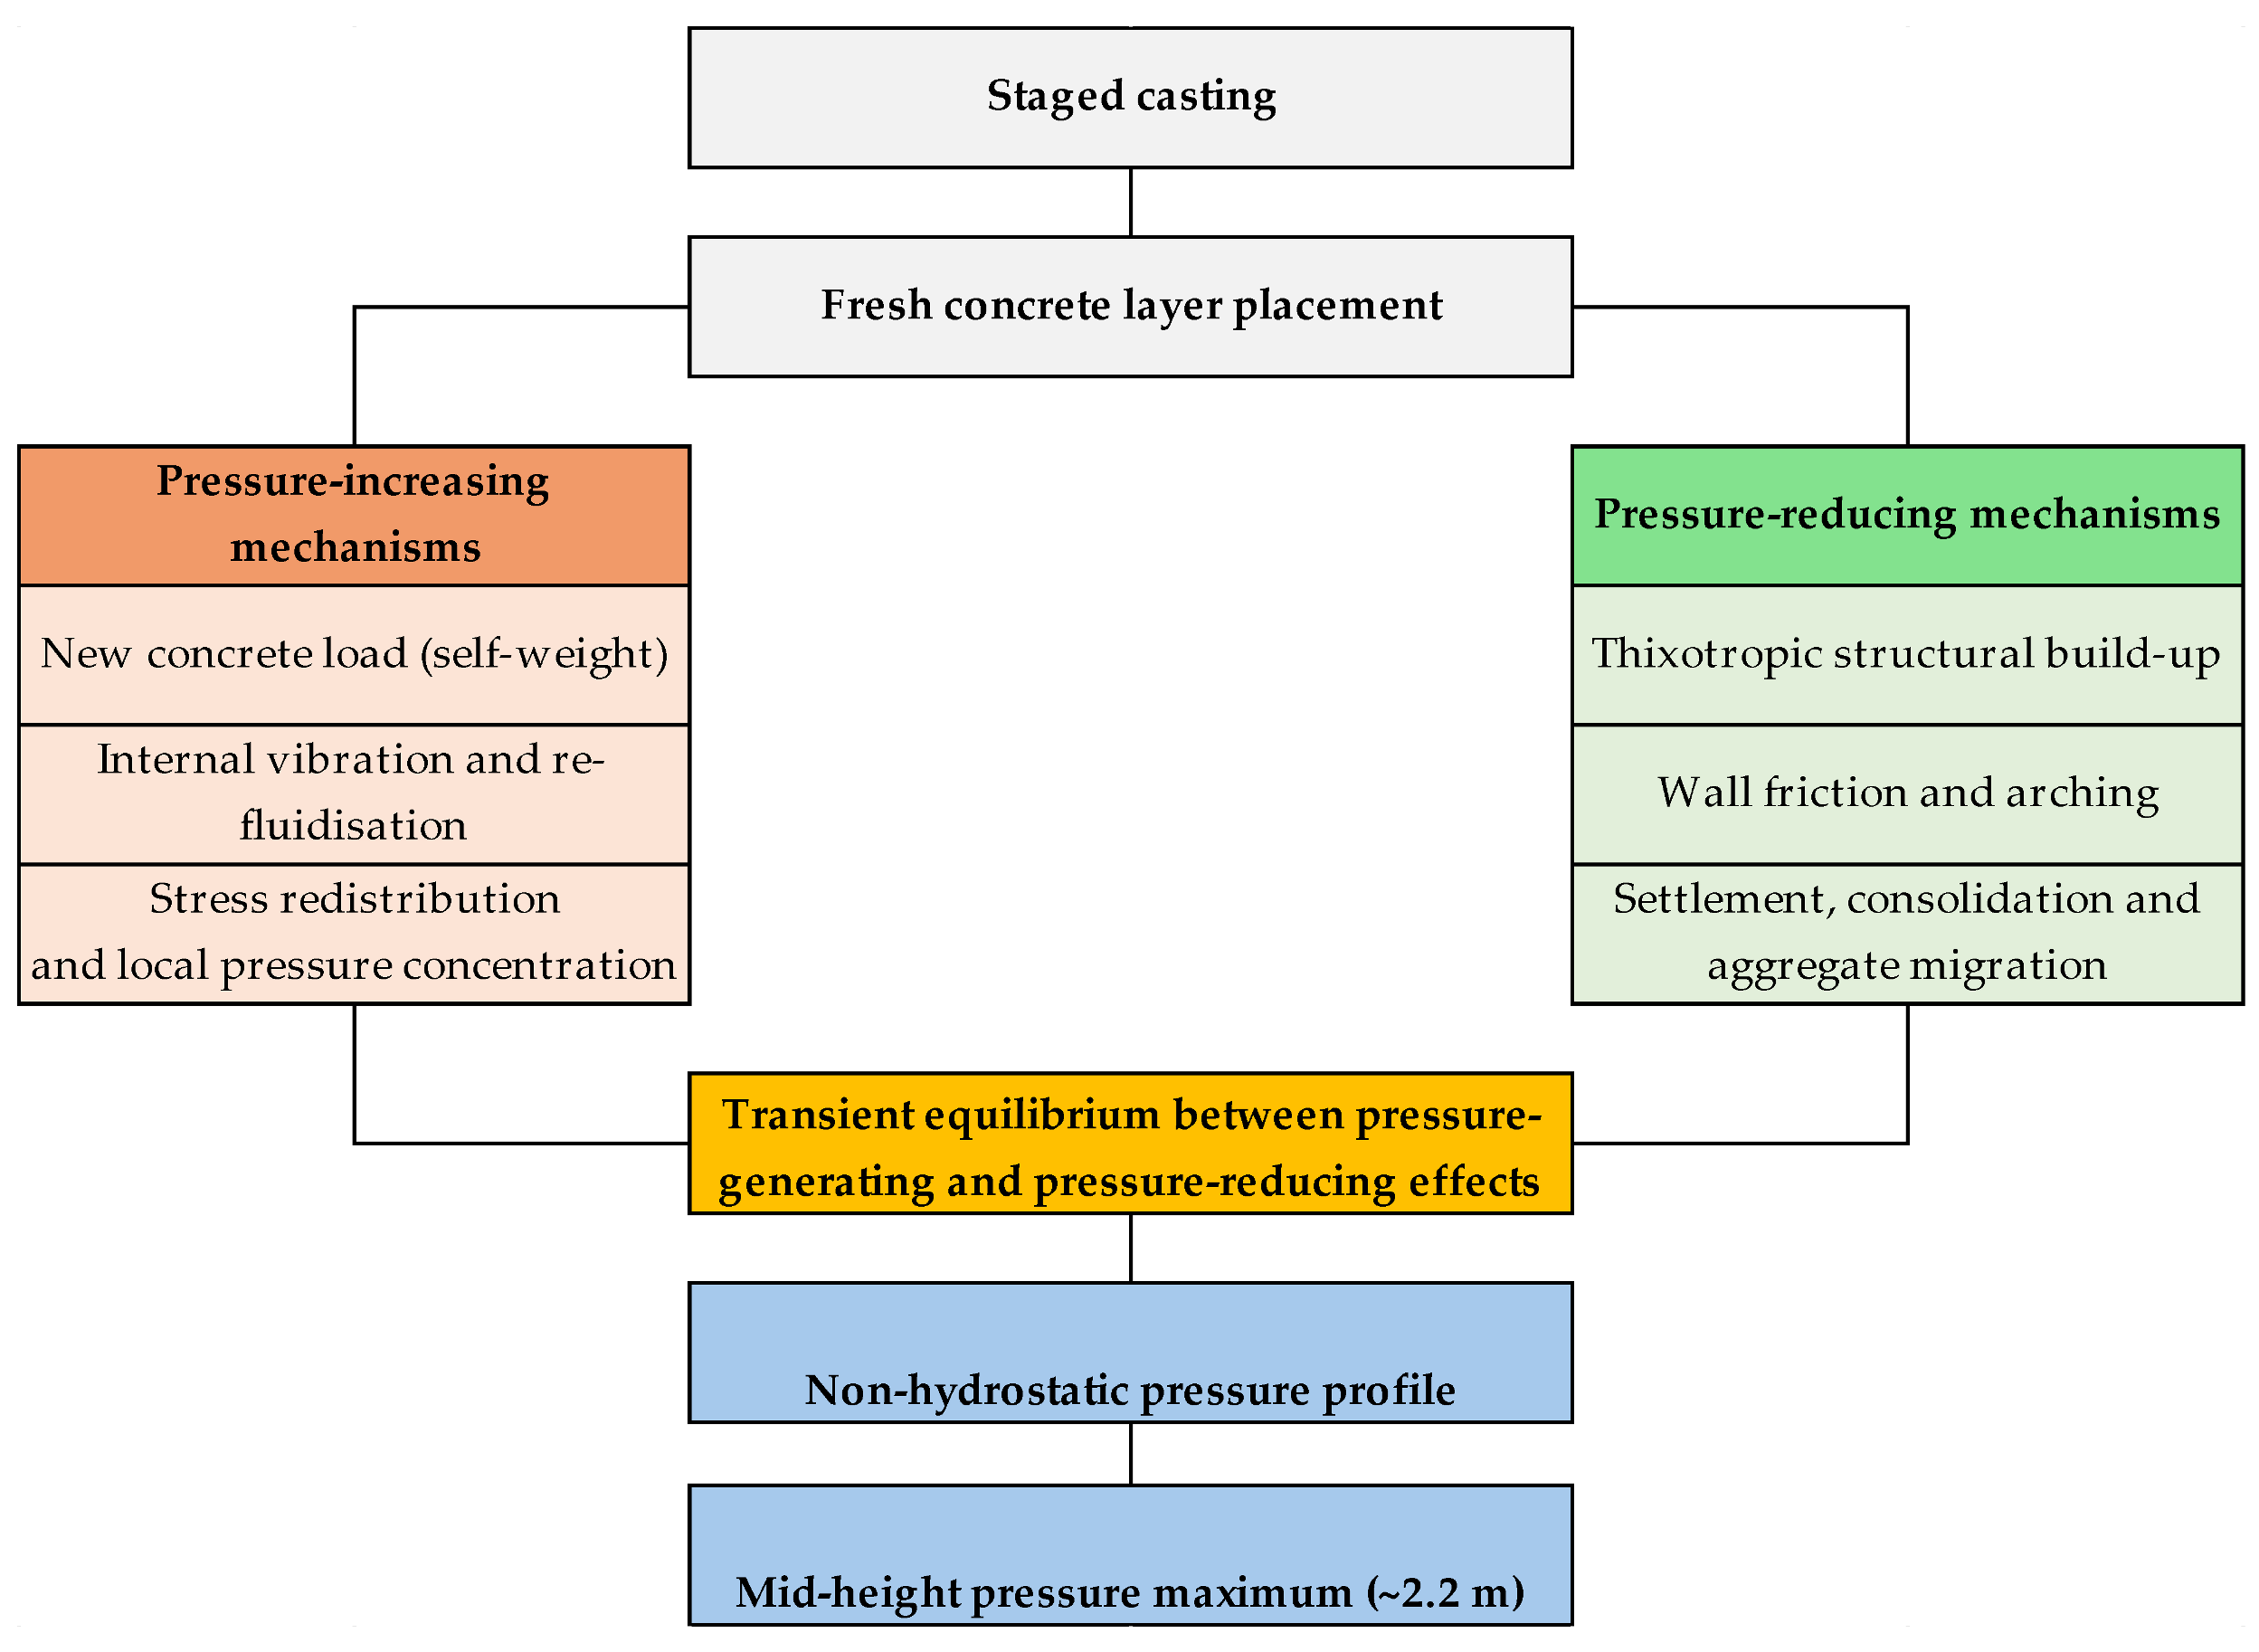
Accordingly, the maximum pressure observed at intermediate wall height is interpreted as the manifestation of a transient balance between pressure-generating and pressure-reducing effects rather than the consequence of a single dominant process.
The conceptual framework shown in Figure 8 summarises the interaction between pressure-generating and pressure-reducing mechanisms identified from the field measurements and supported by previous studies on thixotropic structural build-up, vibration-induced structural breakdown, and stress redistribution in fresh concrete [2,3,4,6,11,12,17,18,19].

4.7. Deep Mechanistic Interpretation of Bottom Sensor Reactivation

A key finding is the late reactivation of the bottom sensor, which contradicts typical hydrostatic or early-stage decay models. Several plausible mechanisms may contribute to this behaviour:
  • Vibration-induced structural breakdown: Vibration liquefies previously stiffened concrete, restoring fluidity and raising lateral pressure.
  • Downward stress redistribution: Upper layers consolidate and transfer load downward during final lifts.
  • Loss of arching: Wall friction temporarily weakens during vibration, allowing pressure redistribution.
  • Settlement and pumping pulse waves: Final pumping actions and concrete settlement generate stress waves that propagate downward.
A similar mechanism has been described by Li et al. [19], who showed that vibration disrupts the internal network structure of fresh concrete, temporarily reducing structural resistance and promoting the redistribution of internal stresses. Such behaviour provides a plausible explanation for the delayed increase in pressure observed at the lower sensor locations.
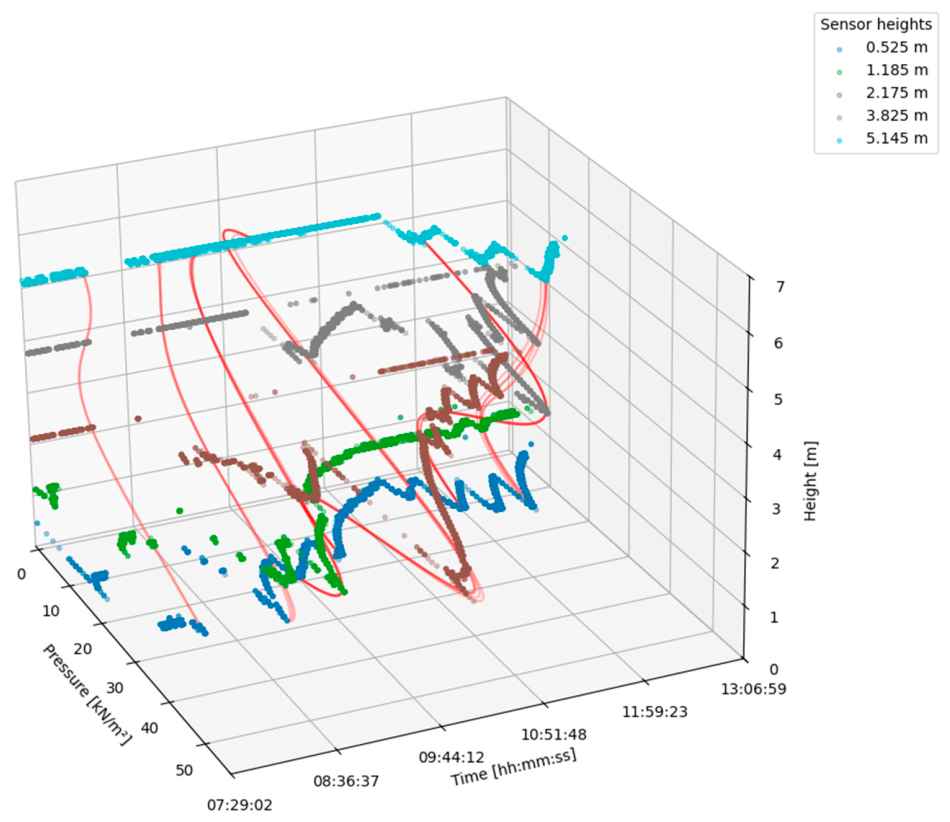
These findings align with mechanisms described in the literature on thixotropy, arching reduction, and vibration-induced pressure amplification [4,16]. The experiment, therefore, provides rare field evidence of a phenomenon previously recorded only in controlled laboratory studies. Similar interactions among casting rate, temperature, and thixotropic structural build-up and recovery, which influence pressure evolution have been observed in controlled experiments [7,12]. Peak pressure events are concentrated within actively vibrated zones, confirming the dominant influence of vibration (Figure 9). Figure 9 shows that most peak pressure events occur during active vibration, reinforcing the idea that vibration is a key factor in transient pressure amplification.
The available measurements do not permit direct verification of the individual mechanisms. Consequently, these explanations should be regarded as hypotheses consistent with the observed pressure evolution and with previously published studies, rather than as experimentally verified causes. Additional investigation using signal cross-correlation analysis, direct rheological monitoring, stress-wave measurements, or coupled numerical modelling would be required for quantitative validation.

4.8. Influence of Vibration

Internal vibration significantly affects lateral pressure development by temporarily reducing the yield stress and restoring a fluid-like behaviour in fresh concrete. Li et al. [19] demonstrated that vibration destroys the initial network skeleton within fresh concrete, reducing internal support forces and increasing particle mobility. As the concrete subsequently rebuilds its internal structure, resistance to deformation gradually increases again. This mechanism provides a physical explanation for the short-duration pressure spikes observed the present field measurements.
The observed response aligns with the conceptual framework presented in Figure 8, in which vibration-induced structural breakdown serves as a pressure-generating mechanism that counteracts thixotropic structural build-up. During vibration, previously stiffened concrete may become temporarily re-fluidised, resulting in enhanced pressure transmission and local pressure amplification. Similar vibration-induced pressure increases have been reported in experimental studies on fresh-concrete rheology and formwork loading [4,7,13,19].
As shown in Figure 9, the majority of peak pressure events coincide with periods of active vibration, supporting the interpretation that vibration is a dominant driver of transient pressure amplification. Figure 10 further illustrates the temporal concentration of pressure-amplification events and their close association with vibration activities and the placement of new concrete lifts.
The combined evidence from Figure 8, Figure 9 and Figure 10 suggests that pressure evolution is governed by a continuous competition between two opposing processes: vibration-induced structural breakdown, which increases pressure transmission, and thixotropic structural build-up, which progressively reduces it during periods of rest. This interaction explains both the short-term pressure spikes observed during compaction and the gradual pressure decay observed following casting interruptions.
It should be noted that the interpretation of the governing mechanisms is based exclusively on pressure measurements. No direct rheological measurements, wall-deformation monitoring, interface-friction measurements, or stress-wave measurements were available during the field investigation. Consequently, the proposed explanation should be regarded as a mechanistic interpretation supported by field observations and published literature rather than as experimentally verified causality. Future studies combining field monitoring with rheological testing, deformation measurements, and numerical simulations would enable more rigorous identification and quantification of the governing mechanisms.

4.9. Implications for Design Models

The comparison shows systematic differences between field data and design predictions consistent with limitations previously identified in reviews of formwork-pressure design practice [11,14]:
  • For the investigated casting conditions, ACI 347R-14 underestimated the measured peak pressure [7,8,14].
  • CIRIA-based methods provide improved agreement by better representing time- and rate-dependent effects [10,13].
  • DIN 18218 shows high sensitivity to material parameters and can vary widely depending on consistency class and setting time assumptions [3,10].
In addition to code-based approaches, statistical models developed specifically for self-consolidating concrete (SCC) have demonstrated that maximum formwork pressure can be predicted with good accuracy using readily available site parameters such as casting rate, slump flow, concrete temperature, element height, and cross-sectional dimensions. Based on a database of 131 experimental SCC tests, Teixeira et al. proposed a practical prediction model that does not require rheological testing and showed particularly good agreement for casting rates exceeding 10 m/h [28]. Recent full-scale investigations and comparative assessments of design models similarly report that simplified code-based approaches underestimate peak pressures, particularly under vibration-intensive casting conditions [14,15]. These results confirm that simplified hydrostatic or envelope-based approaches may not fully capture transient and localised pressure peaks observed in real-world construction, particularly in single-sided formwork systems [8,20,29]. Recent review studies further confirm that most analytical and semi-empirical models struggle to capture vibration-induced and non-hydrostatic pressure effects observed in the field [15].

4.10. Thixotropic Structural Build-Up Rate Estimation

Fresh concrete exhibits time-dependent rheological behaviour governed by thixotropy, in which the internal structure progressively rebuilds at rest and is disrupted under shear or vibration [2,3,4,9,19,23]. This thixotropic structural build-up is associated with particle flocculation and early hydration, which increase the static yield stress over time and reduce the material’s ability to transmit lateral pressure [3,21,30]. As a result, thixotropy plays a fundamental role in governing the evolution of formwork pressure, particularly during casting pauses [4,12].
A simplified representation of thixotropic behaviour can be expressed through the time-dependent evolution of static yield stress:
τ ( t ) = τ 0 + A t h i x t
where
  • τ ( t ) —is the static yield stress at time t ;
  • τ 0 —is the initial yield stress;
  • A t h i x —is the thixotropic structural build-up rate [3,4].
Although direct rheological measurements were not available for the present investigation, an approximate estimation of A t h i x   can be obtained from the observed pressure evolution during a casting interruption.
During the 35-min interruption (approximately 2100 s), a reduction of about 20 kN/m2 in lateral pressure was observed in the lower part of the wall. Assuming this reduction reflects an increase in internal resistance due to structural build-up, the thixotropic build-up rate can be approximated as:
A t h i x P t
where
  • P —represents the reduction in lateral pressure during the interruption period, kN/m2;
  • t —is the corresponding time interval, s;
This value can be approximated as: A t h i x P t = 20   k N m 2 2100   s 0.01   k N m 2 / s .
The importance of thixotropic structural build-up is further supported by studies demonstrating strong correlations between experimentally measured thixotropy indices and both peak formwork pressure and pressure decay rate. Such relationships indicate that thixotropy can serve as an effective engineering parameter for predicting lateral pressure development [16,17].
It should be emphasised that the calculated value represents an apparent field-scale build-up parameter rather than a direct rheological measurement. The observed pressure reduction may also be influenced by wall friction, arching effects, stress redistribution, settlement, and changes in the internal stress path during interruption. Consequently, the estimated value should be interpreted as an engineering indicator of structural build-up rather than a pure material property. The result aligns with reported ranges for normal vibrated concrete with S4 consistency, as documented in rheological studies of structural build-up and thixotropy [4,12,18]. This confirms that thixotropic stiffening is the dominant factor in the observed pressure decay during rest periods. The results further demonstrate that the interplay of two competing mechanisms governs lateral pressure evolution: structural build-up at rest, which increases yield stress and reduces pressure transmission, and shear-induced structural breakdown during casting and vibration, which temporarily restores fluid-like behavior [4,13]. This interplay explains both the pressure decay observed during interruption and the subsequent increase in pressure upon resumption of casting. It should be noted that this estimate represents a simplified macroscopic interpretation, as the relationship between lateral pressure and yield stress is indirect and influenced by additional factors, such as wall friction, stress redistribution, and placement sequence [3,12]. Nevertheless, the result provides a useful engineering approximation of thixotropic effects under real construction conditions.
The interaction between structural breakdown during vibration and subsequent structural rebuilding has also been reported by Li et al. [19], who observed the progressive recovery of internal support forces following vibration-induced destruction of the concrete network structure. This behaviour supports the interpretation that the continuous competition between structural build-up and structural breakdown processes governs pressure evolution.

5. Conclusions

Based on the findings of the present investigation, the following conclusions can be drawn:
  • The non-hydrostatic pressure distribution was confirmed, with the maximum lateral pressure (56 kN/m2) occurring at an intermediate height (~2.2 m) rather than at the base, indicating a significant deviation from conventional hydrostatic assumptions.
  • Measured pressures substantially exceeded the design value, with peak pressure more than doubling the assumed limit (25 kN/m2). This suggests that commonly adopted design parameters may be non-conservative under realistic casting and vibration conditions.
  • Pressure evolution was governed by combined construction and rheological effects, including staged casting, internal vibration, and thixotropic structural build-up. Vibration-induced short-term pressure peaks resulted from structural breakdown, whereas casting interruptions promoted pressure decay and limited subsequent recovery.
  • The comparison with design models revealed systematic discrepancies: for the investigated casting conditions, ACI 347R-14 underestimated the measured peak pressure, particularly under vibration intensive conditions, whereas DIN 18218 results are highly sensitive to parameter selection. Among the evaluated approaches, the CIRIA R108 model showed the closest agreement with experimental data.
  • Real-time monitoring using embedded sensors proved essential for capturing transient and localised pressure effects that simplified models cannot reliably predict.
  • The available measurements do not permit rigorous quantitative separation of the individual mechanisms governing pressure development. The proposed interpretation should therefore be regarded as a mechanistic explanation supported by full-scale observations rather than as a quantitative decomposition of individual effects.
Despite providing valuable full-scale field data, the experimental programme has several limitations that should be considered. The experimental investigation was conducted under a single set of construction conditions, including a single concrete mixture, a specific casting rate, and a particular formwork configuration, which limits the generalisability of the results. In addition, the number and spatial distribution of sensors were limited, preventing a fully continuous characterisation of the pressure field. The rheological properties of fresh concrete, such as yield stress evolution and thixotropic build-up rate, were not directly measured but inferred from pressure behaviour, which could introduce additional uncertainty in interpreting the underlying mechanisms.
Future research should extend this work by considering a broader range of concrete mixtures, casting rates, and temperature conditions, as well as different formwork geometries, including comparisons of single- and double-sided systems. Higher sensor density and integration with direct rheological measurements would enable more accurate identification of the governing mechanisms. Furthermore, combining field measurements with numerical modelling and data-driven approaches could support the development of more reliable, physically based prediction models for fresh-concrete lateral pressure.

Author Contributions

Conceptualisation, A.S. and M.D.; methodology, A.S. and M.D.; software and programming, A.S.; validation, A.S.; formal analysis, A.S.; investigation, A.S. and M.D.; resources, A.S. and M.D.; data curation, A.S.; writing—original draft preparation, A.S. and M.D.; writing—review and editing, M.D.; visualisation, A.S.; supervision, M.D. All authors have read and agreed to the published version of the manuscript.

Funding

This research received no external funding.

Data Availability Statement

The raw data supporting the conclusions of this article will be made available by the authors on request.

Acknowledgments

The authors would like to express their gratitude to UAB, “Doka Lietuva”, for their technical support.

Conflicts of Interest

Author Arūnas Stašauskas was employed by the company UAB Doka Lietuva. The remaining authors declare that the research was conducted in the absence of any commercial or financial relationships that could be construed as a potential conflict of interest.

Appendix A. DokaXact Report

Exact sensor elevations are provided in Table 2. Preliminary notes were made.
Buildings 16 03413 i001

Appendix B. Python Implementation of Pressure Field Reconstruction

This script processes raw sensor measurements, converts time-series data into a height–time domain, reconstructs the pressure field using interpolation, and visualises the pressure envelope.
 
import pandas as pd
import numpy as np
import matplotlib.pyplot as plt
from matplotlib import cm
from matplotlib.colors import Normalize
from scipy.interpolate import UnivariateSpline, griddata
from scipy.ndimage import gaussian_filter
# ===================================================
# LOAD DATA
# ===================================================
excel_file = r”C:\PLOT\Data\2026 01 19 data 01.xlsx”
sheet_name = “2026 01 06 data 01”
df = pd.read_excel(excel_file, sheet_name=sheet_name)
# ===================================================
# COLUMN NAMES
# ===================================================
HEIGHT_COL = “Height, [m]”
TIME_COL = “Time [UTC]”
VALUE_COL = “value rounded [kN2]”
# ===================================================
# TIME → SECONDS
# ===================================================
df[“time_dt”] = pd.to_datetime(
df[TIME_COL].astype(str),
format = “%H:%M:%S”,
errors = “coerce”)
df[“T_sec”] = (
df[“time_dt”].dt.hour * 3600 +
df[“time_dt”].dt.minute * 60 +
df[“time_dt”].dt.second
)
# ===================================================
# HEIGHT + PRESSURE
# ===================================================
df[“H_m”] = df[HEIGHT_COL].astype(str).str.replace(“,”, “.”, regex=False).astype(float)
df[“P”] = pd.to_numeric(df[VALUE_COL], errors=“coerce”)
df = df.dropna(subset=[“T_sec”, “H_m”, “P”])
 
# ===================================================
# SENSOR HEIGHTS
# ===================================================
sensor_heights = np.sort(df[“H_m”].unique())
# ===================================================
# TOP-5 PEAK TIMES PER SENSOR
# ===================================================
peak_times = []
for h in sensor_heights:
df_h = df[df[“H_m”] == h]
peak_times.extend(df_h.nlargest(5, “P”)[“T_sec”].tolist())
peak_times = sorted(set(peak_times))
# ===================================================
# ADD START & FINAL TIMES
# ===================================================
t_start = df[“T_sec”].min()
t_end = df[“T_sec”].max()
all_times = sorted(set([t_start] + peak_times + [t_end]))
# ===================================================
# BUILD SECTION POINTS (H, T → P)
# ===================================================
section_points = []
for t in all_times:
df_t = df[df[“T_sec”] == t].sort_values(“H_m”)
if len(df_t) < 3:
continue
for _, r in df_t.iterrows():
section_points.append((r[“H_m”], t, r[“P”]))
section_points = np.array(section_points)
H_pts, T_pts, P_pts = section_points.T
# ===================================================
# GRID (HEIGHT–TIME)
# ===================================================
H_grid = np.linspace(H_pts.min(), H_pts.max(), 220)
T_grid = np.linspace(T_pts.min(), T_pts.max(), 220)
HH, TT = np.meshgrid(H_grid, T_grid)
# ===================================================
# INTERPOLATE PRESSURE SURFACE
# ===================================================
P_grid = griddata(
(H_pts, T_pts),
P_pts,
(HH, TT),
method = “linear”)
mask = np.isnan(P_grid)
P_grid[mask] = griddata(
(H_pts, T_pts),
P_pts,
(HH[mask], TT[mask]),
method = “nearest”)
# ===================================================
# SMOOTH IN TIME ONLY
# ===================================================
P_grid_smooth = gaussian_filter(P_grid, sigma = (1.0, 0.0))
# ===================================================
# COLOR SETUP
# ===================================================
norm = Normalize(vmin = P_pts.min(), vmax = P_pts.max())
cmap = cm.jet
# ===================================================
# TIME FORMATTER
# ===================================================
def sec_to_hms(sec):
h = int(sec // 3600)
m = int((sec % 3600) // 60)
s = int(sec % 60)
return f”{h:02d}:{m:02d}:{s:02d}”
# ===================================================
# FIGURE
# ===================================================
fig = plt.figure(figsize = (14, 9))
ax = fig.add_subplot(111, projection=“3d”)
 
# MAKE THE TIME AXIS MUCH LONGER (YOUR SKETCH)
ax.set_box_aspect((3.0, 7.0, 6.0))
# (Pressure, Time, Height)
# You can increase 3.0 → 4.0 if you want even longer.
# ===================================================
# JET SURFACE
# ===================================================
ax.plot_surface(
P_grid_smooth,
TT,
HH,
facecolors = cmap(norm(P_grid_smooth)),
linewidth = 0,
alpha = 0.75,
antialiased = True)
# ===================================================
# PRESSURE CONTOURS
# ===================================================
levels = np.linspace(P_pts.min(), P_pts.max(), 12)
ax.contour(
P_grid_smooth,
TT,
HH,
levels = levels,
colors = “black”,
linewidths = 1.0,
alpha = 0.7)
# ===================================================
# SECTION CURVES (BLACK)
# ===================================================
for t in all_times:
df_t = df[df[“T_sec”] == t].sort_values(“H_m”)
if len(df_t) < 3:
continue
spline = UnivariateSpline(df_t[“H_m”], df_t[“P”], s = 0.5)
Hs = np.linspace(df_t[“H_m”].min(), df_t[“H_m”].max(), 200)
Ps = spline(Hs)
ax.plot(
Ps,
np.full_like(Hs, t),
Hs,
color = “black”,
linewidth = 1.8,
alpha = 0.85)
# ===================================================
# AXES & LABELS
# ===================================================
ax.set_xlabel(“Pressure [kN/m2]”)
ax.set_ylabel(“Time [hh:mm:ss]”)
ax.set_zlabel(“Height [m]”)
ax.set_title(“JET Pressure Envelope\nwith Stretched TIME Axis”)
# Pressure axis (reversed)
ax.set_xlim(df[“P”].max(), df[“P”].min())
# Time axis
ax.set_ylim(T_pts.max(), T_pts.min())
# Height axis
ax.set_zlim(0, 7)
# SENSOR HEIGHT LABELS IN BLUE
ax.set_zticks(sensor_heights)
ax.set_zticklabels([f”{h:.2f}” for h in sensor_heights], color = “blue”)
ax.tick_params(axis = “z”, colors = “blue”)
# Time ticks
yticks = np.linspace(T_pts.min(), T_pts.max(), 6)
ax.set_yticks(yticks)
ax.set_yticklabels([sec_to_hms(t) for t in yticks])
# View angle
ax.view_init(elev = 20, azim = 159)
# ===================================================
# COLORBAR
# ===================================================
mappable = cm.ScalarMappable(norm = norm, cmap = cmap)
mappable.set_array([])
fig.colorbar(
mappable,
ax = ax,
shrink = 0.6,
aspect = 15,
label = “Pressure [kN/m2]”)
fig.subplots_adjust(left = 0.05, right = 0.88, bottom = 0.05, top = 0.92)
plt.show()

References

  1. Ritchie, A.G.B. The Pressures Developed by Concrete on Formwork. Civ. Eng. Public Works Rev. 1962, 57, 1–2. [Google Scholar]
  2. Gardner, N.J. Pressure of Concrete on Formwork—A Review. ACI J. Proc. 1985, 82, 744–753. [Google Scholar] [CrossRef] [Scilit]
  3. Gardner, N.J. Time-dependent concrete pressure on formwork. ACI J. 1985, 82, 1–10. [Google Scholar] [CrossRef] [Scilit]
  4. Roussel, N. A thixotropy model for fresh fluid concretes: Theory, validation and applications. Cem. Concr. Res. 2006, 36, 1797–1806. [Google Scholar] [CrossRef] [Scilit]
  5. Billberg, P. Form Pressure Generated by Self-Compacting Concrete: Influence of Thixotropy and Structural Behaviour at Rest. Ph.D. Thesis, KTH Royal Institute of Technology, Stockholm, Sweden, 2006. [Google Scholar]
  6. Assaad, J.J.; Khayat, K.H. Effect of casting rate and concrete temperature on formwork pressure of self-consolidating concrete. Mater. Struct. 2006, 39, 333–341. [Google Scholar] [CrossRef] [Scilit]
  7. Mechtcherine, V.; Khayat, K.; Secrieru, E. (Eds.) Rheology and Processing of Construction Materials: RheoCon2 & SCC9; RILEM Bookseries; Springer: Berlin/Heidelberg, Germany, 2020; Volume 23. [Google Scholar] [CrossRef] [Scilit]
  8. ACI Committee 347. Guide to Formwork for Concrete (ACI 347R-14); American Concrete Institute: Farmington Hills, MI, USA, 2014. [Google Scholar]
  9. DIN 18218; Fresh Concrete Pressure on Vertical Formwork. DIN Deutsches Institut für Normung: Berlin, Germany, 2018.
  10. CIRIA R108; Formwork—A Guide to Good Practice. Construction Industry Research and Information Association: London, UK, 2010.
  11. Proske, T.; Khayat, K.H.; Omran, A.; Leitzbach, O. Form Pressure Generated by Fresh Concrete: A Review about Practice in Formwork Design. Mater. Struct. 2014, 47, 1099–1113. [Google Scholar] [CrossRef] [Scilit]
  12. Assaad, J.; Khayat, K.H.; Mesbah, H. Variation of formwork pressure with thixotropy of self-consolidating concrete. ACI Mater. J. 2003, 100, 29–37. [Google Scholar] [CrossRef] [Scilit]
  13. Perrot, A.; Lecompte, T.; Khelifi, H.; Brumaud, C.; Hot, J.; Roussel, N. Yield stress and bleeding of fresh cement pastes. Cem. Concr. Res. 2012, 42, 937–944. [Google Scholar] [CrossRef] [Scilit]
  14. Gamil, Y.; Nilimaa, J.; Cwirzen, A.; Emborg, M. Experimental based assessment of formwork pressure theoretical design models for self-compacting concrete. J. Build. Eng. 2023, 68, 106085. [Google Scholar] [CrossRef] [Scilit]
  15. Gamil, Y.; Nilimaa, J.; Emborg, M.; Cwirzen, A. Lateral formwork pressure for self-compacting concrete—A review of prediction models and monitoring technologies. Materials 2021, 14, 4767. [Google Scholar] [CrossRef] [Scilit]
  16. Kwon, S.H.; Kim, J.H.; Shah, S.P. Development and Applications of the Intrinsic Model for Formwork Pressure of Self-Consolidating Concrete. Int. J. Concr. Struct. Mater. 2012, 6, 31–40. [Google Scholar] [CrossRef] [Scilit]
  17. Ghoddousi, P.; Shirzadi Javid, A.A.; Ghodrati Amiri, G.; Donyadideh, K. Predicting the Formwork Lateral Pressure of Self-Consolidating Concrete Based on Experimental Thixotropy Values. Int. J. Civ. Eng. 2019, 17, 1131–1144. [Google Scholar] [CrossRef] [Scilit]
  18. Omran, A.F.; Khayat, K.H. Choice of thixotropic index to evaluate formwork pressure characteristics of self-consolidating concrete. Cem. Concr. Res. 2014, 63, 89–97. [Google Scholar] [CrossRef] [Scilit]
  19. Li, J.; Xiang, J.; Tian, Z.; Lu, W.; Xie, L.; Zhao, Y. Experiment and simulation study on coarse aggregates settlement in vibrated concrete based on transparent granular suspensions. J. Build. Eng. 2023, 76, 107381. [Google Scholar] [CrossRef] [Scilit]
  20. Freund, B.; Proske, T.; Graubner, C.-A. Fresh concrete pressure on vertical and inclined formwork systems: Full-scale experimental investigations and numerical modelling. Mater. Struct. 2026, 59, 119. [Google Scholar] [CrossRef] [Scilit]
  21. Ferraris, C.F.; de Larrard, F. Testing and Modelling of Fresh Concrete Rheology; NIST Interagency Report NISTIR 6094; National Institute of Standards and Technology (NIST): Gaithersburg, MD, USA, 1998. [Google Scholar] [CrossRef] [Scilit]
  22. Doka GmbH. DokaXact Digital Monitoring System. Available online: https://www.doka.com/en/solutions/services/dokaxact (accessed on 18 August 2026).
  23. Ferraris, C.F.; de Larrard, F. Modified slump test to measure rheological parameters of fresh concrete. Cem. Concr. Aggreg. 1998, 20, 241–247. [Google Scholar] [CrossRef] [Scilit]
  24. LST EN 12350-1:2019; Testing Fresh Concrete—Part 1: Sampling and Common Apparatus. CEN (European Committee for Standardisation): Brussels, Belgium, 2019.
  25. LST EN 12350-2:2019; Testing Fresh Concrete. Part 2: Slump-Test. CEN (European Committee for Standardisation): Brussels, Belgium, 2019.
  26. LST EN 12350-6:2019; Testing Fresh Concrete. Part 6: Density. CEN (European Committee for Standardisation): Brussels, Belgium, 2019.
  27. LST EN 12350-7:2019; Testing Fresh Concrete. Part 7: Air Content—Pressure Methods. CEN (European Committee for Standardisation): Brussels, Belgium, 2019.
  28. Teixeira, S.; Santilli, A.; Puente, I. Statistical Model for Predicting the Maximum Lateral Pressure Exerted by Self-Consolidating Concrete on Vertical Formwork. J. Build. Eng. 2017, 12, 77–86. [Google Scholar] [CrossRef] [Scilit]
  29. Hurd, M.K. Formwork for Concrete, 7th ed.; American Concrete Institute (ACI SP-4): Farmington Hills, MI, USA, 2005. [Google Scholar]
  30. Ovarlez, G.; Mahaut, F.; Chateau, X. Macroscopic behaviour of bidisperse suspensions of noncolloidal particles in yield stress fluids. J. Rheol. 2010, 54, 815–833. [Google Scholar] [CrossRef] [Scilit]
Figure 1. View of the formwork setup on site.
Buildings 16 03413 g001
Figure 2. Formwork section with calculated acting loads.
Buildings 16 03413 g002
Figure 3. (a) Sensor position on the formwork; (b) view of two bottom sensors (ID 0508 and ID 0512) fixed to the formwork.
Buildings 16 03413 g003
Figure 4. Trafag industrial pressure sensor: (a) sensor mounting interface view with technical characteristics; (b) sensor producer.
Buildings 16 03413 g004
Figure 5. DokaXact measurement unit with integrated sensor connection (a) top view; (b) side view; (c) information label; (d) battery module.
Buildings 16 03413 g005
Figure 6. Measurement chart. The maximum pressure does not occur at the base, contradicting hydrostatic assumptions.
Buildings 16 03413 g006
Figure 7. Envelope of maximum measured lateral pressures along the wall height. Coloured curves represent the measured pressure evolution at each sensor location. At the same time, the dashed black line denotes the maximum pressure envelope, derived from the peak value recorded at each sensor elevation. The measured peak pressure of 57 kN/m2 occurred approximately 2.2 m above the wall base, indicating a non-hydrostatic pressure distribution and a pressure maximum located away from the wall base.
Buildings 16 03413 g007
Figure 8. Conceptual framework illustrating the interaction of pressure-generating and pressure-reducing mechanisms governing fresh-concrete lateral pressure during staged casting of a single-sided wall. Pressure-generating effects include self-weight loading, vibration-induced re-fluidisation, and stress redistribution, whereas pressure-reducing effects include thixotropic structural build-up, wall friction, arching, and settlement processes. The measured non-hydrostatic pressure distribution is interpreted as reflecting a transient equilibrium between vibration-induced structural breakdown and time-dependent structural rebuilding of the concrete skeleton. The resulting pressure profile exhibits a maximum at an intermediate wall height (~2.2 m), consistent with the field measurements and the mechanistic interpretation proposed in this study. The framework is supported by previous studies on thixotropic structural build-up, vibration-induced structural breakdown, pressure redistribution, wall friction, arching, settlement, and rheological evolution of fresh concrete [2,3,4,6,11,12,17,18,19].
Buildings 16 03413 g008
Figure 9. Raw data by sensor height, with the top-5 peak events per sensor (smoothed section curves, red). Peak pressure events are concentrated within actively vibrated zones, confirming the dominant influence of vibration.
Buildings 16 03413 g009
Figure 10. Pressure envelope with stretched time axis.
Buildings 16 03413 g010
Table 1. Lateral pressure on formwork, thixotropy, rheology, and segregation, based on the literature.
Ref.Reason/MechanismFindings and RecommendationsResearch Methods
[1]Initial fresh concrete state (low thixotropy)Fresh concrete behaves nearly hydrostatically immediately after placement; maximum pressure γ · h . This defines the critical design envelope.Engineering observations and formwork-pressure studies
[3]Structural build-up (thixotropy at rest)Concrete develops an internal structure through flocculation and CSH bridge formation, thereby increasing yield stress and reducing mobility.Rheology theory
[3,4]Yield stress evolutionStatic yield stress increases linearly with time:
τ ( t ) = τ 0 + A t h i x t . This governs pressure decay and stability.
Analytical + rheometer
[4]Structural build-up rate (A_thix)A_thix is the key parameter controlling pressure reduction; higher values lead to faster transition from fluid to solid behaviour.Model calibration
[12,17]Influence of thixotropy on pressureIncreasing thixotropy reduces peak formwork pressure and accelerates pressure decay due to internal friction and cohesion recovery. Strong correlations between thixotropy indices and formwork-pressure characteristics have been reported, with correlation coefficients reaching R2 > 0.90.Instrumented column tests
[7]Casting rate effectHigher casting rates (>5 m/h) increase pressure by 15–27% due to insufficient time for structural buildup.Multi-factor review
[7,16]Time-dependent pressure evolutionPressure follows a time-dependent evolution characterised by rapid increase, gradual pressure decay under sustained loading, and eventual pressure cancellation driven by structural build-up and hydration processes.Time-dependent monitoring
[4]Static vs dynamic yield stressStatic yield stress reflects the structure at rest; dynamic yield stress reflects a fully destructured state. Their difference quantifies thixotropy.Rheometer tests
[18]Thixotropy index (TI)The thixotropy index quantifies the degree of structural build-up and is suitable for mix comparison and engineering control.Rheological analysis
[4]Effect of resting timeLonger rest increases yield stress and structural stability, lowering lateral pressure but reducing flowability.Time-dependent tests
[4,13]Effect of shear historyPre-shearing destroys structure; thixotropy depends strongly on mechanical history, such as pumping or vibration.Controlled experiments
[4]Torque decay behaviorUnder shear, stress decays exponentially; the decay rate reflects the kinetics of structural breakdown.Rheometer
[4]Apparent viscosity reductionThixotropic breakdown reduces viscosity under shear; high-thixotropy mixes exhibit greater viscosity losses.Derived rheological data
[3,4]Hysteresis loop methodHysteresis loop measures breakdown energy but depends on the testing procedure and is not an intrinsic material property.Flow curve loops
[4]Rheopexy (anti-thixotropy)Concrete may exhibit an increase in viscosity under shear (rheopexy), especially with superplasticisers and high shear rates.Flow curve modeling
[4]Shear thinning vs. thickeningConcrete can exhibit both shear thinning and thickening depending on mix composition and shear rate.Herschel–Bulkley analysis
[3,4]Separation of mechanismsThixotropy dominates early (minutes) while hydration dominates later (hours), affecting rheology differently.Rheology + microstructure
[2]Factors influencing formwork pressureCasting rate, concrete consistency, temperature, admixtures, and placement procedures significantly influence lateral pressure development and prediction-model accuracy.Literature review and model comparison
[7]Temperature influenceHigher temperatures accelerate structural build-up and setting processes, leading to faster pressure decay and reduced duration of hydrostatic conditions.Experimental investigation
[7,13]Secondary vibration effectRe-vibration destroys the structure and can increase pressure by 50–60% due to re-fluidisation.Experimental review
[19]Vibration-induced structural breakdownVibration destroys the initial network skeleton structure of fresh concrete, reducing internal support forces and increasing mobility. This temporarily restores fluid-like behavior and redistributes stress.Experimental observation + numerical simulation
[19]Structural rebuilding after vibrationAfter vibration ceases, the internal concrete structure progressively rebuilds and support forces recover. This process increases resistance to deformation and reduces mobility over time.Transparent granular suspension experiments + simulation
[19]Stress redistribution during vibrationStructural breakdown and rebuilding alter internal stress transfer, leading to non-uniform particle movement, settlement, and redistribution of stresses within the concrete body.Experimental monitoring and numerical modelling
[11,20]Formwork geometry (arching effect)Wider sections allow redistribution of internal stress (arching), reducing lateral pressure by up to 40%.Modeling + experiments
[15]Segregation under high-drop pouringSevere segregation occurs at the early casting stage due to free-fall separation of aggregates and paste.Field sampling
[15]Aggregate separation mechanismDifferent free-fall velocities lead to layering and clustering of aggregates.Image analysis
[15]Strength reduction due to segregationSegregation reduces compressive strength (≈30 MPa vs. the required 35 MPa).Strength testing
[15]Pore structure changesSegregation alters pore distribution (fewer micropores, more mesopores), impacting durability.NMR analysis
[3,15]Thixotropy vs segregationHigher thixotropy improves stability and prevents particle settling.Theory + experiments
[3,4]Layer casting effectHigh thixotropy may lead to poor layer bonding (cold joints) and a loss of up to 40% in strength if casting delays occur.Modeling
[3]Application-specific designWalls require high thixotropy (low pressure), slabs require lower thixotropy (better bonding).Engineering interpretation
Table 2. Sensor ID and position on formwork (Figure 3a).
Sensor IDElevation (m)
05080.525
05121.185
05152.175
05203.825
05245.145
Table 3. Technical specifications of the DokaXact pressure sensor.
ParameterSpecification
Measurement range0–2.5 bar (gauge)
Maximum pressure5 bars
Output signal4–20 mA (analogue current loop)
Supply voltage9–32 V DC
AccuracyTypical ±1% (maximum ±2%)
CalibrationFactory pre-calibrated
Quality controlSystematic testing during assembly
Table 4. Peak lateral pressures at different elevations.
Sensor IDElevation (m)Peak Pressure (kN/m2)
05080.52534
05121.18538
05152.17556
05203.82539
05245.14524
Table 5. DIN 18218 predicted lateral pressure results (sensitivity analysis).
Case K 1 t E , ( h ) σ h , k , m a x , ( k N / m 2 ) Description
Lower bound6.54.039.0Fast setting/low conservatism
Mid-range7.55.056.3Representative S4 condition
Upper bound8.58.0102.0Slow setting/high conservatism
Table 6. Comparison of Predicted and Measured Pressures.
ModelPmax (kN/m2)Notes
Measured56Peak at 2.175 m
Hydrostatic156.1Theoretical upper-bound assumption
ACI 347R-1436.1Empirical design model (non-conservative under vibration)
CIRIA (C2 = 0.45)49.6Best agreement with measurements
DIN 1821839–100Strongly parameter-dependent
Table 7. Qualitative assessment of mechanisms governing pressure development.
MechanismEvidence in the Present StudyExpected
Influence
Thixotropic structural build-upPressure decay during interruptionHigh
Vibration-induced re-fluidisationPressure spikes during compactionHigh
Stress redistributionMid-height pressure maximumMedium
Wall friction/archingNon-hydrostatic profileMedium
Settlement/consolidationLate-stage pressure evolutionLow–Medium
Disclaimer/Publisher’s Note: The statements, opinions and data contained in all publications are solely those of the individual author(s) and contributor(s) and not of MDPI and/or the editor(s). MDPI and/or the editor(s) disclaim responsibility for any injury to people or property resulting from any ideas, methods, instructions or products referred to in the content.