Article

Experimental Study on Lightweight Geopolymer Composites Synergistically Modified with Biomass and Recycled EPS

1
School of Energy and Power, Jiangsu University of Science and Technology, Zhenjiang 212100, China
2
College of Civil Engineering, Hunan University, Changsha 410082, China
3
Changsha Construction Project Quality and Safety Supervision Station, Changsha 410000, China
*
Authors to whom correspondence should be addressed.
Buildings 2026, 16(15), 3136; https://doi.org/10.3390/buildings16153136
Submission received: 3 July 2026 / Revised: 31 July 2026 / Accepted: 4 August 2026 / Published: 6 August 2026

Abstract

The growing demand for low-carbon building materials and the challenges of handling agroforestry waste and discarded EPS particles have spurred research toward developing novel building composites that utilize solid waste. Therefore, this study aims to develop a lightweight geopolymer composite incorporating these recycled materials to balance thermal insulation, mechanical strength, and waterproofing properties. In this work, geopolymer served as the binder, with various types of raw biomass (sawdust, rice husk, rice straw, and coconut fiber) as the primary aggregates and EPS particles as an additive to create a closed-pore structure. The microstructure of the raw biomass was characterized by SEM, while its specific surface area and average pore diameter were determined by BET analysis. Furthermore, the prepared composites were comprehensively evaluated in terms of their microstructure, pore structure (MIP), density, thermal conductivity, compressive strength, total water absorption, capillary water absorption, surface wettability, and UV aging behavior. The results showed that the prepared composites exhibited a porosity of 59.9–65.7%, a density of 492.9–586.3 kg/m3, a compressive strength of 7.3–10.9 MPa, a thermal conductivity of 0.115–0.142 W/(m·K), a total water absorption of 35.2–42.2%, capillary water uptake coefficients of 4.9–11 kg/m2, and a water contact angle exceeding 140° (after modification). In addition, the developed composites offered significant environmental and economic benefits, with a low carbon footprint and an estimated cost of 100.6–150.3 USD/m3, making them more competitive compared to traditional insulation materials. Meanwhile, this study provides a scientific basis for developing high-strength building insulation materials from agroforestry waste, thus outlining a promising direction for future research and industry development.

1. Introduction

The construction industry, a major source of carbon emissions, is undergoing a notable shift to reduce its environmental footprint and meet the dual carbon goals. According to statistics, carbon emissions from the construction sector account for approximately 37% of the global total [1]. The carbon emissions associated with buildings can be broadly categorized into operational carbon emissions and embodied carbon emissions. The former primarily comes from energy needed for heating, cooling, and maintaining the indoor environment, such as HVAC systems. The latter mainly stems from the embodied carbon generated during the production and transportation of building materials, such as cement. Therefore, this shift has led to the exploration of alternative materials to lower embodied carbon and the development of high-insulation materials to reduce energy demand for thermal comfort.
In response, the building materials research community has increasingly focused on innovative inorganic cementitious materials and low-carbon raw materials. Geopolymer, as a promising and competitive green building material, plays a crucial role in enhancing the energy efficiency of buildings and reducing their carbon emissions. It is synthesized through the reaction of aluminosilicate precursors with an alkaline activator solution, a process that mitigates approximately 60% of the energy consumption and 80% of the CO2 emissions compared to conventional cement production [2]. Previous research has indicated that geopolymer possesses superior mechanical strength, low thermal conductivity, low shrinkage, high resistance to chemical attack, and excellent fire resistance [1,3,4].
Recently, some scholars have extensively explored the use of geopolymer binders in developing lightweight bio-based building materials. Alves et al. [5] investigated the bio-based composite materials prepared with geopolymer binders, and the results showed that when the cork content was 70 vol.% and 80 vol.%, the thermal conductivity and compressive strength of the composite materials were 0.16 W/(m·K) and 2.55 MPa, and 0.08 W/(m·K) and 0.5 MPa, respectively. Nasreddine et al. [4,6] used miscanthus fibers (MF) and hemp shives (HS) as aggregates with a geopolymer binder. The results showed that composites containing 50 wt.% MF and 100 wt.% HS achieved compressive strengths of 5.2 MPa and 2.6 MPa, and thermal conductivities of 0.21 W/(m·K) and 0.14 W/(m·K), respectively. Narattha et al. [7] pointed out that in composites with rice husk as aggregate and geopolymer as binder, a rice husk content of 50 vol.% resulted in a compressive strength of 0.33 MPa and a thermal conductivity of 0.195 W/(m·K). However, when the content exceeded 60 vol.%, the mechanical strength of the composite dropped significantly to ≤0.18 MPa. Singh et al. [8] showed that when using a geopolymer as the binder, composites containing a low proportion of agroforestry waste (1–4 wt.%) exhibited relatively high compressive strength (8–15 MPa) and thermal conductivity (0.4–0.6 W/(m·K)).
According to the authors’ investigation, although bio-based lightweight geopolymer composites with high agroforestry waste content can achieve the utilization of solid waste, this does not effectively reduce their thermal conductivity. Furthermore, excessive biomass can interfere with geopolymer polymerization, resulting in unsatisfactory mechanical properties. Therefore, to further reduce the thermal conductivity of composite materials, some scholars have begun to investigate methods that involve lowering biomass content combined with foaming techniques to introduce porous structures [9]. For instance, Zhang et al. [10] prepared kenaf fiber geopolymer composites using H2O2 as a foaming agent, achieving thermal conductivity and compressive strength in the ranges of 0.118–0.248 W/(m·K) and 1.6–19.9 MPa, respectively. However, the porous structures formed by such foaming techniques are predominantly open-cell, while biomass addition can partially suppress the foaming process. Thus, the thermal conductivity of bio-based lightweight geopolymer composites cannot be significantly reduced, while their mechanical properties are also negatively affected. In addition, this approach has limited capacity for the consumption of agricultural and forestry waste and leads to increased production costs.
Expanded polystyrene (EPS), as an artificial material, possesses ultra-low density (10–30 kg/m3), low thermal conductivity (0.02–0.03 W/(m·K)), hydrophobicity, closed-cell structure, and energy absorption capacity [11,12,13]. These properties have led to its wide use in lightweight packaging, energy absorption, thermal insulation, and water treatment applications [11,14]. However, owing to the diverse spectrum of applications, the annual consumption of EPS is showing a growing trend. An estimated 14 million tons of EPS are produced each year globally [14]. The increasing use of EPS has intensified its disposal challenges. Statistics indicate that approximately 80% of EPS waste is landfilled, with the remaining 20% likely entering waterways [15]. Notably, EPS is widely recognized as a non-biodegradable material that requires an extensive period to degrade in the natural environment. This emphasizes the importance of recycling EPS waste and the necessity to devise effective methods for its utilization on a larger scale. However, the research on utilizing the inherent closed-cell structure and low thermal conductivity characteristics of EPS waste to develop building insulation materials by combining it with agroforestry waste has not yet been reported.
From the above perspectives, the purpose of this study is to develop a lightweight, high-strength, and low-thermal-conductivity composite insulation material. In this study, the authors selected sawdust, rice husk, rice straw, and coconut fiber as natural aggregates based on the fiber length characteristics of the raw biomass, while EPS waste particles were used as a closed-cell structure additive to enhance thermal insulation and mechanical properties. Based on this, a novel, eco-friendly biomass/EPS lightweight geopolymer composite was developed. The microstructure, specific surface area, and average pore diameter of raw biomass were characterized, along with their water absorption capacity. Subsequently, the properties of the biomass/EPS lightweight geopolymer composites were investigated, including microstructure, pore structure (MIP), density, thermal conductivity, compressive strength, water absorption (total and capillary), and surface wettability. Furthermore, given the potential application of these composites in high-altitude regions with intense solar radiation, the UV aging behavior was specifically evaluated to preliminarily assess their durability under such environmental conditions. The thermal and mechanical performance of this composite was compared with those of other insulation materials, and its CO2 emissions and cost were analyzed. Therefore, this study has significant implications for advancing lightweight geopolymer composites, as it demonstrates a viable approach to enhancing their thermal and mechanical properties while cost-effectively utilizing solid waste resources.

2. Materials and Preparation

2.1. Materials

2.1.1. Biomass and Expanded Polystyrene (EPS) Granule

Sawdust (Figure 1a), a forestry waste generated during wood processing, was used as a raw biomass material. With a mass mean diameter of 0.54 mm, it was collected from a factory in Jiangsu Province (Suqian), China, and is regarded as a natural insulation material.
Rice husk (Figure 1b), as a type of agricultural waste, was obtained from farmland in Hunan Province (Changsha), China. The rice husk used in the experiment maintained its natural form without any physical or chemical treatment, with a particle size of approximately 8 mm.
Rice straw (Figure 1c) with leaves and ears used in this study was directly obtained from a rice field in Hunan Province (Changsha), China. It was simply cut into 1–2 cm lengths to preserve its natural structure, thereby reducing the cost of raw materials pretreatment.
Coconut fiber (Figure 1d) was obtained from the mesocarp of coconut husks. This raw fiber material was purchased from a local factory in Hainan Province (Sanya), China. It was then manually cut into 1–2 cm lengths for the experiment.
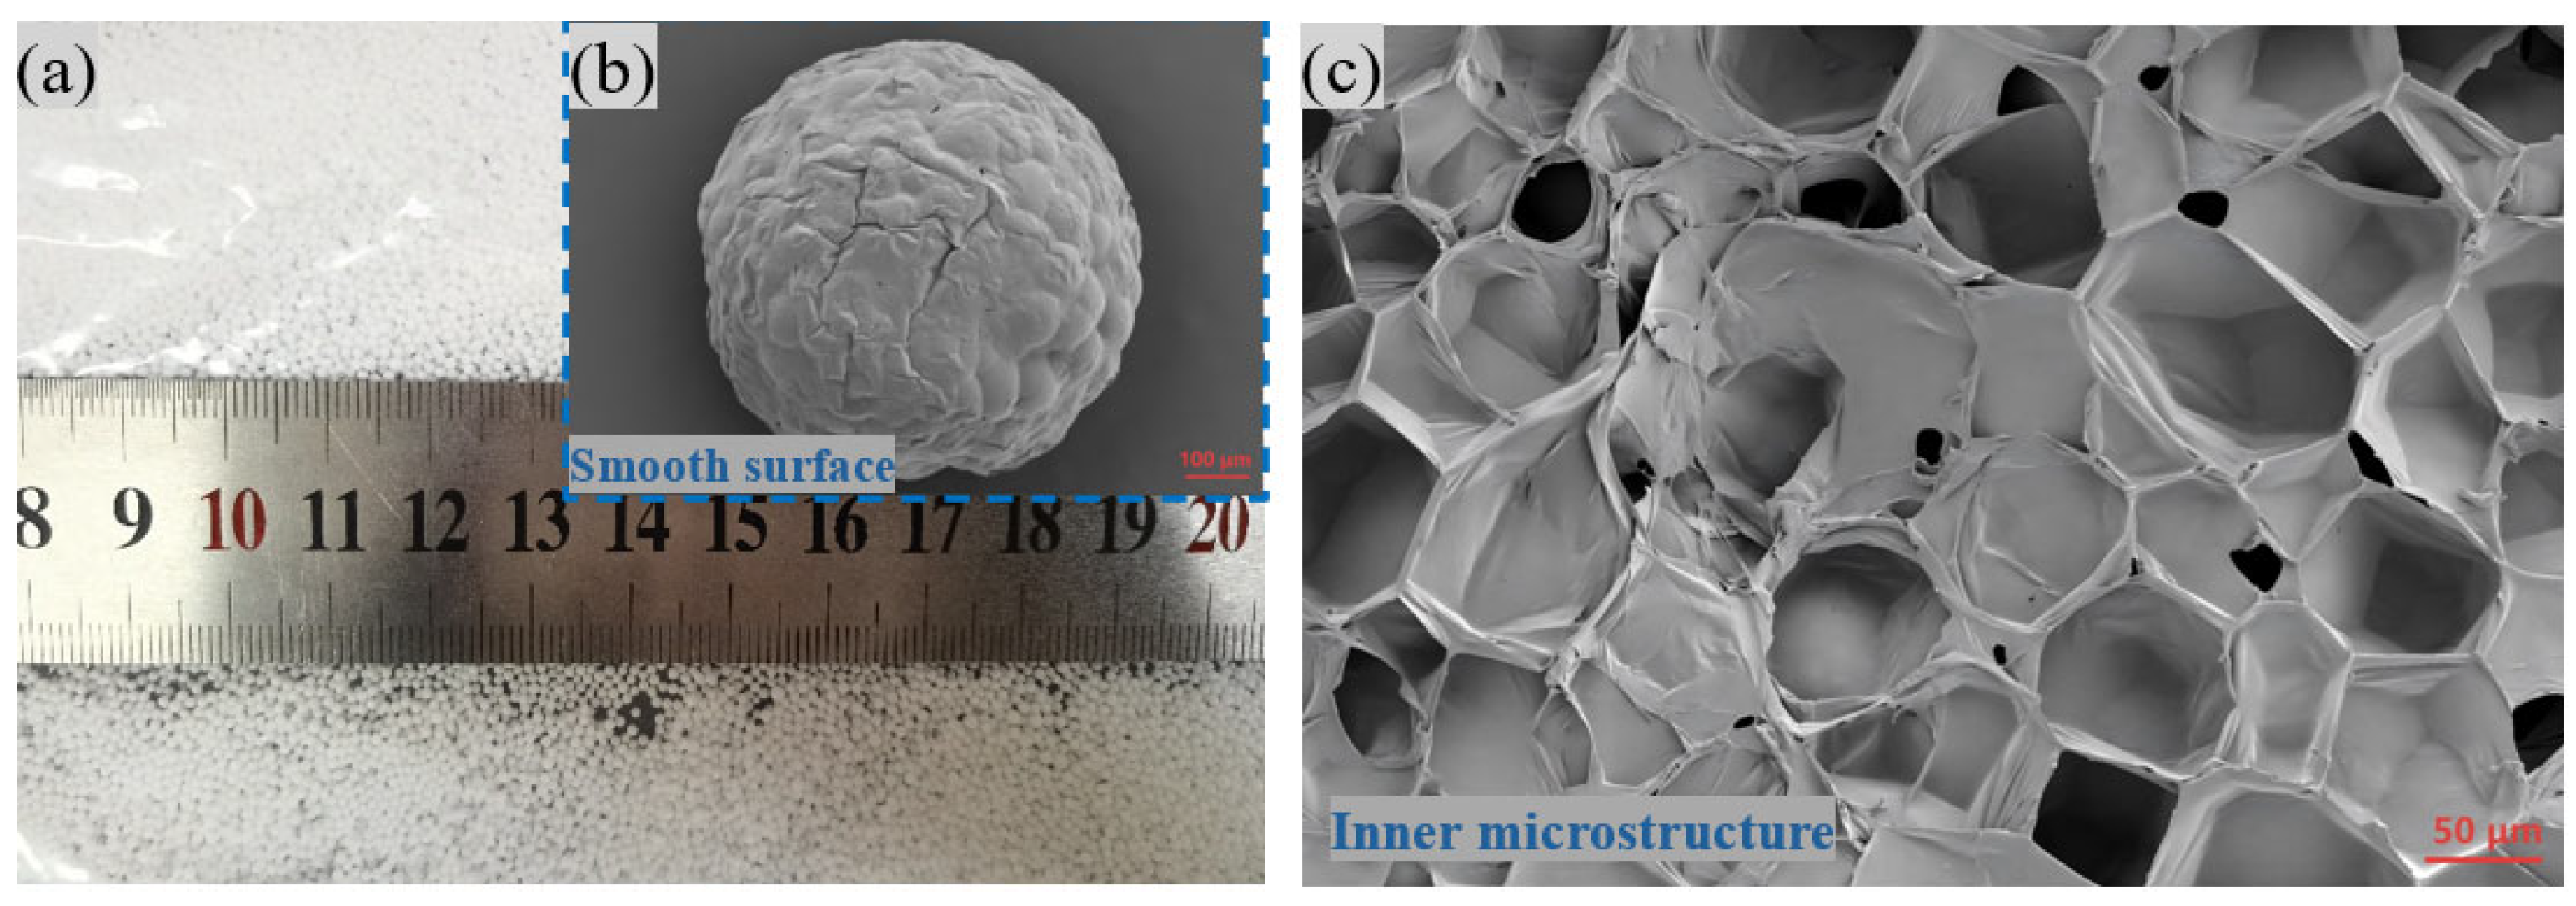
Expanded polystyrene (EPS, Figure 2a) granules used in this study were obtained from Gongyi Beishankou Sanle Water Purification Material Factory in Henan Province (Zhengzhou), China. These granules (0.3–0.8 mm) possess a smooth surface and a closed-cell structure, as shown in Figure 2b,c.

2.1.2. Inorganic Binders and Other Reagents

The inorganic metakaolin-based geopolymer was used as the binder, prepared by mixing an alkali activator solution with metakaolin based on an inorganic polymerization reaction.
The alkali activator solution was obtained by mixing an industrial sodium silicate solution, NaOH particles and water in a certain mass proportion, and then the mixture was allowed to stand at room temperature for 24 h to ensure complete dissolution of the NaOH. In addition, the industrial sodium silicate solution (n(SiO2/Na2O) = 2.45, solid content = 44.91 wt.%) was supplied by XINGBAIHE Chemical Technology Co., Ltd. (Jinan, China). The NaOH particles, with a purity of 96 wt.%, were supplied by HENGXING Chemical Preparation Co., Ltd. (Tianjin, China). The water used in this experiment was tap water, employed for the purpose of cost reduction.
Metakaolin, purchased from CHENYI Refractory Abrasive Co., Ltd., (Gongyi, China), had a particle size distribution of 10–12 µm. Its chemical composition is presented in Table 1 (LOI refers to the mass loss percentage after calcination).
An anionic surfactant prepared from the soap was used in this experiment to improve the rheological properties of the geopolymer slurry. The purpose is to reduce the agglomeration of EPS, enabling it to be evenly distributed in the geopolymer slurry and enhancing the wrapping of the slurry on the surface of EPS particles.
A self-developed waterproofing agent, formulated as a white liquid primarily from siloxane, was used in this experiment. This agent is non-toxic, odorless, and environmentally benign.

2.1.3. Preparation of Biomass/EPS Lightweight Geopolymer Composite

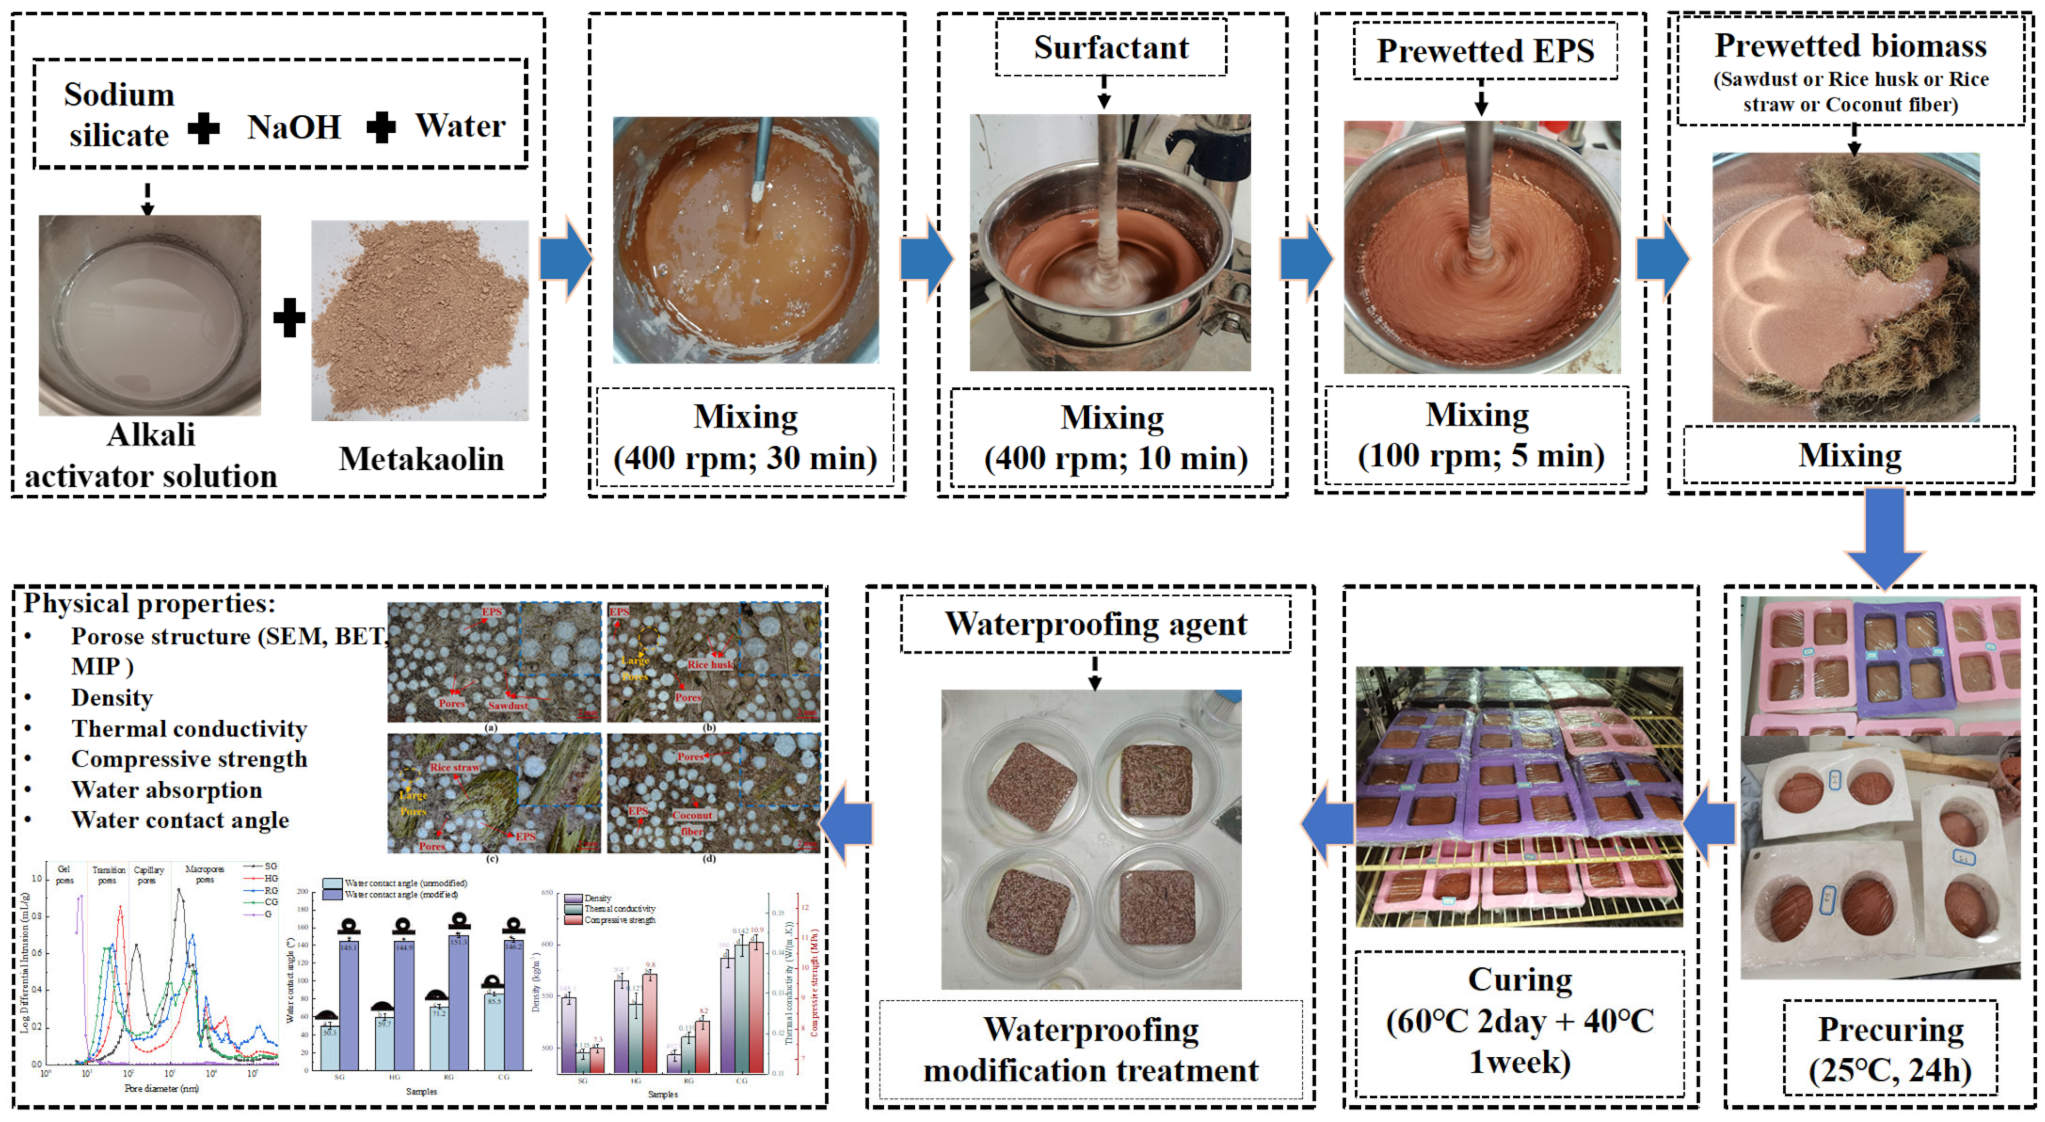
The preparation process of biomass/EPS lightweight geopolymer composite is shown in Figure 3. Prior to composite fabrication, the biomass materials were prepared as follows. Sawdust and rice husks were used in their natural raw state due to their granular morphology, while rice straw and coconut fiber were manually cut into 1–2 cm lengths to facilitate uniform dispersion in the geopolymer matrix. After that, neither chemical nor thermal pretreatment was applied to preserve their natural characteristics.
Before the start of the experiment, both the EPS and biomass particles were subjected to a prewetting treatment. They were blended with predetermined amounts of water, stirred for 2 min, and then allowed to stand for 10 min to fully wet their surfaces without free water accumulation. Subsequently, the detailed steps are as follows: (1) the alkali activator solution prepared in Section 2.1.2 was stirred with metakaolin at a speed of 400 rpm for 30 min to obtain the geopolymer slurry; (2) the surfactant (400 rpm, 10 min) was first added to the geopolymer slurry, followed by the addition of prewetted EPS particles (100 rpm, 5 min) to achieve uniform mixing; (3) the prewetted biomass was added to the mixture with EPS, and mixed manually until uniform to obtain the biomass/EPS geopolymer slurry; (4) the mixture was cast into silicone molds of three sizes (6.6 × 6.6 × 3 cm, 20 × 20 × 10 cm, and Φ5 cm × 6 cm), sealed with film, precured at 25 °C for 24 h, then cured at 60 °C for 48 h, and finally dried at 40 °C for 7 days; (5) the self-developed waterproofing agent, diluted at a 1:1 ratio, was manually brushed onto the smooth test surface of the samples three times and then naturally dried to obtain the final products.
Based on previous research [16,17] and preliminary experimental results (excessive biomass addition prevents the formation of the geopolymer skeleton), the mixture formulations of various samples were presented in Table 2. For inorganic geopolymer binders, the theoretical molar ratios of SiO2 to Al2O3 and SiO2 to Na2O were 3.2 and 3.3, respectively; the mass ratio of total water content (Wt) to the solid content of binder was 0.5; the mass ratio of surfactant to the solid content of binder was 0.09; For EPS particles, the mass ratio of the prewetting water (Weps) to the EPS particles was 5.0; the mass ratio of EPS to the solid content of binder was 0.025. For biomass aggregates, the mass ratio of prewetting water (Wpb) to biomass was 1.0. Meanwhile, to balance the thermal and mechanical properties of the composites and to ensure approximately equal volumes of the different biomass additions (i.e., an equal volume replacement principle), the maximum mass fraction of each biomass type was determined. The weights of the constituent materials required to manufacture 1 m3 of the lightweight geopolymer composite are presented in Table 2.

3. Characterization Methods

All macroscopic physical and mechanical properties (density, compressive strength, thermal conductivity, and water absorption) were measured on four independently prepared samples (n = 4); the mean values were reported as the final results, with error bars representing standard deviation (SD). One-way ANOVA with Tukey’s post hoc test was used to evaluate statistical significance among groups (p < 0.05). For the comparison of compressive strength before and after UV exposure, a paired t-test was performed (p < 0.05). For microscopic characterization (SEM, MIP, and BET), representative samples were selected for qualitative or semi-quantitative analysis.

3.1. Microscopic Morphology

The morphology and microstructure were characterized using an optical microscope (Model 4KD2-0745, ALL WAYS Technology Co., Ltd., Hangzhou, China) and field emission scanning electron microscopy (FESEM, ZEISS Sigma 360, Carl Zeiss AG, Oberkochen, Germany). All samples underwent vacuum degassing and were subsequently coated with a conductive gold layer via sputtering before the tests.

3.2. Surface Area and Porosity

The specific surface area, pore volume, and pore size distribution of the four biomass samples were determined using the Brunauer–Emmett–Teller (BET) method. Nitrogen was employed as the adsorbate gas, and the measurements were conducted at 77 K using a fully automatic specific surface area and porosity analyzer (Micromeritics ASAP 2460, Micromeritics Instrument Corp., Norcross, GA, USA), in accordance with GB/T 19587-2017 (China). Prior to analysis, all samples were degassed at 120 °C for 8 h to remove adsorbed moisture and volatile impurities.
The pore structure and porosity of the lightweight geopolymer composite were characterized by mercury intrusion porosimetry (MIP) using a high-performance automatic porosimeter (Micromeritics AutoPore V 9505, Micromeritics Instrument Corp., Norcross, GA, USA), in accordance with GB/T 21650.1-2008 (China). Before testing, the samples were cut into cubes of less than 1 cm in each dimension, dried, and evacuated.

3.3. Density and Thermal Conductivity

The bulk density (ρ) of the composites was determined following the geometric method with reference to ASTM C271/C271M. The samples were dried in an oven at 40 °C to constant mass before testing. The mass was measured using a high-precision analytical balance (±0.01 mg), while the volume was obtained by measuring the length, width, and height of the samples with a vernier caliper. The bulk density was then calculated as the ratio of mass to volume.
The thermal conductivity (λ) of the composites was measured using a thermal conductivity tester (Model DRPL-II, manufactured by XIANGTAN Instrument Co., Ltd., Xiangtan, China) based on the guarded hot plate method in accordance with GB/T 10295-2008 [18]. Prior to testing, the samples were dried in an oven at 40 °C to constant mass. The test was performed at 25 °C under steady-state conditions.

3.4. Compressive Strength

The compressive strength (P) was measured using a microcomputer-controlled universal testing machine (Model WDW-50, 0–50 kN, Fangyuan Testing Instruments Co., Ltd., Jinan, China) in accordance with JC/T 2357–2016 (China). Before testing, the surfaces of the samples were leveled to ensure uniform loading. The load was then applied at a constant rate of 0.5 kN/s.

3.5. Water Absorption

The total water absorption (Wt) of biomass/EPS lightweight geopolymer composite was tested according to the procedure described in Ref. [19]. The sample was fully immersed in a beaker filled with water at 25 °C for 24 h. After that, it was taken out and lightly wiped with a cloth to remove excess surface water, and its saturated mass was recorded. For the biomass aggregates, the total water absorption (Wt) was measured according to the recommendations in Ref. [20]. The biomass aggregates were oven-dried at 60 °C to constant mass (mass variation < 0.1% over three consecutive 24 h weightings). Water absorption was measured at 1, 15, 30, 60, 240, 1440 (24 h), 2880 (48 h), and 4320 (72 h) min of immersion.
The total water absorption of the sample was calculated using Equation (1):
W t = M t M o M o × 100
where Wt is the total water absorption, %; Mt is the wet mass of the sample at time (t), g; M0 is the initial mass of the sample before immersion, g.
The capillary water absorption of biomass/EPS lightweight geopolymer composite was tested in accordance with EN ISO 29767 to assess the rate of water uptake by capillary action [21]. The cylindrical sample was laterally sealed and then partially immersed in water to a depth of 10 mm for 24 h to ensure unidirectional vertical absorption. To compare the capillary water absorption capacity of different samples in the initial stage, however, the mass of the samples was recorded after 1 min, 15 min, 60 min (1 h), and 240 min (4 h) of capillary absorption. And the capillary water uptake coefficient (Wc) was calculated using Equation (2):
W c = M c M i A b
where Wc is the capillary water uptake coefficient, kg/m2; Mc is the mass of the sample at time, kg; Mi is the initial mass of the sample before immersion, kg; Ab is the surface area at the base of the sample in contact with water, m2.

3.6. Static Water Contact Angle

The static water contact angle was measured using a contact angle goniometer (with a maximum error of 0.5°) to assess the surface wetting properties of the sample. The angle was captured with a high-resolution camera and analyzed with dedicated software. The measurements were performed in accordance with ISO 19403-2:2024.

3.7. UV Aging Behavior

Considering the potential application of these composites in high-altitude regions with intense UV radiation, accelerated aging tests were performed to assess their UV aging behavior following the JC/T 902-2002 (China) standard. Although this standard is not specifically designed for geopolymers, it provides a practical approach for simulating UV exposure. Following this standard, a UV aging chamber was constructed to simulate the effects of UV radiation on materials. In the setup, the samples were placed approximately 5 cm from the UV lamps (UVA-340 nm) under a surface ambient temperature of 45 ± 2 °C. The irradiance was maintained at 2.63 mW/cm2. Following a 35-day exposure period (equivalent to roughly 22 years of daily outdoor UV radiation at 0.55 W/m2), the samples were removed for mechanical property testing.

3.8. CO2 Emission and Cost Calculation

The total CO2 emissions and total cost for each sample are calculated by summing the products of the raw material dosage and their corresponding emission factor or unit price, as expressed in Equations (3) and (4), respectively.
C O 2 , total = i = 1 n ( m i C E i )
C o s t total = i = 1 n ( m i C T i )
where CO2,total denotes the total CO2 emission of each sample (kg CO2-eq/m3); mi is the mass of raw material i per unit volume (kg/m3); CEi is the CO2 emission factor of raw material i (kg CO2-eq/kg); Costtotal represents the total cost of each sample (USD/m3); CTi is the unit cost of raw material i (USD/kg).
The calculations considered only the production-based CO2 emissions of the raw materials of the sample mixtures, with transportation, handling, and site-related processes excluded. The CO2 emission factors for the raw materials were obtained from the literature under the same cradle-to-gate system boundary, whereas the corresponding cost data were sourced from prior studies and local suppliers in China, as shown in Table 3. Based on the mix design in Table 2, the mass of each raw material required to produce 1 m3 of each sample is determined. Consequently, the total CO2 emissions and total cost are calculated. In addition, based on a review of the relevant literature [22,23,24], a zero-burden assumption was applied to the waste aggregates. This assumes that the carbon footprints of their production are entirely attributed to the main commercial products from which they are derived.

4. Results and Discussion

4.1. Characterization of Raw Biomass

4.1.1. Microstructure

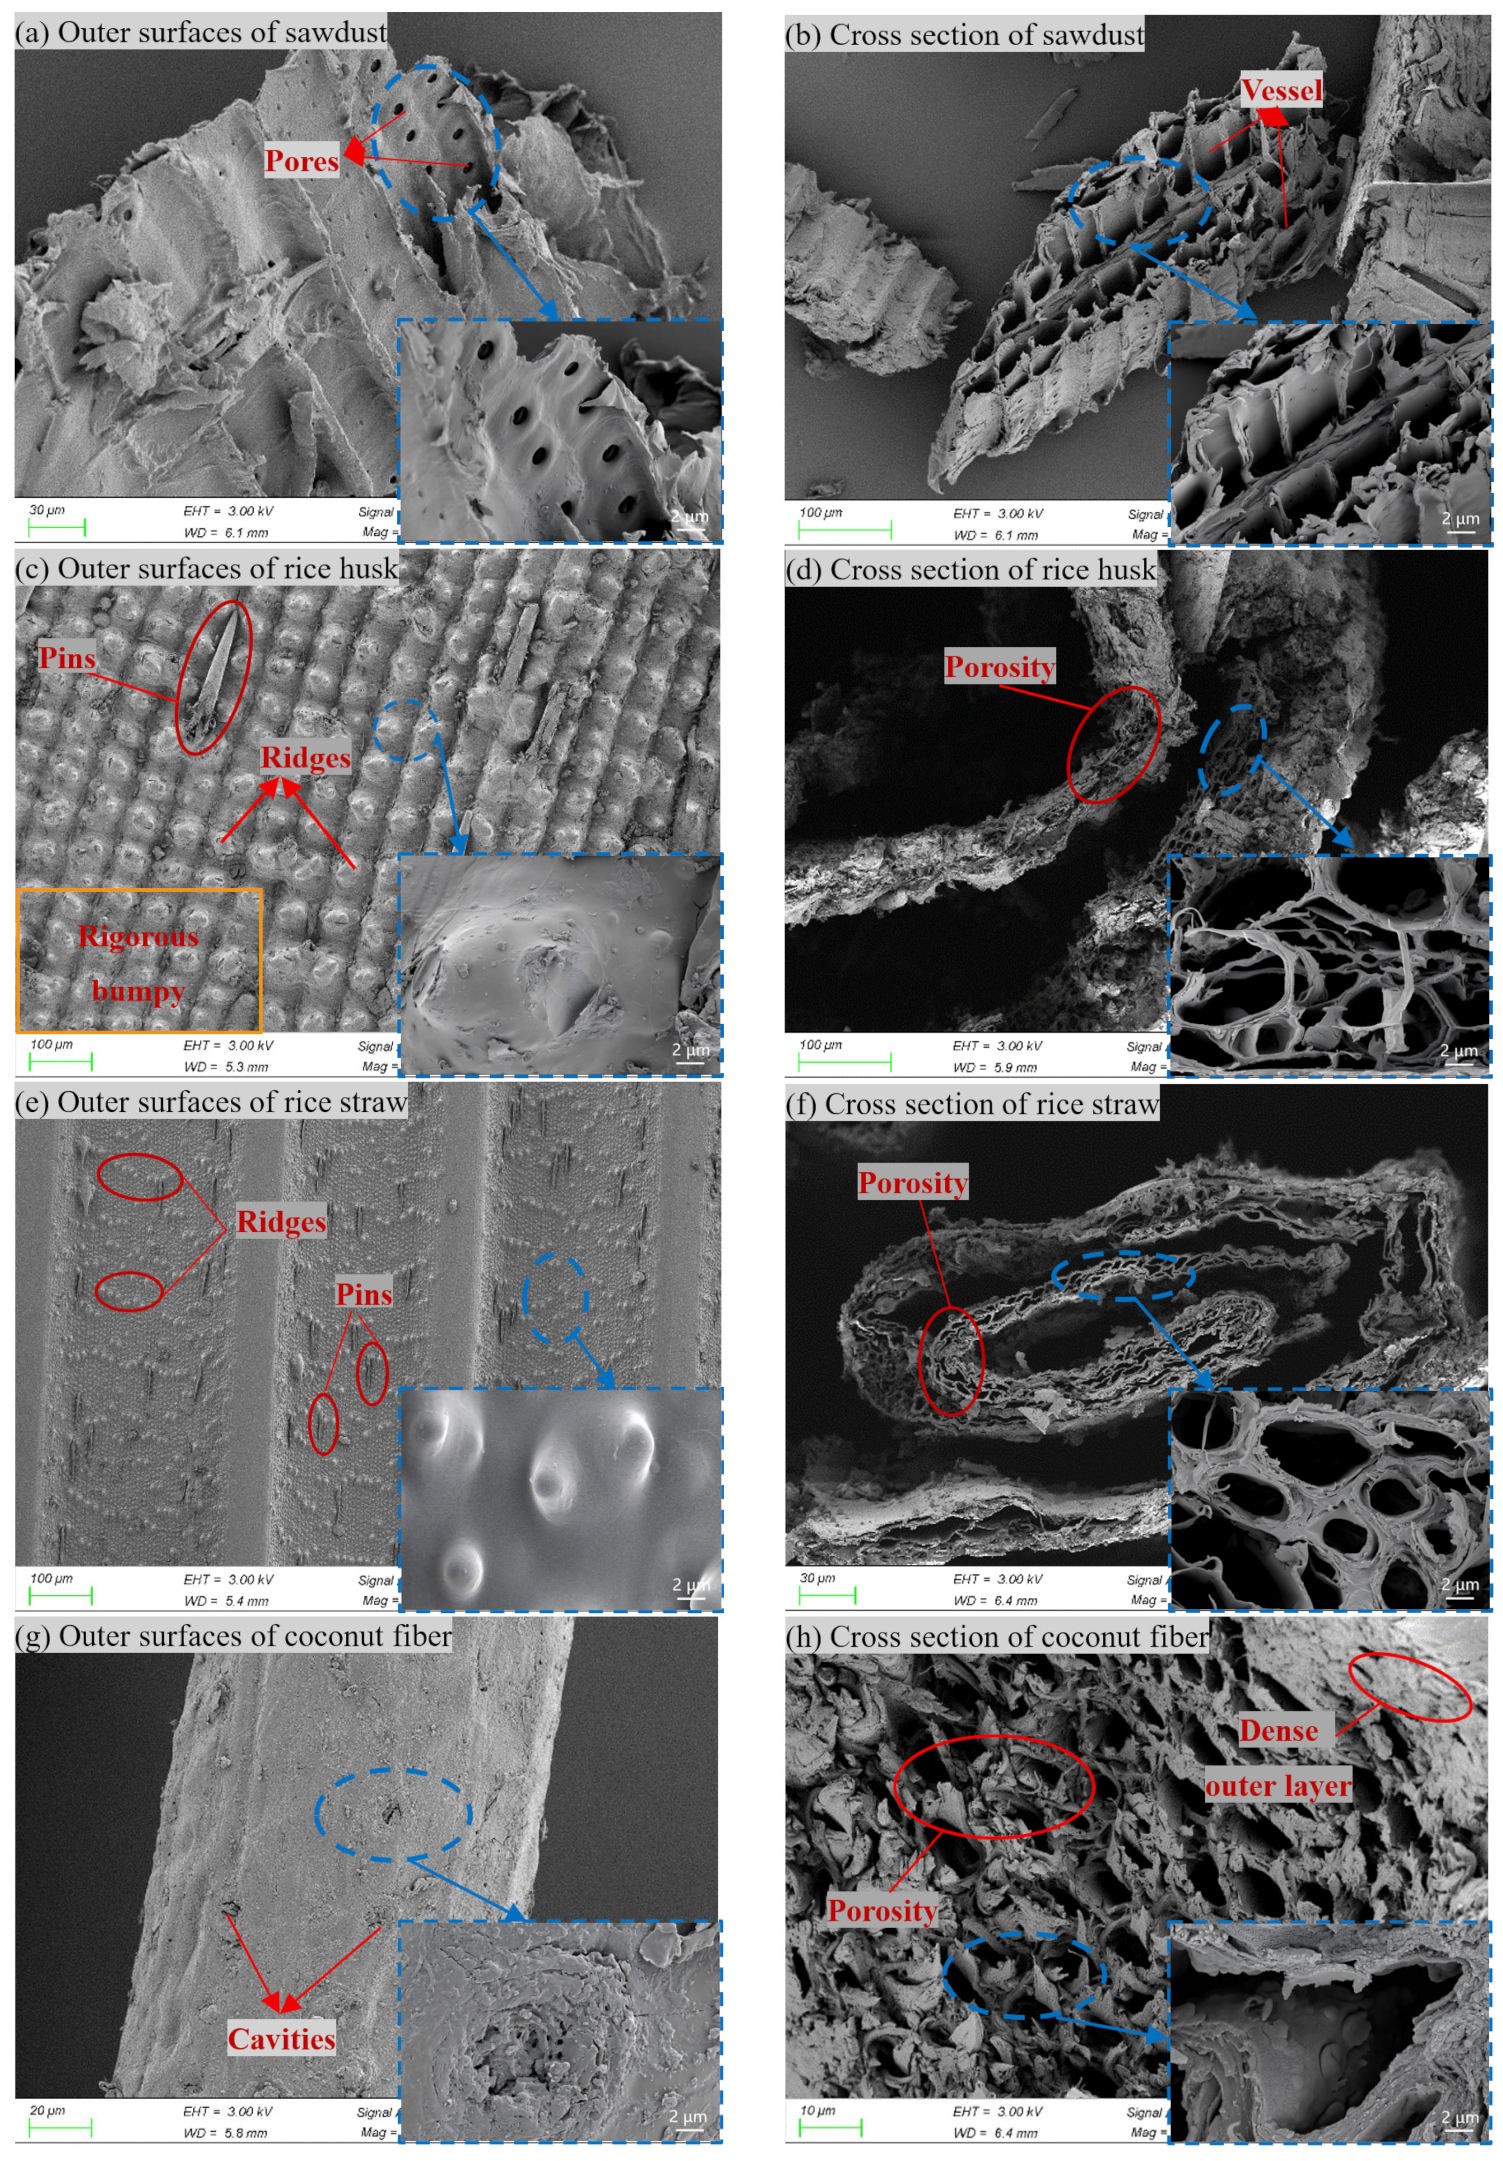
Figure 4 presents micrographs of the outer surface and cross section of sawdust, rice husk, rice straw and coconut fiber. From Figure 4a,b, it can be observed that sawdust exhibits a tubular structure composed of numerous vessels, with pores present in the vessel walls. A similar tubular structure of sawdust was reported in the work of [35,36]. Furthermore, the fully exposed pores of sawdust make it highly prone to water uptake, while its particulate form enlarges the interface zone between the sawdust particles and the geopolymer.
Figure 4c shows that rice husk surfaces exhibit neatly arranged raised ridges and pin-like protrusions, contributing to a fibrous and rough morphology. In addition, the rice husk features a dense outer surface, while its internal cross section reveals a porous, irregular honeycomb-like cavity configuration with considerable variations in pore size and shape (see Figure 4d). This porous structure forms an insulating layer that impedes heat transfer, thereby enhancing thermal performance [37].
As can be observed in Figure 4e,f, the rice straw surface also exhibits distinct morphological features, including pronounced ridges and an array of pin-like protrusions. However, these ridges are randomly distributed and vary in size, unlike the orderly arrangement found on rice husk. Furthermore, the cross-sectional micrographs reveal a highly porous structure. The convoluted structure of rice straw consists of cells that exhibit little variation in size and possess thick intercellular walls. This observation is analogous to the surface phenomenon reported in the work of [38].
For coconut fiber, Figure 4g shows that its surface is not completely smooth and typically exhibits cavities, some of which are obscured by a waxy deposit [39,40]. Furthermore, as shown in Figure 4h, the cross section reveals that its outer layer is relatively dense, while its interior has a high degree of porosity [41], which is the main reason for its very light weight. As a result of these characteristics, coconut fiber is widely employed as an effective thermal insulation material [42].

4.1.2. Surface Area and Pore Structure

The BET surface area, total pore volume, and average pore diameter of the raw sawdust, rice husk, rice straw, and coconut fiber are presented in Table 4.
Among the four biomass samples, sawdust exhibited the highest specific surface area (0.4031 m2/g), with a total pore volume of 0.001476 cm3/g and an average pore diameter of 14.65 nm. Falling within the mesoporous range (2–50 nm), this pore diameter confirms a predominantly mesoporous structure, which facilitates water molecule adsorption and transport. Rice husk exhibited the largest total pore volume (0.001836 cm3/g), with a moderate specific surface area of 0.1626 m2/g and an average pore diameter of 45.18 nm, approaching the mesopore–macropore boundary (50 nm). This indicates that, despite its substantial pore volume, the relatively large pore diameter results in a comparatively low specific surface area. In contrast, rice straw showed the largest average pore diameter (88.32 nm, falling within the macropore range > 50 nm), but recorded the lowest specific surface area (0.0307 m2/g) and total pore volume (0.000677 cm3/g) among the four samples. However, coconut fiber showed the smallest mean pore diameter (6.57 nm, mesoporous) but the lowest total pore volume (0.000236 cm3/g), with a moderate specific surface area (0.1439 m2/g), indicating limited nanopore development despite its fine mesopore size. Therefore, these pronounced differences in pore structure provide a foundation for elucidating the differences in water absorption performance among the four biomass samples.

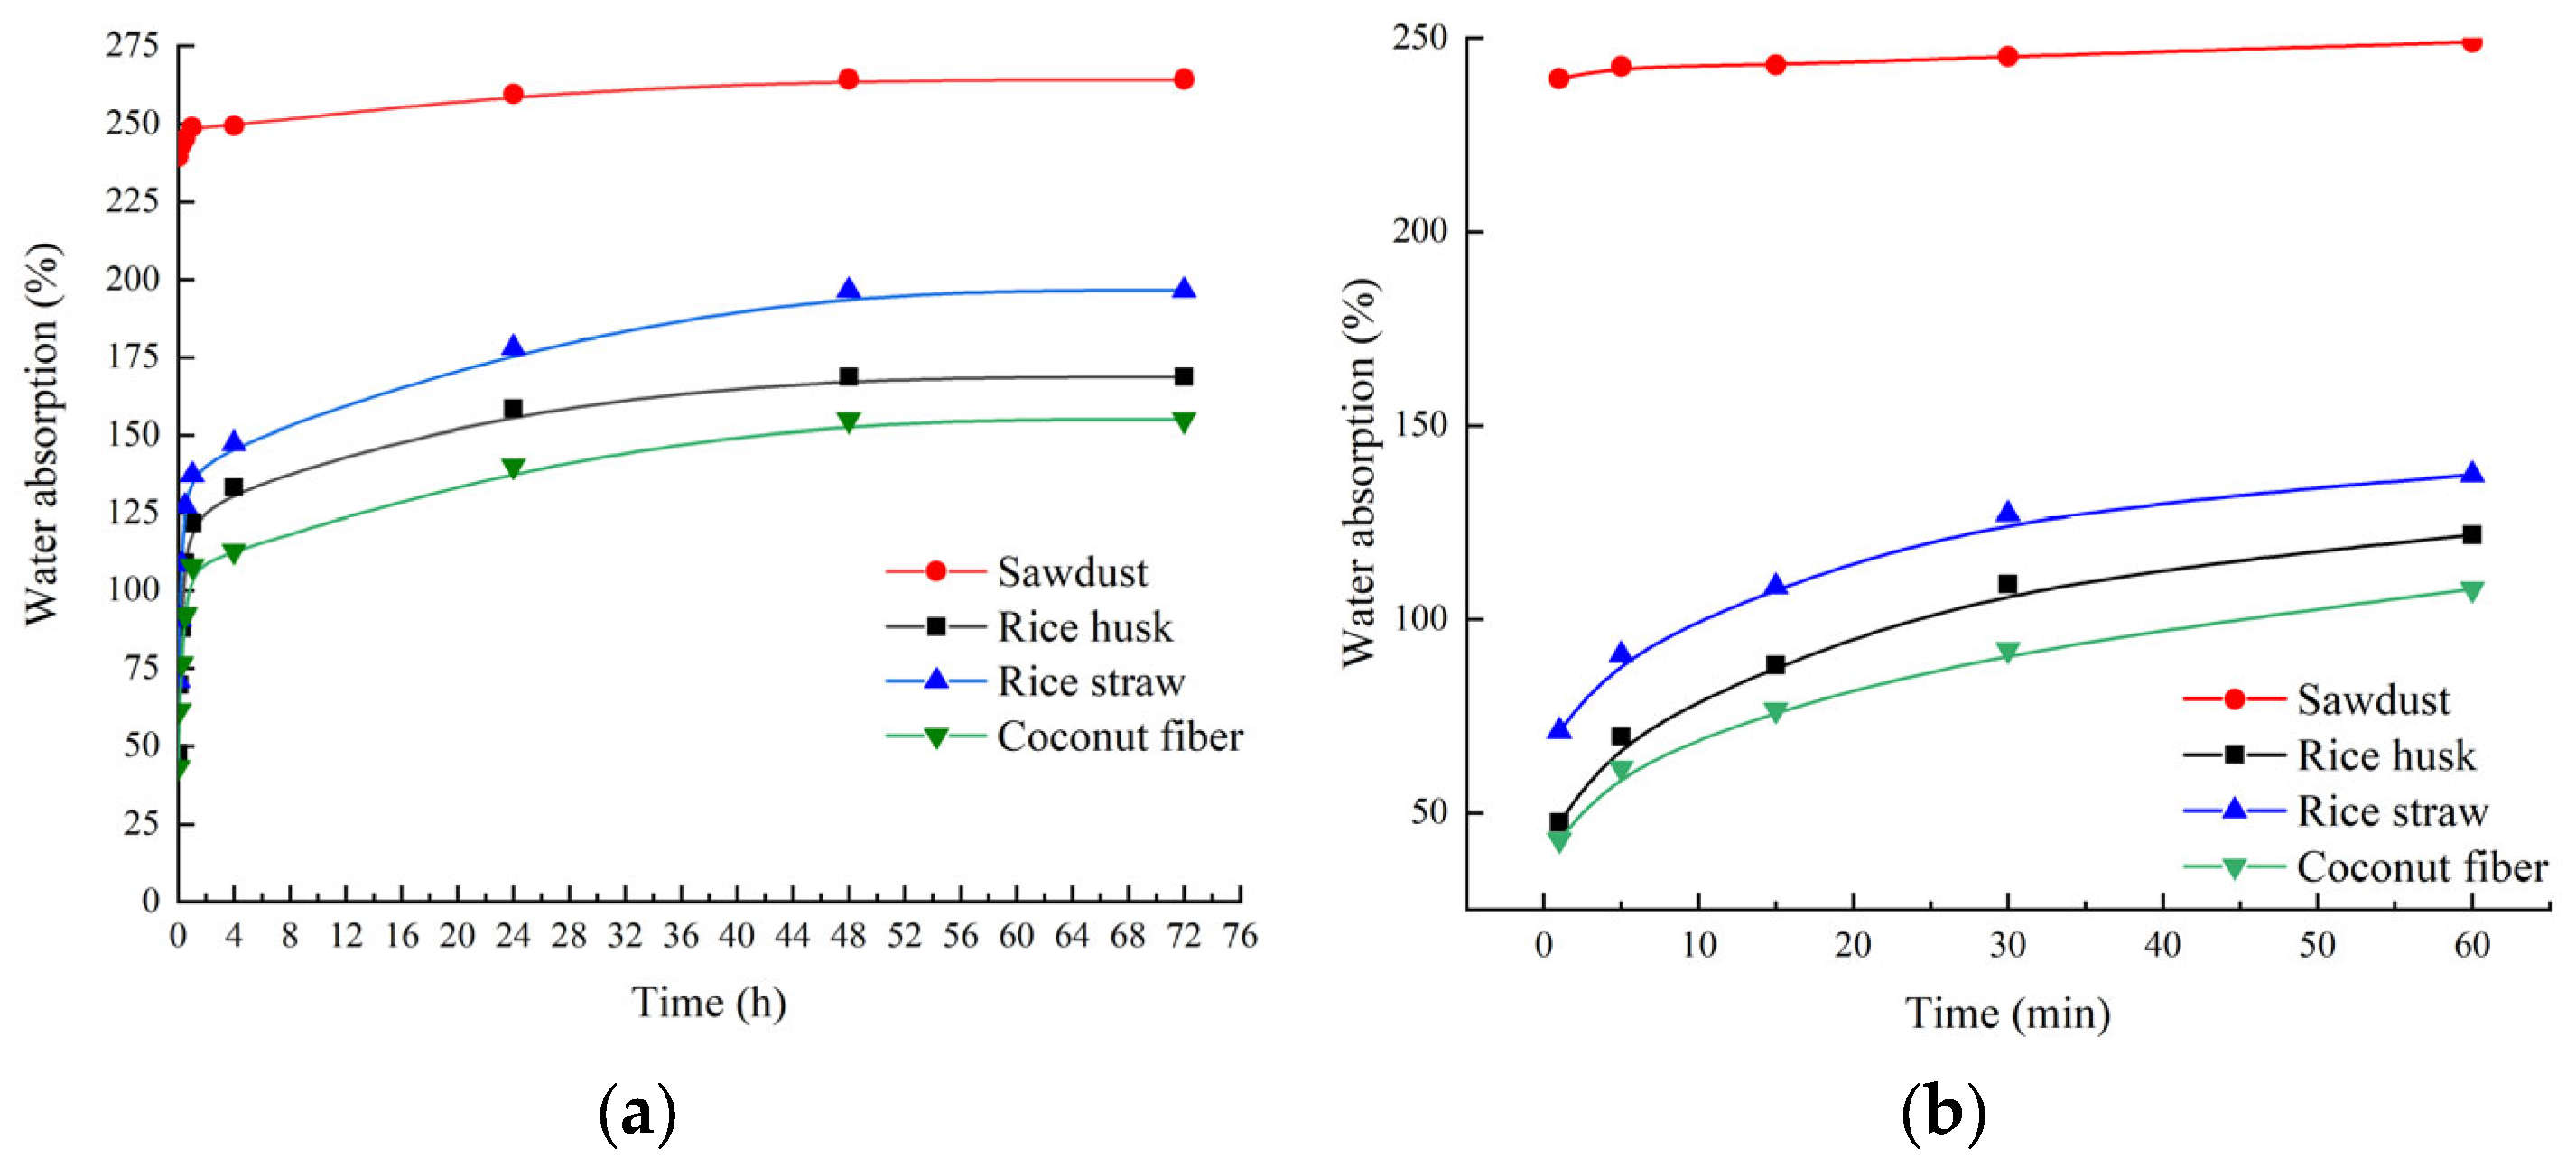
4.1.3. Water Absorption

The phenomenon of water absorption of sawdust, rice husk, rice straw and coconut fiber is indicated by the curve in Figure 5. A significant difference was observed in the water absorption characteristics of the four types of biomass aggregates. At early immersion times (1 min), the water absorption of sawdust reached as high as 239.5%, considerably higher than that of rice husk (47.6%), rice straw (71.2%), and coconut fiber (43.1%), as shown in Figure 5b. In the subsequent immersion period, the water absorption of sawdust slowed markedly. In contrast, the water absorption of rice husk, rice straw, and coconut fiber exhibited a steady increase, ultimately reaching 158.5%, 178.1%, and 140.1% at 24 h, respectively. This trend continued throughout the 48 h period, after which the curve stabilized, showing the water saturation of the four biomass aggregates. The final saturation water absorption for the four biomass aggregates was 264.4% (sawdust), 168.7% (rice husk), 196.5% (rice straw), and 154.9% (coconut fiber), respectively.
These results confirm the higher hydrophilicity of sawdust aggregates compared to rice husk, rice straw and coconut fiber, particularly in the early stages of water exposure. The high specific surface area (0.4031 m2/g) and well-developed mesoporous structure of sawdust facilitate capillary action and enable rapid water molecule infiltration into the pores [43], thereby contributing to its fast water uptake. Among them, rice straw, despite having the smallest pore volume, exhibited the largest pore diameter (88.32 nm), which facilitates water ingress but limits retention due to weak capillarity; rice husk, with the largest pore volume (0.001836 cm3/g), showed moderate water uptake, as its large pore diameter (45.18 nm) approached the macropore range, reducing capillary forces. In contrast, the lowest water absorption of coconut fiber is likely due to its denser outer surface (Figure 4g) and lower pore volume (Table 3), which hinder water penetration.
These findings not only clarify the water absorption characteristics of the four biomass materials but also offer essential support for further investigations. Especially for biomass-derived composites, the inherent properties of biomass aggregates can significantly affect the hydraulic performance of the final product. Therefore, understanding the intrinsic water absorption of these aggregates is essential for predicting the hydraulic behavior of the resulting composites.

4.2. Biomass/EPS Lightweight Geopolymer Composites Properties

4.2.1. Microstructure

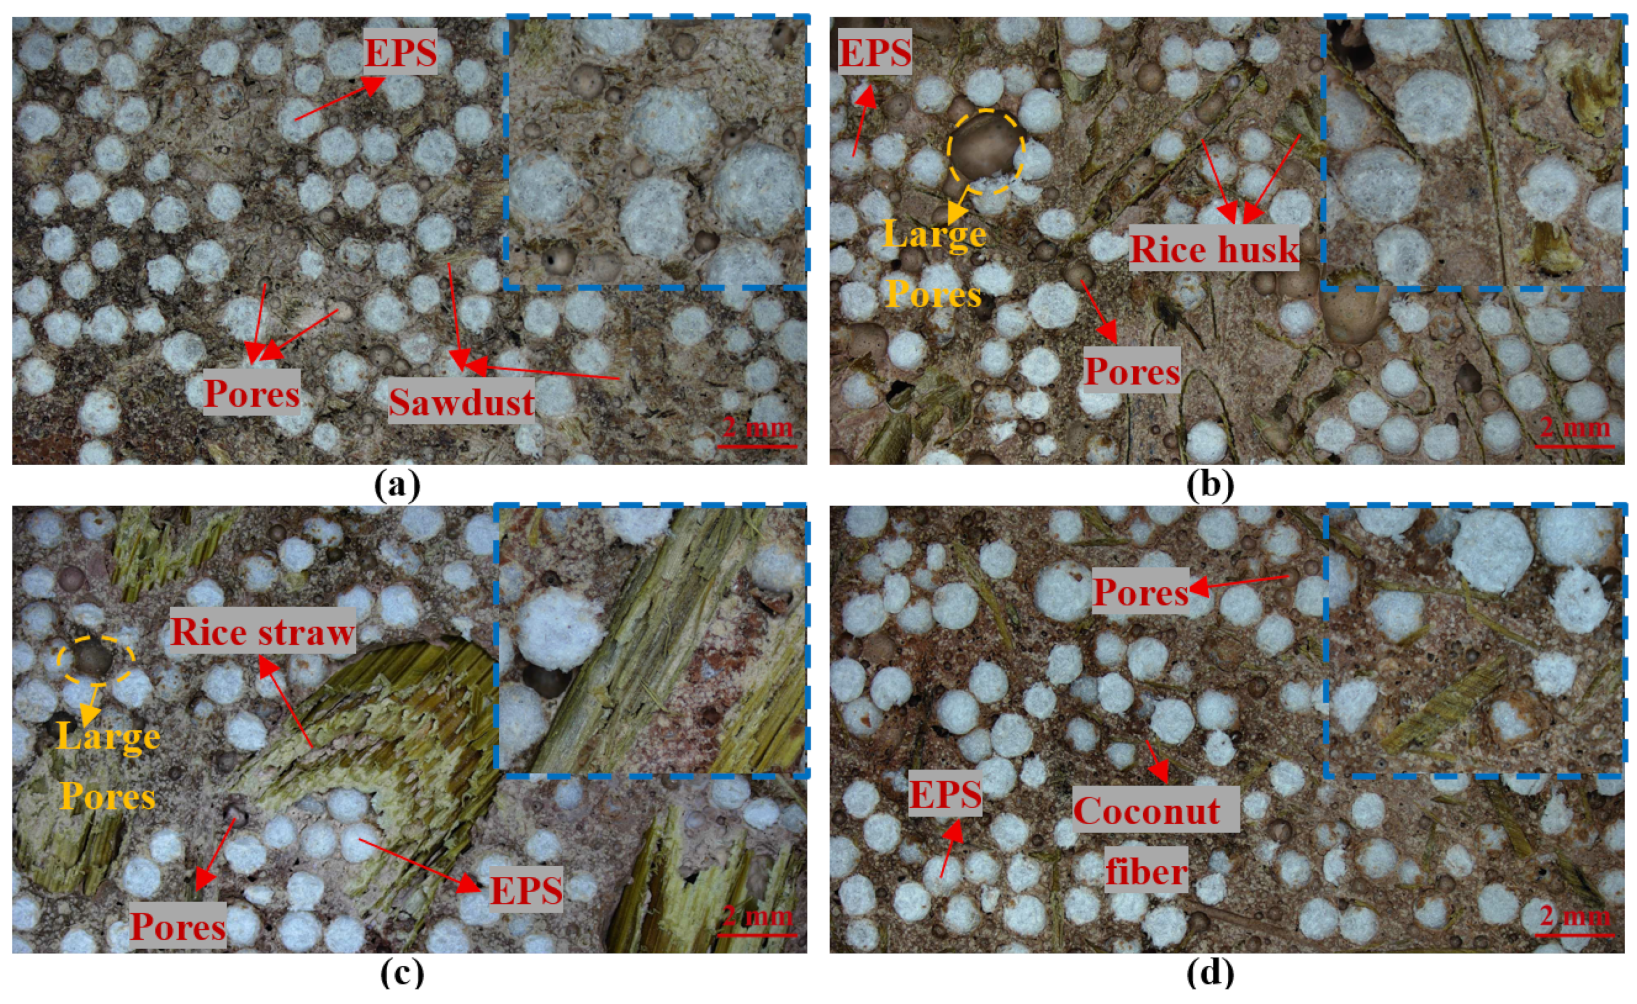
The microstructure of biomass/EPS lightweight geopolymer composites containing different types of biomasses is shown in Figure 6. It is evident that the surface of the SG sample is smooth (Figure 6a), with sawdust and EPS particles uniformly dispersed in the inorganic binder matrix. Moreover, excellent interfacial bonding is observed between the sawdust and the matrix. However, the surface of the HG sample is uneven (Figure 6b), exhibiting a distinct interfacial zone between the rice husk and the geopolymer binder, with the rice husk’s grooves also occupied by geopolymer and EPS particles. Compared to HG, the larger rice straw in the RG sample creates a distinct interface with the inorganic binder (Figure 6c), while its hollow structure is fully filled with geopolymer and EPS. Meanwhile, the CG sample also exhibits a flat surface, a tightly bonded interface between the coconut fiber and the inorganic binder (Figure 6d). These features are similar to those observed in the SG sample. Additionally, many micropores were identified in the inorganic geopolymer matrix, consistent with the observations of Lazorenko et al. [44]. The formation of these pores can likely be attributed to two main factors: (1) air entrainment during the mixing process, and (2) the evaporation and outgassing of water during the curing stage. However, differences in micropore size were observed among the four samples, likely due to the morphological and dimensional variations in the biomass materials. The smaller particle size and higher surface roughness of sawdust enable the sawdust particles to fill the paste matrix more effectively, resulting in increased compactness. In contrast, the larger size and notable width of rice husk and rice straw create a bridging effect within the paste, hindering close packing and promoting the formation of comparatively larger pores. Although coconut fiber has a similar length to rice straw fiber, its smaller diameter reduces the surface area per individual fiber, allowing it to be more readily and thoroughly encapsulated by the geopolymer paste, thereby suppressing the formation of larger pores [6].
In sum, the type and fiber size of the biomass have a great influence on the morphology, pore structure, and interfacial properties. These differences in microstructure directly determine the macroscopic physical properties of the composites. Therefore, microstructural analysis is essential for explaining the macroscopic properties.

4.2.2. Porous Structure

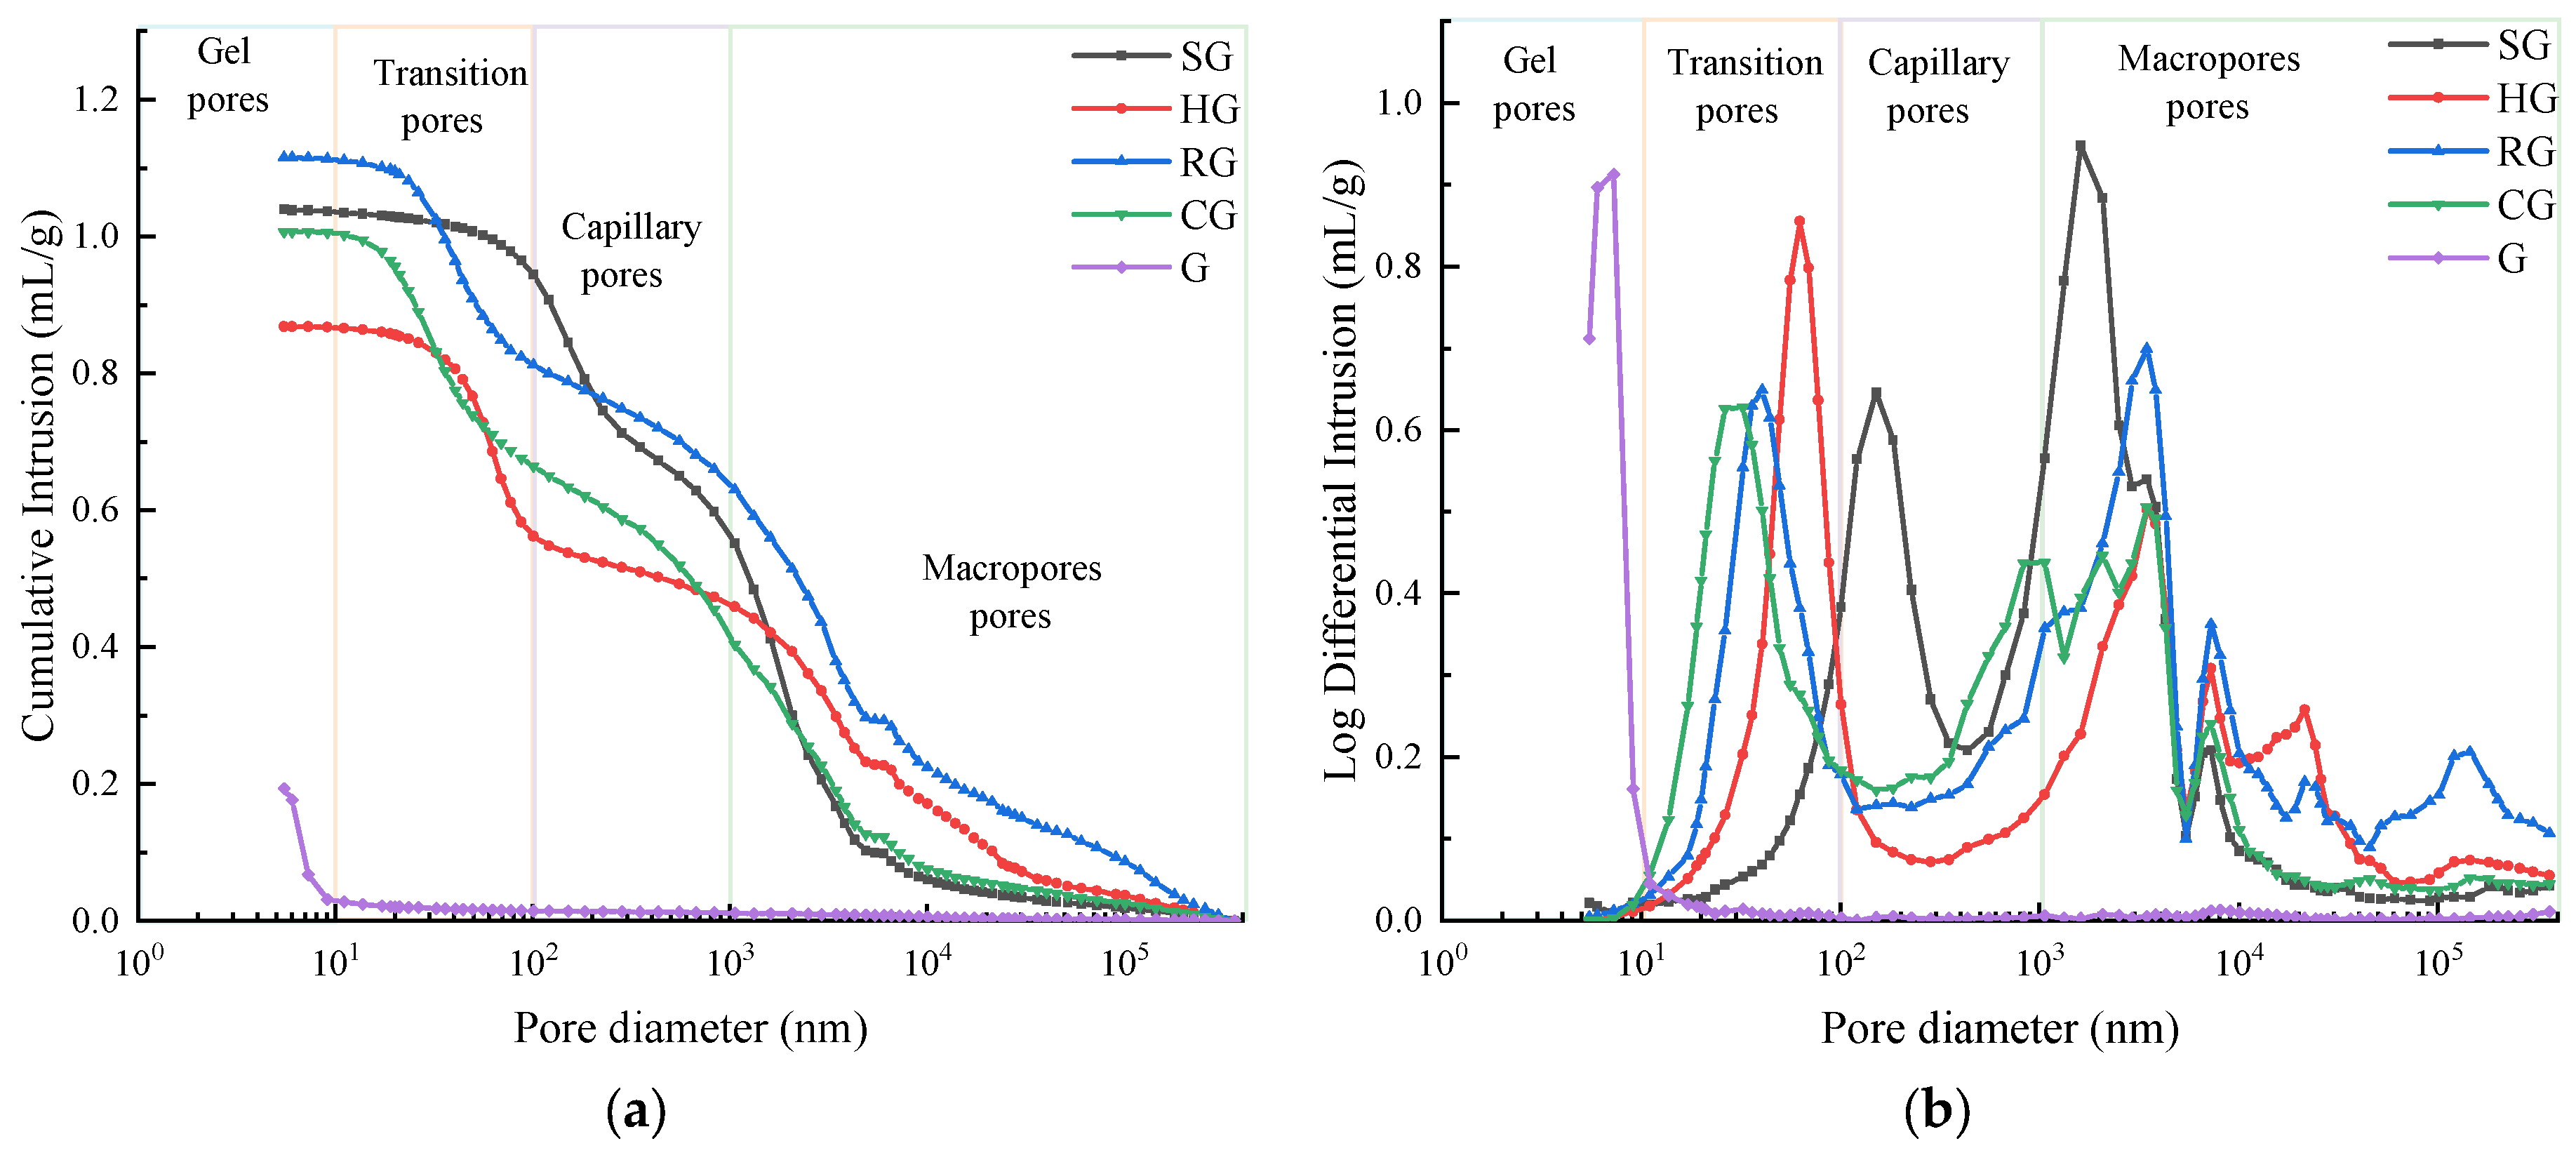
MIP analysis was conducted to obtain the cumulative intrusion and pore size distribution curves of the geopolymer composites, as shown in Figure 7. As can be seen from Figure 7a, the cumulative mercury intrusion volumes of SG, HG, RG, CG, and G are 1.0395, 0.8681, 1.1154, 1.0063, and 0.1932 mL/g, respectively.
Furthermore, based on their diameter, pores in building materials are generally classified into four categories: gel pores (<10 nm), transition pores (10–100 nm), capillary pores (100–1000 nm), and macropores (>1000 nm) [45]. From Figure 7b, it is evident that the pure geopolymer (G) exhibits only a single peak at approximately 6–7 nm, which is attributed to the intrinsic gel pores formed by the packing of gel particles [46]. In contrast, all biomass/EPS lightweight geopolymer composites exhibit two main peaks. The first peak (SG: ~151 nm; HG: ~69 nm; RG: ~40–69 nm; CG: ~32–49 nm) is attributed to interfacial microcracks caused by the mismatch between geopolymer chemical shrinkage and biomass rigid constraint, with peak position variations reflecting different interfacial interaction strengths, while the second peak (>1000 nm) results from the combined contribution of intrinsic biomass hollow channels (Figure 4), EPS-induced macroscopic gaps, and entrapped mixing air bubbles (Figure 6). Notably, the gel-pore signal below 10 nm almost disappears in the composites. This can be attributed to two synergistic effects. First, the high volume fraction of biomass and EPS particles dilutes the geopolymer binder and physically disrupts the spatial continuity of the geopolymer gel network; localized gel formation may still occur, but the overall gel phase cannot percolate throughout the composite, leading to a significant reduction in nanoscale gel pores. Second, the alkaline environment of the slurry promotes partial degradation of cellulose and hemicellulose in the biomass, releasing organic species that consume hydroxyl ions and reduce system alkalinity, thereby hindering polycondensation [6]. The combination of these physical and chemical effects results in a negligible fraction of gel pores, indicating that the introduction of biomass and EPS aggregates fundamentally alters the pore evolution pathway of the matrix.
In summary, the pore size distribution curve of the pure geopolymer exhibits only a single peak, indicating a homogeneous and dense gel pore structure. In contrast, the curves of the composites display two distinct main peaks within the 10–6000 nm range, accompanied by multiple small peaks in the macropore region (>6000 nm), which signifies a transition from a unimodal to a multimodal pore size distribution. These results suggest that, compared with the neat geopolymer, the introduction of biomass and EPS particles substantially modifies the open pore volume and pore dimensions of the composites, and such changes in pore structure parameters will inevitably exert a direct influence on their macroscopic physical properties, including thermal conductivity and mechanical performance.

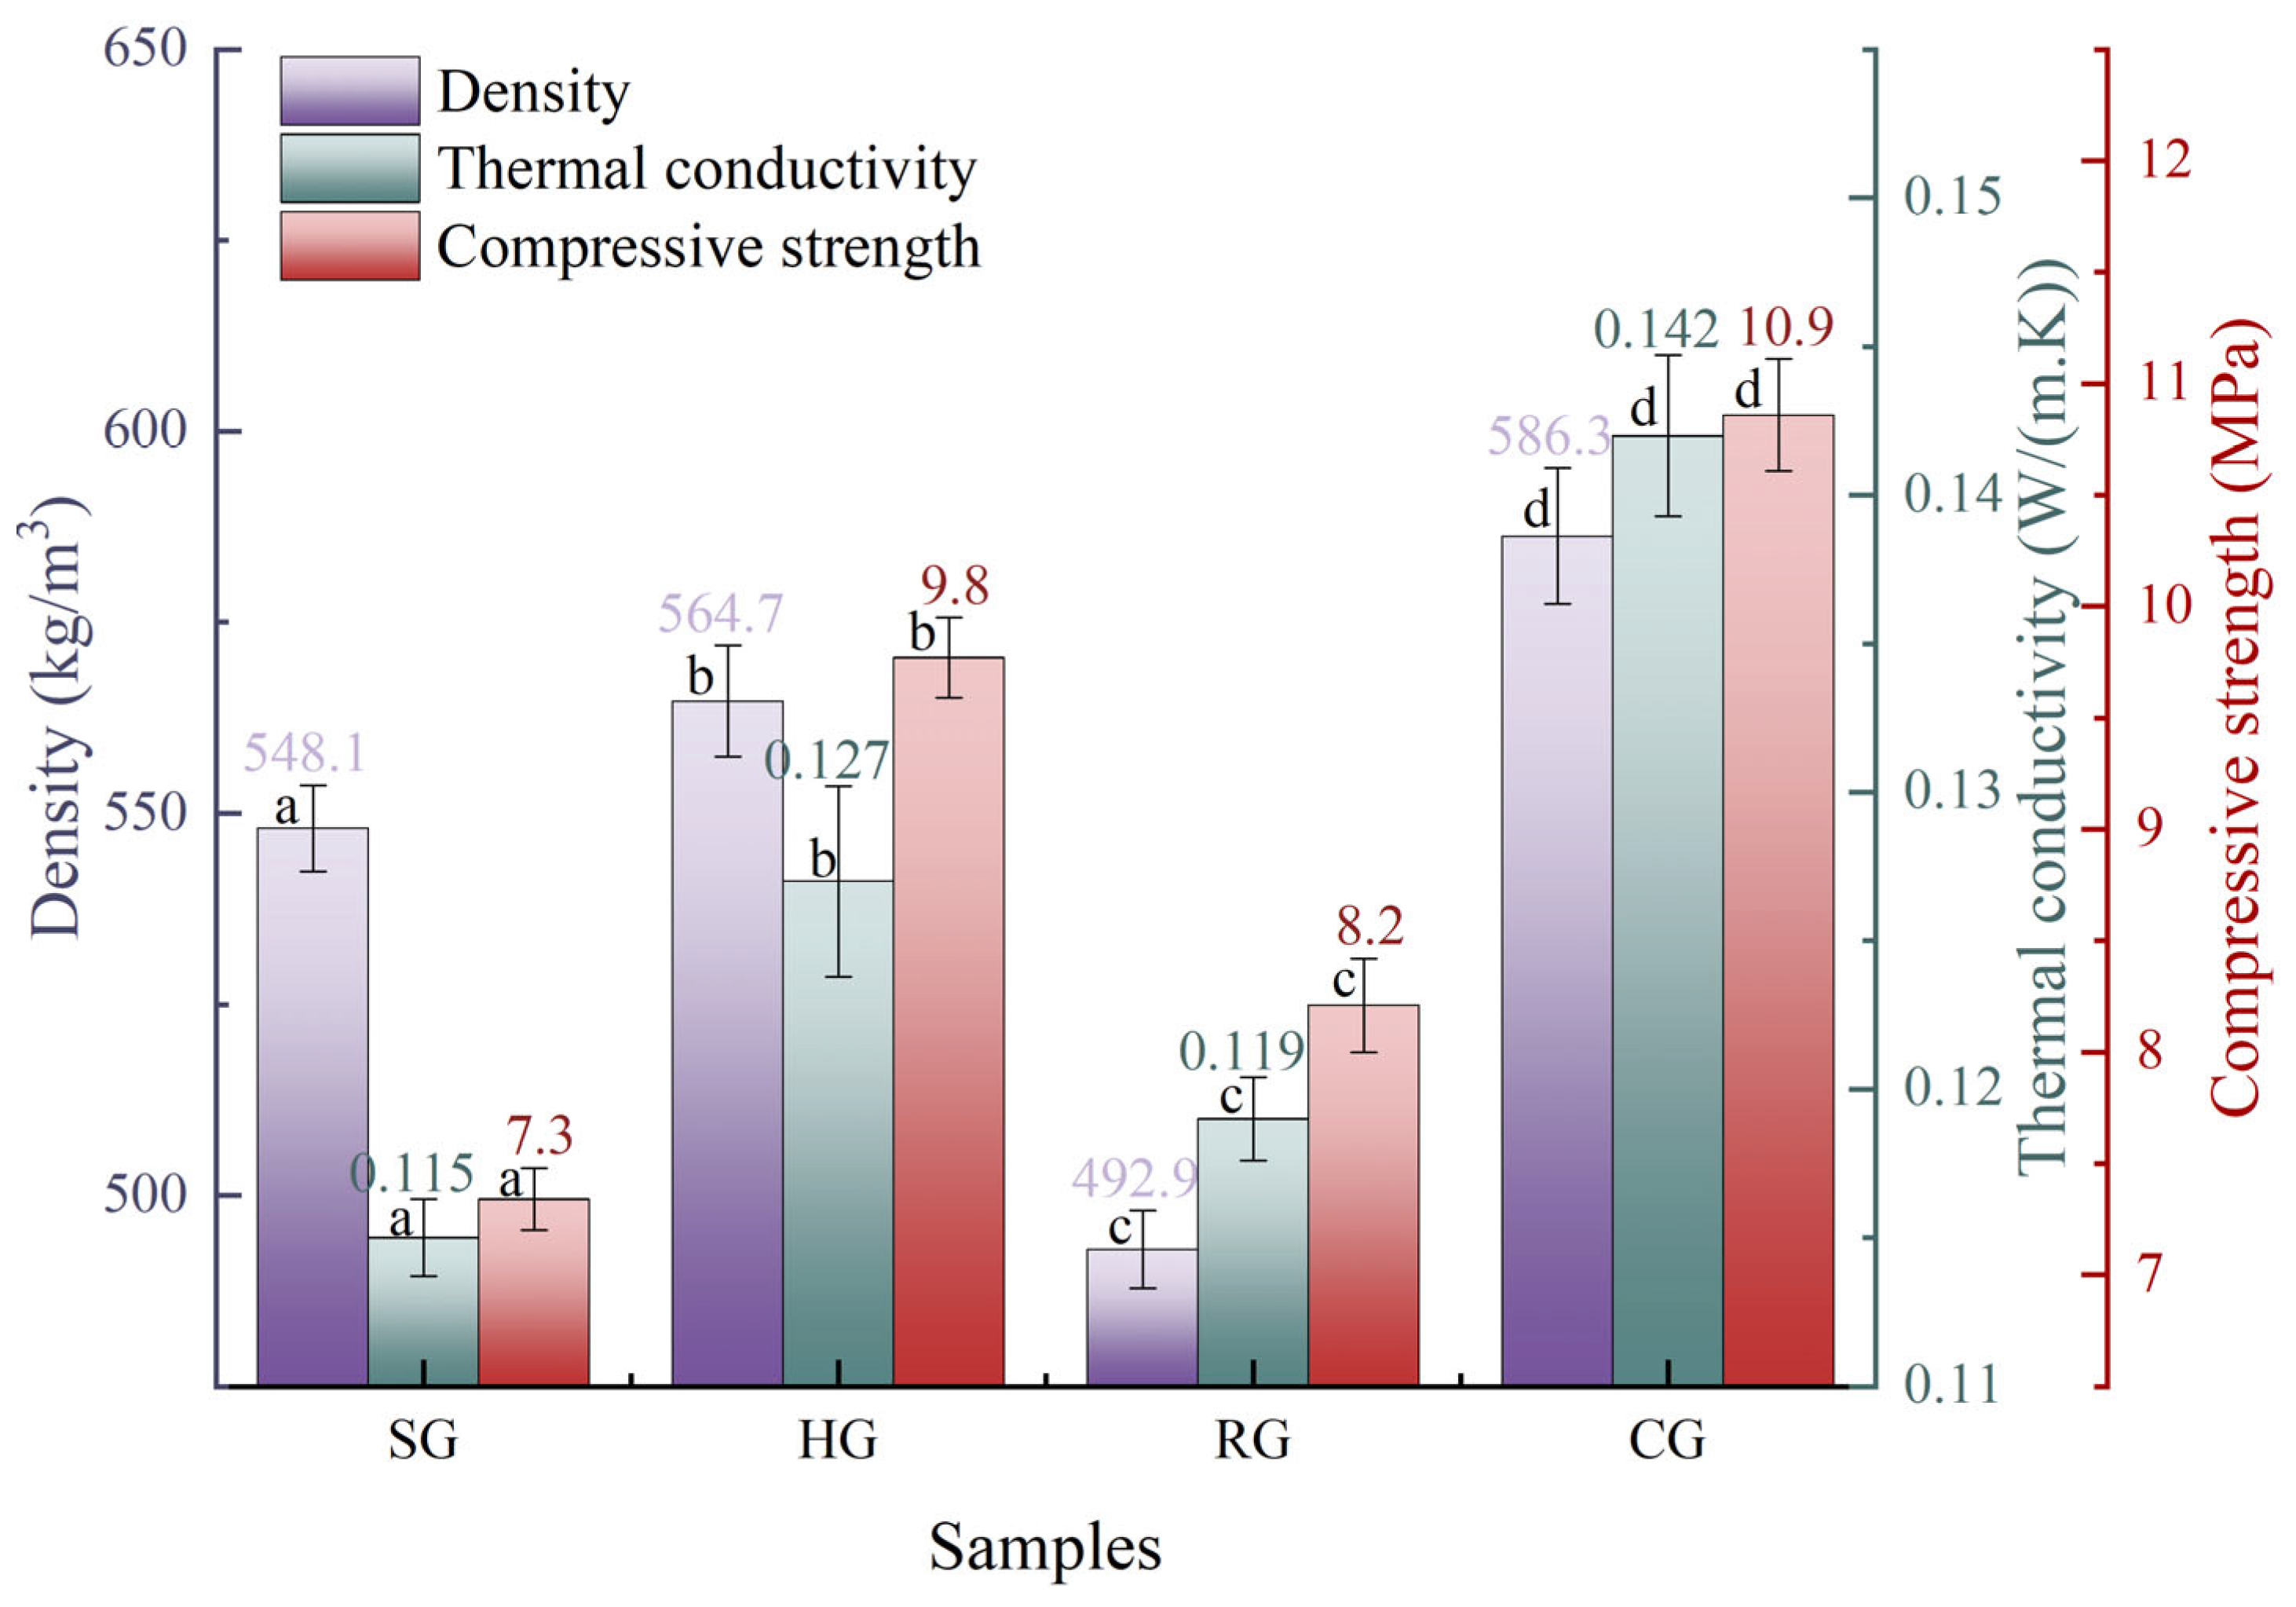
4.2.3. Thermal Conductivity and Compressive Strength

As can be seen from Figure 8 and Table 5, the thermal conductivities of the SG, HG, RG, and CG samples are 0.115, 0.127, 0.119, and 0.142 W/(m·K), respectively, with SG exhibiting the lowest value and CG the highest. SG shows the best thermal insulation performance, which is attributed to its highest porosity (65.7%) and largest average pore size (230.29 nm), allowing a large amount of stagnant air to be trapped inside. However, the large porous structure also weakens the skeleton continuity, resulting in the lowest compressive strength (7.3 MPa). In contrast, CG possesses the lowest porosity (59.9%) and the smallest average pore size (80.25 nm), indicating the densest structure; consequently, its density, thermal conductivity, and compressive strength (10.9 MPa) are all the highest. HG and RG lie in between. HG has a lower porosity (61.1%) than RG (64.8%), and although its average pore size (123.85 nm) is slightly larger than that of RG (118.61 nm), the lower porosity dominates the mechanical performance, making the compressive strength of HG (9.8 MPa) higher than that of RG (8.2 MPa). In addition, although RG shows the lowest density (492.9 kg/m3), its porosity is only slightly lower than that of SG. The relatively higher density of SG (548.1 kg/m3) is mainly due to the higher true density of the added sawdust, rather than a more compact structure.
Statistical analysis (one-way ANOVA) revealed that the p-values for density, thermal conductivity, and compressive strength among the SG, HG, RG, and CG samples were all below 0.001, confirming that biomass type significantly influences the physical properties of the composites. In comparison, the RG sample offers the best combination: low thermal conductivity (0.119 W/(m·K)), high compressive strength (8.2 MPa), and low density (492.9 kg/m3). Moreover, the RG sample exhibits more competitive overall properties than those of similar composites reported in the literature [4,6]. This simultaneous improvement in thermal insulation and mechanical performance can be attributed to the complementary roles of the two main components: the EPS particles introduce closed-cell structures with intrinsically low thermal conductivity, effectively reducing heat transfer; meanwhile, the biomass fibers act as reinforcing fillers within the geopolymer matrix, facilitating stress transfer and crack deflection, which helps sustain the compressive strength. This verifies that incorporating low-thermal-conductivity EPS particles into a non-foamed geopolymer system effectively reduces the overall thermal conductivity while preserving good mechanical properties [47].
In addition, compared with previous studies [48] using H2O2 as a foaming agent to produce straw-based geopolymer composites (λ: 0.115 W/(m·K), P: 2.1 MPa), the new approach replaces 10 g of H2O2 with 400 mL of waste EPS. This substitution maintains a comparable thermal conductivity while achieving a significant increase in the compressive strength of the composite. In addition, according to the GB/T 50003-2011 [49], CG samples with a compressive strength exceeding 10 MPa meet the basic requirements for structural lightweight blocks. Therefore, they have potential applications in secondary buildings that have lower insulation requirements for the envelope structure but require good thermal storage capacity, such as greenhouses or livestock shelters.

4.2.4. Water Absorption

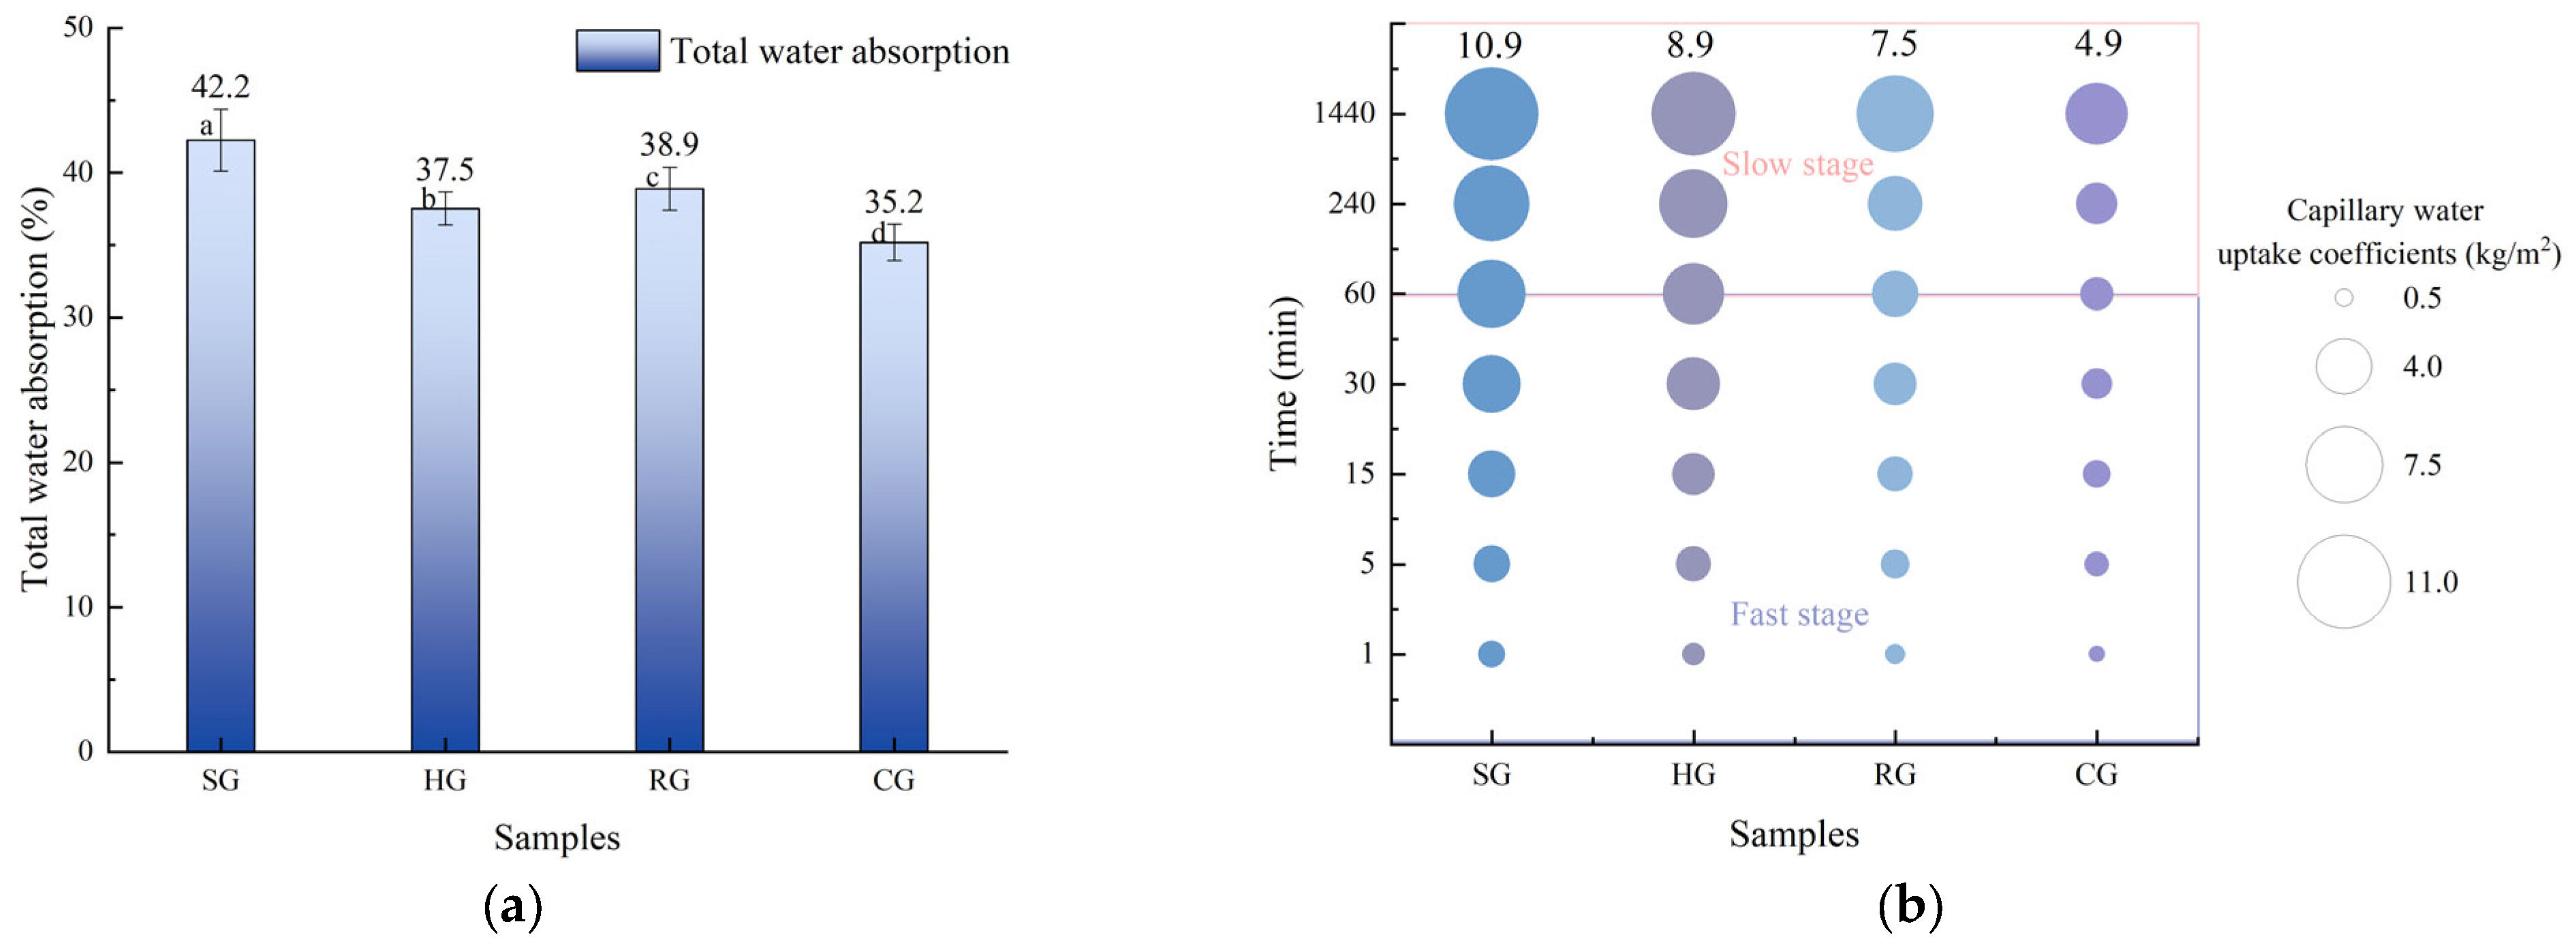
Figure 9 presents the water absorption properties of lightweight geopolymer composites based on different biomass types. It can be observed that there are significant differences in the total water absorption of the SG, HG, RG, and CG samples. Among them, SG exhibits the highest absorption (42.2%), followed by RG and then HG, while CG demonstrates the lowest (35.2%), as shown in Figure 9a. This is largely attributable to the close relationship between water absorption and porosity. The porosity of the four samples (SG (65.7%) > RG (64.8%) > HG (61.1%) > CG (59.9%), as detailed in Section 4.2.3) follows the same order as their water absorption. Additionally, this trend is also consistent with the water absorption behavior of the raw biomass materials themselves [19], as shown in Figure 5.
However, the capillary water uptake coefficients of the four composites also differed considerably (Figure 9b). All samples exhibited a two-stage growth trend. In the fast stage (within the first 60 min), the coefficient of SG rose from 0.9 to 5.9 kg/m2 (+555.6%), HG from 0.7 to 4.8 kg/m2 (+585.7%), RG from 0.5 to 2.7 kg/m2 (+440%), and CG from 0.4 to 1.4 kg/m2 (+250%). In the slow stage, SG increased from 5.8 to 10.9 kg/m2 (+87.9%), HG from 4.7 to 8.9 kg/m2 (+89.4%), RG from 2.7 to 7.5 kg/m2 (+177.8%), and CG from 1.4 to 4.9 kg/m2 (+250%). This phenomenon is mainly attributable to a stage-dependent shift in the dominant driving force. In the early stage, capillary force drives rapid water penetration through meso-/macropores, while gravitational equilibrium and air back-pressure gradually take over thereafter, suppressing further water ingress and causing the uptake rate to decay [50].
Interestingly, the capillary water uptake coefficient correlates well with the first peak positions shown in Figure 7b (SG: ~151 nm; HG: ~69 nm; RG: ~40–69 nm; CG: ~32–49 nm). The capillary driving force primarily originates from pores in the 10–100 nm range; however, the uptake capacity is also governed by flow resistance, which increases with decreasing pore size. SG, with a moderate pore size, achieves an optimal balance between driving force and resistance, and thus exhibits the highest capillary uptake coefficient (10.9 kg/m2). HG and RG have similar pore sizes, yet HG shows a higher peak intensity in this region (Figure 7b), indicating a larger pore volume and consequently stronger water uptake. In contrast, CG has the smallest pore size; despite providing the maximum driving force, the substantial flow resistance severely impedes water ingress, giving the lowest coefficient (4.9 kg/m2).

4.2.5. Water Contact Angle

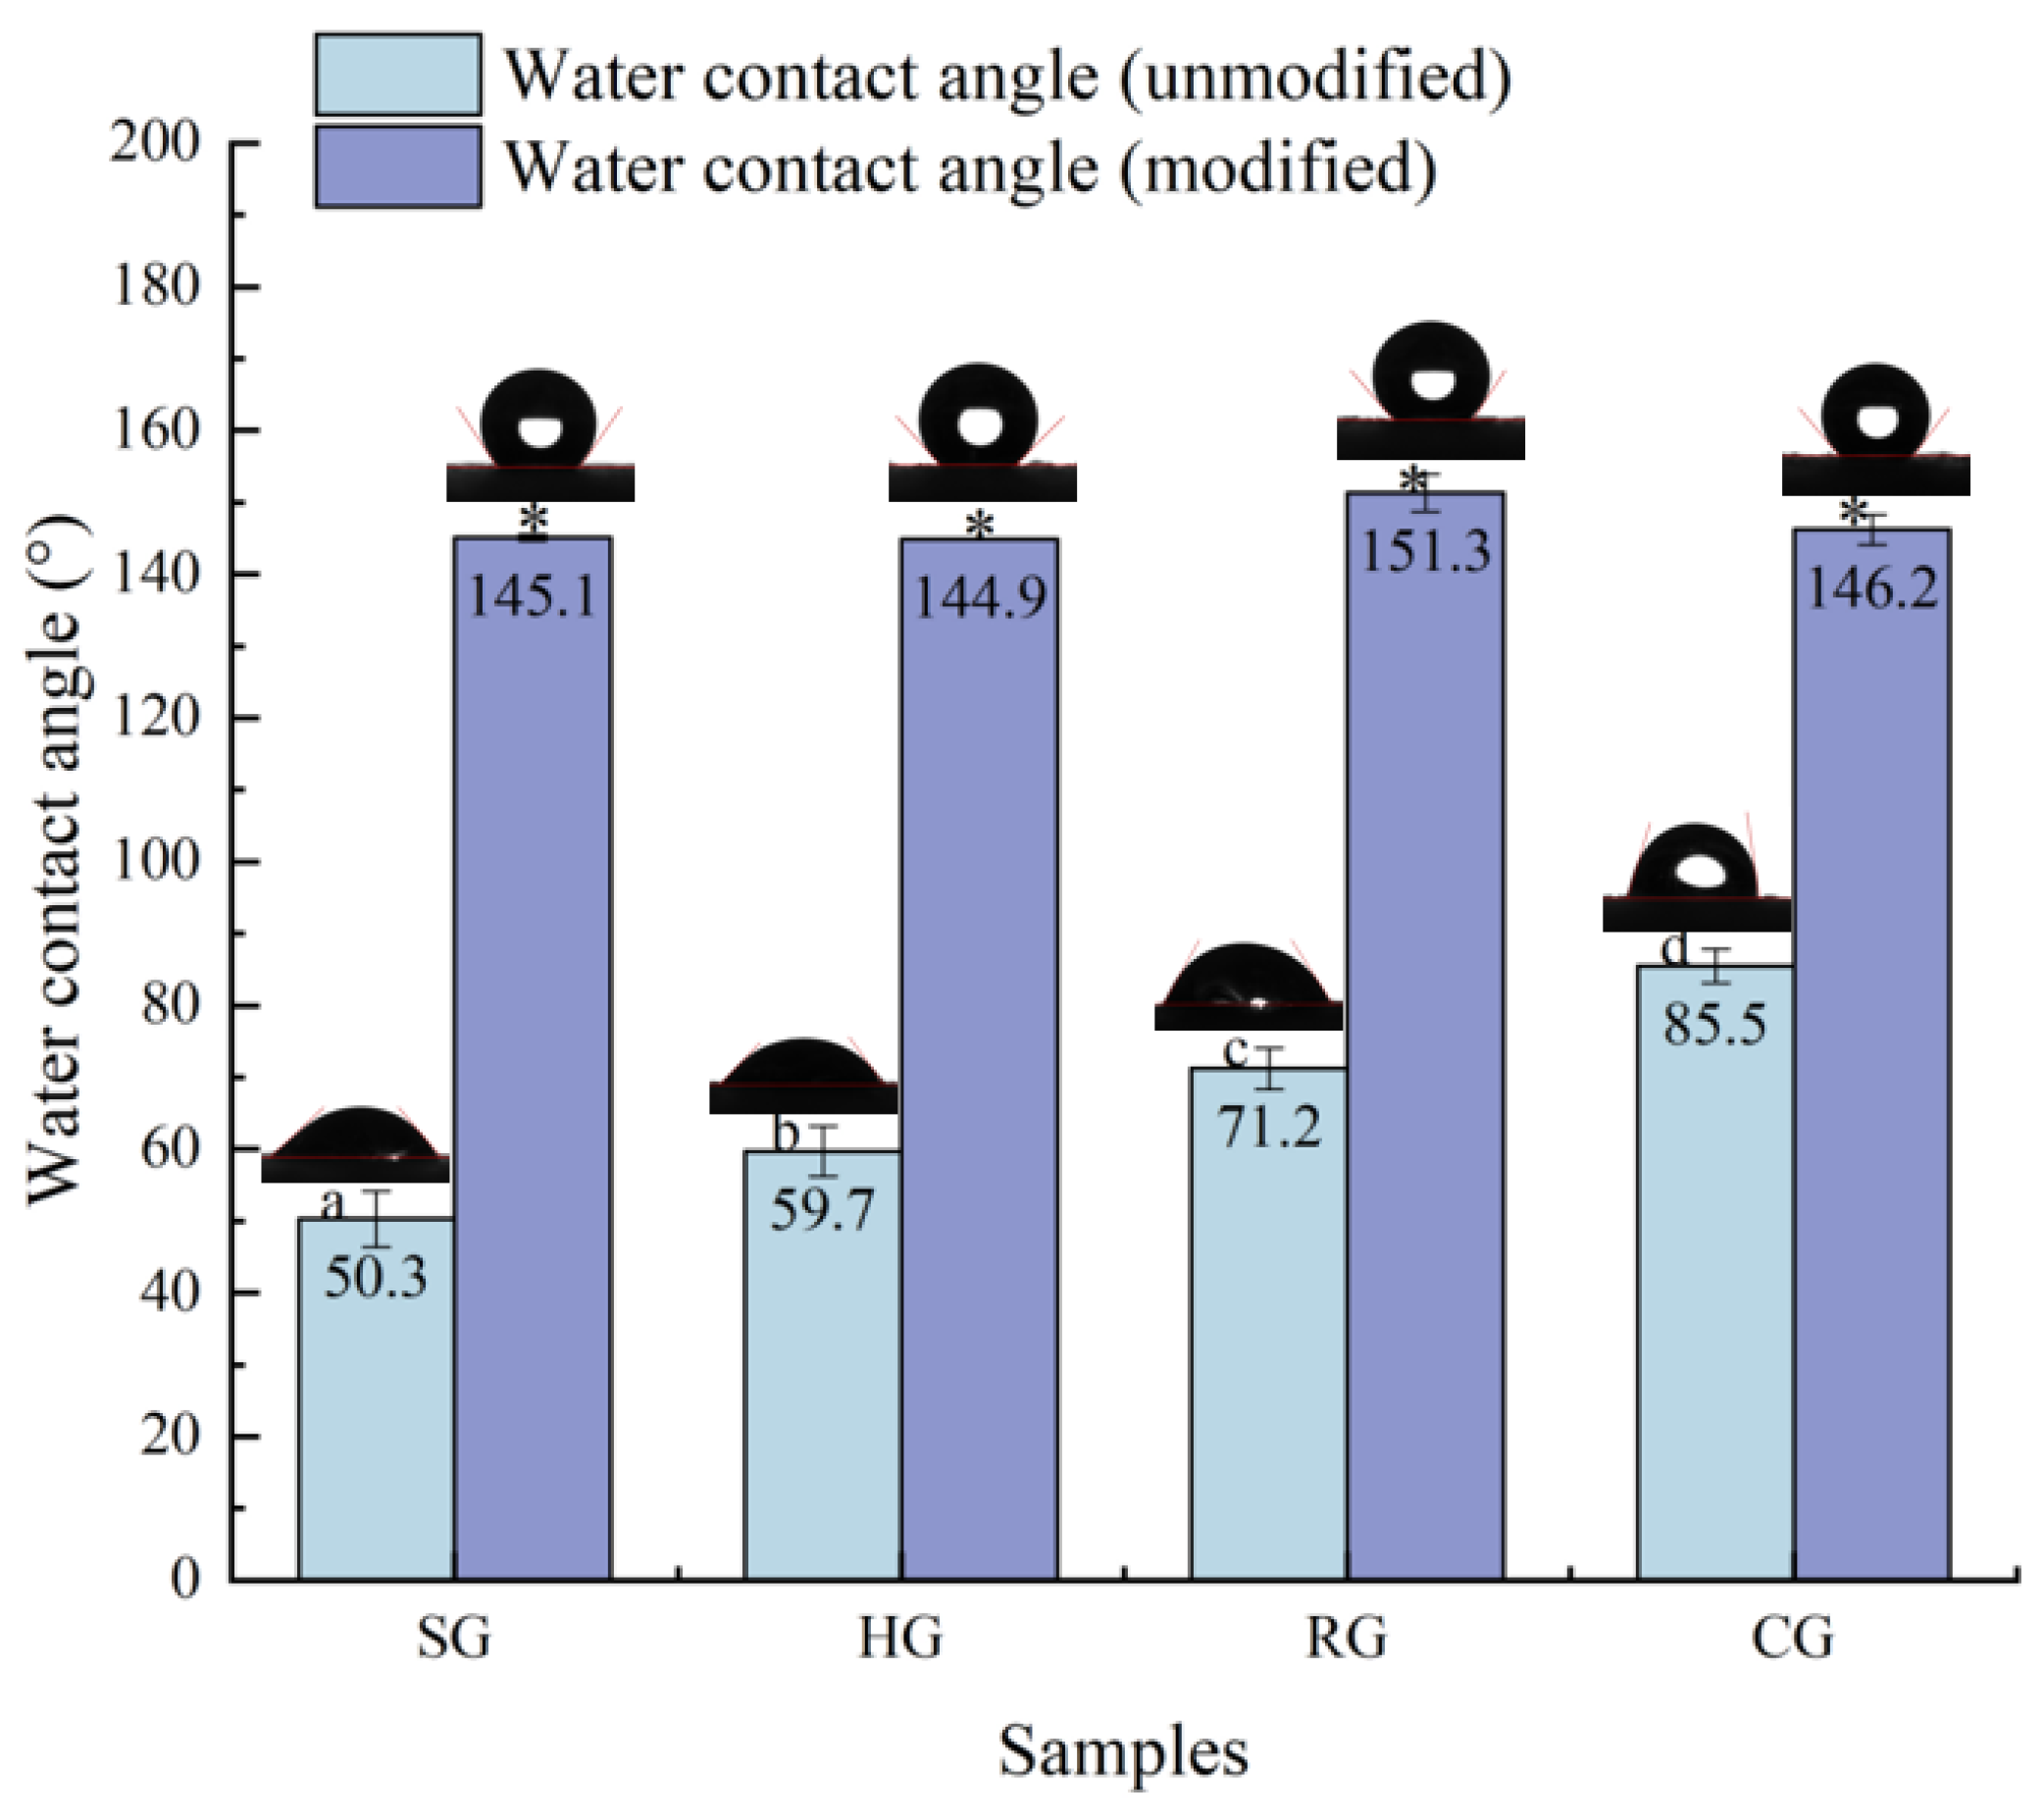
The surface wettability, as determined by water contact angle measurements, of the unmodified and modified samples is shown in Figure 10. It is observed that the water contact angles of the unmodified SG, HG, RG, and CG samples are 50.3°, 59.7°, 71.2°, and 85.5°, respectively. The surfaces can be ranked in order of decreasing wettability: SG > HG > RG > CG. The observed trend aligns with our capillary water absorption data (Figure 9b), and a similar phenomenon has been documented in Ref. [51]. Moreover, the dynamic water contact angle videos clearly show that the droplet was absorbed most rapidly on the SG surface (see Supplementary Video), more slowly on the HG and RG surfaces (see Supplementary Video), and remained the longest on the CG surface (see Supplementary Video). However, the fact that absorption occurred on all surfaces confirms their wettable nature.
After modification, the static water contact angles increased to 145.1° (SG), 144.9° (HG), 151.3° (RG), and 146.2° (CG) for the respective samples, showing little variation among them. This indicates that the waterproofing agent has excellent chemical bonding capability with the geopolymer matrix, biomass aggregates, and EPS particles. In addition, according to the international standard (ISO 19403-1:2022), a surface is classified as hydrophilic if the water contact angle is less than 90°, hydrophobic if it is between 90° and 150°, and superhydrophobic if it exceeds 150° [52]. Therefore, the unmodified SG, HG, RG, and CG samples all exhibit hydrophilic surfaces, which can adversely affect their thermal, mechanical, and durability performance in construction applications. In contrast, the modified samples achieve a nearly superhydrophobic surface, which provides remarkable waterproof performance while retaining sufficient breathability.
Based on the above results, the surface of unmodified composites exhibits strong hydrophilic properties (water contact angles: 50.3–85.5°), whereas after surface modification with a self-developed waterproofing agent, the composite surface approaches a superhydrophobic state (water contact angles: 144.9–151.3°). Furthermore, the waterproofing modification method adopted in this study is simple and cost-effective; the water contact angle achieved is significantly higher than the range reported for the cement-based surface coated with a waterproofing agent (120.99–128.76°) [51], and also considerably exceeds the value for the geopolymer composite with an incorporated hydrophobic agent (115.35°) [53].

4.2.6. UV Aging Behavior

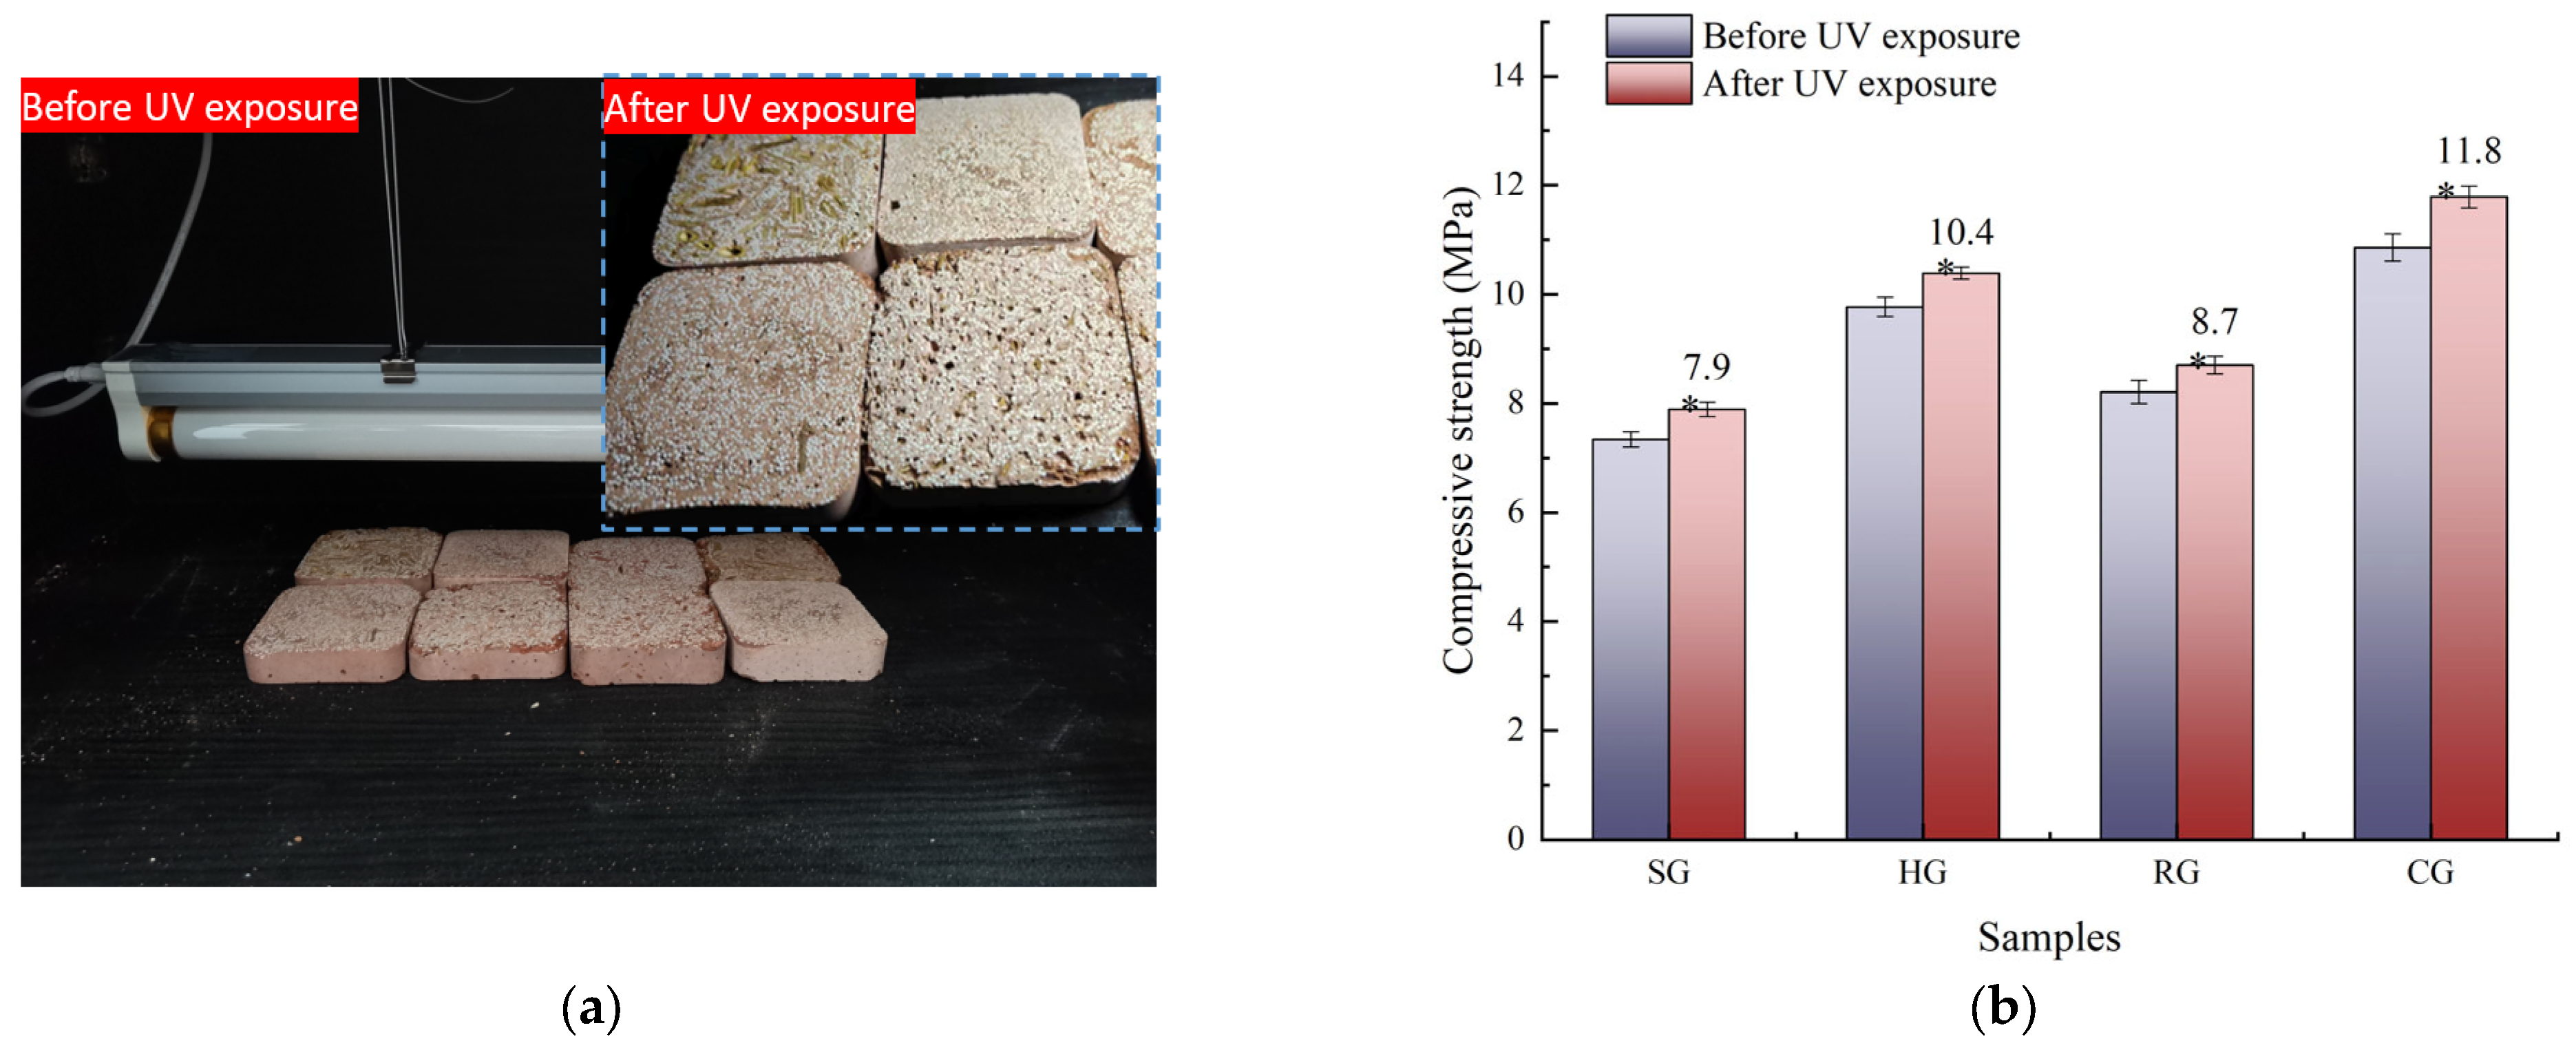
Figure 11a shows the appearance of the samples before and after UV exposure. There was no discoloration, cracking, or other noticeable changes in surface morphology after exposure in the UV aging chamber. This indicates that the geopolymer, biomass, and EPS all possess good UV resistance. Furthermore, the biomass and EPS, when encapsulated within the geopolymer matrix, may experience reduced direct impact from ultraviolet radiation.
Furthermore, an interesting phenomenon is observed: as shown in Figure 11b, the compressive strength of the samples increases after UV exposure. A paired t-test confirmed that this increase is statistically significant for all formulations (p < 0.05). Specifically, the compressive strengths of the SG, HG, RG, and CG samples increase from 7.3 MPa to 7.9 MPa (+8.2%), from 9.8 MPa to 10.4 MPa (+6.1%), from 8.2 MPa to 8.7 MPa (+6.1%), and from 10.9 MPa to 11.8 MPa (+8.3%), respectively. The observed strength enhancement may be attributed to two possible reasons. On the one hand, the sustained mild-temperature exposure at 45 ± 2 °C (inherently generated by the radiant heat of the UV lamps) may facilitate further densification of the geopolymer network through continued polycondensation. On the other hand, as discussed by Sun et al. [54], prolonged UV irradiation may also induce additional crosslinking within the geopolymer gel structure. However, due to the coupled nature of UV irradiation and thermal exposure in the current setup, it is difficult to determine the dominant contribution of these two factors. Comparative tests are needed in the next study for a more rigorous distinction. Nevertheless, the composites exhibit good UV resistance and show potential for application in high-altitude regions.

4.3. Comparison of Biomass/EPS Lightweight Geopolymer Composites with Other Insulation Materials

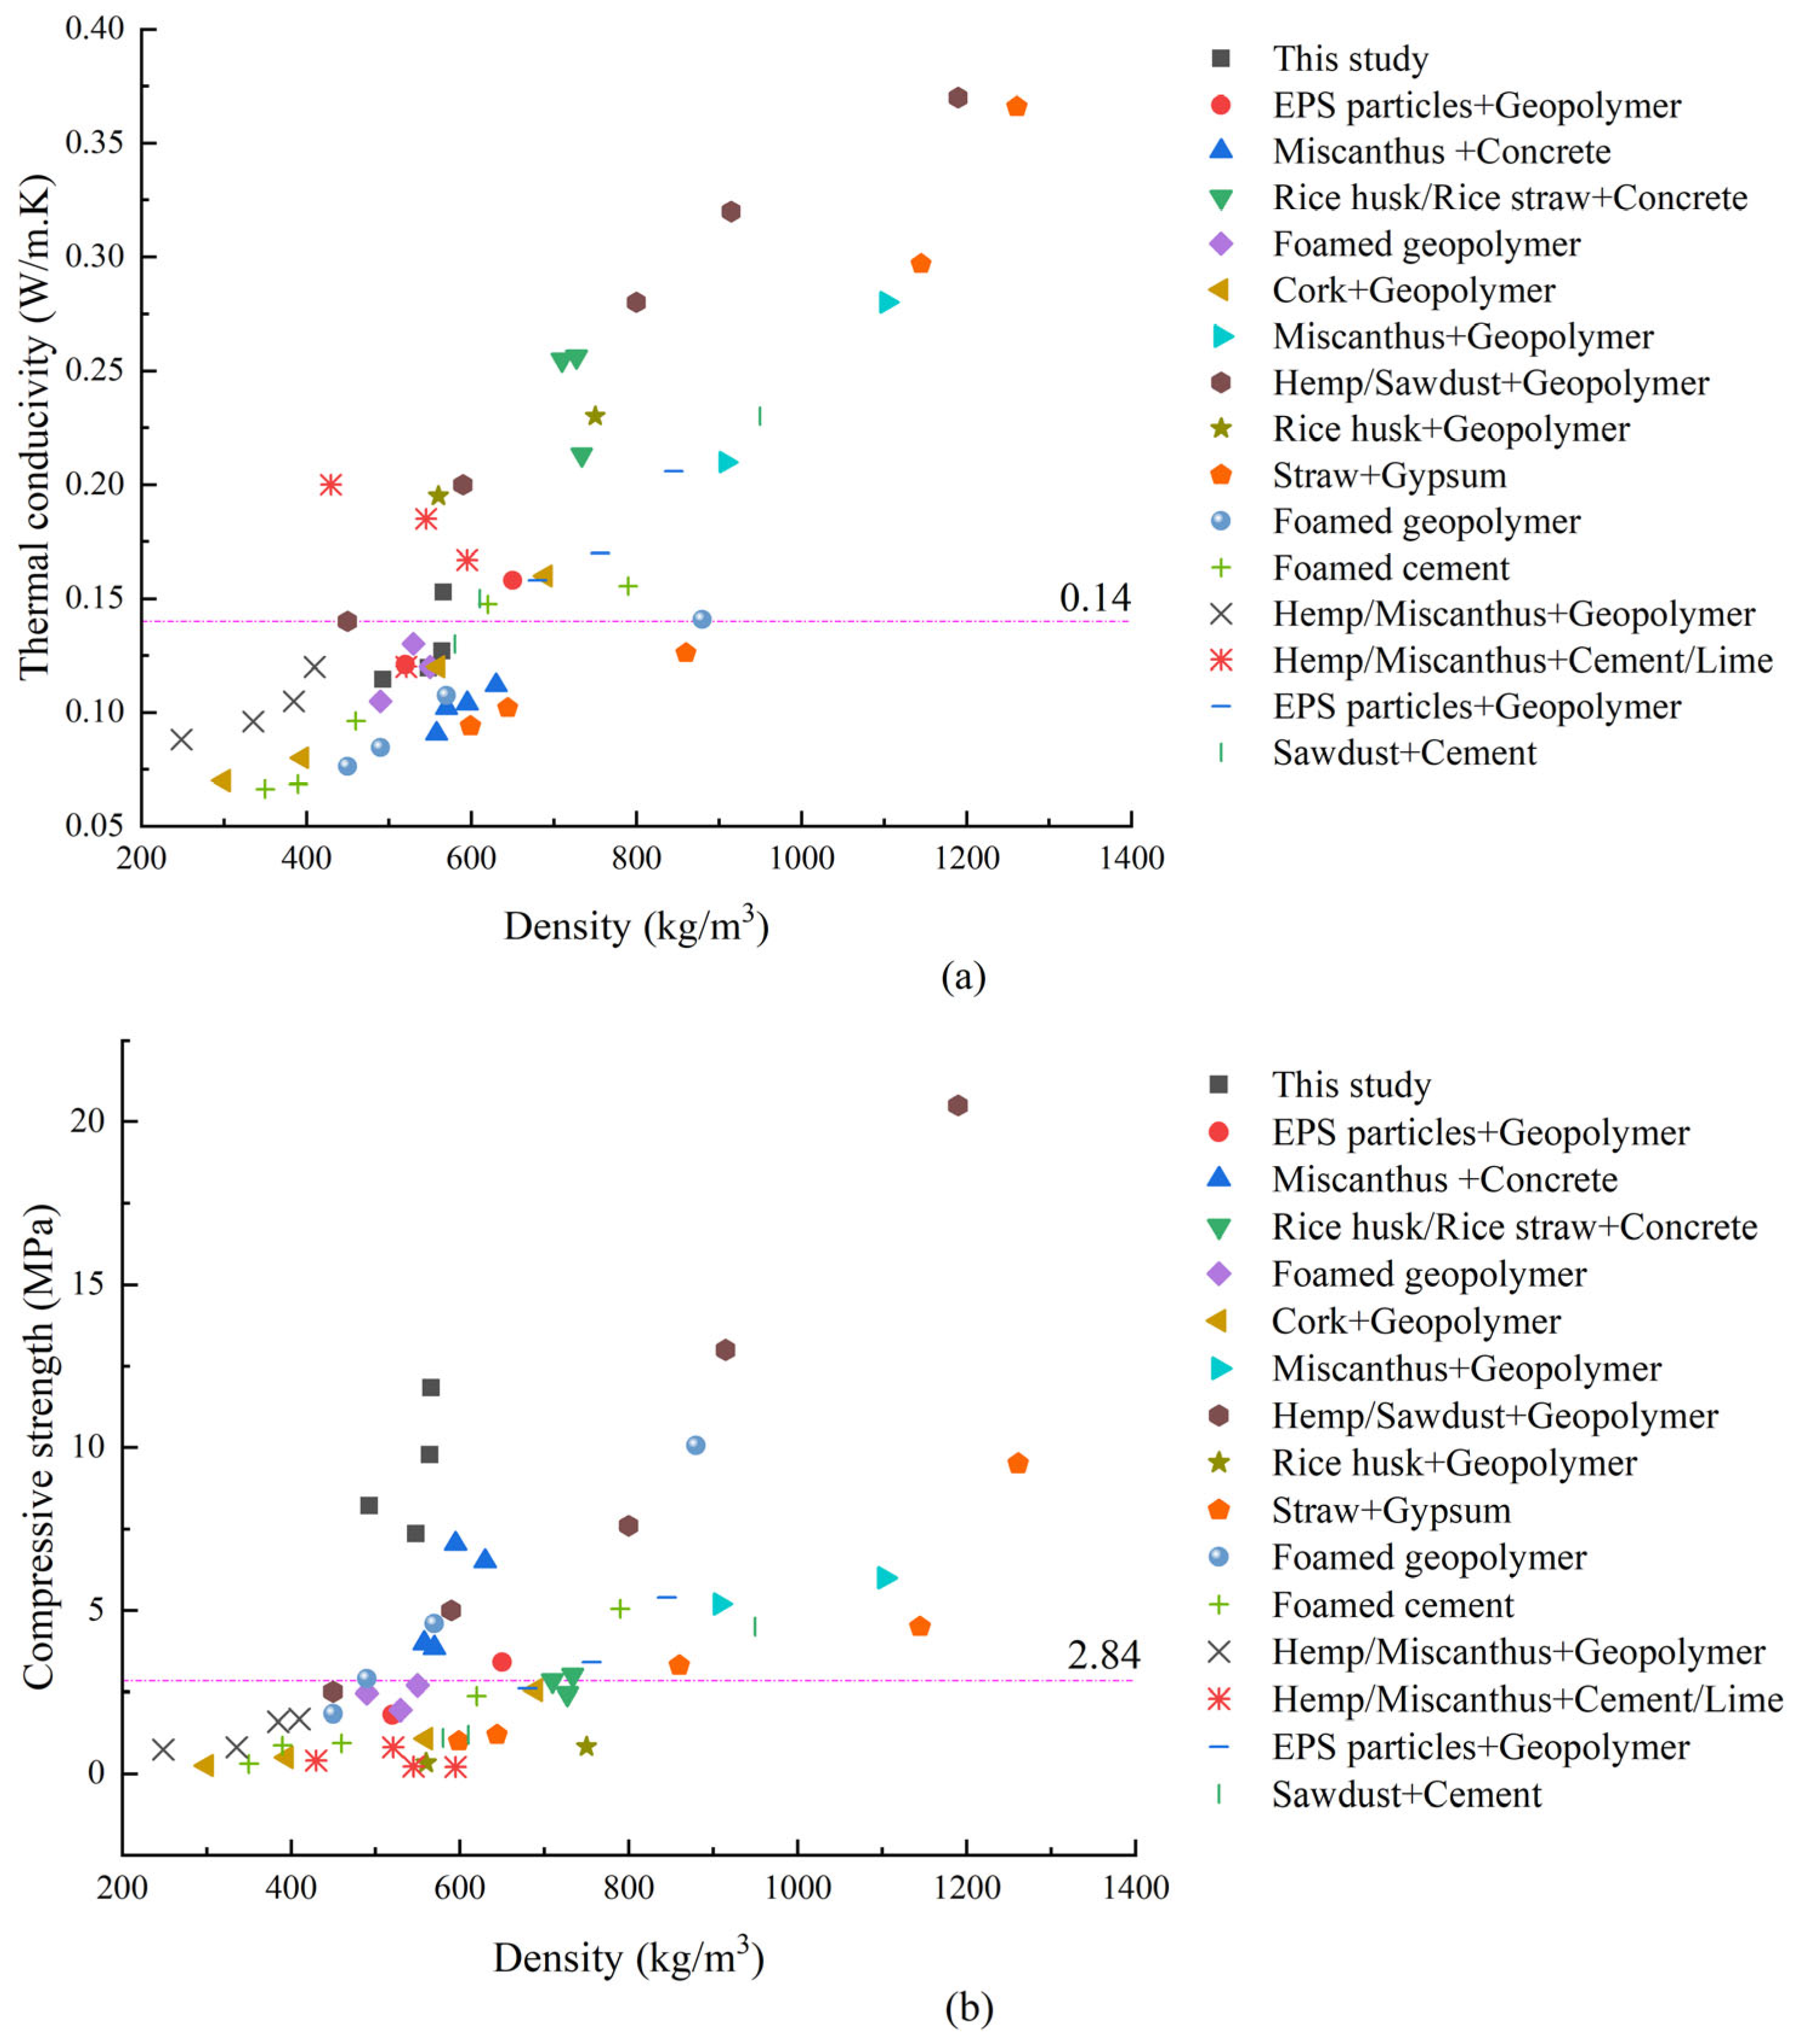
To further evaluate the potential of the composites prepared in this study, their key physical parameters are compared with data on related composites reported in the literature [4,5,6,7,19,20,50,54,55,56,57,58,59,60]. For a systematic comparison, the selected reference materials are categorized into three groups: (1) composites using the same or similar biomass as the primary lightweight aggregate; (2) composites with EPS particles as the main lightweight aggregate; and (3) composites formed by direct foaming without added aggregates. All these composites use one type of inorganic binder (e.g., geopolymers, concrete, cement, or gypsum) as the matrix. The relationships of density with thermal conductivity and compressive strength for these composites are shown in Figure 12a and Figure 12b, respectively.
As shown in Figure 12, both the thermal conductivity and compressive strength of the composites increase with density. Compared with low-foam lightweight porous systems (e.g., foamed geopolymer and foamed cement), the composites developed in this study exhibit comparable thermal conductivity (0.12–0.1555 W/(m·K) [54,58] but significantly higher compressive strength (7.3–10.9 MPa) than those reported in previous studies (2.7–10.05 MPa) [54,58]. Similarly, the compressive strength of the composites produced in this study is also higher than that of composites containing EPS particles [55,60]. However, in biomass-aggregate composites, some earlier works achieved extremely low thermal conductivity (0.0663–0.1075 W/(m·K)) by incorporating high dosages of lightweight biomass. While this effectively lowers thermal conductivity, it excessively weakens the matrix skeleton, resulting in markedly reduced strength (0.25–2.55 MPa) [5,7]. Therefore, in the present work, EPS particles with low thermal conductivity are used to form closed-cell structures, while biomass fibers serve as reinforcing aggregates. This approach not only maintains a relatively low thermal conductivity but also substantially enhances the mechanical performance of the composites.
In summary, the thermal conductivity of the biomass/EPS lightweight geopolymer composites prepared in this study is predominantly near or below the median value (0.14 W/(m·K)), indicating that their thermal insulation performance exceeds that of at least 50% of the reference samples. Moreover, their compressive strength is significantly higher than the overall sample median (2.84 MPa). These results demonstrate that the developed bio-based composites provide a feasible approach to achieving high-performance materials that integrate thermal insulation with structural functionality. However, research on the application of bio-based composites in building insulation is still scarce. Furthermore, systematic investigations into their long-term durability [61] (particularly under wetting-drying and freeze–thaw cycles) are essential prior to practical application and will be a key focus of our future work.

4.4. Carbon Emission and Cost Analysis of Biomass/EPS Lightweight Geopolymer Composites

The biomass/EPS lightweight geopolymer composite developed in this study is further evaluated to assess its potential as a competitive low-carbon building material, including a calculation of the carbon emissions and cost for four sample types. The CO2 emissions and production costs were calculated using the method described in Section 3.8.
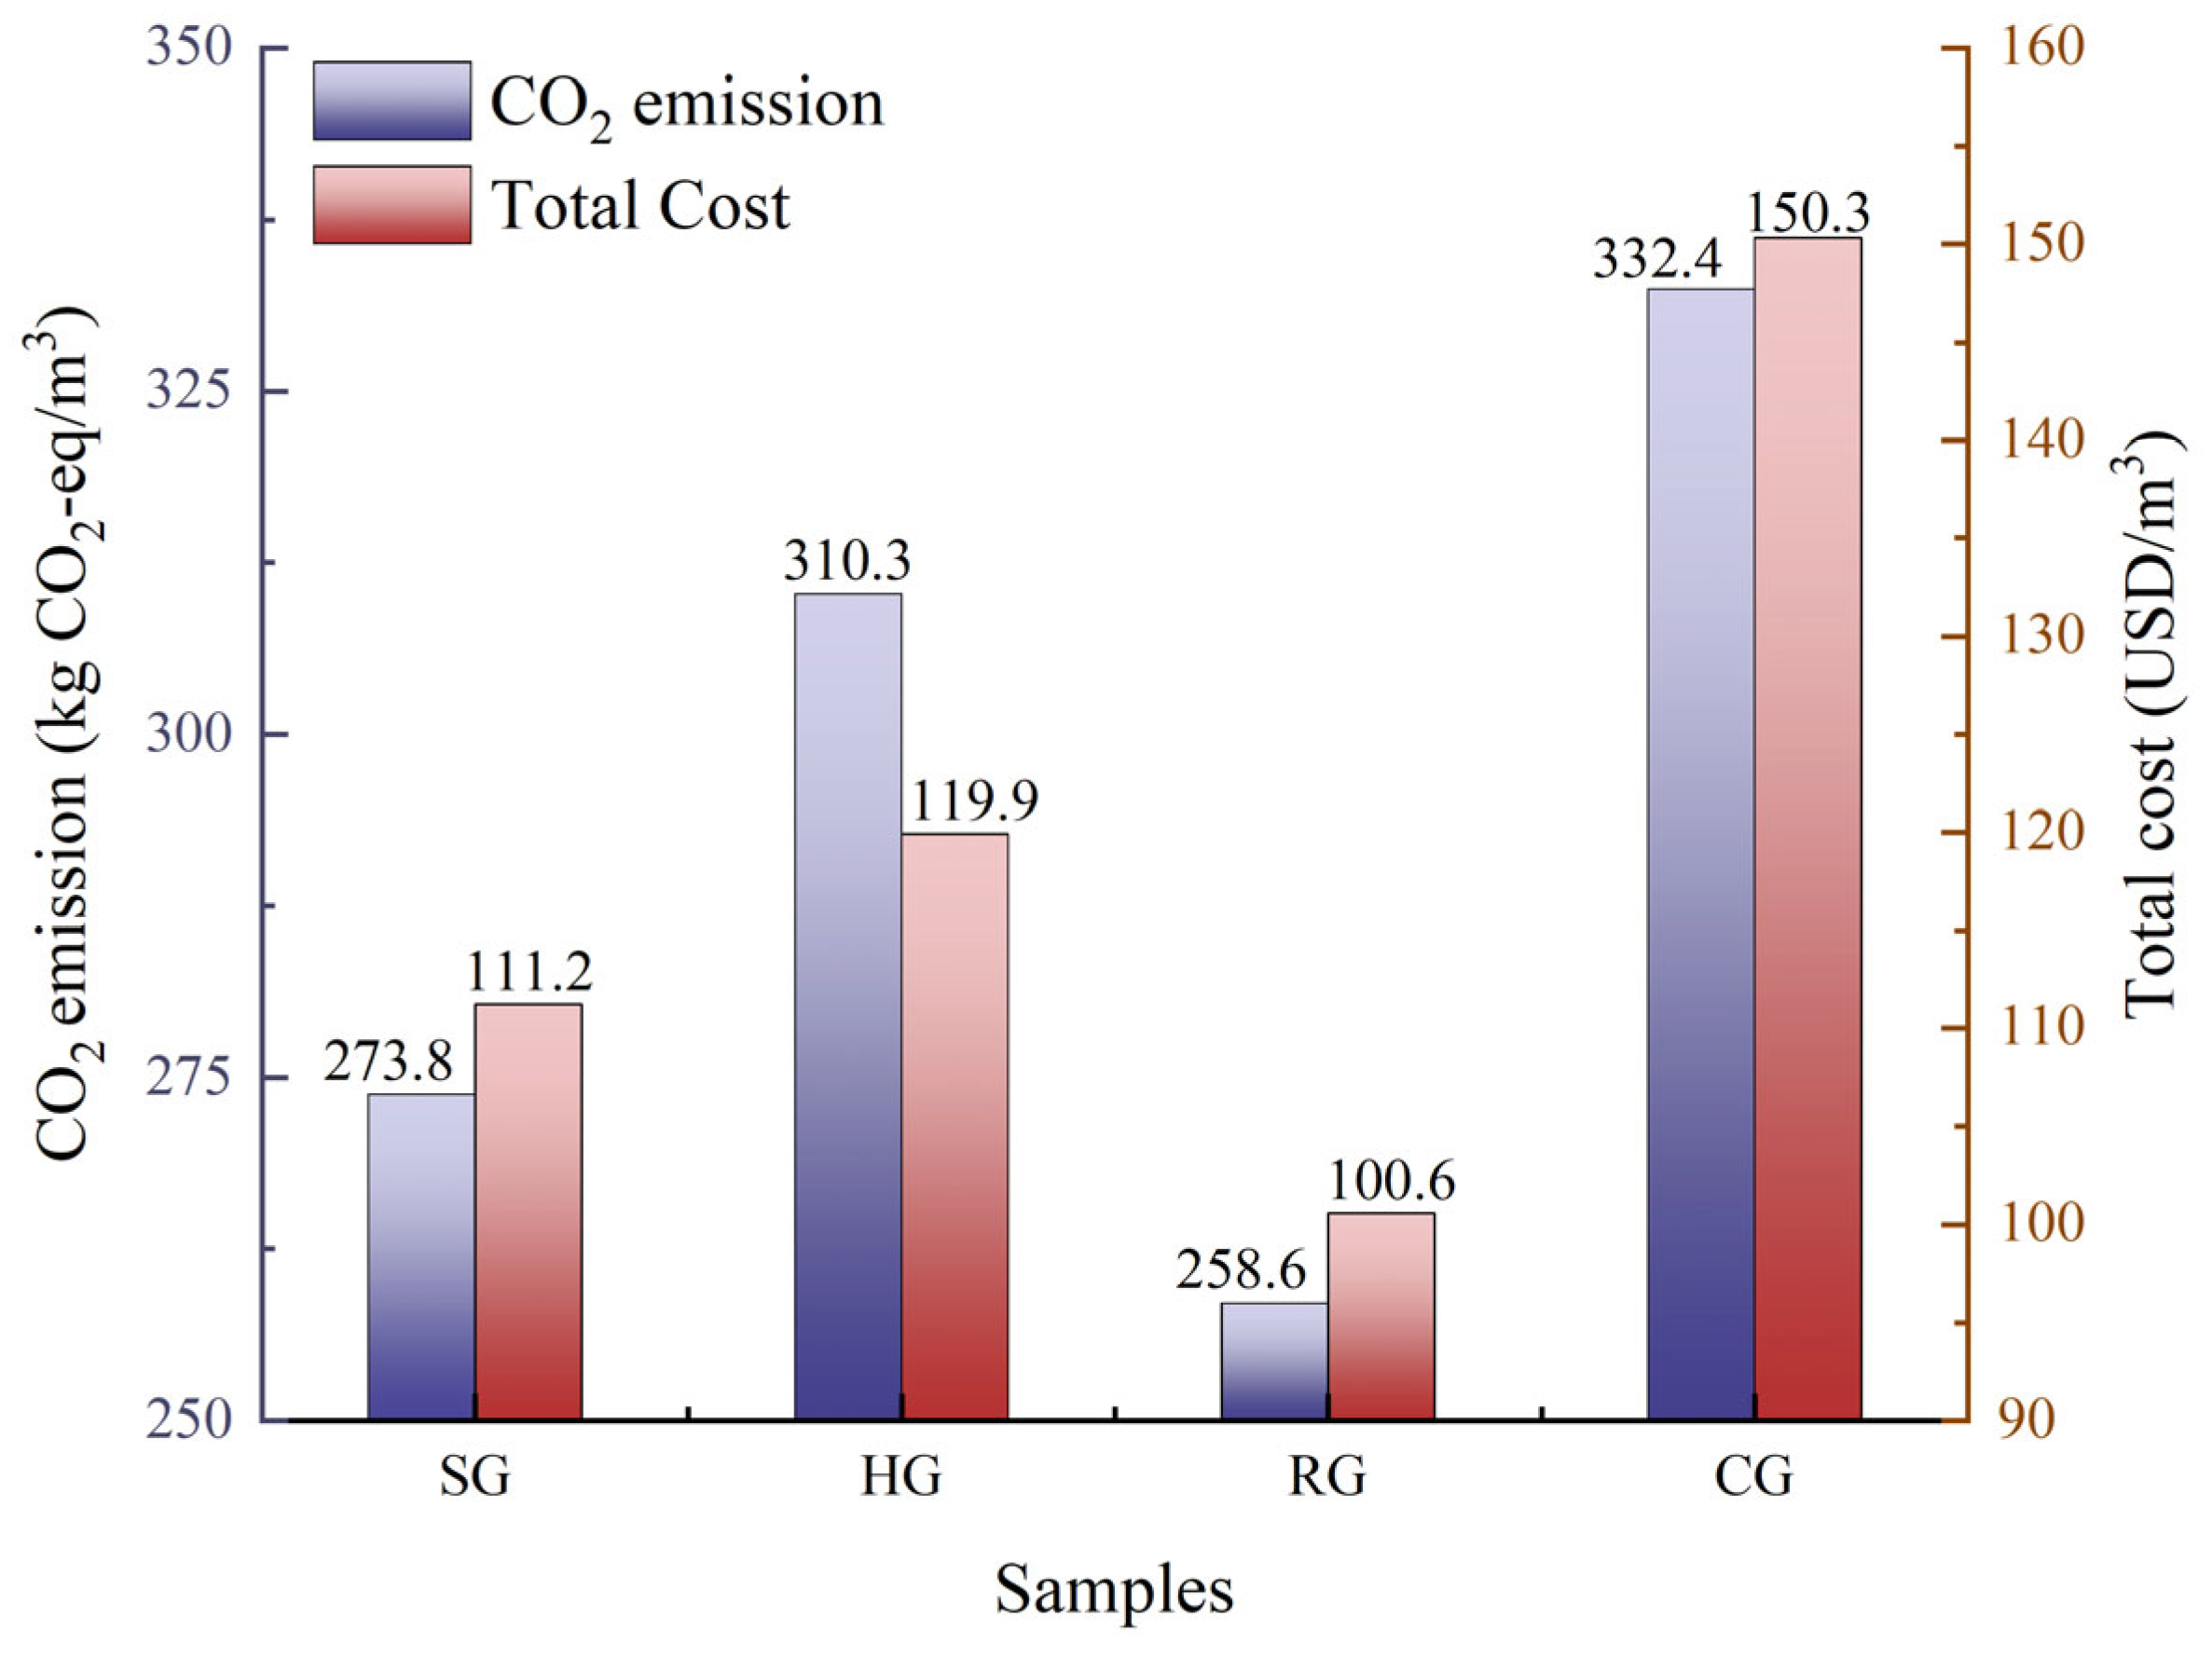
The results are presented in Figure 13. It can be seen that the CO2 emissions of the four samples (SG, HG, RG, and CG) are 273.8, 310.3, 258.6, and 332.4 kg CO2-eq/m3, respectively. Compared to studies where carbon emissions are also attributed solely to the production of the constituent raw materials (cradle-to-gate), the values obtained in this work are significantly lower; specifically, the emissions are far below those reported for the production of common insulation materials such as extruded polystyrene (XPS, ~400 kg CO2-eq/m3) and rock wool (~432 kg CO2-eq/m3) [19]. Furthermore, they are also lower than the carbon footprints of foamed geopolymers made from agricultural/industrial waste (393.2 kg CO2-eq/m3; 0.52 W/(m·K) at 1.45 MPa) reported by Shilar et al. [62]. Moreover, the composite developed in this study exhibits an even lower thermal conductivity. It should be noted that the reported CO2 footprint (258.6–332.4 kg CO2-eq/m3) is based on a cradle-to-gate assessment that excludes transportation and handling. The environmental advantage of the proposed composites is most pronounced when waste materials are sourced locally; long-distance transport would partially offset the emission savings achieved through waste utilization. In addition, sodium hydroxide has the highest emission factor among all raw materials (2.04 kg CO2-eq/kg). However, the total CO2 footprint per cubic meter depends not only on emission factors but also on material dosages. The cradle-to-gate calculation reveals that sodium silicate is actually the largest contributor to total emissions due to its relatively high dosage. This finding demonstrates the value of adopting such a system boundary, as it enables quantitative identification of dominant emission sources and provides a clear direction for low-carbon optimization of future composite production.
In terms of economic performance, the developed composite also exhibits a significant cost advantage. As shown in Figure 13, the total costs for the four samples are 111.2, 119.9, 100.6, and 150.3 USD/m3, respectively. The prices are substantially lower than those of extruded polystyrene insulation board (304.23 USD/m3), rock wool (716.1 USD/m3) [63], and lightweight cementitious composite (738–850 USD/m3) [24]. They are also below the cost of the geopolymer foam (156.12 USD/m3) with a similar thermal conductivity (0.14 W/(m·K)) reported in Matalkah’s study [63]. And they are also comparable to the prices of sustainable geopolymer composites (104.06–108.05 USD/m3) in Akgun’s research [29], as both utilize waste materials as the primary aggregates.
Overall, the findings demonstrate that the newly developed biomass/EPS lightweight geopolymer composite is highly attractive from a market competitiveness perspective, given its dual advantages of low carbon emissions and cost. Moreover, this novel composite promotes the valorization of agricultural, forestry, and industrial wastes while reducing the consumption of virgin natural resources.

5. Conclusions

In this work, a novel lightweight geopolymer composite containing recycled agroforestry waste and EPS was prepared, and its key physical properties were characterized to evaluate its potential for building insulation applications. Based on the results, the main conclusions are summarized as follows:
(1) One-way ANOVA confirmed that biomass type significantly influences the composite performance (p < 0.001). The composites exhibit an open porosity of 59.9–65.7%, a thermal conductivity of 0.115–0.142 W/(m·K), a density of 492.9–586.3 kg/m3, and a compressive strength of 7.3–10.9 MPa.
(2) The composites are initially hydrophilic, with static water contact angles below 90° and total water uptake in the range of 35.2–42.2%, reflecting the moisture sensitivity of the biomass aggregates. After hydrophobic modification, the contact angles significantly increased to above 140° for all formulations, approaching a near-superhydrophobic state.
(3) After prolonged UV exposure, the compressive strength of the composites increased by 6.1–8.3%, and a paired t-test confirmed the statistical significance of this increase (p < 0.05). The enhancement may be attributed to thermal post-curing, UV-induced crosslinking, or their combined effect.
(4) The lightweight geopolymer composite shows promising environmental and economic performance, with a carbon footprint of 258.6–332.4 kg CO2-eq/m3 (cradle-to-gate, excluding transportation and site-related processes) and an estimated cost of 100.6–150.3 USD/m3.
The novel lightweight geopolymer insulation composite exhibits excellent overall performance and can serve as an eco-friendly replacement for traditional building insulation materials. Furthermore, its substantial utilization of recycled agroforestry waste and EPS beads significantly reduces the environmental footprint, enhancing its sustainability profile.

Supplementary Materials

The following supporting information can be downloaded at: https://www.mdpi.com/article/10.3390/buildings16153136/s1, Video S1: SG-unmodified-video (water contact angle); Video S2: RG-unmodified-video (water contact angle); Video S3: HG-unmodified-video (water contact angle); Video S4: CG-unmodified-video (water contact angle).

Author Contributions

Methodology, S.W.; Validation, C.C.; Investigation, Z.T.; Resources, K.L. and H.H.; Data curation, T.W.; Writing—original draft, T.W., S.W. and Z.T.; Writing—review & editing, K.L.; Visualization, C.C.; Supervision, H.H. and H.L.; Funding acquisition, S.W. and H.L. All authors have read and agreed to the published version of the manuscript.

Funding

This research was supported by the contribution of the Jiangsu University of Science and Technology Research Startup Fund and the National Natural Science Foundation of China (No. 52076070).

Data Availability Statement

The data presented in this study are available on request from the corresponding author due to privacy.

Conflicts of Interest

The authors declare no conflict of interest.

References

  1. Song, Y.; Xue, C.; Guo, W.; Bai, Y.; Shi, Y.; Zhao, Q. Foamed geopolymer insulation materials: Research progress on insulation performance and durability. J. Clean. Prod. 2024, 444, 140991. [Google Scholar] [CrossRef] [Scilit]
  2. Wang, F.; Zhai, J.; Ding, Y.; Nishiwaki, T.; Yu, J.; Li, V.C.; Yu, K. Design-driven approach for engineered geopolymer composite with recorded low fiber content. Compos. Part B Eng. 2024, 287, 111834. [Google Scholar] [CrossRef] [Scilit]
  3. Liang, G.; Liu, T.; Li, H.; Wu, K. Shrinkage mitigation, strength enhancement and microstructure improvement of alkali-activated slag/fly ash binders by ultrafine waste concrete powder. Compos. Part B Eng. 2022, 231, 109570. [Google Scholar] [CrossRef] [Scilit]
  4. Nasreddine, H.; Salem, T.; Djerbi, A.; Dujardin, N.; Gautron, L. Enhanced thermal insulation behavior of metakaolin-based geopolymer reinforced by miscanthus fibers. Appl. Clay Sci. 2024, 258, 107496. [Google Scholar] [CrossRef] [Scilit]
  5. Alves, Z.; Carvalheiras, J.; Senff, L.; Lacasta, A.M.; Cantalapiedra, I.R.; Labrincha, J.A.; Novais, R.M. A comparison between the use of cork and synthetic aggregates in the production of geopolymer composites. Constr. Build. Mater. 2024, 438, 137147. [Google Scholar] [CrossRef] [Scilit]
  6. Nasreddine, H.; Djerbi, A.; Salem, T.; Dujardin, N.; Gautron, L. Impact of bio-sourced material type and content on thermal insulation and mechanical strength of geopolymer composites. Constr. Build. Mater. 2024, 452, 138932. [Google Scholar] [CrossRef] [Scilit]
  7. Narattha, C.; Wattanasiriwech, S.; Wattanasiriwech, D. Sustainable, multifunctional fly ash geopolymer composite with rice husk aggregates for improved acoustic, hygric, and thermal performance. Constr. Build. Mater. 2024, 445, 137743. [Google Scholar] [CrossRef] [Scilit]
  8. Singh, S.; Dalbehera, M.M.; Maiti, S.; Bisht, R.S.; Balam, N.B.; Panigrahi, S.K. Investigation of agro-forestry and construction demolition wastes in alkali-activated fly ash bricks as sustainable building materials. Waste Manag. 2023, 159, 114–124. [Google Scholar] [CrossRef] [Scilit] [PubMed]
  9. Türkel, İ.; Özkan, İ.G.M.; Baltaoğlu, E.; Benli, A.; Bayraktar, O.Y.; Özel, H.B.; Şevik, H.; Kaplan, G. Enhancing thermal insulation, mechanical strength, and durability of one-part fly ash-based geopolymer foam concrete using lime and mahogany sawdust. Constr. Build. Mater. 2025, 491, 142656. [Google Scholar] [CrossRef] [Scilit]
  10. Zhang, N.; Wang, B.; Yue, D.; Pan, D.; Wang, H.; Li, J.; Zhang, Y. Waste liquid-added regeneration activator to enhance the pore structure and compressive strength of geopolymer-foam-fiber: A sustainable strategy of kenaf fiber pretreatment and reuse. Process Saf. Environ. Prot. 2023, 170, 536–544. [Google Scholar] [CrossRef] [Scilit]
  11. Li, Z.; Chen, W.; Hao, H.; Khan, M.Z.N.; Pham, T.M. Dynamic compressive properties of novel lightweight ambient-cured EPS geopolymer composite. Constr. Build. Mater. 2021, 273, 122044. [Google Scholar] [CrossRef] [Scilit]
  12. Prasittisopin, L.; Termkhajornkit, P.; Kim, Y.H. Review of concrete with expanded polystyrene (EPS): Performance and environmental aspects. J. Clean. Prod. 2022, 366, 132919. [Google Scholar] [CrossRef] [Scilit]
  13. Ali, A.Y.F.; Ahmed, S.A.; El-Feky, M.S. Alkali-activated concrete with expanded polystyrene: A lightweight, high-strength solution for fire resistance and explosive protection. J. Build. Eng. 2025, 99, 111648. [Google Scholar] [CrossRef] [Scilit]
  14. Rofdi, M.I.; Tamat, N.S.M.; Nuryawan, A.; Sakagami, H.; Hermawan, A. Studies on particleboard production using Expanded Polystyrene (EPS) waste as a binder for construction applications. Constr. Build. Mater. 2024, 449, 138279. [Google Scholar] [CrossRef] [Scilit]
  15. Montalvo-Romero, N.; Montiel-Rosales, A.; Fernández-Lambert, G.; Fernández-Echeverría, E. Development of an Adhesive Based on Waste Management as a Mechanism Towards Sustainability. Sustainability 2022, 14, 13225. [Google Scholar] [CrossRef] [Scilit]
  16. Wang, S.; Li, H.; Zou, S.; Liu, L.; Bai, C.; Zhang, G.; Fang, L. Experimental study on durability and acoustic absorption performance of biomass geopolymer-based insulation materials. Constr. Build. Mater. 2022, 361, 129575. [Google Scholar] [CrossRef] [Scilit]
  17. Wang, S.; Li, H.; Liu, L. Development of a multifunctional bio-based insulation material with corncob and silica aerogel. Energy Build. 2024, 323, 114817. [Google Scholar] [CrossRef] [Scilit]
  18. GB/T 10295; Thermal insulation-Determination of Steady-State Thermal Resistance and Related Properties—Heat Flow Meter Apparatus. Standardization Administration of the People’s Republic of China: Beijing, China, 2008.
  19. Nasreddine, H.; Salem, T.; Djerbi, A.; Dujardin, N.; Gautron, L. Gautron, Durability and hygrothermal performance of metakaolin-based geopolymer composites reinforced with hemp shiv and miscanthus fibers. Constr. Build. Mater. 2025, 494, 143461. [Google Scholar] [CrossRef] [Scilit]
  20. Affan, H.; El Haddaji, B.; Ajouguim, S.; Khadraoui, F. Comparative analysis of bio-based insulation materials with low-carbon binders: Mechanical, hygrothermal, and durability performance. Case Stud. Constr. Mater. 2025, 22, e04915. [Google Scholar] [CrossRef] [Scilit]
  21. EN ISO 29767; Thermal Insulating Products for Building Applications—Determination of Short-Term Water Absorption by Partial Immersion. ISO: Geneva, Switzerland, 2019.
  22. De Silva, G.S.; Naveen, P. Naveen, Effect of rice husk ash and coconut coir fiber on cement mortar: Enhancing sustainability and efficiency in buildings. Constr. Build. Mater. 2024, 440, 137326. [Google Scholar] [CrossRef] [Scilit]
  23. Pandey, V.; Panda, S.K.; Singh, V.K. Preparation and characterization of high-strength insulating porous bricks by reusing coal mine overburden waste, red mud and rice husk. J. Clean. Prod. 2024, 469, 143134. [Google Scholar] [CrossRef] [Scilit]
  24. Shen, Q.; Lu, C.; Zhang, Z.; Abdalla, J.A.; Hawileh, R.A.; Zhang, X. Tailoring sustainable lightweight insulating ECC for structural use via incorporating recycled expanded polystyrene: Microstructural and mechanical properties. J. Clean. Prod. 2025, 530, 146867. [Google Scholar] [CrossRef] [Scilit]
  25. Zhao, J.; Wang, X.; Li, S.; Tang, Y. Development and performance evaluation of ultra-lightweight geopolymer foam insulation material. J. Build. Eng. 2024, 98, 111222. [Google Scholar] [CrossRef] [Scilit]
  26. Farizal, F.; Amanda, T.; Dachyar, M.; Noor, Z.Z. 2030 oil palm plantation carbon footprint estimation using O-LCA and forecasting. J. Clean. Prod. 2024, 463, 142646. [Google Scholar] [CrossRef] [Scilit]
  27. Abdellatief, M.; Ahmed, Y.M.; Taman, M.; Elfadaly, E.; Tang, Y.; Abadel, A.A. Physico-mechanical, thermal insulation properties, and microstructure of geopolymer foam concrete containing sawdust ash and egg shell. J. Build. Eng. 2024, 90, 109374. [Google Scholar] [CrossRef] [Scilit]
  28. Bi, H.; Tang, Z.; Wang, F.; Li, L.; Mirzaev, B.; Yu, K.; Liu, L. Sustainable one-part engineered geopolymer composite with thermal insulation in coastal region: Utilizing red mud dual-function as precursor and activator. Case Stud. Constr. Mater. 2025, 23, e04998. [Google Scholar] [CrossRef] [Scilit]
  29. Akgun, I.O.; Uysal, M.; Yilmaz, M. Sustainable geopolymer composites incorporating waste volcanic tuff and recycled geopolymer concrete powder as base materials. Constr. Build. Mater. 2026, 509, 145161. [Google Scholar] [CrossRef] [Scilit]
  30. Tang, Z.; Li, Z.; Hua, J.; Lu, S.; Chi, L. Enhancing the damping properties of cement mortar by pretreating coconut fibers for weakened interfaces. J. Clean. Prod. 2022, 379, 134662. [Google Scholar] [CrossRef] [Scilit]
  31. Kim, D.; Lee, M.; Shin, Y.; Lee, J.; Lee, Y.-J.; Lee, J.W. Comparative techno-economic analysis and life cycle assessment of styrene monomer production from conventional route and waste polystyrene pyrolysis. Chem. Eng. J. 2025, 525, 170034. [Google Scholar] [CrossRef] [Scilit]
  32. Elehinafe, F.B.; Adisa, H.A.; Adesina, A.; Okedere, O.B.; Unen, U.E. Economic potentials of pyro bio-oil production from sawdust generated by southwest, Nigeria—A simulation-based approach. Case Stud. Chem. Environ. Eng. 2024, 9, 100590. [Google Scholar] [CrossRef] [Scilit]
  33. Murugan, D.K.; Said, Z.; Shankaranarayanan, S.; Dhamodaran, G.; Dayakar, C.V. Experimental validation; support vector machine optimization of rice husk gasification for sustainable syngas production and dual-fuel engine application. Results Eng. 2025, 28, 108345. [Google Scholar] [CrossRef] [Scilit]
  34. de Assis Castro, R.C.; Camacho, C.E.C.; Roberto, I.C.; Mussatto, S.I. Techno-economic assessment of rice straw biorefineries to produce ethanol with co-production of xylitol and phenolic acids. Biomass Bioenergy 2025, 197, 107804. [Google Scholar] [CrossRef] [Scilit]
  35. Huang, D. Thermal insulation performances of carbonized sawdust packed bed for energy saving in buildings. Energy Build. 2022, 254, 111625. [Google Scholar] [CrossRef] [Scilit]
  36. Wang, S.; Li, H.; Zhang, X. A Preliminary Investigation on the Adsorption of Cu2+ by Sawdust/Foamed Geopolymer Composites. Buildings 2025, 15, 2251. [Google Scholar] [CrossRef] [Scilit]
  37. Abobakr, H.; Kakou, C.A.; Bensalah, M.O.; Bouhfid, R.; Qaiss, A.E.K.; Raji, M. Development of lightweight insulation particleboard with superior thermo-mechanical and acoustic properties based on rice husks. J. Build. Eng. 2025, 104, 112289. [Google Scholar] [CrossRef] [Scilit]
  38. Yin, X.; Lawrence, M.; Maskell, D.; Ansell, M. Comparative micro-structure and sorption isotherms of rice straw and wheat straw. Energy Build. 2018, 173, 11–18. [Google Scholar] [CrossRef] [Scilit]
  39. Xu, S.; Zeng, Z.; Liang, J.; Wen, S.; Zhou, Y.; Zhou, C. Honeycomb-inspired coir fiber concrete wall with enhanced thermal insulation and soundproofing properties. J. Build. Eng. 2025, 113, 114086. [Google Scholar] [CrossRef] [Scilit]
  40. Ru, S.; Zhang, X.; Yang, R.; Zhang, Y.; Yang, S. Sustainable extraction of high-quality coconut husk fibers: A comparative study of chemical, boiling, and physical methods. Food Bioprod. Process. 2025, 154, 449–464. [Google Scholar] [CrossRef] [Scilit]
  41. Huang, F.; He, J.; Peng, D.; Fu, S. An experimental investigation on the mechanical and thermal characteristics of eco-friendly concrete with coconut shell aggregate and coir fiber as reinforcement. Constr. Build. Mater. 2025, 498, 144012. [Google Scholar] [CrossRef] [Scilit]
  42. Char, M.; Khrissi, Y.; Tilioua, A. Development of ecological thermal insulation materials based on renewable natural fiber waste and gum Arabic: Experimental study and characterization for use in semi-arid climates. Results Eng. 2025, 27, 106510. [Google Scholar] [CrossRef] [Scilit]
  43. Özkan, İ.G.M.; Aldemir, K.; Alhasan, O.; Benli, A.; Bayraktar, O.Y.; Yılmazoğlu, M.U.; Kaplan, G. Investigation on the sustainable use of different sizes of sawdust aggregates in eco-friendly foam concretes: Physico-mechanical, thermal insulation and durability characteristics. Constr. Build. Mater. 2024, 438, 137100. [Google Scholar] [CrossRef] [Scilit]
  44. Lazorenko, G.; Denisov, S.; Goryajnov, D.; Tsvetkov, S.; Kasprzhitskii, A. Tensile strength, thermal conductivity and abrasion resistance of natural fiber-reinforced fly ash-based geopolymer composites produced with flax tow. Constr. Build. Mater. 2025, 493, 143275. [Google Scholar] [CrossRef] [Scilit]
  45. Ma, B.; Zhu, Z.; Huo, W.; Yang, L.; Zhang, Y.; Sun, H.; Zhang, X. Assessing the viability of a high performance one-part geopolymer made from fly ash and GGBS at ambient temperature. J. Build. Eng. 2023, 75, 106978. [Google Scholar] [CrossRef] [Scilit]
  46. Wang, H.; Ouyang, S.; Lv, Y.; Chen, S.; Zhai, Z.; Wang, D.; Jin, W. Mechanical properties and microstructural mechanism of ternary geopolymer cementitious materials based on molybdenum tailings, red mud and GGBS. Constr. Build. Mater. 2026, 520, 145938. [Google Scholar] [CrossRef] [Scilit]
  47. Sayadi, A.A.; Tapia, J.V.; Neitzert, T.R.; Clifton, G.C. Effects of expanded polystyrene (EPS) particles on fire resistance, thermal conductivity and compressive strength of foamed concrete. Constr. Build. Mater. 2016, 112, 716–724. [Google Scholar] [CrossRef] [Scilit]
  48. Liu, L.; Zou, S.; Li, H.; Deng, L.; Bai, C.; Zhang, X.; Wang, S.; Li, N. Experimental physical properties of an eco-friendly bio-insulation material based on wheat straw for buildings. Energy Build. 2019, 201, 19–36. [Google Scholar] [CrossRef] [Scilit]
  49. GB/T 50003; Code for Design of Masonry Structures. Ministry of Housing and Urban-Rural Development of the People’s Republic of China: Beijing, China; General Administration of Quality Supervision, Inspection and Quarantine of the People’s Republic of China: Beijing, China, 2011.
  50. Wei, Z.; Gu, K.; Chen, B.; Wang, C. Comparison of sawdust bio-composites based on magnesium oxysulfate cement and ordinary Portland cement. J. Build. Eng. 2023, 63, 105514. [Google Scholar] [CrossRef] [Scilit]
  51. Liu, Z.; Li, S.; Sui, S.; Liu, A.; Geng, Y.; Chen, X.; Jiang, J.; Liu, Y.; Lu, J. Preparation of hydroxylated hexagonal boron nitride/isobutyltriethoxysilane hybrid latices for improved waterproofing performance of cement coating. Constr. Build. Mater. 2023, 404, 133232. [Google Scholar] [CrossRef] [Scilit]
  52. Erkmen, J.; Yavuz, H.I.; Kavci, E.; Sari, M. A new environmentally friendly insulating material designed from natural materials. Constr. Build. Mater. 2020, 255, 119357. [Google Scholar] [CrossRef] [Scilit]
  53. Yakut, R.; Erkmen, J.; Gümüş, M.; Bayrak, H. Effect of using waste ash resulting from tire pyrolysis in hydrophobic geopolymer production on thermal insulation, sound insulation and waterproofing. Therm. Sci. Eng. Prog. 2025, 62, 103646. [Google Scholar] [CrossRef] [Scilit]
  54. Sun, Y.; Yang, B.; Li, X.; Yi, M.; Chen, W.; Wang, K. Comparative study on the thermal and irradiation resistance performance of geopolymers and cement-based foamed materials. J. Build. Eng. 2025, 116, 114699. [Google Scholar] [CrossRef] [Scilit]
  55. Colangelo, F.; Roviello, G.; Ricciotti, L.; Ferrándiz-Mas, V.; Messina, F.; Ferone, C.; Tarallo, O.; Cioffi, R.; Cheeseman, C.R. Mechanical and thermal properties of lightweight geopolymer composites. Cem. Concr. Compos. 2018, 86, 266–272. [Google Scholar] [CrossRef] [Scilit]
  56. Chen, Y.X.; Wu, F.; Yu, Q.; Brouwers, H.J.H. Bio-based ultra-lightweight concrete applying miscanthus fibers: Acoustic absorption and thermal insulation. Cem. Concr. Compos. 2020, 114, 103829. [Google Scholar] [CrossRef] [Scilit]
  57. Pachla, E.C.; Silva, D.B.; Stein, K.J.; Marangon, E.; Chong, W. Sustainable application of rice husk and rice straw in cellular concrete composites. Constr. Build. Mater. 2021, 283, 122770. [Google Scholar] [CrossRef] [Scilit]
  58. Shi, J.; Zhang, M.; Zhu, X.; Yalçınkaya, Ç.; Çopuroğlu, O.; Liu, Y. Evaluation of thermal insulation capacity and mechanical performance of a novel low-carbon thermal insulating foam concrete. Energy Build. 2024, 323, 114744. [Google Scholar] [CrossRef] [Scilit]
  59. Yang, L.; Wang, S.; Yang, L.; Wu, Y.; Liu, Y. Towards net zero carbon buildings: Potential use of gypsum-based highland barley straw concrete in solar energy enrichment area of China. Build. Environ. 2025, 271, 112586. [Google Scholar] [CrossRef] [Scilit]
  60. Wu, Y.; Pan, D.; Liu, X.; Dan, J.; Bian, S.; Li, Y.; Wang, J.; Yang, X. Effect of shell-modified EPS particles on foam geopolymer properties. J. Build. Eng. 2024, 96, 110582. [Google Scholar] [CrossRef] [Scilit]
  61. Ganguly, S. Fundamentals of Aging and Degradation of Polymer Nanocomposites; Woodhead Publishing: Cambridge, UK, 2026; pp. 39–63. [Google Scholar]
  62. Shilar, F.A.; Alqahtani, D.A.; Shilar, M.; Khan, T.M.Y. Valorization of agricultural and industrial wastes in geopolymer foam concrete, a ternary binder approach using corncob ash, red mud, and fly ash. Case Stud. Constr. Mater. 2026, 24, e05716. [Google Scholar] [CrossRef] [Scilit]
  63. Matalkah, F.; Ababneh, A.; Aqel, R. Synthesis of calcined kaolin-based geopolymer foam: Assessment of mechanical properties, thermal insulation, and elevated temperature stability. Ceram. Int. 2023, 49, 9967–9977. [Google Scholar] [CrossRef] [Scilit]
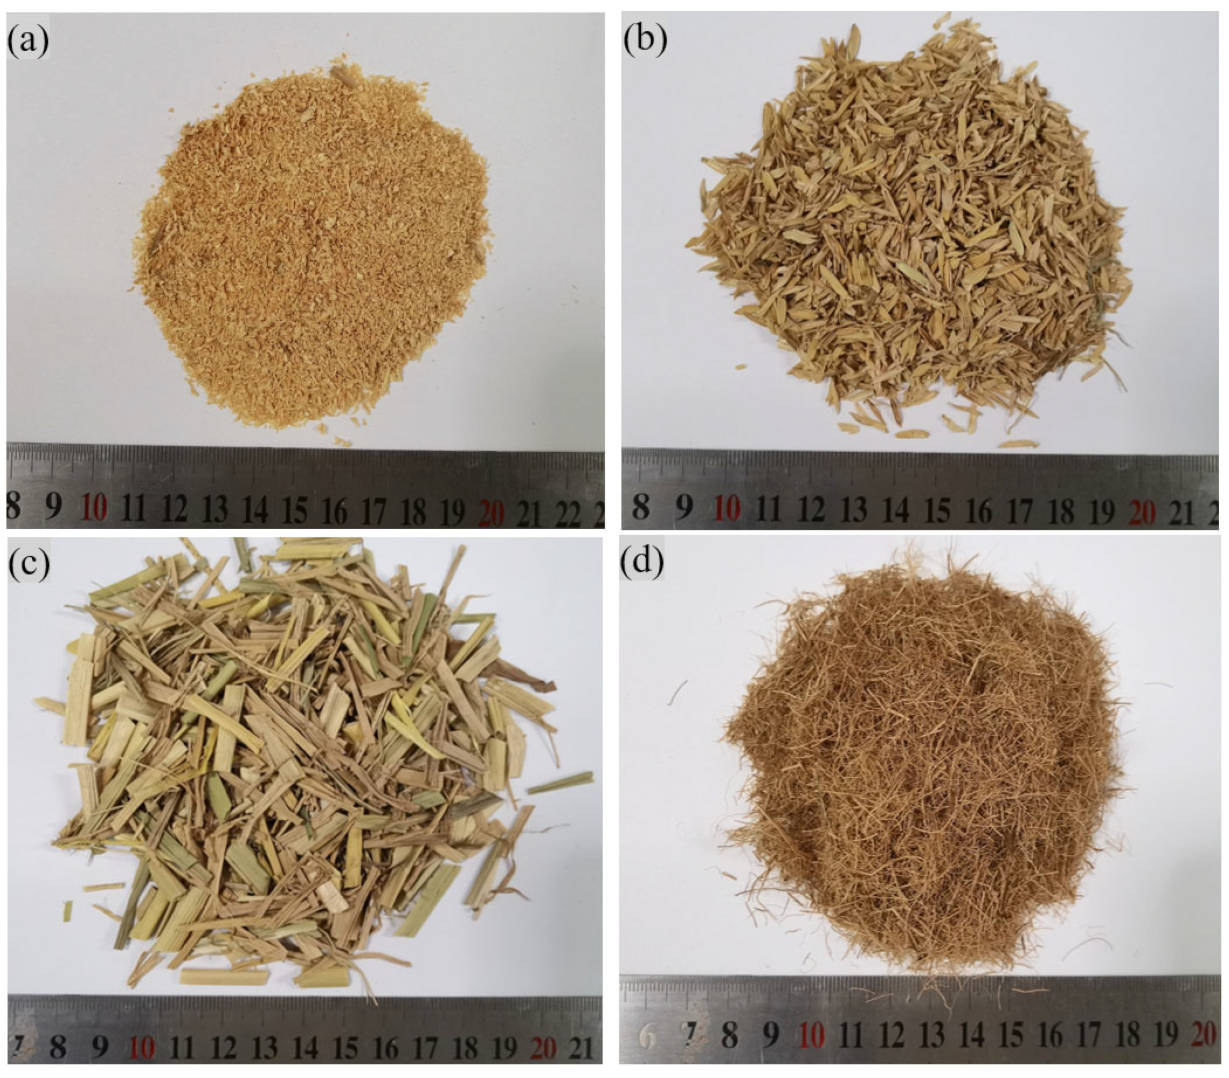
Figure 1. Image of raw biomass: (a) sawdust; (b) rice husk; (c) rice straw; (d) coconut fiber.
Buildings 16 03136 g001
Figure 2. Image of EPS: (a) EPS used; (b) outer surface; (c) cross-section. Note: the creases on the EPS surface (b) are from compression during transit.
Buildings 16 03136 g002
Figure 3. Preparation process of biomass/EPS lightweight geopolymer composites.
Buildings 16 03136 g003
Figure 4. SEM images of outer surfaces and cross section of sawdust, rice husk, rice straw and coconut fiber at different magnifications.
Buildings 16 03136 g004
Figure 5. The water absorption of the four samples: (a) over the complete 72 h period; (b) magnification of the first 60 min.
Buildings 16 03136 g005
Figure 6. Image of biomass/EPS lightweight geopolymer composites: (a) SG; (b) HG; (c) RG; (d) CG. Note: The image inside the blue box in the upper right corner is an enlarged view.
Buildings 16 03136 g006
Figure 7. MIP results of the geopolymer composites: (a) cumulative intrusion; (b) log differential intrusion. Note: G refers to the neat geopolymer without the addition of biomass and EPS particles.
Buildings 16 03136 g007
Figure 8. Density, thermal conductivity and compressive strength of biomass/EPS lightweight geopolymer composites. Note: Error bars represent standard deviation (SD, n = 4). Different letters (a, b, c, d) above the bars indicate statistically significant differences among groups (p < 0.001, one-way ANOVA with Tukey’s post hoc test).
Buildings 16 03136 g008
Figure 9. (a) Total water absorption and (b) capillary water uptake coefficients of lightweight geopolymer composites. Note: Error bars represent standard deviation (SD, n = 4). Different letters (a, b, c, d) above the bars indicate statistically significant differences among groups (p < 0.001, one-way ANOVA with Tukey’s post hoc test).
Buildings 16 03136 g009
Figure 10. Static contact angles of the SG, HG, RG and CG samples before and after waterproof modification. Note: Error bars represent standard deviation (SD, n = 4); Different letters (a, b, c, d) above the bars indicate statistically significant differences among groups (p < 0.05, one-way ANOVA with Tukey’s post hoc test); Asterisks (*) indicate a statistically significant difference between before and after waterproof treatment within the same formulation group (paired t-test, p < 0.05).
Buildings 16 03136 g010
Figure 11. (a) Surface morphology and (b) compressive strength of the samples before and after UV exposure. Note: Error bars represent standard deviation (SD, n = 4). Asterisks (*) indicate a statistically significant difference between before and after UV exposure within the same formulation group (paired t-test, p < 0.05).
Buildings 16 03136 g011
Figure 12. Performance comparison of biomass/EPS lightweight geopolymer composites (a) thermal conductivity and (b) compressive strength.
Buildings 16 03136 g012
Figure 13. CO2 emissions and total cost of prepared biomass/EPS lightweight geopolymer composites.
Buildings 16 03136 g013
Table 1. Chemical compositions of metakaolin.
CompositionsSiO2Al2O3Na2OFe2O3TiO2CaOMgOLOI
Contents (wt.%)45.0843.840.115.762.630.960.242.79
Table 2. Detailed mixture formulations and material dosages (kg/m3).
SamplesComposition (kg/m3)
MetakaolinSodium SilicateNaOHWtSurfactantBiomassWpbEPSWeps
SG385.8451.833.280.45.6135.4135.418.577.2
HG437.3512.037.691.26.3106.7106.721.087.5
RG364.4426.731.376.05.379.479.417.572.9
CG468.5548.640.397.76.854.854.822.593.7
Note: SG: sawdust/EPS lightweight geopolymer composites; HG: Rice husk/EPS lightweight geopolymer composites; RG: Rice straw/EPS lightweight geopolymer composites; CG: Coconut fiber/EPS lightweight geopolymer composites.
Table 3. CO2 emissions and the cost of raw materials.
Raw Material
MetakaolinSodium SilicateNaOHSurfactantWaterRecycled EPSSawdustRice HuskRice StrawCoconut Fiber
CO2 (kg CO2-eq/kg)0.1320.332.041.080.00010600000
Ref.[19][19][25][26][27]/////
Cost
(USD/kg)
0.0550.1260.182.720.0006160.290.050.0150.0240.43
Ref.[28][29][29]Note[30][31][32][33][34][30]
Note: These prices were procured from the domestic market in China.
Table 4. Specific surface area, pore volume, and average pore diameter of the four biomass samples.
Biomass TypesBET Surface Area
(m2/g)
Pore Volume
(cm3/g)
Average Pore Diameter
(nm)
Sawdust0.40310.00147614.65
Rice husk0.16260.00183645.18
Rice straw0.03070.00067788.32
Coconut fiber0.14390.0002366.57
Table 5. Porosity and average pore diameter of the SG, HG, RG, and CG samples.
SGHGRGCG
Porosity (%)65.761.164.859.9
Average pore diameter (nm)230.29123.85118.6180.25
Disclaimer/Publisher’s Note: The statements, opinions and data contained in all publications are solely those of the individual author(s) and contributor(s) and not of MDPI and/or the editor(s). MDPI and/or the editor(s) disclaim responsibility for any injury to people or property resulting from any ideas, methods, instructions or products referred to in the content.