Article

Novel Star–Ellipse Honeycomb Metamaterials for Achieving Optimal Trade-Offs Between Stiffness and Energy Absorption

1
School of Civil Engineering, Chongqing University, Chongqing 400045, China
2
Key Laboratory of New Technology for Construction of Cities in Mountain Area, Chongqing University, Chongqing 400045, China
*
Author to whom correspondence should be addressed.
Buildings 2026, 16(15), 3014; https://doi.org/10.3390/buildings16153014
Submission received: 9 July 2026 / Revised: 25 July 2026 / Accepted: 27 July 2026 / Published: 29 July 2026

Abstract

To address the trade-off between stiffness and auxeticity in conventional star-shaped honeycombs (SH), this study introduces a novel star-ellipse honeycomb (SEH) design, incorporating elliptical stiffeners that enhance both load-bearing capacity and energy absorption. The mechanical performance of SEH was comprehensively evaluated using FE simulations, theoretical modeling, and quasi-static tests on 3D-printed multi-cell specimens. An equivalent Cauchy model using the Variational Asymptotic Method (VAM) was established and validated against experiment and finite element results, demonstrating high predictive accuracy in elastic behavior analysis while significantly reducing computational costs. Based on the collapse mechanism of a representative unit cell, a theoretical model was proposed to estimate the plateau stress. Comparative analyses show that the elliptical stiffener mitigates the classic stiffness–auxeticity trade-off by enabling cooperative deformation, which results in a simultaneous increase in elastic modulus and a stronger negative Poisson’s ratio compared to conventional star-shaped honeycombs. Additionally, the SEH exhibited a unique progressive folding mode under compression, delivering enhanced stiffness and energy dissipation, albeit with reduced ductility. The elliptical aspect ratio of 1.3, length ratio of 2.1, thickness ratio of 1.0, and star angle of 45–50° offer the best compromise between stiffness, energy dissipation, and auxetic performance, providing clear guidelines for tailoring SEH structures toward specific lightweight protective applications.

1. Introduction

Auxetic metamaterials—engineered cellular solids with a negative Poisson’s ratio—have attracted significant attention in aerospace and protective engineering [1,2,3]. Such materials expand laterally under tension and contract under compression, conferring unusual deformation and energy dissipation characteristics [4,5,6]. In practical applications, auxetic honeycomb cores and lattice panels are valued for their light weight, high impact resistance, and enhanced energy absorption [7]. For instance, Nian et al. [8] demonstrated that lattice metamaterials substantially improve the crashworthiness of bridge pier protection systems, effectively reducing peak forces and absorbing energy through plastic deformation. Usta et al. [9] employed auxetic honeycombs as core materials in sandwich panels due to their higher yield strength, shear stiffness, and toughness compared to traditional hexagonal honeycombs. These properties contribute to improved vibration damping and enhanced energy absorption during impact events [10].
Various re-entrant honeycomb designs have been explored to optimize auxetic performance [11]. Liu et al. [12] proposed an interdisciplinary design framework based on programmable mechanical metamaterials, highlighting the potential of geometry-driven material design for building applications. Széles et al. [13] developed a novel doubly re-entrant auxetic honeycomb structure that achieves up to 767% enhancement in energy absorption and a 17-fold increase in maximum compressive force while eliminating buckling deformation. The classical re-entrant hexagonal honeycomb is well known for its strong auxetic effect and excellent energy absorption; however, its large voids and thin walls result in relatively low structural stiffness [14]. To address this limitation, the star-shaped honeycomb (SH) was developed by replacing horizontal cell walls with zigzag struts, thereby introducing additional support points and improving overall stiffness. Star-shaped honeycombs can be categorized into three types based on structural order: third-order (triangular), fourth-order (quadrilateral), and sixth-order (hexagonal) configurations.
Recently, Wei et al. [15] applied topology optimization to the design of triangular star-shaped honeycombs. Their auxetic behavior is mainly influenced by strut length and the angle between struts [16]. Montazeri et al. [17] analyzed the mechanical properties of quadrilateral star-shaped honeycombs and found that both the Poisson’s ratio and equivalent elastic modulus are affected by strut slenderness and aspect ratios. The auxetic effect in quadrilateral and hexagonal star-shaped honeycombs is more pronounced than in the triangular star-shaped honeycomb. The auxetic effect and structural performance of these honeycombs are strongly influenced by strut length, angle, and the connecting stiffness [18].
Although the geometric design of star-shaped honeycombs improves initial stiffness, the added material can inhibit intrinsic re-entrant deformation, thereby reducing the negative Poisson’s ratio. Recent innovations have focused on embedding stiffeners within the unit cell, such as in hierarchical auxetic star-shaped honeycombs (HASS) [19] and stiffened rhombic honeycombs (SRH) [20]. These modifications enhance plateau stress and load-bearing capacity but also introduce complex deformation modes and increased mass, which may limit their energy absorption efficiency [21,22].
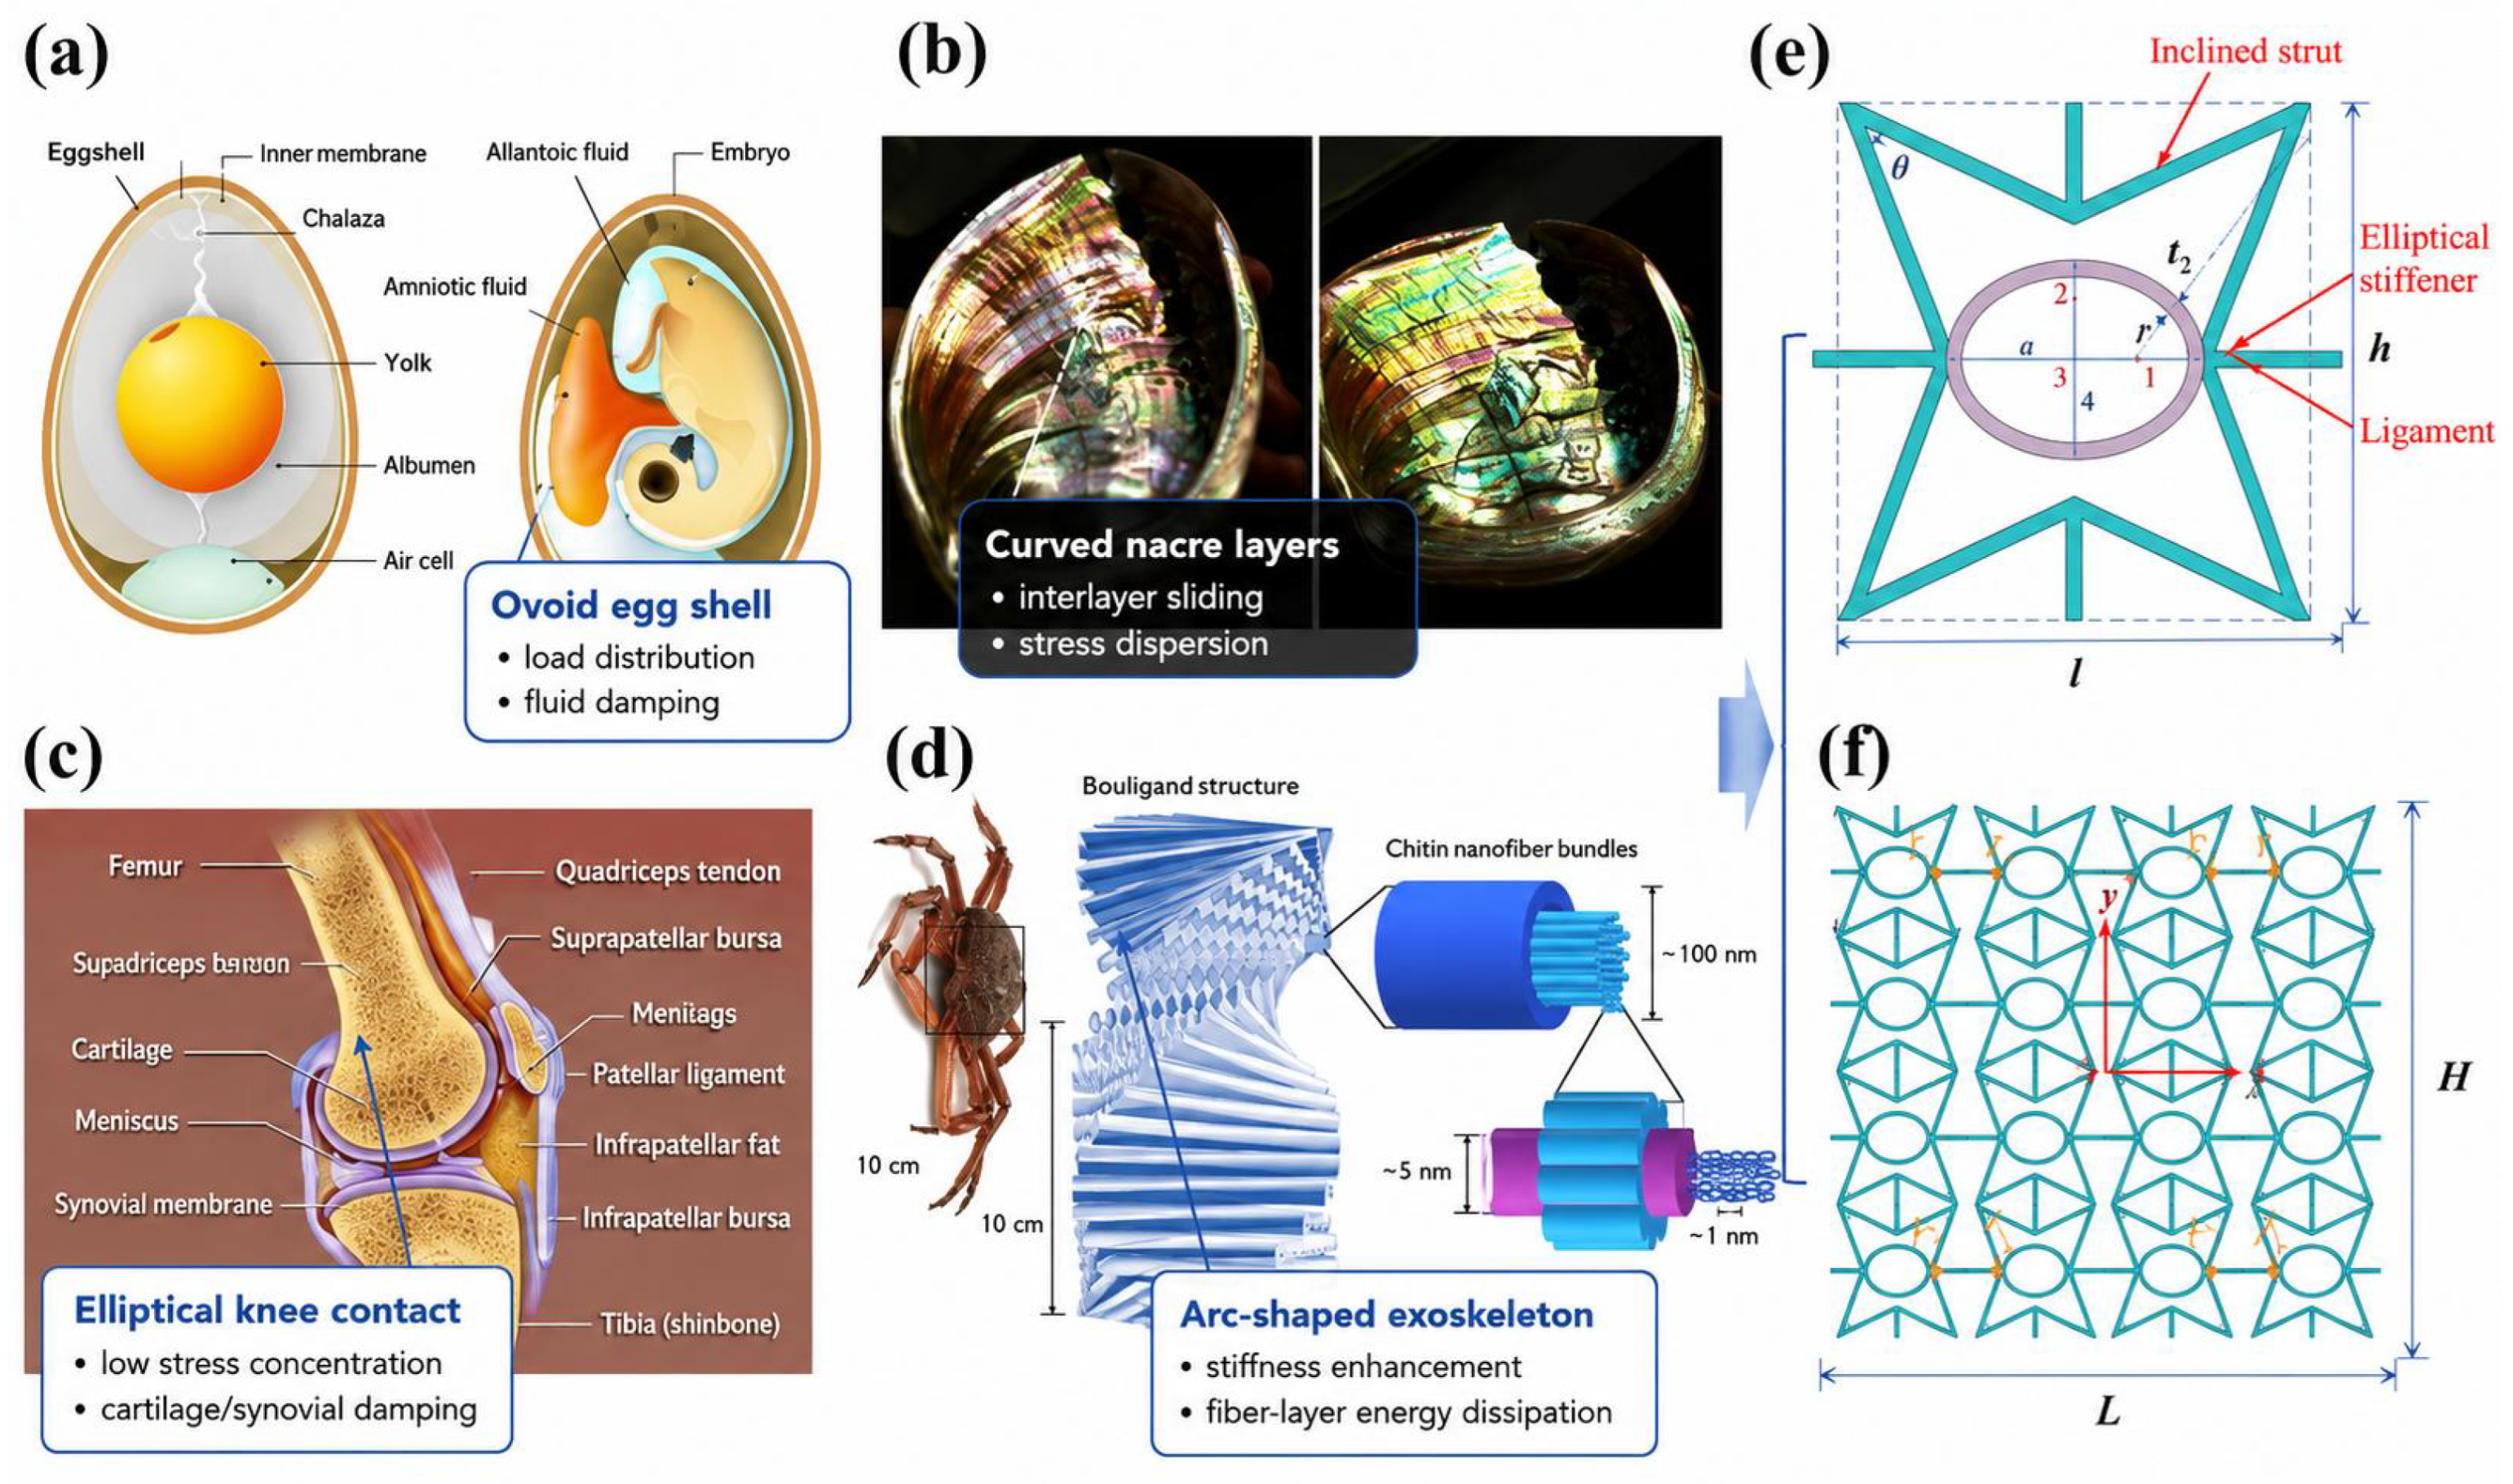
Representative elliptical structures in nature exhibit remarkable capabilities in both energy absorption and stiffness enhancement, as shown in Figure 1. Bird eggs possess ovoid elliptical shells that efficiently distribute external loads, while the internal fluid medium provides additional damping [23]. Nacre shells, with their elliptical curvature and layered architecture, dissipate impact energy through interlayer sliding while simultaneously dispersing stress [24]. Knee joints feature elliptical contact surfaces that minimize stress concentration and improve joint stability, aided by the damping effects of cartilage and synovial fluid [25]. Insect exoskeletons adopt elliptical arc-shaped carapaces, which increase bending stiffness and facilitate energy dissipation via fiber-reinforced layers [26]. Collectively, these bioinspired examples highlight the multifunctional role of elliptical geometries in simultaneously achieving energy absorption and structural stiffness, offering valuable design principles for the development of advanced metamaterials.
Inspired by these natural elliptical structures, this study proposes a novel star–ellipse honeycomb (SEH), evolved from the conventional SH design by incorporating a central elliptical stiffener. The unit cell comprises an outer eight-armed star-shaped framework with ligaments and an embedded ellipse. By tuning the ellipse’s aspect ratio and thickness, strut thickness, and star angles, the design establishes multiple load paths that enhance bending stiffness while preserving auxetic deformation. Under compression, the struts and ellipse deform cooperatively, forming hinge points and enabling progressive folding. This new configuration is expected to reconcile the traditional trade-off between stiffness and auxeticity, providing simultaneous improvements in stiffness and energy absorption.
In addition to structural design, accurate modeling of auxetic honeycombs is essential for predicting their effective properties and guiding optimization [27,28]. Homogenization methods for cellular materials generally fall into three categories: (i) analytical models based on simplified beam or strut theories, which are efficient but limited in capturing complex stiffened geometries [29]; (ii) numerical homogenization using representative volume elements with periodic boundary conditions, which improves accuracy but requires high computational cost [30,31]; and (iii) reduced-order equivalent continuum models, which derive effective properties through energy equivalence and offer a practical balance between accuracy and efficiency [32,33]. Among these, the Variational Asymptotic Method (VAM) is recognized as an effective approach that transforms the 3D strain energy of a periodic cell into an equivalent continuum representation [34,35,36]. In this work, the VAM is applied to effectively capture the essential mechanics of SEH structures while substantially reducing computational cost.
The remainder of this paper is structured as follows. Section 2 describes the configuration and effective mass density of the SEH, along with key design parameters. Section 3 introduces the theoretical models, including the VAM-based equivalent Cauchy model and plateau stress model. Section 4 outlines the experimental setup and FE modeling method used to validate the mechanical behavior under quasi-static compression. Section 5 presents results and discussions comparing the performance of SEH and SH structures, focusing on elastic response, energy absorption, and deformation mechanisms. Section 6 extends the comparison to other stiffened star-shaped and auxetic honeycombs, and Section 7 summarizes the main findings and potential applications of the SEH design.

2. Geometry and Relative Density of SEH

2.1. Geometric Description

Based on the star-shaped honeycomb (SH) shown in Figure 1e, a novel stiffened star-shaped honeycomb configuration, termed the star–ellipse honeycomb (SEH), is developed through the introduction of an embedded elliptical stiffener, as illustrated in Figure 1f. The SEH translates the biomechanical paradigm of continuous-curvature-mediated stress redistribution and progressive energy dissipation into four synergistic mechanisms.
  • The bird egg-inspired elliptical profile promotes curvature-guided load redistribution. Concentrated forces from the inclined struts are dispersed along the stiffener perimeter, and the tangential junction geometry eliminates sharp load transfer discontinuities.
  • SEH mimics the progressive damage tolerance of nacre through temporally staged plastic deformation. Sequential hinging of the outer framework and elliptical stiffener prevents abrupt collapse and maintains stable load resistance throughout compression.
  • The elliptical stiffener acts as a compliant rotational constraint analogous to the femoral condyles. Continuous curvature enables smooth load transfer and unrestricted strut rotation, whereas polygonal reinforcements introduce discrete constraints.
  • The elliptical stiffener achieves curvature-efficient reinforcement analogous to an insect exoskeleton. By distributing material away from the neutral axis, it increases bending rigidity without substantial mass addition.
The SEH cell comprises three primary components: an outer star-shaped framework formed by eight inclined struts, four ligaments, and a central elliptical stiffener. To promote auxetic deformation along the 1-direction, the ligament length in this direction is set as l 2 , extending beyond the basic star-shaped block size and thereby facilitating lateral expansion under compression. In the 2-direction, the ligament length follows the block dimension of the star-shape and is expressed as l 1 sin α , where α = π 4 θ 2 denotes the strut inclination angle.
Other essential geometric parameters are defined in Figure 1c: l 1 denotes the length of the inclined struts, t 1 denotes the thickness of struts and ligaments, and θ specifies the star angle. The elliptical stiffener is defined by its semi-major axis a and semi-minor axis b, with t 2 representing its thickness. Accordingly, the SEH cell length l and height h are given by
l = 2 l 2 + 2 a , h = 2 l 1 cos π 4 θ 2 + t 1 .
For convenience in subsequent analysis, the following dimensionless parameters are introduced:
m = a / b , n = 10 t 1 / l 2 , c = t 2 / t 1 .
To prevent geometric overlap between the inclined struts and the elliptical stiffener, the following condition must hold in the undeformed configuration:
b < l 1 ( cos α sin α ) .
a = l 1 sin ( θ + α ) l 1 sin α .

2.2. Effective Density

In periodic lattice structures, the effective density is a critical factor governing stiffness, strength, and overall mechanical performance. The mass m of a SEH cell can be calculated as
m = 8 l 1 t 1 + 2 l 2 t 1 + l 1 sin π 4 θ 2 t 1 + π t 2 2 a + 2 b + t 2 d · ρ c ,
where ρ c is the density of the constituent material and d denotes the depth of the SEH cell. The corresponding volume of a unit cell is
V = l · h · d = 2 l 2 + a 2 l 1 cos π 4 θ 2 + t 1 d .
Accordingly, the effective density of the 3D SEH can be formulated as
ρ * = m V = ρ c · 8 l 1 t 1 + 2 l 2 t 1 + l 1 sin π 4 θ 2 + π t 2 2 a + 2 b + t 2 2 l 2 + a · 2 l 1 cos π 4 θ 2 + t 1 .

2.3. Performance Metrics

To evaluate the mechanical performance of SEH structures across varying porosity levels, the following key indicators are employed:
(1) Energy absorption (EA), specific energy absorption (SEA), and absorption efficiency (EAE, η ) are defined as
EA = 0 δ d F ( δ ) d δ , SEA = EA m , η = 0 ε d σ ( ε ) d ε σ ( ε ) ε = ε d ,
where δ d and ε d represent densification displacement and strain, respectively; F represents the applied force and m is the mass of the structure; σ ( ε ) is the compressive stress.
(2) Plateau stress ( σ p ), crushing force efficiency (CFE), and mean crushing force (MCF):
σ p = ε 0 ε d σ ( ε ) d ε ε d ε 0 , CFE = σ p σ m a x , MCF = EA δ d
where ε 0 is the elastic limit strain and σ m a x is the peak stress.
(3) Dynamic Poisson’s ratio
The strain-dependent Poisson’s ratio at step k, describing the instantaneous lateral-to-axial strain response under compression, is calculated using eight reference points (P1–P8) defined in Figure 1f. The nominal transverse and axial strains, ε ¯ x k and ε ¯ y k , are calculated from the averaged relative displacements of four lateral and four vertical point pairs. The instantaneous Poisson’s ratio ν ¯ k is then calculated as the negative ratio of the transverse to axial strain:
ε x k = 1 4 i = 1 4 x i 4 k x i 1 k L / L
ε ¯ y k = 1 4 j = 1 4 y 4 j k y 1 j k H / H
v ¯ k = ε ¯ x k / ε ¯ y k
where x i j and y i j represent the deformed coordinates of each point, and L and H represent the initial length and height of the calculation region, respectively.

3. Theoretical Models for SEH Structures

3.1. VAM-Based Equivalent Model

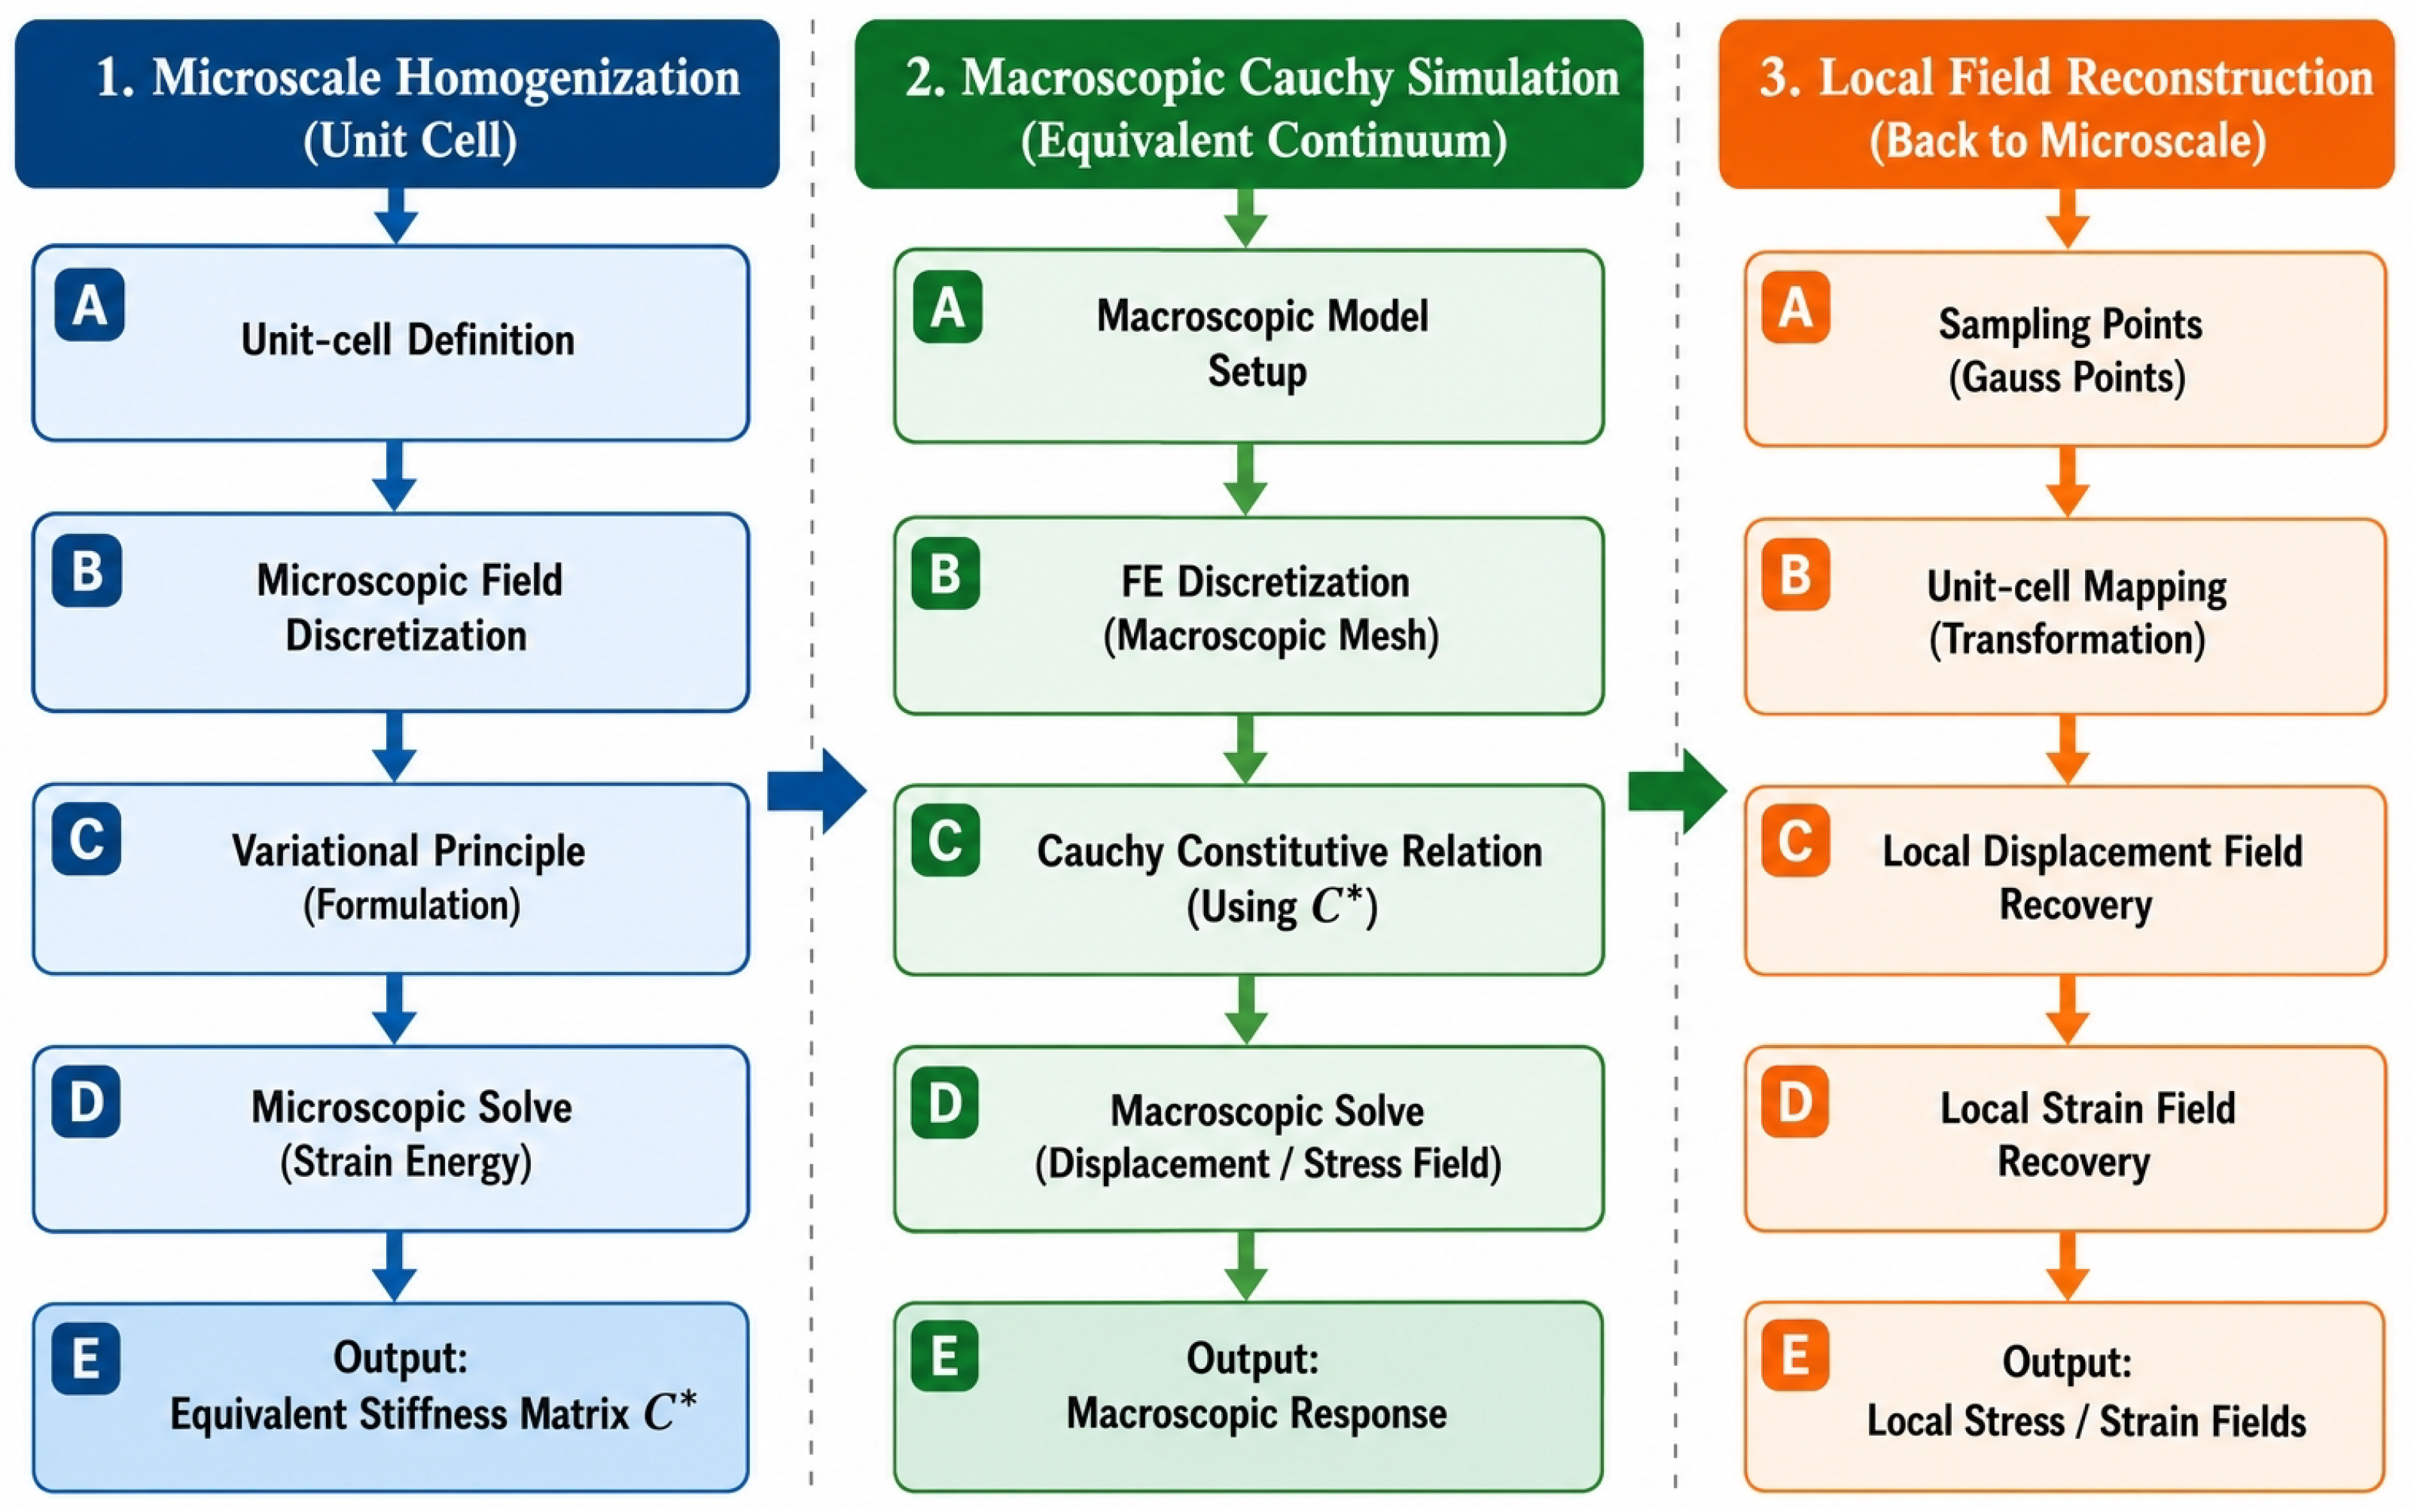
The design and analysis of large-scale honeycomb structures present considerable computational challenges due to the rapid increase in degrees of freedom and extended simulation durations. To address this issue, a 3D equivalent Cauchy model (3D-ECM) for the SEH is established using the VAM. This method is founded on two fundamental assumptions: (1) the microstructure is periodic and suitable for homogenization, and (2) higher-order strain terms can be neglected to maintain computational efficiency. The equivalent mechanical properties obtained from unit-cell homogenization are incorporated into the 3D-ECM to accurately capture the structural auxetic behavior. The global structural response is then utilized to reconstruct local field distributions through a recovery relationship, as illustrated in Figure 2. The arrows indicate the sequential data flow. The 3D-ECM dramatically reduces computational cost while preserving the auxetic behavior and stiffness characteristics of the original SEH microstructure.

3.2. Theoretical Derivation of Plateau Stress Model

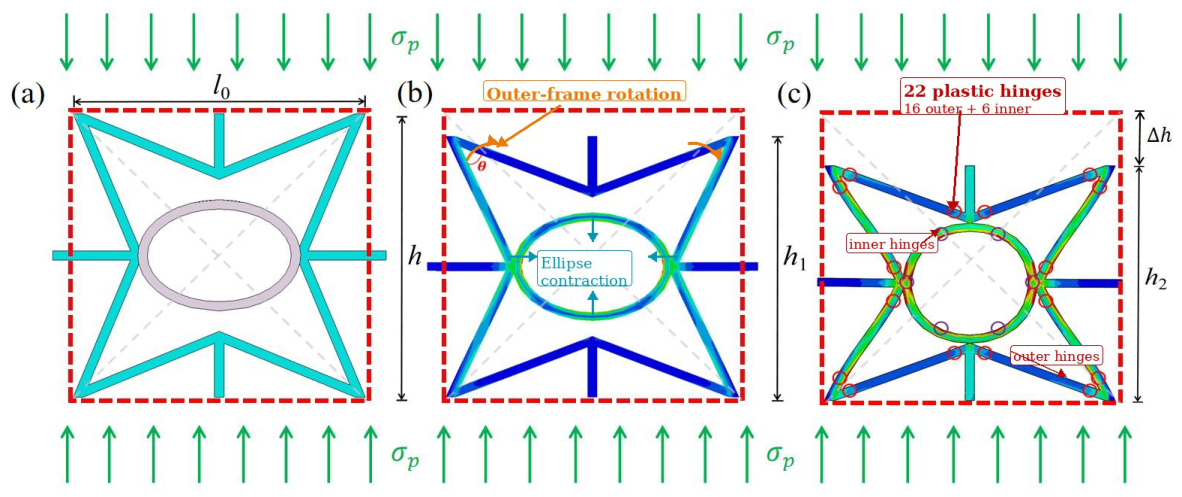
To predict the theoretical plateau stress of the SEH cell under quasi-static compression, a representative cross-sectional model is established based on experimental observations and finite element simulations. The collapse process in Figure 3 is idealized under the following assumptions: strut dimensions remain constant; the material is rigid-perfectly plastic; the horizontal ligament undergoes vertical translation; inclined struts rotate about plastic hinges at the joints; and the central elliptical stiffener is treated as a rigid body undergoing wave-like deformation with hinge formation at its junctions and curved side struts. According to the principle of energy conservation, external work is dissipated primarily through plastic hinges, while inertia and dynamic effects are neglected under quasi-static loading.
As compression progresses (Figure 3b), the outer star-shaped framework rotates about its central hinges while the inner elliptical structure contracts inward. At the stage shown in Figure 3c, a total of 22 plastic hinges are formed: 16 in the outer framework and 6 in the inner reinforcement. Although the horizontal ligaments play a crucial role in mitigating stress concentration and delaying local collapse, they develop only minor hinges due to their low transverse resistance. Based on the deformation geometry, the rotation angles of the outer star struts and inner elliptical stiffener are denoted as α 1 and α 2 , respectively.
α 1 = π 4 θ 2 , α 2 = α 1
The total plastic dissipation energy of the unit cell is expressed as
E p = 16 M p 1 α 1 + 6 M p 2 α 2 ,
where M p 1 and M p 2 are the fully plastic bending moments of the outer and inner frameworks, respectively, given by
M p 1 = σ 0 d t 1 2 / 4 , M p 2 = σ 0 d t 2 2 / 4 ,
where σ 0 represents the flow stress of an ideal plastic material. Considering strain hardening, the equivalent flow stress is given by
σ 0 = σ s + σ u 2
where σ s and σ u denote the yield and ultimate stresses of the material.
The work performed by the external load is
W p = σ p h d Δ h
where σ p is the plateau stress, h is the initial cell height, and Δ h is the vertical displacement during compression, which can be determined from the deformation geometry as
Δ h = h h 2 = h 2 × l / 2 cos π 4 θ 2 × sin θ .
Finally, based on the energy conservation principle E p = W p , the theoretical plateau stress for the SEH can be formulated as
σ p = E p h d Δ h = σ 0 ( π 2 θ ) 8 t 1 2 + 3 t 2 2 8 h 2 1 sin θ cos π 4 θ 2 .
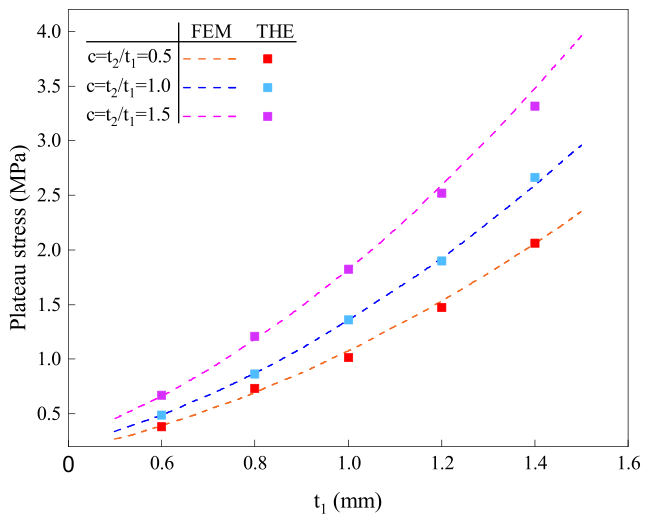
Figure 4 compares the theoretical predictions of the plateau stress with the FEM results as a function of the ligament thickness t 1 under different thickness ratios ( c = t 2 / t 1 ). For all examined configurations, the plateau stress increases monotonically with t 1 , indicating that thickening the load-bearing ligaments significantly enhances the macroscopic load-carrying capacity of the SEH structure. This trend is consistently captured by the theoretical model, which explicitly relates the plateau stress to the bending resistance of the plastic hinges through the quadratic dependence on t 1 and t 2 in Equation (19).

4. Experimental Setup and FE Modeling

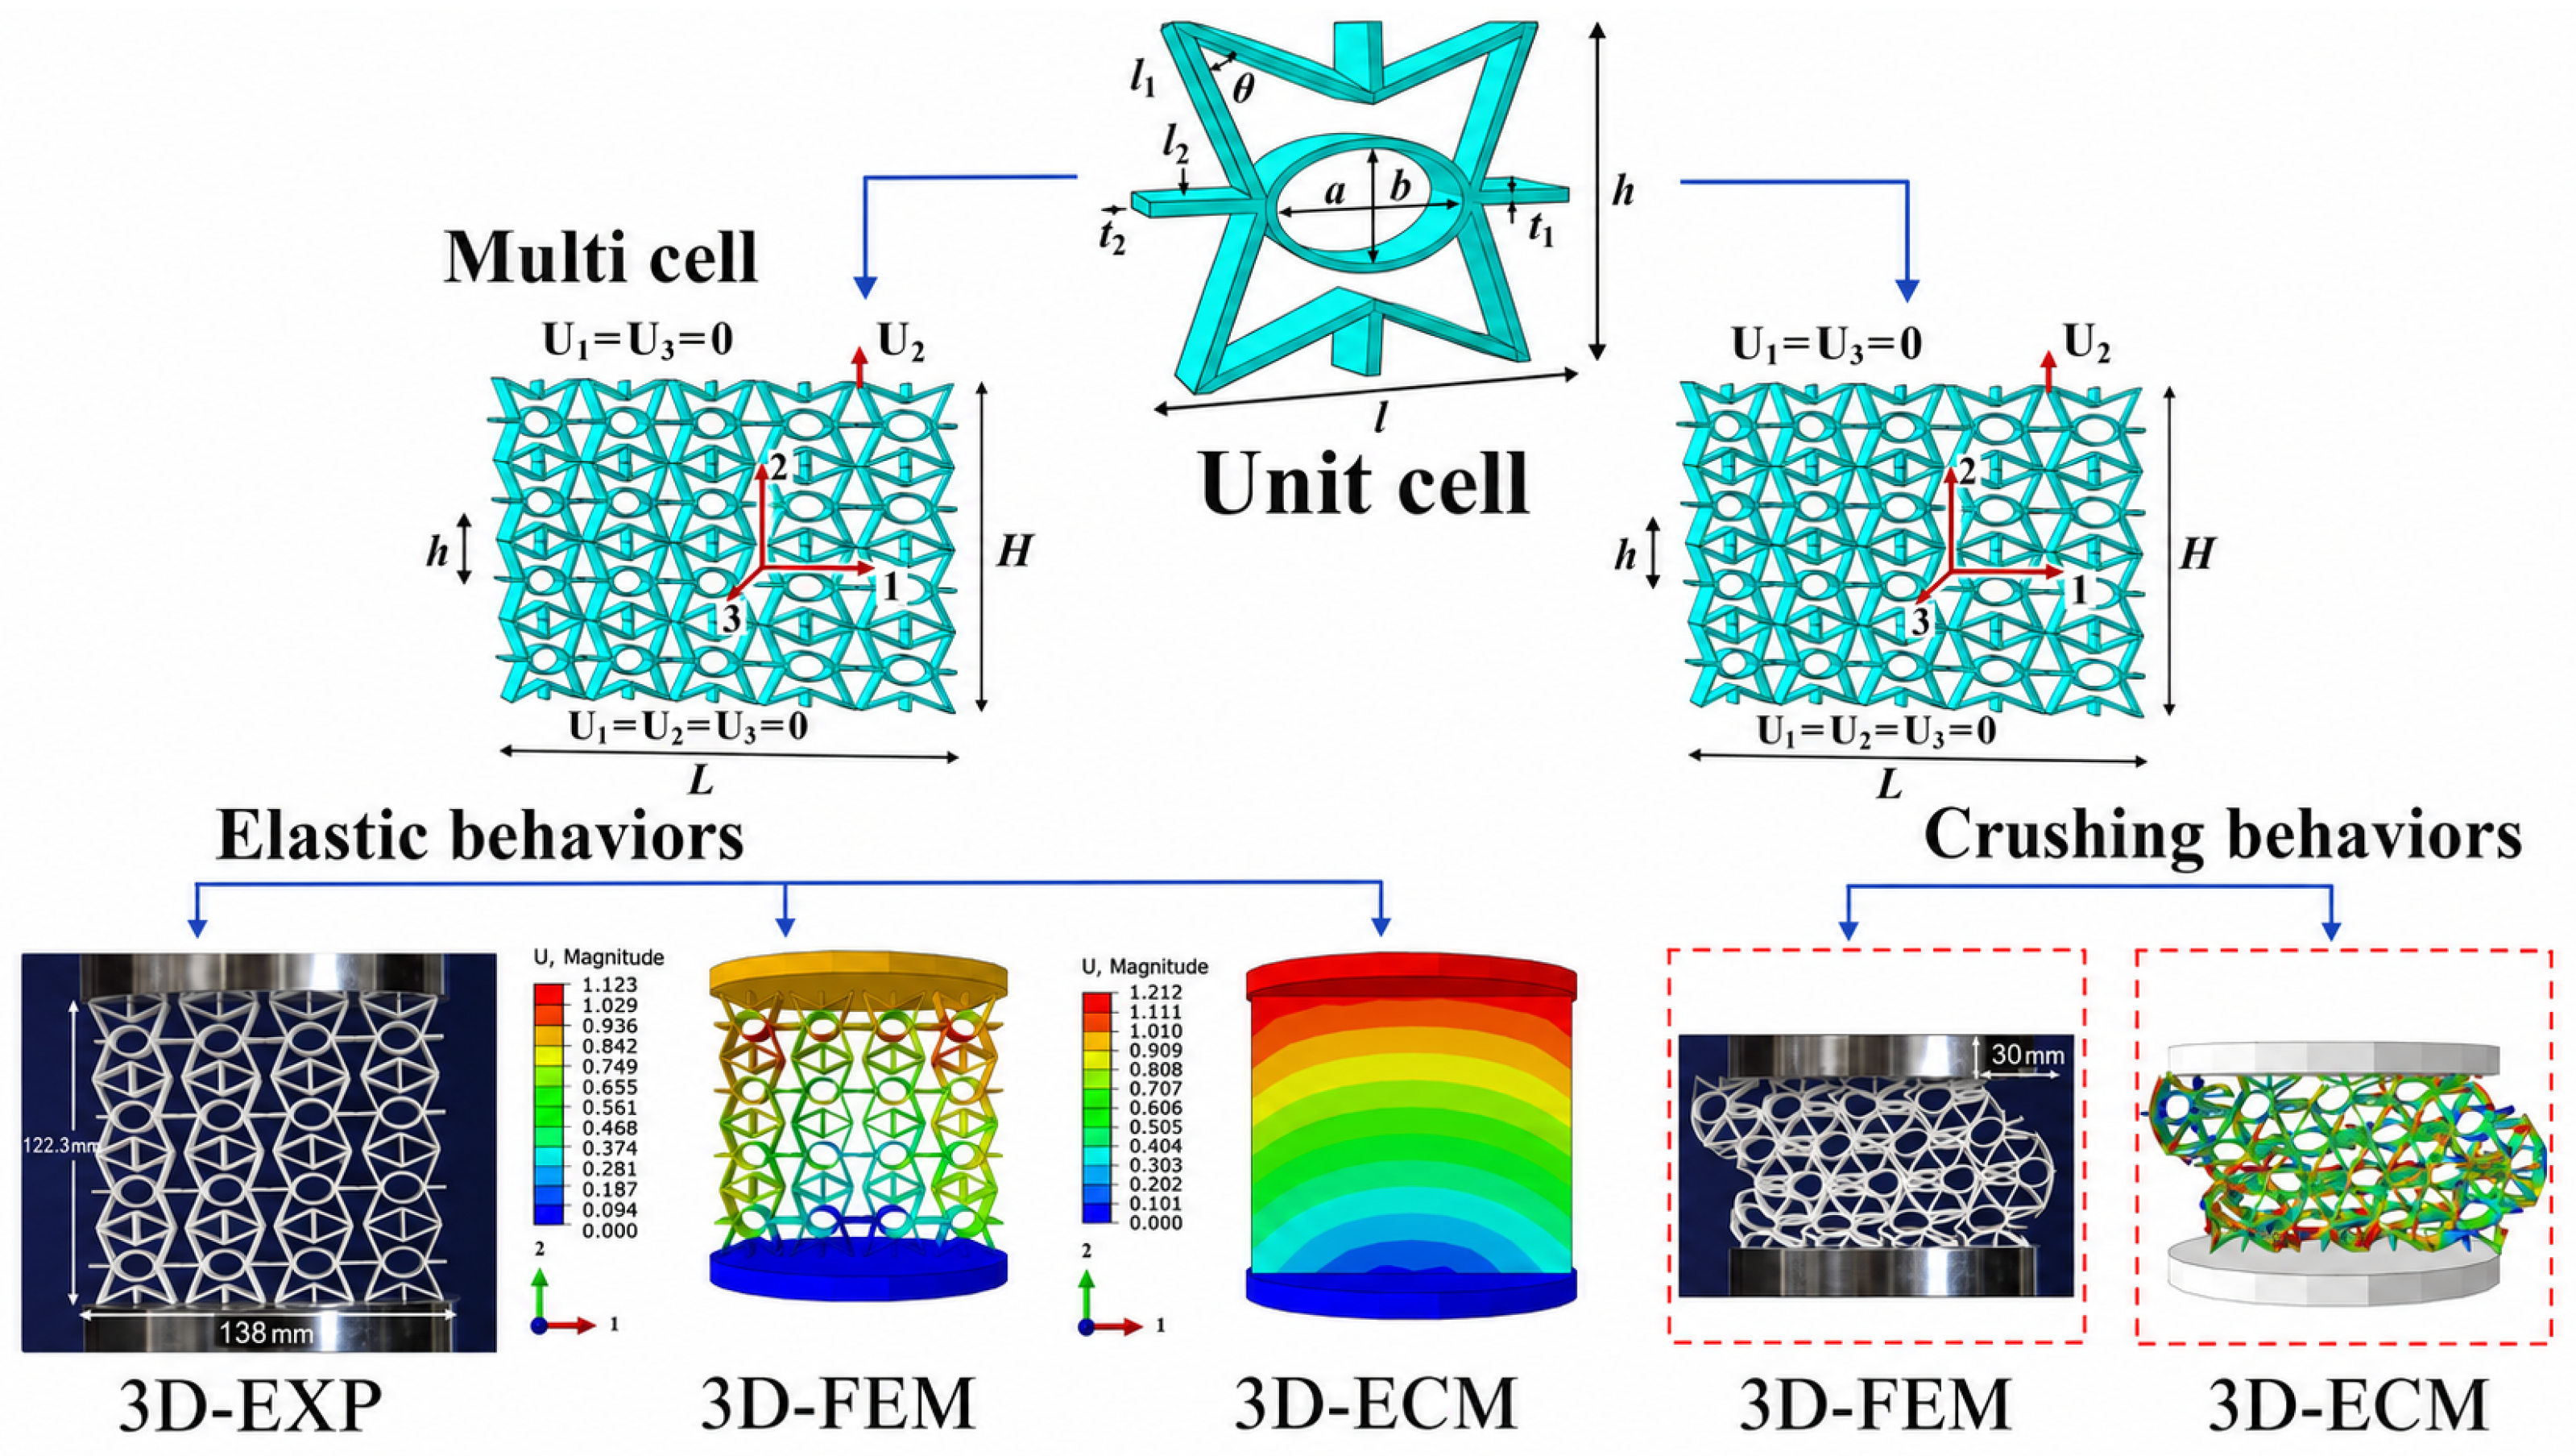
This section pursues two objectives, as shown in Figure 5: (1) Elastic behavior validation—evaluating 3D-ECM accuracy via 3D-printed quasi-static tests (3D-EXP) and comprehensive 3D-FEM simulations; (2) Plateau behavior validation—verifying 3D-FEM predictions of deformation modes and plateau stress against experimental and theoretical results. This two-stage validation framework (elastic → plateau) establishes model fidelity and provides a foundation for subsequent parametric studies.

4.1. Material Property Test

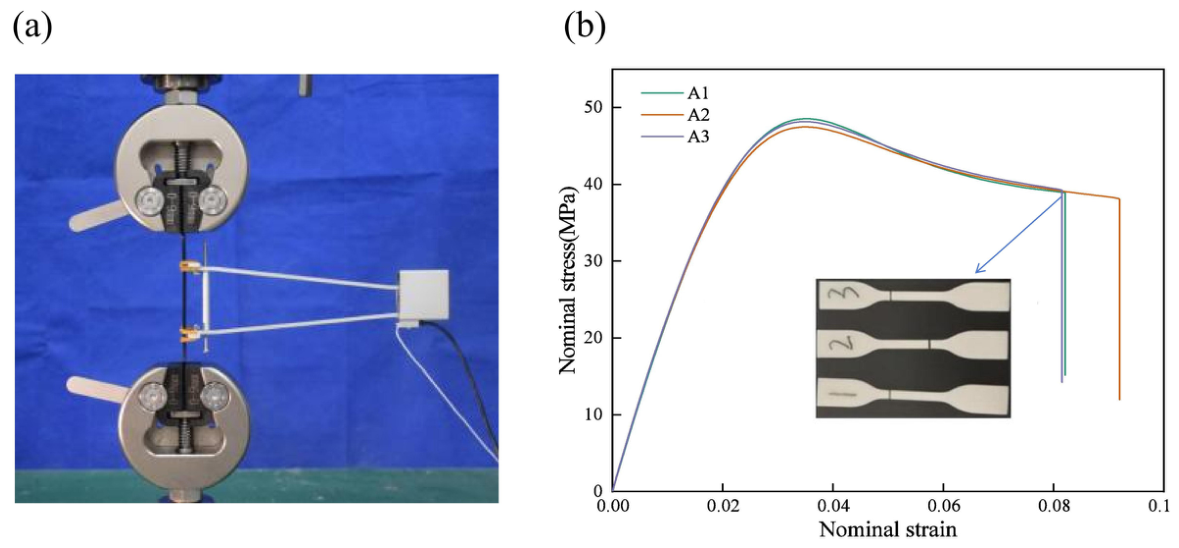
Uniaxial tensile tests were conducted on 3D-printed ABS specimens to characterize the base material used in the fabrication of SEH structures (Figure 6). Dog-bone-shaped samples were tested in accordance with ASTM D638 using a universal testing machine equipped with an NSS SSG2/20-S extensometer. To ensure consistency and minimize anisotropy, all specimens were fabricated on an Ultimaker S3 under controlled conditions: printing speed of 50 mm/s, layer thickness of 0.2 mm, nozzle temperature of 230 °C, and build orientation aligned with the loading direction. Figure 6b presents the nominal stress–strain responses of three ABS specimens (A1–A3), demonstrating excellent repeatability. The inset confirms consistent fracture morphology across all specimens. Key material properties, including yield stress, ultimate strength, and elastic modulus, are summarized in Table 1.

4.2. Quasi-Static Compressive Test Design

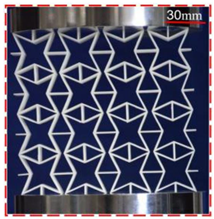
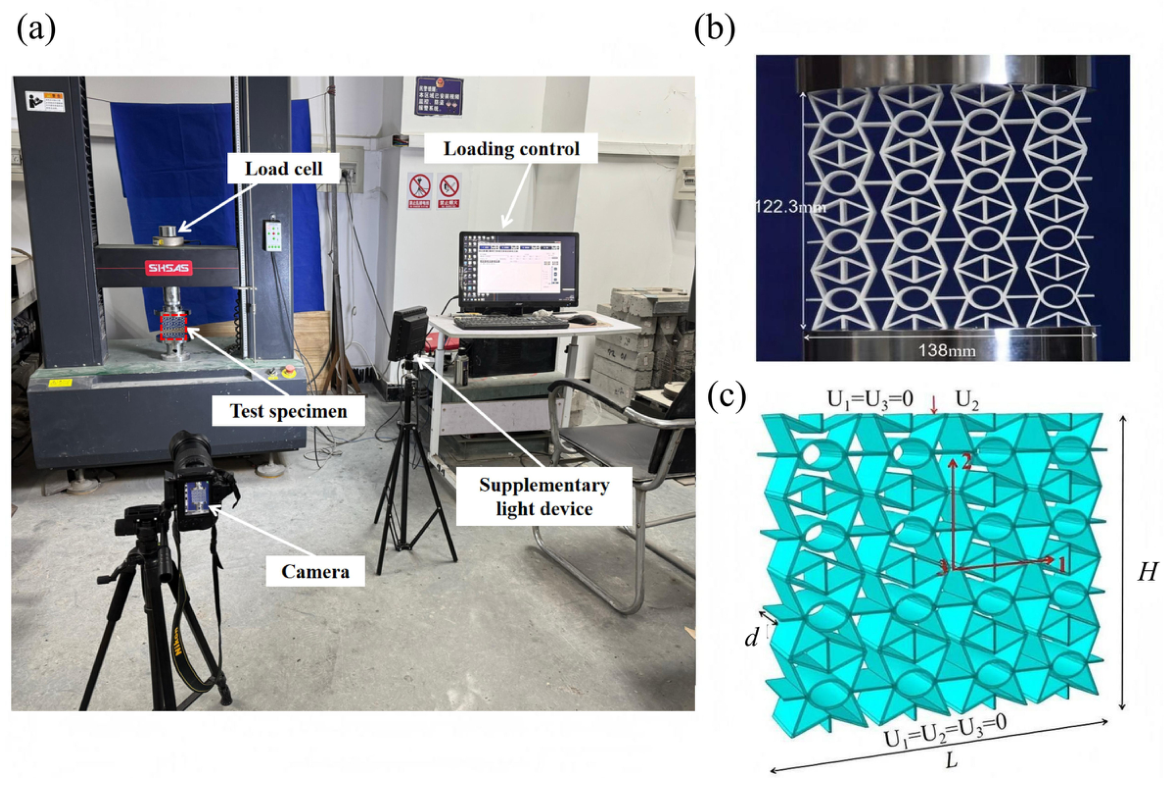
Fused deposition modeling (FDM) is one of the most widely adopted additive manufacturing techniques due to its accessibility, material versatility, and capability to produce complex cellular geometries [37,38]. All SEH and SH specimens in this study were fabricated using an Ultimaker S3 FDM printer. Figure 7a shows that experiments were performed using a universal testing machine at a constant loading rate of 1 mm/min. A rigid top platen applied the compressive load, while specimen deformation was captured with a high-resolution digital camera. No additional lubrication or interlayer materials were used between the specimen and platens to simulate direct structural contact conditions. Prior to each test, the specimen was carefully centered on the lower platen using alignment guides to ensure uniform loading and avoid eccentric compression. Force-displacement data were simultaneously acquired through a dedicated data acquisition system. The geometric dimensions of both SEH and SH specimens are detailed in Table 2.
Manufacturing fidelity was assessed using three randomly selected SEH and SH specimens. Key dimensions, including L × H , t 1 , a, b, t 2 , and θ , were measured before testing using a digital caliper and a Keyence VHX-7000 microscope. Three measurements were taken at different locations on each specimen and averaged. Table 3 summarizes the nominal and measured dimensions. For SEH, the external dimensions deviated by less than 0.15%, while the measured t 1 was 0.97 ± 0.04 mm, corresponding to an approximately 3% deviation. The deviations in a, b, t 2 , and θ were 2.1%, 2.6%, 4.0%, and 1.5%, respectively. The relatively larger t 2 error reflects the limited FDM resolution for thin curved features. Similar deviations were observed for SH.

4.3. Finite Element Modeling

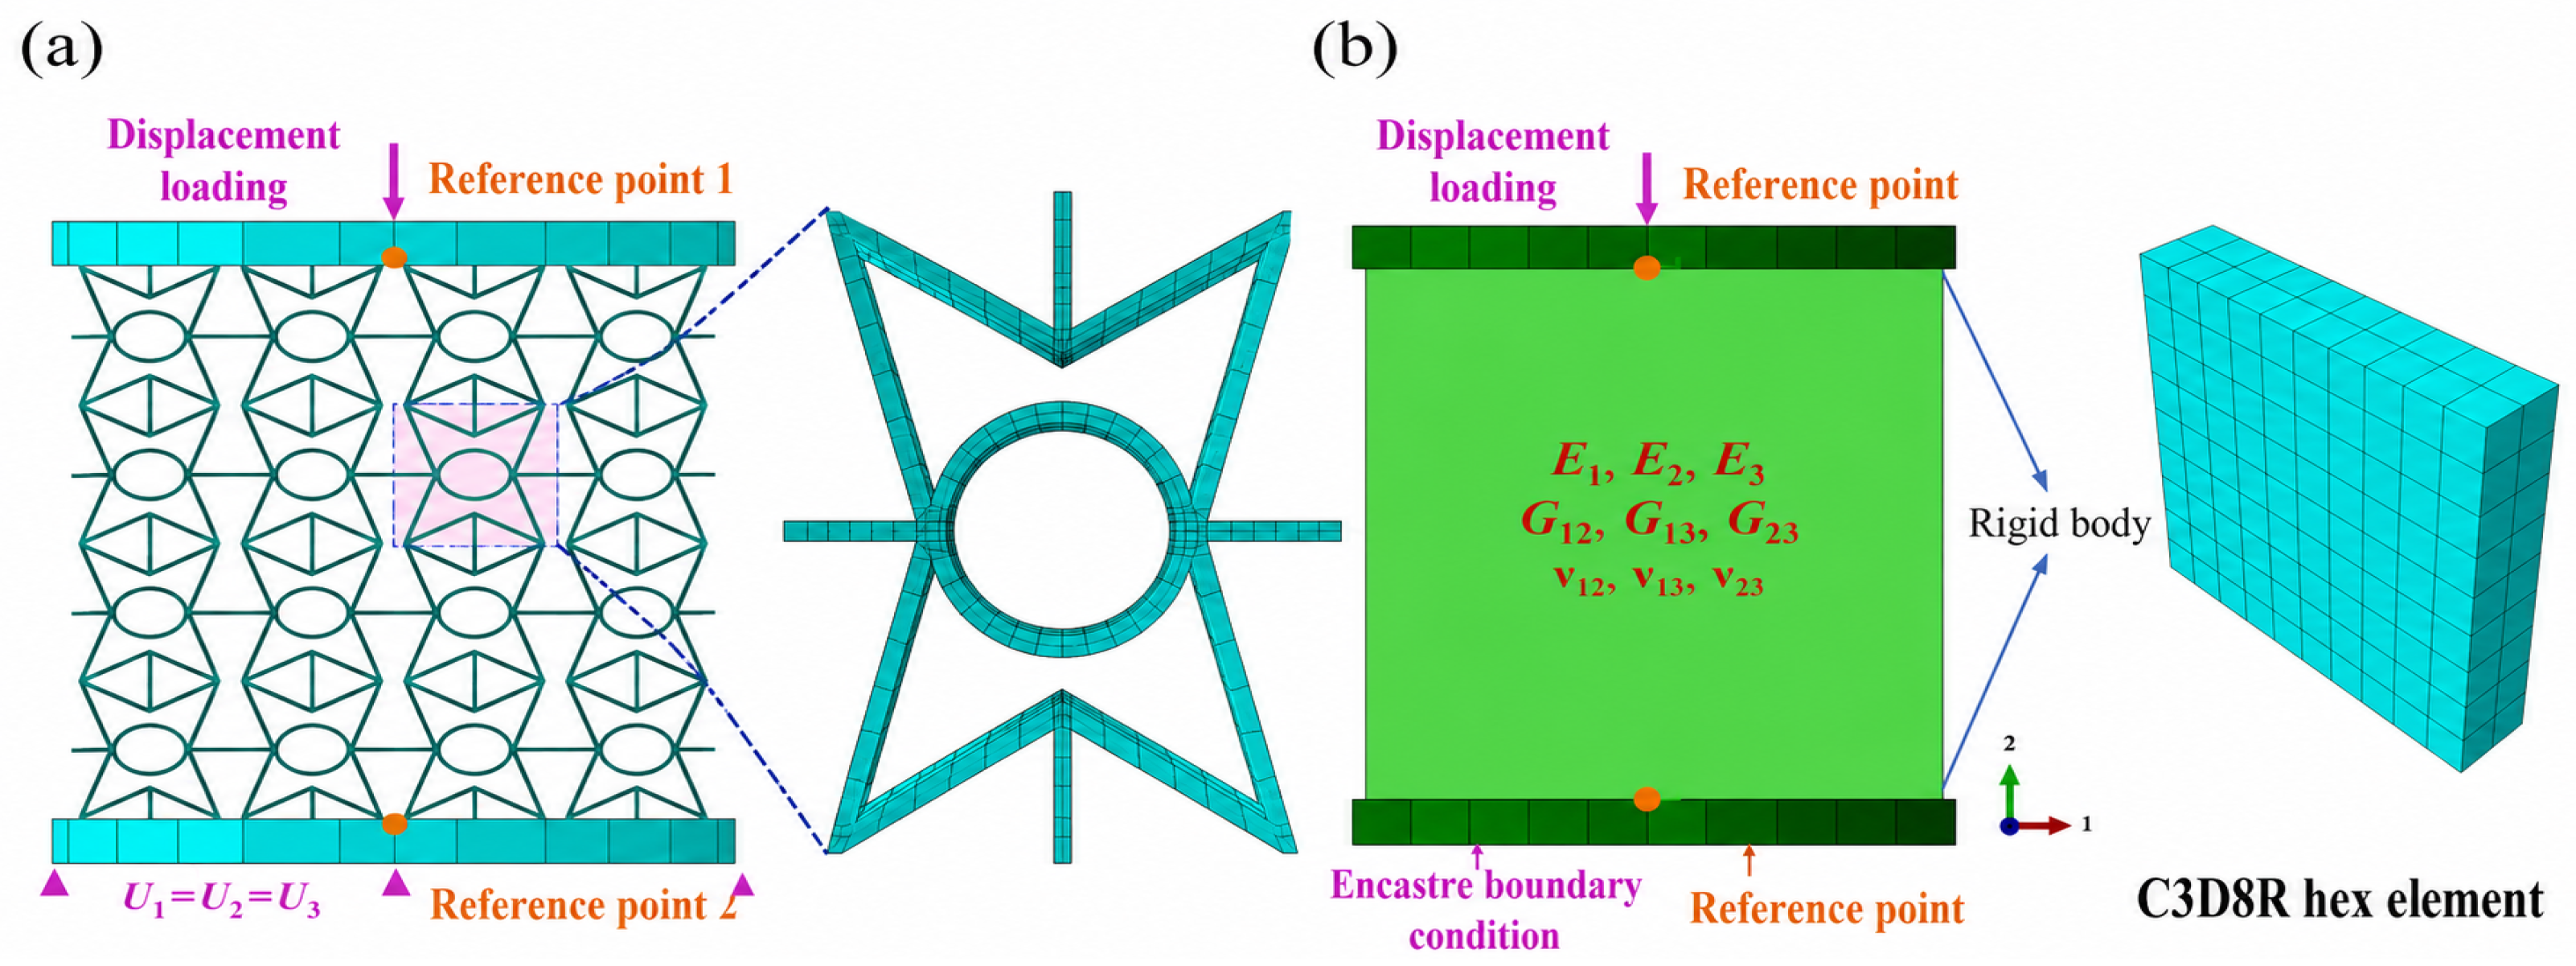
Quasi-static compression simulations were performed using the Abaqus/Explicit solver. A general contact condition was applied to the model with a tangential friction coefficient of 0.2 and hard contact enforcement in the normal direction. The upper and lower platens were modeled as analytical rigid bodies to accurately represent the experimental setup. The lower platen was fixed, and a prescribed displacement was applied to the upper platen to impose compression, as depicted in Figure 8a.
The structured hexahedral mesh comprising C3D8R elements with enhanced hourglass control was adopted to capture strut bending, local buckling, and contact during progressive folding. The mesh was progressively refined by increasing the number of elements along the strut thickness and the out-of-plane direction. At each refinement level, global stress–strain responses and plateau stress values were evaluated. Mesh convergence was achieved with at least five elements through the out-of-plane direction and six elements across the strut thickness. The maximum element aspect ratio remained below 3.5, and the minimum Jacobian determinant exceeded 0.85. Further mesh refinement changed the plateau stress by less than 2%, confirming the adequacy of the selected mesh density. The 3D-ECM was discretized using C3D8R hexahedral elements, as shown in Figure 8b.
The final mesh configuration, consisting of 50,112 elements, provided an optimal balance between computational cost and accuracy. The engineering constants of the SEH, obtained from unit-cell homogenization, are summarized in Table 4 and subsequently employed as input parameters for the 3D-ECM. In addition to the elastic and shear moduli, the in-plane bulk modulus K x y was evaluated to characterize the resistance of SEH to areal deformation. Using the orthotropic relation K x y = E 1 E 2 E 1 ( 1 ν 21 ) + E 2 ( 1 ν 12 ) , SEH yields K x y = 12.13 MPa, approximately 4.5 times that of SH (2.68 MPa). This enhancement is primarily attributed to the substantial increases in E 1 and E 2 induced by the elliptical stiffener. Although the negative Poisson’s ratios increase the denominator and partially offset this improvement, the stiffness enhancement remains dominant.
SEH and SH shared identical external dimensions and base-strut thickness ( t 1 = 1 mm). The only difference was the embedded elliptical stiffener in SEH, enabling a controlled assessment of its mechanical contribution. The embedded stiffener increases the equivalent density of SEH from 0.37 to 0.57 g / cm 3 relative to SH. This added mass is an inherent consequence of internal reinforcement and is consistent with conventional stiffened-panel and lattice core design. The density difference was accounted for using specific modulus and SEA. SEH achieves higher ( E 2 / ρ * ) and SEA than SH, confirming that its performance gains outweigh the added mass and originate from the efficient geometry of the elliptical stiffener rather than material addition alone.

5. Results and Discussion

This section systematically evaluates the compressive response of SEH structures using 3D-EXP, 3D-ECM, and 3D-FEM. Key performance metrics—including deformation modes, stress–strain behavior, energy absorption characteristics, and Poisson’s ratio evolution—are analyzed and compared with star-shaped honeycombs (SH).

5.1. Experimental Results of Multi-Cell Structures

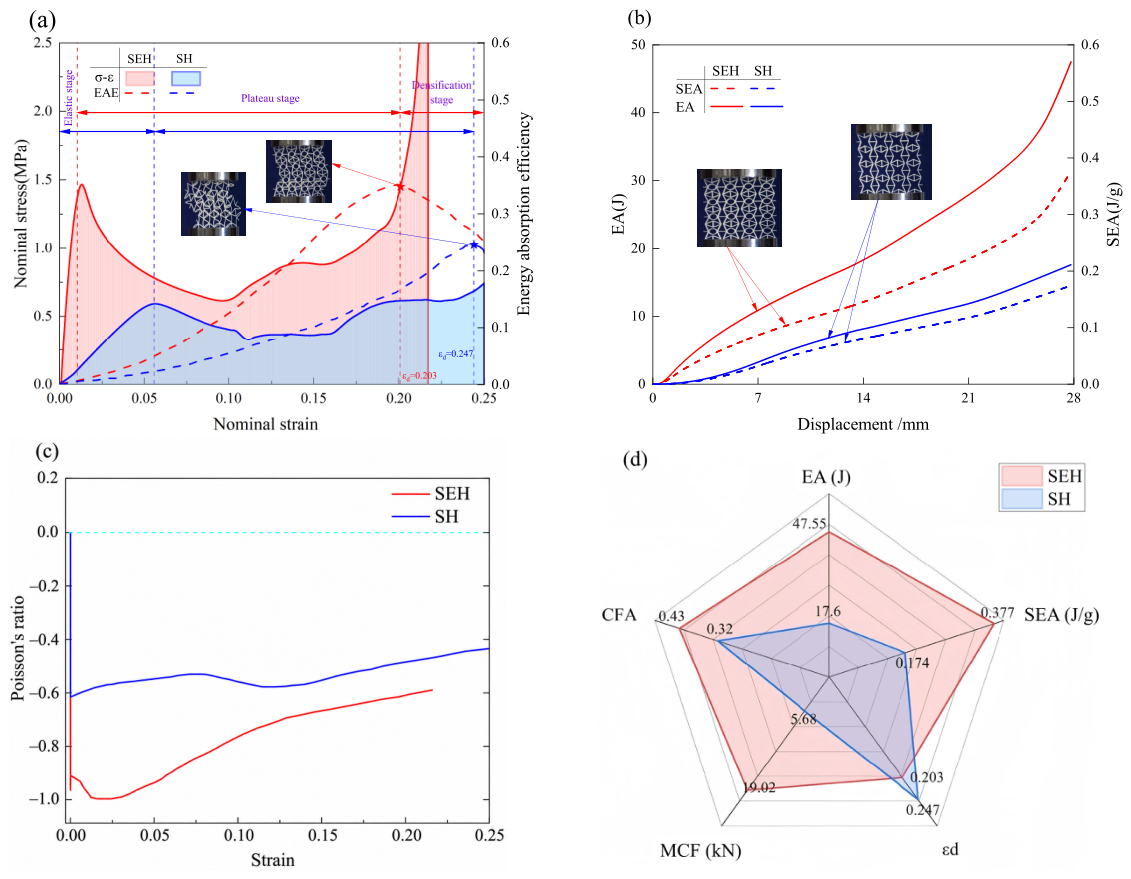
Figure 9a demonstrates that SEH structures exhibit significantly higher compressive modulus (109.72 MPa) compared to SH structures (8.39 MPa), with a more pronounced plateau stage that is critical for energy absorption applications. The SEH absorbs energy more efficiently during compression, showing a 78% increase in energy absorption efficiency (EAE) within the plateau stage. This enhancement is attributed to the SEH’s improved internal network and structural stability, which enable more effective energy dissipation and plastic deformation compared to the SH structure.
Figure 9b compares the EA and SEA of SEH and SH specimens under quasi-static compression. The displacement-EA curve indicates that SEH outperforms SH at all displacement levels, exhibiting higher energy absorption during both initial and advanced deformation stages. Additionally, SEH demonstrates greater SEA, further improving its energy absorption capacity without increased mass. This performance advantage stems from SEH’s optimized elliptical stiffeners, which better withstands and distributes applied loads, enhancing energy absorption efficiency.
Figure 9c shows the evolution of the Poisson’s ratio for SEH and SH structures. The SEH curve exhibits greater local fluctuations than the SH curve. This is a direct manifestation of SEH’s more complex and progressive collapse mechanism. The sequential formation and interaction of multiple plastic hinges (22 hinges per unit cell, as per the model in Section 3.2) between the elliptical stiffener and the star-shaped frame cause dynamic changes in the local deformation field during compression. Each hinge activation represents a minor local instability followed by load redistribution, momentarily affecting the measured strain ratio. In contrast, the SH deforms through a simpler, more monotonic strut-bending mode, resulting in lower fluctuation but also inferior energy absorption efficiency. Importantly, despite the local fluctuations, the SEH maintains a consistently negative average Poisson’s ratio (approximately −0.7), confirming its stable global auxetic behavior, which works synergistically with its high stiffness to achieve exceptional overall performance.
Figure 9d presents a radar chart comparing the energy absorption performance and related metrics of SEH and SH structures. SEH outperforms SH in several key metrics, including EA, SEA, and CFE, consistent with its superior mechanical performance in the stress–strain response and energy absorption efficiency. The higher values for SEH suggest that its design—featuring optimized cell geometry and material distribution—enhances energy dissipation and mechanical stability. Moreover, SEH’s superior performance in MCF further supports its structural robustness, enabling it to withstand higher loads and provide better protection in practical applications.

5.2. Elastic Behaviors

5.2.1. FE Model Validation

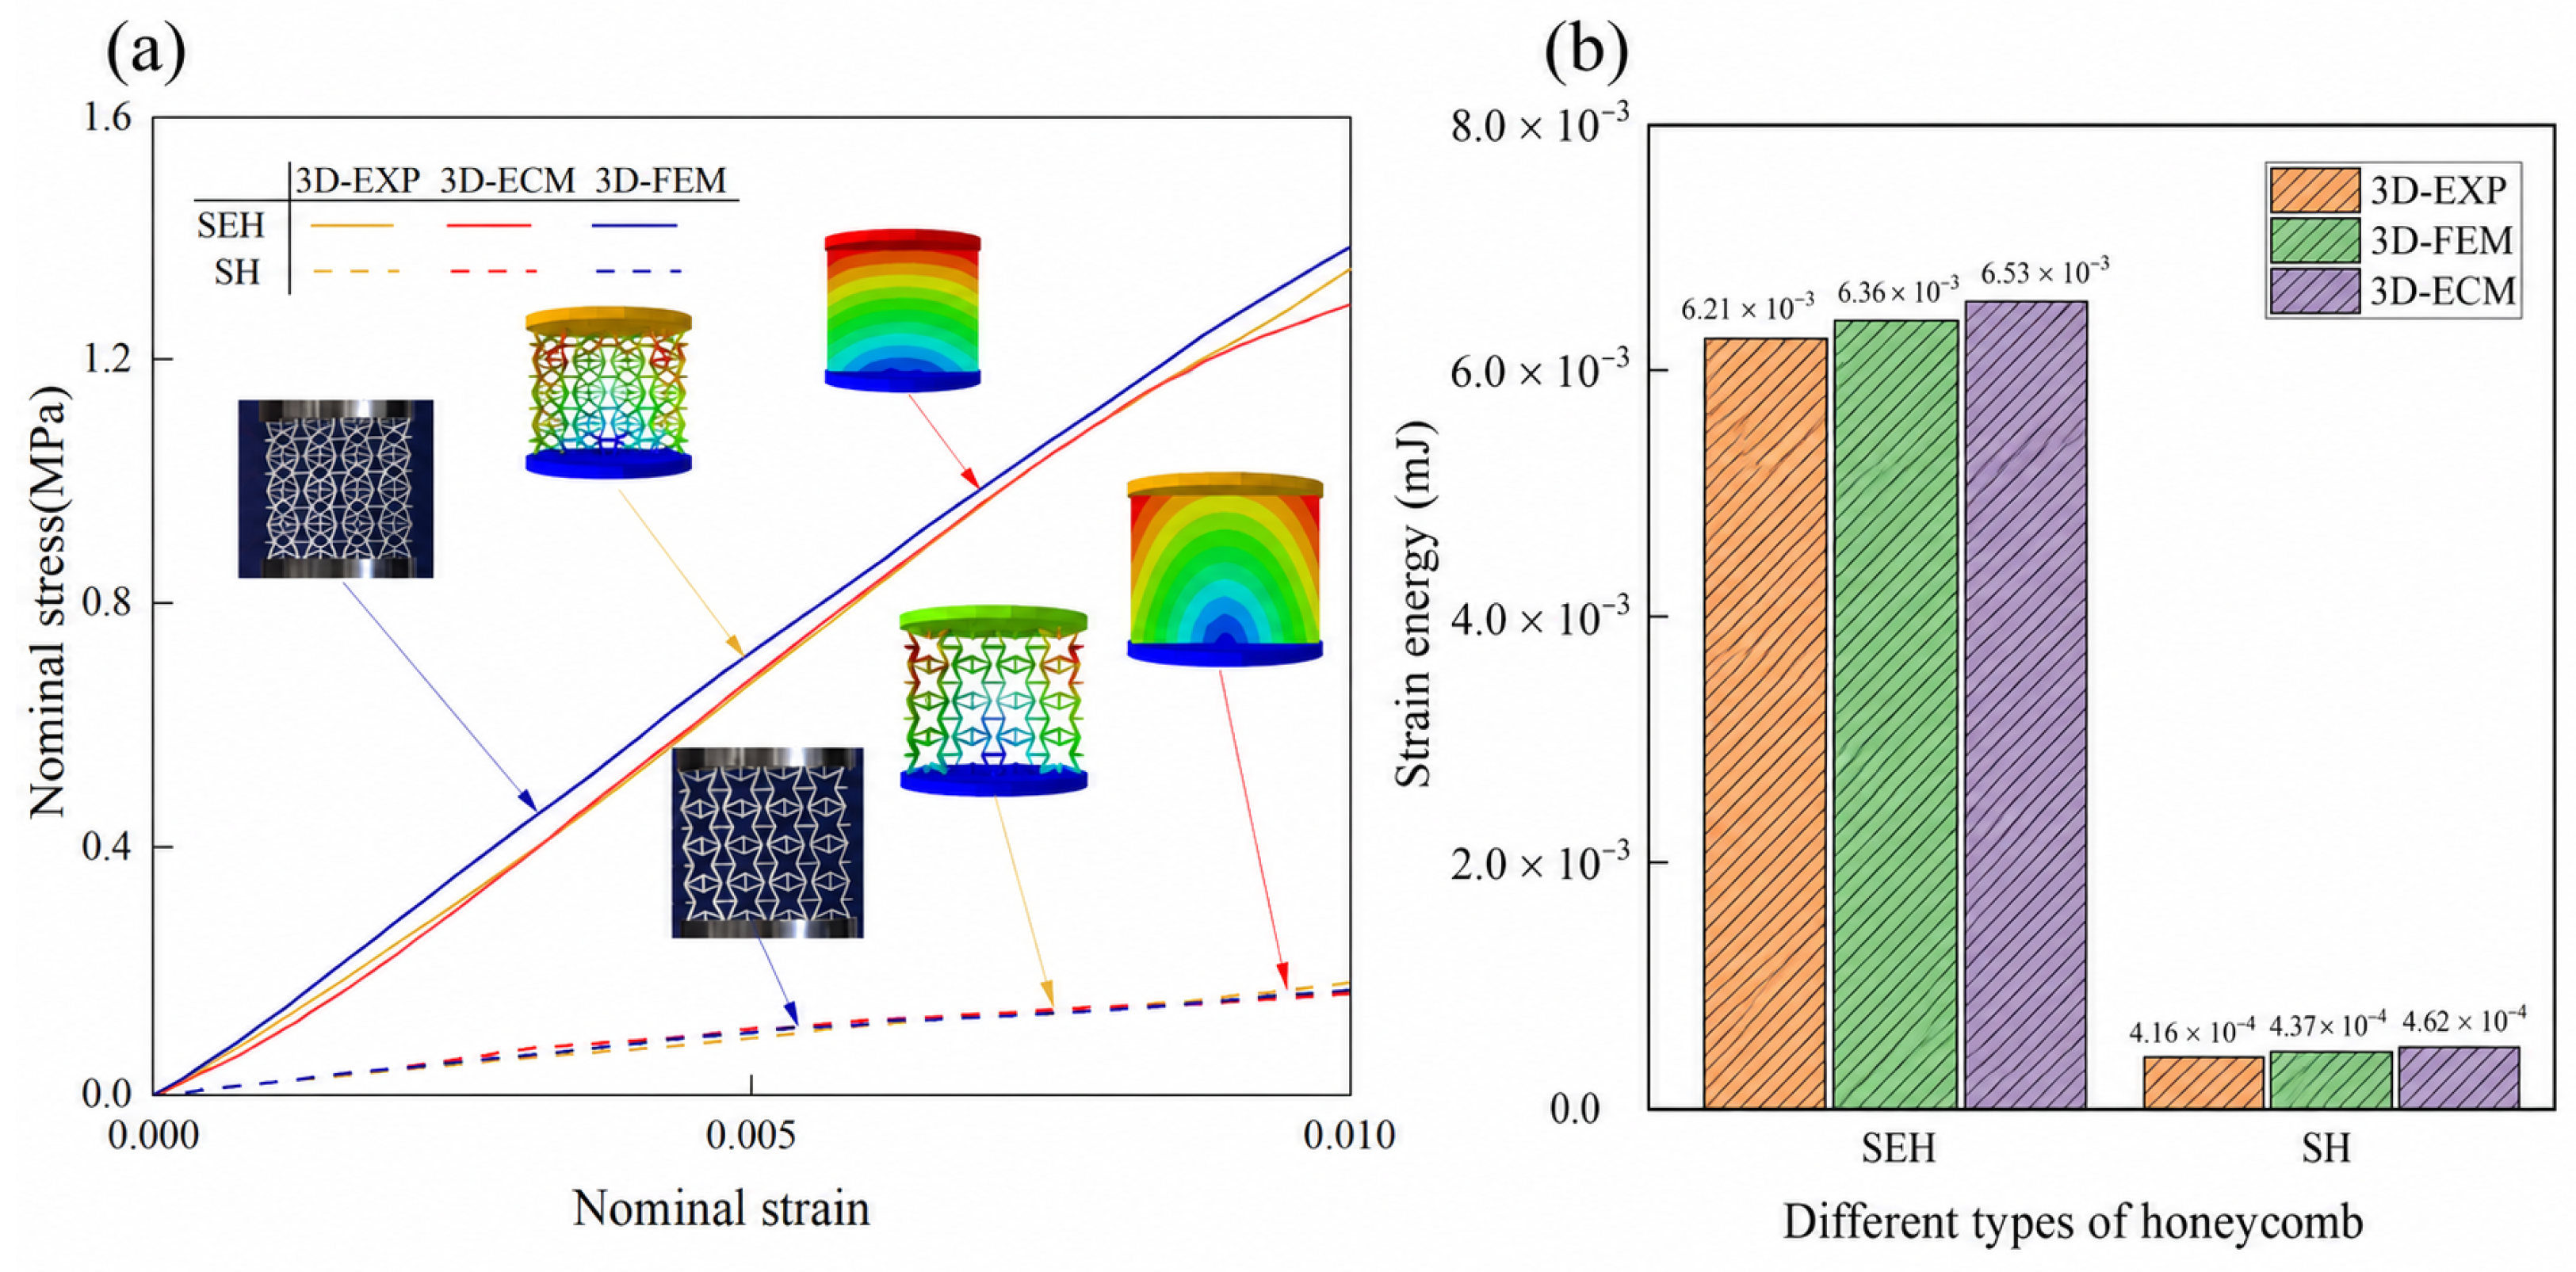
Figure 10a shows that both 3D-EXP (experimental), 3D-FEM (finite element method), and 3D-ECM (equivalent model) simulations display consistent behavior, confirming the effectiveness of the FE model in predicting the SEH’s mechanical performance. The nominal stress–strain curves indicate that the elastic modulus of the SEH is nearly 13 times higher than that of the SH, a result primarily attributed to the integration of elliptical stiffeners within the SEH. Figure 10b shows that SEH exhibits significantly higher strain energy absorption compared to SH, reaching up to 0.0063 mJ at ε 22 = 0.01. This highlights SEH’s superior energy absorption capability during the elastic stage, making it ideal for impact resistance applications.
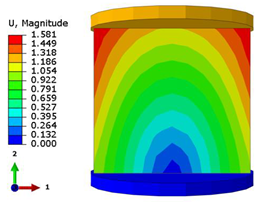
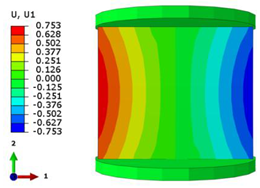
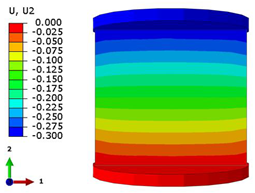
Table 5 highlights significant differences in the mechanical behavior of SEH and SH structures, as predicted by 3D-FEM and 3D-ECM. The displacement magnitudes (U) indicate that the SEH structure experiences greater deformation compared to SH, due to the elliptical stiffeners that enhance stiffness while allowing more localized deformation. The displacements in the 1-direction ( U 1 ) and 2-direction ( U 2 ) further demonstrate the SEH’s superior energy absorption capabilities, with higher displacement values in both directions, especially in the 3D-FEM results. The 3D-ECM closely matches the 3D-FEM predictions, confirming its suitability for predicting the SEH’s mechanical behavior.
Table 6 compares the mechanical properties of SEH and SH structures at a strain of ε 22 = 0.01 , revealing significant differences in E 2 and ν 21 . The SEH exhibits a markedly higher E 2 , confirming its superior stiffness in the 2-direction due to the presence of the elliptical stiffeners, which effectively enhance load transfer and structural rigidity. Moreover, SEH shows a more negative ν 21 , indicating stronger lateral expansion under compression and thus a more pronounced auxetic effect compared with SH.
The novelty of the proposed VAM-based 3D-ECM lies in its dimensional completeness, computational efficiency, field recovery capability, and geometric applicability. Unlike conventional 2D VAM-based plate models developed mainly for sandwich panels, the proposed 3D-ECM represents the full three-dimensional response of bulk cellular media and accounts for coupled in-plane and out-of-plane deformation. Relative to the detailed 3D-FEM, the model reduces computational time to 16.4–17.8% and storage requirements to 18.6–31.9%, while limiting the minimum relative error to 1.53%. Its efficiency is therefore comparable to or greater than that achieved in recent VAM analyses of SRH and elliptical arc hybrid honeycombs.
More importantly, the recovery relations reconstruct local stress and strain distributions within the unit cell, allowing the model to connect homogenized behavior with the underlying interaction between the elliptical stiffener and star-shaped framework. To the best of the authors’ knowledge, this is the first VAM-based three-dimensional equivalent model developed for a star-shaped honeycomb containing an embedded elliptical stiffener, thereby broadening the applicability of VAM to complex bioinspired metamaterial architectures.

5.2.2. Parameter Influence Analysis

The mechanical performance of SEH structures is strongly influenced by various geometric parameters. Using the validated 3D-ECM, this section examines the impact of five key parameters—star angle θ , elliptical aspect ratio m = a / b , slenderness ratio n = 10 t 1 / l 2 , length ratio k = l 1 / l 2 , and thickness ratio c = t 2 / t 1 —on the engineering constants and effective density of SEH structures. Table 7 summarizes the variation ranges of these parameters. The geometric parameter ranges were selected based on geometric feasibility, manufacturing constraints, theoretical stability, and coverage of the relevant performance trends. Geometric feasibility was first ensured through the non-overlap condition in Equation (3), which constrains the coupled parameters m and k. For FDM-printed ABS, n = 10 t 1 / l 2 and c = t 2 / t 1 were selected as 1.1–1.5 and 0.5–1.5, respectively, to satisfy printability while spanning flexible-to-stiff configurations. The star angle was limited to 40° θ 60°, outside which auxeticity weakens or geometric self-locking becomes significant.
The selected ranges also encompass the main transitions in mechanical response. The range m = 1.1∼1.5 captures the shift from stiffness- to auxeticity-dominated behavior, with an optimal balance at m = 1.3 . Similarly, k = 1.7∼2.1 spans shear-dominated failure to bending-dominated progressive folding, while c = 0.5∼1.5 covers premature buckling to early densification, with maximum energy absorption at c = 1.0 . Thus, the design space captures the principal stiffness–auxeticity–energy absorption trade-offs while satisfying geometric, manufacturing, and application constraints.
The star angle primarily influences strut orientation and load transfer paths, while the slenderness ratio governs buckling resistance and bending stiffness. These parameters collectively affect load distribution, structural stability, and energy absorption performance.
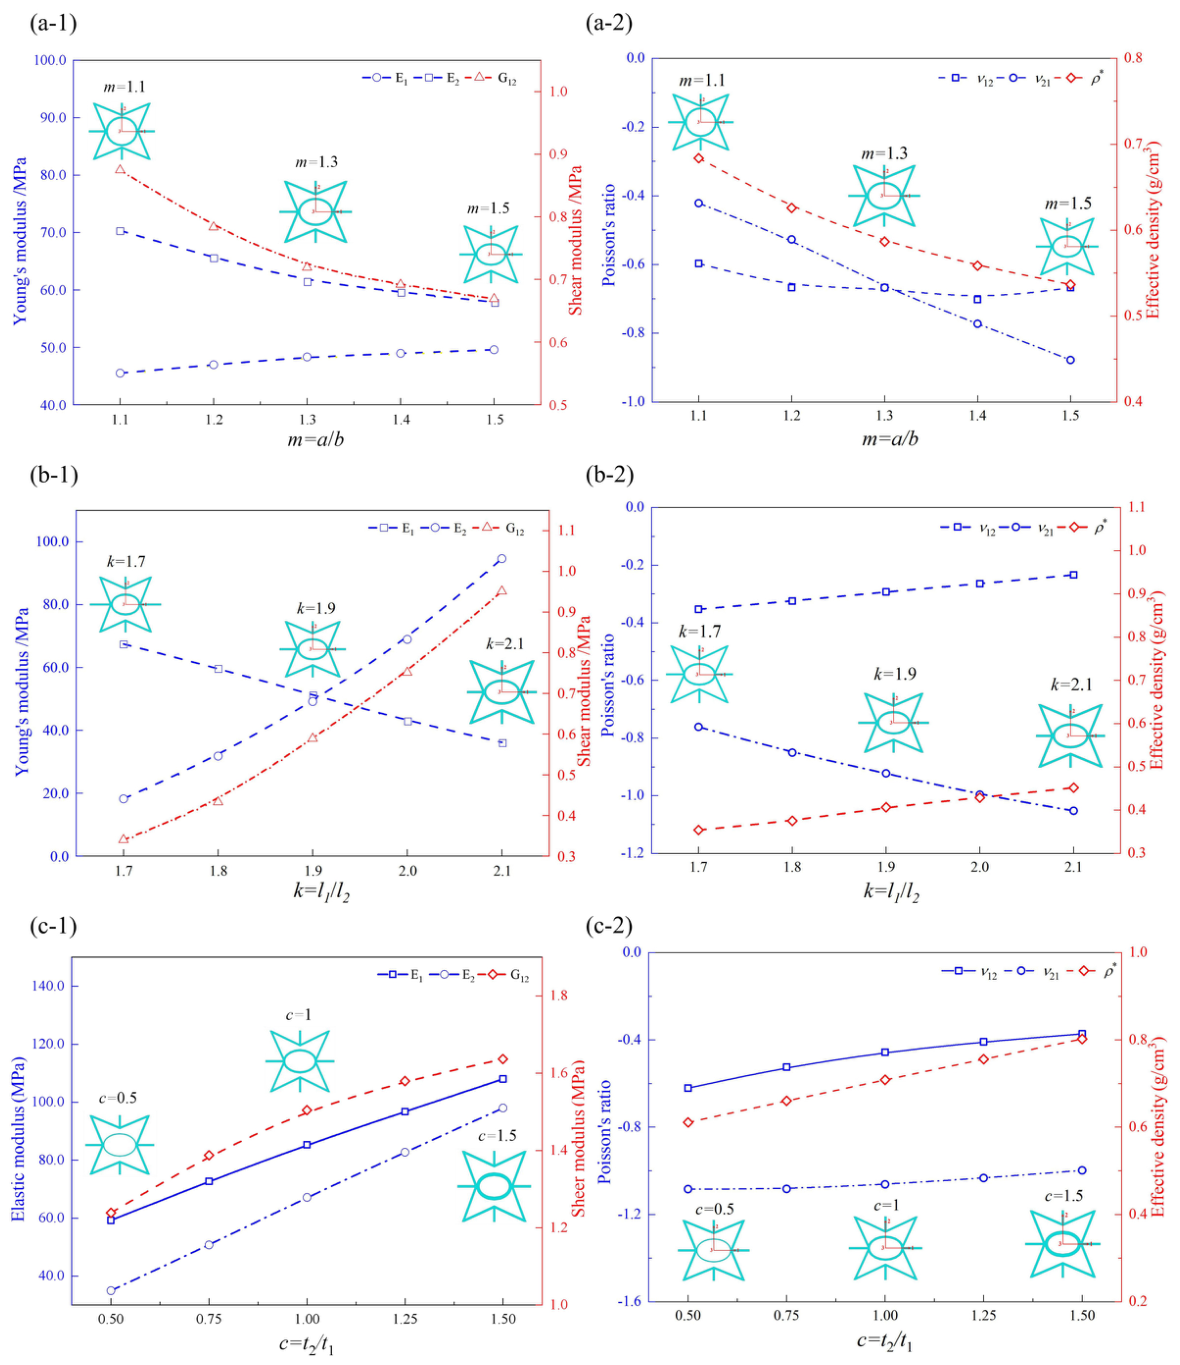
Figure 11(a-1) presents the variation of the engineering elastic constants (elastic modulus and shear modulus) of the SEH structure with respect to the elliptical aspect ratio m. By adjusting the value of m, the shape of the elliptical stiffener can be changed. The lower ellipticity ratio (i.e., small m) results in the stiffener approaching a circular shape, leading to a noticeable increase in both elastic modulus and shear modulus. Specifically, the 2-directional modulus ( E 2 ) and the shear modulus G 12 show a significant decreasing trend, whereas E 1 remains relatively unchanged. The transition from an elliptical to a more circular shape strengthens transverse load-bearing capacity, thereby significantly increasing structural stiffness.
Figure 11(a-2) shows the influence of elliptical aspect ratio on Poisson’s ratio and effective density. Both ν 12 and ν 21 become more negative as m increases, indicating a stronger auxetic effect. Larger m values reduce vertical stiffness, while the elliptical stiffener offers greater buffering capacity. This change facilitates pronounced transverse expansion through inward rotation of the elliptical unit when loaded in the 1-direction, thereby enhancing auxetic behavior. The effective density of the SEH structure decreases with increasing m, as a higher aspect ratio reduces the volume of voids within the structure, resulting in a more compact design. Nevertheless, the overall stiffness remains primarily governed by the geometric properties of the elliptical stiffener, which provides substantial transverse support while balancing stiffness and density.
Figure 11(b-1) shows the elastic constants of the SEH structure vary with the length ratio k = l 1 / l 2 . A decrease in k (longer horizontal ligaments) increases the elastic modulus E 1 but reduces the shear modulus G 12 , due to stress concentration at the corners. Conversely, an increase in k (shorter horizontal ligaments) enhances both E 2 and G 12 , as the inclined struts and elliptical stiffeners bear more load and dissipate shear stress through hinge mechanisms. Figure 11(b-2) shows that increasing k reduces | ν 12 | (weakening auxetic effect in the 2-direction) but raises | ν 21 | (enhancing auxetic behavior in the 1-direction). This opposing trend arises due to the stiffness anisotropy induced by variations in k: a higher k significantly enhances the 2-directional elastic modulus ( E 2 ), while reduces the transverse strain response under 1-directional loading. The relationship is governed by the reciprocal theorem of anisotropic elasticity, ν 12 / E 1 = ν 21 / E 2 , which couples the Poisson’s ratios with the directional moduli. The effective density remains nearly unchanged as k varies, due to minimal material redistribution.
Figure 11(c-1) demonstrates the variation of elastic and shear moduli with the thickness ratio c = t 2 / t 1 . Increasing stiffener thickness (higher c) significantly enhances both moduli, due to the enhanced stiffness and load capacity provided by thicker stiffeners. The cooperative deformation between the elliptical stiffeners and the inclined struts further contributes to this stiffness increase. Figure 11(c-2) indicates that both Poisson’s ratio and effective density rise with increasing c. Thicker stiffeners reduce pore volume and restrict deformation, leading to higher density, though the effect on Poisson’s ratio is moderate. These results suggest that stiffener thickness predominantly influences structural stiffness and density, with limited impact on auxetic behavior.

5.3. Crushing Behaviors

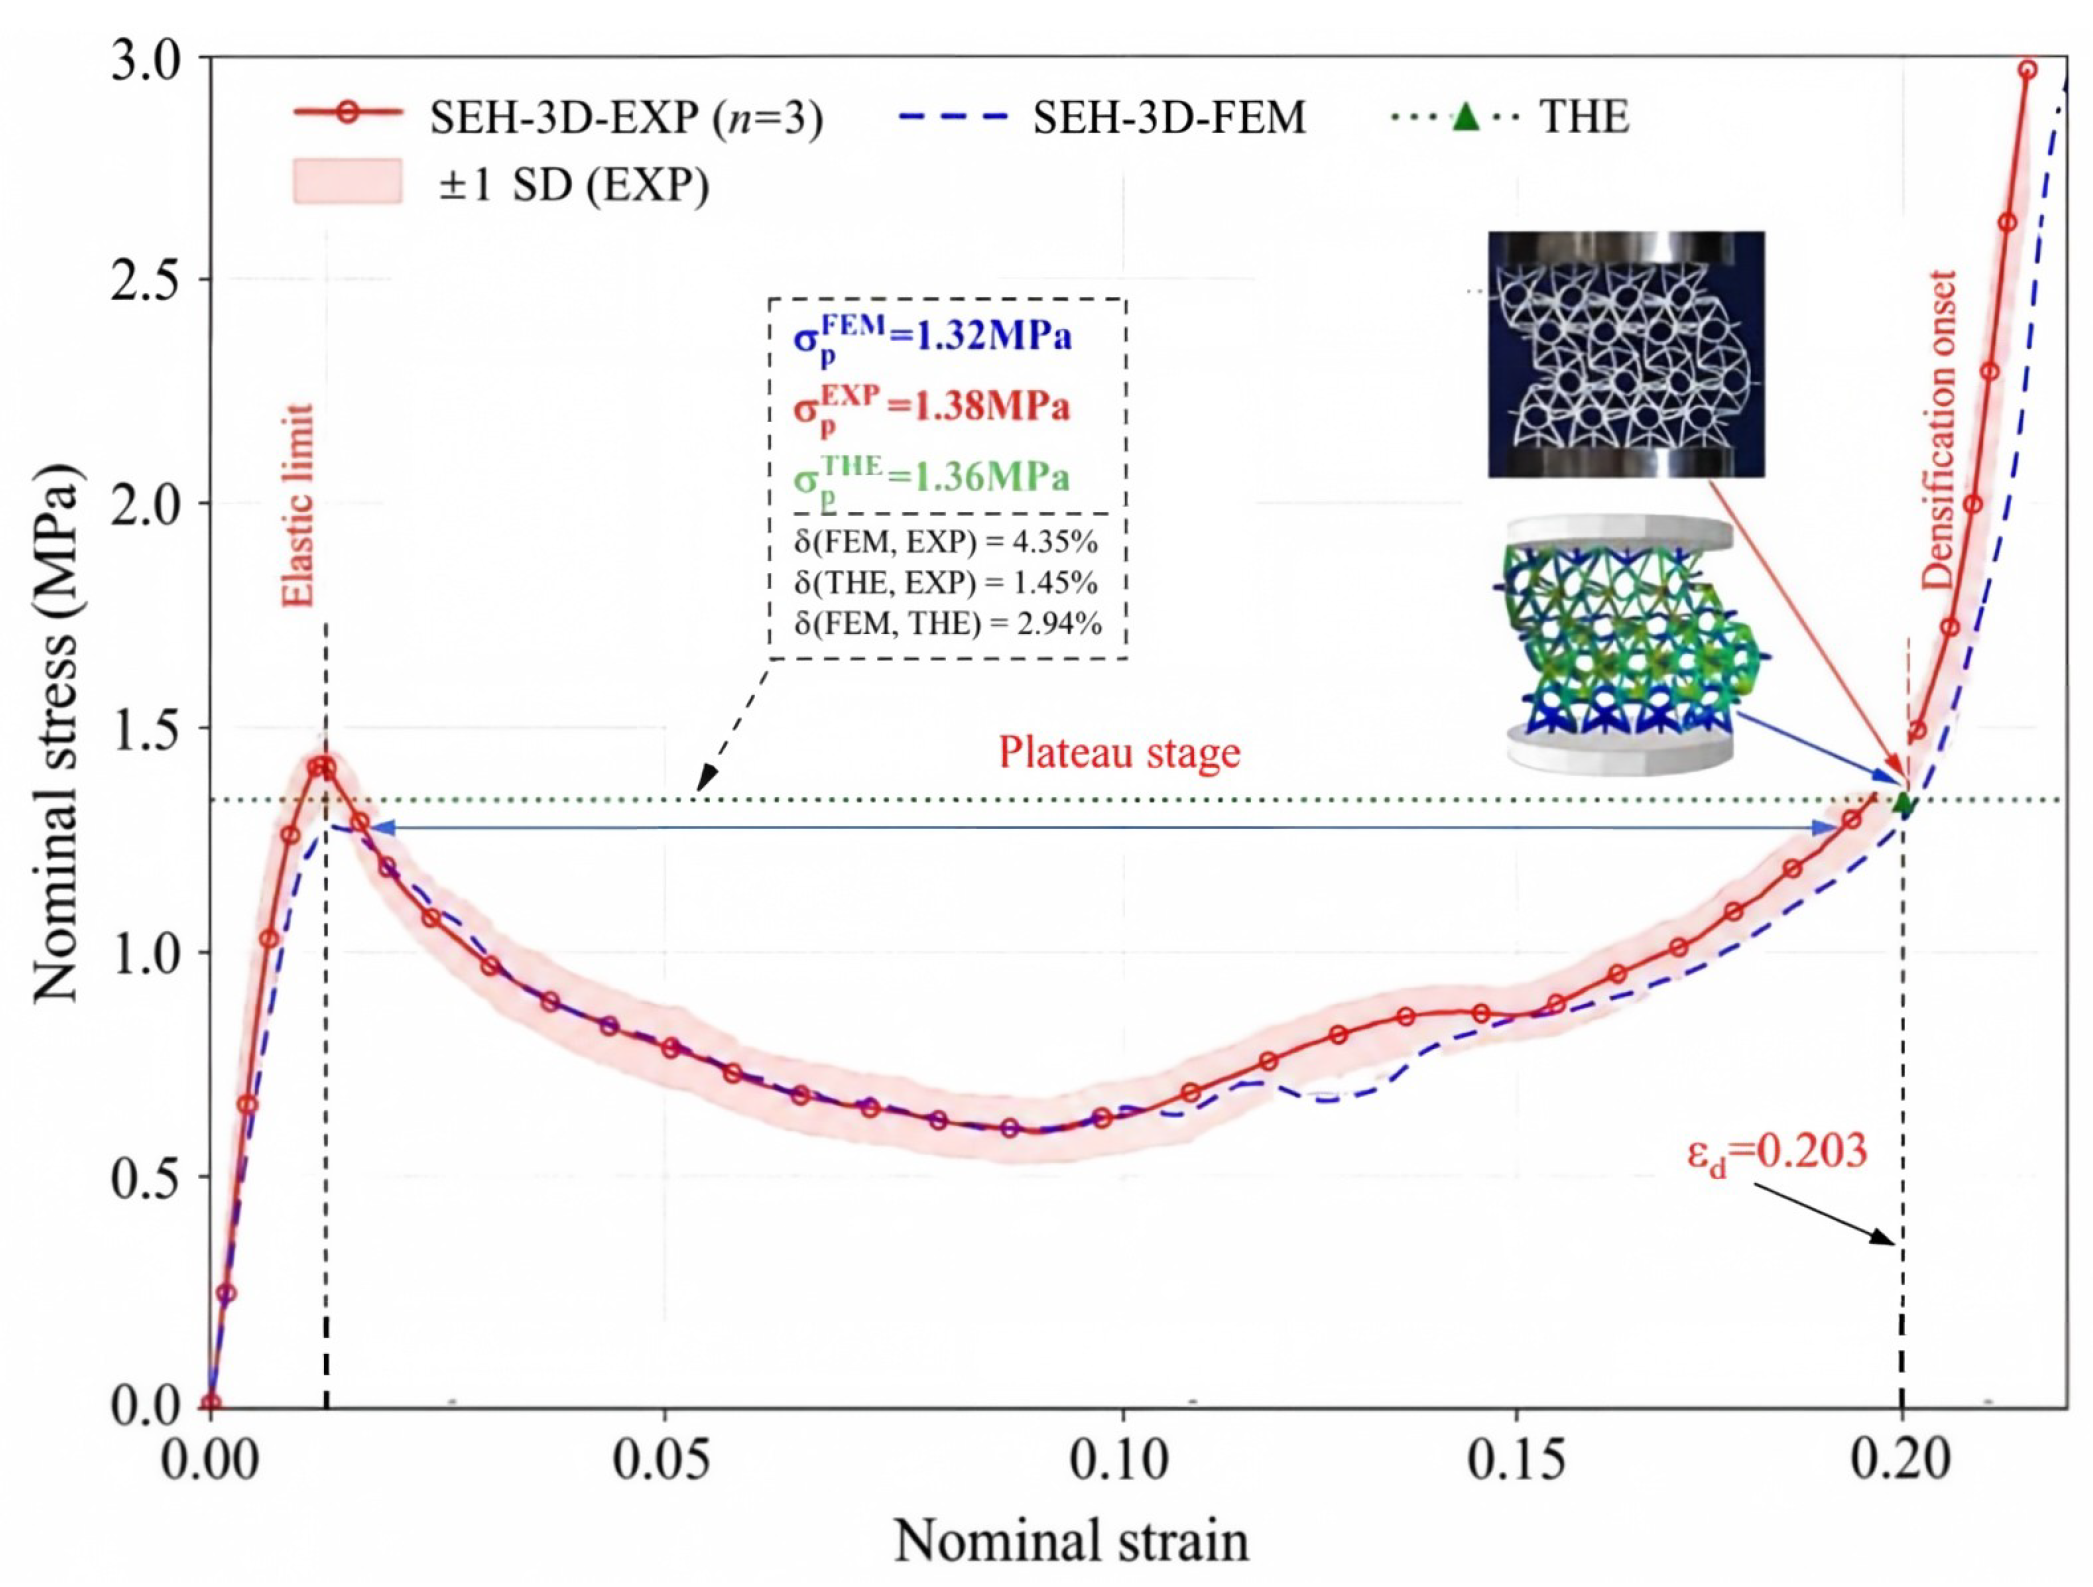
Figure 12 illustrates the nominal stress–strain response of the multi-cell SEH under quasi-static loading, comparing results from experiments (3D-EXP), 3D-FEM simulations, and theoretical predictions (THE). The experimental curve exhibits a clear elastic region, a stable plateau, and eventual densification, all of which are faithfully reproduced by the 3D-FEM simulation. The experimental repeatability band (±1 SD) is narrow, indicating high consistency among the three printed specimens. As the strain progresses into the plateau stage, the stress continues to rise at a considerably reduced rate, reflecting substantial energy absorption via plastic deformation. The incorporation of elliptical stiffeners promotes progressive folding in the SEH structure, effectively distributing the load and facilitating lateral expansion. In this stage, the experimental plateau stress ( σ p EXP = 1.38 MPa) is marginally higher than those obtained from FEM ( σ p FEM = 1.32 MPa) and theoretical analysis ( σ p THE = 1.36 MPa), which can be attributed to minor discrepancies arising from material imperfections, geometric tolerances, and boundary conditions. Notably, the relative deviation between the experimental and theoretical plateau stresses remains below 5%, affirming the reliability of the theoretical model. These results unequivocally validate the reliability of the proposed 3D-ECM and the theoretical plateau stress model for the SEH, providing a solid foundation for subsequent parametric studies and performance comparisons.

5.3.1. Deformation Modes and Mechanisms

Table 8 compares the deformation modes of multi-cell SEH and SH structures under quasi-static compression at different strain levels. The close agreement between 3D-EXP and 3D-FEM validates the accuracy of the finite element model in capturing the macroscopic mechanical behavior of the structures. The SEH undergoes progressive deformation: the upper layers bend to the left and the lower layers to the right, forming a distinct “S”-shaped deformation mode. At ε 22 = 0.16, localized buckling becomes evident in the middle layers, signaling the onset of failure. Further loading leads to densification of the lower layers. Notably, at ε 22 = 0.203, brittle fracture occurs at the overlap between the star-shaped corners and horizontal ligaments, attributable to material defects and the limited plastic deformation capacity of ABS plastic under high stress concentrations.
In contrast, the SH exhibits more uniform deformation, bending diagonally and transitioning into densification beyond ε 22 = 0.19. This difference stems primarily from the elliptical stiffeners in the SEH, which introduce additional hinges that promote localized buckling and the formation of densified bands. These bands serve as stress concentrators and propagate downward via progressive folding. This mechanism enables the SEH to absorb energy through multi-stage folding, making it well-suited for dynamic impact protection.
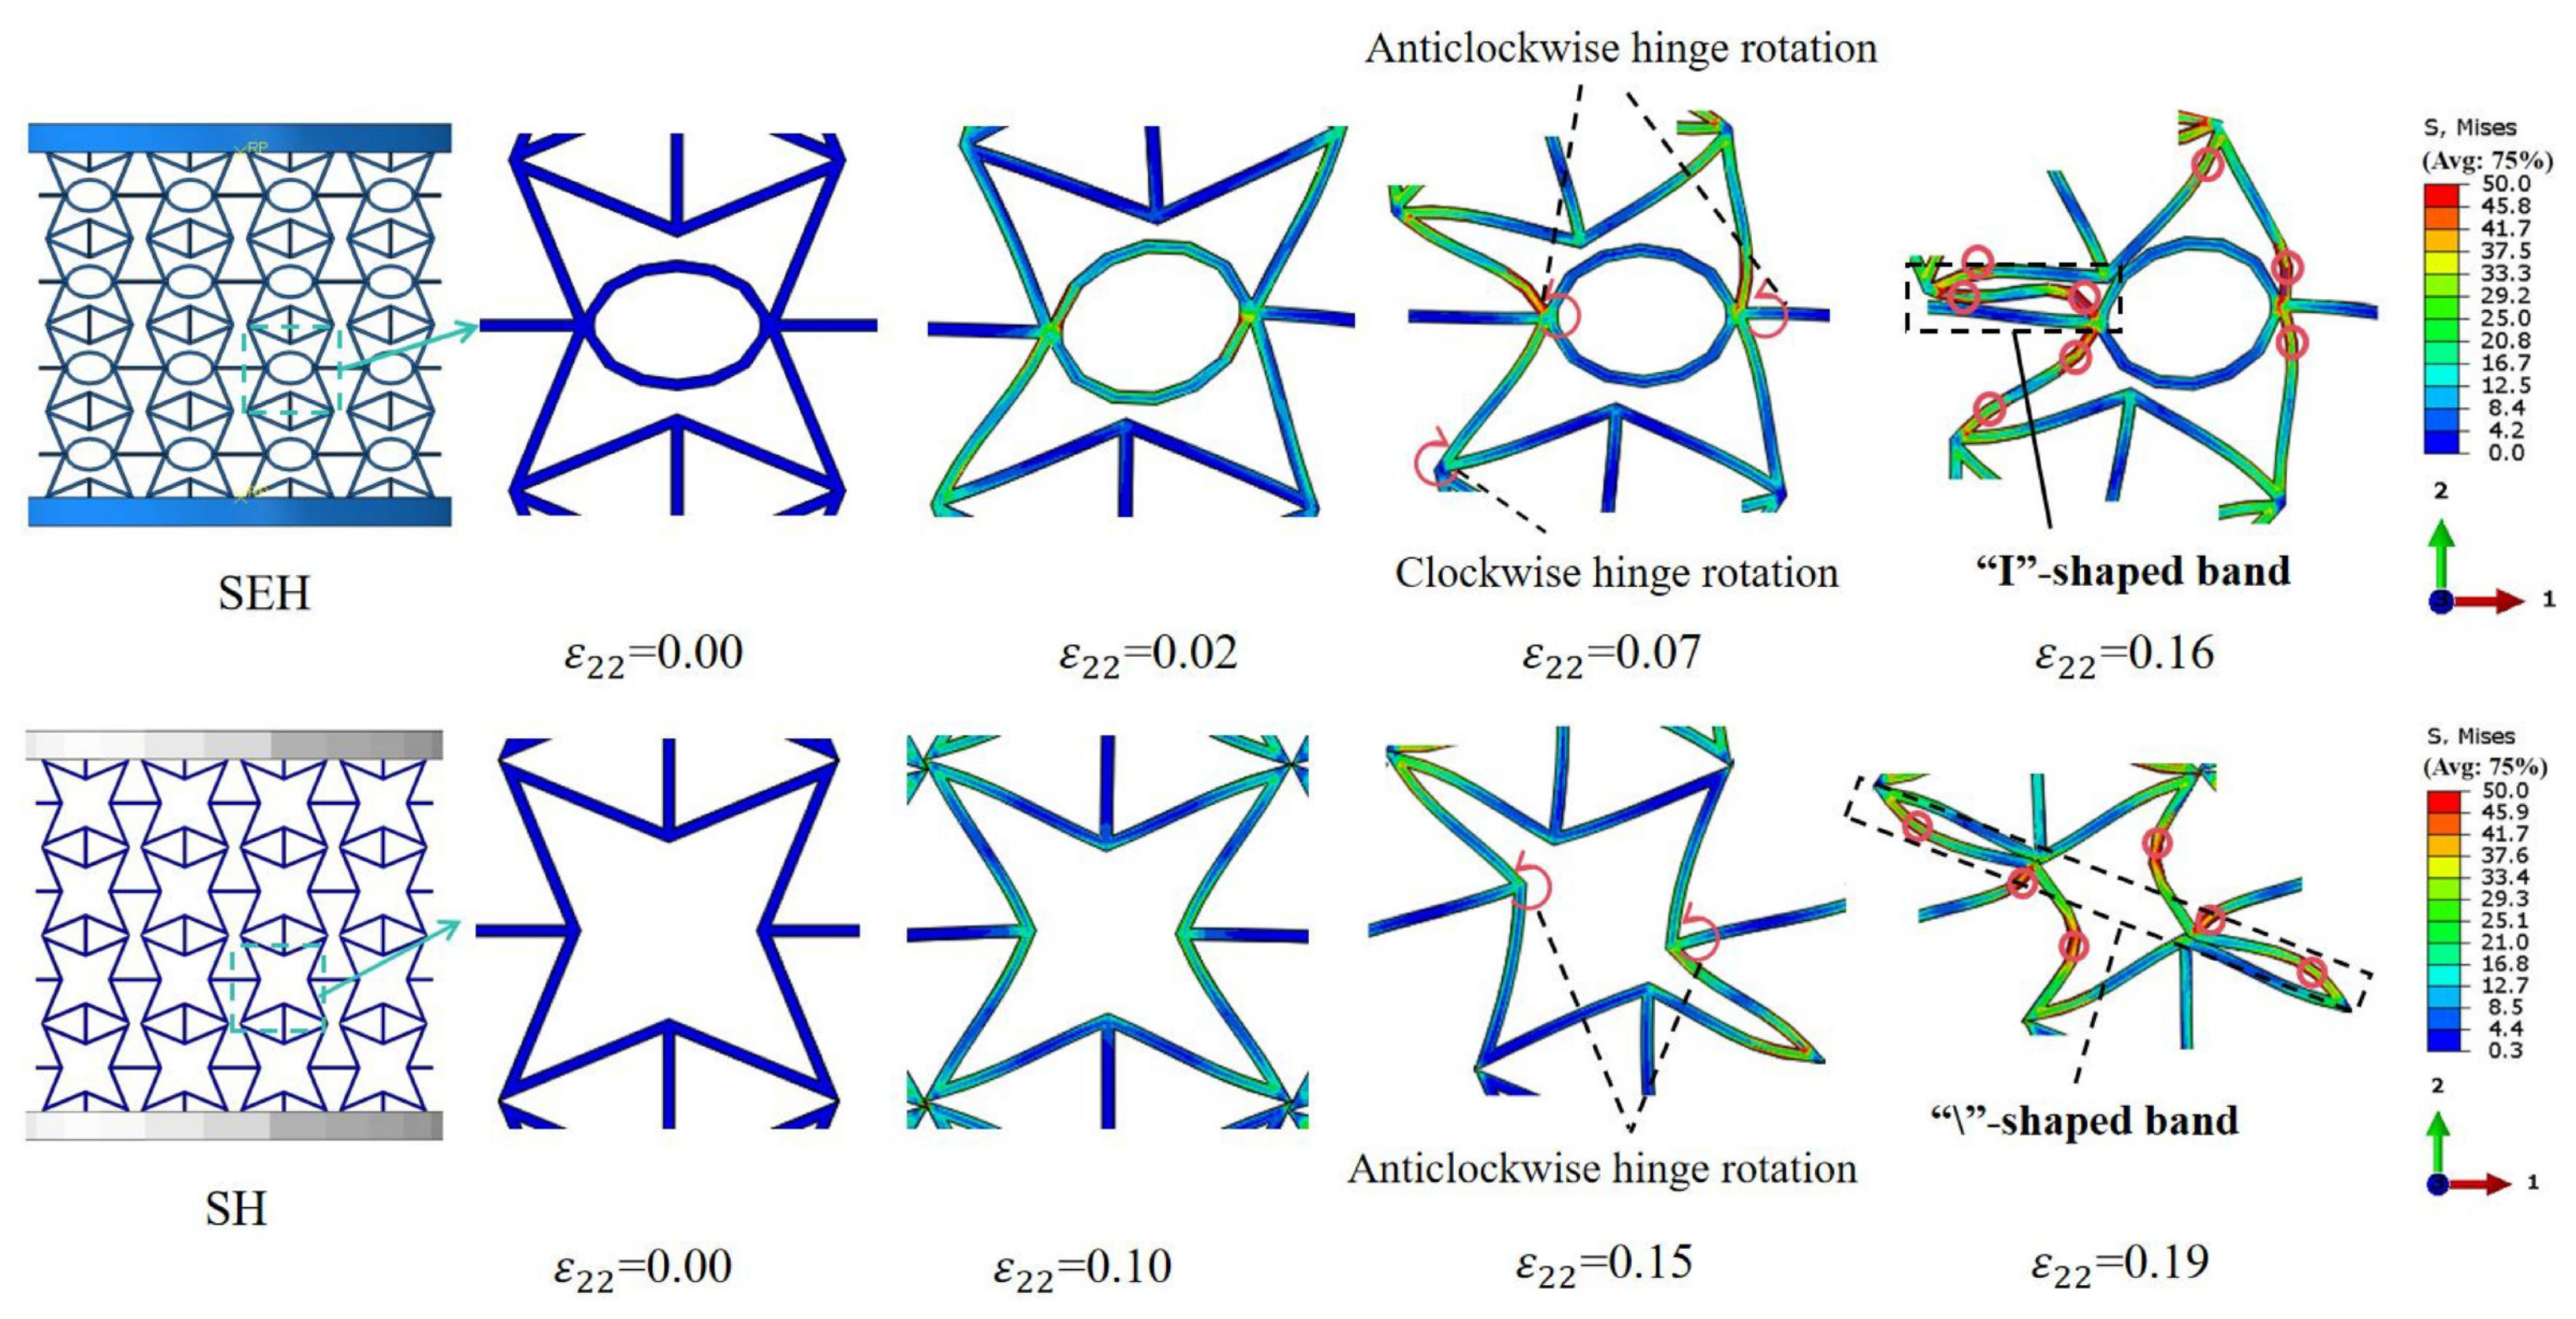
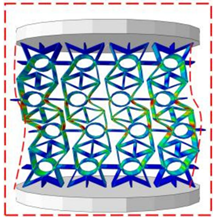
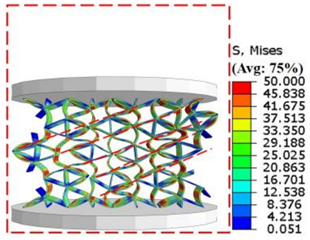
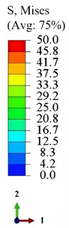
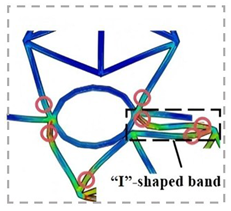
Figure 13 illustrates the local stress distribution and deformation modes of SEH and SH cells under quasi-static compression. At a low strain level ( ε 22 = 0.02 ), the SEH exhibits stress predominantly distributed along the elliptical stiffeners, with pronounced concentration at the intersections of horizontal ligaments and inclined struts, reaching a maximum value of 42.67 MPa. In contrast, the SH shows stress primarily localized along the inclined struts, with peak values of 29.17 MPa occurring at the junctions between the struts and horizontal members. The SEH exhibits more uniform stress distribution overall, though with higher stress concentrations at specific locations, due to the supportive role of the elliptical stiffeners during compression.
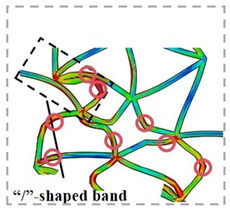
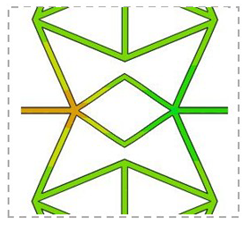
Upon entering the plateau stage, the SEH cell displays reverse “C”-shaped bending, with clockwise hinge rotation in the lower part and counterclockwise rotation in the mid-upper region. The SH cell deforms diagonally with a clear counterclockwise hinge rotation. As densification progresses, the upper-left region of the SEH cell forms an “I”-shaped band, signifying interlayer folding and gradual collapse. In contrast, the SH cell forms a “/”-shaped densification band, reflecting a global shear-slip mechanism followed by overall compressive densification.
In short, the deformation mechanism of SEH is distinct from conventional star-shaped or stiffened honeycombs. The embedded elliptical stiffener acts as a coordinating core that guides the sequential buckling of surrounding struts, leading to a progressive layer-by-layer folding rather than global shear failure. This mechanism results in a more stable plateau stress and enhanced energy dissipation through distributed plastic hinge formation, which is a direct consequence of the elliptical geometry’s ability to redistribute stress.

5.3.2. Effects of Key Parameters on the Crushing Behaviors

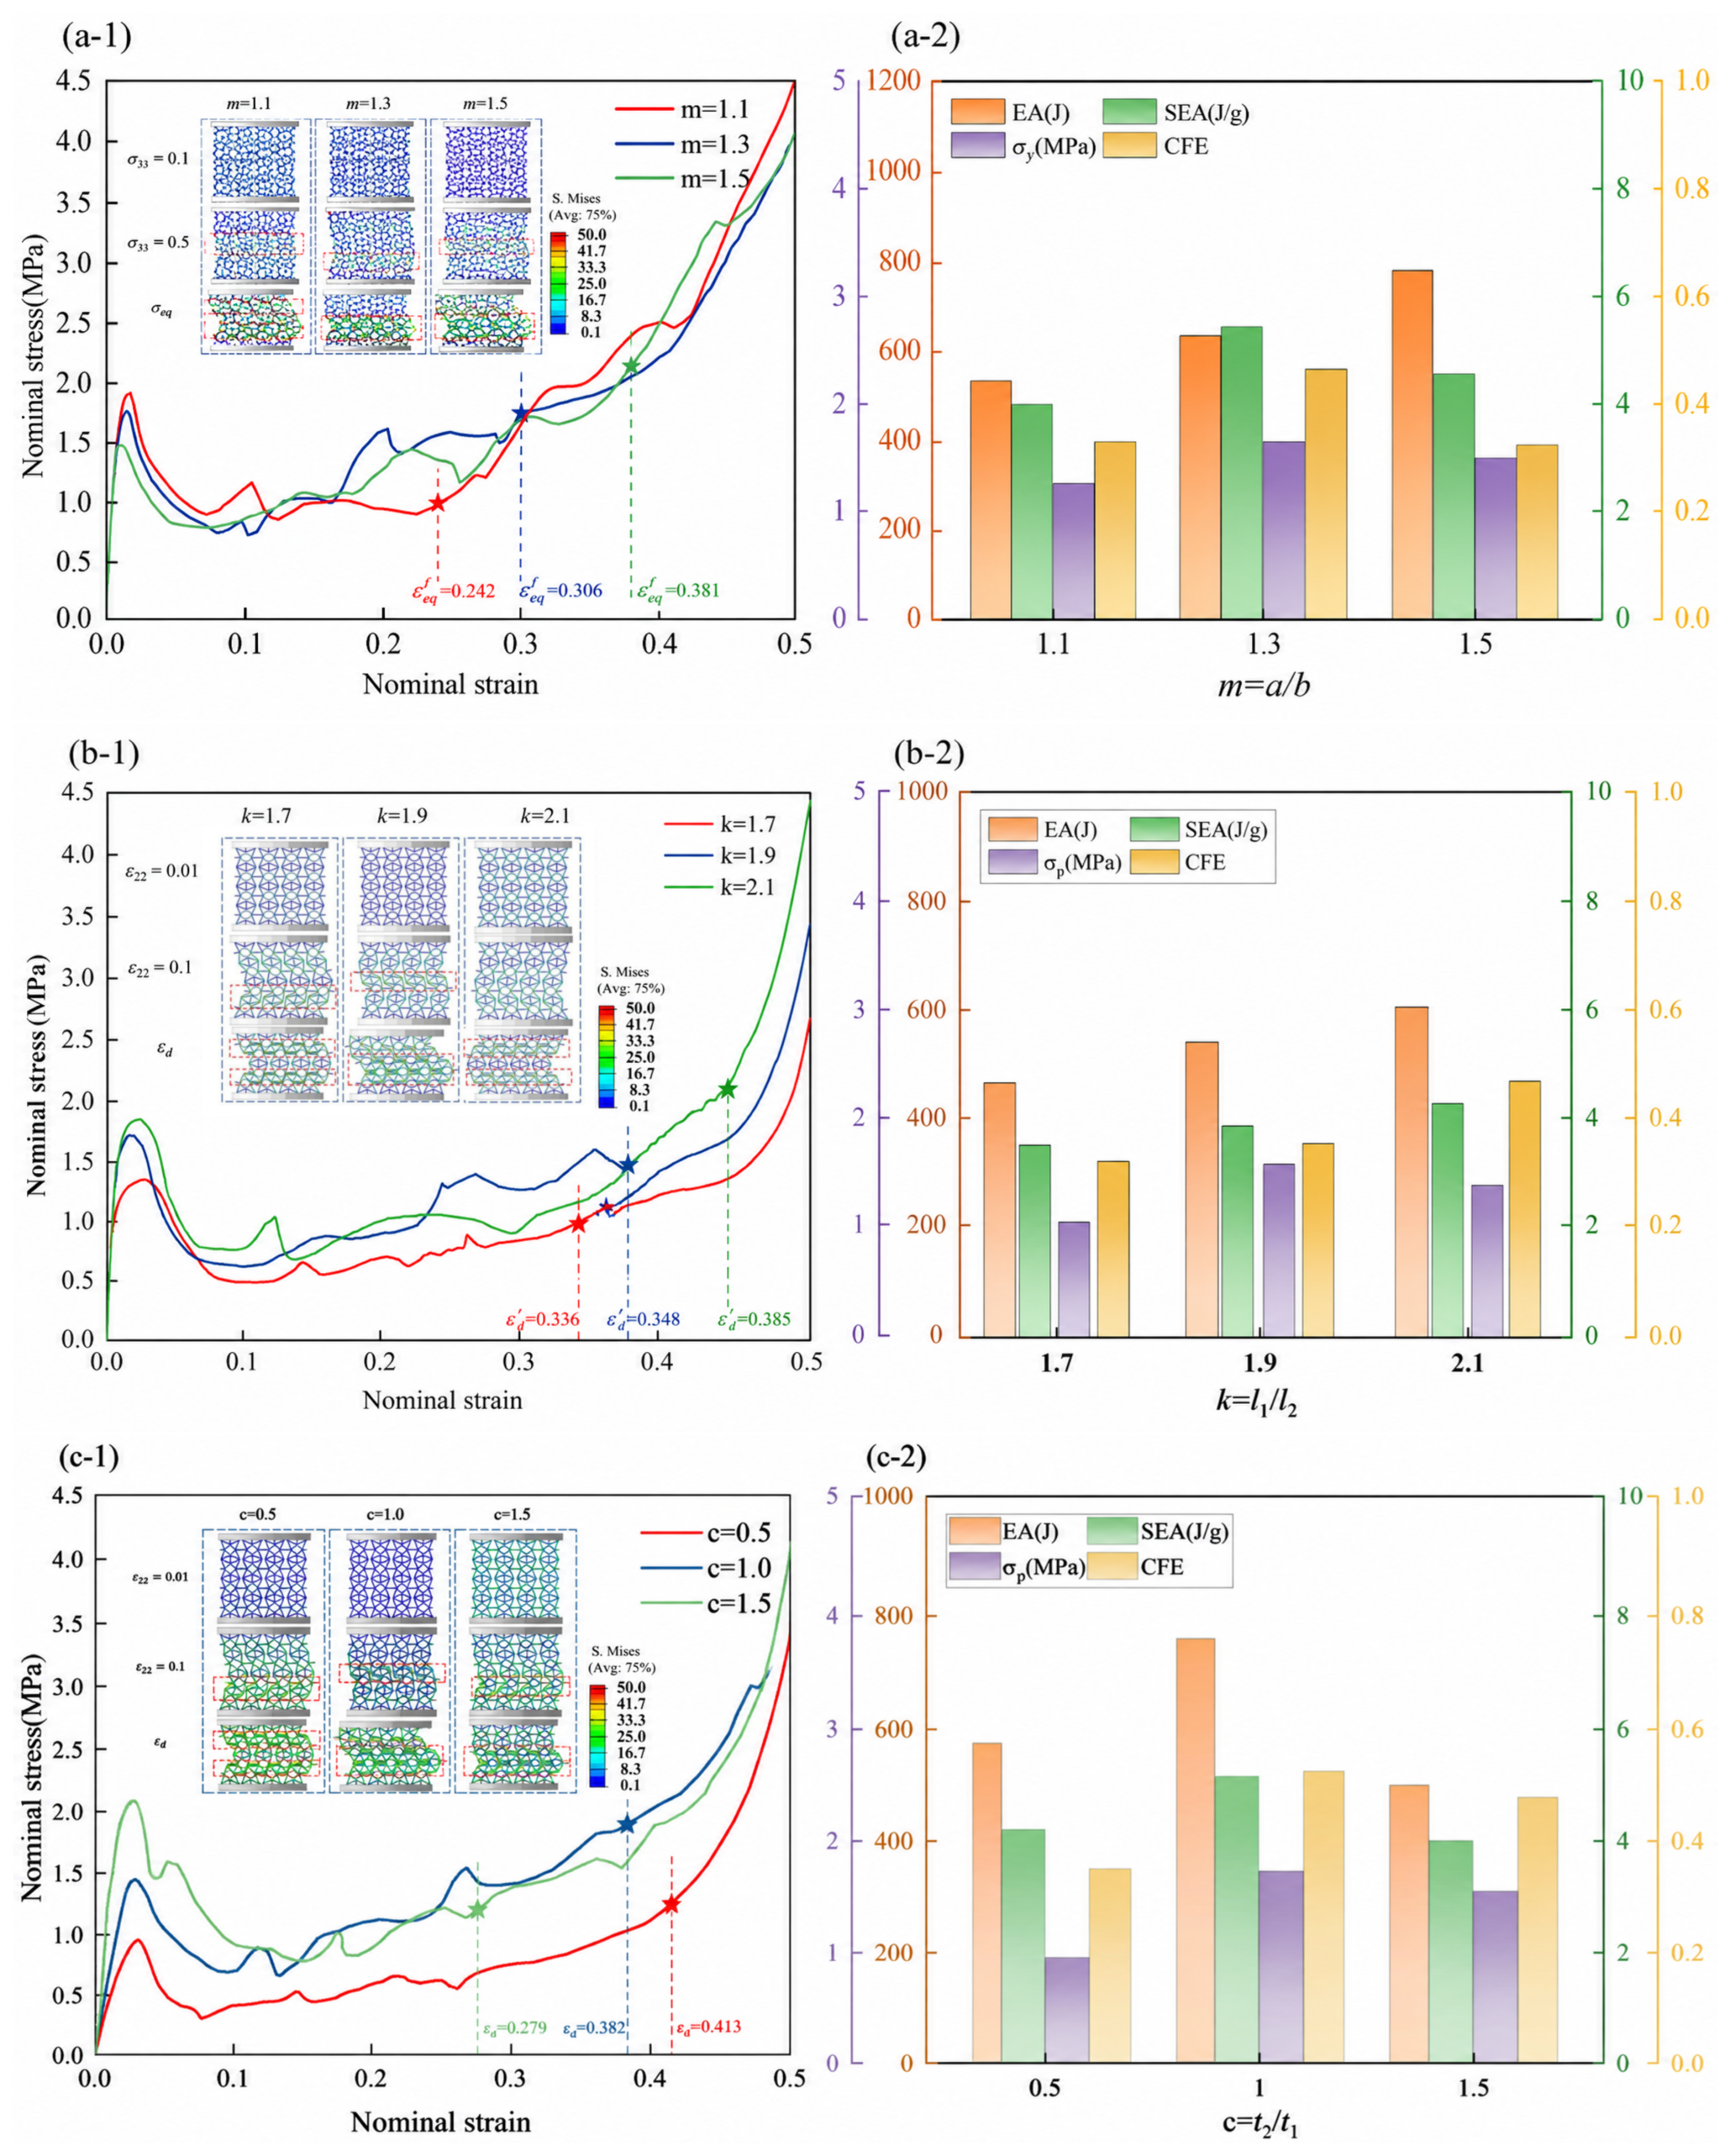
Figure 14(a-1) shows that during the plateau stage, the initiation location of local buckling varies with the elliptical aspect ratio m. For m = 1.1 and m = 1.5, buckling initiates in the middle of the structure, whereas for m = 1.3, it begins in the lower section. For m = 1.1, the near-circular stiffeners provide strong vertical support, resulting in higher initial stiffness. However, the stress–strain curve shows pronounced fluctuations, indicating a tendency toward localized failure and dispersed deformation. In contrast, at m = 1.5, the flattened stiffeners offer reduced support, leading to slightly lower stiffness, yet the stress response is smoother due to more regular geometry and reduced stress concentration, promoting cooperative structural failure.
Figure 14(a-2) further demonstrates that the SEA is maximized at m = 1.3, owing to an optimal geometric configuration that enhances plastic hinge rotation and interfacial friction, allowing more complete deformation. At m = 1.1, the structure behaves in a geometrically rigid manner, leading to premature failure, while at m = 1.5, excessive localized failure reduces residual load-bearing capacity. At m = 1.3, both plateau stress and CFE are higher, as the structure maintains initial load capacity through collaborative load transfer and mitigates sudden collapse via controlled localized failure. This behavior results from an optimal coupling between geometry and mechanics, balancing regularity and load path alignment to facilitate coordinated deformation and maximize both load-bearing and energy absorption.
Figure 14(b-1) presents the stress–strain responses of SEH structures with different length ratios k. At k = 1.7, premature local buckling and pronounced stress fluctuations lead to early densification ( ε d = 0.336 ) and inferior energy absorption. In contrast, the curve for k = 1.9 shows a smoother plateau stage and delayed densification strain ( ε d = 0.348 ), reflecting progressive deformation and coordinated plastic hinge formation. This promotes broader cellular engagement and even stress distribution, enhancing energy dissipation. The structure with k = 2.1 exhibits a higher peak stress and a larger densification strain ( ε d = 0.385 ), which contributes to more stable energy absorption.
Figure 14(b-2) shows that both EA and SEA increase with k, with the k = 2.1 achieving the most balanced performance by combining relatively high SEA with the highest CFE. This suggests that the upper bound of the investigated range, k = 2.1, provides the best compromise between stiffness and ductility. Overall, the results reveal that k = 1.7 is governed by premature local buckling, k = 1.9 by concentrated failure, whereas k = 2.1 achieves progressive buckling and uniform stress distribution, making it the optimal design for enhancing both load-bearing capacity and energy absorption efficiency.
Figure 14(c-1) shows the stress–strain responses of SEH structures with different thickness ratios c = t 2 / t 1 . At c = 0.5 , thin stiffeners induce premature local buckling, but densification occurs later ( ε d = 0.413 ), leading to extended deformation but limited efficiency. At c = 1.0 , a smoother plateau and delayed densification ( ε d = 0.382 ) indicate progressive buckling and coordinated plastic hinge rotation, ensuring broad cell participation and stable energy dissipation. At c = 1.5 , although the peak stress is higher, early densification ( ε d = 0.279 ) shortens the plateau and reduces energy absorption efficiency due to localized failure.
Figure 14(c-2) compares the energy absorption indices of SEH structures with different c values. Both EA and SEA peak at c = 1.0 , confirming that this ratio achieves the best energy dissipation per unit mass. The peak stress σ p increases with c, reflecting enhanced load-bearing capacity, while the crash force efficiency (CFE) also reaches its maximum at c = 1.0 , indicating that this configuration provides the optimal compromise between strength, stability, and cushioning performance.

5.3.3. Multi-Parameter Interaction and Coupled Effects

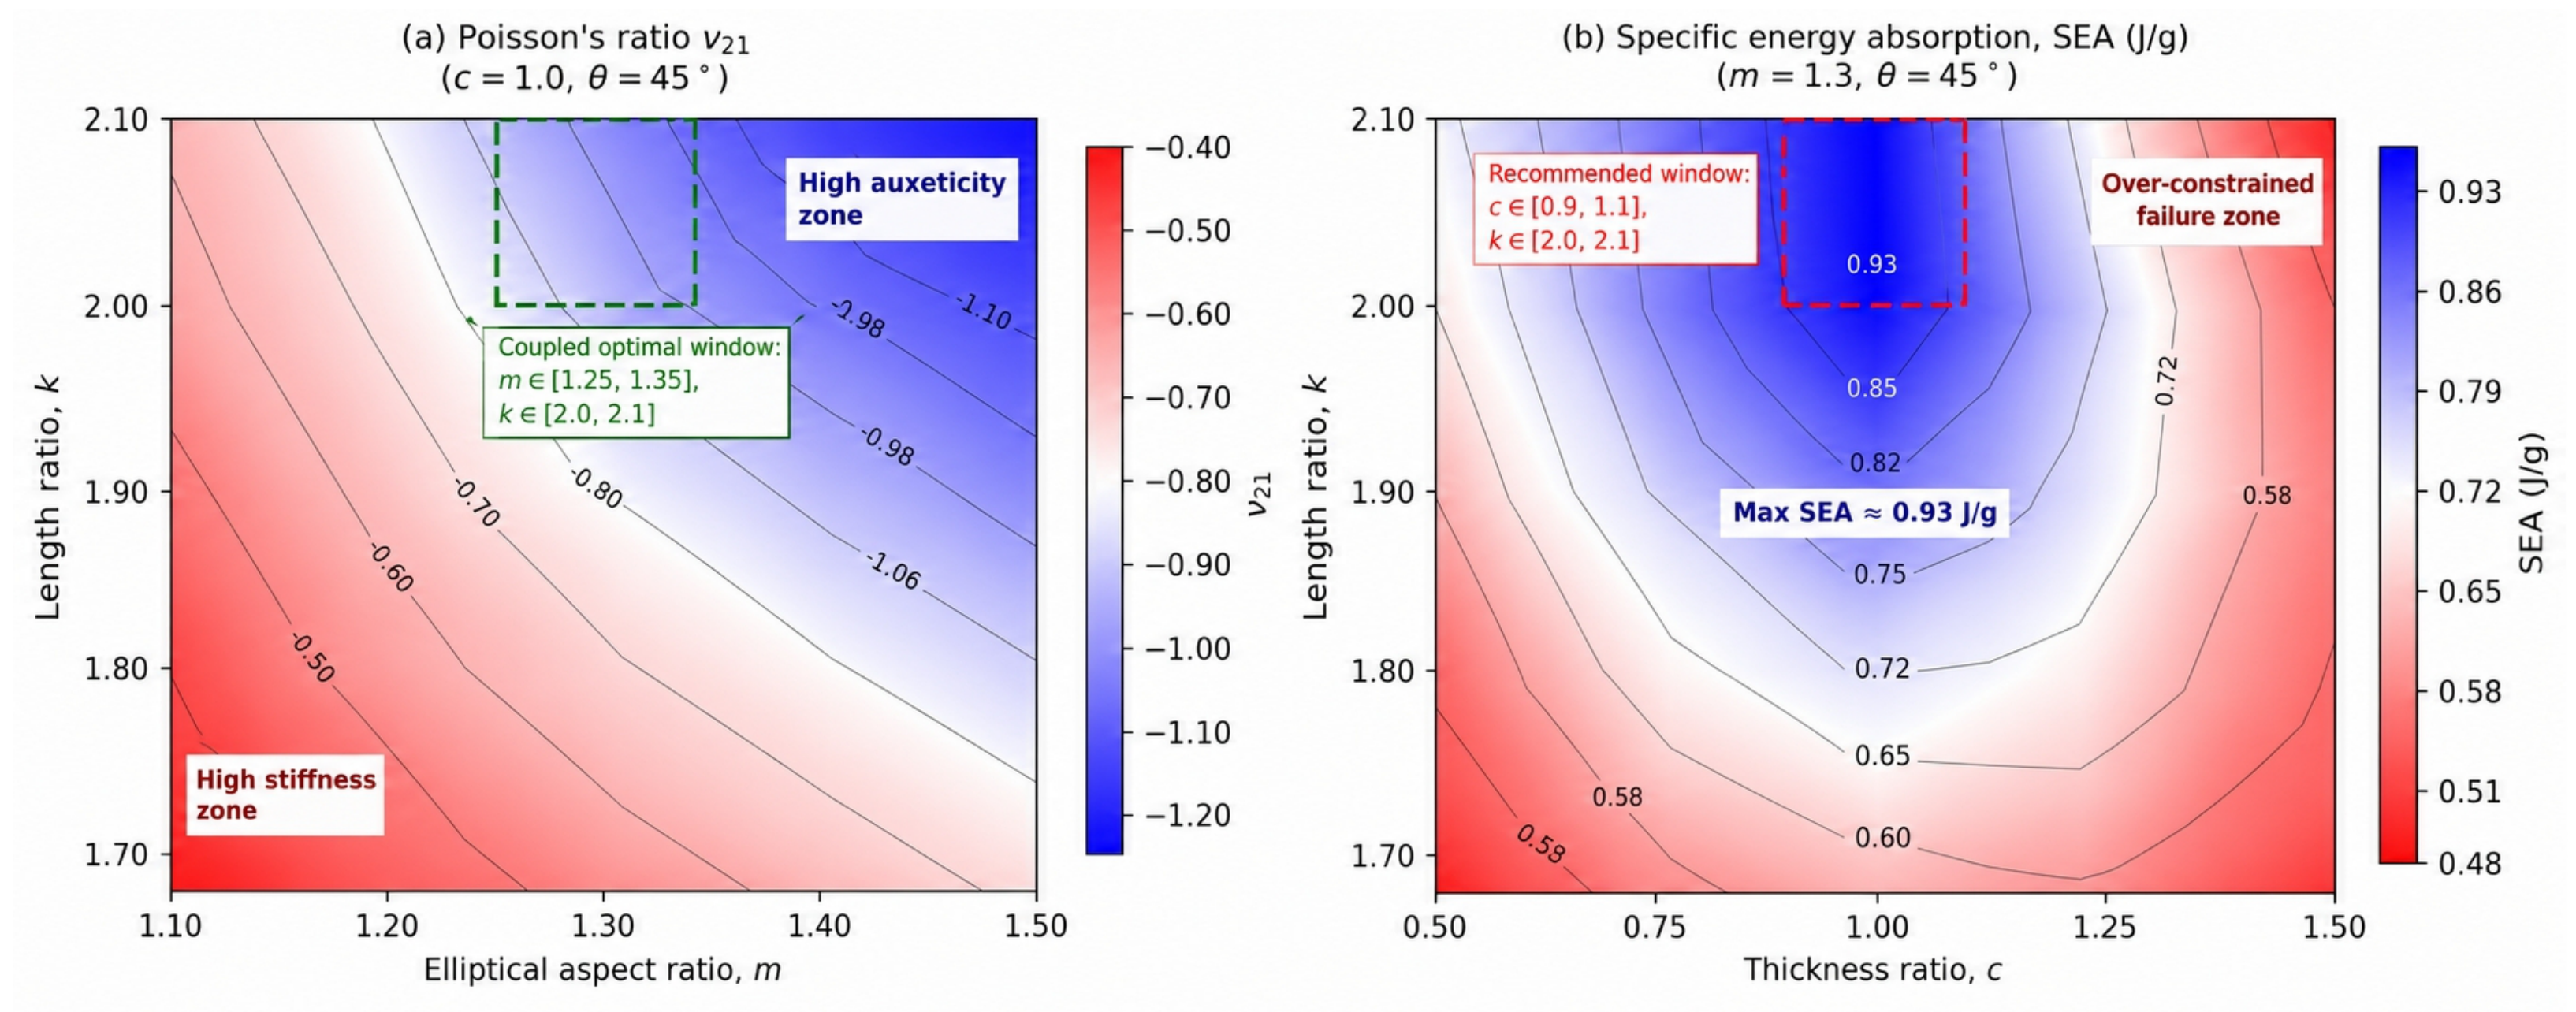
To account for parameter coupling, two-dimensional interaction maps were constructed for two parameter pairs (m, k) and (k, c), which predominantly control the stiffness–auxeticity balance and energy absorption, respectively. Figure 15 presents contour maps of Poisson’s ratio ( ν 21 ) in the mk design space and SEA in the kc design space. The main observations are as follows:
(1) Stiffness–auxeticity coupling (m vs. k). The contour map reveals a diagonal trade-off between stiffness and auxeticity. At m > 1.4 and k > 2.0, the structure exhibits strong auxeticity ( ν 21 < −1.0), but excessive flexibility and global buckling reduce the elastic modulus. In contrast, m = 1.1 and k = 1.8 provide greater transverse support and stiffness, but only moderate auxeticity ( ν 21 = −0.5). The best compromise occurs near m = 1.3 and k = 2.1, where ν 21 < −0.9, confirming that m and k should be optimized jointly.
(2) Energy absorption coupling (k vs. c). The SEA contour map shows a pronounced non-monotonic interaction. At c < 0.8, increasing k continuously enhances SEA by increasing bending deformation and plastic-hinge rotation. At c > 1.2, SEA increases up to k = 2.0 but decreases sharply for k > 2.1, as thick stiffeners and overly long struts suppress progressive folding and promote early densification. The maximum SEA of 0.93 J/g occurs near c = 1.0 and k = 2.0–2.1, where stiffener support and strut flexibility are optimally balanced.
Based on the interaction analysis, the single-parameter recommendations are refined into a coupled optimal design window of m = 1.25–1.35, k = 2.0–2.1, and c = 0.9–1.1. Within this range, the elastic modulus, auxeticity, and SEA simultaneously approach their optimal levels, providing robust design guidance for protective engineering applications.

5.4. Equal-Relative-Density Comparison to Isolate Geometric Benefit

To verify the intrinsic geometric benefit of elliptical reinforcement, an iso-density SEH configuration was established. Mass equivalence with SH was achieved by reducing t 1 to 0.78 mm, while preserving the elliptical stiffener (m = 1.3, t 2 = 1.0 mm) and all other modeling conditions. Table 9 summarizes the 3D-FEM-predicted mechanical properties of the three configurations. Three principal findings are identified.
Despite having the same density as SH, SEH-iso achieves an eightfold higher elastic modulus (72.4 vs. 9.05 MPa). This demonstrates that the stiffness enhancement originates from the load-transfer and rotational restraint mechanisms of the elliptical stiffener, rather than from increased material usage. The specific modulus of SEH-iso is approximately eight times that of SH (195.7 vs. 24.5   MPa · cm 3 / g ), demonstrating the markedly greater stiffness-to-mass efficiency of the elliptical reinforcement. SEH-iso achieves a higher plateau stress (0.86 vs. 0.52 MPa ) and SEA (1.74 vs. 1.21 J / g ) than SH. This equal-density comparison verifies that progressive folding enabled by the elliptical stiffener is responsible for the improved energy absorption.
The enhanced mechanical performance of SEH is governed by three interacting mechanisms introduced by the embedded elliptical stiffener. (i) The embedded elliptical stiffener introduces multiple load-transfer paths and shares the applied load with the star-shaped framework. The resulting stress redistribution reduces strut bending and delays local buckling, accounting for the 13-fold increase in compressive stiffness observed in Figure 10a. (ii) The 22 plastic hinges in each unit cell activate sequentially rather than simultaneously. Initial rotation of the outer framework is followed by inward contraction of the elliptical stiffener and secondary hinging of the curved side struts. This sequence promotes layer-wise folding and progressive densification, yielding a longer and more stable plateau than the shear-slip mode of SH. (iii) The elliptical stiffener enables simultaneous enhancement of stiffness and auxeticity. Its curvature provides continuous support without suppressing hinge rotation, while inward contraction promotes transverse shrinkage of the outer framework. Consequently, SEH exhibits a substantially higher E 2 and a more negative ν 21 than SH.

6. Comparison with Other Stiffened Star-Shaped and Auxetic Honeycombs

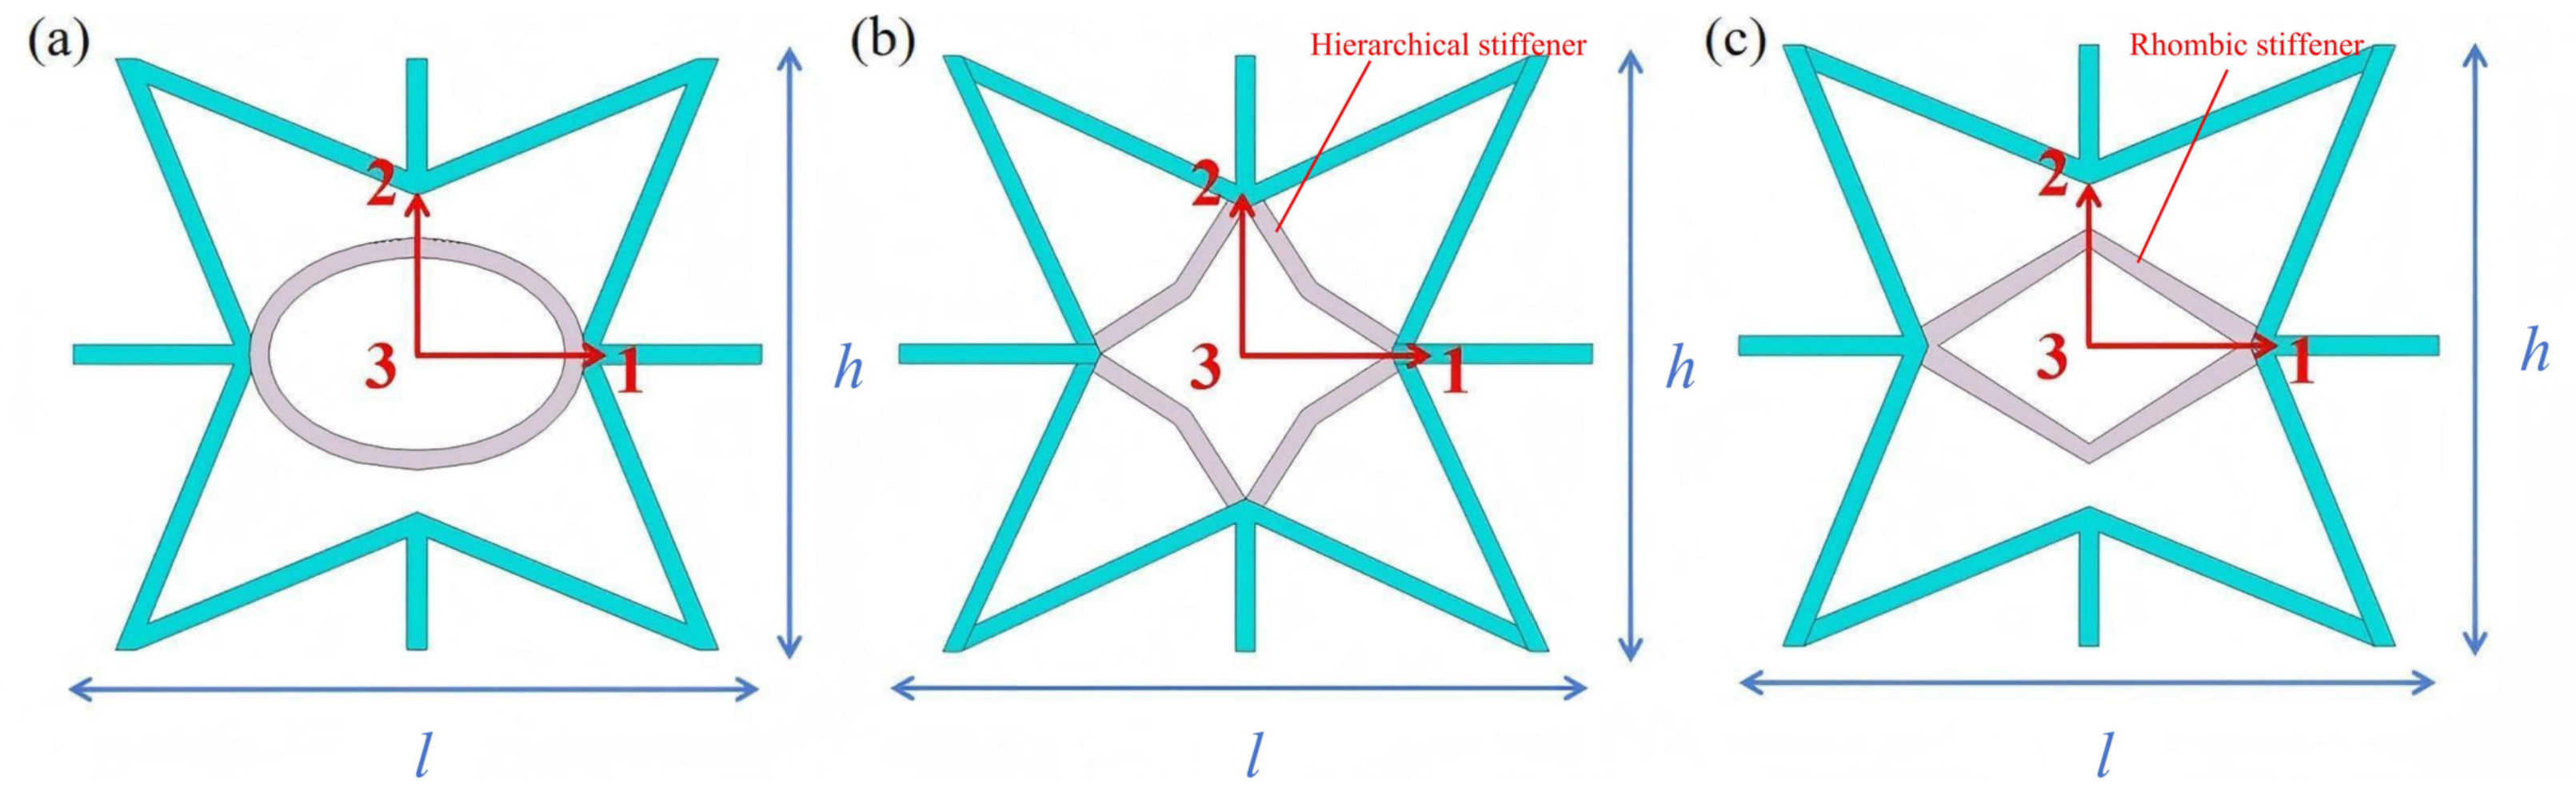
Significant research efforts have been devoted to enhancing the structural performance of star-shaped honeycombs through the incorporation of stiffeners. Utilizing the validated VAM-based 3D-ECM and 3D-FEM, this section examines the differences in elastic properties, energy absorption characteristics, and local deformation mechanisms among three types of stiffened star-shaped honeycombs and other auxetic honeycombs (SH). Figure 16a–c illustrates the geometric configurations of the SEH, HASS (hierarchical auxetic star-shaped honeycomb) [19], and SRH (stiffened rhombic honeycomb) [20]. All unit cells have identical planar dimensions of l × h = 35.6 × 30.5 mm with a uniform strut thickness of t 1 = 1 mm and are modeled using ABS material properties.

6.1. Comparison of Engineering Constants

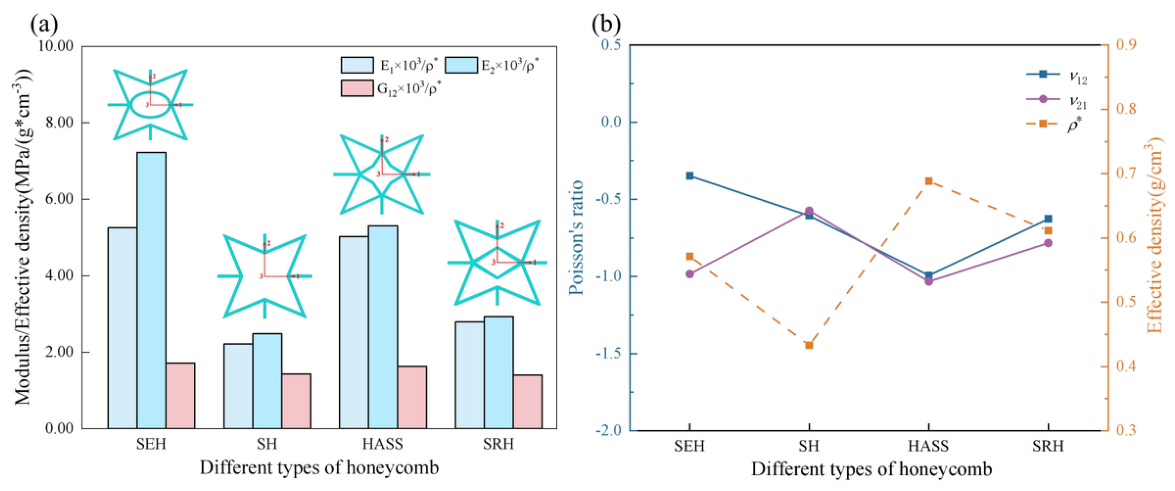
The specific modulus, defined as the ratio of modulus to effective density, serves as a key indicator of lightweight design. Figure 17a compares the specific modulus ( E 1 / ρ * , E 2 / ρ * , and G 12 / ρ * ) of the four star-shaped honeycombs. The results demonstrate that the SEH exhibits the highest specific modulus, indicating that its geometric design achieves an optimal balance of lightness and strength. Specifically, the specific elastic modulus ( E 2 / ρ * ) of SEH significantly exceeds those of the other three structures—approximately 1.3 times that of HASS and about three times those of SRH and SH. This enhancement can be attributed to the elliptical stiffeners in the SEH, which facilitate multi-path load transfer and substantially improve structural stiffness.
Figure 17b compares the Poisson’s ratio and effective density of the four star-shaped honeycombs. All four configurations exhibit negative Poisson’s ratios, confirming their auxetic nature. The SEH shows the smallest absolute value of ν 12 among the four structures, while ν 21 is comparable to that of HASS, both approaching approximately −1. This indicates that while the auxetic effect of SEH is less pronounced under loading in the 1-direction, it becomes more significant under 2-directional loading. The elliptical stiffener design enhances support in the 2-direction, thereby constraining deformation under 1-directional loading, while the introduction of additional hinge points promotes cooperative folding that facilitates deformation in the 1-direction. Remarkably, the SEH enhances the auxetic effect while maintaining high stiffness, effectively overcoming the traditional stiffness–auxeticity trade-off. Furthermore, the SEH achieves a relatively low effective density ( ρ * ), as the elliptical stiffener design optimizes material distribution and minimizes redundant mass, resulting in an excellent balance between stiffness and lightweight performance.

6.2. Quasi-Static Compression Comparison

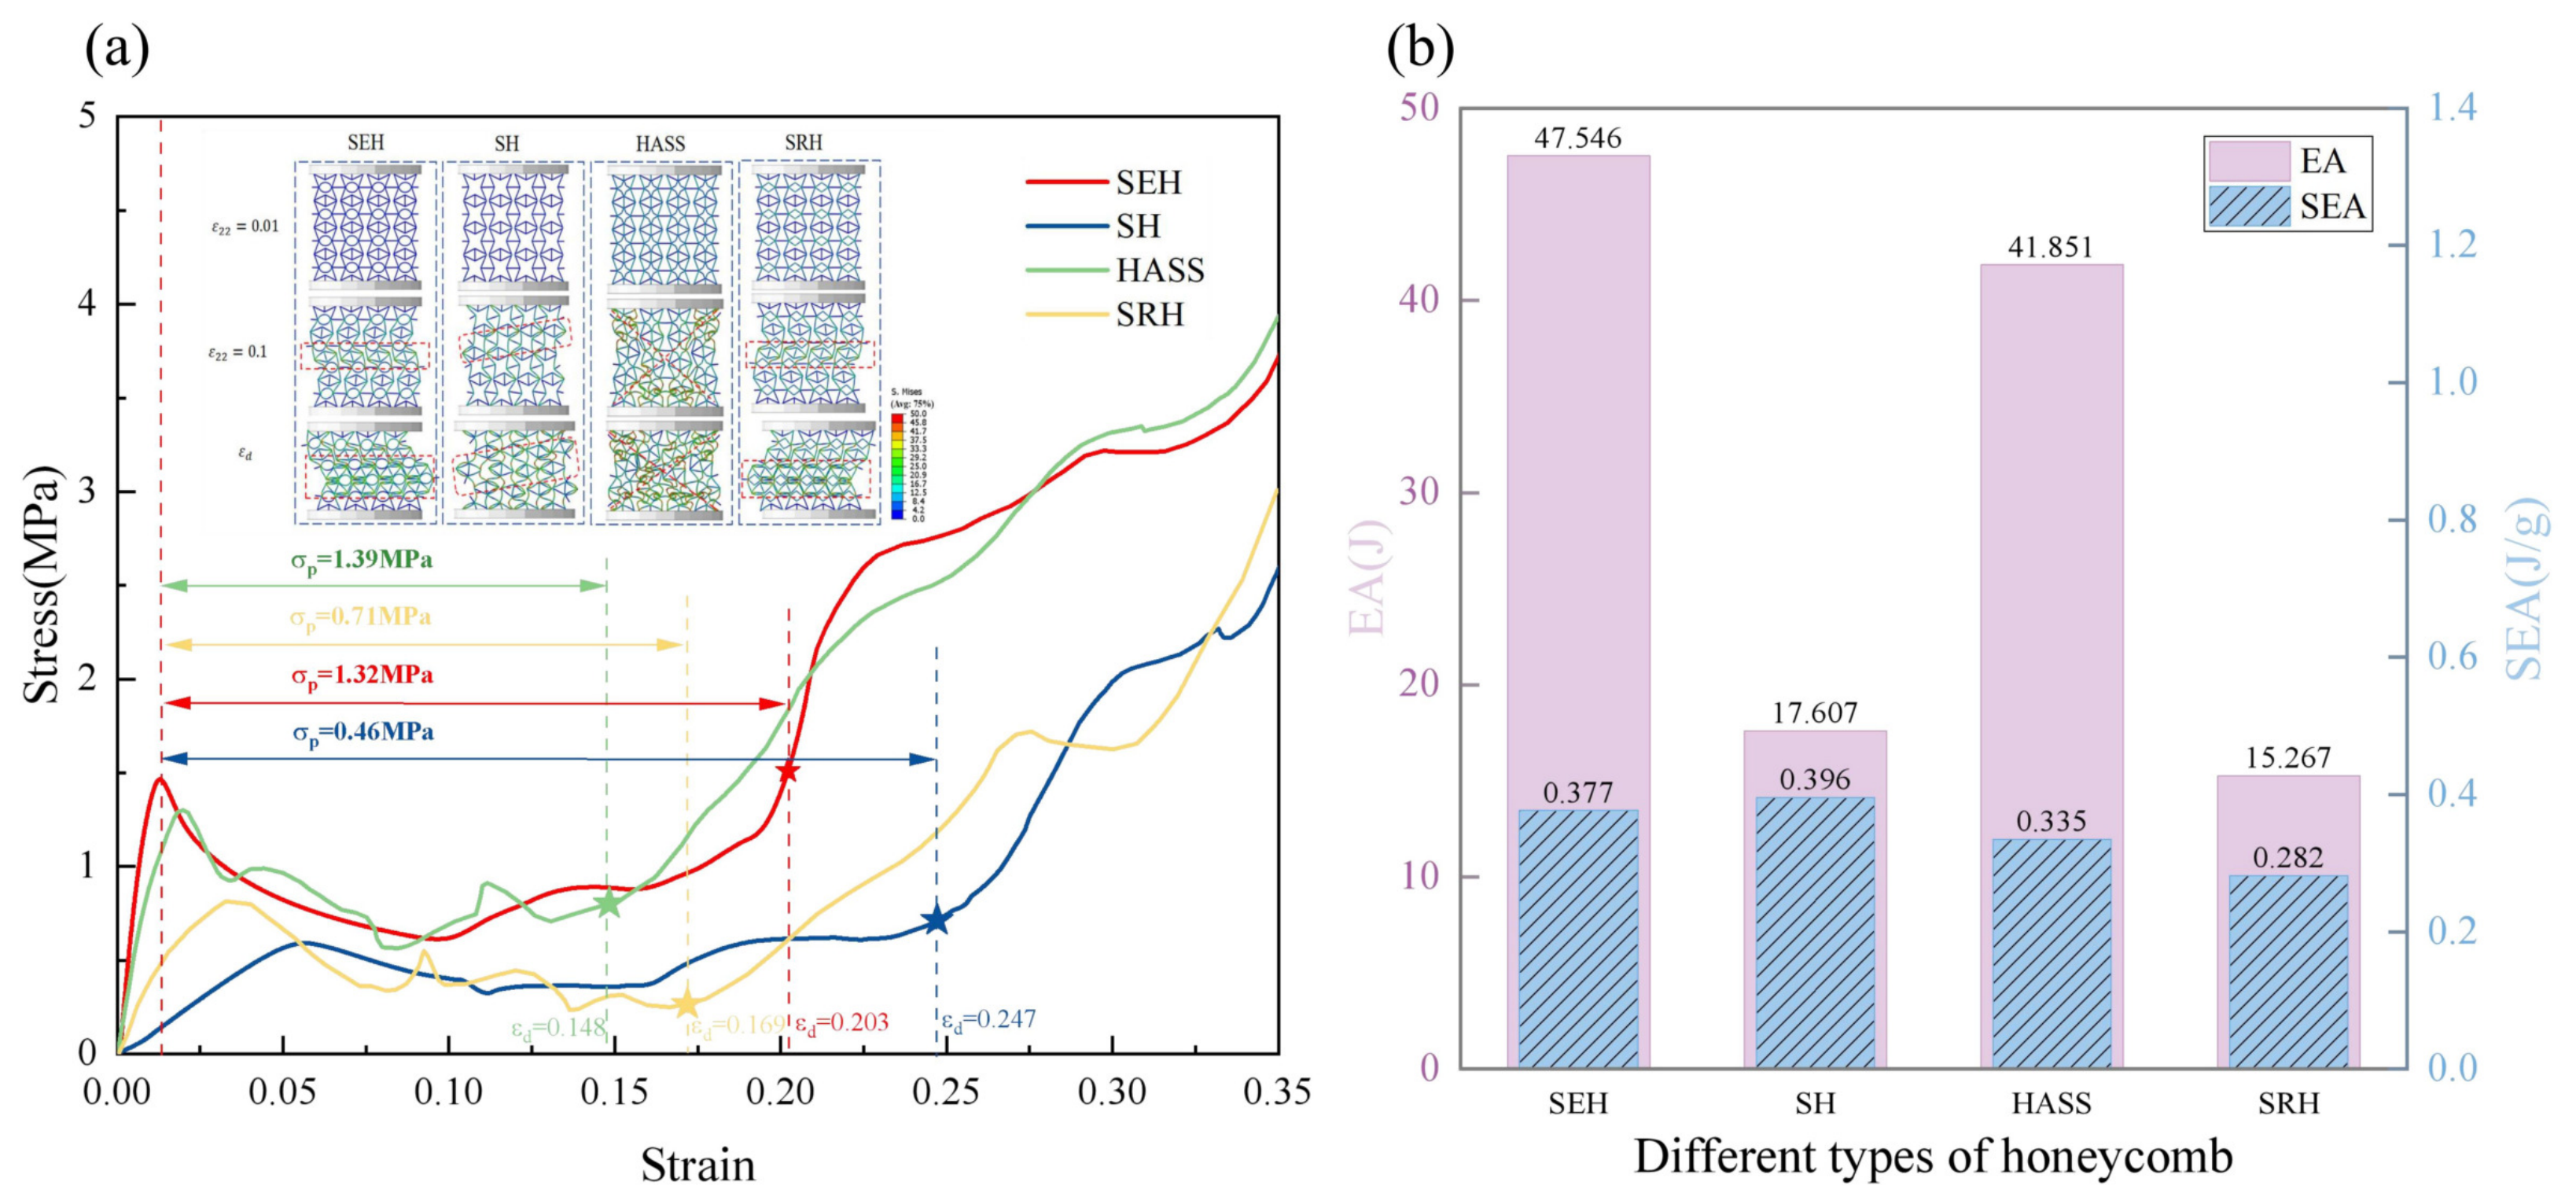
Figure 18a shows that the SEH structure exhibits the highest peak stress, with a distinct elastic region followed by a rapid stress increase after yielding, reflecting its superior stiffness and load-bearing capacity. This behavior indicates that the SEH effectively resists deformation during the initial compression stage. The SH structure, despite its lower peak stress, demonstrates the most extended stress plateau, suggesting an enhanced ability to absorb energy through prolonged deformation without rapid structural failure. In contrast, both HASS and SRH structures enter the densification stage at relatively low strain levels, indicating reduced compression resistance and consequently diminished energy absorption capability.
Figure 18b further compares the EA and SEA values of the four star-shaped honeycombs. The SEH attains the highest EA value (47.546 J), consistent with its exceptional load-bearing capacity and energy dissipation potential. Its SEA value is also considerable, highlighting efficient energy absorption relative to its mass. Although SH exhibits lower EA, it demonstrates higher SEA, indicating superior energy dissipation per unit mass and making it particularly suitable for applications requiring high impact resistance. The HASS structure shows moderate EA and SEA values, while the SRH yields the lowest values in both metrics, underscoring its inferior performance in both load-bearing and energy absorption capacities.
The enhanced energy absorption and load-bearing performance of the SEH can be attributed to its elliptical stiffener design, which provides substantial compression resistance while enabling progressive deformation, thereby maximizing energy dissipation. The SH, with its extended stress plateau, absorbs significant energy relative to its mass, albeit at the expense of load-bearing capacity. The HASS and SRH structures exhibit compromised performance in both energy absorption and load-bearing capacity, with the SRH particularly prone to premature failure under compression. Thus, the SEH emerges as the most balanced configuration, offering an optimal combination of stiffness, energy absorption, and load-bearing capacity, making it ideal for high-performance applications demanding both structural strength and energy dissipation.

6.3. Localized Cellular Deformation Comparison

Table 10 compares the stress distribution and deformation mechanism of local unit cells (2 × 2 arrays) of four star-shaped honeycombs under quasi-static loading at three strain levels: elastic strain ( ε 22 = 0.01 ), plateau strain ( ε 22 = 0.10 ), and densification strain ( ε d ). At the elastic stage, the SEH exhibits uniform stress distribution across the elliptical stiffeners, with stress concentrated at stiffener–strut intersections, confirming that stiffeners carry most of the applied load. The SH, lacking stiffeners, shows stress concentration primarily at the junctions between struts and horizontal ligaments. In the HASS, both stiffeners and struts contribute to load-bearing, with stress concentrated at their intersections. The SRH relies mainly on its rhombic stiffeners to carry the load. In all configurations, the stress on horizontal ligaments remains minimal.
During the plateau stage, the SEH cell displays a “C”-shaped bending with counterclockwise hinge rotation in the lower region. The SH cell exhibits diagonal deformation accompanied by clockwise hinge rotation. The HASS cell demonstrates more complex deformation patterns, forming a “/”-shaped densification band at the top and expansion at the lower sides. The SRH cell shows deformation similar to the SEH cell but in the opposite direction, characterized by reverse “C”-shaped bending with clockwise hinge rotation. Upon reaching densification, the SEH cell forms an ”I”-shaped densification band in the lower right region, while the SRH cell develops a similar band in the lower left area, both indicating progressive densification and interlayer folding. In contrast, the SH and HASS cells form “/”-shaped densification bands, with the SH cell exhibiting this pattern throughout the entire cell, reflecting a global shear-slip mechanism and transition into overall compressive densification.
Table 11 compares the displacement field of local unit cells (2 × 2 arrays) for four star-shaped honeycombs under quasi-static compression at elastic strain of ε 22 = 0.01 . The results reveal that under 2-directional compression, all four structures contract laterally in the 1-direction, demonstrating their auxetic behavior. Specifically, the SEH cell exhibits the largest 1-directional displacement change ( Δ U 1 = 0.487 mm), followed by the SRH, while the HASS exhibits the smallest displacement. This behavior stems from the buffering effect provided by the elliptical stiffeners within the SEH during compression. These stiffeners cooperate with the inclined struts to deform synergistically, introducing additional hinge points along the deformation path that significantly enhance lateral contraction and amplify the auxetic effect. In contrast, the hierarchical stiffeners in the HASS effectively restrain the rotation of star-shaped struts, reducing lateral deformation and weakening the auxetic effect. The SRH, which incorporates rhombic stiffeners similar to the elliptical stiffeners in the SEH, shows slightly less lateral deformation than the SEH due to stronger deformation constraints, yet still maintains considerable auxetic behavior.

6.4. Comparison with Other Auxetic Counterparts

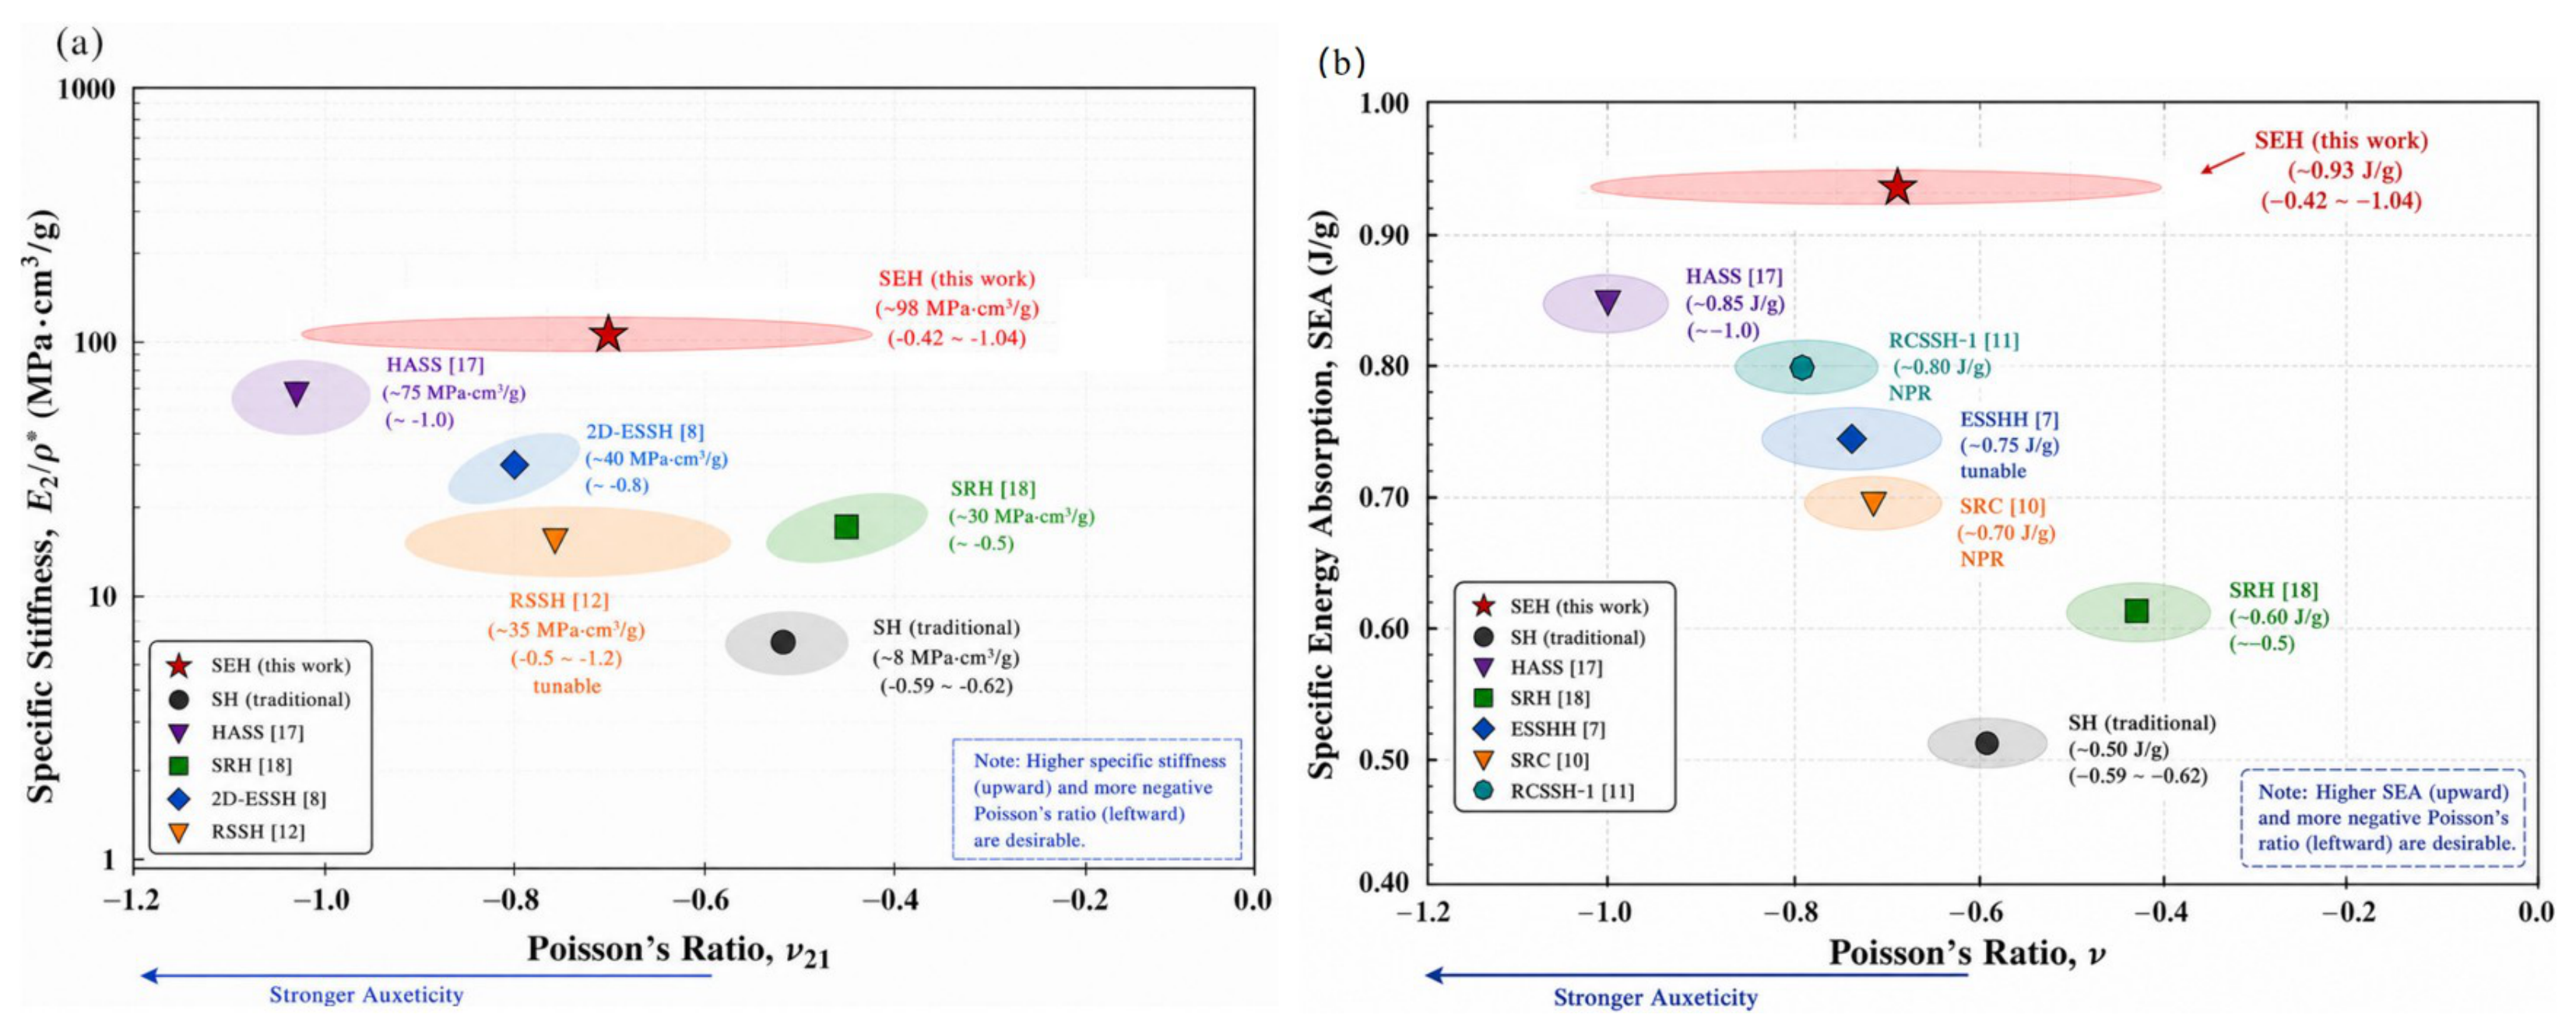
To highlight the performance advantages of the proposed metamaterial, Figure 19 presents Ashby plots of specific stiffness versus auxeticity and SEA versus auxeticity. As shown in Figure 19a, SEH occupies the upper region, demonstrating superior specific stiffness and auxeticity. Its specific stiffness is approximately 12 times that of conventional SH while retaining a comparable or more negative Poisson’s ratio. Compared with HASS and SRH, SEH achieves a more favorable stiffness–auxeticity balance, confirming the effectiveness of the embedded elliptical stiffener. Figure 19b shows that SEH outperforms SH and SRH in both SEA and auxeticity. It also achieves SEA comparable to or higher than HASS, ESSHH, and RCSSH while retaining a strongly negative Poisson’s ratio. These results confirm that the elliptical stiffener improves energy absorption efficiency without sacrificing auxetic performance.
Rhombic reinforcement in SRH improves crushing resistance but restricts strut rotation, promoting premature densification and weakening auxeticity. The nested-star stiffener in HASS enhances specific stiffness while constraining deformation of the outer framework. Circular reinforcement preserves auxeticity but offers limited directional tunability, whereas ASSH/ASH designs primarily modify local stress distributions without introducing an independent load-bearing path. In contrast, SEH employs a directionally tunable elliptical stiffener. By adjusting the elliptical aspect ratio and thickness, strut thickness, and star angle, SEH establishes multiple load-transfer paths while retaining rotational flexibility. Cooperative deformation between the ellipse and surrounding struts promotes sequential hinge formation and progressive folding, thereby improving stiffness and energy absorption without compromising auxeticity.

7. Conclusions

This work introduces a novel star–ellipse honeycomb (SEH) to offer a triple-performance trade-off strategy (stiffness, auxeticity, energy absorption). A VAM-based equivalent Cauchy model (3D-ECM) was developed for efficient analysis of multi-cell SEH structures. The mechanical performance under quasi-static compression was thoroughly investigated via experiments, simulations, and theoretical modeling, leading to the following key conclusions:
(1) The SEH design addresses the stiffness–auxeticity trade-off through the embedded elliptical stiffener, which diversifies load paths and introduces synergistic folding. Compared to conventional star-shaped honeycombs (SH), the SEH exhibits approximately 13 times higher elastic modulus and elastic strain energy, and about 2.5 times greater peak stress. Furthermore, the EA value of SEH is 1.47 times that of SH, while maintaining comparable SEA, indicating that the SEH improves energy efficiency without compromising its lightweight characteristics.
(2) Both 3D-FEM and 3D-ECM show excellent agreement with experimental results (3D-EXP) in predicting the elastic compression behavior of SEH structures. The 3D-ECM achieves high computational accuracy while reducing the model size and computation time to only 16.4–17.8% and 18.6–31.9% of those required by 3D-FEM, respectively. These results demonstrate that 3D-ECM can serve as a reliable and highly efficient alternative to full-scale 3D-FEM for predicting the elastic mechanical response of SEH structures.
(3) Under compressive loading, the elliptical stiffeners work synergistically with the inclined struts, increasing the number of plastic hinge points and enhancing lateral contraction, thereby strengthening the auxetic effect. The SEH enters the densification stage earlier than SH and exhibits a characteristic “S”-shaped deformation pattern with progressive densification. Although this design sacrifices some ductility, it achieves superior stiffness, load-bearing efficiency, and enhanced energy absorption performance.
(4) The elliptical aspect ratio m governs the balance between stiffness and auxeticity, with m = 1.3 achieving the optimal SEA and CFE. The length ratio k directly influences load transfer, where k = 2.1 provides the highest plateau stress and superior energy absorption capacity. The thickness ratio c controls failure mode transition, and c = 1.0 yields the most stable plateau response with maximum EA, SEA, and CFE. Moreover, the coupled effect of star angle θ and slenderness ratio n indicates that small θ and moderate n improve stiffness, while larger θ enhances the auxetic effect.
The proposed SEH design demonstrates exceptional potential for applications requiring both high stiffness and excellent energy absorption capabilities, particularly in impact protection and lightweight structural systems. The established 3D-ECM provides an efficient computational framework for further optimization and design of advanced honeycomb structures. Future work should investigate the high-strain-rate response of SEH, functionally graded distributions of parameters, post-yield extensions of the VAM-based model, and metallic additive manufacturing. These advances would further improve crashworthiness, computational design efficiency, and structural scalability, supporting applications in lightweight sandwich cores and infrastructure protection.

Author Contributions

Conceptualization, Y.T.; investigation, Y.Z.; formal analysis, writing—review and editing, Q.L.; validation, supervision, R.L. All authors have read and agreed to the published version of the manuscript.

Funding

This research was funded by the National Natural Science Foundation of China (Grant Numbers, 51778088, 52073036).

Data Availability Statement

The data presented in this study are available on request from the corresponding author. The data are not publicly available due to subsequent analyses and publications.

Conflicts of Interest

The authors declare no conflicts of interest.

References

  1. Han, D.; Ren, X.; Zhang, Y.; Zhang, X.Y.; Zhang, X.G.; Luo, C.; Xie, Y.M. Lightweight auxetic metamaterials: Design and characteristic study. Compos. Struct. 2022, 293, 115706. [Google Scholar] [CrossRef] [Scilit]
  2. Cheng, X.; Zhang, Y.; Ren, X.; Han, D.; Jiang, W.; Zhang, X.G.; Luo, H.C.; Xie, Y.M. Design and mechanical characteristics of auxetic metamaterial with tunable stiffness. Int. J. Mech. Sci. 2022, 223, 107286. [Google Scholar] [CrossRef] [Scilit]
  3. Zhang, X.Y.; Ren, X.; Zhang, Y.; Xie, Y.M. A novel auxetic metamaterial with enhanced mechanical properties and tunable auxeticity. Thin-Walled Struct. 2022, 174, 109162. [Google Scholar] [CrossRef] [Scilit]
  4. Ma, H.; Wang, K.; Zhao, H.; Hong, Y.; Zhou, Y.; Xue, J.; Li, Q.; Wang, G.; Yan, B. Energy dissipation in multistable auxetic mechanical metamaterials. Compos. Struct. 2023, 304, 116410. [Google Scholar] [CrossRef] [Scilit]
  5. Zhang, H.; Chen, P.; Zhang, Z.; Lin, G.; Sun, W. Structural response and energy absorption assessment of corrugated wall mechanical metamaterials under static and dynamic compressive loading. Int. J. Impact Eng. 2023, 172, 104427. [Google Scholar] [CrossRef] [Scilit]
  6. Mercer, C.; Speck, T.; Lee, J.; Balint, D.S.; Thielen, M. Effects of geometry and boundary constraint on the stiffness and negative Poisson’s ratio behaviour of auxetic metamaterials under quasi-static and impact loading. Int. J. Impact Eng. 2022, 169, 104315. [Google Scholar] [CrossRef] [Scilit]
  7. Zhao, X.; Wei, L.; Wen, D.; Zhu, G.; Yu, Q.; Ma, Z.D. Bending response and energy absorption of sandwich beams with novel auxetic honeycomb core. Eng. Struct. 2021, 247, 113204. [Google Scholar] [CrossRef] [Scilit]
  8. Nian, Y.; Wan, S.; Wang, X.; Zhou, P.; Avcar, M.; Li, M. Study on crashworthiness of nature-inspired functionally graded lattice metamaterials for bridge pier protection against ship collision. Eng. Struct. 2023, 277, 115404. [Google Scholar] [CrossRef] [Scilit]
  9. Usta, F.; Türkmen, H.S.; Scarpa, F. Low-velocity impact resistance of composite sandwich panels with various types of auxetic and non-auxetic core structures. Thin-Walled Struct. 2021, 163, 107738. [Google Scholar] [CrossRef] [Scilit]
  10. Wang, W.J.; Zhang, W.M.; Guo, M.F.; Yang, J.S.; Ma, L. Energy absorption characteristics of a lightweight auxetic honeycomb under low-velocity impact loading. Thin-Walled Struct. 2023, 185, 110577. [Google Scholar] [CrossRef] [Scilit]
  11. Jiang, F.; Yang, S.; Zhang, Y.; Qi, C.; Chen, S. Fabrication and crushing response of graded re-entrant circular auxetic honeycomb. Int. J. Mech. Sci. 2023, 242, 107999. [Google Scholar] [CrossRef] [Scilit]
  12. Liu, C.; Qiu, S.; Zhang, X.; Chen, Z. Research on interdisciplinary design thinking and methods based on programmable mechanical metamaterials. Buildings 2023, 13, 933. [Google Scholar] [CrossRef] [Scilit]
  13. Széles, L.; Horváth, R.; Cveticanin, L. Analysis of mechanical properties and parameter dependency of novel, doubly re-entrant auxetic honeycomb structures. Buildings 2024, 14, 2780. [Google Scholar]
  14. Luo, H.C.; Ren, X.; Zhang, Y.; Zhang, X.Y.; Zhang, X.G.; Luo, C.; Cheng, X.; Xi, Y.M. Mechanical properties of foam-filled hexagonal and re-entrant honeycombs under uniaxial compression. Compos. Struct. 2022, 280, 114922. [Google Scholar] [CrossRef] [Scilit]
  15. Wei, L.; Zhao, X.; Yu, Q.; Zhu, G. Quasi-static axial compressive properties and energy absorption of star-triangular auxetic honeycomb. Compos. Struct. 2021, 267, 113850. [Google Scholar] [CrossRef] [Scilit]
  16. Li, X.; Li, Z.; Guo, Z.; Guo, Z.; Mo, Z.; Li, J. A novel hybrid star honeycomb with individually adjustable second plateau stresses. Compos. Struct. 2025, 356, 118881. [Google Scholar] [CrossRef] [Scilit]
  17. Montazeri, A.; Ahmadian, I.; Bahmanpour, E.; Saeedi, A.; Safarabadi, M. Mechanical behaviors of star honeycombs with symmetry-broken lattices. Eur. J. Mech. A-Solids 2025, 113, 105709. [Google Scholar] [CrossRef] [Scilit]
  18. Bahmanpour, E.; Montazeri, A.; Saeedi, A.; Mahnama, M. Flexural behaviors of asymmetric Re-entrant auxetic honeycombs. Eur. J. Mech. A-Solids 2025, 109, 105475. [Google Scholar] [CrossRef] [Scilit]
  19. Mo, K.; Lu, F.; Zhang, C.; Liu, Y.; He, Y.; Wei, T.; Zhu, Y. Energy absorption characteristics of a novel hierarchical auxetic star-shaped honeycomb. Thin-Walled Struct. 2025, 215, 113598. [Google Scholar] [CrossRef] [Scilit]
  20. Zhang, X.; Lu, C.; Li, R.; Xie, T. Study of rhombic star-shaped honeycomb with tunable Poisson’s ratio and elastic modulus properties. Appl. Phys. A 2024, 130, 91. [Google Scholar] [CrossRef] [Scilit]
  21. Deng, Y.; Huang, Z.; Liu, C.; Zhang, Y. Improved design of 3D printed star honeycomb pressure resistance and sandwich panel protective capability. Mater. Today Commun. 2024, 38, 108069. [Google Scholar] [CrossRef] [Scilit]
  22. Jiang, W.Z.; Teng, X.C.; Ni, X.H.; Zhang, X.G.; Cheng, X.; Jiang, W.; Han, D.; Zhang, Y.; Ren, X. An improved re-entrant honeycomb with programmable densification and multistage energy-absorbing performance. Eng. Struct. 2024, 301, 117318. [Google Scholar] [CrossRef] [Scilit]
  23. Narushin, V.G.; Romanov, M.N.; Griffin, D.K. Egg-inspired engineering in the design of thin-walled shelled vessels: A theoretical approach for shell strength. Front. Bioeng. Biotechnol. 2022, 10, 995817. [Google Scholar] [CrossRef] [Scilit] [PubMed]
  24. Ahamed, M.K.; Wang, H.; Ameri, A.; Hazell, P.J. Nacre-inspired design of engineered cementitious composite beams for enhanced impact resistance and energy absorption. J. Build. Eng. 2023, 78, 107687. [Google Scholar] [CrossRef] [Scilit]
  25. Petitjean, N.; Canadas, P.; Royer, P.; Noël, D.; Le Floc’h, S. Cartilage biomechanics: From the basic facts to the challenges of tissue engineering. J. Biomed. Mater. Res. A 2023, 111, 1067–1089. [Google Scholar] [PubMed]
  26. Hou, J.; Aydemir, B.E.; Dumanli, A.G. Understanding the structural diversity of chitins as a versatile biomaterial. Philos. Trans. R. Soc. A 2021, 379, 20200331. [Google Scholar] [CrossRef] [Scilit]
  27. Wang, L.; Liu, H.T. Parameter optimization of bidirectional re-entrant auxetic honeycomb metamaterial based on genetic algorithm. Compos. Struct. 2021, 267, 113915. [Google Scholar] [CrossRef] [Scilit]
  28. Shen, X.; Yan, K.; Zhu, D.; Hu, Q.; Wu, H.; Qi, S.; Yuan, M.; Qian, X. Inverse machine learning framework for optimizing gradient honeycomb structure under impact loading. Eng. Struct. 2024, 309, 118079. [Google Scholar] [CrossRef] [Scilit]
  29. Wang, S.; Deng, C.; Ojo, O.; Akinrinlola, B.; Kozub, J.; Wu, N. Design and modeling of a novel three dimensional auxetic reentrant honeycomb structure for energy absorption. Compos. Struct. 2022, 280, 114882. [Google Scholar] [CrossRef] [Scilit]
  30. Marchal, V.; Shujie, T.; Zhang, Y.; Labed, N.; Peyraut, F. Multiscale periodic homogenization for additive manufacturing of honeycomb lattices. Int. J. Solids Struct. 2024, 302, 112974. [Google Scholar] [CrossRef] [Scilit]
  31. Zhu, C.W.; Kaddouri, W.; Kanit, T.; Jiang, Q.; Ounaies, S. Effect of auxetic behavior on effective properties of composite materials. Mech. Res. Commun. 2025, 145, 104389. [Google Scholar] [CrossRef] [Scilit]
  32. Sadikbasha, S.; Pandurangan, V. High velocity impact response of sandwich structures with auxetic tetrachiral cores: Analytical model, finite element simulations and experiments. Compos. Struct. 2023, 317, 117064. [Google Scholar] [CrossRef] [Scilit]
  33. Morris, J.; Wang, W.; Plaisted, T.; Hansen, C.J.; Amirkhizi, A.V. Optimizing graded metamaterials via genetic algorithm to control energy transmission. Int. J. Mech. Sci. 2024, 263, 108775. [Google Scholar] [CrossRef] [Scilit]
  34. Zhou, Y.; Zhong, Y.; Zhu, Y.; Liu, R. 3D equivalent Cauchy model for serrated re-entrant auxetic honeycombs based on variational asymptotic method. Thin-Walled Struct. 2024, 200, 111883. [Google Scholar] [CrossRef] [Scilit]
  35. Li, W.; Zhong, Y.; Zhu, Y.; Cao, H.; Liu, R. Enhancing the structural stiffness and energy absorption of re-entrant auxetic honeycombs using folded stiffeners. Thin-Walled Struct. 2024, 205, 112504. [Google Scholar] [CrossRef] [Scilit]
  36. Yuxin, T.; Yifeng, Z.; Yilin, Z.; Rong, L. Energy absorption characteristics and auxetic effect of novel elliptic-arc re-entrant honeycomb structures. Eng. Struct. 2025, 323, 119260. [Google Scholar] [CrossRef] [Scilit]
  37. Ganguly, S.; Tang, X.S. 3D printing of high strength thermally stable sustainable lightweight corrosion-resistant nanocomposite by solvent exchange postprocessing. ACS Sustain. Chem. Eng. 2024, 13, 423–435. [Google Scholar] [CrossRef] [Scilit]
  38. Shahrubudin, N.; Lee, T.C.; Ramlan, R. An overview on 3D printing technology: Technological, materials, and applications. Procedia Manuf. 2019, 35, 1286–1296. [Google Scholar] [CrossRef] [Scilit]
Figure 1. Representative elliptical structures in nature with superior energy absorption and stiffness enhancement: (a) bird egg [23], (b) nacre shell [24], (c) knee joint [25], and (d) insect exoskeleton [26]; (e) detailed geometrical parameters of SEH cell; and (f) periodic arrangement of SEH cells.
Buildings 16 03014 g001
Figure 2. Three-stage procedure for deriving the 3D equivalent Cauchy model of SEH structures.
Buildings 16 03014 g002
Figure 3. Idealized plastic hinge model of the SEH cell under quasi-static compression: (a) initial configuration, (b) deformation process, and (c) final deformed configuration.
Buildings 16 03014 g003
Figure 4. Comparison of plateau stress predicted by the analytical model (Equation (19)) and extracted from FEM simulations as a function of wall thickness t.
Buildings 16 03014 g004
Figure 5. Multiscale modeling and validation of SEH structures: multi-cell configurations analyzed for elastic and crushing behaviors using 3D-EXP, 3D-FEM, and 3D-ECM.
Buildings 16 03014 g005
Figure 6. Tensile tests of 3D-printed base material: (a) setup; (b) nominal stress–strain curves of A1–A3 with failure morphologies (inset).
Buildings 16 03014 g006
Figure 7. Experimental setup and multi-cell compression model parameters: (a) compression setup in the testing machine, (b) Close-up view of the multi-cell structure. (c) 3D representation of the multi-cell compression model.
Buildings 16 03014 g007
Figure 8. Finite element modeling of (a) 3D-FEM and (b) 3D-ECM, including unit cell geometry, finite element mesh, and boundary and loading conditions.
Buildings 16 03014 g008
Figure 9. Comparison of mechanical properties between SEH and SH structures: (a) Nominal stress–strain curve and EAE vs. nominal strain; (b) EA and SEA vs. displacement; (c) Poisson’s ratio vs. strain; (d) Radar chart comparing the key energy absorption metrics.
Buildings 16 03014 g009
Figure 10. Comparison of elastic performance between SEH and SH structures: (a) nominal stress–strain curves up to ε 22 = 0.01 ; (b) corresponding strain energy values.
Buildings 16 03014 g010
Figure 11. Effect of geometric parameters on the elastic properties, Poisson’s ratios, and effective density of SEH structures: (a-1,a-2) elliptical aspect ratio ( m = a / b ); (b-1,b-2) length ratio ( k = l 1 / l 2 ); (c-1,c-2) thickness ratio ( c = t 2 / t 1 ).
Buildings 16 03014 g011
Figure 12. Validation of the 3D-FEM and theoretical models against experimental quasi-static compression tests for the SEH multi-cell specimen. The main panel shows nominal stress–strain curves from experiments (shaded band = ±1 SD, n = 3), FE simulations, and theoretical prediction of plateau stress.
Buildings 16 03014 g012
Figure 13. Local deformation and stress distribution of SEH and SH cells under different compressive strains (unit: MPa).
Buildings 16 03014 g013
Figure 14. Stress–strain responses and energy absorption characteristics of SEH structures under different geometric parameters: (a-1,a-2) elliptical aspect ratio ( m = a / b ); (b-1,b-2) length ratio ( k = l 1 / l 2 ); (c-1,c-2) thickness ratio ( c = t 2 / t 1 ).
Buildings 16 03014 g014
Figure 15. Multi-parameter interaction contour maps for SEH structures: (a) Poisson’s ratio, (b) Specific energy absorption (SEA).
Buildings 16 03014 g015
Figure 16. Geometric configuration of star-shaped honeycombs with varying stiffener geometries: (a) SEH with elliptical stiffeners; (b) hierarchical auxetic star-shaped honeycomb (HASS); (c) stiffened rhombic honeycomb (SRH).
Buildings 16 03014 g016
Figure 17. Comparison of (a) specific modulus and (b) Poisson’s Ratio and effective density for different star-shaped honeycomb structures.
Buildings 16 03014 g017
Figure 18. Comparison of (a) stress–strain behavior and (b) energy absorption of different star-shaped honeycomb structures.
Buildings 16 03014 g018
Figure 19. Ashby-plot comparison of (a) specific stiffness vs. auxeticity and (b) SEA vs. auxeticity for different star-shaped honeycomb structures.
Buildings 16 03014 g019
Table 1. ABS plastic properties used for model validation.
MaterialsElastic ModulusPoisson’s RatioDensityYield StressUltimate Strength
ABS plastic2100 MPa0.391.04 g/cm327 MPa48 MPa
Table 2. Geometric parameters of SEH and SH specimens (unit: mm).
Models l 1 l 2 θ t 1 = t 2 abLHd
SEH16940°11510138122.330
SH16940°1//138122.330
Table 3. Dimensional measurements and fabrication deviations of 3D-printed SEH and SH specimens (unit: mm).
ParameterNominalSEH MeasuredSEH DeviationSH MeasuredSH Deviation
L138.00137.87 ± 0.15−0.13 (0.09%)137.92 ± 0.12−0.08 (0.06%)
H122.33122.21 ± 0.18−0.12 (0.10%)122.25 ± 0.14−0.08 (0.07%)
t 1 1.000.97 ± 0.04−0.03 (3.0%)0.98 ± 0.03−0.02 (2.0%)
a10.009.79 ± 0.21−0.21 (2.1%)
b7.697.49 ± 0.20−0.20 (2.6%)
t 2 1.000.96 ± 0.05−0.04 (4.0%)
θ 40°39.4 ± 0.6°−0.6° (1.5%)39.5 ± 0.5°−0.5° (1.3%)
Table 4. Engineering constants of the SEH obtained using the unit-cell homogenization.
Parameters E 1 (MPa) E 2 (MPa) G 12 (MPa) ν 12 ρ * (g/cm3) K xy (MPa)
Properties31.6754.301.63−0.420.57 12.13
Table 5. Displacement contour comparison of SEH and SH structures at elastic strain of ε 22 = 0.01 (unit: mm).
ModelsSEHSH
3D-FEM3D-ECM3D-FEM3D-ECM
UBuildings 16 03014 i001Buildings 16 03014 i002Buildings 16 03014 i003Buildings 16 03014 i004
U 1 Buildings 16 03014 i005Buildings 16 03014 i006Buildings 16 03014 i007Buildings 16 03014 i008
U 2 Buildings 16 03014 i009Buildings 16 03014 i010Buildings 16 03014 i011Buildings 16 03014 i012
Table 6. Mechanical properties comparison of SEH and SH structures at elastic strain of ε 22 = 0.01 .
Models3D-EXP3D-FEM3D-ECMError 1 aError 2Error 3
E 2 /MPaSEH109.72111.67113.381.78%3.33%1.53%
SH8.398.679.053.33%4.38%7.86%
ν 21 SEH−0.98−1.04−1.096.10%4.81%11.22%
SH−0.59−0.62−0.675.08%8.06%13.56%
a Errors 1–3 represent the relative errors between 3D-EXP and 3D-FEM, 3D-EXP and 3D-ECM, as well as 3D-FEM and 3D-ECM, respectively.
Table 7. Variation ranges for different structural parameters.
Star AngleSlenderness RatioElliptical Aspect RatioLength RatioThickness Ratio
θ n = 10 t 1 / l 2 m = a / b k = l 1 / l 2 c = t 2 / t 1
40∼60°1.1∼1.51.1∼1.51.7∼2.10.5∼1.5
Table 8. Deformation modes of SEH and SH structures at different strain levels.
StrainsSEHSH
3D-EXP3D-FEM3D-EXP3D-FEM
ε 22 = 0.00
( ε 22 = 0.00) a
Buildings 16 03014 i013Buildings 16 03014 i014Buildings 16 03014 i015Buildings 16 03014 i016
ε 22 = 0.02
( ε 22 = 0.10)
Buildings 16 03014 i017Buildings 16 03014 i018Buildings 16 03014 i019Buildings 16 03014 i020
ε 22 = 0.07
( ε 22 = 0.15)
Buildings 16 03014 i021Buildings 16 03014 i022Buildings 16 03014 i023Buildings 16 03014 i024
ε 22 = 0.16
( ε 22 = 0.19)
Buildings 16 03014 i025Buildings 16 03014 i026Buildings 16 03014 i027Buildings 16 03014 i028
ε 22 = 0.203
( ε 22 = 0.247)
Buildings 16 03014 i029Buildings 16 03014 i030Buildings 16 03014 i031Buildings 16 03014 i032
a Strain values inside and outside parentheses correspond to SEH and SH, respectively.
Table 9. Comparative mechanical properties of SEH, equal-density SEH (SEH-iso), and SH predicted by 3D-FEM.
PropertySEHSEH-Iso (Equal ρ * )SHSEH-Iso vs. SH
t 1 (mm)1.000.781.00
ρ * (g/cm3)0.570.370.37Equal
E 2 (MPa)113.3872.49.058.0 × higher
E 2 / ρ * (MPa·cm3/g)198.9195.724.58.0 × higher
σ p (MPa)1.380.860.521.65 × higher
SEA (J/g)2.481.741.211.44 × higher
Table 10. Deformation and stress distribution comparison of different star-shaped honeycomb cells at different strain levels (unit: MPa).
ModelsSEH CellSH CellHASS CellSRH Cell
Elastic stage
( ε 22 = 0.01 )
Buildings 16 03014 i033Buildings 16 03014 i034Buildings 16 03014 i035Buildings 16 03014 i036Buildings 16 03014 i037
Plateau stage
( ε 22 = 0.10 )
Buildings 16 03014 i038Buildings 16 03014 i039Buildings 16 03014 i040Buildings 16 03014 i041Buildings 16 03014 i042
Densification
( ε d )
Buildings 16 03014 i043Buildings 16 03014 i044Buildings 16 03014 i045Buildings 16 03014 i046Buildings 16 03014 i047
Table 11. Local deformation comparison of different star-shaped honeycomb cells at elastic strain ε 22 = 0.01 (unit: mm).
ModelsSEH CellSH CellHASS CellSRH Cell
U 1 Buildings 16 03014 i048Buildings 16 03014 i049Buildings 16 03014 i050Buildings 16 03014 i051Buildings 16 03014 i052
Δ U 1 0.487 mm0.439 mm0.363 mm0.462 mm
Disclaimer/Publisher’s Note: The statements, opinions and data contained in all publications are solely those of the individual author(s) and contributor(s) and not of MDPI and/or the editor(s). MDPI and/or the editor(s) disclaim responsibility for any injury to people or property resulting from any ideas, methods, instructions or products referred to in the content.