Article

Exploring the Accessibility of Medical Facilities from the Perspective of Medical Spatial Equalization Evaluation: A Study Based on Harbin, China


1
School of Art and Archaeology, Hangzhou City University, Hangzhou 310015, China
2
Key Laboratory of Cold Region Urban and Rural Human Settlement Environment Science and Technology, School of Architecture and Design, Harbin Institute of Technology, Ministry of Industry and Information Technology, Harbin 150001, China
3
Qingdao Innovation and Development Base, Harbin Institute of Technology (Weihai), No. 106-2, Jingcheng Road, Chengyang District, Qingdao 266109, China
*
Authors to whom correspondence should be addressed.
Buildings 2026, 16(15), 2981; https://doi.org/10.3390/buildings16152981
Submission received: 4 June 2026 / Revised: 20 July 2026 / Accepted: 24 July 2026 / Published: 27 July 2026
(This article belongs to the Section Architectural Design, Urban Science, and Real Estate)

Abstract

As urban demand for healthcare continues to rise, the issue of equity in medical services has become increasingly prominent. This necessitates rational spatial planning of medical facilities, particularly the establishment of spatial equalization among medical facilities. Taking the main urban area of Harbin, Heilongjiang Province, as a case study, this research introduces the comprehensive accessibility of general hospitals and the subjective evaluation factors of spatial equalization for individual hospital buildings, comparing these with objective resource indicators such as bed capacity, to investigate the spatial equalization planning of medical facilities. The study reveals that the degree of equalization of medical facilities in Harbin’s main urban area exhibits a centrally radiating distribution pattern. The overall accessibility of medical facilities is satisfactory. The weighted subjective evaluation factors exert a more pronounced influence in both the core and peripheral zones of the city. Medical facilities in the urban core need to enhance spatial equalization at the individual building level, while peripheral areas require improvements in resource allocation to strengthen the equalization effect. Based on the research findings, four zones for the equalization planning and configuration of urban medical facilities are identified: facility optimization zones, service stability zones, allocation compensation zones, and peripheral buffer zones.

1. Introduction

With the increasing global awareness of public health and the frequent occurrence of novel public health risks, the rational utilization of medical resources has become a critical concern for society [1]. As centers of population, cities face extensive healthcare demands, posing challenges to the construction of medical service systems and the effective planning of medical facilities [2]. The equitable distribution of medical facilities directly affects people’s health and well-being; however, the imbalance of medical resources has become increasingly prominent in the process of rapid urbanization [3]. How to rationally plan and allocate medical facilities within limited spatial resources to achieve efficient utilization and social equity has become an urgent issue in urban development [4,5].
In recent years, academic research on the equitable distribution of medical facility resources has primarily focused on facility configuration indicators such as hospital tier, bed capacity, and the number of medical personnel [6], as well as on spatial layout accessibility and facility siting [7]. These indicators are essential for evaluating macroscale resource allocation, but they often treat hospitals as homogeneous supply points and therefore cannot fully explain how building-level factors such as circulation organization, functional configuration, emergency conversion capacity, and site environment affect actual service experience. At the same time, a growing body of research has emphasized the importance of spatial equalization in the monitoring and planning of hospital systems. Measurement-oriented studies have quantified inequalities in healthcare resource allocation at national and provincial scales, demonstrating that persistent supply–demand mismatches can only be identified when the spatial dimension of resource allocation is explicitly and continuously monitored [8]. Accessibility-based studies employing the two-step floating catchment area (2SFCA) family of methods have further shown that spatial equalization indicators can reveal underserved populations that remain invisible to simple per capita resource statistics [9,10]. Research on the equity of urban public services likewise indicates that spatial equity assessment provides an operational basis for facility siting and resource reallocation decisions [3,5]. Collectively, these studies establish continuous monitoring of hospital spatial equalization as a prerequisite for equitable healthcare planning; however, they focus predominantly on regional resource allocation, leaving the building level largely unexamined. The spatial equalization of hospital buildings refers to the degree of equalization of the hospital building or medical space itself; it is not limited to geographic distance but also encompasses medical service efficiency and the rationality of medical service functions.
In this study, “spatial equalization of medical facilities” refers to the degree to which populations can equitably obtain the medical services or medical resources they require. This concept first comprehensively considers, from the supply side of medical resources, attractiveness factors in spatial accessibility such as distance, facility tier, and institutional capacity [11,12]. It further considers, from the perspective of patient demand, users’ equalization evaluations of medical facilities during the process of seeking care [13]. The purpose of this approach is to enhance the equity and effectiveness of medical facilities by integrating objective resource indicator configuration with subjective evaluation.
Taking Harbin as a case study, this research addresses the spatial equalization of urban medical facilities. By constructing a spatial equalization evaluation model, the study analyzes the distribution characteristics and degree of spatial equalization of medical facilities in Harbin’s main urban area, explains the spatial differentiation of equalization, and proposes strategies for optimizing the spatially equalized distribution of urban medical facilities. The research provides a scientific basis for the spatial planning of urban medical facilities and promotes the rational allocation of medical resources and the improvement of public health and well-being.

2. Literature Review

2.1. Spatial Distribution and Accessibility of Medical Services

Medical services refer to a series of health services provided to the population, encompassing disease prevention, medical treatment, infectious disease control, rehabilitation nursing, and social health activities. With the growing demand of urban populations for medical services, the need to improve medical service efficiency and effectively utilize medical space has rendered the spatial distribution and accessibility of medical facilities critical to the equalization of medical resource allocation [14]. Accessibility, as a core concept across interdisciplinary fields, is widely applied to evaluate the ease with which individuals or groups can access specific locations or resources. In medical services, accessibility directly affects people’s ability to obtain basic medical care, influencing their health and well-being [15].
Employing the Enhanced Two-Step Floating Catchment Area (E2SFCA) method, a study (2025) constructed a comprehensive spatial accessibility index for healthcare services and analyzed the equity of healthcare service distribution in Sistan and Baluchestan Province, southeastern Iran, using Lorenz curves and Gini coefficients. Results indicated a high degree of inequity in provincial healthcare distribution, with a Gini coefficient of 0.517; nearly 75% of the population had low accessibility to primary care, and only 11.6% enjoyed high overall accessibility [9].
Furthermore, the geographic accessibility of medical services is significantly associated with public health and epidemic prevention. Cao, Y.J. et al. (2025) evaluated the geographic accessibility of COVID-19 vaccination on a multicountry scale, including comparisons between low- and middle-income countries and high-income countries, and further explored potential economic factors related to accessibility and their impact on health outcomes [15]. In evaluating the accessibility of medical facilities, travel distance to seek care is a critical variable that influences patients’ hospital-selection decision-making processes. Liang, G.D. et al. (2025) constructed a multimodal accessibility model integrating actual medical travel behavior characteristics and found that travel impedance influences mode choice and spatiotemporal variation; this method enables more accurate evaluation of medical resource allocation and avoids estimation bias [16]. Meanwhile, Hwang, H et al. (2025) took Cheonan, South Korea, as a case study and proposed a microspatial assessment framework based on a 500 m × 500 m grid [17]. By integrating three dimensions of E2SFCA accessibility analysis, distribution equity, and supply adequacy, the framework evaluates the supply of childcare and senior welfare facilities.

2.2. Configuration and Optimization of Medical Facilities

The configuration of medical facilities involves the supply–demand relationship within the medical service system, encompassing the complex hierarchy and dimensions of medical space as well as the operating mechanisms of medical services. A substantial body of research suggests that the configuration of medical facilities can first be examined from the perspective of facility scale through the optimization of objective indicators such as facility level, hospital bed capacity, and the number of medical personnel [18]. For example, Kim, J.N. et al. (2024) employed inflow and outflow indices (correlation index and commitment index) to analyze patient flow and utilization patterns across different types of hospital beds in South Korea, identifying differences in bed utilization and regional distribution between tertiary referral hospitals and long-term care hospitals, and investigating rational approaches to medical resource allocation [6]. From a sociological perspective, a well-configured medical facility system can satisfy the needs of a greater number of people and achieve improved medical outcomes by enhancing service efficiency and quality. For instance, Luan, J.Y. et al. (2025) examined the synergy between the spatial accessibility of medical facilities and the perceived accessibility of elderly individuals with mobility and health limitations, employing Importance Performance Analysis to identify low accessibility factors requiring urgent improvement [19]. Research on the spatial equalization of hospital buildings is characterized by interactivity, complexity, and dynamism; accordingly, it is important to establish a spatial equalization system for medical facilities to assess the current service status of hospital buildings and to rationally coordinate medical resource allocation.
While existing research has provided valuable insights, it tends to focus singularly on the optimization of either the layout or the quantity of medical facilities, failing to adequately reflect the complexity encountered in practical application. In reality, the equalization of medical facility configuration involves not only the location selection of medical facilities and the configuration of medical resources, but also the spatial equalization of the hospital building itself, such as the rationality of patient circulation routes, the convenience of medical space utilization, and the flexible use of medical space. Accordingly, establishing a systemic spatial equalization framework extending from individual hospital buildings to the regional service efficiency of medical facilities and forming a theoretical structure and logical framework for studying the spatial equalization of hospital buildings along with comprehensive technical methods is a critical challenge.
This study establishes a spatial equalization system perspective extending from individual hospital buildings to regional medical facility spatial planning. Its contribution is not to replace conventional accessibility modeling, but to introduce a hospital building spatial performance indicator into the supply term of the 2SFCA framework and to compare it with the conventional bed capacity indicator. This design allows the analysis to distinguish macrolevel resource scale from microlevel building performance, thereby clarifying which planning recommendations are obtainable only after the spatial equalization of individual hospital buildings is considered. Taking the main urban area of Harbin, Heilongjiang Province, as a case study, the study proposes optimization strategies for spatially equalized hospital planning and provides a technical pathway for linking hospital construction evaluation with regional medical facility planning.

3. Materials and Methods

3.1. Analytical Framework

This study reveals the influence of the spatial equalization capacity of individual hospital buildings on the overall service capacity equalization of regional medical facilities and quantifies the degree of spatial equalization of medical facilities in Harbin’s main urban area. Drawing on spatial accessibility evaluation methods [5,10], the study first collects medical facility data and performs spatial positioning to determine the residential locations of populations served by street-level service units; second, it obtains information on the service levels of medical institutions and maps the spatial distribution of medical resources based on medical facility tiers. Subsequently, spatial equalization evaluation data for individual hospital buildings are collected encompassing factors such as site selection, functional configuration, circulation organization, and site environment to assess the impact of individual medical building spatial performance on the spatial equalization of medical resources.
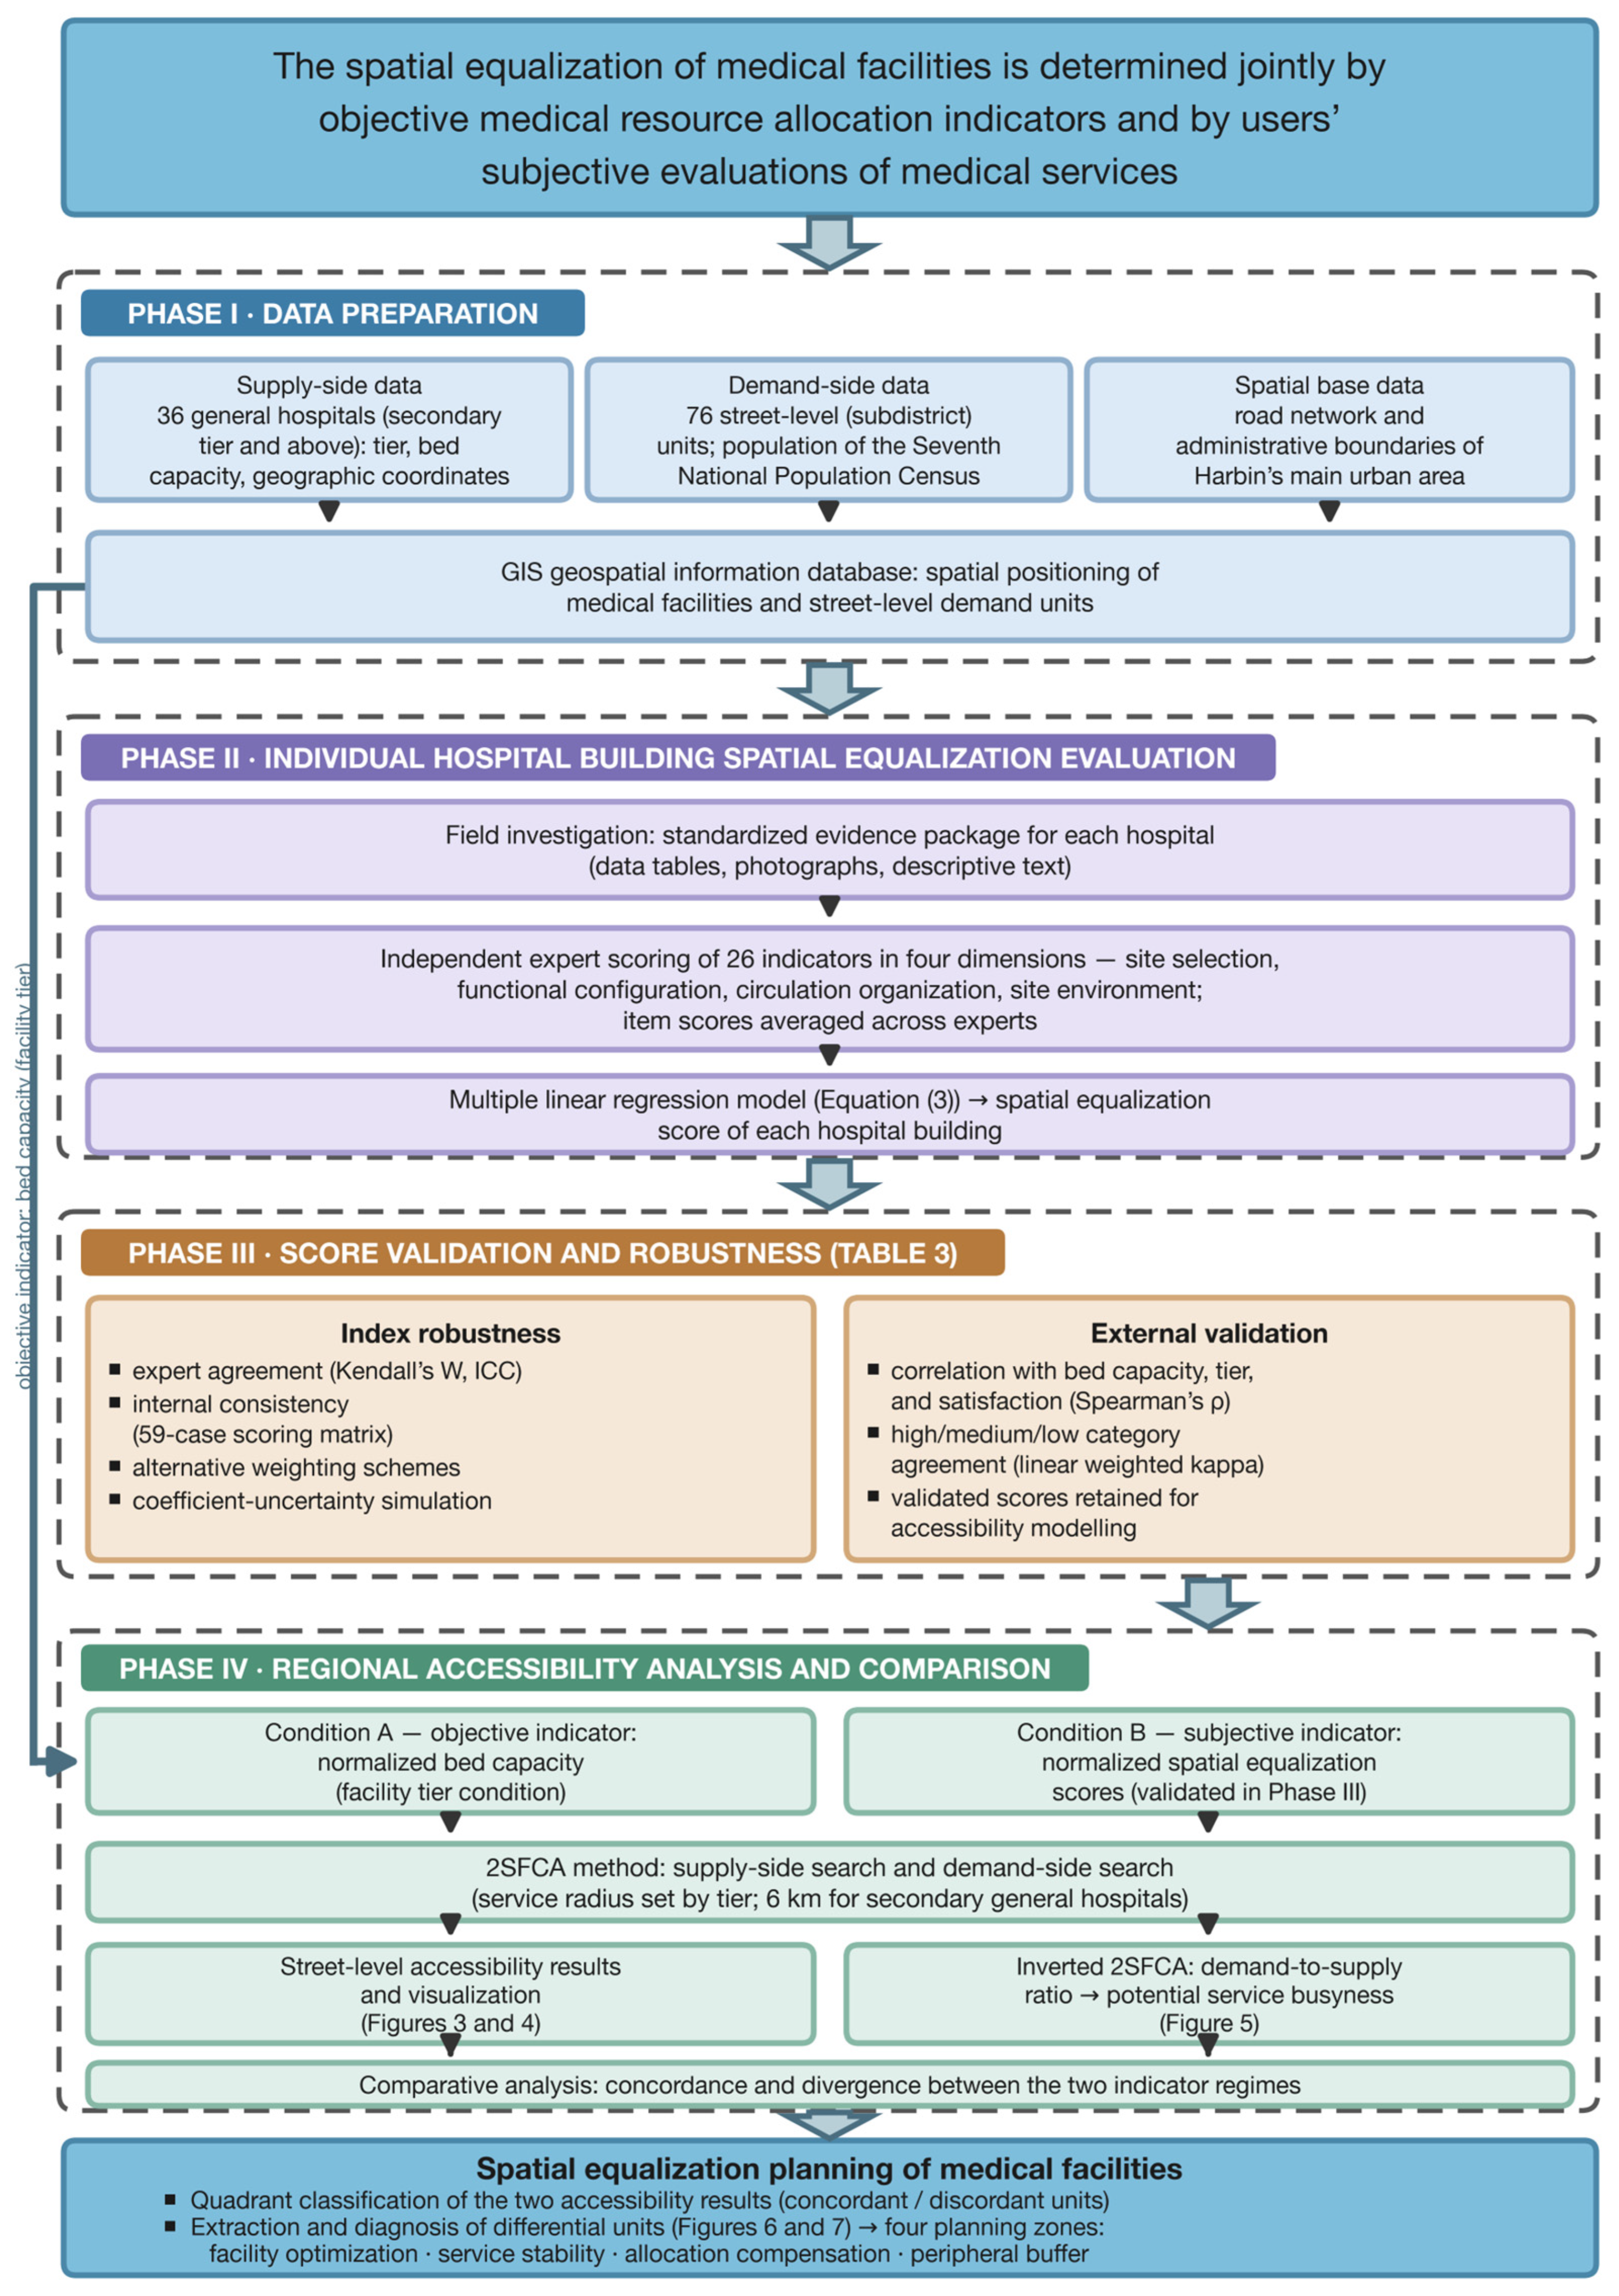
Methodologically, the study applies a previously validated linear regression model to translate four first-level dimensions of hospital building spatial equalization into a composite supply indicator [20]. The linear form is adopted because the preceding scale development study reduced 26 indicators to four interpretable dimensions and estimated their joint contribution to overall spatial equalization. The present article does not re-estimate that model; rather, it applies the published coefficients to Harbin’s hospital sample, incorporates the resulting scores into the accessibility model, and compares the outcomes with those derived from the conventional bed capacity indicator. High spatial accessibility signifies that patients can quickly and conveniently obtain services meeting their needs, whereas low spatial accessibility may result in underutilization of services, resource waste, and exacerbated medical service inequity. To clarify reproducibility and robustness, the framework also includes consistency testing of the expert-based score, alternative weighting checks, coefficient uncertainty assessment, and external comparison with conventional hospital supply indicators. The methodological framework is illustrated in Figure 1.
With respect to accessibility assessment, a spatial visualization model of hospital buildings is constructed through spatial data analysis, directly reflecting the spatial structure and layout status of hospital buildings. The study employs the Two-Step Floating Catchment Area (2SFCA) method to construct spatial equalization models of hospital buildings under two respective conditions: the tiered structural conditions of medical facilities and the spatial equalization evaluation score conditions. The 2SFCA method effectively captures the supply–demand relationship of medical resources. In the model construction process, the tiered structural conditions of medical facilities are primarily represented by the bed capacity of each hospital—a key indicator for assessing hospital tiers in China and an important reference for hospital hierarchical structure. The spatial equalization indicator conditions represent the equalization assessment scores obtained from evaluating all general hospitals in the main urban area as individual hospital buildings. By substituting these two different datasets into the 2SFCA method separately, the resulting outcomes can be compared directly to analyze the rationality of the distribution of general hospitals in Harbin’s main urban area under the influence of equalization indicators.
The calculation procedure is as follows:
Step 1: For each supply point j with a search radius d0, the supply–demand ratio Rj is the ratio of the supply volume to the total demand across k demand points within the search area:
R j = S j k d k j d 0 D k
where dkj is the distance between demand point k and supply point j; Dk is the demand at the k demand point within the search area (where dkjd0); and Sj is the supply volume at supply point j.
Step 2: For each demand point i with a search radius d0, the accessibility Ai F* is the sum of supply–demand ratios Rj across all supply points within the search area:
A i F = j d i j d 0 R j = j d i j d 0 S j k d k j d 0 D k
where dij is the distance between demand point i and supply point j. A larger Ai F* indicates better service accessibility at the demand point.
To ensure the validity of the comparison results, both the bed capacity indicator and the spatial equalization evaluation indicator were normalized prior to model entry, scaling both datasets to a uniform interval [0, 1]. Min–max normalization was applied using the formula: (data point − minimum value)/(maximum value − minimum value).

3.2. Survey Region and Data

3.2.1. Study Area

Harbin is the provincial capital of Heilongjiang Province and serves as a critical hub of medical resources for the region. The administrative jurisdiction of Harbin’s main urban area encompasses seven districts: Daoli, Daowai, Nangang, Xiangfang, Pingfang, Songbei, and Hulan. Multiple large hospitals within the city extend their reach and influence to the entire province and even the broader northeastern region of China. With the development of the city’s economy and social undertakings, Harbin has established a relatively comprehensive medical and health system encompassing healthcare, public health and hygiene, emergency medical services, and epidemic prevention. Given that the general hospital services in Hulan District and Pingfang District are largely supplied from neighboring jurisdictions, the study primarily focuses on Daoli, Daowai, Nangang, Xiangfang, and Songbei districts, comprising 76 service street-level units. Street-level (subdistrict) units were adopted as the basic analysis units for three reasons. First, the street-level unit is the smallest administrative unit for which complete and authoritative demographic data are available from the Seventh National Population Census, so that demand estimates rest on official statistics rather than downscaled approximations. Second, in China’s planning practice, the subdistrict is the basic operational unit through which public service facilities, including medical facilities, are allocated and administered, so results reported at this scale can be adopted directly by planning authorities. Third, the research objects of this study are general hospitals at the secondary level and above, whose service catchments extend over several kilometers; the street-level unit is commensurate with this service scale, whereas block- or grid-scale units are more appropriate for community-level facilities with walking-based catchments [17]. A total of 36 general hospitals at the secondary level and above are identified within the study area.

3.2.2. Spatial Data

The specific data involved in the study include: ① An administrative division map of Harbin’s main urban area, subdivided to the street level. ② The road network layer of the study area. ③ Data from the Seventh National Population Census of Harbin. ④ Detailed data for each general hospital, including name, address, and bed capacity. ⑤ Geographic coordinate data for each general hospital. ⑥ Spatial equalization status evaluation scores for each general hospital building. Additionally, as supplementary and updated data, relevant information was collected from the Harbin Municipal Government Data Open Platform and through web scraping software. GIS technology was employed to organize the spatial data of Harbin’s hospitals, establishing a geospatial information database.

3.2.3. Spatial Equalization Status Evaluation Data for Individual General Hospital Buildings

The four-dimensional evaluation model was adopted from Liu et al. [20]. In the original model development study, factor analysis supported the four-dimensional structure of the evaluation system (KMO = 0.890; Bartlett’s test p < 0.001; cumulative variance explained = 74.631%). The regression model was statistically significant (F = 63.520, p < 0.001; adjusted R2 = 0.467), and the reported variance inflation factors for the four first-level dimensions were approximately 1.040–1.076, indicating no evident multicollinearity. The coefficients were estimated by the ordinary least squares method, and residual diagnostics in the original study showed that the residuals approximately followed a normal distribution, supporting the linear specification. The unstandardized regression coefficients were therefore used as the weights in the following composite evaluation model:
y = −1.450 + 0.385 × Site Selection + 0.265 × Functional Configuration + 0.255 × Circulation Organization + 0.286 × Site Environment
Table 1 presents the relevant indicators, weights, and scoring criteria within the evaluation system [20]. Based on these items, each of the 36 general hospitals entering the GIS accessibility model is assessed individually. These 36 hospitals constitute the main analytical sample because they meet the study scope of secondary-and-above general hospitals in Harbin’s main urban area and have the spatial location, bed capacity, tier, and accessibility modeling attributes required for the 2SFCA comparison. The coefficients in Equation (3) are the unstandardized regression coefficients from the prior model development study; because coefficient choice may affect the final composite score, the present study further evaluates robustness using equal weighting, standardized beta weighting, leave-one-dimension-out recalculation, and coefficient uncertainty simulation. The spatial equalization evaluation scores obtained for each individual hospital building are subsequently incorporated into the accessibility evaluation model for medical facilities.
To strengthen the evidence for the expert-based scoring instrument itself, a supplementary validation sample was constructed by adding 23 publicly verifiable medical institutions within the Harbin administrative region, yielding a 59-case medical institution-by-dimension scoring matrix. This expansion was not intended to redefine the main GIS sample or to infer new accessibility patterns; rather, it was used to test whether the four-dimensional spatial equalization scoring system remained reliable and internally consistent when applied to a more heterogeneous set of cases. The added cases were selected through a purposive, heterogeneity-oriented validation strategy covering tertiary public hospitals in central and new urban districts, specialist hospitals, maternal and child health institutions, traditional Chinese medicine hospitals, and district-level people’s hospitals. Geographically, they extend from the main urban districts of Daoli, Daowai, Nangang, and Songbei to peripheral district-level areas including Acheng, Shuangcheng, Wuchang, Shangzhi, Yanshou, Mulan, Tonghe, and Fangzheng. This procedure follows measurement instrument validation practice, in which reliability, internal consistency, construct validity, and generalizability should be evaluated transparently on samples consistent with the intended application context [21,22,23]. Therefore, the 59-case matrix is reported as a supplemental robustness and validation dataset, whereas the formal spatial accessibility analysis remains based on the 36 hospitals with complete GIS attributes.
Taking the First Affiliated Hospital of Heilongjiang University of Chinese Medicine—one of the 36 general hospitals—as an illustrative example, the individual-level spatial equalization evaluation model described above is applied. This hospital is located in Xiangfang District, Harbin, covering a site area of 130,000 square meters. It operates three inpatient departments and one outpatient department, with a total of 1500 beds. The surrounding area features diverse land uses, encompassing provincial-level professional sports venues, universities, commercial districts, residential areas, and a railway station, with a relatively convenient transportation environment. In terms of functional configuration, the hospital adopts an integrated approach combining traditional Chinese medicine and Western medicine, offering a diverse range of diagnostic and treatment modalities, with particular distinction in disease prevention and pre-disease intervention.
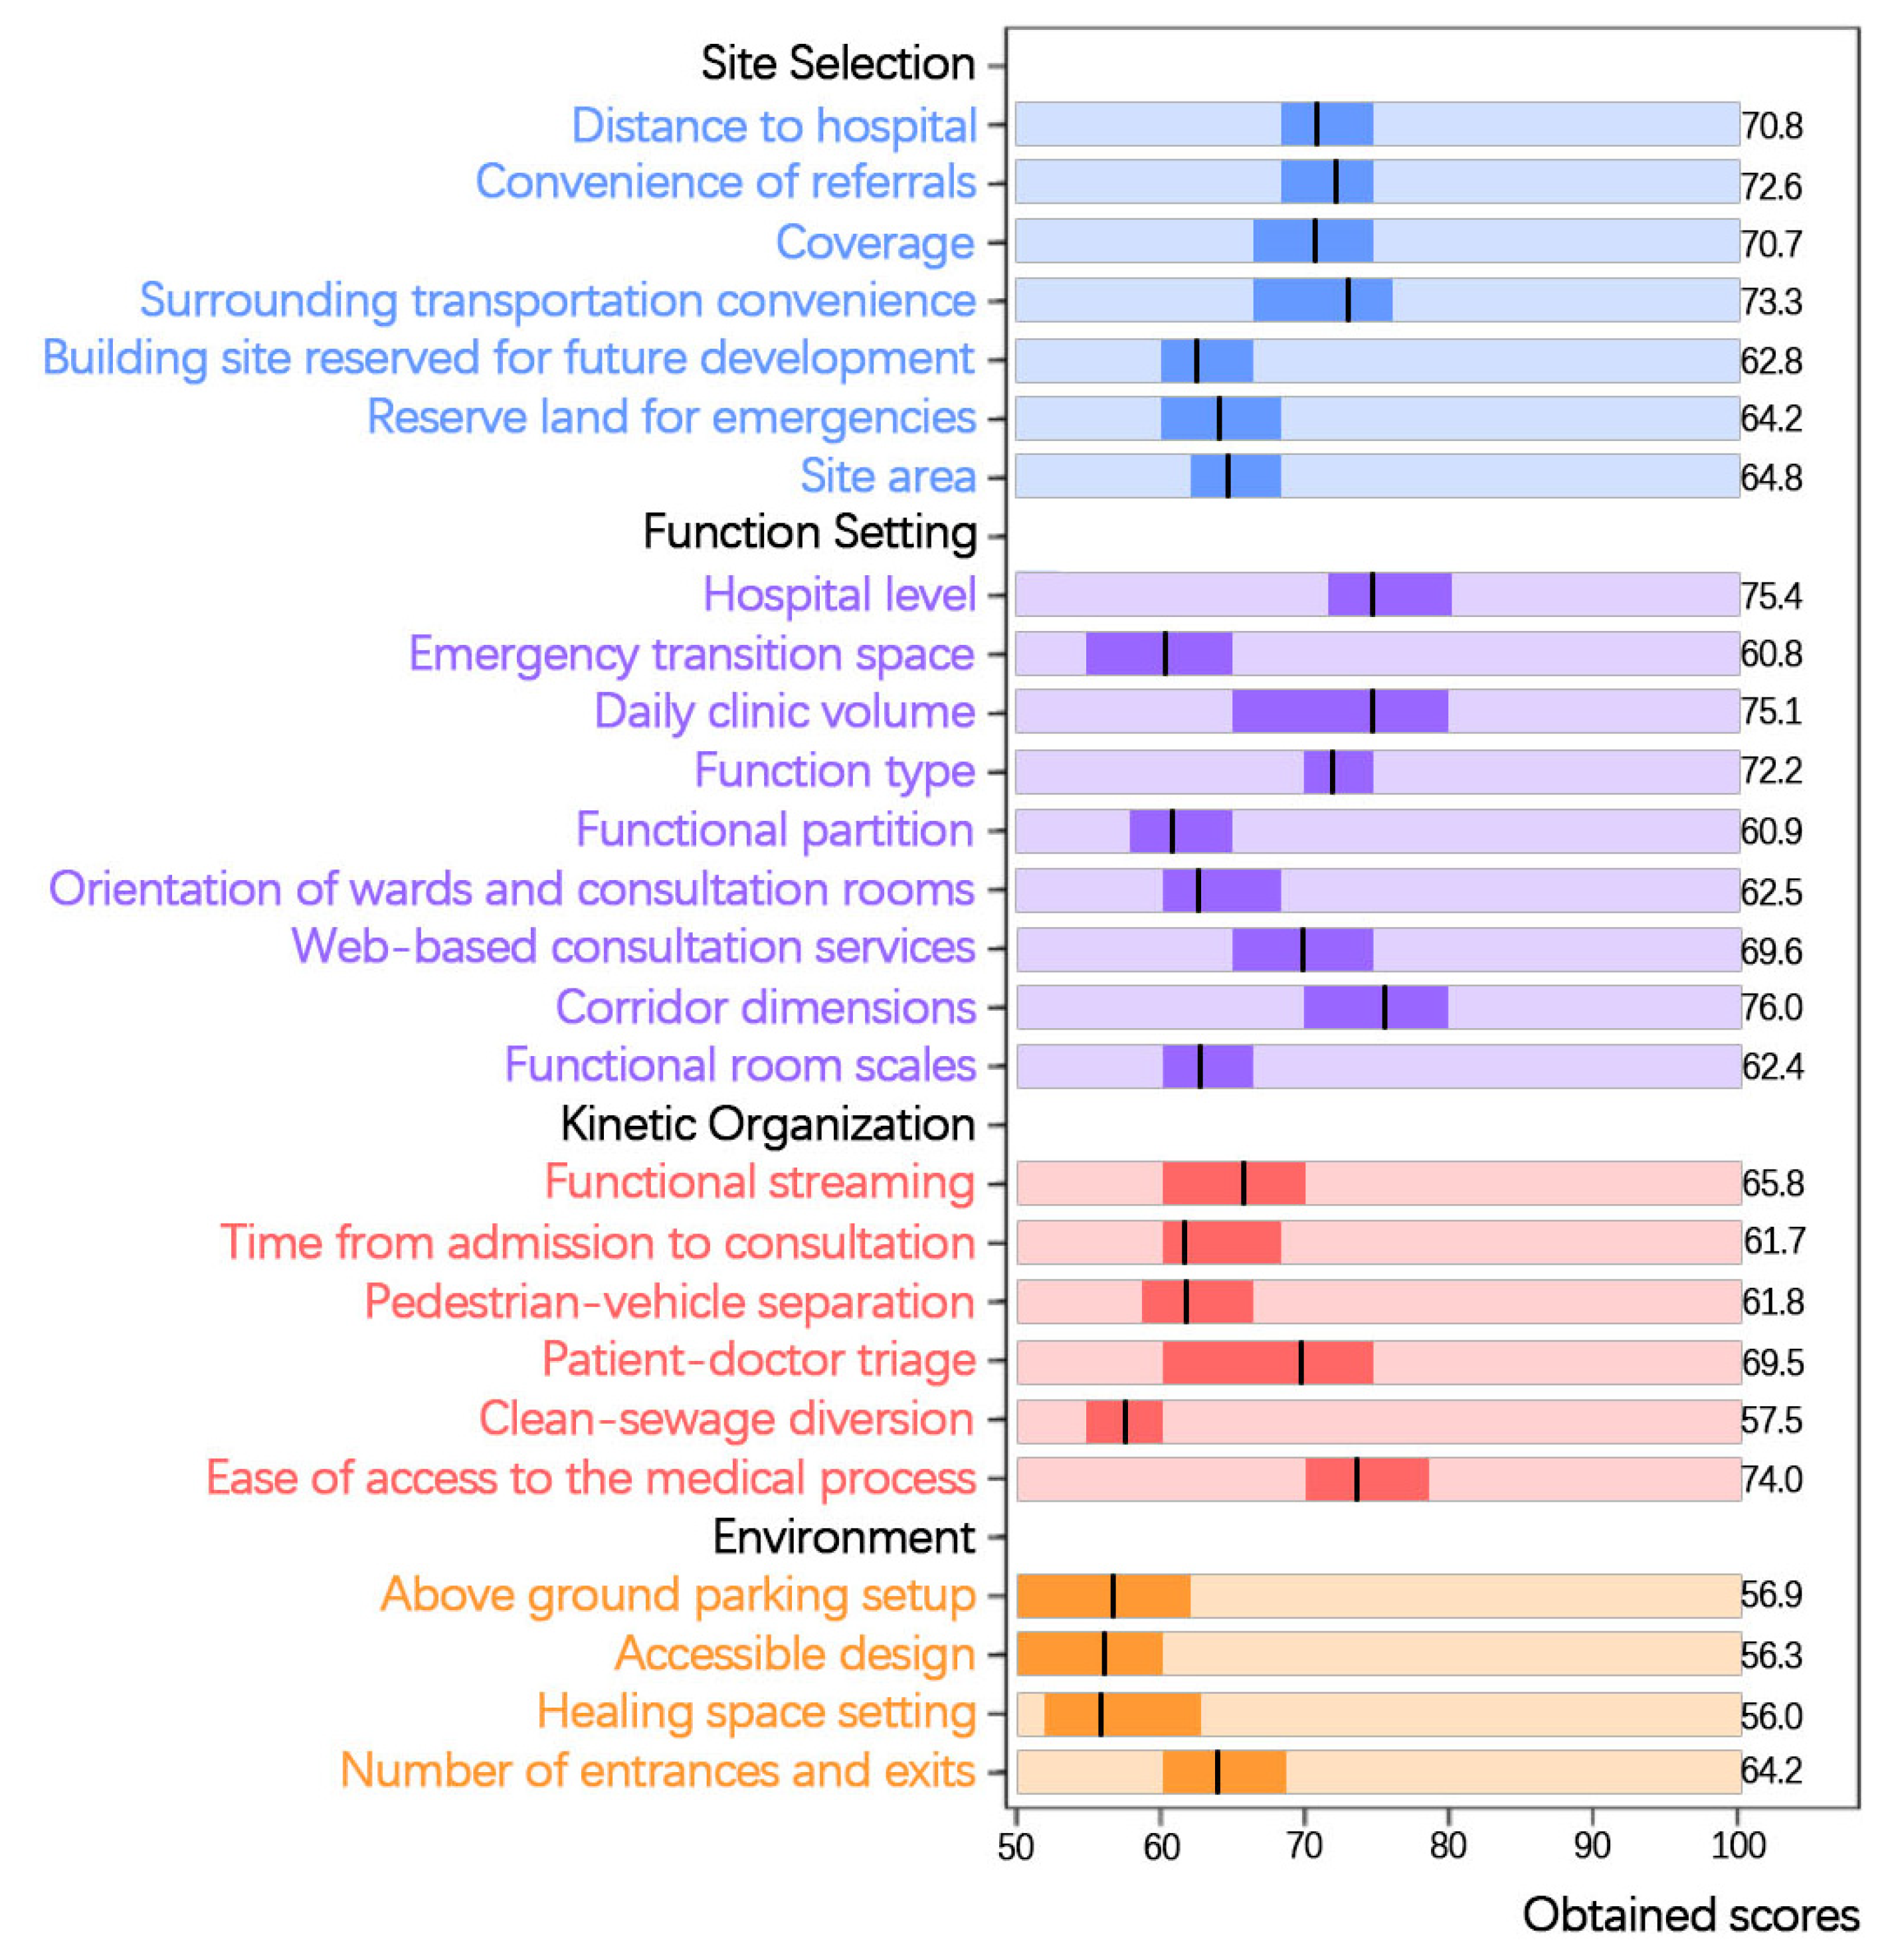
Data for the site were collected in accordance with the spatial equalization evaluation criteria, and the primary conditions were compiled into tabular form, supplemented by additional photographs and descriptive text to most accurately reflect the actual site conditions. Industry experts were subsequently invited to score each item individually, as illustrated in Figure 2. The scoring results for each item were averaged and weighted to produce the final scores for the four dimensions: site selection, functional configuration, circulation organization, and site environment.
The scores are specifically: Site Selection = 68.4335 (comprising 7 indicators: Medical Access Distance = 70.8, Referral Convenience = 72.6, Service Coverage Range = 70.7, Sur-rounding Transport Accessibility = 73.3, Reserved Construction Land within Campus = 62.8, Reserved Emergency Land = 64.2, Land Area = 64.8); Functional Configuration = 68.2588 (comprising 9 indicators: Hospital Tier = 75.4, Emergency Conversion Space = 60.8, Daily Outpatient Volume = 75.1, Functional Types = 72.2, Functional Zoning = 60.9, Ward and Consultation Room Orientation = 62.5, Online Consultation Services = 69.6, Corridor Dimensions = 76, Functional Room Dimensions = 62.4); Circulation Organization = 56.1618 (comprising 6 indicators: Functional Separation of Circulation = 65.8, Time from Admission to Consultation = 61.7, Pedestrian–Vehicle Separation = 61.8, Medical Staff–Patient Separation = 69.5, Clean–Waste Separation = 57.5, Convenience of Medical Procedures = 74); Site Environment = 58.4029 (comprising 4 indicators: Above-Ground Parking = 56.9, Barrier-Free Design = 56.3, Healing Space = 56, Number of Campus Entrances/Exits = 64.2).
To facilitate entry into the linear regression model, scores were rounded to integers: Site Selection = 68, Functional Configuration = 68, Circulation Organization = 65, Site Environment = 58. The final scores were entered into the individual-level spatial equalization linear regression model, yielding the spatial equalization score for the First Affiliated Hospital of Heilongjiang University of Chinese Medicine as follows:
y = −1.450 + 0.385 × 68 + 0.265 × 68 + 0.255 × 65 + 0.286 × 58 = 75.913
During the scoring of individual buildings, this study employed a manual questionnaire scoring approach and assigned values to each sample according to the evaluation criteria. Because the scoring procedure contains expert judgment, additional reliability and consistency checks were conducted before incorporating the scores into the accessibility model. In the supplementary 59-case scoring matrix, the four first-level dimensions showed high internal consistency (Cronbach’s alpha = 0.986; bootstrap 95% CI: 0.975–0.991), and the estimates for the original 36 hospitals and the added 23 hospitals were similar (alpha = 0.984 and 0.991, respectively). In the raw 23 expert rating matrix, 23 experts rated 26 indicators with no missing cells; Kendall’s W was 0.910 (permutation p < 0.001), ICC(2,1) was 0.590 for a single rater, and ICC(2,k) was 0.971 for the average expert score. These results indicate that individual expert scores show moderate absolute agreement, whereas the averaged expert score used in the model is highly reliable.

4. Results

4.1. Accessibility Assessment Under Medical Facility Tier Conditions

The spatial equalization assessment of hospital buildings under tiered conditions primarily reflects the evaluation of medical service levels within the industry, based on a comprehensive assessment of bed capacity, the number of medical personnel, and medical service evaluations. Hospital buildings within the same-tier category are assumed to perform equivalent functional roles. The evaluation model established under tiered conditions more effectively highlights the spatial equalization role of hospital building distribution and industry-level medical service tier evaluation.
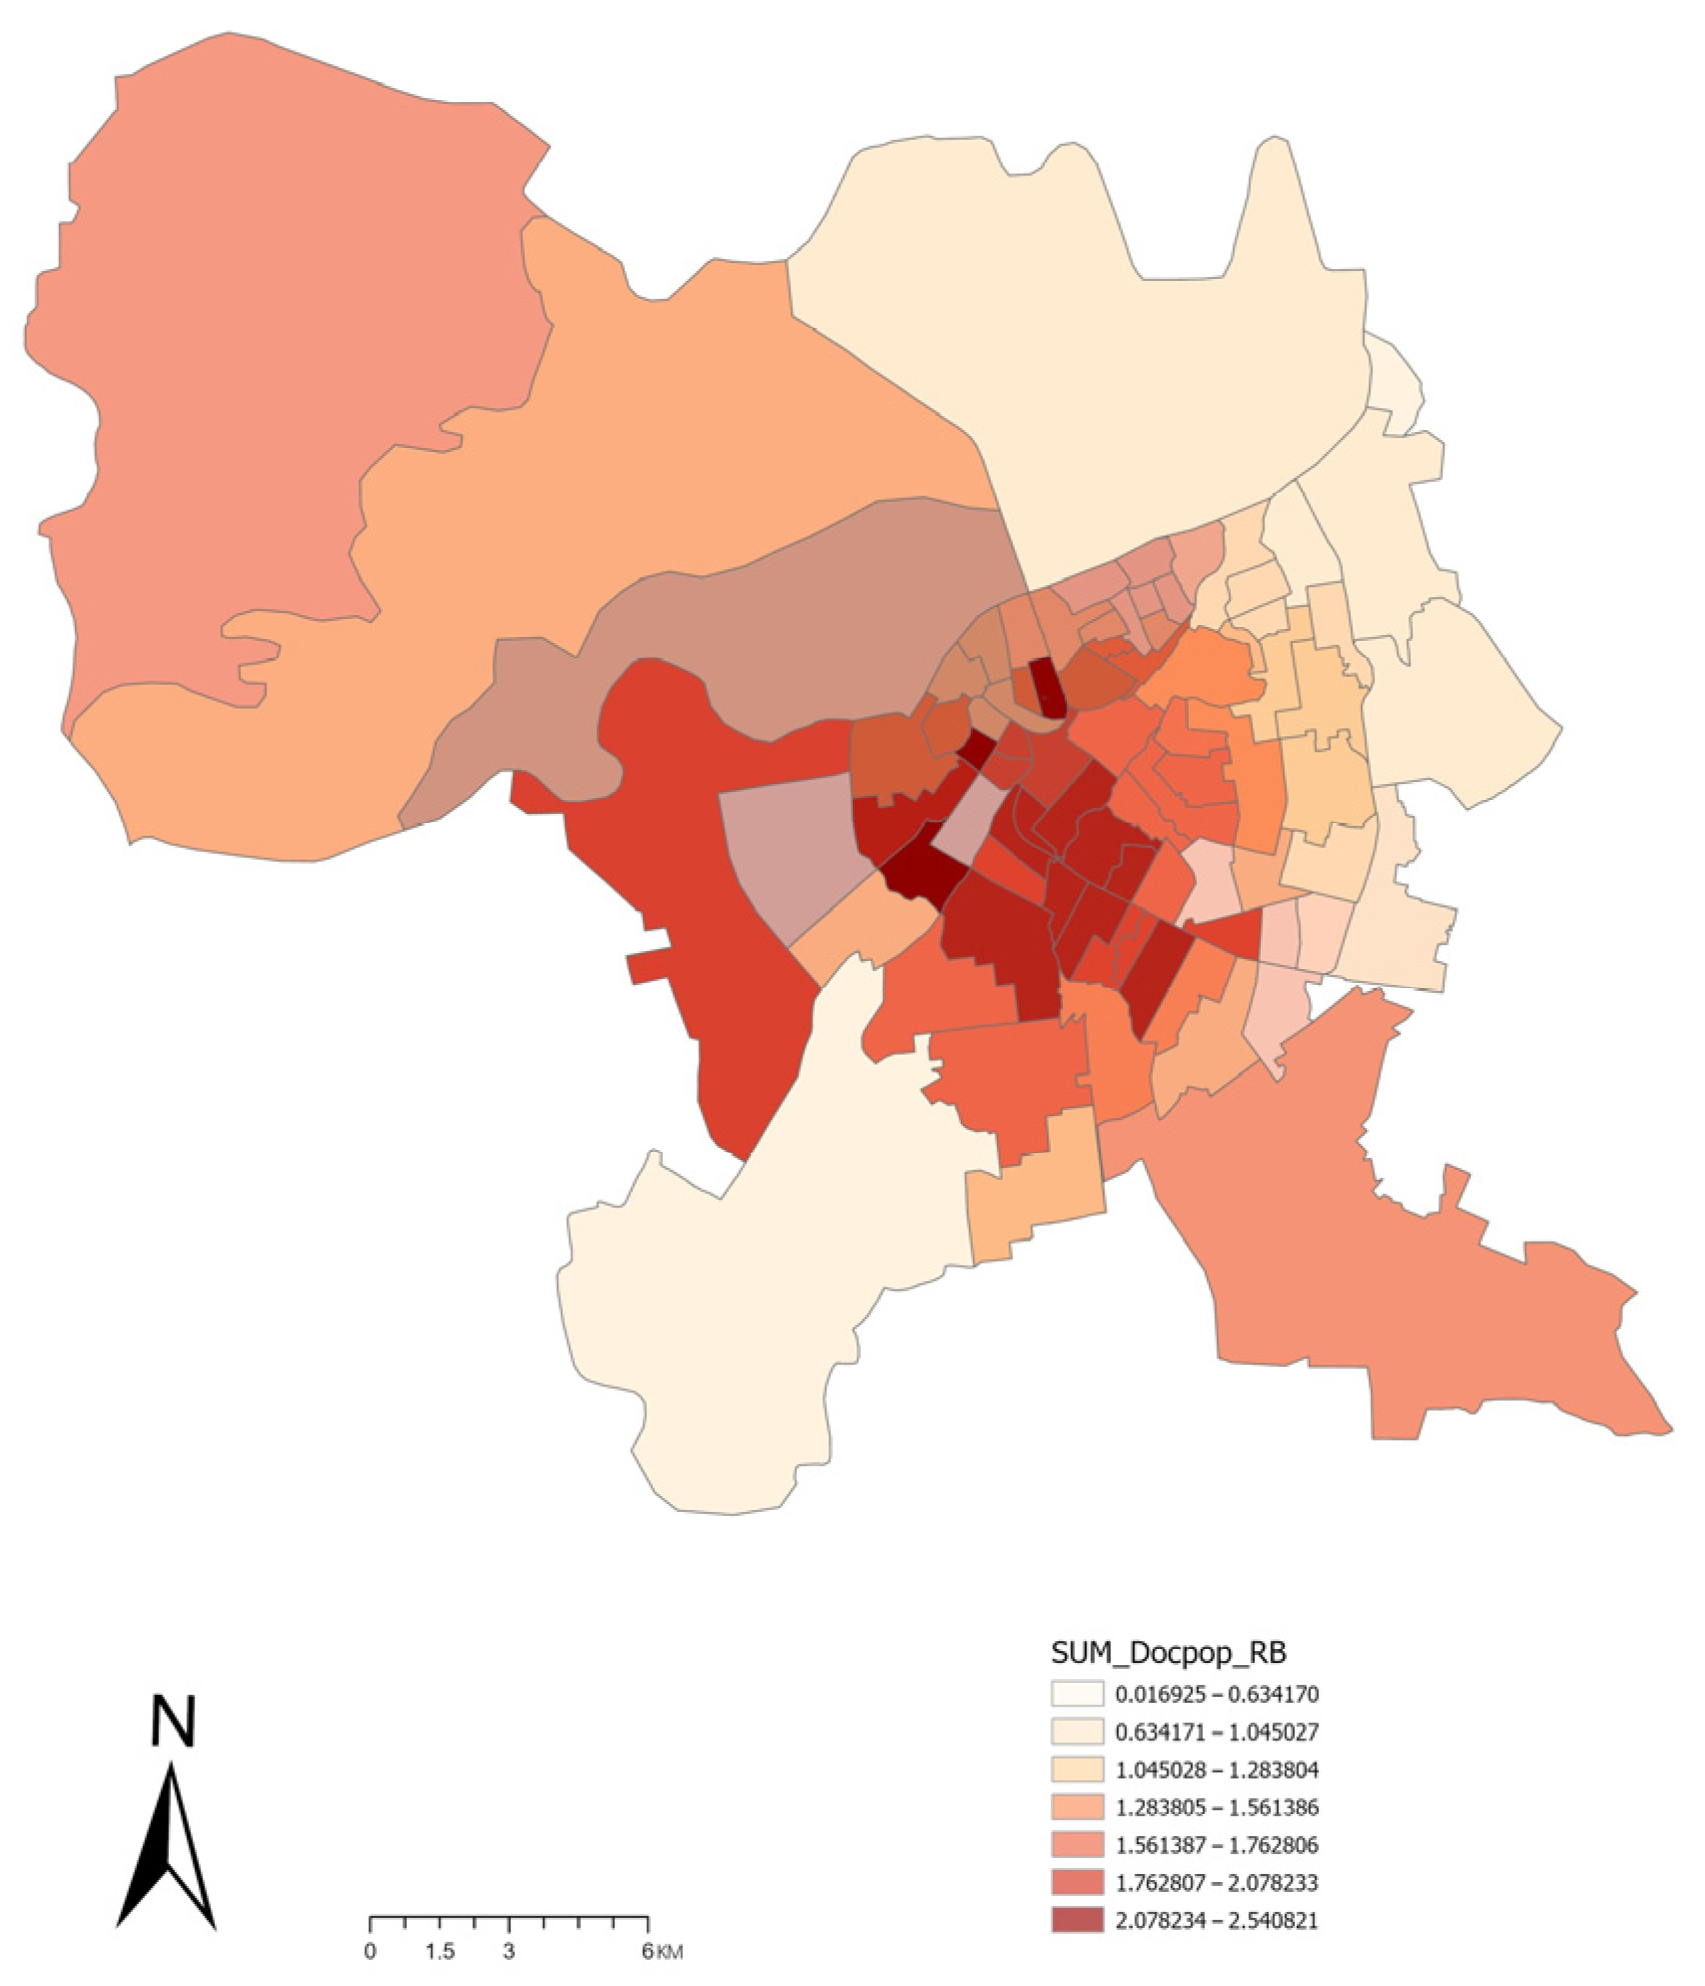
The study first employs buffer zone analysis to define the service coverage of each hospital building node within the study area and then applies a common catchment setting for comparable accessibility scenarios. The spatial distribution of hospital buildings in Harbin’s main urban area is primarily concentrated in the central area, exhibiting a pattern of central concentration with radial dispersion toward the periphery. Because no explicit national regulation specifies a fixed service coverage radius for secondary and tertiary general hospitals, the catchment setting should be treated as a modeling assumption rather than a universal planning standard. Previous 2SFCA research has shown that catchment size and distance decay can affect accessibility estimates [24,25], and recent Chinese urban medical facility research has used differentiated radii of approximately 7 km for general hospitals, 5 km for community health service centers, and 3.5 km for community clinics [26]. Accordingly, a 6 km linear radius is adopted here as a conservative baseline close to the reported general hospital range. This value is also consistent with observed travel conditions: applying a typical urban road network detour factor of 1.2–1.3, a 6 km Euclidean radius corresponds to approximately 7–8 km of network distance—roughly 15–20 min of motorized travel at average peak-period speeds of 25–30 km/h, which lies well within the 30-min vehicle access expectation for general hospitals in Chinese planning practice. Moreover, because the radius is held constant across the two supply indicator scenarios, any misspecification of the catchment shifts both accessibility surfaces in the same direction, so the concordance–discordance classification on which the subsequent planning zoning rests is considerably less sensitive to the radius choice than the absolute accessibility values are. To make the threshold transparent, the proposed sensitivity protocol recalculates the two supply indicator scenarios over 4–8 km at 1 km intervals and compares street-level rankings using Spearman’s rho and zone-agreement rates when the street-level accessibility table is available. The service coverage of general hospitals at the secondary level and above in Harbin’s main urban area, calculated using the 2SFCA method, is presented in Figure 3.
Through model analysis, the total service coverage of hospital buildings in Harbin’s main urban area is calculated at 454.91 km2, accounting for 76.97% of the total area of Harbin’s main urban area. The service coverage of tertiary general hospitals is 433.78 km2, and that of secondary general hospitals is 266.89 km2. Nangang District achieving the highest coverage rate at 97.49%, and Xiangfang District recording the lowest at 64.13%.
The analysis under tiered conditions indicates that the service coverage of general hospitals in Harbin’s main urban area can essentially cover the entire region; however, the service areas of the majority of general hospitals overlap substantially, particularly within the urban core area inside the Second Ring Road, resulting in a degree of resource redundancy in medical facility coverage. For Songbei District and Xiangfang District, which have comparatively large territorial areas, the service matching degree of hospital buildings is relatively low.

4.2. Accessibility Assessment Under Spatial Equalization Conditions

Using the individual-level hospital building spatial equalization evaluation model, spatial equalization assessments were conducted and scored for all 36 general hospitals at the secondary level and above in Harbin’s main urban area. The scores for each hospital are presented in Table 2.
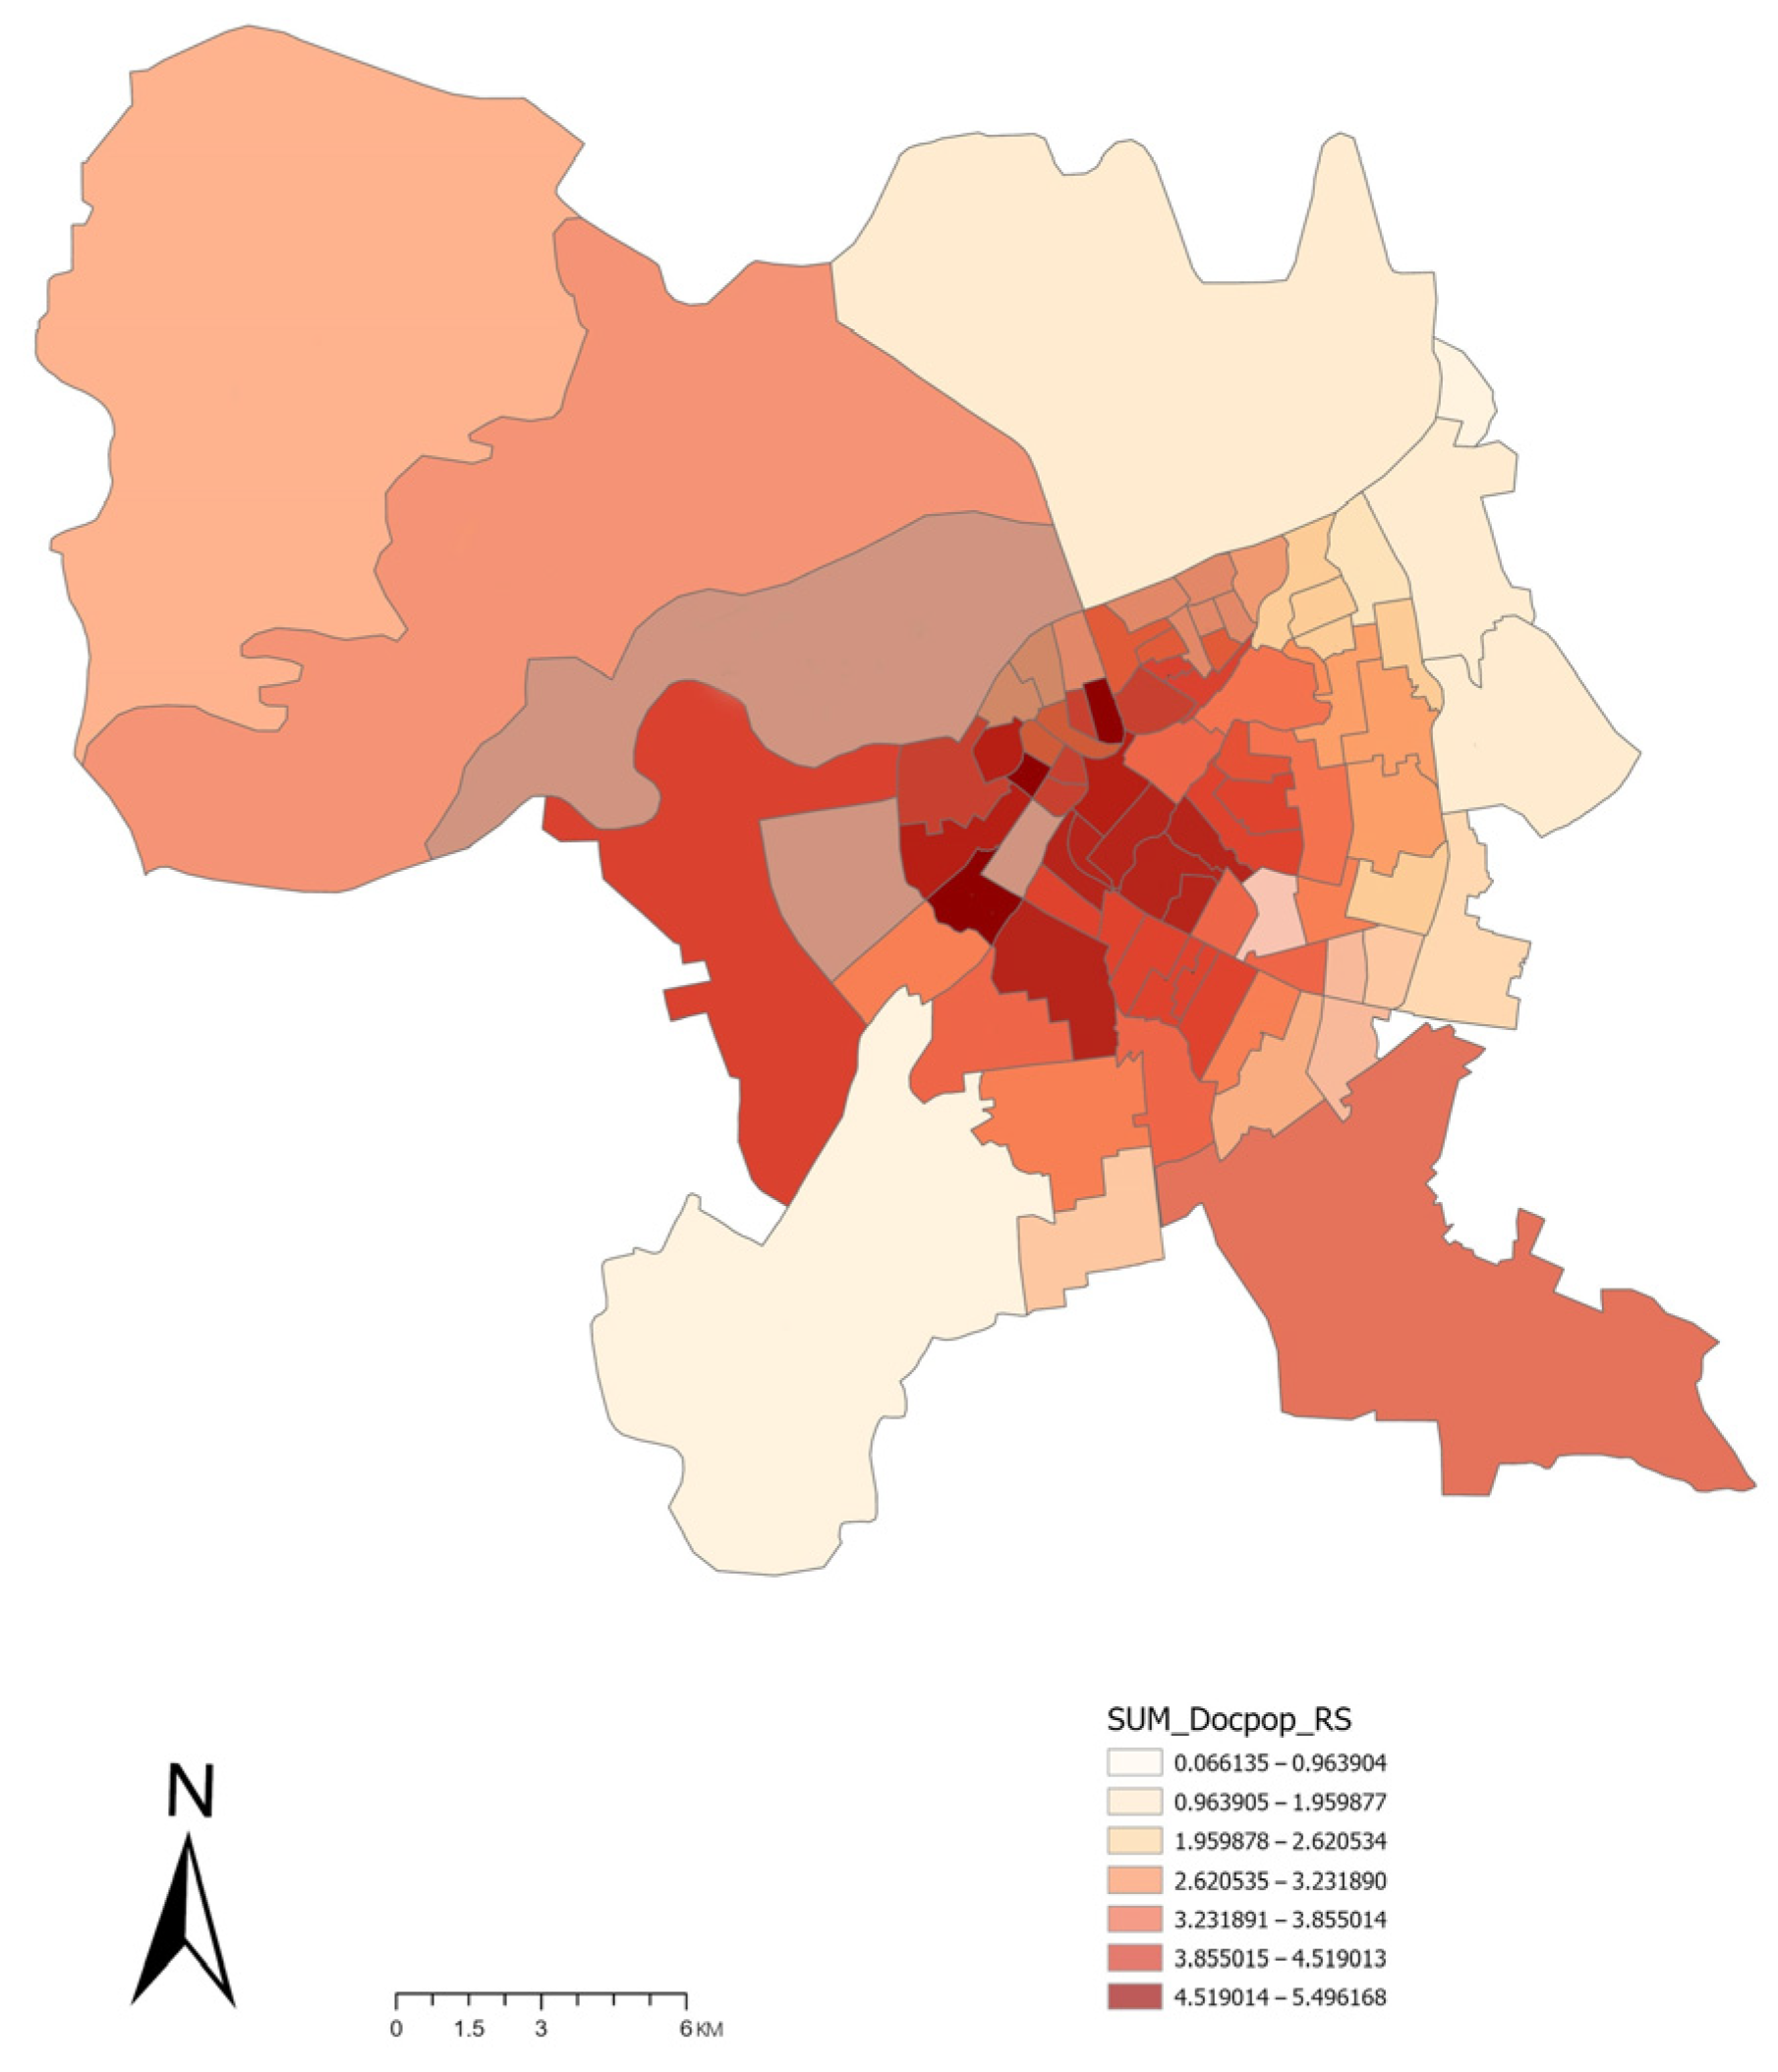
The spatial equalization evaluation scores of individual hospital buildings were normalized and subsequently incorporated into the medical facility spatial accessibility evaluation model established above, substituting for the normalized bed capacity weighting indicators of each medical facility. Before model entry, robustness checks indicated that the ranking of hospitals was highly stable in the supplementary 59-case scoring matrix: equal weighting, standardized beta weighting, and leave-one-dimension-out recalculation produced Spearman rank correlations of 0.991–1.000 with the original regression-score ranking, with complete overlap in the top 10 and 90–100% overlap in the bottom 10. A Monte Carlo simulation based on the published regression coefficients and standard errors indicated that absolute score levels contain coefficient uncertainty, with an average 95% interval width of 23.755 points; nevertheless, all 10 top-ranked hospitals and 9 of the 10 bottom-ranked hospitals remained stable, with probabilities above 95%. Key reliability, validation, and robustness results are summarized in Table 3. The resulting accessibility assessment outcomes are illustrated in the accompanying Figure 4.

4.3. Comparison of Hospital Building Spatial Equalization Under Two Different Approaches

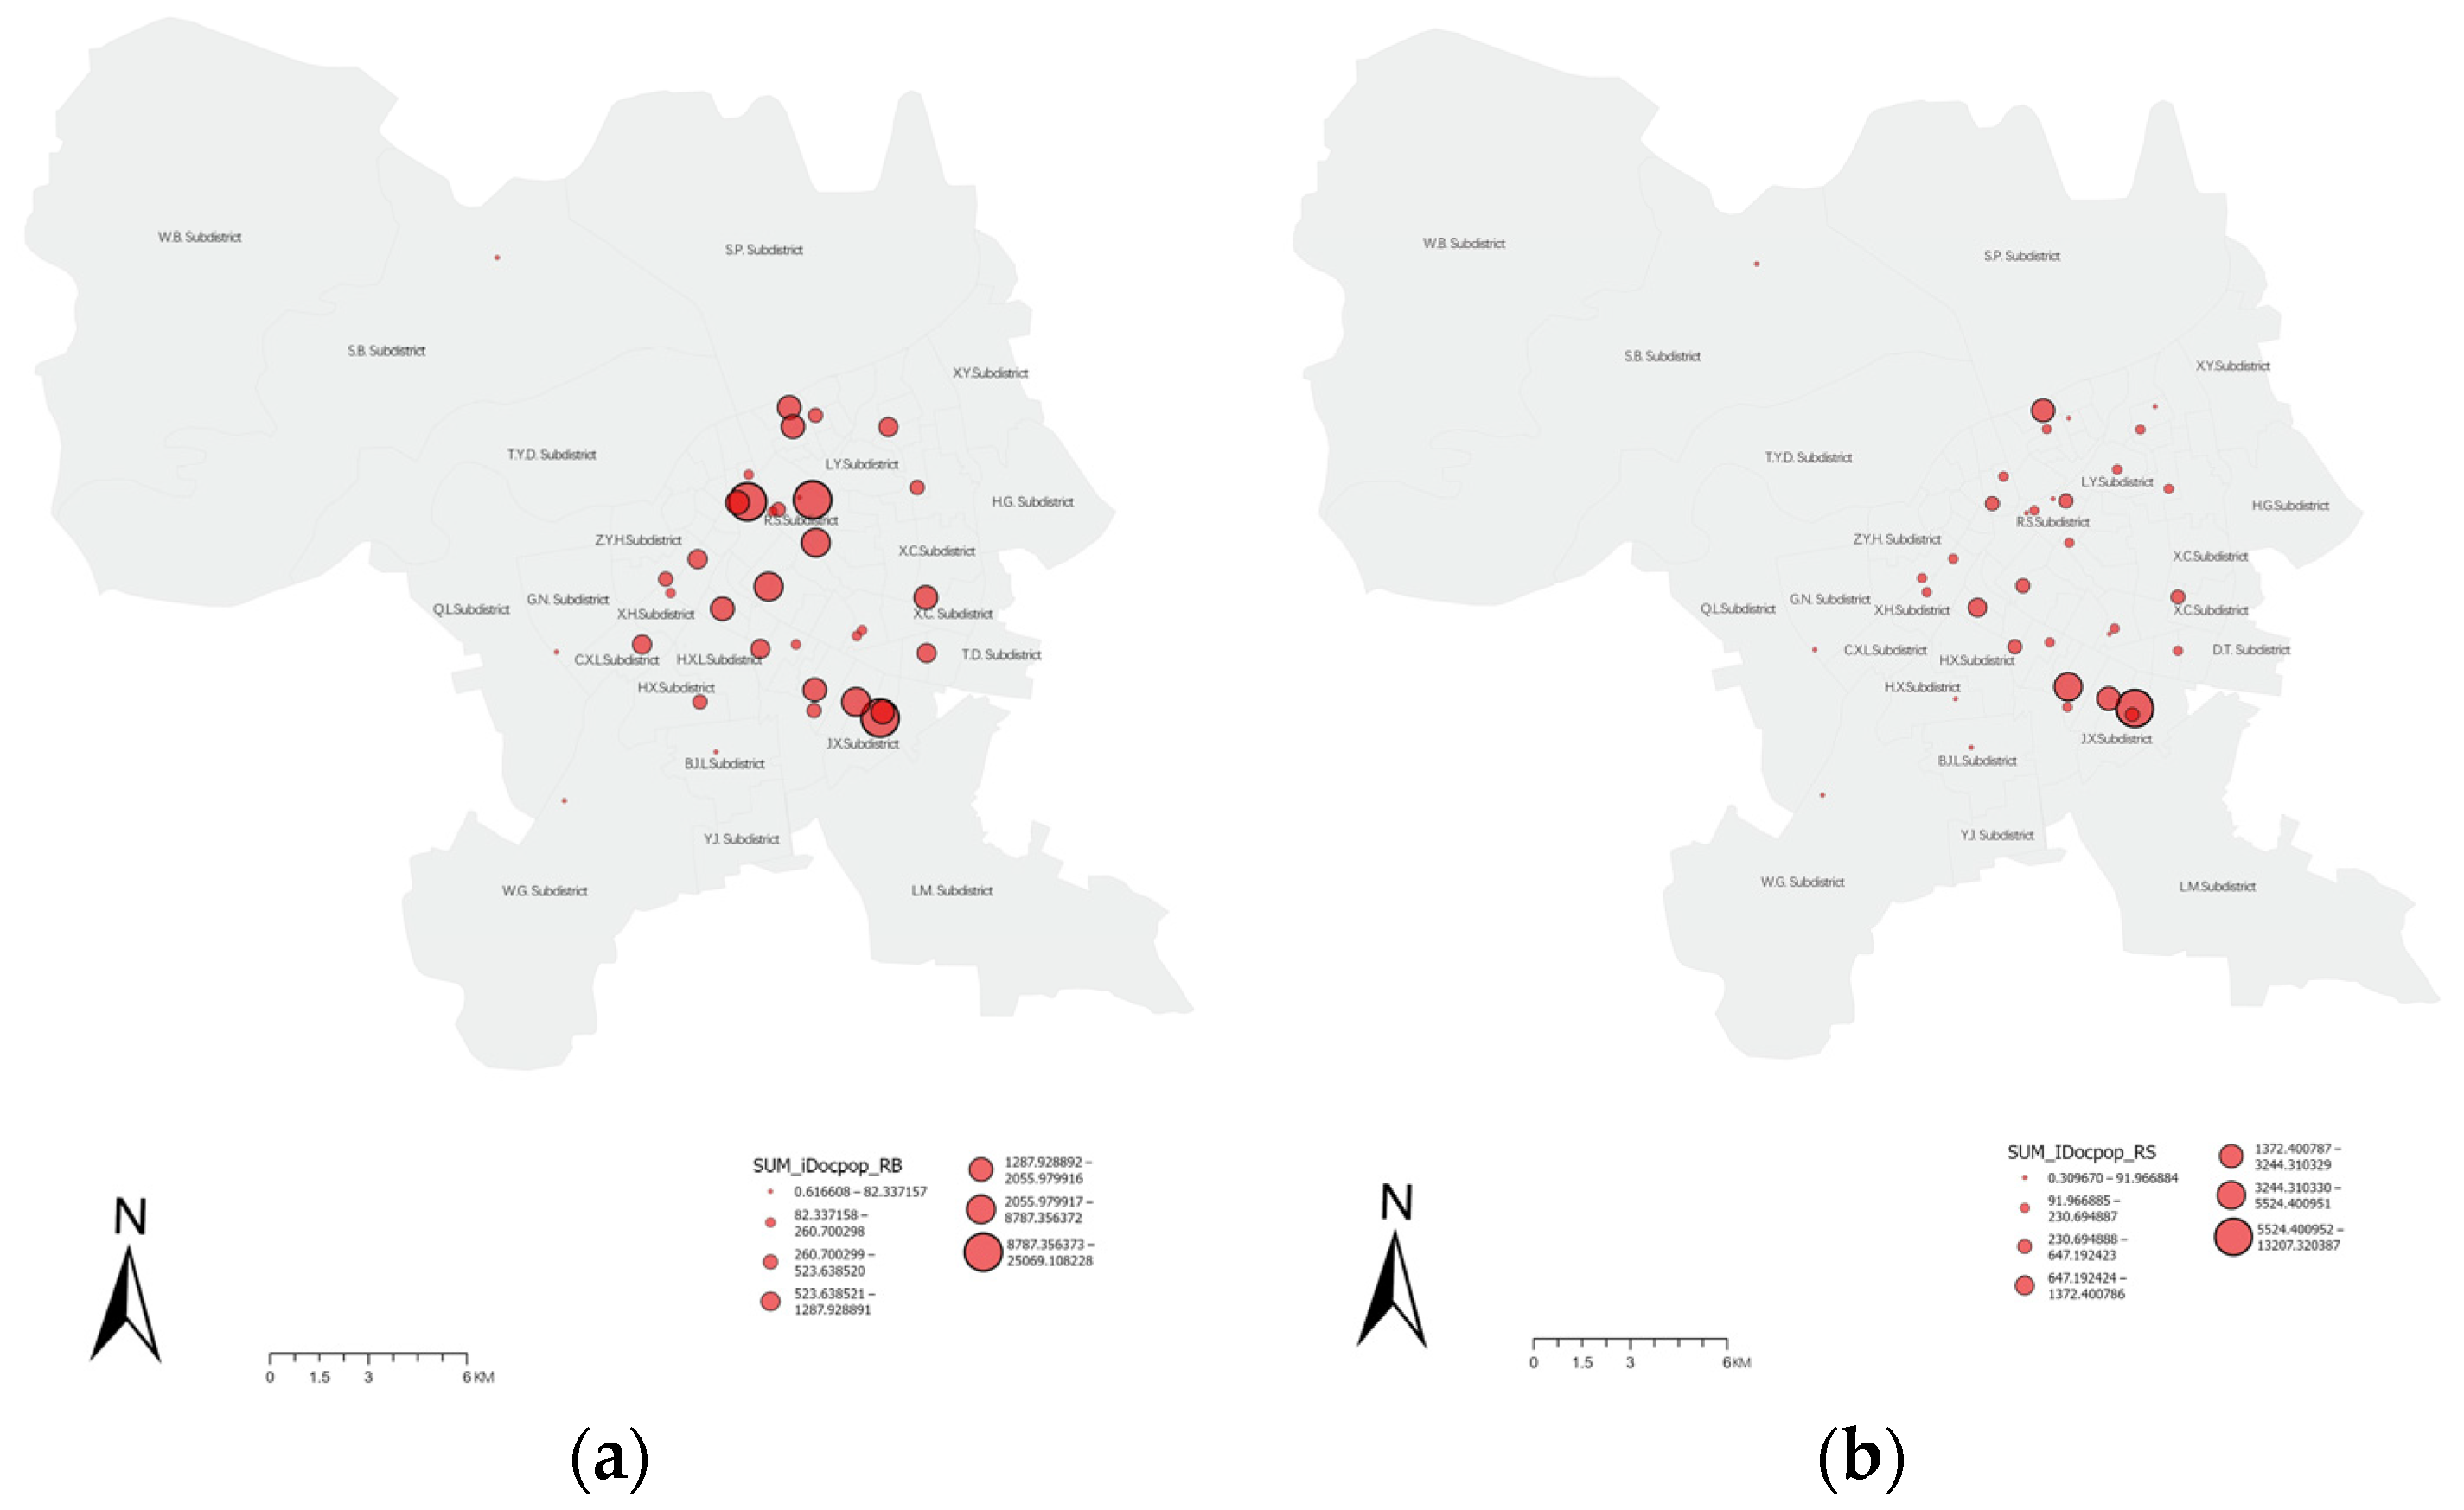
To better reflect the supply–demand matching, the study further employs the Inverted Two-Step Floating Catchment Area (Inverted 2SFCA) method on the basis of the above data and results. By reversing the steps and supply–demand relationship of the 2SFCA method, and calculating the ratio of medical demand to medical facility supply across different areas, an evaluation outcome oriented toward the supply capacity of medical facilities is obtained. This result may be interpreted as the “potential congestion of medical services,” as illustrated in the accompanying Figure 5.
It can be observed that the service busyness of medical facilities established on the basis of bed capacity demonstrates excessively high service frequency and overloaded service efficiency in the central urban area, while the service busyness assessed through the spatial equalization scores of individual hospital buildings is relatively stable across the entire study area. The bed capacity conditions of medical facilities are typically associated with service tier designations assigned by the government and with related indicators such as the number of medical personnel and the variety of medications, thereby reflecting a top-down, macro-planning perspective. The spatial equalization evaluation index of individual hospital buildings, in contrast, reflects building-level service organization and perceived use conditions to a greater extent. Therefore, the proposed framework does not merely redraw the same central–peripheral accessibility pattern; it identifies places where large-scale medical resources do not necessarily correspond to equally strong building-level spatial performance.
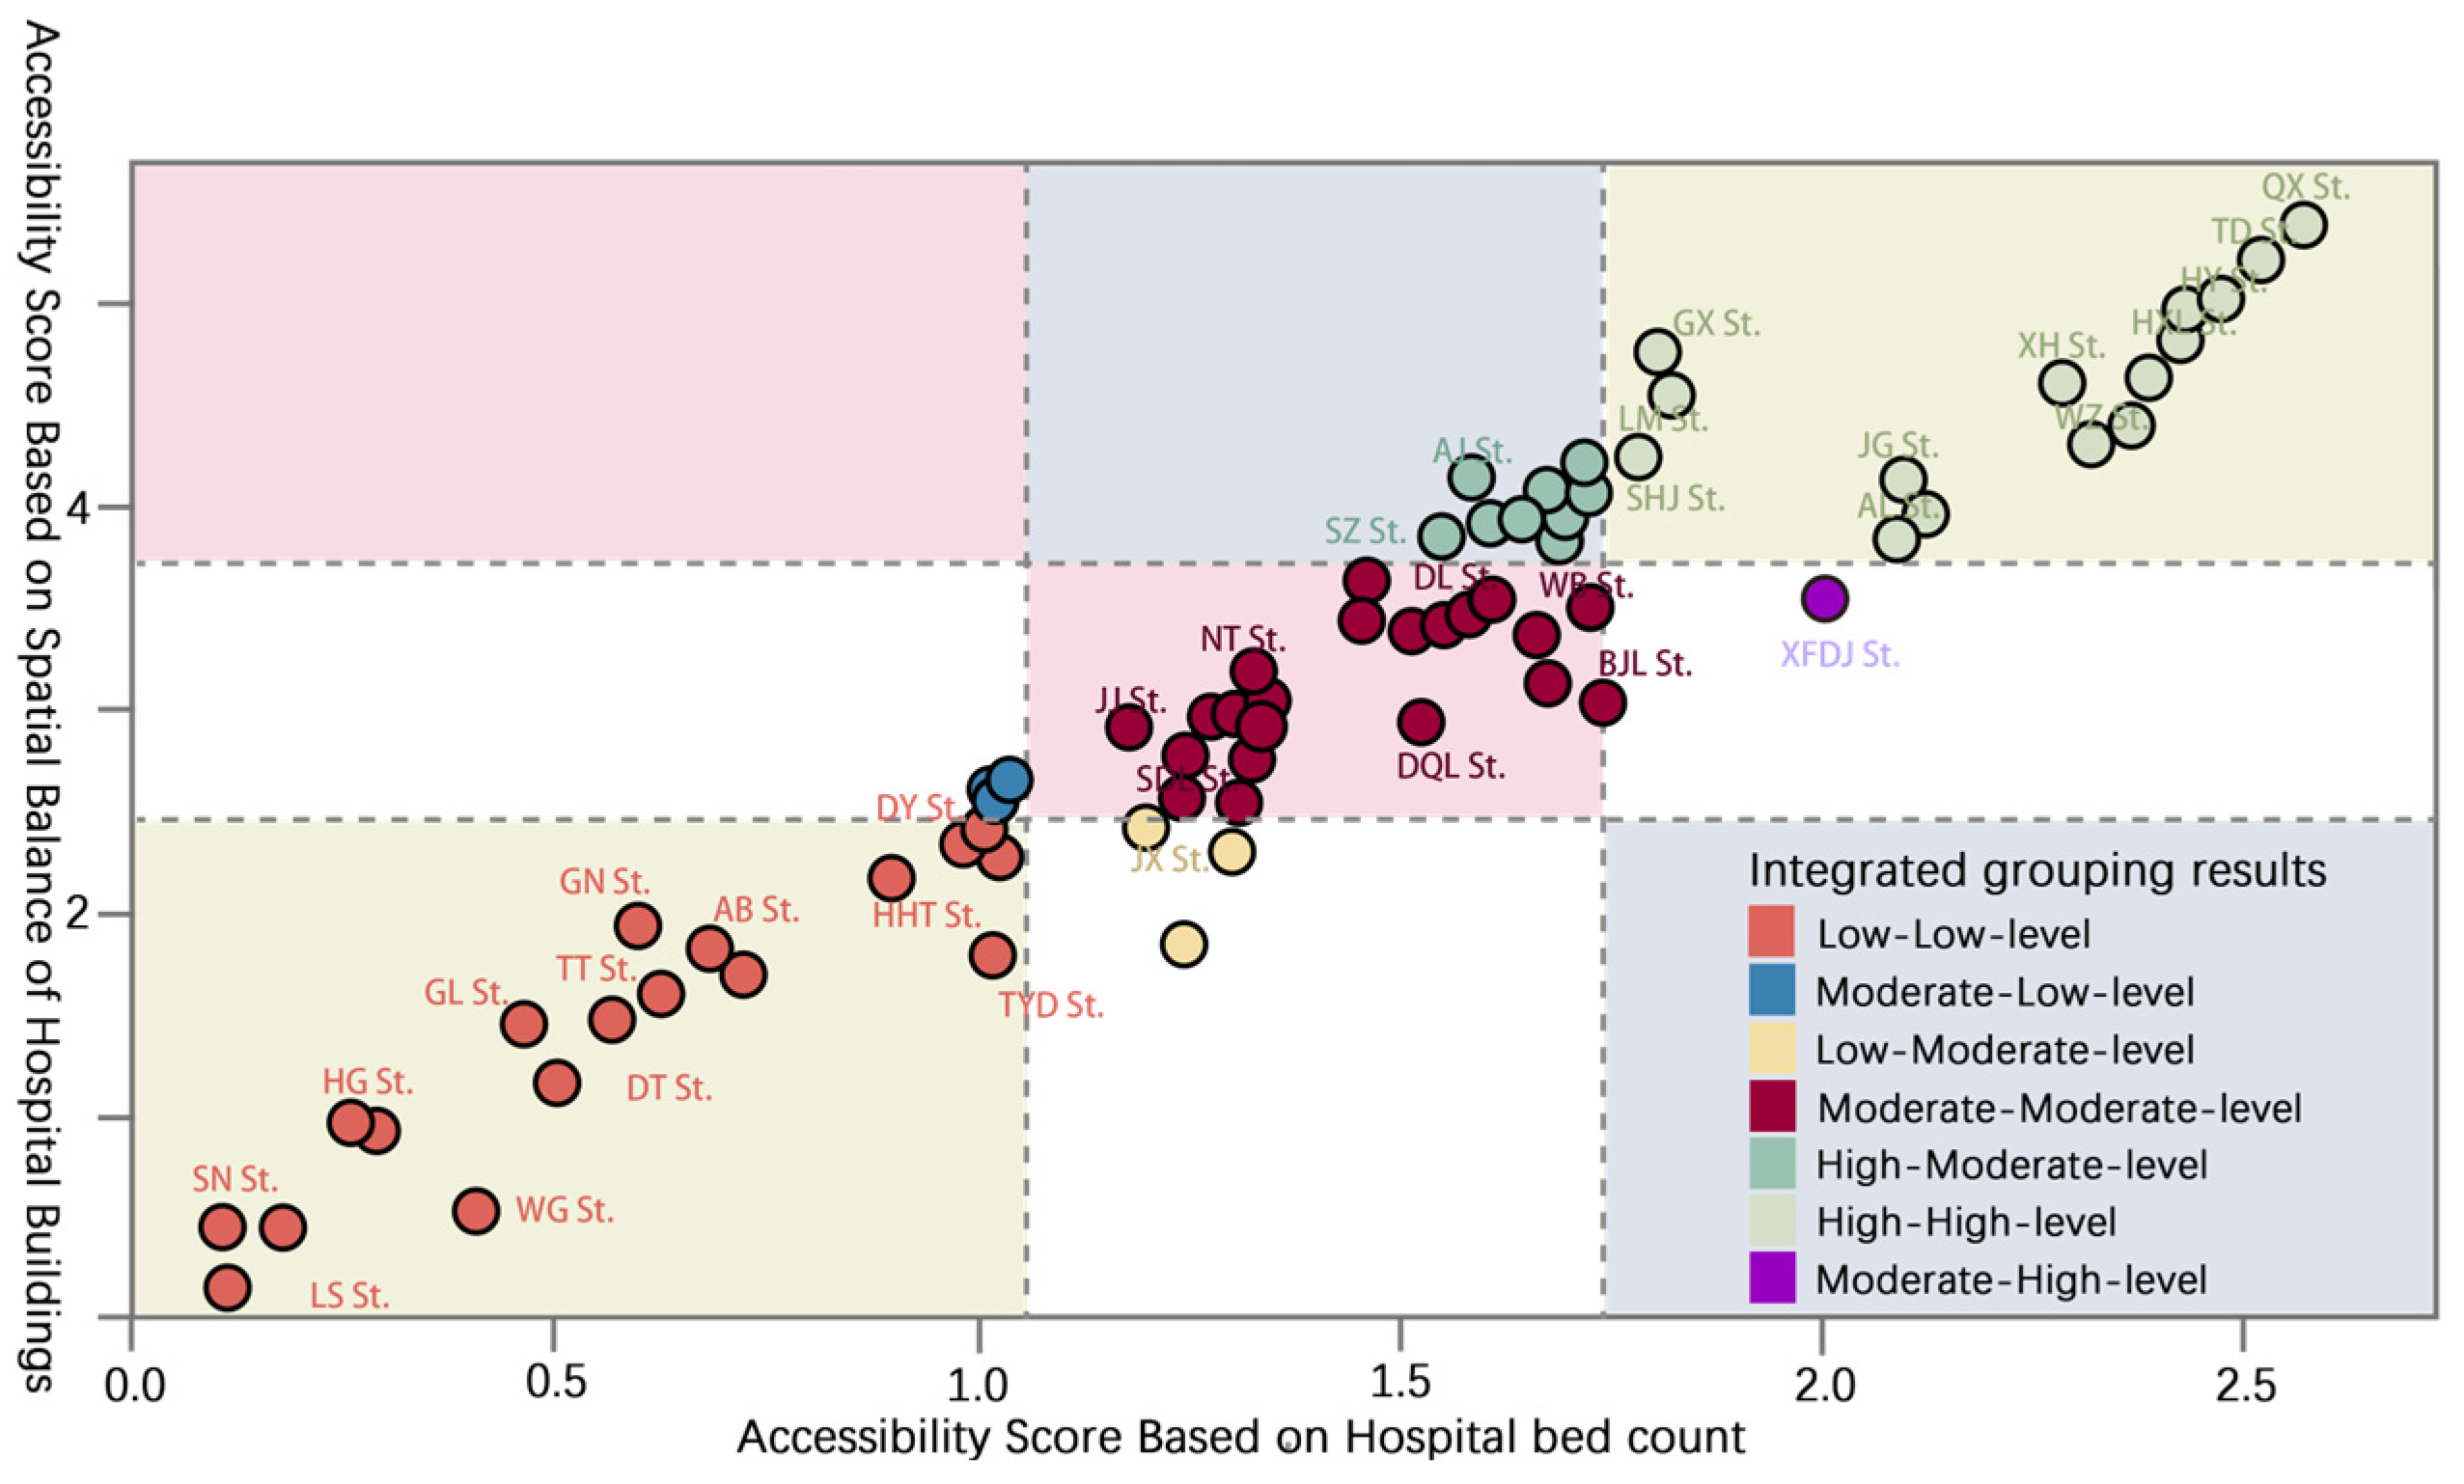
To better identify the discrepancies between the two perspectives on medical facility service accessibility and equity, the relationship between the conventional bed capacity indicator and the spatial equalization score was first examined at the hospital supply level. The two indicators were positively but not perfectly associated (Spearman’s rho = 0.810, p < 0.001), and the high/medium/low grouping agreement was moderate to substantial (linear weighted kappa = 0.625). This indicates that the spatial equalization score is related to, but not redundant with, the conventional supply scale. The street-level accessibility scores derived from the two indicators were then rank-ordered and classified into high, medium, and low categories using natural breaks classification. (See Figure 6). The resulting quadrant diagram reveals broadly consistent accessibility profiles, while highlighting localized discrepancies that are important for differentiated planning.
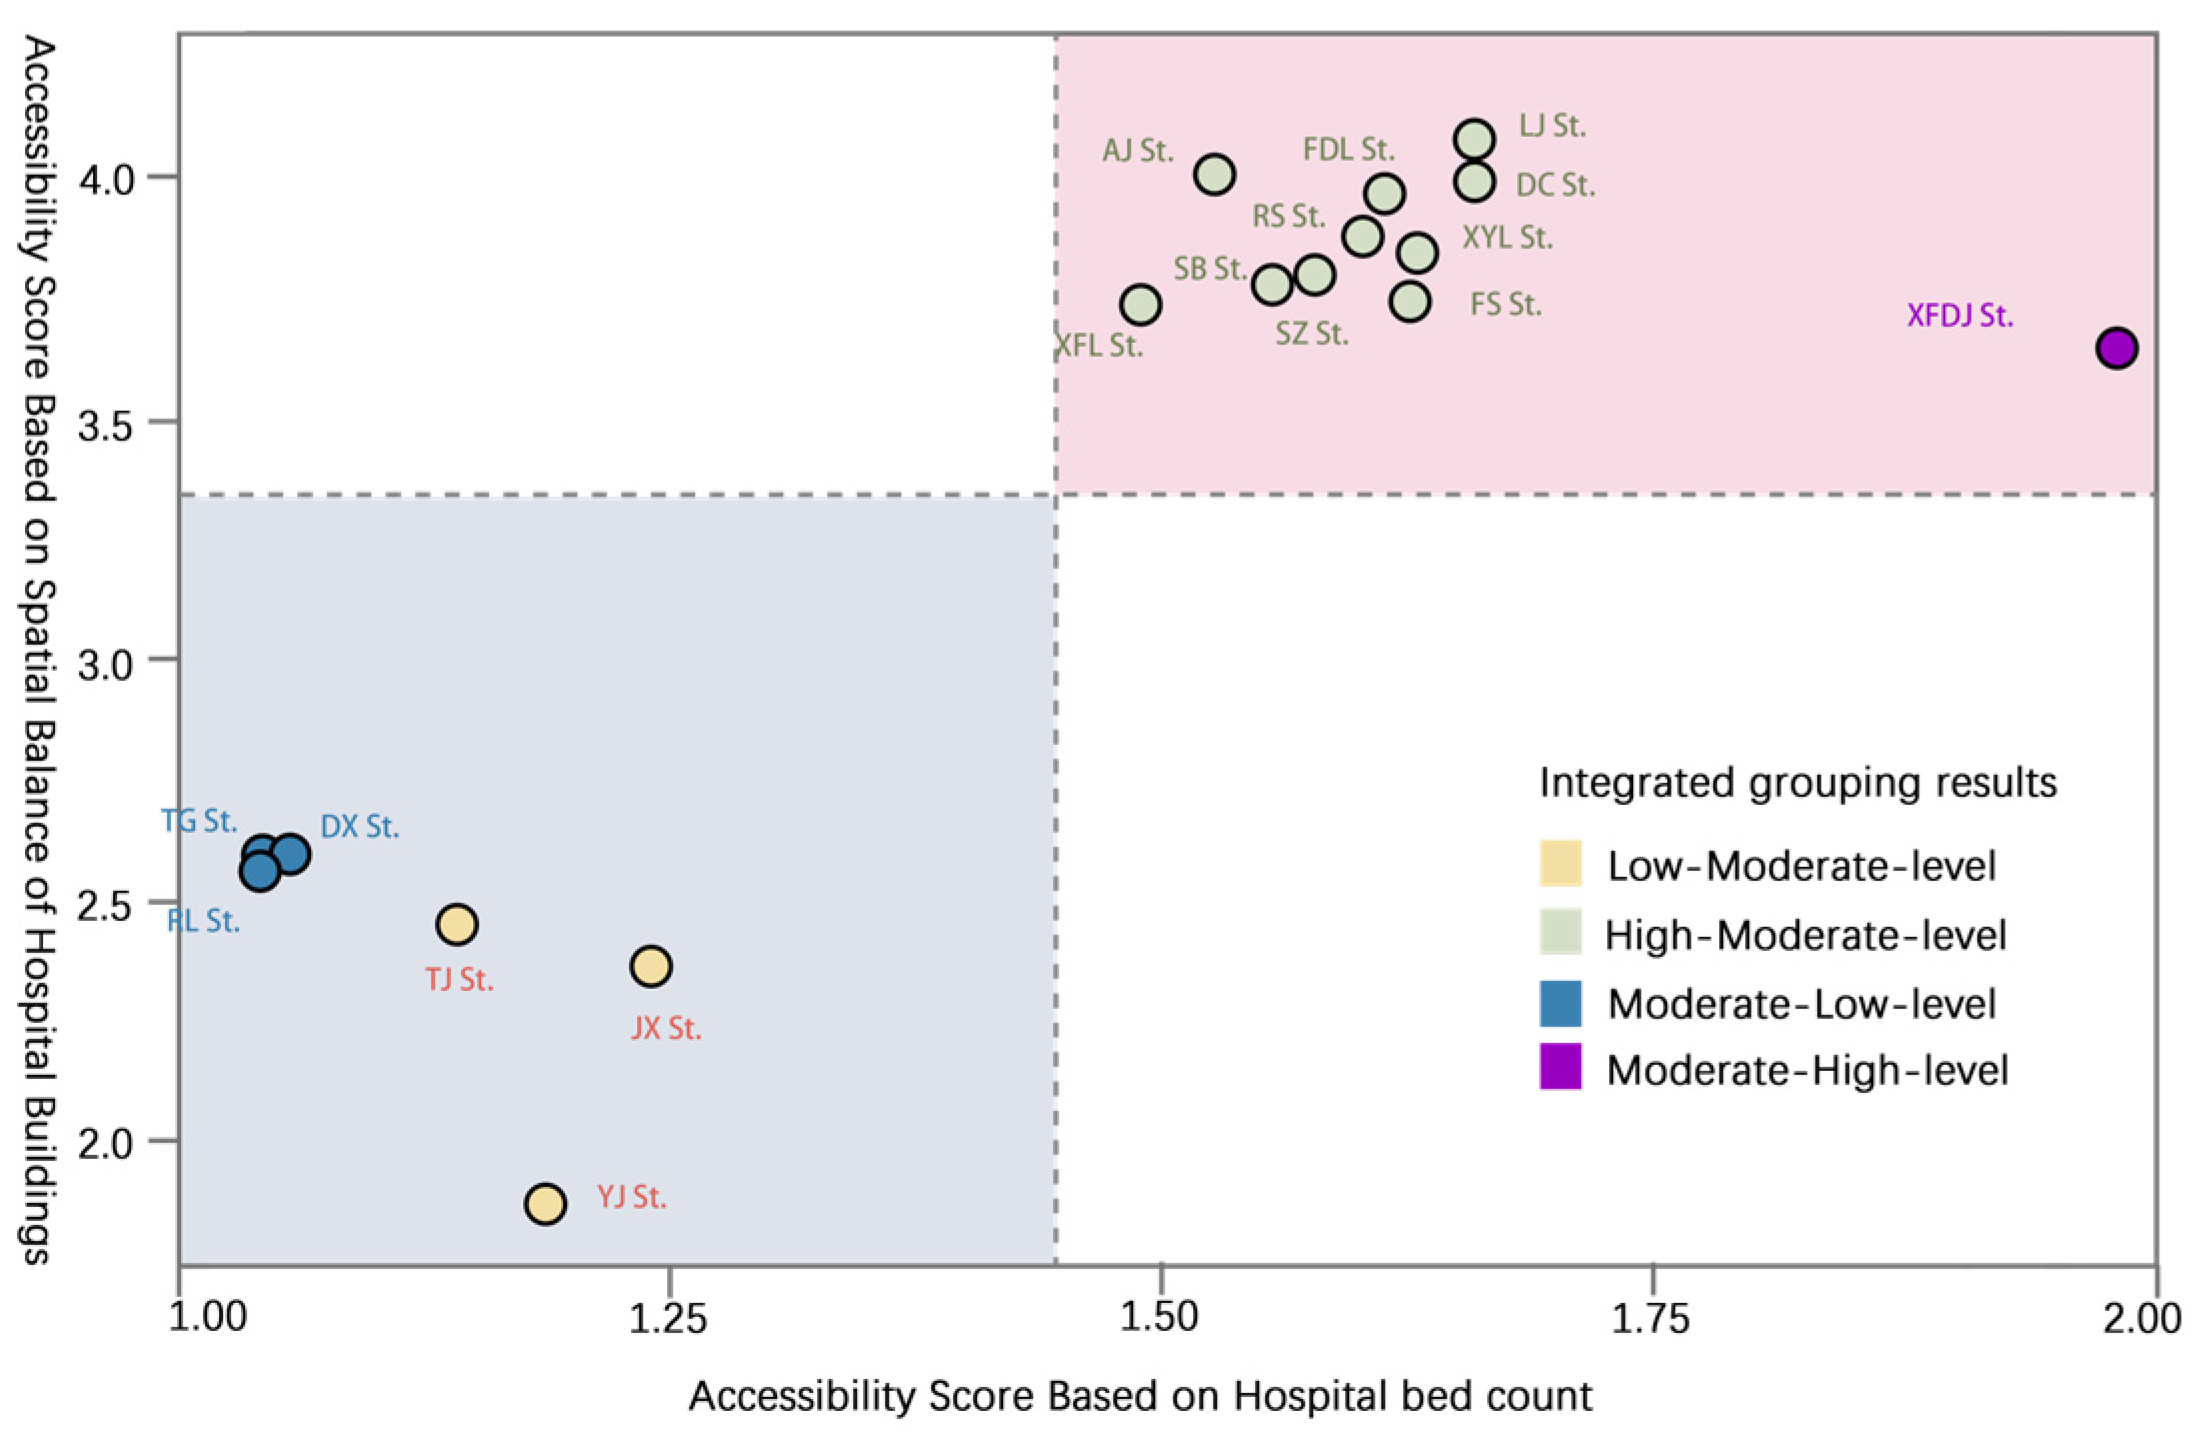
The differentiated areas were further extracted and plotted on the correlation diagram. The upper-right and lower-left parts of the diagram identify street-level units where the conventional bed capacity perspective and the building-level spatial equalization perspective diverge, thereby providing the empirical basis for distinguishing facility optimization areas from allocation compensation areas. (See Figure 7).

5. Discussion

Comparing the accessibility models derived under tiered conditions and equalization indicator conditions, both types of accessibility exhibit high values in the urban center and low values in the periphery at the urban planning scale. This pattern is consistent with Harbin’s role as a provincial medical center and with China’s tiered medical service system, in which tertiary hospitals concentrated in central districts attract patients from both local neighborhoods and wider regional catchments. However, the comparison also shows that bed capacity accessibility and building-level spatial equalization do not convey identical planning information. Bed capacity captures institutional scale and governmental resource allocation, whereas the spatial equalization score captures site selection, functional configuration, circulation organization, and site environment. In practice, patients’ hospital choices are also shaped by non-spatial factors such as medical cost, reimbursement arrangements, specialist preference, appointment availability, and caretaker networks; therefore, the building-level equalization indicator should be interpreted as a supply-side complement to, rather than a substitute for, broader healthcare system analysis. The most pronounced differences between the two approaches appear in the urban core and peripheral zones. In the urban core, enhancing spatial equalization requires improvements at the level of individual medical buildings. In the urban periphery, where fewer medical facilities are present, improving service efficiency more effectively requires compensatory facility configuration and stronger multimodal connectivity between residential areas and hospital nodes. Buffer zones such as the Xiangfang Farm area should therefore adopt an integrated urban–rural medical facility strategy based on residential population distribution and population density.
The non-spatial factors noted above merit fuller consideration, because they condition how spatial equalization translates into realized access. First, healthcare costs in China are tiered: reimbursement rates under the basic medical insurance schemes are generally more favorable at lower-tier institutions, while out-of-pocket expenditure rises with hospital tier and with the complexity of the service provided, so cost-sensitive patients—particularly low-income and elderly groups—may forgo nearby high-tier hospitals despite favorable spatial accessibility. Second, the graded diagnosis and treatment (hierarchical referral) policy is intended to channel patients through primary care before higher-tier care, so the effective service population of high-tier hospitals is regulated not only by distance but also by institutional gatekeeping, a mechanism captured in the present evaluation system only partially through the referral convenience indicator. Third, informal caretaker networks play a substantial supplementary role in China’s care model: family members routinely accompany patients and undertake queuing, escorting, and bedside care, so hospitals whose spatial organization accommodates accompanying caregivers through adequate waiting space, clear wayfinding, and barrier-free circulation deliver a higher effective service quality than bed counts alone would suggest. Integrating cost variables and caregiver-related indicators into the evaluation system is therefore an important direction for extending the framework toward realized access.
The structure of the evaluation model itself also carries direct planning implications. In Equation (3), site selection carries the largest coefficient (0.385), followed by site environment (0.286), functional configuration (0.265), and circulation organization (0.255), indicating that location-related conditions—medical access distance, service coverage, surrounding transport accessibility, and reserved land—exert the strongest marginal influence on the spatial equalization of an individual hospital building. For planning practice, this implies that siting and land reservation decisions made at the early planning stage are far more difficult to remedy afterwards than interior functional adjustments and should therefore receive priority scrutiny in the approval of new hospital projects, whereas the within-dimension indicator weights in Table 1—for example, the number of campus entrances/exits (0.257) and healing space (0.254) in the site environment dimension—can serve directly as a renovation checklist for hospitals located in facility optimization zones. The unit of analysis carries a similar implication: the street-level unit adopted in this study matches both the granularity of census data and the administrative unit of facility allocation, but it inevitably smooths intra-unit variation; for community-level facilities, or for identifying underserved pockets within large street-level units, a finer block- or grid-scale analysis (e.g., a 500 m × 500 m grid) would be more appropriate [17], and coupling the present hospital-level framework with such micro-scale analysis is a promising direction for follow-up research.
Based on the joint positions of street-level units under the two accessibility evaluation regimes, the equalization planning of urban medical facilities can be classified into four zones: facility optimization zones, service stability zones, allocation compensation zones, and peripheral buffer zones. The facility optimization zone primarily encompasses areas in which bed capacity accessibility is relatively high but building-level spatial equalization is weaker. Such areas should not simply add new beds; instead, they require refined improvements to hospital entrances, internal circulation, emergency conversion space, parking organization, and patient support facilities so that institutional capacity can be translated into a more effective user experience.
The service stability zone encompasses areas that receive favorable evaluations from both the government-led and building-level evaluation perspectives, with broadly consistent results. These areas should maintain service quality while preparing for population aging, chronic disease management, and possible urban shrinkage. The allocation compensation zone comprises areas where medical resource demand exceeds supply; such areas should strengthen cross-district medical collaboration, improve public transport and road network connection to existing hospitals, and consider targeted facility supplementation rather than uniform expansion. Finally, the peripheral buffer zone requires guidance strategies that connect peripheral settlements with transitional zones and improve recognition of appropriate medical service options. These differentiated strategies make the planning recommendations more directly traceable to the empirical comparison between conventional accessibility and spatial equalization accessibility.

6. Conclusions

Taking the main urban area of Harbin as a case study, this research constructs a comprehensive evaluation framework integrating objective resource indicators (bed capacity) with subjective user evaluations (spatial equalization of individual hospital buildings) from the perspective of medical facility spatial equalization. Through the application of the Two-Step Floating Catchment Area (2SFCA) method, the study systematically analyzes the distribution characteristics of medical facility accessibility and its patterns of spatial differentiation. The principal conclusions are as follows.
First, the spatial equalization of medical facilities in Harbin’s main urban area exhibits a radially structured pattern of “high in the center, low in the periphery,” with overall accessibility at a medium-to-above level, indicating that the allocation of urban medical resources is broadly reasonable while significant spatial inequalities persist.
Second, the spatial equalization of individual hospital buildings encompassing factors such as site selection, functional configuration, circulation organization, and site environment exerts a significant influence on the overall effectiveness of regional medical services. The expanded robustness checks indicate that the composite score has high internal consistency across the supplementary 59-case matrix (Cronbach’s alpha = 0.986) and stable rankings under alternative weighting schemes (Spearman’s rho = 0.991–1.000). In the matched external validation sample of 36 hospitals, its association with bed capacity is strong but incomplete (Spearman’s rho = 0.810; linear weighted kappa = 0.625), indicating that it provides information beyond conventional resource scale. Upon weighting the spatial equalization factors, differences between the urban core and peripheral zones become more pronounced: the core area requires internal optimization of individual medical buildings, whereas the peripheral zone relies more heavily on compensatory facility configuration.
Third, based on differences in supply–demand relationships, the study classifies urban medical facility equalization planning into four zone types: facility optimization zones, service stability zones, allocation compensation zones, and peripheral buffer zones, and proposes targeted optimization strategies for each zone type, providing a decision-making basis for differentiated medical facility planning.
The study transcends the limitations of conventional medical facility equalization research, which relies predominantly on macro-level indicators such as bed capacity and facility tier, by incorporating the spatial equalization of individual hospital buildings into the regional accessibility evaluation framework. The resulting analytical framework extends from the individual building to the regional level and clarifies how internal hospital spatial performance can alter the interpretation of regional medical service accessibility. This approach enhances the explanatory capacity for medical facility equity and provides a replicable technical pathway for medical facility planning in cities with similar hierarchical healthcare systems.
Nevertheless, this study has certain limitations. First, the expert evidence base of this study comprises a 23-expert indicator-level rating matrix and a supplementary 59-case validation matrix; however, these additional cases are used to test the reliability and robustness of the scoring instrument, not to replace the 36-hospital GIS accessibility sample. The matched external validation with bed capacity, hospital tier, satisfaction, and GIS attributes is currently complete for the 36 hospitals entering the main accessibility model. Future work should continue archiving the complete expert by hospital by indicator matrix and synchronizing it with hospital capacity and coordinate attributes. Second, the 6 km service radius is used as a common baseline for comparing two supply indicators, but actual accessibility is affected by travel time, traffic congestion, public transport connectivity, emergency transfer routes, and caretaker networks. Third, the study does not fully account for population mobility, medical cost, reimbursement constraints, specialist preferences, or the differentiated accessibility needs of elderly and low-income groups [27]. Moreover, the study focuses on general hospitals and does not encompass community health service centers, specialist hospitals, or other primary or specialized medical facilities.
Considering these limitations and future research directions, subsequent studies will further explore the linkage mechanisms between medical facility spatial equalization and residents’ health outcomes to verify the practical significance of equalization evaluation. Research will incorporate population structure changes (e.g., population aging and declining birth rates) and urban shrinkage trends to conduct predictive and resilience planning research on medical facility equalization oriented toward medium- and long-term social needs. Multi-source spatiotemporal data (e.g., mobile signaling data, real-time traffic data) will be introduced to construct dynamic accessibility models, enhancing the timeliness and authenticity of assessments. The study scope will also be extended to urban–rural fringe areas and surrounding rural regions, with a view to constructing a comprehensive equalization evaluation and optimization system for medical facilities encompassing integrated urban–rural development.

Author Contributions

Conceptualization, Y.L. and J.Z.; methodology, Y.L.; software, J.Z.; validation, Y.L., T.W. and J.Z.; formal analysis, J.Z.; investigation, Y.L.; resources, T.W.; data curation, Y.L.; writing—original draft preparation, Y.L.; writing—review and editing, T.W.; visualization, J.Z.; supervision, Y.L.; project administration, Y.L.; funding acquisition, Y.L. All authors have read and agreed to the published version of the manuscript.

Funding

This research was funded by Zhejiang Provincial Philosophy and Social Sciences Planning Project, grant number 26JCXK017YB.

Data Availability Statement

The original contributions presented in this study are included in the article. Further inquiries can be directed to the corresponding authors.

Conflicts of Interest

The authors declare no conflicts of interest.

References

  1. Buhler, M.; Shah, T.; Perry, M.; Tennant, M.; Kruger, E.; Milosavljevic, S. Spatial equity of physiotherapy accessibility in Aotearoa New Zealand in relation to Māori and Pacific ethnicity, socioeconomic deprivation, and rurality. Health Policy 2026, 163, 105498. [Google Scholar] [CrossRef] [Scilit]
  2. Li, D.; Yamada, M.; Gao, D.; Yang, F.; Nie, H. Spatial variations in health service utilization among migrant population: A perspective on health equity. Front. Public Health 2024, 12, 1447723. [Google Scholar] [CrossRef] [Scilit] [PubMed]
  3. Zhao, Y.; Gong, P. Optimal site selection strategies for urban parks green spaces under the joint perspective of spatial equity and social equity. Front. Public Health 2024, 12, 1310340. [Google Scholar] [CrossRef] [Scilit] [PubMed]
  4. Bambra, C.; Norman, P.; Johnson, N.P.A.S. Visualising regional inequalities in the 1918 Spanish flu pandemic in England and Wales. Environ. Plan. A Econ. Space 2021, 53, 607–611. [Google Scholar]
  5. Landman, K.; Aelbrecht, P. Public space and equity: Reconsidering the socio-spatial complexities of spatial equity. Urban Des. Int. 2025, 30, 147–149. [Google Scholar] [CrossRef] [Scilit]
  6. Kim, J.N.; Oh, I.H. Optimizing Hospital Bed Capacity and Resource Allocation Using Inflow and Outflow Indices for Effective Healthcare Management. Inq. J. Health Care Organ. Provis. Financ. 2024, 61, 00469580241304244. [Google Scholar] [CrossRef] [Scilit] [PubMed]
  7. Launay, L.; Guillot, F.; Medjkane, M.; Launoy, G.; Dejardin, O. Spatial Accessibility to Primary Care in Metropolitan France: Results Using the SCALE Spatial Accessibility Index for All Regions. Int. J. Environ. Res. Public Health 2024, 21, 276. [Google Scholar] [CrossRef] [Scilit] [PubMed]
  8. Ren, H.; Li, C.; Huang, Y. Spatial and temporal analysis of China’s healthcare resource allocation measurements based on provincial data: 2010–2021. Front. Public Health 2023, 11, 1269886. [Google Scholar] [CrossRef] [Scilit] [PubMed]
  9. Raeesi, A.; Hashtarkhani, S.; Tara, M.; Sargolzaei, N.; Kiani, B. Empowering access: Unveiling an overall composite spatial accessibility index to healthcare services in Southeastern Iran. Int. J. Equity Health 2025, 24, 35. [Google Scholar] [CrossRef] [Scilit] [PubMed]
  10. Liu, T.; Deng, Q.; Wang, S.; Wang, G. Equity Evaluation of Multilevel Medical Facility Allocation Based on Ga2SFCA. J. Urban Plan. Dev. 2023, 149, 04023041. [Google Scholar] [CrossRef] [Scilit]
  11. Douglas, J.A.; Subica, A.M. COVID-19 treatment resource disparities and social disadvantage in New York City. Prev. Med. 2020, 141, 106282. [Google Scholar] [CrossRef] [Scilit] [PubMed]
  12. Zhang, Z.; Guo, Z.; Li, B.; Song, L. Informing equitable urban health policy: A multi-source geospatial assessment of spatial mismatch in medical facility distribution across Chinese cities. Front. Public Health 2026, 14, 1775514. [Google Scholar] [CrossRef] [Scilit] [PubMed]
  13. Wang, H.; Kang, Q.; Mou, S.H.; Nie, X.; Chen, Z.; Wu, T. How does the spatial accessibility of medical resources change during a public health crisis? A perspective based on residents’ healthcare preferences. J. Urban Manag. 2025, 14, 232–246. [Google Scholar] [CrossRef] [Scilit]
  14. Sharma, G.; Patil, G.R. Urban spatial structure and equity for urban services through the lens of accessibility. Transp. Policy 2024, 146, 72–90. [Google Scholar] [CrossRef] [Scilit]
  15. Cao, Y.; Li, T.; Chen, H.; Zhao, Q.; Sun, J.; Grépin, K.A.; Kang, J.-Y. Evaluating geographic accessibility to COVID-19 vaccination across 54 countries/regions. BMJ Glob. Health 2025, 10, e017761. [Google Scholar] [CrossRef] [Scilit] [PubMed]
  16. Liang, G.; Tang, L.; Zhang, L.L.; Yang, X.; Tan, X. Measuring spatial accessibility to medical facilities: Aligning with actual medical travel behavior. Habitat Int. 2025, 157, 103308. [Google Scholar] [CrossRef] [Scilit]
  17. Hwang, H.; Jung, S. A Spatial Assessment of Urban Welfare Facility Supply: Integrating Accessibility, Equity, and Demand for Daycare Centers and Senior Welfare Facilities. Appl. Spat. Anal. Policy 2025, 18, 109. [Google Scholar] [CrossRef] [Scilit]
  18. Hosseinzadeh, S.; Ketabi, S.; Atighehchian, A.; Nazari, R. Hospital bed capacity management during the COVID-19 outbreak using system dynamics: A case study in Amol public hospitals, Iran. Int. J. Healthc. Manag. 2022, 17, 63–75. [Google Scholar] [CrossRef] [Scilit]
  19. Luan, J.; Tian, Y.; Jim, C.Y.; Zheng, H.; Fan, S. Assessing elderly’s perceived accessibility of community hospitals from a satisfaction perspective in China’s Beijing metropolis. Health Policy Technol. 2025, 14, 101080. [Google Scholar] [CrossRef] [Scilit]
  20. Liu, Y.; Chen, L.L.; Qi, M.; Kong, D.Z. Construction of a Spatial Equalization Assessment System for Medical Facilities. Buildings 2024, 14, 1265. [Google Scholar] [CrossRef] [Scilit]
  21. Boateng, G.O.; Neilands, T.B.; Frongillo, E.A.; Melgar-Quinonez, H.R.; Young, S.L. Best practices for developing and val-idating scales for health, social, and behavioral research: A primer. Front. Public Health 2018, 6, 149. [Google Scholar] [CrossRef] [Scilit] [PubMed]
  22. Mokkink, L.B.; Terwee, C.B.; Patrick, D.L.; Alonso, J.; Stratford, P.W.; Knol, D.L.; Bouter, L.M.; de Vet, H.C.W. The COSMIN checklist for assessing the methodological quality of studies on measurement properties of health status measurement instruments: An international Delphi study. Qual. Life Res. 2010, 19, 539–549. [Google Scholar] [CrossRef] [Scilit] [PubMed]
  23. Kottner, J.; Audige, L.; Brorson, S.; Donner, A.; Gajewski, B.J.; Hrobjartsson, A.; Roberts, C.; Shoukri, M.; Streiner, D.L. Guidelines for Reporting Reliability and Agreement Studies (GRRAS) were proposed. J. Clin. Epidemiol. 2011, 64, 96–106. [Google Scholar] [CrossRef] [Scilit] [PubMed]
  24. Luo, W.; Qi, Y. An enhanced two-step floating catchment area (E2SFCA) method for measuring spatial accessibility to primary care physicians. Health Place 2009, 15, 1100–1107. [Google Scholar] [CrossRef] [Scilit] [PubMed]
  25. McGrail, M.R.; Humphreys, J.S. Measuring spatial accessibility to primary care in rural areas: Improving the effectiveness of the two-step floating catchment area method. Appl. Geogr. 2009, 29, 533–541. [Google Scholar] [CrossRef] [Scilit]
  26. Wang, H.; Yang, Y.; Gao, Y.; Wu, J. Accessibility Assessment and Space Optimization of Medical Facilities in Pingshan District, Shenzhen City. Acta Sci. Nat. Univ. Pekin. 2026, 62, 162–174. [Google Scholar] [CrossRef]
  27. Zhou, Q.; Shi, W. How does town planning affect urban-rural income inequality: Evidence from China with simultaneous equation analysis. Landsc. Urban Plan. 2022, 221, 104380. [Google Scholar] [CrossRef] [Scilit]
Figure 1. Methodological framework.
Buildings 16 02981 g001
Figure 2. Score distribution of First Affiliated Hospital of Heilongjiang University of Chinese Medicine.
Buildings 16 02981 g002
Figure 3. Accessibility assessment under medical facility tier conditions.
Buildings 16 02981 g003
Figure 4. Accessibility assessment under spatial equalization conditions.
Buildings 16 02981 g004
Figure 5. Comparison of medical service busyness under different indicator regimes: (a) medical service utilization intensity map based on bed occupancy; (b) medical service busyness derived from spatial equalization assessment of hospital buildings.
Buildings 16 02981 g005
Figure 6. Quadrant chart revealing concordant and discordant street-level units across two accessibility evaluation frameworks.
Buildings 16 02981 g006
Figure 7. Quadrant chart of further classified inconsistent street-level units.
Buildings 16 02981 g007
Table 1. Indicator information in the spatial equalization evaluation model for medical facilities.
DimensionIndicatorWeightScoring CriteriaDimensionIndicatorWeightScoring Criteria
Site
Selection
Medical Access Distance0.139Optimal if a general hospital is reachable by vehicle within 30 min or a primary care facility is reachable on foot within 15 min; score decreases proportionally with greater deviation.Functional ConfigurationHospital Tier0.113Rated by accredited tier; Class III Grade A (tertiary level A) is optimal, with scores decreasing accordingly.
Referral Convenience0.145Optimal if the hospital campus has ambulance access and convenient upward/downward referral channels enabling rapid transfer; score decreases with greater deviation.Emergency Conversion Space0.111Presence of spaces within the campus available for emergency temporary conversion (wards, examination rooms, operating theatres, etc.); higher score with more convertible space.
Service Coverage Range0.143Optimal if a general hospital effectively interfaces with affiliated primary care institutions and the primary service area covers a radius of 3 km or more; score decreases with deviation.Daily Outpatient Volume0.110Optimal if daily outpatient volume of a general hospital exceeds 1000 visits.
Surrounding Transport Accessibility0.142Optimal if public transportation in the vicinity is convenient and rail transit directly connects to the campus; score decreases with greater deviation.Functional Types0.113Optimal if functional rooms are fully configured, emergency reserve space is available, and functional setup meets the requirements for the hospital’s tier; score decreases for each unmet criterion.
Reserved Construction Land within Campus0.147Presence of reserved development/construction land within the campus; rated based on reserved area in combination with current hospital tier.Functional Zoning0.112Optimal if functional zoning is clearly defined and medical service efficiency within the campus is high; score decreases with greater deviation.
Reserved Emergency Land0.147Optimal if temporary emergency medical structures can be set up on reserved land within the campus, effectively integrated with the infectious disease zone; score decreases with deviation.Ward and Consultation Room Orientation0.110Optimal if 80% of wards and consultation rooms face south; otherwise assessed based on adequacy of natural light and absence of interference with medical operations.
Land Area0.137Optimal if hospital scale meets medical needs without imposing pressure on surrounding land use or environment; score decreases with greater deviation.Online Consultation Services0.113Higher score with more online medical service offerings (e.g., appointment registration, payment, telemedicine, inpatient ward registration).
Corridor Dimensions0.108Optimal if waiting/consultation spaces meet patient needs and are accessible by wheelchair; score decreases with deviation.
Functional Room Dimensions0.109Higher score with greater utilization efficiency on top of meeting standard area requirements.
Circulation OrganizationFunctional Separation of Circulation0.160Optimal if the campus has clearly defined separate circulation routes or entrances for outpatient, emergency, physical examination, maternal and child health, inpatient, and infectious disease prevention functions; score decreases with deviation.Site EnvironmentAbove-Ground Parking0.248Optimal if all five categories of parking are present and organized (temporary parking, emergency vehicle parking, staff parking, patient parking, logistics vehicle parking or underground equivalent); score decreases for each missing category.
Time from Admission to Consultation0.160Optimal if a general hospital patient is seen within 30 min, or a primary care patient within 10 min; score decreases with greater deviation.Barrier-Free Design0.241Optimal if barrier-free ramps, handrails, accessible restrooms, elevators, and other barrier-free facilities are well provided; score decreases with greater deviation.
Pedestrian–Vehicle Separation0.171Optimal if independent pedestrian and vehicular circulation routes exist and are clearly separated; score decreases with greater deviation.Healing Space0.254Assessed by actual sensory experience; optimal if temperatures in all rooms are balanced and comfortable; score decreases with deviation.
Medical Staff–Patient Separation0.172Optimal if medical staff and patient circulation routes do not intersect; good if some areas have exclusive staff corridors; poor if routes intersect.Number of Campus Entrances/Exits0.257Hospital must have no fewer than two entrances/exits; general hospitals are advised to have three; optimal if requirement is met; score decreases with deviation.
Clean–Waste Separation0.168Optimal if personnel and waste routes do not intersect; good if partial intersection; poor if significant intersection. Intelligent rail logistics systems may be assessed accordingly.
Convenience of Medical Procedures0.170Optimal if the entire medical procedure is smooth, spaces are clearly identifiable, and backtracking is minimal; score decreases with greater deviation.
Table 2. Spatial equalization assessment scores of general hospitals.
Hospital NameScoreHospital NameScoreHospital NameScoreHospital NameScore
HAMU 4th Hospital (Songbei Branch)98.647Heilongjiang Forestry Industry General Hospital67.258Harbin Armed Police Corps Hospital71.572HLJ Prison Administration Center Hospital60.513
1st Affiliated Hospital of Harbin Medical Univ.104.767Harbin Red Cross Central Hospital68.402HLJ State Farms General Hospital72.393Harbin Electric Machinery Factory Hospital59.015
2nd Affiliated Hospital of Harbin Medical Univ.103.415Daoli District People’s Hospital, Harbin80.536PLA Heilongjiang Military District Hospital72.953Heilongjiang Seamen’s Hospital59.150
4th Affiliated Hospital of Harbin Medical Univ.89.726Taiping People’s Hospital, Daowai District71.825Harbin 5th Hospital76.308Harbin University of Technology Hospital66.275
Heilongjiang Provincial Hospital88.630Daowai District People’s Hospital73.832PLA 211th Hospital82.720Nangang District People’s Hospital, Harbin75.381
Harbin 1st Hospital78.955Heilongjiang Electric Power Hospital64.4832nd Affiliated Hospital of HLJ Univ. of CM74.803Harbin Boiler Factory Hospital59.312
Heilongjiang Provincial TCM Hospital79.706Harbin Public Security Hospital62.333Harbin TCM Hospital68.367HLJ Provincial Commercial Workers Hospital58.620
HAMU 1st Hospital Qunli Campus103.899Xiangfang District People’s Hospital, Harbin73.244Harbin 4th Hospital76.865Harbin Muslim Hospital66.582
1st Affiliated Hospital, HLJ Univ. of CM75.913Harbin Steam Turbine Factory Hospital58.750Harbin 2nd Hospital68.980Harbin Xingguang Hospital63.727
Table 3. Reliability, validation, and robustness checks for expert-based spatial equalization scores.
InterpretationResultData and StatisticCheck
Expanded scores retain a stable four-dimensional structure.0.986; 95% CI 0.975–0.991; original/additional alpha 0.984/0.99159 medical institution cases × 4 dimensions; Cronbach’s alphaConstruct consistency
Average expert scores are sufficiently reliable for model entry.W = 0.910, p < 0.001; ICC(2,1) = 0.590; ICC(2,k) = 0.97126 indicators × 23 experts; Kendall’s W and ICCExpert agreement
Scores align with but do not duplicate external supply references.Beds 0.810; tier 0.705; satisfaction 0.963; all p < 0.001Matched 36 hospitals; Spearman’s rhoExternal validation
Bed capacity and spatial equalization groupings are broadly consistent.0.625Matched 36 hospitals; linear weighted kappaCategory agreement
Hospital rankings remain highly stable.Rank rho 0.991–1.00059 medical institution cases; alternative weighting schemesWeight sensitivity
Uncertainty mainly affects absolute scores rather than extreme ranks.Mean 95% width 23.755; stable top/bottom: 10/10 and 9/1059 medical institution cases; 100,000 Monte Carlo simulationsCoefficient uncertainty
Disclaimer/Publisher’s Note: The statements, opinions and data contained in all publications are solely those of the individual author(s) and contributor(s) and not of MDPI and/or the editor(s). MDPI and/or the editor(s) disclaim responsibility for any injury to people or property resulting from any ideas, methods, instructions or products referred to in the content.