Article

Experimental Investigation on Seismic Performance of the Masonry Structure with Reinforced Concrete Walls and Large Openings at Its Bottom Floor

1
Shandong Railway Investment Holding Group Co., Ltd., Jinan 250102, China
2
Key Lab of Building Structural Retrofitting and Underground Space Engineering of the Ministry of Education, Shandong Jianzhu University, Jinan 250101, China
3
School of Civil Engineering, Shandong Jianzhu University, Jinan 250101, China
*
Author to whom correspondence should be addressed.
Buildings 2026, 16(15), 2923; https://doi.org/10.3390/buildings16152923
Submission received: 29 June 2025 / Revised: 1 July 2026 / Accepted: 6 July 2026 / Published: 23 July 2026
(This article belongs to the Special Issue Seismic Analysis and Design of Building Structures—2nd Edition)

Abstract

In view of the key problems such as the weakened seismic performance and reduced safety caused by the expansion of openings at bottom floor of masonry structure to meet the functional requirements, a 1:4 scale model of a four-story brick-concrete masonry structure was designed and fabricated. Based on the principle of stiffness equivalence, the partial masonry walls on the side of the bottom floor with large openings were replaced by reinforced concrete walls, and then the pseudo static test was conducted on the model. Through the test, the seismic performance indexes such as the failure mode of each floor, the displacement, hysteresis curve, skeleton curve, and stiffness degradation were obtained. The results showed that the masonry structure can form a close connection with the reinforced concrete walls and then the whole structure exhibits the characteristic of ductility. There is no sudden change in bearing capacity during the loading and the hysteresis curves show that the structure retained a certain energy dissipation capacity during cyclic loading, without sudden loss of bearing capacity. The displacement of the second floor of the structure changes significantly, and its stiffness should thus be paid more attention to during the design process to avoid the formation of a weak floor. The torsional of the masonry structure with large openings at its bottom floor under earthquake can be avoided through the setting of reinforced concrete walls.

1. Introduction

Since the State was founded, earthquakes have been one of the most significant natural disasters in our country, causing substantial human and economic losses. In China, masonry structures serve multiple purposes. Masonry structures in small and medium-sized cities account for over 70% of construction areas [1]. This is due to the extended construction time, poor integrity, the lack of resistance to successive collapses, lack of formal design, and the lack of structural measures. These factors will reduce the wall’s shear bearing capacity [2,3] and significantly reduce its seismic performance [4,5]. Consequently, the wall will be the most vulnerable to earthquake damage and severe damage [6,7,8,9]. As a result, masonry structures must be reinforced or repaired [10,11].
As urban renewal progresses, the ground floor of masonry buildings is being used for various purposes. For example, it is common to convert the ground floor into a garage or storefront facing the street. However, this creates a sudden change in the structure’s vertical stiffness, making the ground floor a weak layer and further weakening the structure’s seismic performance while decreasing safety [12]. In the Wenchuan earthquake, Wu et al. [13] investigated damage to nearly 2000 buildings and conducted a statistical analysis of seismic damage to buildings. They found that earthquake-stricken areas have a structural form of brick walls and frame columns that are jointly load-bearing but do not meet code requirements for the bottom frame structure. The significant disparity in stiffness between the frame structure and masonry components compromises deformation coordination under seismic loading. This leads to severe cracking at the connection zones between the load-bearing brick walls and the frame on the bottom floor of residential buildings. In extreme cases, this structural inconsistency can cause the entire floor to collapse. Gao et al. [14] conducted low-cycle, horizontal, repeated, quasi-static tests on a 1:2 scale model of a seven-floor brick house with a bottom-frame seismic wall. The researchers compared the test results with the analysis of the model’s ultimate bearing capacity and evaluated the seismic resistance of this type of building. The results indicate that the second floor experiences complex stresses that serve to transmit seismic shear forces and overturning moments from the upper floors. Therefore, design measures should be implemented to enhance the wall’s shear and bending resistance. Zhang et al. [15] conducted research on the lateral stiffness of perforated masonry walls with perforation rates that comply with standards. Using existing perforated wall calculation methods and the finite element method, they found that changes in perforation position affect wall lateral stiffness in a quadratic manner and that existing perforated wall lateral stiffness calculation methods and finite element analysis results contain errors. Therefore, studying the seismic performance of masonry structures with large openings at ground level is necessary to ensure structural safety, support urban renewal, and promote the standardization and normalization of the construction industry [16].
Current research indicates that improvements can be made to address the issue of “rigid upper layers and flexible lower layers,” which weakens the seismic performance of masonry structures. These improvements include identifying weak layers to alter the sequence of failure [17], adjusting structural stiffness [18], and adding lateral force-resisting components [19]. Liu et al. [20] used the Beichuan County Telecommunications Bureau residential building in the Wenchuan earthquake as a prototype to design four 1/5 scale models of commercial masonry structures on the ground floor. Through shake table model tests, they obtained the collapse failure patterns of commercial masonry structures during earthquakes. The tests revealed inconsistent wall stiffness in the same direction and showed that seismic forces were distributed according to wall stiffness. This led to sequential wall breaches during the earthquake, ultimately resulting in overall failure or collapse. To study the seismic performance of bottom frame-shear wall masonry buildings and determine appropriate stiffness ratios, seismic shear force amplification factors for frame-shear wall layers, and total building height (number of layers) when applied to a seismic intensity zone of seven, Xiong et al. [21] performed simulated earthquake vibration table tests and nonlinear analyses on models of these structures. According to the results, a frame-shear masonry building’s elastic lateral stiffness ratio between the masonry layer and the next frame-shear layer should not be greater than 2.5 for a seismic intensity of 7. Additionally, the building’s overall height should not be greater than 21 m (seven layers). Low-cycle repeated horizontal loading tests were performed on two brick masonry walls with varying height-to-width ratios by Yang et al. [22]. Examining the variables affecting the failure patterns of masonry constructions between windows was the aim. The tests showed that upon collapse, the higher parts of the walls and structural columns remained intact, creating a “roly-poly” shape centered on the columns, while the lower parts of both walls were crushed. The specimens cracked without collapsing, showing high overall integrity. The seismic performance of masonry window-between walls was examined by analyzing the specimens’ ductility, energy dissipation, skeleton, hysteresis characteristics, and fracture distribution. Zhao et al. [23] investigated the impact of abrupt changes in bottom stiffness on the likelihood of various structural failure states by changing the lateral stiffness ratio between the bottom and second layers. Their findings showed that abrupt variations in bottom stiffness greatly increase a structure’s susceptibility. Actually, street-front stores or garages are usually located on one side of the structure, which causes abrupt changes in vertical stiffness as well as an uneven distribution of planar stiffness. Because of this, they are more likely to be broken during earthquakes, which exacerbates seismic damage [24,25]. To improve the seismic performance of such structures and guarantee the protection of people’s lives and property, certain measures must be proposed.
Reinforced concrete components have better seismic energy dissipation properties than masonry components during earthquakes. Liang et al. [26] and Wu et al. [27] respectively installed reinforced concrete wing columns and wing walls in scaled-down models of multistory masonry structures. They then conducted comparative tests with models of ordinary masonry structures. Their results showed that installing reinforced concrete seismic components provides reliable seismic performance for masonry structures. Wang et al. [28] used a reinforcement scheme that involved encasing masonry structures in prefabricated reinforced concrete wall panels and installing an isolation layer on top of the structure. They then conducted vibration table testing. Their results showed that this method extended the structure’s natural vibration period, increased its damping ratio, and significantly improved its seismic performance. Wang, Xin et al. [29] used a mixture of fibers to reinforce the surface layer of active powder concrete and conducted low-cycle repeated load tests on masonry window walls. Their results showed that the surface layer effectively restrained the masonry window walls and significantly improved the ductility of the reinforced walls. Yan et al. [30] designed and constructed a scale model of a four-layer brick–concrete composite structure at a ratio of 1:4. Based on the principle of stiffness equivalence, they replaced some of the exterior walls on the side of the model with large ground-floor openings with reinforced concrete frame columns and beams. The researchers conducted quasi-static tests on the model to obtain the failure patterns of each structural layer, as well as hysteresis curves, skeleton curves, displacement ductility, stiffness degradation, energy dissipation capacity, and other seismic performance indicators. The results indicate that the replacement method based on stiffness equivalence is a feasible solution for addressing structural torsion issues caused by irregular floor plans. Wu et al. [31] examined the seismic performance of masonry walls reinforced with ultra-high-ductility concrete through experiments and finite element simulations. The researchers also proposed a method for calculating the shear-bearing capacity of these structures. Their results showed that ultra-high ductility concrete reinforcement effectively improves seismic performance and significantly increases the ultimate bearing capacity of masonry structures. Liu et al. [32] added seismic walls of different sizes to the ground floor of buildings to adjust their stiffness and effectively alleviate the concentration of deformation on the ground floor. Guo et al. [33] proposed the concept of a reinforced layer at the base of multistory masonry structures. They defined the area at the base of multistory masonry structures that may suffer severe damage due to seismic loads as the reinforced layer. This layer has a higher seismic bearing capacity and stiffness than other areas. Other reinforcement methods include wire mesh [34,35], concrete panel [36,37,38], and steel strip reinforcement [39]. Using concrete, steel mesh, and steel strips to reinforce masonry structures enhances their load-bearing capacity and ability to dissipate energy. Studies indicate that masonry structures reinforced with reinforced concrete components have significantly improved seismic performance. This provides new insights for improving the seismic performance of masonry structures with large ground-floor openings. This paper investigates the failure characteristics of masonry structures with large openings at the base under seismic loads. A model of a masonry structure in a 1/4-scale was designed, with a substantial opening situated on one side of the base. In this case, the stiffness equivalence method was innovatively applied to replace the traditional masonry wall on the side of the opening with a reinforced concrete wall. Pseudo-static tests were conducted to study the seismic performance of such structures.

2. Experimental Program

2.1. Design of Test Specimens

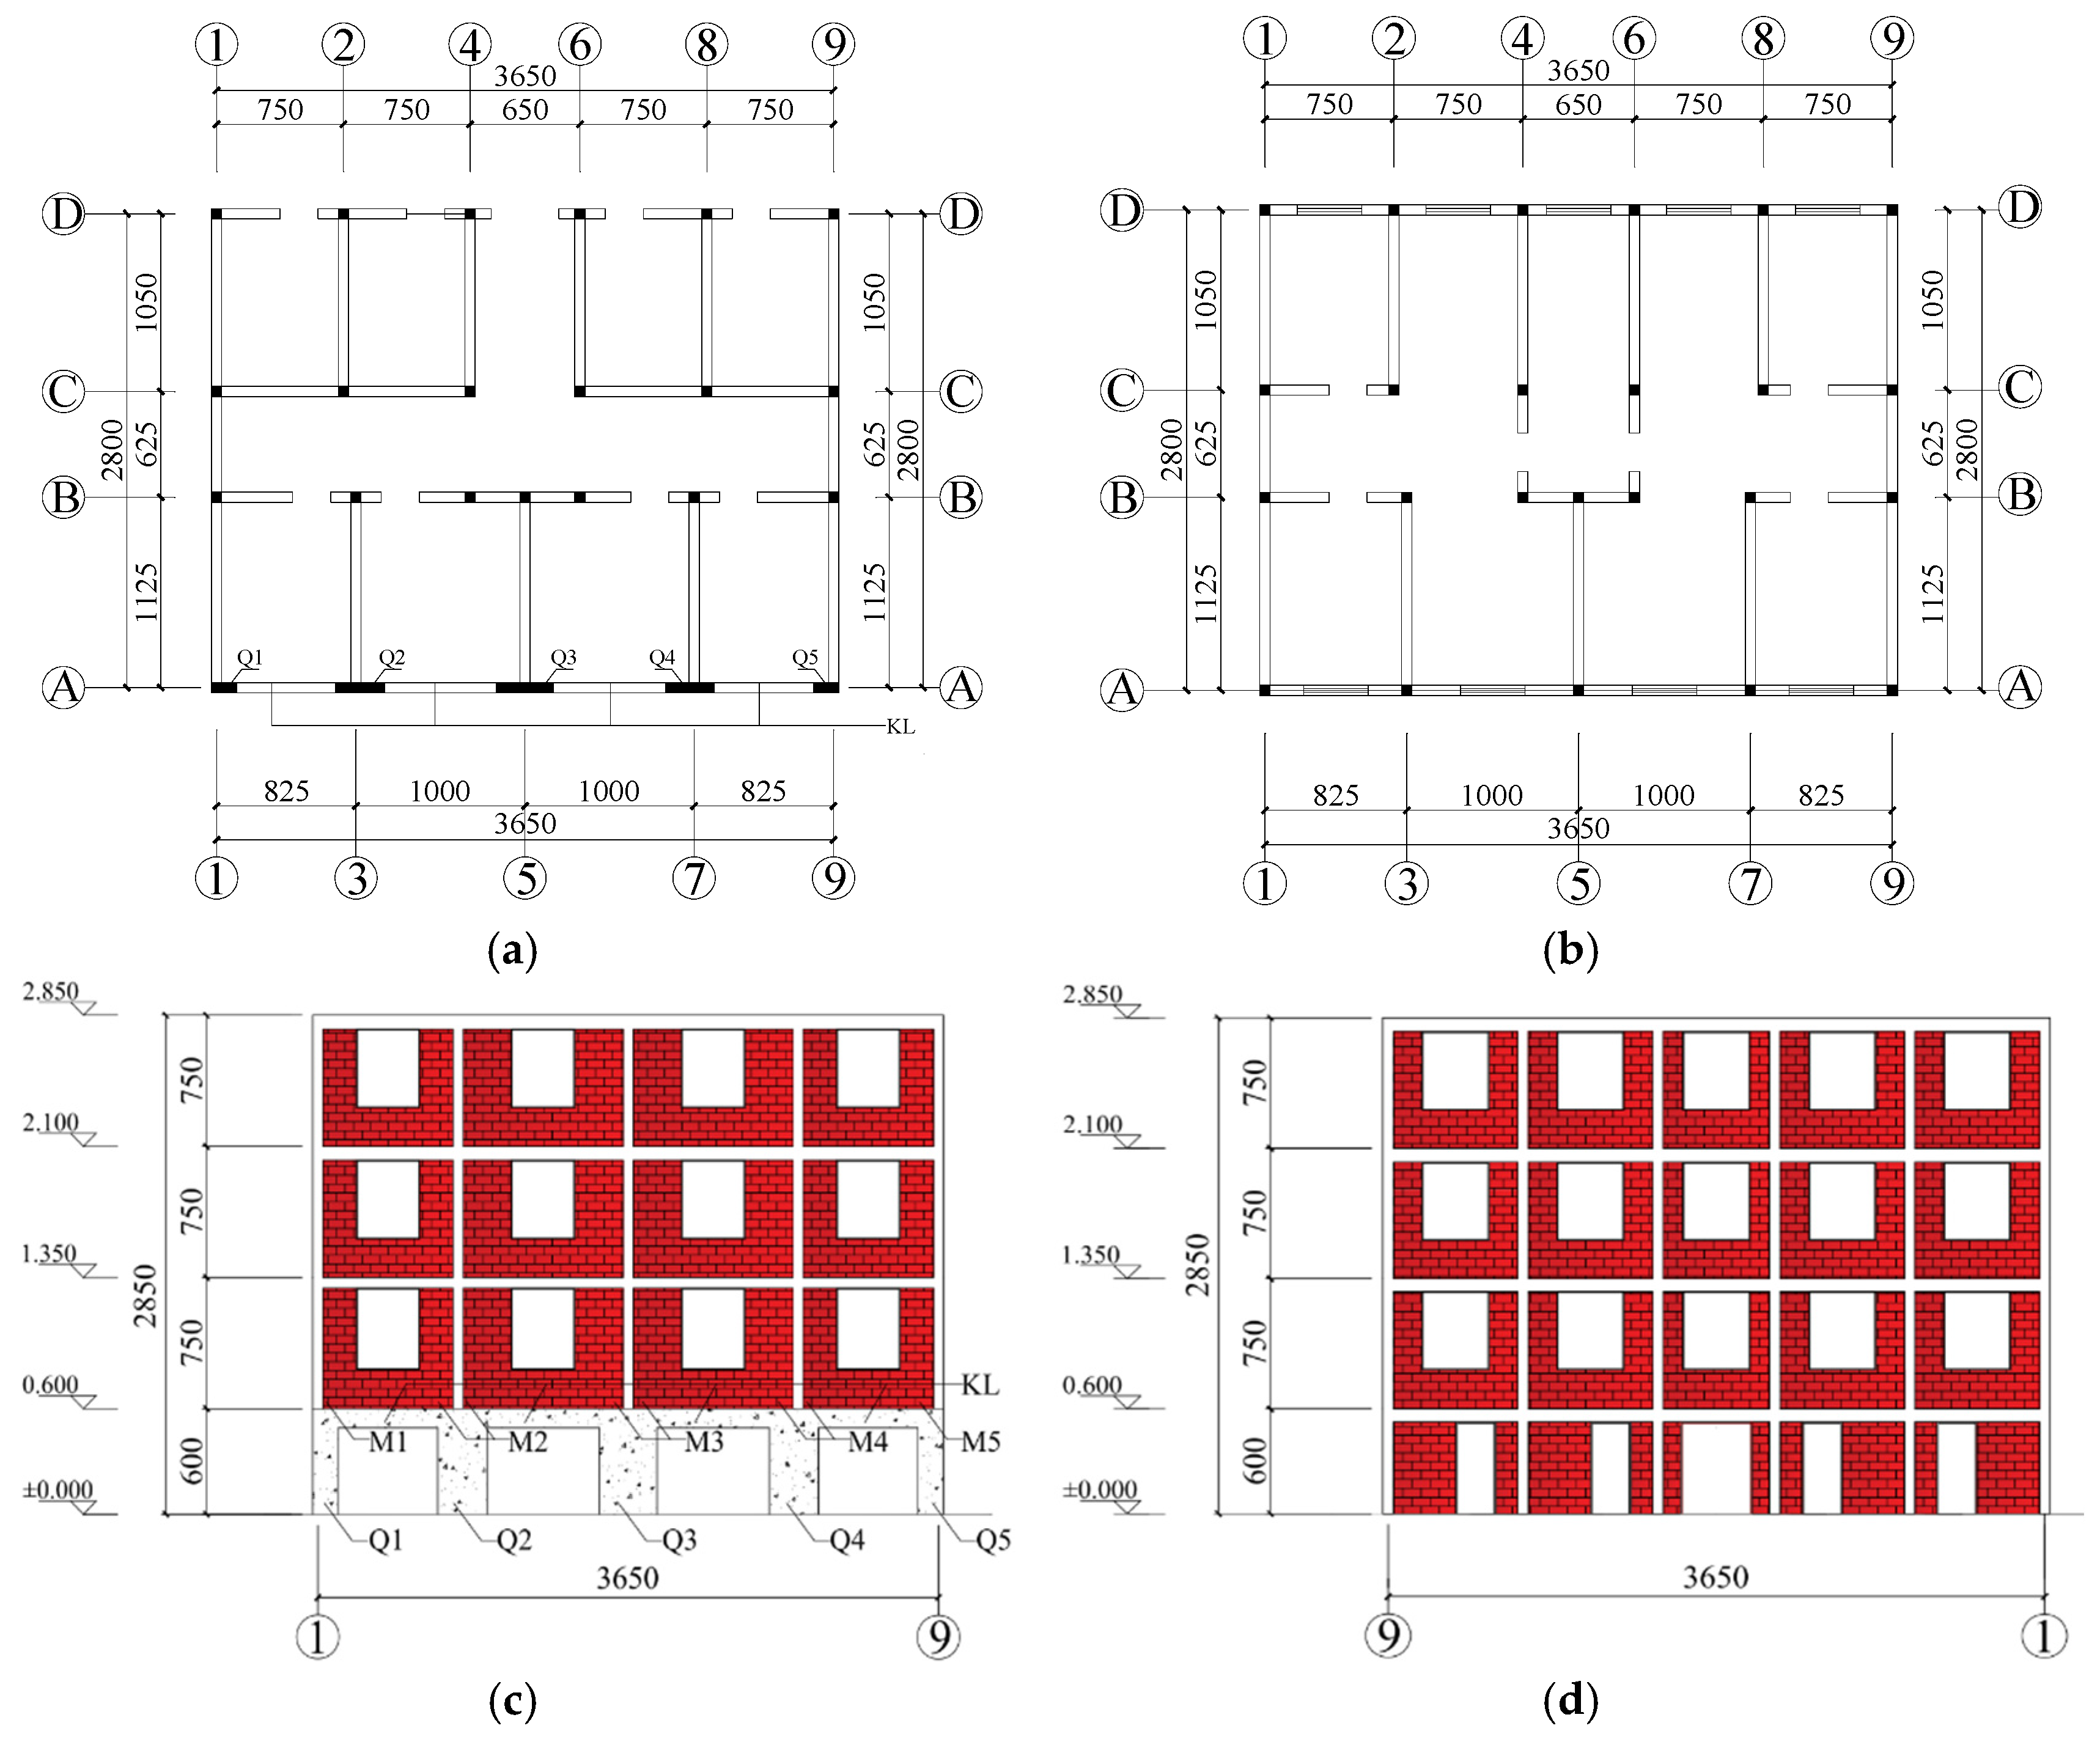
The engineering prototype was a six-story brick-and-concrete masonry building. Considering that the seismic damage of masonry structures with large bottom-floor openings is mainly concentrated in the lower layers, and considering the height limitation, loading capacity, and safety requirement of the laboratory test system, the lower four stories of the prototype were selected and constructed as a 1:4 scaled substructure model. Therefore, the tested model should be regarded as the lower substructure of the six-story prototype rather than a complete six-story model. The model had total dimensions of 3.71 m × 2.86 m × 2.85 m, with an exterior wall thickness of 60 mm. The fifth and sixth floors were subjected to uniformly distributed loads applied to their roofs. The second, third, and fourth layers of the structural model have window openings. The ground floor has a standard door opening on one side and simulates a commercial space and garage on the other side with a large opening. The aforementioned construction results in an uneven distribution of vertical and horizontal stiffness in the structural model. Finite element analysis studies have shown that uneven horizontal stiffness can cause structural torsion during earthquakes [22]. The Code for Seismic Design of Buildings (GB 50011-2010) [40] explicitly states that buildings with irregular layouts should be reinforced. Therefore, to leverage the significantly higher lateral stiffness of reinforced concrete walls compared to masonry walls, reinforced concrete walls are installed in place of masonry walls in large openings on the ground floor. This approach meets the building’s functional requirements and compensates for the stiffness loss caused by the large openings. The schematic diagram of the structural model is shown in Figure 1, where the reinforced concrete walls are denoted as Q1 to Q5, and the remaining walls are masonry walls.

2.2. Specimen Fabrication and Material Properties

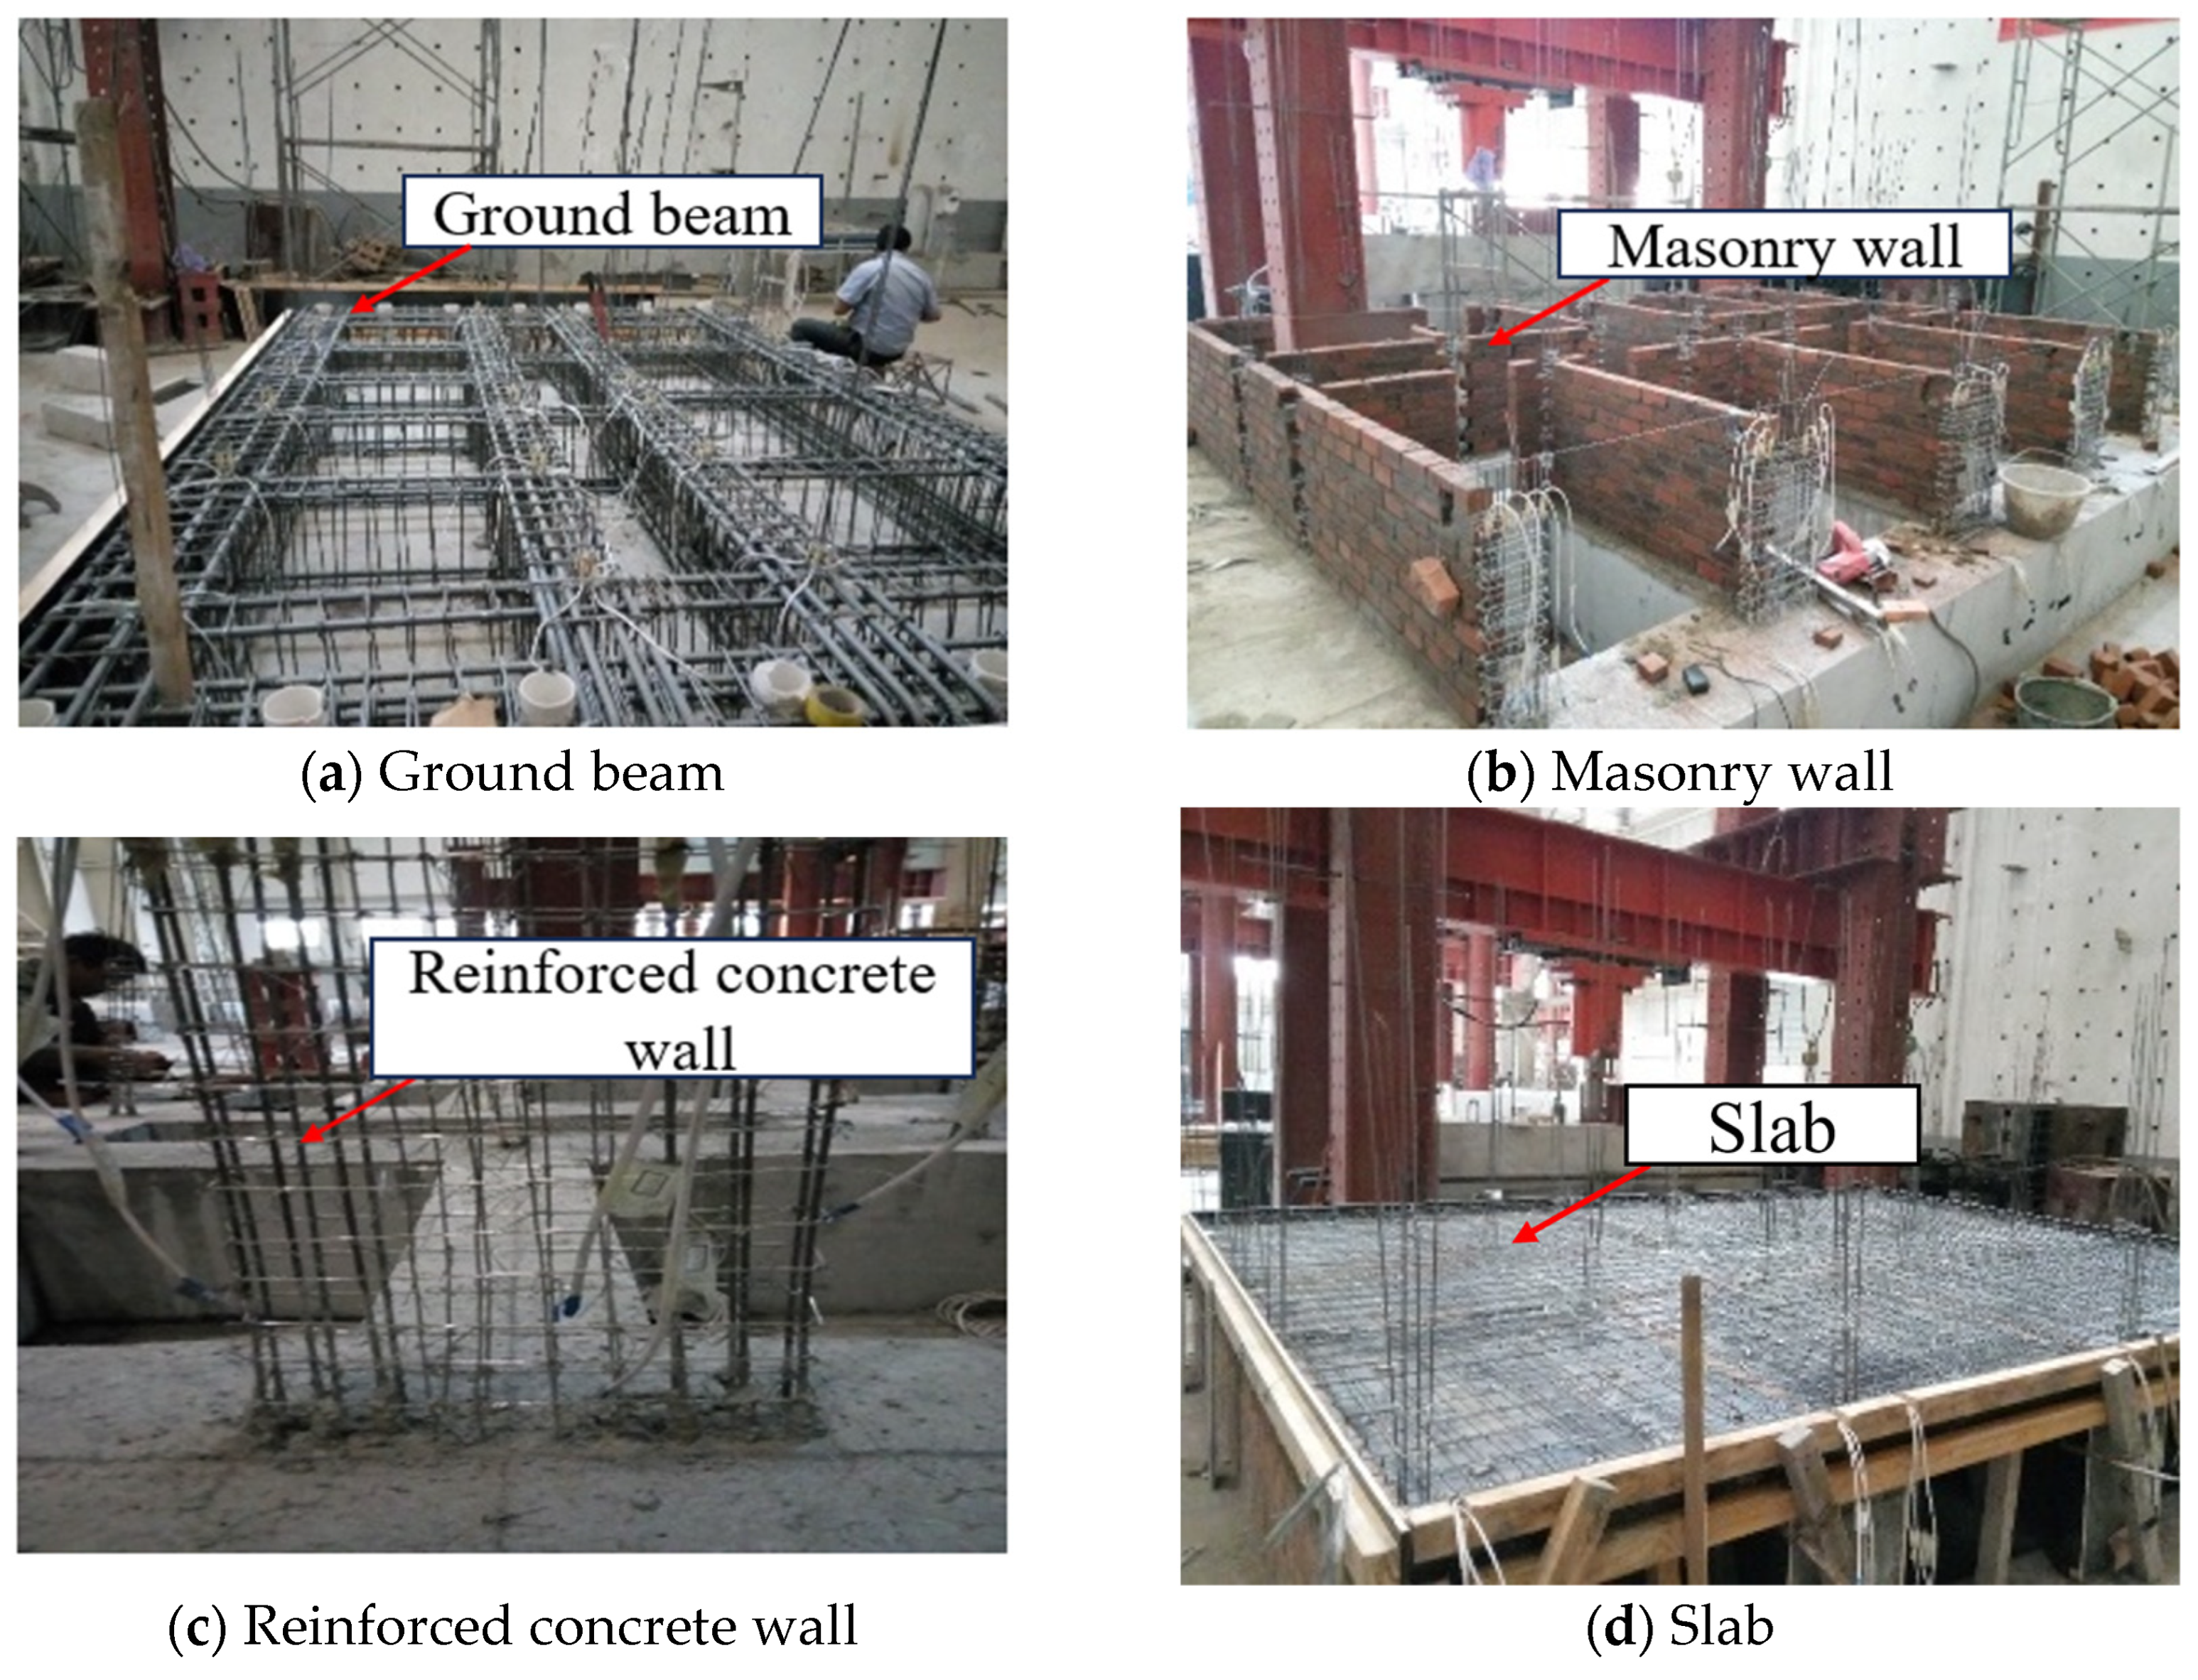
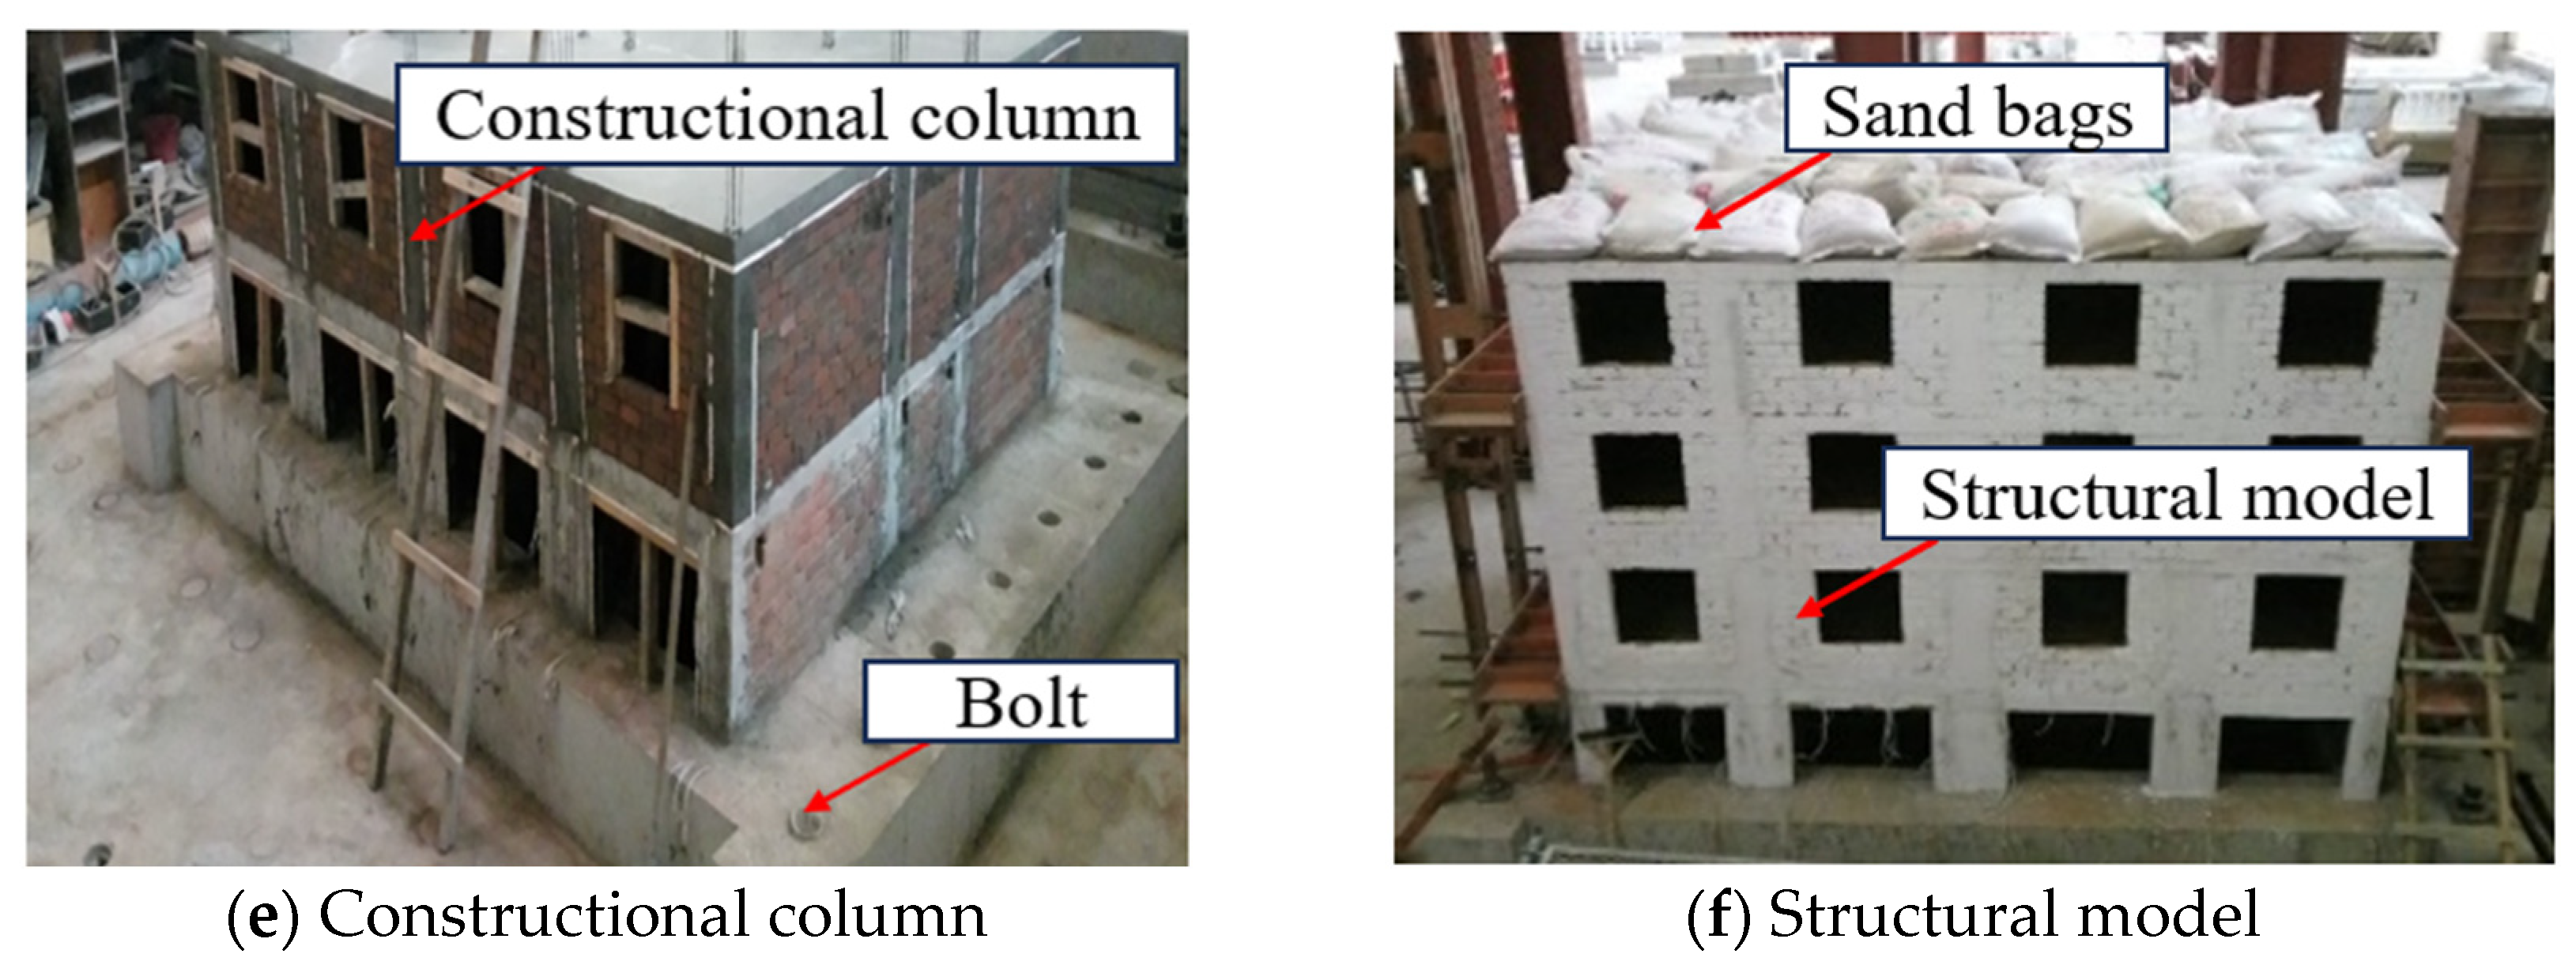
The fabrication procedures of the structural model are shown in Figure 2. The ground beam, reinforced concrete walls, floor slabs, structural columns, and frame beams are all cast with C30 concrete. According to the Standard Test Methods for Physical and Mechanical Properties of Concrete (GB/T 50081-2019) [41], the cube compressive strength of the concrete is measured at 35.6 MPa and the axial compressive strength at 21.3 MPa. Brick walls are constructed of M7.5 mortar, while M10 mortar is used for reinforced concrete walls and ground beams. Both types of mortar underwent strength testing according to the Standard Test Methods for Basic Properties of Building Mortar (JGJ/T 70-2009) [42]. The bricks utilized in the construction of the brick wall are conventional fired bricks that have undergone a comparable processing procedure. The dimensions of the processed bricks are 115 mm × 60 mm × 53 mm. Strength tests were conducted according to the provisions of Fired Ordinary Bricks (GB/T 5101-2017) [43], and the results indicated that the strength of the bricks is MU10. HRB400 grade steel bars were selected, and a 1:4 reduction in cross-sectional area was conducted. Due to the strength increase caused by the smaller steel area, the strength shall be subject to the measured values. According to the provisions of Metallic Materials—Tensile Testing—Part 1: Method of Test at Room Temperature (GB/T 228.1-2021) [44], the measured mechanical properties of the steel bars are shown in Table 1.
The thickness of the reinforced concrete walls is consistent with that of the masonry walls at corresponding locations on the standard floor (60 mm). The width is determined using the stiffness equivalence method. First, the stiffness (kM) of the masonry walls (M1 to M5) at the corresponding positions on the standard floor, as shown in Figure 1c, was calculated according to the Code for Seismic Design of Buildings (GB 50011-2010) [40]. The height-to-width ratio of the masonry wall segment was considered in the stiffness calculation. When ( ρ < 1), the wall segment is relatively squat and its lateral deformation is mainly controlled by shear deformation. When ( 1 ρ 4 ), both shear and flexural deformations are considered. This is the reason for using the piecewise stiffness expression in Equation (2). Then, the width (B) of the reinforced concrete wall is determined based on the principle that the stiffness (kC) of the reinforced concrete wall equals the stiffness (kM) of the masonry walls. The calculation process is illustrated in Equations (1)–(6). Among these equations, h is the height of the masonry wall or reinforced concrete wall, b is the width of the masonry wall, E is the elastic modulus of the masonry wall, and t is the thickness of the masonry wall or reinforced concrete wall. The elastic modulus of the reinforced concrete wall is denoted by EC, the shear modulus of the reinforced concrete wall is denoted by GC, the sectional moment of inertia of the reinforced concrete wall is denoted by IW, the cross-sectional area of the reinforced concrete wall is denoted by AW, and the shear non-uniformity coefficient is denoted with μ , which is taken as 1.2 for the rectangular cross-sections. The widths of the reinforced concrete walls at bottom floor and masonry wall at standard floor is listed in Table 2.
ρ = h b
k M = E t 3 ρ ρ < 1 E t 3 ρ + ρ 3 1 ρ 4
I W = t B 3 12
A W = t B
k C = 3 E C I W h 3 1 + 3 μ E C I W h 2 G C A W
k C = k M
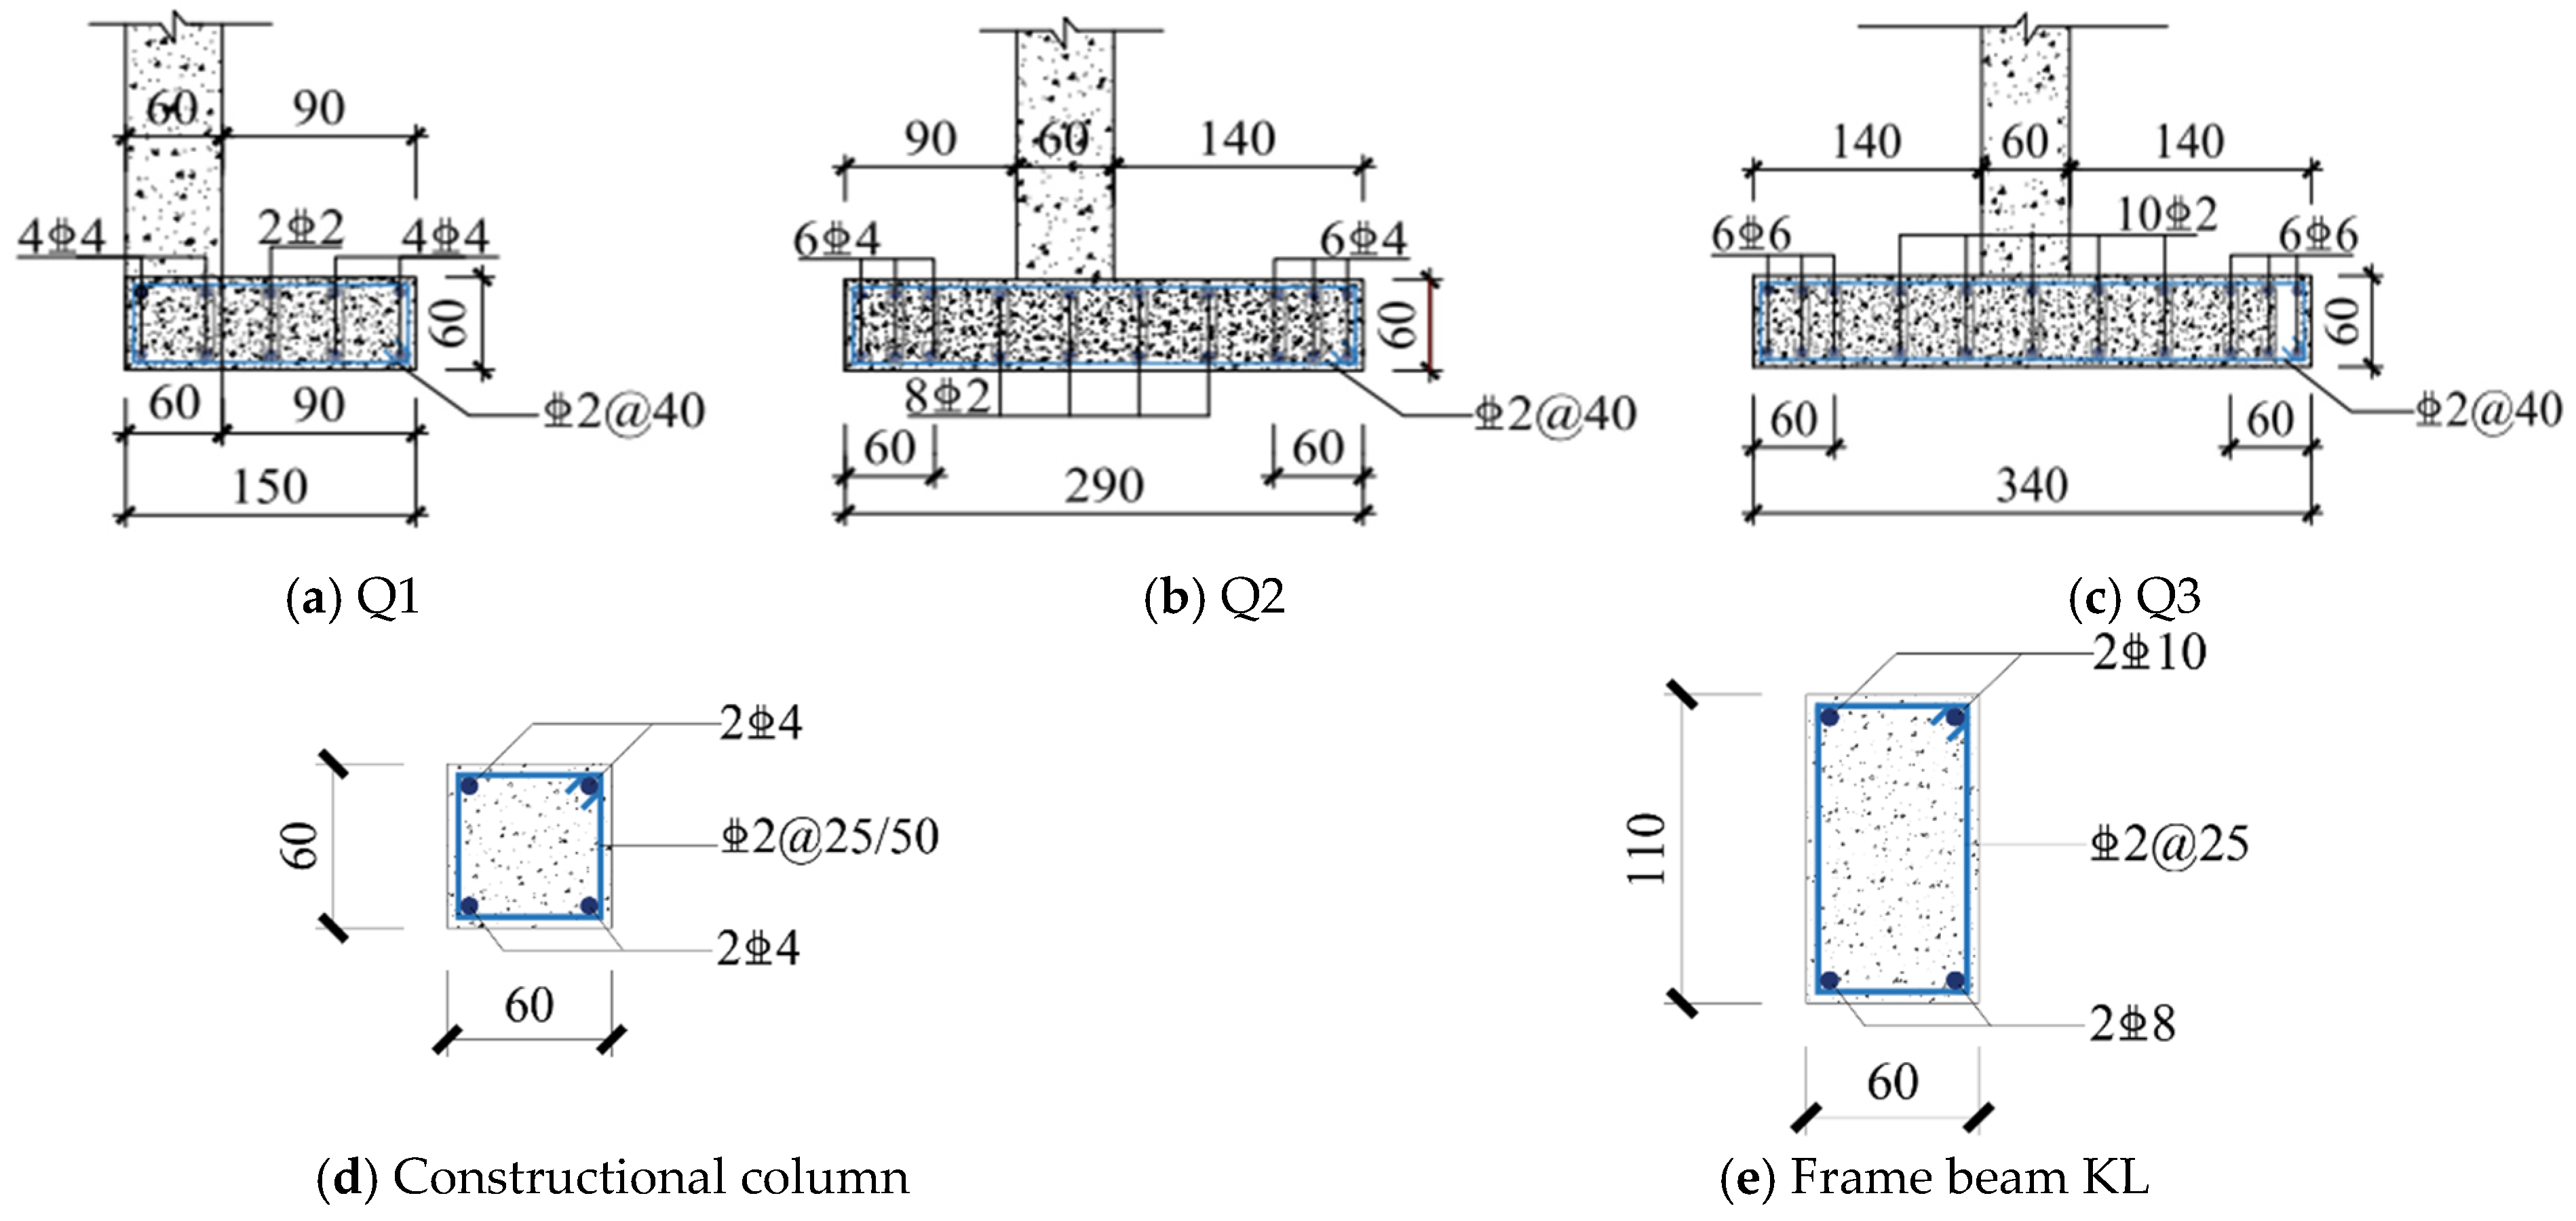
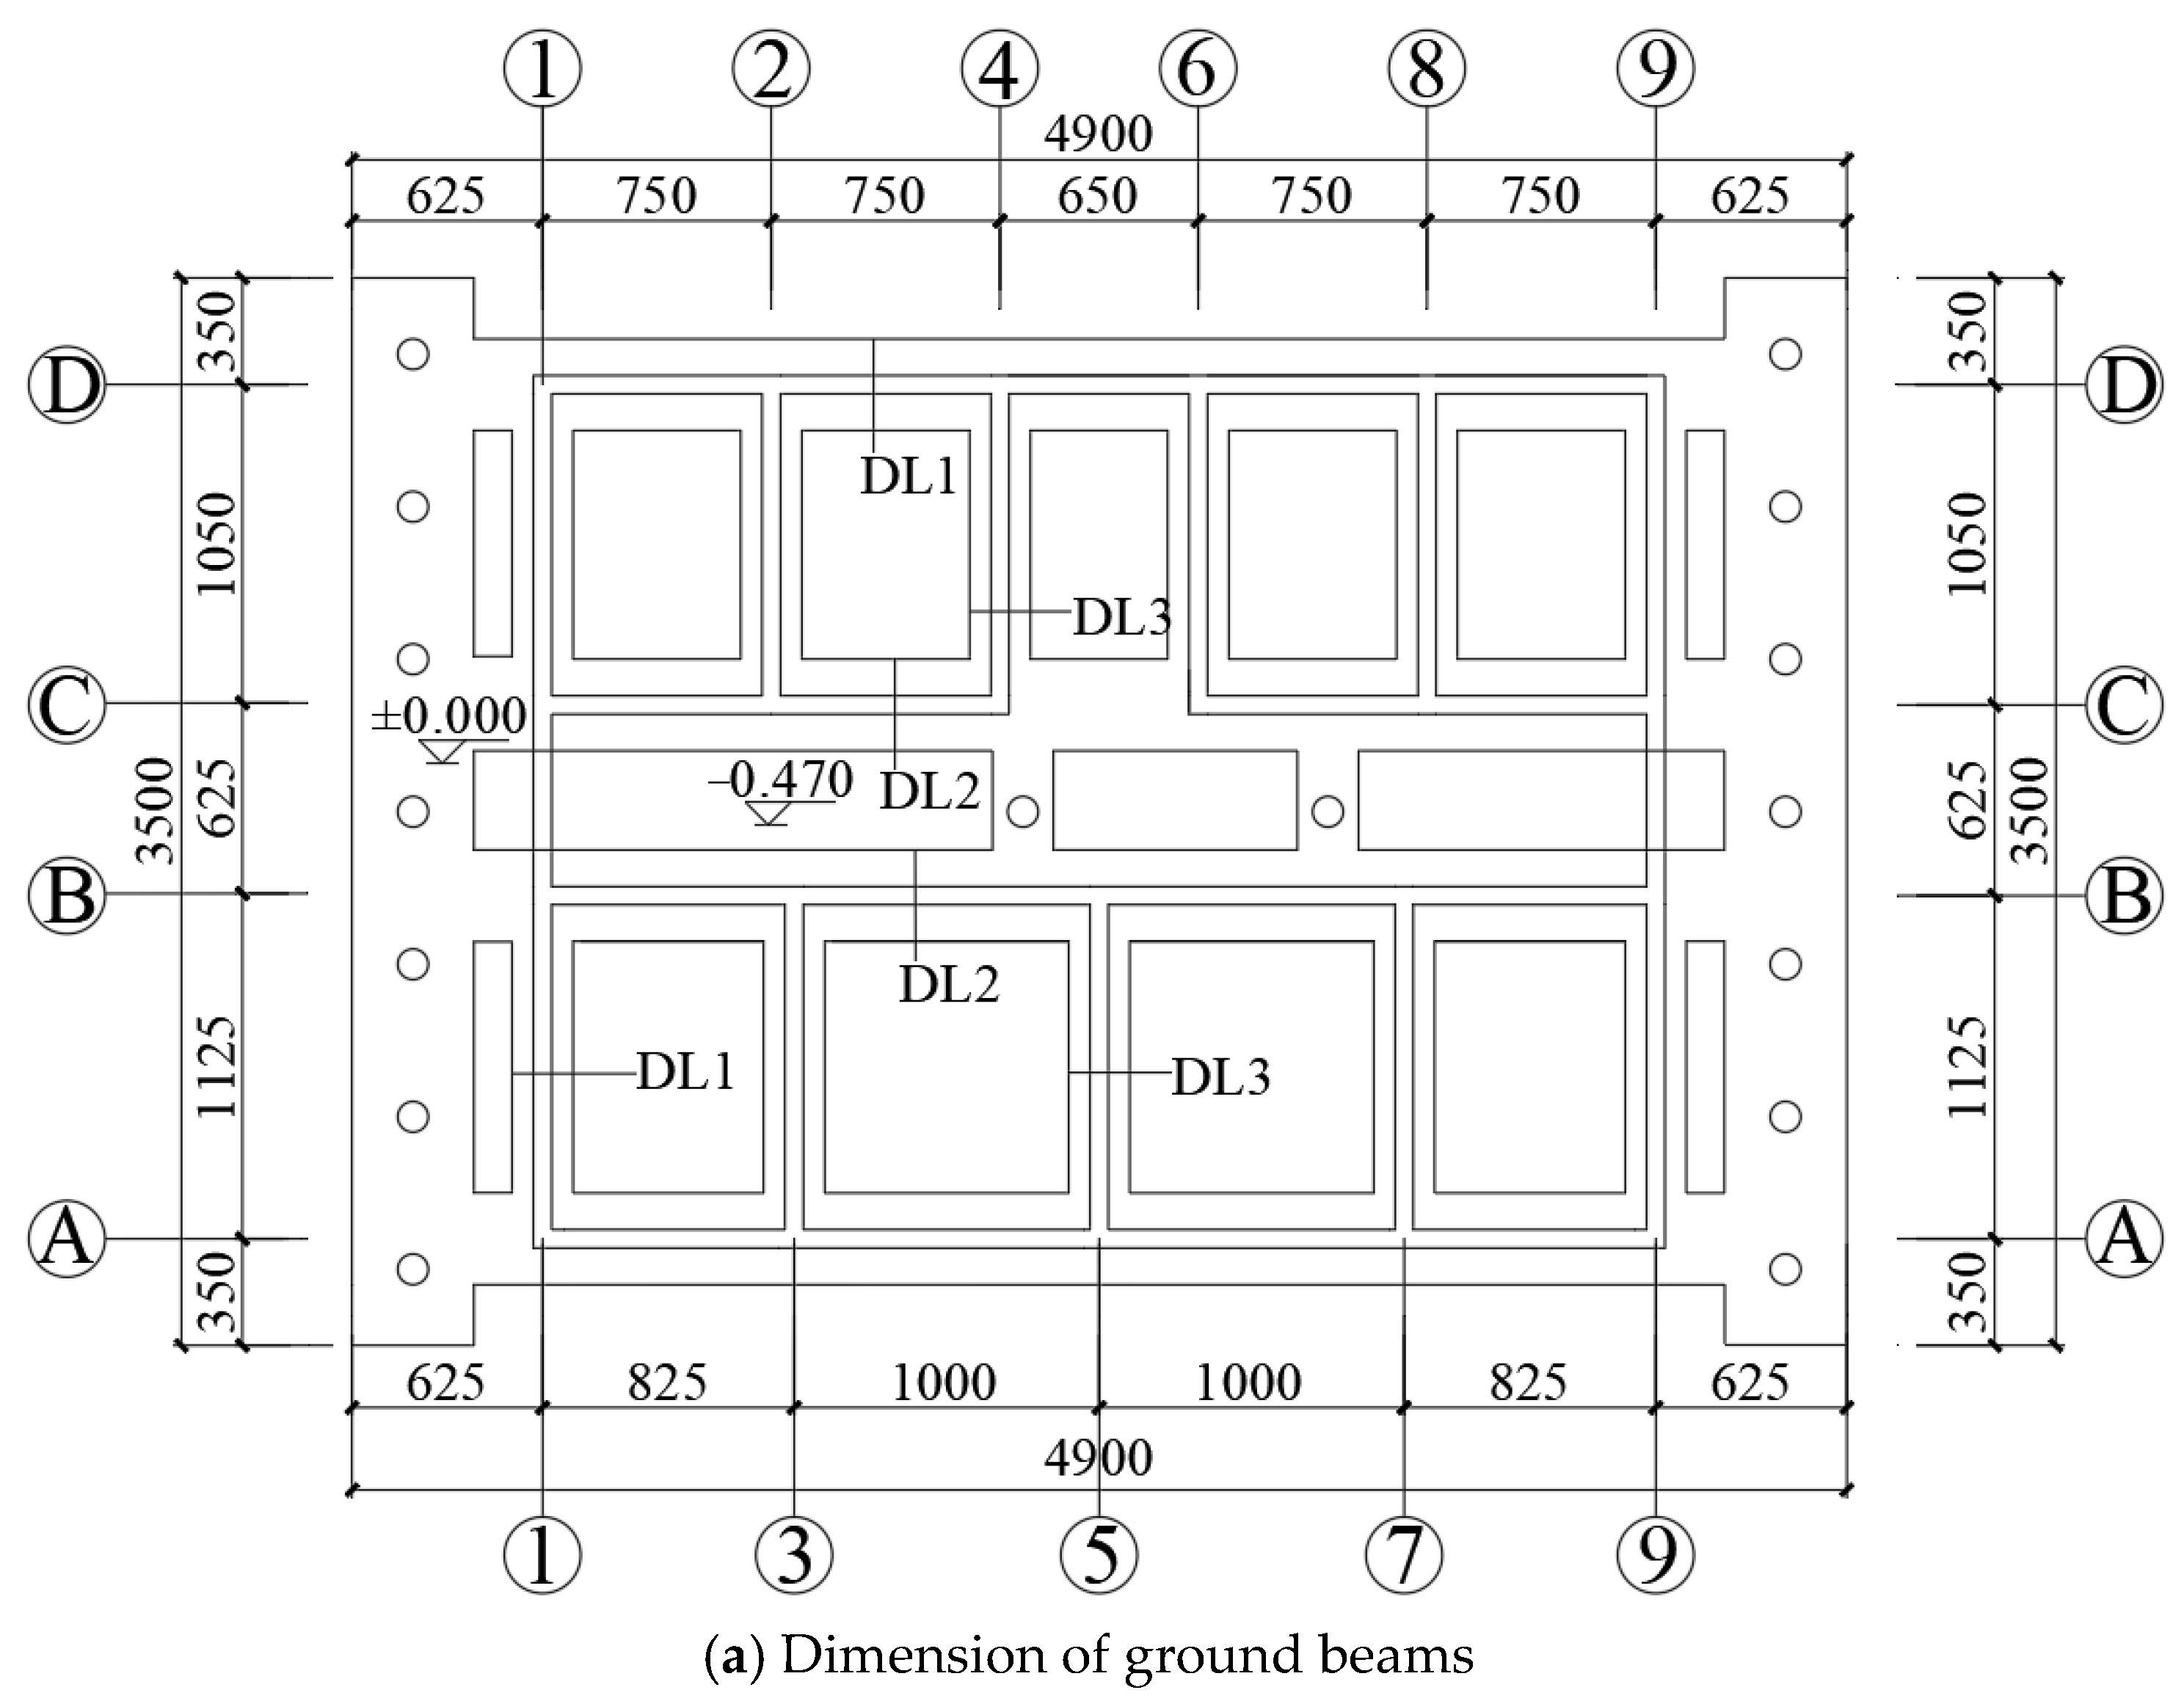
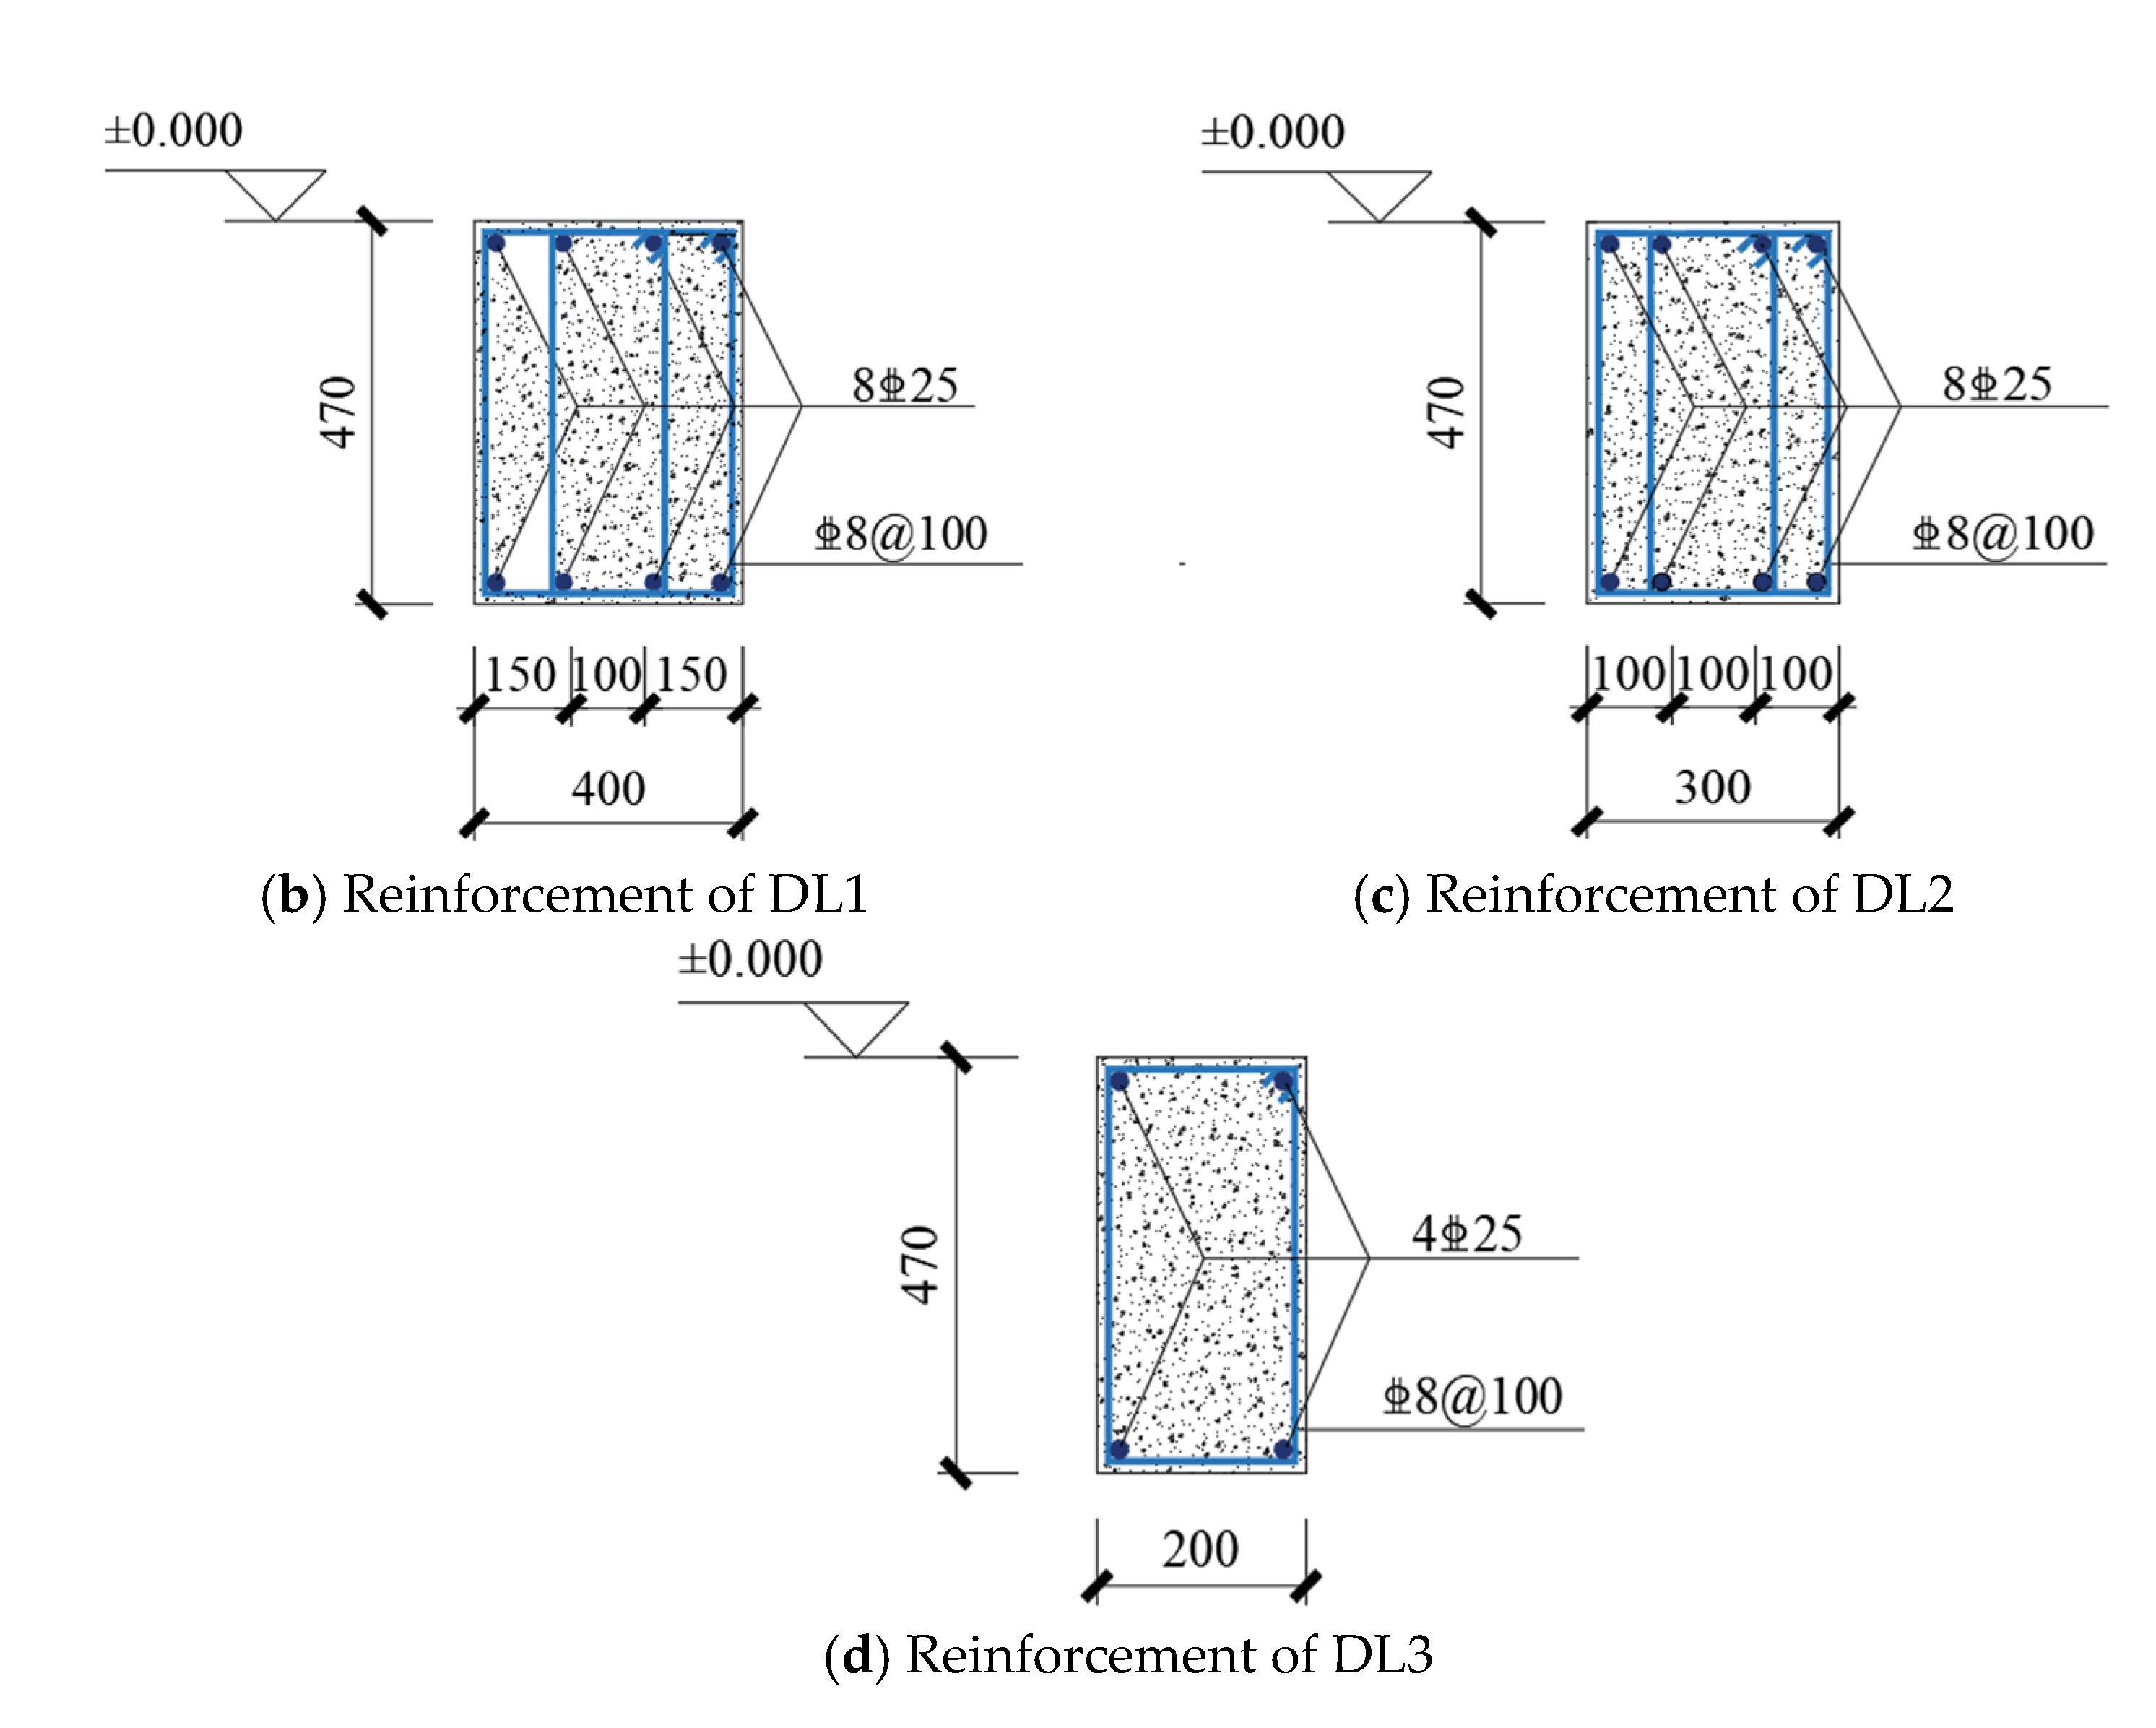
The dimension and reinforcement details of the reinforced concrete wall, constructional columns and frame beams are illustrated in Figure 3. The stirrups of the structural columns are densely spaced within a 100 mm zone above and below the floor level. The reinforcement of reinforced concrete reinforced walls Q4 and Q5 is analogous to that of Q2 and Q1, respectively. The ground beams are engineered to distribute seismic loads with the structural model, thereby ensuring the stability of the structural base. The dimension and reinforcement of ground beam are shown in Figure 4.

2.3. Loading Equipment and Regime

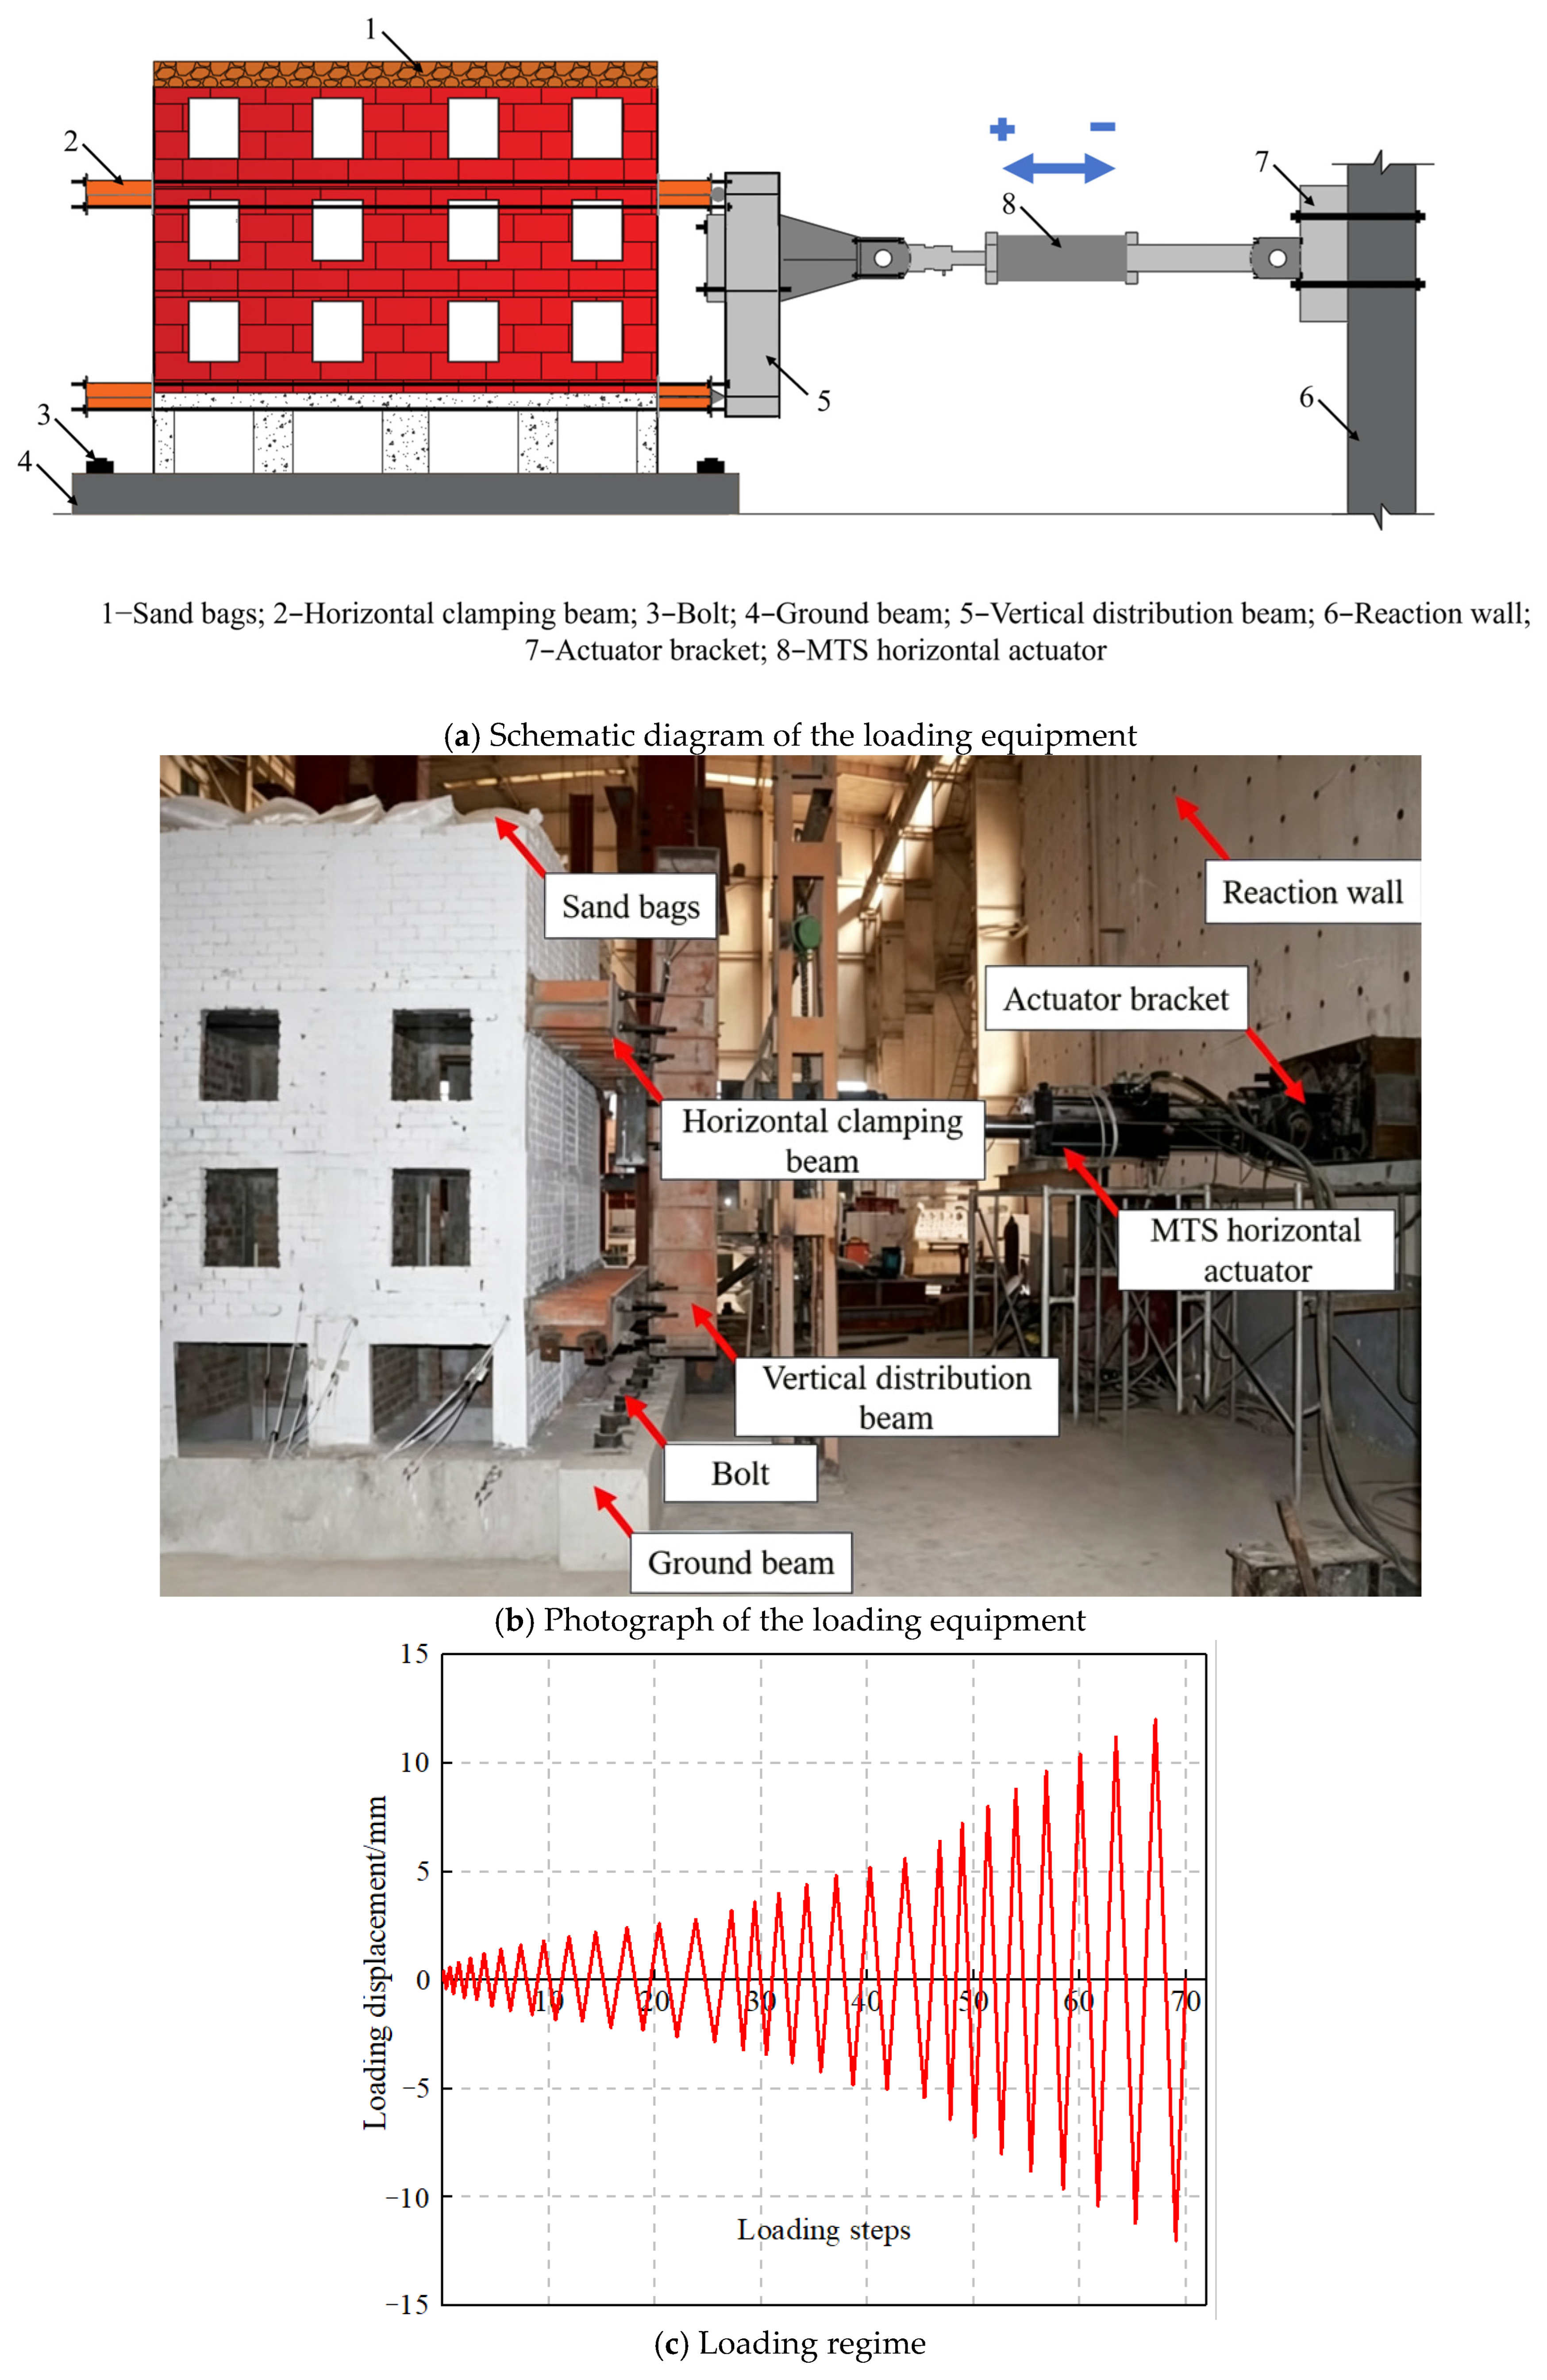
The loading of structural models is divided into vertical loading and horizontal loading. Vertical loads are considered to be solely due to self-weight and live loads. According to the provisions of Code for Loading of Building Structures (GB 50009-2012) [45], the standard value of live load for residential floors is 2.0 kN/m2. Uniformly distributed loads are applied to each floor using sandbags. For the structural model, uniformly distributed loads of 1.0 kN/m2 were applied to the 1st to 3rd floors. A uniformly distributed load of 3.0 kN/m2 was applied to the roof of the 4th floor by sandbags. This load included the representative vertical load of the 4th floor and the equivalent gravity contribution of the omitted 5th and 6th floors. In this way, the axial compression level of the lower stories in the six-story prototype was approximately considered in the four-story scaled substructure model. The horizontal load was applied using MTS actuators in a layered loading manner, and the recorded load represents the total actuator force transmitted to the structure. The MTS horizontal actuator is connected to the reaction wall via supports. To simulate the inter-story displacement caused by horizontal seismic motion during an earthquake, a layered loading method is employed. The MTS horizontal actuator exerts horizontal reciprocating loads on the uppermost levels of the first and third floors on the eastern side of the structural model through the utilization of vertical distribution beams and horizontal clamping beams. The loading equipment is illustrated in Figure 5a,b. Horizontal loading is performed using displacement control, with the loading regime illustrated in Figure 5c. Each loading level is cycled twice, with positive and negative displacements corresponding to pushing and pulling, respectively.

2.4. Test Instrumentation

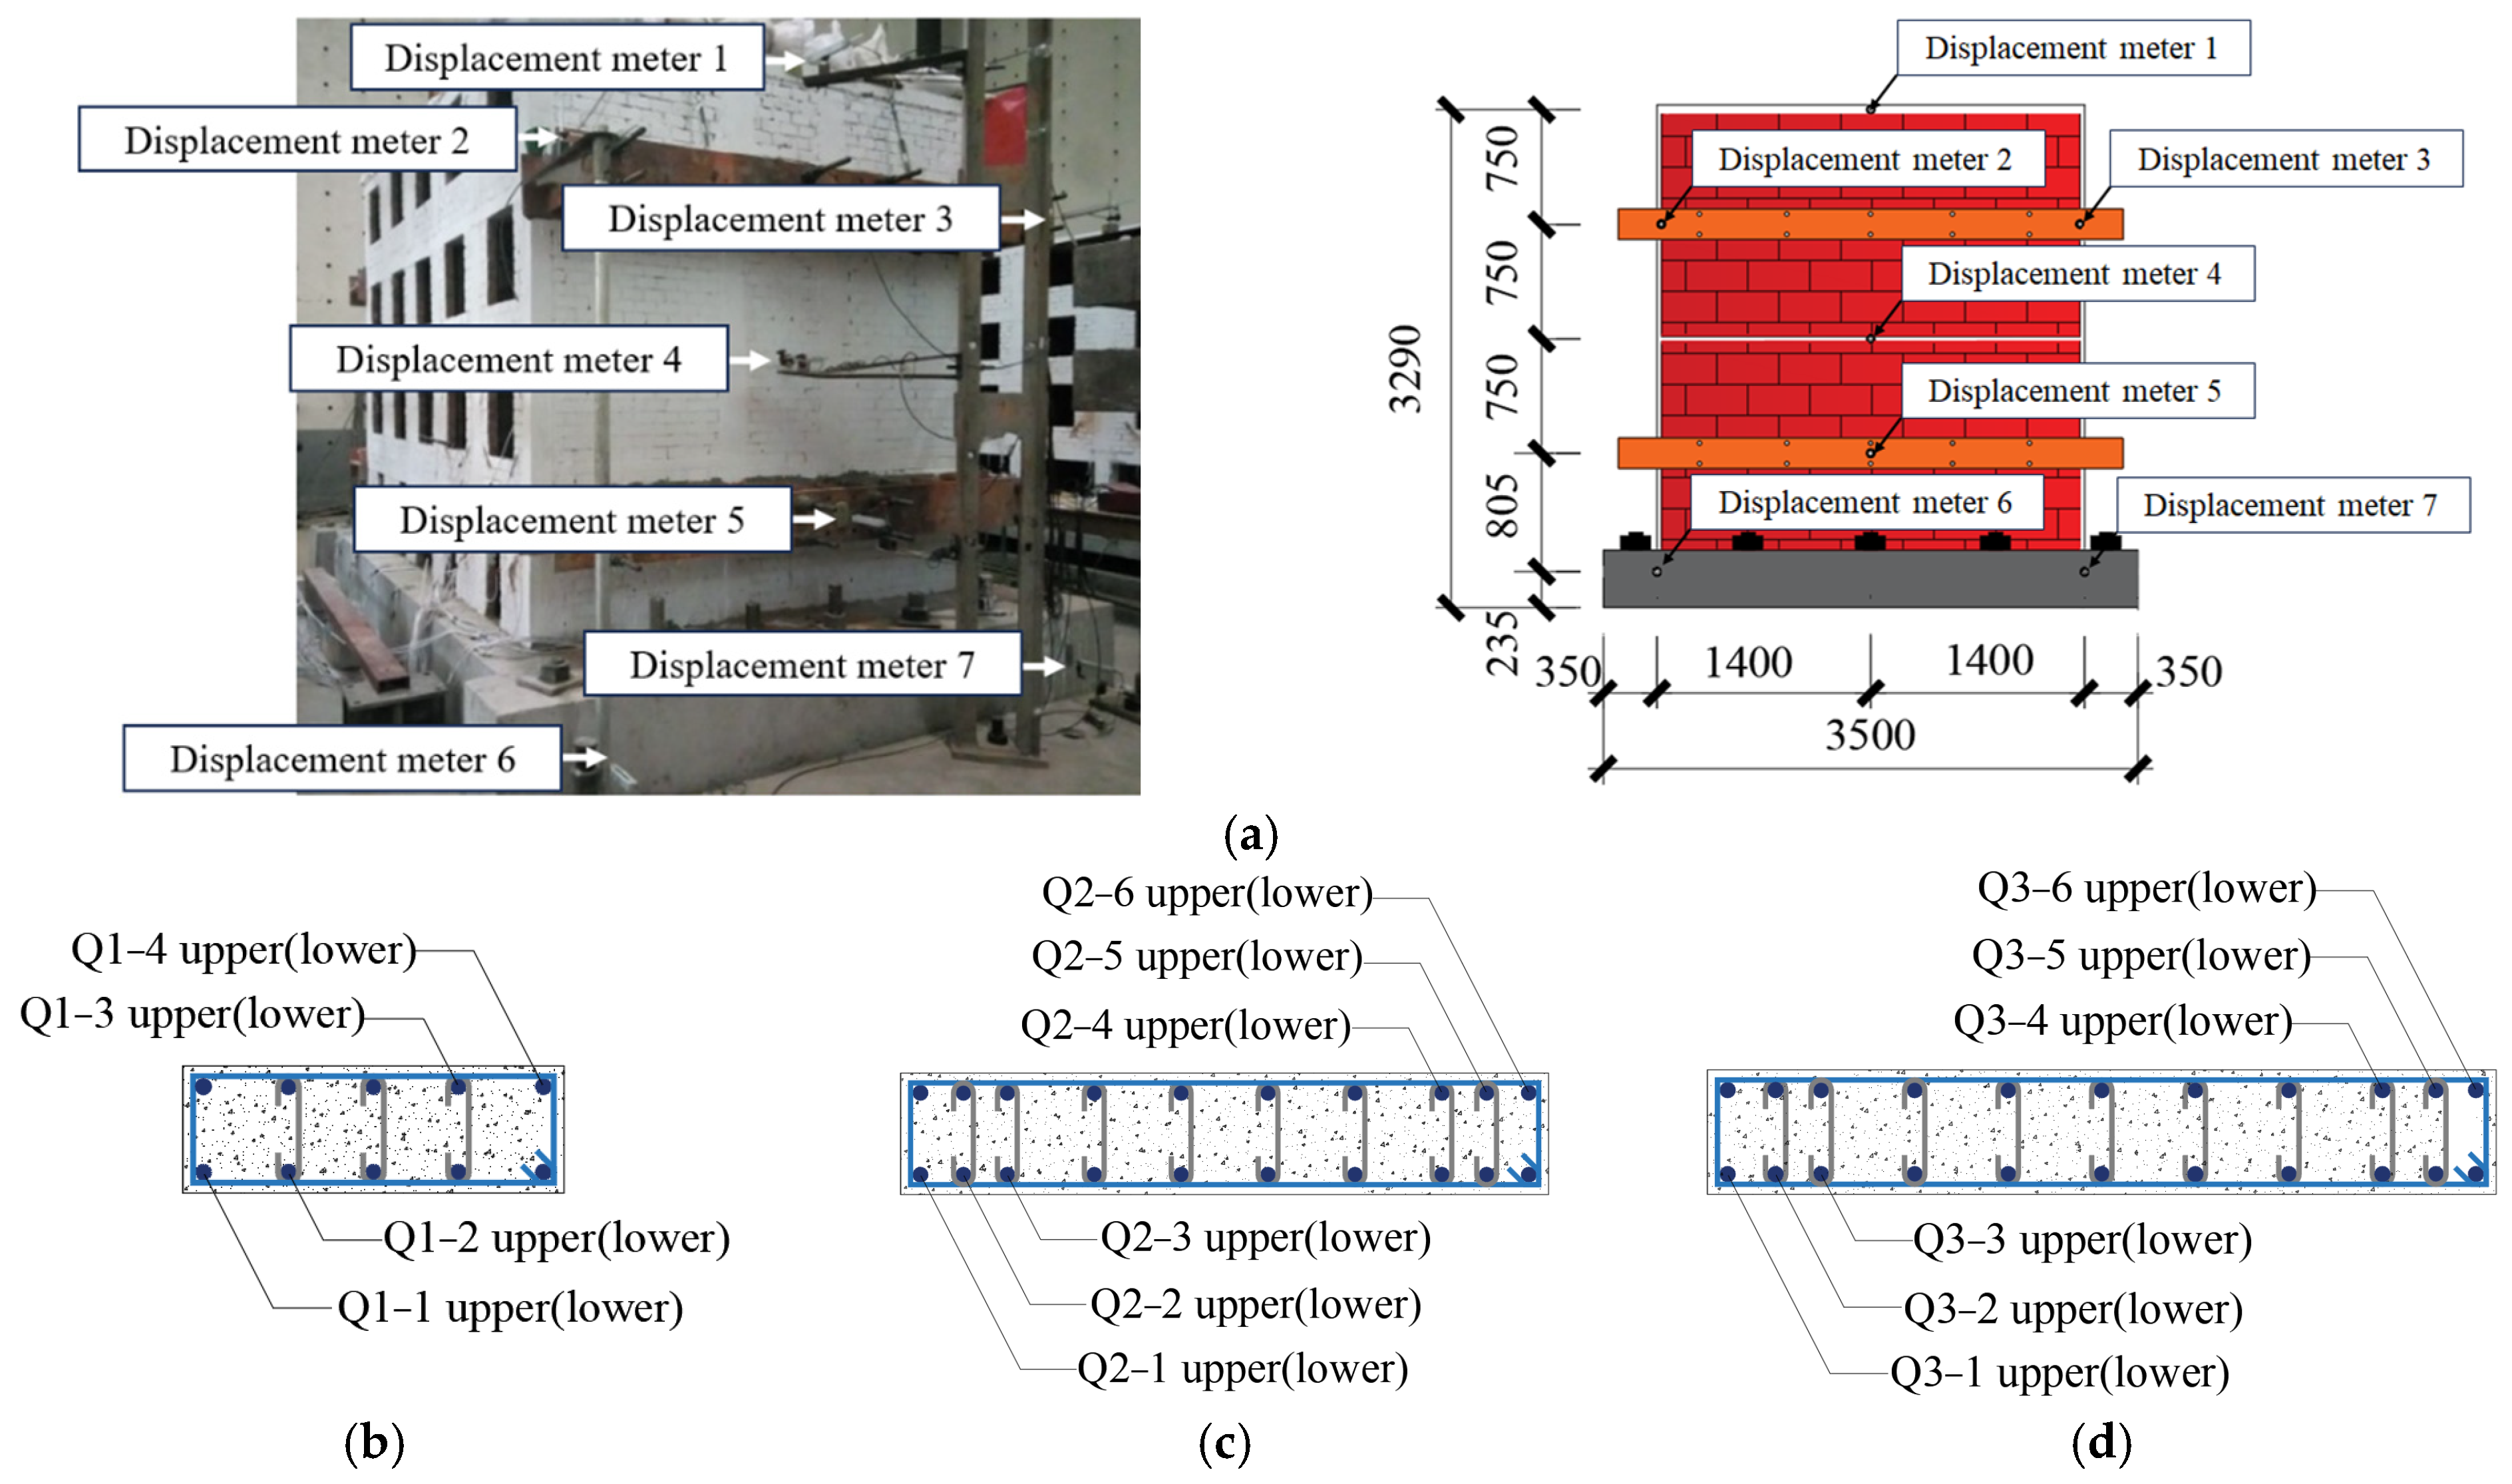
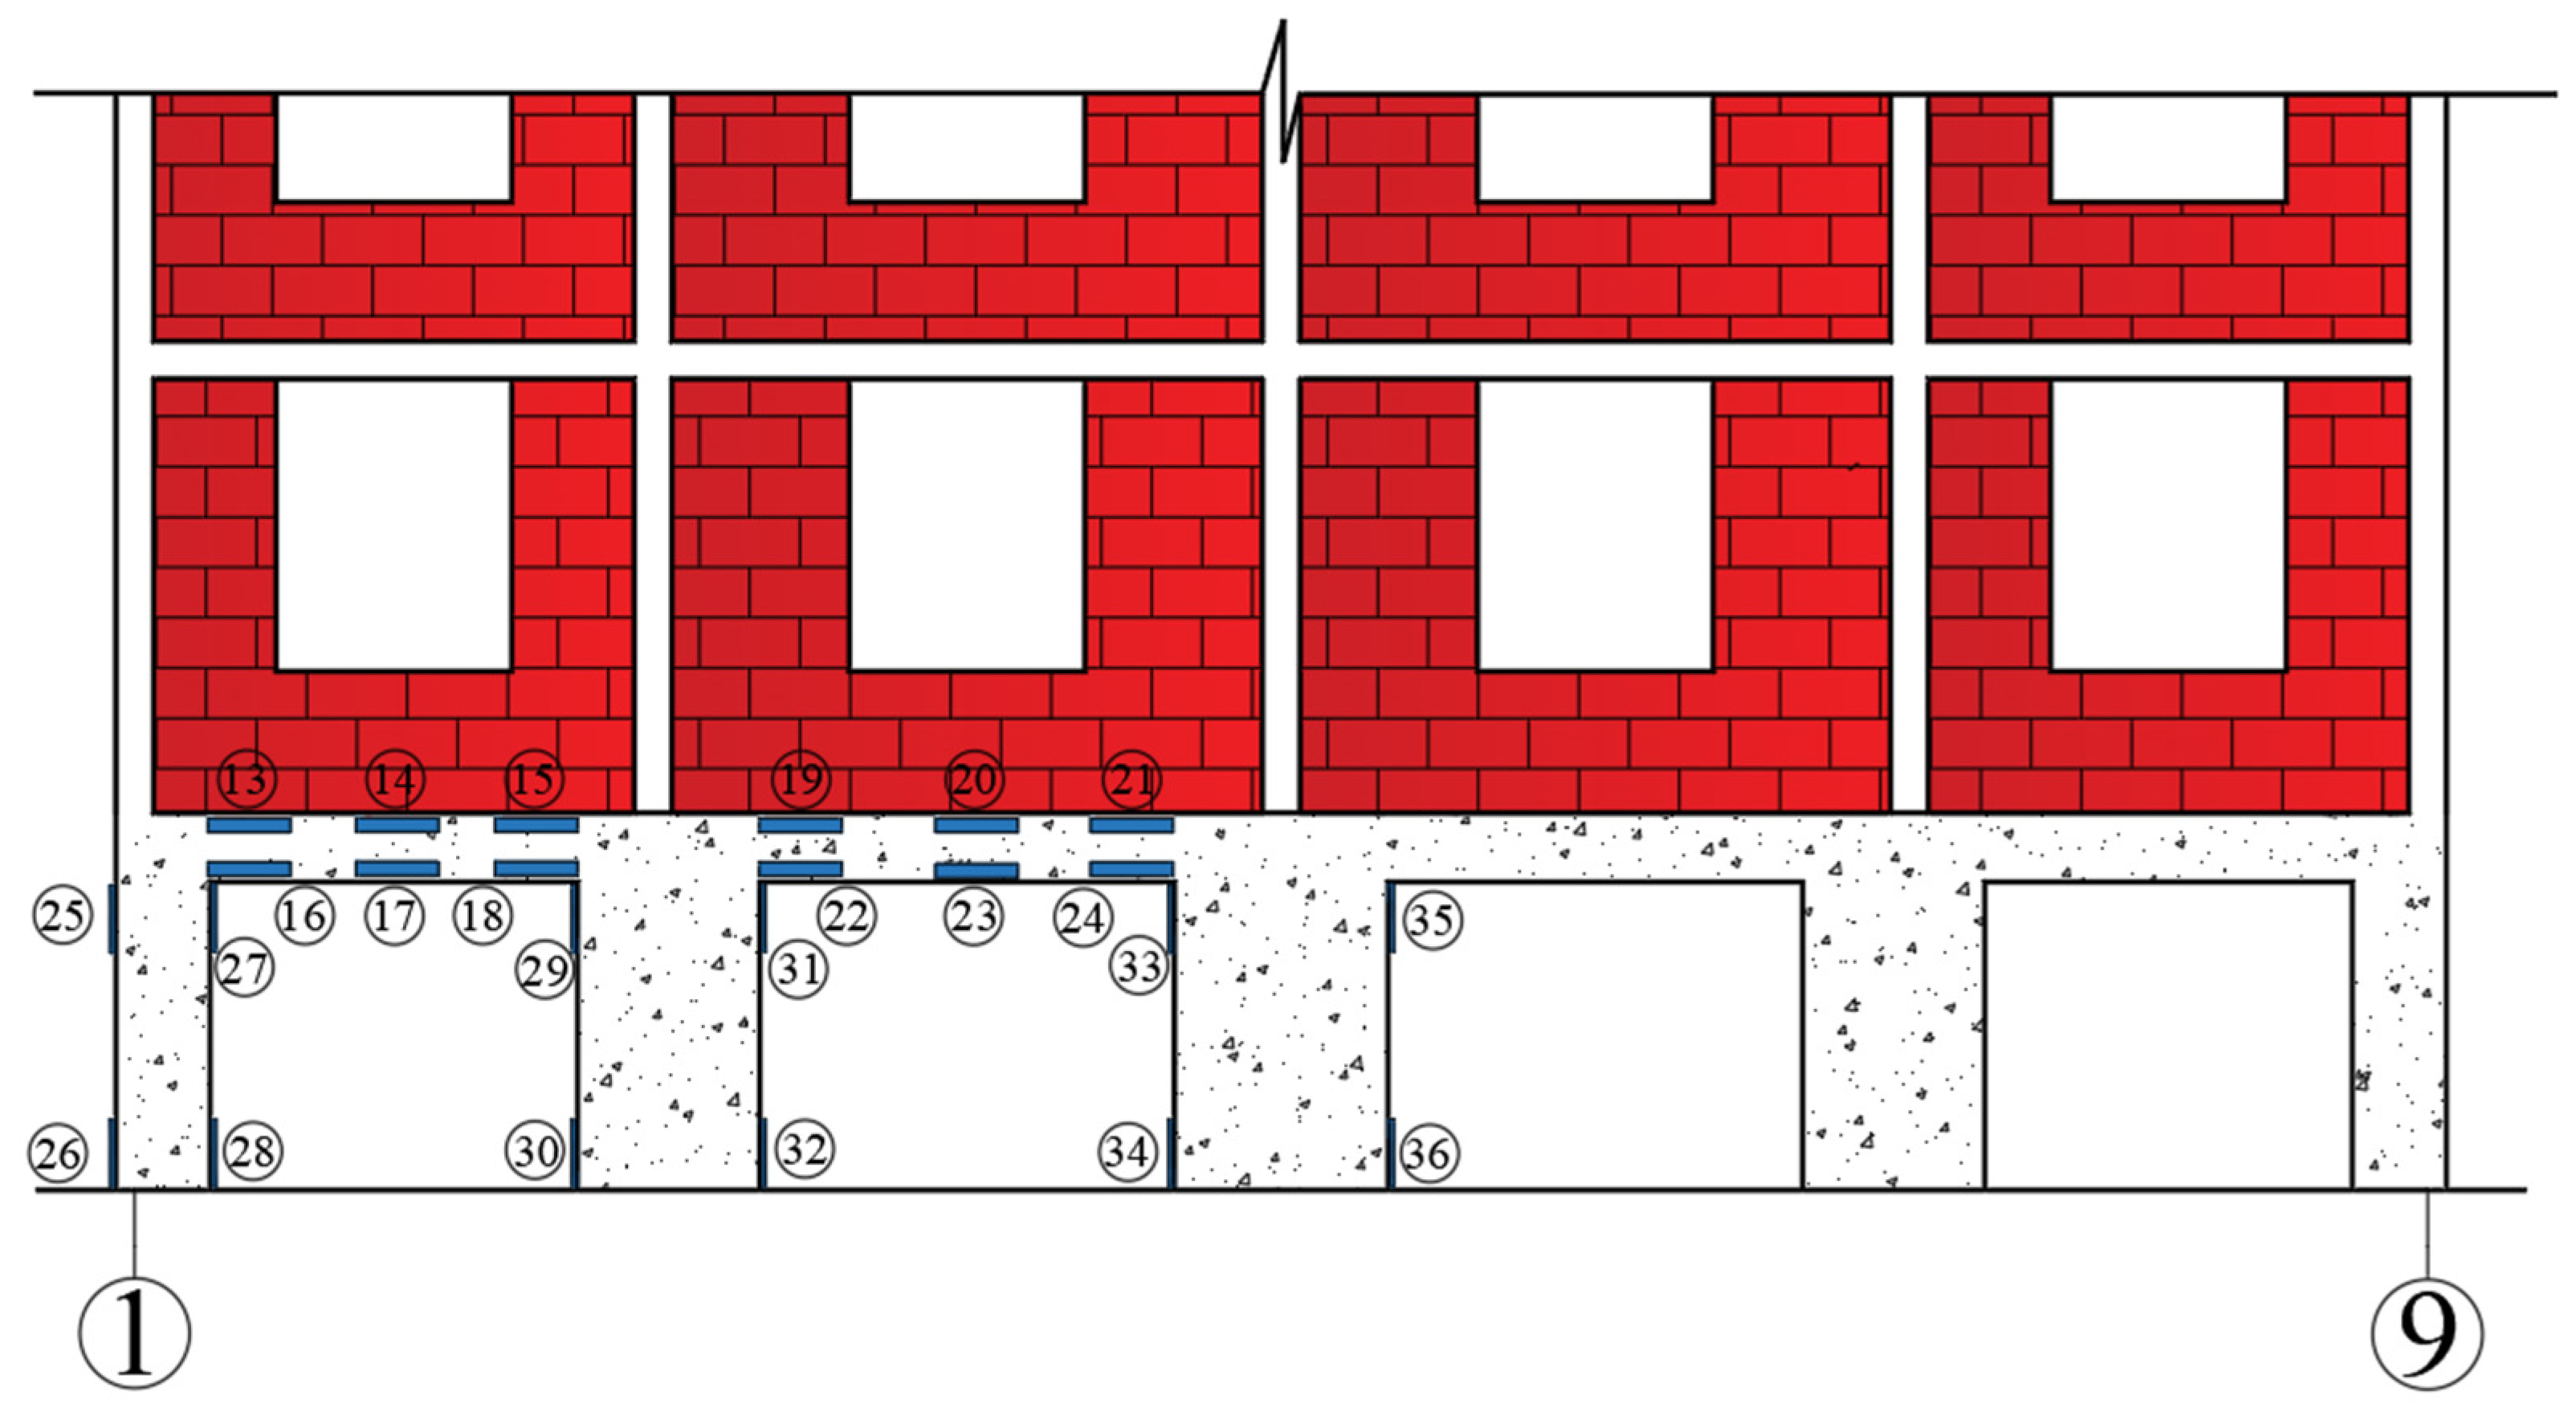
Seven displacement transducers were installed on the west facade of the structural model (Figure 1a, 1-axis) to measure displacement changes during loading. The displacement measuring points at the facade of 1-axis are illustrated in Figure 6a. A total of 32 BX120-2AA (2 × 1) strain gauges were installed at the upper and lower ends of the reinforcing bars in the reinforced concrete walls Q1 to Q3 to measure the strain changes in the reinforcing bars of each reinforced concrete wall during the loading process. The strain measuring points of the steel rebar in reinforced concrete walls are shown in Figure 6b–d. It is evident that the strain of the reinforcing bars inside walls Q4 and Q5 is antisymmetric to that of Q2 and Q1. Consequently, strain gauges are no longer installed on these two components. The measuring point arrangement of the strain on the reinforced concrete walls and frame beams along A-axis is illustrated in Figure 7.

3. Experimental Phenomena

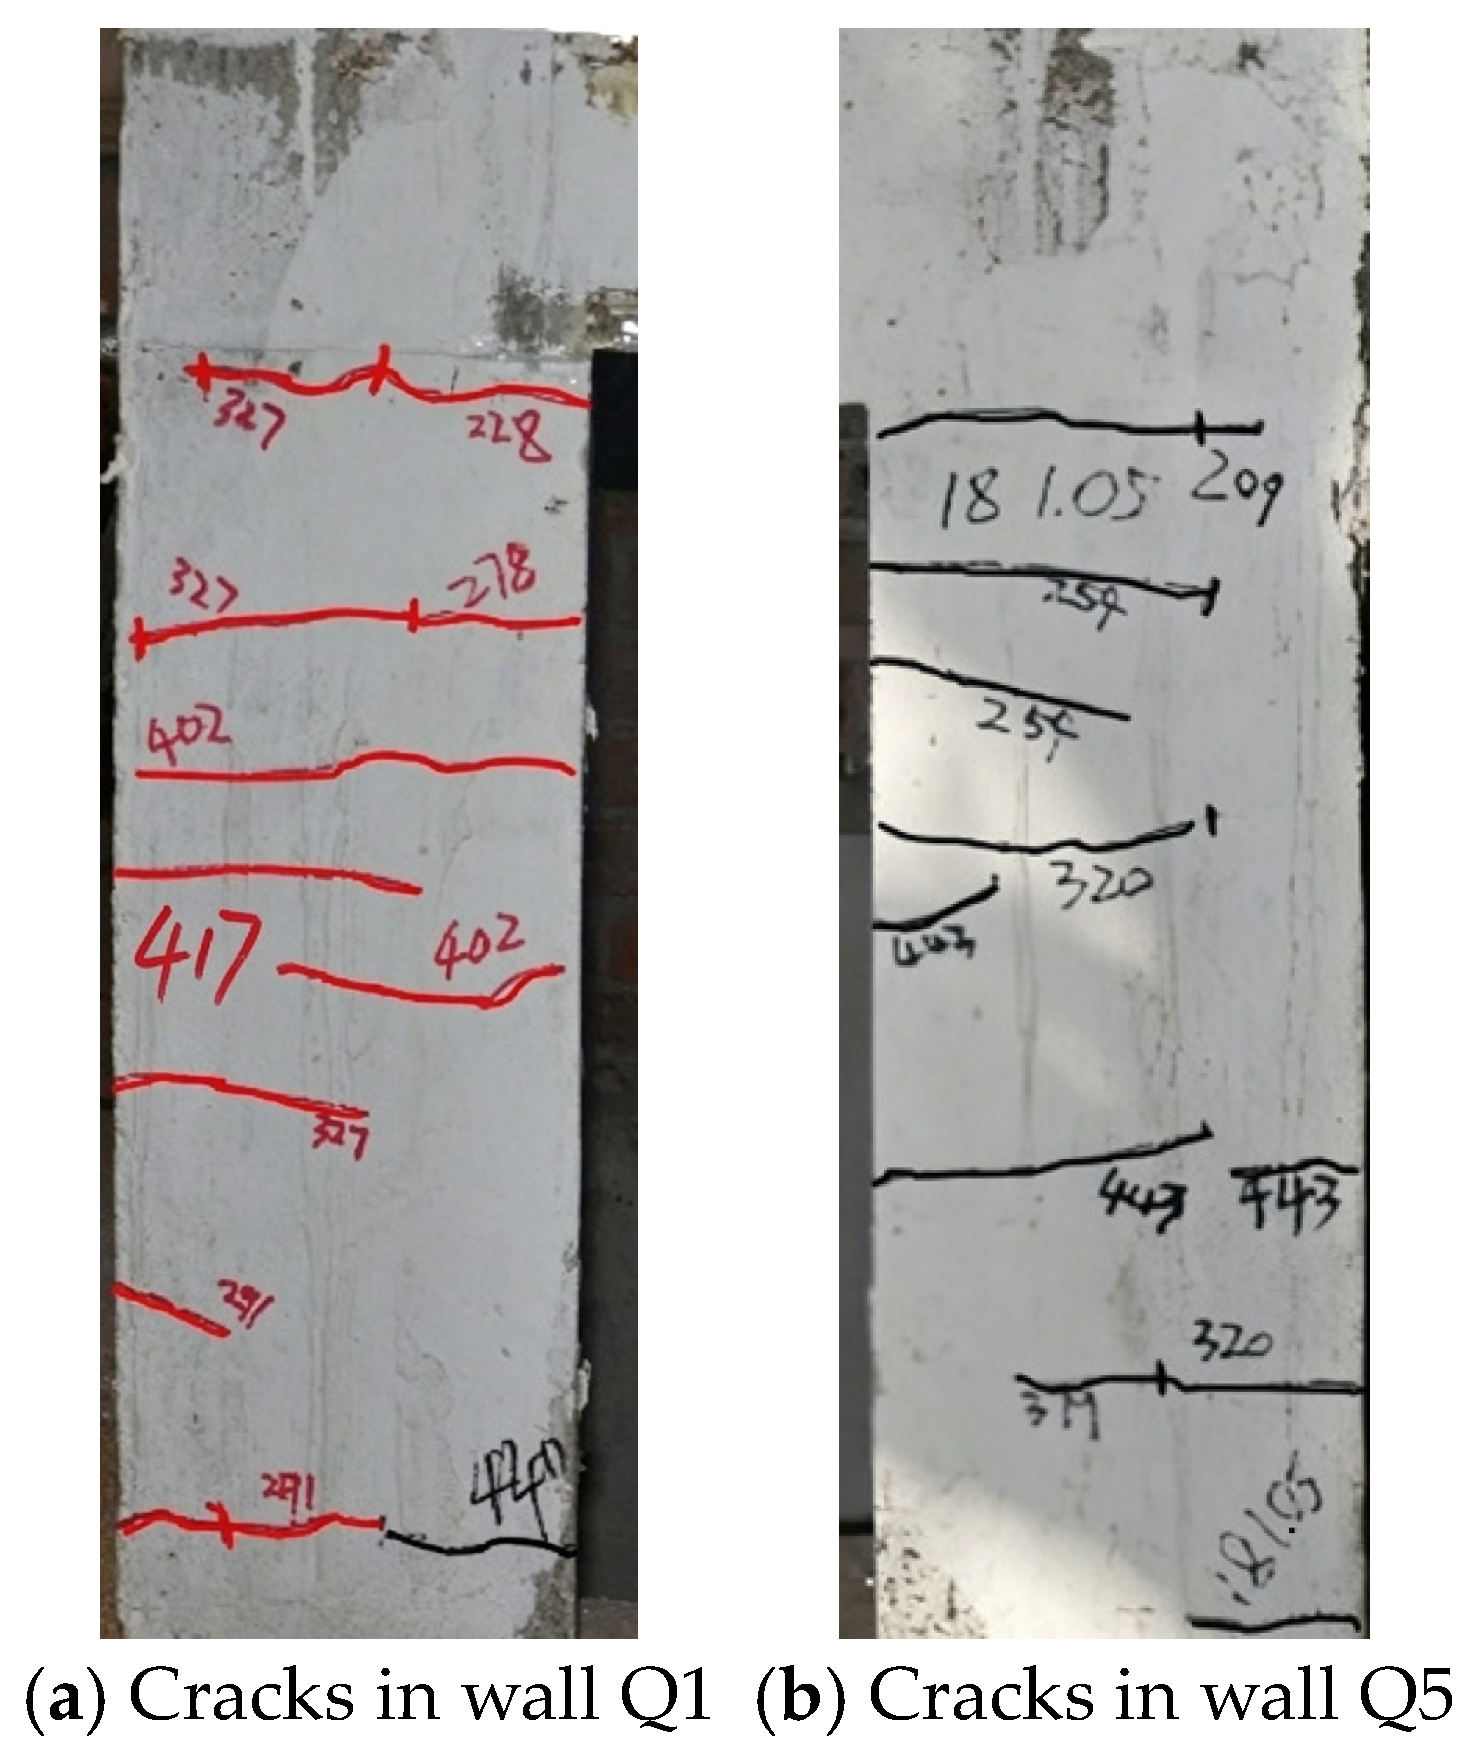
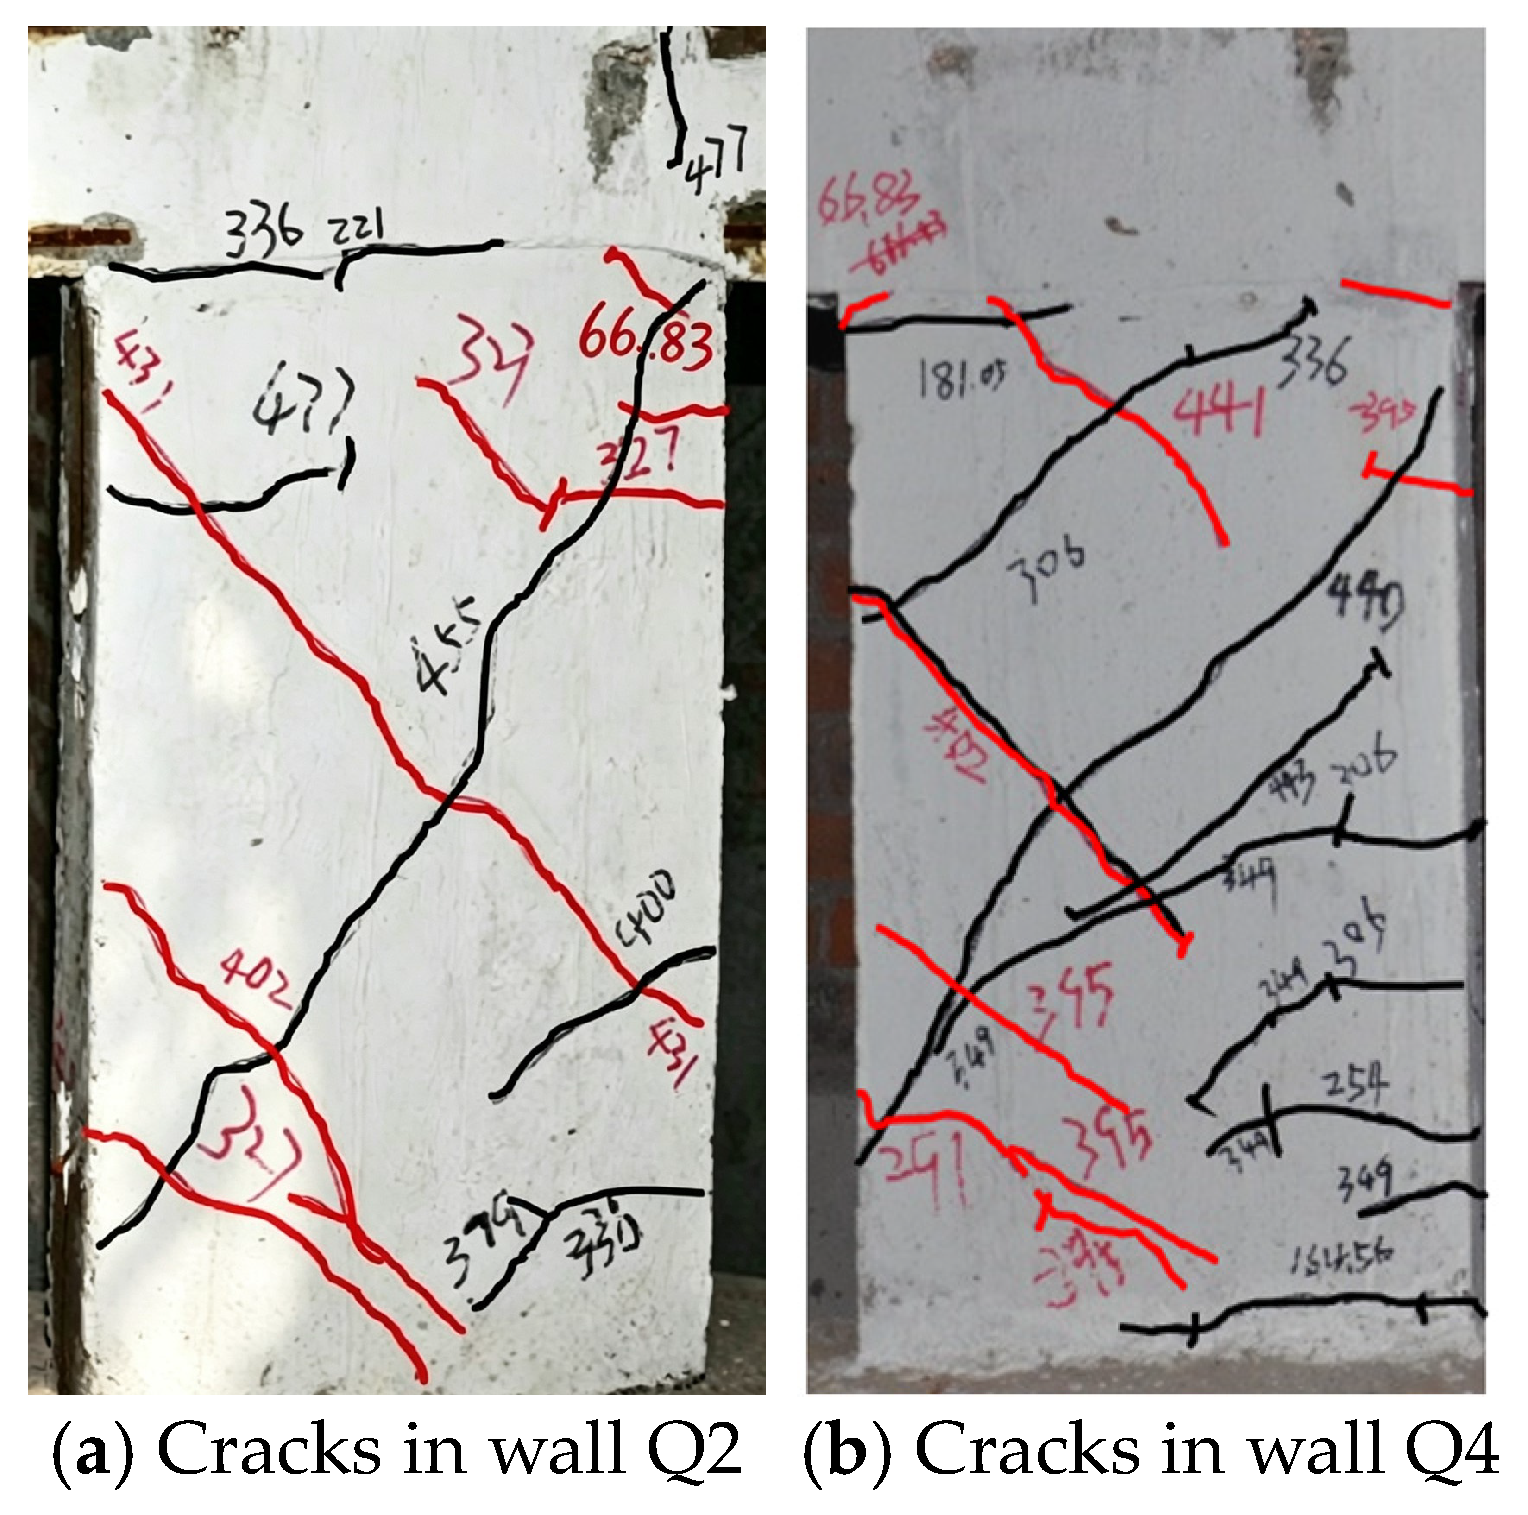
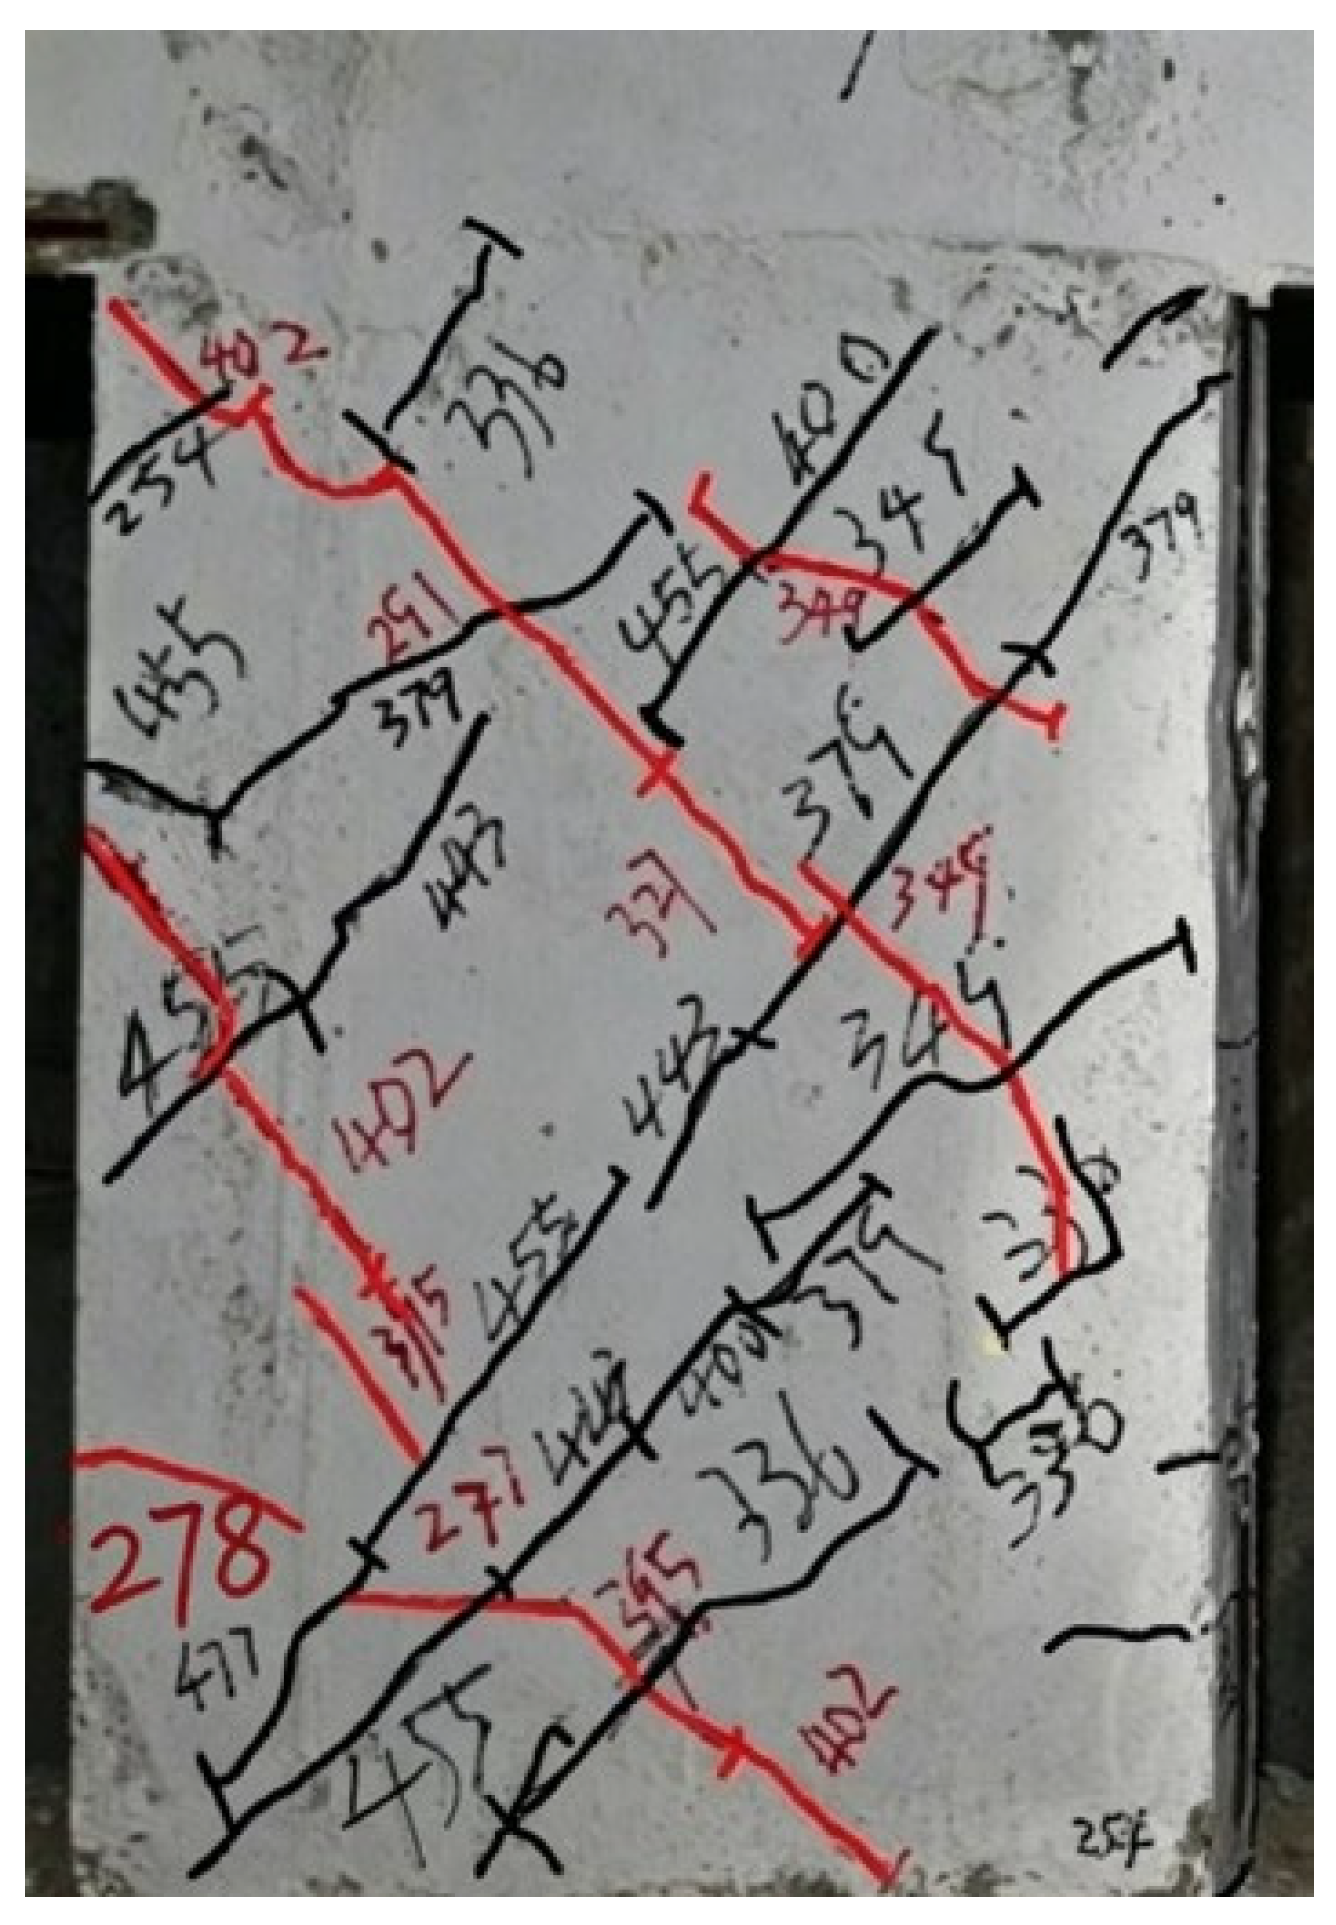
In order to facilitate the analysis, the following set of rules has been established for the test data and phenomena: When a thrust is applied to the test piece, the load and displacement are defined as positive values, and cracks in the structural components are marked with black symbols. When a tensile force is applied to the test piece, the load and displacement are defined as negative values, and cracks in the structural components are marked with red symbols. Furthermore, the cracking load value of the test piece is annotated in conjunction with the observed cracks.

3.1. Reinforced Concrete Walls

3.1.1. Walls Q1 and Q5

The walls Q1 and Q5 are situated at the left and right extremities of the structural model, respectively. The fissures on both walls manifest a horizontal distribution, exhibiting analogous propagation processes. When loaded to −3.2 mm and −5.2 mm, the upper right corner and lower left corner of the Q1 wall crack, respectively. As displacement increases, the number of horizontal cracks on the wall continues to grow. When loaded to 4.4 mm and 8.0 mm, horizontal cracks caused by thrust appear at the lower right corner of the wall Q1; all cracks on the wall Q5 are caused by thrust. At loads of 2.0 mm, the upper left and lower right corners of the wall Q5 crack, and as displacement increases, cracks gradually appear in the middle of the wall. The cracking patterns on the surface of walls Q1 and Q5 are shown in Figure 8.

3.1.2. Walls Q2 and Q4

The walls Q2 and Q4 are arranged symmetrically in the structural model. During the test, the crack patterns on these walls exhibited antisymmetric characteristics. When loaded to −3.2 mm, a crack caused by tensile force appeared in the lower left corner of the wall Q2. When loaded to 5.2 mm, a crack caused by compressive force appeared in the upper left corner of the wall Q2. At 0.8 mm, a horizontal crack appeared between the lower right corner of the wall Q4 and the ground beam. Simultaneously, the upper left corner of the wall Q4 cracked as well. At a load of 1.8 mm, the crack at the lower right corner of the wall Q4 extended. At 2.0 mm, a new horizontal crack appeared at the upper left corner of the wall Q4, extending further. At 3.2 mm, a new horizontal crack appeared at the lower right corner and gradually tilted downward at a 40° angle from the horizontal. At a load displacement of −5.4 mm, a downward-tilting crack appeared in the lower left part of the wall at an angle of 30°. At ultimate failure, the main diagonal crack forms an angle of approximately 50° with the horizontal line. As displacement continues to increase, new cracks appear on both walls, gradually shifting from horizontal to inclined and extending toward the center of the wall. When loaded to ± 7.2 mm, the cracking rate accelerates, and main cracks form at a 45° angle intersecting across the wall surface. These cracks exceed 10 mm in width. The final crack diagram revealed that the distributions of cracks caused by tensile and compressive forces were different. Under repeated compressive forces, Q4 first experienced bending moments, resulting in horizontal cracks at the two corners. Subsequent loading produces diagonal cracks. Under repeated tensile force, Q4 primarily develops cracks sloping from the upper left corner to the lower right corner at approximately a 45° angle to the horizontal line. The cracking patterns on the surface of walls Q2 and Q4 are shown in Figure 9.

3.1.3. Wall Q3

The wall Q3 is situated at the core of the structural model. Upon reaching a load of 3.4 mm, a horizontal crack emerges at the lower right corner of the wall surface. As the displacement continues to increase, the initial crack ceases to develop, and new cracks originate from the center of the wall surface and extend toward both ends. As observed in walls Q2 and Q4, upon reaching a load of 7.2 mm, the crack propagation rate accelerates, forming numerous push-pull diagonal cracks on the wall surface. These cracks are distributed in a crisscross pattern, with crack widths exceeding 10 mm. The cracking pattern on the surface of wall Q3 is illustrated in Figure 10.
During the test, the process of cracking in the five reinforced concrete walls was divided into two stages. In the initial loading stage, all walls were in the elastic stage. As the loading process persisted, fissures emerged in the walls, progressing sequentially through the elastic–plastic phase. Similarly, under the horizontal reciprocating loads, cracks initially manifest at the corners of each reinforced concrete wall where stress is concentrated. This observation indicates that the structural model provides adequate restraint at the upper and lower extremities of each wall. Due to variations in their locations, the morphology and distribution of cracks on the surfaces of reinforced concrete walls also vary. The walls Q1 and Q5 are situated at the extremities of the structural model. The majority of cracks observed on wall Q1 were attributed to tensile forces, with only a limited number of cracks resulting from compressive forces that emerged in the subsequent phases of the test. It has been determined that the presence of fissures in the Q5 wall was attributable to the application of compressive forces. The distribution of the horizontal cracks on both walls was found to be uniform along the vertical axis. The fissures that manifested on the Q2 and Q4 walls during the preliminary phases of the test were horizontal, occurring at the extremities and corners of the walls. This finding suggests that, in the initial phases of the test, the fissures in the Q2 and Q4 walls were initiated by the application of either compressive or tensile forces alone. As the loading process persisted, the cracks exhibited a propensity to tilt and extend toward the center of the wall. The observed crack development was found to be the result of the combined action of thrust and tensile forces. In the test’s subsequent phases, diagonal fractures with a cross-distribution pattern emerged in the test wall’s central region. Wall Q3 is situated in the medial aspect of the structural model, and the occurrence of diagonal fractures was observed earlier. The diagonal cracks resulting from thrust and tensile forces are distributed uniformly on the surface of the wall and possess opposing orientations. A distinguishing feature of this wall is its resistance to new crack formation as loading continues. In contrast to other walls, no new cracks appear at the ends of the wall. Instead, cracks originate from the middle and extend toward both ends. After the test, a thorough examination of the five reinforced concrete walls revealed the extent of the damage, which was subsequently categorized as follows: Q3 > Q2 = Q4 > Q1 = Q5. This finding suggests that the degree of damage to the reinforced concrete walls diminished in a gradual manner, in accordance with the sequence in which they entered a state of dual stress, which was induced by cyclic repeated loading.

3.2. Longitudinal Masonry Wall Along A-Axis

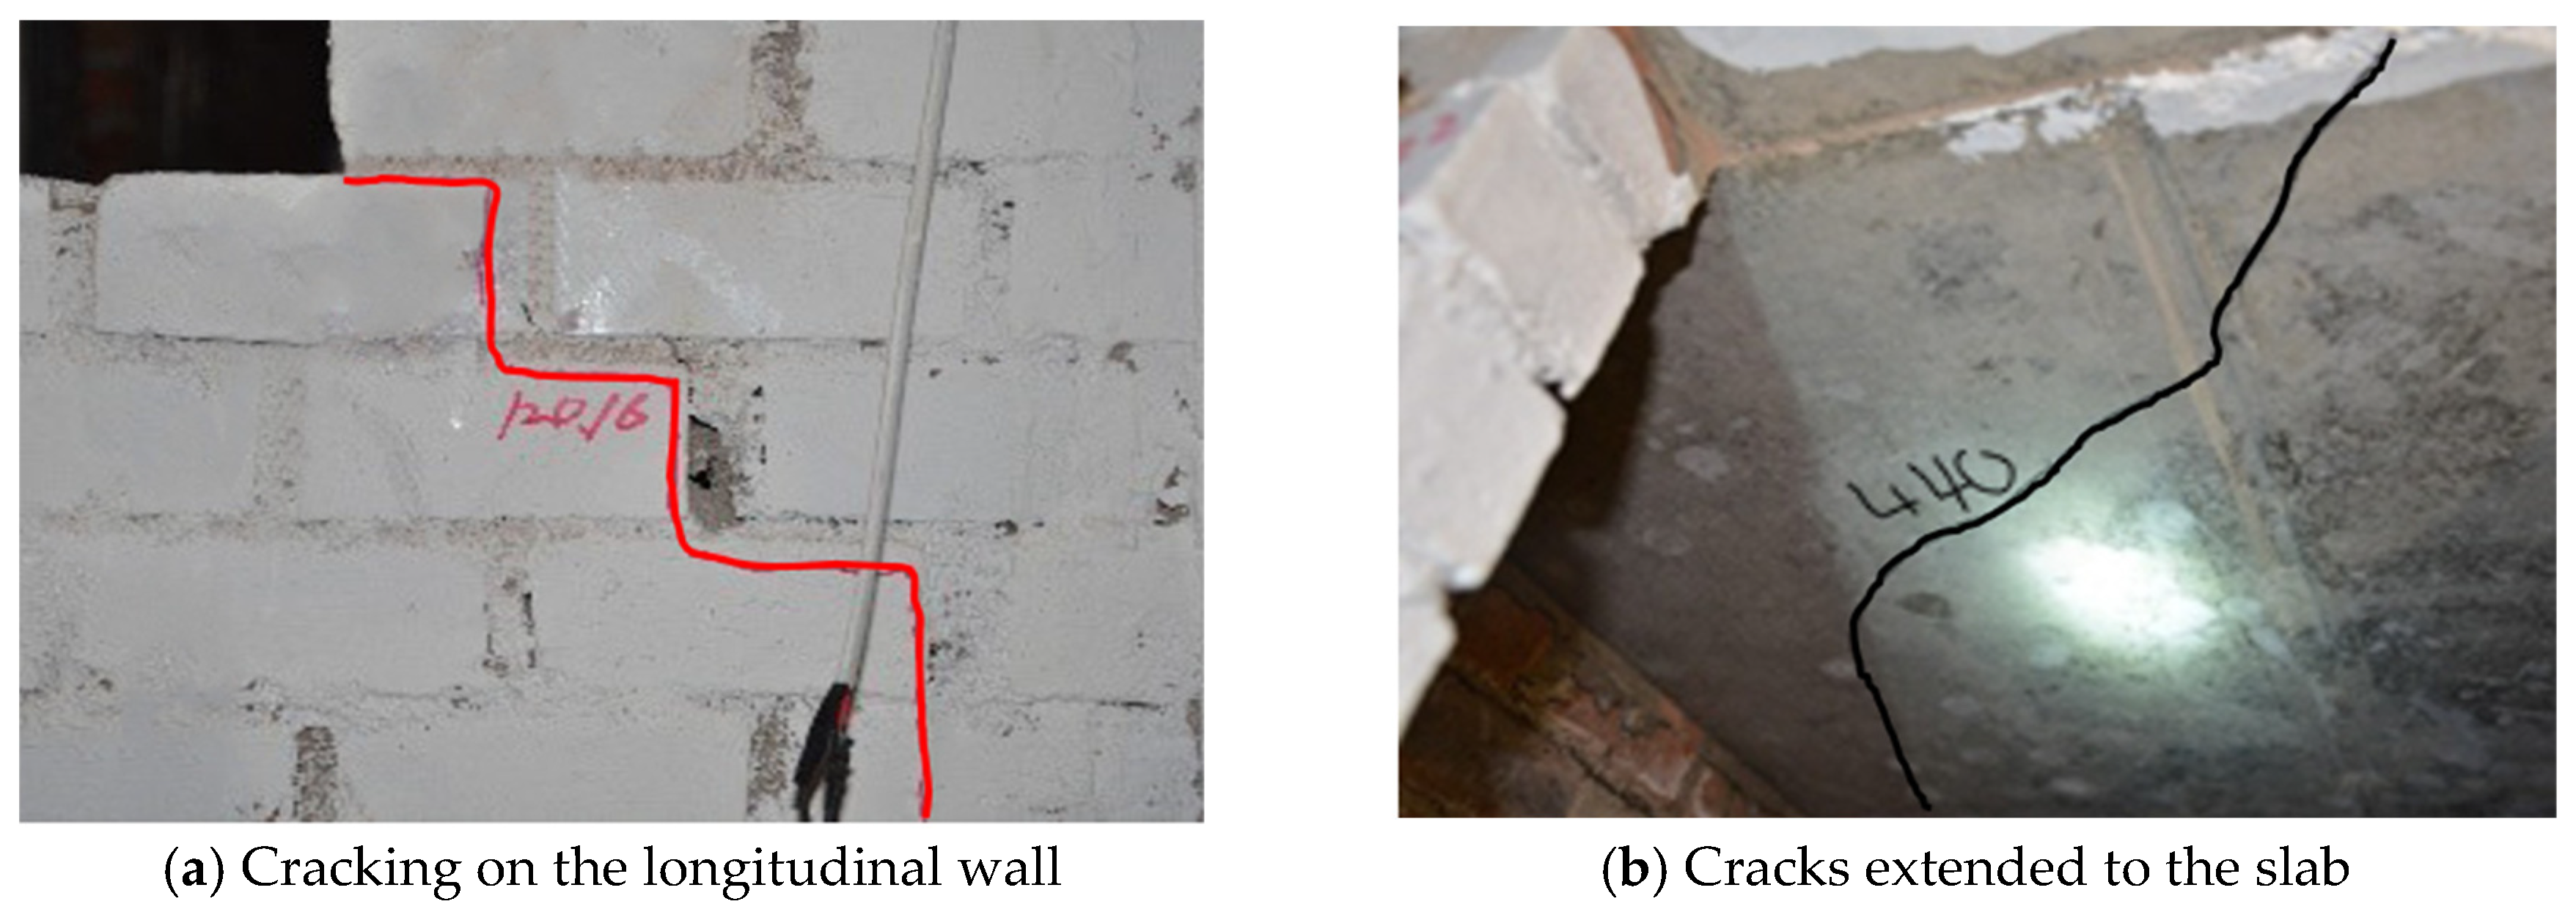
The cracking patterns of the longitudinal wall at the second floor along the A-axis are shown in Figure 11. Subsequent to the loading of −1.4 mm, step-like cracks began to emerge at the corners of each window along the mortar joints in the second-floor longitudinal wall of the A-axis, as illustrated in Figure 11a. Subsequent to loading to 8.0 mm, diagonal cracks became apparent in the window partition wall on the second floor, with a relatively rapid crack development rate. The cracks in the wall beneath the window were also gradually extended to the slab, as illustrated in Figure 11b. As displacement continued to increase while the load increased relatively slowly, the test was terminated at a displacement of 12 mm for safety reasons and to observe the structural damage after the test. At the conclusion of the test, the longitudinal wall surface exhibited severe damage, characterized by the formation of dense cracks. However, the wall and structural columns remained stable and did not collapse. The damage process of the entire wall surface lagged behind that of the reinforced concrete wall.

3.3. Longitudinal Masonry Wall Along D-Axis

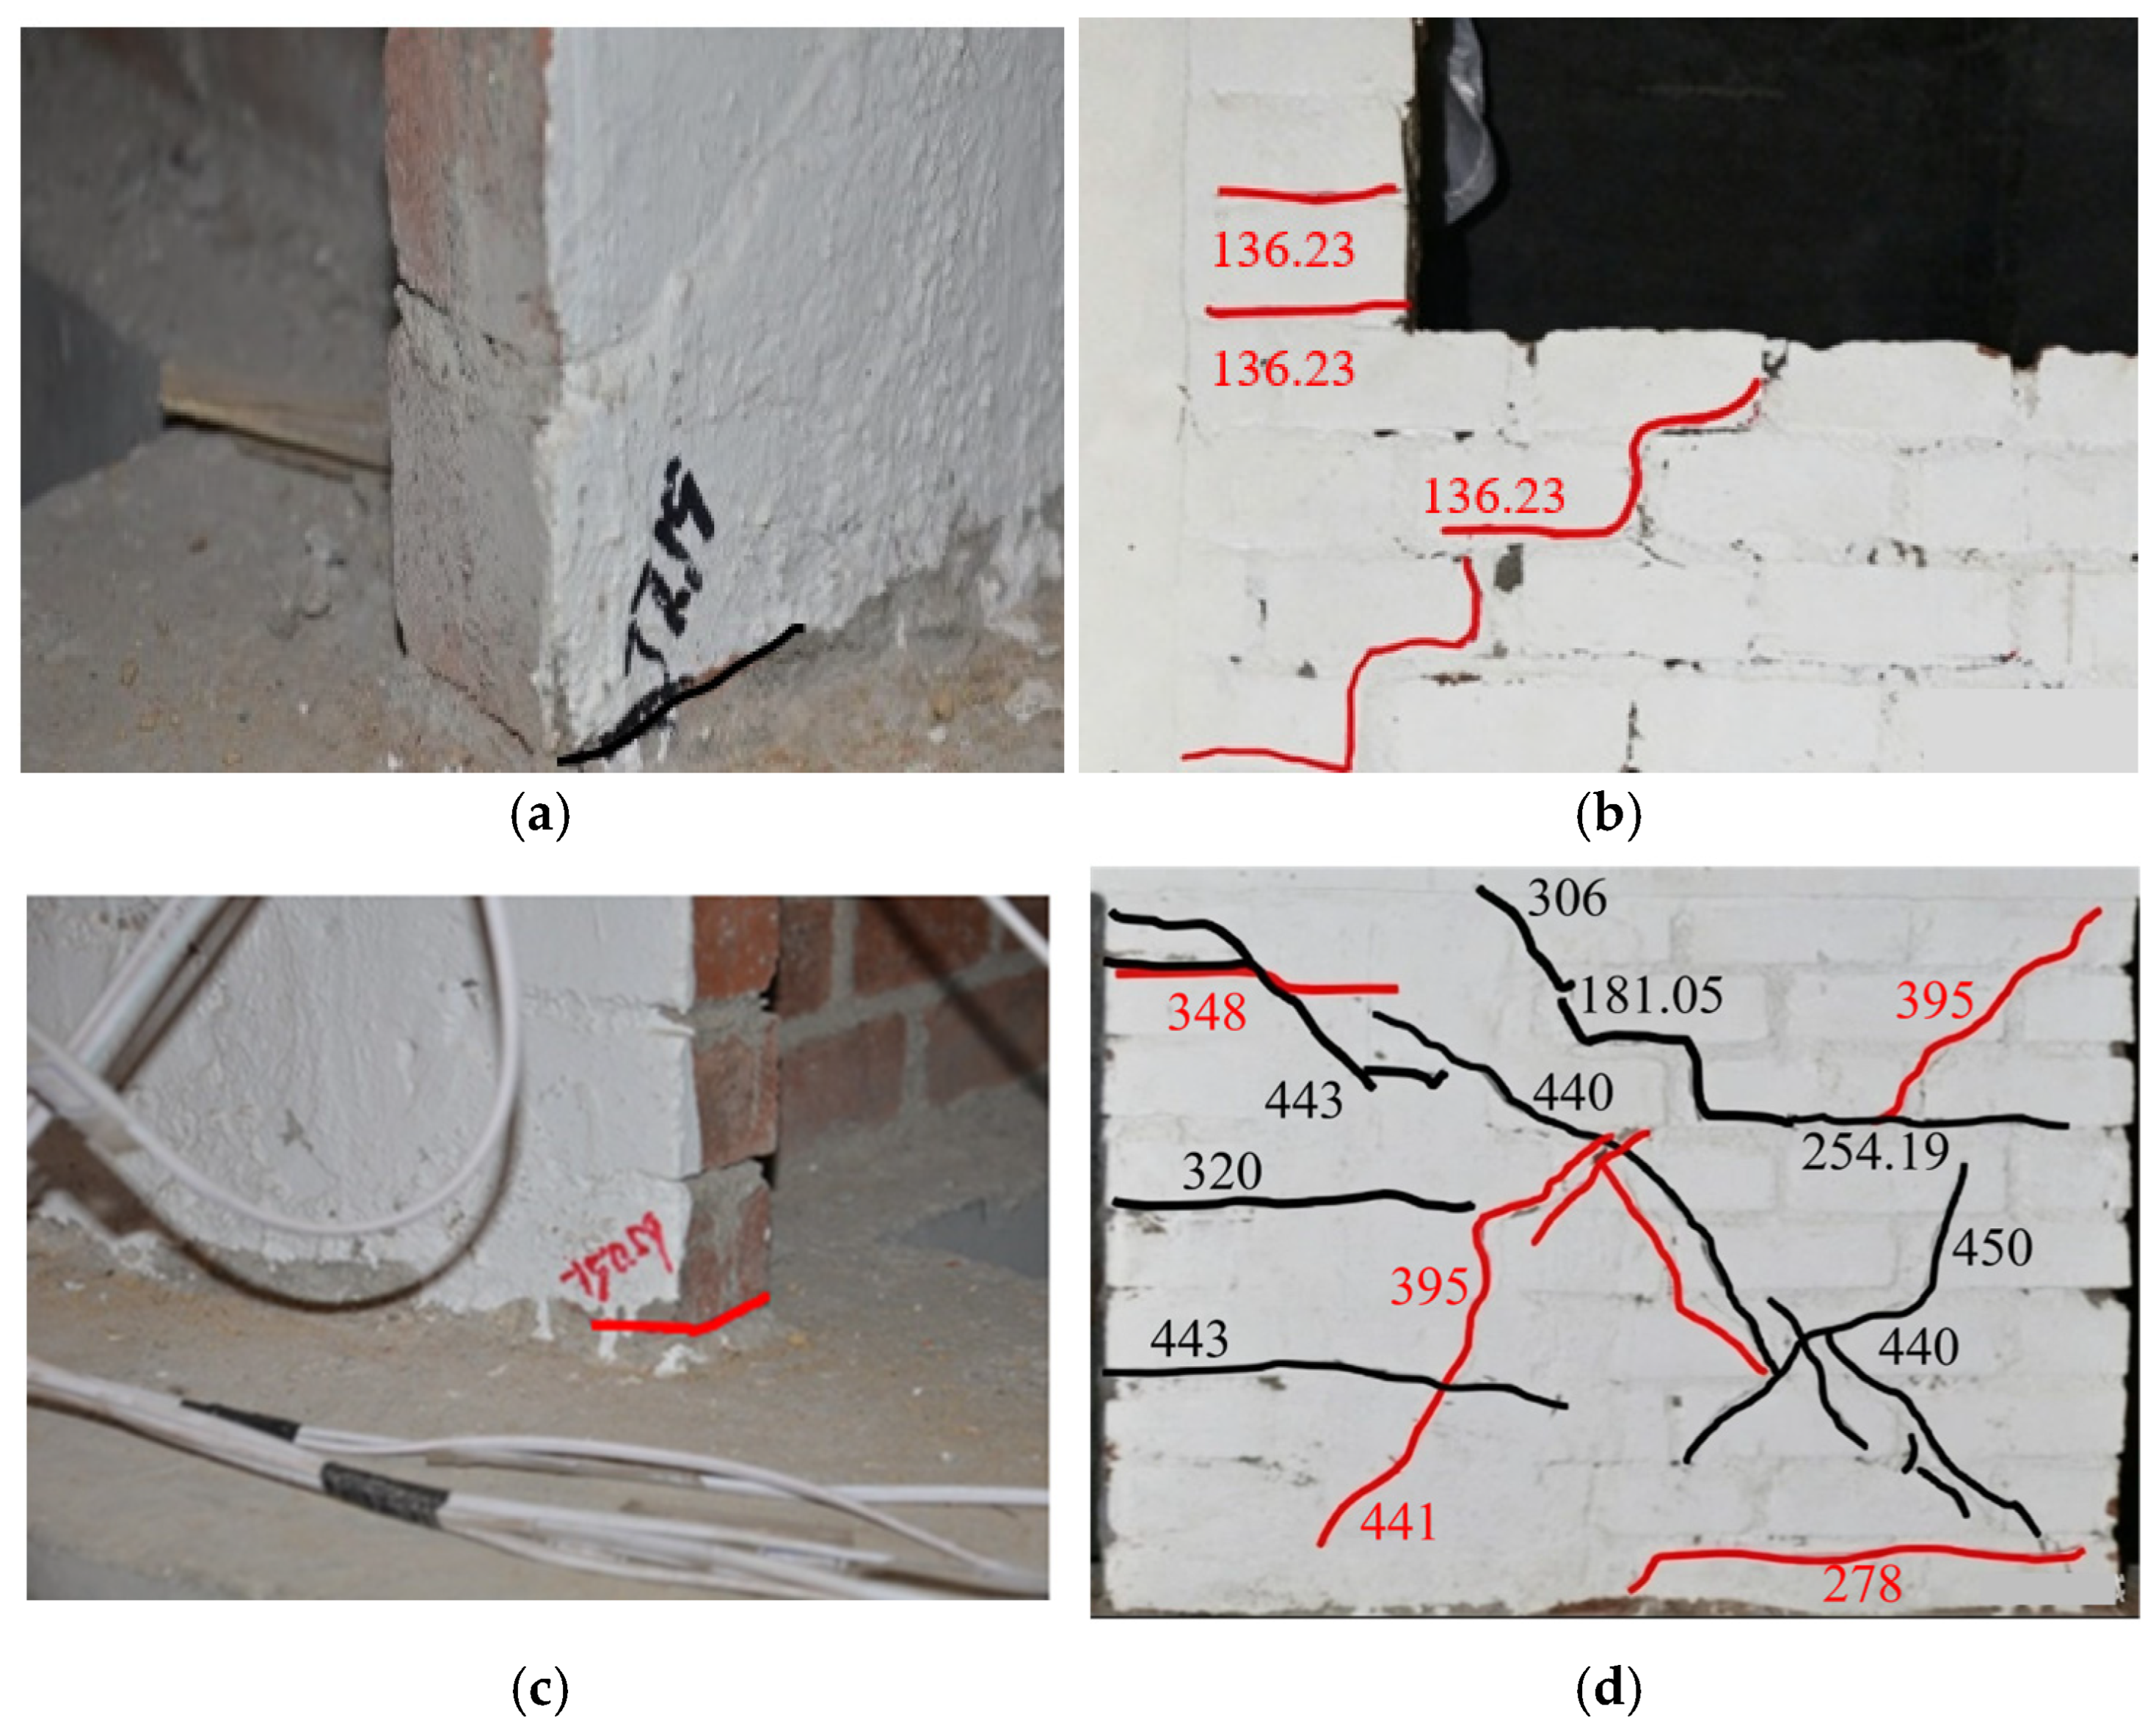
The cracking patterns of the longitudinal walls along the D-axis are shown in Figure 12. As demonstrated in Figure 12a, horizontal cracks became evident between the D-8 longitudinal wall and the ground beam at the bottom floor when the load reached 0.8 mm. Subsequent to this, fissures of a step-like nature became visible on the walls beneath each window. When loaded to 2.0 mm, the cracks in the ground-floor brick wall extended to the structural column, and further cracks appeared in both the brick wall and the structural column thereafter. As the displacement load attained −1.4 mm, the walls situated beneath the D-8-9 windows at the third floor exhibited step-like fractures, which extended through to the floor slab. Horizontal cracks were also observed along the mortar joints at the lower left corner of the window, as illustrated in Figure 12b. At this juncture, horizontal cracks had formed between the lower right corner of the D-2 longitudinal wall at the bottom floor and the foundation beam, as illustrated in Figure 12c. Subsequent to the displacement reaching 8.0 mm, diagonal cracks in the D-8 longitudinal wall at the bottom floor were distributed in a crisscross pattern, as illustrated in Figure 12d. Following the conclusion of the test, it was observed that a number of diagonal cracks had been detected in the brick walls located on the ground and second floor. These cracks had penetrated the structural columns.
The process of cracking in the brick walls on the ground floor along the D-axis appears to be largely synchronized with that of the reinforced concrete walls. However, in contrast to the reinforced concrete walls, the cracks in the brick walls exhibit both horizontal and inclined forms, and their distribution shows no obvious pattern. The cracking process of the longitudinal walls on the standard floors of the A-axis lags behind that of the reinforced concrete walls on the ground floor, but precedes that of the longitudinal walls on the standard floors of the D-axis. A comparison of the second and third floors reveals that the walls, structural columns, and floor slabs on the second floor exhibit cracking at an earlier stage. Following the experiment, the structural model exhibited the densest cracking on the second floor, with cracks penetrating the walls and structural columns being more numerous than on other floors.

3.4. Transverse Wall and Inner Longitudinal Wall

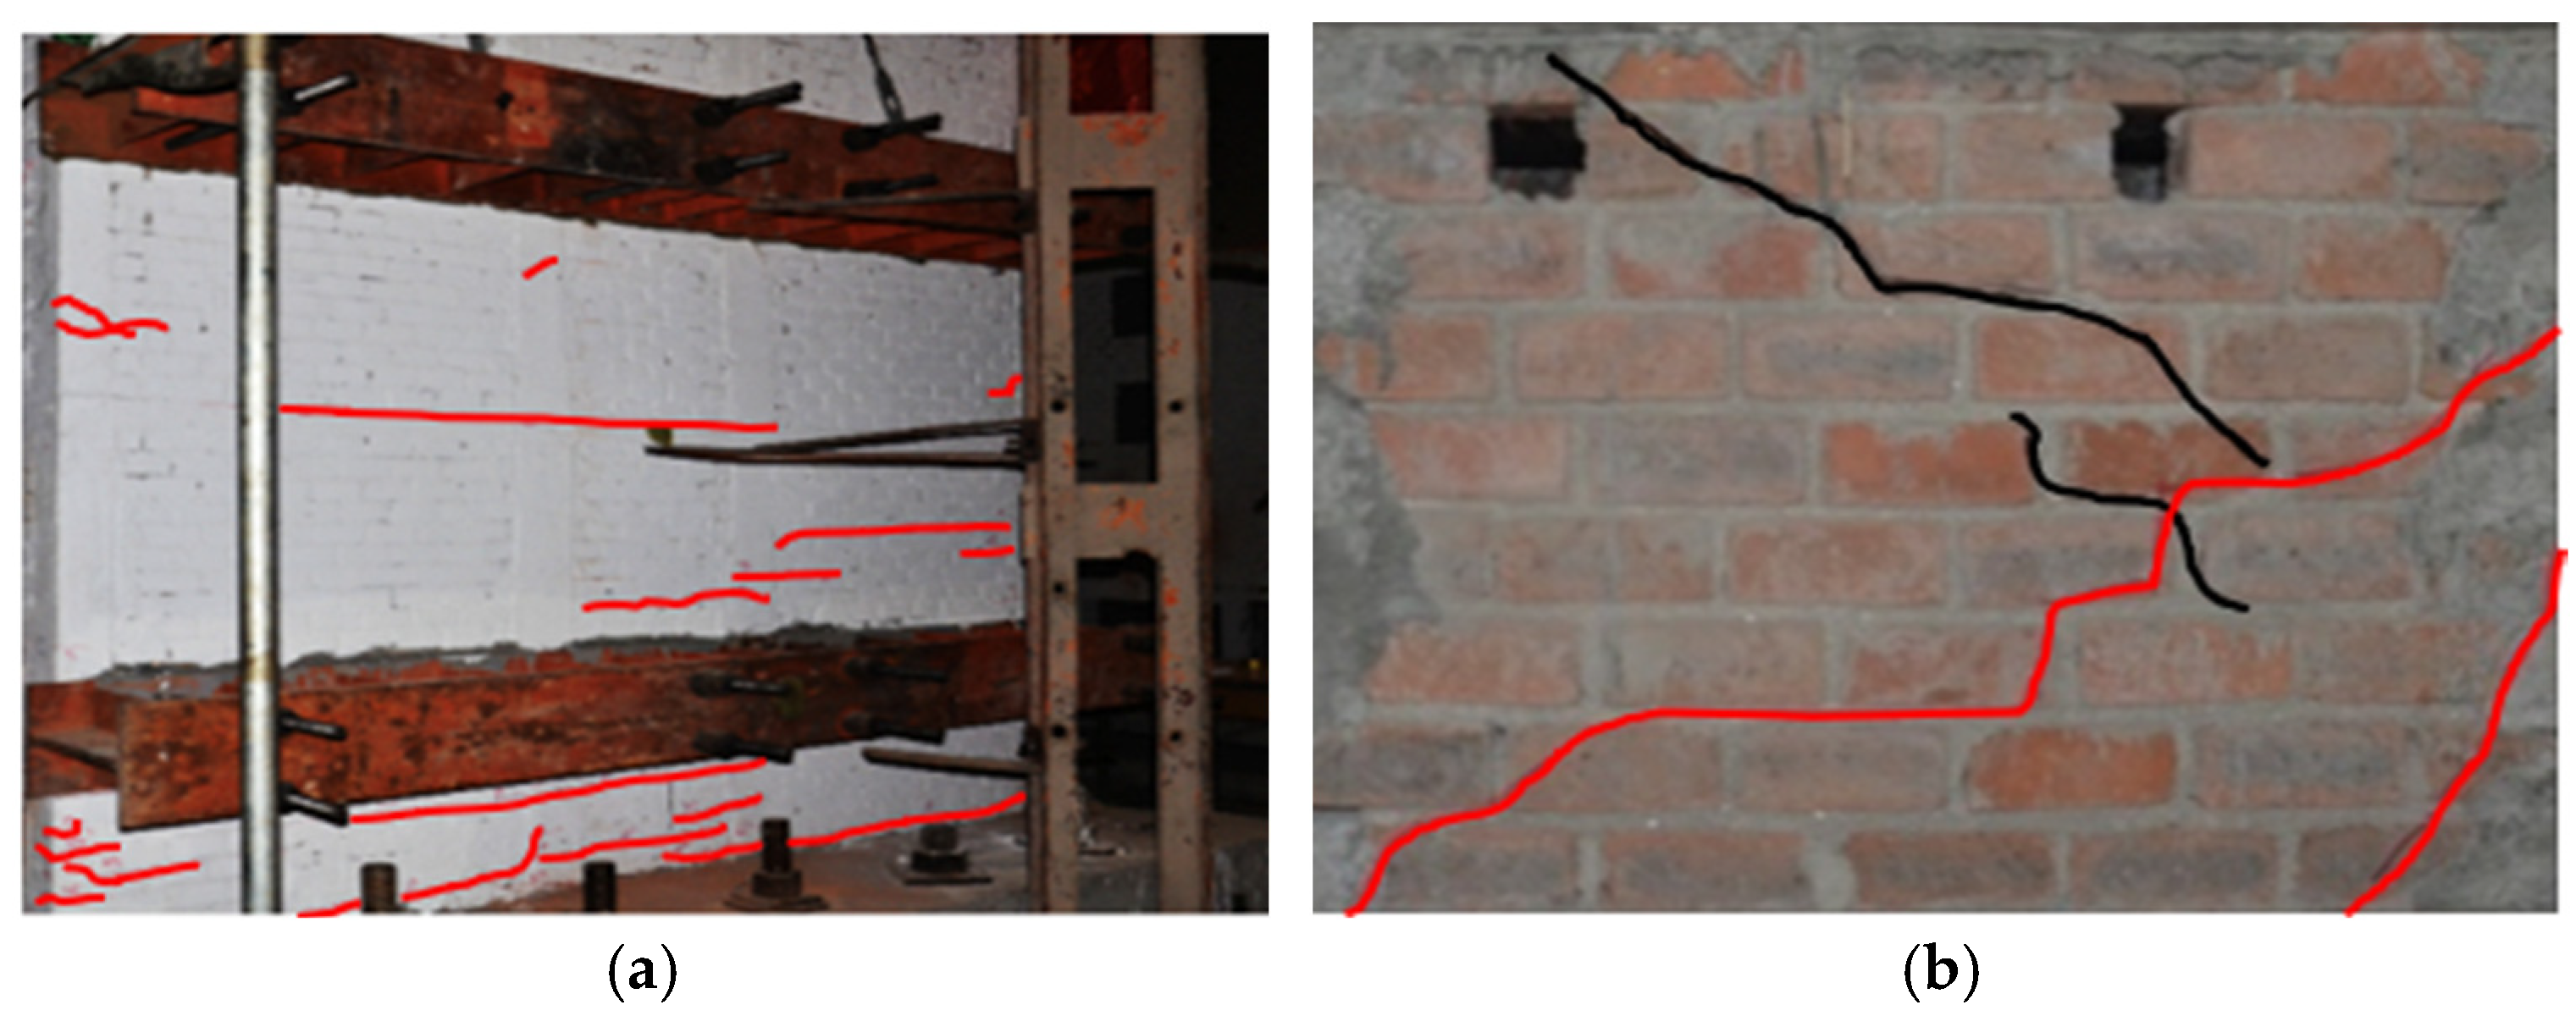
The development of cracks was observed in the transverse walls on both sides of the structural model after the application of loads in the range of ± 3.4 mm. The observed cracks were all of a tensile nature and horizontal orientation, with the hypothesis being that they were caused by normal stress during the process of pushing and pulling. At the conclusion of the test, the damage to the transverse walls on both sides was most severe at ground floor level, exhibiting dense through cracks, while the damage to the second and third floors was comparatively minor, exhibiting sparser cracks. Due to the impracticality of observing the crack development of the inner longitudinal walls during the test, an inspection of these walls was conducted post-test. A survey of the structure revealed that the majority of cracks were located on the ground and second floors, forming a staircase pattern. It was evident that fissures had already manifested on the ground floor, extending to the ground beam. This was primarily due to the fact that the walls on these two floors were located on both sides, and the force application points of the horizontal beams were not on the floor slabs but on the walls of the upper and lower floors. The forces from the horizontal beam tie rods were first transmitted to these two longitudinal walls. In the initial phase of load application, the forces exerted on the two walls comprise two components: firstly, a force allocated to the walls based on the stiffness of the ground floor; and secondly, a force from the horizontal beam tie rods. Consequently, cracking occurs at an earlier stage in these areas. The damage sustained by the transverse and interior longitudinal walls is not severe, with the damage to the transverse walls occurring subsequent to that inflicted upon the reinforced concrete walls. The cracking patterns on the surface of the transverse wall and interior longitudinal wall are illustrated in Figure 13.
It was observed that the cracking process and crack patterns exhibited by each component indicated that the reinforced concrete walls functioned in conjunction with other load-bearing components during the test, thereby facilitating effective load transfer within the structural model. The structural model did not undergo a sequence of component failures that would typically result in a collapse. The cracking process was continuous, and following the test, the cracks were found to be uniformly distributed. The structural model retained residual bearing capacity, and the entire structural model exhibited significant ductility characteristics.

4. Experimental Result Analysis

4.1. Displacement

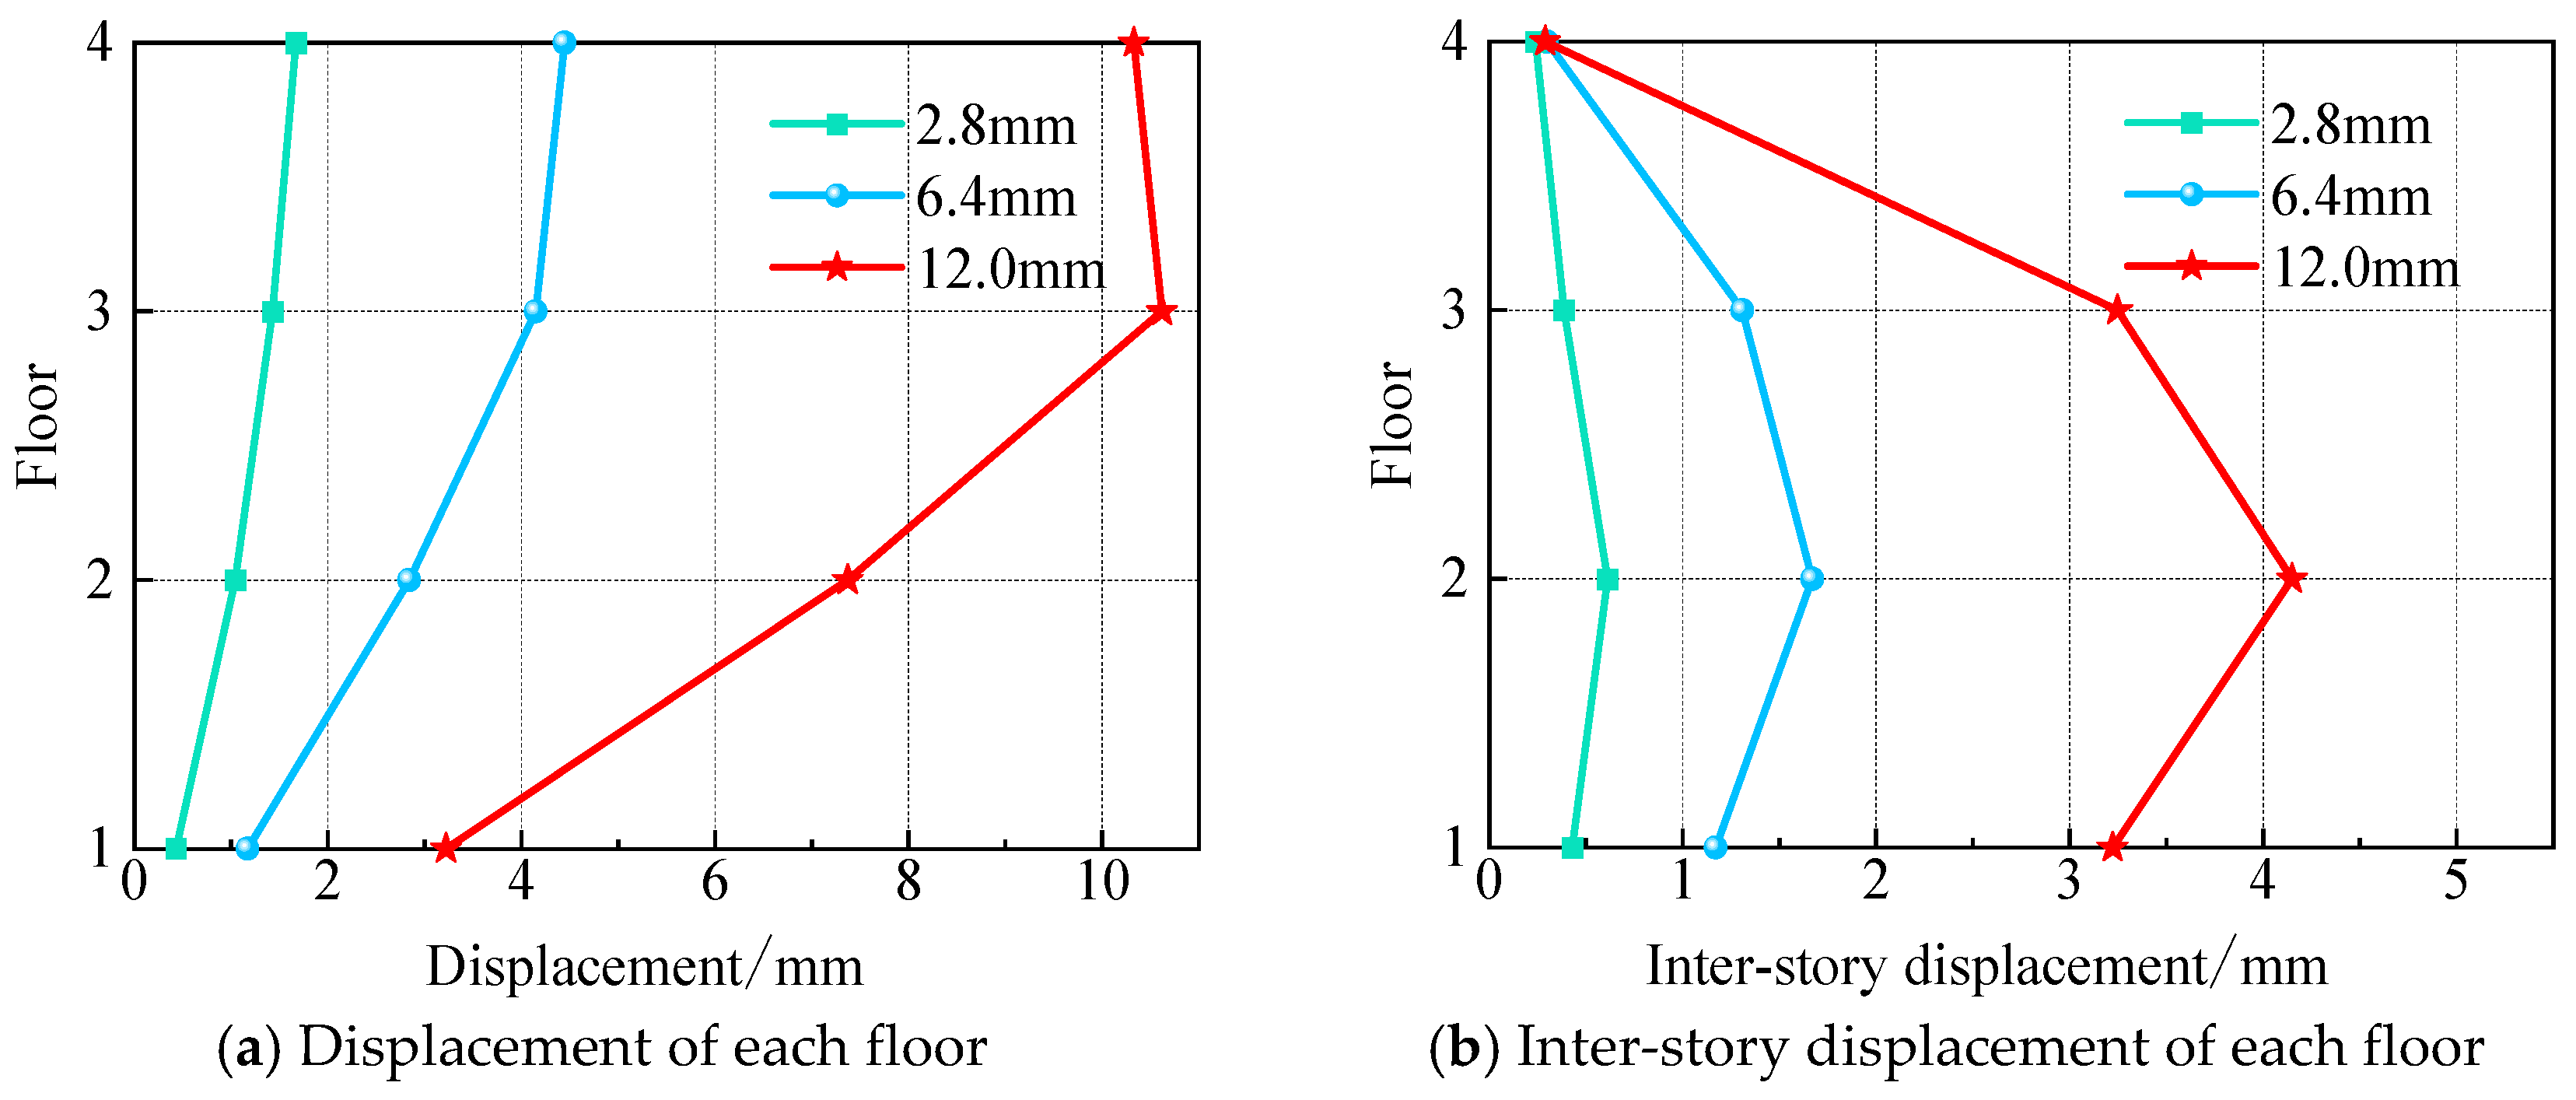
The seven displacement transducers and MTS horizontal actuators recorded the displacement data of the structural model throughout the entire test. The displacement control points selected for this study were 2.8 mm, 6.4 mm, and 12.0 mm, which were designated as displacement feature points. The displacement of each layer, in addition to the inter-story displacement at each displacement feature point under cyclic loading, was obtained. The displacement and inter-story displacement at the control points of each floor is illustrated in Figure 14.
With regard to lateral displacement, during the initial phase of the test, the displacement loads applied by the MTS horizontal actuator to the structural model were comparatively minimal. The displacements of each floor exhibited a linear distribution, with all floor displacements being less than 1.9 mm and inter-story displacements being less than 0.7 mm. At this stage, the structural model exhibited a certain degree of rigidity and demonstrated considerable resistance to deformation. However, as the displacement load increased further, the nonlinear characteristics of the displacement at each floor gradually became evident. The displacement changes in the upper structure were significantly greater than those in the lower floors. This phenomenon can be attributed to two factors. Firstly, the lower floors have a larger number of longitudinal walls, resulting in higher inherent stiffness. Secondly, although the lower floors are damaged before or simultaneously with the upper structure, under the same degree of damage, the weakening of reinforced concrete walls is less than that of brick walls. Following the conclusion of the test, it was evident that full-scale cracks had developed on all floors. The subsequent decline in stiffness significantly compromised the capacity to resist deformation, resulting in substantial variations in inter-story displacements among the floors. It was evident that the second floor underwent the most significant displacement alterations during the course of the entire experiment. A comparison of the cracking conditions of each floor revealed that the dense cracks present in the second floor resulted in a significant degradation of its stiffness.
In the context of seismic design, the Code for Seismic Design of Buildings (GB50011—2010) [40] stipulates that, under specified horizontal forces, a floor is deemed to be torsional irregular if its maximum elastic horizontal displacement (or inter-story displacement) exceeds 1.2 times the average value of the elastic horizontal displacement (or inter-story displacement) at both ends of the structure. Define the value of displacement meter 2 as δ 1 and the value of displacement meter 3 as δ 2 . δ MAX is the larger of δ 1 and δ 2 . According to the above specifications, torsional irregularities can be disregarded for this structural model if 2 δ MAX / δ 1 + δ 2 1.2 . Select the displacement control points for the torsion irregularity assessment. The calculation results, shown in Table 3, indicate that the assessment criteria are met at all displacement control points. In fact, during the elastic stage, the structure does not undergo torsion. However, as the displacement load continues to increase, varying degrees of damage to different components, coupled with uneven stiffness degradation, cause the stiffness center of the structure to shift, resulting in minor torsion. However, this torsion remains below the specified limit values (see Table 3), thus enabling the torsion effect to be neglected.

4.2. Strain

4.2.1. Strain of the Steel Rebar in Reinforced Concrete Walls

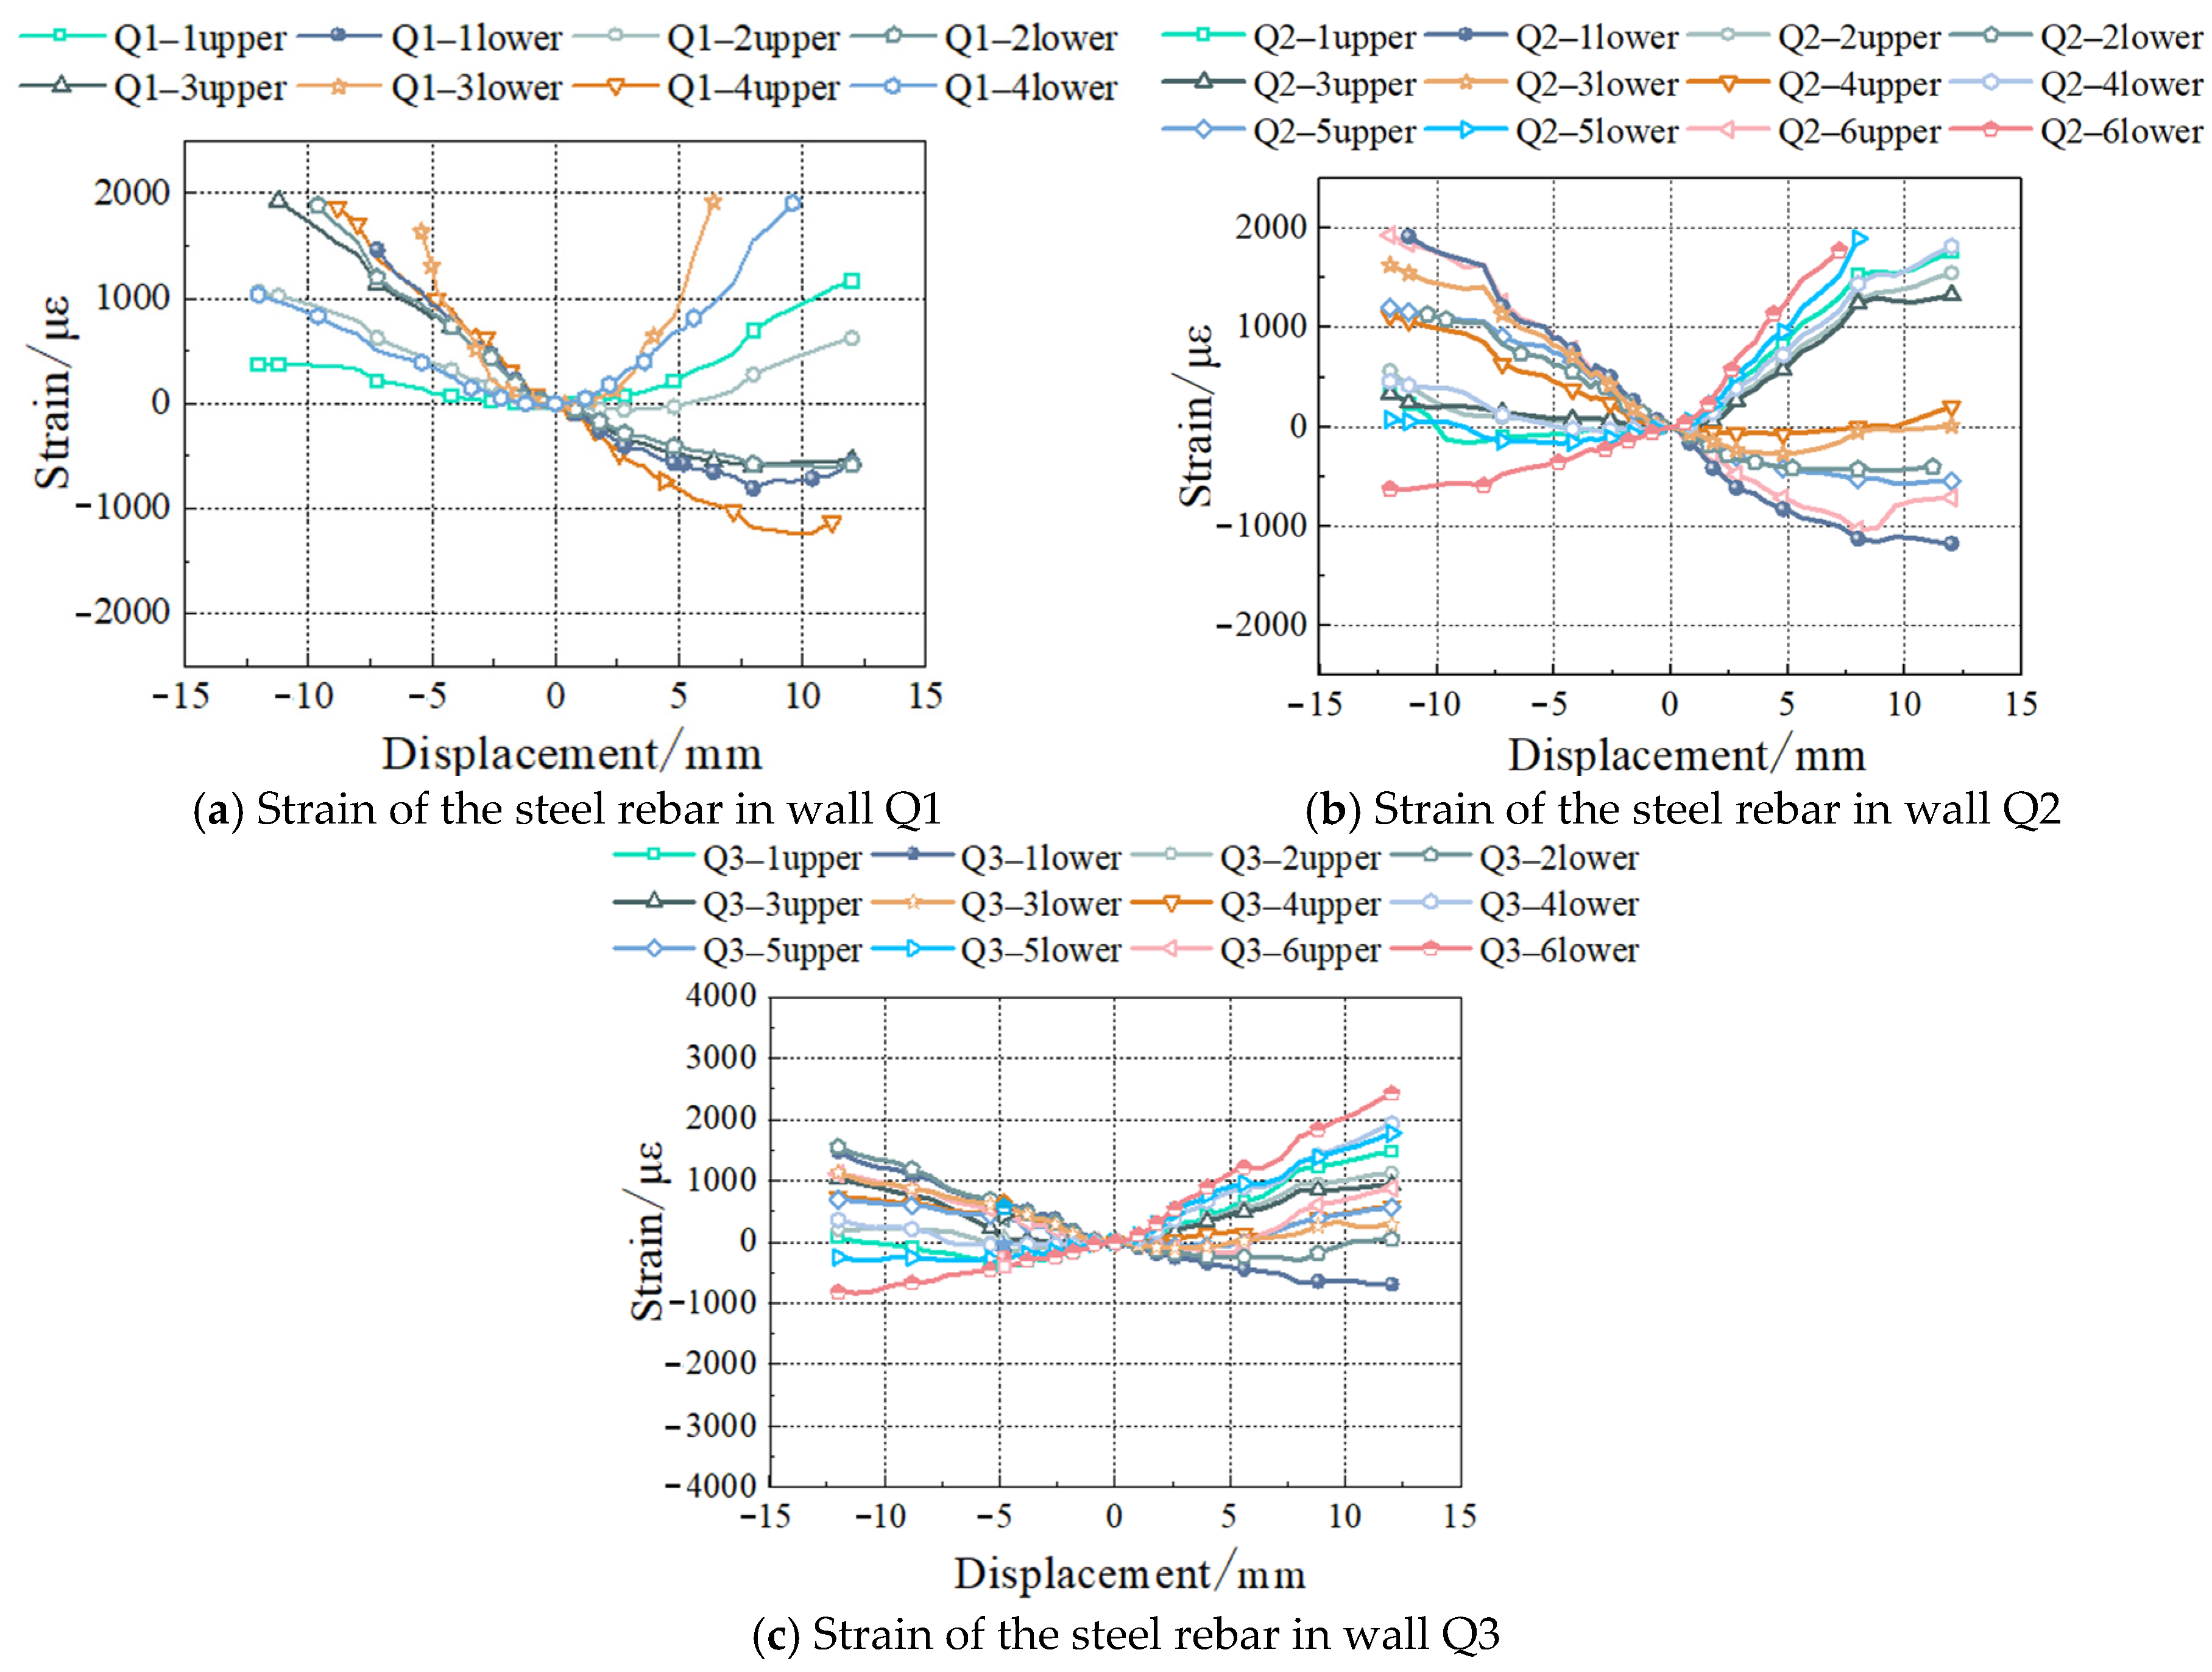
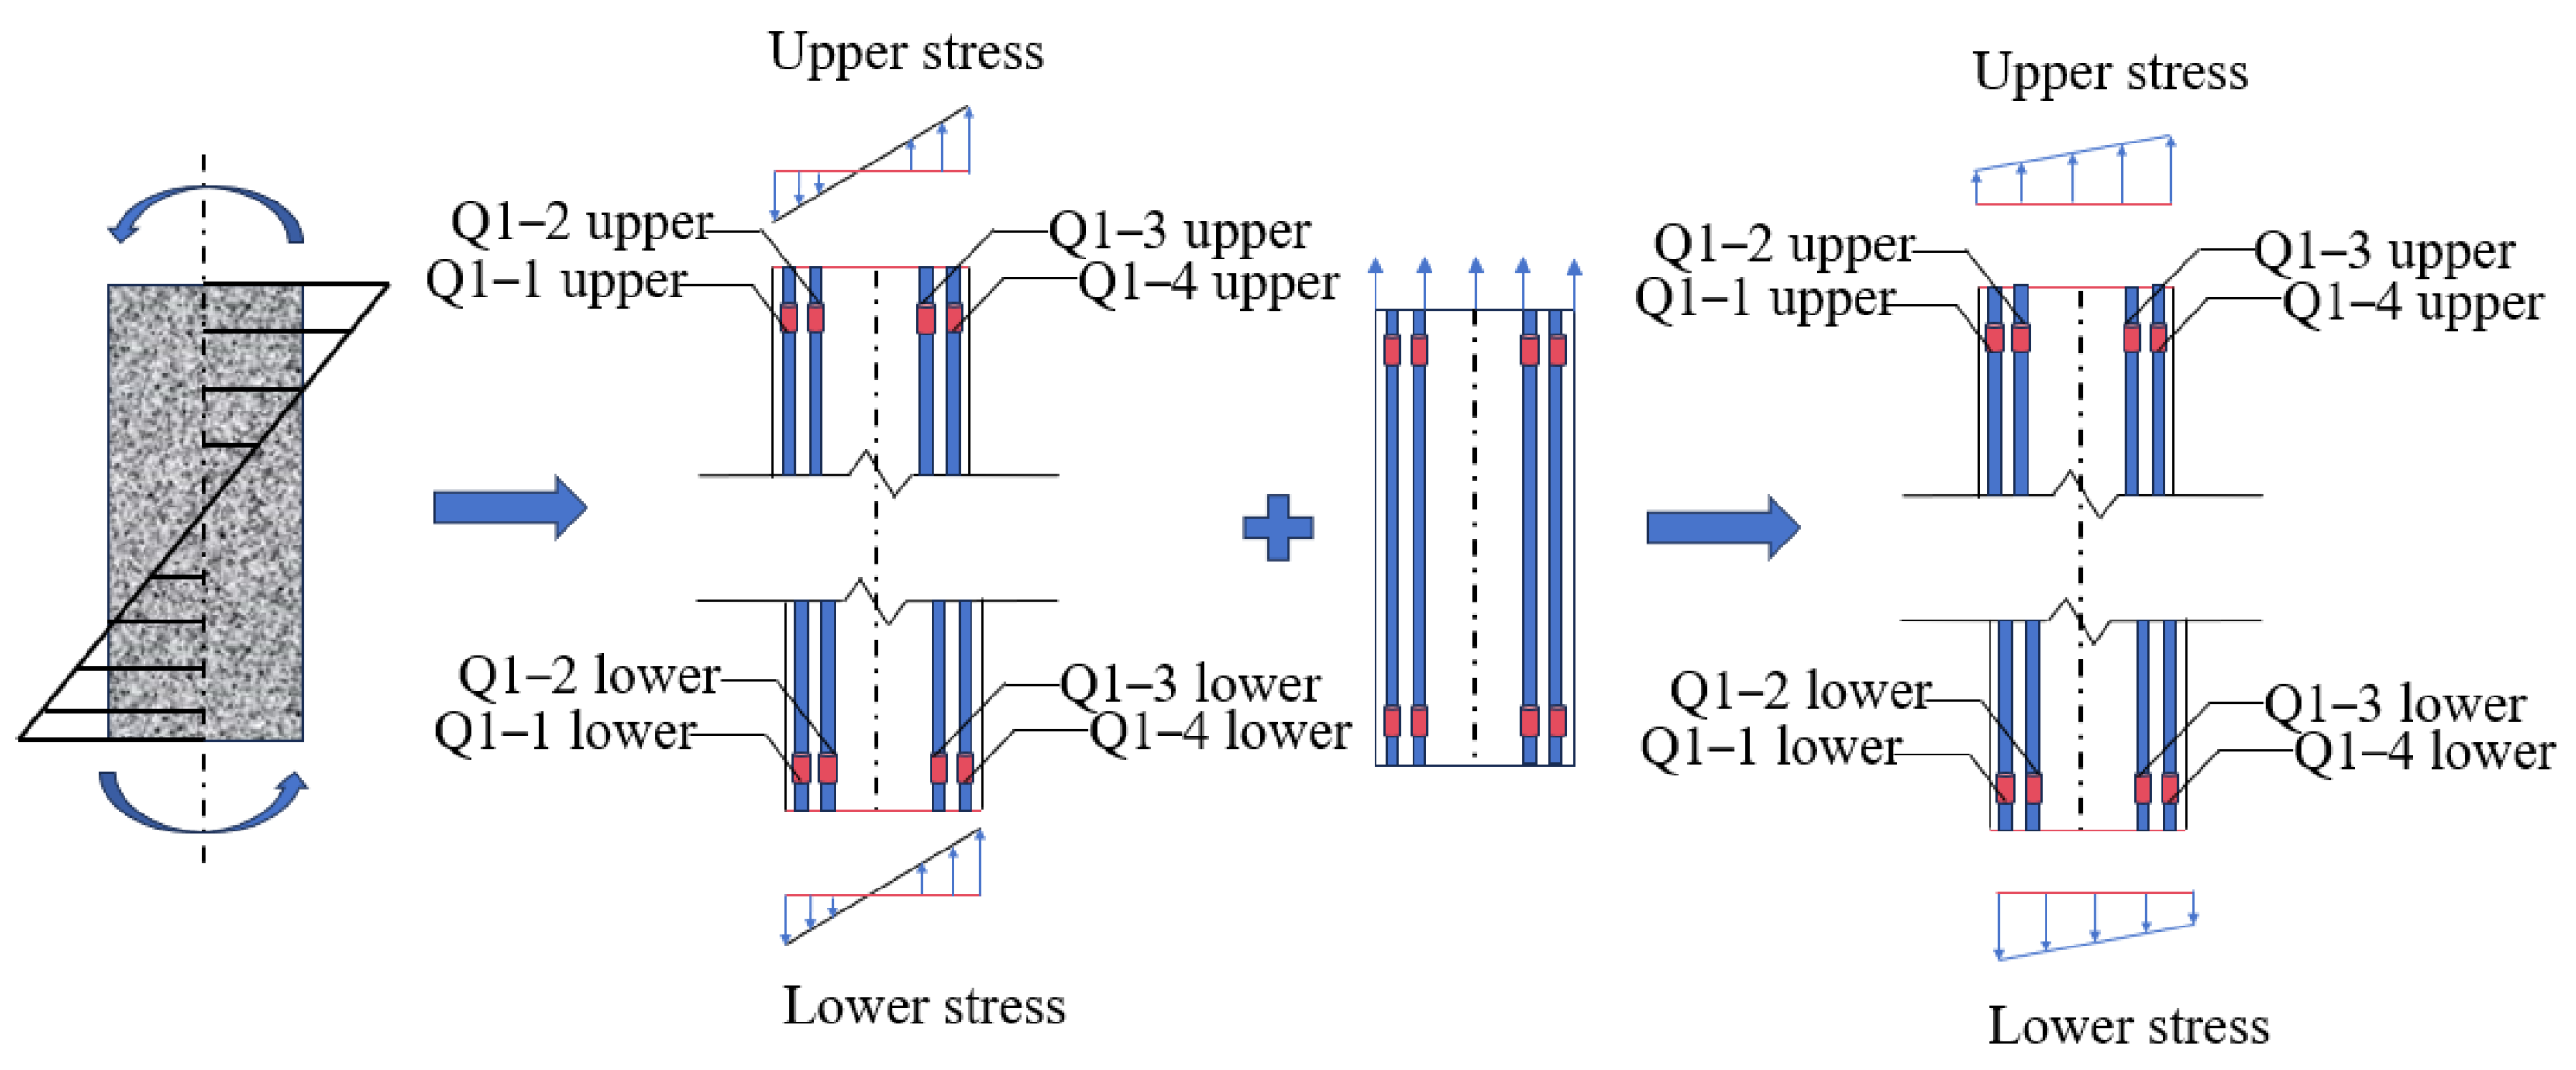
The strain of the steel rebar in wall Q1 is shown in Figure 15a. It can be seen that the stress state of wall Q1 exhibits variation under the influence of thrust and tensile forces. In the presence of tensile force, all reinforcing bars are subjected to tension, resulting in the occurrence of axial tensile force within the wall. Conversely, under the action of thrust force, the upper segments of Q1-1 and Q1–2 experience stress, while the lower segments undergo compression. Simultaneously, Q1–3 and Q1–4 are subjected to tension at the base and compression at the apex. This observation signifies the existence of bending moments within the wall, a phenomenon attributed to structural embedment effects. This finding also demonstrates that the upper structure provides a significant constraint on the shear wall. The bending moment is the cause of the cracking that initially appears at the edge of the wall and then continues inwards. The schematic diagram of the force analysis for wall Q1 is illustrated in Figure 16.
The strain of the steel rebar in walls Q2 and Q3 is shown in Figure 15b and Figure 15c, respectively. It can be seen that when the displacement load is minimal, both walls Q2 and Q3 are in an elastic working state, exhibiting comparable tensile and compressive strain values. The structural embedment effect on the walls is evident, and cracks first appear at the extremities of the walls. As the displacement load continues to increase, the increase in diagonal cracks in the reinforced concrete walls leads to a reduction in wall stiffness, thereby decreasing the wall’s ability to withstand horizontal loads. Furthermore, the rate of change in reinforcement strain decreases as the displacement load increases.
As shown in Figure 15, when the displacement load of Q2 is −2.8 mm, the displacement load of Q3 is −4.8 mm, and the displacement load of Q1 is 8.0 mm, the displacement load of Q2 is 8.0 mm, and the Q3 displacement load is 5.2 mm. This phenomenon can be explained by the fact that, as displacement increases, the strain of the reinforcing bars in the compressed zone no longer develops. In some cases, the compressive strain of the reinforcing bars decreases to 0 and then becomes tensile strain. There are two reasons for this. Firstly, the reinforced concrete wall cracks severely under large loads, leading to a redistribution of internal forces that causes the reinforcing bars to bear greater tensile forces. Secondly, after the upper structure cracks, the constraint on the reinforced concrete wall is reduced. It is evident that under the condition of cyclic loading, the tensile–compressive boundary line of the structure undergoes continuous displacement towards the compressed side as damage accumulates, thereby increasing the area subjected to tensile stress. Once the damage reaches a certain level, the changes stabilize, and with the exception of the reinforcing bars within the two side walls, all other reinforcing bars remain in a tensile state. This also leads to a transformation in the crack propagation patterns of Q1, Q2, and Q3 during loading. When the displacement load at Q2 is −2.8 mm, the displacement load at Q3 is −4.8 mm, and the displacement load at Q1 is 8.0 mm, a phenomenon occurs where the displacement load at Q2 is 8.0 mm, and Q3 displacement load is 5.2 mm. In this case, the strain of the reinforcing bars in the compressed zone no longer develops as displacement increases. In some cases, the compressive strain of the reinforcing bars decreases to 0 and then becomes a tensile strain. Two possible causes for this phenomenon have been posited: firstly, the reinforced concrete wall may crack severely under large loads, leading to a redistribution of internal forces that causes the reinforcing bars to bear greater tensile forces; secondly, after the upper structure cracks, the constraint on the reinforced concrete wall is reduced. As is evident, under the condition of cyclic loading, the tensile–compressive boundary line of the structure undergoes continuous displacement towards the compressed side as damage accumulates, thereby increasing the area subjected to tensile stress. Once the damage reaches a certain level, the changes stabilize, and with the exception of the reinforcing bars within the two side walls, all other reinforcing bars remain in a tensile state. This also leads to a transformation in the crack propagation patterns of walls Q1, Q2, and Q3 during loading.

4.2.2. Strain of the Concrete in Reinforced Concrete Walls and Frame Beams

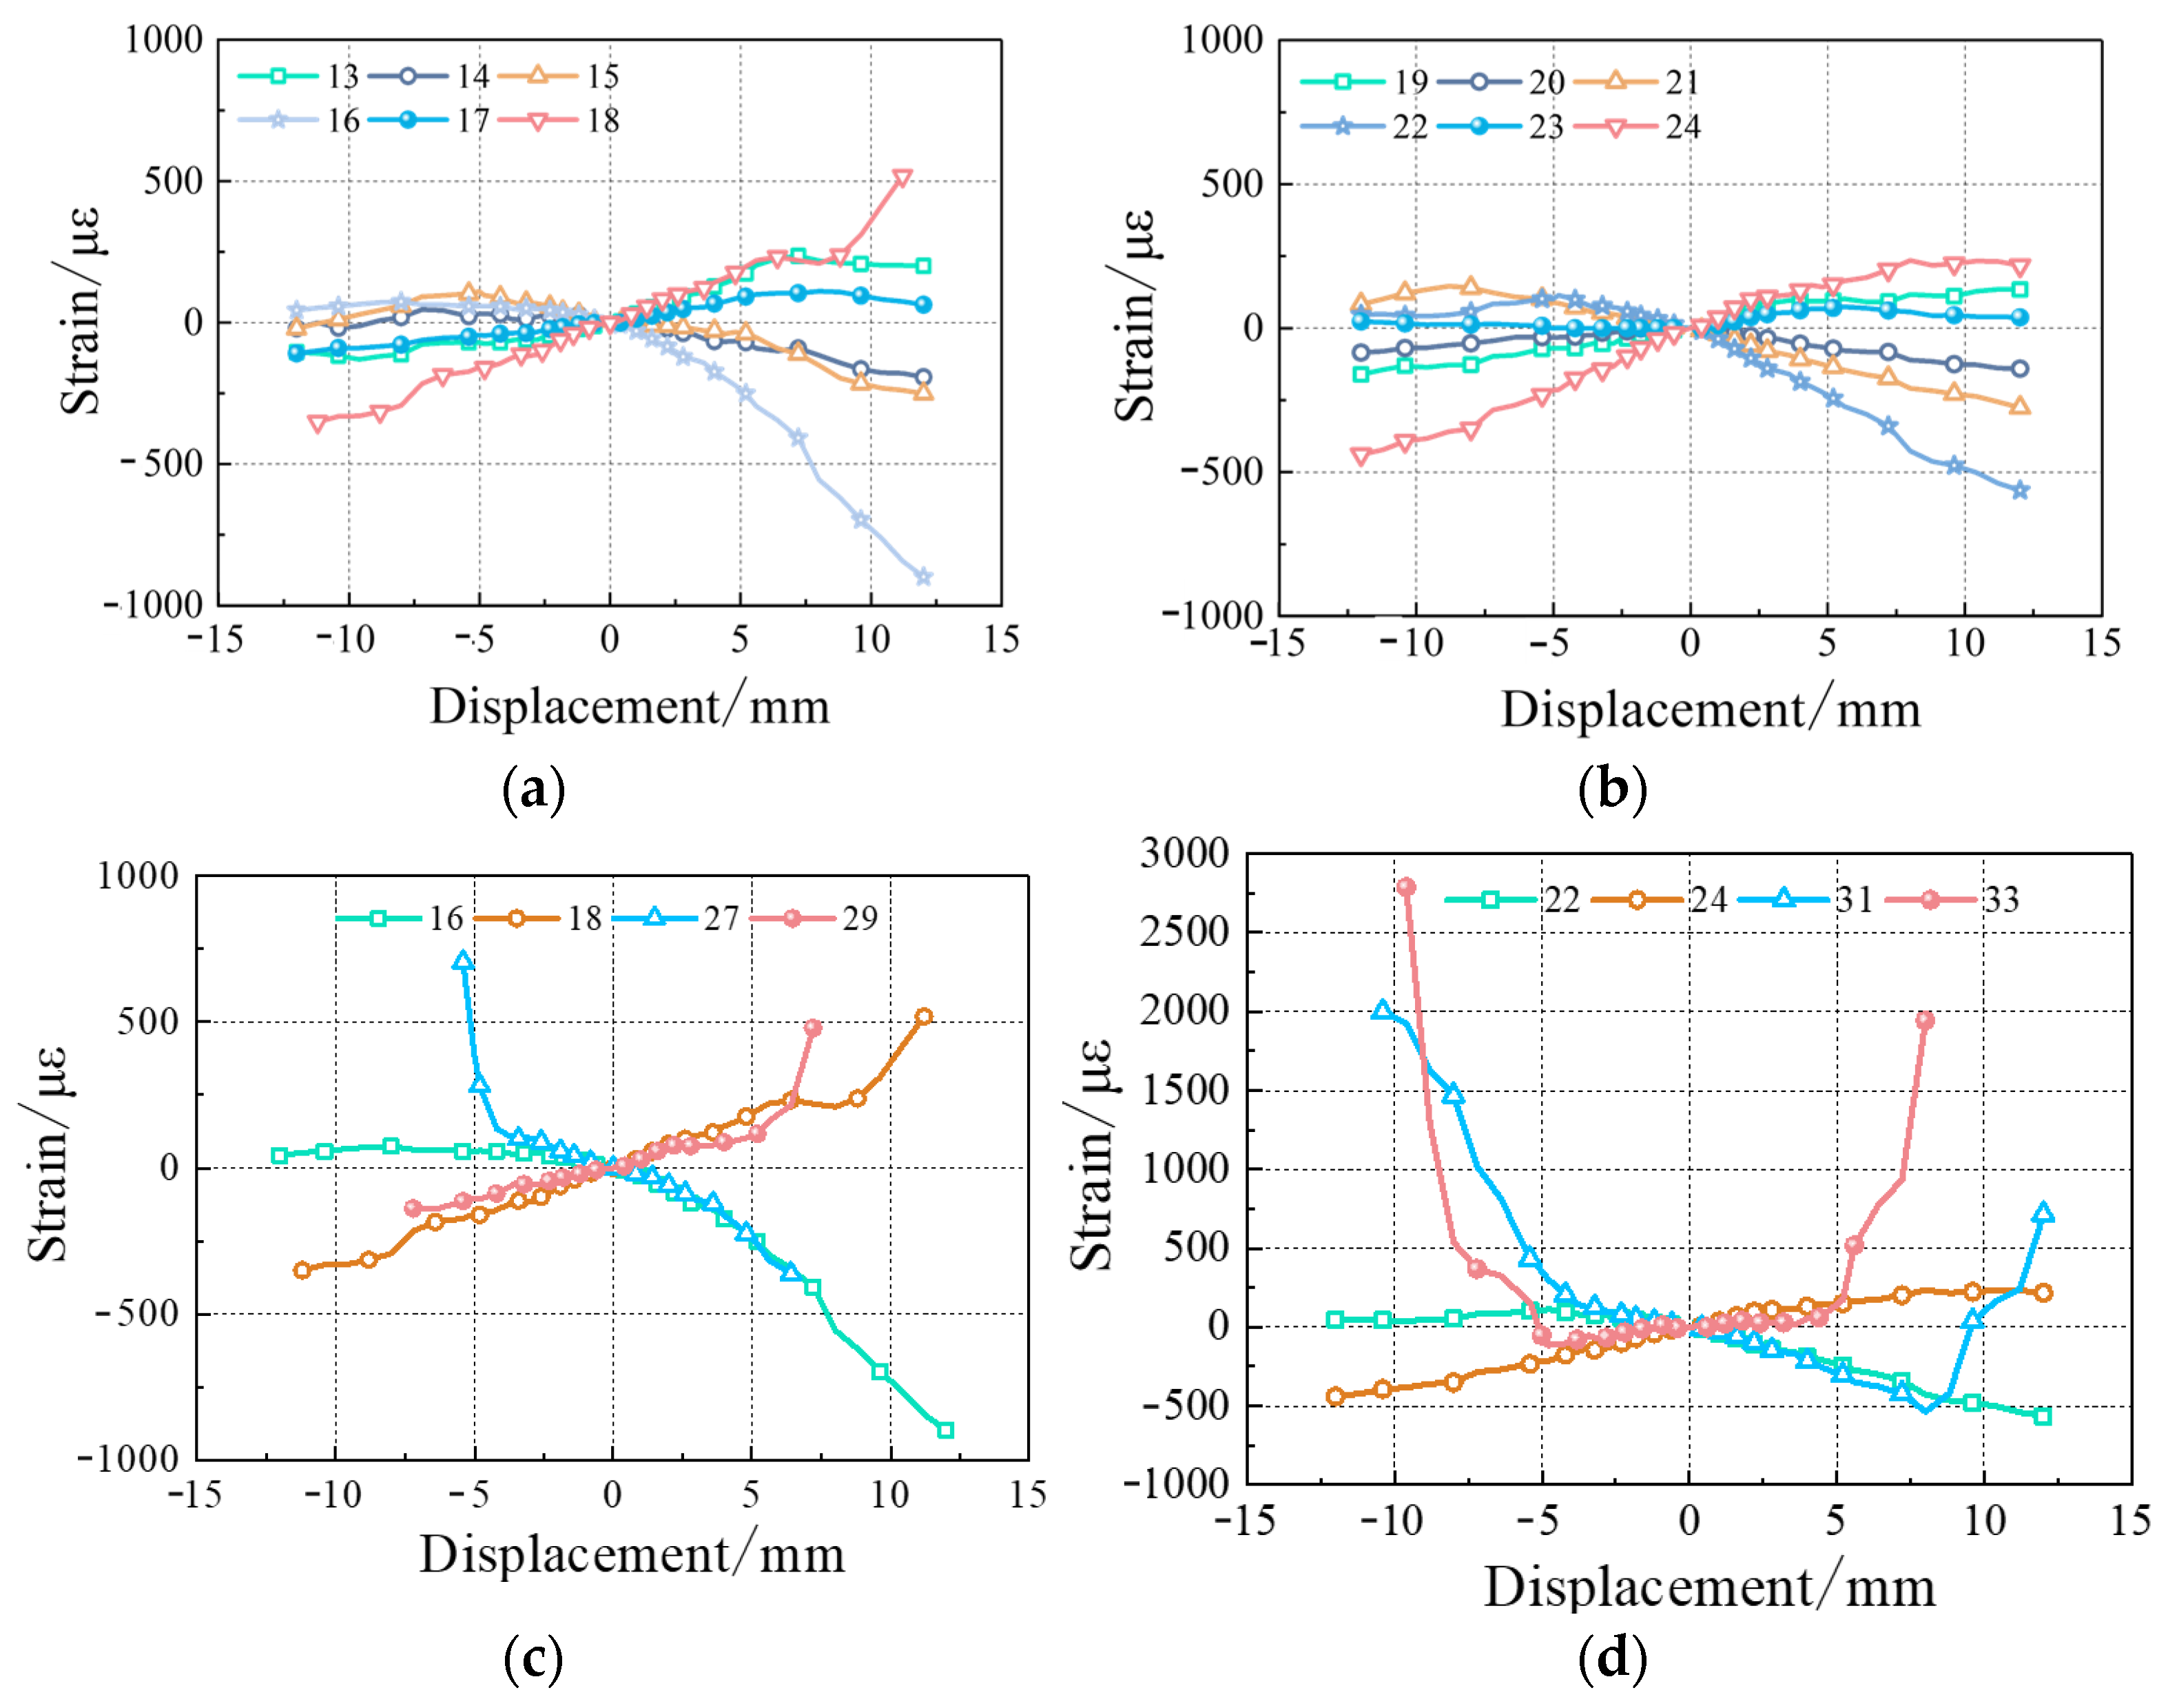
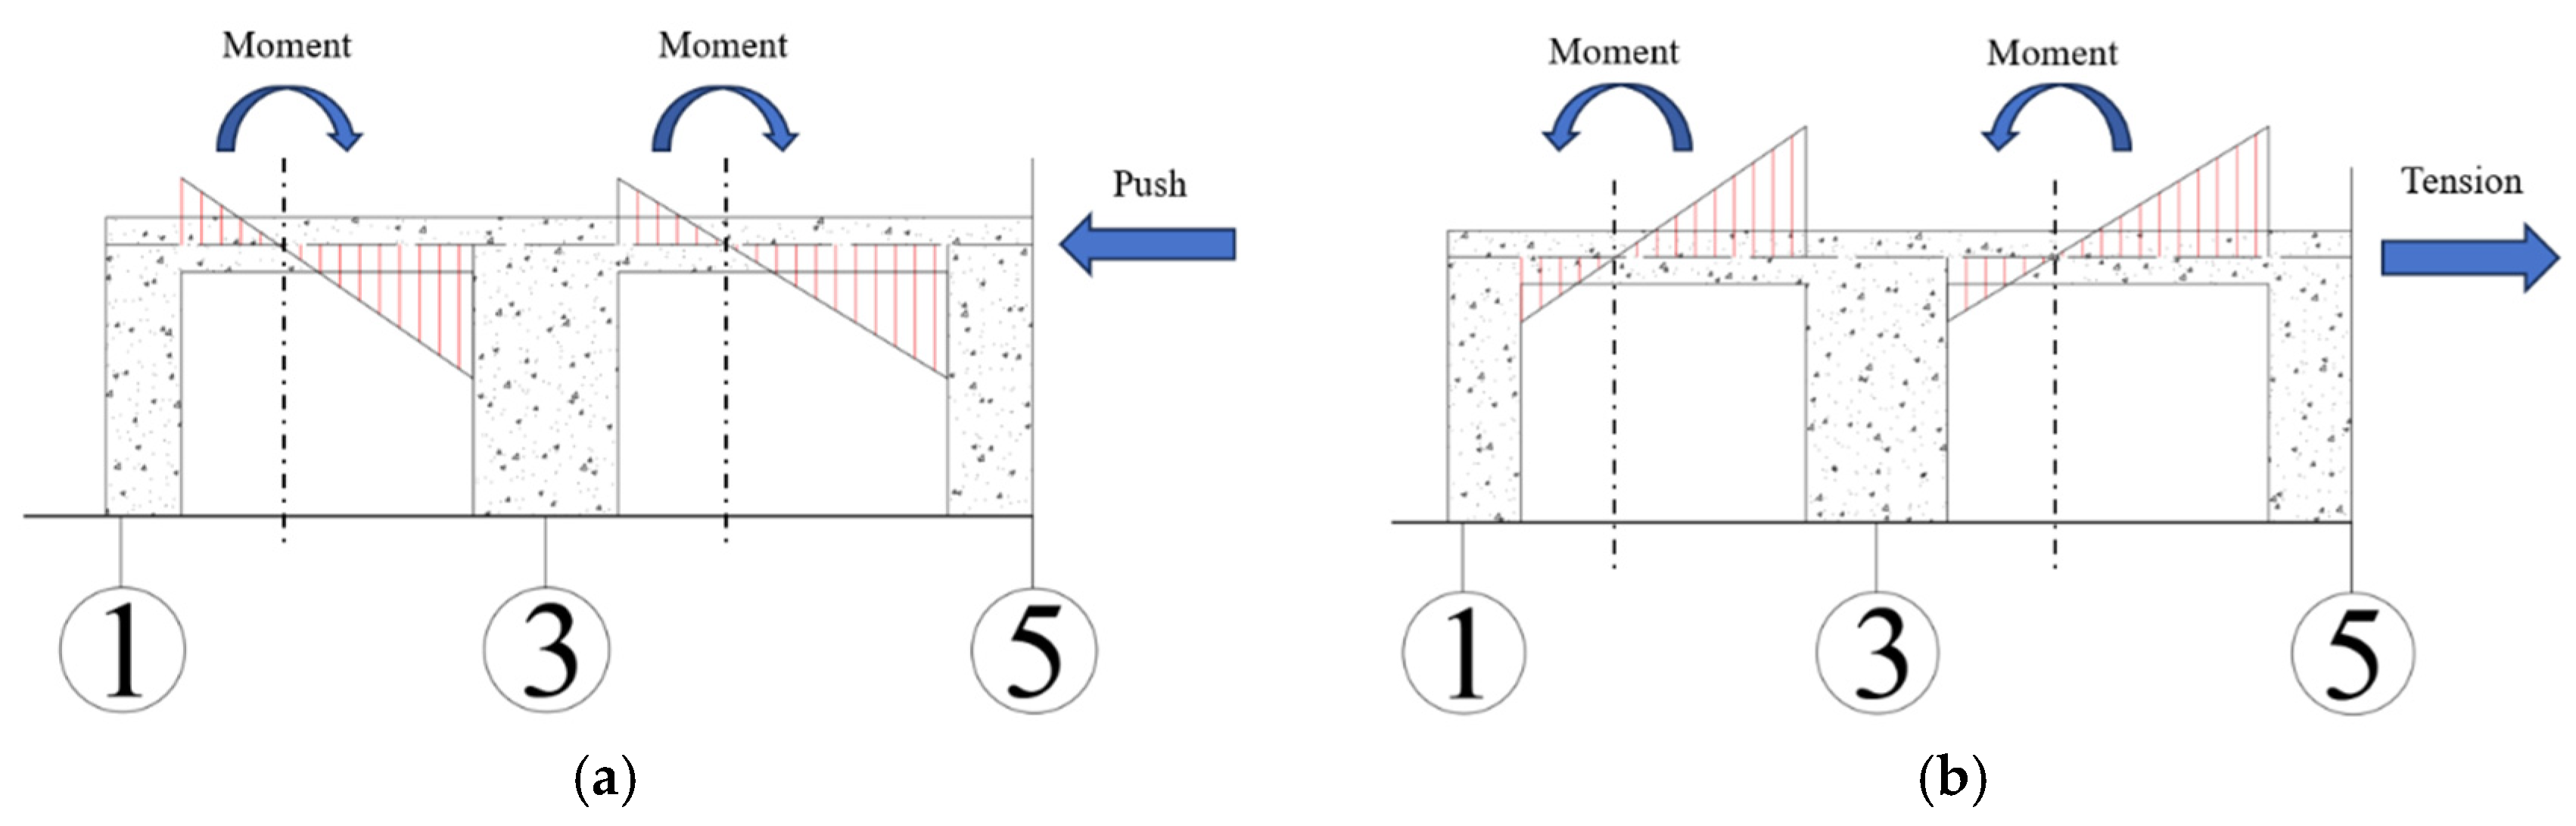
The measuring point arrangement of the strain on the reinforced concrete walls and frame beams along the A-axis is shown in Figure 7, and the strain of the concrete in the frame beams is illustrated in Figure 17. In the context of thrust loading, strain gauges 13, 17, and 18 on beam 1-3-A are observed to be in tension, while strain gauges 14, 15, and 16 are found to be in compression. It can thus be concluded that bending moments exist at both extremities of the beam, with the bending moment value at the 1-axis being less than that at 3-axis. On beam 3-5-A, strain gauges 19, 23, and 24 are under tension, while strain gauges 20, 21, and 22 are under compression. Furthermore, it was observed that bending moments exist at both ends of beam 3-5-A, with the bending moment value at 3-axis being less than that at 5-axis. Under the action of a tensile force, strain gauges 13, 17, and 18 on beam 1-3-A experienced compression, while strain gauges 14, 15, and 16 experienced tension. Therefore, it can be concluded that the bending moment value at 1-axis is less than that at 3-axis. Strain gauges 19, 23, and 24 on beam 3-5-A are under compression, while strain gauges 20, 21, and 22 are under tension. In a similar manner, the bending moment value at 3-axis is less than that at 5-axis. The schematic diagram for the bending moment of the frame beam under cycle loading is shown in Figure 18.
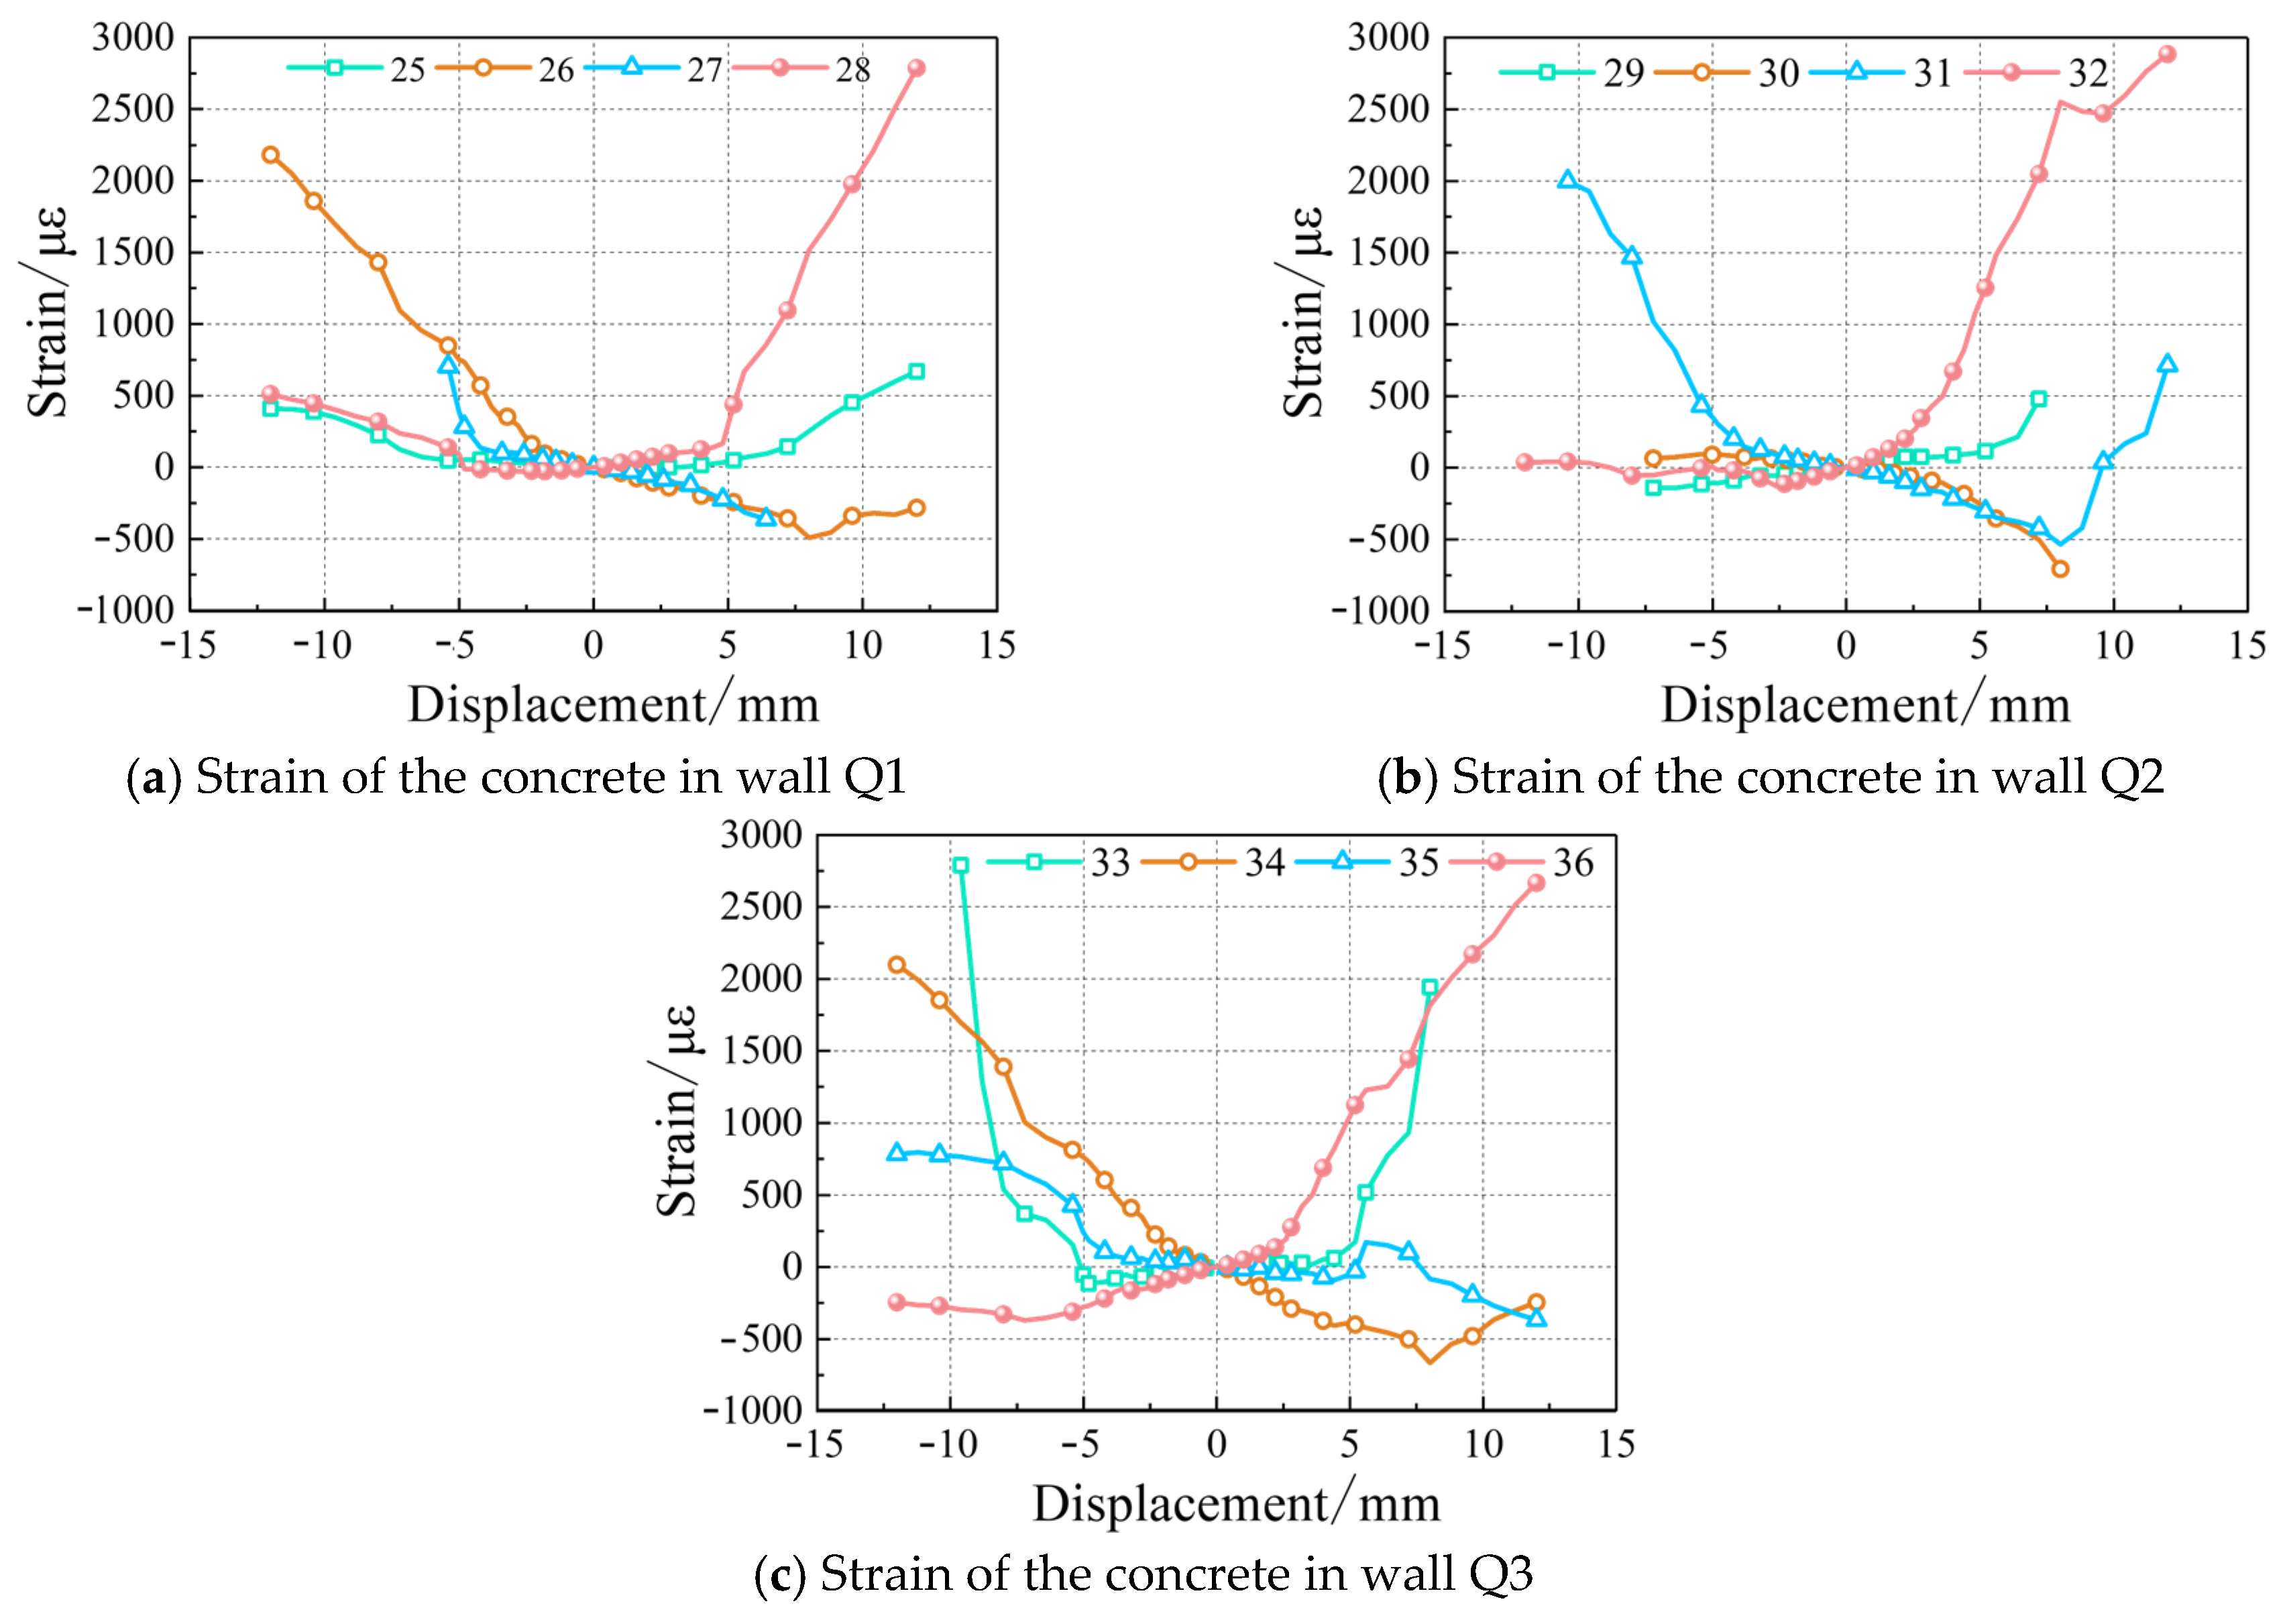
The concrete strain of 16#, 27#, 18#, and 29# is shown in Figure 17c, and the concrete strain of 22#, 31#, 24#, and 33# is shown in Figure 17d. As demonstrated in Figure 17c,d, the tensile strain of the concrete is lower than the compressive strain value at the corresponding position. In the initial stage, a comparison was made of strain gauges 16 and 27, 18 and 29, 22 and 31, and 24 and 33. It was found that these also changed synchronously. As the load increases, when all strain gauges are located on the tension side, the tensile strain on the shear wall is significantly greater than the tensile strain on the beam. From the perspective of loading method and force transmission, the test specimen was loaded at the first-floor top and third-floor top. The load at the first-floor top acts on the beam end, and the beam also serves to transmit horizontal thrust. Therefore, during the test, in addition to the loading of the bending moment at the extremity of the shear wall, axial pressure is also loaded, resulting in larger compressive strain values and smaller tensile strain values.
The strain of the concrete in reinforced concrete walls is shown in Figure 19. As demonstrated in Figure 19, the strain changes in the strain gauges on the reinforced concrete wall and the reinforcing bars within the shear wall are consistent. In the presence of tensile force, Q1 displays tensile strain. As the thrust increases, the position on Q1 that previously exhibited compressive strain gradually stabilizes. The strain gauge 33# on shear wall Q3 demonstrates a gradual decrease in compressive strain, commencing from a displacement of −4.8 mm, followed by a swift rise to tensile stress. This is in complete accordance with the strain alterations of the reinforcing bars within the shear wall.
A comprehensive analysis of the strain test results of the longitudinal reinforcing bars in the reinforced wall, in conjunction with the strain gauges installed on the reinforced wall and the connecting beams, was conducted. The findings of this analysis indicated that the stress mechanism of the reinforced wall and the connecting beams is analogous to that of a multi-member reinforced concrete shear wall structure.

4.3. Hysteresis Curves

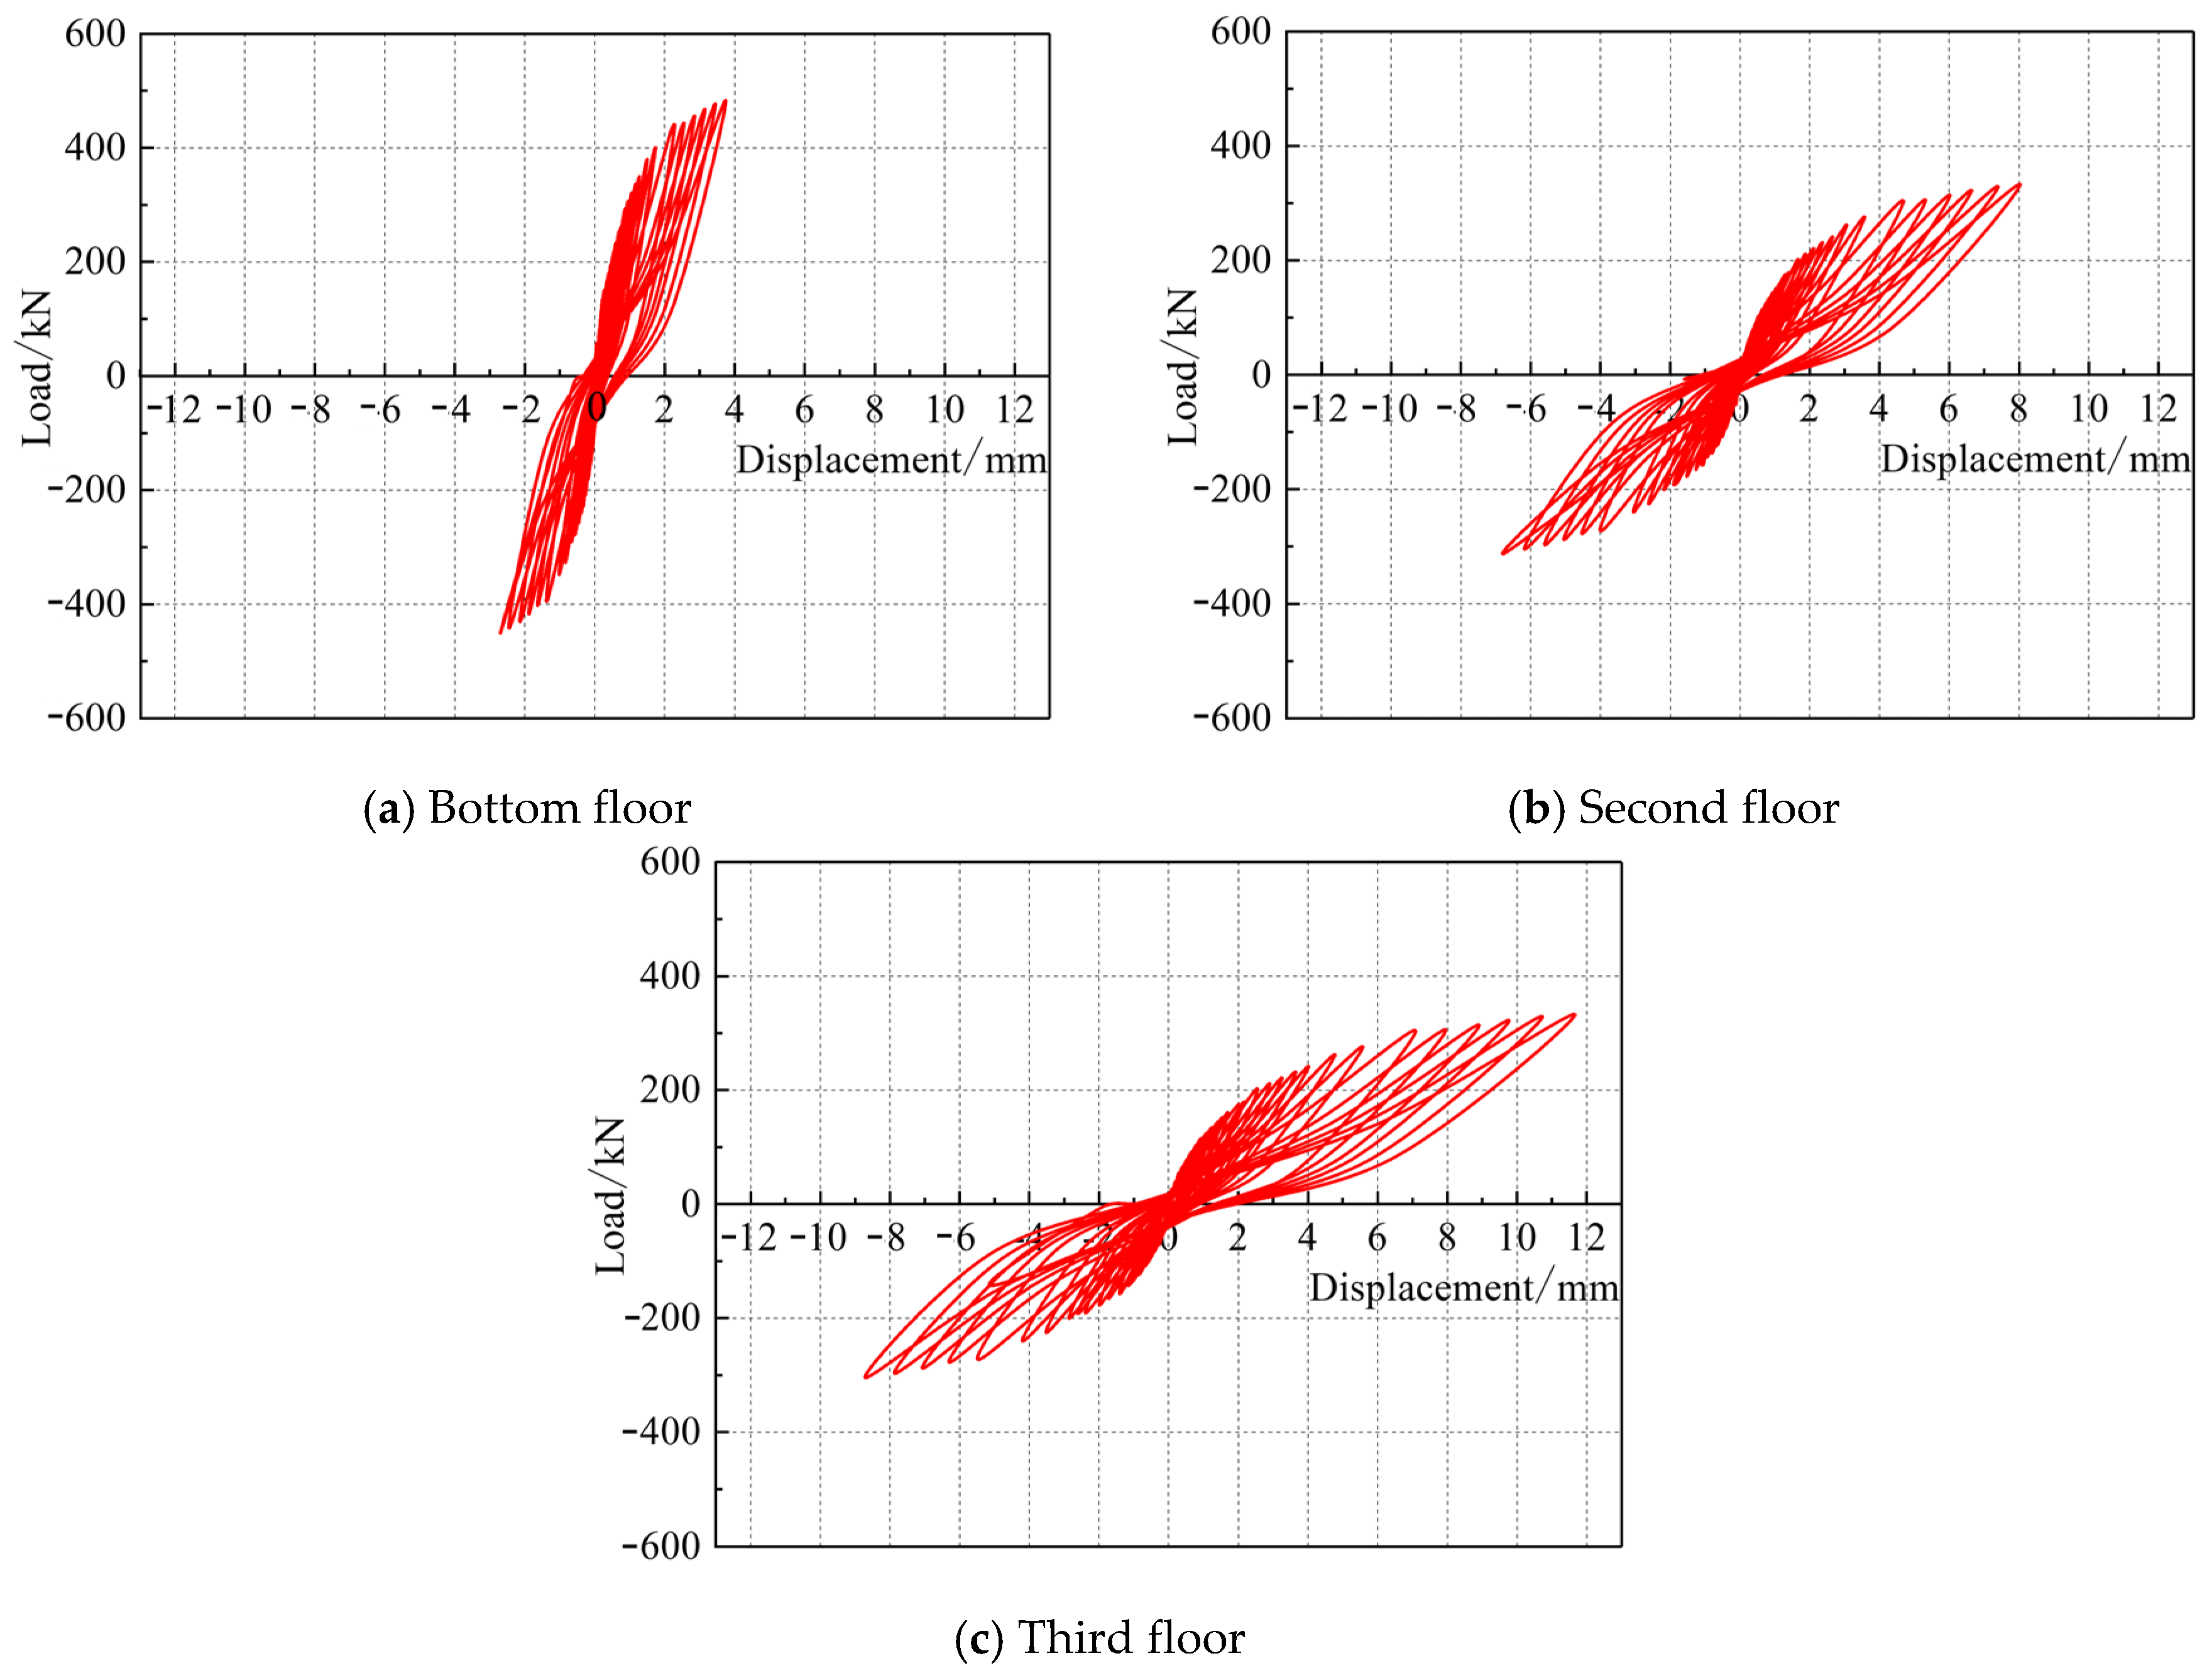
In the context of horizontal reciprocating loads, hysteresis curves constitute a fundamental component in the analysis of seismic performance in structural engineering. The load and displacement data recorded by the displacement meter and the MTS horizontal actuator were utilized to generate hysteresis curves for each floor of the structural model during the quasi-static test. The hysteresis curve of each floor in the structural model is shown in Figure 20. It can be seen that the hysteresis characteristics of the structural model manifest a discernible two-stage behavior. During the initial loading phase, the hysteresis curves are densely spaced and approximate a straight line passing through the origin. This indicates that the structural model has not yet cracked and is in the elastic stage, with load increasing steadily as displacement increases. Once displacement exceeds a certain threshold, the hysteresis curves begin to curve, forming an inverted “S” shape. This indicates that the structural model has entered the elastic–plastic stage. Fractures emerge within the structural framework, accompanied by an augmentation in plastic deformation. As displacement on the structural model increases, load increase becomes less significant. The components are prone to cracking when subjected to significant levels of energy, and as the displacement continues to increase, the cracks propagate rapidly, resulting in an expansion of the hysteresis loop, which approaches saturation.
Additionally, a comparison of the hysteresis curves of the second and third floors with those of the bottom floor of the structural model reveals that the former are characterized by greater density and a steeper slope, whilst the hysteresis loop area is smaller. This finding suggests that the bottom floor remains in the first stage, or the transition period between the first and second stages, for a protracted period during loading, thereby sustaining greater loads. It can be concluded that, in view of the fact that the crack development process on the bottom floor walls is analogous to that of the second and third floors when subjected to an equivalent load, the displacement of the bottom floor is less pronounced than that of the second and third floors. Consequently, the displacement of the bottom floor is less influenced by crack development compared to the second and third floors. The hysteresis curve of the third floor demonstrated greater saturation compared to that of the second floor, as indicated by a larger hysteresis loop area. This finding suggests that the third floor exhibits superior energy dissipation performance and ductility compared to the second floor.

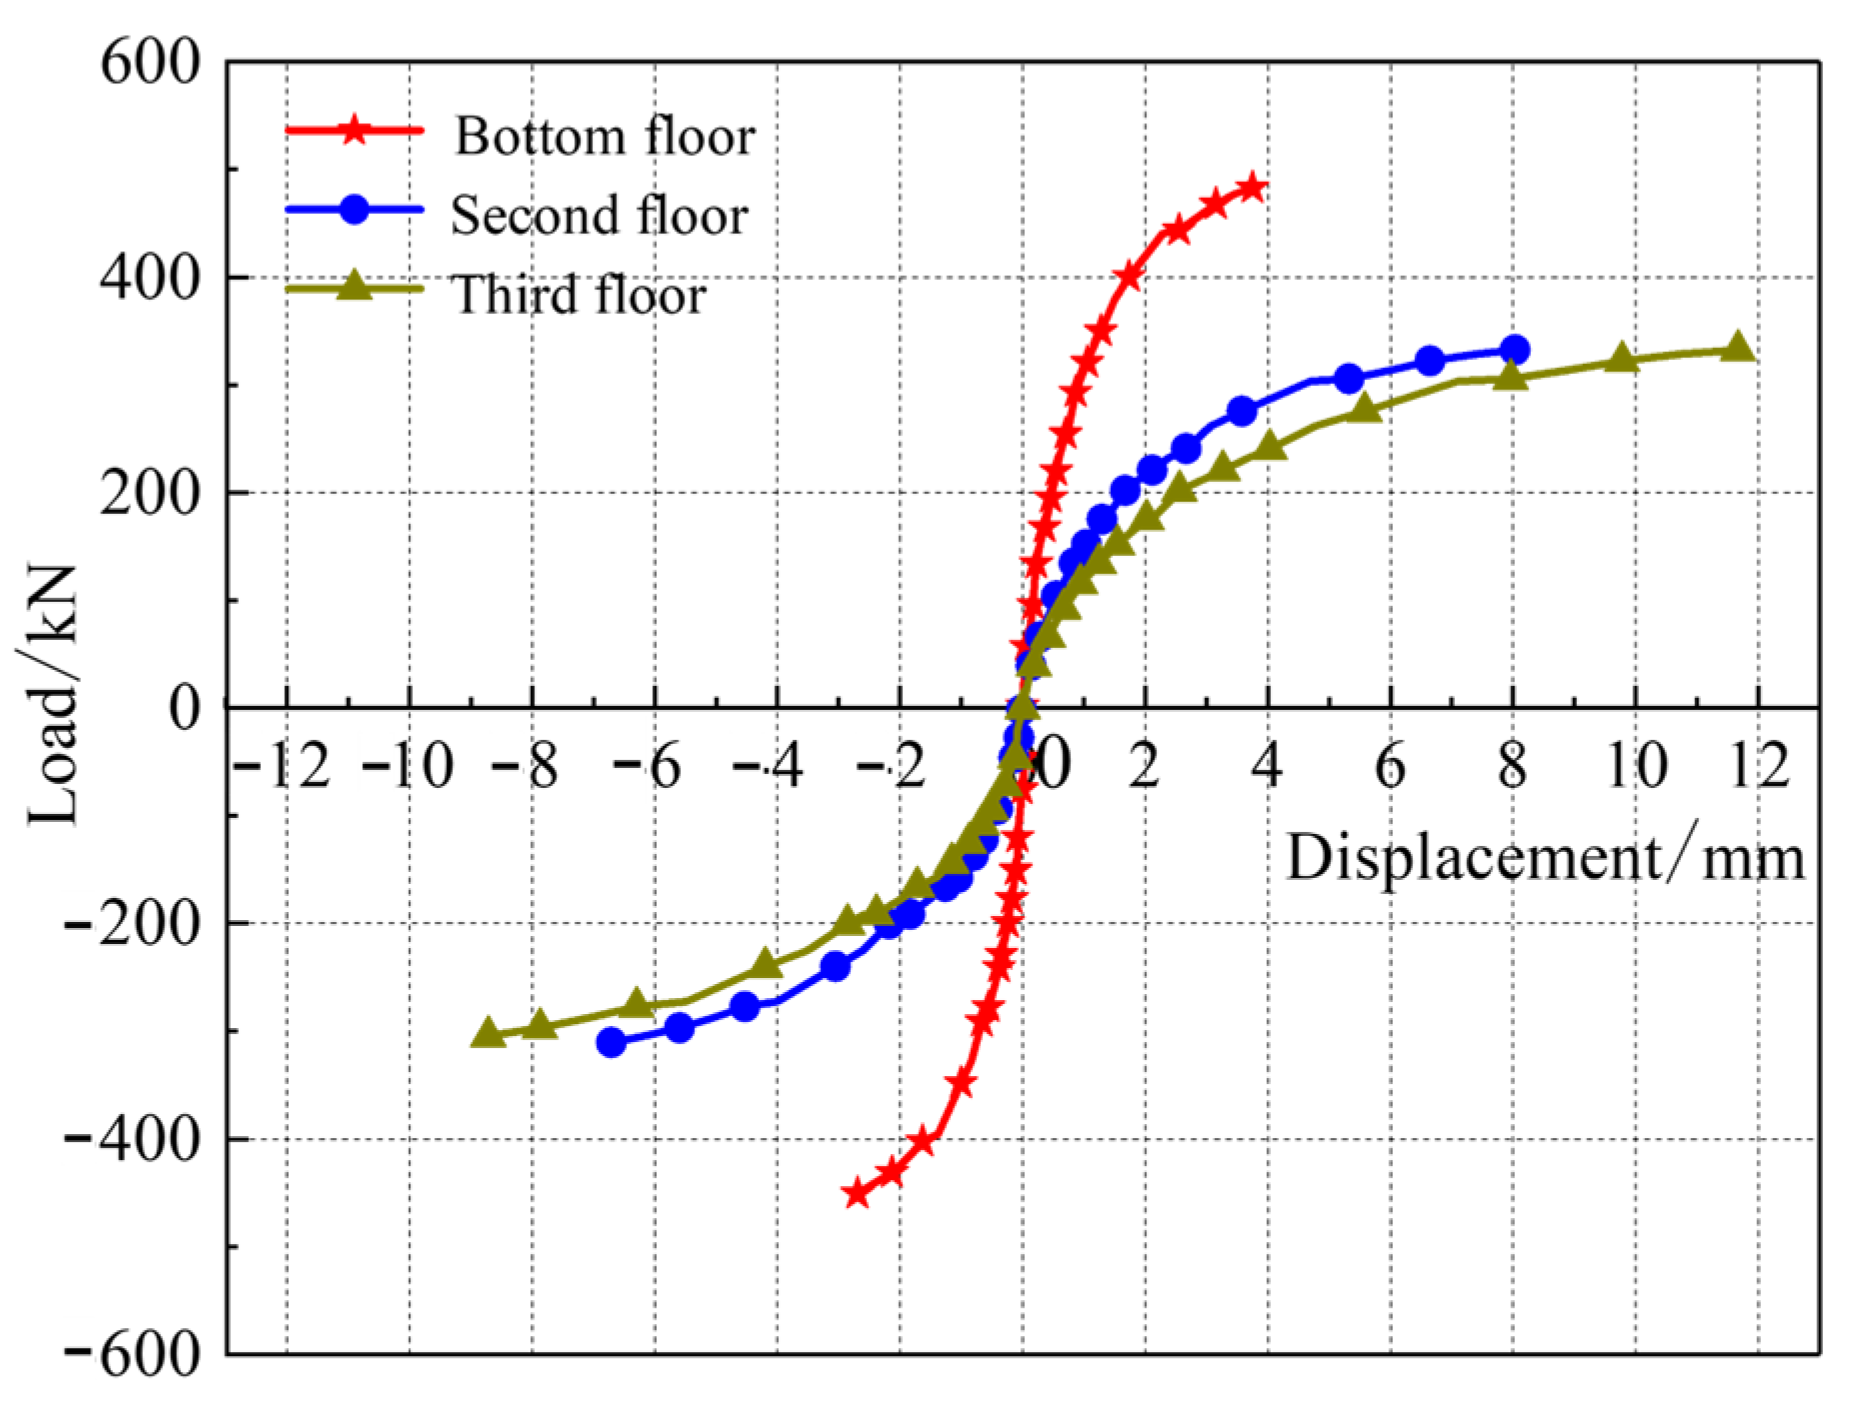
4.4. Skeleton Curves

The envelope curve, formed by connecting the peak points of the hysteresis curves under various loading conditions, is referred to as the skeleton curve. The comparison of the skeleton curve of each floor in structural model is shown in Figure 21. It can be seen that the slope of the skeleton curve is relatively steep prior to cracking, indicating a linear relationship between load and displacement. This suggests that the stiffness of each floor has not yet undergone significant degradation. As the loading process continues, cracks begin to appear in the walls, and the slope of the skeleton curves gradually decreases for each floor, with the curves becoming flatter, particularly on the second and third floors, where this phenomenon is especially pronounced. This indicates that the stiffness degradation on these floors occurs more rapidly. Concurrently, under the same displacement condition, the load value of the skeleton curve for the ground floor was greater than those of the second and third floors, indicating that the ground floor sustained a larger horizontal load. Furthermore, due to the complete development of cracks in structural components during the later stages of loading, the magnitude of changes in the slope of the skeleton curves for each floor gradually decreases, and stiffness degradation no longer becomes significant. Overall, no sudden changes in bearing capacity were observed in the skeleton curves for any floor, indicating that the structural model exhibits ductile characteristics during loading and possesses beneficial seismic performance.

4.5. Stiffness Degradation

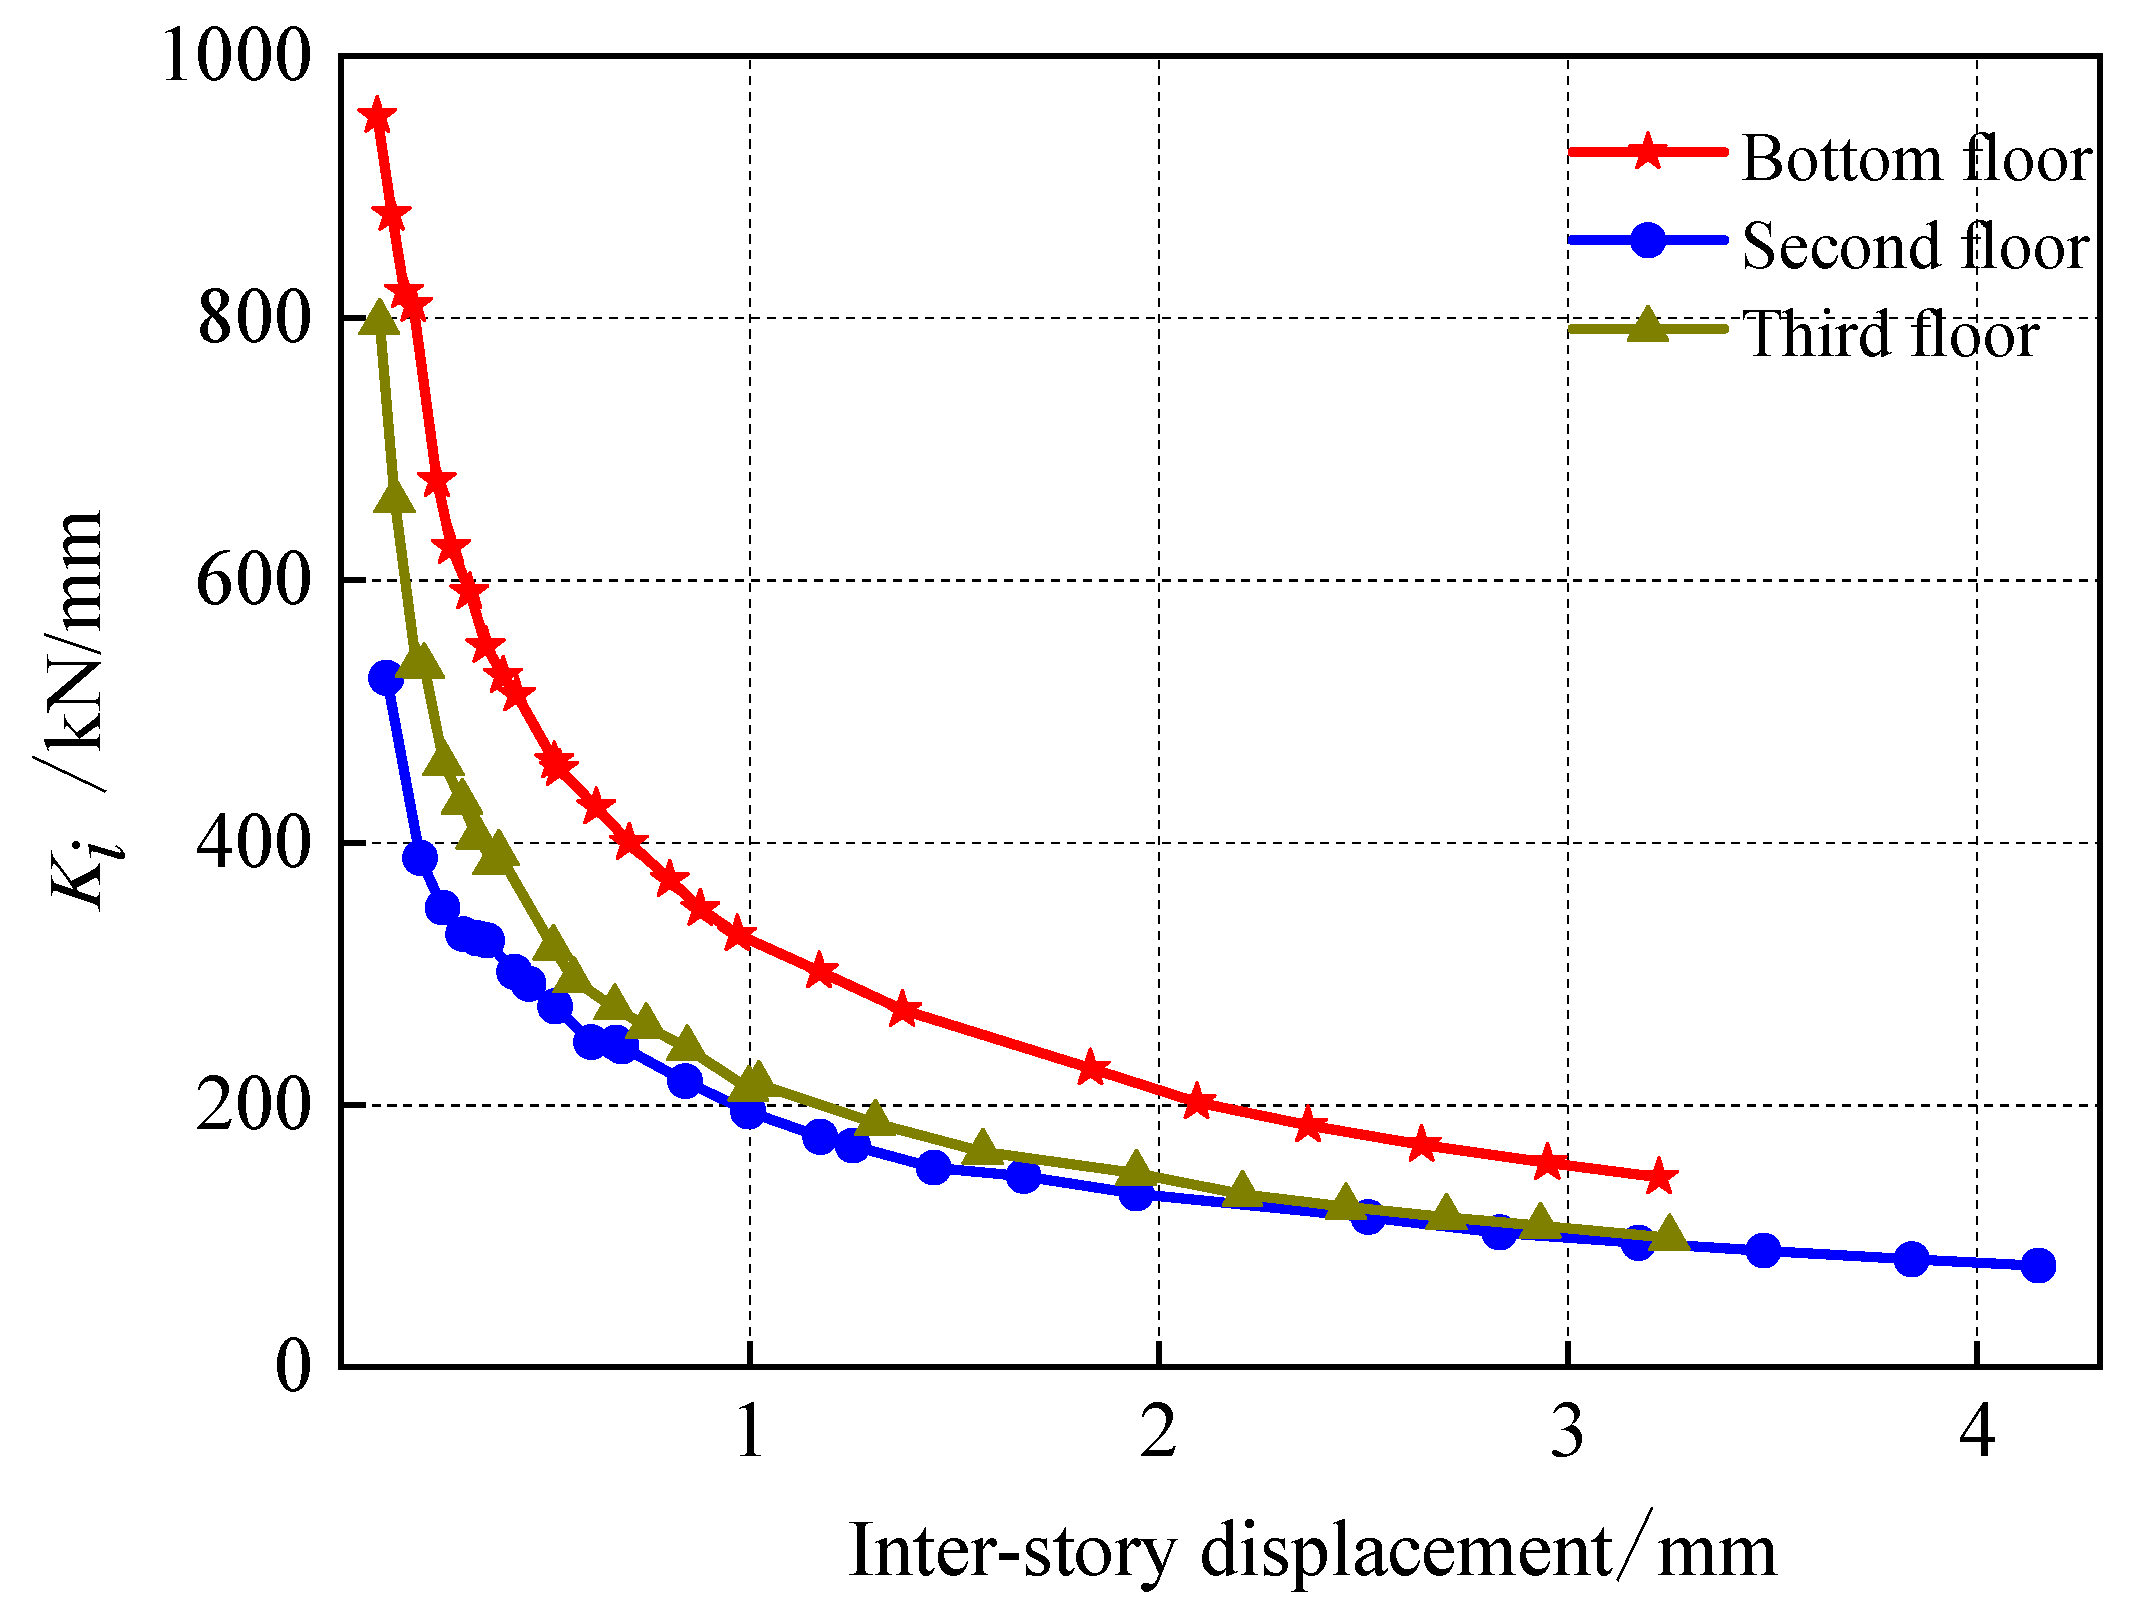
It is evident that, under the condition of cyclic loading, the gradual accumulation of structural damage ultimately results in a corresponding degradation of the overall stiffness of the structure. The degradation of stiffness in each story of the structure is indicative of the extent of overall structural damage during loading and the differences in seismic performance between stories. The stiffness degradation curve is a graphical representation of the patterns of stiffness changes and the ease or difficulty of resisting deformation during the cracking, damage, and failure processes of the specimen. In accordance with the stipulations set out in the Code for Seismic Testing of Buildings (JGJ/T 101—2015) [46], the stiffness of walls is to be determined using secant stiffness, with the calculation formula presented in Equation (7).
K i = + P i + P i + Δ i + Δ i
where + P i and P i denote the load values at the positive and negative peaks, respectively, while + Δ i and Δ i represent the displacement values at the positive and negative peaks.
The comparison of the stiffness degradation curve of each floor in the structural model is shown in Figure 22. It can be seen that the stiffness degradation of each floor of the structural model went through two stages. After cracks appeared in the early stage of loading, the stiffness of each floor decreased significantly. In the late stage of loading, when cracks had fully developed, the stiffness degradation curves of each floor gradually leveled off. The bottom floor was damaged first, so its stiffness degraded first. The stiffness of the second and third floors degraded next, with the second floor experiencing the largest degradation rate. Its stiffness was consistently lower than that of the other two floors, indicating that the deformation demand was transferred to the second floor after the bottom floor was strengthened by reinforced concrete walls. Therefore, when designing this type of masonry structure with large bottom-floor openings, the stiffness compatibility between the strengthened bottom floor and the second floor should be carefully checked. The stiffness of the ground-floor reinforced concrete walls should not be increased without limitation. If the second floor shows excessive inter-story displacement, rapid stiffness degradation, or high shear demand, the masonry walls on the second floor, especially the wall piers, window-side wall segments, and walls above the large openings, should be locally strengthened by measures such as reinforced mortar layers with steel mesh, reinforced concrete surface layers, additional constructional columns, ring beams, or enhanced wall-slab connections.

5. Conclusions

This paper designed and fabricated a four-floor masonry-concrete structure according to a scale of 1:4. Based on the principle of stiffness equivalence, the model’s bottom floor, which has large openings, was reinforced with a concrete wall instead of a traditional masonry wall. Seismic performance tests were then carried out under the action of low weekly reciprocating loads. The conclusions are as follows:
(1)
The reinforced concrete wall works in coordination with other stressed members. The load is effectively transferred within the masonry structure. The structural cracking process is coherent. The overall distribution of structural cracks is uniform. The members are not destroyed one by one. The structural model exhibited certain deformation capacity under the adopted cyclic loading regime, and no sudden loss of bearing capacity was observed during the test.
(2)
After the test, the final damage severity of the reinforced concrete walls varied with their positions. The middle wall Q3 showed the most severe damage, followed by Q2 and Q4, while the two outermost walls Q1 and Q5 showed relatively lighter damage. For the standard floors, namely the second to fourth floors, the masonry walls above the side with large bottom-floor openings cracked later than the bottom-floor reinforced concrete walls, but earlier than the masonry walls on the side without large bottom-floor openings.
(3)
The torsion generated by the structural model is much lower than the code requirement and can be considered negligible. The reinforced concrete walls can effectively reduce the torsional response of masonry structures with large bottom-floor openings. However, the displacement and stiffness degradation of the second floor are significant. Therefore, the stiffness compatibility between the strengthened bottom floor and the second floor should be checked in design. When necessary, the second-floor masonry walls should be locally strengthened, or the stiffness of the ground-floor reinforced concrete walls should be properly adjusted to avoid the formation of a weak transition story.
(4)
Under cyclic loading, the dividing line between tensile and compressive forces in the damaged masonry house shifts towards the compressed side. As damage accumulated, the reinforcement in the middle reinforced concrete walls, especially Q2, Q3, and Q4, remained mainly in tension, whereas the reinforcement in the two outermost reinforced concrete walls, Q1 and Q5, still exhibited different tensile–compressive strain states. It changes the way cracks develop in reinforced concrete walls during the loading process.
(5)
The hysteresis, skeleton and stiffness degradation curves of a bottom large-open-cavity masonry structure with a reinforced concrete wall subjected to cyclic repetitive loading can be characterized by two stages. Initially, the structure remains intact and exhibits consistent stiffness. As the load increases, cracks develop, stiffness degrades rapidly and energy dissipates. The structure is consistent in its bearing capacity during loading, demonstrating reliable seismic performance.
Future research should combine refined numerical models or shaking table tests to further investigate the seismic performance of masonry structures with large bottom floor openings, focusing on the effects of opening ratios, reinforced concrete wall layouts, and stiffness ratios between the strengthened ground floor and upper stories. Practical design recommendations should be developed to avoid abrupt stiffness transitions and soft story behavior. In parallel, complete hysteresis data should be acquired to calculate the equivalent viscous damping ratio and displacement ductility coefficient, enabling a quantitative assessment of the energy dissipation and ductility capacity of such structures.

Author Contributions

J.D.: Formal analysis, Writing—original draft. G.H.: Investigation, Formal analysis, Writing—original draft, Writing—review and editing. K.Y.: Formal analysis, Supervision, Writing—review and editing. All authors have read and agreed to the published version of the manuscript.

Funding

This research received no external funding.

Data Availability Statement

The data that support the findings of this study are available from the corresponding author upon reasonable request.

Conflicts of Interest

Authors Jixin Du and Guanghua Hu were employed by the company Shandong Railway Investment Holding Group Co., Ltd. The remaining author declares that the research was conducted in the absence of any commercial or financial relationships that could be construed as a potential conflict of interest.

References

  1. Zhou, B.Z. Experiences and future of earthquake-resisting of the masonry structure in China. Build. Struct. 2011, 41, 151–158. (In Chinese) [Google Scholar] [CrossRef]
  2. Dutu, A.; Niste, M.; Spatarelu, I.; Dima, D.; Kishiki, S. Seismic evaluation of romanian traditional buildings with timber frame and mud masonry infills by in-plane static cyclic tests. Eng. Struct. 2018, 167, 655–670. [Google Scholar] [CrossRef]
  3. Wang, M.; Liu, K.; Lu, H.F.; Shrestha, H.; Guragain, R.; Pan, W.; Yang, X.D. In-plane cyclic tests of seismic retrofits of rubble-stone masonry walls. Bull. Earthq. Eng. 2018, 16, 1941–1959. [Google Scholar]
  4. Meimaroglou, N.; Mouzakis, H. Mechanical properties of three-leaf masonry walls constructed with natural stones and mud mortar. Eng. Struct. 2018, 172, 869–876. [Google Scholar] [CrossRef]
  5. Rohit, K.A.; Dina, D. 2015 Nepal earthquake: Seismic performance and post-earthquake reconstruction of stone in mud mortar masonry buildings. Bull. Earthq. Eng. 2020, 18, 3863–3896. [Google Scholar] [CrossRef]
  6. Khadka, B.; Shakya, M. Seismic characteristics of unreinforced mud masonry houses in Nepal: A miserable scenario before and after 2015 Gorkha (Nepal) earthquake. Eng. Fail. Anal. 2021, 124, 105308. [Google Scholar] [CrossRef]
  7. Zhao, B.; Taucer, F.; Rossetto, T. Field investigation on the performance of building structures during the 12 May 2008 Wenchuan earthquake in China. Eng. Struct. 2009, 31, 1707–1723. [Google Scholar] [CrossRef]
  8. Civil and Structural Groups of Tsinghua University; Xinan Jiaotong University and Beijing Jiaotong University. Analysis on seismic damage of buildings in the Wenchuan earthquake. J. Build. Struct. 2008, 29, 1–9. (In Chinese) [Google Scholar] [CrossRef]
  9. Pan, Y.; Yuan, J.C.; Lin, Y.J.; Song, J.; Zhu, L.X. Seismic damage investigation and analysis of rural residential buildings in MS 6.8 Luding earthquake. J. Disaster Prev. Mitig. Eng. 2023, 43, 1200–1214. (In Chinese) [Google Scholar] [CrossRef]
  10. Dong, Z.F.; Deng, M.K.; Zhang, Y.X.; Zhang, C.; Ma, P. Out-of-plane strengthening of unreinforced masonry walls using textile reinforced mortar added short polyvinyl alcohol fibers. Constr. Build. Mater. 2020, 260, 119910. [Google Scholar] [CrossRef]
  11. Lazaridis, P.C.; Thomoglou, A.K. Rapid shear capacity prediction of TRM-strengthened unreinforced masonry walls through interpretable machine learning deployed in a web app. J. Build. Eng. 2024, 98, 110912. [Google Scholar] [CrossRef]
  12. Li, Y.M.; Han, J.; Liu, L.P.; Liu, J.W. Investigation and analysis of earthquake damage of masonry structure houses in Wenchuan earthquake of “5·12”. J. Xi’an Univ. Archit. Technol. (Nat. Sci. Ed.) 2009, 41, 606–611. (In Chinese) [Google Scholar]
  13. Wu, Z.B.; Zhou, X.X.; Xie, W.; An, X.J. Earthquake damage investigation statistics and seismic design thinking of buildings in Wenchuan earthquake. Build. Struct. 2010, 40, 144–148. (In Chinese) [Google Scholar] [CrossRef]
  14. Gao, X.W.; Meng, J.Y.; Liao, X.X.; Li, H.; He, J.; Wang, J.; Xiao, W.; Wang, J.M.; Wang, Y.F.; Wu.; et al. Study on seismic test of 1/2 scale model of brick masonry building with seven story bottom frame seismic wall. Archit. Sci. 1995, 04, 18–23. (In Chinese) [Google Scholar]
  15. Zhang, R. Discussion on lateral stiffness of masonry wall with openings. Guangdong Sci. Technol. 2008, 16–17. (In Chinese) [Google Scholar]
  16. Salman, M.; Javed, M.; Asif Jan, M.; Arshad, M.A.; Hussain, S.; Rehman, Z.U. Experimental and empirical study of in-plane seismic performance of unreinforced masonry walls with large and multiple openings. Structures 2025, 78, 109190. [Google Scholar] [CrossRef]
  17. Zheng, S.S.; Yang, Y.; Zhao, H.T. Experimental study on aseismic behavior of masonry building with frame-shear wall structure at lower stories. China Civ. Eng. J. 2004, 37, 23–31. (In Chinese) [Google Scholar]
  18. Zhou, X.L.; Li, Y.M.; Song, L.B.; Tan, Q.; Shao, Y.; Hao, S.; Luo, Y.; Xing, J.; Liu, Z. Study on rational ratios of lateral stiffness for masonry building with frame structure at first two stories. Appl. Mech. Mater. 2012, 174–177, 2012–2015. [Google Scholar] [CrossRef]
  19. Chang, P.; Zhai, C.Y. Applications of multi-ribbed walls in the strengthening of masonry structures with bottom frame. Adv. Mater. Res. 2011, 163–167, 3645–3648. [Google Scholar] [CrossRef]
  20. Liu, H.B. Study on the Collapse Mechanism of Multi-Story Masonry Structure; Institute of Engineering Mechanics, China Earthquake Administration: Harbin, China, 2012. (In Chinese) [Google Scholar]
  21. Xiong, L.H.; Gao, L.J.; Xiong, C.H.; Liu, M. Study on seismic performance of frame-shear wall-masonry building. J. Shenyang Jianzhu Univ. (Nat. Sci. Ed.) 2008, 24, 586–591. (In Chinese) [Google Scholar]
  22. Yang, J. Test and Analysis on Failure Mode of Full-Scale Model of Masonry Structure Seismic Wall. Master’s Thesis, Taiyuan University of Technology, Taiyuan, China, 2013. (In Chinese) [Google Scholar] [CrossRef]
  23. Zhao, W.Z.; Wen, Z.P.; Xu, C.; Chen, B. Analysis of the effect of lateral stiffness ratio of floors on seismic fragility of masonry structures. Technol. Earthq. Disaster Prev. 2018, 13, 878–892. (In Chinese) [Google Scholar] [CrossRef]
  24. Sun, B.T.; Mei, Y.D. A study on the aseismic capacity of the confined masonry structure with variable vertical stiffness. Earthq. Eng. Eng. Dyn. 2012, 32, 1–13. (In Chinese) [Google Scholar] [CrossRef]
  25. Zhu, Z.Y.; Chen, T.T.; Zou, Z.Y.; Que, M.Y. Analysis on damage characteristics of single-bay street farmhouses in Lushan earthquake. J. Disaster Prev. Mitig. Eng. 2021, 41, 203–210. (In Chinese) [Google Scholar] [CrossRef]
  26. Liang, Y.D.; Guo, X.; Jiang, J.Z.; Jiang, Y. Seismic behaviors of bottom-business multi-story masonry structure with winged columns. China Earthq. Eng. J. 2017, 39, 623–631. (In Chinese) [Google Scholar] [CrossRef]
  27. Wu, Z.X. Seismic Behavior Comparison and Collapse Mechanism Analysis of Multi-Story Masonry Structure with First Story Used as Shops; Institute of Engineering Mechanics, China Earthquake Administration: Harbin, China, 2014. (In Chinese) [Google Scholar]
  28. Wang, S.G.; Miao, Q.S.; Liu, J.L.; Liu, W.Q.; Du, D.S. Shaking table test of masonry structures strengthened with external prefabricated reinforced concrete wall and with added story isolation. J. Build. Struct. 2012, 33, 99–106. (In Chinese) [Google Scholar] [CrossRef]
  29. Wang, X.; Gao, Y.C.; Chen, H.; Luan, X.L.; Ren, X.; Su, Z. Experimental study on seismic behavior of masonry walls with different height-width ratio strengthened by HFMRPC. J. Disaster Prev. Mitig. Eng. 2023, 43, 1057–1066+1111. (In Chinese) [Google Scholar] [CrossRef]
  30. Yan, K.; Liu, Z.; Ren, P.F.; Liu, X.Y.; Wei, R.X.; Zhao, K.Z. Experimental study on seismic performance of masonry structure with large openings at the bottom of equivalent concrete frame column replacement part of the wall. Build. Struct. 2026, 56, 85–96. (In Chinese) [Google Scholar] [CrossRef]
  31. Wu, X.X.; Xie, Q.; Zhao, P.; Jing, Y.W.; Lin, M.Q. Seismic behavior of masonry wall strengthening with ultra-high ductility concrete. J. Disaster Prev. Mitig. Eng. 2024, 44, 859–869. (In Chinese) [Google Scholar] [CrossRef]
  32. Liu, Y.S.; Tong, L.P. Effect of lateral stiffness ratio on the seismic performance of bottom frame masonry structure. Earthq. Resist. Eng. Retrofit. 2013, 35, 15–21+31. (In Chinese) [Google Scholar] [CrossRef]
  33. Guo, M.; Li, C.; Xu, F.Q. Research on the concept and seismic design theory of the bottom strengthened story of multi-story masonry structure. J. Nat. Disasters 2022, 31, 27–41. (In Chinese) [Google Scholar] [CrossRef]
  34. Garcia-Ramonda, L.; Pelà, L.; Roca, P.; Camata, G. Experimental cyclic behaviour of shear masonry walls reinforced with single and double layered steel reinforced grout. Constr. Build. Mater. 2022, 320, 126053. [Google Scholar] [CrossRef]
  35. Tripathy, D.; Singhal, V. Strengthening of weak masonry assemblages using wire reinforced cementitious matrix (WRCM) for shear and flexure loads. Constr. Build. Mater. 2021, 277, 122223. [Google Scholar] [CrossRef]
  36. Meriggi, P.; Caggegi, C.; Gabor, A.; Felice, G. Shear-compression tests on stone masonry walls strengthened with basalt textile reinforced mortar (TRM). Constr. Build. Mater. 2022, 316, 125804. [Google Scholar] [CrossRef]
  37. Xu, W.; Zhang, T.; Chen, X.; Miao, Q.; Wang, S.; Du, D. Experimental and numerical investigation on the seismic performance of masonry walls reinforced by PC panels. J. Build. Eng. 2022, 58, 105049. [Google Scholar] [CrossRef]
  38. Li, W.; Wang, T.; Chen, X.; Zhong, X.; Pan, P. Pseudo-dynamic tests on masonry residential buildings seismically retrofitted by precast steel reinforced concrete walls. Earthq. Eng. Eng. Vib. 2017, 16, 587–597. [Google Scholar] [CrossRef]
  39. Jing, D.H.; Xing, K.L. Axial Compressive Characteristics of Brick Masonry Wall Strengthened by Steel Strips. IOP Conf. Ser. Mater. Sci. Eng. 2018, 392, 022005. [Google Scholar] [CrossRef]
  40. GB 50011—2010; Code for Seismic Design of Buildings. China Architecture & Building Press: Beijing, China, 2010. (In Chinese)
  41. GB/T 50081—2019; Standard for Test Methods of Concrete Physical and Mechanical Properties. China Architecture & Building Press: Beijing, China, 2019. (In Chinese)
  42. JGJ/T 70—2009; Standard for Test Method of Performance on Building Mortar. China Architecture & Building Press: Beijing, China, 2009. (In Chinese)
  43. GB/T 5101—2017; Fired Common Bricks. Standards Press of China: Beijing, China, 2017. (In Chinese)
  44. GB/T 228.1—2021; Metallic Materials-Tensile Testing-Part 1: Method of Test at Room Temperature. Standards Press of China: Beijing, China, 2021. (In Chinese)
  45. GB 50009—2012; Load Code for the Design of Building Structures. China Architecture & Building Press: Beijing, China, 2012. (In Chinese)
  46. JGJ/T 101—2015; Specification for Seismic Test of Buildings. China Architecture & Building Press: Beijing, China, 2015. (In Chinese)
Figure 1. Schematic diagram of the structural model (unit: mm). (a) Bottom floor. (b) Standard floor. (c) Side facade of the bottom floor with large openings. (d) Side facade of the bottom floor without large openings.
Buildings 16 02923 g001
Figure 2. Fabrication procedures of the structural model.
Buildings 16 02923 g002aBuildings 16 02923 g002b
Figure 3. Dimension and reinforcement details of the reinforced concrete wall, constructional columns and frame beams (unit: mm).
Buildings 16 02923 g003
Figure 4. Dimension and reinforcement of ground beams (unit: mm).
Buildings 16 02923 g004aBuildings 16 02923 g004b
Figure 5. Loading equipment and regime.
Buildings 16 02923 g005
Figure 6. Measuring point arrangement of the displacement and steel rebar strain of the structural model. (a) Displacement measuring points at the facade of the 1-axis (unit: mm). (b) Strain measuring point of the steel rebar in Q1. (c) Strain measuring point of the steel rebar in Q2. (d) Strain measuring point of the steel rebar in Q3.
Buildings 16 02923 g006
Figure 7. Measuring point arrangement of the strain on the reinforced concrete walls and frame beams along the A-axis (note: the numbers with circle represent the identification numbers of the strain gauges).
Buildings 16 02923 g007
Figure 8. Cracking patterns on the surface of walls Q1 and Q5 (note: the unit of the cracking load in this figure is kN).
Buildings 16 02923 g008
Figure 9. Cracking patterns on the surface of walls Q2 and Q4 (note: the unit of the cracking load in this figure is kN).
Buildings 16 02923 g009
Figure 10. Cracking pattern on the surface of wall Q3 (note: the unit of the cracking load in this figure is kN).
Buildings 16 02923 g010
Figure 11. Cracking patterns of the longitudinal walls at the second floor along the A-axis (note: the unit of the cracking load in this figure is kN).
Buildings 16 02923 g011
Figure 12. Cracking patterns of the longitudinal walls along the D-axis (note: the unit of the cracking load in this figure is kN). (a) Cracks on the D-8 longitudinal wall at the bottom floor. (b) Cracks on the window edge of D-8-9 longitudinal wall at the third floor. (c) Cracks on the D-2 longitudinal wall at the bottom floor. (d) Diagonal cracks on the D-8 longitudinal wall at the bottom floor.
Buildings 16 02923 g012
Figure 13. Cracking patterns on the surface of transverse wall and inner longitudinal wall. (note: Cracks generated by the application of thrust are marked with black symbols, whereas those generated by the application of tensile force are marked with red symbols. (a) Cracks on the transverse wall. (b) Cracks on the interior longitudinal wall.
Buildings 16 02923 g013
Figure 14. Displacement and inter-story displacement at the control points of each floor.
Buildings 16 02923 g014
Figure 15. The strain of the steel rebar in reinforced concrete walls.
Buildings 16 02923 g015
Figure 16. A schematic diagram of the force analysis for wall Q1.
Buildings 16 02923 g016
Figure 17. Strain of the concrete in the frame beams. (a) Concrete strain of the frame beam at 1-3-A. (b) Concrete strain of the frame beam at 3-5-A. (c) Concrete strain of 16#, 27#, 18#, and 29#. (d) Concrete strain of 22#, 31#, 24#, and 33#.
Buildings 16 02923 g017
Figure 18. Schematic diagram for the bending moment of the frame beam under cycle loading. (a) Bending moment of the frame beam under push. (b) Bending moment of the frame beam under tension (note: the numbers with circle represent the grid number).
Buildings 16 02923 g018
Figure 19. Strain of the concrete in reinforced concrete walls.
Buildings 16 02923 g019
Figure 20. The hysteresis curve of each floor in the structural model.
Buildings 16 02923 g020
Figure 21. A comparison of the skeleton curve of each floor in structural model.
Buildings 16 02923 g021
Figure 22. Comparison of the stiffness degradation curve of each floor in the structural model.
Buildings 16 02923 g022
Table 1. Mechanical properties of steel bar.
Grade of Steel BarDiameter
(mm)
Yield Strength
(MPa)
Ultimate Strength
(MPa)
HRB4002589791
4531743
6487610
8449607
10400590
Table 2. Widths of the reinforced concrete walls at bottom floor and masonry wall at standard floor.
Type of Wall NumberWidth (mm)
Masonry walls at standard floorL1, L5225
L2, L4538
L3625
Reinforced concrete walls at bottom floorQ1, Q5150
Q2, Q4290
Q3340
Table 3. Torsional irregularity criteria.
Criteria for JudgmentControl Point for Displacement Loading/mm
0.40.60.81.82.86.412.0
2 δ MAX δ 1 + δ 2 1.001.001.001.011.021.021.04
Disclaimer/Publisher’s Note: The statements, opinions and data contained in all publications are solely those of the individual author(s) and contributor(s) and not of MDPI and/or the editor(s). MDPI and/or the editor(s) disclaim responsibility for any injury to people or property resulting from any ideas, methods, instructions or products referred to in the content.