


Abstract
The response modification factor R is a fundamental parameter in seismic design, linking the elastic demand expected under strong ground motion to the reduced forces used in practice. It reflects the capacity of well-detailed structures to dissipate energy through stable inelastic behavior while maintaining sufficient strength, stiffness, and deformation capacity to prevent collapse. Accordingly, R directly influences design base shear, member forces, reinforcement demands and expected seismic performance. It is prescribed by seismic codes as a single typology dependent value, although analytical evidence indicates that its magnitude varies systematically with structural configuration. Therefore, this study decomposes R for twelve reinforced concrete moment-resisting frame archetypes that combine three heights (4, 8, and 14 stories) with four span configurations (1–4 spans) over a constant 12 m plan length. All frames are designed per ACI 318-19 and ASCE/SEI 7-22 for the Pedernales, Ecuador, subduction-zone seismic hazard. The response modification factor R is evaluated through a component-based decomposition that separates the effects of ductility, overstrength, and redundancy—namely the capacity ductility , the demand ductility , the overstrength , and a geometric redundancy index , using bilinearized pushover analyses. Dynamic verification, used here as a consistency check, is explicitly restricted to the low-rise class (four-story frames) through nonlinear response-history analysis under eleven spectrum-matched ground-motion records; results for the 8- and 14-story frames are therefore pushover-based only. To bracket the inelastic reduction capacity, a demand-based companion factor is reported and defined as the demand-based counterpart of R, providing a capacity-oriented estimate R and a demand-oriented companion estimate . R ranges from 3.80 to 14.56, whereas ranges from 1.82 to 7.63. The component ranges are the capacity ductility –, the demand ductility –, the overstrength –, and the geometric redundancy index –. Capacity ductility saturates in taller frames (about variation). In addition, and exhibit a mechanical trade-off that challenges the independence assumption implicit in the multiplicative decomposition. Dynamic results corroborate the pushover-implied demand only for the low-rise class; no extrapolation to taller frames is claimed. Overall, the findings motivate configuration-sensitive analytical calibration as a prerequisite for any future normative discussion on R.
1. Introduction
Reinforced concrete moment-resisting frames (RC MRFs) are widely used in mid-rise construction across seismic regions of Latin America, including Ecuador [1,2]. Across subduction-dominated seismic regions of South America, past earthquakes have revealed significant deficiencies in non-engineered buildings, while the Pedernales earthquake of 16 April 2016 in Ecuador also exposed vulnerabilities in the reinforced-concrete building stock, including engineered buildings [2,3,4]. Beyond the regional setting, the recurrence of comparable damage across major seismic events reflects a common set of governing mechanisms. Reconnaissance studies of code-deficient and partially compliant RC frames have repeatedly attributed severe damage and collapse to soft- and weak-story column-sway mechanisms, insufficient transverse confinement and inadequate development length, short-column effects, beam–column joint shear failures, and violations of the strong-column/weak-beam hierarchy. The 6 February 2023 Kahramanmaraş (Türkiye) earthquake doublet ( and ) provided a recent large-magnitude confirmation of these vulnerabilities, with extensive heavy damage and collapse of RC buildings associated with inadequate detailing, deficient construction materials, and noncompliance with capacity-design principles [5].
Under strong seismic excitation, the behavior of RC frames is governed by the coupled effects of ductility, overstrength, and redundancy. These parameters collectively define the capacity of a structural system to dissipate hysteretic energy, redistribute internal forces after local yielding, and preserve global stability throughout inelastic response. Their influence becomes particularly relevant once the structure departs from the elastic range, where reserve strength, alternative load paths, and deformation capacity largely determine damage progression and collapse resistance. Accordingly, rigorous quantification of these performance factors is essential for reliable seismic assessment, rational code calibration, and the development of resilient design strategies for RC frame systems [6,7,8].
Current design practice in the region frequently follows force-based procedures consistent with ACI 318-19 [9] and ASCE/SEI 7-22 [10], which reduce the elastic spectral demand through a single prescriptive response modification factor R—set equal to 8 for special moment-resisting frames (SMRFs), regardless of height, number of spans, or other configurational attributes of the system. This single-value treatment of R has been the subject of sustained scrutiny in the code-calibration literature [11,12], yet the quantitative evidence required to justify configuration-sensitive values remains fragmented across structural typologies, modeling assumptions, and seismic hazard contexts [13,14]. Internationally, the same inelastic force reduction is represented through different code formats—the response modification factor R in ASCE/SEI 7-22 and the behaviour factor q in European practice—yet in both cases the value is assigned at the typology level rather than at the configuration level. The principal criticisms documented in the literature are that such factors are period-dependent, sensitive to structural configuration and detailing, and historically lacked an explicit probabilistic basis until collapse-oriented calibration frameworks such as FEMA P-695 were introduced; more recent work has additionally questioned the consistency of transferring linear-analysis concepts to nonlinear static procedures within new-generation codes [15].
Recent studies have further documented the limitations of assigning a single response modification factor to broad structural categories. Parametric and probabilistic assessments have shown that computed values of R may vary with height, structural regularity, detailing level, analysis method, and performance objective [16,17,18]. Cui et al. [19] probabilistically assessed the response modification factor of RC frames using a demand-capacity-factor method, highlighting the role of collapse-prevention confidence levels in R calibration. Caballero-Castro et al. [20] evaluated R for RC and steel moment-resisting frames equipped with TADAS devices in a high-seismic-hazard region of Colombia, emphasizing the system- and region-dependent nature of response modification factors. Safi et al. [21] examined deficient RC frames in a developing-country context and showed that code-level R values may be inappropriate when local construction and detailing practices are considered. In parallel, Cook et al. [22] assessed modern RC archetype buildings using a probabilistic performance-based recovery framework, reinforcing the value of archetype-based studies for understanding the performance delivered by modern code-designed RC systems. In parallel, recent studies in construction materials continue to refine low-carbon cementitious composites with enhanced deformation capacity and sustainability attributes relevant to future seismic-performance research [23].
It is well established that the response modification factor R can be decomposed, following Uang [12], into the product of a ductility reduction factor , an overstrength factor , and a redundancy factor :
Each factor has a distinct physical interpretation. The ductility reduction factor quantifies the reduction in elastic force demand attributable to inelastic deformation capacity. Foundational calibrations were proposed by Miranda and Bertero [14], who developed period-dependent relationships; by Park [24], through equivalent-yielding bilinearization; and by Borzi and Elnashai [25], who formulated inelastic spectral ratios. The overstrength factor is commonly defined as the ratio between the ultimate base shear and the yield base shear [26,27,28], representing a structurally variable strength reserve that, in bare-frame analytical models, may differ substantially from code-prescribed values.
The redundancy factor is arguably the least uniformly defined component of Equation (1). In the literature, redundancy has been interpreted as a physical sensitivity measure based on element removal [29,30], as a reliability- and configuration-related concept in seismic design discussions [31], and as a geometric or topological measure associated with structural connectivity [32]. These different definitions are not interchangeable and have direct consequences for the interpretation of computed R values.
The conceptual scope of structural redundancy has evolved substantially since its introduction as a qualitative safety attribute. Bertero and Bertero [31] distinguished between physical redundancy, understood as the ability of a structure to redistribute loads after the loss or degradation of individual load-resisting elements, and configurational redundancy, associated with the multiplicity and arrangement of available load paths in the as-designed structural system. This distinction is not merely semantic: different redundancy definitions may generate different numerical indices for the same structure, and their conflation has been a persistent source of discrepancy in the literature.
Husain and Tsopelas [29] and Tsopelas and Husain [30] proposed quantitative redundancy indices for two-dimensional RC frames using element-removal procedures. In their formulation, redundancy is evaluated by comparing the ultimate strength of the complete structure with that of a modified structure in which selected elements are removed. This approach captures physical redundancy through loss-of-load-path sensitivity. In parallel, nonlinear studies on code-designed reinforced concrete structural systems have shown that lateral response parameters are strongly affected by configuration and detailing assumptions [33], while collapse-oriented studies of ductile RC moment frames have more commonly evaluated system safety through nonlinear dynamic analysis and probabilistic collapse metrics [34]. Massumi and Mohammadi [35] extended redundancy-related investigations to three-dimensional RC frames under seismic excitation, reporting spatial effects that may deviate from their two-dimensional counterparts.
A complementary line of research has examined the influence of geometric configuration on the response modification factor. For example, Hussein et al. [32] studied the effect of non-uniform frame dimensions and span configuration on computed R values for RC frames, supporting the idea that geometric reconfiguration may influence the apparent ductility and strength components of seismic response. However, it is important to clarify the scope of the present study. This work does not evaluate three-dimensional plan redundancy, torsional redistribution, or the number of parallel lateral-resisting frames within a building plan. Instead, it introduces a relative two-dimensional geometric topology index, denoted here as , obtained by comparing frame elevations with different numbers of spans but the same total frame length and height class. Therefore, is used as a controlled measure of span reconfiguration within a 2D frame archetype, not as a direct substitute for the physical redundancy factor or for the redundancy coefficient used in seismic design codes.
This clarification is essential because the phrase “geometric redundancy” may otherwise suggest that the study measures plan redundancy associated with multiple parallel frames in a three-dimensional structure. In the present work, the adopted index is narrower: it quantifies how changing the number of spans in a 2D frame, while keeping the total frame length fixed, modifies the ultimate base shear relative to a four-span reference configuration of the same height. Thus, the study addresses a topology-controlled parametric effect rather than a full redundancy assessment in the element-removal or three-dimensional plan sense.
Furthermore, response modification factors have been treated within the FEMA P-695 framework [8] through probabilistic collapse-based calibration and within performance-based seismic assessment frameworks [36,37,38]. Nevertheless, tabulated R values in design codes [2,10,39,40,41,42] typically assign system-level values that do not explicitly vary with the controlled span configurations examined here, including span count, bay length, and height class. Consequently, the influence of controlled geometric reconfiguration on the components of R remains insufficiently quantified for RC moment frames subjected to subduction-zone seismic hazard [17,18,32].
Meanwhile, the overstrength factor prescribed by ASCE/SEI 7-22 for SMRFs, i.e., , has not been fully reconciled with the lower analytical values commonly reported for bare-frame idealizations [26,27,43]. This discrepancy is often attributed to reserve strength from nonstructural components, slab participation, and other mechanisms not explicitly included in bare-frame models; however, these contributions are rarely quantified in a consistent archetype-based framework. Similarly, the interaction among ductility, overstrength, and the adopted geometric topology index has not been resolved with sufficient parametric resolution, particularly regarding whether the components in Equation (1) behave as independent multipliers or become mechanically coupled when building height and span configuration vary simultaneously.
Addressing these gaps requires a controlled parametric decomposition of R over a consistent set of RC frame archetypes. The present study therefore examines twelve two-dimensional RC moment-frame archetypes combining three height classes (4, 8, and 14 stories) and four span configurations (1, 2, 3, and 4 spans) under a fixed total frame length of 12 m. The archetypes were designed in accordance with ACI 318 [9] and ASCE/SEI 7 [10] provisions for Seismic Design Category D for the Pedernales, Ecuador, seismic-hazard context.
The objective of this study is to quantify how the response modification factor R and its components vary with two controlled geometric variables: structural height and span reconfiguration under fixed total frame length. More specifically, the study asks how much of the variation in R is associated with height class and how much is associated with changing the number of spans in a 2D RC moment-frame archetype, while maintaining a consistent design, modeling, and analysis protocol. This formulation intentionally avoids claiming a direct measurement of plan redundancy and instead focuses on a reproducible 2D topology-controlled index.
The manuscript is organized as follows. Section 2 describes the archetype matrix, constitutive framework, nonlinear modeling assumptions, analysis protocols, and the mathematical decomposition of R and its components. Section 3 reports the elastic dynamic characterization, nonlinear static capacity, dynamic verification of the low-rise class, and parametric evolution of the R components. Section 4 interprets the findings with explicit attention to the scope and limitations of the proposed index. Section 5 summarizes the conclusions and outlines future work.
2. Materials and Methods
The proposed approach is organized as a reproducible framework that can be applied to other RC frame typologies. It comprises six sequential steps: (i) code-compliant design of the archetype set under a common hazard, material, and detailing basis; (ii) nonlinear modeling with lumped-plasticity hinges defined from the as-designed sections; (iii) three analysis protocols (modal response-spectrum characterization, first-mode pushover, and nonlinear response-history analysis restricted to the low-rise class); (iv) FEMA 440 equal-area bilinearization of each pushover curve; (v) extraction of the components—capacity ductility , demand ductility , overstrength , and the geometric redundancy index —from the bilinearized curves; and (vi) synthesis of the capacity-based factor R and the demand-based companion . The complete workflow is summarized below, and the equations and parameters required to reproduce each step are given in Section 2.1, Section 2.2, Section 2.3, Section 2.4 and Section 2.5.
2.1. Structural Archetypes
Twelve two-dimensional RC SMRF archetypes were generated to examine the combined effects of structural height and span reconfiguration on R, as both parameters are necessary variables in the assessment of seismic response (Figure 1). The investigated configurations comprised three height levels of 4, 8, and 14 stories, representing low-rise, mid-rise, and high-rise categories, together with four bay arrangements of 1, 2, 3, and 4 spans.
Figure 1.
Schematic representation of the RC archetypes adopted in this study.
A uniform story height of 3.5 m was adopted, resulting in total building heights of 14 m, 28 m, and 49 m. A constant plan length of m was maintained across all configurations to preserve slenderness; consequently, the individual span length decreases as the number of spans increases (i.e., 12.0, 6.0, 4.0, and 3.0 m).
This geometric constraint isolates the effect of span count at invariant plan extent, consistent with the parametric scheme adopted by Hussein et al. [32] for non-uniform RC frames. The geometric properties were not obtained from a performance-based optimization or a section-level iterative design; rather, they were fixed a priori to define a controlled parametric matrix. The 3.5 m story height and the 12 m plan length correspond to common mid-rise residential RC practice in the region, whereas the three height classes (4, 8, and 14 stories) were selected to span the short-, intermediate-, and long-period ranges of the design spectrum, so that the influence of the fundamental period on the decomposition could be examined. Within this matrix, the number of spans is the single controlled geometric variable at fixed total plan length. Figure 1 shows the archetypes analyzed.
All archetypes were idealized as bare frames with rigid diaphragms, while infill walls and other nonstructural components were excluded from the analytical model. The rigid-diaphragm assignment enforces in-plane (membrane) kinematic compatibility among the nodes of each floor, which is the physically appropriate representation of the in-plane rigidity provided by a cast-in-place slab; as a consequence, relative axial elongation of the beams within a floor is restrained. This restraint is consistent with the bare-frame scope adopted here and has a limited effect on the quantities governing the decomposition ( and ), which are controlled by the flexural beam-sway mechanism of the capacity-designed (strong-column/weak-beam) frames at the moderate deformation levels attained (peak interstory drift , with no archetype reaching collapse). The amplification of column axial demand by beam elongation becomes significant mainly near collapse, a regime that is explicitly outside the scope of the present study; it is therefore noted as a limitation of the planar bare-frame idealization. This idealization was intentionally adopted to isolate the analytical value of R attributable solely to the primary lateral force resisting system, thereby avoiding conflation with auxiliary reserve mechanisms that may be implicitly embedded in code-prescribed values, including overstrength, redundancy, and nonstructural contributions [8,12,28,43].
The analysis was deliberately formulated in two dimensions for the same reason of control: a planar moment-frame model isolates the in-plane decomposition of R from three-dimensional effects—plan redundancy arising from multiple parallel frames, torsional redistribution, and bidirectional demand—that would otherwise confound the geometric index and the interpretation of its components. These three-dimensional effects are acknowledged as outside the present scope and are identified as future work; the planar idealization is therefore consistent with the controlled, configuration-isolating objective of the study rather than an attempt to reproduce the full spatial response of a complete building.
The archetypes were designed for Seismic Design Category D in Pedernales, Ecuador, on Site Class D soil, adopting the code-prescribed value of for SMRFs [2,10]. Cross-sectional dimensions were updated stepwise every two stories in the 4-story frames and every four stories in the 8- and 14-story frames, while satisfying the code limits on sectional reduction between adjacent levels [9]. Strong-column weak-beam requirements and joint shear capacity were verified for all archetypes.
Regarding the mechanical properties of the materials and design parameters, they are summarized in Table 1. Gravity loads were assigned assuming residential occupancy. The seismic mass lumped at each floor level was obtained from the gravity loads as , where kN m−2 and kN m−2 are listed in Table 1, is the live-load participation factor adopted in accordance with ASCE/SEI 7-22, Section 12.7.2, is the tributary floor area assigned to the planar frame (1.0 m out-of-plane tributary width was adopted), and m s−2. Concrete was modeled using the unconfined and confined stress–strain constitutive law [44]. Reinforcing steel was modeled using the Park [24] strain-hardening bilinear model.
Table 1.
Material constitutive models, gravity loads, and seismic design parameters.
2.2. Nonlinear Modeling Assumptions
All archetypes were modeled using SAP2000 analysis software [45]. A lumped-plasticity formulation was adopted, with concentrated plastic hinges located at the ends of all beam and column elements in accordance with the modeling parameters of ASCE/SEI 41-17 [46]. Beams were assigned a uniaxial flexural hinge, while columns were assigned a coupled hinge governed by the interaction of axial force and biaxial bending moments (a P-M-M interaction hinge), with yield and post-yield surfaces auto-generated from the section geometry, longitudinal reinforcement, and the expected material strengths. The hinge properties were thus generated directly from the as-designed sections rather than from generic tabulated values, with inelasticity concentrated at the member-end hinges. Gross (uncracked) section properties were assigned to the elastic portions of the elements; the post-cracking and post-yield stiffness reductions are represented explicitly through the ASCE/SEI 41-17 hinge backbones rather than through effective-stiffness multipliers applied to the elastic members. It is acknowledged that adopting gross elastic stiffness yields shorter elastic periods and smaller elastic drifts than an effective-cracked-stiffness idealization would; however, because the decomposition is evaluated on the FEMA 440 bilinearized curves (Section 2.5), in which an equivalent yield stiffness is recovered through the equal-area procedure, the relative configuration trends that constitute the findings of this study are not sensitive to this choice. Acceptance criteria for the performance levels were taken from ASCE/SEI 41-17. The adopted hinge backbone includes post-yield and post-peak branches according to the ASCE/SEI 41-17 component modeling framework [46]. The lumped-plasticity idealization was adopted because it provides a standardized, code-anchored, and computationally tractable representation of member-level inelasticity that can be applied consistently across the twelve archetypes and the three sequential analysis protocols. For frames detailed to satisfy the strong-column/weak-beam hierarchy and responding primarily in their first mode, inelastic action is expected to concentrate at the member ends, where the concentrated-hinge formulation is most appropriate; the ASCE/SEI 41-17 backbones employed here are the same component models adopted in collapse-oriented assessment of ductile RC frames [34]. As noted in the Limitations, this formulation does not explicitly represent distributed plasticity or the full set of cyclic-deterioration mechanisms, which would be required for collapse-level simulation but are not necessary for the system-level capacity decomposition pursued here.
Beam-column joints were modeled as rigid zones, as well as column bases were assumed fully fixed. Second-order geometric effects (P–) were considered through geometric nonlinearity of the stiffness matrix, consistent with the recommendation of Haselton et al. [34] for collapse-oriented assessment. In the present two-dimensional archetypes, the entire tributary gravity load is carried by the columns of the modeled frame; there are no gravity-only (non-lateral) columns excluded from the model. Consequently, the geometric stiffness already acts on the complete tributary gravity load, and the destabilizing P– effect is represented in full without the need for a separate leaning (P–) column. The gravity loads were applied first and held constant during both the pushover and the response-history analyses, so that the second-order demand is consistently included throughout the inelastic response.
Classical Rayleigh damping was adopted for nonlinear response history analyses with a critical damping ratio of . The Rayleigh damping coefficients were calibrated using two anchor periods. The first corresponded to the fundamental vibration mode T1, while the second T2 was selected as the mode at which the cumulative modal mass participation reached at least 90% of the total structural mass. Furthermore, the stiffness proportional damping term was based on the initial elastic stiffness matrix rather than the tangent stiffness.
The nonlinear dynamic response was solved by direct time integration using the Newmark- method with and (i.e., average-acceleration, unconditionally stable). An integration time step of , was employed, where denotes the period of the highest order mode contributing significantly to the structural response. Equilibrium at each time step was enforced through full Newton–Raphson iterations with a relative energy convergence tolerance of . Figure 2 shows the methodology followed in this research.
Figure 2.
Integrated methodology.
2.3. Analysis Protocols
Three analysis protocols were executed sequentially for each archetype. First a linear modal response-spectrum analysis was performed for elastic dynamic characterization. Then a nonlinear static pushover analysis was used for evaluating the design parameters. Finally a nonlinear response history analysis (NLRHA), restricted to the 4-story archetype, was performed to verify the dynamic shear demands. This sequential scheme follows Fajfar [38] methodology and is consistent with the comparative pushover dynamic protocol presented by Mwafy & Elnashai [47].
2.3.1. Nonlinear Static Pushover Analysis (NSP)
A displacement-controlled pushover analysis was performed on each archetype under an invariant lateral load pattern proportional to the first-mode shape. This choice is justified by the dominance of the fundamental mode in the translational direction (>80% mass participation for all archetypes) while acknowledging the well-documented limitations raised by Krawinkler & Seneviratna [48] for tall frames, which motivate the complementary nonlinear dynamic verification described below. The use of a single first-mode load pattern is consistent with this strong first-mode dominance, particularly for the low-rise class. It is acknowledged that applying a second (e.g., uniform) load profile is a recommended practice for bracketing the uncertainty of the capacity curve, as it tends to increase the base-shear capacity while reducing the displacement capacity [15]; this effect is most relevant for the taller frames, where higher-mode contributions are larger. The use of multiple and adaptive load patterns is therefore identified as part of the future extension of the assessment to the mid- and high-rise classes. Gravity loads were applied first as a nonlinear static case and maintained as the initial state for the lateral pushover. The roof node was adopted as the control node. The analysis was continued until a 20% post-peak strength drop was observed or until numerical instability precluded convergence.
2.3.2. Nonlinear Response-History Analysis (NLRHA)
Nonlinear response-history analyses were performed as a dynamic consistency check for the low-rise class only (i.e., the four 4-story archetypes). It is emphasized that the response modification factor R and its components are obtained entirely from the static pushover decomposition described in Section 2.5; the NLRHA results do not enter the computation of R. Their role is limited to checking whether the low-rise dynamic response is consistent with the pushover-based trends in the archetype class for which first-mode dominance makes the nonlinear static procedure most reliable. A suite of eleven horizontal acceleration records, obtained from six earthquake events and spectrally matched over the range –, was applied independently to each low-rise archetype. Thus, 11 NLRHA were conducted per 4-story archetype, resulting in 44 nonlinear dynamic analyses in total.
The low-rise class was selected because the 4-story archetypes exhibit the shortest fundamental periods (– s), placing them close to the spectral amplification plateau of the target spectrum. In addition, pushover–dynamic correspondence is generally more reliable in low-rise frames where first-mode dominance is pronounced [47,48]. Conversely, extending NLRHA to the 8- and 14-story archetypes would require height-specific record conditioning and larger suites to account for higher-mode effects and record-to-record variability [48,49].
Accordingly, the 8- and 14-story archetypes are incorporated into the R framework solely through static decomposition. This limitation in scope is explicitly maintained in Section 4. For each NLRHA, peak roof displacement, peak interstory drift, and base shear at the first plastic hinge event were recorded.
2.4. Ground-Motion Selection
A suite of eleven horizontal acceleration records, obtained from six earthquake events, was selected from the PEER NGA-West2 database where available and supplemented with public strong-motion records for the 2016 Pedernales earthquake. The suite size is consistent with the minimum number of ground motions specified in ASCE/SEI 7-22 for nonlinear response-history analysis when mean response quantities are used [10]. This minimum suite is appropriate for the present purpose because the dynamic analyses are used only to obtain mean response quantities for a bounded consistency check, and not to calibrate R itself. A probabilistic or fragility-based estimate of R—which would indeed require substantially larger and more systematically conditioned record sets, for example through incremental dynamic analysis—is explicitly outside the scope of this study; consequently, the sensitivity of a derived R to the number of records does not arise here, since R is defined from the static decomposition.
Record selection followed the recommendations of Baker [50], Iervolino et al. [51], and Kohrangi et al. [52], considering magnitude range, soil classification, fault mechanism, and tectonic regime. The adopted suite was composed of records with moment magnitudes ranging from 5.91 to 7.80, consistent with the subduction-zone seismic hazard of the Ecuadorian coast [3]. Site conditions were represented by values approximately between 200 and 290 m/s, compatible with Site Class D. Preference was given to reverse and oblique-reverse faulting mechanisms, representative of subduction-related seismic environments. The complete set of records is presented in Table 2.
Table 2.
Selected horizontal acceleration records and key seismic properties.
Amplitude-based spectral matching was performed to enforce compatibility with the NEC-SE-DS target design spectrum for the Pedernales site over the period range – of the 4-story archetype class. The matching tolerance was defined such that the mean matched spectrum did not fall below 90% of the target spectrum at any period within the matching interval.
2.5. Data Processing
The pushover capacity curve (base shear V vs. roof displacement ) was bilinearized using the equal-area method of FEMA 440 [53], yielding the yield point (, ) and the ultimate point (, ). The yield displacement corresponds to the intersection of the elastic-equivalent branch with the post-yield branch under equal areas beneath the original and idealized curves. The ultimate displacement is defined as the 80% post-peak strength threshold of the pushover curve, consistently with commonly adopted collapse-prevention conventions in nonlinear static assessment [46,53]. The development of local plastic-hinge states was monitored in parallel with this global criterion. No beam or column hinge reached its component-level Collapse Prevention limit before the global 20% post-peak strength-drop threshold was attained. Consequently, the capacity ductility reported in this study is governed by the global capacity-curve criterion and is not controlled by premature local element failure. Throughout this work, the ultimate state refers to the aforementioned condition, since no NLRHA simulation reached global collapse. Accordingly, the pushover-derived constitutes the governing ultimate measure adopted throughout the decomposition.
The performance point (, ) was obtained through the capacity spectrum method [53], intersecting the capacity curve (acceleration–displacement response spectrum, ADRS) with the site demand spectrum reduced by equivalent viscous damping. Because the resulting displacement demand directly controls the demand ductility ratio, inelastic displacement demand is interpreted following established displacement-ratio concepts [54]. The ratio was used as a global demand-to-capacity indicator to contextualize the performance point with respect to the adopted ultimate displacement. It should not be interpreted as a substitute for component-level IO, LS, and CP acceptance checks under ASCE/SEI 41-17.
Capacity ductility , demand ductility , overstrength , and the geometric redundancy index are extracted from bilinearized pushover curves, and the synthesized factor is reported alongside a demand-based companion factor to bracket the inelastic reduction capacity.
Subsequently, the response modification factor was computed following the canonical decomposition formalized by Uang [12], while recognizing that code-level calibration of seismic performance factors would require a probabilistic framework such as FEMA P-695 [8]. The demand ductility, capacity ductility, overstrength, and geometric redundancy index are defined as:
Equations (2) and (3) follow the FEMA 440 convention [53], with , , and extracted from the bilinearized pushover curve as described in Section 2.5. Equation (4) defines the analytical overstrength ratio used in this study as the ratio between ultimate and yield base shear of the bare-frame pushover curve.
The redundancy index in Equation (5) is defined as the ratio between the ultimate base shear of the i-span configuration and that of the four-span baseline configuration of the same height class. This operational definition constitutes a geometric redundancy index (), which differs conceptually from the classical physical redundancy factor, which quantifies the loss of capacity upon removal of individual load-resisting elements [30,35].
The distinction between physical redundancy (element-removal basis) and configurational redundancy (geometry basis) was articulated by Bertero & Bertero [31]. The index adopted here captures the latter and is explicitly labeled throughout to avoid conceptual conflation.
As a secondary metric, a demand-based companion factor is reported:
substitutes the demand ductility for the capacity ductility and thus represents the reduction factor associated with the seismic demand imposed on the archetype by the code spectrum, rather than the upper-bound inelastic capacity available. The dual reporting of R and provides a conservative envelope for analytical inspection; its use as a normative-calibration statement would require dynamic validation at all height classes and is not claimed here.
For the 4-story archetypes, lognormal exceedance functions of the maximum interstory drift ratio were fitted to the NLRHA results to compare the drift-demand distribution against selected global performance thresholds.
3. Results
This section reports the numerical outcomes of the three analysis protocols of Section 2. The complete numerical matrix across the twelve archetypes is compiled in Table 3, which serves as the quantitative backbone for all subsequent subsections.
Table 3.
Response modification factor decomposition.
3.1. Elastic Dynamic Characterization
The fundamental period and the maximum elastic interstory drift ratio () are reported in Figure 3 as functions of the number of spans () for each height class. increases monotonically with height, spanning 0.526 s (4 stories, 4 spans) to 1.522 s (14 stories, 1 span)—a 2.89× amplification driven by the increase in translational mass and in deformable element length. Within each height class, decreases monotonically with the number of spans: the 14-story class exhibits the strongest sensitivity (a 14.3% reduction from one to four spans), followed by the eight-story (11.5%) and eight-story (9.0%) classes.
Figure 3.
Dynamic characterization as a function of : (a) ; (b) .
The design-level interstory drift ratio, obtained from the response-spectrum analysis after applying the code-based amplification, ranges from 0.96% (four stories, four spans) to 1.75% (14 stories, 1 span). All twelve archetypes satisfy the 2% NEC-SE-DS serviceability threshold and remain below the 2.5% ASCE/SEI 7-22 collapse-prevention limit.
3.2. Ground-Motion Suite and Spectral Coverage
The eleven selected horizontal acceleration records were amplitude-matched to the NEC-SE-DS target design spectrum for the Pedernales site (Figure 4). The mean of the matched spectra remains within ±10% of the target across the matching interval –.
Figure 4.
Acceleration response spectra of the eleven scaled ground-motion records shown against the NEC-SE-DS target design spectrum, the ensemble mean, and the 90–110% acceptance bounds; the spectral-matching interval is indicated.
Figure 4 presents the individual scaled record spectra together with the NEC-SE-DS target design spectrum, the ensemble mean, and the 90–110 percent acceptance bounds. Over the matching interval –, the ensemble mean satisfies the prescribed tolerance, whereas the individual spectra show the expected record-to-record variability around the target.
Residual record-to-record variability is retained after spectral matching, thereby transmitting part of the aleatory ground-motion variability into the NLRHA responses reported in Section 3.5.
3.3. Nonlinear Static Capacity (Pushover)
The monotonic pushover capacity curves for the twelve archetypes are presented as a composite in Figure 5, organized by number of spans. In the one-span class, the peak base shear increases from 273.7 kN (4 stories) to 441.5 kN (14 stories); within any height class, decreases with span count because the lateral demand is redistributed across more columns. The ratio decreases monotonically with height, from ≈4.9 for the four-story frames to ≈3.0 for the 14-story frames, reflecting earlier strength degradation and the increasing contribution of P- in taller configurations [34]. Most consequentially, drops sharply with the addition of spans: in the four-story class, decreases from 43.8 mm (one span) to 22.2 mm (four spans), a 49.4% reduction, while decreases by only 9.2% over the same range. The same pattern holds for the eight-story ( in ) and 14-story ( in ) classes. The global demand-to-capacity ratio ranges from 0.42 to 0.63 for all archetypes, indicating that the code-spectrum demand remains below the adopted ultimate displacement threshold. This global ratio is used only as a system-level indicator and is not intended to replace component-level ASCE/SEI 41-17 acceptance checks.
Figure 5.
Pushover capacity curves for configuration: (a) 1 span; (b) 2 spans; (c) 3 spans; (d) 4 spans.
3.4. Computed R and Values
The parametric evolution of , , , and R versus number of spans is presented in Figure 6 as a composite. Capacity ductility increases from the one-span to the four-span configuration by approximately 80% and 71% in the four- and eight-story classes, respectively, and saturates at in the 14-story class (≈12% variation).
Figure 6.
Parametric variation of the response modification factor components versus the number of spans: (a) ; (b) ; (c) ; (d) .
Demand ductility (Table 3) ranges from 3.04 to 5.98 across the matrix. Overstrength (panel b) ranges from 1.19 to 1.38 across all twelve archetypes with no sustained monotonic trend. The geometric redundancy index (panel c), normalized to the four-span baseline of each height class, returns 0.49–0.53 for the one-span configurations, 0.77–0.85 for two-span, 0.85–0.95 for three-span, and 1.00 for four-span.
The synthesized factor (panel d) ranges from 3.80 (eight-story, one-span) to 14.56 (four-story, four-span) across the pushover-based matrix—a 3.83× amplification. The demand-based companion factor ranges from 1.82 (four-story, one-span) to 7.63 (eight-story, four-span). For each height class, R increases monotonically with span count in the four- and eight-story classes; the 14-story class saturates between three and four spans at , with a marginal decrease from 8.62 to 8.57.
3.5. Dynamic Verification for the Low-Rise Class
NLRHA was conducted on the four four-story archetypes under the eleven selected horizontal acceleration records, producing 44 converged simulations. Peak interstory drift ratios per record and configuration are reported in Table 4. The ensemble mean drift is 1.24%, 1.25%, 1.36%, and 1.13% for the one-, two-, three-, and four-span configurations, respectively; individual maxima reach 1.96%–2.16%. All configurations remain below the 2.5% ASCE/SEI 7-22 collapse-prevention limit; three record–configuration responses marginally exceed the 2.0% NEC-SE-DS service limit.
Table 4.
Peak interstory drift ratio (%) from NLRHA for the 4-story archetypes.
The comparison between base-shear demand from NLRHA () and the pushover demand shear ( kN for the four-story, four-span reference archetype) is presented in Figure 7. The ratio clusters around 1.0 for the Friuli (0.92–1.07), Chi-Chi E-W (0.97), and Taiwan E-W (0.98) records, indicating that the pushover-implied demand captures the time-history response within 10% for records whose spectral shape matches the design target within the matching interval. The Loma Prieta, Taiwan N-S, and Pedernales records yield ratios of 0.18–0.27, indicating that these records impose lower base-shear demand than the monotonic pushover would suggest. No NLRHA simulation reached global collapse.
Figure 7.
Base-shear demand at the first plastic hinge event for the 4-story, 4-span archetype.
3.6. Dynamic Verification-Drift-Excedance Probability
Figure 8 presents the probability of exceedance functions of the maximum interstory drift ratio obtained from NLRHA of the four-story archetypes under the design-level ground-motion suite. The vertical reference lines correspond to the adopted global drift thresholds for Operational Performance (OP), Immediate Occupancy (IO), Life Safety (LS), and Collapse Prevention (CP). These thresholds are used here only as system-level drift references and are not intended to replace component-level acceptance checks.
Figure 8.
Exceedance probability of maximum interstory drift ratio for the 4-story archetypes, with adopted OP, IO, LS, and CP drift thresholds.
All configurations exhibit near-certain exceedance of the OP threshold and high exceedance probability of the IO threshold, indicating that the design-level earthquake is expected to produce measurable deformation demand while maintaining a substantial margin against severe damage. This behavior is consistent with the design philosophy underlying the response modification factor R, which permits controlled inelastic response under design-level shaking.
More pronounced differences emerge at the LS threshold, where exceedance probabilities range approximately from 21% to 36%. The four-span archetype exhibits the lowest probability of exceeding the LS threshold, whereas the three-span archetype shows the highest exceedance probability. These trends suggest that span configuration affects the distribution of nonlinear drift demand in the low-rise class. Mechanically, increasing the number of spans at fixed plan length shortens the individual span, raises the lateral stiffness, and reduces both the fundamental period and the yield displacement, so that for a given record the imposed drift demand and the sequence in which plastic hinges form are altered. The non-monotonic pattern—with the three-span archetype showing the highest exceedance at the Life Safety threshold and the four-span archetype the lowest—reflects the competition between the increased stiffness, which tends to raise spectral demand at the shifted period, and the greater number of vertical resisting lines, which improves force redistribution after yielding; the balance between these two effects is further modulated by the spectral content of individual records near the shifted period. Furthermore, the exceedance probability trends indicate that the influence of bay configuration cannot be attributed solely to the increase in geometric redundancy. Because the total plan length was maintained constant across all archetypes, increasing the number of bays necessarily reduced the individual span length, thereby modifying the stiffness distribution and the beam-to-column strength balance of the system. Shorter spans generally increase lateral stiffness and reduce drift demands; however, they also alter the distribution of internal forces and the sequence of plastic hinge formation. Consequently, the observed seismic performance results from the combined effect of redundancy, span length, and force redistribution mechanisms rather than from the number of bays alone. This interaction helps explain the nonmonotonic exceedance probability patterns observed in the NLRHA results, where configurations with a greater number of spans do not necessarily exhibit a proportional improvement in performance. These findings further support the interpretation that the redundancy factor represents an emergent structural property arising from the interaction among alternative load paths, stiffness distribution, and strength hierarchy, rather than a purely geometric descriptor. However, because the analysis is restricted to four-story bare-frame models and eleven selected records, the observed differences should be interpreted as configuration-dependent response trends rather than as a direct measurement of physical redundancy.
At the CP threshold, all archetypes exhibit low exceedance probabilities, generally below 10%. This result indicates that the analyzed low-rise archetypes retain a substantial drift margin under the selected design-level records. Nevertheless, exceedance of the CP drift threshold should not be interpreted as equivalent to global collapse, since collapse would require explicit dynamic instability or collapse-oriented assessment.
4. Discussion
The response modification factor, R, is one of the most sensitive parameters in seismic design because it directly controls the reduction of elastic seismic forces and, consequently, the level of inelastic demand implicitly accepted by the design process. Its adoption is therefore not a neutral modeling choice: it affects member sizing, expected damage, deformation capacity, reserve strength, and the margin between design-level performance and collapse prevention. For this reason, treating R as a single typology-level constant may be convenient for code implementation, but it can obscure the mechanical dependence of seismic performance on height, span configuration, stiffness, strength hierarchy, ductility, overstrength, and redundancy.
The results in Section 3 show that the analyzed RC moment-frame archetypes do not mobilize these mechanisms uniformly. The discussion is therefore organized around three levels of interpretation: (i) findings directly supported by the numerical evidence, (ii) trends that are mechanically plausible but require broader validation, and (iii) aspects that should not be generalized beyond the present analytical framework.
4.1. Configuration-Dependence of R Within the Analyzed Archetypes
The most relevant finding is that the computed response modification factor is strongly configuration-dependent even though the material properties, loading assumptions, design code basis, hazard context, and total plan length are kept constant. Across the analyzed archetypes, R varies by a factor of 3.83, while the companion demand-based factor varies by a factor of 4.2. This dispersion is too large to be interpreted as numerical scatter only; it indicates that the lateral-force reduction capacity emerging from the models is controlled by the interaction between deformation capacity, reserve strength, and span reconfiguration.
The ASCE/SEI 7-22 value for special moment-resisting frames does not behave as a uniformly conservative or uniformly unconservative multiplier. The one-span configurations produce –, well below the code value, whereas the four-span configurations produce –, reaching or exceeding the prescribed value. This contrast suggests that a single value of R may mask substantial differences in the inelastic response of frames that share the same structural typology but differ in height and span configuration.
This result should be read carefully. The study does not provide a normative recalibration of R, nor does it demonstrate that code values should be modified directly. A code-level statement would require probabilistic collapse assessment, uncertainty propagation, record-to-record variability, and multi-typology validation following a framework such as FEMA P-695 [8]. The present evidence is instead best interpreted as analytical support for configuration-sensitive screening and as motivation for more rigorous calibration studies.
4.2. Meaning and Limits of the Geometric Redundancy Index
The parameter used in this study should be understood as a configuration-sensitive index rather than as a fully isolated physical measure of redundancy. Increasing the number of spans within a fixed 12 m plan length also changes the individual span length, member force distribution, lateral stiffness, plastic-hinge sequence, and global strength. Therefore, the observed trends cannot be attributed exclusively to redundancy in the strict sense of independent alternative load paths. They reflect the combined effect of span reconfiguration, topology, stiffness, strength, and deformation capacity.
This distinction is important because redundancy in seismic design is often associated with the ability of a structural system to redistribute forces after local yielding or damage. In the present two-dimensional bare-frame models, captures a relative change in global capacity with respect to the four-span reference frame of the same height. It is useful for comparing the archetypes internally, but it should not be interpreted as directly equivalent to a code redundancy factor or to a three-dimensional system-level redundancy measure. A more complete evaluation would require explicit element-removal procedures, three-dimensional redistribution mechanisms, and dynamic collapse-oriented assessment [30].
4.3. Overstrength: Analytical Values Versus Code Prescription
The computed overstrength factor, , remains within a relatively narrow range of 1.19–1.38, which is systematically lower than the ASCE/SEI 7-22 value prescribed for reinforced concrete moment-resisting frames (SMRFs). This difference is, to a large extent, definitional rather than an analytical error. The factor adopted in this study, (Equation (4)), measures only the post-yield hardening reserve between the idealized yield and ultimate base shears of the pushover curve. The code value, by contrast, is a system overstrength factor defined relative to the design base shear , and therefore additionally embeds the substantial reserve developed between the design force level and first yield—arising from the force reduction by R, the use of expected rather than nominal material strengths (), load and capacity-design factors, and minimum-reinforcement and drift-control requirements. Because , the ratio is necessarily smaller than the code system factor, so a direct numerical equality between the two was not to be expected. This difference is mechanically understandable. The numerical models represent bare two-dimensional frames and therefore exclude several sources of reserve capacity that may be implicitly embedded in code-level overstrength values, including slab participation, nonstructural contributions, construction-stage overdesign, three-dimensional interaction, and continuity with adjacent resisting systems. The magnitude of the omitted slab contribution alone is not negligible: experimental evidence indicates that slab reinforcement within the effective flange width substantially increases the negative-moment (hogging) capacity of beams framing into the joints, with roughly one-third of the slab reinforcement within the effective width contributing as effectively as the beam reinforcement [55]. Such reserve mechanisms increase and the strong-column/weak-beam margin and, together with the design-to-yield reserve discussed above, account for the gap between the bare-frame ratio and the code system value.
The result is nevertheless meaningful because it shows that the analytical overstrength mobilized by the designed frame members alone is modest. In this sense, the models reproduce the broader observation that overstrength is not a purely material or member-level property, but an emergent system response influenced by modeling assumptions, design conservatism, detailing, gravity-load participation, and the degree to which non-modeled components contribute to lateral resistance [26,27,28]. Thus, the comparison with the code value should not be read as evidence that is incorrect, but as evidence that the bare-frame idealization captures only part of the reserve strength represented in design provisions.
4.4. Ductility, Height Effects, and Saturation of the Span-Configuration Benefit
The ductility component shows a clear dependence on span configuration for low- and mid-rise frames, but this benefit becomes less pronounced in taller frames. In the 4-story and 8-story classes, increases by approximately 80% and 71%, respectively, as the number of spans increases. This indicates that shorter spans and additional vertical resisting lines improve the ability of the system to sustain inelastic deformation before reaching the adopted collapse displacement.
In contrast, the 14-story class shows only about 12% variation in across the span range, with values between 6.22 and 6.97. The ductility benefit appears to saturate between the 3- and 4-span configurations. At the same time, decreases monotonically with span count in the 14-story class, from 1.324 to 1.235, while approaches unity. These coupled trends explain the slight inversion of R between the 3-span and 4-span 14-story configurations, where R decreases from 8.62 to 8.57.
This behavior suggests that, for taller frames, increasing the span count does not indefinitely increase the response modification capacity. Once the system has developed sufficient redistribution capacity, further span subdivision may produce smaller gains in ductility while reducing the relative overstrength contribution. The observed – trade-off therefore indicates that the components of Equation (1) should not be assumed to act as strictly independent multipliers in all height classes. However, this conclusion remains conditional on the present archetypes and pushover-based decomposition. Its generalization would require dynamic validation for mid- and high-rise frames, alternative lateral-load patterns, and uncertainty-sensitive modeling.
From the standpoint of ductility demand, the systematic lengthening of the fundamental period with increasing height also reshapes the performance criteria implied by a fixed code R. As the period lengthens across the height classes, the elastic spectral acceleration demand decreases along the descending branch of the design spectrum, whereas the capacity ductility saturates in the tallest frames (about 12% variation in the 14-story class). Because the ratio between inelastic and elastic displacement demand is itself period-dependent—tending toward the equal-displacement regime at longer periods and the equal-energy regime at shorter periods [14,54]—a single prescriptive R corresponds to different levels of inelastic deformation demand, and hence to different effective performance margins, across the period range spanned by the archetypes.
4.5. Pushover–Dynamic Correspondence in the Low-Rise Class
For the four-story archetypes, the nonlinear response-history analyses provide a partial check on the pushover-based interpretation. The records whose spectral shape is consistent with the design target over the relevant period range produce base-shear demands within approximately 10% of the pushover-implied demand. This provides a limited consistency check for the use of pushover analysis in the low-rise class under the selected spectrally matched records.
However, the agreement is not uniform across all records. Other motions produced lower ratios, indicating that spectral matching over the selected period interval does not eliminate record-dependent differences in nonlinear demand. This confirms that the demand side of the problem is as important as the capacity side: R is not a fixed physical constant of the frame, but an emergent reduction capacity mobilized under a specific seismic demand. The result is consistent with the observations of Mwafy & Elnashai [47], who emphasized that pushover–dynamic correspondence depends strongly on structural period, modal participation, and ground-motion characteristics.
The dynamic verification should therefore be interpreted as supportive but limited. It strengthens the low-rise conclusions, yet it does not validate the pushover-based R values for the 8- and 14-story archetypes. For those height classes, higher-mode effects, cyclic degradation, record-to-record variability, and displacement concentration may modify the relationship between static capacity curves and dynamic response [48].
4.6. Implications for Seismic Design and Analytical Calibration
The dual reporting of R and provides a useful bracket for interpreting the reduction capacity of the analyzed archetypes. The capacity-based value R represents an upper estimate associated with the idealized deformation capacity obtained from pushover analysis, whereas introduces a demand-consistent perspective through the displacement demand. The distance between both factors is informative because it separates what the system could theoretically mobilize from what the selected demand actually requires.
From a design perspective, the results reinforce the need to treat R as a system-dependent performance parameter rather than as a purely typological label. Frames with different height and bay layouts may satisfy the same prescriptive design provisions while developing substantially different combinations of ductility, overstrength, and redundancy-related capacity. This does not imply that simplified code values should be abandoned, but it does suggest that future calibration exercises should explicitly examine configuration effects, especially when applying imported design provisions to high-seismicity subduction environments such as Ecuador.
At the same time, the present results should not be used as direct code recommendations. Their appropriate role is to support analytical screening, identify configurations that may deserve deeper evaluation, and motivate collapse-based studies with larger ground-motion suites, uncertainty propagation, and three-dimensional modeling. In that sense, the contribution of this work is not the proposal of a new value of R, but the demonstration that the components used to justify R can vary substantially within a single structural typology. A concrete pathway toward code relevance follows from this demonstration. The present controlled study identifies which configurations—notably the single-bay, low-redundancy frames that fall well below the prescriptive value—most warrant deeper evaluation; a subsequent calibration study could then treat configuration as an explicit variable within the FEMA P-695 methodology, combining three-dimensional models with slab and infill participation, multi-record incremental dynamic analysis, and several hazard contexts, to translate the configuration-sensitivity established here into statistically supported, code-oriented values. The results reported in this work are intended to motivate and scope that effort rather than to substitute for it.
4.7. Limitations
The interpretation of the results is subject to several limitations. First, the archetypes are two-dimensional bare frames; therefore, three-dimensional redistribution, slab participation, torsional effects, soil–structure interaction, and nonstructural contributions are not represented [35,43]. The use of archetype structures follows the methodology established in FEMA P695 for the evaluation of seismic performance factors. Rather than reproducing the complexity of individual real world buildings, archetypes are intended to represent the essential characteristics of a structural system while enabling controlled assessment of the parameters under investigation. In the present study, this approach permits the isolated evaluation of height and geometric redundancy effects on the response modification factor and its components, avoiding the confounding influence of building specific irregularities and nonstructural features. Second, the adopted is a relative configuration index based on global capacity normalization, not an explicit redundancy factor obtained from element-removal or system-reliability procedures. Third, lumped-plasticity hinges are used without explicit calibration of cyclic deterioration mechanisms such as stiffness degradation, strength deterioration, pinching, bar slip, or joint-panel deformation. More refined collapse-oriented models could incorporate deterioration rules of the type proposed by Ibarra et al. [56].
In addition, all archetypes were detailed to satisfy the strong-column/weak-beam hierarchy of ACI 318-19; the weak-column/strong-beam mechanism frequently observed in older, non-conforming construction—which concentrates damage in column-sway or soft-story mechanisms and sharply reduces both ductility and the attainable R—was therefore not represented. Consequently, the present decomposition should be regarded as an upper-bound characterization relative to such deficient configurations, and the explicit analysis of weak-column/strong-beam archetypes is identified as a priority for future work.
Fourth, the ground-motion set is conditioned on a single site and hazard context, so hazard-dependent variability of the decomposition is not explored. Fifth, modeling uncertainty is not propagated probabilistically [57]. Sixth, nonlinear response-history analysis is restricted to the 4-story class; consequently, the 8- and 14-story results remain pushover-based and should be interpreted as analytical trends rather than dynamically validated performance measures. Finally, the use of eleven horizontal acceleration records is consistent with the minimum suite size commonly adopted in design-oriented nonlinear response-history procedures when mean response quantities are used; however, larger and more systematically selected suites would be necessary for future collapse-based or normative calibration studies.
5. Conclusions
This study examined the analytical decomposition of the response modification factor R for a controlled matrix of two-dimensional RC moment-resisting frame archetypes designed according to ACI 318-19 and ASCE/SEI 7-22 and subjected to the hazard of the Pedernales subduction-zone. The matrix combined three height classes (4, 8, and 14 stories) with four span configurations (one, two, three, and four spans) under a fixed total frame length of 12 m. The factor R was obtained from bilinearized pushover curves for the complete set of archetypes, while nonlinear response-history analysis (NLRHA) was used to verify the low-rise class under eleven selected horizontal acceleration records amplitude-matched to the NEC-SE-DS target spectrum. The demand-based companion factor was also reported to compare capacity-based estimates with code-spectrum demand estimates.
The results demonstrate that, within the set of parametric definitions and archetypes adopted, the analytical decomposition of R varies significantly with height and span reconfiguration with fixed total length. The main conclusions are as follows:
- (1)
- Across the twelve archetypes, the pushover-based factor R ranges from 3.80 to 14.56, while the demand-based companion factor ranges from 1.82 to 7.63. These ranges indicate substantial configuration sensitivity within the analyzed matrix and show that a single typology-level value cannot fully represent the response of the considered bare-frame archetypes.
- (2)
- Within the adopted parametric definition and archetype set, the ASCE/SEI 7-22 value lies above the computed values for the single-span configurations (–) and below several values obtained for the multi-span configurations, particularly the four-span cases (–). This comparison is matrix-specific and should not be interpreted as a normative recalibration of the code-prescribed response modification factor.
- (3)
- The analytical overstrength factor remains relatively low, ranging from 1.19 to 1.38, and is consistently below the ASCE/SEI 7-22 prescribed value of for SMRFs. This difference is consistent with the adopted bare-frame idealization, which excludes masonry infills, slab participation, nonstructural reserves, and other strength contributions that may be implicitly reflected in code-level overstrength values.
- (4)
- The capacity ductility increases markedly with the number of spans in the low- and mid-rise classes. In contrast, the 14-story class exhibits a much weaker variation, with changing by only approximately 12% across the span range. This suggests that the benefit associated with span reconfiguration tends to stabilize in taller frames within the analyzed matrix.
- (5)
- The observed trends should not be attributed solely to geometric redundancy. Because the adopted parametrization keeps the total frame length fixed, increasing the number of spans also reduces the individual span length and modifies lateral stiffness, strength distribution, and plastic mechanism development. Therefore, the results are best interpreted as evidence of configurational sensitivity within a controlled two-dimensional topology matrix, rather than as an isolated measurement of redundancy.
- (6)
- In the 14-story class, the simultaneous variation of , , and suggests a possible coupling among the components of the canonical decomposition. However, this observation remains exploratory because it is inferred from a limited archetype matrix and from pushover-based results. Accordingly, the apparent trade-off between and should be regarded as a hypothesis requiring further verification, not as conclusive evidence that the decomposition components are generally non-independent.
- (7)
- The low-rise NLRHA results support the use of pushover analysis as a screening tool for the corresponding 4-story archetypes. However, equivalent dynamic validation was not performed for the 8- and 14-story classes. Consequently, the reported R and values for the mid- and high-rise archetypes should be interpreted as pushover-consistent estimates only, without extrapolating the same level of dynamic support obtained for the low-rise subset.
From a practical standpoint, these findings indicate that configuration should be treated as an explicit screening variable in performance-oriented seismic assessment. Single-bay, low-redundancy frames may develop a response modification capacity well below the prescriptive and therefore warrant closer scrutiny, whereas the systematically low bare-frame overstrength signals the configurations in which designers implicitly rely on reserve mechanisms—slab participation, infills, and three-dimensional continuity—that are not captured by the primary lateral system alone. These observations are intended to support analytical screening and to motivate a configuration-explicit calibration study following the FEMA P-695 methodology, rather than to modify code-prescribed values directly.
Future work. Further research should address four main extensions: (i) three-dimensional modeling capable of evaluating plan effects and element-removal redundancy in the sense of Tsopelas & Husain [30] and the explicit modeling of weak-column/strong-beam and other non-conforming configurations to complement the code-compliant archetypes analyzed here; (ii) explicit inclusion of masonry infill walls, slab participation, and nonstructural strength reserves [43]; (iii) probabilistic propagation of modeling and record-to-record uncertainty through incremental dynamic analysis [57,58]; and (iv) extension of NLRHA to the mid- and high-rise classes using ground-motion sets conditioned on the first-mode period and relevant higher-mode contributions of each height class [50,52].
Author Contributions
B.S.: Conceptualization, Methodology, Software, Supervision, Writing—Review and Editing. S.V.: Investigation, Methodology, Software, Validation, Formal analysis, Data curation, Visualization, Writing—Original draft. C.D.M.: Conceptualization, Writing—Review and Editing. B.C.: Visualization, Writing—Review and Editing. All authors have read and agreed to the published version of the manuscript.
Funding
This research was funded by the VINCI-DI Program of the Pontificia Universidad Católica de Valparaíso through project No. 039.734/2025; and the SEED-26 Research Program of the Universidad Tecnológica Indoamérica project No. IIDI-048-26.
Data Availability Statement
The numerical datasets generated and analyzed during the current study (archetype geometries, pushover capacity curves, response-history time histories, and post-processing scripts) are available from the corresponding author upon reasonable request. Ground-motion records were retrieved from the PEER NGA-West2 database (https://ngawest2.berkeley.edu, accessed on 22 September 2025) and, for the Pedernales 2016 event, from publicly available sources.
Acknowledgments
The authors acknowledge the infrastructure support provided by the School of Civil Engineering, Pontificia Universidad Católica de Valparaíso, during the development of this research.
Conflicts of Interest
The authors declare no conflicts of interest.
References
- Mata, R.; Nuñez, E.; Hernández, M.; Correa, C.; Bustamante, G. Seismic Performance of RC Moment Frame Buildings Considering SSI Effects: A Case Study of the New Venezuelan Seismic Code. Buildings 2023, 13, 1694. [Google Scholar] [CrossRef] [Scilit]
- Ministerio de Desarrollo Urbano y Vivienda. NEC-SE-DS: Peligro Sísmico y Requisitos de Diseño Sismo Resistente; Norma Ecuatoriana de la Construcción; Ecuadorian National Standard, MIDUVI: Quito, Ecuador, 2015.
- Parra Cárdenas, H.A. Desarrollos Metodológicos y Aplicaciones Hacia el Cálculo de la Peligrosidad Sísmica en el Ecuador Continental y Estudio del Riesgo Sísmico en la Ciudad de Quito. Ph.D. Thesis, Universidad Politécnica de Madrid, Madrid, Spain, 2015. [Google Scholar]
- Yépez, F.; Yépez, O. Role of Construction Materials in the Collapse of R/C Buildings after Mw 7.8 Pedernales Ecuador Earthquake, April 2016. Case Stud. Struct. Eng. 2017, 7, 24–31. [Google Scholar] [CrossRef] [Scilit]
- Mertol, H.C.; Tunç, G.; Akış, T.; Kantekin, Y.; Aydın, İ.C. Investigation of RC Buildings after 6 February 2023, Kahramanmaraş, Türkiye Earthquakes. Buildings 2023, 13, 1789. [Google Scholar] [CrossRef] [Scilit]
- Tamrazyan, A.; Matseevich, T. Seismic Resistance of Reinforced Concrete Building Frames Based on Interval Assessment of the Coefficient of Permissible Damage. Buildings 2024, 14, 3776. [Google Scholar] [CrossRef] [Scilit]
- Miceli, E.; Ferrara, S.; Castaldo, P. Confinement Effects within the Seismic Design of Reinforced Concrete Frames: Reliability Assessment and Comparison. Eng. Struct. 2024, 313, 118248. [Google Scholar] [CrossRef] [Scilit]
- Federal Emergency Management Agency. Quantification of Building Seismic Performance Factors (FEMA P-695); Technical Report; FEMA: Washington, DC, USA, 2009.
- ACI Committee 318; Building Code Requirements for Structural Concrete (ACI 318-19) and Commentary on Building Code Requirements for Structural Concrete. American Concrete Institute: Farmington Hills, MI, USA, 2019. [CrossRef] [Scilit]
- ASCE/SEI 7-22; Minimum Design Loads and Associated Criteria for Buildings and Other Structures. American Society of Civil Engineers: Reston, VA, USA, 2022. [CrossRef] [Scilit]
- Kappos, A.J. Evaluation of Behaviour Factors on the Basis of Ductility and Overstrength Studies. Eng. Struct. 1999, 21, 823–835. [Google Scholar] [CrossRef] [Scilit]
- Uang, C.M. Establishing R (or Rw) and Cd Factors for Building Seismic Provisions. J. Struct. Eng. 1991, 117, 19–28. [Google Scholar] [CrossRef] [Scilit]
- Bojórquez, E.; Ruiz, S.E. Strength Reduction Factors for the Valley of Mexico, Considering Low-Cycle Fatigue Effects. In Proceedings of the 13th World Conference on Earthquake Engineering, Vancouver, BC, Canada, 1–6 August 2004; p. 516. [Google Scholar]
- Miranda, E.; Bertero, V.V. Evaluation of Strength Reduction Factors for Earthquake-Resistant Design. Earthq. Spectra 1994, 10, 357–379. [Google Scholar] [CrossRef] [Scilit]
- Ruggieri, S.; Uva, G. Extending the concepts of response spectrum analysis to nonlinear static analysis: Does it make sense? Innov. Infrastruct. Solut. 2024, 9, 235. [Google Scholar] [CrossRef] [Scilit]
- Aguayo, R.; Carvallo, J.; Vielma, J.C. Evaluating Seismic Performance in Reinforced Concrete Buildings with Complex Shear Walls: A Focus on a Residential Case in Chile. Buildings 2024, 14, 761. [Google Scholar] [CrossRef] [Scilit]
- Prasanth, S.; Ghosh, G.; Gupta, P.K.; Kumar, V.; Paramasivam, P.; Dhanasekaran, S. Selection of Response Reduction Factor Considering Resilience Aspect. Buildings 2023, 13, 626. [Google Scholar] [CrossRef] [Scilit]
- Mata-Lemus, R.; Idrees-Rustom, A.; Sánchez-Rodríguez, J.; Torres-Moreno, R.; Nuñez-Castellanos, E.; Bustamante-Laissle, G. Assessment of Strength Reduction Factor on Concrete Moment Frames According to the New Venezuelan Seismic Code. Buildings 2022, 12, 255. [Google Scholar] [CrossRef] [Scilit]
- Cui, S.; Chen, Y.; Lu, D. Probability Assessment of Structural Response Modification Factor of RC Frames by the Demand-Capacity-Factor Method. Structures 2021, 30, 628–637. [Google Scholar] [CrossRef] [Scilit]
- Caballero-Castro, L.F.; Cano-Castaño, H.A.; Molina-Herrera, M.; Villalba-Morales, J.D.; Arroyo, O. Evaluating the Response Modification Factor (R) for Reinforced Concrete and Steel Structures Equipped with TADAS Devices Designed for High Seismic Hazard in Colombia. Structures 2024, 65, 106748. [Google Scholar] [CrossRef] [Scilit]
- Safi, M.; Karaki, G. Seismic Performance of Deficient Reinforced Concrete Frames in Developing Countries: A Case Study in Ramallah City. Discov. Civ. Eng. 2024, 1, 95. [Google Scholar] [CrossRef] [Scilit]
- Cook, D.T.; Liel, A.B.; Safiey, A. Earthquake Functional Recovery in Modern Reinforced Concrete Buildings. J. Struct. Eng. 2024, 150, 04024117. [Google Scholar] [CrossRef] [Scilit]
- Bai, M.; Song, L.; Xiao, Q.; Sun, J.; Liu, H. Development of low-carbon engineered cementitious composites incorporating lithium slag: Mechanical properties, microstructure evolution, and life cycle assessment. Constr. Build. Mater. 2026, 520, 145983. [Google Scholar] [CrossRef] [Scilit]
- Park, R. State-of-the-Art Report: Ductility Evaluation from Laboratory and Analytical Testing. In Proceedings of the 9th World Conference on Earthquake Engineering, Tokyo-Kyoto, Japan, 2–9 August 1988; Volume 8, pp. 605–616. [Google Scholar]
- Borzi, B.; Elnashai, A.S. Assessment of Inelastic Response of Buildings Using Force- and Displacement-Based Approaches. Struct. Des. Tall Build. 2000, 9, 251–277. [Google Scholar] [CrossRef]
- Mitchell, D.; Paultre, P. Ductility and Overstrength in Seismic Design of Reinforced Concrete Structures. Can. J. Civ. Eng. 1994, 21, 1049–1060. [Google Scholar] [CrossRef] [Scilit]
- Jain, S.K.; Navin, R. Seismic Overstrength in Reinforced Concrete Frames. J. Struct. Eng. 1995, 121, 580–585. [Google Scholar] [CrossRef] [Scilit]
- Humar, J.L.; Rahgozar, M.A. Concept of Overstrength in Seismic Design. In Proceedings of the 11th World Conference on Earthquake Engineering, Acapulco, Mexico, 23–28 June 1996; p. 639. [Google Scholar]
- Husain, M.; Tsopelas, P. Measures of Structural Redundancy in Reinforced Concrete Buildings. I: Redundancy Indices. J. Struct. Eng. 2004, 130, 1651–1658. [Google Scholar] [CrossRef] [Scilit]
- Tsopelas, P.; Husain, M. Measures of Structural Redundancy in Reinforced Concrete Buildings. II: Redundancy Response Modification Factor RR. J. Struct. Eng. 2004, 130, 1659–1666. [Google Scholar] [CrossRef] [Scilit]
- Bertero, R.D.; Bertero, V.V. Redundancy in Earthquake-Resistant Design. J. Struct. Eng. 1999, 125, 81–88. [Google Scholar] [CrossRef] [Scilit]
- Hussein, M.M.; Gamal, M.; Attia, W.A. Seismic Response Modification Factor for RC-Frames with Non-Uniform Dimensions. Cogent Eng. 2021, 8, 1923363. [Google Scholar] [CrossRef] [Scilit]
- Godínez-Domínguez, E.A.; Tena-Colunga, A. Nonlinear Behavior of Code-Designed Reinforced Concrete Concentric Braced Frames under Lateral Loading. Eng. Struct. 2010, 32, 944–963. [Google Scholar] [CrossRef] [Scilit]
- Haselton, C.B.; Liel, A.B.; Deierlein, G.G.; Dean, B.S.; Chou, J.H. Seismic Collapse Safety of Reinforced Concrete Buildings. I: Assessment of Ductile Moment Frames. J. Struct. Eng. 2011, 137, 481–491. [Google Scholar] [CrossRef] [Scilit]
- Massumi, A.; Mohammadi, R. Structural Redundancy of 3D RC Frames under Seismic Excitations. Struct. Eng. Mech. 2016, 59, 15–36. [Google Scholar] [CrossRef] [Scilit]
- Priestley, M.J.N. Performance Based Seismic Design. Bull. N. Z. Soc. Earthq. Eng. 2000, 33, 325–346. [Google Scholar] [CrossRef] [Scilit]
- Ghobarah, A. Performance-Based Design in Earthquake Engineering: State of Development. Eng. Struct. 2001, 23, 878–884. [Google Scholar] [CrossRef] [Scilit]
- Fajfar, P. A Nonlinear Analysis Method for Performance-Based Seismic Design. Earthq. Spectra 2000, 16, 573–592. [Google Scholar] [CrossRef] [Scilit]
- Instituto Nacional de Normalización. NCh433.Of1996: Diseño Sísmico de Edificios; Technical Report NCh433.Of1996 Mod.2009; Instituto Nacional de Normalización: Santiago, Chile, 2012. [Google Scholar]
- Asociación Colombiana de Ingeniería Sísmica. Reglamento Colombiano de Construcción Sismo Resistente (NSR-10); Asociación Colombiana de Ingeniería Sísmica: Bogotá, Colombia, 2010. [Google Scholar]
- FONDONORMA. Norma Venezolana COVENIN 1756:2001: Edificaciones Sismorresistentes; Technical Report COVENIN 1756:2001; Fondo para la Normalización y Certificación de la Calidad: Caracas, Venezuela, 2001. [Google Scholar]
- Ministerio de Vivienda, Construcción y Saneamiento. Norma Técnica E.030: Diseño Sismorresistente; Technical Report R.M. N° 355-2018-VIVIENDA; Ministerio de Vivienda, Construcción y Saneamiento: Lima, Perú, 2018.
- Fardis, M.N.; Panagiotakos, T.B. Seismic Design and Response of Bare and Masonry-Infilled Reinforced Concrete Buildings. Part II: Infilled Structures. J. Earthq. Eng. 1997, 1, 475–503. [Google Scholar] [CrossRef]
- Mander, J.B.; Priestley, M.J.N.; Park, R. Theoretical Stress-Strain Model for Confined Concrete. J. Struct. Eng. 1988, 114, 1804–1826. [Google Scholar] [CrossRef] [Scilit]
- Computers and Structures, Inc. SAP2000: Integrated Software for Structural Analysis and Design, Version 20; Computers and Structures, Inc.: Berkeley, CA, USA, 2020. [Google Scholar]
- ASCE/SEI 41-17; Seismic Evaluation and Retrofit of Existing Buildings. American Society of Civil Engineers: Reston, VA, USA, 2017. [CrossRef] [Scilit]
- Mwafy, A.M.; Elnashai, A.S. Static Pushover versus Dynamic Collapse Analysis of RC Buildings. Eng. Struct. 2001, 23, 407–424. [Google Scholar] [CrossRef] [Scilit]
- Krawinkler, H.; Seneviratna, G.D.P.K. Pros and Cons of a Pushover Analysis of Seismic Performance Evaluation. Eng. Struct. 1998, 20, 452–464. [Google Scholar] [CrossRef] [Scilit]
- Medina, R.A.; Krawinkler, H. Seismic Demands for Non-Deteriorating Frame Structures and Their Dependence on Ground Motions; Technical Report PEER Report 2003/15; Pacific Earthquake Engineering Research Center, University of California, Berkeley: Berkeley, CA, USA, 2004. [Google Scholar]
- Baker, J.W. Conditional Mean Spectrum: Tool for Ground-Motion Selection. J. Struct. Eng. 2011, 137, 322–331. [Google Scholar] [CrossRef] [Scilit]
- Iervolino, I.; Galasso, C.; Cosenza, E. REXEL: Computer Aided Record Selection for Code-Based Seismic Structural Analysis. Bull. Earthq. Eng. 2010, 8, 339–362. [Google Scholar] [CrossRef] [Scilit]
- Kohrangi, M.; Bazzurro, P.; Vamvatsikos, D. Vector and Scalar IMs in Structural Response Estimation, Part II: Building Demand Assessment. Earthq. Spectra 2016, 32, 1525–1543. [Google Scholar] [CrossRef] [Scilit]
- Federal Emergency Management Agency. FEMA 440: Improvement of Nonlinear Static Seismic Analysis Procedures; Technical Report FEMA 440; Federal Emergency Management Agency: Washington, DC, USA, 2005.
- Ruiz-García, J.; Miranda, E. Inelastic Displacement Ratios for Evaluation of Existing Structures. Earthq. Eng. Struct. Dyn. 2003, 32, 1237–1258. [Google Scholar] [CrossRef] [Scilit]
- Doğan, O.; Genç, Y.; Öztürk, B.; Odacıoğlu, O.G.; Kopraman, Y.; Sevim, O. Experimental evaluation of slab reinforcement contribution to negative moment capacity in beam-column joints to prevent storey mechanism in RC frames. Eng. Struct. 2025, 345, 121569. [Google Scholar] [CrossRef] [Scilit]
- Ibarra, L.F.; Medina, R.A.; Krawinkler, H. Hysteretic Models that Incorporate Strength and Stiffness Deterioration. Earthq. Eng. Struct. Dyn. 2005, 34, 1489–1511. [Google Scholar] [CrossRef] [Scilit]
- Liel, A.B.; Haselton, C.B.; Deierlein, G.G.; Baker, J.W. Incorporating Modeling Uncertainties in the Assessment of Seismic Collapse Risk of Buildings. Struct. Saf. 2009, 31, 197–211. [Google Scholar] [CrossRef] [Scilit]
- Vamvatsikos, D.; Cornell, C.A. Incremental Dynamic Analysis. Earthq. Eng. Struct. Dyn. 2002, 31, 491–514. [Google Scholar] [CrossRef] [Scilit]
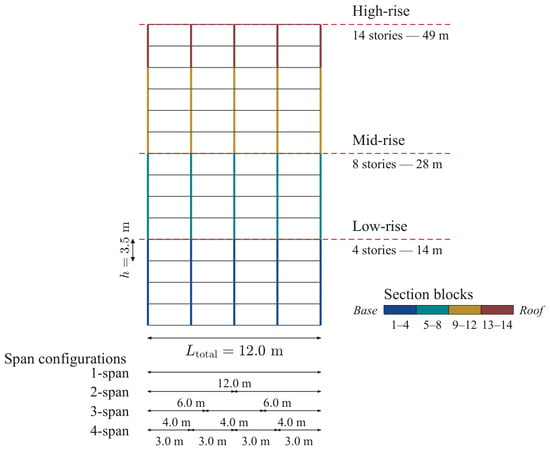
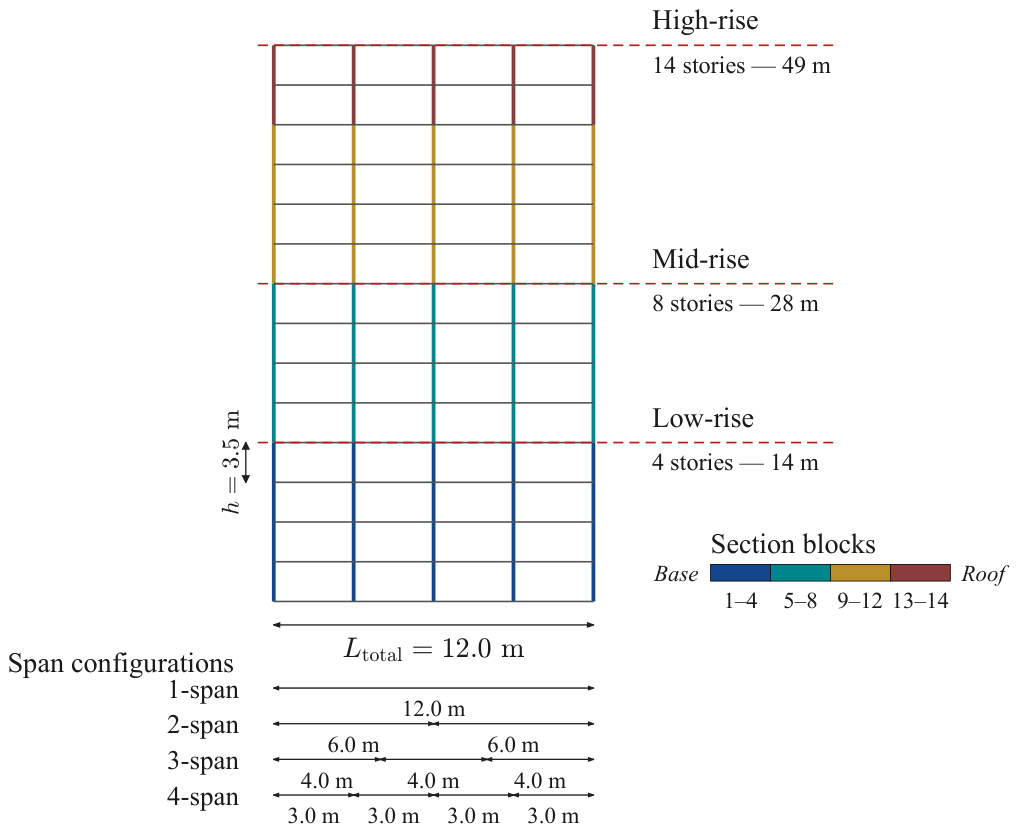
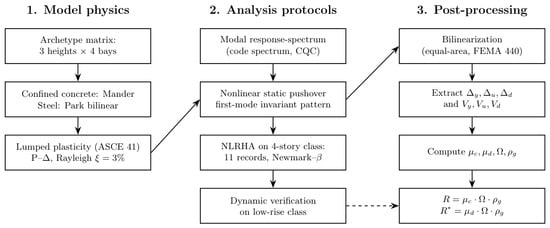
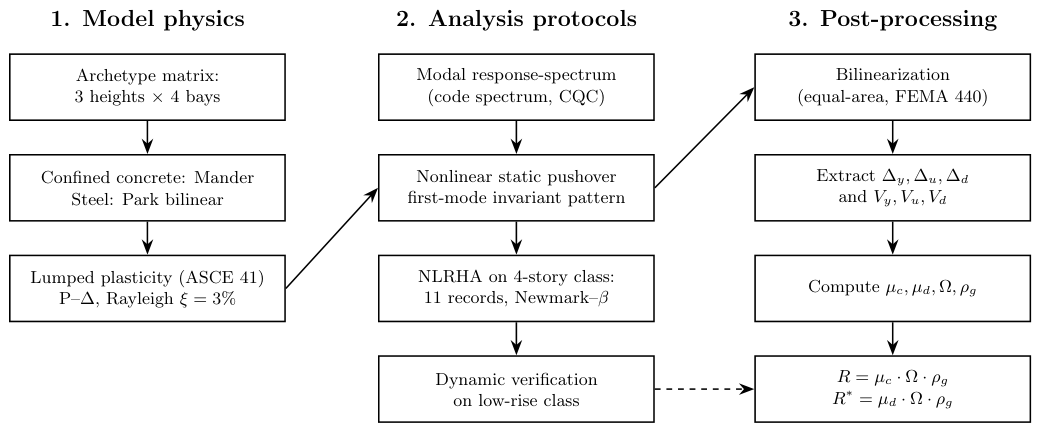
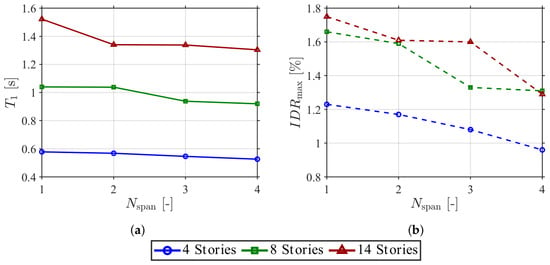
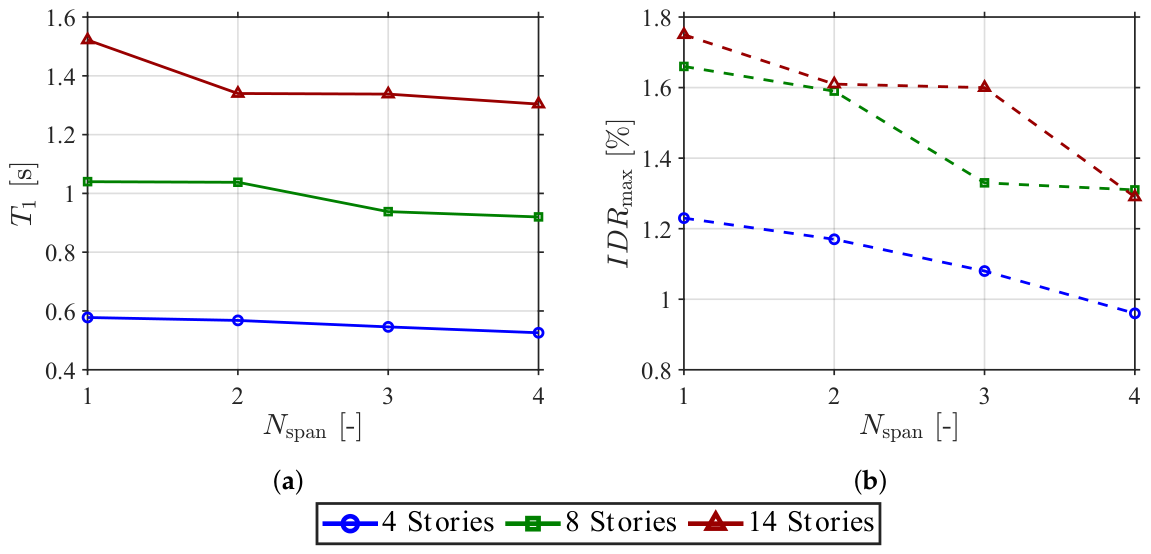
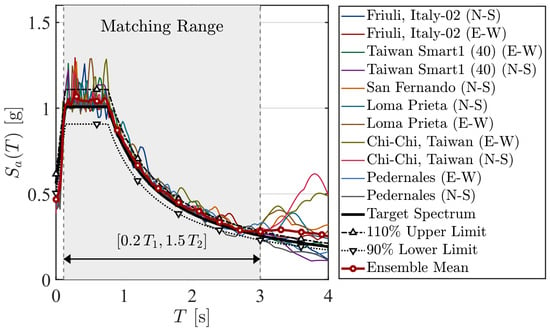
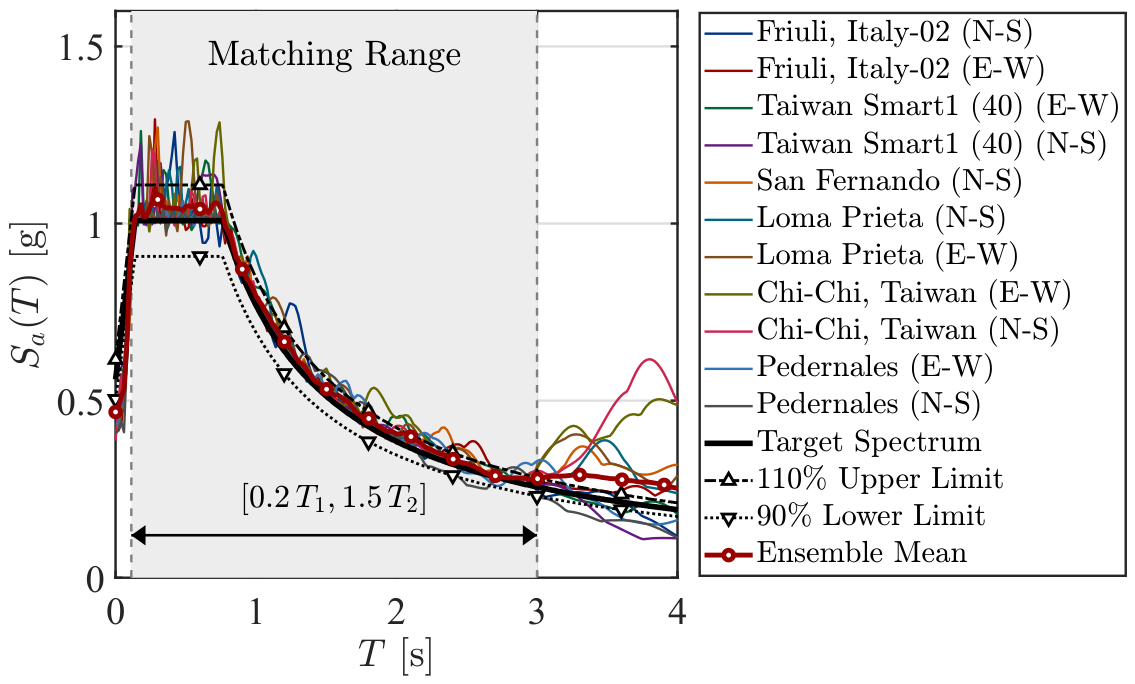
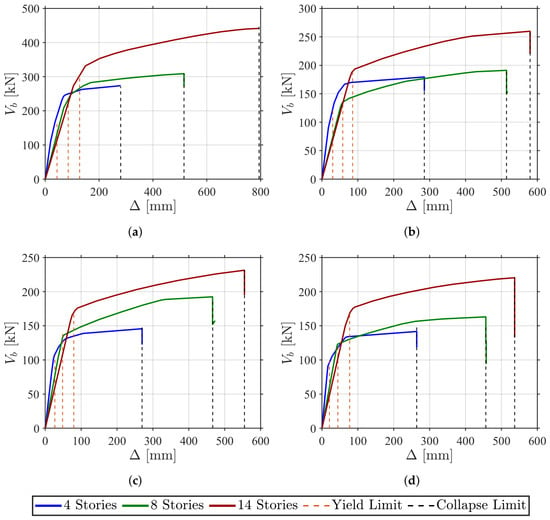
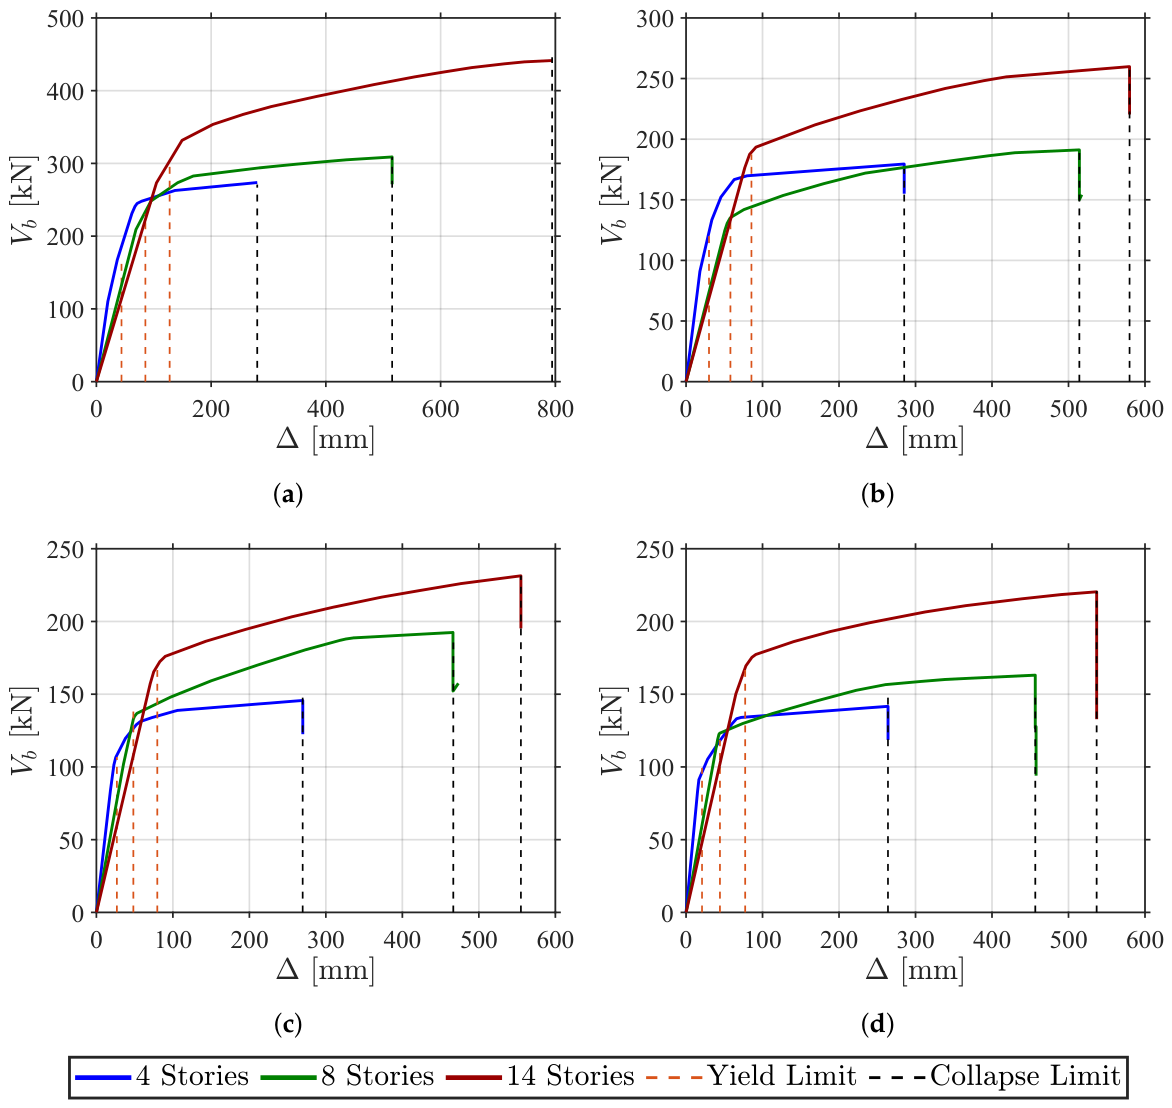
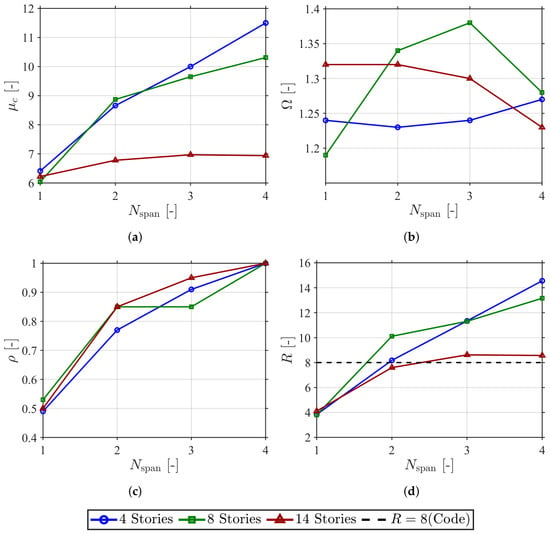
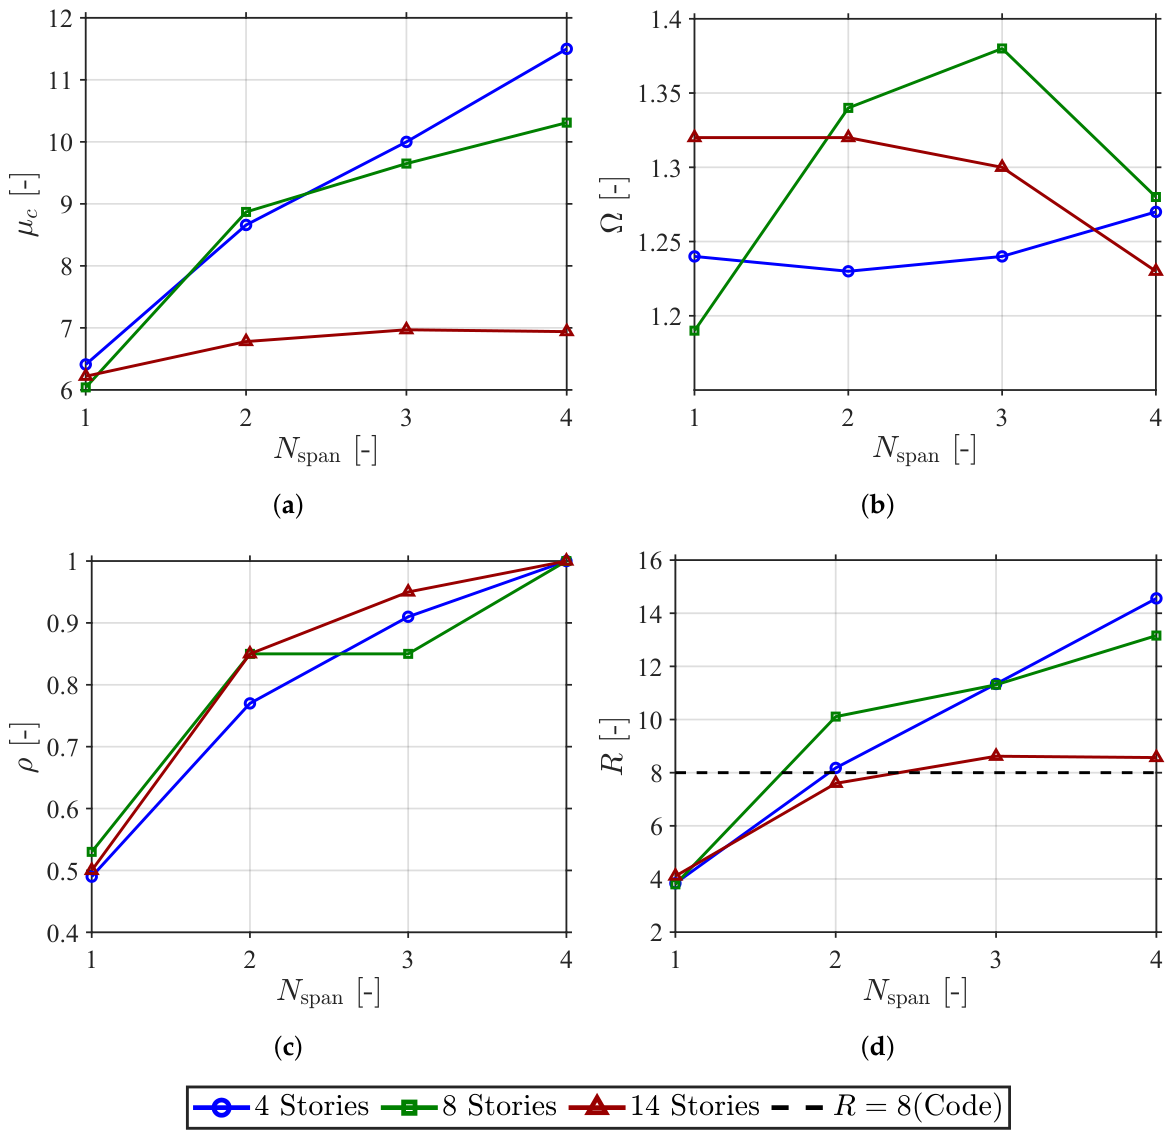
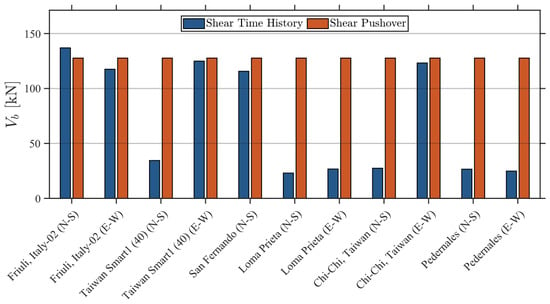
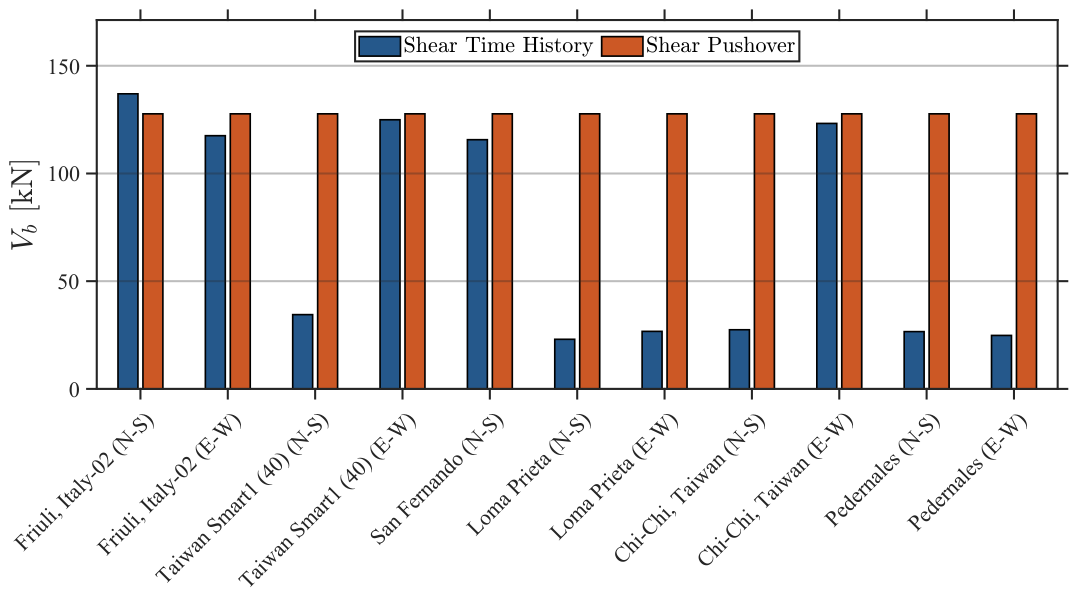
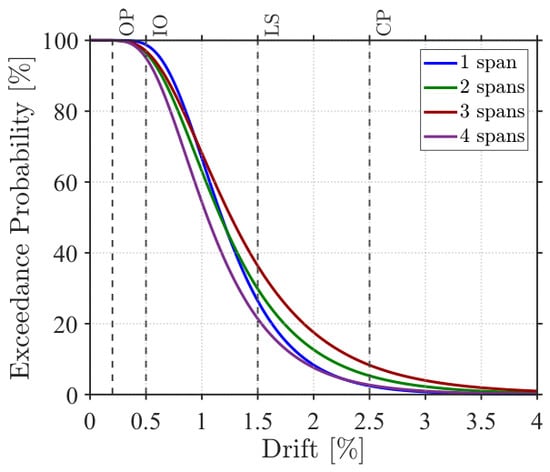
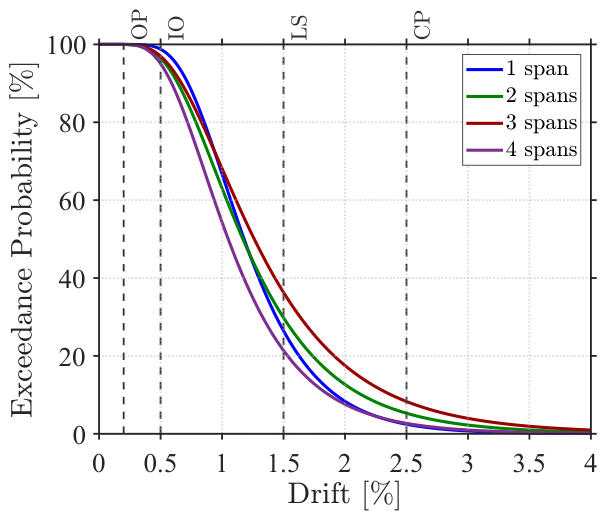

Disclaimer/Publisher’s Note: The statements, opinions and data contained in all publications are solely those of the individual author(s) and contributor(s) and not of MDPI and/or the editor(s). MDPI and/or the editor(s) disclaim responsibility for any injury to people or property resulting from any ideas, methods, instructions or products referred to in the content. |
© 2026 by the authors. Licensee MDPI, Basel, Switzerland. This article is an open access article distributed under the terms and conditions of the Creative Commons Attribution (CC BY) license.