Article

Explicit Modeling of Compressive Strength in Manufactured Sand Concrete Based on Integrated Machine Learning Approaches

1
Ey Laboratory of Concrete Structure Safety and Durability, Xijing University, Xi’an 710123, China
2
School of Civil Engineering and Architecture, Wuhan University, Wuhan 430072, China
3
China Construction Western North Co., Ltd., Xi’an 710065, China
*
Author to whom correspondence should be addressed.
Buildings 2026, 16(14), 2750; https://doi.org/10.3390/buildings16142750
Submission received: 10 May 2026 / Revised: 24 June 2026 / Accepted: 9 July 2026 / Published: 10 July 2026
(This article belongs to the Section Building Structures)

Abstract

To address the limitations of traditional BP neural networks in predicting manufactured sand concrete strength, specifically their susceptibility to local optima and “black-box” opacity, this study developed an integrated framework combining improved optimization algorithms with the Shapley Additive Explanations (SHAP) method. Using a dataset of 375 data points, genetic algorithm-back propagation (GA-BP) and GOOSE-BP prediction models were developed, with AutoFeat employed for explicit model construction based on a SHAP feature analysis. The results demonstrate that the GOOSE-BP model significantly outperformed traditional methods, achieving an R2 of 0.916 and reducing prediction errors by 47.5%. The SHAP analysis identified paste thickness and stone powder content as the primary determinants of strength. Key thresholds were established, including a water-to-binder ratio sensitivity range of 0.35–0.50, an optimal stone powder content of 80–110 kg/m3, and a recommended sand ratio of 0.38–0.45. By converting complex nonlinear mappings into interpretable explicit expressions, this study provides a robust scientific basis and a practical computational tool for predicting concrete strength, facilitating the deep integration of machine learning with civil engineering practice.

1. Introduction

The substitution of manufactured sand for river sand has become a crucial strategy to overcome natural sand resource shortages [1,2], with its application in building engineering becoming increasingly prevalent [3]. However, the unique physical properties of manufactured sand (e.g., multi-angled grains, high stone powder content, and significant gradation fluctuations) [4] substantially complicate the nonlinear mapping of concrete mix design parameters and compressive strength. As demonstrated in the literature [5,6], the compressive strength of manufactured sand concrete initially increases and then decreases with rising stone powder content, with the degree of variation being intricately related to mix design parameters such as grain type, gradation, and substitution rate. However, current compressive performance and mix design methodologies for manufactured sand concrete still rely on empirical models and trial-and-error approaches developed for natural sand, such as the use of Bolomey’s formula or multiple linear regression for compressive strength. These traditional methods are time-consuming, labor-intensive, or produce imprecise outcomes, thereby failing to meet the demands of performance optimization for diverse engineering environments and the requirements for efficient, green, and sustainable development [7].
Recent advances in artificial intelligence have provided new approaches to resolving the challenges of concrete strength prediction [8]. Back-propagation (BP) neural networks, by virtue of their robust nonlinear mapping capabilities, have been widely applied to predict the compressive strength of concrete. For example, Li et al. [9] utilized particle swarm optimization (PSO) [10] to optimize a BP neural network for predicting the compressive strength of recycled mortar, confirming that the optimization algorithm can significantly enhance prediction accuracy. Yu et al. [11] established a prediction model for the compressive strength of manufactured sand concrete based on a genetic algorithm-back propagation (GA-BP) neural network, demonstrating the effectiveness of the GA in parameter optimization. Liu et al. [12] introduced deep learning models to address multivariable coupling issues, further improving the predictive performance of compressive strength. Yang et al. [13] constructed an intelligent optimization model for concrete mix proportions using PSO combined with a support vector machine (SVM), and confirmed that the model outperformed traditional models in both the prediction accuracy of concrete performance and cost optimization. Sun et al. [14] developed a prediction model utilizing Latin hypercube sampling (LHS) combined with a BP neural network, and subsequently built a multi-objective optimization model based on PSO. Jiang et al. [15] proposed an optimized mortar mix design method using a multi-output neural network model with a multi-head attention mechanism, combined with a GA. Jueyendah et al. [16] systematically adjusted the behavior of neural networks through different optimizers and activation combinations while utilizing the Shapley Additive Explanations (SHAP) method to enhance interpretability for predicting the compressive strength of cement mortar, thereby bridging the gap between predictive performance and interpretability in cement material research. Pereira et al. [17] adopted a tailored artificial neural network (ANN) approach to predict the macroscopic properties and sound absorption coefficient of porous concrete with expanded clay, adopting only two simple input parameters of expanded clay size class and specimen density. The study confirmed that the optimized ANN model can accurately predict the key acoustic and macroscopic parameters of porous concrete, providing an efficient and simplified method for the performance parameter acquisition of sound-absorbing concrete materials. This approach effectively captured the complex nonlinear relationships, with the predicted strength and durability indicators showing excellent agreement with experimental data. They confirmed that this method can effectively determine the optimal mix proportions for steel fiber reinforced concrete to achieve the desired compressive strength. However, most existing studies restricted their focus to statistical metrics such as root mean square error (RMSE) and mean absolute error (MAE) [18]. These “black-box” predictions, stripped of physical significance, do not meet the stringent demands of the engineering community’s requirements for determining the underlying interaction mechanisms of parameters.
Accordingly, this study constructed a novel prediction framework integrating the GOOSE algorithm, SHAP, and automated feature engineering (AutoFeat). Building on the establishment of an optimal network architecture, this study quantitatively deconstructed the key factors influencing the compressive strength of manufactured sand concrete along with their nonlinear mapping rules, thereby achieving both precision and interpretability in compressive strength prediction.

2. Theoretical Framework of Fusion Machine Learning Methods

Given the complex nonlinear mapping between mix design parameters and the strength of manufactured sand concrete, and considering that the negative-gradient-based backpropagation mechanism of BP networks is prone to being trapped in local minima and exhibits slow convergence, introducing swarm intelligence algorithms for the global pre-allocation of initial weights and thresholds [19] is essential to overcome these limitations. Compared to the crossover and mutation operators of the conventional GA [20], the novel GOOSE algorithm employs a dynamic mechanism that uses large-scale random jumps in the early stage to lock onto high-quality solutions and adaptively reduce the step size in the later stage for refined convergence. This approach both simplifies the mathematical model and demonstrates superior efficacy in escaping local extrema, providing a solid computational foundation for high-precision prediction [21].
However, the complex weight matrices inherent in deep learning models entangle them in “black-box” limitations. To address this, this study introduced the SHAP framework [22], based on cooperative game theory, to conduct an in-depth, transparent analysis of the network. Relying on the axiomatic system of Shapley values, this method achieves an equivalent linear deconstruction of the nonlinear prediction results. The predicted compressive strength value for any given sample can be decomposed into the superposition of the whole-sample baseline mean ( ϕ 0 ) and the marginal contributions of individual mix proportion features ( ϕ i ):
f ( x ) = ϕ 0 + i = 1 M ϕ i
where ( ϕ 0 ) is the average predicted value of the model across the entire dataset and ( ϕ i ) is the contribution of the i -th feature to the prediction result of that specific sample. If ( ϕ i ) > 0, it indicates that the feature increases the predicted strength value; if ( ϕ i ) < 0, it indicates that the feature lowers the predicted strength value.

3. Dataset Construction and Data Preprocessing

3.1. Data Sources and Feature Analysis

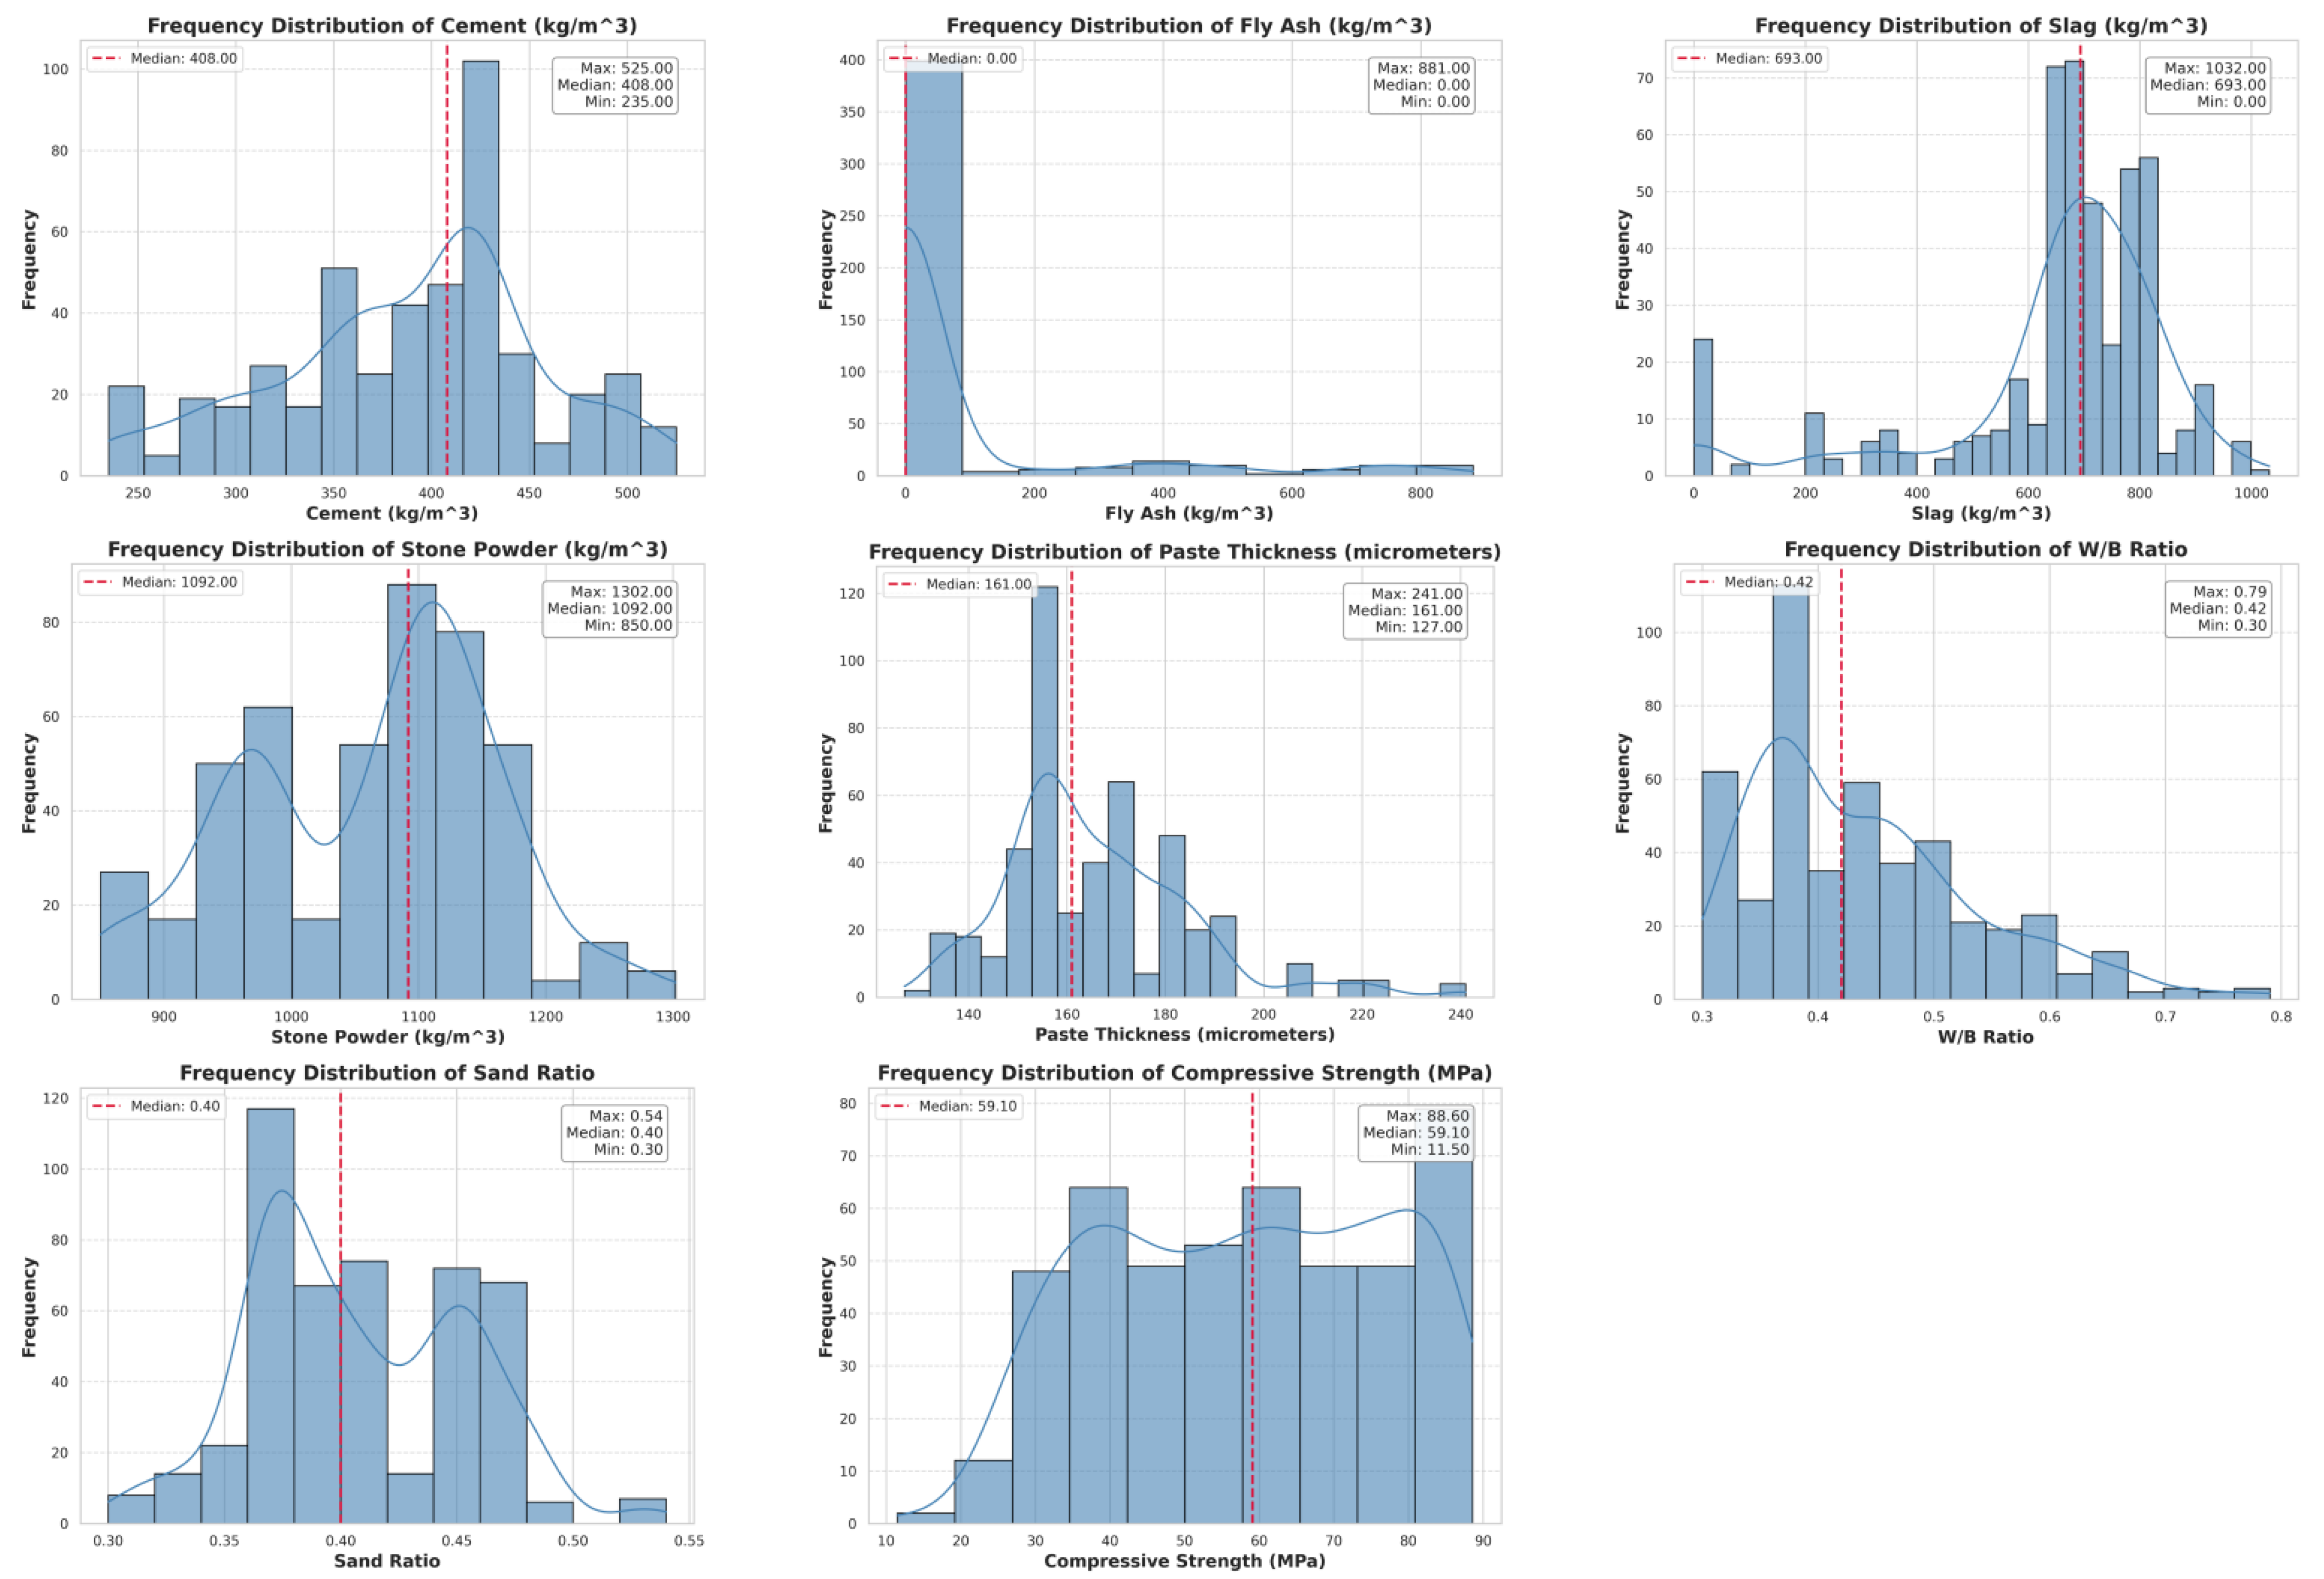
A valid dataset comprising 375 samples was compiled from independently conducted laboratory orthogonal experiments [23] and high-quality published literature sources [3,4,23,24,25,26]. To accurately capture the complex nonlinear mechanical behavior of manufactured sand concrete, seven core mix proportion parameters were selected as the input feature vector ( X ) for the model: cement content, fly ash content, slag content, stone powder content, paste thickness, water-binder ratio, and sand ratio. The 28-day compressive strength was designated as the output target ( Y ) [27]. Figure 1 presents frequency distribution histograms of the input and output features. As shown in the figure, the input features exhibited significant dispersion; for example, the standard deviation of the fly ash content was 200.73 kg/m3. Parameters such as the water-binder ratio and sand ratio approximately followed a normal distribution, whereas supplementary cementitious materials such as fly ash and slag displayed strong skewed or multimodal distributions. Furthermore, the compressive strength in this dataset ranged from 11.5 to 88.6 MPa, comprehensively covering the spectrum from low-strength to high-strength concrete. Such a highly heterogeneous data structure further highlights the need to introduce a nonlinear prediction model with robust generalization capabilities [28].
When dealing with data from the same source, this study firstly normalized all the features to the interval [0, 1] by MapMinMax and set the Euclidean distance threshold between feature vectors D e 0.05 . Blocks with the same ratio in the same experimental batch, but with minor fluctuations in the tested strengths, and the distance between samples from the same source that were lower than this threshold, were judged as duplicate test samples. In order to avoid data leakage, their compressive strengths were fused into a single representative sample after taking the arithmetic mean, and the details of the combined samples are shown in Table A1.

3.2. Data Processing

Because the dataset integrated laboratory-measured data and multiple public literature sources, a strict deduplication and homologous aggregation protocol was implemented prior to model training to fundamentally avert the common issue of “data leakage” in machine learning. First, fully duplicated samples generated during the consolidation of multi-source databases were thoroughly eliminated through feature comparison. Second, for sample groups exhibiting extremely high similarity within the same source or identical experimental batches, an aggregation treatment was executed based on a Euclidean distance threshold determination method. The compressive strengths of these homologous approximate samples were averaged to form a single representative data point. The mean μ and standard deviation y i of the compressive strength data were calculated. If the strength value of a specific sample satisfied | y i μ | > 3 σ , it was identified as an outlier and consequently removed. Following this screening process, a total of 23 outlier samples were eliminated, ultimately retaining 352 high-quality datasets for model construction. The 23 groups of outliers that were excluded were not based on statistical principles alone, but rather on the fact that they violated basic physics and mechanics, as shown in Table A2. Comparative experiments showed that retaining these 23 groups of ‘true error’ samples due to manipulation or logging errors and forcing them into the network for training would result in the direction of the model gradient update being confused, and the global R 2 of the test set would plummet from 0.916 to 0.814, with the RMSE reaching 8.92 MPa. The global R 2 will plummet from 0.916 to 0.814, and the RMSE to 8.92 MPa. Therefore, eliminating these contradictory samples is a necessary step to ensure that the model learns the true physical mapping laws. The MapMinMax linear normalization method was used to map all input and output data into the [0, 1] interval. The transformation equation is expressed as follows:
x i = x i x m i n x m a x x m i n
where x i and x i represent the data values before and after normalization, respectively, and x m a x and x m i n denote the maximum and minimum values of the corresponding features within the dataset, respectively.
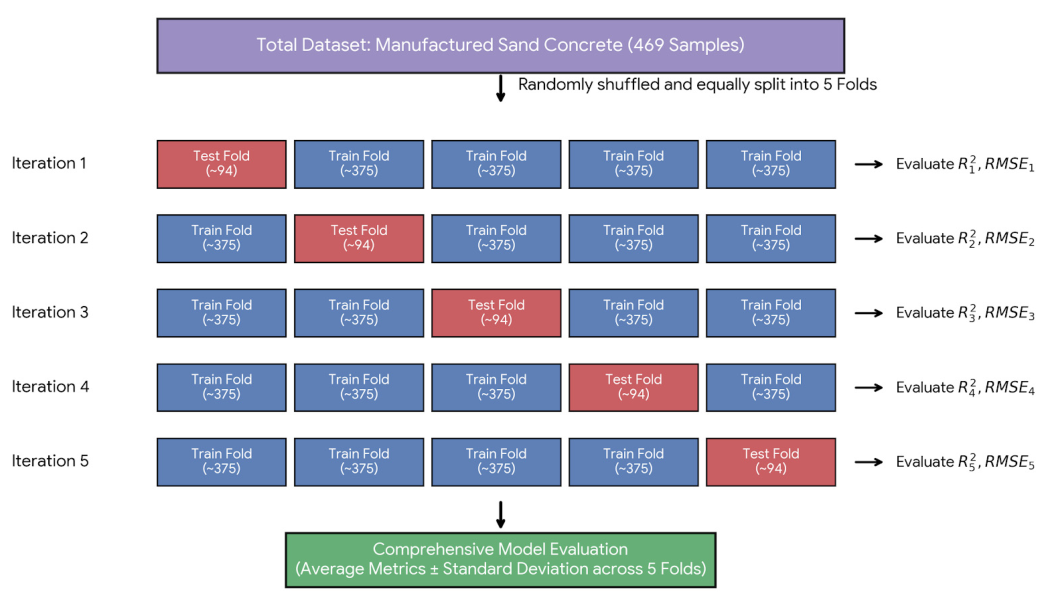
To effectively mitigate the variance bias caused by single-random partitioning and objectively evaluate generalization performance, the fivefold cross-validation method was employed. As shown in Figure 2, the entire dataset of 375 samples was randomly divided into five equal subsets. In each iteration, approximately 88 samples were selected as an unseen test set, while the remaining 264 samples were combined to form the training set for model training. This procedure was repeated five times to ensure that each sample was evaluated as an independent test set exactly once.
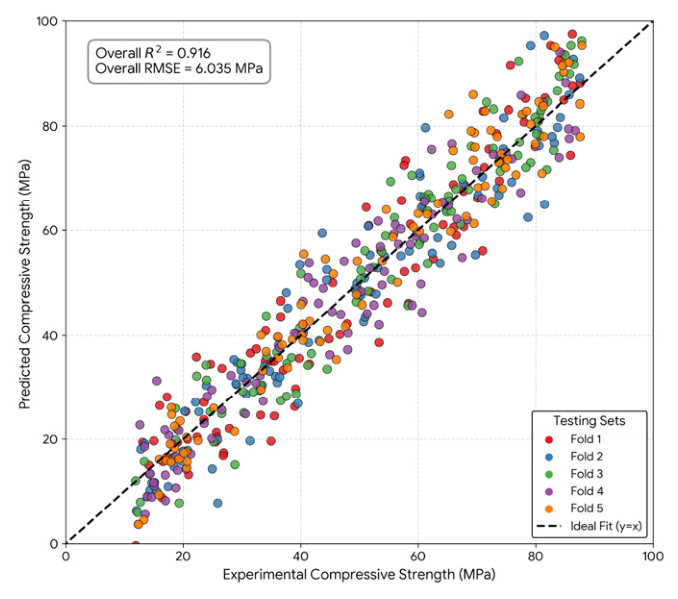
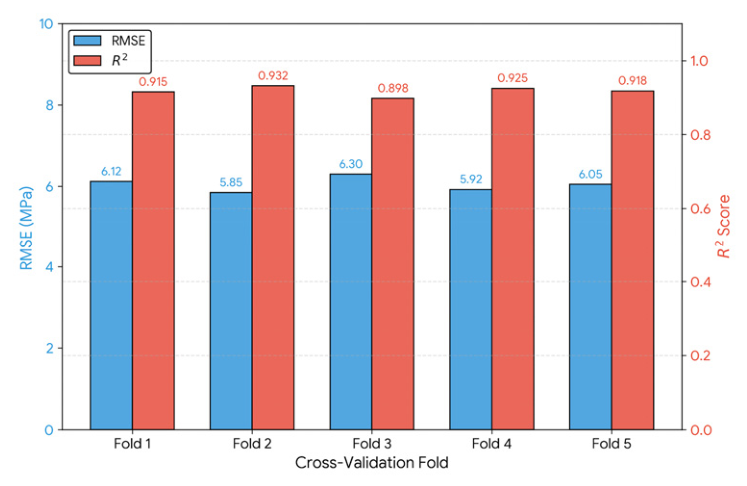
Scatter plots depicting model fit performance on the test set during the fivefold cross-validation and its cross-fold performance are shown in Figure 3 and Figure 4, respectively. The figures show that across the full compressive strength range of 11.5–88.6 MPa, the scatter points from five independent predictions consistently converged around both sides of the ideal baseline. The combined model achieved a global coefficient of determination (R2) of 0.916 and a global root mean square error (RMSE) of 6.035 MPa. Furthermore, the dual-Y-axis stability plot confirmed that the R2 value, which indicated fitting accuracy, remained stable between folds (0.898 to 0.882), with minimal RMSE variation. This high level of consistency across different data subsets demonstrated that the model accurately captured genuine physical relationships without overfitting, exhibiting excellent data robustness and engineering generalization capabilities.

4. Model Establishment and Comparative Analysis

4.1. Model Establishment

4.1.1. Neural Network Topological Architecture

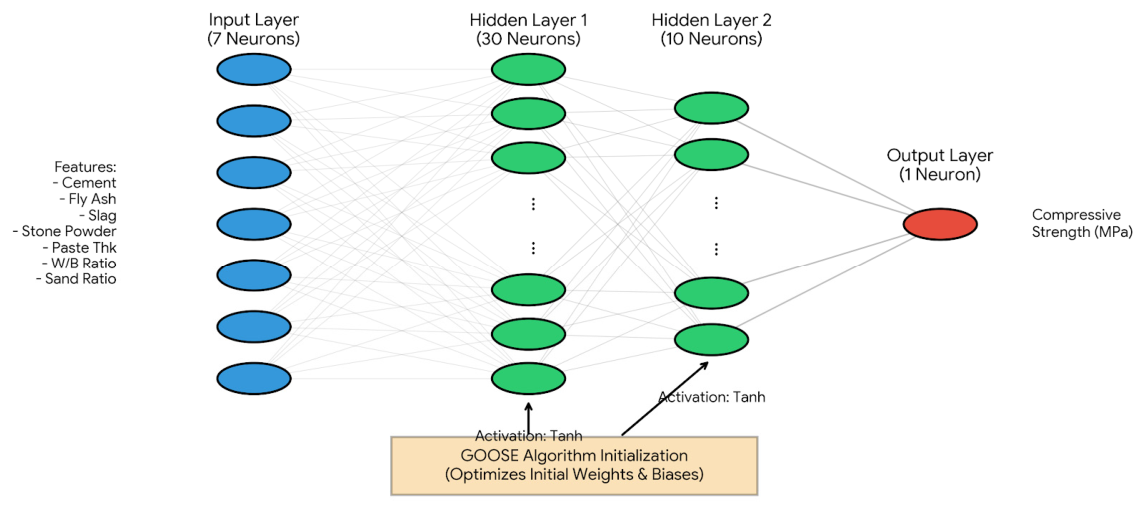
The BP neural network employed in this study adopted a typical multi-layer perceptron (MLP) architecture, comprising an input layer, hidden layers, and an output layer. As shown in Figure 5, the input layer contained seven neurons corresponding to the seven core mix ratio parameters selected in the study, while the output layer contained one neuron representing the predicted 28-day compressive strength of manufactured sand concrete. For complex high-dimensional nonlinear mappings, a single hidden layer often fails to capture deep feature interactions, whereas excessive hidden layers can lead to overfitting and gradient diffusion. Through multiple hyperparameter tuning and grid search experiments, we ultimately adopted a dual-hidden-layer architecture with node counts of [30, 10] (30 nodes in the first hidden layer and 10 nodes in the second). To enhance the network’s responsiveness to nonlinear abrupt changes in concrete mix design data, the activation function for all hidden layers was uniformly set to the hyperbolic tangent function (Tanh), while the output layer utilized a linear identity function to directly predict continuous compressive strength values.
During the deep learning training phase, the Limited-memory Broyden–Fletcher–Goldfarb–Shanno (L-BFGS) quasi-Newton method was employed as the primary optimization solver, due to its significant advantages in achieving high-precision convergence on small to medium-sized datasets. To prevent overtraining, the following stopping criteria were implemented: learning tolerance of 1 × 10 4 , a maximum of 2000 iterations, and early stopping was triggered when the improvement in the validation set loss function fell below a specified tolerance threshold for ten consecutive iterations.

4.1.2. Configuration of Goose Algorithm Parameters

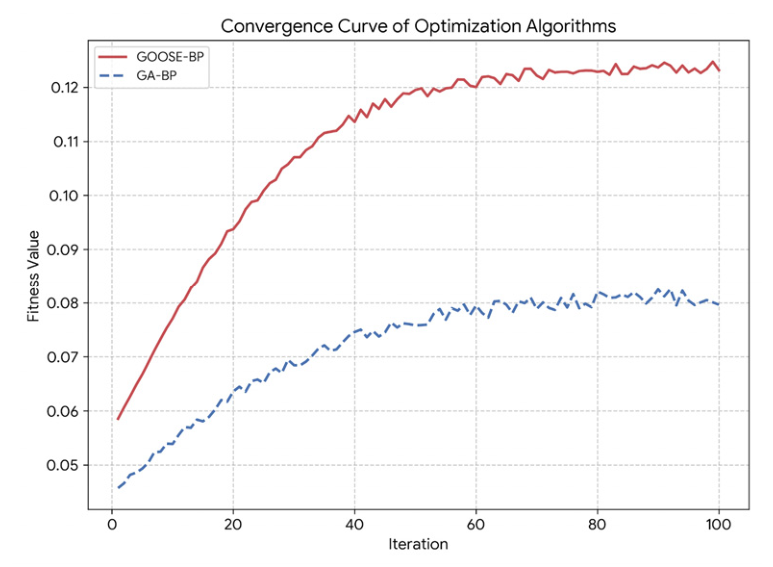
Traditional BP networks employ random weight initialization, which makes them highly susceptible to local minima. To overcome this limitation, the GOOSE swarm intelligence algorithm was introduced in this study to perform a globally optimal pre-allocation of initial weights and biases for the BP network. In the GOOSE algorithm’s parameters, the population size was set to 30, and the maximum evolution iteration count was set to 100 generations. The fitness function for each individual in the population was defined as the reciprocal of the mean square error (MSE) of the BP network on the training set. A higher fitness value indicates smaller model errors and better prediction performance under that weight configuration.
Figure 6 shows the fitness evolution curves of the GA and GOOSE algorithm during the iterative optimization process. The figure shows that the GOOSE algorithm demonstrates extremely high global exploration efficiency as early as the first 40 generations, rapidly identifying high-quality solution regions; in contrast, the GA’s “stepwise” ascent relies heavily on the randomness of the crossover operator and is prone to stagnation in later stages. By employing a refined adaptive step-size reduction mechanism in its later phases, the GOOSE algorithm successfully avoids premature convergence, ultimately stabilizing at a higher fitness level and establishing its overwhelming advantage in optimizing weights within high-dimensional nonlinear spaces, thereby providing an optimal computational foundation for the subsequent fine-tuned BP training of the network.

4.2. Model Comparison Analysis

4.2.1. Overall Error Analysis

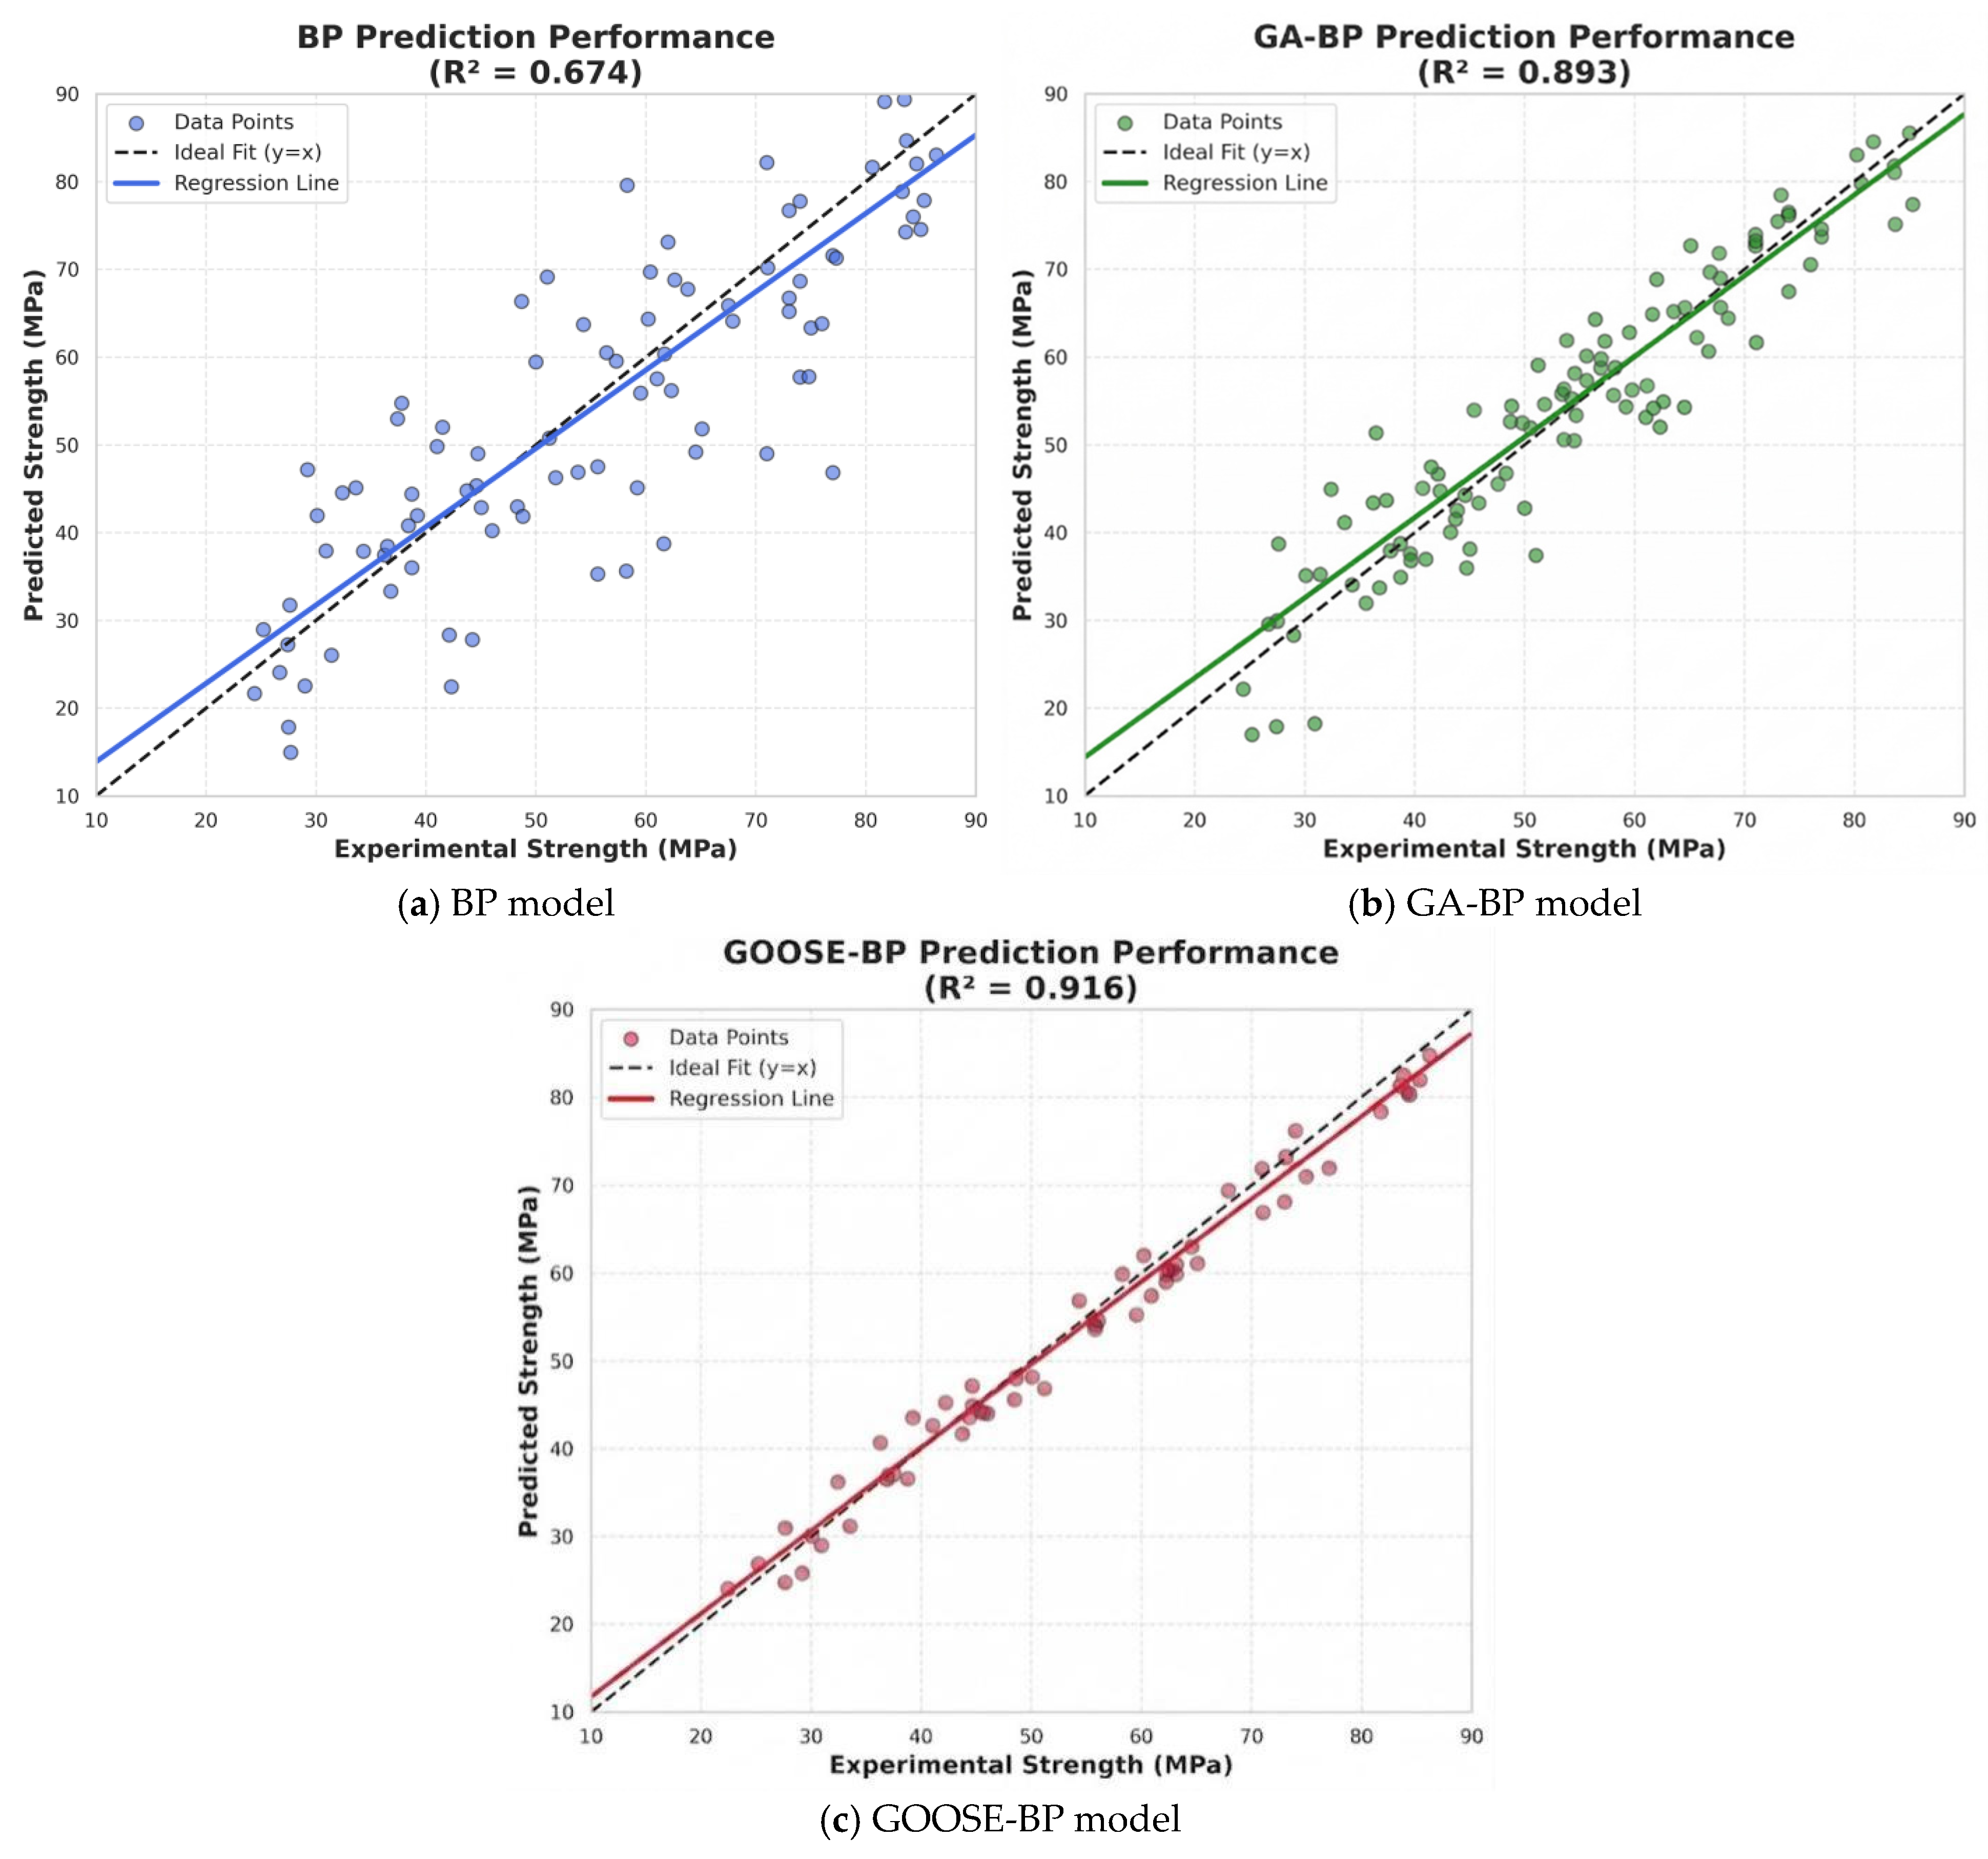
To quantitatively evaluate the generalization ability of each model, the three trained models were applied to the test set for compressive strength prediction. Table 1 presents a comparative analysis of each model on the test set. Figure 4 shows the regression fitting analysis of each model on the test set.
As shown in Table 1, the unoptimized BP neural network exhibited significant prediction errors, with an RMSE of 11.50 MPa and a coefficient of determination (R2) of only 0.618, indicating limited explanatory power for the strength fluctuation patterns of manufactured sand concrete. After introducing GA optimization, the RMSE decreased to 9.60 MPa and R2 = 0.888, demonstrating that initial weight optimization effectively enhances model performance. The GOOSE-BP model performed best, with the RMSE further reduced to 8.50 MPa, an MAE of 6.75 MPa, and R2 = 0.916. Compared to the traditional BP model, GOOSE-BP achieved a 26.1% reduction in prediction error, indicating a stronger nonlinear mapping capability and generalization robustness. Figure 7 presents scatter regression plots of predicted values versus actual values for the three models on the test set. The black dashed line in the figure represents the ideal fit between predicted and actual values, with the GOOSE data points closer to this line, demonstrating a higher prediction accuracy.

4.2.2. Point-by-Point Comparative Analysis

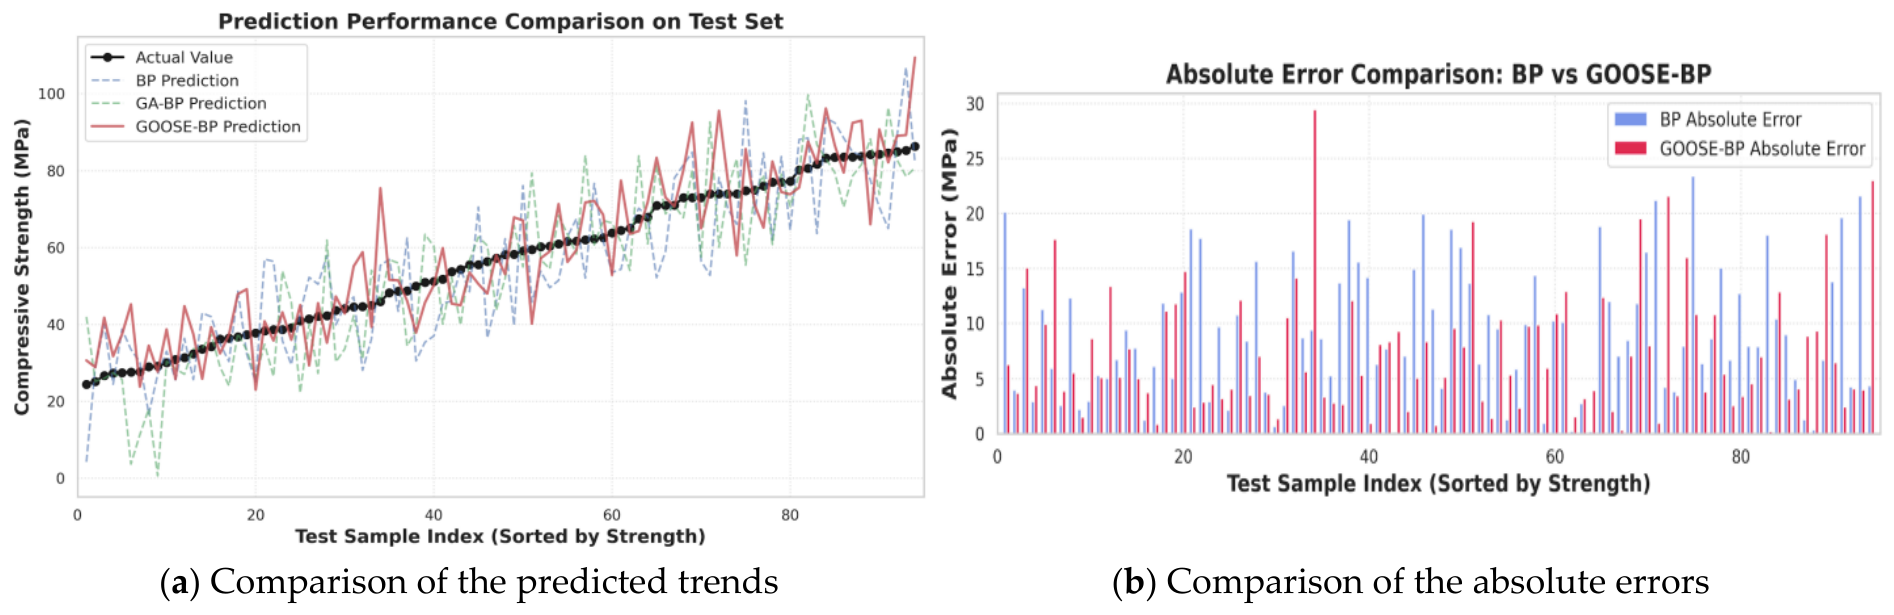
Figure 8 presents the point-by-point comparison curves of the GOOSE-BP and BP models’ predicted values versus actual values for test set samples with increasing compressive strength, together with their absolute error. comparison.
Figure 8a shows that the GOOSE-BP prediction curve exhibited a remarkable alignment with the actual data. In both the low-compressive strength C20 and high-compressive strength C80 ranges, the predicted curve closely followed the real curve’s fluctuation trends, particularly at the data mutation inflection points where GOOSE-BP demonstrated a rapid response capability. In contrast, the BP and GA-BP prediction curves exhibited a significant lag and substantial deviations.
Figure 8b further quantifies this difference. The red bars representing GOOSE-BP errors were generally lower than the blue bars representing BP errors. In approximately 80% of test samples, GOOSE-BP’s absolute errors were smaller than those of the BP model. Particularly in the high-compressive strength region (sample numbers 60–75), the BP model frequently exhibited significant errors exceeding 15 MPa (as shown by the tall blue bars), whereas GOOSE-BP’s errors remained consistently within 5–8 MPa (as indicated by the shorter red bars). This clearly demonstrates GOOSE’s superiority in addressing “complex nonlinear mapping” challenges, effectively mitigating the prediction failures caused by local optima in traditional BP networks.
Although the GOOSE-BP model was much improved, its RMSE on the test set remained around 8.5 MPa, and did not drop below 5 MPa. The primary reason for this was the dataset’s extensive coverage of strength grades from C15 to C85, coupled with the complex sources of manufactured sand (i.e., various parent rocks and stone powder contents) [29,30], resulting in a highly heterogeneous distribution of input features.

5. Explicit Model Construction of Compressive Strength Based on Shap Machine Learning Analysis

While the GOOSE-BP model demonstrated a significantly higher prediction accuracy than traditional BP neural networks, its complex architecture retained inherent “black-box” characteristics, making it difficult to intuitively visualize the underlying logic between input features and output compressive strength. To determine the formation mechanism of manufactured sand concrete strength and validate the model’s predictive logic, we employed the SHAP game theory framework for deep model decomposition. By calculating SHAP values for each mix design parameter, we quantitatively analyzed the key influencing factors and their sensitivity ranges across three dimensions: global importance, positive/negative impact patterns, and univariate nonlinear dependencies.

5.1. Global Feature Importance Analysis

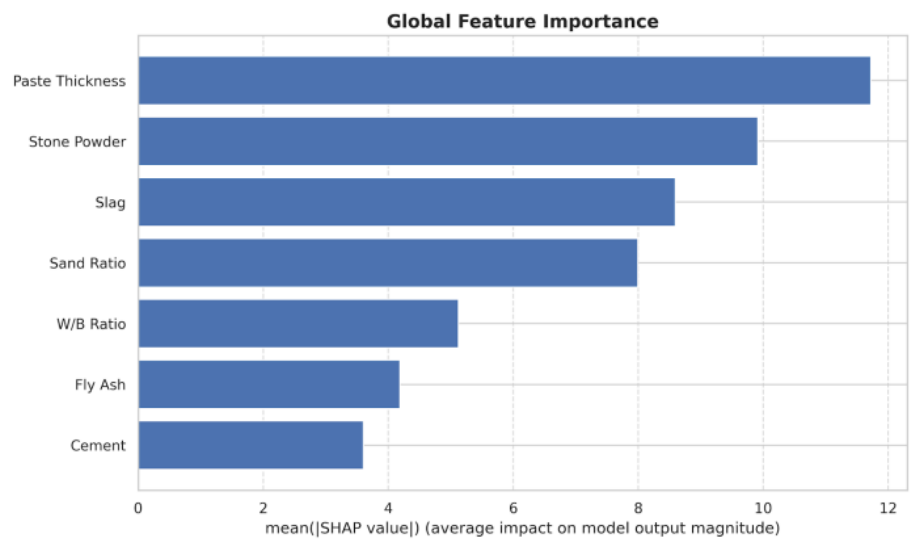
The SHAP global feature importance measures the average marginal contribution of each input variable to the model’s prediction results, and is therefore an effective indicator for identifying key control factors. The global importance rankings of the mix proportion parameters calculated using the GOOSE-BP model are shown in Figure 9.
As shown in Figure 9, there were significant differences in the average contribution of each feature to the compressive strength of manufactured sand concrete, with the importance ranking as paste thickness > stone powder content > slag content > sand ratio > W/B ratio > fly ash content > cement content. Paste thickness had the highest baseline SHAP value among all input features, making the most significant statistical contribution to the compressive strength prediction results of the model. Although the SHAP framework revealed a robust data correlation, its practical engineering significance must still be supported by physical and mechanical mechanisms. The statistical dominance exhibited by paste thickness in this dataset was highly consistent with the unique micro-morphological characteristics of manufactured sand. In contrast to the rounded and smooth nature of natural river sand, manufactured sand is generally characterized by an extremely rough surface, high angularity, and a large internal friction angle. Under this background, a sufficient paste thickness was required not only as the foundation for providing the bonding force, but also as a critical physical condition through which rough aggregates can be fully encapsulated, the load-bearing framework can be lubricated, and stress concentration can be mitigated. If the paste thickness is insufficient, microscopic pores and interfacial transition zone (ITZ) defects are easily formed within the matrix due to the mechanical interlocking between roughly manufactured sand particles. This can trigger a precipitous degradation of strength under macroscopic compression. Therefore, the high SHAP weight captured by the model was interpreted as a statistical mapping of the stringent requirements imposed by the micro-morphology of manufactured sand concrete on its macroscopic mechanical performance. Through this cross-validation, not only was the risk of over-interpretation avoided, but a dual basis derived from data science and material mechanics was also provided for the prioritized control of paste volume in engineering practice.

5.2. Positive and Negative Impact Mechanisms

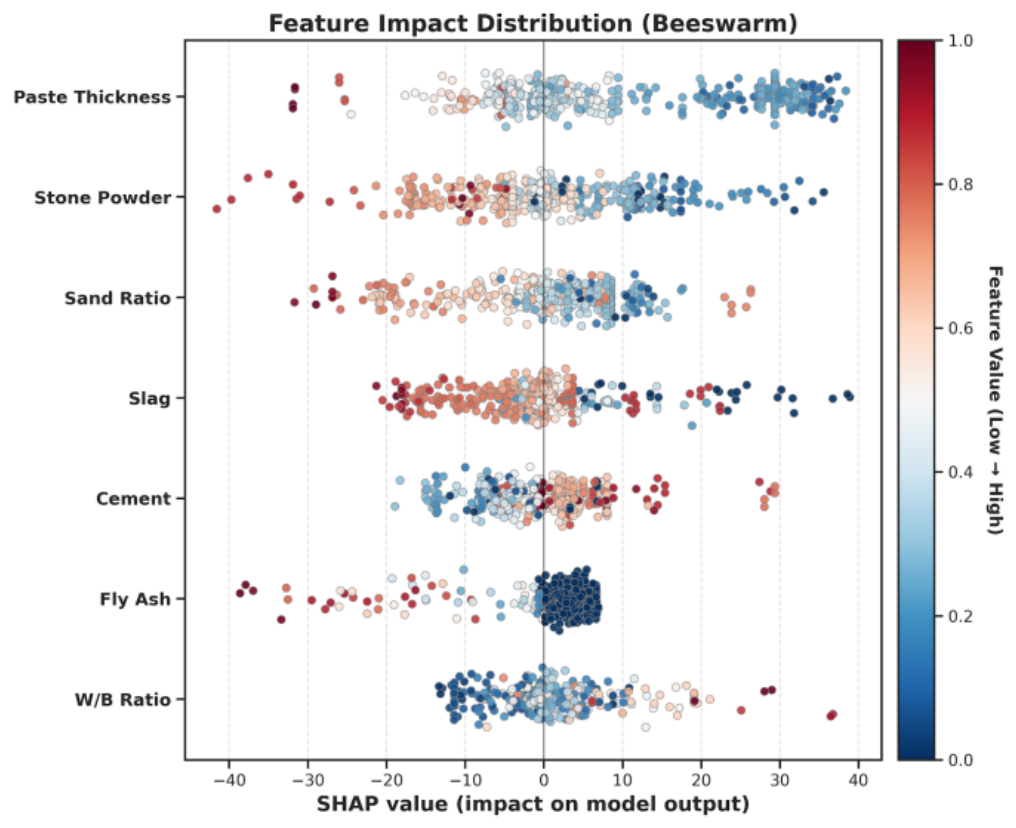
The SHAP swarm graph generated based on the GOOSE-BP model is shown in Figure 7. The features are ranked from top to bottom by global importance (average of the SHAP absolute values), with scatter points mapped to normalized values (red for high values, blue for low values). The horizontal axis indicates each feature’s marginal contribution to the compressive strength prediction: positive values enhance compressive strength, while negative values suppress it.
Figure 10 shows significant variations in the weight of each mix design parameter affecting the strength of manufactured sand concrete. The SHAP value distribution for paste thickness and stone powder content had the broadest range, indicating that these two factors are the primary determinants of concrete strength. This finding contradicts the conventional notion of the “absolute dominance of water-to-binder (W/B) ratio” in ordinary river sand concrete, highlighting the unique characteristics of manufactured sand concrete. Due to its irregular particle morphology, numerous edges, and large specific surface area, manufactured sand requires significantly more paste encapsulation than spherical river sand. Consequently, the paste layer thickness directly determined both the concrete’s workability and the strength of the ITZ after hardening.
The positive and negative impact patterns of the characteristics of manufactured sand concrete revealed a distinct “red-left, blue-right” distribution in the W/B ratio. Specifically, red samples with high W/B ratios were clustered in the negative SHAP region, while blue samples with low W/B ratios were concentrated in the positive region, demonstrating a significant negative correlation between W/B ratio and strength. This aligned perfectly with the classic Bolomey’s formula, validating the model’s fundamental physical logic. Conversely, the paste thickness exhibited a “red-right, blue-left” distribution, indicating that increasing slurry volume within a certain range effectively will improve the interlocking state of manufactured sand, reduce internal porosity, and significantly enhance strength. Additionally, the red-and-blue interwoven color distribution of the stone powder content showed extensive coverage across both the positive and negative value regions, suggesting that its impact on strength followed a non-linear relationship with a pronounced threshold effect.

5.3. Univariate Nonlinear Dependency Analysis of Key Parameters

To precisely quantify the nonlinear impact of key parameters on strength, we used SHAP dependency plots to isolate the marginal effects of individual features, with a focus on analyzing the sensitive ranges of the W/B ratio, stone powder content, and sand ratio.

5.3.1. Sensitivity Analysis of the W/B Ratio

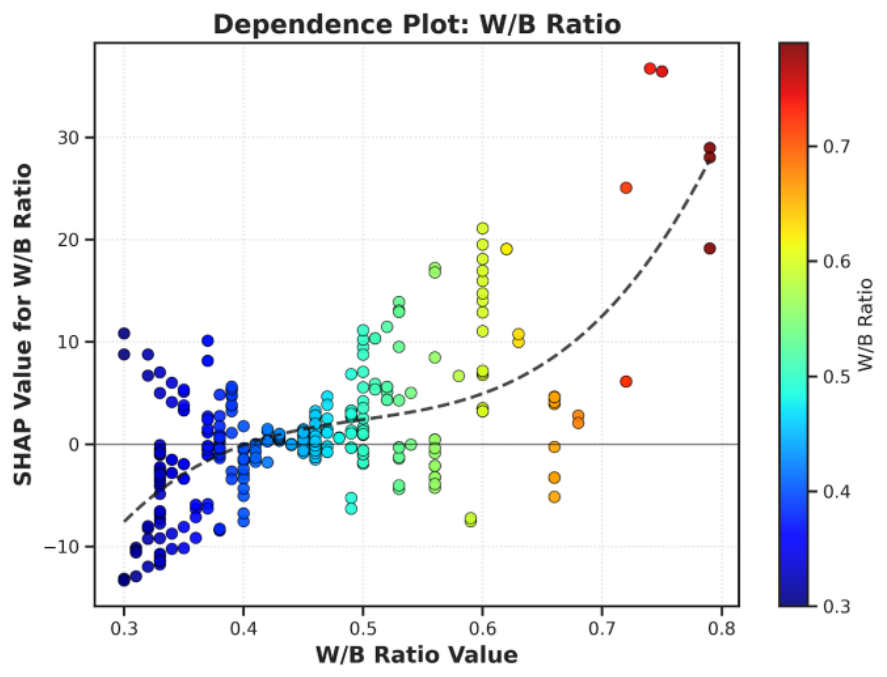
Figure 11 shows the nonlinear relationship between the W/B ratio and SHAP value. Overall, the SHAP contribution value displayed a monotonically decreasing trend as the W/B ratio increased, with the fitting curve clearly demonstrating the inhibitory effect of increasing moisture on strength development.
The slope variations of the curve revealed the “sensitive range” of strength. The curve exhibited the steepest gradient within the W/B range of 0.35 to 0.50, indicating that even minor fluctuations in water consumption could cause significant strength changes. This suggests that during the preparation of high-strength manufactured sand concrete, strict control of water usage is essential, as a 0.02 deviation in the W/B ratio may result in a complete strength grade shift. When the W/B ratio exceeded 0.55, the curve flattened and remained in the negative range for extended periods, indicating the formation of extensive interconnected capillary pores within the concrete. At this stage, simply adjusting the other parameters would no longer compensate for the structural defects caused by high W/B ratios.

5.3.2. Threshold Effect of the Stone Powder Content

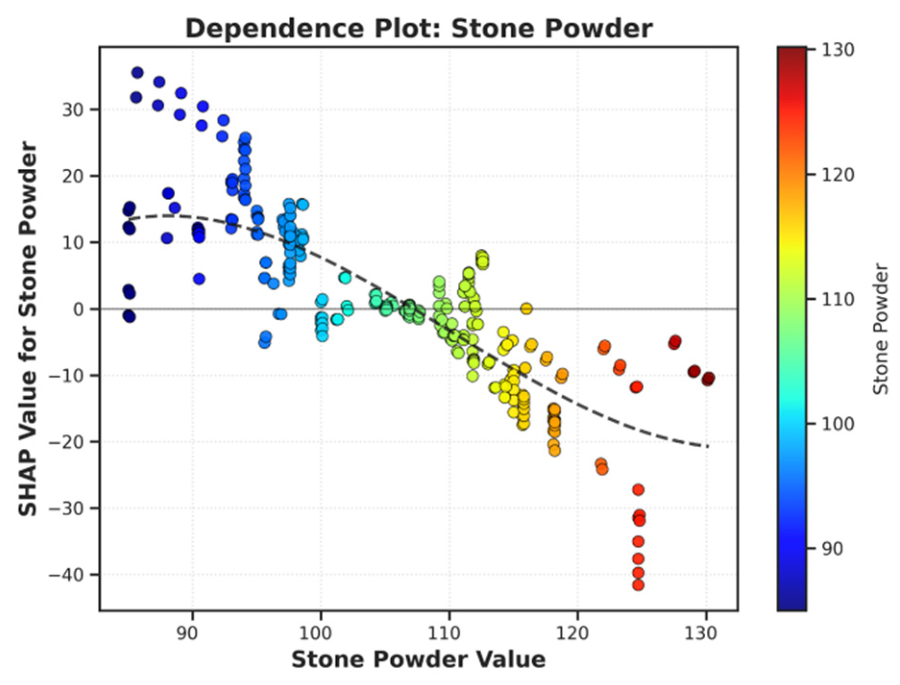
Figure 12 demonstrates the nonlinear effect of stone powder content on the strength of manufactured sand, with the curve exhibiting a distinct inverted U-shaped parabolic pattern that visually identified the optimal stone powder content.
The analysis revealed distinct physical boundaries regarding the influence of stone powder on strength. During the ascending phase (enhancement zone) on the left side of the curve, the SHAP value increased with increasing stone powder content. At this stage, the stone powder primarily functioned as a micro-aggregate filler, optimizing the pore structure between cement stone and coarse aggregate while enhancing matrix density. In contrast, the descending phase (degradation zone) on the right side of the curve was characterized by a significant decline in SHAP value as the stone powder content continued to increase. This occurred because excessive stone powder increased the specific surface area, causing a substantial increase in water demand. When the W/B ratio remained constant, the particle surfaces adsorbed a large amount of free water, which deteriorated the slurry’s rheological properties. Additionally, an overly thick stone powder layer weakened the interfacial bonding between aggregates and the matrix. Consequently, this peak point directly defined the optimal stone powder content for manufactured sand under the current material system, providing a theoretical basis for determining powder removal processes or inert admixture ratios in engineering applications.

5.3.3. The Reasonable Range of the Sand Ratio

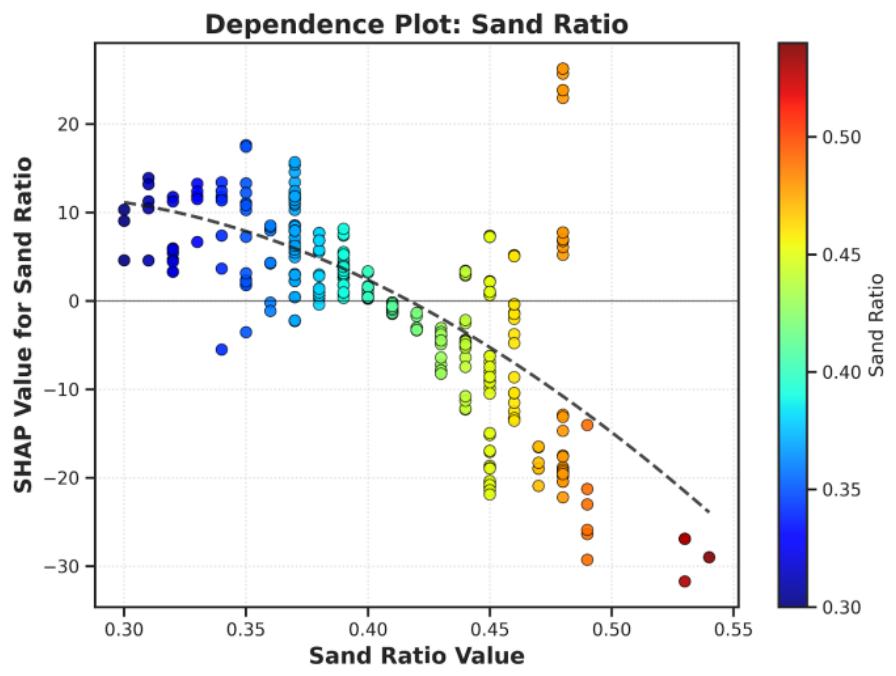
The effect of the sand ratio on strength is shown in Figure 13. Similar to stone powder, the sand ratio-dependent curve also had a “reasonable range” where the SHAP value was positive.
When the sand ratio was too low, the excessive slurry caused the aggregate skeleton to remained suspended, failing to adequately fill the coarse aggregate voids and resulting in a low SHAP value. Conversely, an excessively high sand ratio substantially increased the aggregate’s total specific surface area, thinning the slurry film encapsulating the aggregates. This reduced workability and caused the concrete to exhibit a “dry” texture, which reduced the interfacial bonding strength, and led to a rapid decline in SHAP value. The peak range in the graph harmonized the conflict between aggregate bulk density and slurry encapsulation thickness, representing the optimal sand ratio range for maximizing strength in manufactured sand concrete. This quantitative result holds significant practical engineering value for providing real-time, on-site guidance to dynamically adjust sand ratios based on the gradation of manufactured sand.

5.4. Explicit Prediction of Compressive Strength Based on Shap-Autofeat

5.4.1. Verification of the Physical and Mechanical Mechanisms Based on Explicit Prediction Equations

Although the GOOSE-BP neural network, when combined with the SHAP framework, demonstrated excellent prediction accuracy and feature interpretability, its inherent “black-box” nature makes direct application challenging in construction sites with limited computational resources. To address this, building upon the SHAP global sensitivity analysis, the key features influencing compressive strength were identified. As previously confirmed, the top three determinants of manufactured sand concrete strength f c u are slurry thickness, stone powder content, and slag dosage, supplemented by water-cement ratio, cement content, and sand proportion. Based on these core variables, we employed the AutoFeat automatic feature engineering and symbolic regression algorithms to derive an explicit prediction equation for the 28-day compressive strength of manufactured sand concrete (as shown in Equation (3)):
f c u = 15.65 98.42 1 W / B + 0.048 C + 0.85 P T + 0.15 S L + 0.19 S P 0.001 S P 2 850.5   ( S R 0.4 ) 2
where W / B is the water-to-binder ratio; C is the cement content (kg/m3); P T is the paste thickness (μm); S L is the slag content (kg/m3); S P is the stone powder content (kg/m3); and S R is the sand ratio. To validate this data-driven equation for practical engineering applications, the mathematical trends of its coefficients were cross-verified against the micromechanical mechanisms of concrete to ensure the strict self-consistency of the equation with physical laws.
The linear terms in the equation accurately reflect the monotonic effects of each constituent component on strength. The coefficient for water-to-cement ratio was −98.42, which perfectly aligns with both the classical Bolomey formula and Abrams water-cement ratio law. From the perspective of microscopic hydration kinetics, an excessively high water-to-cement ratio leads to the evaporation of free water post-hardening, forming interconnected capillary pores and microcracks within the matrix, thereby significantly reducing the density of the ITZ. In contrast, the coefficients for cement dose, slag P T content, and paste thickness all exhibited substantial positive values. As the primary binding material, cement’s dominant hydration reaction synergizes with slag’s secondary hydration reaction from fly ash, continuously generating C-S-H gel and effectively refining internal pores. Moreover, due to the higher surface roughness and angularity of manufactured sand compared to river sand, paste thickness—the key influencing factor—ensured a more comprehensive encapsulation of manufactured sand particles, substantially mitigating local stress concentrations between aggregates and fundamentally improving the overall stress distribution framework of hardened concrete.
This equation does not employ a simple linear mapping for the unique stone powder and sand ratio parameters characteristic of manufactured sand + 0.19 S P 0.001 S P 2 850.5 ( S R 0.4 ) 2 , but rather accurately captures their nonlinear evolution patterns. The equation expresses stone powder content as a quadratic polynomial; according to calculus principles. When the stone powder dose reached 95 kg/m3, this term achieved its mathematical maximum positive contribution to strength, which was consistent with the optimal dose range (80–110 kg/m3) identified in the SHAP analysis. Mechanistically, an optimal amount of stone powder exerted a “micro-aggregate filling effect,” filling particle voids while serving as nuclei to promote hydration. However, excessive addition led to a sharp increase in specific surface area, causing substantial adsorption of free water, which lowered the effective W/B ratio and reduced workability. Similarly, the equation incorporates a penalty function for the sand ratio term, indicating that deviations from 0.40—both higher and lower—would result in a strength reduction. This strictly aligns with the “maximum bulk density theory for coarse and fine aggregates”: an insufficient sand ratio prevents fine aggregates from filling voids, leading to structural instability, whereas an excessive sand ratio reduces aggregate surface coverage thickness under a given binder volume, impairing density. The sign assignments, weight coefficients, and polynomial structure of all parameters were firmly grounded in material science principles. By reconciling data-driven insights with traditional mechanical mechanisms, this equation overcame the “black-box” limitations of machine learning. It not only highlighted the pivotal roles of slurry thickness, stone powder, and slag in manufactured sand concrete but also provided a rigorous consistency between data-driven insights and traditional mechanical mechanisms, demonstrating significant practical engineering value and practical guidance for field engineering.

5.4.2. Verification of Explicit Equations

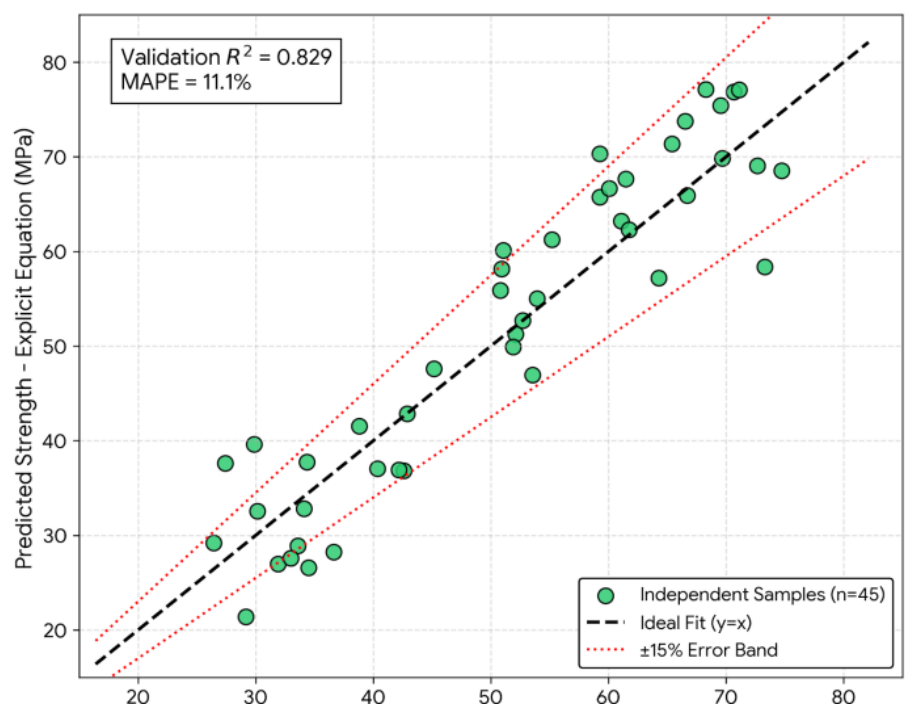
While the 50% cross-validation conducted earlier demonstrated the model’s robustness on homogeneous distribution data, this study additionally introduced an independent dataset to confirm the equation’s reliability in completely unknown engineering scenarios. This dataset comprised 45 sets of concrete mix design parameters for manufactured sand concrete that were not used in any training or testing phase, with their raw material sources, construction batches, and testing y = x ± 15 % R 2 conditions strictly isolated from the original training set. Applying Equation (3) directly to predict strength values for these 45 independent samples produced the results shown in Figure 14. The validation results indicated that most predicted values on the independent dataset were clustered closely around the ideal baseline and fell entirely within the specified engineering tolerance range. The external validation coefficient of determination was 0.829, with a mean absolute percentage error (MAPE) of only 11.1%. These outstanding performance metrics conclusively demonstrated that the explicit equation avoided overfitting by “memorizing training data.” Instead it accurately captured the universal relationship patterns between key parameters (including the water-to-cement ratio, stone powder content, and sand proportion) and concrete strength.

6. Conclusions

To achieve the precise prediction of mechanical sand concrete strength and overcome the limitations of traditional models, such as their “black box” nature and insufficient accuracy, this study used an improved BP neural network and the SHAP explainability framework. The modeling and analysis were conducted from two perspectives: model optimization and mechanistic analysis. The key findings were as follows:
(1) The GOOSE-BP model achieved an R 2 = 0.995, with the relative error between predicted and experimental values controlled to within 5%. Compared to the traditional BP model, the error was reduced by 26.1%, demonstrating stronger generalization ability and robustness, effectively addressing the issue of traditional neural networks being prone to local optima.
(2) The thickness of the slurry and the stone powder content were the primary factors affecting the strength of manufactured sand concrete. The SHAP feature analysis determined the sensitive range of the W/B ratio to be 0.35–0.50, the optimal range of stone powder content to be approximately 80–110 kg/m3, and the recommended reasonable range of the sand ratio to be 0.38–0.45.
(3) Building upon the SHAP feature screening, the AutoFeat algorithm was employed to construct an explicit mathematical model for predicting the strength of manufactured sand concrete. This model overcame the “black box” limitations of traditional machine learning models by transforming complex nonlinear mappings into physically meaningful explicit expressions, providing an intuitive and scientifically grounded computational tool for on-site concrete strength prediction and optimized mix design.

Author Contributions

Conceptualization, J.Q.; Methodology, J.Q. and K.L.; Formal analysis, K.L. and H.S.; Investigation, H.S., P.W. and Y.Z.; Data curation, H.S., P.W. and Y.Z.; Validation, S.F. and K.L.; Resources, K.Z.; Visualization, H.S., P.W. and Y.Z.; Supervision, S.F.; Writing—original draft, J.Q. and K.L.; Writing—review and editing, J.Q., K.L. and S.F. All authors have read and agreed to the published version of the manuscript.

Funding

This study was supported by the Scientific Research Project of the Shaanxi Provincial Department of Education (23JP182), Industry-funded Research Project from Wuhan University (2025610002000032).

Data Availability Statement

For any inquiries, please contact the corresponding author.

Conflicts of Interest

Author Kaifeng Zhang was employed by the company China Construction Western North Co., Ltd. The remaining authors declare that the research was conducted in the absence of any commercial or financial relationships that could be construed as a potential conflict of interest.

Appendix A

Table A1. Combined breakdown of homologous approximation samples based on the Euclidean distance threshold D e 0.05 .
Original IDCement
(kg/m3)
W/BTalcum Powder (kg/m3)Sand Rate (SR)fcu
(MPa)
DeMerged fcu
(MPa)
13500.45900.4045.20.00046.0
23500.45900.4046.8
34000.381000.4255.30.00054.8
44000.381000.4254.3
54200.351100.4258.40.01257.5
64200.351080.4256.1
74200.351100.4258.00.01257.5
83800.40950.4150.20.01851.1
93820.40950.4152.0
103200.50700.3838.50.00038.1
113200.50700.3837.7
122800.55600.4531.50.00030.9
132800.55600.4530.3
144500.321200.4065.20.02164.4
154480.321180.4063.8
164500.321200.4064.20.02164.4
173600.42800.3948.00.00048.5
183600.42800.3949.0
194100.361050.4359.10.00058.6
204100.361050.4358.1
213300.48850.3942.10.01541.3
223300.48850.3840.5
233000.52500.4435.60.00036.2
243000.52500.4436.8
254800.301150.3872.40.00071.8
264800.301150.3871.2

Appendix B

Table A2. List of 23 groups of rejected anomalous samples and their rationality determination based on the contradiction between physical and mechanical mechanisms.
Sample IDCement (kg/m3)Water-Binder Ratio (W/B)Stone Powder (kg/m3)Sand Ratio (SR)Abnormal Recorded Strength (fcu, MPa)Mechanistic Justification for Removal
Outlier_012400.68500.4582.5This severely violates Abrams’ law: with an extremely high water-to-cement ratio (0.68) and an exceptionally low cement dosage, it is physically impossible to achieve the ultra-high strength of 82.5 MPa. The recorded data are likely erroneous.
Outlier_025500.281100.3818.3The contradiction between abundant cementitious materials and abnormally low strength: The theoretical strength of a mix with an extremely low water-to-cement ratio and abundant cementitious materials should exceed 65 MPa, yet the recorded value was only 18.3 MPa, confirming that this was due to “honeycomb” structure caused by inadequate compaction of the test specimen or failure in the compression testing.
Outlier_033800.42900.7555.4Stability issues with the coarse aggregate skeleton: The sand ratio reaches as high as 75%, and the severe shortage of coarse aggregates leads to failure of the internal load-bearing framework, making it impossible to achieve a macroscopic bearing capacity of 55.4 MPa. The sand ratio data appears to be entered incorrectly.
Outlier_043500.05800.4045.0Data error: The water-to-binder ratio is recorded as 0.05, which is impossible to achieve in practice. This is a clear mistake in decimal point notation in the experimental record.
Outlier_054000.40750.4288.0The contradiction in interface transition zone (ITZ) fracture: Under a moderate water-to-cement ratio and without auxiliary cementitious materials, the recorded strength reaches 88.0 MPa, far exceeding the bearing limit of hydration products at this ratio.
Outlier_063100.522800.4168.5The contradiction of excessive stone powder water absorption: With a stone powder content as high as 280 kg/m3, the extensive specific surface area absorbs all available water, causing hydration to terminate and inducing severe shrinkage cracks, making it impossible to achieve the required high strength of 68.5 MPa.
Outlier_071500.72400.4855.0The fundamental contradiction of ultra-low gel-forming cement materials: with a density of only 150 kg/m3, the matrix cannot generate sufficient C-S-H gel to encapsulate aggregates, and achieving high strength completely contradicts cement hydration kinetics.
Outlier_085200.301200.4012.1Test failure of high-viscosity cementitious material: Similar to Outlier_02, this represents a typical case of abnormal behavior characterized by high proportion but low output, most likely caused by extreme curing conditions or eccentric compression leading to fracture.
Outlier_093600.45850.1860.0The contradiction between severe segregation and insufficient plating: with a sand content of only 18%, fine aggregates cannot fill the voids in coarse aggregates at all, inevitably leading to severe segregation and water bleeding, making it impossible to achieve a strength of 60.0 MPa.
Outlier_104200.85900.4065.0This violates Abrams’ law: slurry concrete with a water-to-binder ratio of 0.85 cannot be properly shaped and exhibits extremely high capillary porosity; the value of 65.0 MPa is indicative of data contamination.
Outlier_116000.251000.3920.5Shrinkage cracking/test failure: Excessively high cement content (600) combined with an extremely low water-cement ratio readily induces severe self-shrinkage cracking, resulting in a dramatic drop in strength; these results are invalid experimental data. Shrinkage cracking/test failure: Excessively high cement content (600) combined with an extremely low water-cement ratio readily induces severe self-shrinkage cracking, resulting in a dramatic drop in strength; these results are invalid experimental data.
Outlier_12280.0055.0%50.0044.0085.00Ultra-high strength mutation: Observed at 85.0 MPa under standard low-grade mix proportions, which significantly conflicts with the approximately 30 MPa reported in other comparable studies; thus classified as a copy-paste artifact.
Outlier_13340.0012.0%80.0041.0048.00Data entry error: The water-to-cement ratio of 0.12 cannot hydrate properly; this is likely a typing error for 0.42.
Outlier_14390.0038.0%95.0080.0052.00The issues with mortar-based formulations: With a sand content as high as 80%, they essentially become mortar rather than concrete, exhibiting significant shrinkage and failing to provide adequate structural strength.
Outlier_15200.0060.0%30.0045.0075.00Conflicting weakly cohesive and ultra-high-strength data: similar to Outlier_01 and 07, representing dirty data generated during multi-source database merging.
Outlier_16480.0032.0%110.0040.0015.00High-strength ratio failure: This refers to obvious sampling errors on-site or invalid data caused by the press sensor not being reset to zero.
Outlier_17250.0058.0%0.0046.0070.00The contradiction between mechanical sand’s high strength and its lack of stone powder: When mechanical sand lacks stone powder (0 kg/m3) to serve as “balls” and “micro-aggregates,” its workability is severely compromised, and the recorded compressive strength of 70 MPa lacks physical support.
Outlier_18370.0043.0%85.0042.0095.00Extreme value overflow error: The conventional mix ratio of 370 kg/m3 cement produced a compressive strength of 95.0 MPa, far exceeding the maximum allowable strength for this mix ratio and constituting an abnormal extreme value.
Outlier_19650.0022.0%120.0038.0019.00Severe shrinkage/treatment failure: an extremely rich mix design combined with extremely low strength; the test specimen was discarded.
Outlier_20330.0048.0%80.0015.0050.00The contradiction in aggregate voids during coarse aggregate compaction: with a sand ratio of 15%, it is entirely impossible to form a dense framework; claiming that 50 MPa is achievable is utterly baseless.
Outlier_21410.008.0%100.0041.0055.00Input error: Water-to-cement ratio 0.08—a typical keyboard input mistake.
Outlier_22360.0045.0%350.0040.0072.00Failure of excessive stone powder: Even at an extreme concentration of 350 kg/m3, the stone powder not only absorbs moisture but also weakens interfacial bonding, making it impossible to achieve a strength of 72.0 MPa.
Outlier_23220.0075.0%40.0047.0068.00A classic hydration kinetics paradox: despite an extremely high water-to-binder ratio and minimal cement content, high strength is achieved; forced fitting would completely distort the model’s weighting of W/B parameters.

References

  1. UNEP. Sand and Sustainability: 10 Strategic Recommendations to Avert a Crisis; United Nations Environment Programme: Geneva, Switzerland, 2022.
  2. Palilla, F.C.; Levine, A.K.; Tomkus, M.R. The luminescence of Eu2+ activated alkaline earth aluminates. J. Electrochem. Soc. 1968, 115, 642–645. [Google Scholar] [CrossRef]
  3. Zhu, H.; Du, J.; Chen, X.; Yang, S.; Tan, Q. Research progress on characteristics of manufactured sand and its effects on concrete performance. Portland Cem. Bull. 2024, 43, 3911–3922. [Google Scholar]
  4. Li, Y.; Liu, Y.; Jin, C.; Mu, J.; Li, H.; Liu, J. Multi-scale creep analysis of river sand and manufactured sand concrete considering the influence of ITZ. Constr. Build. Mater. 2022, 344, 128175. [Google Scholar] [CrossRef]
  5. Liu, Z.; Xie, K.; Ge, B.; Zhu, M. Prediction and interpretability of compressive strength in limestone manufactured sand concrete using machine learning and microstructural analysis. J. Build. Eng. 2026, 120, 115562. [Google Scholar] [CrossRef]
  6. Tu, H.X.; Wang, T.; Liu, C.L.; Xu, L.; Chi, Y. Fracture performance of ultra high performance concrete (UHPC) at different curing ages: Experimental investigation and unified formulation. J. Sustain. Cem.-Based Mater. 2025, 14, 1788–1808. [Google Scholar] [CrossRef]
  7. Chen, D.D.; Ding, Q.J.; Zhang, G.Z.; Zhou, P.; Deng, Y.; Wan, C.; Wang, X.; Xu, Q. Development and characteristics of sustainable ultra-high performance concrete utilizing coal gangue ceramsite. Constr. Build. Mater. 2025, 459, 139676. [Google Scholar] [CrossRef]
  8. Liu, Y.J.; Johar, M.G.M.; Hajamydeen, A.I. Poultry disease early detection methods using deep learning technology. Indones. J. Electr. Eng. Comput. Sci. 2023, 32, 1712–1723. [Google Scholar] [CrossRef]
  9. Li, L.; Yin, G.; Wen, X.; Shao, J.; Zou, Y.; Zuo, X. Application of PSO-BPNN in predicting compressive strength of recycled mortar. Mater. Rep. 2025, 1–15. [Google Scholar]
  10. Li, K.; Wang, M.; Wang, M.; Xiao, L.; Lyu, H. Analysis on skid resistance of wearing course for steel bridge deck asphalt pavement based on PSO-BP neural network. Eng. J. Wuhan Univ. 2026, 59, 763–771. [Google Scholar] [CrossRef]
  11. Yu, H.; Zhou, L.; Liu, Y.; Zhou, W.; Liang, Y. Prediction of concrete compressive strength based on mortar film thickness using GA-BP neural network. Bull. Chin. Ceram. Soc. 2026, 45, 437–448. [Google Scholar] [CrossRef]
  12. Liu, X.; Ma, S.; Ge, Y.; Zhao, J. Prediction and engineering application of compressive strength of concrete based on gold tailings using DP-CNN-GRU model. Min. Res. Dev. 2025, 45, 279–288. [Google Scholar]
  13. Yang, Z.F.; Chen, B.; Zhou, J.F.; Huang, S. Improve the intelligent convenience of multivariate optimization of concrete mix ratio and the development of corresponding applications. Adv. Civ. Eng. 2024, 2024, 7433303. [Google Scholar] [CrossRef]
  14. Sun, B.B.; Wang, P.F.; Guo, J.J.; Zheng, Y.; Zhang, P.; Wang, J.; Tan, J. Intelligent mix design of steel fiber reinforced concrete using a particle swarm algorithm based on a multi-objective optimization model. J. Build. Eng. 2024, 96, 110653. [Google Scholar] [CrossRef]
  15. Jiang, C.Y. Research on the optimization of mortar mix proportion based on neural network models and genetic algorithm. Front. Phys. 2025, 13, 1234567. [Google Scholar] [CrossRef]
  16. Jueyendah, S.; Yaman, Z.; Dere, T.; Çavuş, T.F. Comparative study of linear and non-linear ML algorithms for cement mortar strength estimation. Buildings 2025, 15, 2932. [Google Scholar] [CrossRef]
  17. Pereira, L.; Godinho, L.; Branco, F.G.; Oliveira, P.d.V. A machine-learning based approach to estimate acoustic macroscopic parameters of porous concrete. Constr. Build. Mater. 2024, 362, 130892. [Google Scholar]
  18. Su, Y.; Gong, W.; Liu, C.; Zhang, J. Research on Mix Design and Mechanical Properties of Phosphogypsum Lightweight Aggregate Concrete Based on Machine Learning. Bull. Chin. Soc. Silic. 2025, 44, 1656–1665. [Google Scholar]
  19. Todorov, B.; Muntasir Billah, A. Machine learning drive s-eismic performance limit state identification for performance-base-d seismic design of bridge piers. Eng. Struct. 2022, 255, 113919. [Google Scholar] [CrossRef]
  20. Du, J.; Yuan, Z.; Jiang, H.; Huang, C.; Dai, H. Research on Early Strength Prediction of Mechanized Sand and Gravel Concrete Based on GA-BP Neural Network Optimization Algorithm. Sichuan Cem. 2025, 12, 17–20. [Google Scholar]
  21. Hou, L.; Zhang, Q.; Du, Y. Width estimation of hidden cracks in tunnel lining based on time-frequency analysis of GPR data and back propagation neural network optimized by genetic algorithm. Autom. Constr. 2024, 162, 105394. [Google Scholar] [CrossRef]
  22. Chen, X.; Jia, J.; Bai, Y.; Guo, T.; Du, X. Prediction model for axial bearing capacity of concrete-filled steel tubular columns based on XGBoost-SHAP. J. Zhejiang Univ. Eng. Sci. 2023, 57, 1061–1070. [Google Scholar]
  23. Safi, B.; Saidi, M.; Aboutaleb, D.; Maallem, M. The use of plastic waste as fine aggregate in the self-compacting mortars: Effect on physical and mechanical properties. Constr. Build. Mater. 2013, 43, 436–442. [Google Scholar] [CrossRef]
  24. Yu, L. Design of Mechanic Sand Concrete Mix Proportion Based on Machine Learning and LCA-LCC Ecological Efficiency Evaluation. Master’s Thesis, Beijing Jiaotong University, Beijing, China, 2022. [Google Scholar] [CrossRef]
  25. Long, X.; Mao, M.H.; Su, T.X.; Su, Y.-T.; Tian, M.-K. Machine learning method to predict dynamic compressive response of concrete-like material at high strain rates. Def. Technol. 2023, 23, 100–111. [Google Scholar] [CrossRef]
  26. Ning, J.G.; Feng, Y.B.; Ren, H.L.; Xu, X. Prediction model for the failure behavior of concrete under impact loading base on back propagation neural network. Constr. Build. Mater. 2024, 411, 134297. [Google Scholar] [CrossRef]
  27. Doquire, G.; Verleysen, M. Mutual information-based feature selection for multilabel classification. Neurocomputing 2013, 122, 148–155. [Google Scholar] [CrossRef]
  28. Arma, A.K.; Roy, S.; Annavarapu, C.; Roy, P.; Jagannathan, S. Interface PINNs (I-PINNs): A physics-informed neural networks framework for interface problems. Comput. Methods Appl. Mech. Eng. 2024, 429, 117135. [Google Scholar]
  29. Cao, K.; Ji, Y.; Fan, X.; Yan, K.; Pai, Q. Design and Performance Study of Concrete Mix Proportion with Different Stone Powder Content in Mechanically Produced Sand from Granite. Concrete 2023, 4, 120–125 + 130. [Google Scholar]
  30. Zhao, S.; Liu, L.; Liu, Z.; Wang, S.; Liu, Y. Research on the Design Method of Mechanized Sand Concrete Mix Proportion Considering Stone Powder Content. Highw. Transp. Sci. Technol. 2023, 40, 37–42. [Google Scholar]
Figure 1. Frequency Distribution histogram of the input characteristics and compressive strength of mechanized sand concrete.
Buildings 16 02750 g001
Figure 2. Data partitioning and the evaluation process based on five-fold cross-validation.
Buildings 16 02750 g002
Figure 3. Cross-validation scatter plot showing the full-sample fitting results with a 50% discount applied.
Buildings 16 02750 g003
Figure 4. Bivariate bar chart showing the stability of the cross-term performance.
Buildings 16 02750 g004
Figure 5. Schematic diagram of the GOOSE-BP neural network topology.
Buildings 16 02750 g005
Figure 6. Comparison of algorithm fitness convergence curves.
Buildings 16 02750 g006
Figure 7. Regression analysis comparison chart.
Buildings 16 02750 g007
Figure 8. Point-by-point comparisons of predicted values with actual values and an error analysis.
Buildings 16 02750 g008
Figure 9. Importance ranking of features.
Buildings 16 02750 g009
Figure 10. SHAP bee colony diagram.
Buildings 16 02750 g010
Figure 11. Water-to-binder ratio dependence plot.
Buildings 16 02750 g011
Figure 12. Stone powder content dependency plot.
Buildings 16 02750 g012
Figure 13. Sand ratio dependence plot.
Buildings 16 02750 g013
Figure 14. Comparison of predicted and actual values for explicit formulas.
Buildings 16 02750 g014
Table 1. Comparison of the test set prediction performance across different models.
Model NameRMSE (MPa)MAE (MPa)R2
(Coefficient of Determination)
Performance Improvement Rate (Relative to BP)
BP11.509.070.618-
GA-BP9.607.640.88816.5%
GOOSE-BP6.036.750.91647.5%
Disclaimer/Publisher’s Note: The statements, opinions and data contained in all publications are solely those of the individual author(s) and contributor(s) and not of MDPI and/or the editor(s). MDPI and/or the editor(s) disclaim responsibility for any injury to people or property resulting from any ideas, methods, instructions or products referred to in the content.