1. Introduction
Engineered mass-timber buildings are increasingly considered for seismic regions because cross-laminated timber (CLT), glulam, and related engineered wood products combine low self-weight, prefabrication, and favorable strength-to-weight characteristics with the need for explicit seismic detailing. Current research emphasizes not only strength but also residual drift control, repairability, and post-earthquake functional recovery [
1,
2,
3,
4].
Full-scale and component-level CLT tests have shown that wall-panel layout, connection slip, diaphragm compatibility, and boundary restraint can govern seismic response as strongly as material strength. Prior shake-table and cyclic experiments on CLT buildings and wall systems provide the experimental foundation for interpreting system-level behavior in later rocking-wall tests [
5,
6,
7,
8].
Low-damage timber concepts evolved from post-tensioned and prestressed timber systems in which unbonded tendons provide recentering, and supplemental devices provide energy dissipation. These concepts have been implemented in multi-story timber systems and validated through connection-, wall-, and building-scale experiments [
9,
10,
11,
12].
Post-tensioned CLT rocking walls are a direct extension of this low-damage philosophy. Experimental and analytical studies have clarified the roles of wall uplift, tendon elongation, U-shaped flexural plates, interface contact, flexible-foundation effects, and reduced-order modeling in the lateral response of self-centering CLT walls [
13,
14,
15,
16].
The NHERI TallWood two-story shake-table program is therefore a key benchmark because it combines a full-scale mass-timber gravity frame, CLT diaphragms, post-tensioned rocking walls, U-shaped flexural plates, and dense instrumentation under repeated earthquake excitations. The associated publication, public datasets, and construction report provide traceable evidence for the specimen geometry, instrumentation, loading sequence, and observed response [
17,
18,
19,
20].
Interpreting such a dataset requires structural-dynamics descriptors rather than isolated peak measurements. Equations of motion, base-excitation theory, numerical time integration, and rocking-body mechanics provide the basis for connecting measured acceleration, displacement, stiffness, and recentering behavior to physical mechanisms [
21,
22,
23,
24].
Frequency-domain identification is particularly useful for sequential shake-table data because transfer functions, power spectra, coherence, and output-only modal estimates can identify changes in effective modal state after each excitation. These tools help distinguish measurement artifacts from physically meaningful changes in stiffness and damping [
25,
26,
27,
28].
Intensity and damping measures are also needed because different ground motions can impose similar peak acceleration but very different cumulative demand. Operational modal identification, half-power damping, Arias intensity, and significant duration provide complementary evidence for mechanism evolution [
29,
30,
31,
32].
Vibration-based monitoring and structural health monitoring literature further show that shifts in identified modal properties must be interpreted together with environmental, operational, and boundary-condition effects. For rocking timber systems, this caution is important because modal softening can arise from reversible contact opening, connection seating, or interface slip rather than from conventional distributed material damage [
33,
34,
35].
Experimental protocols and benchmark wood-structure simulations provide additional context for interpreting cyclic deterioration, pinching, drift demand, and uncertainty in timber seismic tests. These references support the use of repeatable response descriptors and transparent processing assumptions when reanalyzing public shake-table records [
36,
37,
38].
Performance-based seismic assessment ultimately requires a mechanism-oriented interpretation of response rather than a single drift, acceleration, or frequency metric. FEMA performance assessment and seismic performance factor frameworks motivate the combined use of intensity, modal-state, residual-deformation, and repairability-related descriptors for low-damage mass-timber systems [
39,
40].
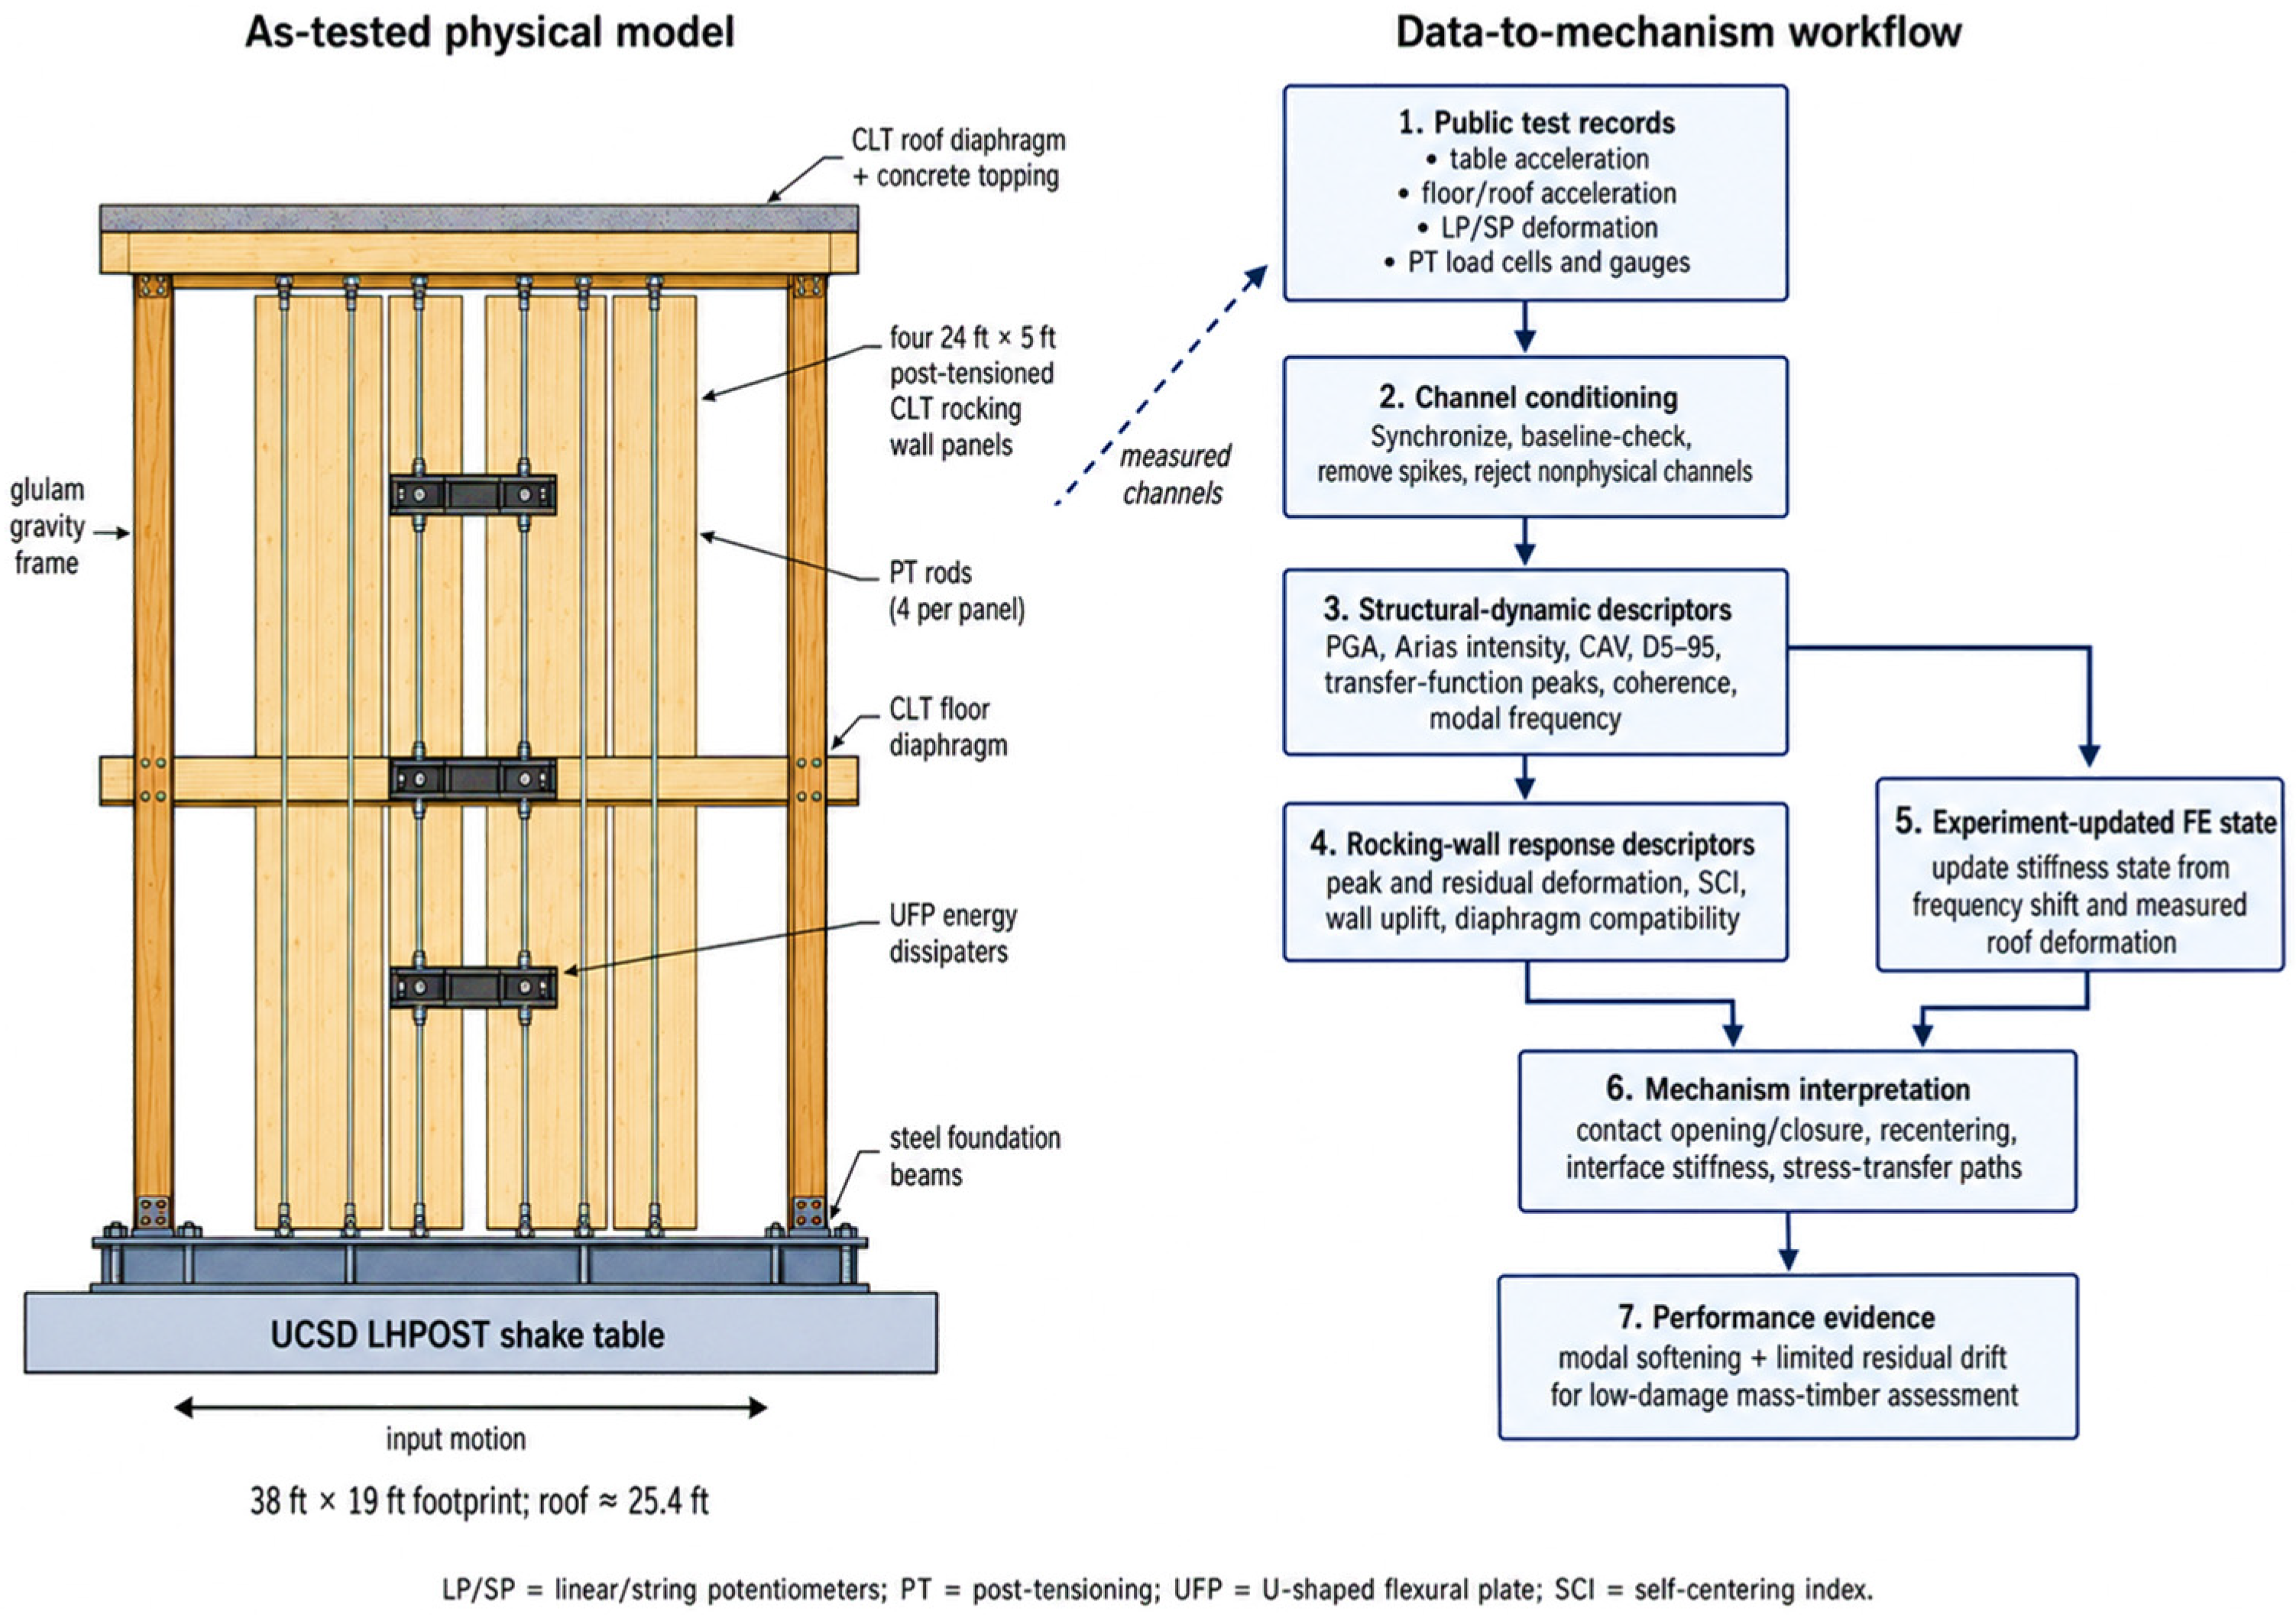
Accordingly, the tested building is treated as a sequence of evolving dynamic states, as shown in
Figure 1. Each earthquake modifies the effective contact stiffness, diaphragm compatibility, frictional condition, and residual configuration. The workflow combines input intensity, roof-to-table transfer functions, coherence, modal frequency, equivalent damping, residual-to-peak deformation, self-centering index, and deformation-weighted inertial demand, followed by experiment-updated finite-element visualization. The goal is a reproducible mechanism-oriented interpretation of modal softening and self-centering in a full-scale mass-timber rocking-wall building.
The research gap addressed here is the absence of a unified, sequence-based interpretation of the public NHERI TallWood rocking-wall records that combines input severity, modal-state evolution, recentering, residual response, and visualization of updated deformation states in one reproducible workflow.
The novelty is therefore not the individual use of PGA, Arias intensity, CAV, transfer functions, coherence, damping, or residual deformation, which are established quantities. Instead, the contribution is their combined use as a physics-informed descriptor vector for distinguishing evolving rocking-wall states, identifying modal softening with coherence control, mapping resilience phases, and linking the open experimental record to experiment-constrained finite-element state visualization.
2. Experimental Data and Signal Processing
The public NHERI TallWood two-story mass-timber rocking-wall dataset archived in DesignSafe-CI was used as the experimental basis of this study. The tested specimen consisted of mass-timber gravity framing, CLT floor and roof diaphragms, and a post-tensioned CLT rocking-wall lateral system. Fourteen sequential earthquake excitations were considered, covering service-level, design-basis, repeated design-basis-times-two, maximum-considered, and 1.2MCE input motions. As illustrated in
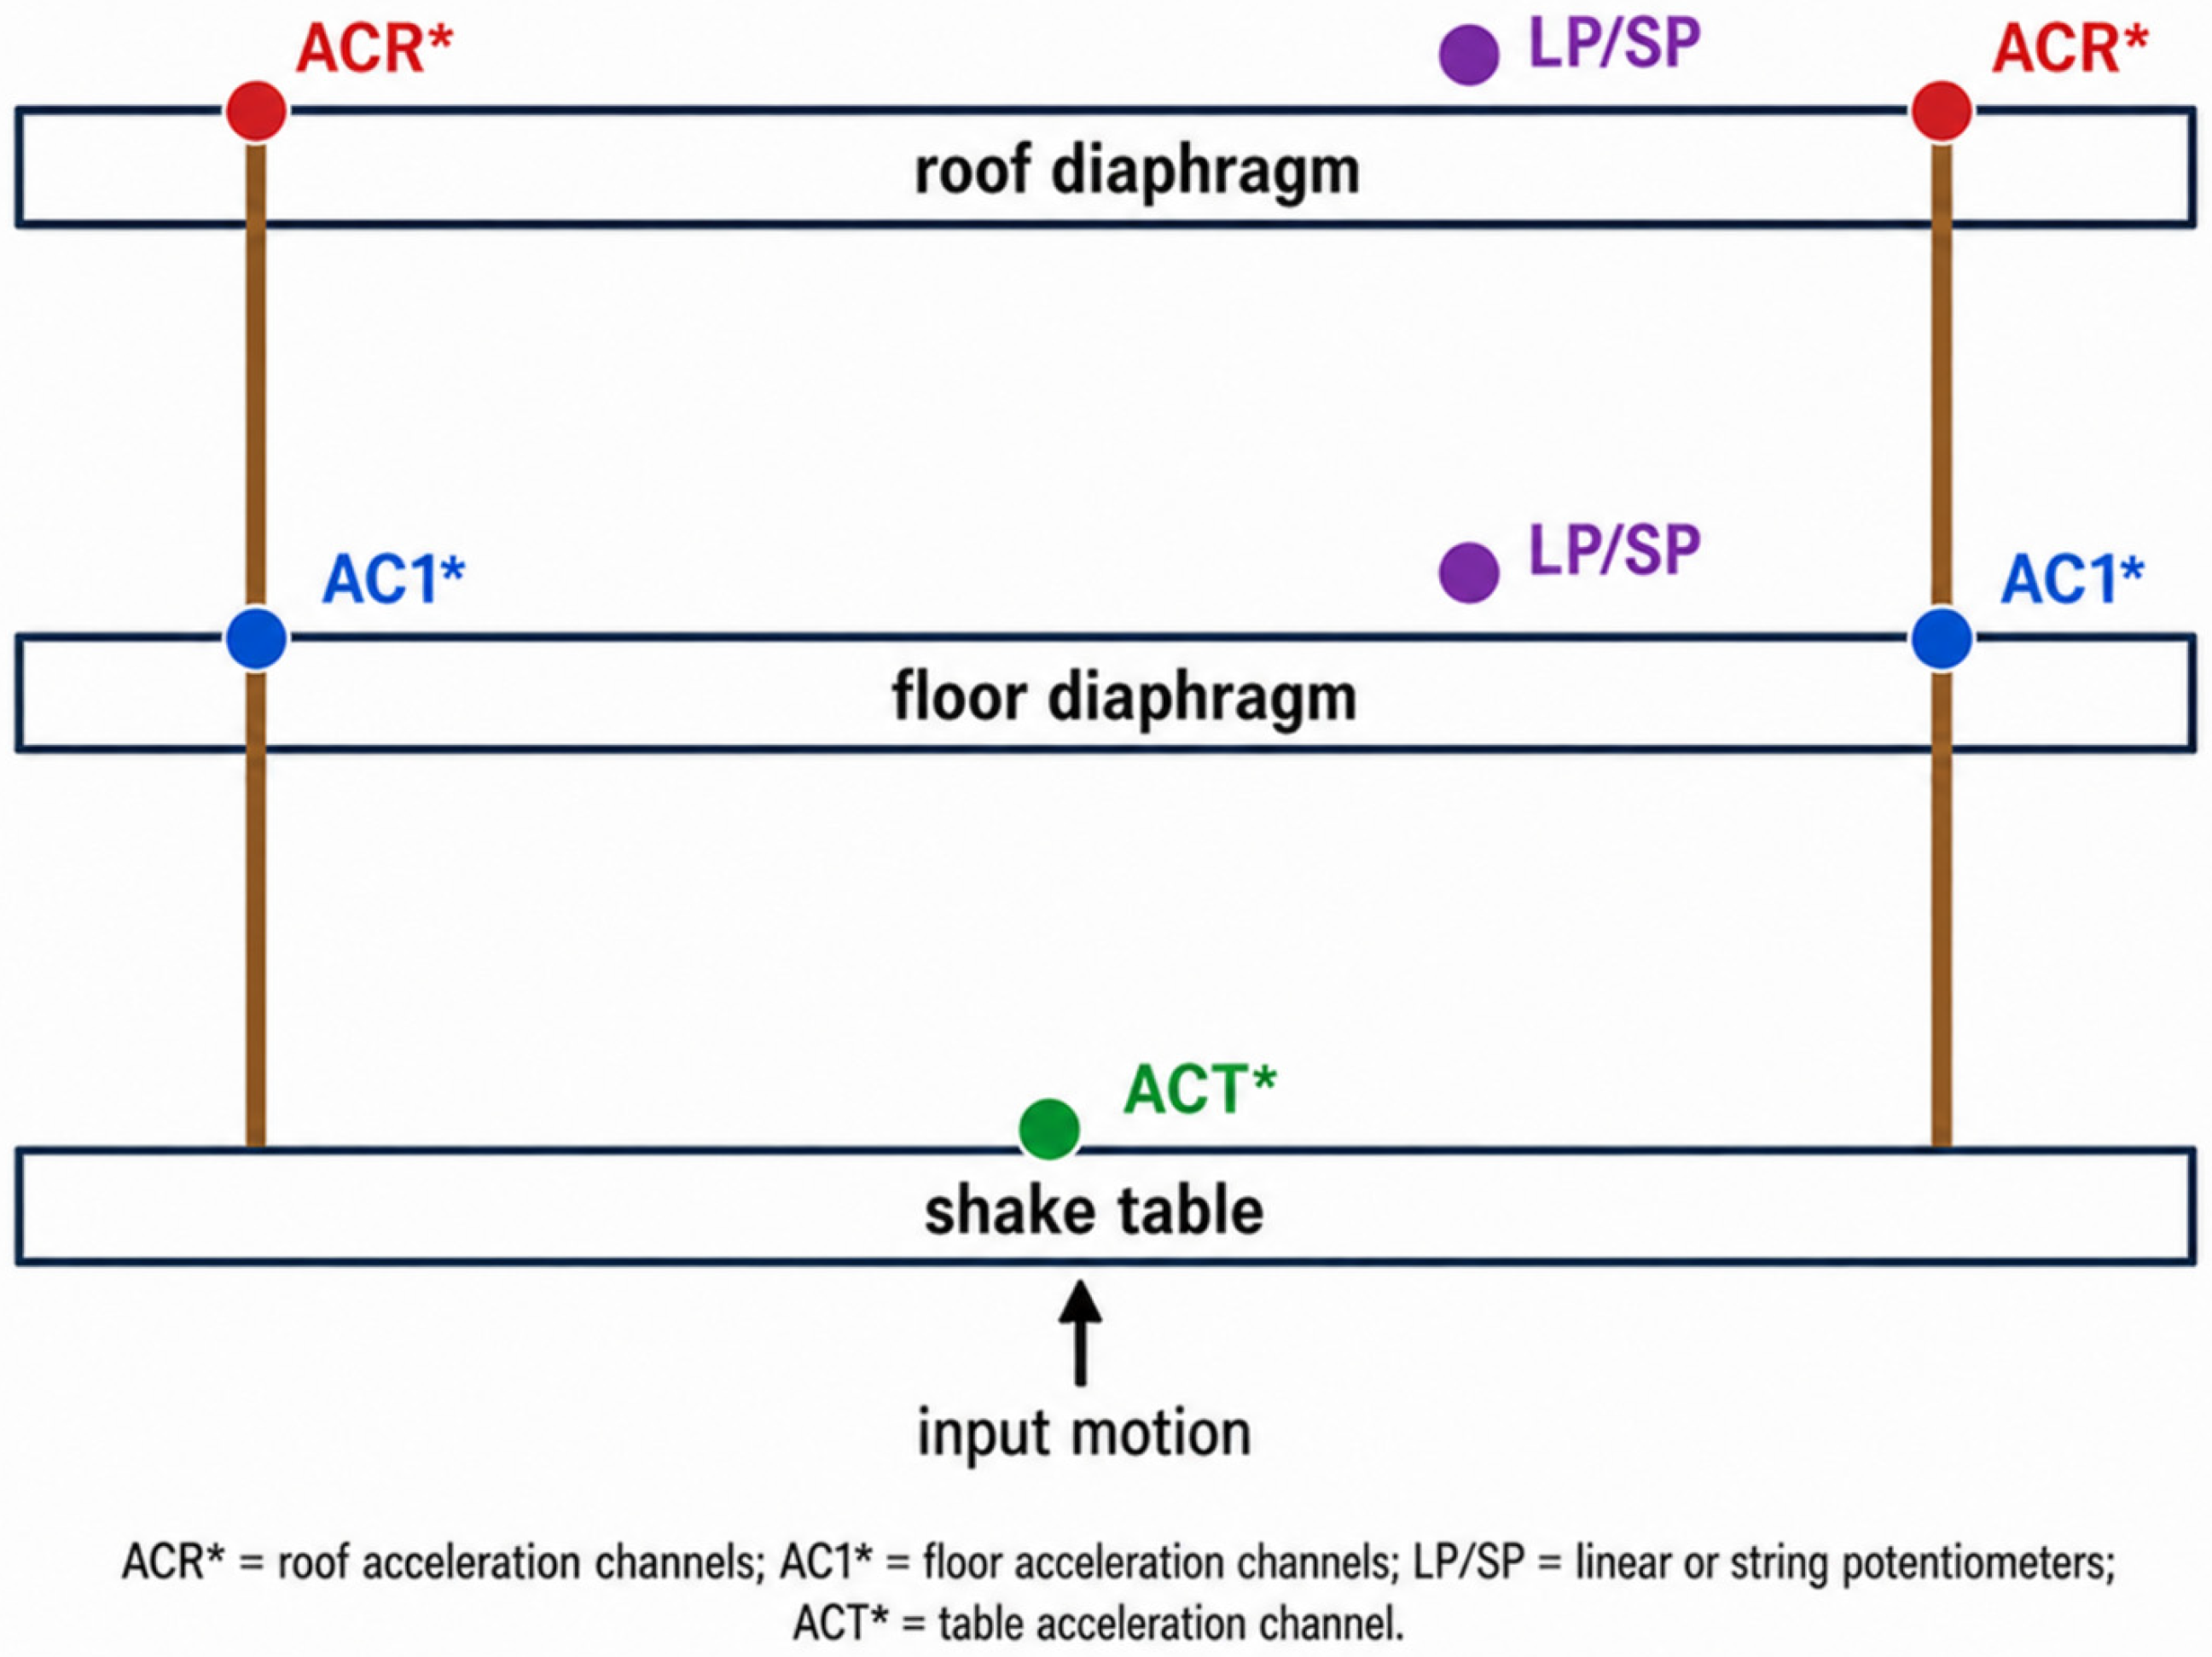
Figure 2, the data-processing workflow starts from the as-tested physical model and its measured channel families, including table acceleration, floor and roof acceleration, LP/SP deformation records, and PT load-cell or gauge measurements. The figure also clarifies how these records are converted through channel conditioning, structural-dynamic descriptor extraction, rocking-wall response descriptor extraction, experiment-updated FE state representation, and final mechanism interpretation. Therefore,
Figure 3 acts as both a processing roadmap and a mechanical link between the measured shake-table responses and the later interpretation of contact opening, recentering, interface stiffness change, and stress-transfer paths.
The raw time-history channels were first parsed from the original headers and then screened to obtain a consistent event-by-event dataset. Table acceleration channels, roof and floor accelerometer channels, and selected linear or string potentiometer deformation channels were retained for the main analysis. Nonphysical acceleration spikes were removed using percentile-based filtering, while deformation channels with unrealistic excursions were interpolated or excluded from envelope calculations. Peak values were evaluated using robust percentile operators rather than single extreme samples, which reduces the influence of isolated sensor artifacts. All acceleration histories were evaluated in gravitational units after baseline checking, and spectral quantities were calculated from the recorded table input rather than from nominal target motions. This treatment is important because table control, bidirectional component balance, and specimen–table interaction can change the effective excitation applied to the building. Transfer-function peaks were identified using consistent spectral windows, and only peaks supported by sufficient input–output coherence were accepted as physically meaningful modal evidence. Displacement descriptors were interpreted as deformation-channel evidence rather than as full-field interstory drift because the available instrumentation was spatially sparse.
For clarity, the retained quantities are separated into primary measured responses and derived descriptors. Primary quantities include recorded table accelerations, floor and roof accelerations, selected deformation-channel histories, and residual deformation. Derived descriptors include Arias intensity, CAV, significant duration, transfer-function frequency, equivalent damping, the frequency-squared stiffness-loss index, SCI, the deformation-weighted inertial-demand proxy, and the descriptor maps used for interpretation.
Table 1 summarizes the event-level descriptors extracted from the processed shake-table records. The table reports the ground motion, nominal performance level, scale factor, resultant table acceleration
, identified dominant frequency
, peak instrumented displacement, and self-centering index (SCI) for each test. The results show that nominal intensity alone does not fully represent the actual structural demand. For example,
varies from 0.099 g to 0.861 g, while the identified frequency decreases from 2.11 Hz in the initial low-level event to approximately 0.703 Hz in the final 1.2MCE event, indicating substantial sequence-dependent modal softening. Peak displacement and SCI also evolve nonmonotonically; the largest peak displacement reaches 0.925 in. in Test 5, whereas the final 1.2MCE event has a smaller peak displacement of 0.324 in. but a reduced SCI of 0.608. These trends indicate that the response cannot be explained by PGA, peak deformation, or nominal test level alone. Instead, the dataset should be interpreted as an evolving mechanical state sequence in which input intensity, modal softening, deformation demand, and recentering capacity must be evaluated together.
3. Physics-Informed Descriptor Framework
The tested rocking-wall building was interpreted as an evolving base-excited structural system rather than as a set of independent peak-response records. In relative coordinates, the low-order dynamic equilibrium can be written as:
where
and
are the mass and damping matrices,
is the relative displacement vector,
is the influence vector,
is the measured table acceleration, and
denotes the nonlinear restoring vector associated with uplift, contact opening and closure, friction, tendon elongation, diaphragm compatibility, and connection slip. The roof-to-table dynamic state was identified in the frequency domain using the
transfer function and the magnitude-squared coherence between the table input
and the roof response
:
where
,
, and
are the auto- and cross-spectral density functions. The dominant frequency
was extracted from the coherent roof-to-table transfer peak, while the equivalent damping ratio was estimated using the half-power bandwidth method:
Input demand was described using complementary intensity measures rather than a single peak acceleration value. Arias intensity, cumulative absolute velocity, and significant duration were defined as:
where
is gravitational acceleration,
is the record duration, and
and
correspond to the times at which 5% and 95% of cumulative Arias intensity are reached. To quantify modal softening, a frequency-squared stiffness-loss index was introduced as:
where
is the identified dominant frequency of the initial event, and
is the corresponding frequency of the
-th event. Self-centering performance and deformation-weighted inertial demand were then evaluated as:
where
is the selected deformation-channel response,
is the residual deformation after the
-th event,
is the roof acceleration, and
is the recorded table acceleration. The deformation-weighted inertial-demand proxy
is not intended to represent a complete energy balance. Instead, it provides a comparative descriptor for identifying events in which inertial demand and deformation-rate demand occur simultaneously.
The self-centering index is used only as a normalized residual-to-peak deformation descriptor, not as a direct constitutive or material property. Likewise, the deformation-weighted inertial-demand term is retained as a comparative proxy for simultaneous inertial and deformation demand, and is not interpreted as a complete hysteretic or input-energy quantity.
For event-level comparison, the measured response was assembled into a physical descriptor vector:
This vector combines input severity, duration effect, current dynamic stiffness, equivalent damping, deformation demand, residual response, and inertial-deformation coupling. At the wall–foundation interface, the onset of rocking can be interpreted through an overturning-balance condition:
where
is the overturning demand,
is the gravity-restoring moment,
is the post-tensioning restoring contribution, and
represents auxiliary resistance from energy-dissipation devices or connection mechanisms. This balance explains why the apparent tangent stiffness of the system changes with amplitude and loading history. The descriptor framework is therefore intentionally redundant at the measurement level but not at the mechanism level:
,
, and
describe excitation severity;
,
,
, and
describe dynamic state and modal reliability;
,
,
, and
describe stiffness evolution, deformation demand, and recentering; and
captures the timing interaction between inertial force and deformation rate. This formulation avoids reducing the response to a single scalar damage index and instead supports a mechanism-based interpretation of modal softening, residual deformation control, and low-damage rocking behavior.
This hierarchy also clarifies the intentional redundancy of the descriptor set. PGA, Arias intensity, CAV, and duration quantify different aspects of excitation severity; transfer function, coherence, frequency, and damping describe modal state and reliability; residual deformation, SCI, stiffness-loss index, and the inertial-demand proxy describe response state and recentering behavior. The descriptors are therefore partly redundant statistically but are retained because they separate different mechanical interpretations.
4. Experimental Descriptor Results
This section evaluates the sequential shake-table response using the physics-informed descriptors defined above. The purpose is not only to rank the fourteen earthquake records by nominal intensity but also to identify how input demand, modal state, acceleration amplification, deformation demand, residual response, and self-centering evolve through the loading sequence. Because rocking-wall buildings are strongly path-dependent, the test number is treated as a state-history coordinate. The following figures therefore describe the response as a progressive mechanism evolution rather than as a set of independent peak-response observations.
The result interpretation below follows a measurement hierarchy. Recorded accelerations and deformation-channel quantities are treated as primary observations, whereas modal frequency, damping, stiffness-loss index, SCI, energy proxy, descriptor correlation, descriptor map, and resilience phase map are derived indicators used to compare states and support mechanism-oriented interpretation.
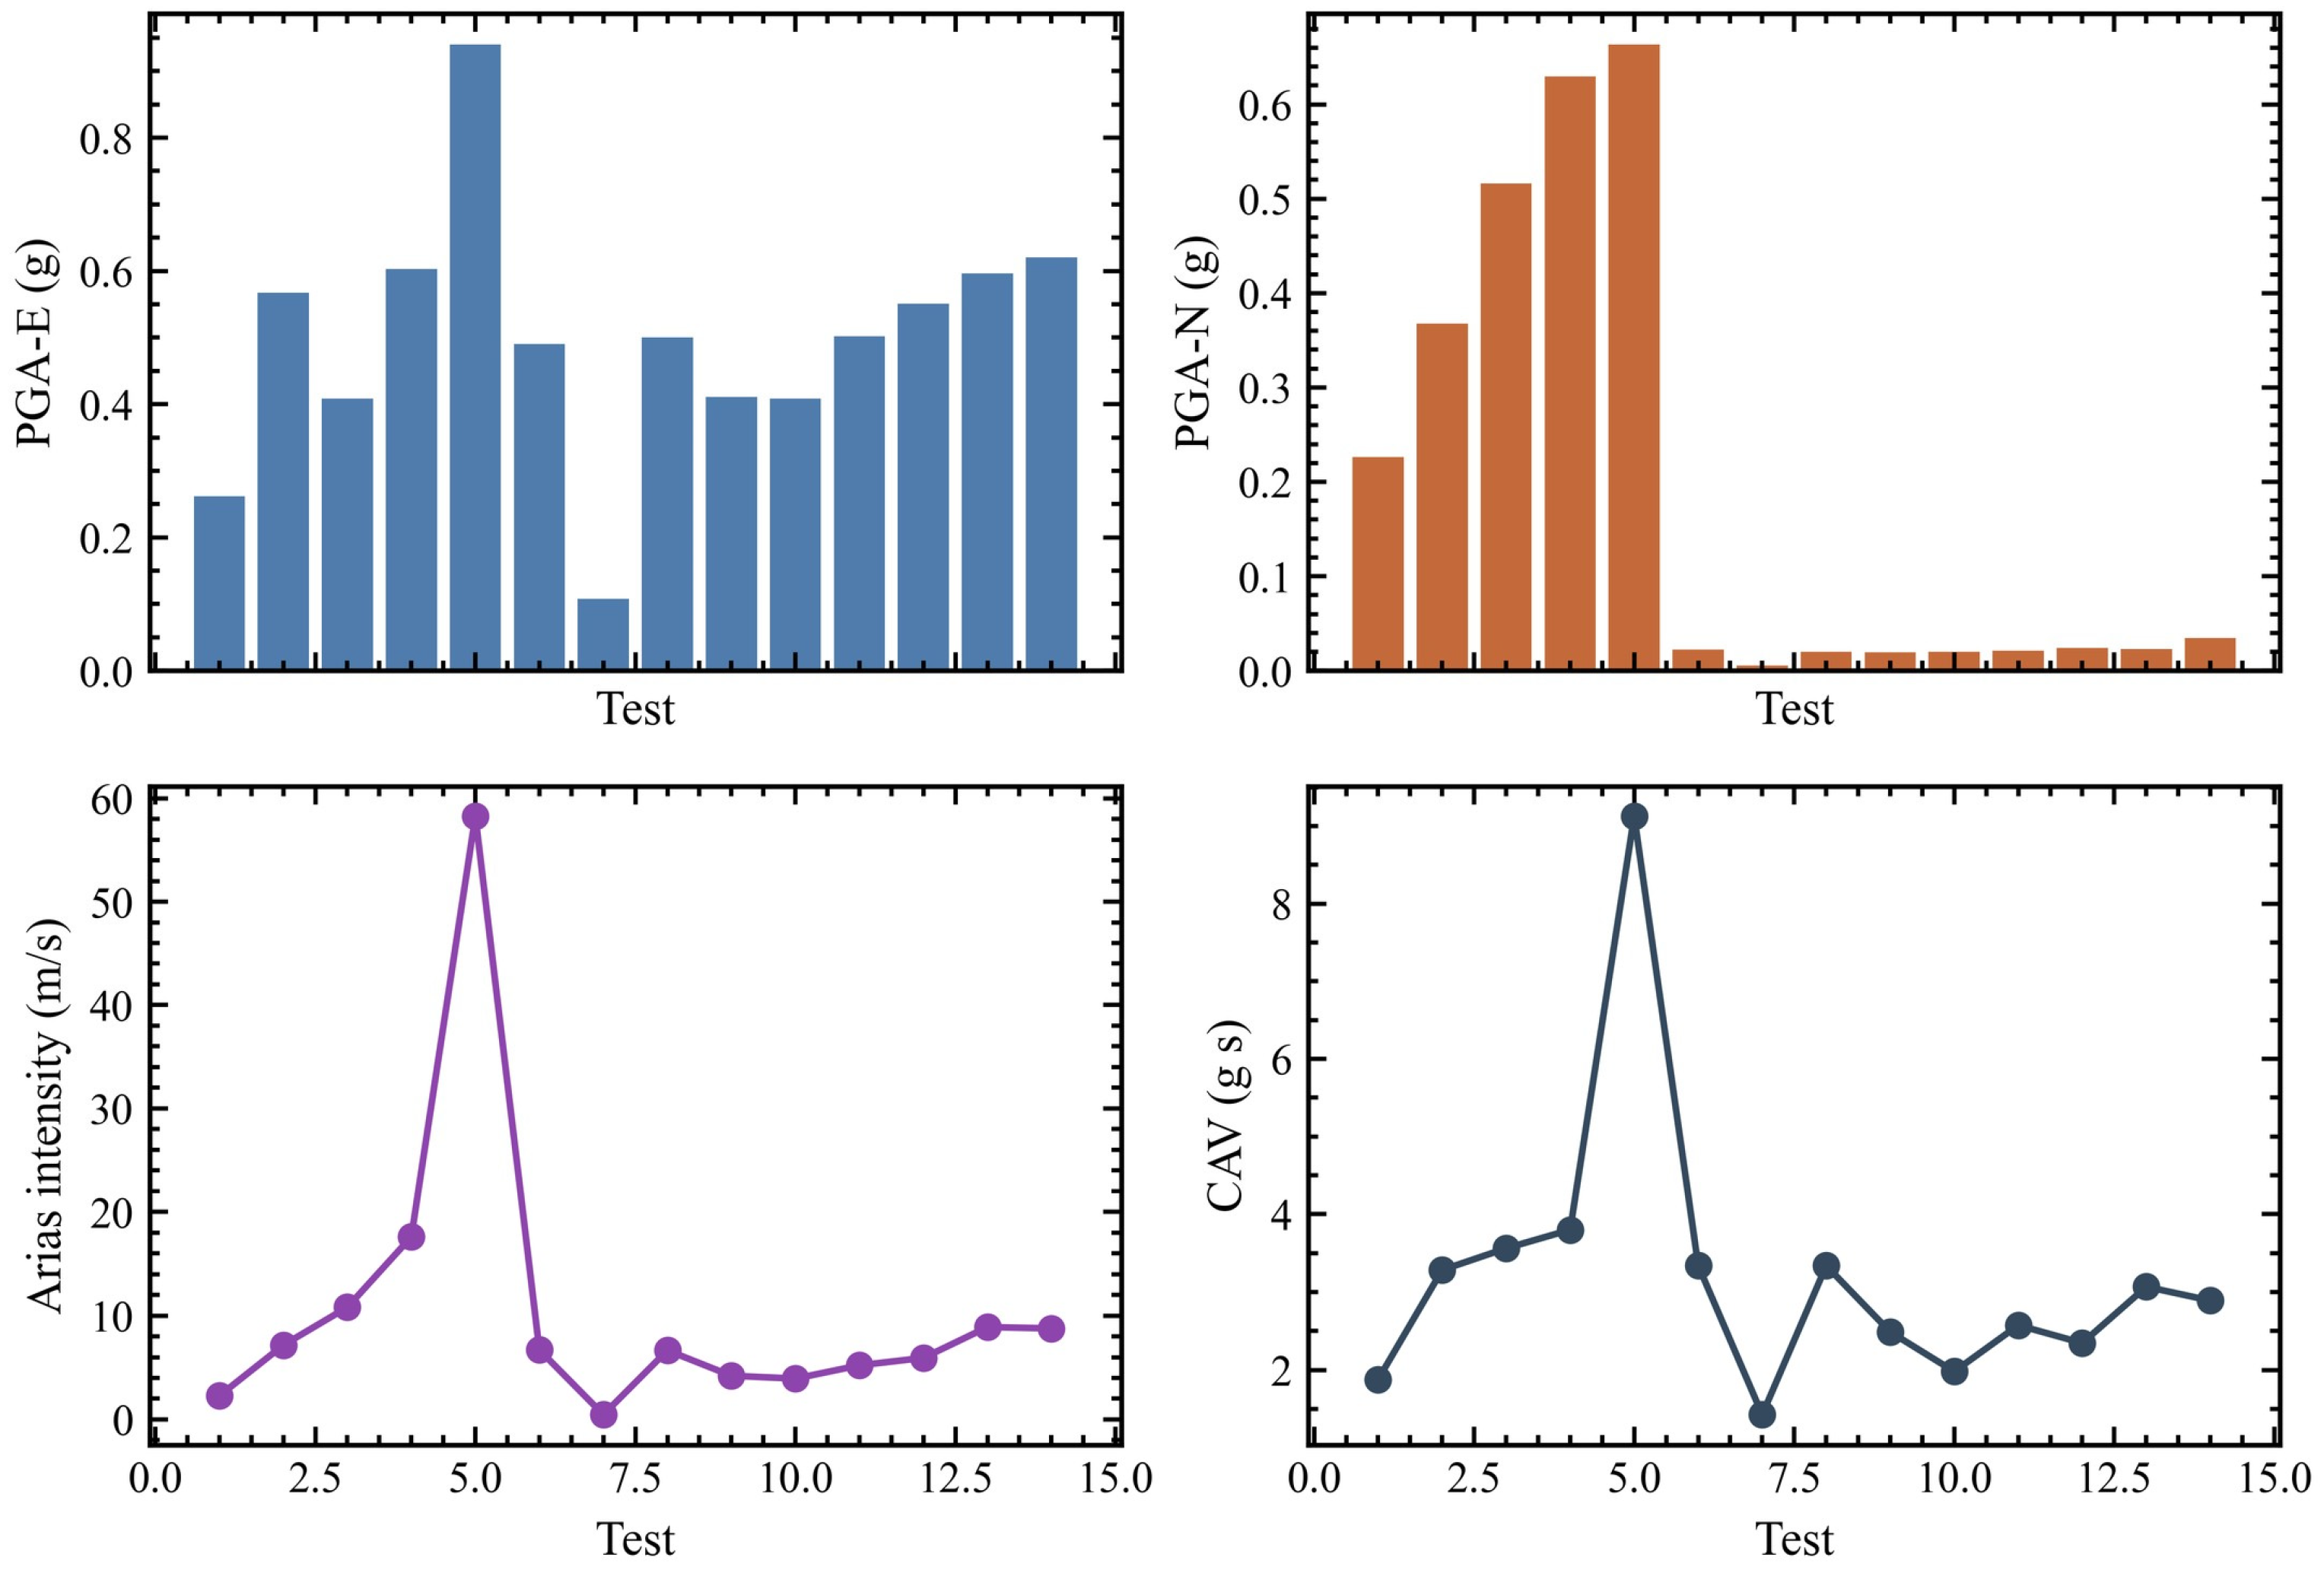
Figure 3 summarizes the input intensity descriptors calculated from the recorded table channels. The resultant table PGA varies from 0.099 g in Test 7 to 0.861 g in Test 5, showing that the nominal test scale does not uniquely determine the measured input severity. The east–west PGA reaches 0.940 g in Test 5, whereas the north–south component becomes very small in several later records, with values near 0.020 g to 0.034 g for many DBE, MCE, and 1.2MCE tests. Arias intensity and CAV provide additional information: Test 5 has the largest Arias intensity of about 58.28 m/s and the largest CAV of about 9.13 g·s, while Test 7 has a very small Arias intensity of about 0.46 m/s but a long significant duration. This indicates that PGA, Arias intensity, CAV, and duration describe different demand aspects and should not be collapsed into a single intensity measure.
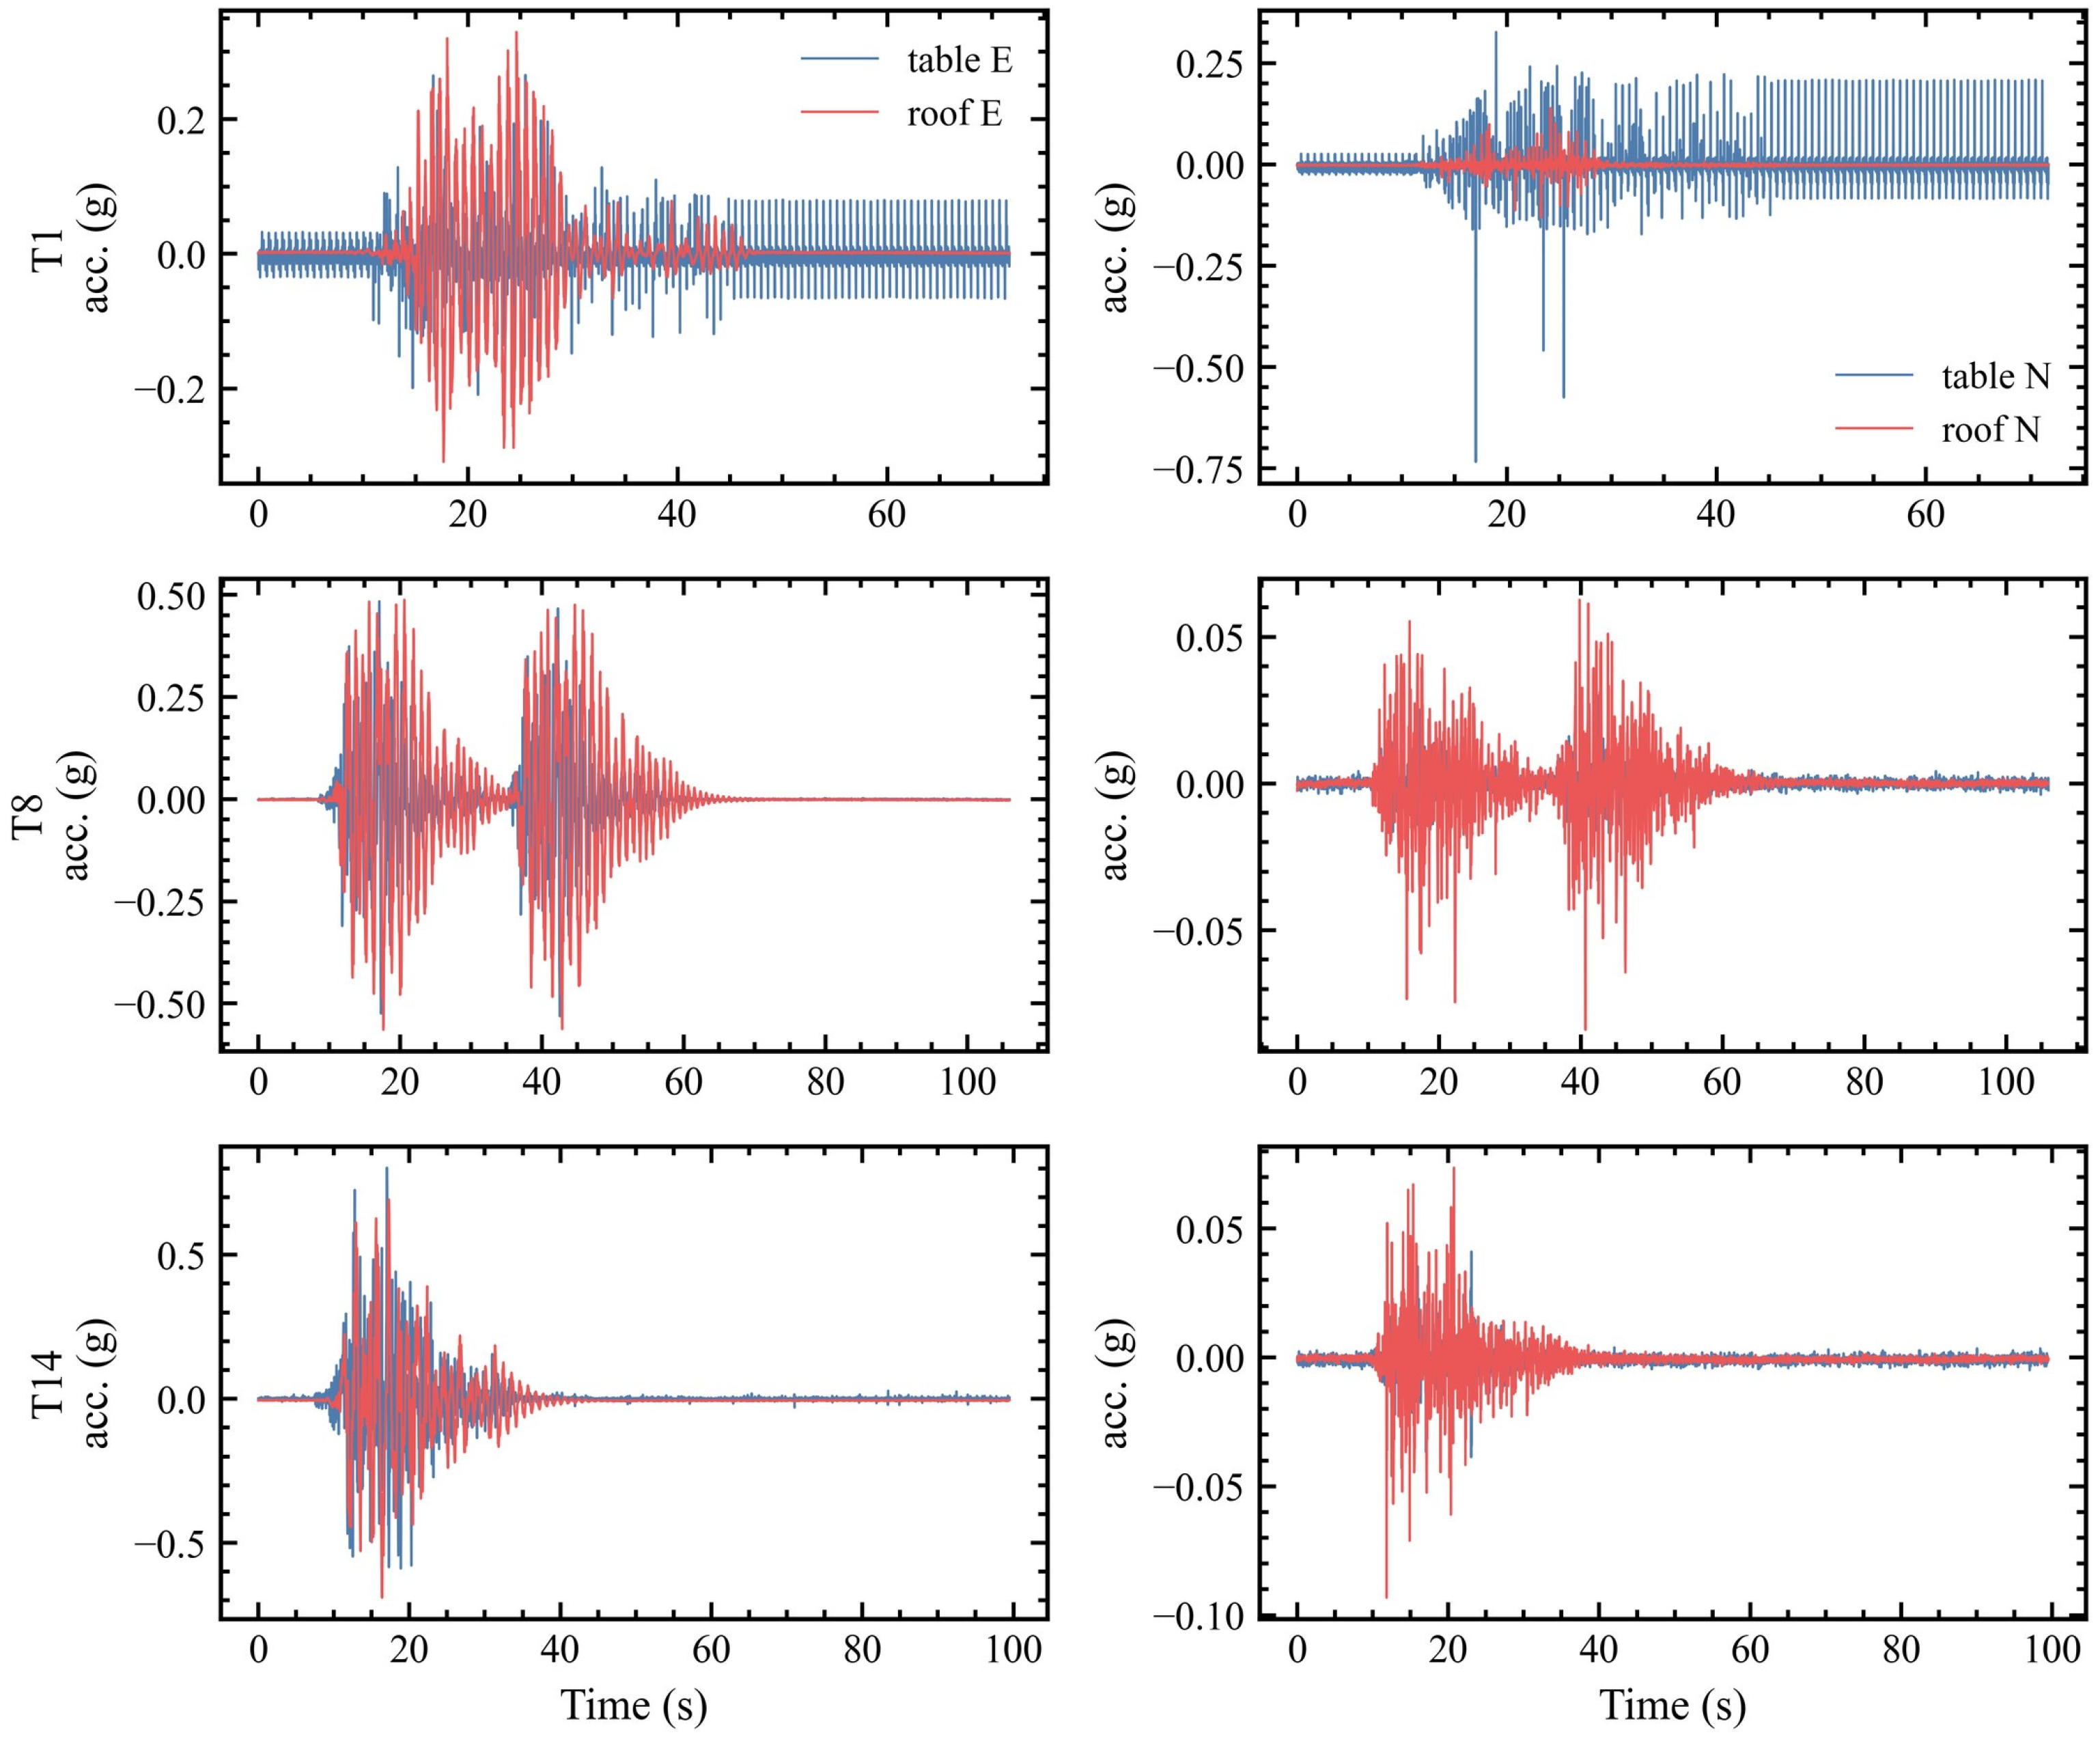
Figure 4 compares representative acceleration histories for a low-level event, a repeated DBE-level event, and the final maximum-level event. In Test 1, the resultant table PGA is about 0.286 g, and the peak roof acceleration in the east–west direction is about 0.310 g. In the repeated DBE case represented by Test 8, the resultant table PGA increases to about 0.470 g and the roof east–west peak acceleration reaches about 0.514 g. In Test 14, the final 1.2MCE record produces a resultant table PGA of about 0.593 g and a roof east–west peak acceleration of about 0.683 g. The time histories show that later events are not simply scaled versions of early events; the response duration, directional balance, and roof-to-table phase relation all change with the evolving structural state.
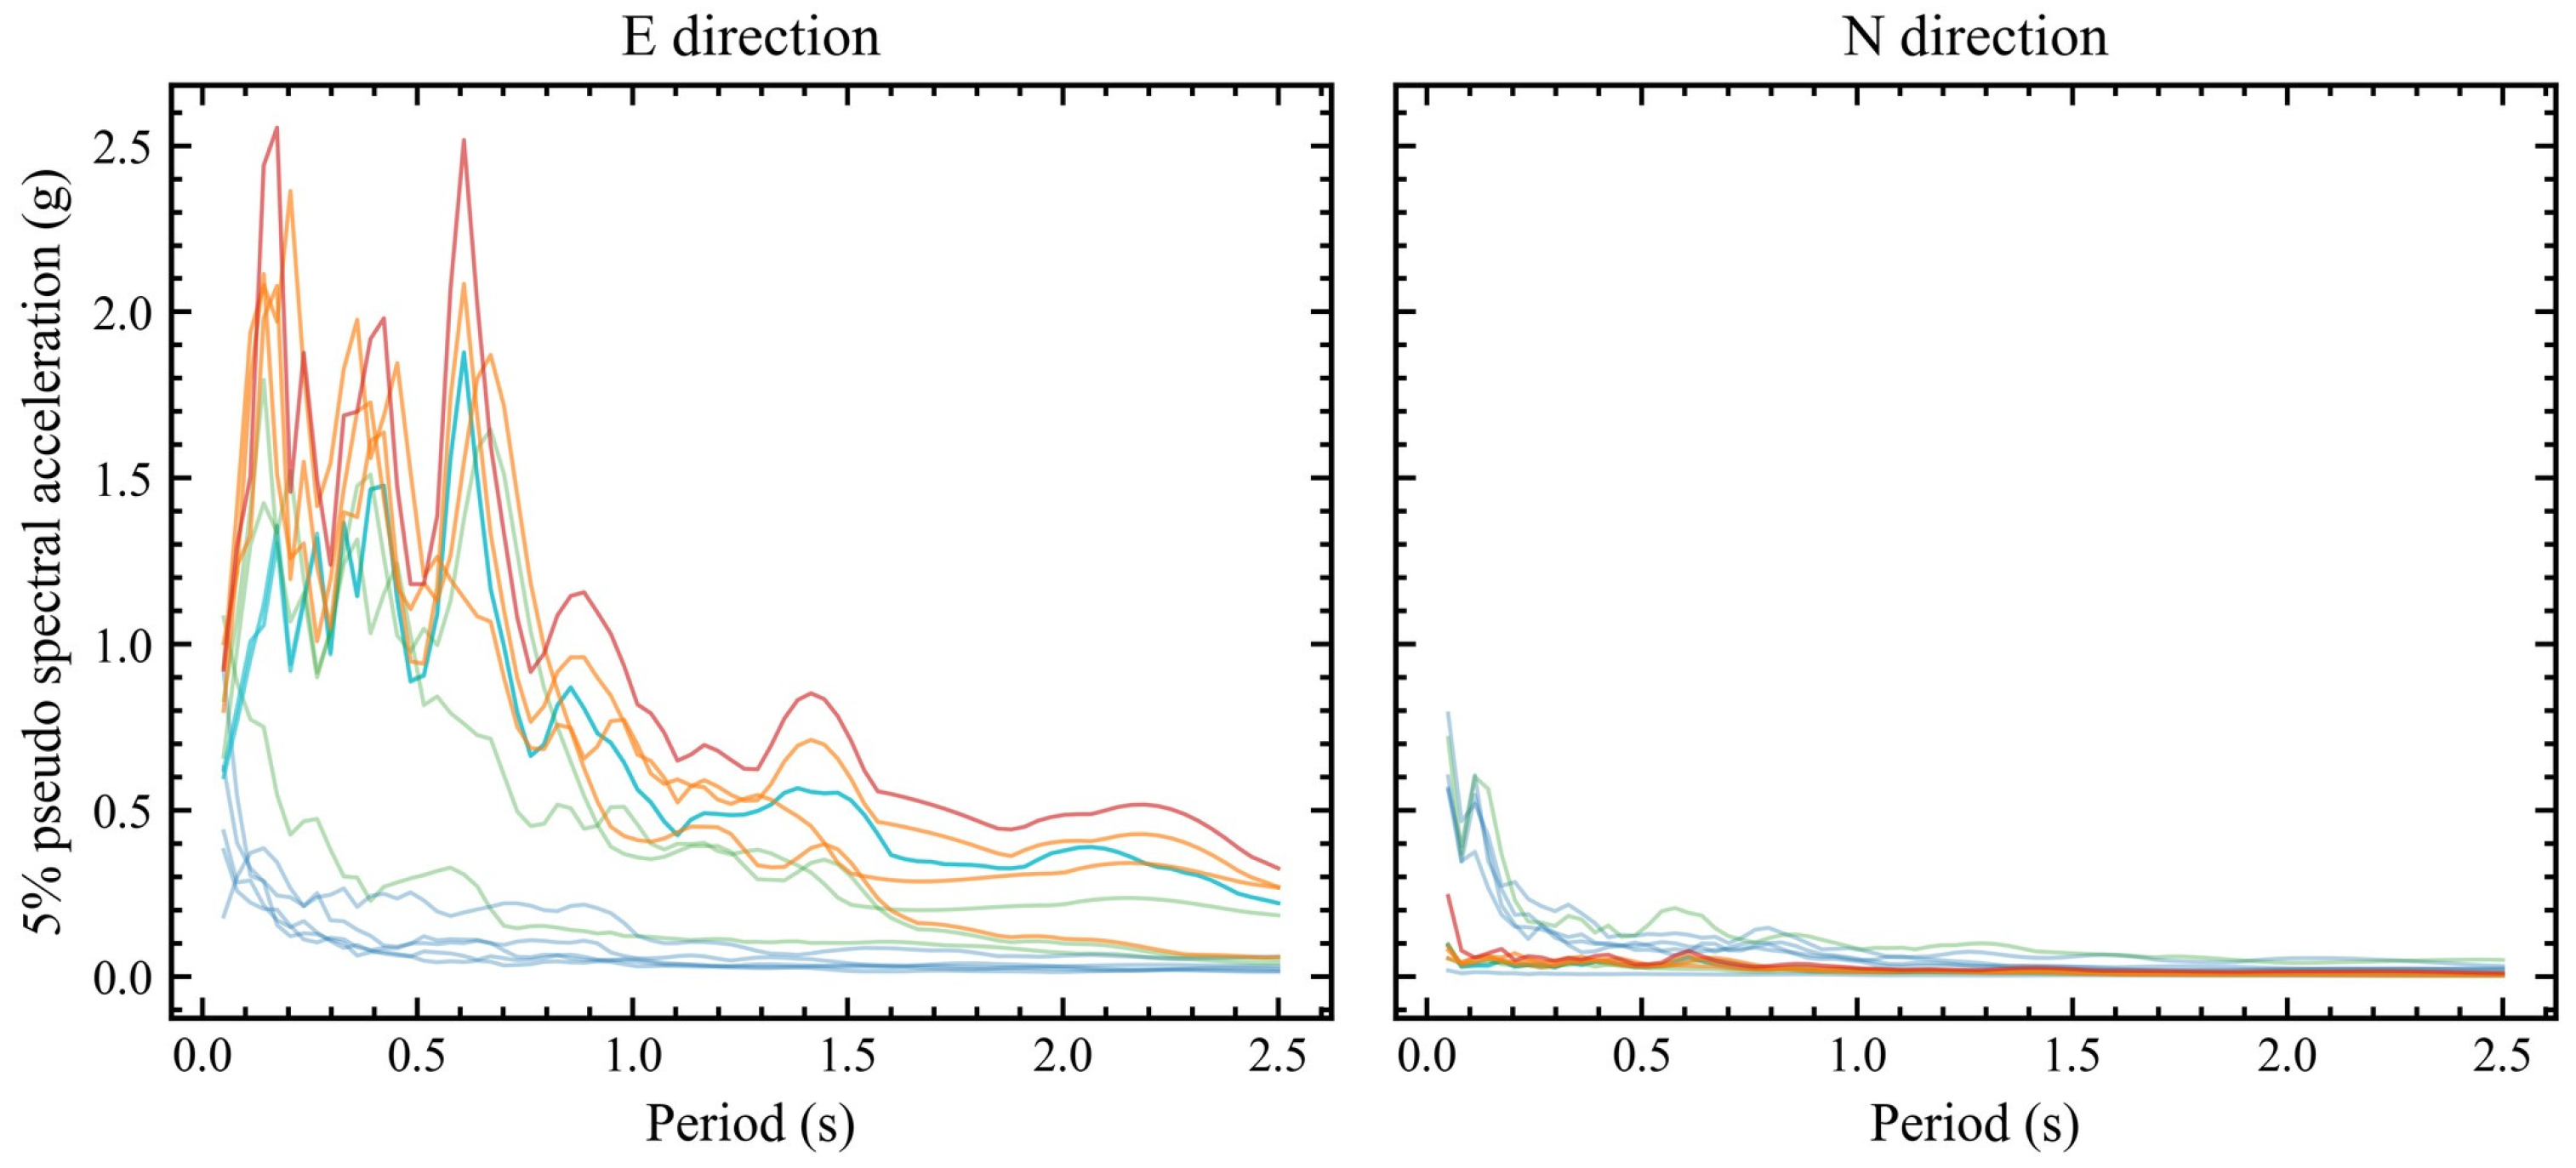
Figure 5 presents the five-percent damped pseudo-acceleration spectra computed directly from the recorded table motions. The spectra show that the strongest input demand is concentrated mainly over the short-to-intermediate period range, which is relevant because the identified structural period evolves from approximately 0.47 s to 1.42 s during the sequence. The east–west spectra dominate the later records, while the north–south spectra become weak after the early tests. This directional imbalance explains why subsequent modal and amplification results must be interpreted using the recorded table motions rather than the nominal target records.
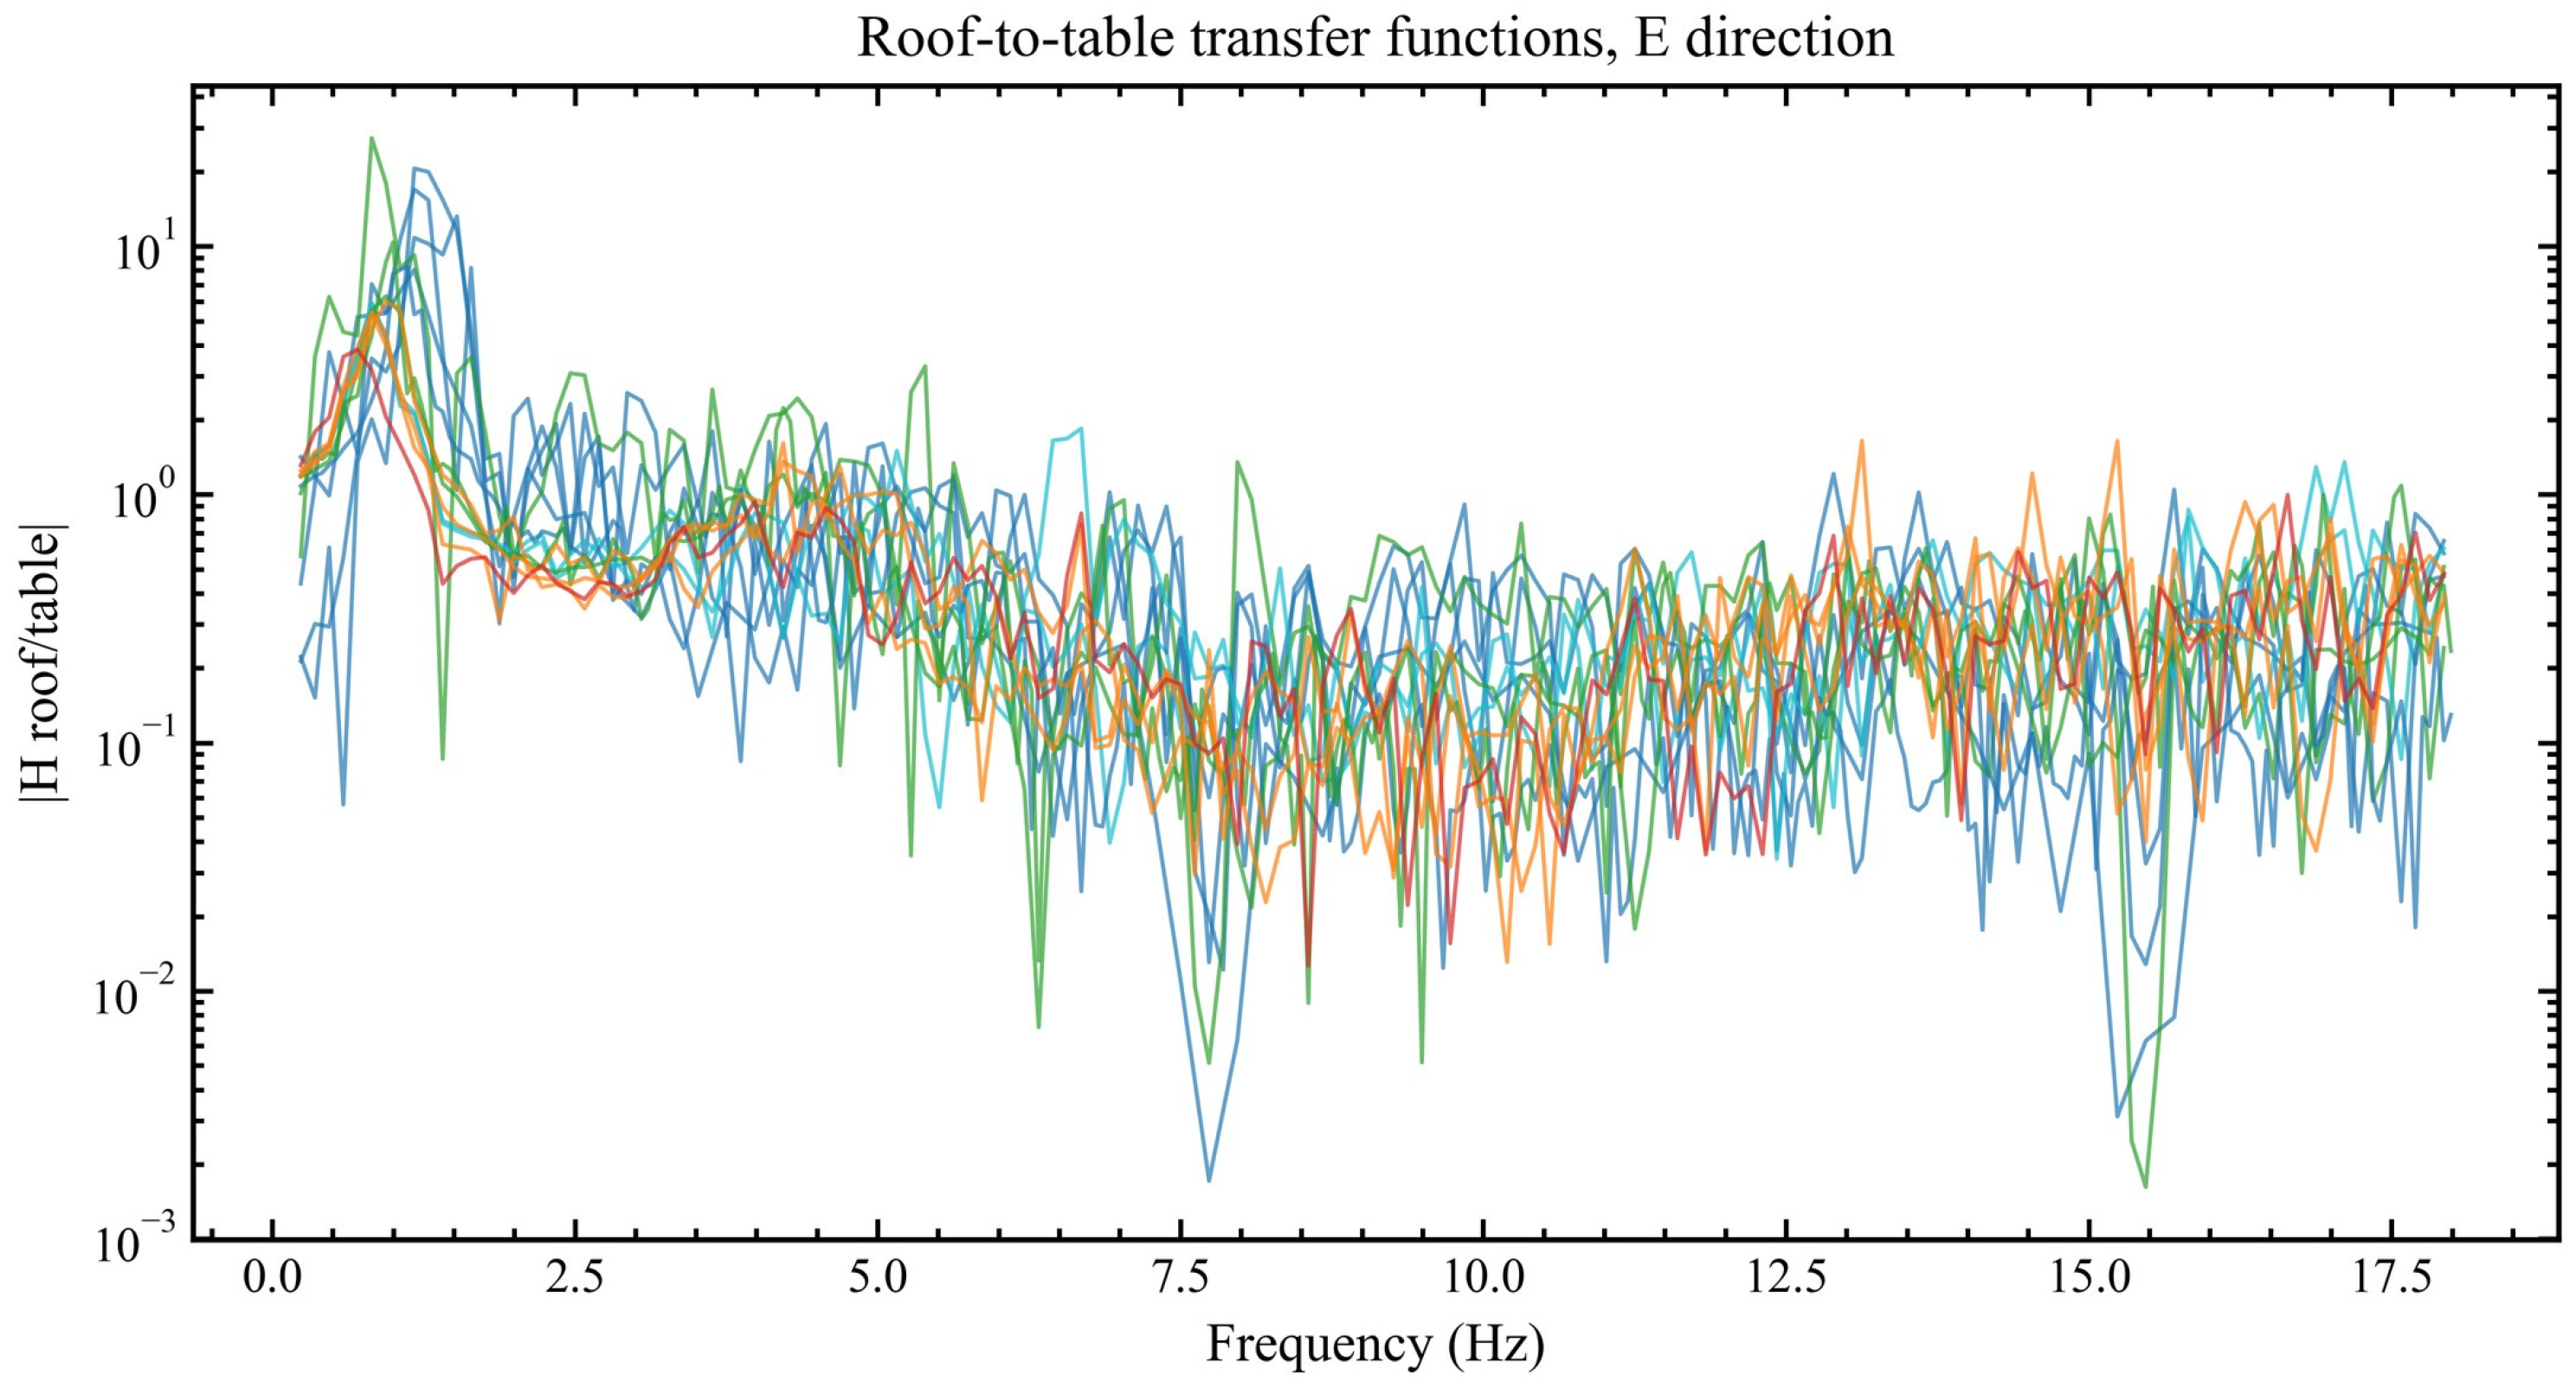
Figure 6 shows the roof-to-table transfer functions in the east–west direction. The transfer-function peaks migrate toward lower frequency as the system enters softened rocking states. The identified dominant frequency decreases from approximately 2.11 Hz in Test 1 to about 0.70 Hz in Tests 4 and 14, while several intermediate strong events stabilize near 0.82 Hz. This frequency migration is a direct dynamic signature of tangent-stiffness reduction. The broadening of the transfer-function peak also indicates that the response is increasingly governed by contact opening, repeated uplift and recontact, diaphragm compatibility, and connection seating rather than by a fixed linear elastic mode.
These modal trends should be interpreted as correlation-supported evidence of changing effective dynamic state rather than as direct proof of a unique physical mechanism. In a rocking-wall system, frequency migration and bandwidth broadening may reflect a combination of uplift, recontact, interface seating, diaphragm compatibility, and connection-state changes.
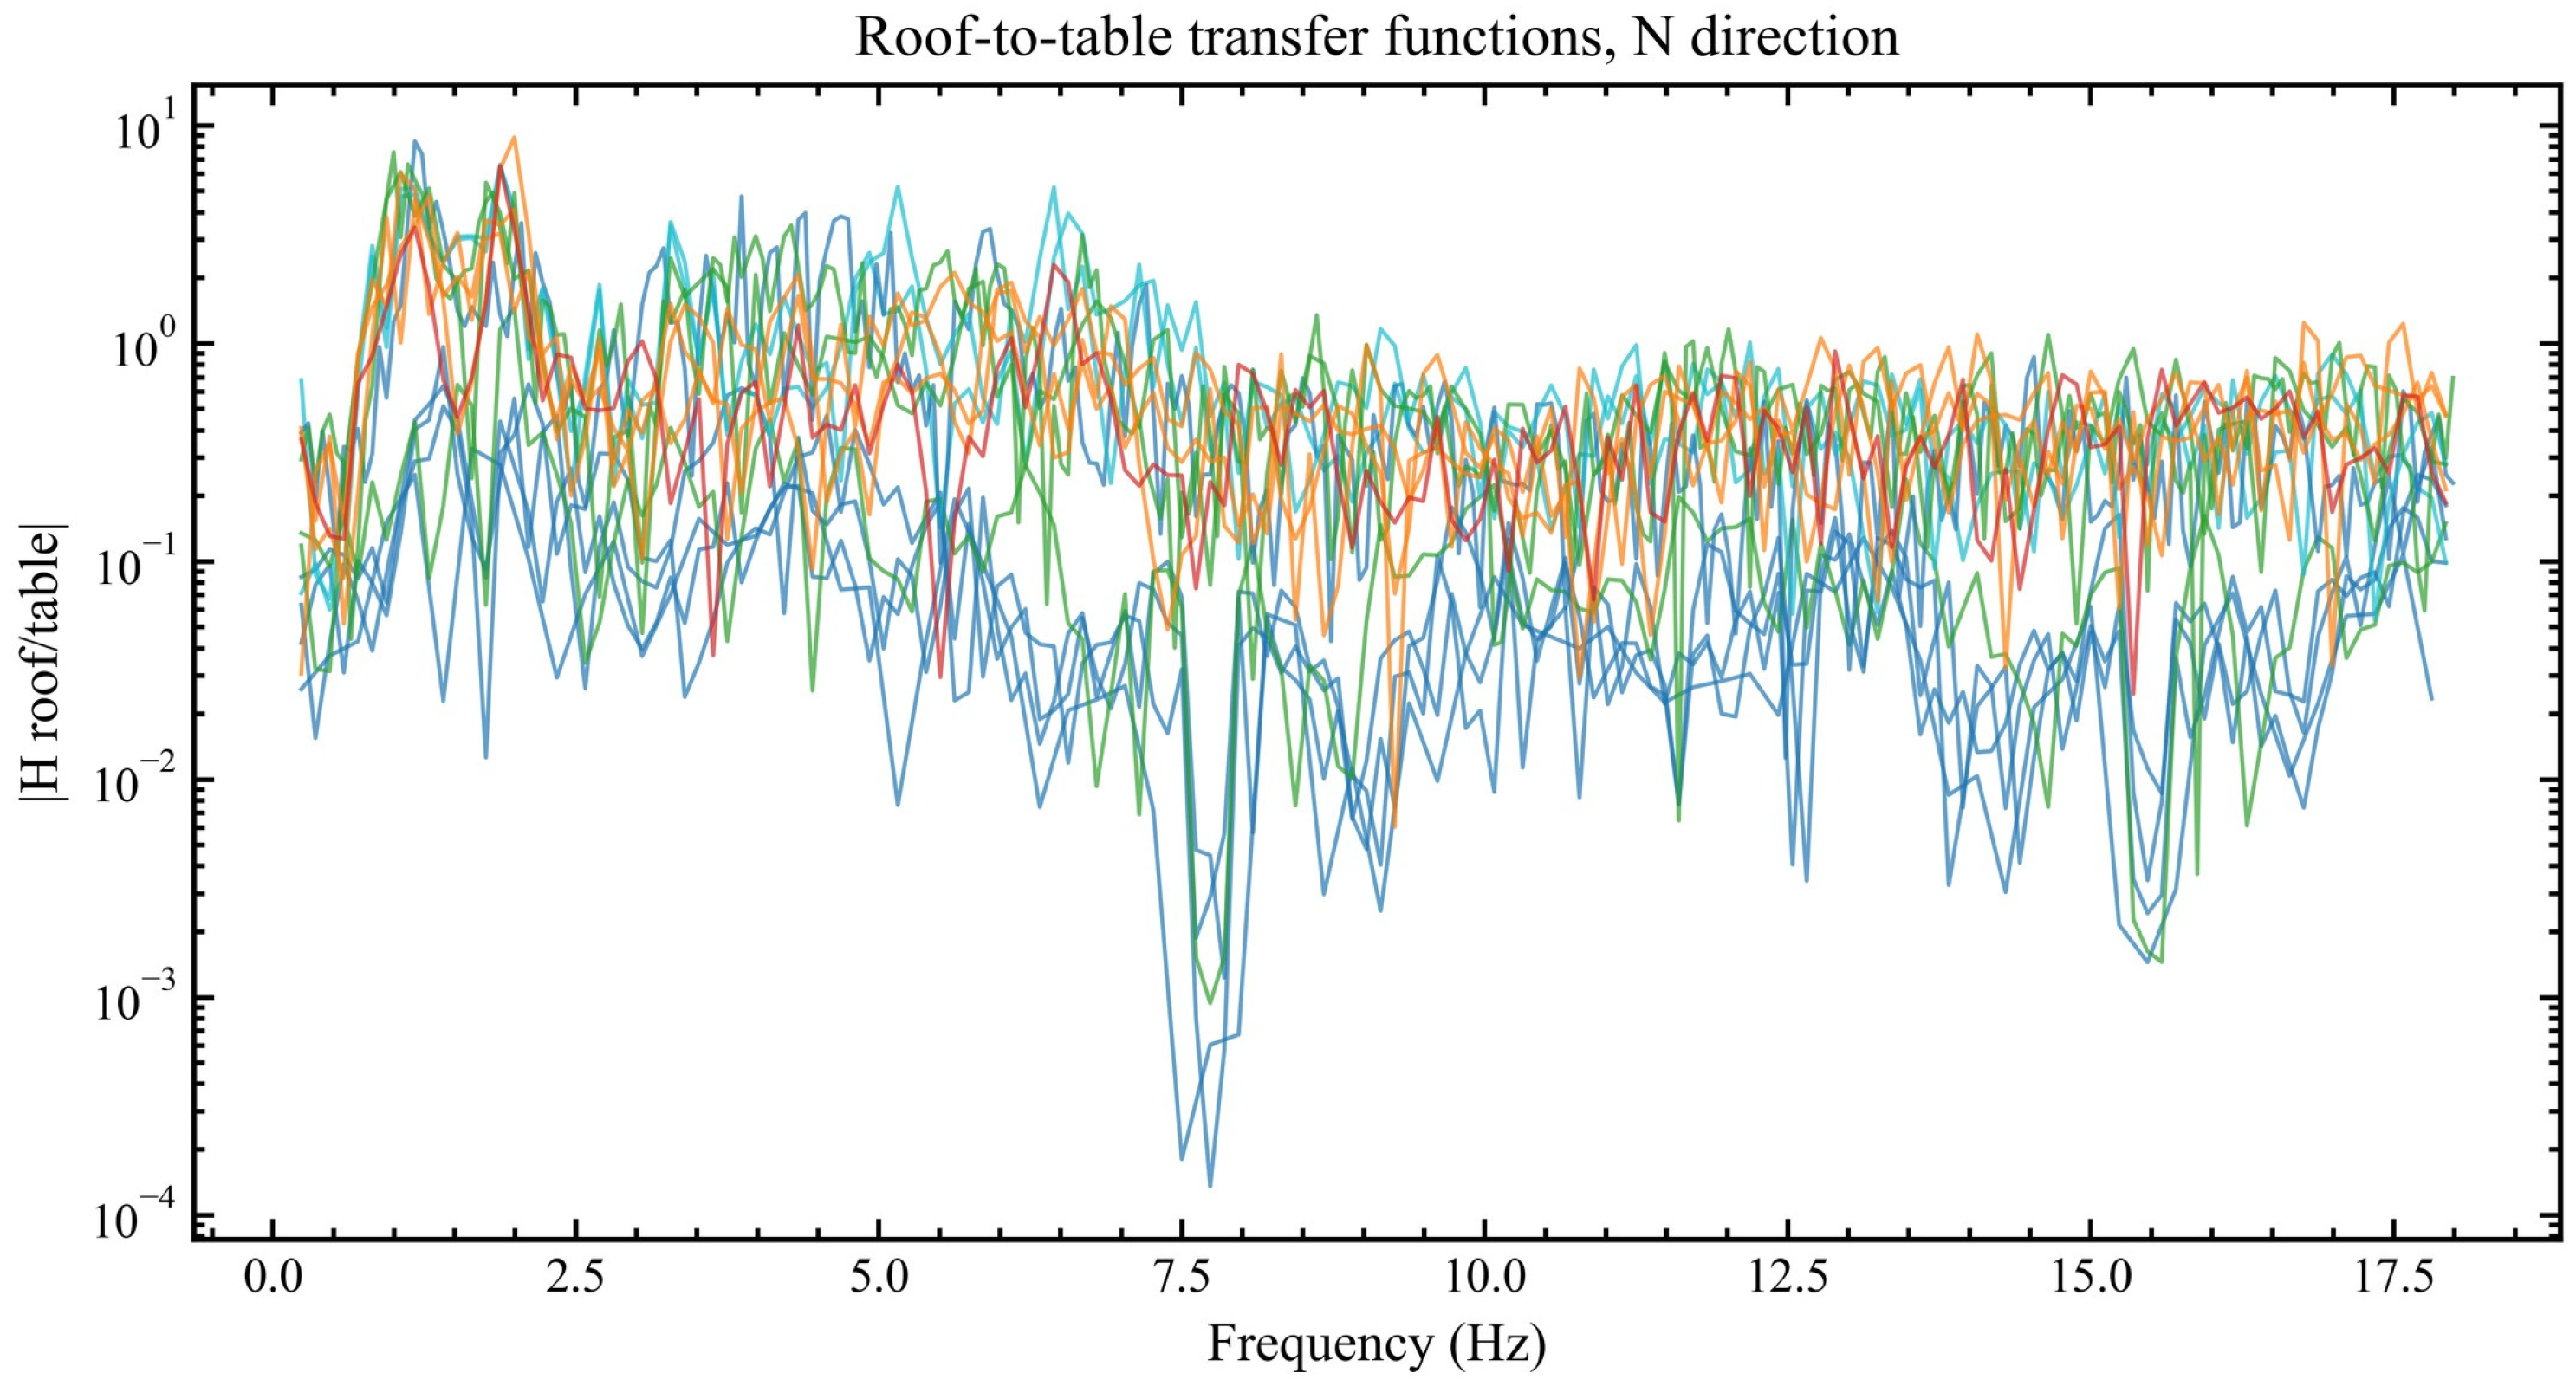
Figure 7 gives the corresponding north–south transfer functions. Unlike the east–west direction, the north–south transfer estimates are less reliable for several later records because the table input in that direction is very small. For example, the north–south PGA is only about 0.020 g to 0.024 g in Tests 8 to 13, while the roof response remains measurable. This can produce large apparent transfer ratios even when the absolute roof acceleration is small. Therefore, the north–south transfer functions should be read together with the coherence map and the directional input intensity rather than being interpreted as direct evidence of strong structural amplification.
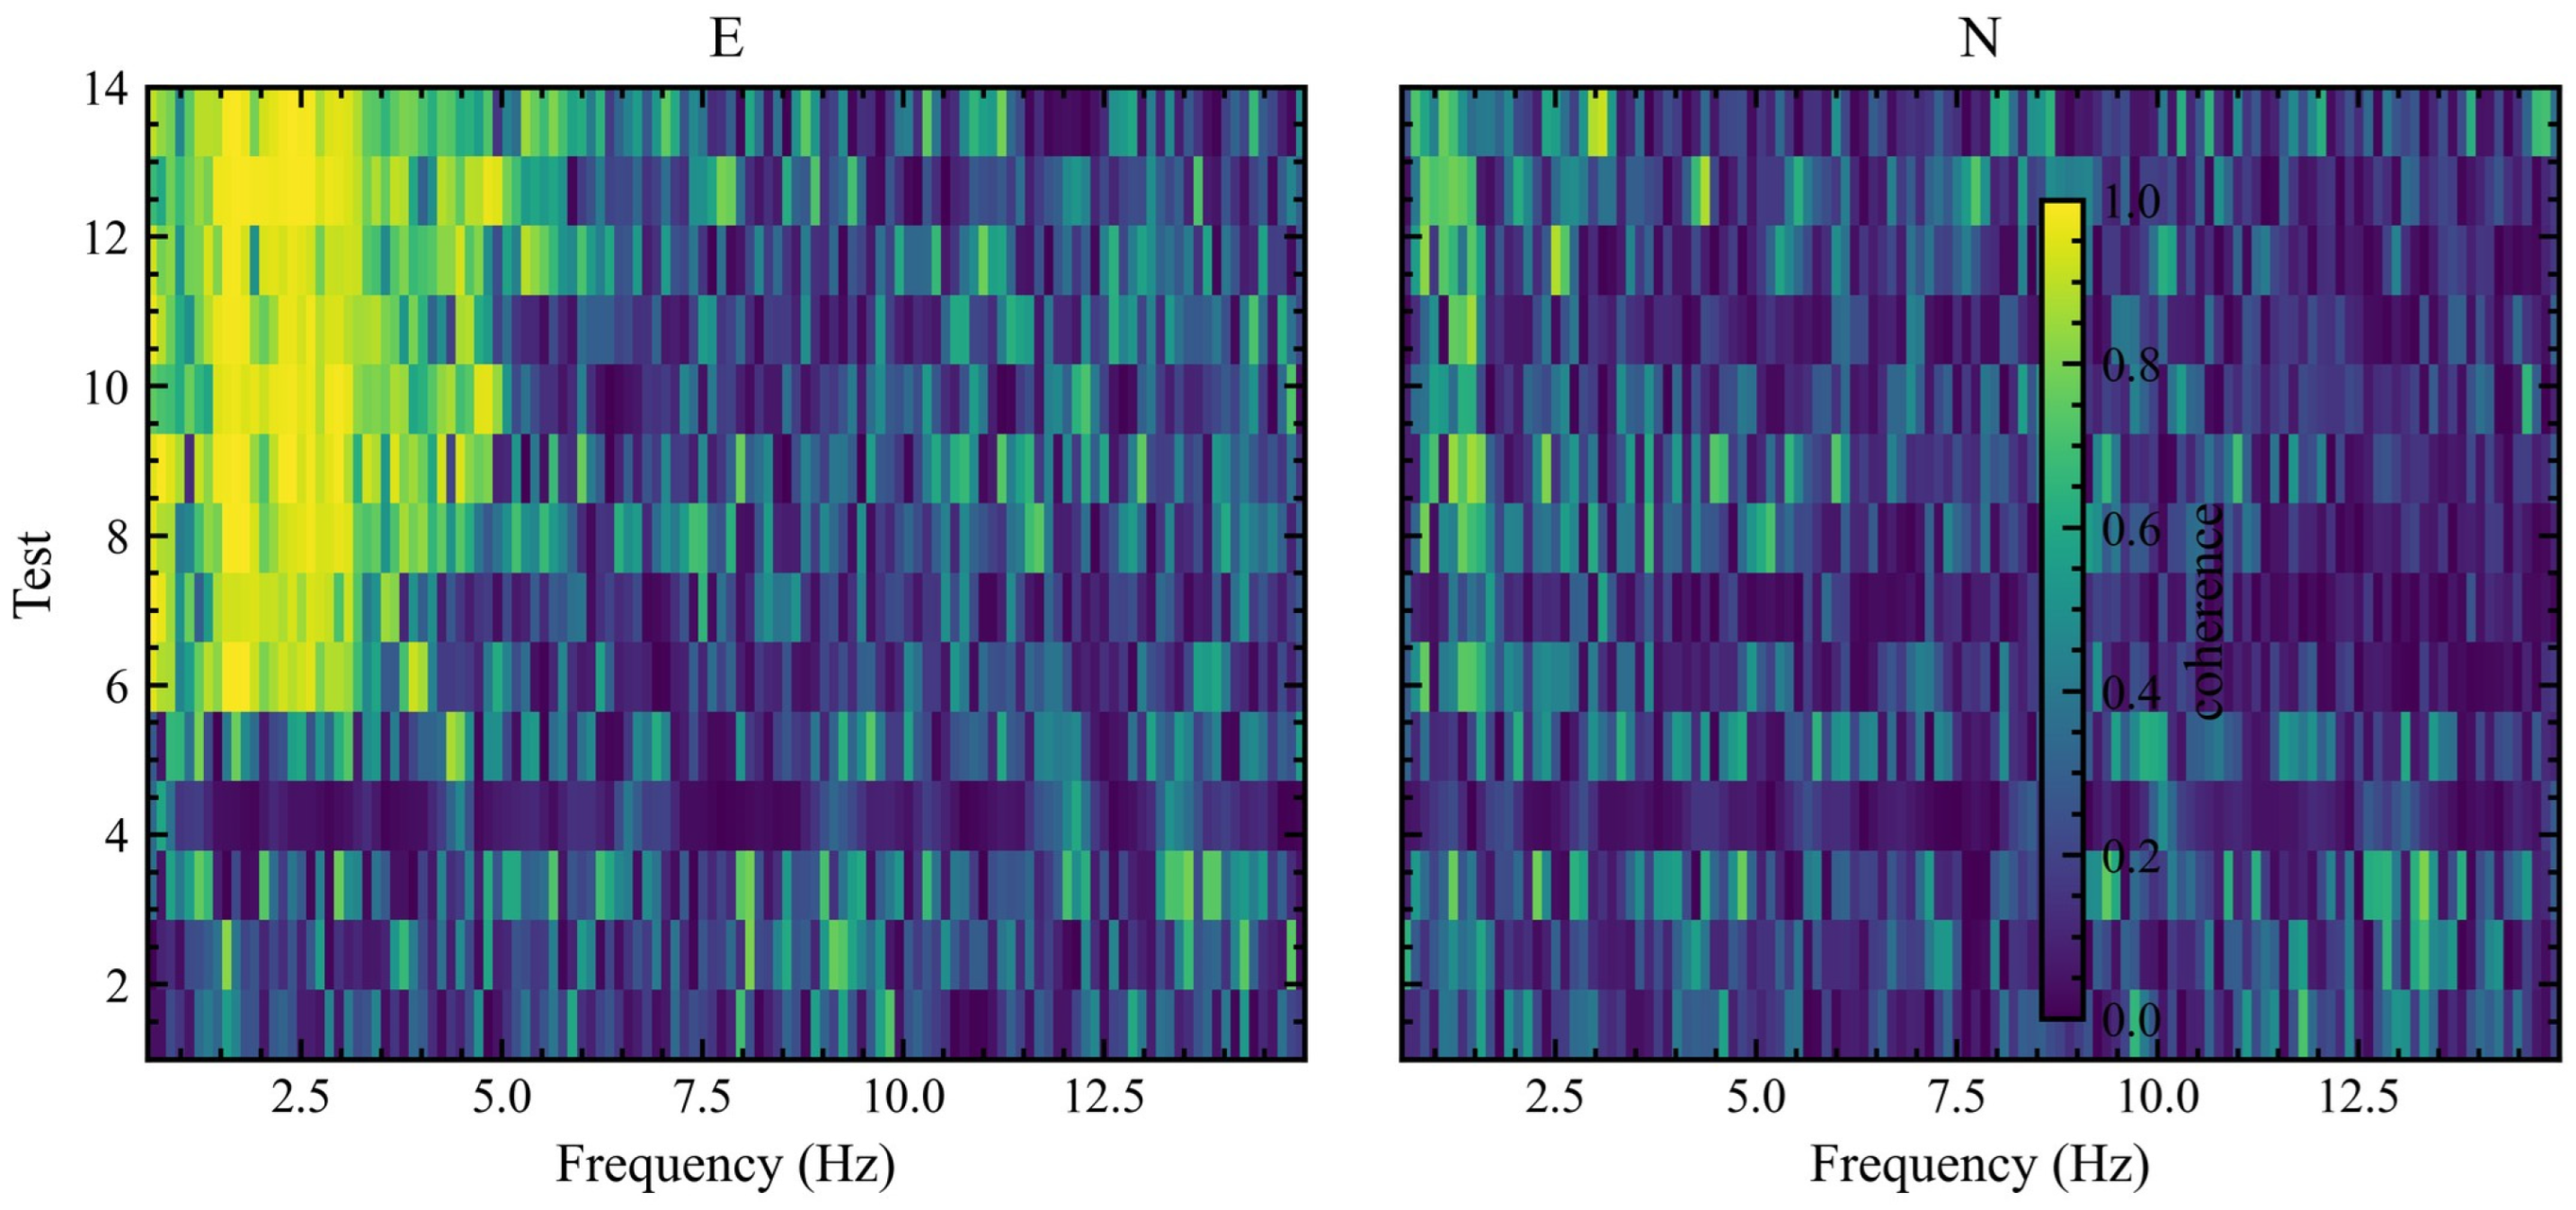
Figure 8 maps the input–output coherence between table input and roof response. The coherence results identify the frequency bands where transfer-function peaks are physically meaningful. The east–west direction shows more continuous reliable bands in the low-frequency range associated with the dominant rocking response, whereas the north–south direction contains more fragmented reliable zones because the corresponding input becomes weak in later events. This figure provides the quality-control basis for accepting or rejecting modal-frequency estimates from the transfer functions.
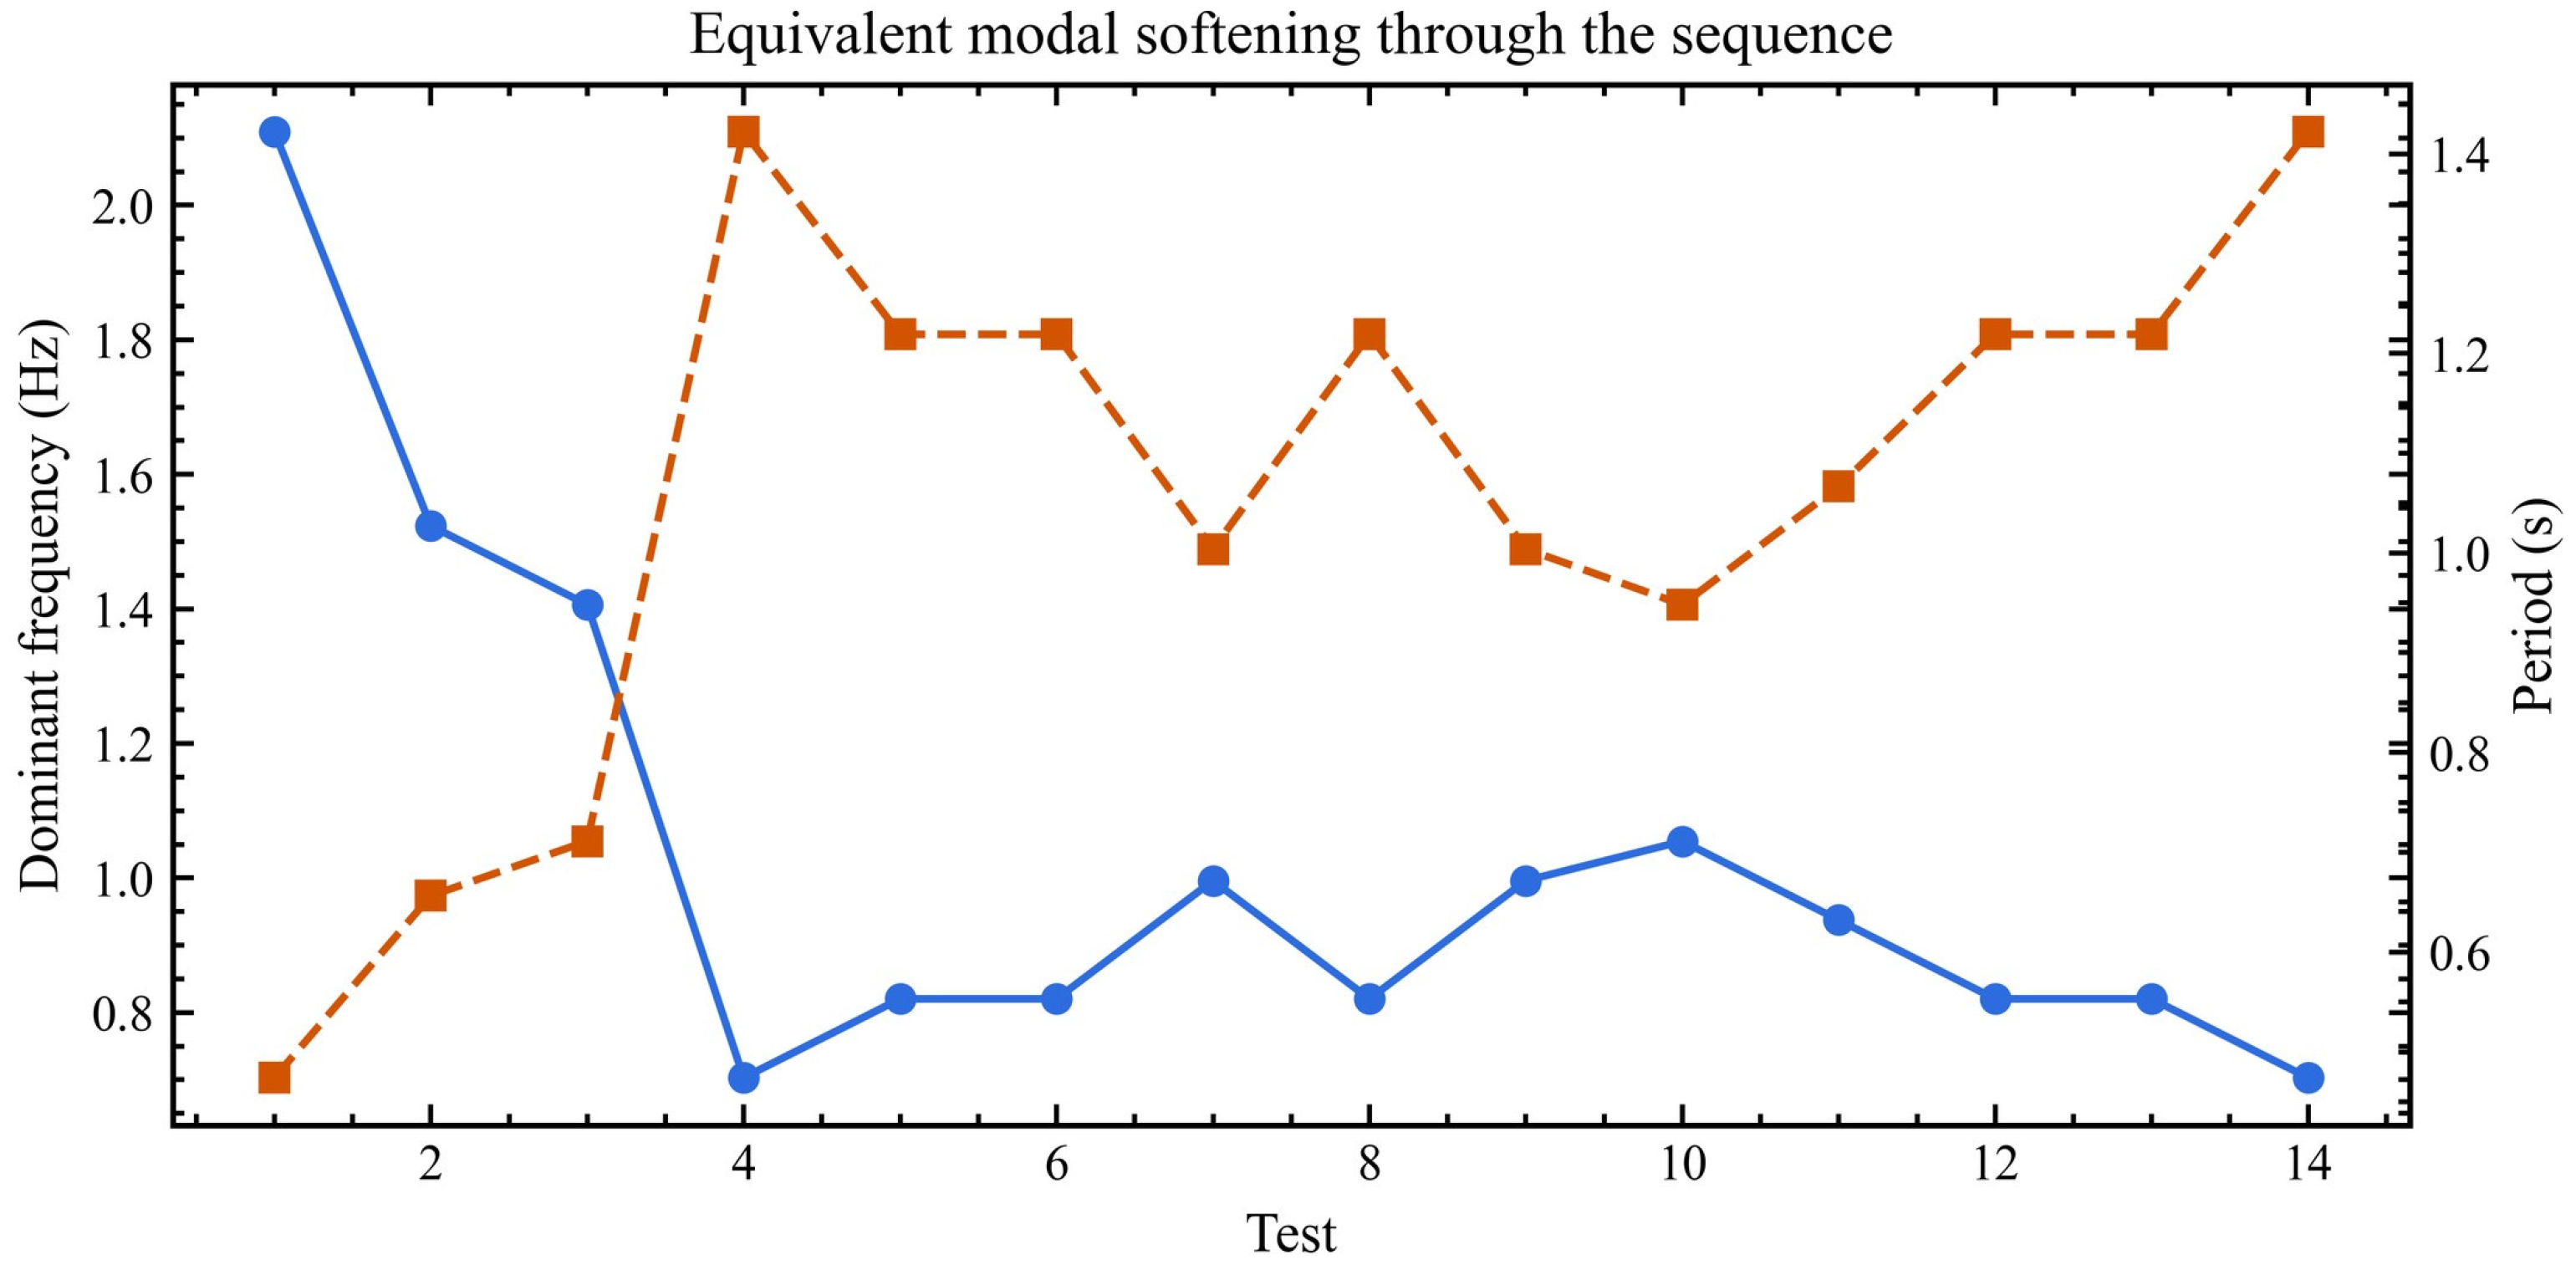
Figure 9 shows the evolution of the dominant frequency and corresponding period through the fourteen tests. The dominant frequency drops from 2.11 Hz in the initial low-level event to 1.52 Hz and 1.41 Hz in Tests 2 and 3, then reaches approximately 0.70 Hz in Test 4. From Tests 5 to 14, the frequency mostly remains between 0.82 Hz and 1.05 Hz, before returning to approximately 0.70 Hz in the final 1.2MCE event. In period terms, this corresponds to an increase from about 0.47 s to about 1.42 s. The result indicates substantial modal softening, but the nonmonotonic path also shows that frequency is affected by loading history and contact state, not by instantaneous PGA alone.
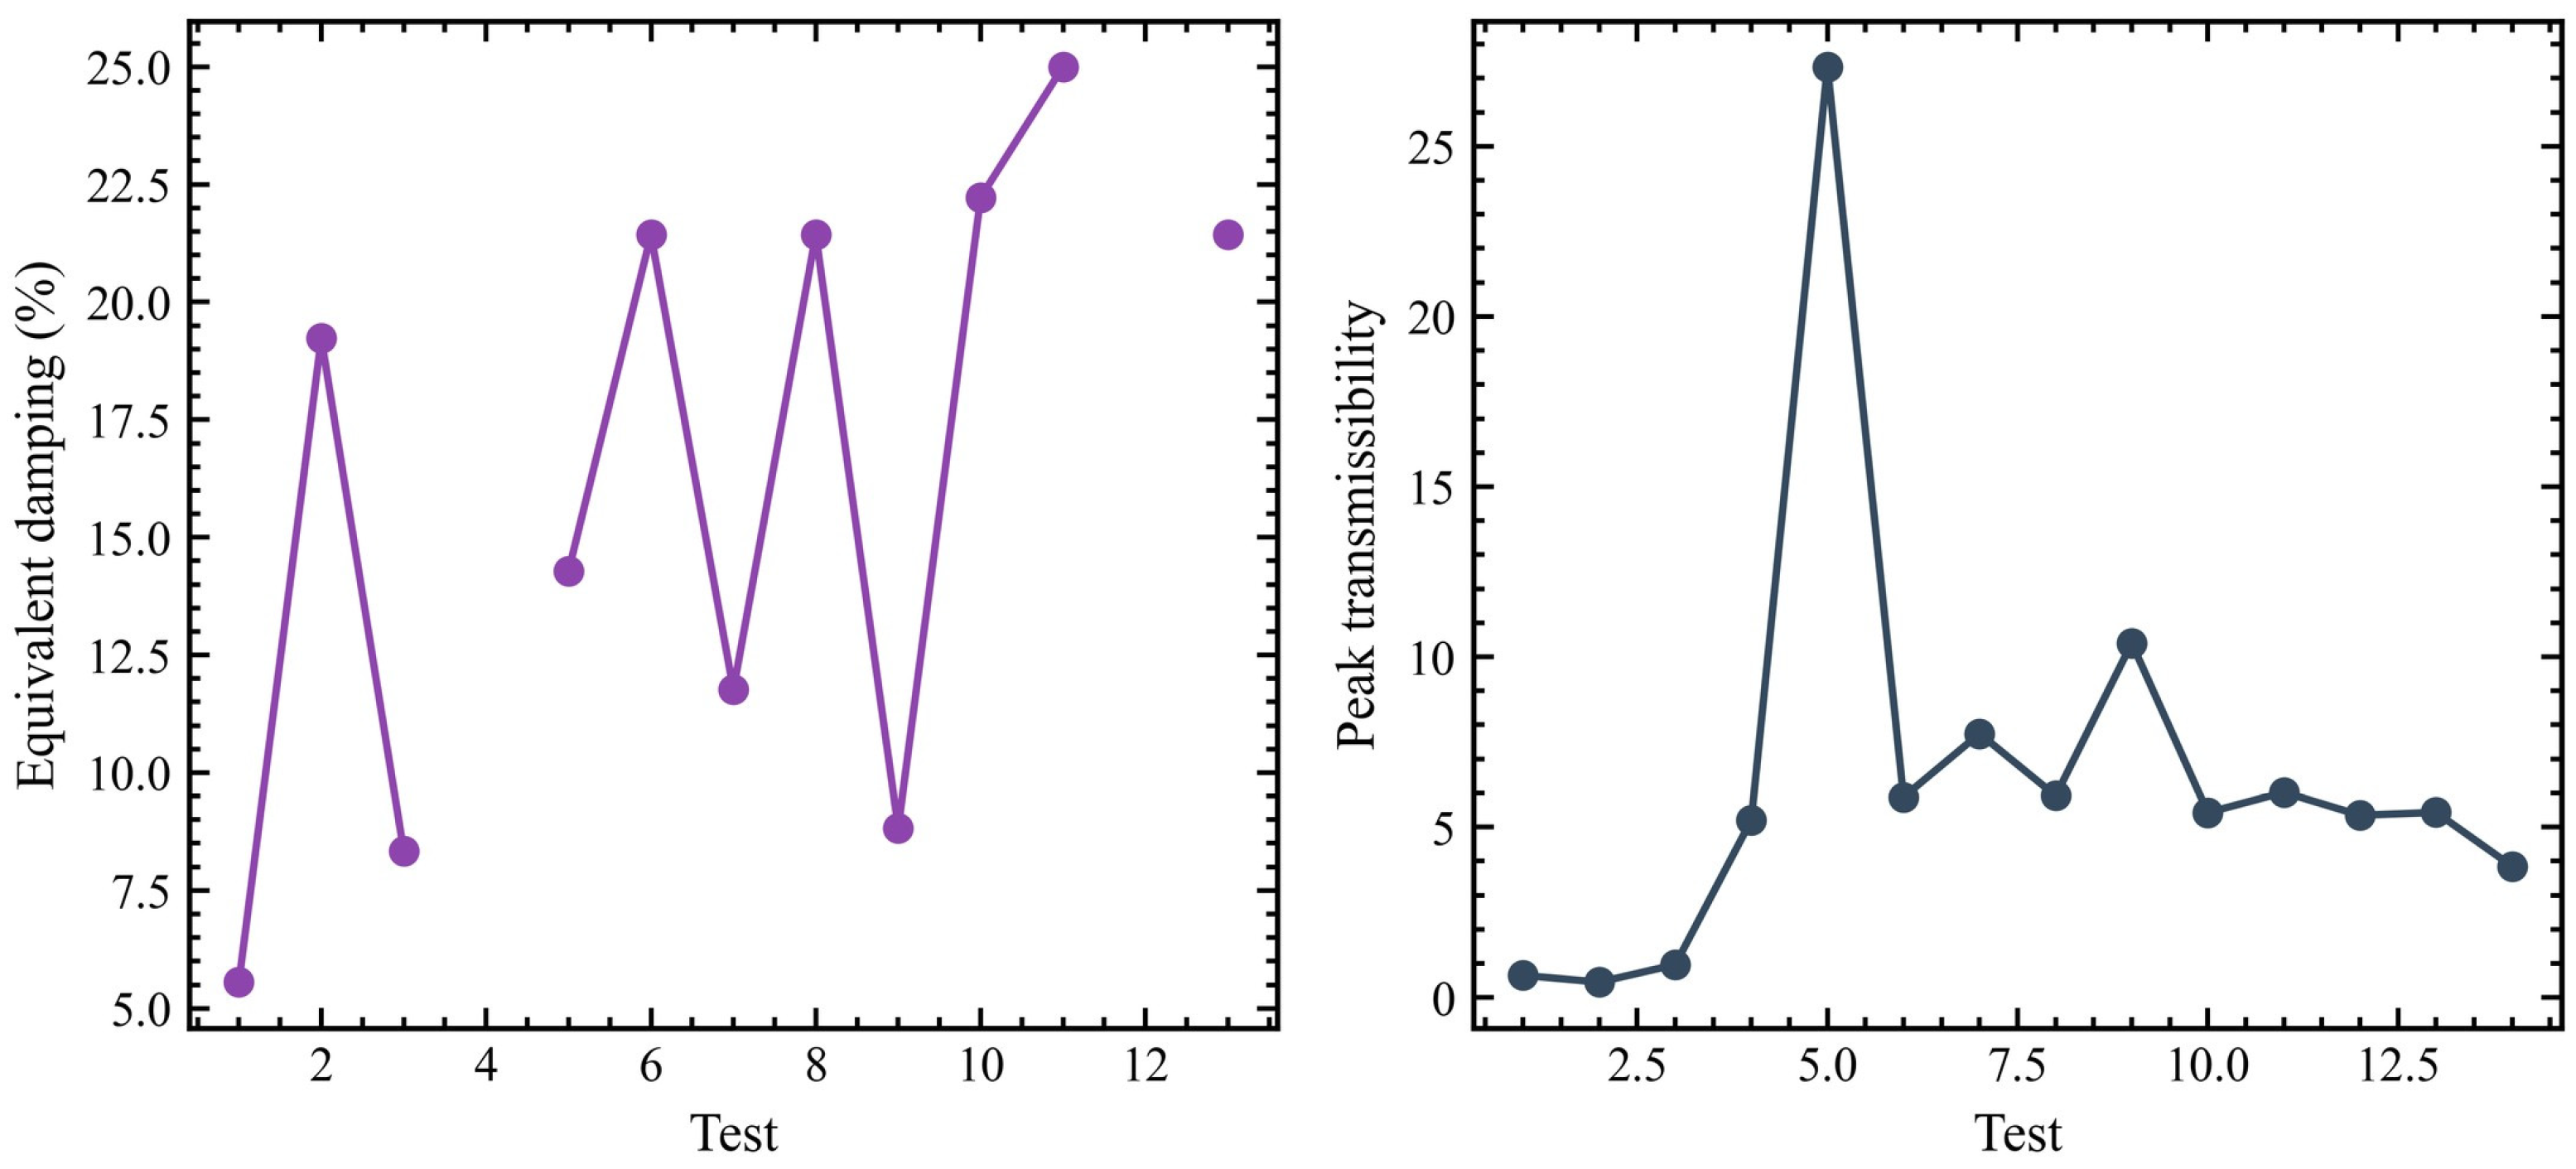
Figure 10 reports the equivalent damping estimates and the maximum transfer-function amplitudes. The accepted half-power damping estimates range from about 5.6% to 25.0%, which is much broader than would be expected for a constant viscous damping assumption. The maximum transfer amplitude reaches about 27.34 in Test 5, while most later events have values between about 3.85 and 10.40. These variations indicate nonlinear bandwidth broadening caused by rocking, friction, local impact, connection slip, and changing boundary conditions. Therefore, the damping values should be interpreted as equivalent modal descriptors rather than as material damping ratios.
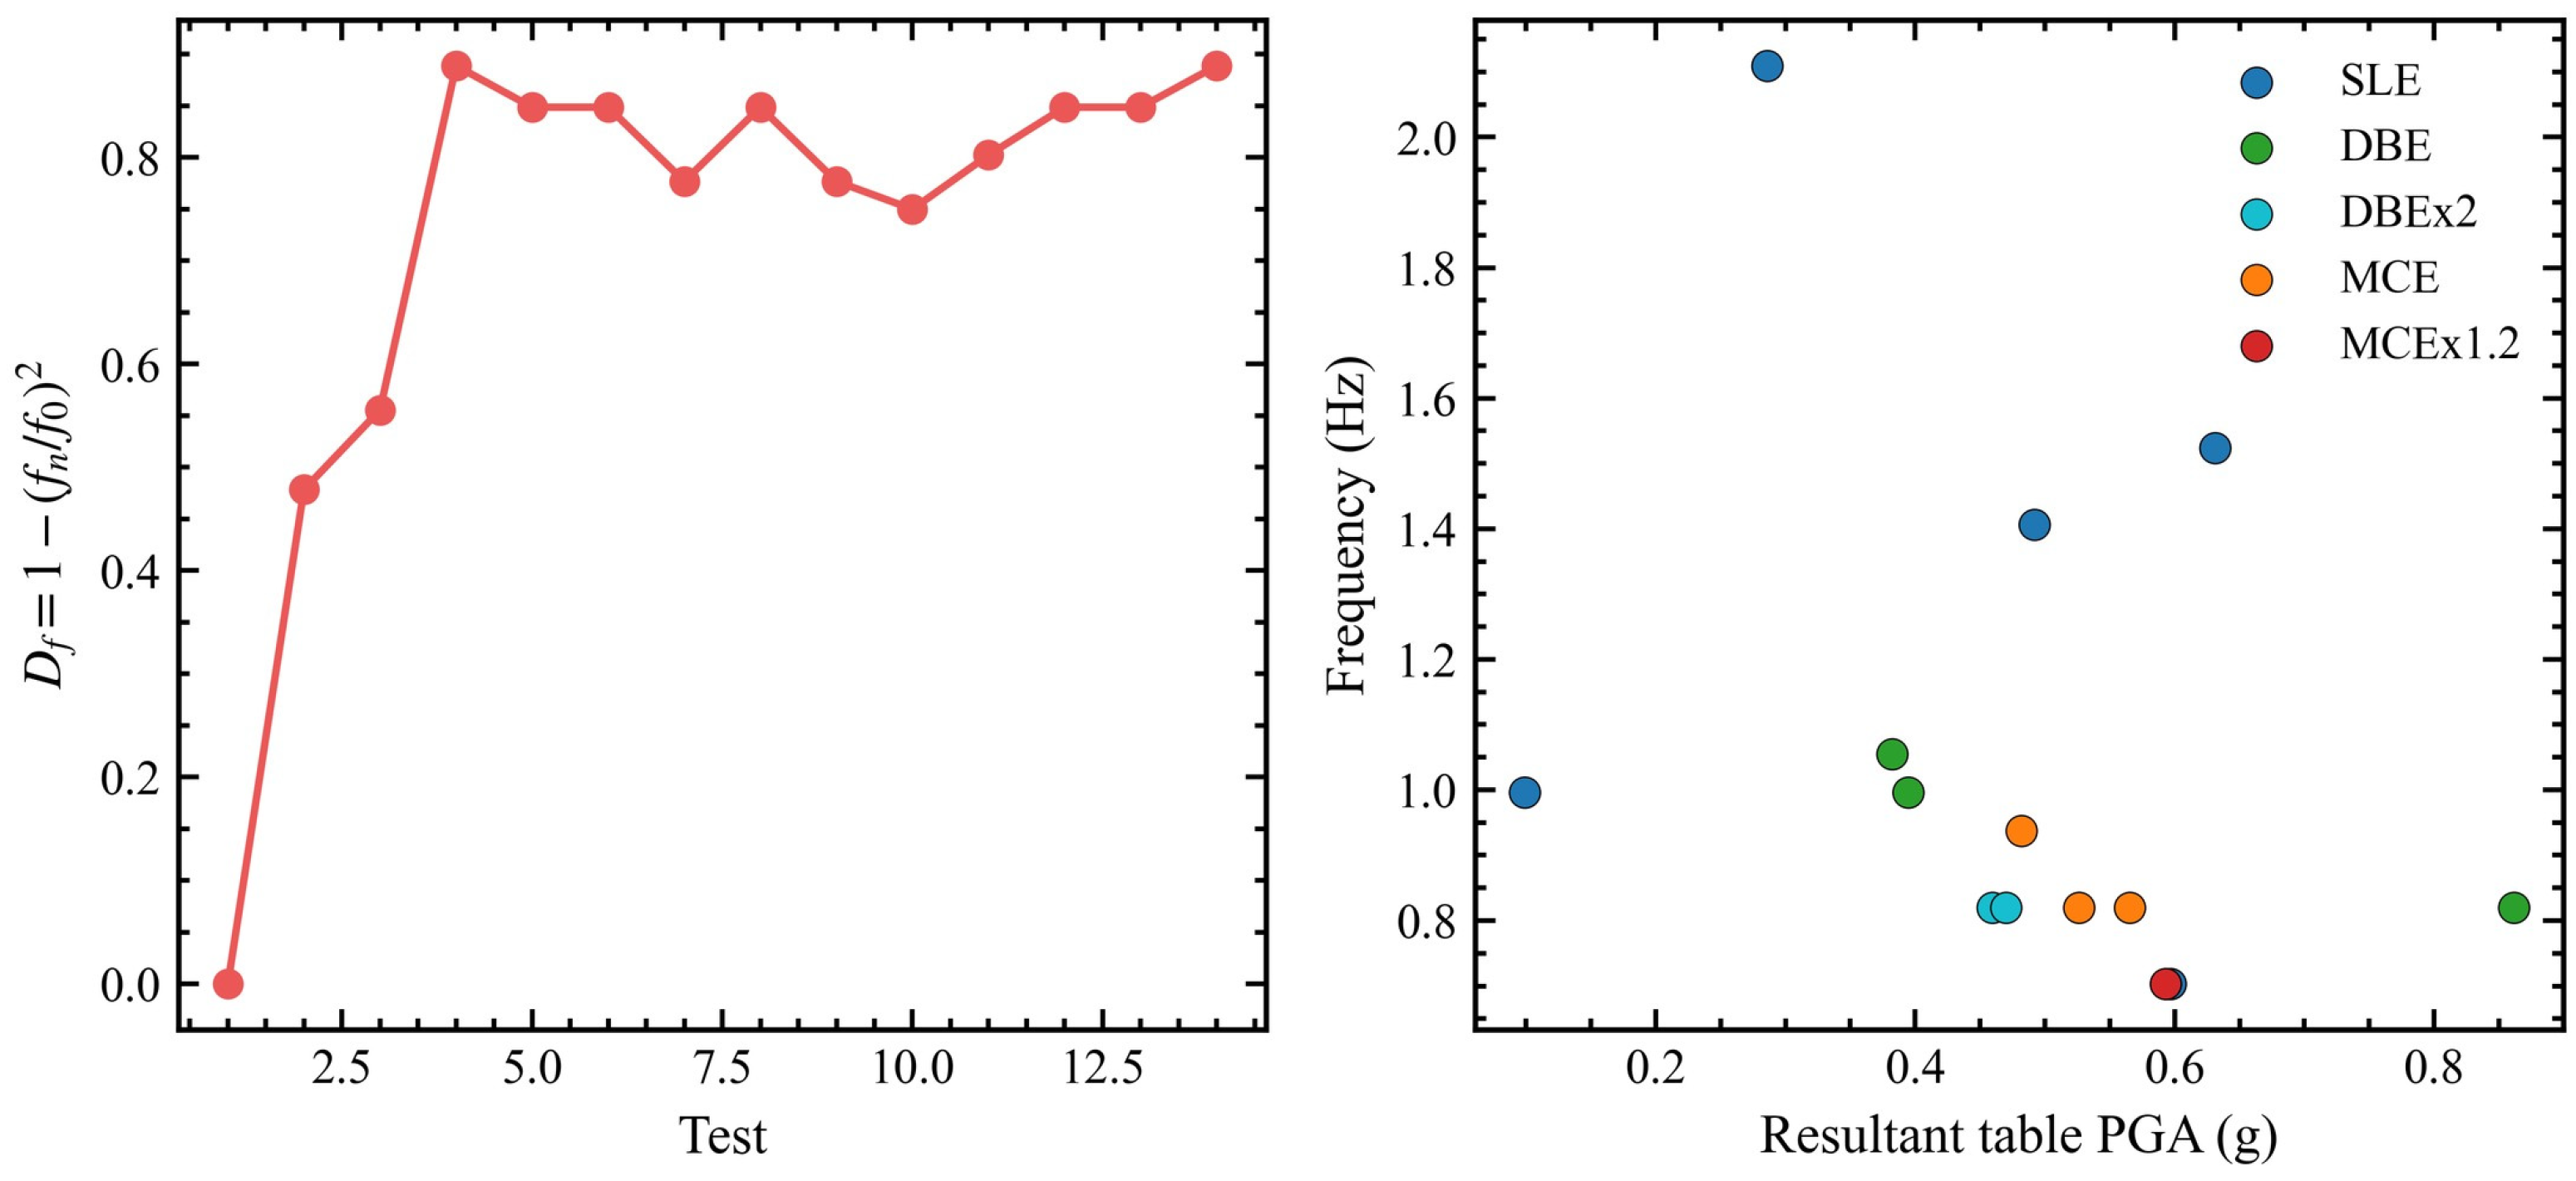
Figure 11 converts the modal-frequency reduction into a frequency-based stiffness-loss index. The index increases from zero in Test 1 to approximately 0.48 in Test 2, 0.56 in Test 3, and about 0.89 by Test 4. The final 1.2MCE event also reaches about 0.89. This means that the effective tangent stiffness inferred from the frequency-squared ratio is reduced by nearly 89% relative to the initial state. However, the scatter against resultant PGA shows that stiffness loss is not controlled only by input amplitude. For example, Test 7 has a very low resultant PGA of about 0.099 g but retains a softened frequency state because it occurs after stronger previous shaking.
The stiffness-loss index is therefore an effective modal-softening descriptor based on the frequency-squared ratio. It should not be read as a direct measure of material stiffness degradation or global plastic damage because reversible contact opening, wall uplift, tendon action, and interface-state changes can also reduce the apparent tangent stiffness identified from the transfer function.
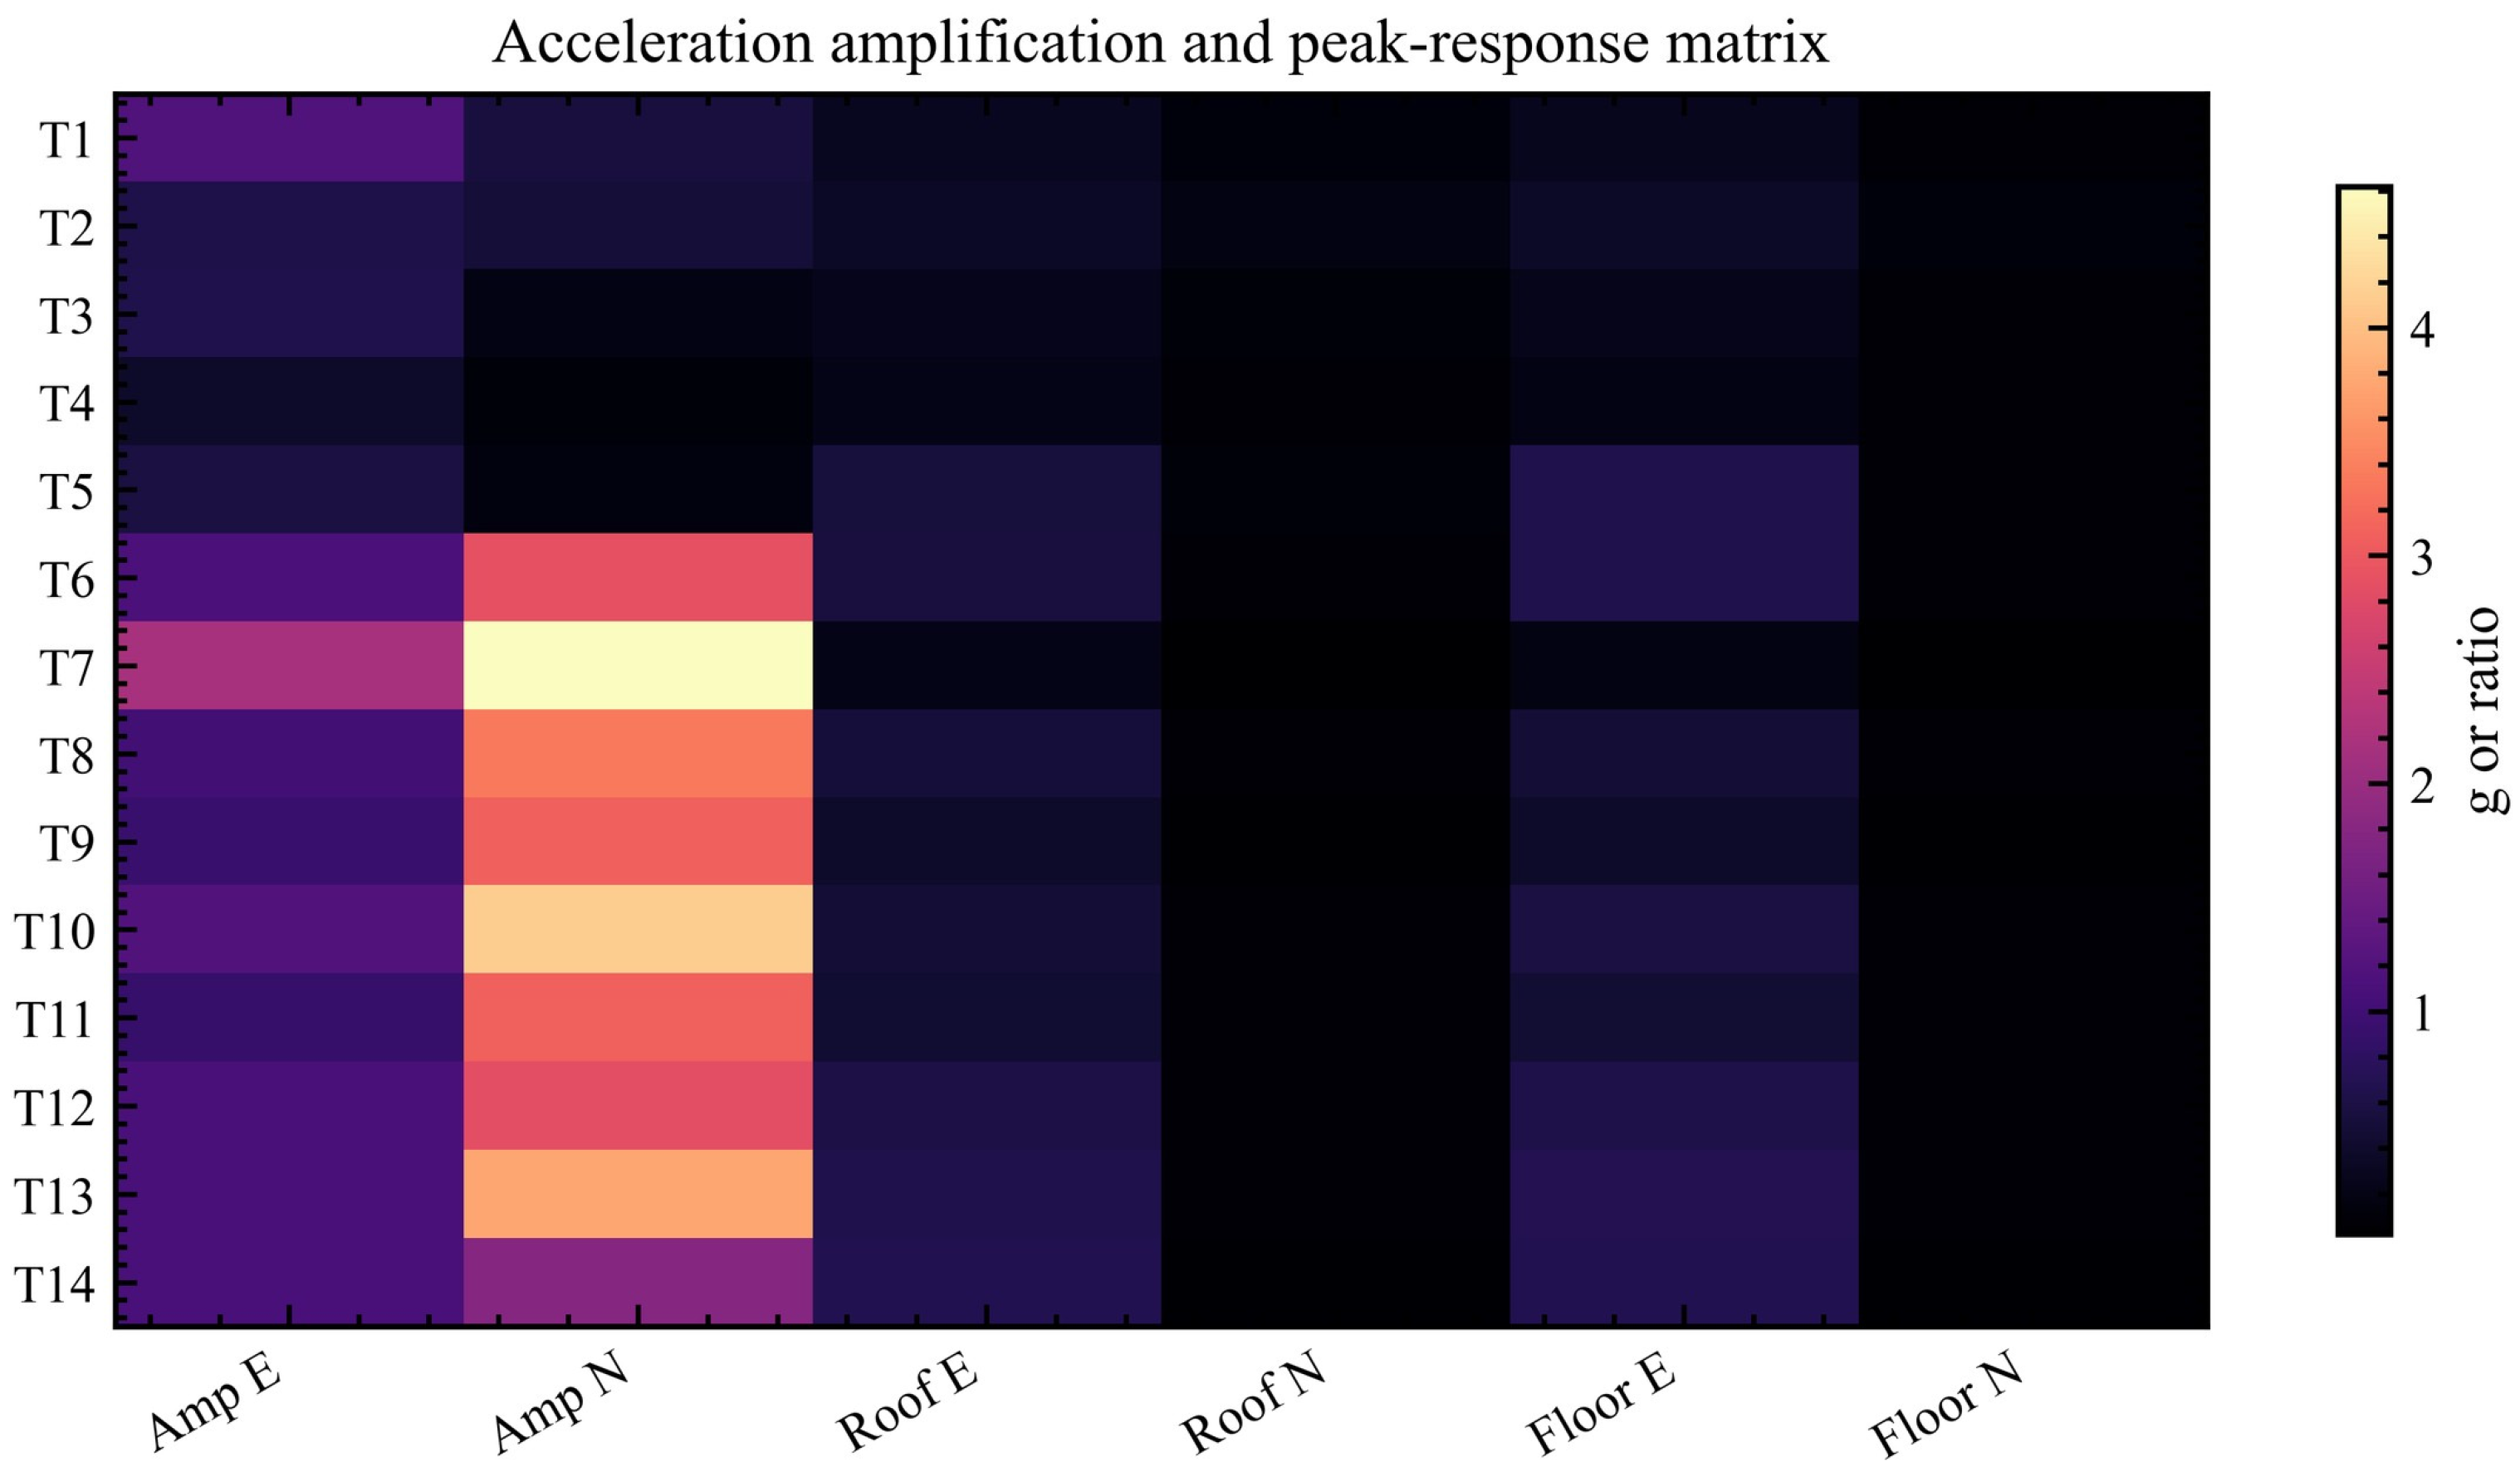
Figure 12 summarizes acceleration amplification and peak-response quantities as a heat-map matrix. The east–west roof acceleration reaches a maximum of about 0.683 g in Test 14, while the east–west floor acceleration reaches about 0.697 g in Test 13. In contrast, the north–south roof and floor accelerations remain much smaller in the later sequence because the input in that direction is weak. The roof-to-table amplification ratio varies from about 0.39 to 2.17 in the east–west direction and from about 0.11 to 4.62 in the north–south direction. The high north–south ratios are mainly caused by small input denominators, confirming that amplification ratios must be interpreted together with absolute acceleration levels.
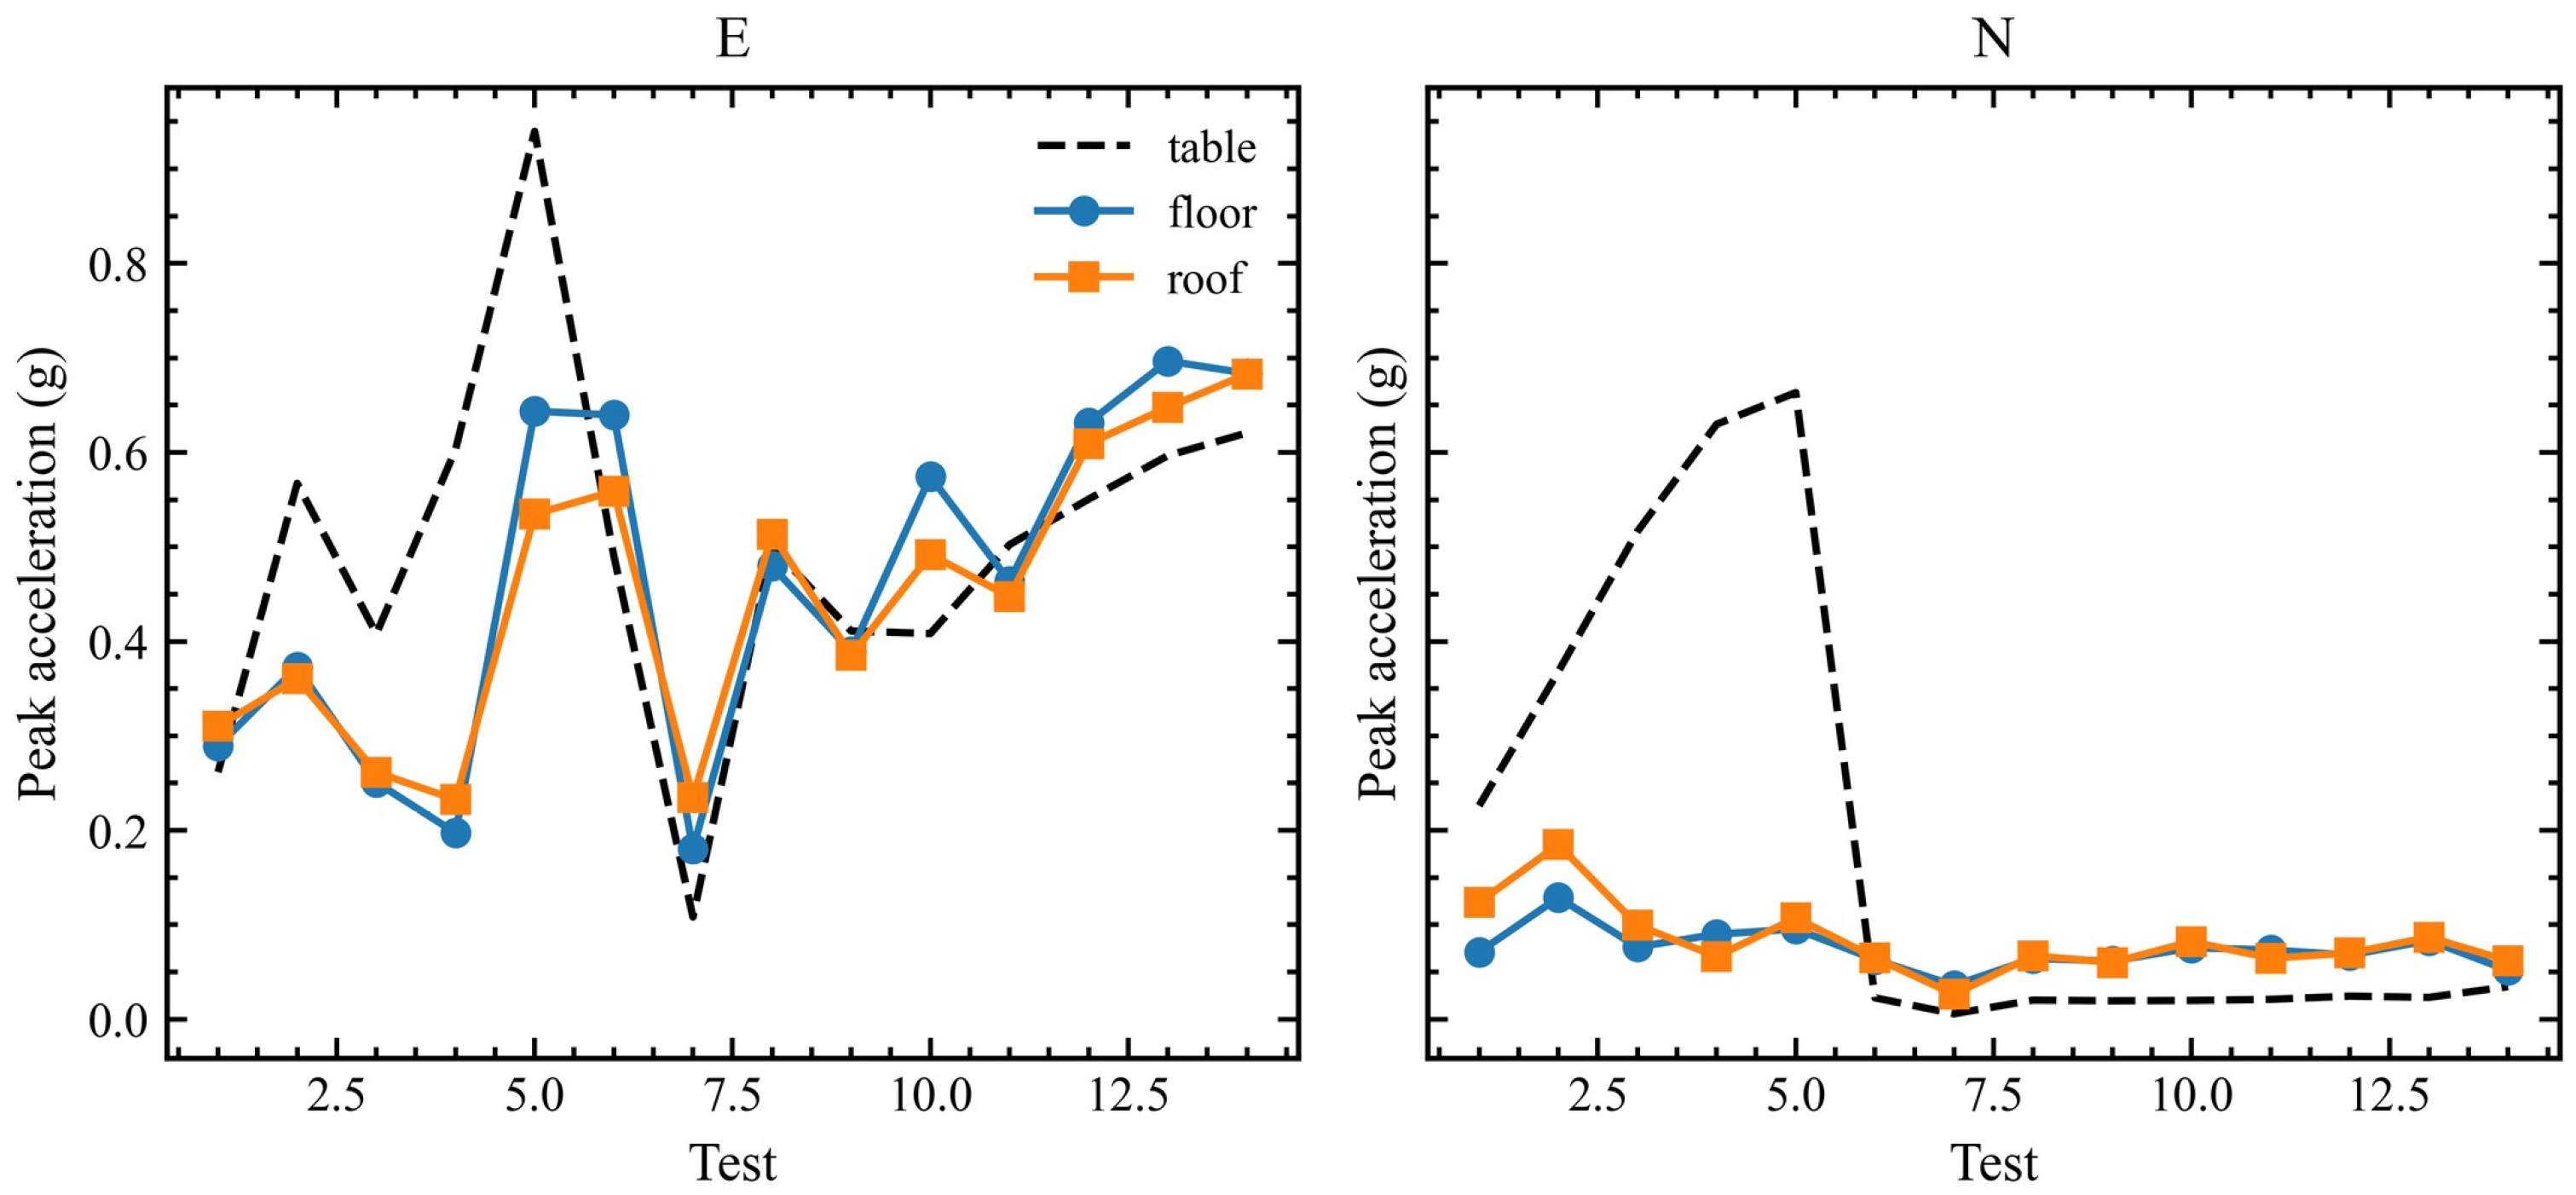
Figure 13 compares peak accelerations at the table, floor diaphragm, and roof diaphragm in both horizontal directions. In the east–west direction, the table PGA ranges from about 0.108 g to 0.940 g, while the roof acceleration ranges from about 0.233 g to 0.683 g. The floor acceleration follows a similar range, with a maximum of about 0.697 g. In the north–south direction, however, the table input becomes very small in later tests, whereas the roof and floor accelerations remain low, generally below about 0.09 g after Test 6. This figure shows that the building response is strongly directional and that resultant PGA alone cannot describe diaphragm acceleration demand.
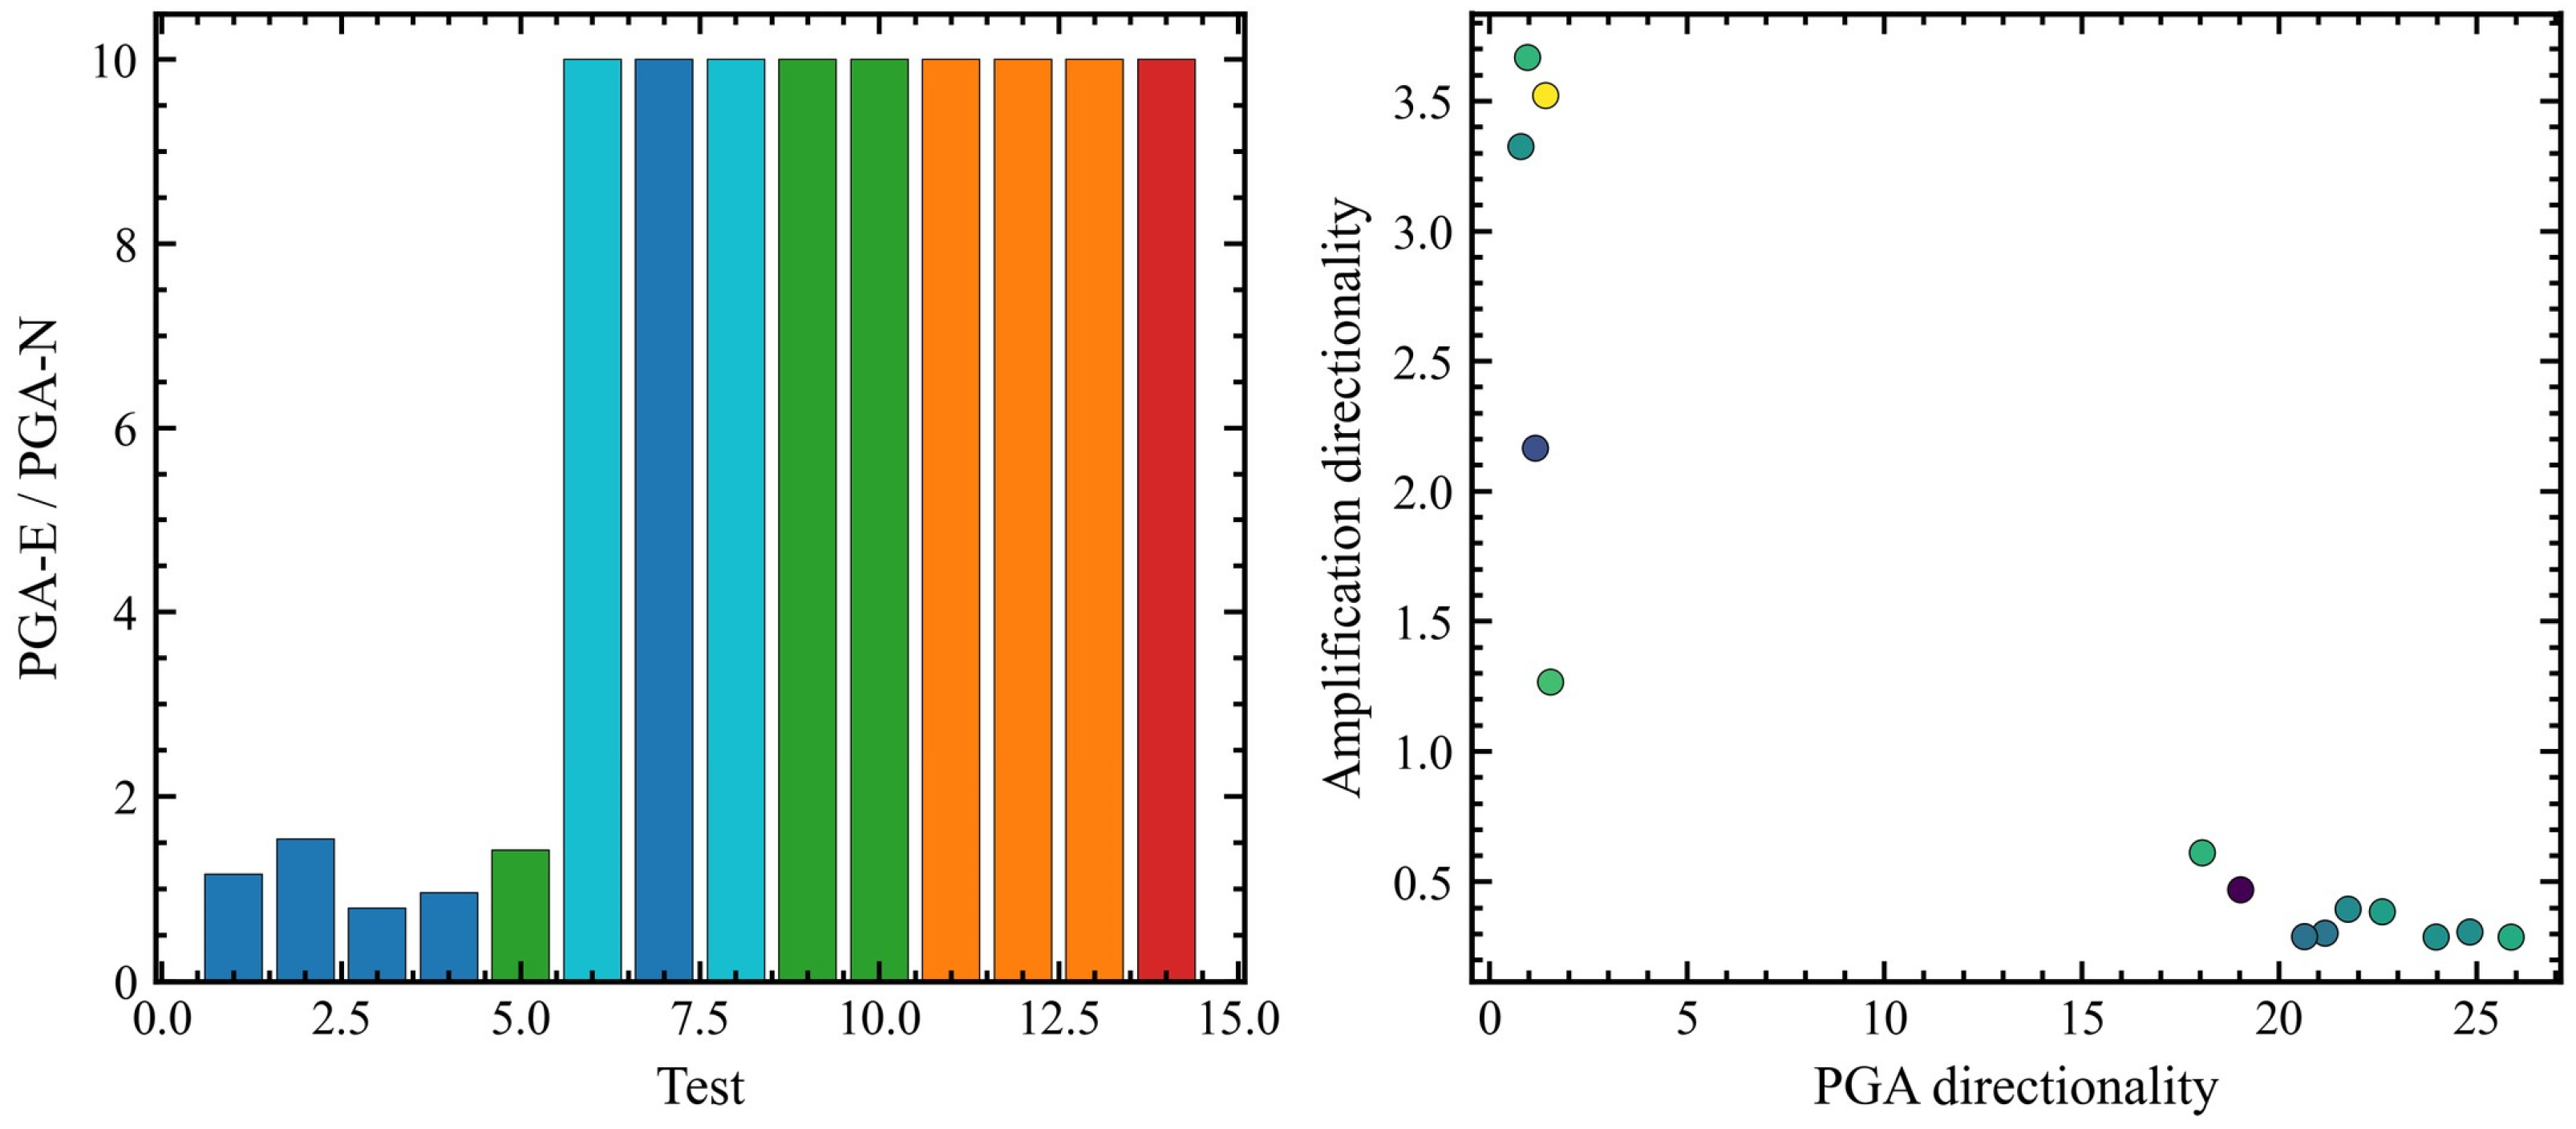
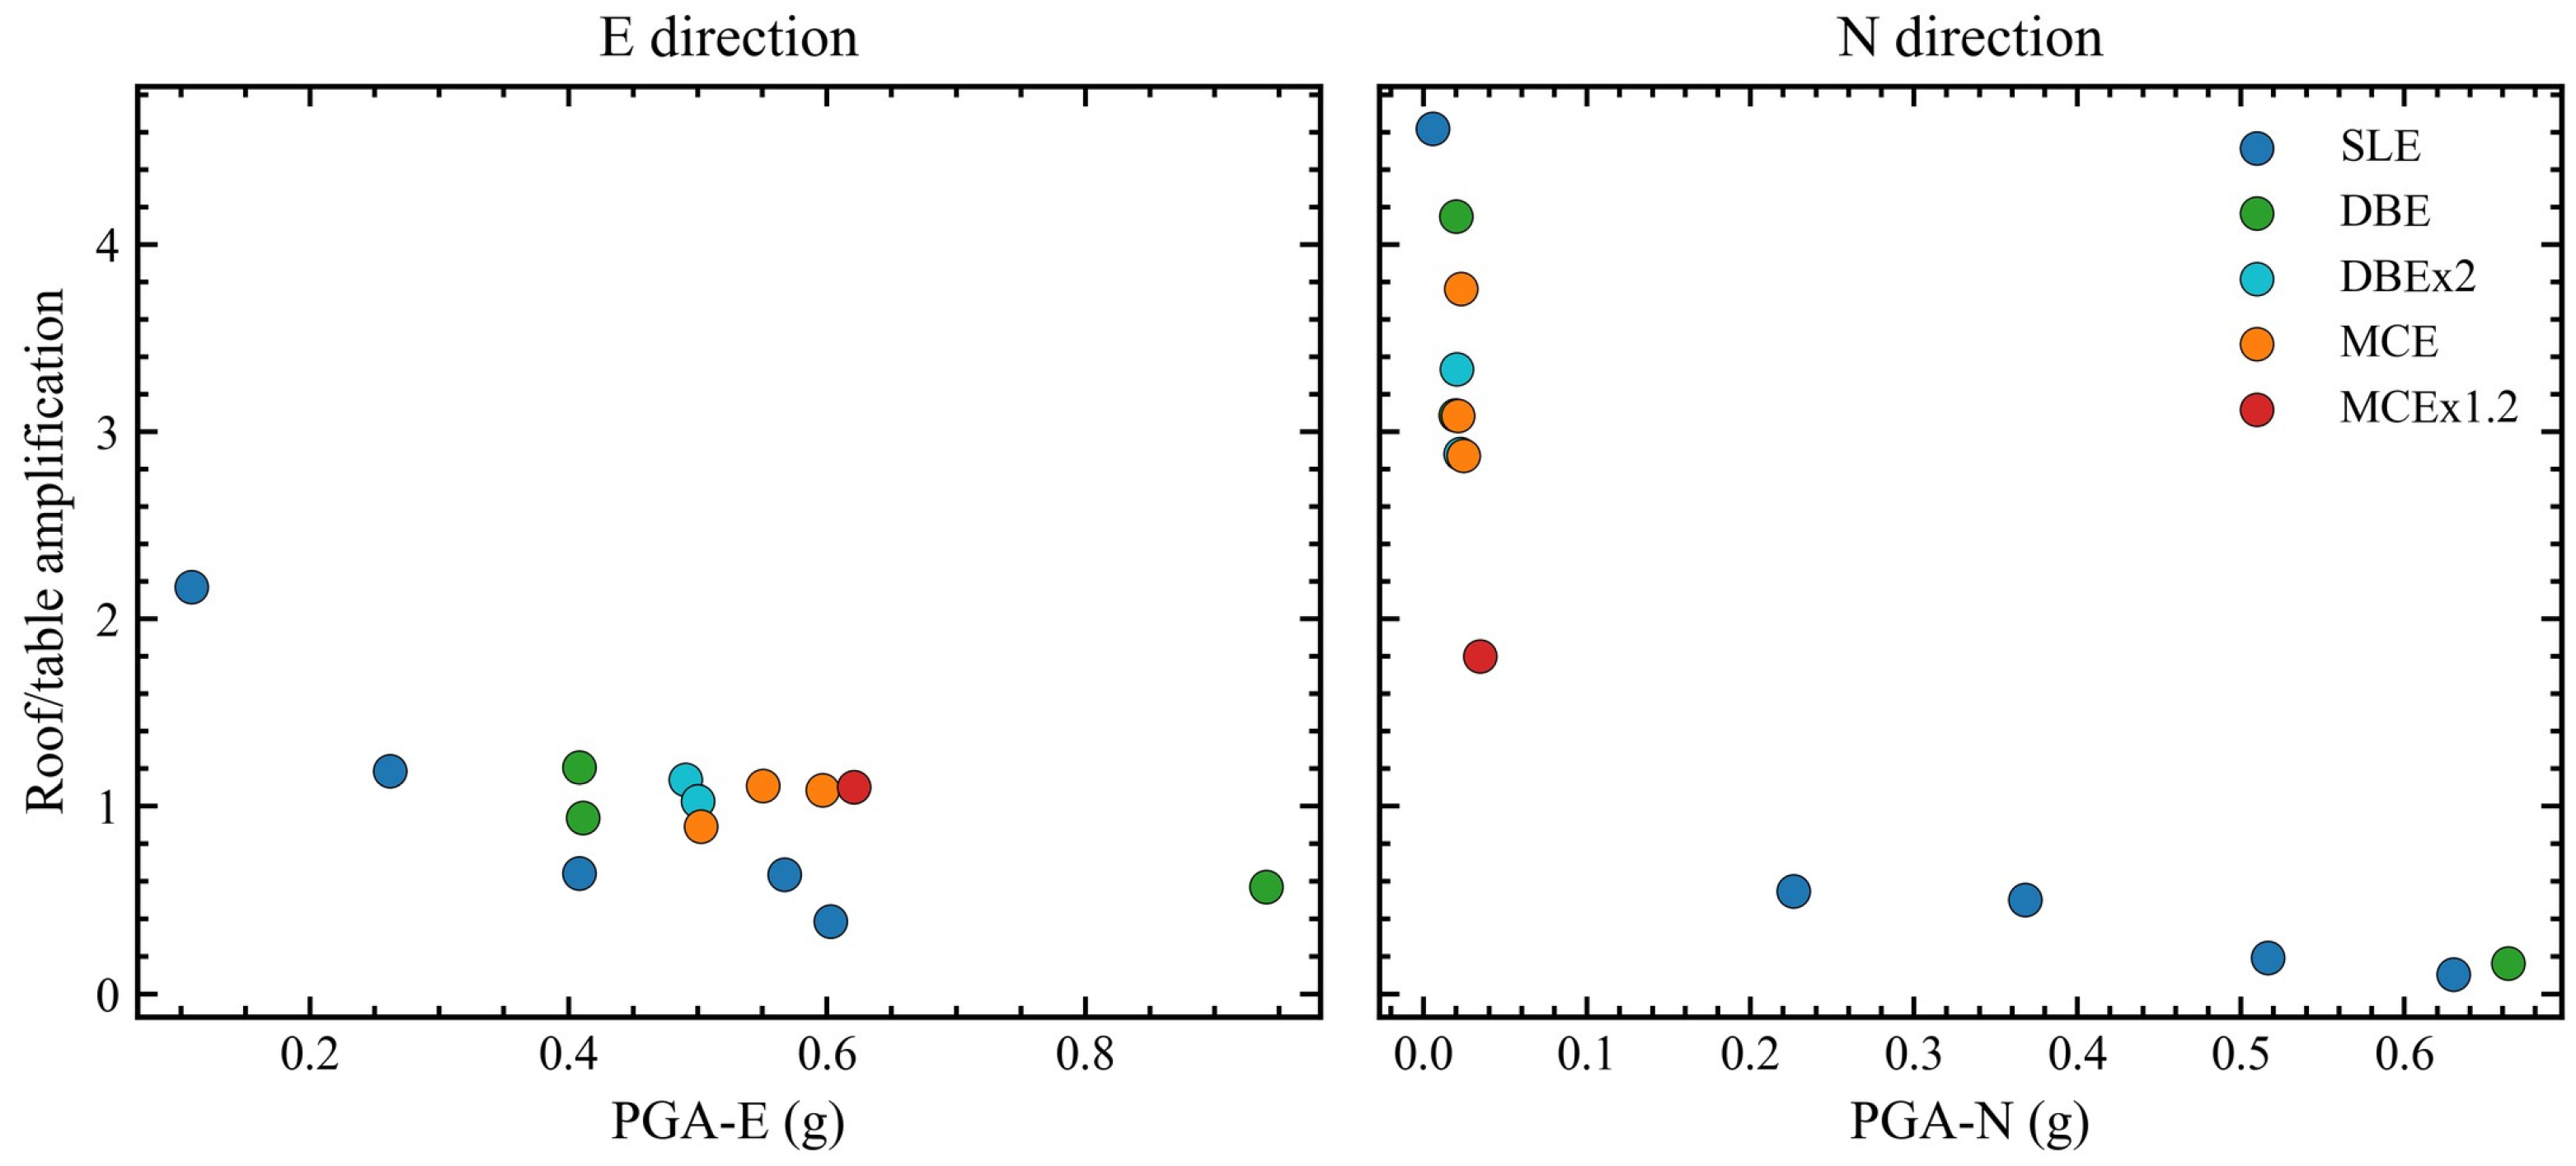
Figure 14 plots roof-to-table acceleration amplification against directional table PGA. The relation is clearly nonmonotonic. In the east–west direction, the largest amplification of about 2.17 occurs in Test 7, where the input PGA is only about 0.108 g, while stronger input cases with east–west PGA around 0.50 g to 0.62 g generally show amplification close to 0.89 to 1.20. In the north–south direction, amplification can exceed 3.0 when the input PGA is only about 0.02 g. This demonstrates that a large amplification ratio does not necessarily mean severe structural amplification; it may result from weak directional input and must be checked against absolute response and coherence.
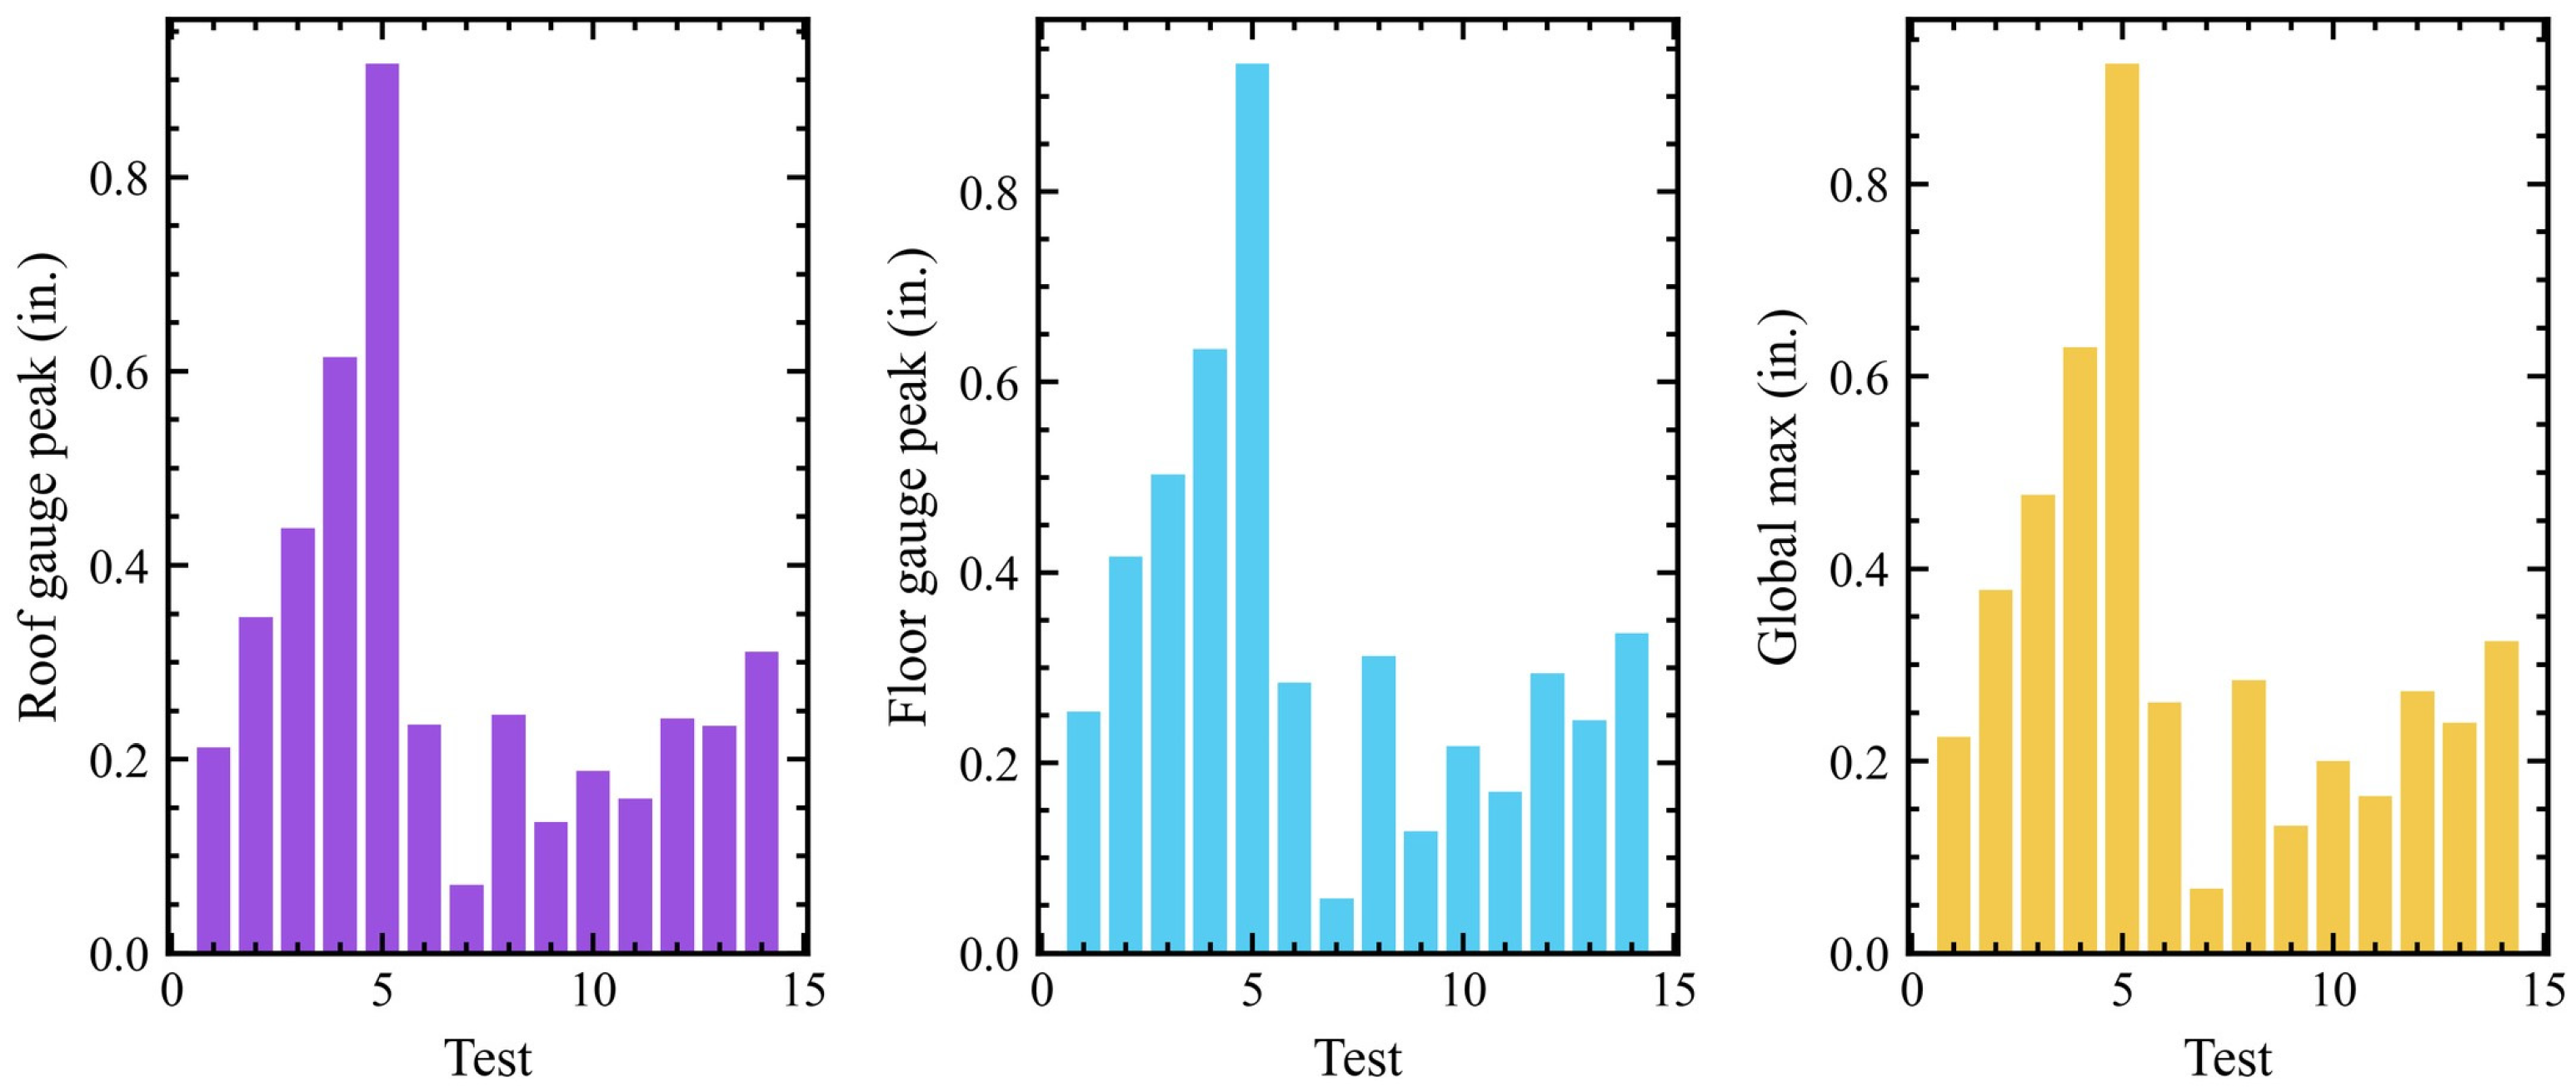
Figure 15 presents the instrumented displacement envelopes derived from selected linear and string potentiometer channels. The global peak deformation ranges from about 0.067 in. in Test 7 to about 0.925 in. in Test 5. The largest roof and floor channel peaks also occur in Test 5, reaching approximately 0.917 in. and 0.935 in., respectively. Later maximum-level events do not produce the largest displacement envelope; for example, Test 14 has a peak value of about 0.324 in. This nonmonotonic behavior indicates that deformation demand depends on input directionality, diaphragm-wall compatibility, and prior state change, not simply on nominal intensity level.
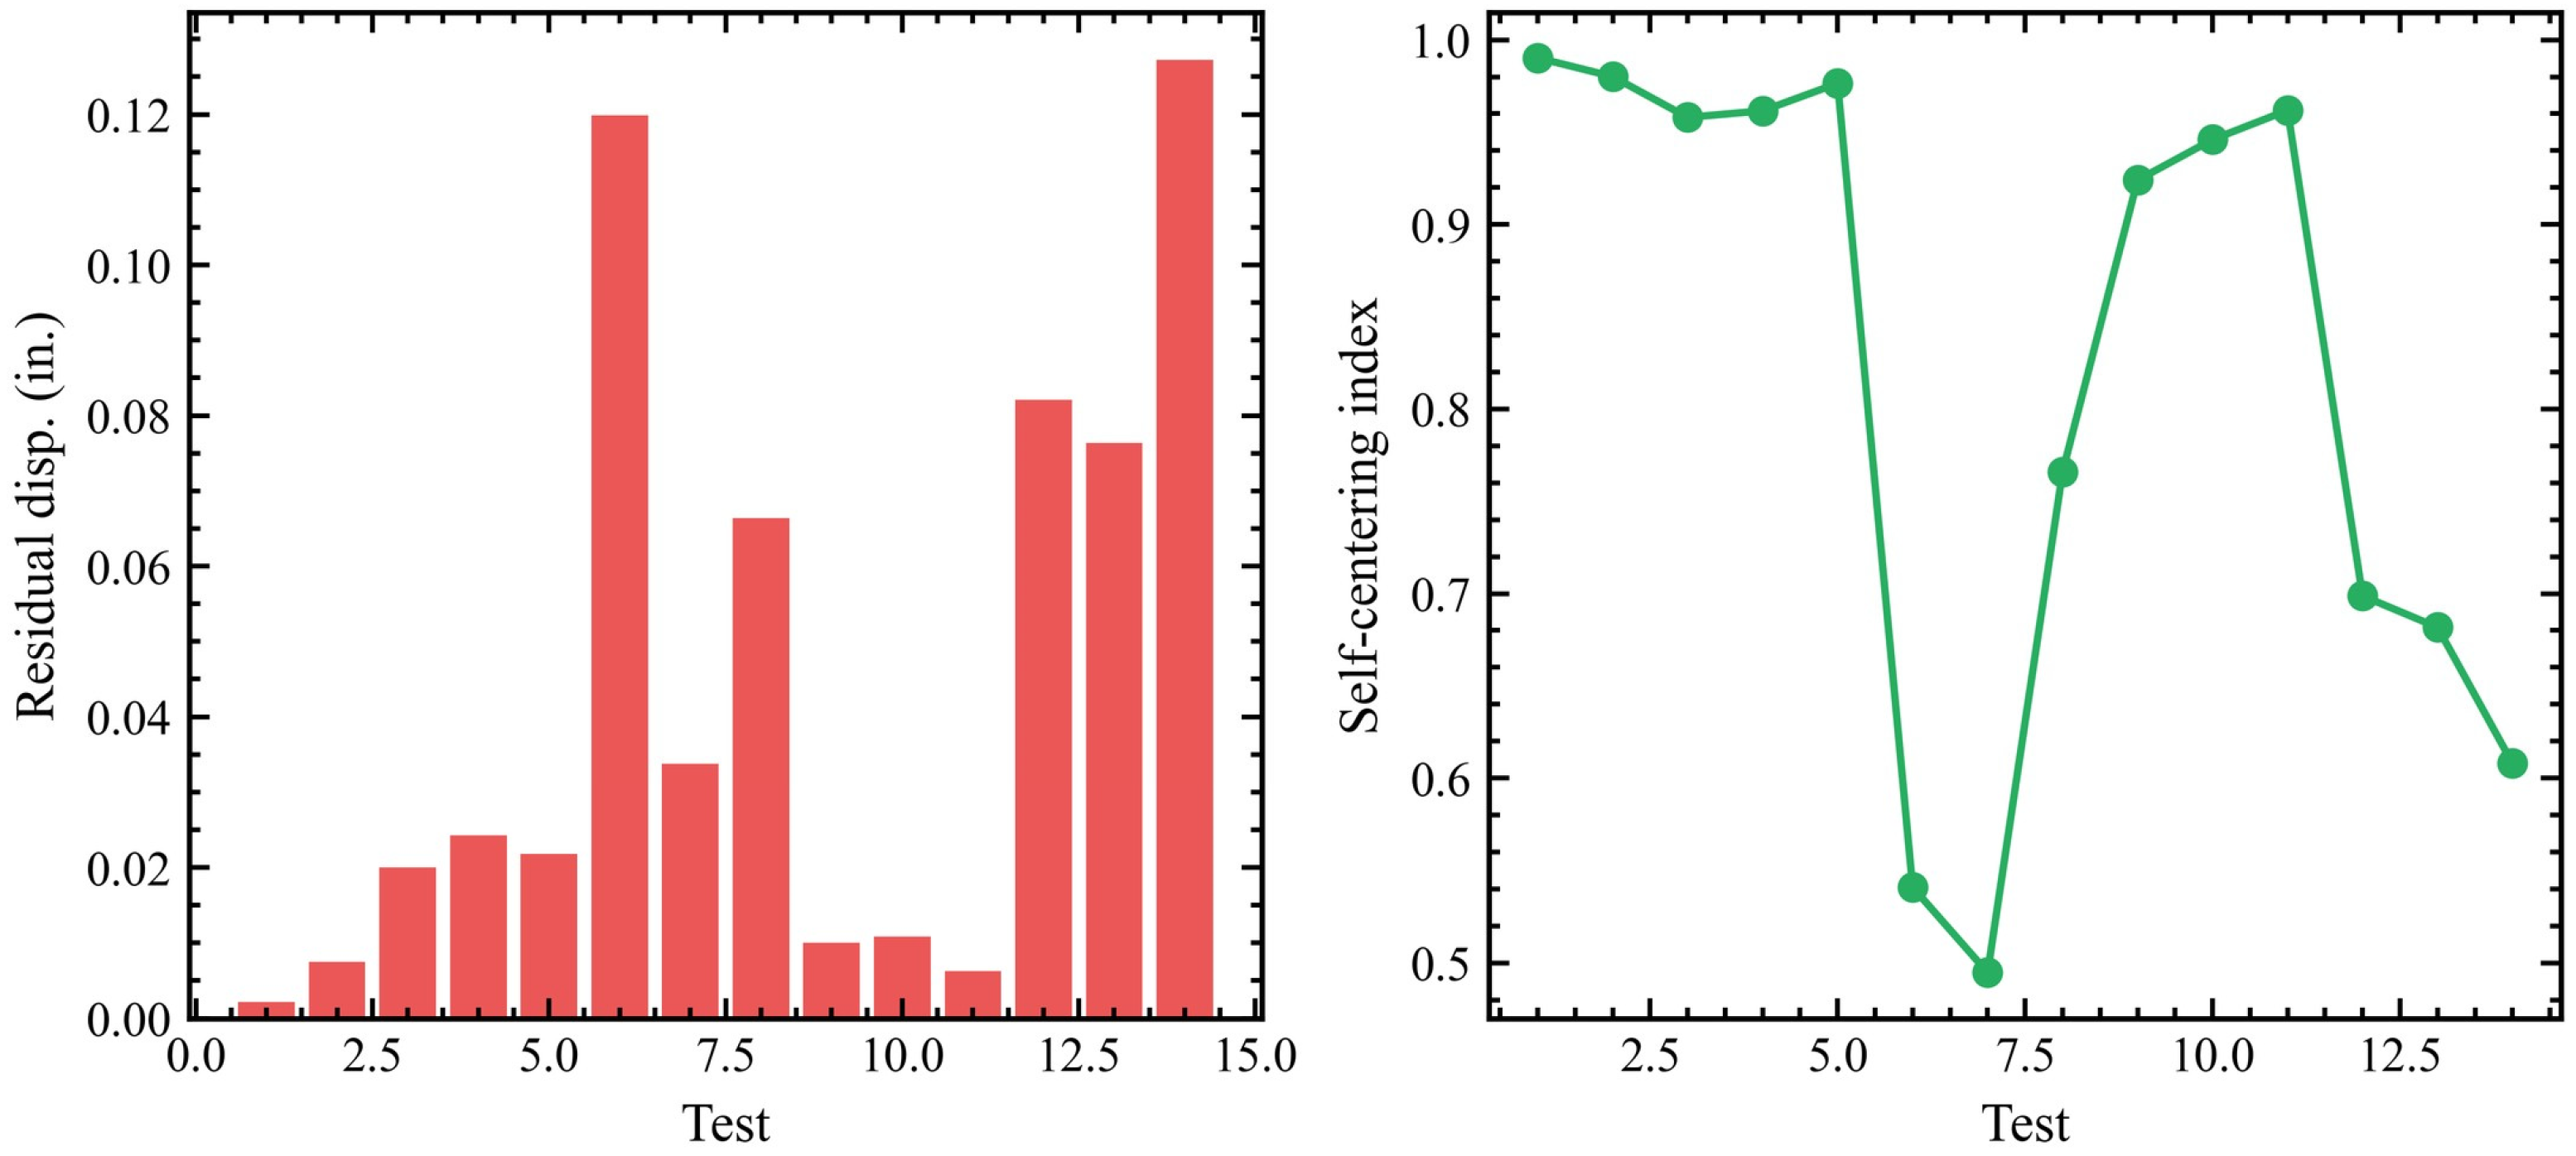
Figure 16 describes residual deformation and self-centering performance. The residual deformation remains small in absolute terms, ranging from approximately 0.002 in. in Test 1 to about 0.127 in. in Test 14. The self-centering index is close to unity in the early tests, with values of about 0.990, 0.980, and 0.958 in Tests 1 to 3. It decreases in some later records, reaching about 0.541 in Test 6, 0.495 in Test 7, and 0.608 in Test 14. These results show that significant modal softening can occur while residual deformation remains limited, which is consistent with a low-damage rocking mechanism rather than a conventional cumulative plastic-damage mechanism.
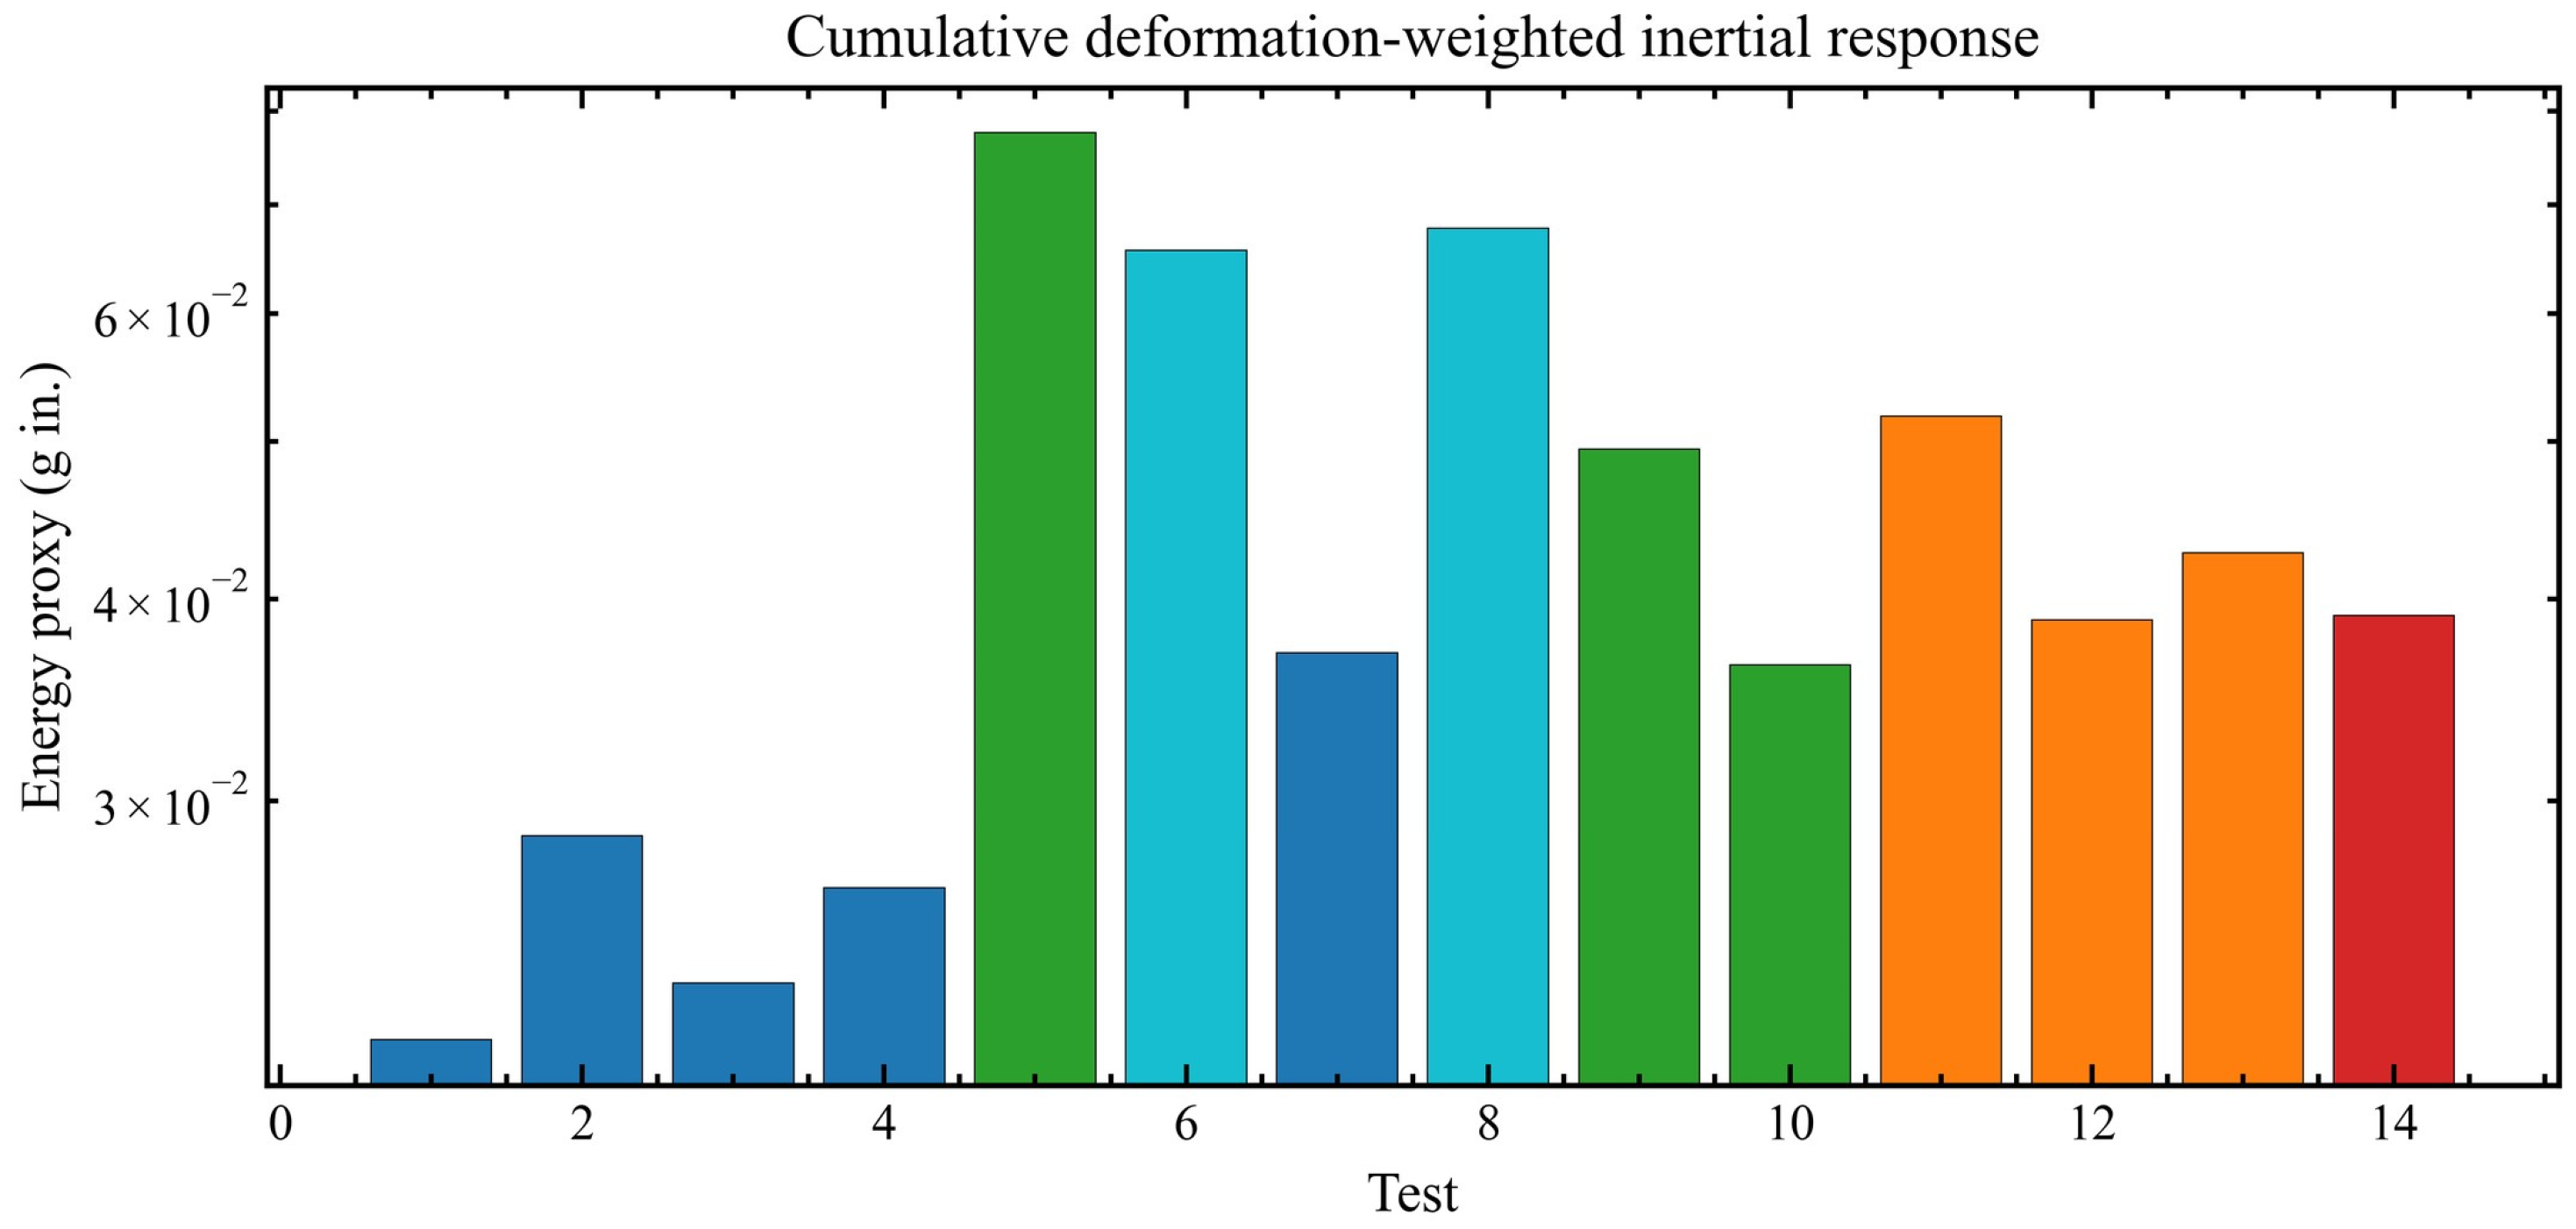
Figure 17 gives the deformation-weighted inertial-response proxy. The proxy reaches its largest value in Test 5, approximately 0.0776 g·in., followed by Tests 8 and 6 with values of about 0.0677 g·in. and 0.0656 g·in., respectively. The final 1.2MCE test has a smaller value of about 0.0391 g·in., even though it represents the largest nominal intensity level. This shows that the most demanding event in terms of simultaneous acceleration and deformation-rate interaction is not necessarily the final event. The energy proxy therefore provides complementary information to PGA and peak displacement.
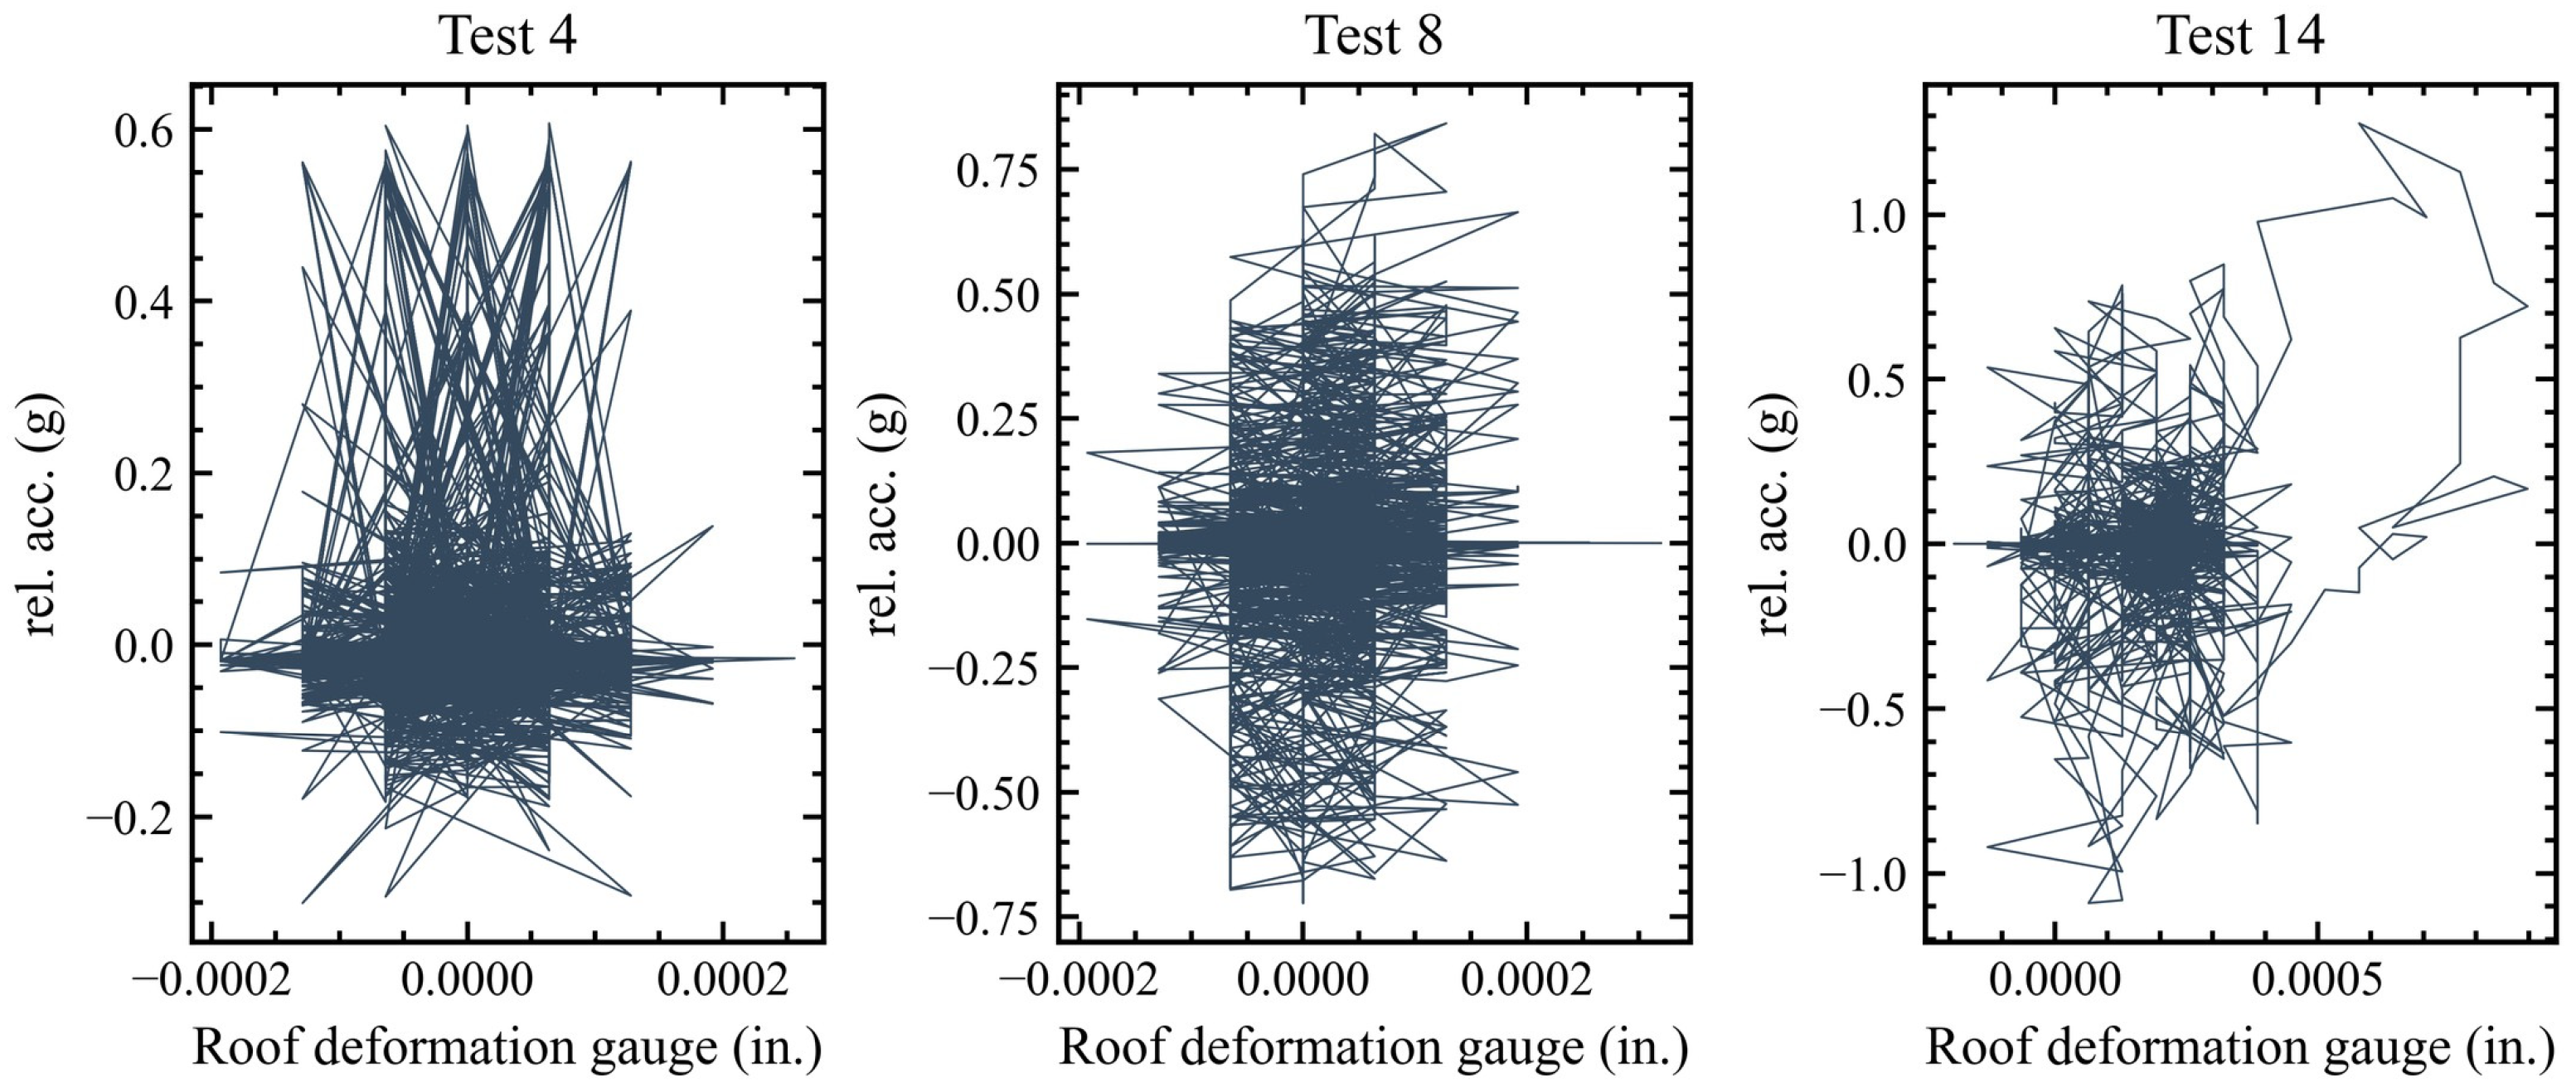
Figure 18 shows proxy acceleration-deformation loops for selected events. Test 4 has a peak deformation of about 0.630 in. and a residual deformation of about 0.024 in., while Test 8 has a smaller peak deformation of about 0.284 in. but a larger residual deformation of about 0.066 in. Test 14 has a peak deformation of about 0.324 in. and the largest residual deformation of about 0.127 in. The loop patterns become more irregular after stronger shaking, indicating that the relation between inertial response and deformation is affected by changing contact, recentering force, and interface conditions. These loops support the interpretation that the system evolves through path-dependent rocking states.
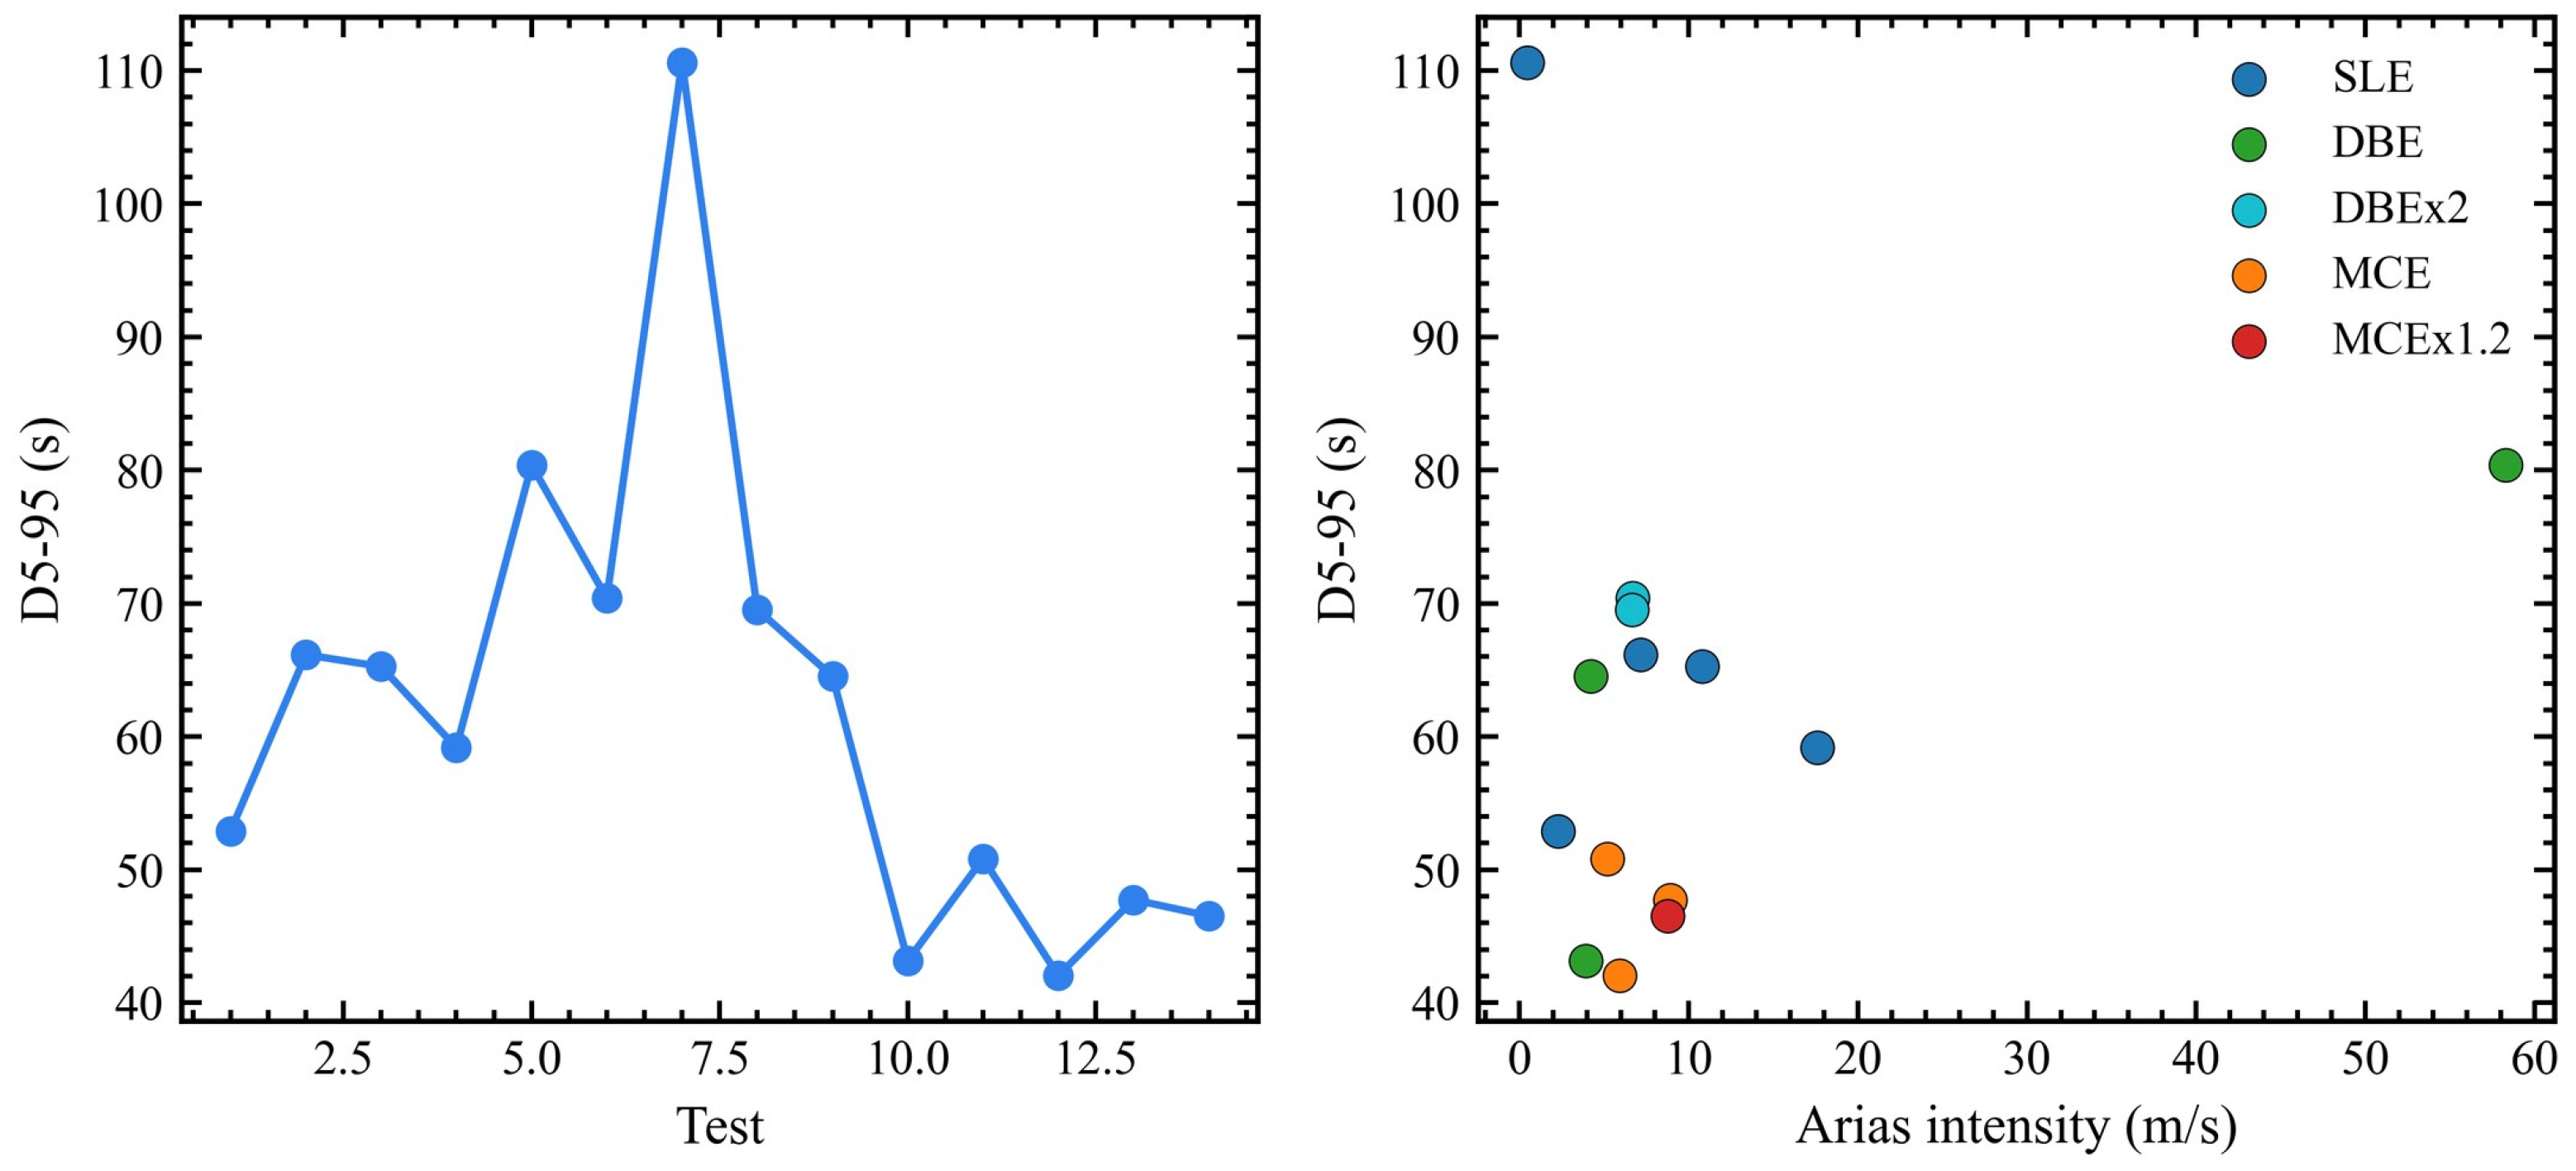
Figure 19 evaluates significant duration and its relation to Arias intensity. Significant duration varies from about 42.0 s in Test 12 to about 110.6 s in Test 7. Test 7 is especially informative because it has the longest duration but very small resultant PGA and Arias intensity, whereas Test 5 has the largest Arias intensity of about 58.28 m/s and a significant duration of about 80.4 s. This contrast shows that duration and cumulative shaking cannot be inferred from PGA alone. Duration-related descriptors are therefore needed to distinguish long low-amplitude records from shorter high-energy records.
Figure 20 summarizes directional coupling using input directionality and roof amplification directionality. The PGA directionality ratio changes from near-balanced values in the early tests to extremely east–west-dominant values in later records. For example, the east–west to north–south PGA ratio is about 1.16 in Test 1, but increases to approximately 21.74 in Test 6, 24.83 in Test 8, and 25.87 in Test 13. These values explain why several north–south amplification ratios appear large despite low absolute north–south acceleration. The figure therefore confirms that directionality is essential for interpreting both spectral and time-domain response.
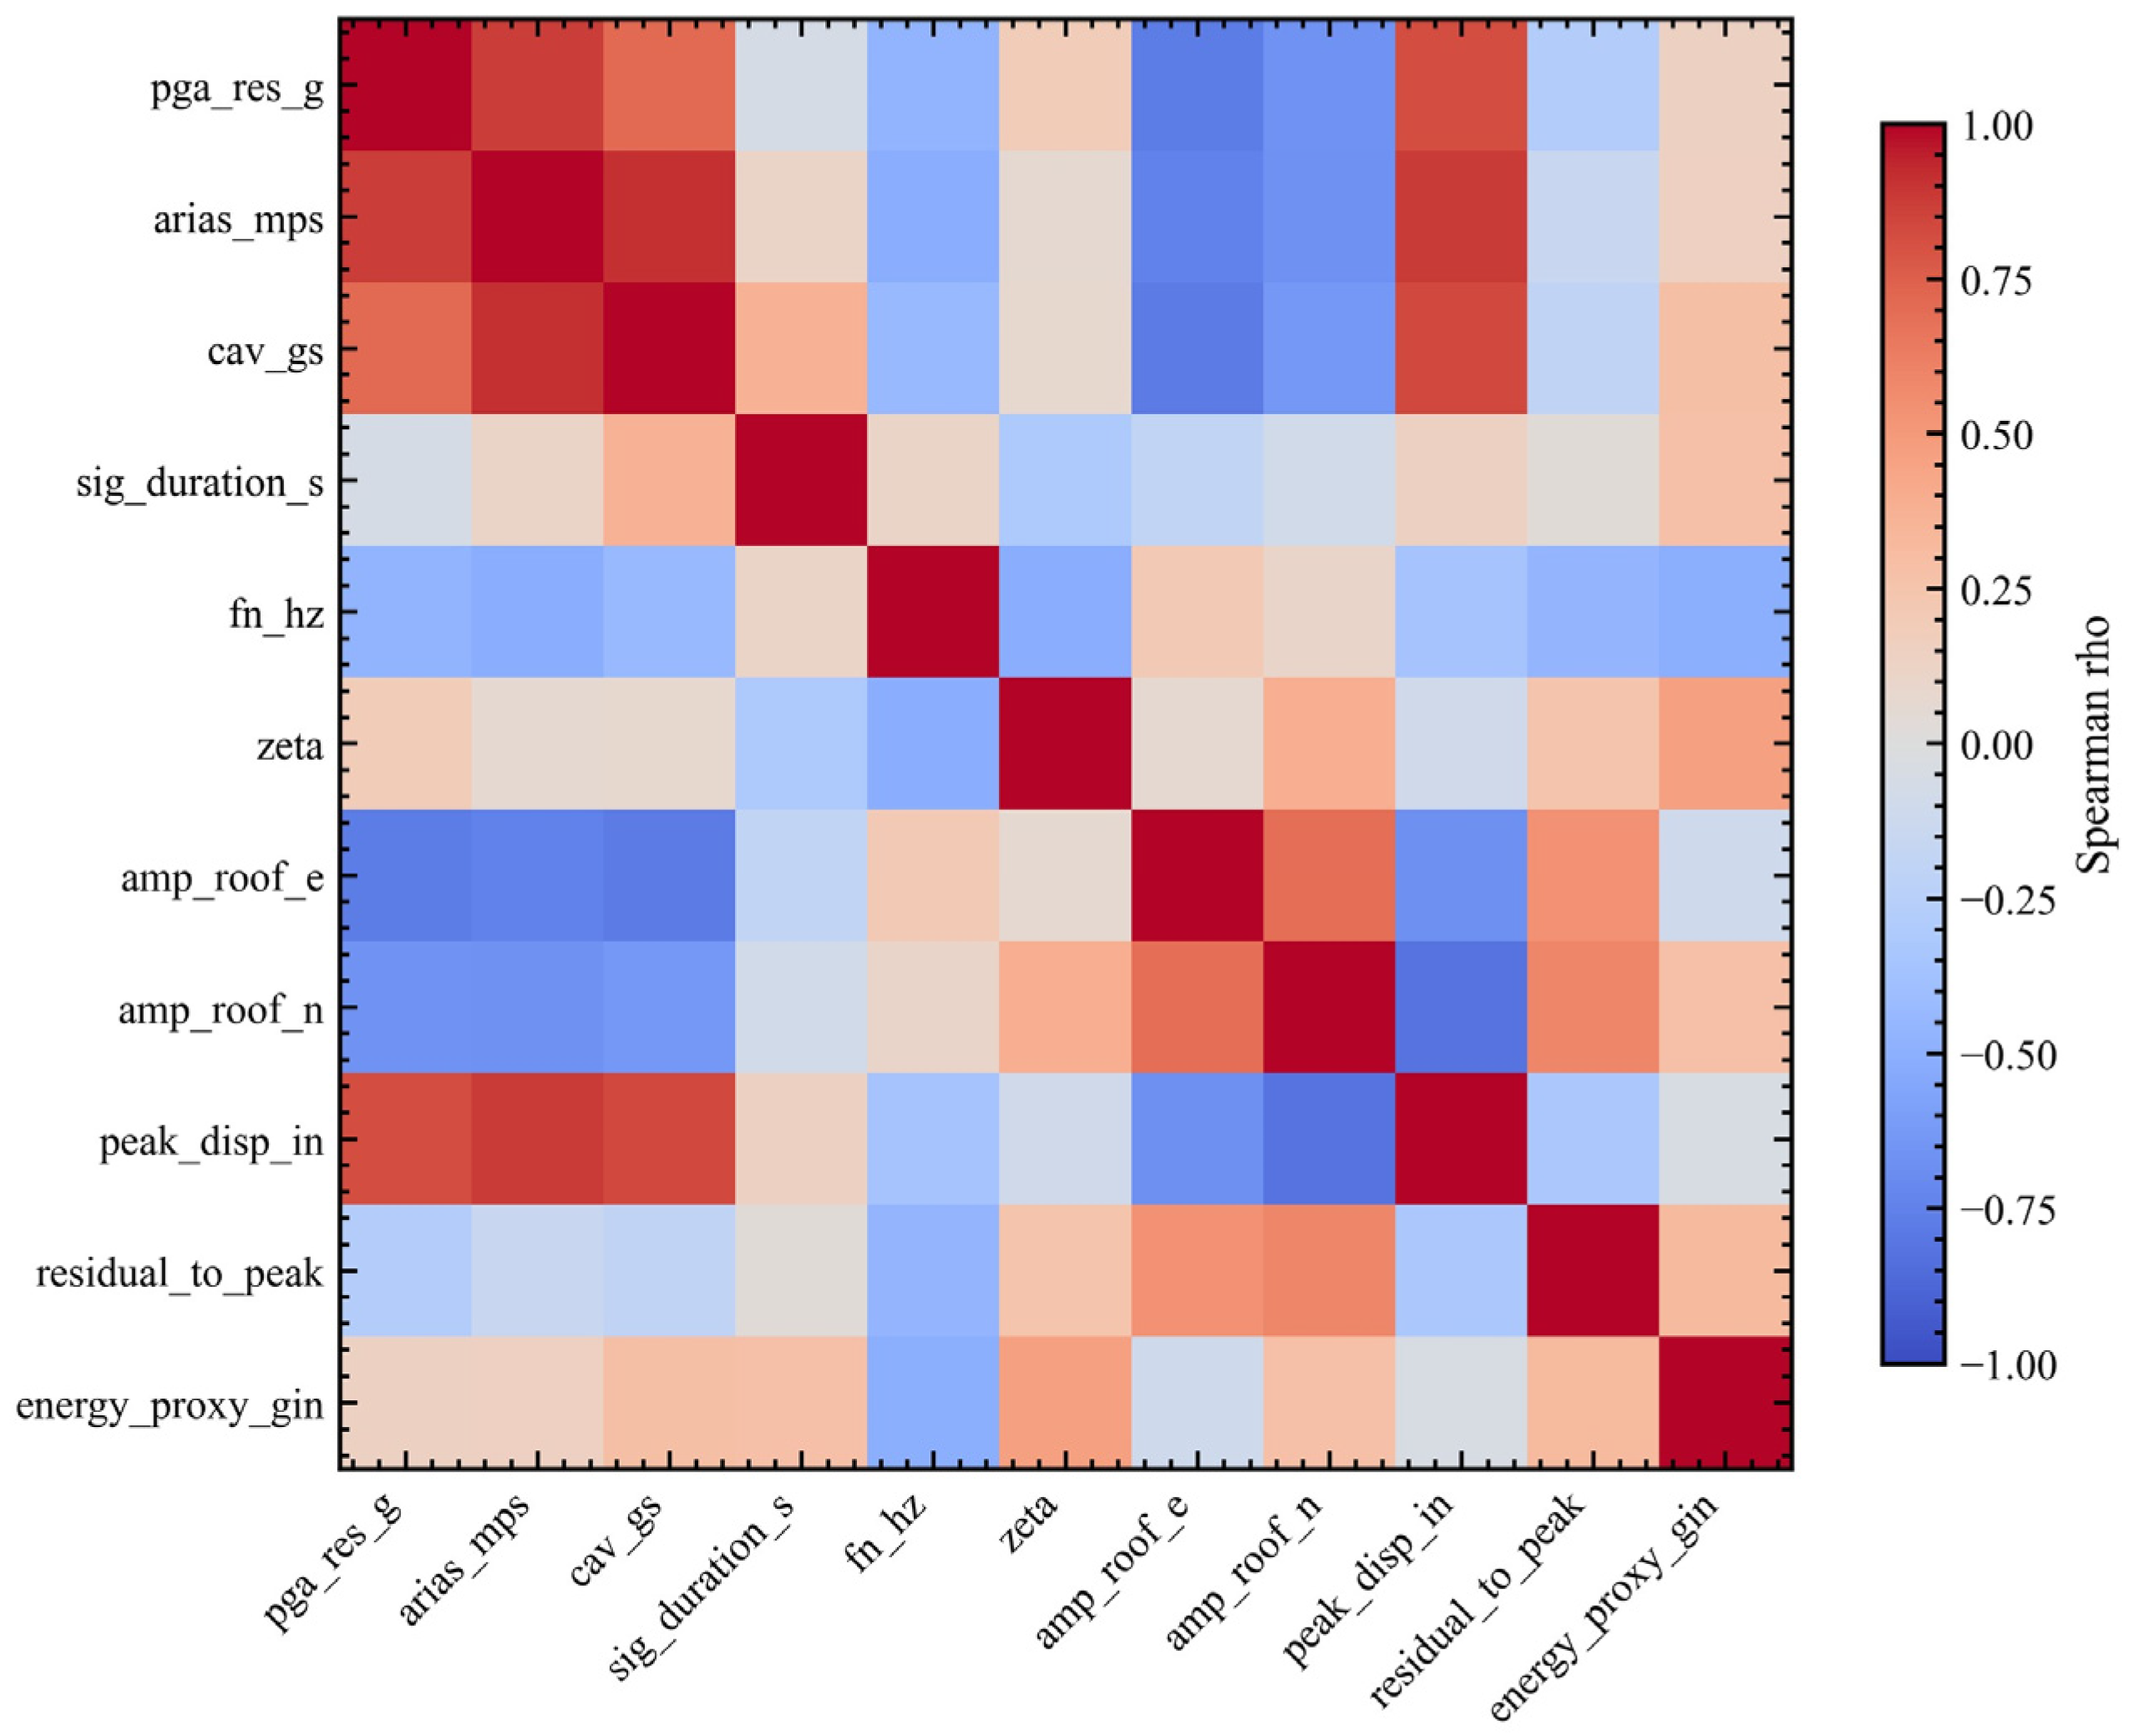
Figure 21 presents the descriptor correlation matrix. The intensity-related descriptors are strongly correlated; the Spearman correlation between resultant PGA and Arias intensity is about 0.87, and the correlation between Arias intensity and CAV is about 0.91. Peak displacement is also strongly correlated with Arias intensity and CAV, with correlations of about 0.88 and 0.83, respectively. In contrast, dominant frequency is negatively correlated with Arias intensity and energy proxy, with approximate correlations of minus 0.51 and minus 0.50. The residual-to-peak ratio retains partly independent information, showing that stiffness degradation, peak response, and recentering cannot be reduced to a single PGA-based descriptor.
This correlation structure provides quantitative support for retaining multiple descriptors. Although PGA, Arias intensity, CAV, and peak displacement show strong associations, the modal-frequency and residual-response quantities retain partly independent information. The descriptor set is therefore used diagnostically, not to claim that any new index universally outperforms conventional indicators.
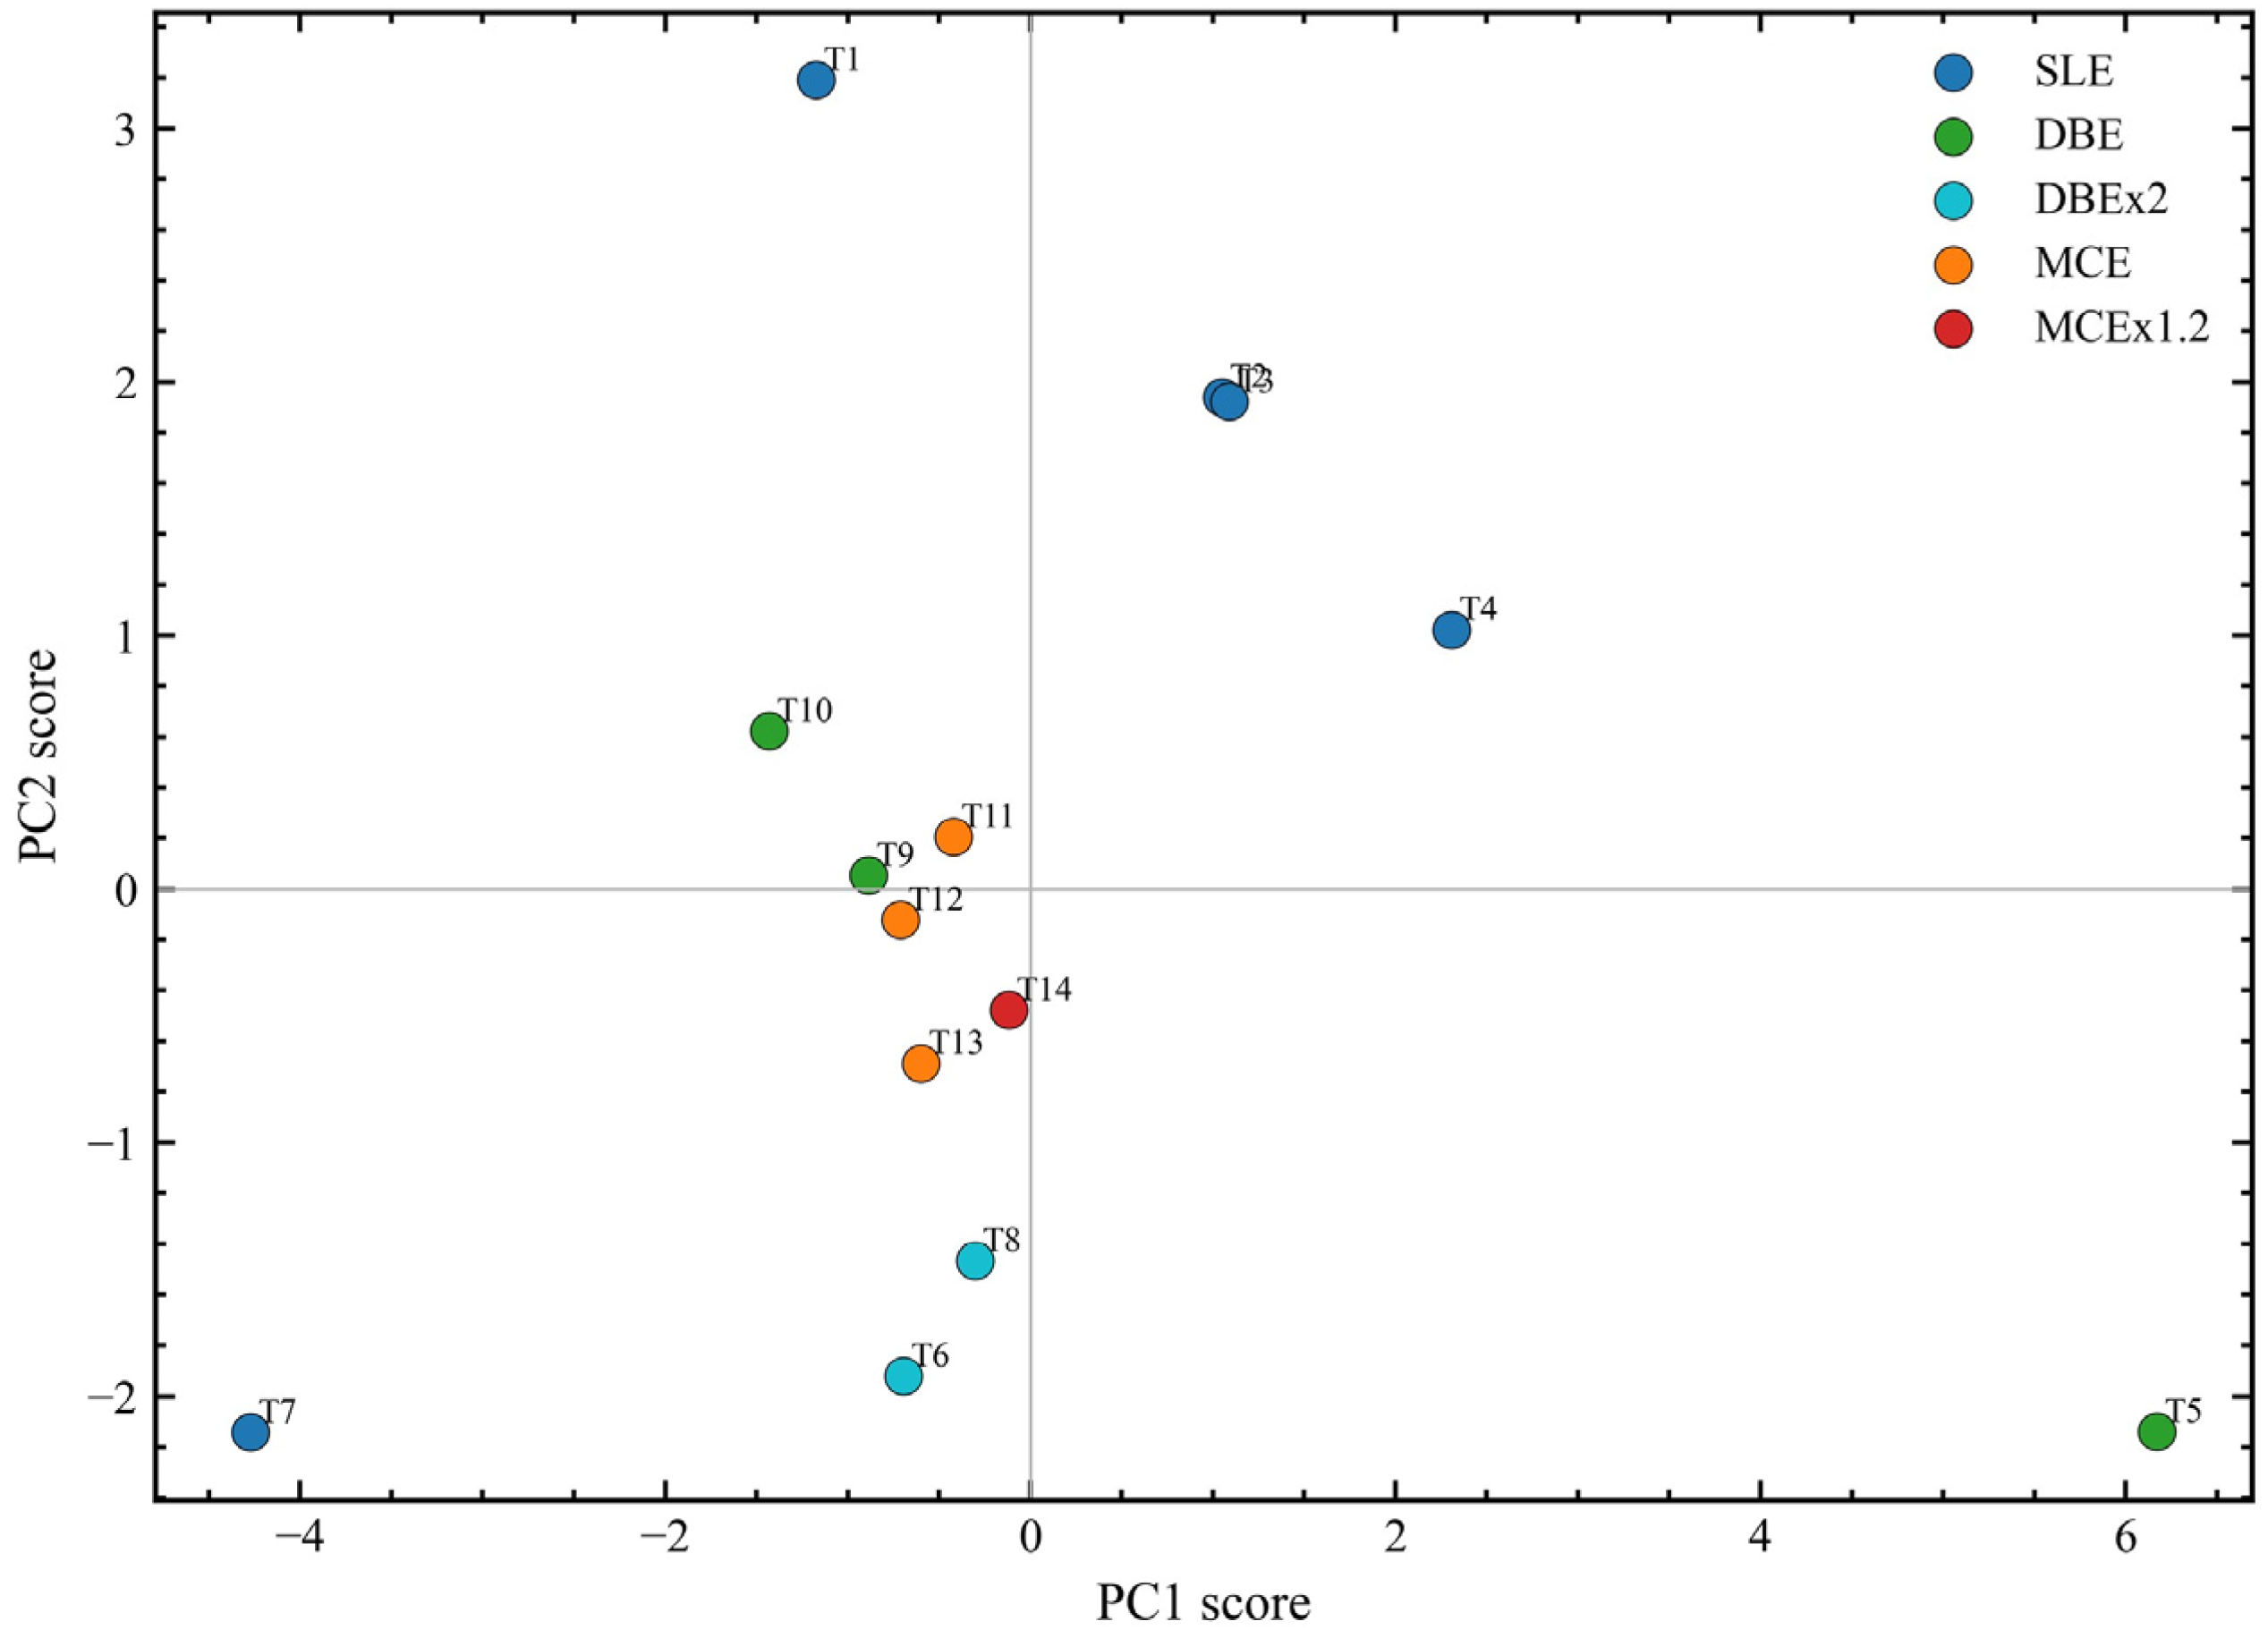
Figure 22 gives the low-dimensional descriptor map obtained from standardized physical descriptors. The map separates the tests according to their combined dynamic and deformation characteristics rather than by nominal intensity alone. Test 5 appears as a distinct high-demand state because it combines the largest resultant PGA, Arias intensity, CAV, and peak deformation. Test 7 is also separated, but for a different reason: it has weak input intensity and long duration after prior strong shaking. The high-intensity MCE and 1.2MCE records cluster in a softened-state region, indicating that the structural state after repeated shaking differs from the initial low-level response even when some peak response quantities are moderate.
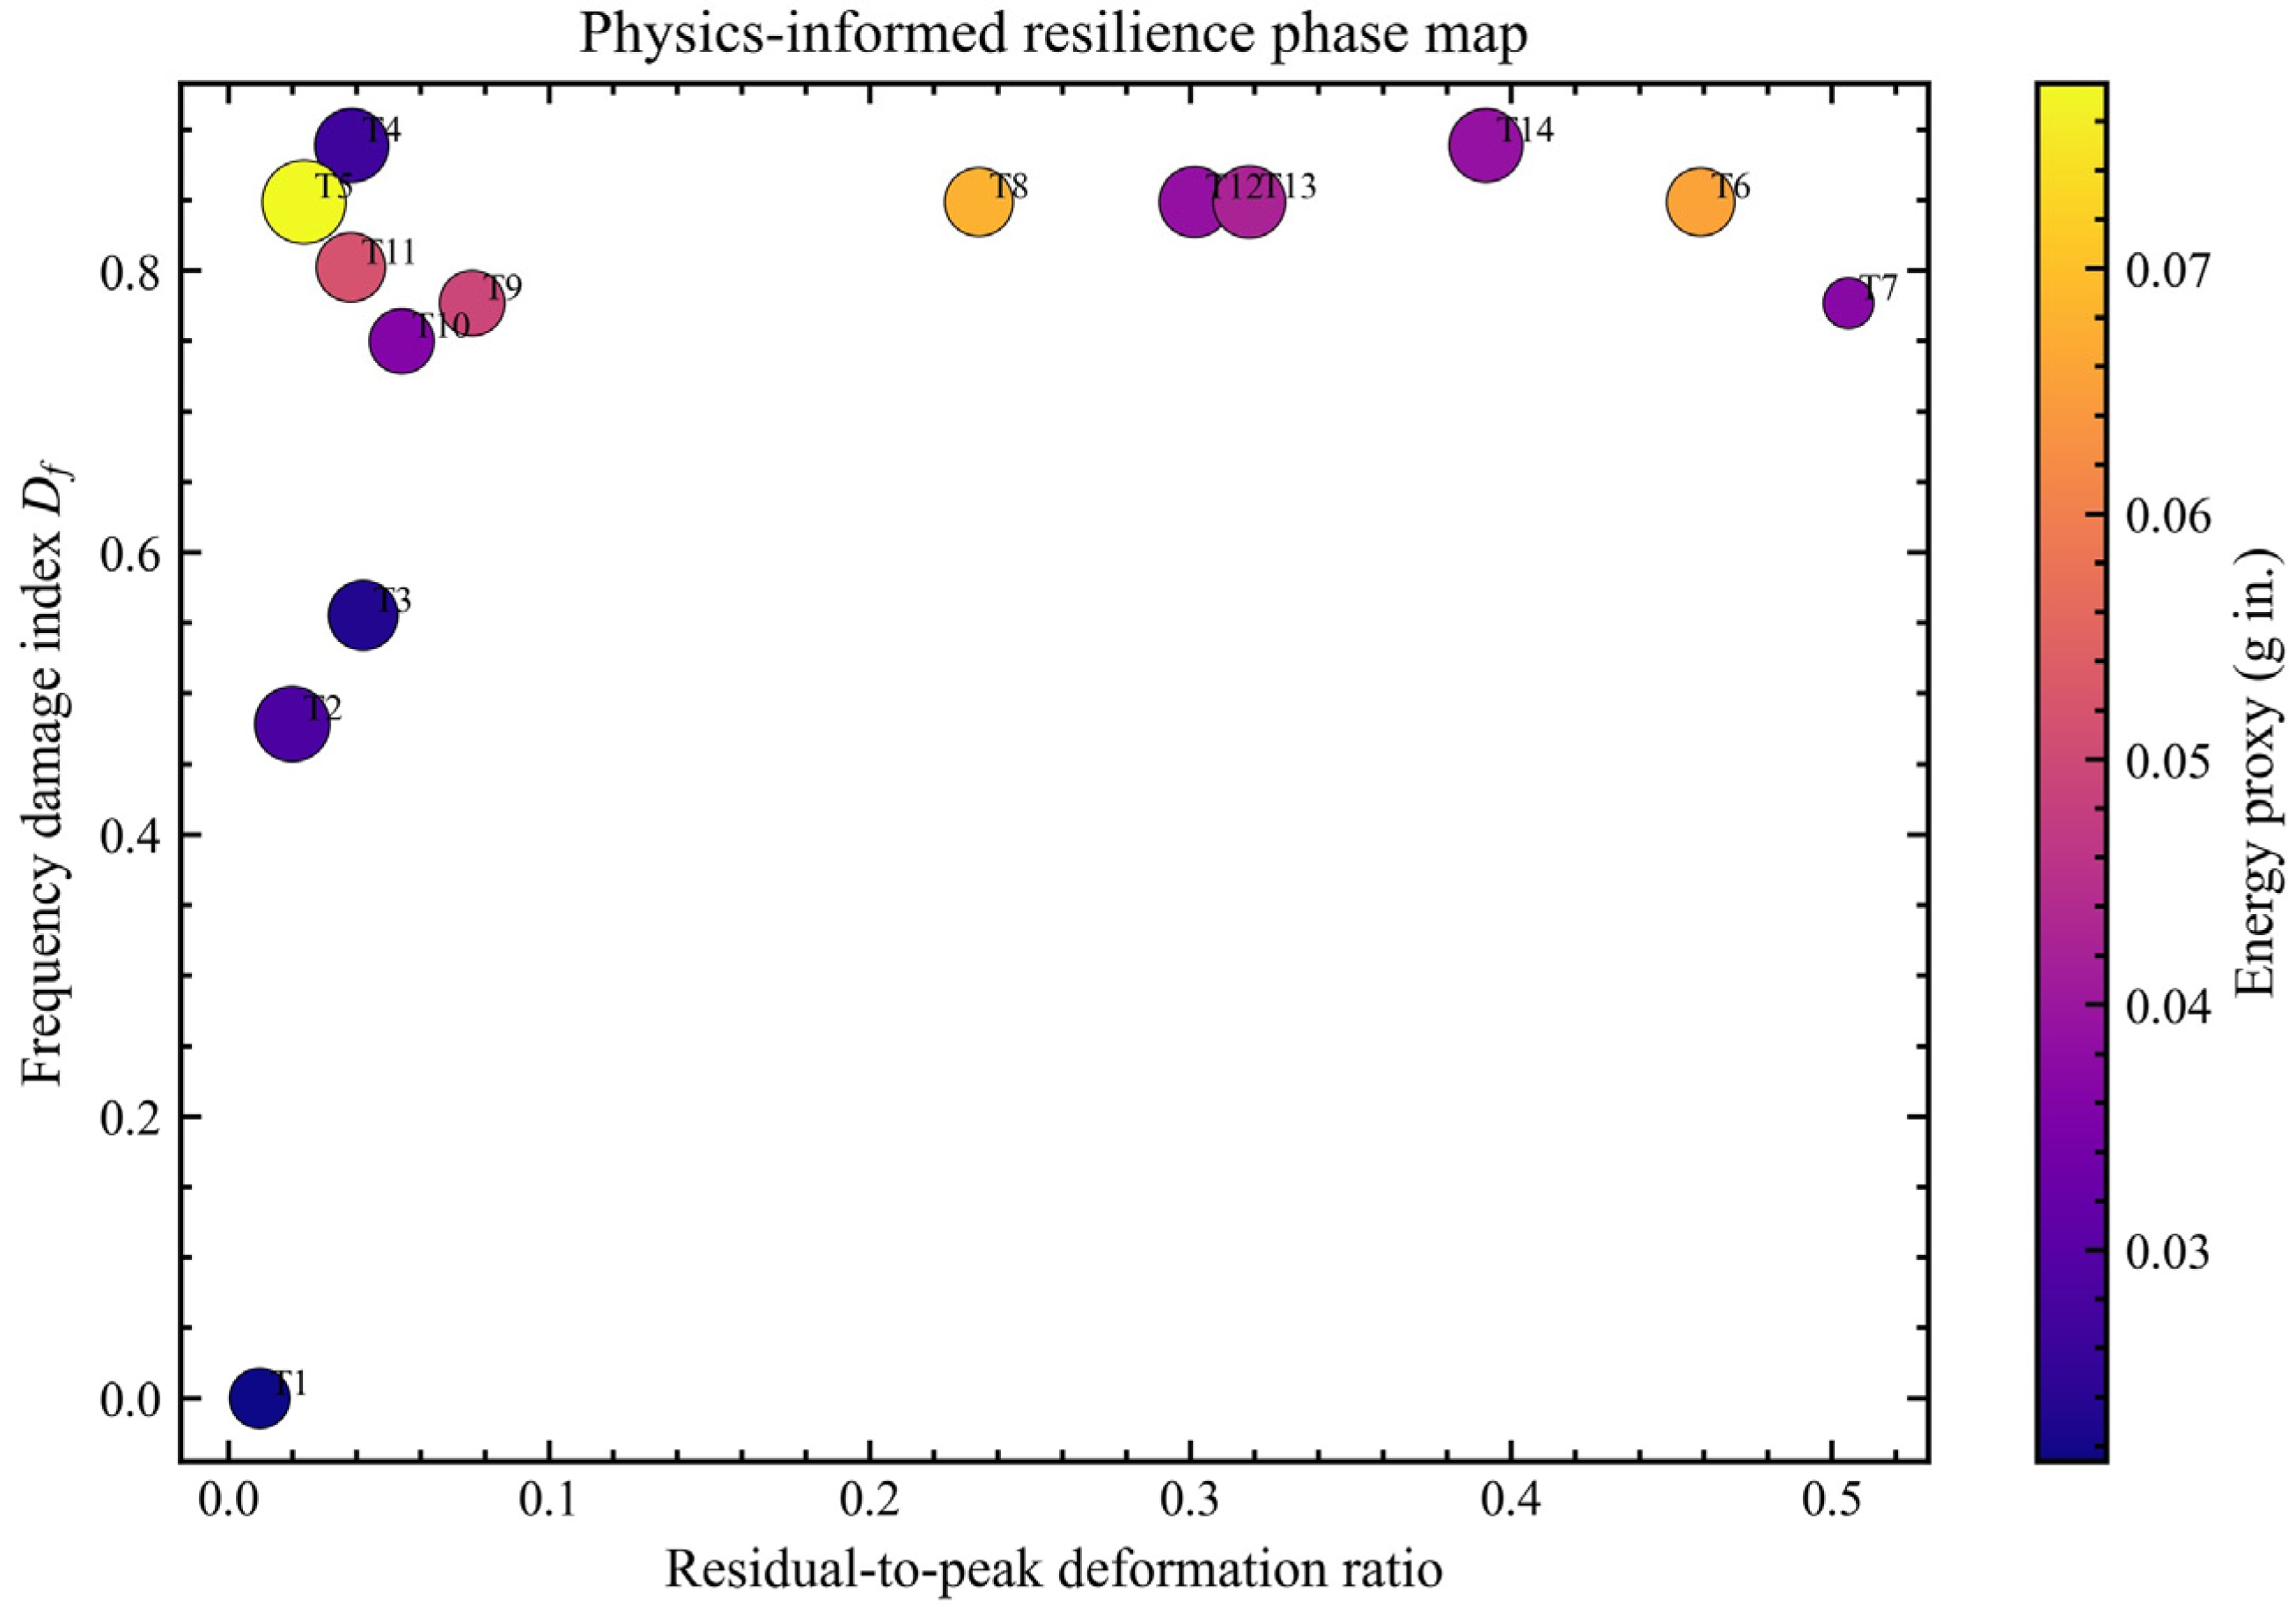
Figure 23 integrates residual deformation ratio, frequency-based stiffness loss, input intensity, and the deformation-weighted energy proxy into a resilience phase map. Early tests occupy a high-frequency and low-residual region, such as Test 1 with
and a residual-to-peak ratio of about 0.010. Later strong tests move toward a softened but still recentering region; for example, Tests 12 to 14 have stiffness-loss indices of approximately 0.849 to 0.889 and residual-to-peak ratios of about 0.301 to 0.392. The final event therefore indicates substantial modal softening but not loss of global recentering. This figure is the clearest evidence that the structural state should be interpreted as a continuum of resilience phases rather than as a binary damaged or undamaged condition.
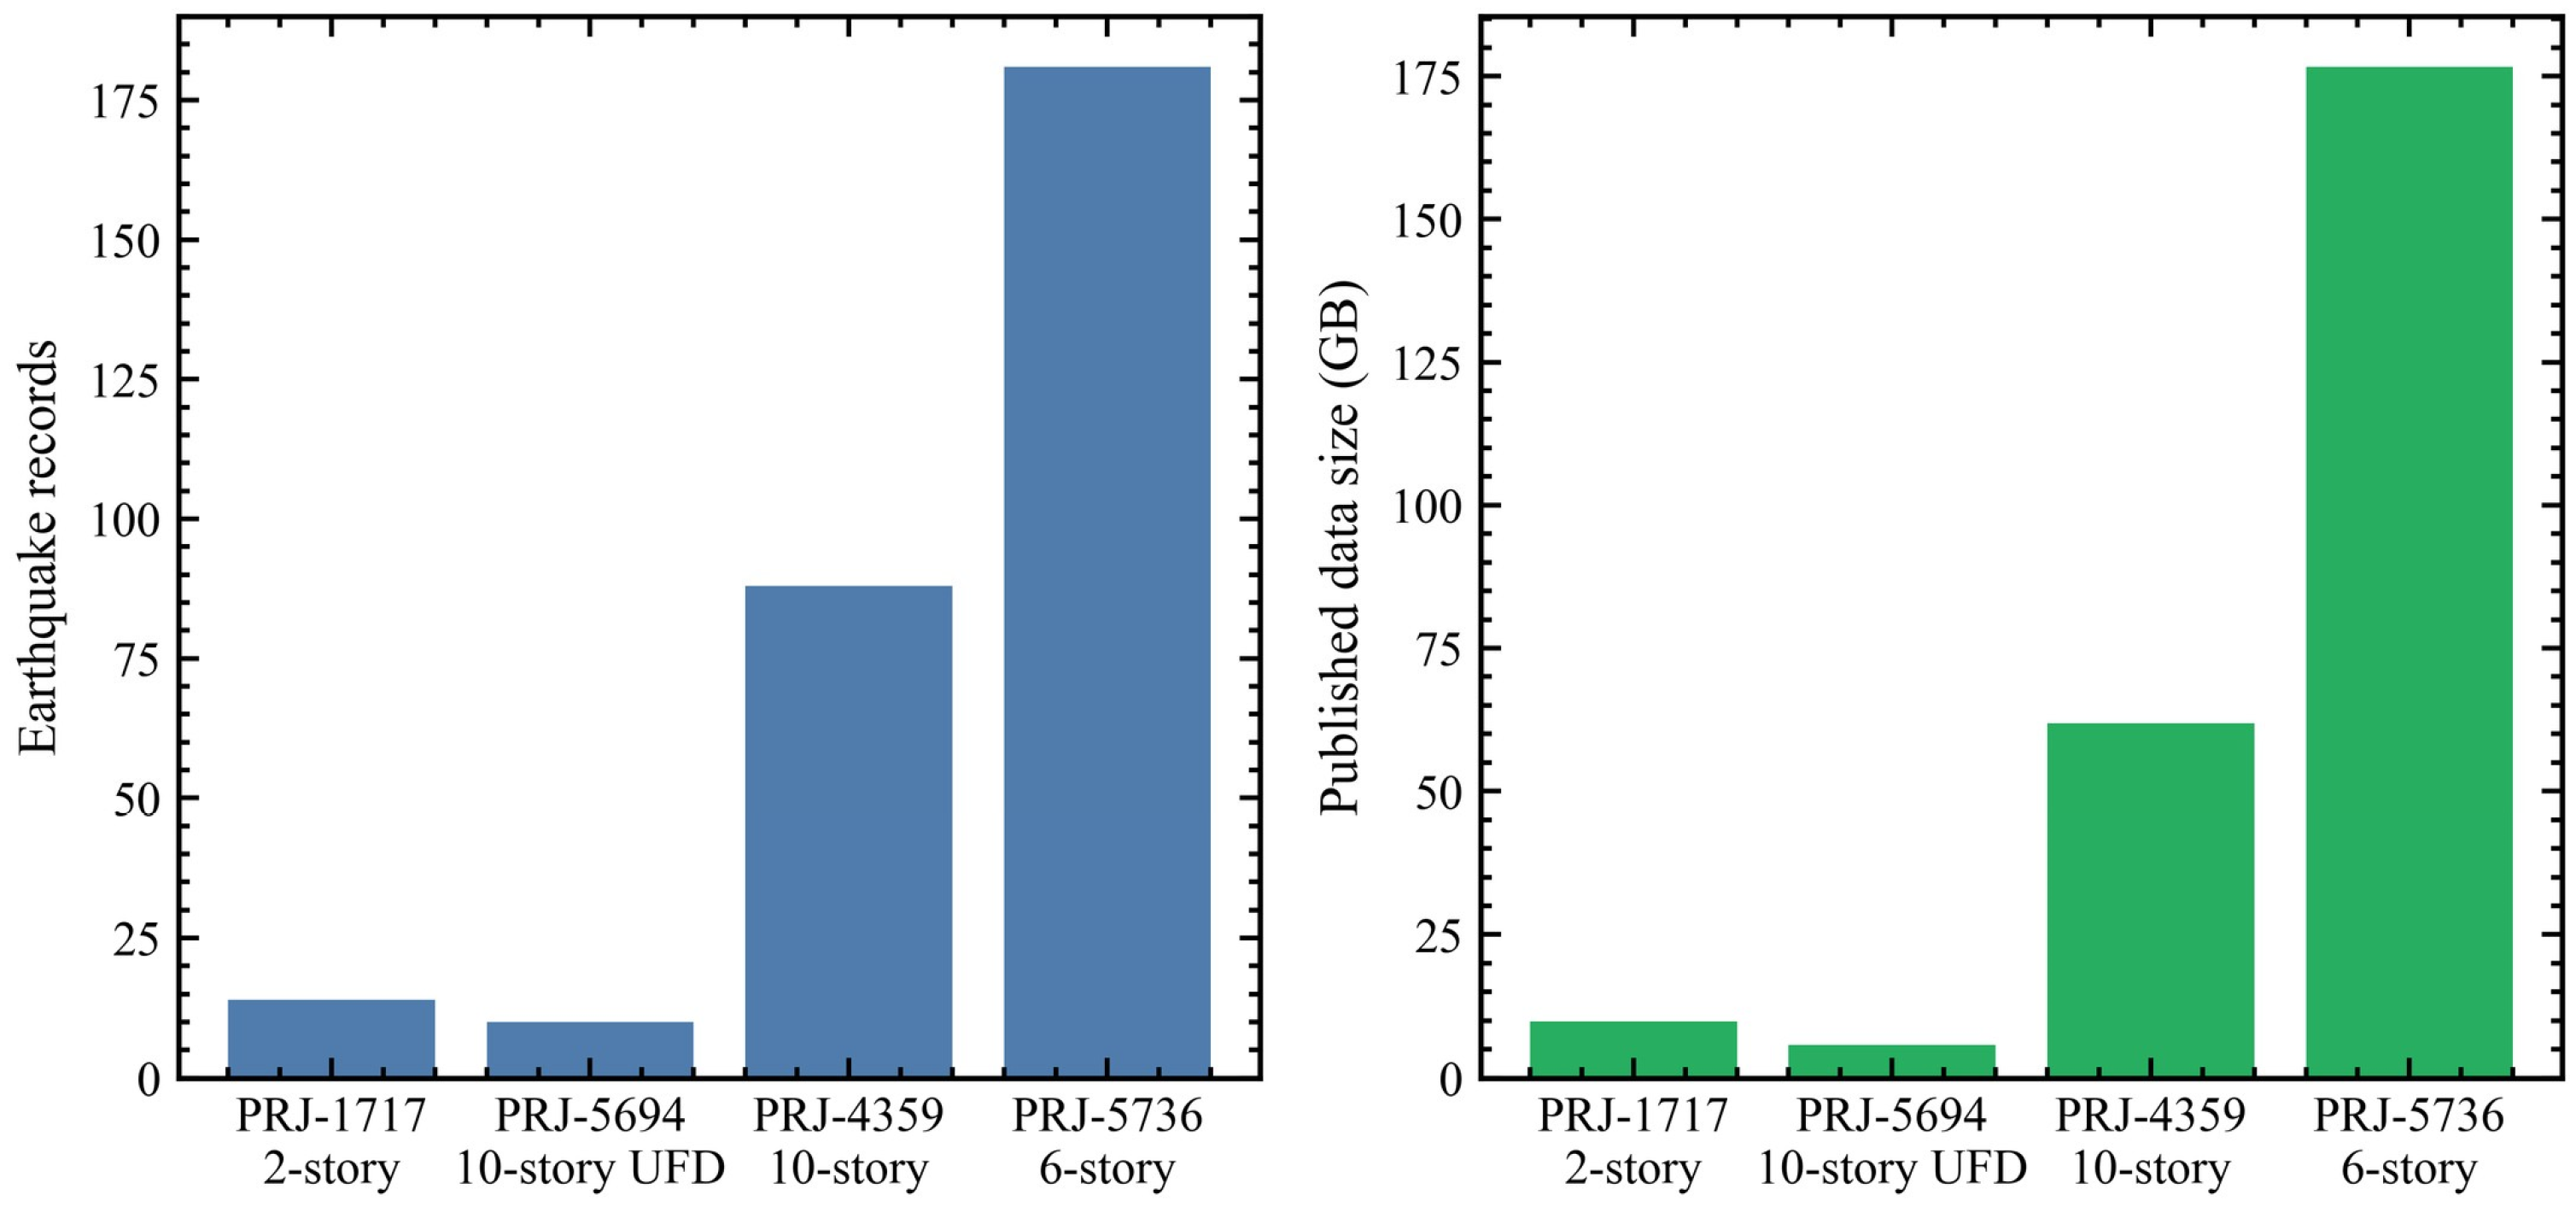
Figure 24 places the analyzed two-story PRJ-1717 dataset in the broader context of public NHERI mass-timber shake-table datasets. The PRJ-1717 dataset contains fourteen earthquake records and is smaller than newer multi-story mass-timber datasets, which include larger numbers of records and substantially larger published data volumes. The contextual comparison shows that the two-story rocking-wall test remains valuable because it provides a compact, well-instrumented benchmark for studying modal softening, self-centering, and low-damage response. At the same time, the same descriptor framework can be extended to taller mass-timber specimens, where additional modes, diaphragm flexibility, and vertical force redistribution are expected to become more significant.
5. Experiment-Updated Abaqus Visualization
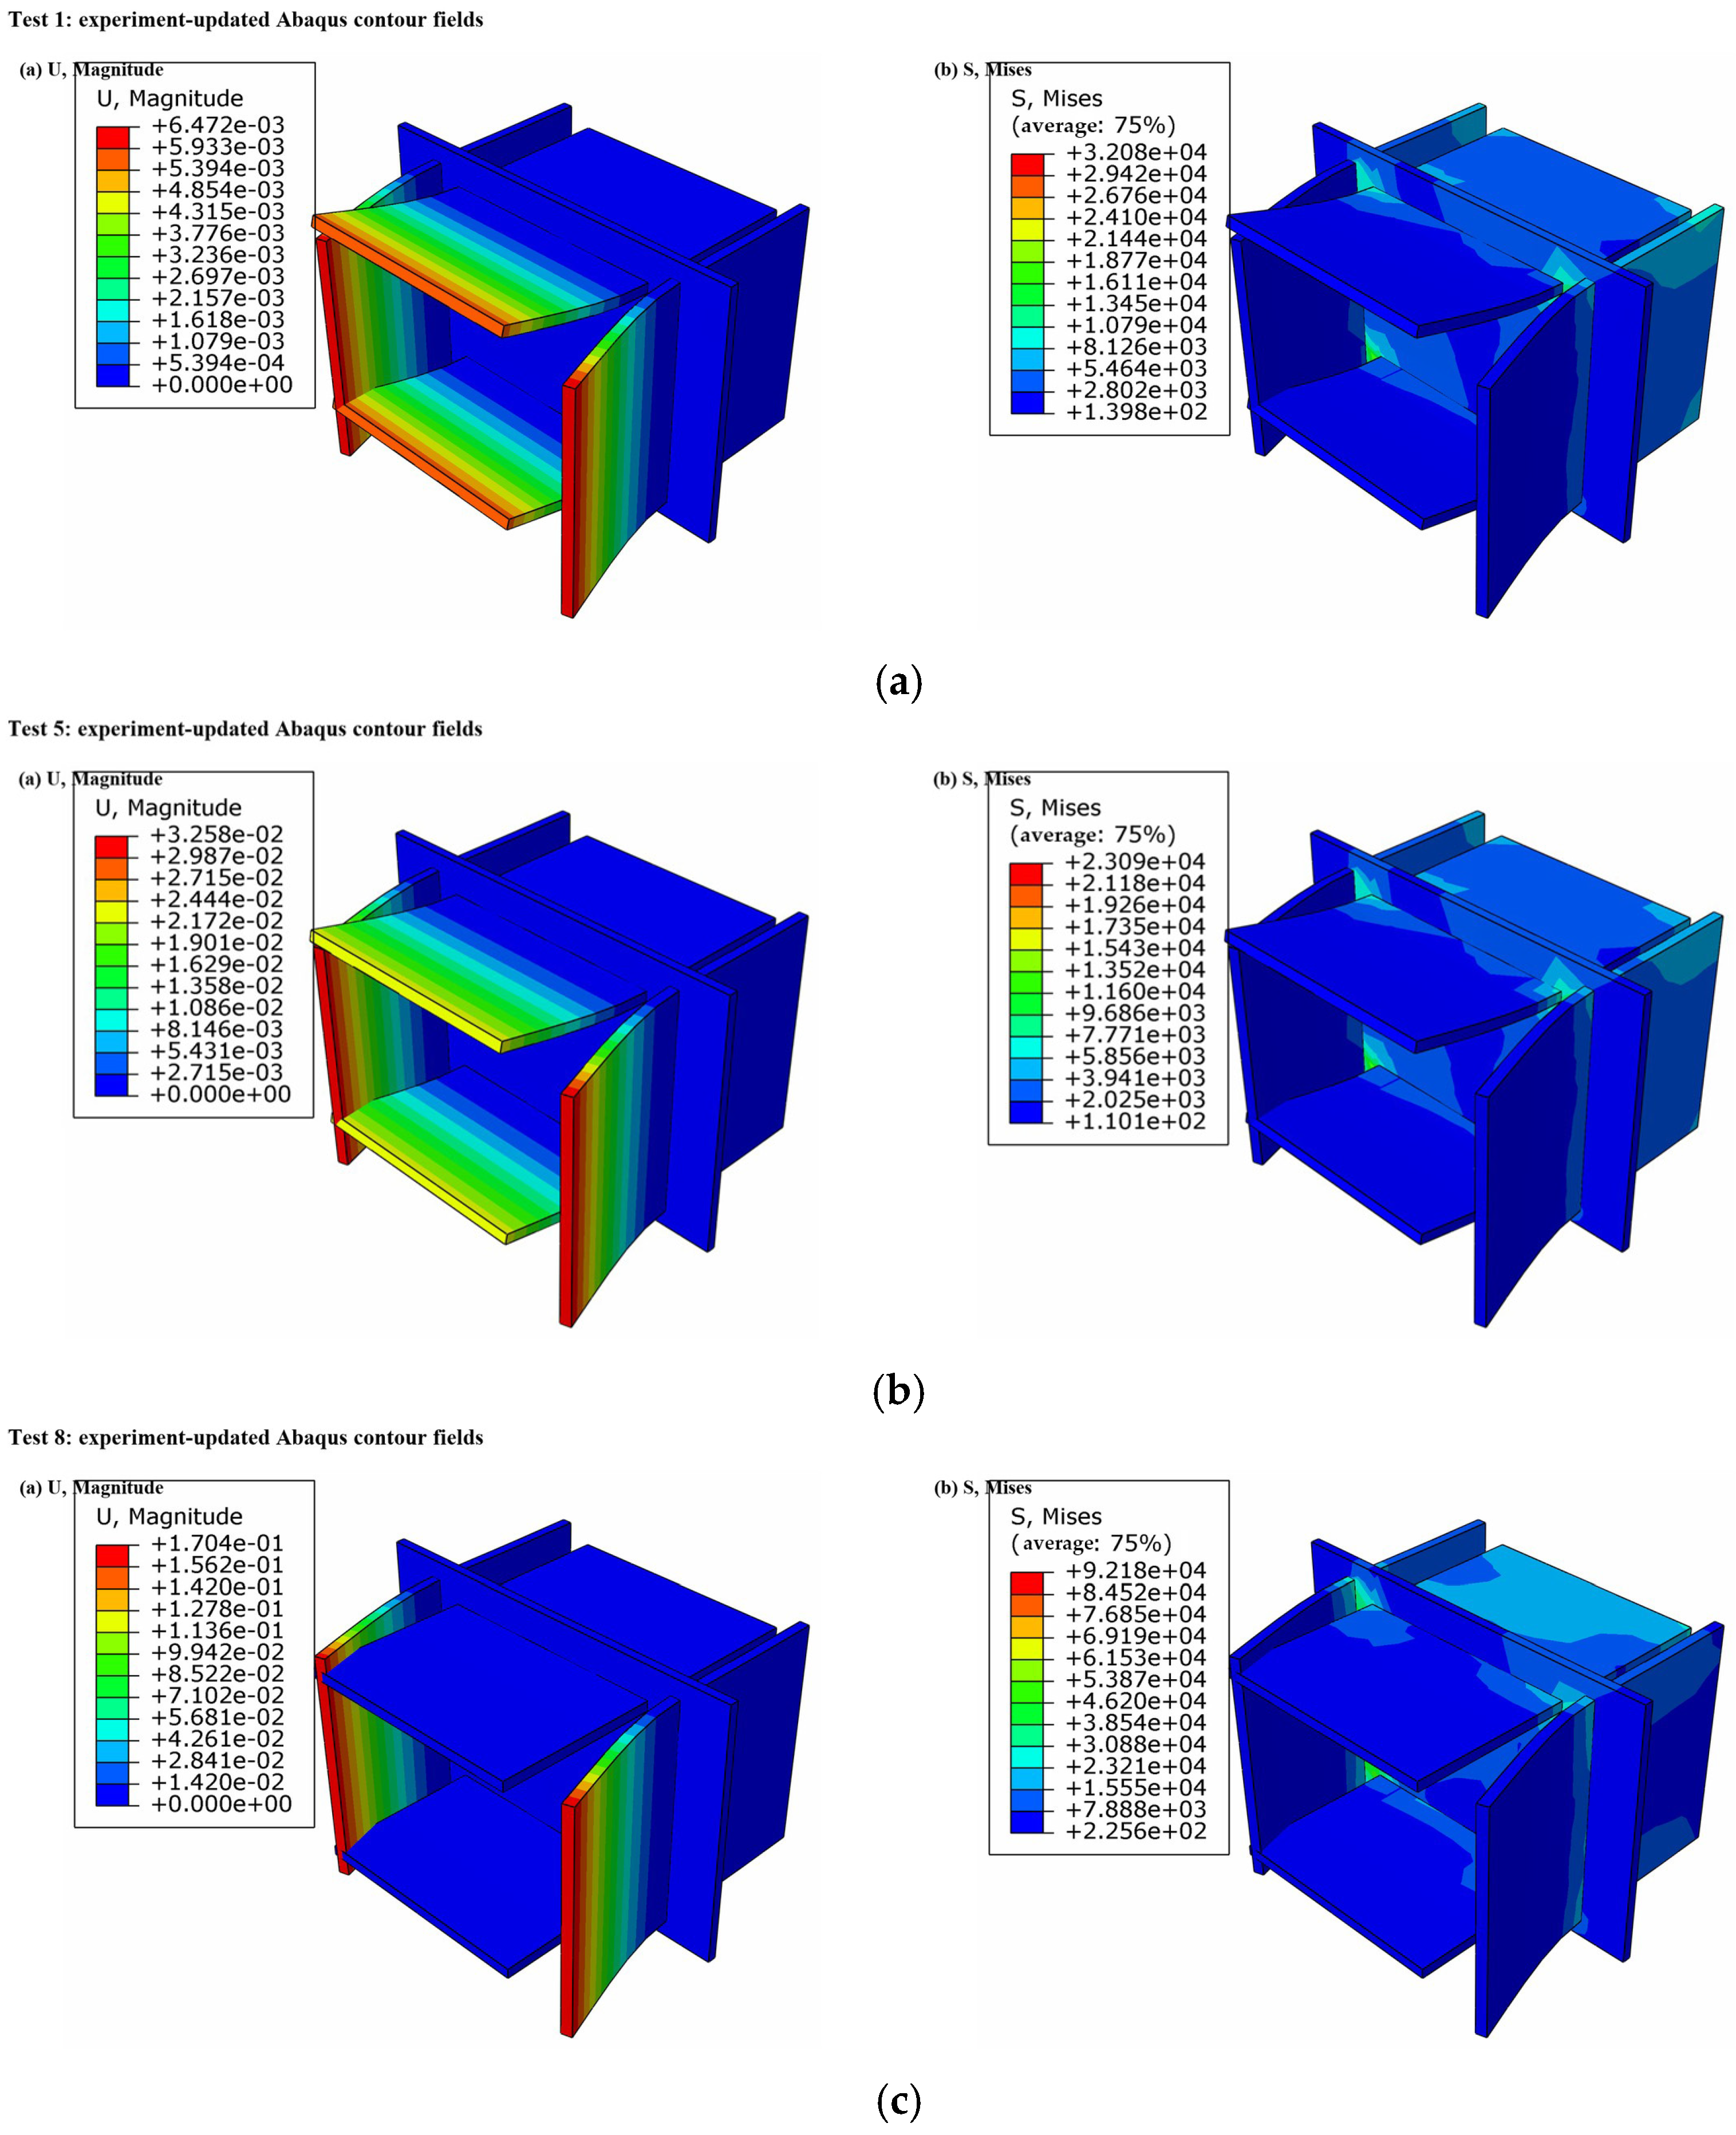
Table 2 checks whether the experiment-updated Abaqus states reproduce the measured global deformation level before the contour fields are used for mechanism interpretation. For all four representative events, the FE roof probe displacement is exactly matched to the target roof displacement, increasing from 5.72 mm in Test 1 to 23.5 mm in Test 5, then decreasing to 7.21 mm and 8.24 mm in Tests 8 and 14, respectively. This agreement indicates that the visualization model is constrained by the measured response amplitude rather than by an arbitrary load scale. The maximum FE displacement field, however, differs substantially among the updated states, with
increasing from 6.47 mm in Test 1 to 32.6 mm in Test 5, and then reaching much larger localized values of 170 mm and 143 mm in Tests 8 and 14. The participation coefficient
also changes from 0.121 in Test 1 to 0.0256 in Test 5, 0.251 in Test 8, and 0.125 in Test 14, showing that the same roof-level displacement target may correspond to different spatial deformation patterns after repeated rocking, interface seating, and stiffness-state evolution.
The updating objective is to match representative measured roof-displacement states before visualizing the corresponding displacement and stress-transfer fields. This procedure improves interpretability of the measured states, but it is not an independent validation of predictive FE capability because the boundary and loading states are constrained by experimental observations.
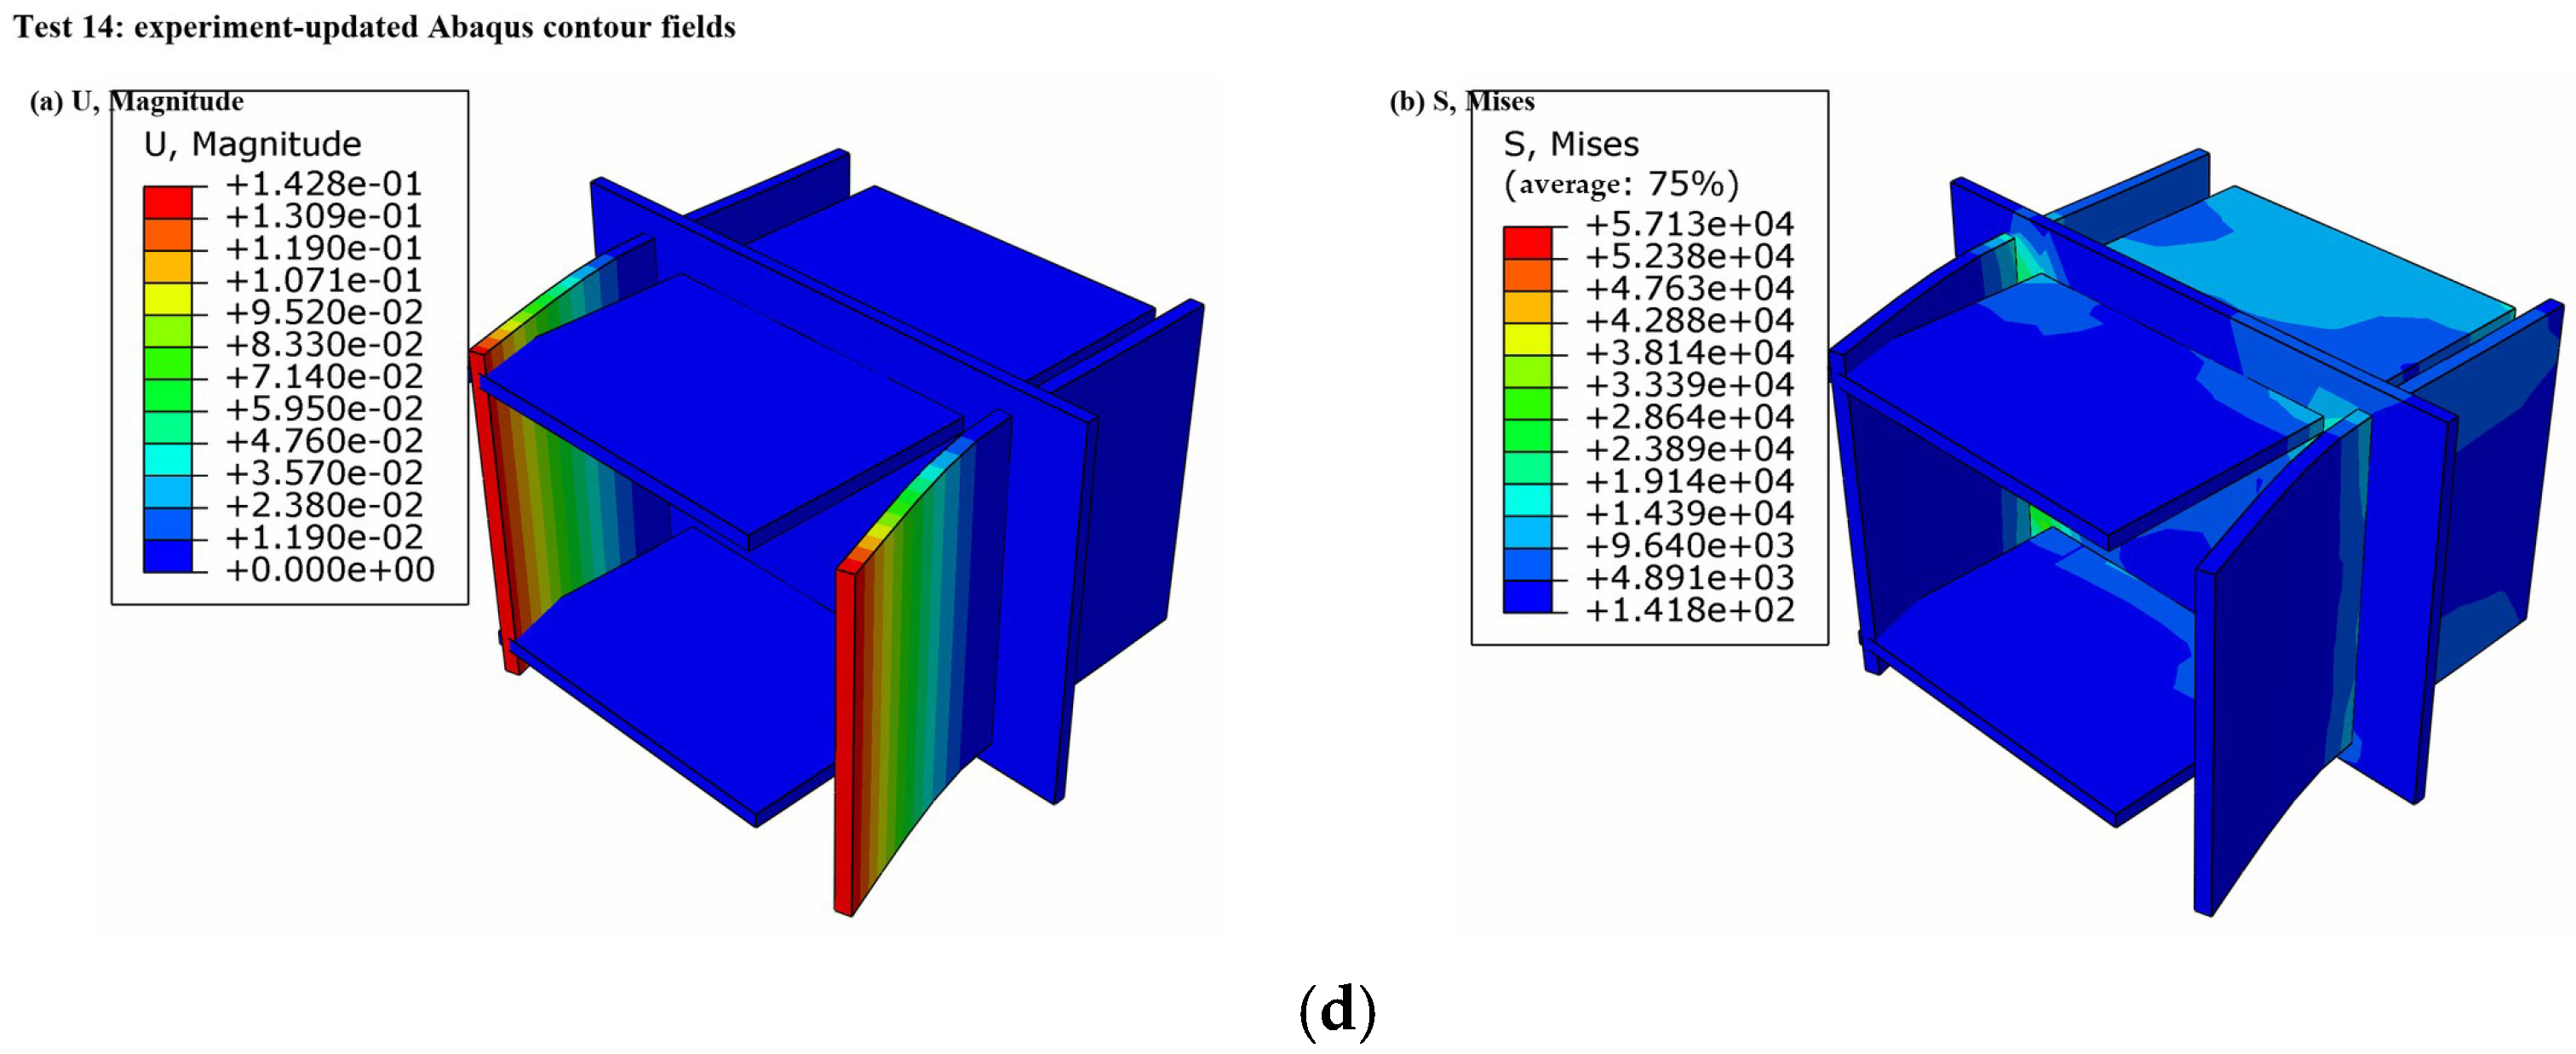
Figure 25 presents the experiment-updated Abaqus displacement and Mises-stress contour fields for Tests 1, 5, 8, and 14, representing the initial low-level event, the design-basis Northridge event, the repeated DBE-times-two event, and the final 1.2MCE event, respectively. In each subfigure, the left contour shows displacement magnitude, and the right contour shows the equivalent stress-transfer field. Test 1 exhibits a relatively small and smooth displacement field, with
mm, indicating an initial state with limited deformation concentration. Test 5 shows a larger deformation response, with
mm, and the stress field becomes more concentrated around wall–diaphragm transfer regions, consistent with stronger rocking demand. Tests 8 and 14 show the most localized displacement fields, with
mm and 143 mm, respectively, suggesting that repeated strong shaking modifies the effective deformation path even when the calibrated roof probe displacement remains moderate. The corresponding stress contours concentrate near wall intersections, diaphragm interfaces, and wall–base transfer zones, supporting the interpretation that the system evolves mainly through contact opening and closure, diaphragm–wall compatibility, and interface stiffness redistribution rather than through uniform global material damage.
6. Discussion and Limitations
The integrated descriptor workflow should be interpreted as a diagnostic framework for this measured full-scale sequence, not as a universal predictive model for all mass-timber structures. Its main value is to combine established structural-dynamics quantities into a state-based interpretation that distinguishes input severity, modal softening, residual response, recentering, and inertial-deformation coupling.
The observed frequency-squared stiffness reduction of nearly 89% is qualitatively consistent with prior post-tensioned CLT and rocking-wall studies in which apparent stiffness is controlled by uplift, recontact, tendon action, connection seating, and foundation or interface flexibility [
13,
14,
15,
16,
17,
18,
19,
20]. It is therefore reported as effective modal softening rather than as direct global plastic damage. The SCI evolution is also consistent with the expected behavior of post-tensioned rocking systems, where recentering can remain substantial even after large changes in apparent tangent stiffness.
The descriptor validation remains limited by the available dataset. The public test sequence does not provide independent damage labels for every descriptor, so the stiffness-loss index, deformation-weighted inertial-demand proxy, and resilience phase map are used as comparative state descriptors rather than as proven predictors. The correlation matrix, low-dimensional descriptor map, resilience phase map, and model-updating check provide quantitative support for interpretation, but they do not by themselves establish general predictive superiority over conventional metrics.
The proposed workflow is transferable in procedure, but the physical conclusions are case-specific to the two-story PRJ-1717 NHERI TallWood specimen and its instrumentation. Application to taller mass-timber systems will require additional validation because higher modes, diaphragm flexibility, vertical force redistribution, and different wall-to-diaphragm boundary conditions may change the descriptor relationships.