Article

Outdoor Thermal Comfort of University Students and Space Design Strategies for Alleviation: A Case Study in Xi’an

1
School of Culture and Arts, Xi’an Fanyi University, Xi’an 710105, China
2
School of Culture and Arts, Kangwon National University, Chuncheon-si 24341, Gangwon-do, Republic of Korea
*
Author to whom correspondence should be addressed.
Buildings 2026, 16(11), 2233; https://doi.org/10.3390/buildings16112233
Submission received: 16 March 2026 / Revised: 23 May 2026 / Accepted: 25 May 2026 / Published: 1 June 2026
(This article belongs to the Special Issue Advances in Urban Heat Island and Outdoor Thermal Comfort)

Abstract

Amid rapid urbanization and the expansion of higher education campuses, the physical and psychological well-being of college students has garnered increasing scientific attention. Although outdoor activities are crucial for student health, participation rates are heavily constrained by outdoor thermal comfort (OTC). This study investigates the OTC of university students in Xi’an, China, utilizing the Universal Thermal Climate Index (UTCI) to assess thermal perceptions across four distinct open spaces and to propose localized bioclimatic design interventions. The results reveal four key findings: (1) The meteorological correlates of thermal sensation vary significantly by spatial typology; relative humidity (RH) and air temperature (Ta) dominate in sunken spaces (HB), whereas solar radiation (G), globe temperature (Tg), and wind velocity (Va) are the primary correlates in sports squares (CS) and activity squares (SH). (2) Thermal benchmarks exhibit remarkable spatial heterogeneity during summer. The Neutral UTCI (NUTCI) varied widely from 17.11 °C in hard-paved squares (SH) to 26.13 °C in shaded bridge areas (JG), with the corresponding neutral zones (NUTCIR) shifting accordingly. (3) Significant variations in thermal adaptation exist even within identical macro-climates, underscoring the necessity of microclimate-specific design. (4) Targeted bioclimatic strategies—including optimized vegetation deployment, shading structures, localized sprinkler systems, and permeable paving—are proposed. These findings provide actionable guidelines for urban planners and landscape architects to optimize campus environments, thereby encouraging outdoor engagement and enhancing student well-being.

1. Introduction

As university infrastructures expand and student enrollments surge, prioritizing the psychological and physiological health of this demographic has become a critical public health objective [1,2,3]. Insufficient engagement in outdoor activities correlates with notable physiological and psychological detriments among students [4]. Consequently, the likelihood of students utilizing open spaces is heavily dictated by prevailing outdoor thermal comfort (OTC) conditions [5]. Previous empirical studies verify that thoughtfully integrating specific botanical species alongside strategic landscape elements can tangibly alleviate outdoor heat stress [6,7]. Thus, formulating campus configurations that actively optimize thermal parameters is indispensable for driving frequent outdoor participation and, by extension, safeguarding student wellness [8].
A substantial body of literature has explored outdoor thermal comfort variations across diverse contexts. For instance, Zhen et al. underscored extreme regional and climatic gradients by contrasting comfort zones in Xi’an, Tianjin, and Harbin [9]. Similarly, He et al. documented a winter thermal tolerance window of 12.2–19.4 °C among factory personnel in Haining [10], and further pinpointed distinct seasonal limits (2.3–17.1 °C in winter; 13.6–21.7 °C in summer) for adolescents traversing a Harbin park [11]. In more extreme environments, Kumar et al. determined that active individuals in India’s hot semi-arid zones maintained comfort between 27.7 and 35.7 °C [12]. Likewise, residential courtyard evaluations in Shiraz yielded a 23.2–30.8 °C threshold [13], while campus-specific studies at Birjand University identified an operational range of 16.4–25.3 °C [14]. Parallel investigations on tropical Malaysian campuses recorded optimal boundaries between 24 and 34 °C [15]. Reinforcing the impact of local geometry, Liu et al. assessed nine heterogeneous sites at a Shanghai university, confirming that micro-spatial morphology profoundly manipulates local thermoregulation, yielding a student comfort bracket of 29.16–32.04 °C [16]. Ultimately, these assessments illuminate the immense plasticity of human thermal perception when subjected to shifting geographical and structural stimuli.
Historically, campus landscape research has prioritized macro-scale ecological initiatives, such as deploying Low Impact Development (LID) frameworks for sponge campuses [17], advocating for broad biodiversity safeguards [18], or mapping environmental acoustics [19]. Other methodological approaches have utilized space syntax theory to optimize general site connectivity [20]. Furthermore, contemporary building environment research (2024–2026) has increasingly emphasized the critical intersection of outdoor microclimates, adaptive façade/daylight control strategies, and indoor energy performance. Recent literature highlights the necessity of employing advanced daylight performance metrics and multi-objective optimization to balance building energy use against daylight availability and glare constraints under integrated thermal-visual comfort criteria [21]. For example, a recent study by Wang et al. (2025) powerfully demonstrated that optimizing architectural form variables (such as atriums) at the early design stage significantly enhances daylighting and thermal comfort in educational buildings while simultaneously minimizing energy consumption [22]. Despite these innovative approaches, there is a lack of emphasis on designing for thermal comfort, which is crucial for determining how outdoor spaces affect thermal comfort levels. This oversight can significantly diminish students’ participation in outdoor activities. Therefore, integrating thermal comfort considerations into campus outdoor space design is hypothesized to not only enhance the spatial configuration but also potentially promote greater outdoor activity among students, contributing positively to their physical and mental health.
We executed a comprehensive evaluation of outdoor thermal comfort (OTC) within four specific open spaces at a university in Xi’an, utilizing meteorological measurements and surveys. Our objectives were to (1) ascertain if there are disparities in the key factors that affect the outdoor thermal sensations of university students across different spaces; (2) assess the thermal sensations, thresholds, and benchmarks of students within these environments; (3) leverage these insights to propose bioclimatic design strategies tailored for enhancing campus outdoor spaces. Our study not only delineates variations in thermal comfort among students but also elucidates the principal factors that influence these sensations. Furthermore, our research provides actionable bioclimatic design guidelines for planners and landscape architects, aimed at optimizing the campus landscape to foster improved thermal comfort and overall student well-being.

2. Methods

2.1. Study Sites

Geographically situated within China’s northwestern semi-humid continental monsoon region, Xi’an undergoes four pronounced seasonal shifts, most notably characterized by sweltering, high-humidity summers (Köppen–Geiger classification) [23]. Our observational field campaign took place across a 64.07-hectare university campus in this city (108°55′21.36″ E, 34°10′39.25″ N). To capture spatial microclimatic variations, we selected four functionally and morphologically distinct open spaces (Figure 1). These sites were purposefully selected to represent holistic spatial typologies commonly found on campuses, rather than parametrically controlled environments. These include: The first space (HB) is a sunken space in front of mid and low-rise buildings. The second space (SH) is an area encircled by vegetation such as shrubs and grass; The third space (JG) is an open area in front of similar building types; The fourth space (CS) is a square featuring a water pool. Each space was analyzed for its specific spatial characteristics, and the sky view factor (SVF) was quantified using fisheye photography (Table 1).

2.2. Experimental Design

2.2.1. Meteorological Measurements

The study was conducted from April to July 2024, during which we selected one day each week for observations from 8:00 to 18:00. To ensure data quality and comparability, the following sampling strategy was employed:
(1)
Weather conditions: Only days without precipitation (rain/snow) and with wind speeds < 3 m/s at weather station level were selected;
(2)
Sky conditions: Selected days represented typical seasonal conditions with a mix of clear (40%), partly cloudy (35%), and cloudy (25%) conditions;
(3)
Day type: Measurements were conducted on weekdays (Tuesday–Thursday) to capture typical campus usage patterns;
(4)
Synchronization: All four sites were measured simultaneously on the same days to ensure comparability.
A total of 16 measurement days were conducted (4 days per month), with the specific dates selected based on 72 h weather forecasts to meet the above criteria. When weather conditions prevented measurement on the planned day, the next suitable day within the same week was selected.
According to the meteorological data for Xi’an spanning 2009 to 2018 [24], the month of July typically records the highest mean air temperature (Ta) at 28 °C, with a maximum of 33 °C, representing the peak of the seasonal temperature rise and coinciding with the hottest month.
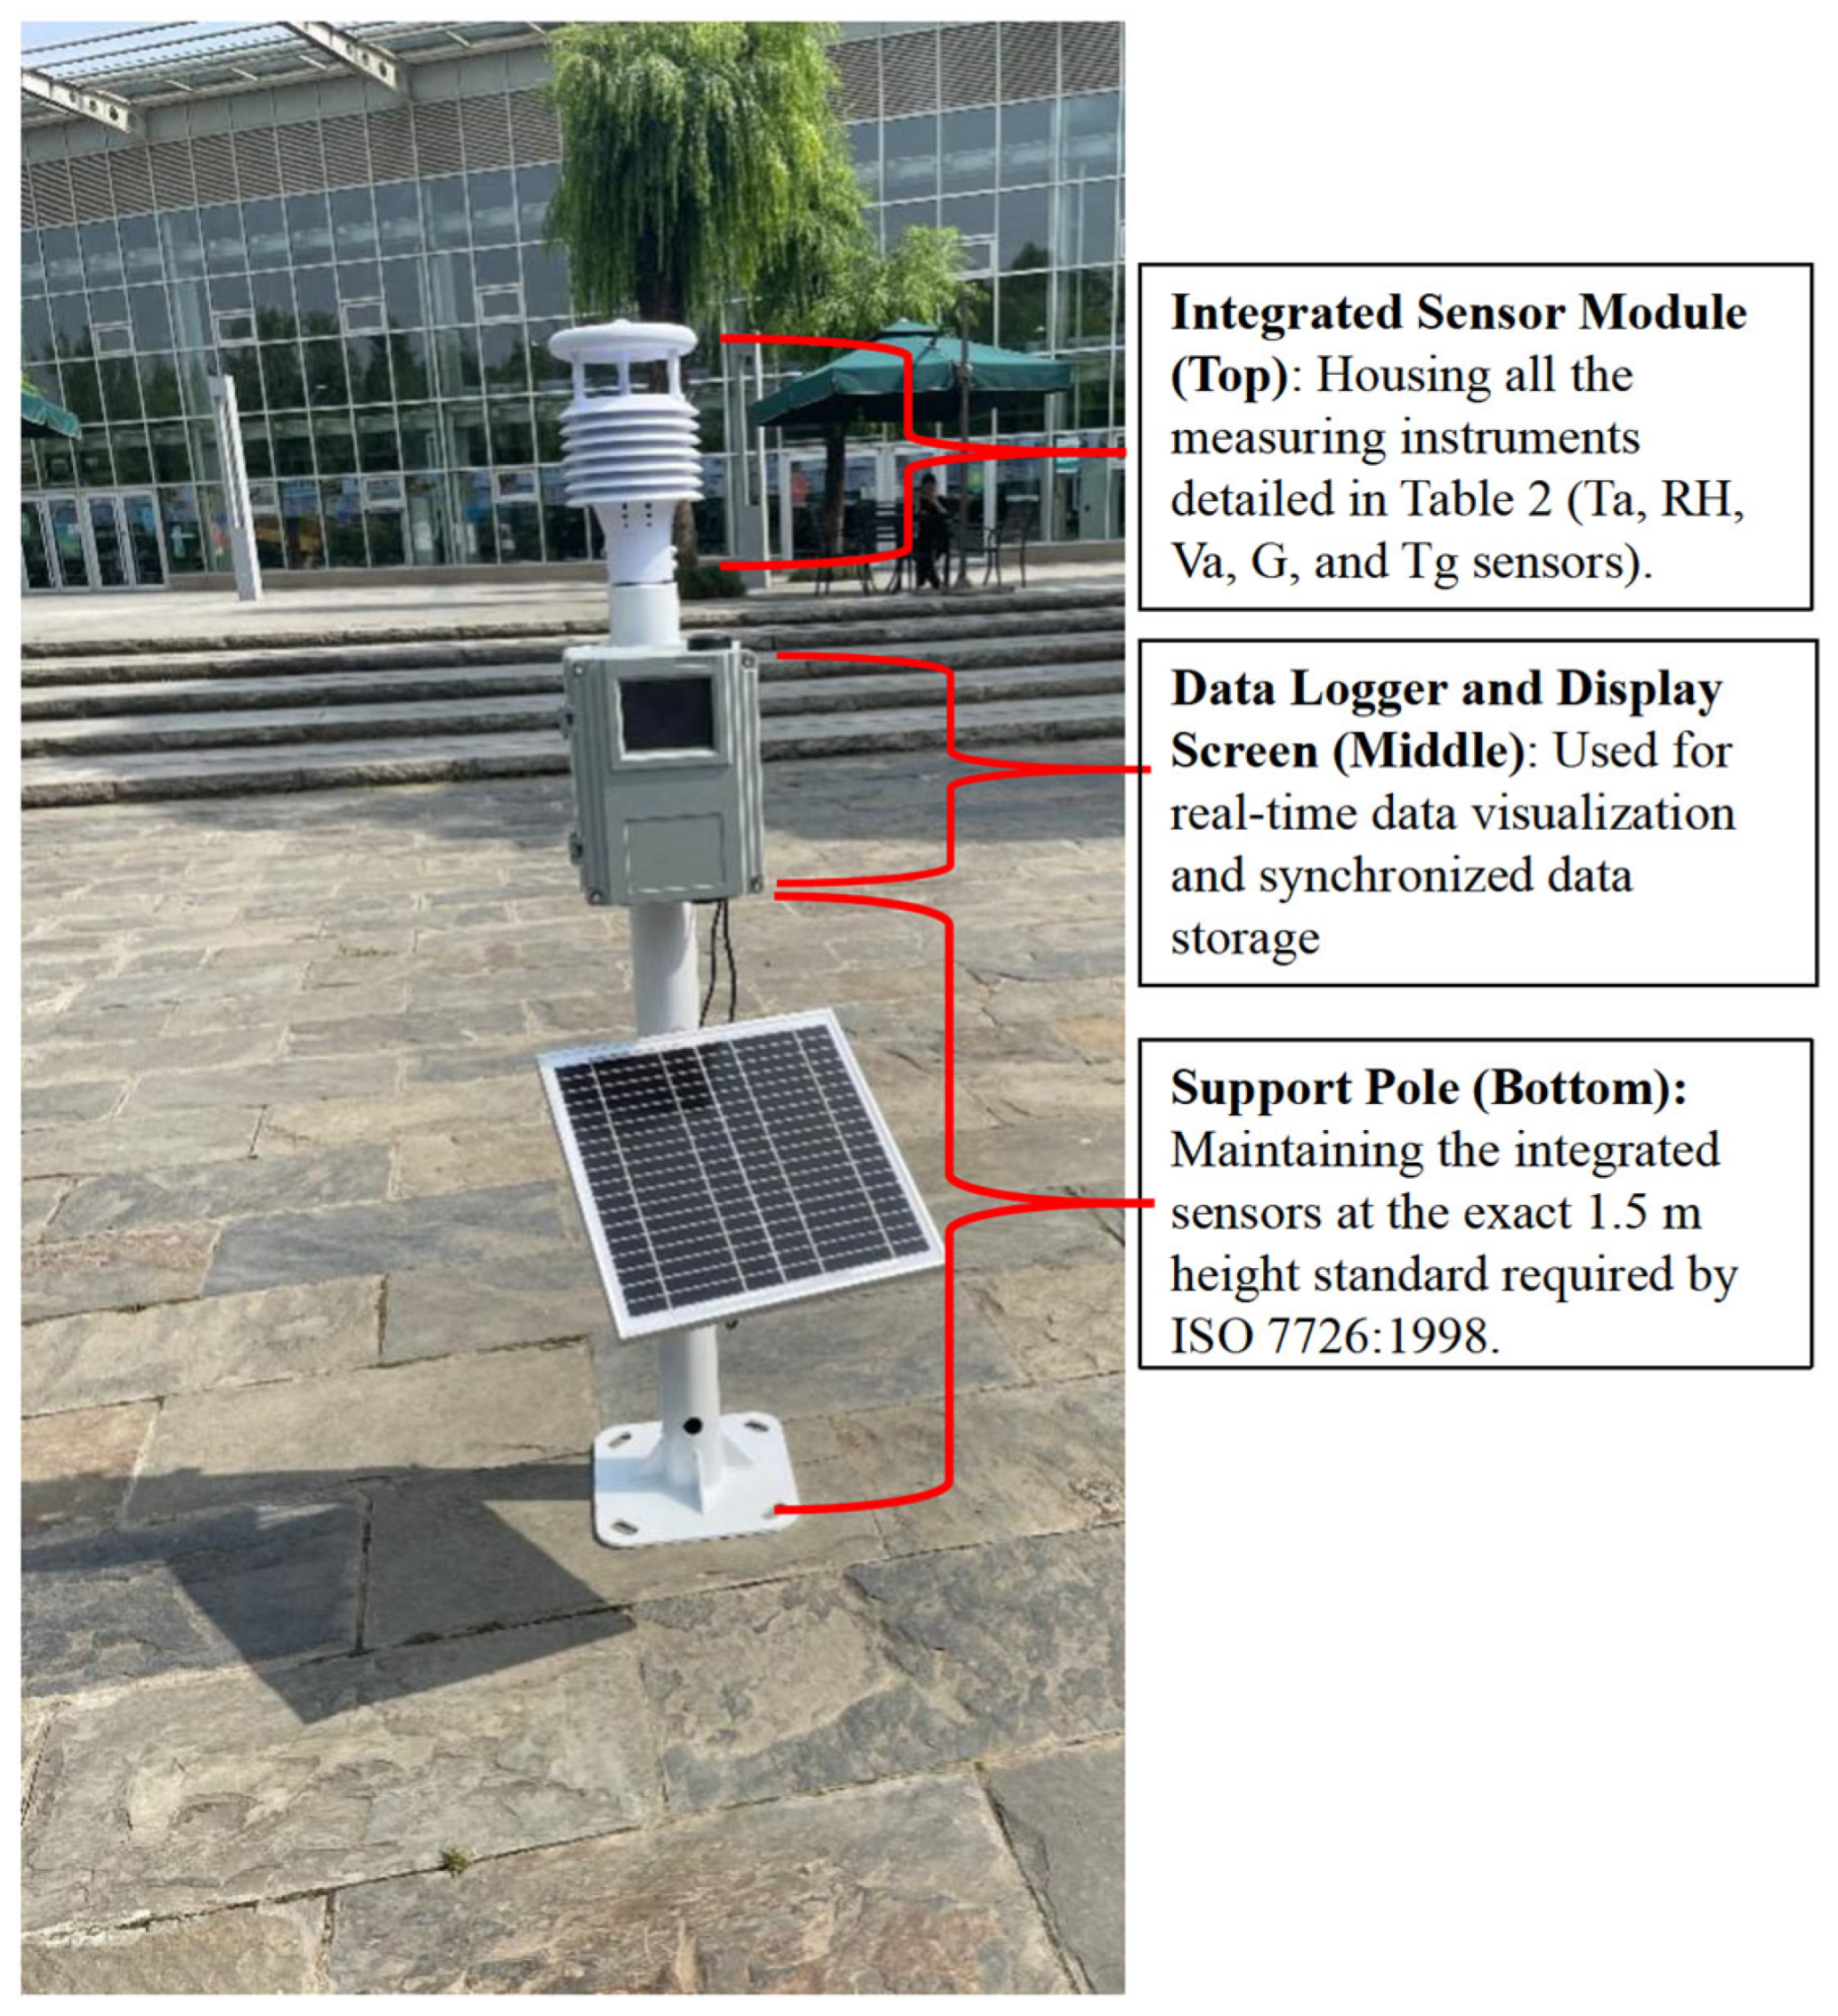
The measured meteorological parameters included air temperature (Ta), relative humidity (RH), wind velocity (Va), solar radiation (G), and globe temperature (Tg). The instruments employed were: a temperature detector (RS485) for Ta, a Black Globe temperature/humidity detector for Tg and RH, a wind speed detector (Wind0501, Bair Technology Co., Ltd., Xi’an, China) for Va, and a Bolometer (JT20201, Bair Technology Co., Ltd., Xi’an, China) for G (specifications are detailed in Table 2). Prior to the field campaign, all instruments were factory-calibrated to ensure measurement accuracy within the ranges specified in Table 2. As shown in Figure 2, the instruments were then mounted on a fixed portable stand at each measurement site, positioned at a height of 1.5 m above the ground to approximate the chest height of a standing adult, in accordance with ISO 7726:1998 [25]. All instruments recorded data continuously at a uniform sampling interval of 1 min throughout each measurement day (8:00–18:00).

2.2.2. Questionnaires and Activity Records

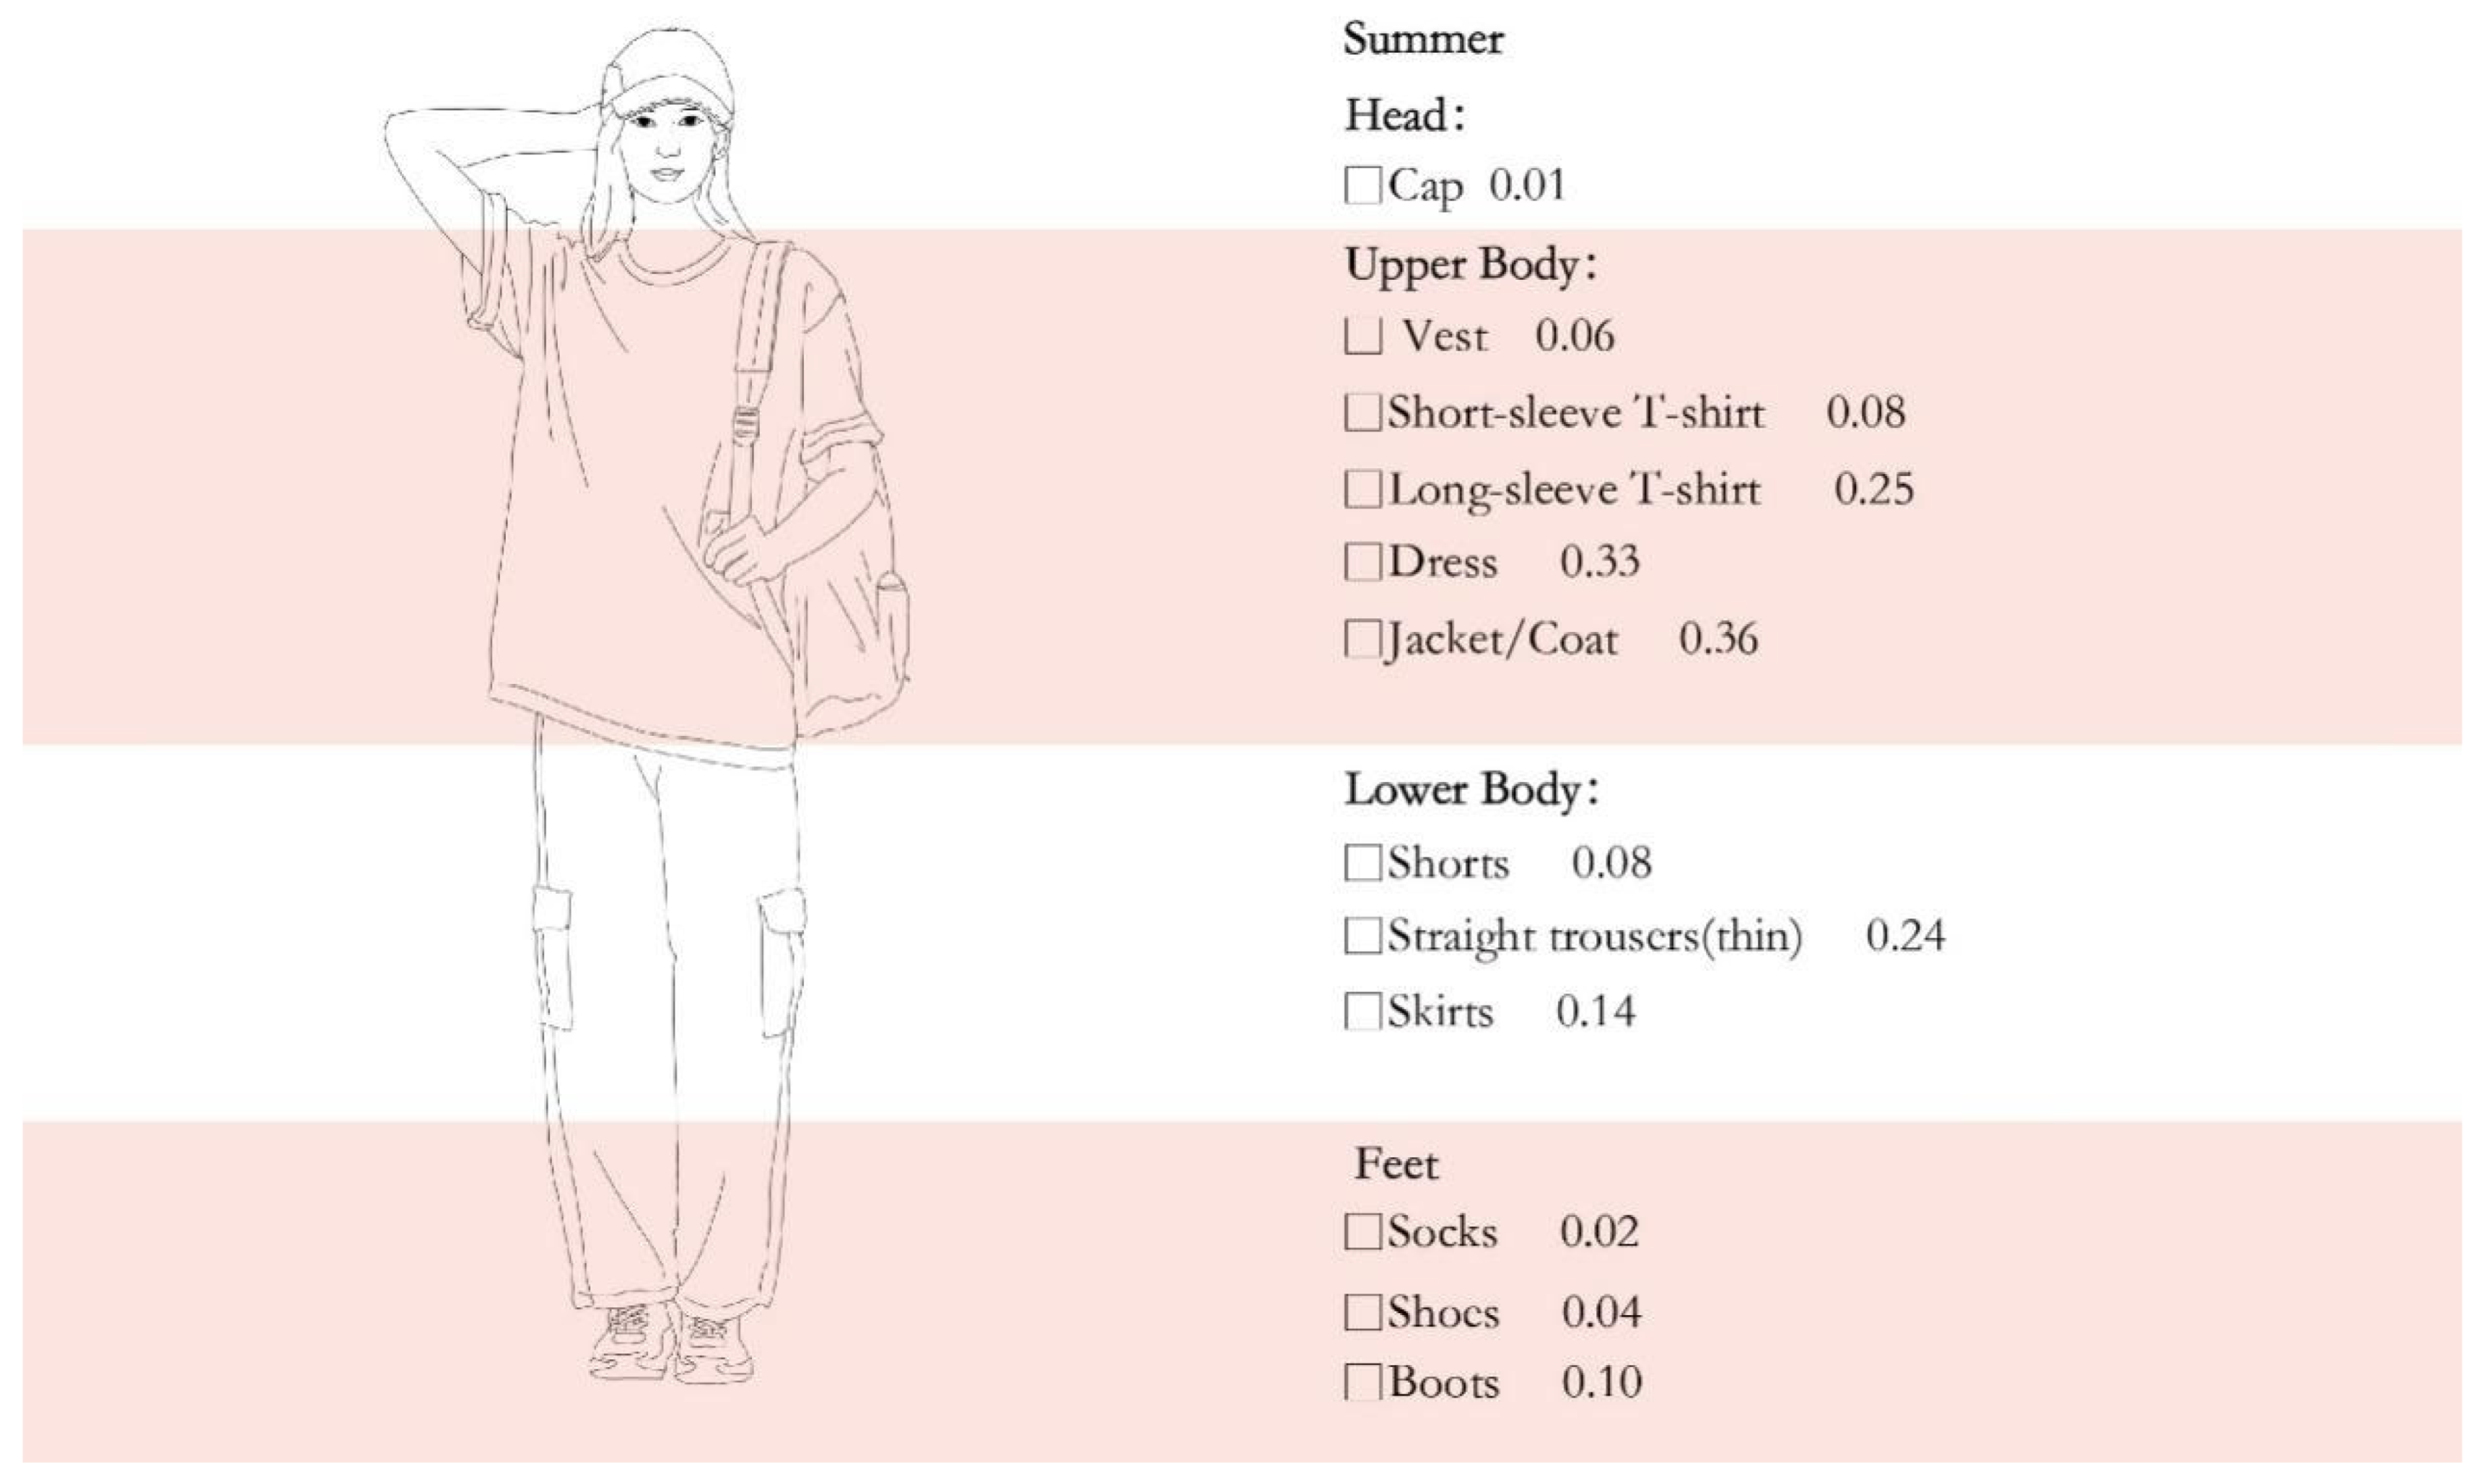
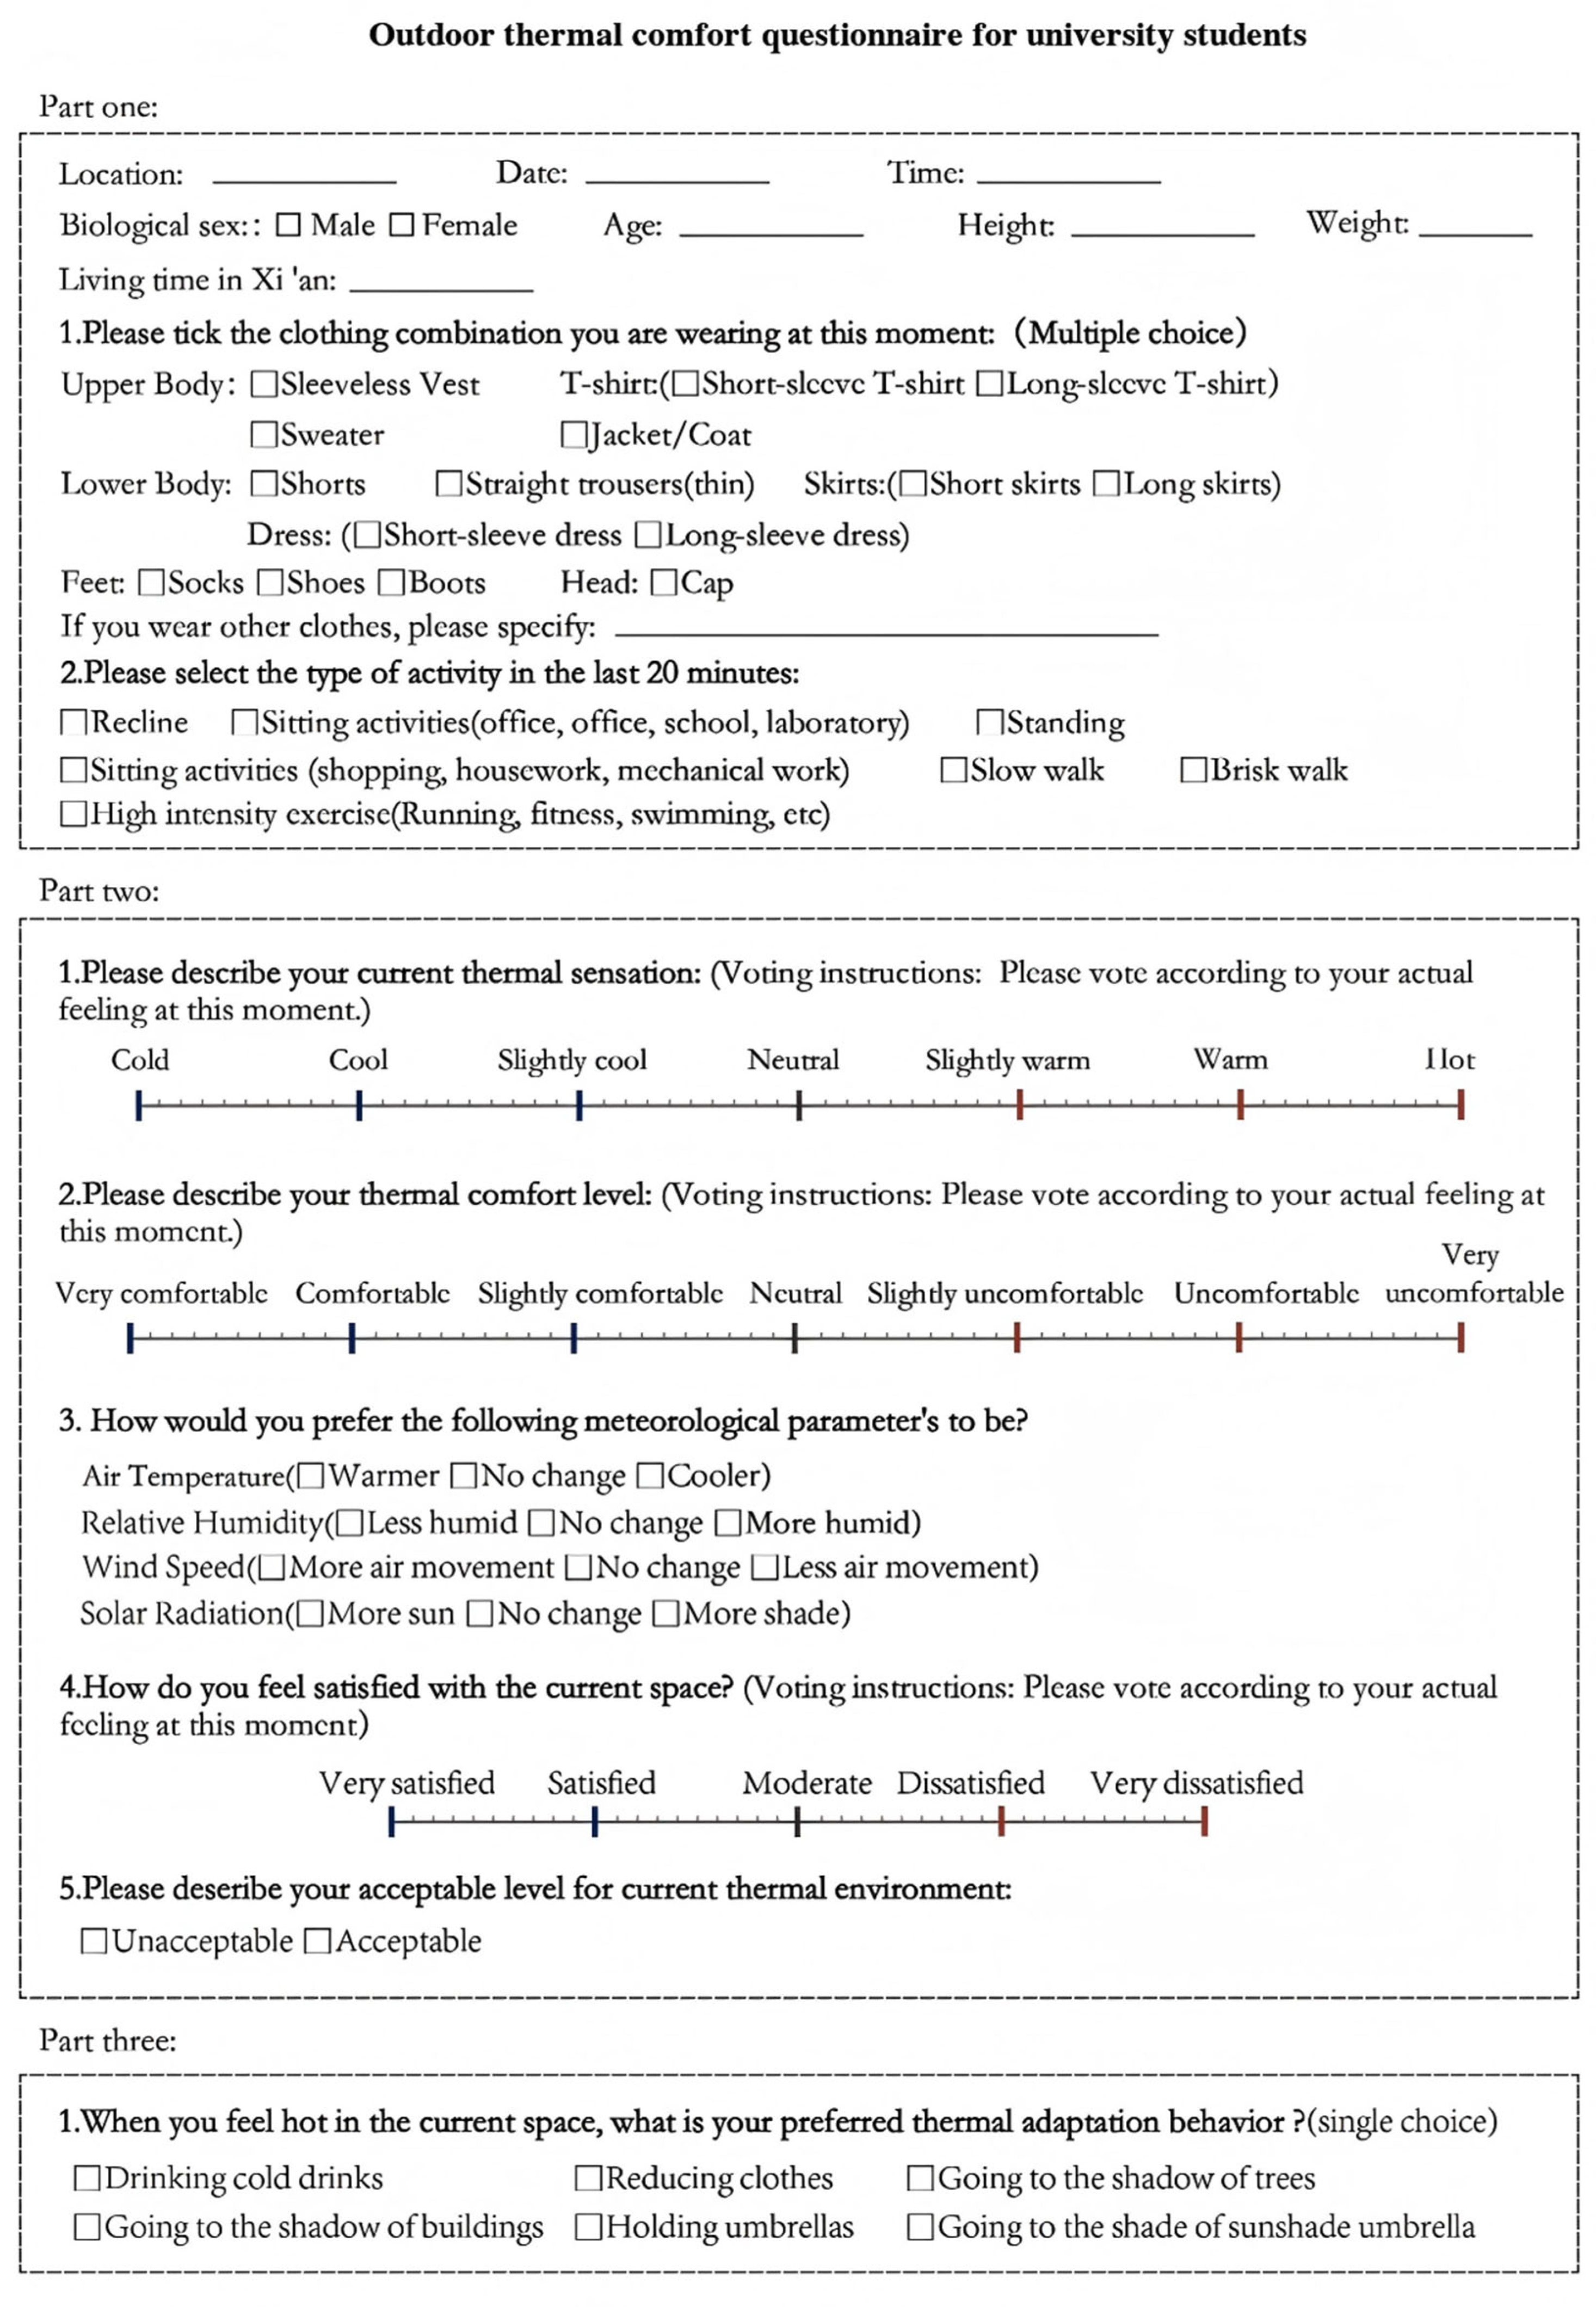
The study commenced with the collection of demographic data from students, including gender, age, clothing, height, and weight (Body Mass Index, BMI), as well as their local residential history and activities they had engaged in during the preceding 20 min. The evaluation of clothing insulation conformed to ASHRAE Standard 55 and ISO 7730 specifications [25,27] (Figure 3). Subsequently, we assessed the thermal perceptions of the students. This assessment included their thermal sensations, comfort levels, and meteorological parameter preferences, employing the ASHRAE 7-point scale for thermal sensation and comfort, and a 3-point scale for meteorological preferences. In the final part of the questionnaire, students were prompted to engage in spontaneous outdoor activities and select their initial thermal adaptation responses. These responses included options such as consuming cold beverages, adjusting their clothing, seeking shade under trees, buildings, or sunshades, and using umbrellas. The questionnaire was conducted in Chinese. the thermal sensation (cold (−3), cool (−2), slightly cool (−1), neutral (0), slightly warm (+1), warm (+2), hot (+3)). Thermal comfort is also indicated by a 7-level scale (very uncomfortable (−3), uncomfortable (−2), slightly uncomfortable (−1), neutral (0), slightly comfortable (+1), comfortable (+2), very comfortable (+3)). Meteorological parameters preference votes include Ta, RH, G and Va. These meteorological parameters are expressed with a 3-level scale (smaller (−1), unchanged (0), larger (+1)) (Figure 4).
The experiment involved an investigator positioned with an unobstructed view of the entire area, allowing for direct observation and recording of the number, type, trajectory, and spatial distribution of student activities across four distinct spaces. The count included only those students who remained in these spaces for more than five minutes.

2.3. Thermal Index

In this study, the UTCI was selected as the primary thermal comfort assessment tool over other indices such as PET or SET [28]. UTCI is an effective index for evaluating outdoor thermal comfort because it integrates multiple meteorological parameters, including air temperature, relative humidity, wind speed, and solar radiation. Unlike PET or SET, which often rely heavily on steady-state indoor reference environments, UTCI accounts for the human body’s dynamic adaptive responses to complex thermal environments and is particularly suitable for assessing the thermal stress experienced by individuals in dynamic outdoor settings, such as university campuses [29].
UTCI values were calculated using the RayMan software (RayMan 2.0, Freiburg, Germany) [30,31], which simulates the impact of the aforementioned meteorological parameters on human thermal sensations. To ensure simulation accuracy and reproducibility, the physiological and behavioral parameters in the RayMan model were configured based on the average demographic data obtained from our survey: age (20.4 years), weight (65.0 kg), and height (1.70 m). The clothing thermal resistance was set to 0.45 clo (representing the average summer clothing insulation of the respondents). The metabolic rate was set to 1.2 met (approximately 70 W/m2), reflecting the predominant light outdoor activities (e.g., sitting, reading, and walking at a normal pace) recorded during the observation periods. The model allows for the assessment of how students’ thermal comfort changes across different campus spaces, taking into account the local climatic conditions. The mean radiant temperature (Tmrt) parameters, necessary for UTCI calculation, are estimated according to Equation (1):
T mrt   = T g   +   273 4   +   1.10   ×   10 8 V a 0.6 ε D 0.4 T g     T a 1 4 273
where D is the diameter of the globe (D = 0.05 m in this study), ε Is the emissivity (for the black globe, ε = 0.95).

2.4. Statistical Analysis

Data analysis was conducted using standard statistical software. To calculate the Neutral UTCI (NUTCI) and evaluate the relationships between meteorological parameters and thermal sensations, regression and correlation analyses were utilized. Because the 902 valid survey responses were generated by 602 unique individuals, treating all data points as strictly independent violates the assumption of independent observation (pseudo-replication). To control for this repeated-measures effect, Linear Mixed-Effects Models (LMM) were employed to validate the regression analyses. In these models, the unique Participant_ID was set as a random intercept to account for intra-subject variance, while meteorological parameters were treated as fixed effects.

3. Results

3.1. Changes in Thermal Acclimatization of Students in Different Locations

3.1.1. Physiological Characteristics

A total of 1024 questionnaires were distributed, yielding 902 valid responses. Because the field survey was conducted over several months within the same university campus, some subjects participated in the study multiple times. Consequently, these 902 valid questionnaires were generated by a total of 602 unique individual respondents (367 males and 235 females). The demographic characteristics reported in Table 3 are based on these 602 unique participants. We calculated the total number of valid responses for different months and locations (Table 4). During the test, the average clothing thermal resistance was 0.5 ± 0.3 clo for men and 0.5 ± 0.3 clo for women. The overall average garment thermal resistance was 0.4 ± 0.2 clo (Table 4).

3.1.2. Thermal Sensation Vote (TSV) and Thermal Comfort Vote (TCV)

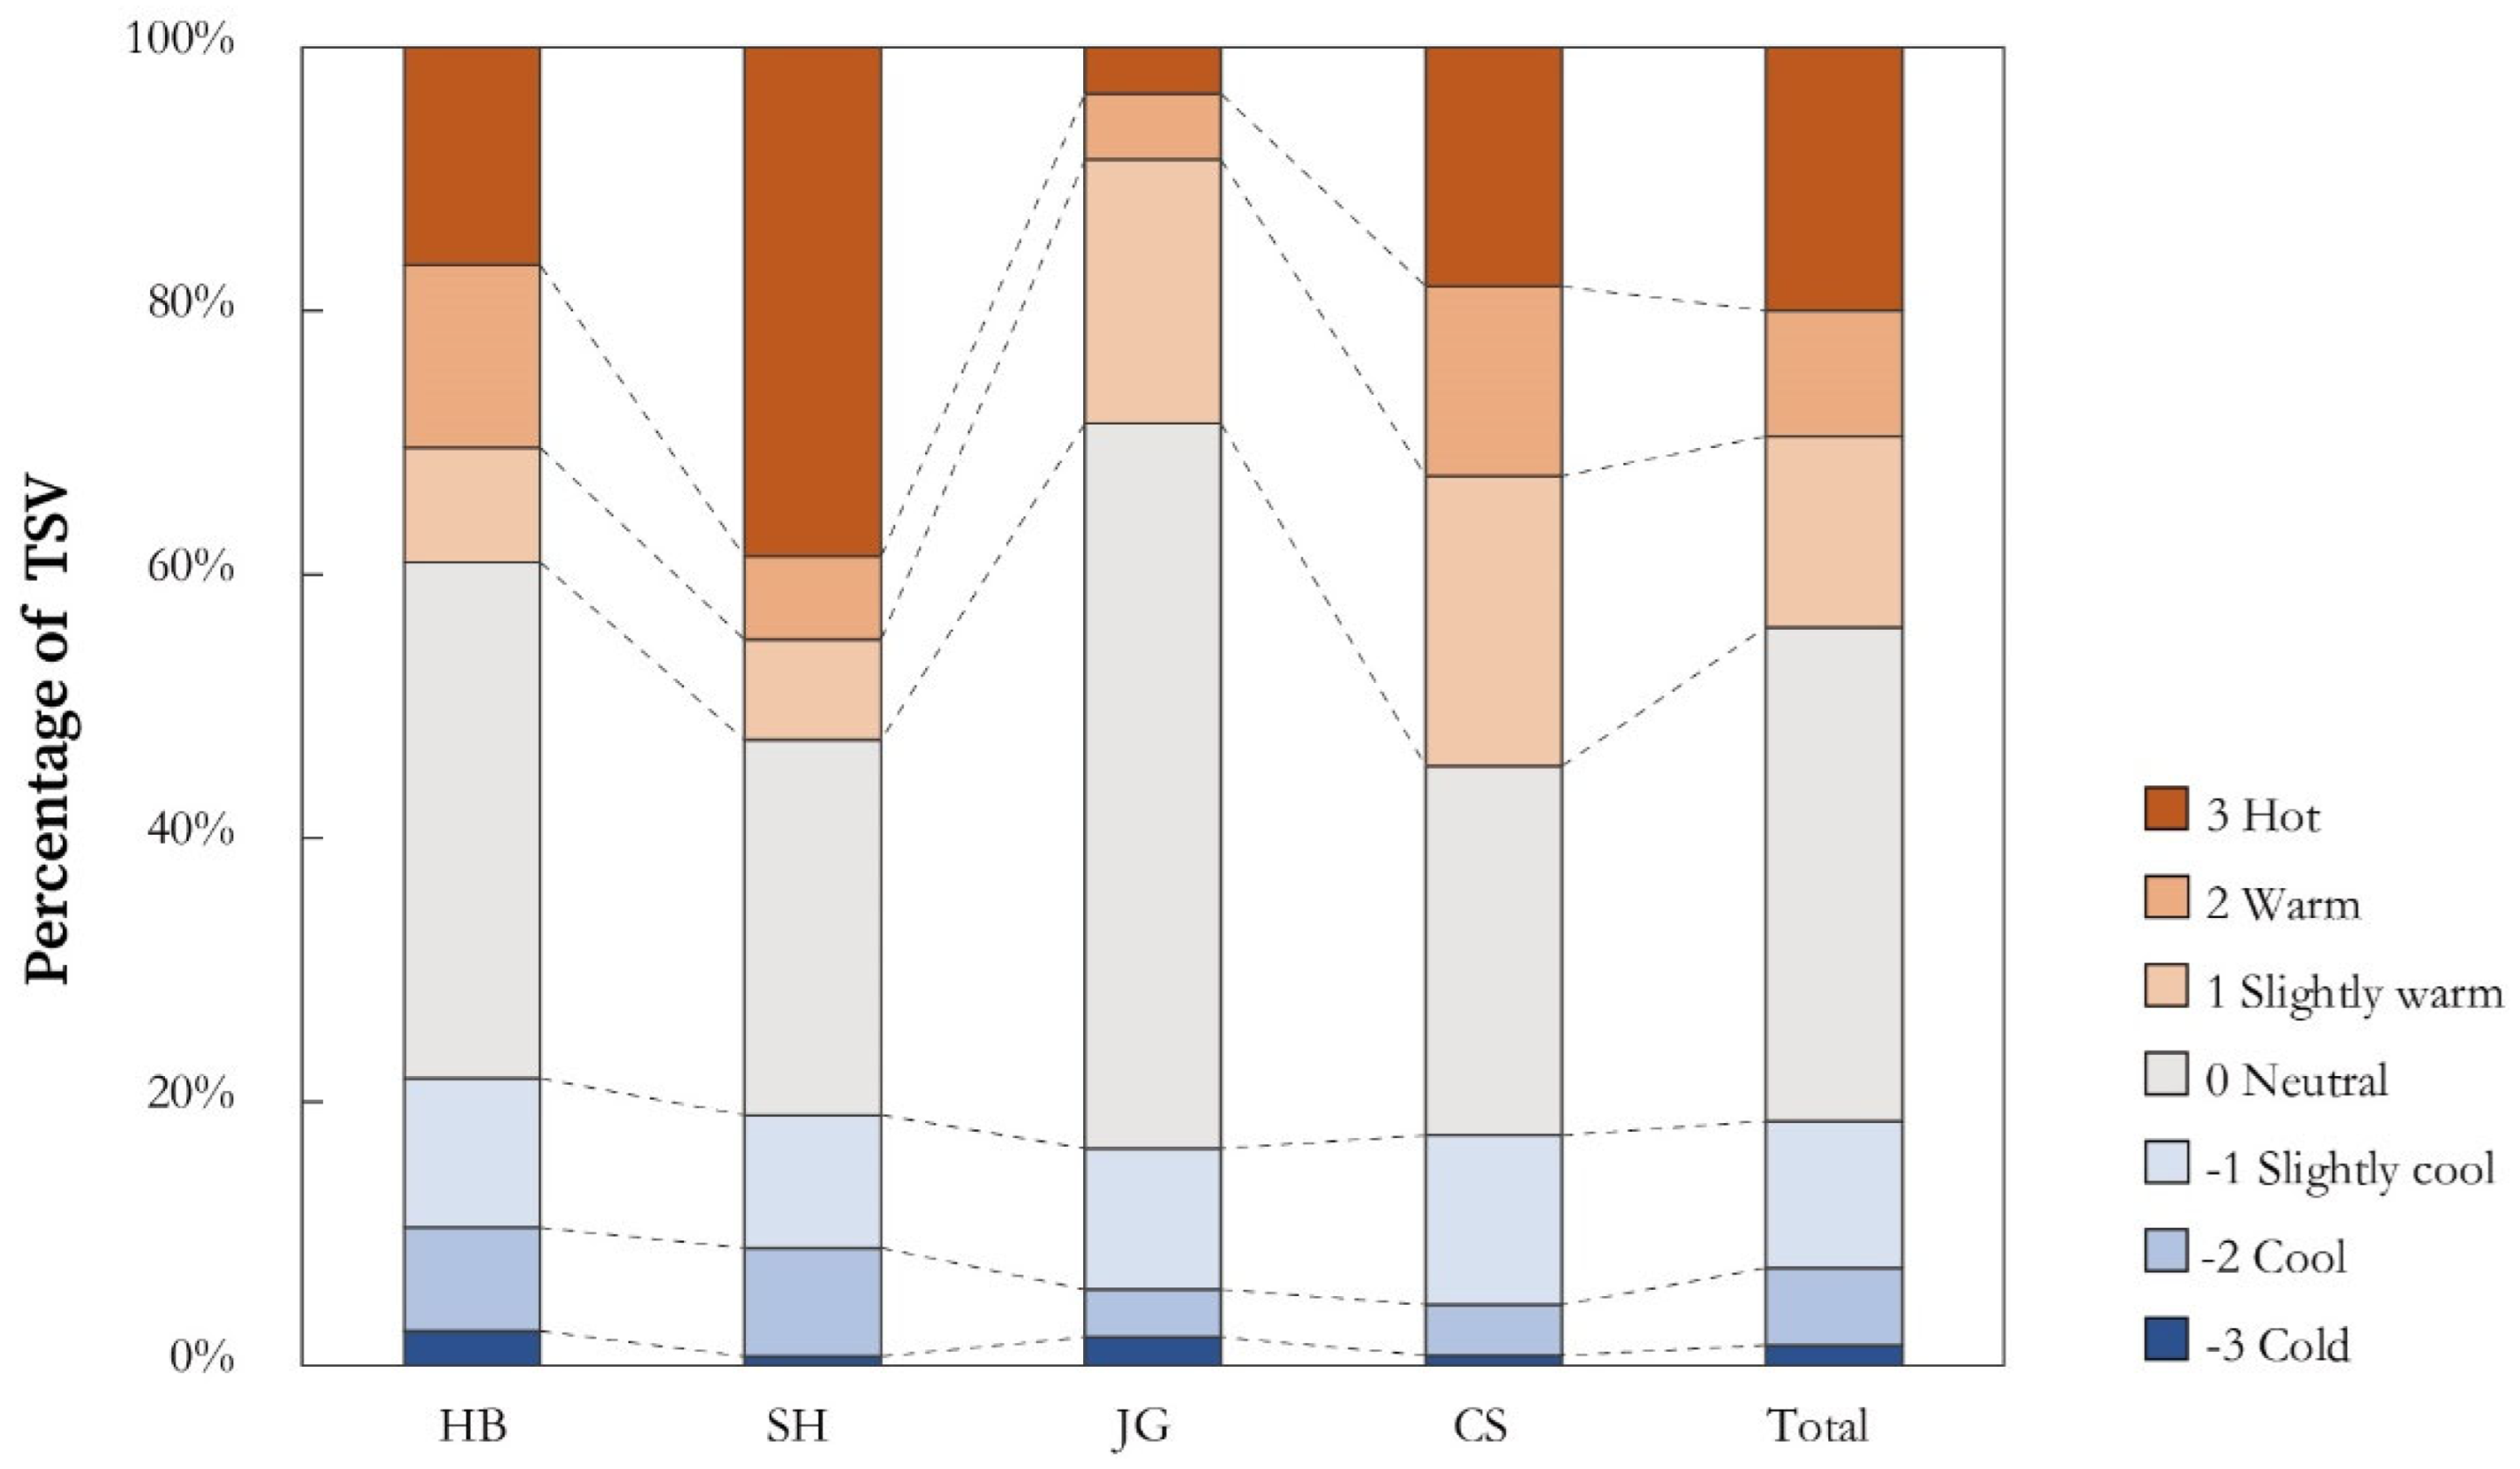
During the summer, the predominant thermal sensation vote among students was “neutral” (37.43%), followed by “hot” (14.50%) and “slightly warm” (14.50%). In the HB space, most students reported a “neutral” sensation (39.13%), followed by “hot” (16.52%) and “warm” (13.91%). In the SH space, the highest proportion of students felt “hot” (38.61%), while 28.48% felt “neutral.” In the JG space, most students reported feeling “neutral” (55.00%), followed by “slightly warm” (20%) and “slightly cool” (10.71%). In the CS space, students’ thermal sensation votes were predominantly “neutral” (28.03%), “slightly warm” (21.97%), and “hot” (18.18%). More students felt heat in the CS and SH spaces compared to the HB and JG spaces (Figure 5).
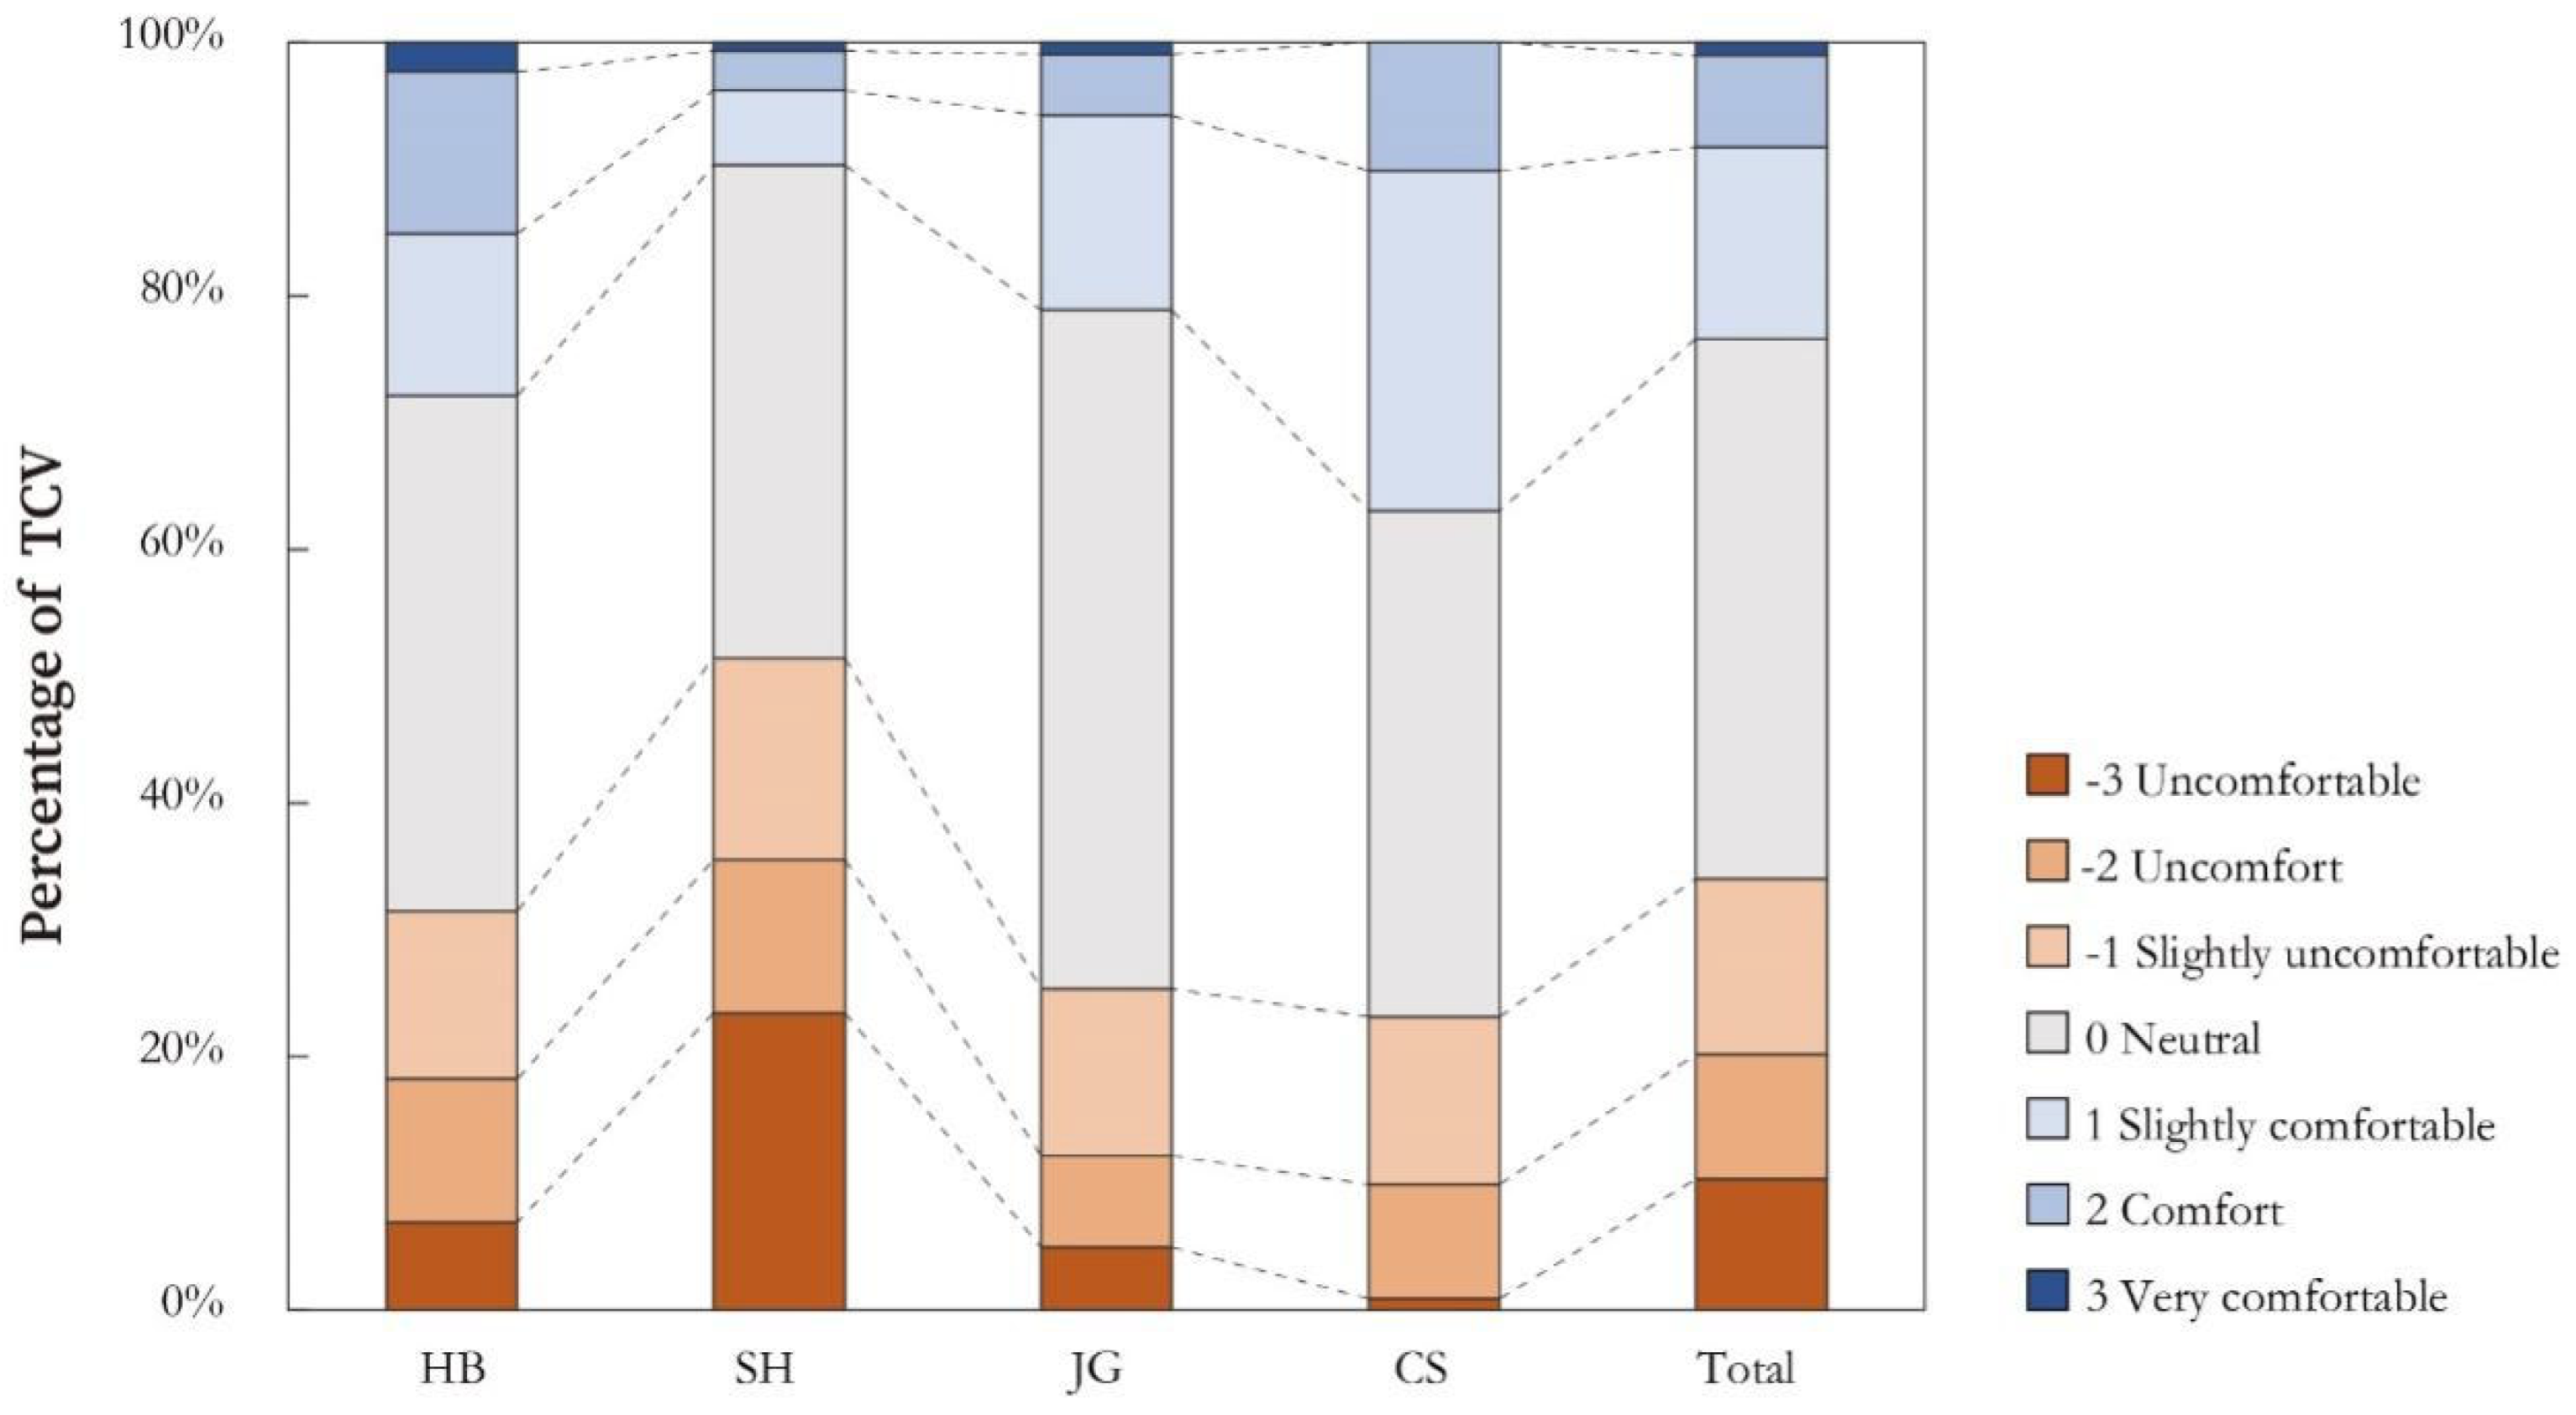
Among the HB and JG spaces, the largest proportion of students reported feeling “neutral” (40.87% and 53.96%, respectively). The proportion of students who felt uncomfortable exceeded that of those who felt comfortable. In the SH space, the majority of students felt uncomfortable (51.59%), followed by a “moderate” comfort level (38.22%), with the smallest proportion of students feeling comfortable (10.19%). In the CS space, students’ thermal comfort votes predominantly indicated “neutral” (40.46%), with a higher proportion feeling comfortable (36.64%) than uncomfortable (22.90%). The proportion of students experiencing thermal discomfort in the HB and SH spaces was greater than in the JG and CS spaces. Overall, during the summer, the proportion of students who felt uncomfortable due to heat (33.94%) was higher than that of students who felt comfortable (22.34%) (Figure 6).

3.1.3. Neutral UTCI (NUTCI) and Neutral UTCI Range (NUTCIR)

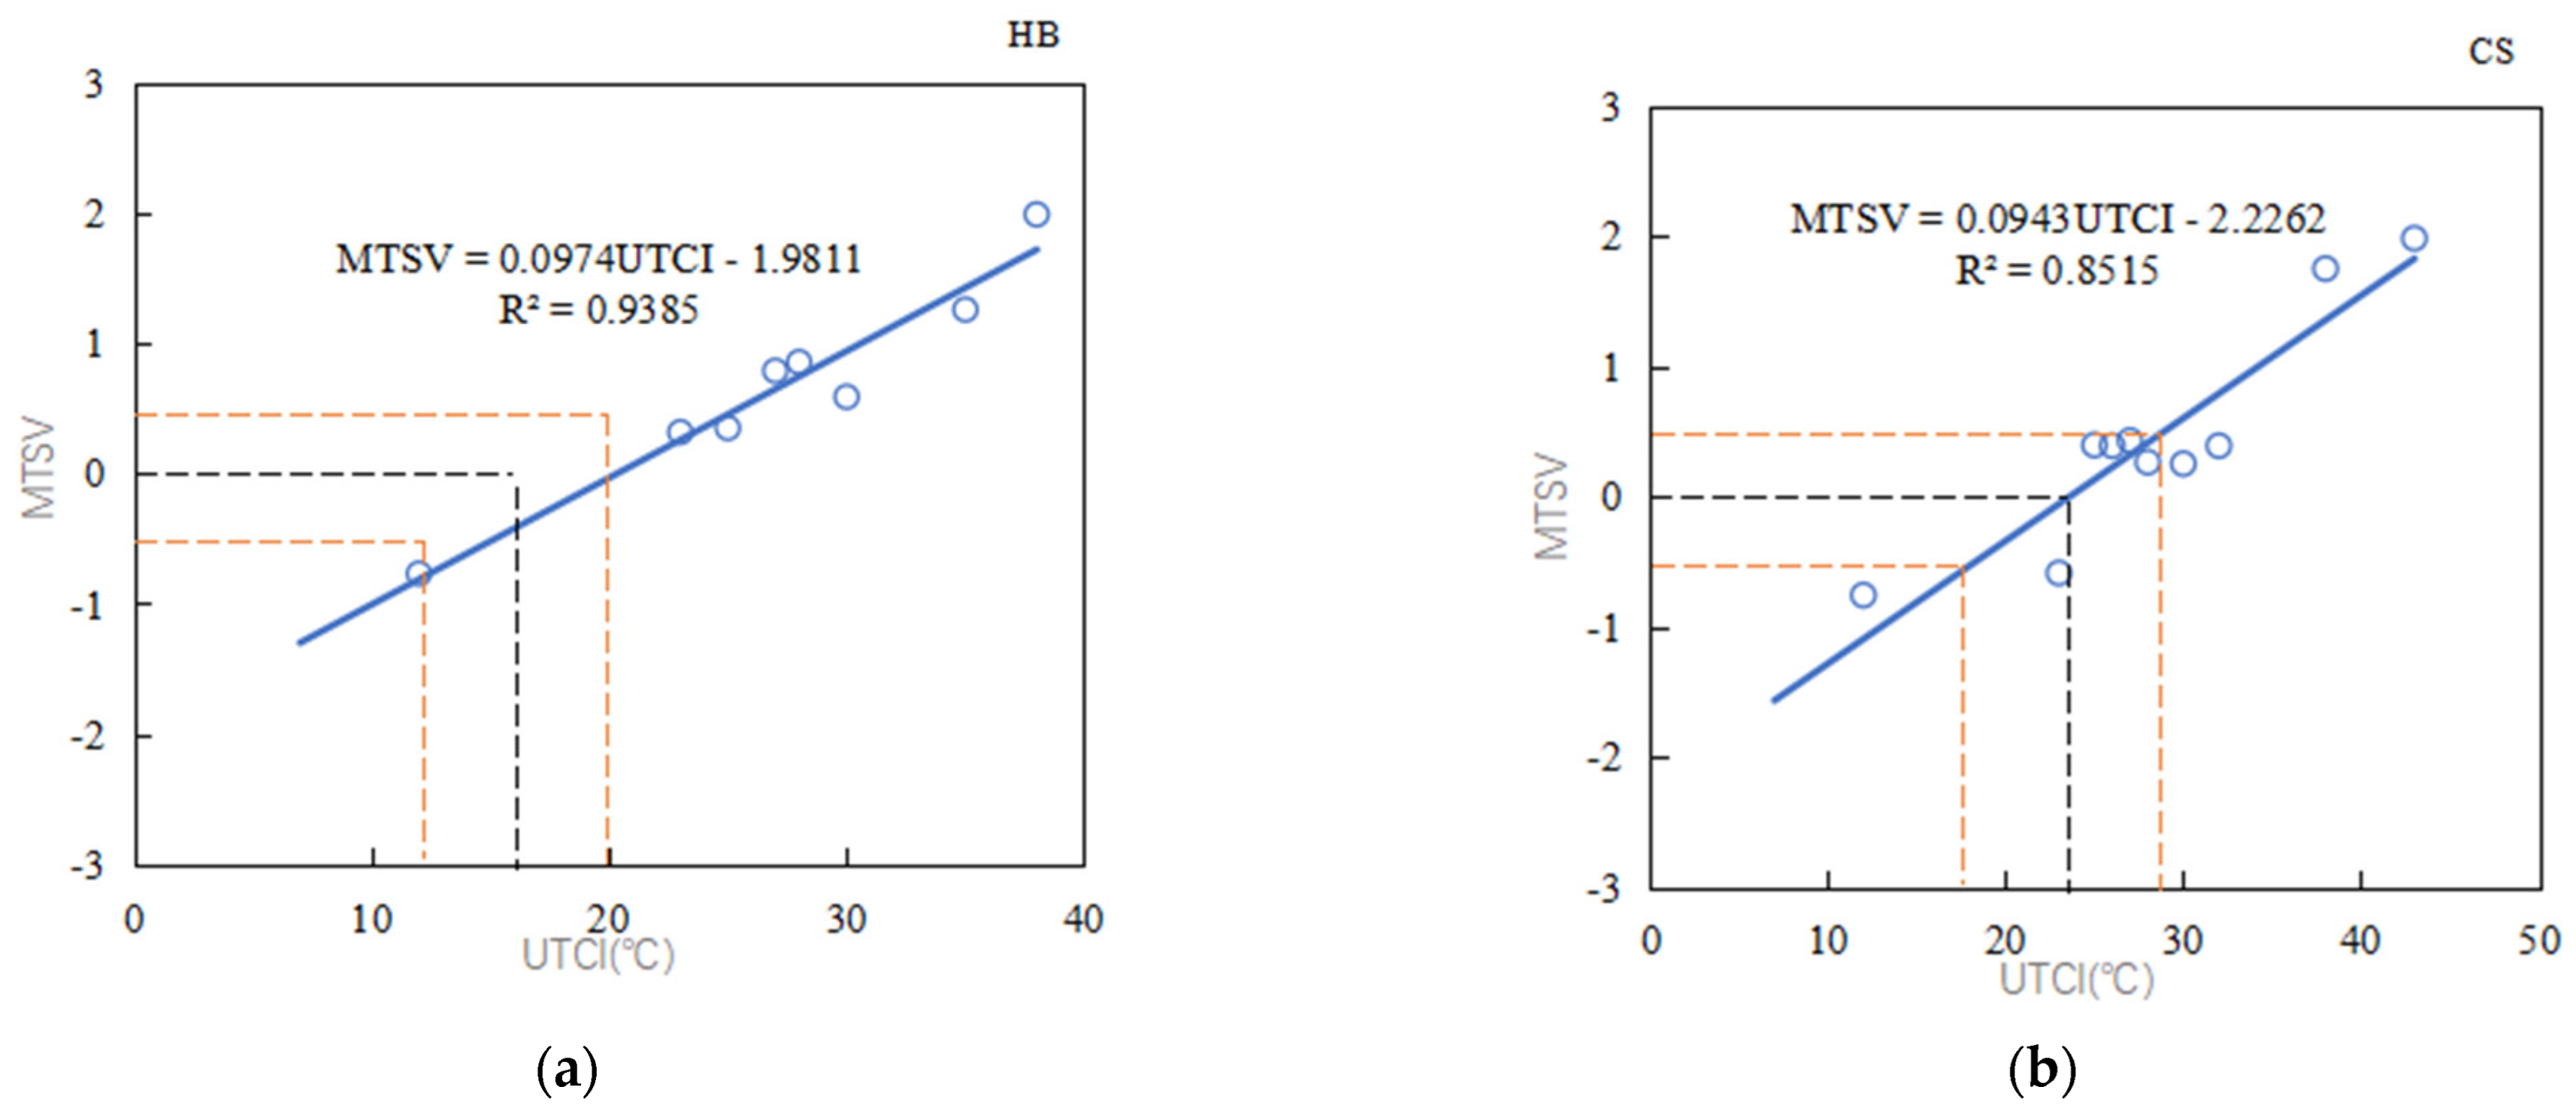
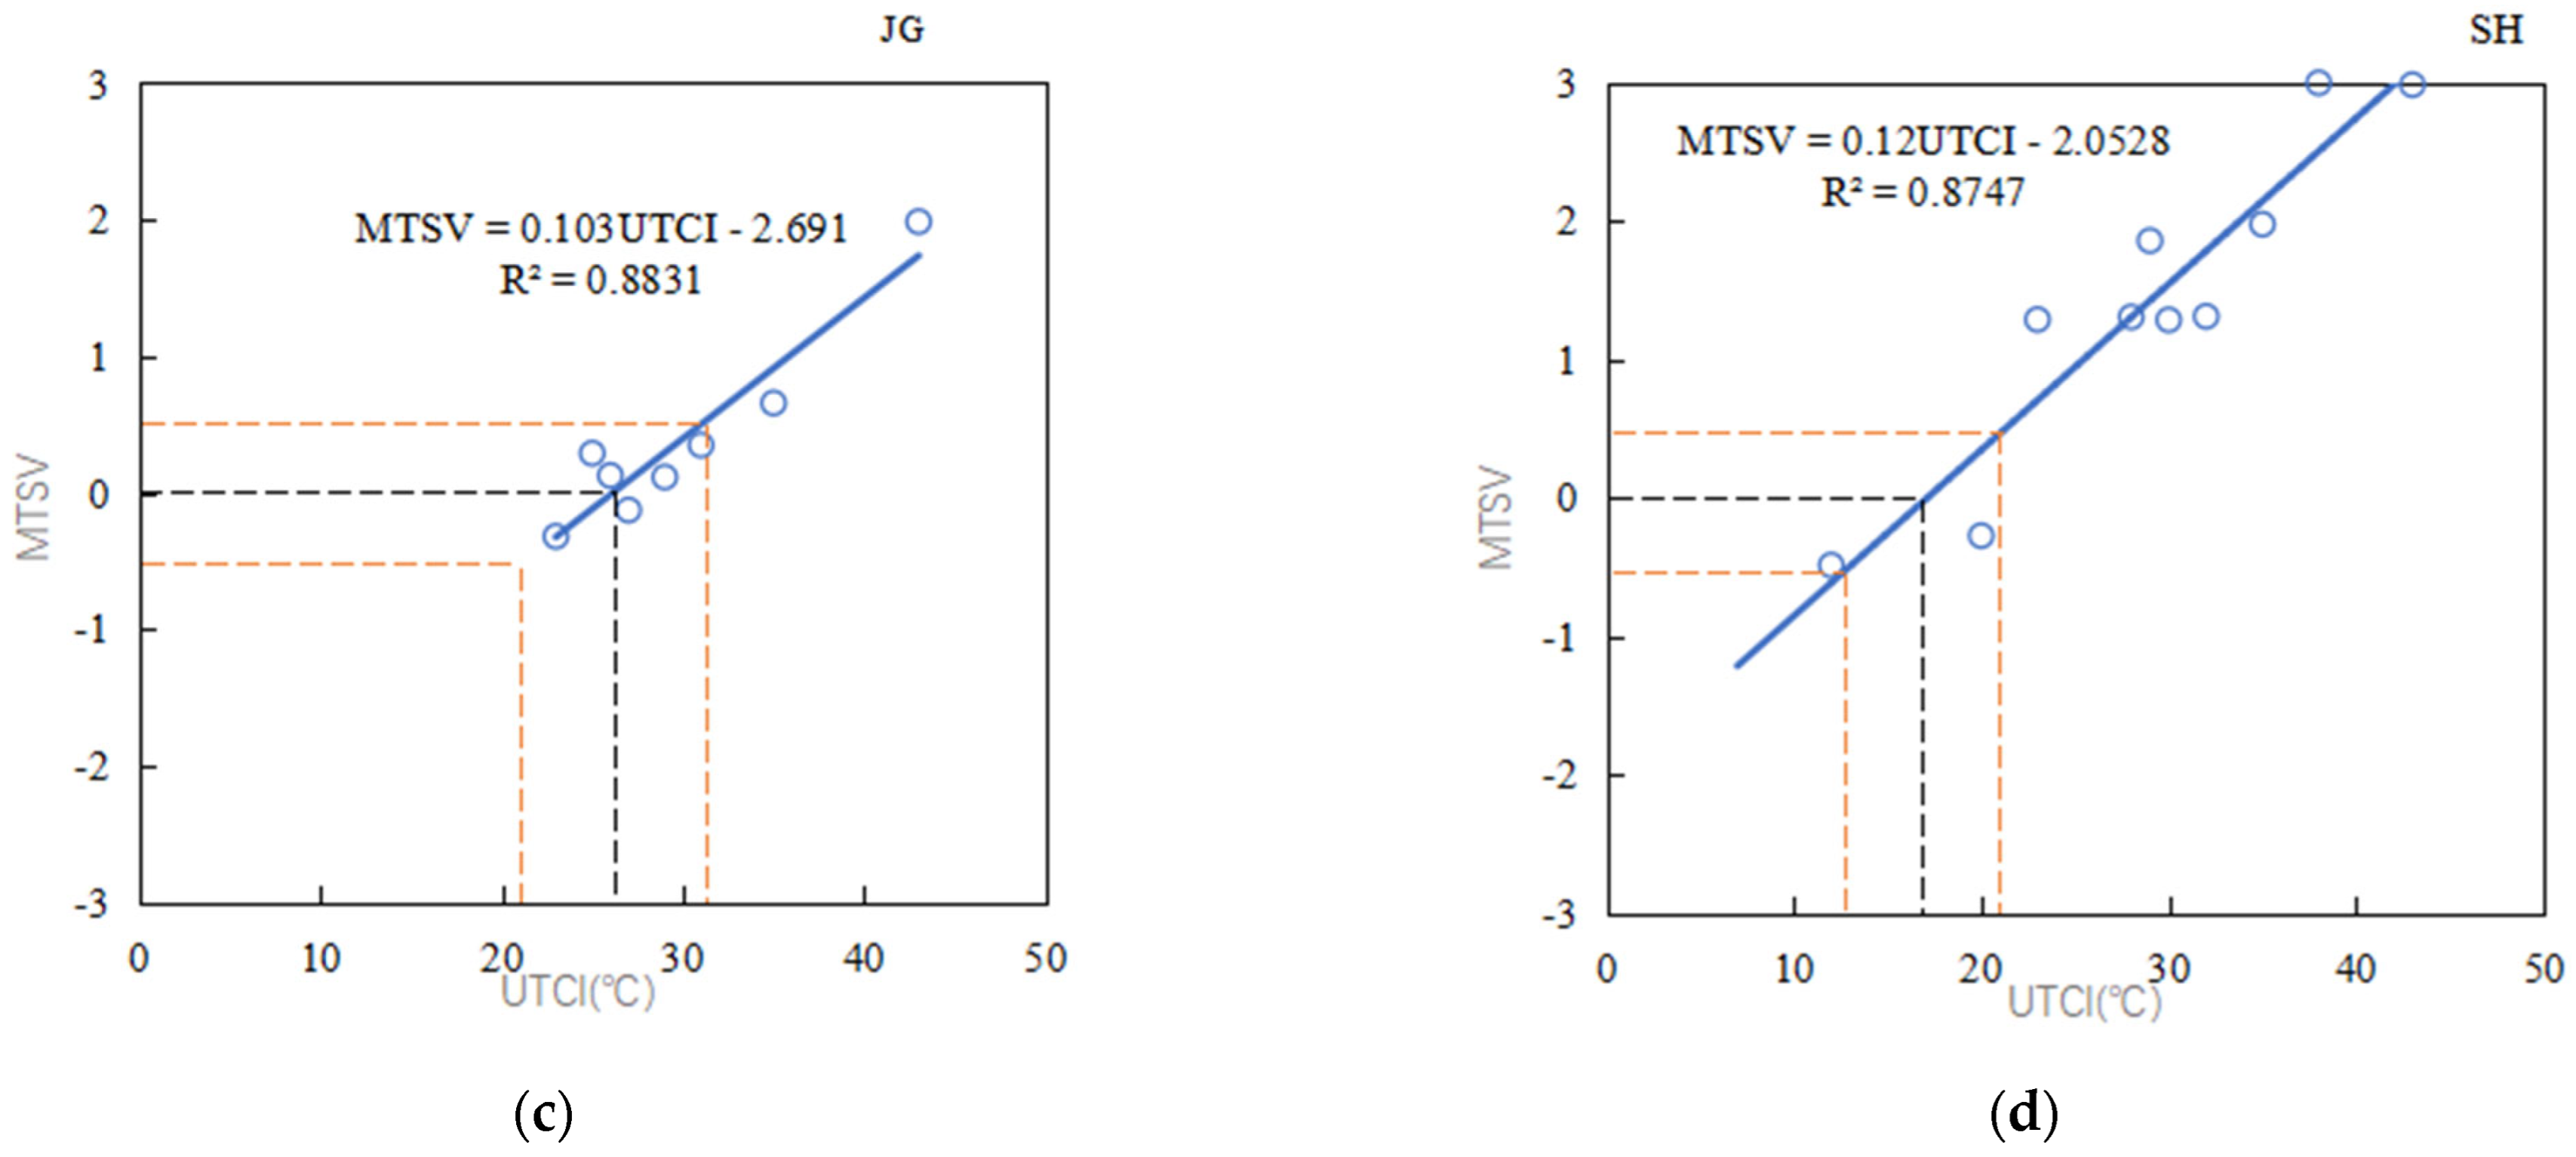
We calculated the weighted mean Thermal Sensation Vote (MTSV) for each 1 °C UTCI interval in four different spaces and plotted these values [32] (Figure 7). Specifically, the linear regression fits were derived from 8 UTCI bins for the HB space,10 bins for the CS space, 8 bins for the JG space, and 10 bins for the SH space. The R2 values for all four spaces exceed 0.85, indicating that UTCI reliably reflects the actual thermal sensations of the students. To control for the pseudo-replication effect stemming from the repeated participation of some subjects, a Linear Mixed-Effects Model (LMM) with participant ID as a random intercept was applied to validate these ordinary least squares (OLS) regressions. The LMM analysis confirmed that intra-subject variance was negligible due to the low average repetition rate (1.49 responses per person). The fixed-effects slopes remained statistically consistent with the OLS estimations. Therefore, the standard linear regression equations effectively and robustly calculate the thermal sensitivity across different spaces. In the HB space, the slope of the linear regression equation between MTSV and UTCI is 0.0974. In the CS space, the slope is 0.0943. The slope for JG space students is 0.103, and for SH space students, it is 0.12 (Equations (2)–(5)). These findings show that students’ thermal sensitivity varies across different spaces, with the highest sensitivity in the SH space, followed by the JG and HB spaces, and the lowest sensitivity in the CS space. NUTCI represents the temperature at which individuals feel neither hot nor cold [33]. When MTSV = 0, the NUTCI values for the four spaces are 20.34 °C (HB), 23.61 °C (CS), 26.13 °C (JG), and 17.11 °C (SH). There are considerable differences among these spaces. NUTCIR denotes the temperature range where the TSV is between −0.5 and 0.5. By substituting MTSV = ±0.5 into the regression equations, the NUTCIR values for the four spaces are 15.21–25.47 °C (HB), 18.31–28.91 °C (CS), 21.27–30.98 °C (JG), and 12.94–21.27 °C (SH). The SH space has the lowest lower and upper limits of NUTCIR. Compared to the JG space, the SH space has a NUTCIR lower limit that is 8.33 °C lower and an upper limit that is 9.71 °C lower. The neutral temperature ranges vary significantly across the different spaces (Table 5).
HB :   MTSV   = 0.0974   UTCl     1.9811   ( R 2 = 0.9385 ,   p   <   0.001 )
CS :   MTSV   = 0.0943   UTCl   2.2262   ( R 2 = 0.8515 ,   p   <   0.001 )
JG :   MTSV   = 0.103   UTCl     2.691   ( R 2 = 0.8831 ,   p   <   0.001 )
SH :   MTSV   = 0.12   UTCl     2.0528   ( R 2 = 0.8747 ,   p   <   0.001 )

3.1.4. Preferred UTCI

The Preferred UTCI identifies the precise thermal equilibrium where subjects actively desire zero change to their atmospheric environment [34]. We extracted this metric by routing the fractional votes for “getting hot” versus “getting cold” through a standard Probit regression model [35].
Given that Probit models rely on cumulative probability distributions, managing the neutral (“no change”) responses is mathematically sensitive. Summarily discarding these neutral votes would distort the dataset, artificially driving dissatisfaction metrics toward 100% across the thermal spectrum and yielding a regression heavily skewed by outlier extremes. To circumvent this, and in strict alignment with foundational thermal comfort protocols [35], the “no change” responses were equally partitioned (50/50) into the warming and cooling probability groups. This mathematical assumption posits a symmetric latent preference among satisfied users, effectively anchoring the intersection of the two probability curves directly to the peak density of the population’s actual satisfaction.
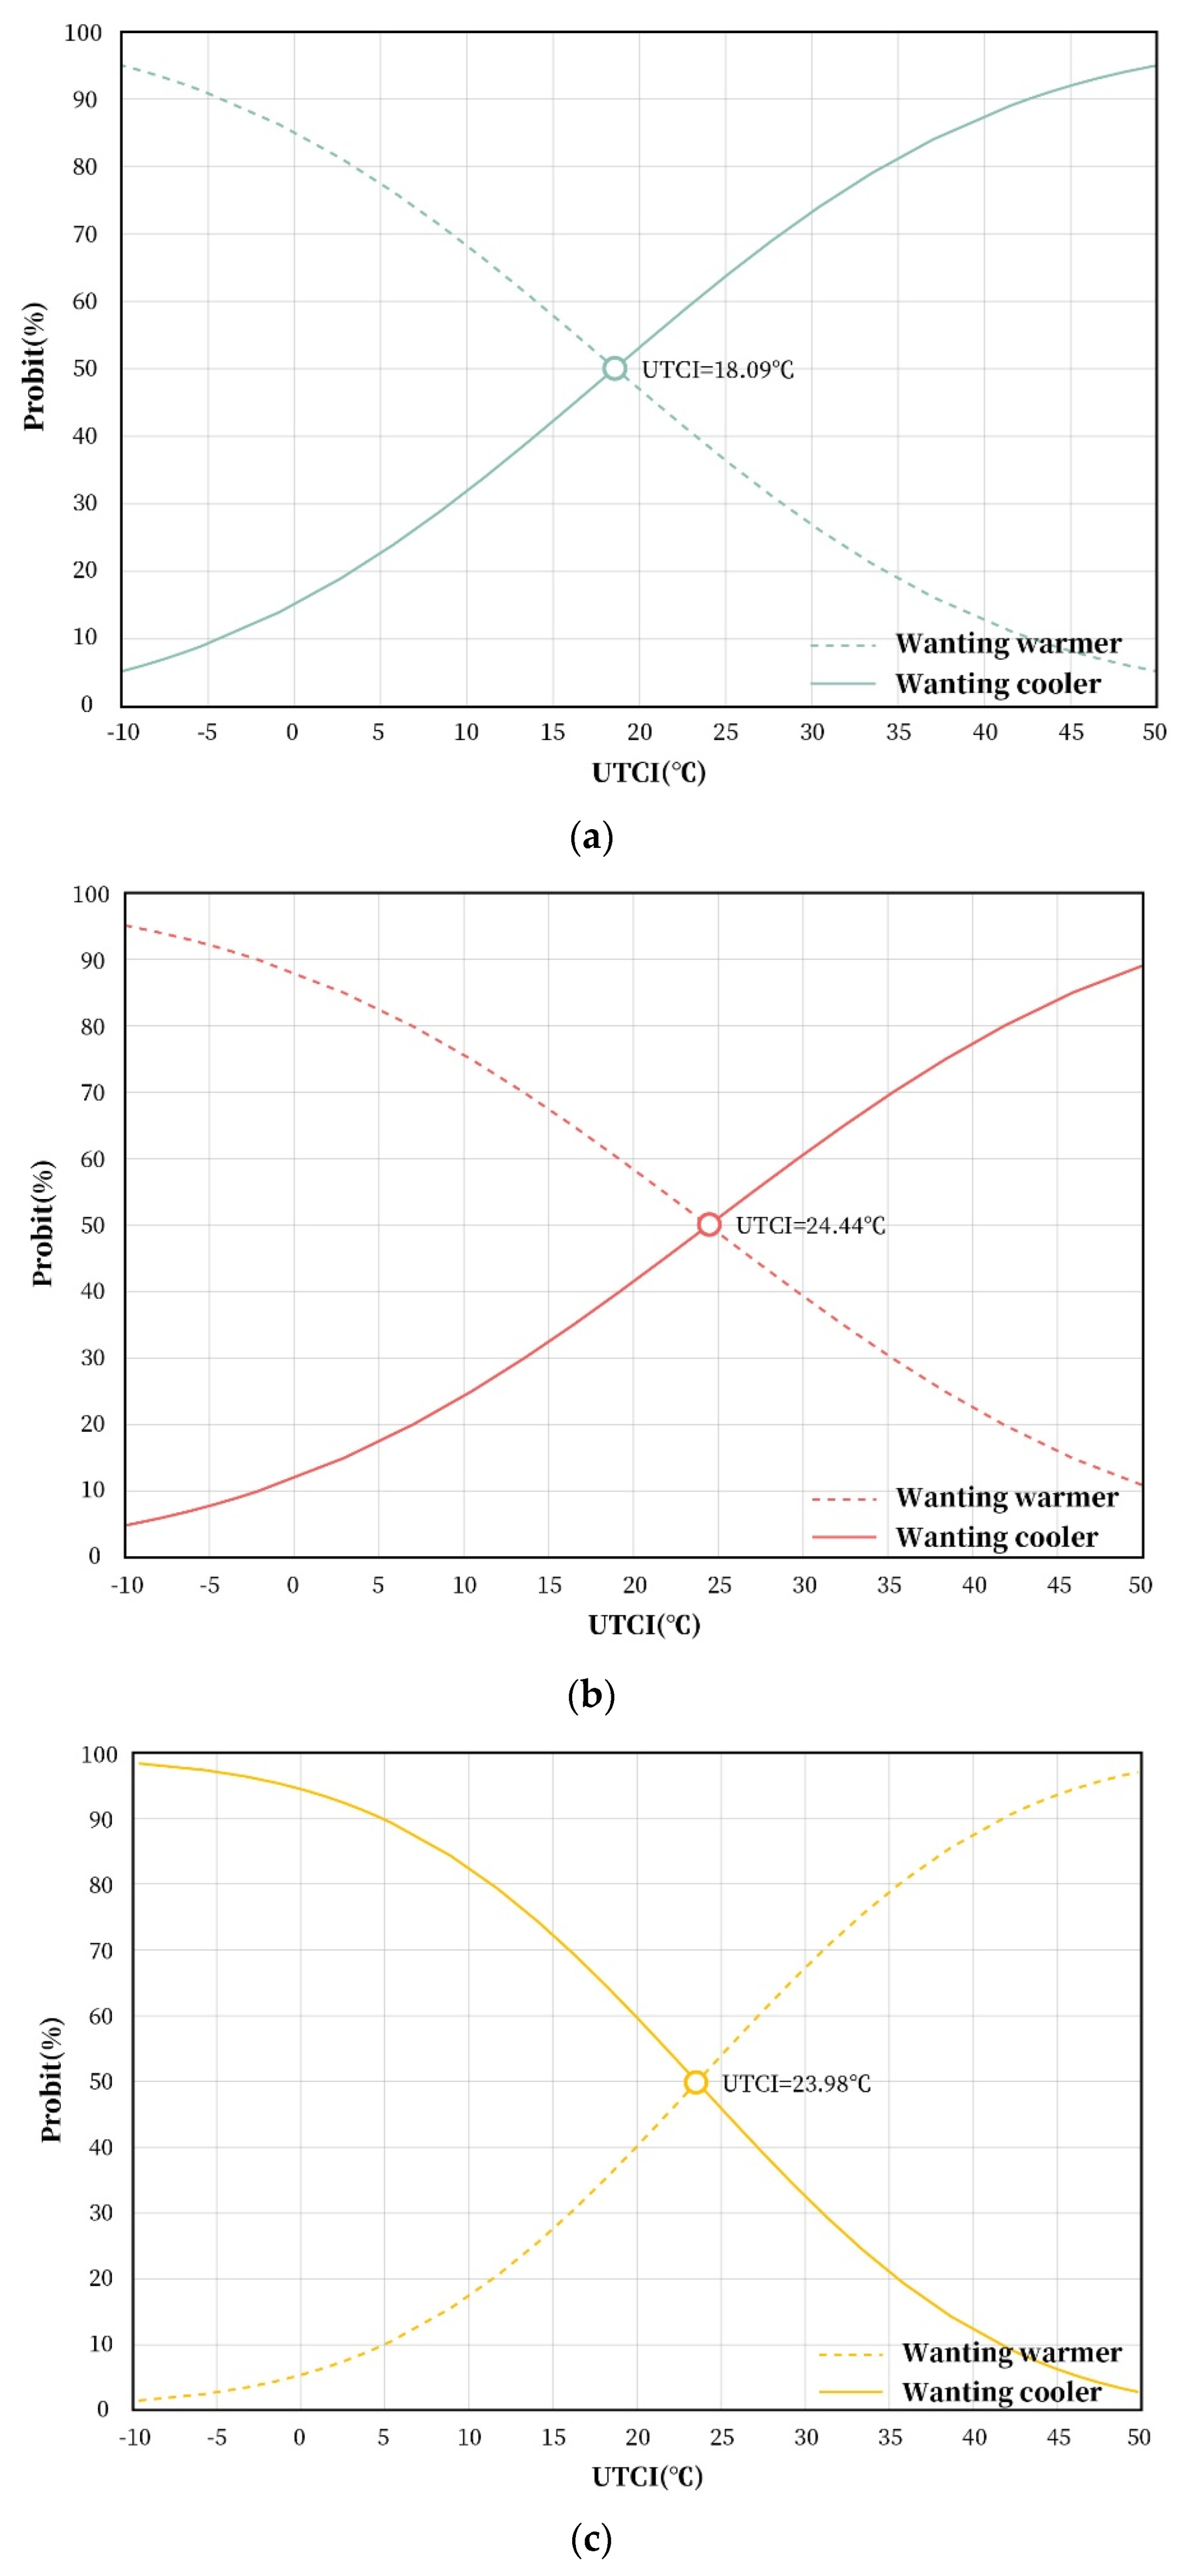
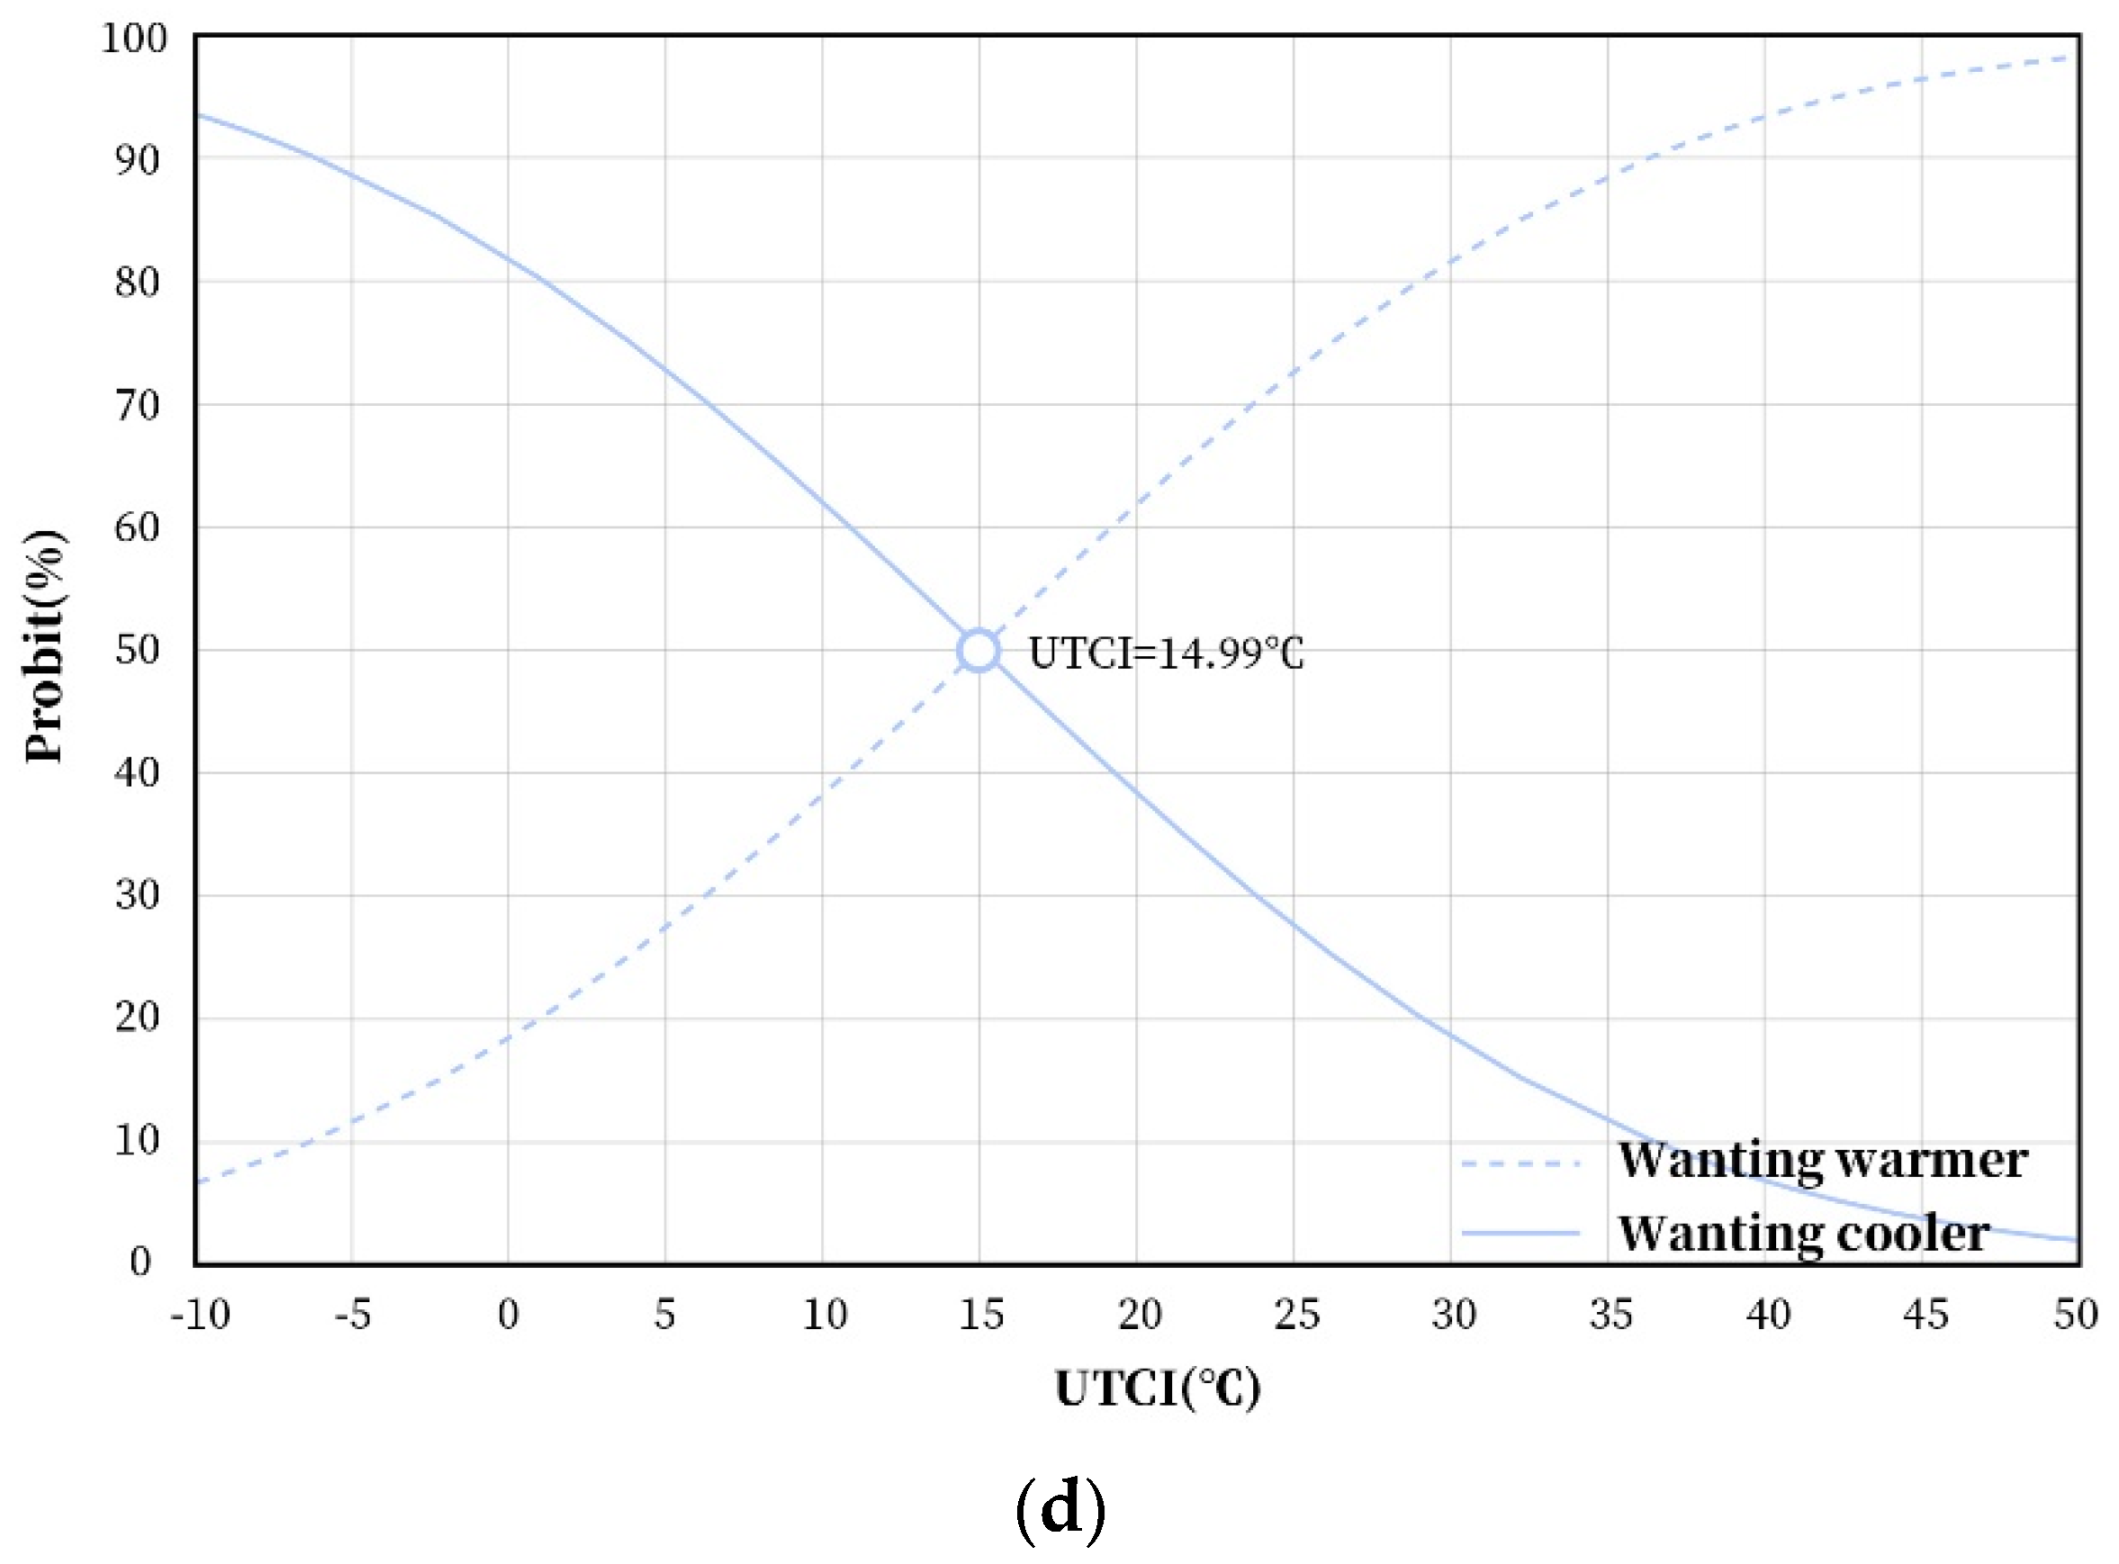
The resulting regression intersections established the Preferred UTCI at 18.09 °C (HB), 24.44 °C (CS), 23.98 °C (JG), and 14.99 °C (SH). The remarkably suppressed preference in the SH space (14.99 °C) firmly highlights an acute psychological demand for aggressive cooling interventions to combat the intense radiant heat of the unshaded concrete (Figure 8).

3.2. Relationships Between Meteorological Parameters in Different Locations and Students’ Thermal Sensation

3.2.1. Meteorological Parameters

The air temperature (Ta) is significantly different among the four spaces. The largest temperature variation is observed in space SH, likely due to its hard underlying surface and lack of shade. The average Ta in the CS space is the highest at 26.17 °C, while the average Ta in the HB space is the lowest at 23.79 °C. The average relative humidity is highest in the CS space at 62.71% and lowest in the JG space at 53.86%. This difference is possibly due to a pool on the south side of the CS space, which increases environmental humidity through water evaporation, along with the humidity boost from the rich vegetation’s transpiration. The wind speed (Va) is highest in space SH at 0.73 m/s and lowest in the HB space at 0.18 m/s, likely because SH is open on all sides while HB is only open on one side and located in a sunken terrain. Solar radiation levels are 120.48 W/m2 in the JG space and 151.85 W/m2 in the CS space, both of which are lower than those in HB (255.97 W/m2) and SH (243.38 W/m2). This discrepancy is attributed to the shade provided by buildings and vegetation in the JG and CS spaces (Table 6).

3.2.2. Meteorological Parameters and TSV

Extant literature consistently identifies ambient air temperature (Ta), relative humidity (RH), localized wind velocity (Va), and globe temperature (Tg) as the foundational meteorological determinants governing human thermal perception in open urban environments [36]. To quantify the statistical alignment between these exact variables and our cohorts’ Thermal Sensation Votes (TSV), we applied a non-parametric Spearman rank-order correlation framework (Table 7).
Within the stagnant HB space, RH exhibited the strongest positive correlation with elevated thermal sensation (R2 = 0.218, p < 0.05), closely tracked by Ta. In stark contrast, within the CS and JG spaces, G and Tg entirely dominated the heat sensation profile, while Va acted as the sole, significant negative correlate (providing vital cooling relief). In the heavily irradiated SH hardscape, Ta (R2 = 0.402, p < 0.01) and Tg (R2 = 0.472, p < 0.01) overwhelmingly dictated thermal discomfort. Consequently, while Ta and Tg universally correlate with summer heat stress, the relative severity of these drivers—and the required bioclimatic remedy—is entirely contingent upon the specific spatial geometry.

3.2.3. Preference Voting

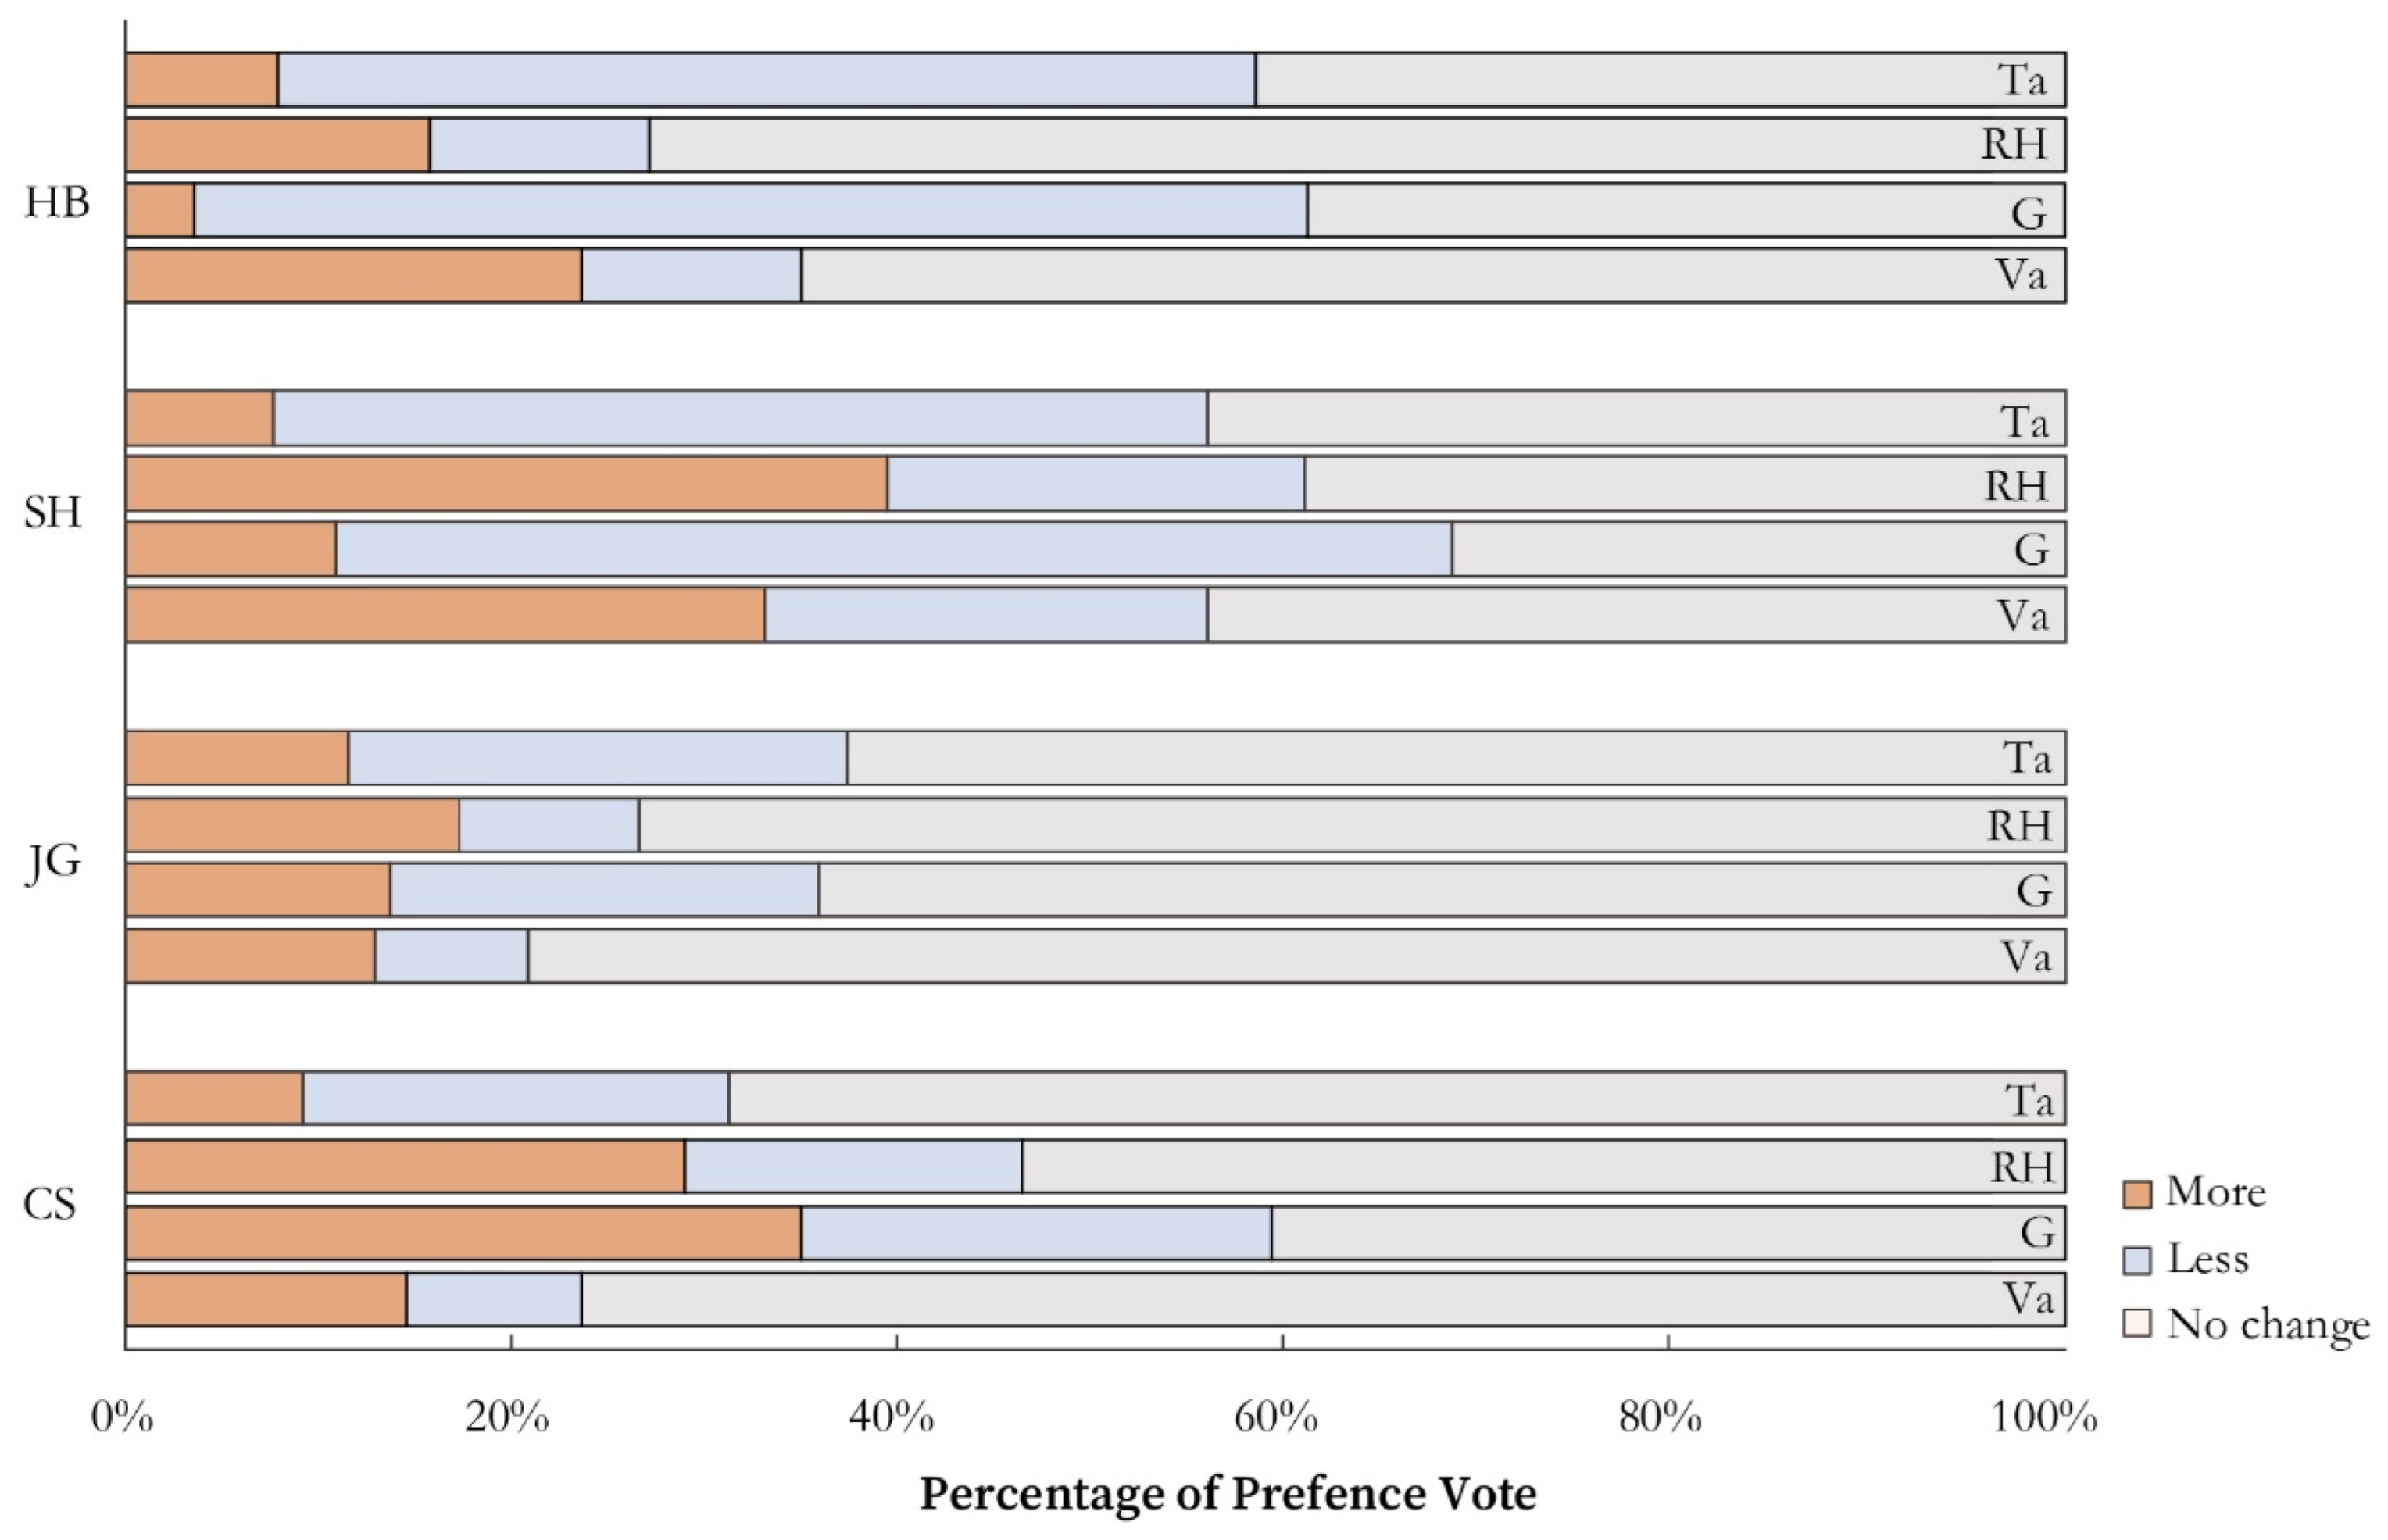
In the HB space, more than half of the students desire a decrease in Ta (50.43%). About 39.13% of the students are satisfied with G, whereas 57.39% prefer G to be smaller. Most students are satisfied with RH and Va (73.04% and 65.22%, respectively). In the SH space, a majority of students wish for G to be smaller (57.59%), and the proportion of students wanting Ta to decrease (48.10%) slightly exceeds that of those who are satisfied with it (44.30%). The proportions of students who want RH to increase and remain unchanged are equal (39.24%), with more students satisfied with Va in this space. In the JG space, most students are satisfied with Ta, RH, G, and Va. In the CS space, the majority are satisfied with Ta, RH, and Tg, with 40.91% satisfied with G and 34.85% wanting G to increase (Figure 9). These results indicate that students have varying preferences for meteorological parameters in different spaces.

3.3. Thermal Adaptation Behavior

3.3.1. Space Utilization and Attendance

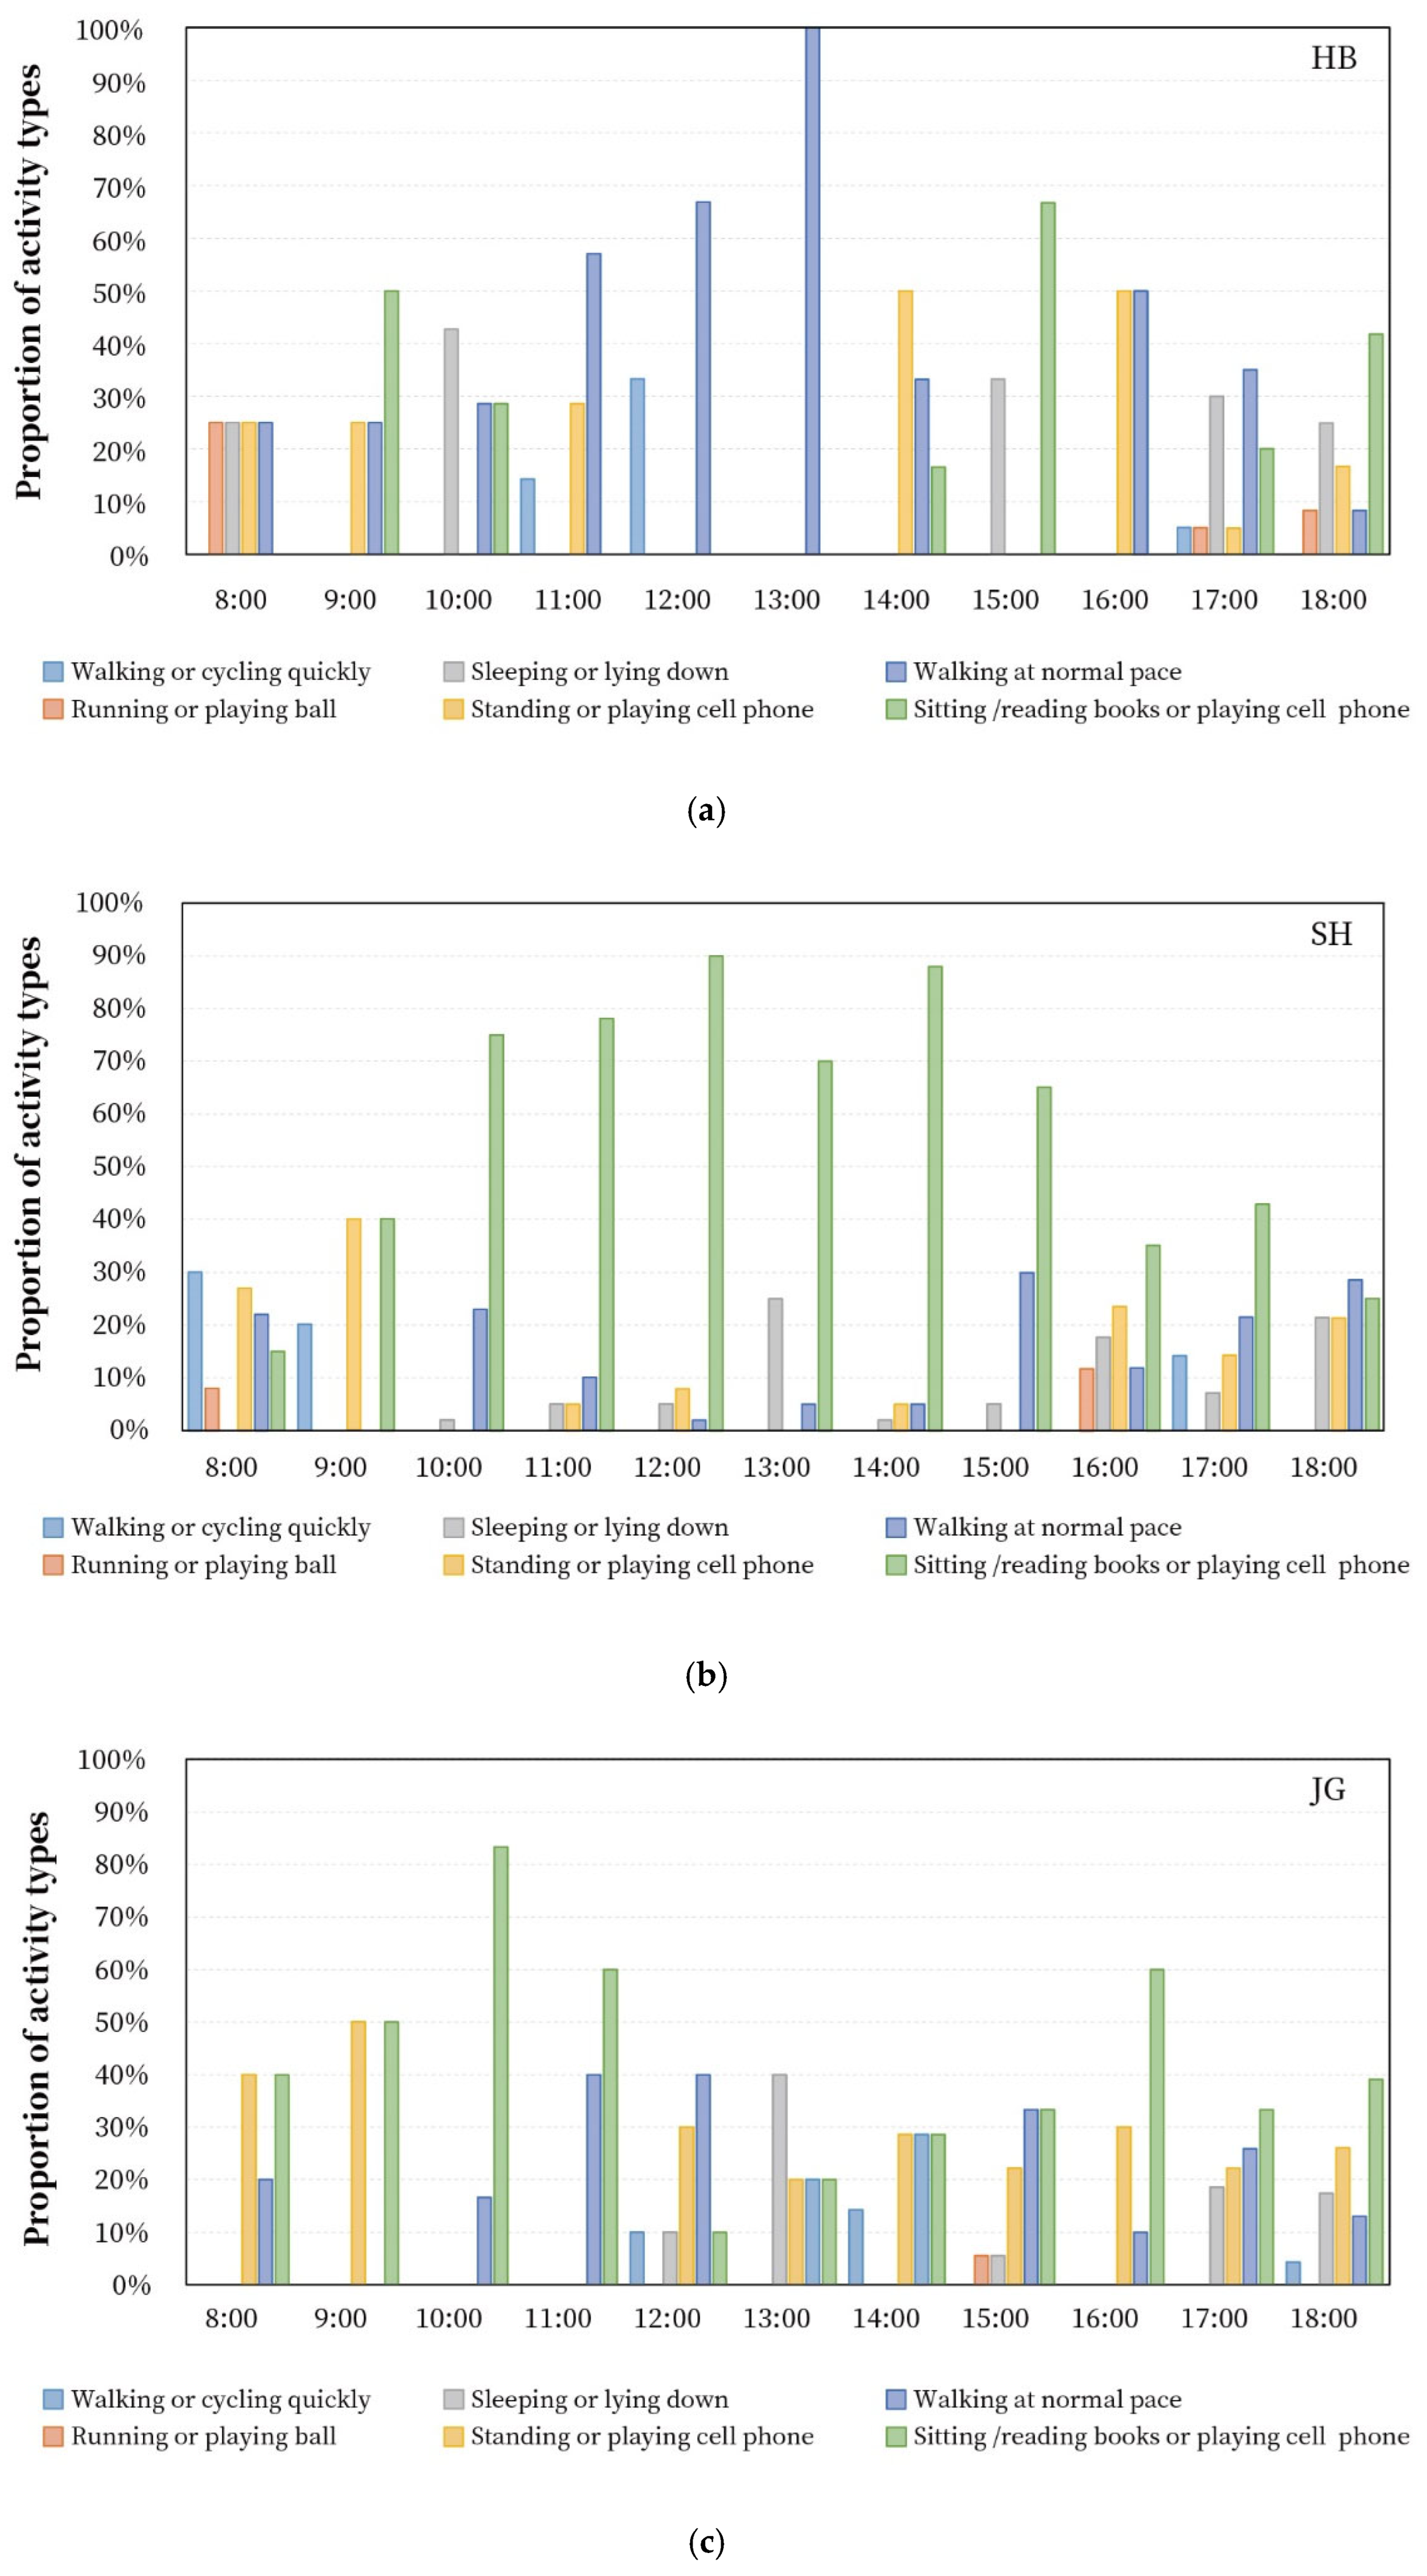
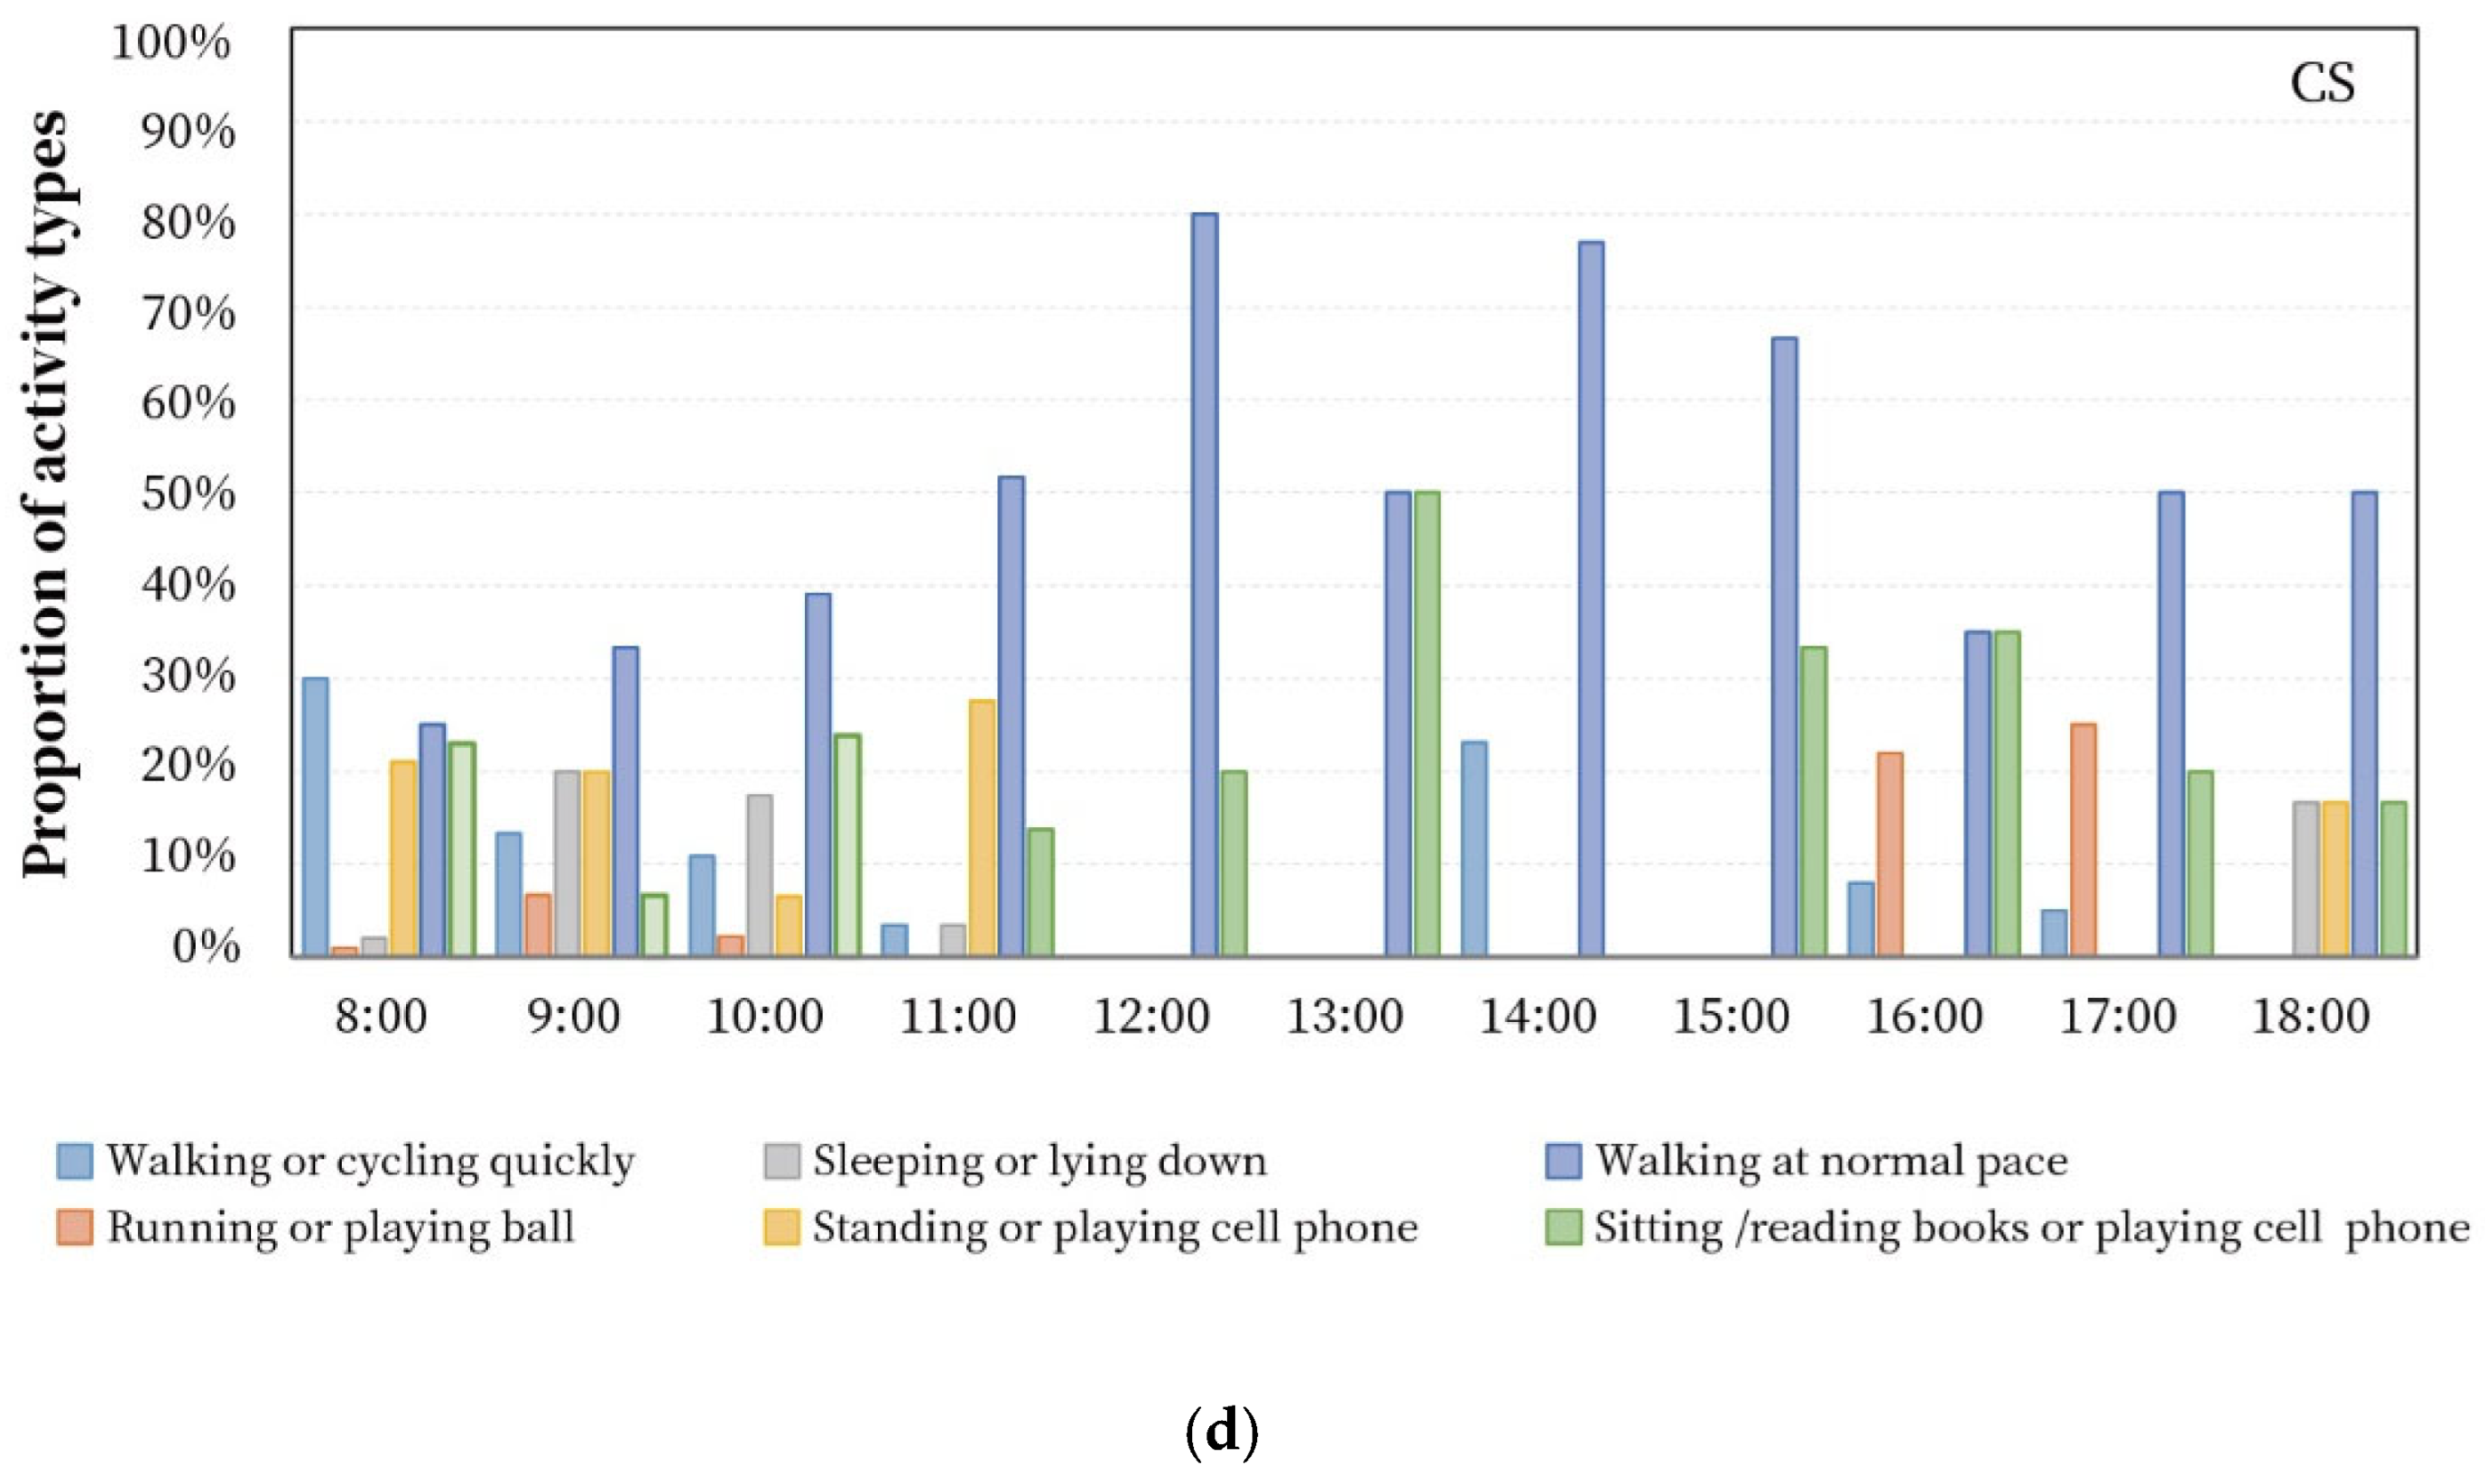
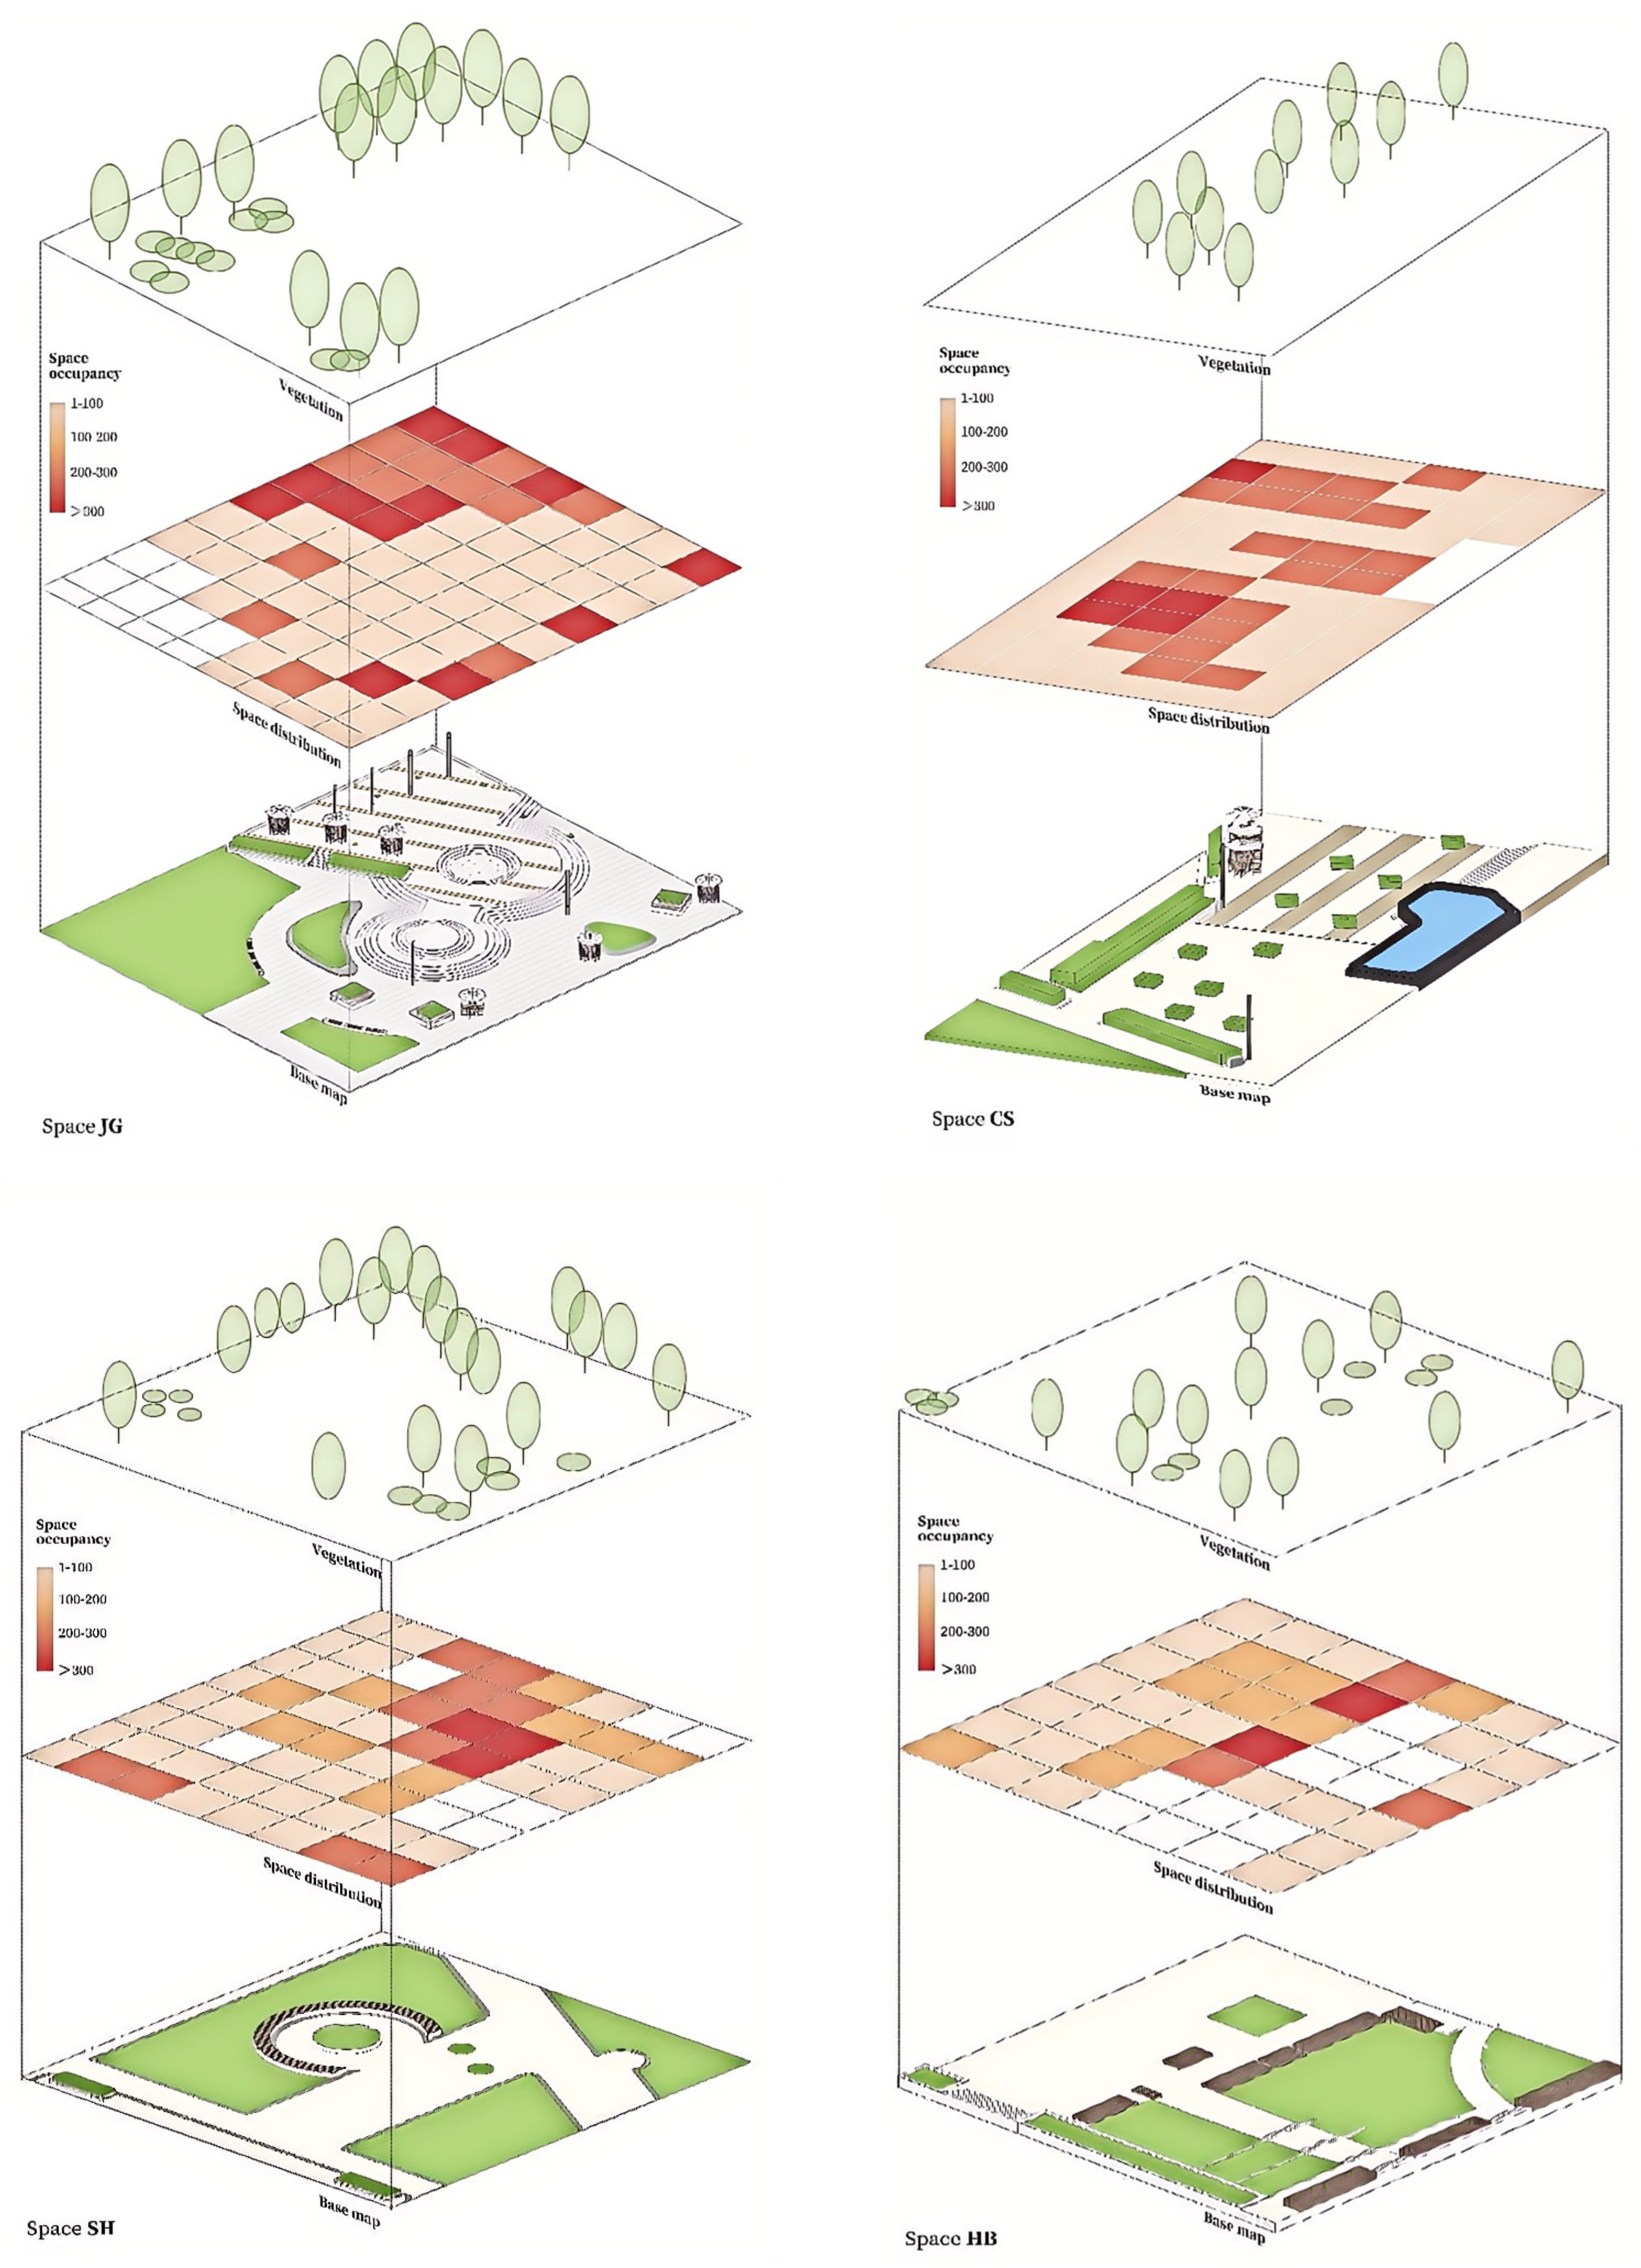
To understand the impact of the outdoor thermal environment on student activities on campus during the experiment, we recorded the number of students and activity types in each space every 60 min and mapped the spatial distribution of student activities (Figure 10 and Figure 11). Across the four spaces, students’ activities primarily included sitting, reading or using mobile devices, and walking at a normal speed. This behavior may be attributed to students reducing the intensity of activities as the temperature rises.
In the HB space, the variety of student activities is greater from 8:00 to 10:00. However, as the temperature increases, the diversity of activities decreases. The highest proportion of students walking at normal speed occurs from 11:00 to 13:00, likely because the HB space provides fewer facilities for students to linger. As temperatures rise, students opt to reduce the intensity of their activities. From 16:00 to 18:00, as temperatures gradually decrease, the diversity of activities in the SH space increases.
In the SH space, activities are relatively limited, primarily consisting of sitting, reading, and using mobile devices, possibly due to the limited facilities in this space. The variety of activities is greater from 8:00 to 9:00. However, as the temperature rises, the activities become more uniform. From 15:00 to 18:00, as the temperature decreases, the variety of activities increases again.
The JG space shows a different pattern compared to the other three spaces. From 8:00 to 11:00, the types of student activities are relatively simple. However, from 12:00 onwards, the variety of activities becomes richer. This may be due to the ample activity space, seating, and other facilities in the JG space. Additionally, trees and shading facilities provide shade.
In the CS space, the variety of activities is wide from 8:00 to 11:00. However, with the temperature increase from 12:00 to 15:00, the variety of student activities decreases. During this time, the highest proportion of activities includes walking at normal speed and sitting, using mobile devices, or reading books, as students choose low-intensity activities. From 16:00 to 18:00, as the temperature decreases, the variety of activities increases again.
We recorded the spatial distribution of students in four spaces. Based on time accuracy, personnel density, and site size, each site was divided into 5 m × 5 m grids, and the number of students staying in each grid was recorded. Only students who stayed for more than 5 min were recorded in this experiment. In summer, the CS and JG spaces are more popular with students due to their lower G values and the provision of more shade and rest facilities. In contrast, the HB and SH spaces have lower student attendance rates in summer because of the lack of plants and shading facilities. Students prefer to stay in areas that provide shade (Figure 11).

3.3.2. Thermal Comfort Behavior Choice

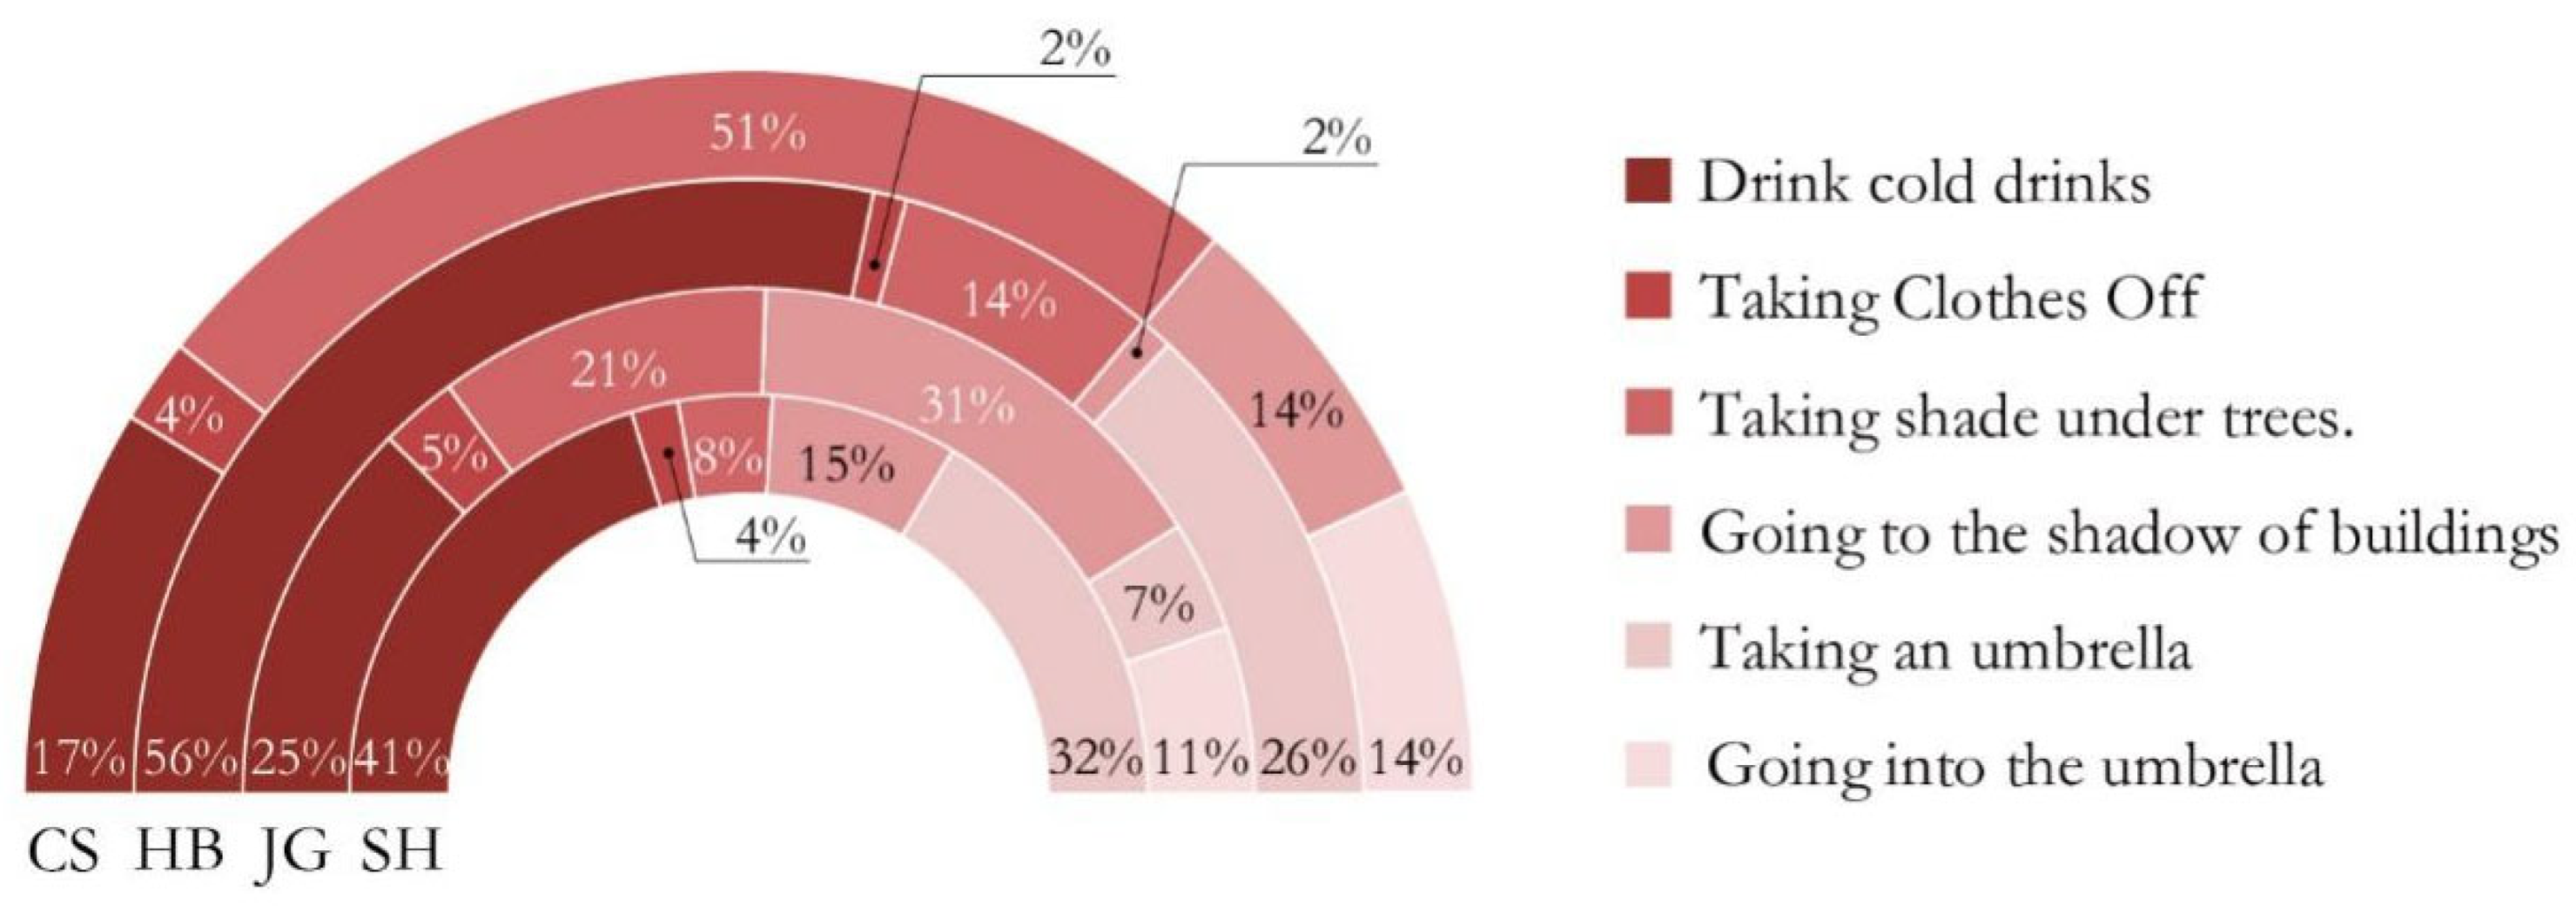
In HB space, most students chose to consuming chilled beverages as their first heat adaptation behavior (56%), followed by 26% and 14% who chose to relieve their heat discomfort by taking umbrellas and seeking arboreal shade. This may be because the tree shade does not cover the main track of students’ actions, so more students will choose to take the initiative to take an umbrella to provide shade to alleviate heat discomfort. In CS space, the proportion of taking shade off trees (51%) is more. This shows that in this space, most students will seek relief from heat discomfort through shading. In JG space, the proportion of students who choose to go to the shadow of buildings (31%), consuming chilled beverages (25%) and go to the shade of trees (21%) is the highest. The proportion of going into the umbrella and taking an umbrella is 11% and 7% respectively. In SH space, the proportion of students who consuming chilled beverages (41%) and take umbrellas (32%) is the highest, and the proportion of students who choose to take a shade off trees (8%) to relieve heat discomfort is very low. This may be because the shade does not cover the main track of students’ actions in this space. In the four spaces, few people choose to reducing clothing insulation to alleviate heat discomfort 2% (HB), 4% (CS), 5% (JG), 4% (SH). This may be because students wear less clothes in summer, with an average clothing resistance of 0.4 clo (girls) and 0.5 clo (boys). To sum up, looking for shade is the main way for students to relieve their thermal discomfort. When there is insufficient shade in the field, students will actively adjust their thermal discomfort by drinking iced drinks and holding umbrellas (Figure 12).

3.4. Bioclimatic Design Strategies

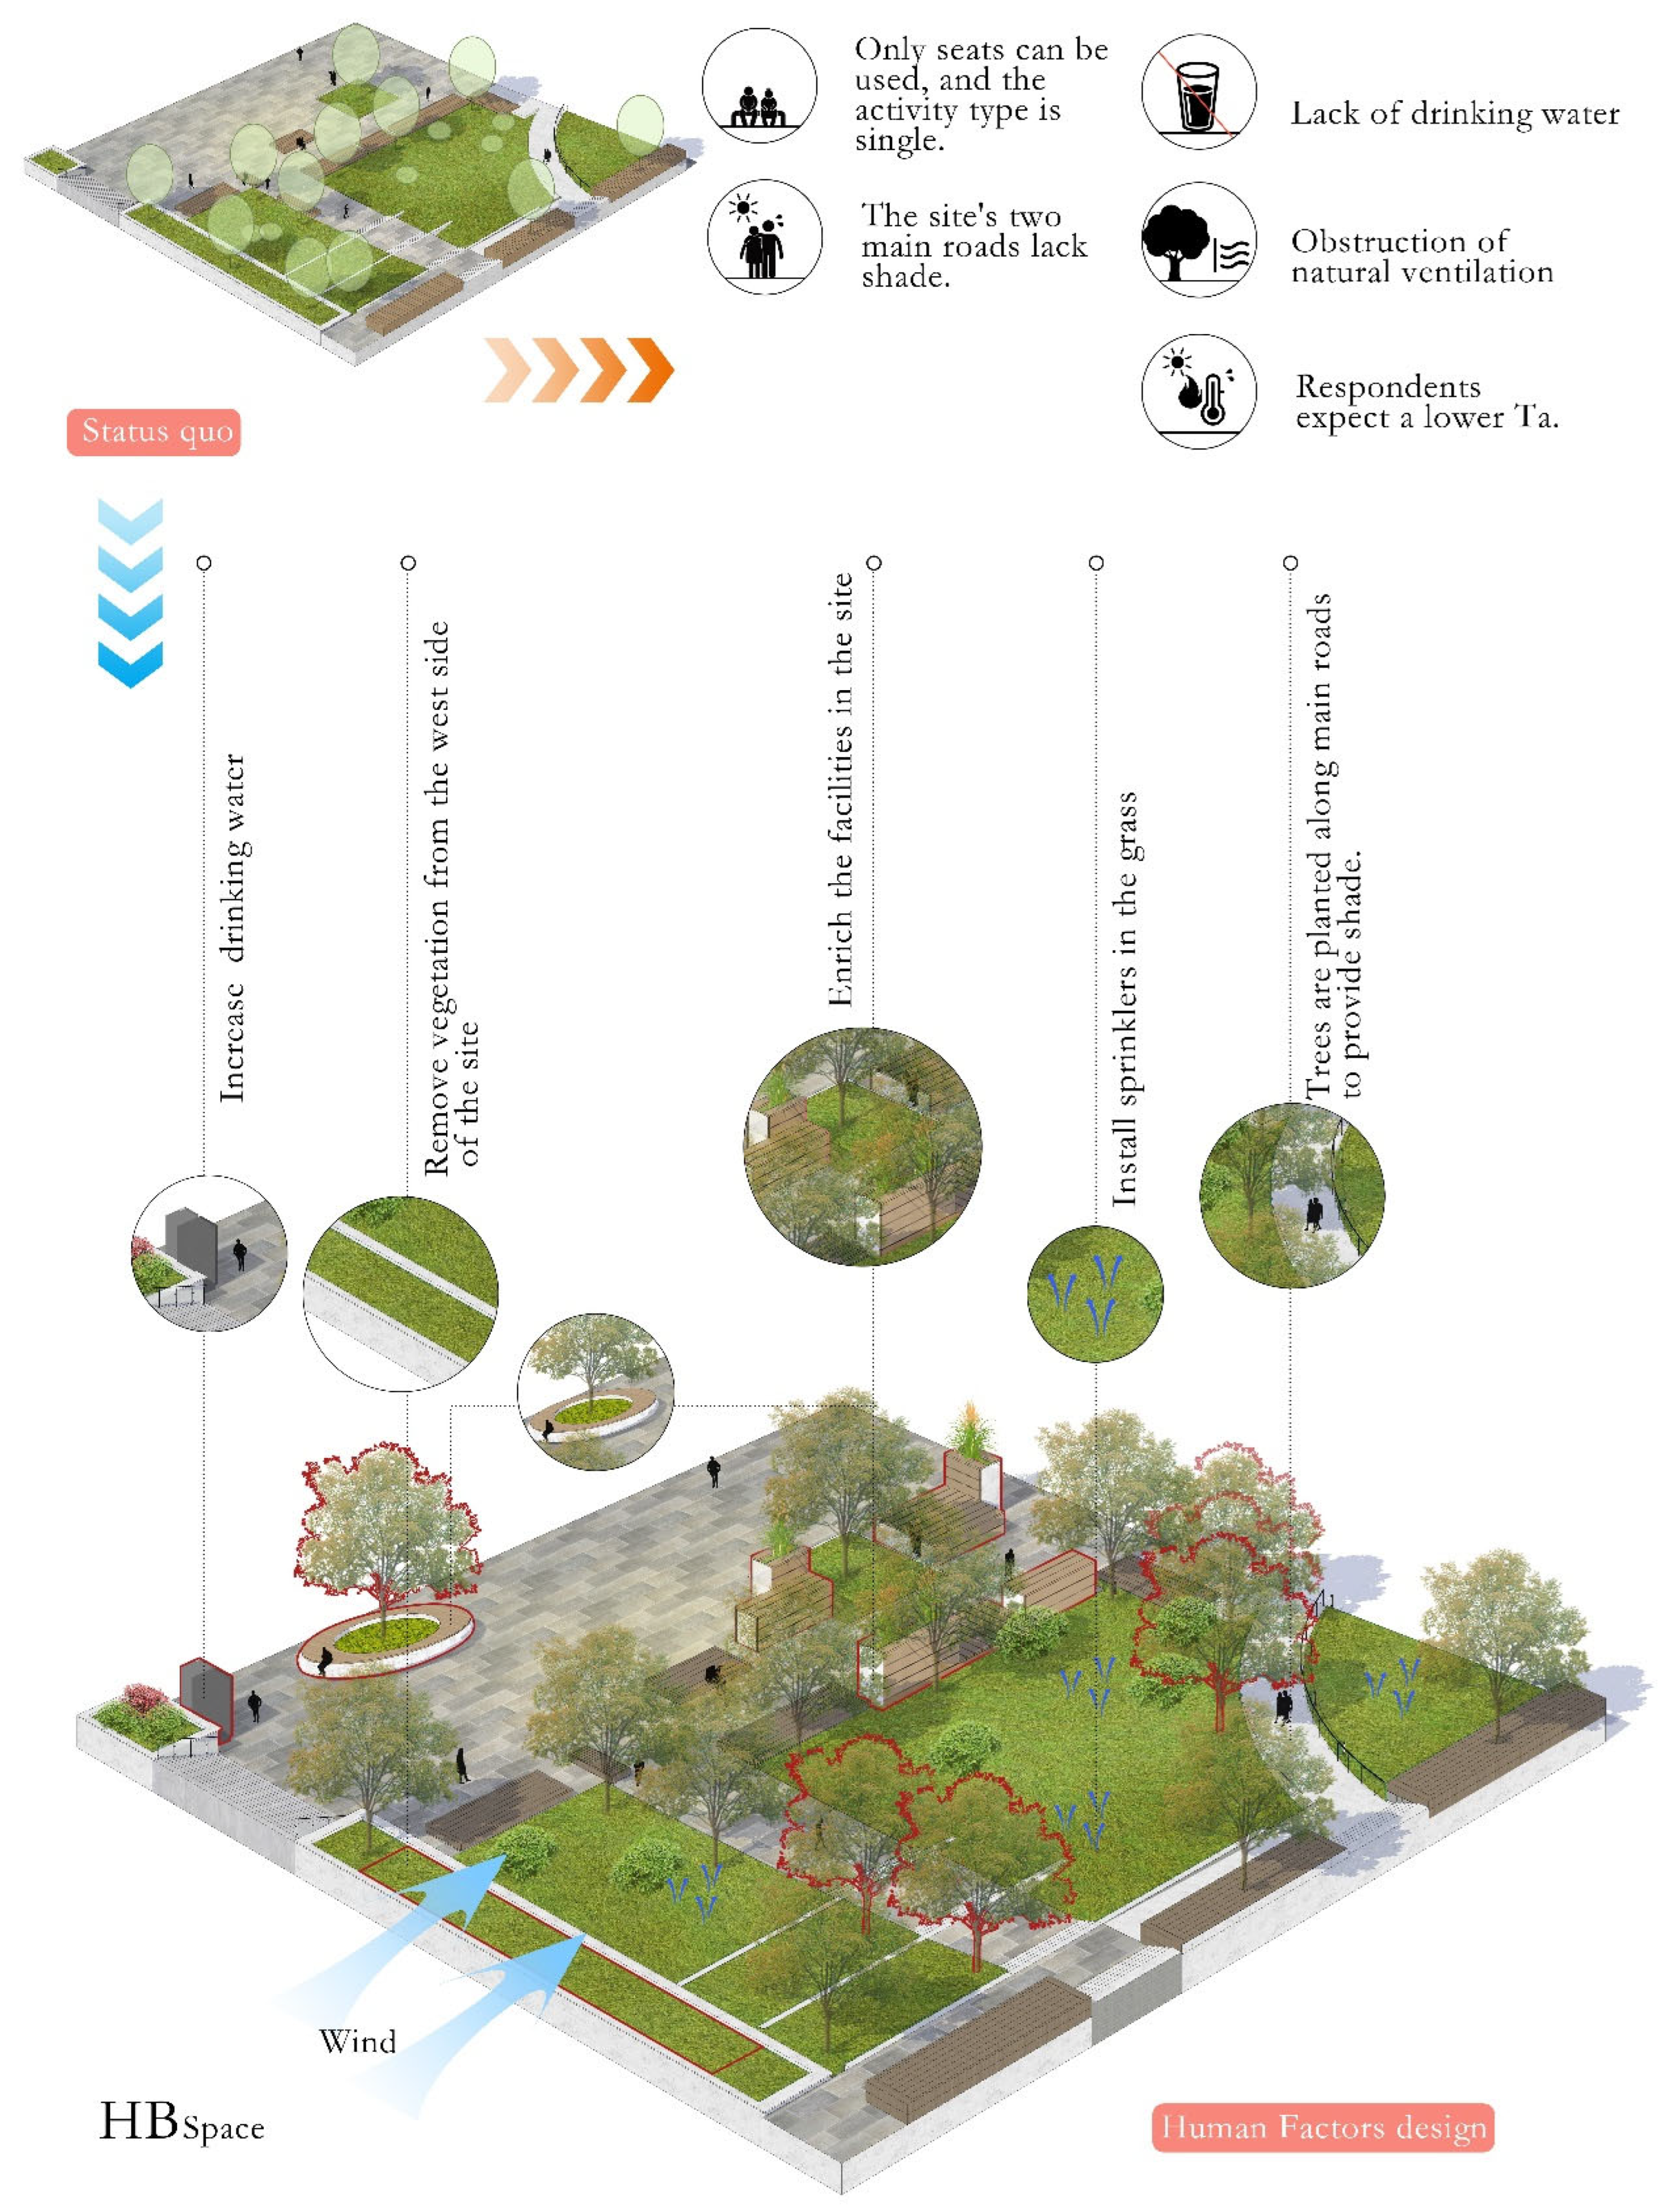
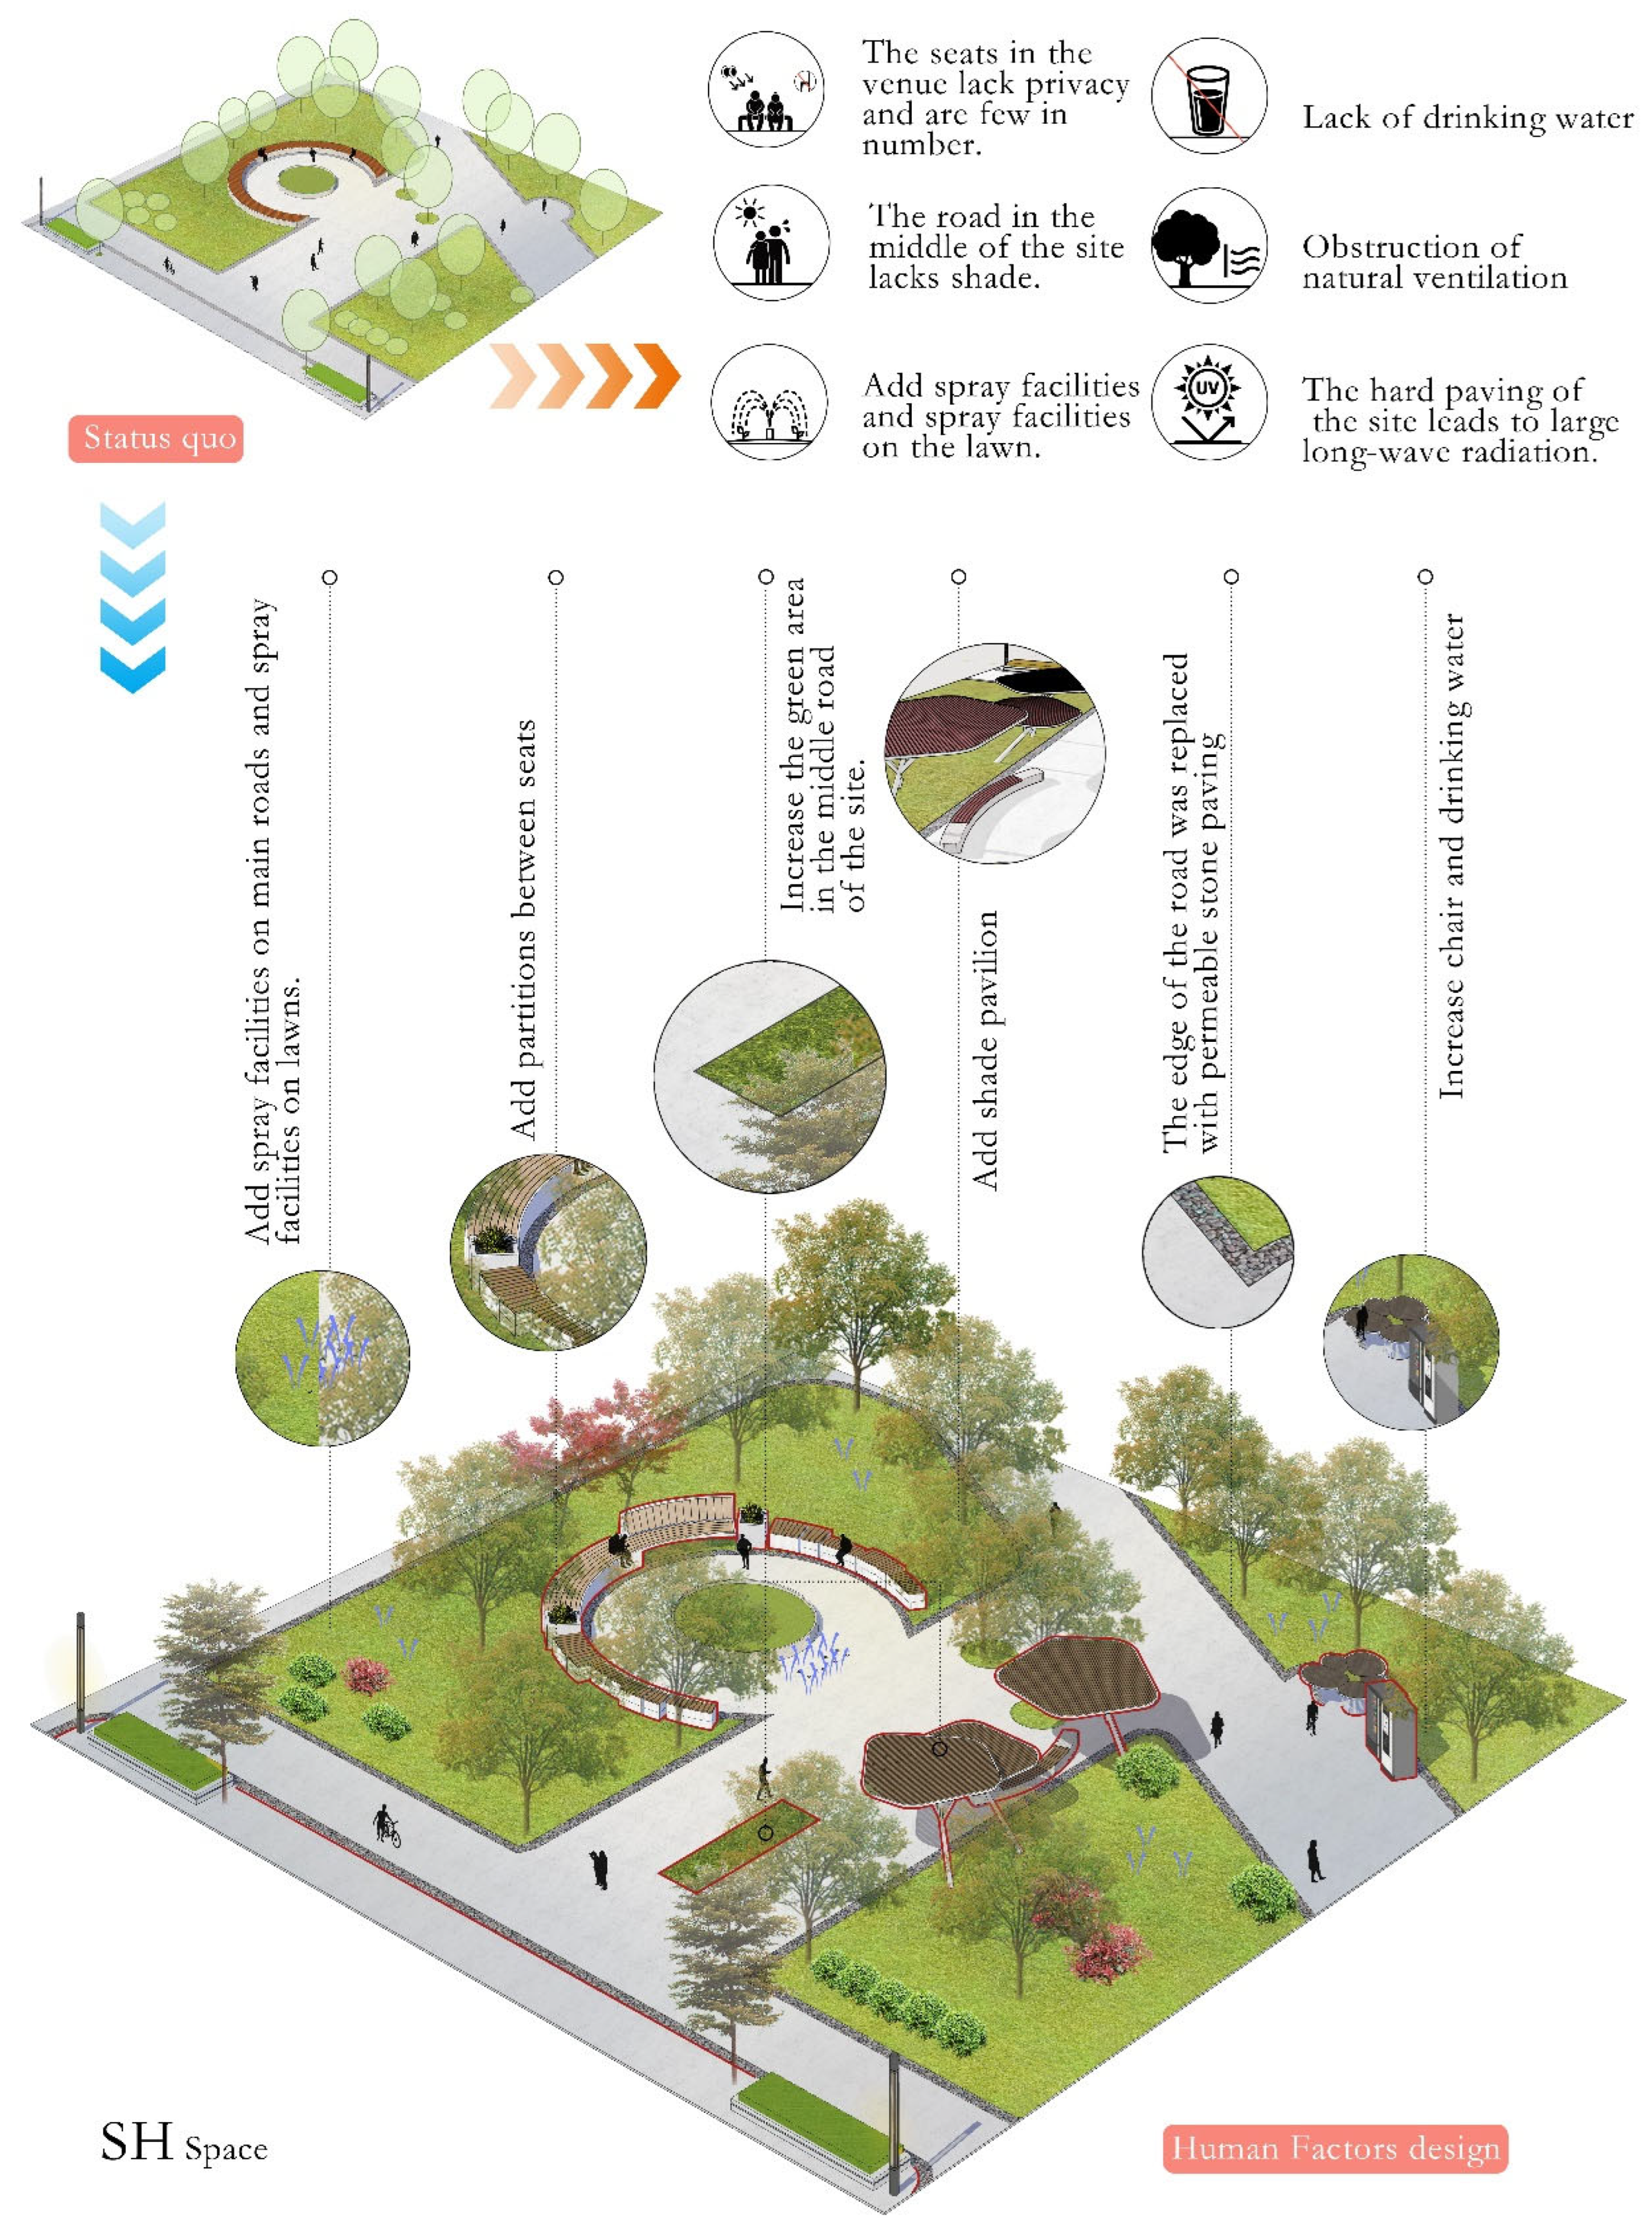
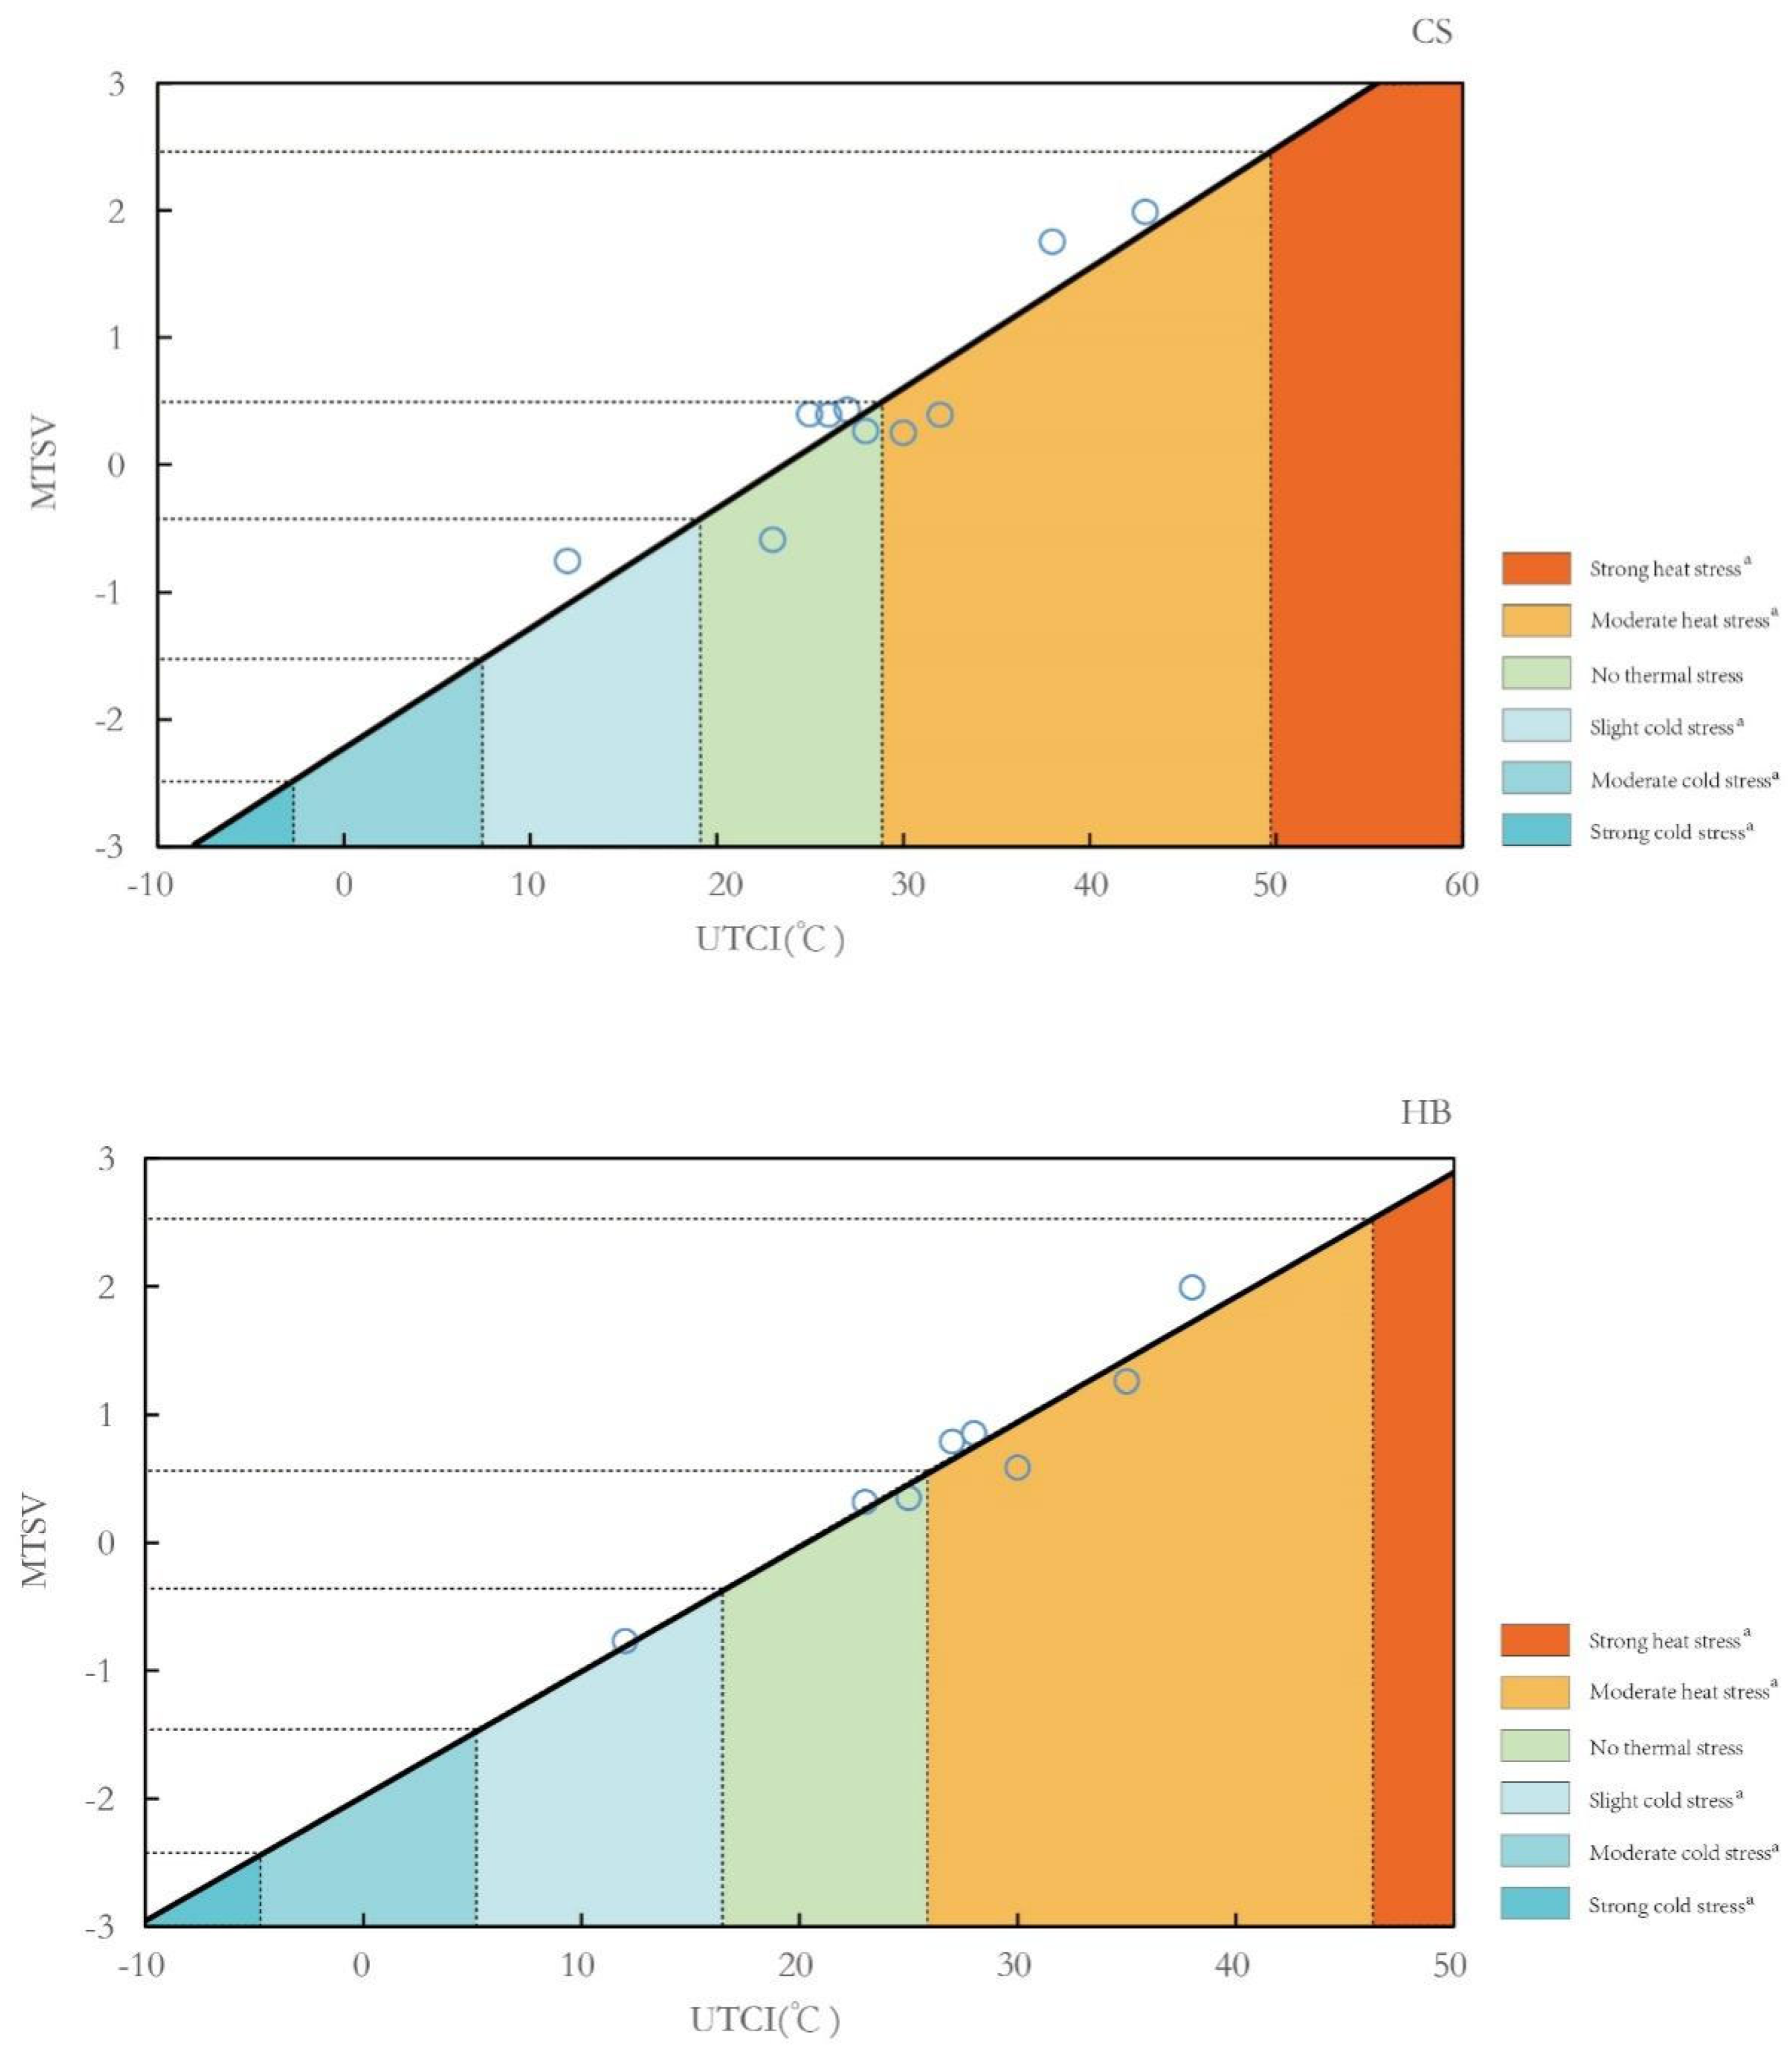
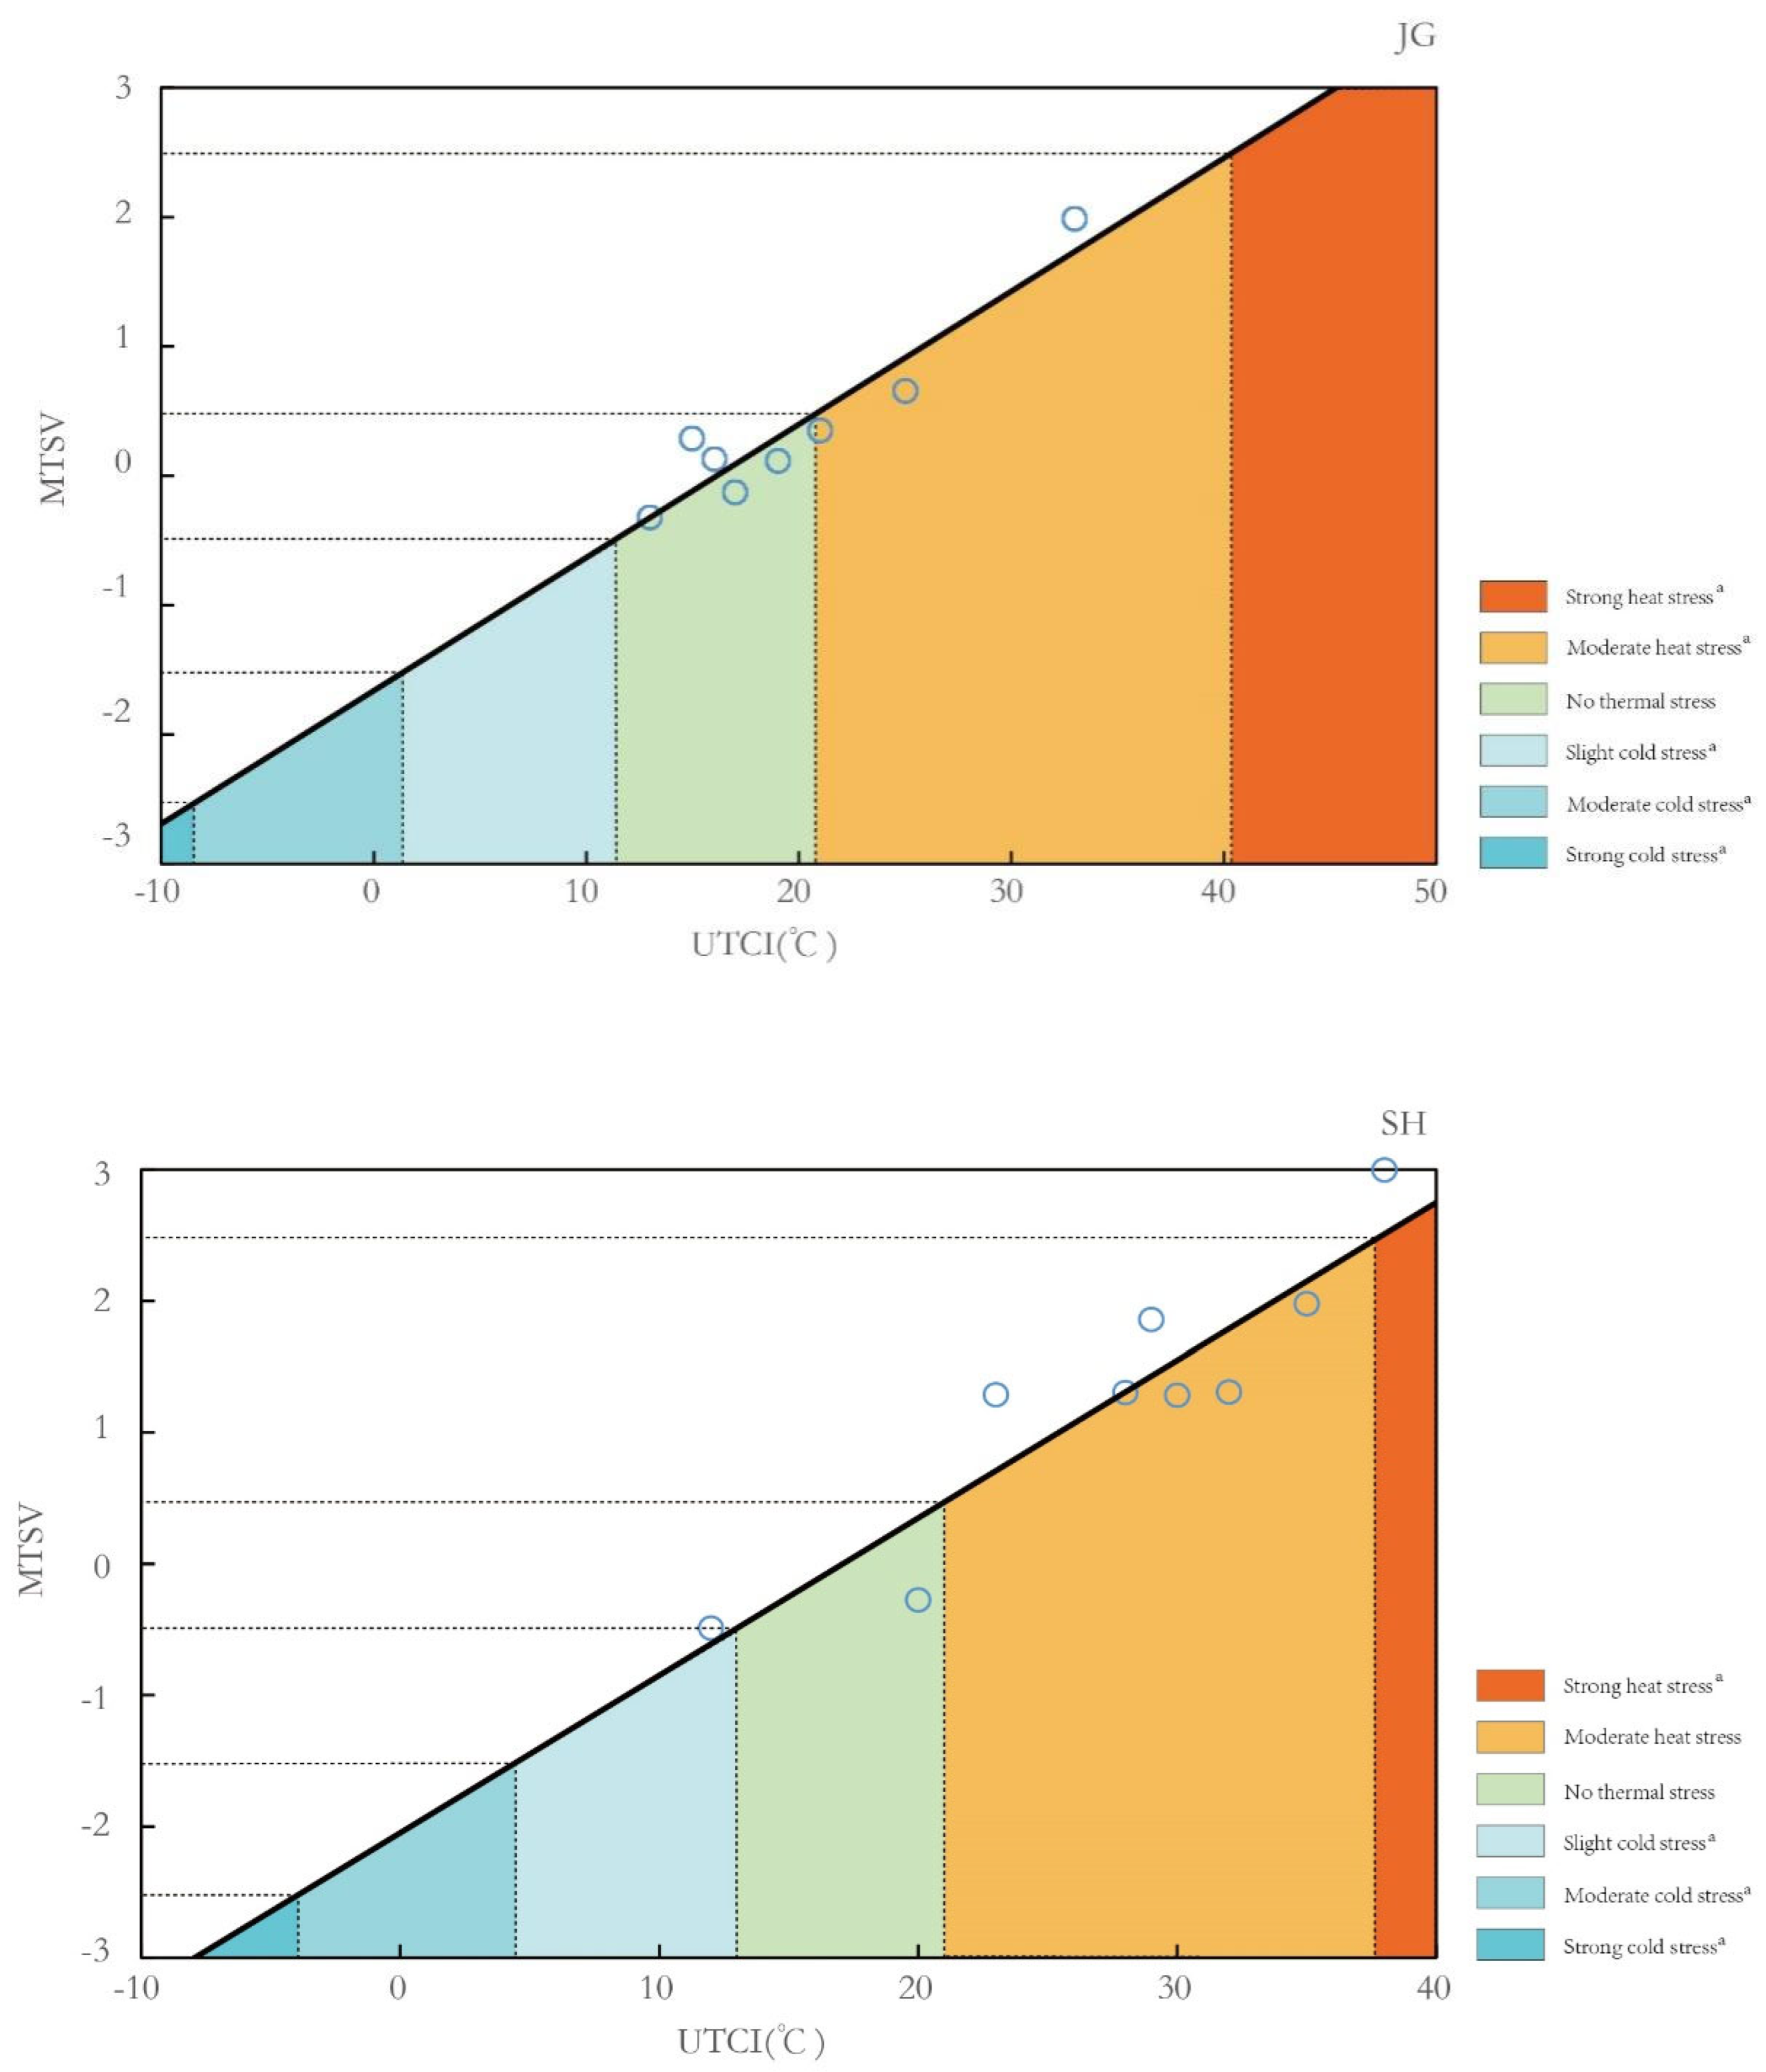
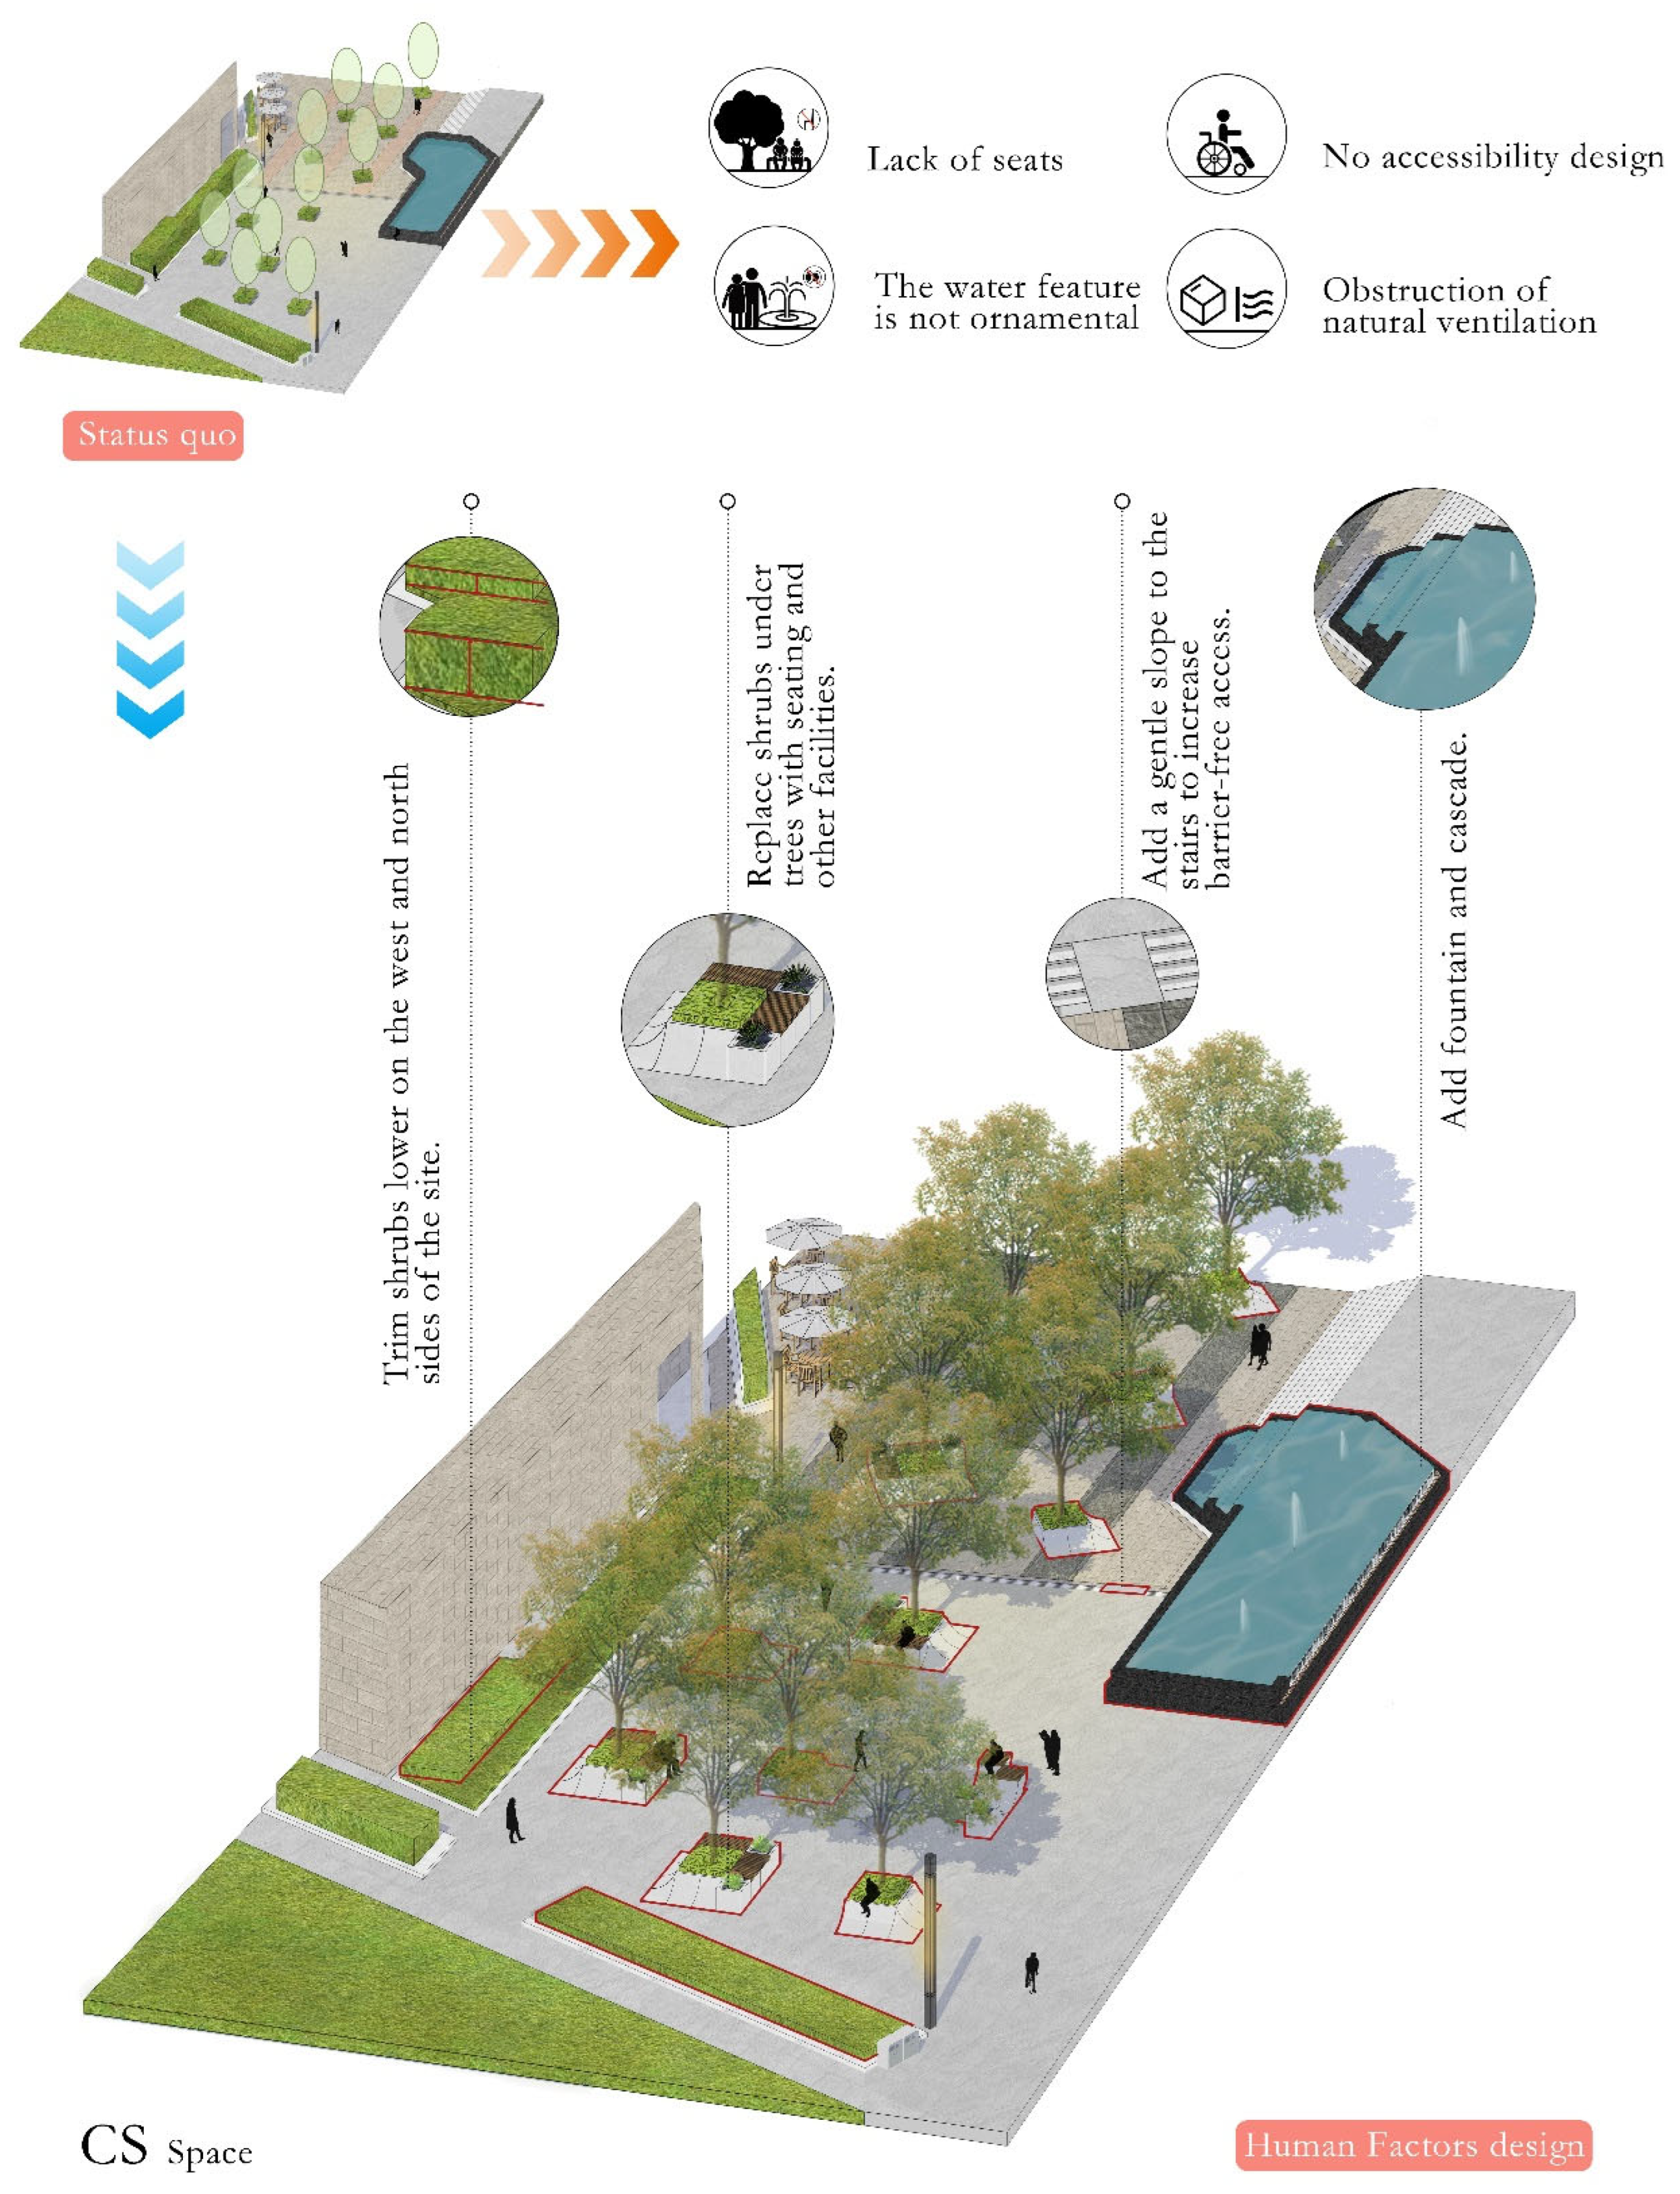
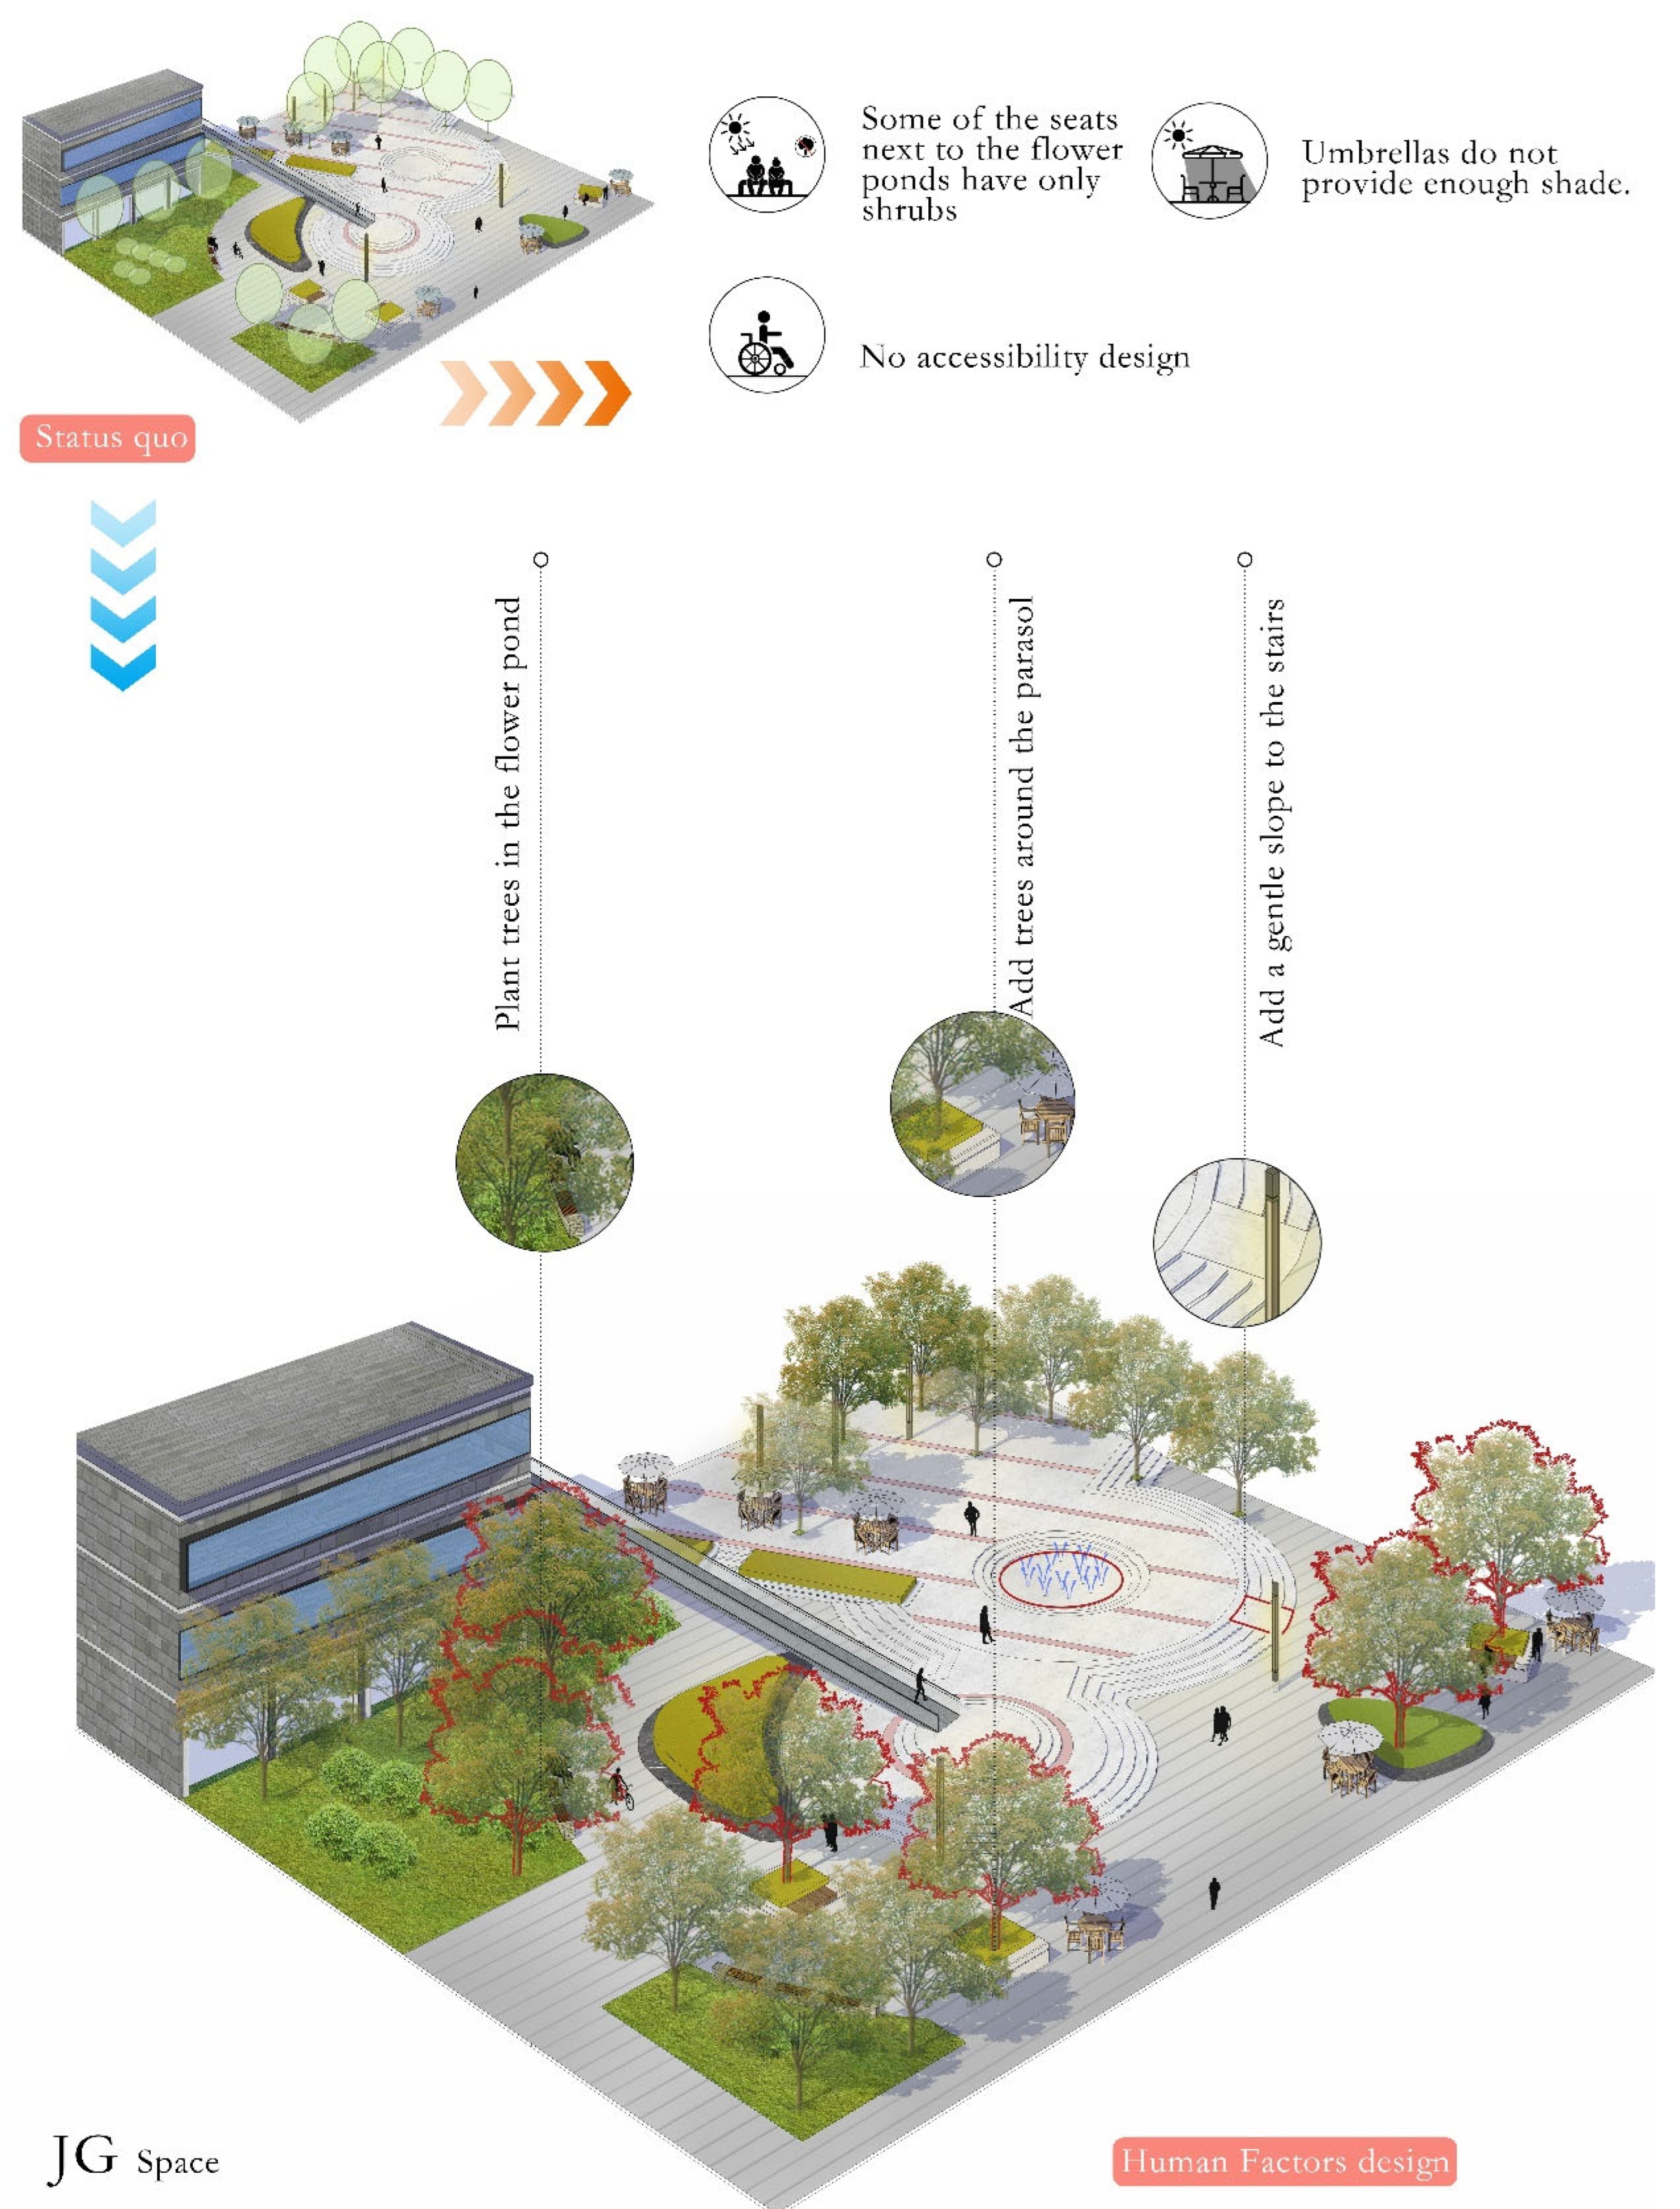
Using the thermal sensing range of each UTCI thermal stress category, we calculated the students’ modified UTCI thermal stress category [5] (Table 8). It must be emphasized that the extreme boundary values in these categories (indicated by ‘a’ in the table) are extrapolated from the linear regression fitting lines. These should be interpreted as theoretical estimates rather than directly observed physiological thresholds. Based on this table, we drew the UTCI diagram corresponding to the thermal stress in the four spaces (Figure 13). Fiala’s study on the UTCI model did not identify “slight thermal stress” due to a lack of physiological response data for this thermal stress category in the simulation, hence its absence from the UTCI thermal stress table [37]. Based on the thermal benchmarks for students in different spaces, we recommend a bioclimatic design strategy aimed at alleviating summer thermal pressure between spaces (Table 9, Figure 14). It is important to note that the following interventions are framed as evidence-informed proposals based on our observational data; they are not validated performance outcomes. Future numerical simulations are required to quantify and verify the specific cooling effects of these strategies.

3.4.1. Vegetation

In the HB space, where air temperature (Ta) and relative humidity (RH) were identified as the primary positive correlates of thermal sensation (Table 7), the two main roads lack shade. Planting large crown trees is proposed beside the main roads specifically to intercept solar radiation and locally lower Ta. Furthermore, because the sunken area’s western arbors restrict wind velocity (Va)—which exacerbates the discomfort associated with high RH—we recommend selectively reducing this western vegetation to facilitate better natural ventilation.
In the CS space, solar radiation (G) and globe temperature (Tg) are the dominant positive drivers, while Va has a mitigating effect. The high shrubs in the west and north currently hinder natural ventilation; these should be trimmed to a lower height, specifically to promote Va.
In the JG space, characterized by strong correlations with Ta and Tg, the flower bed seats are shaded only by shrubs. Trees should be planted in these flower beds to mitigate Tg through direct canopy shading. The existing sunshade covers a small area; planting more trees around it will further suppress Tg exposure.
In the SH space, where Ta and Tg strongly correlate with heat stress, and Va and RH show negative correlations (mitigating effects), the wide middle road lacks shade. Large crown trees should be added here to block G and lower Tg. Concurrently, increasing the spacing between the dense edge trees is proposed to improve Va while maintaining essential shade. Finally, planting arbors in the flower beds between seats can increase visual shielding and privacy.

3.4.2. Paving

In the CS and JG spaces, the absence of barrier-free passages necessitates the addition of gentle slopes at the steps. In the SH space, the extensive hard pavement contributes to significant long-wave radiation (Tg), which our correlation analysis identified as the strongest driver of thermal discomfort in this specific area (R2 = 0.472). Increasing the green area along the middle road and replacing the hard road edges with permeable gravel are highly recommended as targeted mitigation measures to specifically lower local Tg.

3.4.3. Facilities

Respondents expressed a desire for lower Ta in the HB space. To address the strong correlation between Ta and thermal discomfort here, adding spraying facilities on the lawn is proposed to provide an evaporative cooling effect aimed at lowering Ta. To diversify the currently simple activities, installing a high platform beside the seating with flower bed partitions can create multifunctional study areas.
In the CS space, integrating physical seats and facilities directly under the arbors is recommended to pull students out of high G and Tg exposure zones. The existing waterscape lacks utility; upgrading it to an aerated fountain or waterfall could enhance aesthetic appeal while potentially improving local Va and evaporative cooling.
In the SH space, students desire lower Ta, lower G, and notably, higher RH (which aligns with our finding that RH is negatively correlated with heat stress here). Adding spraying facilities on main roads and lawns is proposed to actively lower Ta and increase local RH simultaneously. Furthermore, both the SH and HB spaces lack drinking water facilities; adding vending machines is recommended to assist students with internal metabolic heat relief. When introducing static shading devices (e.g., pavilions or umbrellas) to reduce G, these systems must be optimized to balance thermal mitigation with visual comfort and daylighting, avoiding overly darkened areas [21].

4. Discussion

4.1. TSV and TCV

Because generating direct physiological measurements of absolute thermal sensation within dynamic outdoor environments is logistically prohibitive, structured polling mechanisms remain the scientific gold standard for capturing nuanced subjective perceptions. According to the fundamental principles established by ASHRAE [25], thermal comfort transcends basic physiological thermoregulation; it is fundamentally a psychological condition denoting conscious satisfaction with the ambient thermal surroundings. Consequently, evaluating the TSV metric acts as the primary analytical conduit for decoding this complex psychological state.
Our empirical field data underscored severe discrepancies between TSV baselines and ultimate Thermal Comfort Voting (TCV) trajectories across the four target zones. These extreme deviations are undoubtedly rooted in the highly diverse structural morphologies characterizing each micro-site. Because subjective comfort relies on a highly coupled matrix of immediate physiological strain and latent psychological expectation [38], the radical differences in architectural shielding and atmospheric flow explicitly triggered entirely distinct sensory responses among the surveyed young adult subjects under summer conditions.

4.2. NUTCI

In our study, despite the four sites being located within the same climate zone and having the same subject population, there are substantial differences in the Normalized Universal Thermal Climate Index (NUTCI). The NUTCI between space JG and space SH differs by 9.02 °C. This discrepancy may be due to the varying landscape elements and spatial forms of the four open spaces. For instance, space CS features shadows from water bodies and buildings, which are absent in space SH. Furthermore, the number of trees and shading facilities differs significantly across the four spaces. These elements, such as trees and shading structures, mitigate heat stress and enhance students’ thermal comfort [39,40].
Thermal comfort design should consider the specific spatial form and elements of each site. Although our study was conducted exclusively in the summer, the NUTCI in our study area was higher than that for children in Xi’an, China [1], possibly due to differences in the subject populations. The NUTCI in our research spaces also differs from that in the same region. Excluding age differences, this may be because our study synthesized data from four different locations and was conducted solely in the summer [41].
To position our findings within the existing literature, Table 10 compiles NUTCI and NUTCIR values from comparable OTC studies across different climatic contexts. The table includes studies from a range of climate zones—from subarctic Umeå (Dfc; NUTCI = 14.4 °C) to subtropical Nagoya (Cfa; NUTCI = 34.0 °C)—to illustrate the global spectrum of thermal neutrality shaped by long-term climatic adaptation. Our four campus spaces span a NUTCI range of 17.11–26.13 °C, situated in the middle portion of this global spectrum, consistent with the transitional Cwa/BSk climate classification of Xi’an.
However, the most analytically meaningful comparisons are those conducted within the same climate zone and region. Within Xi’an, Xu et al. (2019) [41] reported a NUTCI of 13.9 °C for children in a city park using combined summer and winter data, which is considerably lower than the range observed in our campus spaces. This difference is likely attributable to two factors: population characteristics (children exhibit greater thermal sensitivity than young adults) and temporal scope (their year-round data produced a lower annual-average neutral point). Huang et al. (2016) [42], studying college students in a Xi’an city park across both summer and winter, reported a NUTCI of 23.1 °C (Table 11), which falls within the range of our four spaces and provides a more direct benchmark.
Notably, the spread across our four campus spaces (9.02 °C between SH and JG) approaches the magnitude of the difference among independent Xi’an studies compiled in Table 11 (9.2 °C between Xu et al.’s 13.9 °C and our JG space’s 26.13 °C). This finding carries a critical practical implication: adopting a single campus-wide NUTCI—as is common practice—would obscure thermal realities that differ by nearly 10 °C between adjacent open spaces. Our space-specific approach reveals that the neutral temperature of SH (17.11 °C) falls below the lower limit of the neutral range reported for Xi’an city parks (18.0–29.1 °C; [41]), whereas JG (26.13 °C) falls near the upper end. This divergence, driven by the spatial configuration differencses documented in Table 2, reinforces the necessity of space-specific thermal benchmarking for evidence-based campus design tailored to specific seasonal and demographic use cases.
The NUTCI between space JG and space SH differs by 9.02 °C. This large discrepancy is primarily driven by the interplay of localized physical microclimates and the psychological adaptation of the students in different spatial contexts.
From a physical perspective, the variation is heavily influenced by the distinct radiation fields created by differing Sky View Factors (SVF) and landscape materials. The SH space, which recorded the lowest NUTCI (17.11 °C), is characterized by an expansive hard-paved plaza with high solar exposure. The intense direct short-wave radiation combined with long-wave radiation emitted from the heated pavement sensitizes students to heat, meaning their thermal neutrality is reached at much lower environmental temperatures. In contrast, spaces like CS and JG incorporate protective microclimatic elements—such as shading structures, tree canopies, and adjacent water bodies—which effectively buffer radiant heat exposure, allowing students to maintain thermal neutrality at significantly higher UTCI levels (up to 26.13 °C).
From a psychological and behavioral perspective, the functional identity of the spaces shapes students’ thermal expectations. The availability of adaptive opportunities, such as accessible seating under shade in the JG space, psychologically enhances students’ thermal tolerance. Furthermore, spaces located near high-activity zones (such as the sports square in CS) may condition students to expect and accept slightly warmer sensations. These findings strongly emphasize that outdoor thermal comfort design cannot rely on a single macro-climatic benchmark; rather, it requires highly localized, space-specific bioclimatic interventions.

4.3. The Main Meteorological Factors Associated with TSV

Our statistical evaluation reveals that the primary meteorological parameters associated with students’ Thermal Sensation Voting (TSV) fluctuate drastically across the different campus open spaces. Prior regional investigations have successfully employed stepwise regression to map the interplay between thermal votes and localized environmental stimuli [41,42]. Our research corroborates these localized findings while highlighting the intense micro-regional differences in the meteorological variables most strongly correlated with TSV. These discrepancies are generated by the highly localized coupling effects of various complex climate parameter combinations on human thermal perception.
The four tested zones in our study encompass highly diverse spatial morphological metrics, primarily reflected in varying sky view factors (SVF) and height-width ratios (AR) [45]. These divergent architectural patterns spawn distinct microclimates within each site, forcing individual meteorological parameters to exert completely different levels of thermal impact depending on the underlying environmental context [31,46]. Therefore, optimizing the microclimate strictly requires designing interventions based on the specific morphological baseline of the site. Overall, air temperature (Ta) and globe temperature (Tg) were conclusively identified as the two primary meteorological parameters most heavily associated with young adult students’ TSV on the campus during the summer peak, a conclusion that strongly aligns with previous regional findings [1,47] (Table 10).

4.4. Thermal Stress Correction

In this paper, we corrected the thermal stress at four research sites and identified significant disparities in thermal stress across these sites. Our study differs from the two studies conducted in Xi’an regarding the modified thermal stress, likely because our subjects are students at school, while the other studies involved children and the elderly [1,47] (Table 12). Through correcting thermal stress in different locations, we can better understand and evaluate the local thermal environment’s impact on the human body, assess the potential risk of heat stress, and implement appropriate preventive and protective measures to ensure public safety and health. This approach provides more precise guidance on summer thermal comfort specifically for young adults, which is crucial for the design and planning of buildings, urban spaces, and outdoor venues, thereby potentially improving thermal comfort and the quality of life for specific target demographics within appropriately bounded seasonal and spatial contexts.
To validate our findings and position our contribution within the broader literature, it is crucial to compare our recalibrated UTCI thresholds with field studies from different climatic zones and populations worldwide. The original UTCI scale was developed based primarily on European populations and temperate climates. However, consistent with field studies in hot-summer and subtropical regions (such as Southeast Asia and Southern China [15,16]), our recalibrated thresholds reveal a clear ‘adaptive shift’. Students in Xi’an demonstrate a significantly higher tolerance for heat stress and a lower tolerance for cold stress compared to the standard European-based UTCI scale. Conversely, recalibration studies in severely cold climates (e.g., Umeå, Sweden [44] or Harbin, China [11]) frequently report much lower neutral UTCI ranges and extended cold tolerance thresholds.
Furthermore, compared to studies focusing on the elderly [47] or children [41] in similar climates (as shown in Table 10), our college student cohort exhibited a narrower ‘no thermal stress’ zone but required a higher threshold before reaching ‘strong thermal stress’. This reflects the distinct metabolic rates and physiological adaptive capacities of young adults. This cross-regional and cross-demographic comparison provides compelling evidence that UTCI stress categories are not globally static; they must be locally recalibrated to accurately account for long-term climatic backgrounds, short-term microclimatic variations (as seen across our four campus spaces), and specific user demographics.

4.5. Limitations and Future Research

Our study has some limitations. Firstly, the climate of Xi’an is characterized by cold, dry winters and hot, humid summers. This study did not address outdoor thermal comfort on campus during the winter season. Secondly, because this was an in situ observational field study rather than a controlled experiment, the four selected spaces possessed simultaneously varying morphological features (e.g., varying SVF, vegetation, and paving). The lack of strict morphological control variables makes it difficult to isolate and quantify the precise independent contribution of individual landscape elements to thermal comfort. Future research should pair these empirical field observations with parametric numerical simulations (e.g., ENVI-met) to control variables and mathematically isolate the specific thermal impacts of distinct morphological features. The respondents in this study were students aged 18 to 25, and we did not examine the thermal comfort of teachers and other staff members of different ages. Thermal comfort is influenced by physical, physiological, psychological, and social factors, so our conclusions may not be applicable to all campus users. Furthermore, it is important to note that the corrected thermal stress ranges presented in this study are inherently bounded by these specific summer conditions and demographics. Specifically, the extreme boundary values (indicated by ‘a’ in Table 7 and Table 11) were extrapolated from linear regression models and must be treated as theoretical estimates rather than directly observed physiological limits.
Finally, this study proposes an ergonomic design strategy aimed at enhancing the thermal comfort of students on campus through the optimization of vegetation, paving, and amenities. Future studies should incorporate numerical simulations to validate the effectiveness of these design strategies.

5. Conclusions

In this study, we employed a combination of meteorological measurements and questionnaires to examine the thermal perception of students in various open spaces on a campus in Xi’an. Acknowledging that our scope of inference is primarily limited to summer conditions and young adults (aged 18–25), and that extreme thermal stress boundaries represent theoretical extrapolations, based on the students’ thermal perception and thermal benchmarks in different landscape spaces, we proposed design strategies for campus spaces. The main conclusions are as follows.
(1)
We find that the primary meteorological factors associated with students’ thermal sensation vary across different open spaces on campus. In HB space, relative humidity (RH) and air temperature (Ta) are the key factors. In CS space, global radiation (G), globe temperature (Tg), and air velocity (Va) are predominantly correlated with thermal sensation. In SH space, Ta, Tg, Va, and RH are the main correlated factors. Similarly, in JG space, the primary meteorological factors associated with students’ thermal sensation are Ta, Tg, Va, and RH.
(2)
In summer, there are notable differences in the thermal standards across different open spaces on campus. The neutral Universal Thermal Climate Index (UTCI) for the four spaces was 20.34 °C (HB), 23.61 °C (CS), 26.13 °C (JG), and 17.11 °C (SH). The neutral temperature ranges for these spaces are 15.21–25.47 °C (HB), 18.31–28.91 °C (CS), 21.27–30.98 °C (JG), and 12.94–21.27 °C (SH).
(3)
In summer, even within the same area, there are variations in the thermal sensations experienced by students in different campus open spaces, underscoring the need for customized thermal comfort designs for each space. Different spatial patterns influence behavior choices and spatial distribution. For example, in HB space, students primarily adapt to heat by drinking iced drinks, whereas in CS space, a greater number of students prefer to cool down under the shade of trees.
Bioclimatic design strategies are proposed with the theoretical potential to provide comfortable outdoor spaces for students in terms of vegetation, paving, landscaping, and students’ heat-adapted behaviors. Our design strategies include: vegetation planting, shading, sprinklers, misting and drinking water, and improved ground cover materials. Furthermore, inclusive barrier-free designs must be integrated to ensure accessibility for all campus demographics.

Author Contributions

Y.L.: Conceptualization, Methodology, Software, Supervision. D.W.: Conceptualization, Methodology. P.Y.: Resources, Investigation. S.N.: Data curation, Investigation. X.Z.: Resources, Investigation. All authors have read and agreed to the published version of the manuscript.

Funding

This research received no external funding.

Institutional Review Board Statement

Ethical review and approval were waived for this study in accordance with Article 32 of the “Measures for Ethical Review of Life Sciences and Medical Research Involving Humans” (2023) issued by the National Health Commission of the People’s Republic of China. The research involved non-interventional, anonymous questionnaires regarding environmental thermal comfort, posing no physiological or psychological risk to participants.

Informed Consent Statement

Informed consent was obtained from all subjects involved in the study. All participants were fully informed of the study’s purpose, data usage, and anonymity guarantees prior to participation.

Data Availability Statement

Data will be provided on request. If anyone would like data from this study, please contact the corresponding author of this article.

Conflicts of Interest

The authors declare no conflicts of interest.

References

  1. Huang, X.; Wang, X.; Hu, J.; Xue, Y.; Wei, Y.; Wan, Y.; Song, X.; Wang, R.; Zhang, B.; Fang, J.; et al. Inadequate mental health literacy and insufficient physical activity potentially increase the risks of anxiety and depressive symptoms in Chinese college students. Front. Psychiatry 2021, 12, 753695. [Google Scholar] [CrossRef]
  2. Li, J.; Che, W. Challenges and coping strategies of online learning for college students in the context of COVID-19: A survey of Chinese universities. Sustain. Cities Soc. 2022, 83, 103958. [Google Scholar] [CrossRef]
  3. Luo, L.; Yang, X.; Zeng, X.; Song, N.; Zhou, L.; Zhang, L.; Yang, Y.; Yang, J. Evaluation of the validity of the physical exercise peer support questionnaire for college students. Front. Public Health 2022, 10, 871306. [Google Scholar] [CrossRef]
  4. Zhang, D.; Li, T.; Xie, Y.; Tao, S.; Yang, Y.; Zou, L.; Qu, Y.; Zhai, S.; Tao, F.; Wu, X. Interaction between physical activity and outdoor time on allostatic load in Chinese college students. BMC Public Health 2022, 22, 187. [Google Scholar] [CrossRef] [PubMed]
  5. Lai, D.; Guo, D.; Hou, Y.; Lin, C.; Chen, Q. Studies of outdoor thermal comfort in northern China. Build. Environ. 2014, 77, 110–118. [Google Scholar] [CrossRef]
  6. Aboelata, A. Reducing outdoor air temperature, improving thermal comfort, and saving buildings’ cooling energy demand in arid cities–Cool paving utilization. Sustain. Cities Soc. 2021, 68, 102762. [Google Scholar] [CrossRef]
  7. Yilmaz, S.; Irmak, M.A.; Qaid, A. Assessing the effects of different urban landscapes and built environment patterns on thermal comfort and air pollution in Erzurum city, Turkey. Build. Environ. 2022, 219, 109210. [Google Scholar] [CrossRef]
  8. Xue, J.; Liu, W.; Liu, K. Influence of thermal environment on attendance and adaptive behaviors in outdoor spaces: A study in a cold-climate university campus. Int. J. Environ. Res. Public Health 2021, 18, 6139. [Google Scholar] [CrossRef] [PubMed]
  9. Zhen, M.; Dong, Q.; Chen, P.; Ding, W.; Zhou, D.; Feng, W. Urban outdoor thermal comfort in western China. J. Asian Archit. Build. Eng. 2021, 20, 222–236. [Google Scholar] [CrossRef]
  10. He, X.; Gao, W.; Wang, R.; Yan, D. Study on outdoor thermal comfort of factory areas during winter in hot summer and cold winter zone of China. Build. Environ. 2023, 228, 109883. [Google Scholar] [CrossRef]
  11. He, X.; Shao, L.; Tang, Y.; Wu, S. Improving children’s outdoor thermal comfort: A field study in China’s severely cold regions. Urban Clim. 2023, 51, 101620. [Google Scholar] [CrossRef]
  12. Kumar, P.; Sharma, A. Assessing the outdoor thermal comfort conditions of exercising people in the semi-arid region of India. Sustain. Cities Soc. 2022, 76, 103366. [Google Scholar] [CrossRef]
  13. Abdollahzadeh, S.M.; Heidari, S.; Einifar, A. Evaluating thermal comfort and neutral temperature in residential apartments in hot and dry climate: A case study in Shiraz, Iran. J. Build. Eng. 2023, 76, 107161. [Google Scholar] [CrossRef]
  14. Khalili, S.; Fayaz, R.; Zolfaghari, S.A. Analyzing outdoor thermal comfort conditions in a university campus in hot-arid climate: A case study in Birjand, Iran. Urban Clim. 2022, 43, 101128. [Google Scholar] [CrossRef]
  15. Othman, N.E.; Zaki, S.A.; Rijal, H.B.; Ahmad, N.H.; Razak, A.A. Field study of pedestrians’ comfort temperatures under outdoor and semi-outdoor conditions in Malaysian university campuses. Int. J. Biometeorol. 2021, 65, 453–477. [Google Scholar] [CrossRef]
  16. Liu, L.; Liang, Z.; Liu, J.; Du, J.; Zhang, H. Field Survey on Local Thermal Comfort of Students at a University Campus: A Case Study in Shanghai. Atmosphere 2022, 13, 1433. [Google Scholar] [CrossRef]
  17. Fei, Y.; Rene, E.R.; Shang, Q.; Singh, R.P. Comprehensive effect evaluation of LID facilities implemented in sponge campuses: A case study. Ecol. Indic. 2023, 155, 110912. [Google Scholar] [CrossRef]
  18. Song, P.; Gao, L. Landscape design of colleges based on the concept of ecological protection-taking Jilin Communications Polytechnic as an example. Int. J. Phytoremediation 2023, 26, 314–323. [Google Scholar] [CrossRef]
  19. Jaszczak, A.; Pochodyła, E.; Kristianova, K.; Małkowska, N.; Kazak, J.K. Redefinition of park design criteria as a result of analysis of well-being and soundscape: The case study of the Kortowo Park (Poland). Int. J. Environ. Res. Public Health 2021, 18, 2972. [Google Scholar] [CrossRef]
  20. El-Darwish, I.I. Enhancing outdoor campus design by utilizing space syntax theory for social interaction locations. Ain Shams Eng. J. 2022, 13, 101524. [Google Scholar] [CrossRef]
  21. Alsukkar, M.; Ibrahim, A.; Eltaweel, A. Multi-objective optimization of daylighting systems for energy efficiency and thermal-visual comfort in buildings: A review. Build. Environ. 2025, 288, 113921. [Google Scholar] [CrossRef]
  22. Wang, L.; Ibrahim, A.; Jiang, Y. Multi-Objective Optimization of Atrium Form Variables for Daylighting, Energy Consumption and Thermal Comfort of Teaching Buildings at the Early Design Stage in Cold Climates. Buildings 2025, 15, 4434. [Google Scholar] [CrossRef]
  23. Peel, M.C.; Finlayson, B.L.; Mcmahon, T.A. Updated world map of the Köppen-Geiger climate classification. Hydrol. Earth Syst. Sci. 2007, 11, 1633–1644. [Google Scholar] [CrossRef]
  24. China Meteorological Administration (CMA). 2020. Available online: http://data.cma.cn/ (accessed on 1 January 2026).
  25. ISO 7730:2005; Ergonomics of the Thermal Environment Analytical Determination and Interpretation of Thermal Comfort Using Calculation of the PMV and PPD Indices and Local Thermal Comfort Criteria. International Standard Organization: Geneva, Switzerland, 2005.
  26. ISO 7726:1998; Ergonomics of the Thermal Environment—Instruments for Measuring Physical Quantities. UNE: Madrid, Spain, 1998.
  27. ASHRAE Standard 55-2017; Thermal Environmental Conditions for Human Occupancy (ANSI/ASHRAE Standard). American Society of Heating, Refrigerating and Air Conditioning Engineers: Atlanta, GA, USA, 2017.
  28. de Freitas, C.R.; Grigorieva, E.A. A comparison and appraisal of a comprehensive range of human thermal climate indices. Int. J. Biometeorol. 2017, 61, 487–512. [Google Scholar] [CrossRef]
  29. Liu, T.; Wang, S.; Zhang, J.; He, L.; Cheng, B.; Peng, H.; Liu, F.; Tan, B.; Shang, X.; Liu, F. Investigating the impact of a large river and its surrounding contextual conditions on pedestrians’ summer thermal perceptions in a Cfa-climate city. Sci. Rep. 2024, 14, 13833. [Google Scholar] [CrossRef]
  30. Matzarakis, A.; Rutz, F.; Mayer, H. Modelling radiation fluxes in simple and complex environments—Application of the RayMan model. Int. J. Biometeorol. 2007, 51, 323–334. [Google Scholar] [CrossRef]
  31. Matzarakis, A.; Rutz, F.; Mayer, H. Modelling radiation fluxes in simple and complex environments: Basics of the RayMan model. Int. J. Biometeorol. 2010, 54, 131–139. [Google Scholar] [CrossRef]
  32. Lin, T.-P.; Matzarakis, A. Tourism climate and thermal comfort in Sun Moon Lake, Taiwan. Int. J. Biometeorol. 2008, 52, 281–290. [Google Scholar] [CrossRef]
  33. Nikolopoulou, M.; Lykoudis, S. Thermal comfort in outdoor urban spaces: Analysis across different European countries. Build. Environ. 2006, 41, 1455–1470. [Google Scholar] [CrossRef]
  34. Lin, T.-P. Thermal perception, adaptation and attendance in a public square in hot and humid regions. Build. Environ. 2009, 44, 2017–2026. [Google Scholar] [CrossRef]
  35. Ballantyne, E.R.; Hill, R.K.; Spencer, J.W. Probit analysis of thermal sensation assessments. Int. J. Biometeorol. 1977, 21, 29–43. [Google Scholar] [CrossRef]
  36. Liu, W.; Zhang, Y.; Deng, Q. The effects of urban microclimate on outdoor thermal sensation and neutral temperature in hot-summer and cold-winter climate. Energy Build. 2016, 128, 190–197. [Google Scholar] [CrossRef]
  37. Bröde, P.; Fiala, D.; Błażejczyk, K.; Holmér, I.; Jendritzky, G.; Kampmann, B.; Tinz, B.; Havenith, G. Deriving the operational procedure for the universal thermal climate index (UTCI). Int. J. Biometeorol. 2012, 56, 481–494. [Google Scholar] [CrossRef]
  38. Megri, A.C.; Naqa, I.E.; Haghighat, F. A learning machine approach for predicting thermal comfort indices. Int. J. Vent. 2005, 3, 363–376. [Google Scholar] [CrossRef]
  39. Mahmoud, R.M.A.; Abdallah, A.S.H. Assessment of outdoor shading strategies to improve outdoor thermal comfort in school courtyards in hot and arid climates. Sustain. Cities Soc. 2022, 86, 104147. [Google Scholar] [CrossRef]
  40. Zhang, S.; Li, S.; Shu, L.; Xiao, T.; Shui, T. Landscape Configuration Effects on Outdoor Thermal Comfort across Campus—A Case Study. Atmosphere 2023, 14, 270. [Google Scholar] [CrossRef]
  41. Xu, M.; Hong, B.; Jiang, R.; An, L.; Zhang, T. Outdoor thermal comfort of shaded spaces in an urban park in the cold region of China. Build. Environ. 2019, 155, 408–420. [Google Scholar] [CrossRef]
  42. Huang, J.; Zhou, C.; Zhuo, Y.; Xu, L.; Jiang, Y. Outdoor thermal environments and activities in open space: An experiment study in humid subtropical climates. Build. Environ. 2016, 103, 238–249. [Google Scholar] [CrossRef]
  43. Watanabe, S.; Nagano, K.; Ishii, J.; Horikoshi, T. Evaluation of outdoor thermal comfort in sunlight, building shade, and pergola shade during summer in a humid subtropical region. Build. Environ. 2014, 82, 556–565. [Google Scholar] [CrossRef]
  44. Tian, Y.; Hong, B.; Zhang, Z.; Wu, S.; Yuan, T. Factors influencing resident and tourist outdoor thermal comfort: A comparative study in China’s cold region. Sci. Total Environ. 2022, 808, 152079. [Google Scholar] [CrossRef] [PubMed]
  45. Stewart, I.D.; Oke, T.R. Local climate zones for urban temperature studies. Bull. Am. Meteorol. Soc. 2012, 93, 1879–1900. [Google Scholar] [CrossRef]
  46. Xie, Y.; Huang, T.; Li, J.; Liu, J.; Niu, J.; Mak, C.M.; Lin, Z. Evaluation of a multi-nodal thermal regulation model for assessment of outdoor thermal comfort: Sensitivity to wind speed and solar radiation. Build. Environ. 2018, 132, 45–56. [Google Scholar] [CrossRef]
  47. Ma, X.; Tian, Y.; Du, M.; Hong, B.; Lin, B. How to design comfortable open spaces for the elderly? Implications of their thermal perceptions in an urban park. Sci. Total Environ. 2021, 768, 144985. [Google Scholar] [CrossRef] [PubMed]
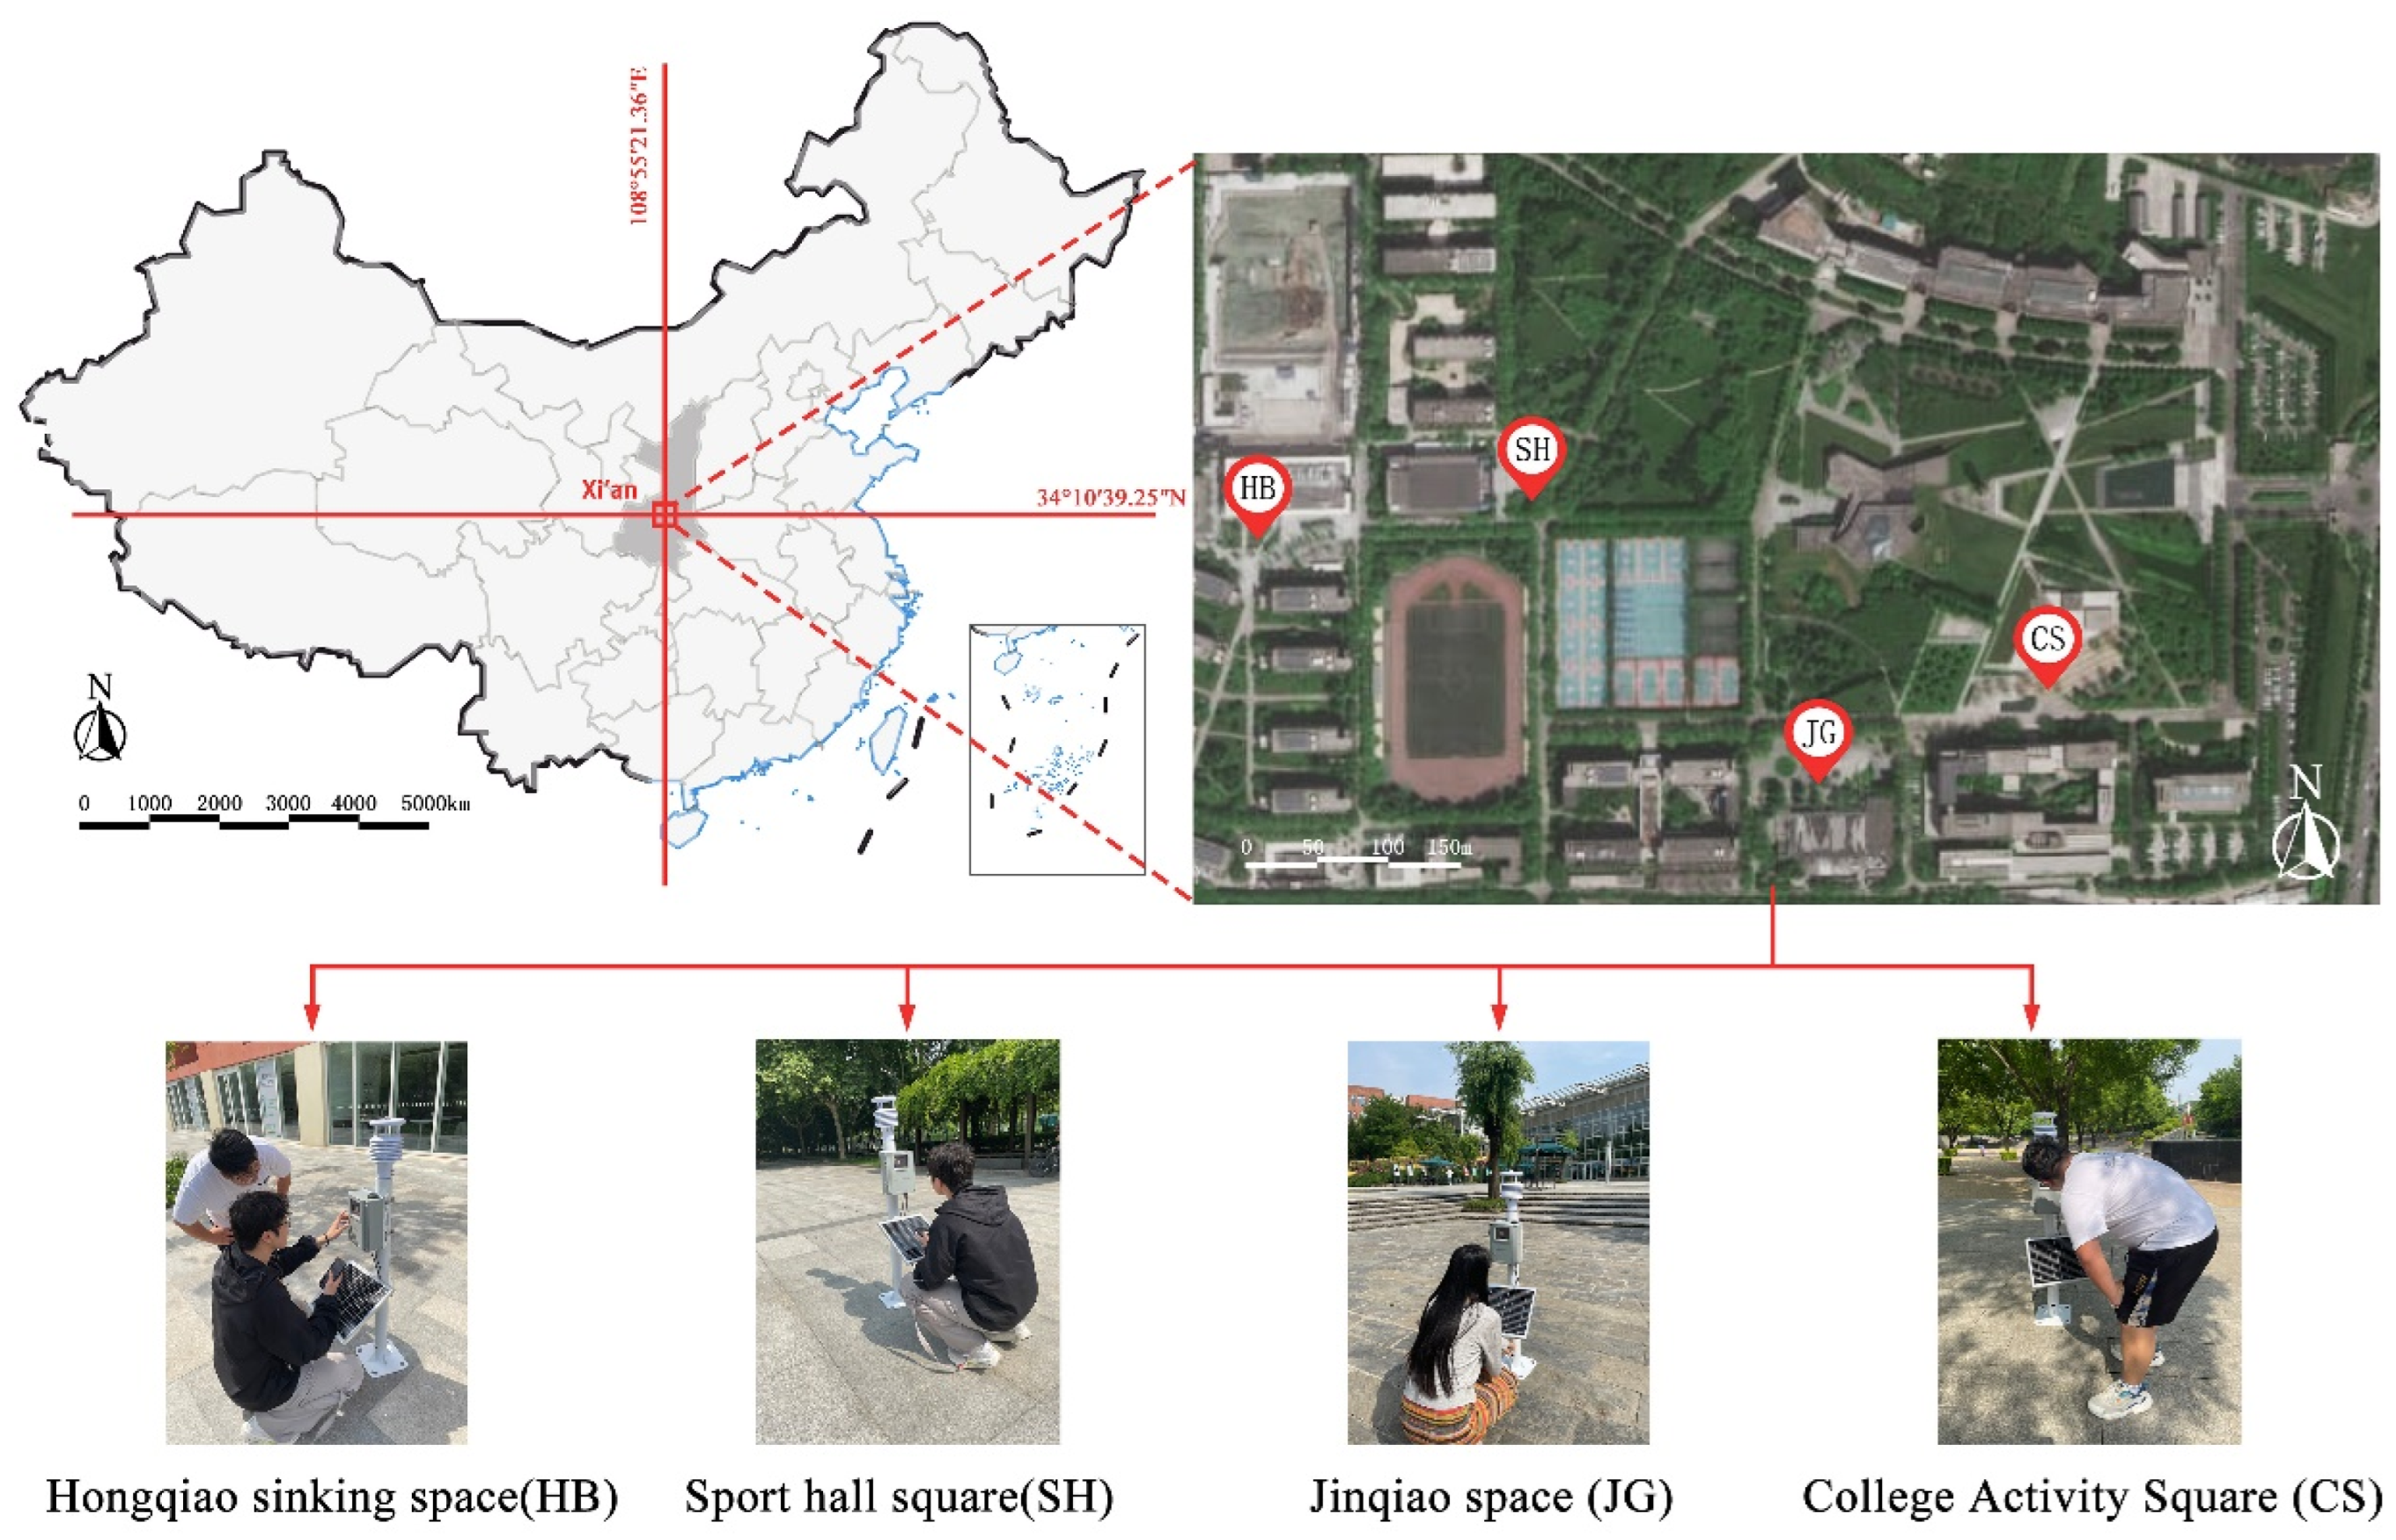
Figure 1. Site location and study spaces: site location.
Buildings 16 02233 g001
Figure 2. Instruments installed at study sites [26].
Buildings 16 02233 g002
Figure 3. Simplified garment checklist.
Buildings 16 02233 g003
Figure 4. Thermal comfort questionnaire (English translation from the original Chinese).
Buildings 16 02233 g004
Figure 5. TSV Distribution.
Buildings 16 02233 g005
Figure 6. TCV Distribution Diagram.
Buildings 16 02233 g006
Figure 7. Linear regression relationships between UTCI and mean thermal sensation vote (MTSV) for four campus spaces: (a) HB—Sunken Plaza, (b) CS—Sports Square, (c) JG—Bridge Area, (d) SH—Activity Square. Data points represent the weighted MTSV for each 1 °C UTCI interval. Regression equations and R2 values are shown in each panel.
Buildings 16 02233 g007aBuildings 16 02233 g007b
Figure 8. Probit regression analysis of students’ preferred UTCI for four campus spaces: (a) HB—Sunken Plaza, (b) CS—Sports Square, (c) JG—Bridge Area, (d) SH—Activity Square. The intersection of the “getting hot” and “getting cold” regression curves indicates the preferred temperature for each space.
Buildings 16 02233 g008aBuildings 16 02233 g008b
Figure 9. Weather preference polling.
Buildings 16 02233 g009
Figure 10. Hourly distribution of student activity types across four campus spaces during measurement days: (a) HB—Sunken Plaza, (b) SH—Activity Square, (c) JG—Bridge Area, (d) CS—Sports Square. Activity types include sitting, reading/using mobile phones, walking at normal speed, and other activities. The horizontal axis represents observation time (8:00–18:00); the vertical axis represents the proportion of each activity type.
Buildings 16 02233 g010aBuildings 16 02233 g010b
Figure 11. Spatial distribution of students in the experiment.
Buildings 16 02233 g011
Figure 12. The promotion of relieving heat disaster behavior.
Buildings 16 02233 g012
Figure 13. Thermal stress category corresponds to UTCI thermal calendar (“a” indicates that the data segment is obtained through the extension of the linear regression fitting line).
Buildings 16 02233 g013aBuildings 16 02233 g013b
Figure 14. Human factors engineering design.
Buildings 16 02233 g014aBuildings 16 02233 g014bBuildings 16 02233 g014cBuildings 16 02233 g014d
Table 1. Descriptions of the four open spaces.
SpaceSpatial CharacteristicsFish-Eye PhotosSVF
HBSunken open space with a double-story building on the north side and two green areas on the south side of the site. Trees and shrubs are planted in the center and west side of the site. There are seating facilities in the center and south side of the site.Buildings 16 02233 i0010.4575
SHA large open hard plaza with green areas distributed on the south, north and east sides of the site, trees and shrubs planted along the edges of the site, a spacious pathway in the center, and a curved seating area on the north side.Buildings 16 02233 i0020.5131
JGA large open hard square with a two-storey building on the south side. The square in front of the building is dotted with trees. Green areas are located all around the square, mainly on the southeast side. The plaza is equipped with umbrellas.Buildings 16 02233 i0030.5122
CSA sunken open space with 11 trees arrayed throughout the site and shrubs planted on the north, west and east sides of the site. A pool is located on the south side of the site. On the north side is a building with three umbrella-mounted seats in the front.Buildings 16 02233 i0040.2538
Table 2. Instruments for recording meteorological variables.
InstrumentMeasuring RangeMeasurement AccuracyWork
Environment
temperature detector (RS4851, Bair Technology Co., Ltd., Xi’an, China)−40 °C~85 °C±0.3 °C/
Wind speed detector (wind05011, Bair Technology Co., Ltd., Xi’an, China)0.2 m/s–10 m/s±0.02 m/s−10 °C~+50 °C
Black ball temperature/Humidity detector (BT20223, Bair Technology Co., Ltd., Xi’an, China)illumination: 0~65,535 lux
Humidity:
0~100%
Black ball:
−10 °C~+85 °C
Humidity:
±2% RH
Black ball: ±0.5 °C
/
Bolometer (JT20201, Bair Technology Co., Ltd., Xi’an, China)Global radiation
0–2 KW/m2
±5% W/m2/
Table 3. Characteristics of the unique respondents (n = 602).
Gender MaleFemale
Quantity 367235
AgeMax2828
Min1919
mean ± standard deviation20.3 ± 2.020.5 ± 2.5
Time of local residence
(years)
0–5237142
6–144135
>158067
Clothing thermal resistanceMax2.22.55
Min0.30.3
mean ± standard deviation0.5 ± 0.30.4 ± 0.2
BMI (kg/m2)Max25.323.9
Min17.517.3
mean ± standard deviation22.5 ± 2.122.3 ± 1.7
Table 4. A table showing the distribution of volunteers during the trial.
LocationTime
AprilMayJuneJuly
HB41605345
SH60737029
JG481005047
CS43636159
Total192296234180
Table 5. NUTCI and NUTCIR.
SpaceMethodEquationR2Sig.Neutral UTCI (°C)Neutral UTCI Range (°C)
HBLR MTSV   = 0.0974 UTCl     1.9811 0.9385<0.00120.3415.21–25.47
CSLR MTSV   = 0.0943 UTCl     2.2262 0.8515<0.00123.6118.31–28.91
JGLR MTSV   = 0.103 UTCl     2.691 0.8831<0.00126.1321.27–30.98
SHLR MTSV   = 0.12 UTCl     2.0528 0.8747<0.00117.1112.94–21.27
Note: LR means linear regression.
Table 6. Each measured space meteorological parameter.
Space T a (°C) RH (%) V a (m/s) T g (°C) G (W/m2)
Max35.1780.4036.2980.5
HBMin21.036022.419.20
Mean23.7955.630.1826.53255.97
Max32.1801.1227.4362.5
CSMin20.742020.19.95
Mean26.1762.710.4324.55151.85
Max33.3720.6034.4480.0
JGMin17.136023.012.40
Mean24.5853.860.2826.64120.48
Max38.4841.5235.0842.5
SHMin10.230014.613.80
Mean26.1054.40.7326.08243.38
Table 7. Correlation analysis of TSV and meteorological parameter Spearman.
SpaceTaRHVaGTg
TSVHB0.185 *0.218 *0.1310.106−0.044
CS0.1240.080−0.204 *0.260 **0.224 **
JG0.201 *−0.156−0.187 *−0.0310.188 *
SH0.402 **−0.321 **−0.277 **0.0950.472 **
Overall0.250 **−0.002−156 **0.0820.227 **
** At 0.01 level (double tail), the correlation is significant. * At 0.05 level (double tail), the correlation is significant.
Table 8. Thermal stress calibration.
Thermal Stress CategoryTSVUTCI (°C)UTCI Beside HB (°C)SH UTCI (°C)UTCI at JG (°C)UTCI at CS (°C)
extreme cold stress<−4.5<−40<−25.9 a<−24.1 a<−17.6 a<−20.4 a
very strong cold stress−4.5 to −3.5−40 to −27−25.9 to −15.6 a−24.1 to −13.5 a−17.6 to −7.9 a−20.4 to −12.1 a
strong cold stress−3.5 to −2.5−27 to −13−15.6 to −5.3 a−13.5 to −2.9 a−7.9 to 1.9 a−12.1 to −3.7 a
moderate cold stress−2.5 to −1.5−13 to 0−5.3 to 4.9 a−2.9 to 7.7 a1.9 to 11.6 a−3.7 to 4.6 a
slight cold stress−1.5 to −0.50 to 94.9 to 15.2 a7.7 to 18.3 a11.6 to 21.3 a4.6 to 12.94 a
without thermal stress−0.5 to 0.59 to 2615.2 to 25.518.3 to 28.921.3 to 31.012.94 to 21.3
moderate thermal stress0.5 to 2.526 to 3225.5 to 46.0 a28.9 to 50.1 a31.0 to 50.4 a21.3 to 37.9
strong thermal stress2.5 to 3.532 to 3846.0 to 56.3 a50.1 to 60.7 a50.4 to 60.1 a37.9 to 46.3 a
very strong thermal stress3.5 to 4.538 to 4656.3 to 66.5 a60.7 to 71.3 a60.1 to 69.8 a46.3 to 54.6 a
extreme thermal stress>4.5>46>66.5 a>71.3 a>69.8 a>54.6 a
A indicates that the data segment is obtained through the extension of the linear regression fitting line.
Table 9. Human factors engineering design strategies for campus open spaces.
SpaceStatusOptimizing Design Strategies
HB
  • Respondents desire lower Ta and G.
  • The two main roads on the site have low occupancy levels and lack shade.
  • The site is located in a sunken area and is poorly ventilated due to vegetation on the western side.
  • There are only a few seats in the venue where students stay for extended periods, resulting in homogenous activity types.
  • Most students choose to drink cold beverages to alleviate heat discomfort, but there is a lack of chilled drinks available in the space.
  • Install turf sprinklers to evaporatively lower Ta;
  • Plant canopy trees along major roads to block solar radiation and reduce Ta;
  • Remove western windbreak shrubs to increase Va, counteracting high RH discomfort;
  • Add drinking water facilities to aid metabolic heat relief.
CS
  • In the CS space, more students prefer to stay in the shade to cool off, but since there are only shrubs under the trees, students can only stand.
  • Few people remain near the site’s water features, which lack ornamental appeal.
  • The site is a sunken area, and the tall shrubs to the west and north hinder natural ventilation.
  • The site lacks barrier-free access.
  • Integrate physical seating beneath existing arbors to directly reduce subjective exposure to G and Tg;
  • Convert static pool to aerated fountain to potentially enhance Va;
  • Trim shrubs on the west and north sides to a lower height to enhance local Va.
JG
  • The east and north sides of the plaza are less crowded, and the seating area by the flower pools has only shrubs but no trees, resulting in insufficient shade and a relatively low utilization rate.
  • The umbrellas are small and fail to provide sufficient shade in the open areas.
  • The site lacks barrier-free access.
  • Plant arborvitae in flower pools to provide direct shade and actively lower Tg;
  • Add trees around umbrellas to expand the shaded area and mitigate Tg.
SH
  • Respondents desire lower G and Ta and higher RH.
  • There is a low number of people staying on the road in the middle of the site.
  • The G value of the site is high, and the hard pavement contributes to significant long-wave radiation.
  • The density of trees at the edge of the site hinders natural ventilation.
  • In the SH space, most students choose to drink cold drinks to relieve heat discomfort, but there is a shortage of iced drinks available to help students cool down.
  • Few people stay at the seating areas, which lack privacy. Additionally, there is a lack of space for students to linger within the site.
  • Increase spraying facilities and sprinklers to actively lower Ta and increase RH;
  • Plant trees on both sides of the middle road to lower Tg;
  • Replace hard curbing with permeable gravel to reduce long-wave radiation (Tg);
  • Increase spacing of fringe trees to enhance Va while retaining shade;
  • Add pavilions to the site to provide shaded areas (blocking G).
Table 10. The main meteorological factors associated with TSV among OTC studies.
Cities, CountriesClimate ZonesSpaceMain Meteorological Factors Associated with TSVCrowdSeasonThe Study AreaAnalytical Methods
Xi’an, China (this study)Cwa/BSkHBRH, Tacollege studentsSummerCampus SpaceSpearman correlation analysis
CSG, Tg, Va
JGTa, Tg, Va
SHTa, Tg, Va, RH
TotalTa, Tg, Va
Xi’an, ChinaCwa/BSkUrbanTa, G, VaUrban residentsSummer & winterResidential areaSignificant
explanatory variables
RuralTa, G, Va, RHRural residents
Xi’an, ChinaCwa/BSkRuralTa, G, Va, RHOldSummer & winterPark spaceSpearman correlation analysis
Xi’an, ChinaCwa/BSkTotalTa, G, Va, RH, TgChildrenSummer & winterPark spaceSpearman correlation analysis
Table 12. UTCI calibrations for different stress categories among OTC studies.
Thermal Stress LevelsUTCI Range (°C)Revised UTCI Scope (Xi’an/
College
Students/HB Space)
Revised UTCI Scope (Xi’an/College Students/CS Space)Revised UTCI Scope (Xi’an/College Students/JG Space)Revised UTCI Scope (Xi’an/College Students/SH Space)Revised UTCI Range (Xi’an/
Elderly)
Revised UTCI Scope (Xi’an/
Children)
extreme cold stress<−40<−25.9 a<−24.1 a<−17.6 a<−20.4 a<−6.1<−53.8 a
very strong cold stress−40 to −27−25.9 to −15.6 a−24.1 to −13.5 a−17.6 to −7.9 a−20.4 to −12.1 a−3.6 to −6.1−53.8 to −38.8 a
strong cold stress−27 to −13−15.6 to −5.3 a−13.5 to −2.9 a−7.9 to 1.9 a−12.1 to −3.7 a−0.8 to −3.6−38.8 to −23.7 a
moderate cold stress−13 to 0−5.3 to 4.9 a−2.9 to 7.7 a1.9 to 11.6 a−3.7 to 4.6 a6.8 to −0.8−23.7 to −8.7 a
slight cold stress0 to 94.9 to 15.2 a7.7 to 18.3 a11.6 to 21.3 a4.6 to 12.94 a2.6–6.8−8.7 to 6.4 a
without thermal stress9 to 2615.2 to 25.518.3 to 28.921.3 to 31.012.94 to 21.36.8–30.06.4 to 21.5
moderate thermal stress26 to 3225.5 to 46.0 a28.9 to 50.1 a31.0 to 50.4 a21.3 to 37.930.0–35.421.5 to 51.5 a
strong thermal stress32 to 3846.0 to 56.3 a50.1 to 60.7 a50.4 to 60.1 a37.9 to 46.3 a35.4–39.551.5 to 66.6 a
very strong thermal stress38 to 4656.3 to 66.5 a60.7 to 71.3 a60.1 to 69.8 a46.3 to 54.6 a39.5–42.966.6 to 81.7 a
extreme thermal stress>46>66.5 a>71.3 a>69.8 a>54.6 a>42.9>81.7 a
A indicates that the data segment is obtained through the extension of the linear regression fitting line.
Table 11. Neutral UTCI in different studies concerning OTC.
Cities, CountriesClimate ZonesNUTCIR (°C)CrowdSeasonThe Study AreaAnalytical MethodsReference
Xi’an, China (HB space in this study)Cwa/BSk15.21–25.47college studentsSummerCampus SpaceLR, MTSV vs. UTCI bin (1 °C) TSV = ±0.5this study
Xi’an, China (CS space in this study)Cwa/BSk18.31–28.91college studentsSummerCampus SpaceLR, MTSV vs. UTCI bin (1 °C) TSV = ±0.5this study
Xi’an, China (JG space in this study)Cwa/BSk21.27–30.98college studentsSummerCampus SpaceLR, MTSV vs. UTCI bin (1 °C) TSV = ±0.5this study
Xi’an, China (SH space in this study)Cwa/BSk12.94–21.27college studentsSummerCampus SpaceLR, MTSV vs. UTCI bin (1 °C) TSV = ±0.5this study
Xi’an, ChinaCwa/BSk6.4–21.5ChildrenSummer & winterPark spaceLR, MTSV vs. UTCI bin (1 °C) TSV = ±0.5[41]
Wuhan, ChinaHSCW11.1–27.4Mixed agesAllResidential areasLR, MTSV vs. UTCI bin (1 °C) TSV = ±0.5[42]
Nagoya, JapanCfa32.2–35.9college studentsSummerCampus SpaceLR, MTSV vs. UTCI bin (1 °C) TSV = ±0.5[43]
Umeå, SwedenDfc11.5–17.2Mixed agesSummerPark spaceLR, MTSV vs. UTCI bin (1 °C) TSV = ±0.5[44]
LR—linear regression.
Disclaimer/Publisher’s Note: The statements, opinions and data contained in all publications are solely those of the individual author(s) and contributor(s) and not of MDPI and/or the editor(s). MDPI and/or the editor(s) disclaim responsibility for any injury to people or property resulting from any ideas, methods, instructions or products referred to in the content.